UNITED STATES
SECURITIES AND EXCHANGE COMMISSION
Washington, D.C. 20549
__________________________________
FORM 10-K
_____________________________________________
|
| | | | |
ý☑ | ANNUAL REPORT PURSUANT TO SECTION 13 OR 15(d) OF THE SECURITIES EXCHANGE ACT OF 1934 |
For the fiscal year ended December 31, 201727, 2020
OR
|
| | | | |
¨☐ | TRANSITION REPORT PURSUANT TO SECTION 13 OR 15(d) OF THE SECURITIES EXCHANGE ACT OF 1934 |
Commission File No. 001-35603
_____________________________________________ CHUY’S HOLDINGS, INC.
(Exact name of registrant as specified in its charter)
__________________________________________________________
|
| | | | | | | |
DELAWAREDelaware | | 20-5717694 |
(State or other jurisdiction of Incorporation incorporation
or Organization) organization) | | (I.R.S. Employer
Identification No.)
|
| |
1623 TOOMEY ROAD
AUSTIN, TEXAS
| | 78704 |
(Address of Principal Executive Offices) | | (Zip Code) |
1623 Toomey Rd.
Austin, Texas 78704
(Address of Principal Executive Offices) (Zip Code)
Registrant’s Telephone Number, Including Area Code:telephone number, including area code: (512) 473-2783
__________________________________________________________
Securities registered pursuant to Section 12(b) of the Act:
|
| | | | | | | |
| Title of each class | Trading Symbol | Name of each exchange on which registered |
| Common Stock, par value $0.01 per share | CHUY | Nasdaq Stock Market LLC |
Securities registered pursuant to section 12(g) of the Act: None
Indicate by check mark if the registrant is a well-known seasoned issuer, as defined in Rule 405 of the Securities Act. Yes ¨☑ No þ☐
Indicate by check mark if the registrant is not required to file reports pursuant to Section 13 or Section 15(d) of the Act. Yes ¨☐ No þ☑
Indicate by check mark whether the registrant (1) has filed all reports required to be filed by Section 13 or 15(d) of the Securities Exchange Act of 1934 during the preceding 12 months (or for such shorter period that the registrant was required to file such reports), and (2) has been subject to such filing requirements for the past 90 days. Yes þ☑ No ¨☐
Indicate by check mark whether the registrant has submitted electronically and posted on its corporate Web site, if any, every Interactive Data File required to be submitted and posted pursuant to Rule 405 of Regulation S-T (§232.405 of this chapter) during the preceding 12 months (or for such shorter period that the registrant was required to submit and post such files). Yes þ☑ No ¨
Indicate by check mark if disclosure of delinquent filers pursuant to Item 405 of Regulation S-K (§ 229.405 of this chapter) is not contained herein, and will not be contained, to the best of registrant’s knowledge, in definitive proxy or information statements incorporated by reference in Part III of this Form 10-K or any amendment to this Form 10-K. ¨☐
Indicate by check mark whether the registrant is a large accelerated filer, an accelerated filer, a non-accelerated filer, a smaller reporting company, or an emerging growth company. See the definitions of “large accelerated filer,” “accelerated filer,” “smaller reporting company” and "emerging growth company" in Rule 12b-2 of the Exchange Act (Check One):
|
| | | | | | | | | | | | | | | | | | | | | | | | | | | | | | | |
| Large accelerated filer | | ¨☐ | | Accelerated filer | | þ☑ | | Emerging growth company | | ☐ |
| Non-accelerated filer | | ¨ (Do not check if a smaller reporting company)
☐ | | Smaller reporting company | | ¨ |
| ☐ | | | | Emerging growth company | | ¨
|
If an emerging growth company, indicate by check mark if the registrant has elected not to use the extended transition period for complying with any new or revised financial accounting standards provided pursuant to Section 13(a) of the Exchange Act. ¨
☐
Indicate by check mark whether the registrant has filed a report on and attestation to its management's assessment of the effectiveness of its internal controls over financial reporting under Section 404(b) of the Sarbanes-Oxley Act (15 U.S.C. 7262(b)) by the registered public accounting firm that prepared or issued its audit report. ☑
Indicate by check mark whether the registrant is a shell company (as defined in Rule 12b-2 of the Exchange Act). Yes ¨☐ No þ
☑
As of June 23, 201726, 2020 (the last business day of our most recently completed second fiscal quarter), the aggregate market value of the registrant’s common stock held by non-affiliates was approximately $364$264 million.
The number of shares of the registrant’s common stock outstanding at March 7, 20181, 2021 was 16,965,910.19,717,380.
Table of Contents
| | | | | | | | |
| | Page |
| | Page |
| | |
| | |
| |
| Item 1. | | |
| Item 1A. | | |
| Item 1B. | | |
| Item 2. | | |
| Item 3. | | |
| Item 4. | | |
| |
| Item 5. | | |
| Item 6. | | |
| Item 7. | | |
| Item 7A. | | |
| Item 8. | | |
| Item 9. | | |
| Item 9A. | | |
| Item 9B. | | |
| |
| Item 10. | | |
| Item 11. | | |
| Item 12. | | |
| Item 13. | | |
| Item 14. | | |
| |
| Item 15. | | |
| |
| SIGNATURES | |
Forward-Looking Statements
This annual report on Form 10-K contains forward-looking statements within the meaning of the Private Securities Litigation Reform Act of 1995. These statements reflect the current views of our senior management with respect to future events and our financial performance. These statements include forward-looking statements with respect to our business and industry in general. Statements that include the words “expect,” “intend,” “plan,” “believe,” “project,” “forecast,” “estimate,” “may,” “should,” “anticipate” and similar statements of a future or forward-looking nature identify forward-looking statements for purposes of the federal securities laws or otherwise.
Forward-looking statements address matters that involve risks and uncertainties. Accordingly, there are or will be important factors that could cause our actual results to differ materially from those indicated in these statements. We believe that these factors include, but are not limited to, the following:
•the ultimate geographic spread, duration and severity of the COVID-19 pandemic, and the effectiveness of actions taken, or actions that may be taken, by governmental authorities to contain the outbreak or treat its impact;
•the success of our existing and new restaurants;
•our ability to identify appropriate sites and develop and expand our operations;
•our ability to manage our growth effectively;effectively and the resulting changes to pre-opening costs;
•we operate most of our restaurants under long-term leases which we may not be able to renew and would be obligated to perform even if we closed our restaurants;
we may not be able to renew leases;
•changes in economic conditions;conditions and consumer buying patterns;
•damage to our reputation or lack of acceptance of our brand in existing or new markets;
•our expansion into markets that we are unfamiliar with;
•economic and other trends and developments, including adverse weather conditions, in the local or regional areas in which our restaurants are located and specifically in Texas where a large percentage of our restaurants are located;
•acts of violence at or threatened against our restaurants or centers in which they are located;
•the impact of negative economic factors, including the availability of credit, on our landlords and surrounding tenants;
•changes in food availability and costs;
•food safety and food borne illness concerns;
•increased competition in the restaurant industry and the segments in which we compete;
•the success of our marketing programs;
•the impact of new restaurant openings, including the effect on our existing restaurants when opening new restaurants in the same markets and restaurant closures;
•strain on our infrastructure and resources caused by our growth;
•the inadequacy of our insurance coverage and fluctuating insurance requirements and costs;
•the impact of security breaches of confidential customer information in connection with our electronic processing of credit and debit card transactions;
•inadequate protection of our intellectual property;
•the failure of our information technology system or the breach of our network security;
•a major natural or man-made disaster;
•labor shortages and increases in our labor costs, including as a result of changes in government regulation, such as regulation;
•the adoptionloss of the new federal health care legislation;key members of our management team;
food safety and food borne illness concerns;
increased competition in the restaurant industry and the segments in which we compete;
•the impact of legislation and regulationsregulation regarding nutritional information and new information or attitudes regarding diet and health or adverse opinions about the health of consuming our menu offerings;
•the impact of federal, state and local beer,laws and regulations, including with respect to liquor licenses and food service regulations;services;
•the impact of litigation;
•the impact of new restaurant openings, including impairment charges;
•the failure of our internal control over financial reporting;
•the impact of federal, state and local tax laws;
•the effect on our existing restaurants when opening new restaurantsof changes in the same markets;accounting principles applicable to us;
the loss of key members of our management team;
strain on our infrastructure and resources caused by our growth;
the inadequacy of our insurance coverage and fluctuating insurance requirements and costs;
•the impact of our indebtedness on our ability to invest in the ongoing needs of our business;
•our ability to obtain debt or other financing on favorable terms or at all;
the impact of a potential requirement to record asset impairment charges in the future;
the impact of security breaches of confidential customer information in connection with our electronic processing of credit and debit card transactions;
inadequate protection of our intellectual property;
the failure of our information technology system or the breach of our network security;
a major natural or man-made disaster;
our increased costs and obligations as a result of being a public company, particularly as we are no longer an emerging growth company;
the failure of our internal control over financial reporting;
the impact of federal, state and local tax laws;
•volatility in the price of our common stock;
•the timing and amount of repurchases of our common stock, if any, changes to the Company's expected liquidity position and the possibility that the repurchase may be suspended or discontinued;stock;
•the impact of future sales of our common stock and the exercise of stock options and any additional capital raised by us through the sale of our common stock;stock or grants of additional equity-based compensation;
•the impact of a downgrade of our shares by securities analysts or industry analysts, the publication of negative research or reports, or lack of publication of reports about our business;
•the effect of anti-takeover provisions in our charter documents and under Delaware law;
•the effect of our decision to not pay dividends for the foreseeable future;
the effect of changes in accounting principles applicable to us;
•our ability to raise capital in the future; and
•other risks and uncertainties described from time to time in the conflicts of interest that may ariseCompany's filings with some of our directors.the Securities and Exchange Commission.
Although we believe that the expectations reflected in the forward-looking statements are reasonable based on our current knowledge of our business and operations, we cannot guarantee future results, levels of activity, performance or achievements. The foregoing factors should not be construed as exhaustive.exhaustive and should be read together with other cautionary statements in this annual report on Form 10-K, including under the heading "Risk Factors" in Item 1A of this annual report. If one or more of these or other risks or uncertainties materialize, or if our underlying assumptions prove to be incorrect, actual results may differ materially from what we anticipate. Any forward-looking statements you read in this annual report on Form 10-K reflect our views as of the date of this annual report on Form 10-K with respect to future events and are subject to these and other risks, uncertainties and assumptions relating to our operations, results of operations, growth strategy and liquidity. You should not place undue reliance on these forward-looking statements and you should carefully consider all of the factors identified in this report that could cause actual results to differ. We assume no obligation to update these forward looking statements, except as required by law.
Basis of Presentation
The accompanying consolidated financial statements have been prepared in accordance with generally accepted accounting principals. We operate on a 52- or 53-week fiscal year that ends on the last Sunday of the calendar year. Each quarterly period has 13 weeks, except for a 53-week year when the fourth quarter has 14 weeks. Our 2017 fiscal year consisted of 53 weeks2020, 2019 and our 2016 and 20152018 fiscal years each consisted of 52 weeks. Fiscal years are identified in this annual report according to the calendar year in which the fiscal year ends. For example, references to “2017,“2020,” “fiscal 2017,2020,” “fiscal year 2017”2020” or similar references refer to the fiscal year endingended December 31, 2017.27, 2020.
Certain prior year amounts have been reclassified in our consolidated financial statements and notes thereto to conform to current year presentation.
PART I
Unless otherwise specified, or the context otherwise requires, the references in this report to "Chuy's", “our company,” “the Company,” “us,” “we” and “our” refer to Chuy’s Holdings, Inc. together with its subsidiaries.
ITEM 1. BUSINESS
General
Chuy’s is a fast-growing,growing, full-service restaurant concept offering a distinct menu of authentic, freshly-prepared Mexican and Tex-Mex inspired food. We were founded in Austin, Texas in 1982 and, as1982. As of December 31, 2017,27, 2020, we operated 91 Chuy’s92 restaurants across 1917 states, with an average annual unit volume of $4.4$3.5 million for our 7086 comparable restaurants for the twelve months ended December 31, 2017.restaurants. Our restaurants have a common décor, but we believe each location is unique in format, offering an “unchained” look and feel, as expressed by our motto “If you’ve seen one Chuy’s, you’ve seen one Chuy’s!” We believe our restaurants have an upbeat, funky, eclectic, somewhat irreverent atmosphere while still maintaining a family-friendly environment. We are committed to providing value to our customers through offering generous portions of made-from-scratch, flavorful Mexican and Tex-Mex inspired dishes. We believe our employees are a cornerstone of our culture and set the tone for a fun, family-friendly atmosphere with attentive service. We believe the Chuy’s culture is one of our most valuable assets, and we are committed to preserving and continually investing in our culture and our customers’ restaurant experience.
Our core menu was established using recipes from family and friends of our founders, and has remained relatively unchanged over the years. We offer the same menu during lunch and dinner, which includes enchiladas, fajitas, rellenos, tacos, burritos, combination platters and daily specials, complemented by a variety of appetizers, soups and salads. Each of our restaurants also offers a variety of homemade sauces, including theour signature Hatch green chile,Green Chile, Boom-Boom and creamy jalapeñCreamy Jalapeño sauces, all of which we make from scratch daily in each restaurant. These sauces are a key element of our offering and provide our customers with an added ability to customize their orders. During the COVID-19 pandemic the Company offered a limited menu featuring a number of long-time favorites and introduced convenient family meal and beverage kits. Our menu offers considerable value to our customers with ouran average check of $14.75$16.93 as of December 31, 2017,27, 2020, which we believe is on the lower end of our casual dining peer group. We also offer a full-service bar in all of our restaurants providing our customers a wide variety of beverage offerings, featuring a selection of specialty cocktails including our signature on-the-rocks margaritas made with fresh, hand-squeezed lime juice and the King's Punch, a made-to-order, hand-shaken rum cocktail served in our signature shaker. The bar represents an important aspect of our concept, where customers frequently gather prior to being seated. For the twelve months ended December 31, 2017,27, 2020, alcoholic beverages constituted 18.4%approximately 15.0% of our total restaurant sales.
We strive to create a unique and memorable customer experience at each of our locations. While the layout in each of our restaurants varies, we maintain distinguishable elements across our locations, including hand-carved, hand-painted wooden fish imported from Mexico, a variety of vibrant Mexican folk art, a “Nacho Car” that provides complimentary chips, salsa and chile con queso in the trunk of a classic car, vintage hubcaps hanging from the ceiling, colorful hand-made floor and wall tile and festive metal palm trees. Including patio space, our restaurants range in size from 5,300 to 12,200 square feet, with seating for approximately 225200 to 400 customers. Nearly all of our restaurants feature outdoor patios. We design our restaurants to have flexible seating arrangements that allow us to cater to families and parties of all sizes. Our brand strategy of having an “unchained” look and feel allows our restaurants to establish their own identity and provides us with a flexible real estate model. Our site selection process is focused on conversions of existing restaurants as well as new ground-up prototypes in select locations. Our restaurants are open for lunch and dinner seven days a week. We serve approximately 5,8003,900 customers per location per week or 303,000203,000 customers per location per year, on average, by providing high-quality, freshly prepared food at a competitive price point. We believe that many of Chuy’s frequent customers visit one of our restaurants multiple times per week.
The COVID-19 pandemic has significantly impacted health and economic conditions throughout the United States. Federal, state and local governments took a variety of actions to contain the spread of COVID-19. Many jurisdictions where our restaurants are located required mandatory closures or imposed capacity limitations and other restrictions affecting our operations. In response to the COVID-19 pandemic, we took various steps to reduce non-essential spend, postpone restaurant development and rightsize operations in light of reduced sales volume to improve our store level profitability and increase our cash flows. See Item 1A. "Risk Factors—COVID-19 has harmed our business and may continue to do so" for additional information.
Our Business Strengths
Over our 35-year38-year operating history, we have developed and refined the following strengths:
Fresh, Authentic Mexican and Tex-Mex Inspired Cuisine. Our goal is to provide unique, authentic Mexican and Tex-Mex inspired food using only the freshest ingredients. We believe we serve authentic Mexican and Tex-Mex inspired food based on our recipes, ingredients, cooking techniques and food pairings, which originated from our founders’ friends and families from Mexico, New
Texas, Mexico and Texas.New Mexico. Every day in each restaurant, we roast and hand pull whole bone-inhand-pull chicken, breasts, hand rollhand-make fresh tortillas, squeeze fresh lime juice and prepare fresh guacamole from whole avocados. In addition, we make all ten of our homemade sauces daily using high-quality ingredients. We believe this commitment to made-from-scratch, freshly prepared cooking results in great tasting, high-quality food, a sense of pride among our restaurant employees and loyalty among our customers. Some of our kitchen managersrestaurant operations teams travel to Hatch, New Mexico every summer to hand-select batches of our green chiles. We believe our commitment to serving high-quality food is also evidenced by serving only Choice quality beef and fresh ingredients. We believe our servers and kitchen staff are highly proficient in executing the core menu and capable of satisfying large quantities of custom orders, as the majority of our orders are customized.personalized.
Considerable Dining Value with Broad Customer Appeal. We are committed to providing value to our customers through offering generous portions of flavorful Mexican and Tex-Mex inspired dishes using fresh, high-quality ingredients. We believe our menu offers a considerable value proposition to our customers with ouran average check of $14.75$16.93 as of December 31, 2017,27, 2020, which we believe is on the lower end of our casual dining peer group. Through our training programs, we trainteach our employees to make sure that each plate is prepared according to our presentation and recipe standards.
Although our core demographic is ages 21 to 44, we believe our restaurants appeal to a broad spectrum of customers and will continue to benefit from trends in consumers’ preferences. We believe consumers are craving bold, spicy and flavorful foods, like those featured in our core offering. Additionally, we believe our brand appeals to a wide demographic and will continue to benefit from the growing demand for fresh, authentic Mexican and Tex-Mex inspired food and a fun, festive dining experience. We believe we are also an attractive venue for families and other large parties, and consider some of our restaurants to be destination locations, drawing customers from as far as 30 miles away. We locate our restaurants in high-traffic locations to attract primarily local patrons with limited reliance onand weekday business travelers.
Upbeat Atmosphere Coupled with Irreverent Brand Helps Differentiate Concept. As stated in our motto “If you’ve seen one Chuy’s, you’ve seen one Chuy’s!” each of our restaurants is uniquely designed. However, most share a few common elements—hand-carved, hand-painted wooden fish, vintage hubcaps hanging from the ceiling, colorful hand-made floor and wall tile, palm trees hand-crafted from scrap metal and a variety of colorful Mexican folk art. Much of this décor, including all of the wooden fish and painted tiles, is sourced from vendors in Mexican villages that have partnered with us for decades. Additionally, virtually all restaurants during weekday happy hours feature a complimentary self-serve “Nacho Car,” a hollowed-out, customized classic car trunk filled with fresh chips, salsa, chile con queso and more.
We believe these signature elements, combined with attentive service from our friendly and energetic employees create an upbeat ambience with a funky, eclectic and somewhat irreverent atmosphere. Our restaurants feature a fun mix of rock and roll, rather than traditional Mexican-style music, which we believe helps to provide an energetic customer experience. We also believe that each restaurant reflects the character and history of its individual community. Many of our restaurants have added unique, local elements such as a special wall of photos featuring customers with their dogs. We believe this has allowed our customers to develop a strong sense of pride and ownership in their local Chuy’s.
Deep Rooted and Inspiring Company Culture. We believe the Chuy’s culture is one of our most valuable assets, and we are committed to preserving and continually investing in our culture and restaurant experience. Since our founding in 1982, we believe we have developed close personal relationships with our customers, employees and vendors. We emphasize a fun, passionate and authentic culture and supportencourage active social responsibility and involvement in local communities. We regularly sponsor a variety of community events including our annual Chuy’s Children Giving to Children Parade in our hometown of Austin, Texas, and other local charitable events. We also support St. Jude Children's Research Hospital on their annual pin-up campaign, raising money and awareness for childhood cancer treatments. We believe our employees and customers share a unique energy and passion for our concept. We believe these characteristics contribute to our favorable annual employee turnover rate at our comparable restaurants and our goal of promoting 40%a significant number of restaurant-level managers from within, as well as our solid base of repeat customers.
In order to retain our unique culture as we grow, we invest significant time and capital into our training programs. We devote substantial resources to identifying, selecting and training our restaurant-level employees. We believe our focus on cultural training is a core aspect of our Company and reinforces our commitment to the Chuy’s brand identity. In conjunction with our training activities, we hold “Culture Clubs” 15several times or more per year, as a means to fully impart the Chuy’s storyhistory through personal appearances bystories of our founders.
Flexible Business Model with Industry Leading Unit Economics. We have a long standing track record of consistently producing high average unit volumes relative to competing Mexican concepts, as well as established casual dining restaurants. For the twelve months ended December 31, 2017,27, 2020, our comparable restaurants generated average unit volumes of $4.4$3.5 million, with our highest volume comparable restaurant generating approximately $9.0$8.4 million. We have opened and operated restaurants in Texas, the Southeast and the Midwest and achieved attractive rates of return on our invested capital, providing a strong foundation for expansion in both new and existing markets. Under our investment model, our new restaurant openings have historically required a net cash investment of approximately $2.3$2.4 million. For our new unit openings, we estimate the cost of a conversion or ground-up buildout will require a total cash investment of $2.6 million to $3.6 million (net of estimated tenant incentives of between zero and $1.0 million). We currently target a cash-on-cash return beginning in the third operating year of approximately 30.0%, and a sales to investment ratio of 1.9:1.
Experienced Management Team. We are led by a management team with significant experience in all aspects of restaurant operations. As of December 31, 201727, 2020 our senior management team hashad an average of approximately 3336 years of restaurant
experience and our 9392 general managers havehad an average tenure at Chuy’s of approximately 68 years. In 2007, we hired our CEO and President, Steve Hislop. Mr. Hislop is the former President of O’Charley’s Restaurants, where he spent 19 years performing a variety of functions, including serving as Concept President and a member of the board of directors, and helped grow the business from 12 restaurants to a multi-concept company with 347 restaurants during his tenure. Since Mr. Hislop’s arrival in 2007, we
have accelerated our growth planopened, and opened 83continue to operate, 84 new restaurants net of a relocation,across the U.S. as of March 7, 2018, and entered 18 new states.December 27, 2020.
Our Business Strategies
Pursue New Restaurant Development. We plan to identify and pursue major markets for expansion, where we believe we can achieve high unit volumes and attractive unit level returns, while at the same time backfilling in our existing markets to continue to build brand awareness. We believe the broad appeal of the Chuy’s concept, historical unit economics and flexible real estate strategy enhance the portability of our concept and provide us opportunity for continued expansion. Currently, our new restaurant development primarily consists of ground up construction and conversions of existing structures.
We have built a scalable infrastructure and have grown our restaurant base through a challenging economic environment. In 2015, we opened ten new restaurants, four in new markets and six backfilling existing markets. We opened twelvenine new restaurants in 2016,2018, one in a new market and eleveneight backfilling existing markets. We opened eleven newsix restaurants backfilling existing markets and closed six under-performing restaurants in 2017, three2019. We opened one new restaurant in 2020 and postponed four new markets and eight backfilling existing markets. Our restaurants opened since 2001 that have been in operations for more than three years have generated average cash-on-cash returnsstore openings to 2021 as part of more than 30.0% inour response to the third year of operations.COVID-19 pandemic. During 2018,2021, we plan to open a total of eightfour to twelvesix restaurants for the year.in existing markets.
Deliver Consistent Comparable Restaurant Sales Through Providing High-Quality Food and Service. We believe we will be able to generate comparable restaurant sales growth by consistently providing an attractive price/value proposition for our customers with excellent service in an upbeat atmosphere. We remain focused on delivering freshly prepared, authentic, high-quality Mexican and Tex-Mex inspired cuisine at a considerable value to our customers. Though the core menu will remain unchanged, we will continue to explore potential additions as well as limited time food and drink offerings. Additionally, we will continue to promote our brand and drive traffic through local marketing efforts, a national marketing campaigns, social media and charity events such as the Chuy’s Children Giving to Children Parade, as well as our line of eclectic t-shirts.
We prioritize customer service in our restaurants, and will continue to invest significantly in ongoing training of our employees. In addition to our new managermanager's training program and frequent “Culture Clubs,” 20 to 24 of our trainers are dispatched to open new restaurants and ensure a solid foundation of customer service, food preparation and our cultured environment. We believe these initiatives will help enhance customer satisfaction, minimize wait times and help us serve our customers more efficiently during peak periods, which we believe is particularly important at our restaurants that operate at or near capacity.
Leverage Our Infrastructure. In preparation for our new restaurant development plan, we have made investments in our infrastructure over the past several years. We believe we now have the corporate and restaurant-level supervisory personnel in place to support our growth plan for the foreseeable future without significant additional investments in infrastructure. Therefore, we believe that as the restaurant base grows, our general and administrative costs willare expected to increase at a slower growth rate than our revenue.
Real Estate
As of March 7, 2018,December 27, 2020, we leased 101112 locations, of which 8293 are free-standing restaurants and 19 are end-cap or in-line restaurants in Class A locations. Of these locations tenand 15 of which are scheduled to open by the end of 2018.closed. We also own one property with a free-standing restaurant in Indiana. End-cap restaurants are highly visible locations at one of the ends of a retail development whereas in-line restaurants are locations that are between multiple retail locations within a development. Class A locations are upscale properties with easily identifiable locations and convenient access that are surrounded by other upscale properties. Including patio space, our restaurants range in size from approximately 5,300 to 12,200 square feet, averaging approximately 8,6008,000 square feet with seating capacity for approximately 225200 to 400 customers. Since the beginning of 2008 through March 7, 2018, we have opened 83 new restaurants, net of a relocation. Since our inception in 1982, we have only moved three locations and closed three locations. In 2016, we closed and moved our Charlotte, North Carolina location, our first closure or relocation since 2004. All of our leases provide for base (fixed) rent, plus the majority provide for additional rent based on gross sales (as defined in each lease agreement) in excess of a stipulated amount, multiplied by a stated percentage. A significant percentage of our leases also provide for periodic escalation of minimum annual rent either based upon increases in the Consumer Price Index or a pre-determined schedule. Typically, the initial lease terms of our leases are 10 or 15 years in length with two to three, five-year extension options. The initial terms of our leases currently expire between 20192021 and 2039.2040. We are also generally obligated to pay certain real estate taxes, insurances, common area maintenance charges and various other expenses related to the properties. Our corporate headquarters is also leased and is located at 1623 Toomey Road, Austin, Texas 78704.
Site Selection Process
We have developed a targeted site acquisition and qualification process incorporating management’s experience as well as extensive data collection, analysis and interpretation. We recently implemented a full-service spatial analytics tool to conduct a comprehensive analysis of new market potential, customer profiling and site selection, which will enhance our site acquisition and qualification process in future years. We seek to identify sites that contribute to our “If you’ve seen one Chuy’s, you’ve seen one Chuy’s” vision, meaning no two restaurants are actively developingalike. As we do not have standardized restaurant requirements with respect to size, location or layout, we are able to be flexible in our real estate selection process. In line with this strategy, we
prefer to identify a combination of conversion sites as well as ground-up prototypes. We currently pursue restaurants in both new and existing markets, and we will continue to expand in selected regions throughout the U.S.
Our Director of Real Estate and Development team works with a master broker who is responsible for identifying and working with local brokers to conduct preliminary research regarding possible development locations. This master broker also assists in site selection and market research. The preliminary research includes an analysis of traffic patterns, parking, access, demographic characteristics, population density, hotel occupancy, major employers, restaurant sales, level of affluence and current or expected co-retail and restaurant tenants. Our Director of Real and Estate Development and the master broker then present potential sites to our Vice President of Real Estate and Development. If our financial criteria for the site are satisfied, our Vice President and Directors of Operations and Chief Executive Officer visit the site and our management negotiates the lease. The key criteria we have for a potential site is that the population within a three mile radius of the restaurant has a high concentration of our target demographic, which is persons ages 21 to 44 and persons with median income ranges in excess of $60,000 per year that dine out frequently. We also preferseek locations with high visibility, especially in a new market, and ample surface parking spaces.
We seek to identify If our financial criteria are met, our Vice Presidents of Operations and Chief Executive Officer visit potential sites that contribute to our “If you’ve seen one Chuy’s, you’ve seen one Chuy’s” vision, meaning no two restaurants are alike. As we do not have standardized restaurant requirements with respect to size, location or layout, we are able to be flexible in our real estate selection process. In line with this strategy, we prefer to identify a combination of conversion sites as well as ground-up prototypes.and then management negotiates leases.
Design
After identifying a lease site, we commence our restaurant buildout. We strive to create a unique and memorable customer experience at each of our locations. While the layout in each of our restaurants varies, we maintain certain distinguishable elements across virtually all locations – hand-carved, hand-painted wooden fish imported from Mexico, a variety of vibrant Mexican folk art, a “Nacho Car” that provides complimentary chips, salsa and chile con queso in the trunk of a classic car, vintage hubcaps hanging from the ceiling, colorful hand-made floor and wall tile and festive metal palm trees. Nearly all of our restaurants feature outdoor patios. Additionally, our flexible seating arrangements allow us to cater to families and parties of all sizes including larger groups, which we believe is a key differentiator from other casual dining operators.
Our new restaurants are either ground-up prototypes or conversions. For our new unit openings, we estimate the cost of a conversion or ground-up buildout will require a total cash investment of $2.6$2.5 million to $3.6 million (net of estimated tenant incentives of between zero and $1.0 million).$3.5 million. The flexibility of our conceptsconcept has enabled us to open restaurants in a wide variety of locations, including high-density residential areas and near shopping malls, lifestyle centers and other high-traffic locations. On average, it takes us approximately 14 to 18 months from identification of the specific site to opening the doors for business. In order to maintain consistency of food and customer service as well as the unique atmosphere at our restaurants, we have set processes and timelines to follow for all restaurant openings.
The development and construction of our new sites is the responsibility of our real estate and development team. Several project managers are responsible for building the restaurants, and several staff members manage purchasing, budgeting, scheduling and other related administrative functions.
New Restaurant Development
We have opened 83 new locations, net of a relocation, since the beginning of 2008 through March 7, 2018 and our managementManagement believes we are well-positioned to continue thisour growth through our new restaurant pipeline, which includes locations currently under development. We maintain a commitment to capitalizing on opportunities and realizing efficiencies in our existing markets while also pursuing attractive locations in new markets. WeAdditionally, we seek to identify new markets in which we believe there is capacity for us to open multiple restaurants.
Restaurant Operations
We currently have eighteentwenty supervisors that report directly to our three Director of Operations andfour Vice PresidentPresidents of Operations who in turn reportsreport to our Chief ExecutiveOperating Officer. Each supervisor oversees an average of approximately four to six restaurants. The staffing at our restaurants typically consists of a general manager, a kitchen manager and three to five assistant managers. In addition, each of our restaurants employs approximately 10060 hourly employees.
Sourcing and Supply
We rely on two regional distributors, Labatt Foodservice ("Labatt") in Texas, Oklahoma, Louisiana and Colorado, andone national distributor, Performance Food Group (“PFG”) in the rest of the United States,, and various other suppliers to provide our beef, cheese, beans, soybean oil, beverages and our groceries. Our distributors deliver suppliesnational distributor makes deliveries to each restaurant two to three times each week. Our distributor relationshipsrelationship with Labatt and PFG havehas been in place for approximately 15eight years and five years, respectively, and the distributors cover 41 and 50 locations, respectively, ascovers all of March 7, 2018.our locations. For our chicken products, we also rely on two suppliers one supplier for all of our Southeast
locations and one supplier for Texas, Oklahoma, Louisiana and Colorado.locations. For our green chiles, each year we contract to buy through two suppliers locatedwith a supplier from a group of farmers in Hatch, New Mexico. If and to the extent the farmers are unable or do not supply a sufficient amount of green chiles or if we need chiles out of season, we purchase the excess amount from several approved suppliers. Each restaurant, through its general manager and kitchen manager, purchases its produce locally. Changes in the price or availability of certain food products could affect the profitability of certain food items, our ability to maintain existing prices and our ability to purchase sufficient amounts of items to satisfy our customers’ demands.
We are currently under contract with our principal non-alcoholic beverage providers through 2018 and intend to renew these contracts.approximately the end of fiscal 2027 based on the estimated consumption rates. Our ability to arrange national distribution of alcoholic beverages is restricted by state law; however, where possible, we negotiate directly with spirit companies and/or regional distributors. We also contract with a third-party provider to source our cooking oil.
Food Safety
Providing a safe and clean dining experience for our customers is essential to our mission statement. We have taken steps to control food quality and safety risks, including implementing a training program for our kitchen staff, employees and managers focusing on food safety and quality assurance. In addition, to minimize the risk of food-borne illness, we have implemented a Hazard Analysis and Critical Control Points (“HACCP”) system for managing food safety and quality. We also consider food safety and quality assurance when selecting our distributors and suppliers. Our suppliers are inspected by federal, state and local regulators or other reputable, qualified inspection services, which helps ensure their compliance with all federal food safety and quality guidelines.
Building Our Brand
We believe our restaurants appeal to a broad spectrum of customers due to our freshly-prepared food and beverage offerings, attentive service and festivefun dining experience. Our target demographic is persons ages 21 to 44 and persons with median income ranges in excess of $60,000 per year that dine out frequently. We aim to build our brand image and awareness at the company level while retaining local neighborhood relationships byrelationships. We achieve this through digital initiatives and targeted traditional advertising that attract new customers combined with local store marketing initiatives aimed at increasing the frequency of visits by our current customerscustomers. We partner with a national media advertising agency and attracting new customers. Wea full-service marketing agency to plan our marketing strategy and our core creative direction. At the local level, we primarily foster relationships with local schools, hotels, businesses, sports teams and neighborhood associations through hosting tasting events and partnering in and sponsoringsponsor local charity events. Our marketing strategyWe also focusesfocus on generating significant brand awareness at new restaurant openings.
Digital Marketing
We have increased our digital presence through paid search and social media, paid influencer campaigns and online listings. Our increased social media presence, primarily on Facebook and Instagram, has enabled us to reach a significant number of people in a timely fashion and at a low cost. We have a Facebook page and a social media champion for every restaurant, allowing us to connect to the community with local content and celebrate our people and our culture. In addition to reaching a larger audience with targeted messaging and radius geo-fencing, we are gathering more accurate demographic information and insight into our customers behaviors. Our Online Ordering and Table Management platforms are fully integrated with our digital initiatives, generating additional customer data points.We are able to use these data points to drive our behavioral e-mail marketing campaigns.
Local Brand Building
A key aspect of our local restaurant marketing/branding strategy is developing community relationships. Our restaurant managers are closely involved in developing and implementing the majority of our local restaurant marketing/branding programs.Store Marketing
Since our founding in 1982, Chuy’s success has stemmed from close personal relationships with our customers, employees and vendors. We believe the Chuy’s culture, which emphasizes fun and authenticity while fostering social responsibility and involvement in local communities, is one of our most valuable assets, and we are committed to preserving and continually investing in it.
A key aspect of our local restaurant marketing/branding strategy is developing community relationships. Our restaurant managers are closely involved in developing and implementing our local store marketing initiatives.
We regularly holdsupport a variety of community events. During the winter holidays,events, primarily focusing on helping children's charities. For over 32 years, we sponsor the Chuy’s Children Giving to Children Parade, which collects toyshave fundraised for Operation Blue Santa in Austin, Texas. Operation Blue Santa givesprovides gifts and holiday meals to families in need in Central Texas. We participate in and sponsor several communityOther local events across all of our locations, specifically focusing on helping children’s charities. For example, we participate in the Give Kids the World and Something mAAgic Foundation event in Orlando, Florida,have sponsored include the Youth for Tomorrow Golf Classic in Northern Virginia, and the Vanderbilt Children's Hospital River of Hope Radiothon in Nashville, Tennessee.Tennessee and the University of Kentucky Children's Hospital Survivor's Picnic in Lexington, Kentucky.
Off-Premise
We have increased our brand awareness outside of the four walls through our off-premise initiatives. Our restaurant To celebrate oneGo specialists take care of traditional phoned-in To Go orders and build relationships with local businesses to increase To Go orders to customers who are unable to come to our restaurants. We have fully implemented our Online Ordering platform, allowing customers to directly order Chuy's from their personal computers or smart devices. We have added catering vans, equipment and a dedicated Catering Manager to several of our signature ingredients,major markets. The Company partners with several third party delivery services to create another channel for new and existing customers to be exposed to our brand. DoorDash is currently our preferred delivery partner. Among other benefits, we believe this partnership will reduce the Hatch green chile, we hold an annual Green Chile Festivaloverall delivery costs and increase efficiencies in all of our restaurants during the August and September harvest, with special menu items featuring Hatch chiles and promotional give-aways.third party delivery process.
New Restaurant Openings
We have developed a marketing/brandingmarketing strategy that we use in connection with opening new restaurant openingsrestaurants to help build local brand recognition and create a “buzz.” In“buzz”. We engage local public relations partners to assist us with earned media coverage, identifying events for Chuy’s to be a part of, establishing relationships with local charities and networking with community leaders. We strategically
choose community events in the months leading up to our opening date to promote the new markets, we generally host a pre-opening party called a “Redfish Rally” after our emblematic redfish for our social media fans, influencers from thelocation and build local community and food bloggers experiencing Chuy’s for the first time. During our “Redfish Rallies”, we serve our food and margaritas and give away free Chuy’s eclectic t-shirts. In addition to the “Redfish Rallies”, werelationships. We employ a variety of pre-opening marketing initiatives such as issuing press releases,paid social media promotions, delivering free food to local businesses highlighting our defining differences, using social media channels,fundraising for our charity partner and hosting a dog event to collect pictures for our “dog wall” and to collect money to benefit a local pet charity and food tasting through training lunches and dinners with local residents, media, community leaders and businesses.
We use the pre-opening period for our new restaurants as an opportunity to reach out to various media outlets as well as the local community. For our new and expanding markets, we retain local public relations partners to assist us with addressing the local market, establishing relationships with local charities, meeting local community leaders, identifying events for Chuy’s to be a part of and gaining brand recognition.
Social Media & E-Marketing
We have increased our social presence, which enables us to reach a significant number of people in a timely and targeted fashion at a fraction of the cost of traditional media. At a corporate level we utilize social media outlets such as Facebook, Twitter and Instagram to promote our brand. We have a local Facebook page for every restaurant location to engage with the community and enhance our local store marketing efforts. We also have an e-mail database for each location that allows us to send customers updates about events at their local Chuy’s.
Training and Employee Programs
We devote significant resources to identifying, selecting and training restaurant-level employees, with an approximately 20-week training program for all of our restaurant managers that includes an average of 11 weeks of restaurant training and eight to nine weeks of “cultural” training, in which managers observe our established restaurants’ operations and customer interactions. We typically have ten in-store trainers at each existing location who provide both front- and back-of-the-house training on site. We conduct comprehensive training programs for our management, hourly employees and corporate personnel. Our training program covers leadership, team building, food safety certification, alcohol safety programs, customer service philosophy training, sexual harassment training and other topics.
Our training process in connection with opening new restaurants has been refined over the course of our experience. Trainers oversee and conduct both service and kitchen training and are on site through the first two weeks of opening and remain on site for two to three additional weeks as needed and depending on unit volumes during the initial weeks. We have two front- and two back-of-the-house training coordinators, and these training coordinators remain on-site to manage the opening for approximately the same period as our other trainers. The lead and other trainers assist in opening new locations and lend support and introduce our standards and culture to the new team. We believe that hiring the best available team members and committing to their training helps keep retention high during the restaurant opening process.wall.”
Management Information Systems
We made significant improvementsAll of our restaurants utilize computerized management information systems, which are designed to ourimprove operating efficiencies, provide restaurant and corporate office with timely access to financial and operating data processing and data security during fiscal year 2017. We completed the implementation of a newreduce administrative time and expense. Our point-of-sale system ("POS"), which was rolled out to services all of our restaurants during 2017. The goals of implementing a new POS system was to leverage our existing information technology infrastructure, to allowand allows for easy integrations from other business applications and provide forapplications. Our POS redundancy at the restaurants. POS processing at our restaurants includes payment of obligations,processes payments, collection of cash, credit and debit card transactions and other processes and procedures. We also use an enterprise back office software program in all of our locations. This program compiles our sales, accounts payable, payroll, inventory and purchasing information and communicates that information to our headquarters to provide visibility tointo our restaurant level operations. Restaurant hardware and software support for all of our restaurants is provided and coordinated with our headquarters in Austin, TX.
We accept credit cards as a method of payment at all of our restaurants. In an effort to provide the best security to our customers' credit card information, we implementedutilize P2Pe solution, an encryption platform, to ensure that no credit card data is stored in our internal systems. ThisWe also included the installation ofuse equipment that can also process smart payment cards, commonly referred to as EMV (Europay, Mastercard and Visa) for credit card processing. This implementation was performed by in-house and third party teams to ensure all equipment was installed in a manner consistent with Payment Card Industry Data Security Standard requirements and manufacturer recommendations. In addition, we deployed industry-leading switching and firewall protection at all company owned internet connections. This allowed us to increase our visibility into the use of our private network, and enhanced our ability to detect malicious or improper digital activity. We also periodically assess our networks for vulnerability.
In 2018, we will implement an online ordering system which will allowWe believe that our current systems and practice of implementing regular updates position us well to expandsupport our to-go sales. In addition we plan to invest in business intelligence technologies and data infrastructure, which will create efficiencies and simplification to our business operations.business.
Government Regulation
WeOur restaurants are subject to numerous federal, state and local laws affecting our business. Each of our restaurants is subject to licensing and regulation by a number of government authorities, which may includeincluding the alcoholic beverage control, nutritional information disclosure, health, sanitation, environmental, zoning and public safety agencies in the statestates or municipalitymunicipalities in which our restaurants are located. Many jurisdictions where our restaurants are located required mandatory closures or imposed capacity limitations and other restrictions affecting our operations during the restaurant is located.COVID-19 pandemic.
For the twelve months ended December 31, 2017, 18.4%27, 2020, approximately 15.0% of our total restaurant sales were attributable to alcoholic beverages. Alcoholic beverage control regulations require each of our restaurants to apply to a state authority and, in certain locations, county and municipal authorities, for licenses and permits to sell alcoholic beverages on the premises. Typically, licenses must be renewed annually and may be subject to penalties, temporary suspension or revocation for cause at any time. Alcoholic beverage control regulations impact many aspects of the daily operations of our restaurants, including the minimum ages of patrons and staff members consuming or serving these beverages, respectively; staff member alcoholic beverage training and certification requirements; hours of operation; advertising; wholesale purchasing and inventory control of these beverages; the seating of minors and the servicing of food within our bar areas; special menus and events, such as happy hours; and the storage and dispensing of
alcoholic beverages. State and local authorities in many jurisdictions routinely monitor compliance with alcoholic beverage laws. We are also subject to “dram shop” statutes in most of the states in which we operate, which generally provide a person injured by an intoxicated person the right to recover damages from an establishment that wrongfully served alcoholic beverages to the intoxicated person.
Various federal and state labor laws govern our operations and our relationships with our staff members, including such matters as minimum wages, breaks, overtime, fringe benefits, safety, working conditions and citizenship or work authorization requirements. We are also subject to the regulations of the U.S. Citizenshipnumerous federal, state and Immigration Services and U.S. Customs and Immigration Enforcement. In addition, some states in which we operate have adoptedlocal laws affecting our business, including (1) laws relating to (a) immigration, employment, lawsminimum wages, breaks, overtime, tip credits, worker conditions and health care, (b) nutritional labeling, nutritional content, menu labeling and food safety and (c) information security, privacy, cashless payments, gift cards and consumer credit, protection and fraud, (2) the Americans with Disabilities Act, which, impose additional conditions on employers. Even if we operateamong other things, requires our restaurants in strict compliance withto meet federally mandated requirements for the laws, rulesdisabled, and regulations of these federal and state agencies, some of our staff members may not meet federal citizenship or residency requirements or lack appropriate work authorizations, which could lead to a disruption in our work force. Significant government-imposed increases in minimum wages, paid or unpaid leaves of absence, sick leave, and mandated health benefits, or increased tax reporting, assessment or payment requirements related to our staff members who receive gratuities, could be detrimental to the profitability of our restaurants operations. Further, we continue to assess the impact of federal health care legislation on our health care benefit costs. Our distributors and suppliers also may be affected by higher minimum wage and benefit standards, which could result in higher costs for goods and services supplied to us. In addition, while we carry employment practices insurance covering a variety of labor-related liability claims, a settlement or judgment against us that is uninsured or in excess of our coverage limitations could have a material adverse effect on our results of operations, liquidity, financial position or business.
We are or may become subject to laws and regulations requiring disclosure of calorie, fat, trans-fat, salt and allergen content. Several states and local jurisdictions have adopted or are considering various food and menu nutritional labeling requirements, many of which are inconsistent or are interpreted differently from one jurisdiction to another and many of which may be superseded by the new federal regulations under the Patient Protection and Affordable Care Act of 2010 ("PPACA") which are scheduled to go into effect on May 7, 2018. The PPACA federal legislation requires chain restaurants with 20 or more locations in the United States to comply with federal nutritional disclosure requirements. However, future regulatory action may result in changes to the federal nutritional disclosure requirements. For additional information, see “Risk Factors - Legislation and regulations requiring the display and provision of nutritional information for our menu offerings, and new information or attitudes regarding diet and health or adverse opinions about the health effects of consuming our menu offerings, could affect consumer preferences and negatively impact our results of operations.” While we believe our ability to adapt to consumer preferences is a strength of our concept, the effect of such labeling requirements on consumer choices, if any, is unclear at this time.
There is also a potential for increased regulation of food in the United States, such as requirements to maintain a HACCP system. HACCP refers to a management system in which food safety is addressed through the analysis and control of potential hazards from production, procurement and handling, to manufacturing, distribution and consumption of the finished product. Many states have adopted legislation or implemented regulations which require restaurants to develop and implement HACCP Systems. Similarly, the United States Congress and the FDA continue to expand the sectors of the food industry that must adopt and implement HACCP programs. For example, the Food Safety Modernization Act (the “FSMA”) was signed into law in January 2011 and significantly expanded FDA’s authority over food safety. Among other requirements, the FSMA granted the FDA with authority to proactively ensure the safety of the entire food system, including through new and additional hazard analysis, food safety planning, increased inspections, and permitting mandatory food recalls. Although restaurants are specifically exempted from some of the requirements outlined in the FSMA and not directly implicated by other requirements, we anticipate that some of the FSMA provisions and FDA’s implementation of the requirements may impact our industry. We cannot assure you that we will not have to expend additional time and resources to comply with new food safety requirements either required by the FSMA or future federal food safety regulation or legislation. Additionally, our suppliers may initiate or otherwise be subject to food recalls that may impact the availability of certain products, result in adverse publicity or require us to take actions that could be costly for us or otherwise harm our business.
We are subject to a variety of federal and state(3) environmental regulations concerning the handling, storage and disposal of hazardous materials, such as cleaning solvents, and the operation of restaurants in environmentally sensitive locations may impact aspects of our operations. During fiscal 2017,2020, there were no material capital expenditures for environmental control facilities, and no such expenditures are anticipated.
Our facilities must comply with the applicable requirements of the Americans with Disabilities Act of 1990 (“ADA”) and related federal and state statutes. The ADA prohibits discrimination on the basis of disability with respect to public accommodations and employment. Under the ADA and related federal and state laws, we must make access to our new or significantly remodeled restaurants readily accessible to disabled persons. We must also make reasonable accommodations for the employment of disabled persons.
We have a significant number of hourly restaurant staff members who receive income from gratuities. We rely on our staff members to accurately disclose the full amount of their tip income and we base our FICA tax reporting on the disclosures provided to us by such tipped employees.
Intellectual Property
We believe that having distinctive marks that are registered and readily identifiable is an important factor in identifying our brand and differentiating our brand from our competitors. We currently own registrations from the United States Patent and Trademark Office (“USPTO”) for the following trademarks: Chuy’s; Chuy’s Mil Pescados Bar (stylized lettering); Chuy’s Green Chile Festival; Fish with sunglasses (our emblematic fish design); and Chuy’s Children Giving to Children Parade, which we have the right to use under our Parade Sponsorship agreement.an agreement with our founders. We have also registered our chuys.com domain name. However, as a result of our settlement agreement with an unaffiliated entity, Baja Chuy’s,Chuy's Mesquite Broiler, Inc. ("Baja Chuy’s"), we may not use “Chuy’s” in Nevada, California or Arizona. An important part of our intellectual property strategy is the monitoring and enforcement of our rights in markets in which our restaurants currently exist or markets which we intend to enter in the future. We also monitor trademark registers to oppose the applications to register confusingly similar trademarks or to limit the
expansion of the scope of goods and services covered by existing similar trademarks. We enforce our rights through a number of methods, including the issuance of cease-and-desist letters or making infringement claims in federal court.
Competition
The restaurant business is intensely competitive with respect to food quality, price/value relationships, ambience, service and location, and is affected by many factors, including changes in consumer tastes and discretionary spending patterns, macroeconomic conditions, demographic trends, weather conditions, the cost and availability of raw materials, labor and energy and government regulations. Our main competitors are full service concepts in the multi-location, casual dining segment in which we compete most directly for real estate locations and customers, including Texas Roadhouse, Cheddar’s Scratch Kitchen and BJ’s Restaurants. We also compete with other providers of Tex-Mex and Mexican fare and adjacent segments, including casual and fast casual segments. We believe we compete favorably for consumers on our food quality, price/value and unique ambience and experience of our restaurants.
Seasonality
Our business is subject to seasonal fluctuations with restaurant sales typically higher during the spring and summer months. Adverse weather conditions during our most favorable months or periods may affect customer traffic. In addition, at nearly all of our restaurants we have outdoor seating, and the effects of adverse weather may impact the use of these areas and may negatively impact our revenues.
EmployeesHuman Capital Management
As of December 31, 2017,27, 2020, we had approximately 9,0006,100 employees, including 9490 corporate management and staff personnel, 650510 restaurant level managers and 8,2005,500 hourly employees. None of our employees are unionized or covered by a collective bargaining agreement. We believe that we have good relations with our employees. Our employees are a cornerstone of our culture and set the tone for a fun, family-friendly atmosphere with attentive service. During the first quarter, as part of managements response to the COVID-19 pandemic, we had furloughed a substantial number of hourly employees as well as store management personnel to right-size our operations as the Company transitioned to an off-premise only operating model. As our restaurants reopened, we were able to rehire approximately 50% of furloughed management employees and approximately 60% of furloughed hourly employees.
We devote significant resources to identifying, selecting and training restaurant-level employees, with a several month long training program for all of our restaurant managers that includes restaurant training and “cultural” training, in which managers observe our established restaurants’ operations and customer interactions. We typically have in-store trainers at each existing location who provide both front- and back-of-the-house training on site. We conduct comprehensive training programs for our management, hourly employees and corporate personnel. Our training program covers leadership, team building, food safety certification, alcohol safety programs, customer service philosophy training, sexual harassment training and other topics.
Our training process in connection with opening new restaurants has been refined over the course of our experience. Trainers oversee and conduct both service and kitchen training and are on site through the first two weeks of opening and remain on site as needed and depending on unit volumes during the initial weeks. We have one front- and one back-of-the-house training coordinators, and these training coordinators remain on-site to manage the opening with our other trainers. The lead and other trainers assist in opening new locations and lend support and introduce our standards and culture to the new team. We believe that hiring the best available team members and committing to their training helps keep retention high during the restaurant opening process.
Fostering and maintaining a strong, healthy culture is a key strategic focus and drives our relationship with our customers, shareholders, business partners, communities and employees and enhances and differentiate our brand reputation. We devote substantial resources to provide extensive cultural training our employees. In conjunction with our training activities, we hold “Culture Clubs” several times per year, as a means of fully imparting Chuy’s history through personal stories of our founders.
The health and safety of our employees is a top priority, particularly in our re-opened restaurants during the COVID-19 pandemic. In protecting our employees’ safety, we have invested in creating safe work environment by taking additional measures. For our office employees, we have added work from home flexibility and mandatory COVID-19 protocol to be followed at the corporate office. For our restaurant employees, we have increased cleaning protocols, implemented temperature screenings and provided additional personal protective equipment and cleaning supplies. For all employees, we currently require masks to be worn in all restaurants and offices and regularly provide company wide updates regarding impacts of the COVID-19 pandemic, including health and safety protocols and procedures.
Company Information
The Company was incorporated in Delaware in 2006. Our principal executive office is located at 1623 Toomey Road, Austin, Texas 78704 and our telephone number is 1-888-HEY-CHUY. Our website address is www.chuys.com. The information on our website is not incorporated by reference into this report.
The Company’s annual reports on Form 10-K, quarterly reports on Form 10-Q, current reports on Form 8-K, and all amendments to those reports are available free of charge on the Company’s website as soon as reasonably practicable after such material is electronically filed with or furnished to, the Securities and Exchange Commission ("SEC"). In addition, copies of the Company’s annual report will be made available, free of charge, on written request.
ITEM 1A. RISK FACTORS
In evaluating our Company, you should consider carefully the following risk factors and the other information in this report, including our consolidated financial statements and related notes to those statements. If any of the following risks actually occur, our business, financial condition and operating results of operations could be adversely affected.harmed.
Risks Relating to Our Business and Industry
COVID-19 has harmed our business and may continue to do so.
The COVID-19 pandemic has significantly impacted health and economic conditions throughout the United States. Federal, state and local governments took a variety of actions to contain the spread of COVID-19. Many jurisdictions where our restaurants are located required mandatory closures or imposed capacity limitations and other restrictions affecting our operations. In response to the COVID-19 pandemic, we took various steps to reduce non-essential spend, postpone restaurant development and rightsize operations in light of reduced sales volume to improve our store level profitability and increase our cash flows. However, we cannot predict how soon we will be able to reopen all of our restaurants at full capacity, open new restaurants in the future or whether we will have to revert back to an off-premise only operating model at some or all of our restaurants. Our ability to continue to operate existing restaurants and open new restaurants in the future will depend in part on the actions of a number of governmental bodies over which we have no control. Moreover, once all restrictions are lifted, it is unclear how quickly customers will return to our restaurants, which may be a function of continued concerns over safety and/or depressed consumer sentiment due to adverse economic conditions, including job losses.
The COVID-19 pandemic has caused and may continue to cause significant disruptions to our ability to generate revenue and cash flows, and uncertainty regarding the length of the disruption may adversely harm our ability to raise additional capital. The COVID-19 pandemic adversely affected and may in the future continue to adversely affect the availability of liquidity generally in the credit markets, and there can be no guarantee that additional liquidity will be readily available or available on favorable terms, especially the longer the COVID-19 pandemic lasts. The equity markets in the United States have been extremely volatile due to the COVID-19 pandemic and our stock price has fluctuated significantly. Continued volatility in the equity markets and our stock price could negatively impact our ability to raise additional capital. The ultimate impact of the COVID-19 pandemic on our business, financial condition and results of operations will depend on our ability to have sufficient liquidity until such time as our restaurants can again generate revenue and profits capable of supporting our ongoing operations, all of which remain highly uncertain at this time.
Our suppliers could also be adversely impacted by the COVID-19 pandemic. If our suppliers' employees are unable to work, whether because of illness, quarantine, limitations of travel or other government restrictions in connection with COVID-19, we could face shortages of food items or other supplies at our restaurants and our operations and sales could be adversely harmed by such supply interruptions.
We could also experience other potential impacts as a result of the COVID-19 pandemic that are not completely known at this time, including, but not limited to, charges from potential adjustments to the carrying amount of goodwill, indefinite-lived intangibles and additional long-lived asset impairment charges. Our actual results may differ materially from our current estimates as the scope of the COVID-19 pandemic evolves, depending largely though not exclusively on the duration of the disruption to our business.
Our financial results depend significantly upon the success of our existing and new restaurants.
Future growth in our revenues and profits will depend on our ability to develop profitable new restaurants, maintain or grow sales and efficiently manage costs in our existing and new restaurants. As of December 31, 2017,27, 2020, we operated 9192 restaurants, of which 216 restaurants are not considered comparable. The results achieved by these restaurants may not be indicative of longer-term performance or the potential market acceptance of restaurants in other locations.
The success of our restaurants revolves principally around customer traffic and average check per customer and customer experience. Significant factors that might adversely affect the average customer traffic and average check per customer include, without limitation:
•the COVID-19 pandemic and other future health crises and the actions taken in response by governmental authorities and others to contain these health crises or treat their impact, including stay-at-home orders;
•uncertain or declining economic conditions, including housing market downturns, rising unemployment rates, lower disposable income, credit conditions, fuel prices and consumer confidence and other events or factors that adversely affect consumer spending in the markets we serve;
•increased competition in the restaurant industry, particularly in the Mexican cuisine and casual and fast-casual dining segments;
•changes in consumer preferences;
•customers’ budgeting constraints;
•customers' acceptance of our brand in new markets;
•customers’ failure to accept menu price increases that we may make to offset increases in key operating costs;
•our reputation and consumer perception of our concepts’ offerings in terms of quality, price, value, ambianceambience and service; and
•customer experiences from dining in our restaurants.
Our restaurants are also susceptible to increases in certain key operating expenses that are either wholly or partially beyond our control, including, without limitation:
•food and other raw materials costs, including to-go supplies, many of which we do not or cannot effectively hedge;
•labor costs, including wage, workers’ compensation and other benefits expenses;
•rent expenses and construction, remodeling, maintenance and other costs under leases for our new and existing restaurants;
•compliance costs as a result of changes in regulatory or industry standards;
•energy, water and other utility costs;
•costs for insurance (including health, liability and workers’ compensation);
•information technology, delivery service charges and other logistical costs; and
•expenses due to litigation against us.
Certain of our restaurants operate at or near capacity. As a result, we may be unable to grow or maintain same store sales at those restaurants, particularly if additional restaurants are opened near the existing location. The failure of our existing or new restaurants to perform as expected could have a significant negative impact onharm our business, financial condition and results of operations.
Our long-term success is highly dependent on our ability to successfully identify appropriate sites and develop and expand our operations in existing and new markets.
We intend to develop new restaurants in our existing markets, and selectively enter into new markets. Since the start of 2008, we have expanded from 8 to 9192 restaurants as of December 31, 2017.27, 2020. We plan to open a total of eightfour to twelvesix restaurants for the year.during fiscal year 2021. There can be no assurance that any new restaurant that we open will have similar operating results to those of existing restaurants. We may not be able to open our planned new restaurants on a timely basis, if at all, and, if opened, these restaurants may not be operated profitably. The number and timing of new restaurants opened during any given period, and their associated contribution to operating growth, may be negatively impacted by a number of factors including, without limitation:
•identification and availability of appropriate locations that will drive high levels of customer traffic and sales per unit;
•inability to generate sufficient funds from operations or to obtain acceptable financing to support our development;
•recruitment and training of qualified operating personnel in the local market;
•availability of acceptable lease arrangements, including sufficient levels of tenant allowances;
•the financial viability of our landlords, including the availability of financing for our landlords and our landlords ability to pay tenant incentives on a timely basis;
•construction and development cost management;
•timely delivery of the leased premises to us from our landlords and punctual commencement of our buildout construction activities;
•delays due to the customized nature of our restaurant concepts and decor, construction and pre-opening processes for each new location;
•obtaining all necessary governmental licenses and permits, including our liquor licenses, on a timely basis to construct or remodel and operate our restaurants;
•our inability to comply with certain covenants under our revolving credit facility (the "Revolving Credit Facility") that could limit our ability to open new restaurants;
•consumer tastes in new geographic regions and acceptance of our restaurant concept;
•competition in new markets, including competition for restaurant sites;
•unforeseen engineering or environmental problems with the leased premises;
•adverse weather during the construction period;
•anticipated commercial, residential and infrastructure development near our new restaurants; and
•other unanticipated increases in costs, any of which could give rise to delays or cost overruns.overruns; and
•the COVID-19 pandemic and other future health crises and the actions taken in response by governmental authorities and others to contain these health crises or treat their impact, including stay-at-home orders.
We have experienced, and expect to continue to experience, delays in restaurant openings from time to time. Such actions may limit our growth opportunities. We cannot assure you that we will be able to successfully expand or acquire critical market presence for our brand in new geographical markets, as we may encounter well-established competitors with substantially greater financial resources. We may be unable to find attractive locations, build name recognition, successfully market our brand or attract new customers. We may incur additional costs in new markets, particularly for transportation and distribution, which may impact the profitability of those restaurants. Competitive circumstances and consumer characteristics and preferences in new market segments and new geographical markets may differ substantially from those in the market segments and geographical markets in which we have substantial experience. As a result, we may be required to close restaurants that are not meeting our performance expectations. If we are unable to successfully expand in existing markets or penetrate new markets, our ability to increase our revenues and profitability may be harmed.
If we fail to manage our growth effectively, it could harm our business.
Failure to manage our growth effectively could harm our business. We have grown significantly since 2008 and intend to continue growing in the future. Our objective is to grow our business and increase stockholder value by (1) expanding our base of company restaurants that are profitable and (2) increasing sales and profits at existing restaurants. While both these methods of achieving our objective are important to us, historically the most significant means of achieving our objective has been through opening new restaurants and operating these restaurants on a profitable basis. As we open and operate more restaurants, our rate of expansion relative to the size of our existing restaurant base will decline, which may make it increasingly difficult to achieve levels of sales and profitability growth that we have seen in the past. In addition, our existing restaurant management systems, financial and management controls and information systems may not be adequate to support our planned expansion. Our ability to manage our growth effectively will require us to continue to enhance these systems, procedures and controls and to locate, hire, train and retain management and operating personnel. We also place a lot of importancehave placed an emphasis on our culture, which we believe has been an important contributor to our success. As we grow, we may have difficulty maintaining our culture or adapting it sufficiently to meet the needs of our operations. We cannot assure you that we will be able to respond on a timely basis to all of the changing demands that our planned expansion will impose on management and on our existing infrastructure. If we are unable to manage our growth effectively, our business, financial condition and operating results of operations could be materially adversely impacted.harmed.
Any decision to either reduce or accelerate the pace of openings may positively or negatively affect our comparative financial performance.
Our opening costs continue to be significant and the amount incurred in any single year or quarter is dependent on the number of restaurants expected to be opened during that time period. As such, our decision to either decrease or increase the rate of openings may have a significant impact on our financial performance for the period of time being measured. Therefore, if we decide to reduce our openings, our comparable opening costs will be lower and the short-term effect on our comparative financial performance will be favorable. Conversely, if the rate at which we develop and open new restaurants is increased to higher levels in the future, the resulting increase in opening costs will have an unfavorable short-term impact on our comparative financial performance.
We occupy most of our restaurants under long-term non-cancelable leases for which we may remain obligated to perform under even after a restaurant closes, and we may be unable to renew leases at the end of their terms.
Many of our current leases are non-cancelable and typically have initial terms ranging from 10 to 15 years with two to three five-year extension options. The initial terms of our leases currently expire between 20192021 and 2039.2040. We believe that leases that we enter into in the future will be on substantially similar terms. If we were to close or fail to open a restaurant at a location we lease, we would generally remain committed to perform our obligations under the applicable lease, which could include, among other things, payment of the base rent for the balance of the lease term. Our obligation to continue making rental payments and
fulfilling other lease obligations in respect of leases for closed or unopened restaurants could have a material adverse effect on our business and results of operations. Alternatively, at the end of the lease term and any renewal period for a restaurant, we may be unable to renew the lease without substantial additional cost, if at all. If we cannot renew such a lease we may be forced to close or relocate a restaurant, which could subject us to construction and other costs and risks. If we are required to make payments or otherwise perform under one of our leases after a restaurant closes or if we are unable to renew our restaurant leases, our business, financial condition and results of operations could be adversely affected.harmed.
The success of our restaurants depends in large part on leased locations. As demographic and economic patterns change, current locations may or may not continue to be attractive or profitable. Possible declines in trade areas where our restaurants are located or adverse economic conditions in surrounding areas could result in reduced revenues in those locations. In addition, desirable locations for new restaurant openings or for the relocation of existing restaurants may not be available at an acceptable cost.
Changes in economic conditions could materially affectharm our business, financial condition and results of operations.
The restaurant industry depends on consumer discretionary spending. Economic conditions are uncertain and may remain volatiledecline or become more uncertain and may repress consumer confidence and discretionary spending. If current volatile economic conditions continuedecline or become more uncertain for a prolonged period of time,
or worsens, customer traffic could be adversely impacted if our customers choose to dine out less frequently or reduce the amount they spend on meals while dining out. We believe that if the current volatile economic conditions persist for a long period of time or become more pervasive, consumers might make long-lasting changes to their discretionary spending behavior, including dining out less frequently on a permanent basis. If restaurant sales decrease, our profitability could decline as we spread fixed costs across a lower level of sales. Reductions in staff levels, asset impairment charges and potential restaurant closures could result from prolonged negative restaurant sales, which could harm our business, financial condition and results of operations.
Changes in consumer buying patterns, particularly e-commerce sites and off premise sales could harm our business, financial condition and results of operations.
In the last several years and more recently during the COVID-19 pandemic, off premise sales, including delivery, have increased due to consumer demand for convenience and safety. While we plan to continue to invest in the growth of our off premise sales, there can be no guarantee that we will be able to increase and/or maintain our off premise sales. Off premise sales could also cannibalize dine in sales. Additionally, our systems and procedures may not be sufficient to handle off premise sales, which require additional investments in technology and people. Our failure to manage off premise sales effectively could harm our business, financial condition and results of operations.
Additionally, delivery from our restaurants is through third party delivery companies. These third party delivery companies require us to pay them commissions, which lower our profit margin on those sales; however, we believe that the majority of such sales are incremental. Any bad press, whether true or not, regarding third party delivery companies or their business model may negatively impact our sales. If these third party delivery companies cease doing business with us, or cannot make their scheduled deliveries, or do not continue their relationship with us on favorable terms, it could harm our business, financial condition and results of operations.
Damage to our reputation or lack of acceptance of our brand in existing or new markets could negatively impactharm our business, financial condition and results of operations.
We believe we have built our reputation on the high-quality of our food, service and staff, as well as on our unique culture and the ambience in our restaurants, and we must protect and grow the value of our brand to continue to be successful in the future. Any incident that erodes consumer affinity for our brand, including any foodborne illness or foodborne illness scare could significantly reduce itsour brand's value and damageharm our business.business, financial condition and results of operations. For example, our brand value could suffer and our business could be adversely affectedharmed if customers perceive a reduction in the quality of our food, service or staff, or an adverse change in our culture or ambience, or otherwise believe we have failed to deliver a consistently positive experience. Additionally, negative incidents that occur at other restaurants may decrease demand for restaurant dining broadly including at our restaurant.restaurants.
In addition, our ability to successfully develop new restaurants in new markets may be adversely affected by a lack of awareness or acceptance of our brand in these new markets. To the extent that we are unable to foster name recognition and affinity for our brand in new markets, our new restaurants may not perform as expected, and our growth may be significantly delayed or impaired.impaired and we may have to close restaurants.
We may be adversely affected by news reports or other negative publicity regardless of their accuracy, regarding food quality issues, public health concerns, illness, safety, injury or government or industry findings concerning our restaurants, restaurants operated by other food service providers, or others across the food industry supply chain. The risks associated with such negative publicity cannot be completely eliminated or mitigated and may materially harm our results of operations and result in damage to our brand.
Also, there has been a marked increase in the use of social media platforms and similar devices, including blogs, social media websites and other forms of Internet-basedinternet-based communications which allow individuals access to a broad audience of consumers and other interested persons. Consumers value readily available information concerning goods and services that they have or plan to purchase, and may act on such information without further investigation or authentication. The availability of information on social media platforms is virtually immediate as is its impact. Many social media platforms immediately publish the content their subscribers and participants can post, often without filters or checks on accuracy of the content posted. The opportunity for dissemination of information, including inaccurate information, is seemingly limitlesshigh and readily available. Information concerning our company may be posted on such platforms at any time. Information posted may be adverse to our interests or may be inaccurate, each of which may harm our performance, prospects or business.business, financial condition and results of operations. The harm may be immediate without affording us an opportunity for redress or correction. Such platforms also could be used for dissemination of trade secret information, compromising valuable company assets. In sum,summary, the dissemination of information online could harm our business, prospects, financial condition and results of operations, regardless of the information’s accuracy.
Our brand could also be confused with brands that have similar names, including Baja Chuy’s, Mesquite Broiler, Inc. (“Baja Chuy’s”), an unaffiliated restaurant chain with whom we have entered into a settlement agreement regarding use of the Chuy’s name. As a result, our brand value may be adversely affectedharmed by any negative publicity related to Baja Chuy’s or any other restaurant that may use brand names, trademarks or trade dress that are similar to ours.
Our expansion into new markets may present increased risks due to our unfamiliarity with the area.
Some of our new restaurants will be located in areas where we have little or no meaningful experience. Those markets may have different competitive conditions, consumer tastes and discretionary spending patterns than our existing markets, which may cause our new restaurants to be less successful than restaurants in our existing markets. An additional risk of expanding into new markets is the lack of market awareness of our brands. Restaurants opened in new markets may open at lower average weekly sales volume than restaurants opened in existing markets and may have higher restaurant-level operating expense ratios than in existing markets. Sales at restaurants opened in new markets may take longer to reach average unit volume, if at all, thereby affectingharming our overall profitability.business, financial condition and results of operations.
Further, the restaurant industry is subject to extensive state and local laws and regulations, which we may be unfamiliar with as we expand into new locations. We are subject to licensing and regulation by state and local authorities relating to health, sanitation, safety and fire standards and the sale of alcoholic beverages. We are also subject to laws and regulations relating to the preparation and sale of food, including regulations regarding product safety, nutritional content and menu labeling. Compliance with these laws and regulations can be costly, and any failure or perceived failure to comply with those laws could adversely affectharm our business, financial condition and results of operation.
Approximately 38%40% of our restaurants are located in Texas and, as a result, we are sensitive to economic, adverse weather and other trends and developments in that state.
As of December 31, 2017,27, 2020, we operated a total of 3538 restaurants in Texas. As a result, we are particularly susceptible to adverse trends and economic conditions in this state, including its labor market. In addition, given our geographic concentration in this state, negative publicity regarding any of our restaurants in Texas, local labor issues, terrorist attacks, changes in energy prices, adverse weather conditions, hurricanes, droughts, fires or other natural or man-made disasters could have a material adverse effect onharm our business, financial condition and results of operations.
We are susceptible to economic and other trends and developments, including adverse weather conditions, in the local or regional areas in which our restaurants are located.
Our financial performance is dependent on our restaurants located in Texas and the Southeastern and Midwestern United States. As a result, adverse economic conditions in any of these areas could have a material adverse effect onharm our overallbusiness, financial condition and results of operations. In recent years, certain of these states have been more negatively impacted by the housing decline, high unemployment rates the overall economic crisis and most recently the decline in oil prices than other geographic areas. In addition, given our geographic concentrations, particularly in Texas, negative publicity regarding any of our restaurants in these areas could have a material adverse effect onharm our business, financial condition and results of operations, as could other regional occurrences such as local labor issues, terrorist attacks, changes in energy prices, adverse weather conditions, hurricanes, droughts, fires or other natural or man-made disasters. Adverse weather conditions may also impact customer traffic at our restaurants, cause the temporary underutilization of outdoor patio seating, and, in more severe cases, cause temporary restaurant closures, sometimes for prolonged periods. In addition, climate change may increase the frequency and severity of weather-related events and conditions, which affect our business.
Our business is subject to seasonal fluctuations, with restaurant sales typically higher during the spring and summer months as well as in December. Adverse weather conditions during our most favorable months or periods may exacerbate the effect of adverse weather on customer traffic and may cause fluctuations in our operating results of operations from quarter-to-quarter within a fiscal year. In addition, outdoor patio seating is available at nearly all of our restaurants and may be impacted by a number of weather-related factors. Our inability to fully utilize our restaurants’ seating capacity as planned may negativelyharm our business, financial condition and results of operations.
Acts of violence at or threatened against our restaurants or the centers in which they are located, including active shooter situations and terrorism, could harm our business, financial condition and results of operations.
Any act of violence at or threatened against our restaurants or the centers in which they are located, including active shooter situations and terrorist activities, may result in restricted access to our restaurants and/or restaurant closures in the short-term and, in the long-term, may cause our customers and staff to avoid our restaurants. Any such situation could adversely impact customer traffic and make it more difficult to fully staff our revenuesrestaurants, which could harm our business, financial condition and results of operations.
The impact of negative economic factors, including the availability of credit, on our landlords and surrounding tenants could negatively affectharm our business, financial results.condition and results of operations.
Negative effects on our existing and potential landlords due to the inaccessibility of credit and other unfavorable economic factors may, in turn, adversely affectharm our business, financial condition and results of operations. If our landlords are unable to obtain financing or remain in good standing under their existing financing arrangements, they may be unable to provide construction contributions or satisfy other lease covenants to us. In addition, if our landlords are unable to obtain sufficient credit to continue to properly manage their retail sites, we may experience a drop in the level of quality of such retail centers. Our development of new restaurants may also be adversely affected by the negative financial situations of developers and potential landlords. Landlords may try to delay or cancel recent development projects (as well as renovations of existing projects) due to the instability in the credit markets which could reduce the number of appropriate locations available that we would consider for our new restaurants. Furthermore, the failure of landlords to obtain licenses or permits for development projects on a timely basis, which is beyond our control, may negatively impact our ability to implement our development plan.
Changes in food availability and costs could adversely affectharm our operating results.business, financial condition and results of operations.
Our profitability and operating margins are dependent in part on our ability to anticipate and react to changes in food costs. We rely on two regional distributors, Labatt in Texas, Oklahoma, Louisianaour national distributor, PFG, and Colorado and PFG in the rest of the United States, and various other suppliers to provide our beef, cheese, beans, soybean oil, beverages and our groceries. For our chicken products, we rely on two suppliers, one supplier for our Texas, Oklahoma, Louisiana and Colorado locations and one for the restall of our locations. ForSee "Item 1. Business—Sourcing and Supply" for information regarding our green chiles, each year we contract with a supplier to buy from a group of farmers in Hatch, New Mexico, which we have the right to select under our agreement. If and to the extent the farmers are unable or do not supply a sufficient amount of green chiles or if we need chiles out of season, we purchase the excess amount from several approved suppliers. Each restaurant, through its general manager and kitchen manager, purchases its produce locally. Any increase in distribution prices, increase in the prices charged by suppliers or failure to perform by these third-parties could cause our food costs to increase or us to experience short-term unavailability of certain products. Failure to identify an alternate source of supply for these items may result in significant cost increases and an inability to provide certain of the items on our menu. If these events occur, it may reduce the profitability of certain of our offerings and may cause us to increase our prices. In addition, any material interruptions in our supply chain, such as a material interruption of ingredient supply due to the failures of third-party distributors or suppliers, or interruptions in service by common carriers that ship goods within our distribution channels, may result in significant cost increases and reduce sales. Changes in the price, as a result of inflation or otherwise, or availability of certain food products could affect the profitability of certain food items, our ability to maintain existing prices and our ability to purchase sufficient amounts of items to satisfy our customer’s demands, which could materially adversely affectharm our profitabilitybusiness, financial condition and reputation.
operations.
The type, variety, quality, availability and price of produce, beef, chicken and cheese are more volatile than other types of food and are subject to factors beyond our control, including weather, governmental regulation, availability and seasonality, each of which may affect our food costs or cause a disruption in our supply. Our food distributors and suppliers also may be affected by higher costs to produce and transport commodities used in our restaurants, higher minimum wage and benefit costs and other expenses that they pass through to their customers, which could result in higher costs for goods and services supplied to us. Although we are able to contract for some of the food commodities used in our restaurants for periods of up to one year, the pricing and availability of some of the commodities used in our operations, such as our produce, cannot be locked in for periods of longer than one week or at all. We do not use financial instruments to hedge our risk to market fluctuations in the price of our ingredients and other commodities at this time. We may not be able to anticipate and react to changing food costs through our purchasing practices and menu price adjustments in the future, and failure to do so could negatively impactharm our revenuesbusiness, financial condition and results of operations.
Increases in our labor costs, including as a result of changes in government regulation, could slow our growth or harm our business.
We are subject to a wide range of labor costs. Because our labor costs are, as a percentage of revenues, higher than other industries, we may be significantly harmed by labor cost increases. Unfavorable fluctuations in market conditions, availability of insurance or changes in state and/or federal regulations could significantly increase our labor costs. We are subject to federal, state, and local laws governing employment practices and working conditions. These laws cover wage and hour practices, labor relations, paid and family leave, and workplace safety, among others. The myriad of laws and regulations being passed at the state and local level creates unique challenges as different standards apply to different locations, sometimes with conflicting requirements. We will continue to monitor and adapt our employment practices to comply with these various laws and regulations. In addition, we are subject to the risk of employment-related litigation at both the state and federal levels, including claims styled as class action lawsuits which are more costly to defend. Also, some employment related claims in the area of wage and hour disputes are not insurable risks.
Significant increases in health care costs may continue to occur, and we can provide no assurance that we will be able to contain those costs.
In addition, many of our restaurant personnel are hourly workers subject to various minimum wage requirements or changes to tip credits. Mandated increases in minimum wage levels and changes to the tip credit, which are the amounts an employer is permitted to assume an employee receives in tips when calculating the employee’s hourly wage for minimum wage compliance purposes, have recently been and continue to be proposed and implemented at both federal and state government levels. For example, in Kentucky employers may not require employees to pool tips in order to share those tips with wait staff, bartenders and bussing staff. As a result, we may be required to pay our wait staff, bartenders and bussing staff in our Kentucky locations additional amounts to ensure they receive minimum wage. Continued minimum wage increases or changes to allowable tip credits may further increase our labor costs or effective tax rate.
Various states in which we operate are considering or have already adopted new immigration laws, and the U.S. Congress and Department of Homeland Security from time to time consider or implement changes to Federal immigration laws, regulations or enforcement programs as well. Some of these changes may increase our obligations for compliance and oversight, which could subject us to additional costs and make our hiring process more cumbersome, or reduce the availability of potential employees. Although we require all workers to provide us with government-specified documentation evidencing their employment eligibility, some of our employees may, without our knowledge, be unauthorized workers. Unauthorized workers are subject to deportation and may subject us to fines or penalties, and if any of our workers are found to be unauthorized we could experience adverse publicity that negatively impacts our brand and may make it more difficult to hire and keep qualified employees. Termination of a significant number of employees that unbeknown to us were unauthorized employees may disrupt our operations, cause temporary increases in our labor costs as we train new employees and result in additional adverse publicity. Our financial performance could be materially harmed as a result of any of these factors.
Labor shortages could increase our labor costs significantly or restrict our growth plans.
Our restaurants are highly dependent on qualified management and operating personnel. Qualified individuals have historically been in short supply and an inability to attract and retain them would limit the success of our existing restaurants as well as our development of new restaurants. We place a heavy emphasis on the qualification and training of our personnel and spend significantly more on training our employees than our competitors. We can make no assurances that we will be able to attract and retain qualified individuals in the future which may have a more significant effect on our operation than those of our competitors. Additionally, the cost of attracting and retaining qualified individuals may be higher than we anticipate, and as a result, our profitability could decline.
Food safety and foodborne illness concerns may have an adverse effect on our business by reducing demand and increasing costs.
Food safety is a top priority, and we dedicate substantial resources to help ensure that our guests enjoy safe, quality food products. However, foodborne illnesses and food safety issues have occurred in the food industry in the past, and could occur in the future. Any report or publicity linking us to instances of foodborne illness or other food safety issues, including food tampering or contamination, could adversely affectharm our brand and reputation as well as our revenuesbusiness, financial condition and profits.results of operations. In addition, instances of foodborne illness, food tampering or food contamination occurring at our competitors' restaurants could result in negative publicity about the food service industry generally and adversely impactcould harm our sales.business, financial condition and results of operations.
Furthermore, our reliance on third-party food suppliers and distributors increases the risk that foodborne illness incidents could be caused by factors outside of our control and that multiple locations would be affected rather than a single restaurant. We cannot assure that all food items are properly maintained during transport throughout the supply chain and that our employees will identify all products that may be spoiled and should not be used in our restaurants. If our guests become ill from foodborne illnesses, we could be forced to temporarily close some restaurants. Furthermore, any instances of food contamination, whether or not at our restaurants, could subject us or our suppliers to a food recall. Any such results could adversely affectharm our brand and reputation as well as our business, financial condition and results of operations.
The United States and other countries have experienced, or may experience in the future, outbreaks of viruses, such as COVID-19, Ebola, Avian Flu, SARS and H1N1. To the extent that a virus is foodborne, future outbreaks may adversely affect the price and availability of certain food products and cause our guests to eat less of a product. To the extent that a virus is transmitted by human-to-human contact, our employees or guests could become infected, or could choose, or be advised or required, to avoid gathering in public places, any one of which could adversely affectharm our business.business, financial condition and results of operations.
Customer traffic at our restaurants could be significantly affected by competition in the restaurant industry in general and, in particular, within the dining segments of the restaurant industry in which we compete.
The restaurant industry is highly competitive with respect to food quality, ambience, service, price and value and location, and a substantial number of restaurant operations compete with us for customer traffic. The main competitors for our brand are other operators of mid-priced, full service concepts in the multi-location casual dining and Tex-Mex/Mexican food segments in which we compete most directly for real estate locations and customers. Some of our competitors have significantly greater financial, marketing, personnel and other resources than we do, and many of our competitors are well established in markets in which we have existing restaurants or intend to locate new restaurants. Any inability to successfully compete with the other restaurants in our markets will place downward pressure on our customer traffic and may prevent us from increasing or sustaining our revenues and profitability. We may also need to evolve our concept or expand to new concepts in order to compete with popular new restaurant formats or concepts that develop from time to time, and we cannot offer any assurance that we will be successful in doing so or that modifications or additions to our concept will not reduceharm our profitability.business, financial condition and results of operations. In addition, with improving product offerings at fast casual restaurants, quick-service restaurants and grocery stores and the influence of negative economic conditions and other factors, consumers may choose less expensive alternatives, which could also negatively affect customer traffic at our restaurants.
Legislationrestaurants and regulations requiring the displayharm our business, financial condition and provision of nutritional information for our menu offerings, and new information or attitudes regarding diet and health or adverse opinions about the health effects of consuming our menu offerings, could affect consumer preferences and negatively impact our results of operations.
Government regulation and consumer eating habits may impact our business as a result of changes in attitudes regarding diet and health or new information regarding the health effects of consuming our menu offerings. These changes have resulted in, and may continue to result in, the enactment of laws and regulations that impact the ingredients and nutritional content of our menu offerings, or laws and regulations requiring us to disclose the nutritional content of our food offerings. The Patient Protection and Affordable Care Act of 2010 (the “PPACA”) establishes a uniform, federal requirement for certain restaurants to post nutritional information on their menus. The FDA finalized regulations to implement the nutritional menu labeling provisions of the PPACA. These final regulations will be effective in May 2018 and will establish a uniform, federal requirement for certain restaurants, including ours, to post nutritional information on their menus. We will be required to publish the total number of calories of standard menu items on menus, along with a statement that puts this calorie information in the context of a total daily calorie intake. The PPACA also requires us to provide to consumers, upon request, a written summary of detailed nutritional information for each standard menu item, and to provide a statement on menus about the availability of this information. An unfavorable report on, or reaction to, our menu ingredients, the size of our portions, or the nutritional content of our menu items could negatively influence the demand for our offerings. We cannot make any assurances regarding our ability to effectively respond to changes in consumer health perceptions or our ability to successfully implement the nutrient content disclosure requirements and to adapt our menu offerings to trends and eating habits. The imposition of menu-labeling laws could have an adverse effect on our results of operations and financial position, as well as the restaurant industry in general.
Multiple jurisdictions in which we operate have recently enacted new requirements that require us to adopt and implement a Hazard Analysis and Critical Control Points (“HACCP”) System for managing food safety and quality. HACCP refers to a management
system in which food safety is addressed through the analysis and control of potential hazards from production, procurement and handling, to manufacturing, distribution and consumption of the finished product. We expect to incur certain costs to comply with these regulations and these costs may be more than we anticipate. If we fail to comply with these laws or regulations or our HACCP system is unable to prevent an issue, our business could experience a material adverse effect.
Federal, state and local beer, liquor and food service regulations may have a significant adverse impact on our operations.
We are required to operate in compliance with federal laws and regulations relating to alcoholic beverages administered by the Bureau of Alcohol, Tobacco, Firearms and Explosives of the U.S. Department of Justice, as well as the laws and licensing requirements for alcoholic beverages of states and municipalities where our restaurants are or will be located. In addition, each restaurant must obtain a food service license from local authorities. Failure to comply with federal, state or local regulations could cause our licenses to be revoked and force us to cease the sale of food or alcoholic beverages at certain locations. Any difficulties, delays or failures in obtaining such licenses, permits or approvals could delay or prevent the opening of a restaurant in a particular area or increase the costs associated therewith. In addition, in certain states, including states where we have existing restaurants or where we plan to open a restaurant, the number of liquor licenses available is limited, and licenses are traded on the open market. Liquor, beer and wine sales comprise a significant portion of our revenues. If we are unable to maintain our existing licenses, our customer patronage, revenues and results of operations could be adversely affected. Or, if we choose to open a restaurant in those states where the number of licenses available is limited, the cost of a new license could be significant.
We apply for our liquor licenses with the advice of outside legal and licensing consultants. Because of the many and various state and federal licensing and permitting requirements, there is a significant risk that one or more regulatory agencies could determine that we have not complied with applicable licensing or permitting regulations or have not maintained the approvals necessary for us to conduct business within its jurisdiction. Any changes in the application or interpretation of existing laws may adversely impact our restaurants in that state, and could also cause us to lose, either temporarily or permanently, the licenses, permits and regulations necessary to conduct our restaurant operations, and subject us to fines and penalties.
Restaurant companies have been the target of class-actions and other litigation alleging, among other things, violations of federal and state law.
We are subject to a variety of lawsuits, administrative proceedings and claims that arise in the ordinary course of our business. In recent years, a number of restaurant companies have been subject to claims by customers, employees and others regarding issues such as food safety, personal injury and premises liability, employment-related claims, harassment, discrimination, disability and other operational issues common to the foodservice industry. A number of these lawsuits have resulted in the payment of substantial damages by the defendants. An adverse judgment or settlement that is not insured or is in excess of insurance coverage could have an adverse impact on our profitability and could cause variability in our results compared to expectations. We carry insurance policies for a significant portion of our risks and associated liabilities with respect to workers’ compensation, general liability, employer’s liability, health benefits and other insurable risks. Regardless of whether any claims that may be brought against us are valid or whether we are ultimately determined to be liable, we could also be adversely affected by negative publicity, litigation costs resulting from the defense of these claims and the diversion of time and resources from our operations.
We are subject to state “dram shop” laws and regulations, which generally provide that a person injured by an intoxicated person may seek to recover damages from an establishment that wrongfully served alcoholic beverages to the intoxicated person. Recent litigation against restaurant chains has resulted in significant judgments, including punitive damages, under such “dram shop” statutes. While we carry liquor liability coverage as part of our existing comprehensive general liability insurance, we may still be subject to a judgment in excess of our insurance coverage, and we may not be able to obtain or continue to maintain such insurance coverage at reasonable costs, if at all. Regardless of whether any claims against us are valid or whether we are liable, we may be adversely affected by publicity resulting from such laws.
Our marketing programs may not be successful.
We expend resources in our marketing efforts using a variety of media, including social media. We expect to continue to conduct brand awareness programs and customer initiatives to attract and retain customers. These initiatives may not be successful, resulting in expenses incurred without the benefit of higher revenues. Additionally, some of our competitors have greater financial resources, which enable them to spend significantly more on marketing and advertising than we are able to. Should our competitors increase spending on marketing and advertising or our marketing funds decrease for any reason, or should our advertising and promotions be less effective than our competitors, there could be a material adverse effect on our business, financial condition and results of operations and financial condition.could be harmed.
The impact of new restaurant openings and closures could result in fluctuations in our financial performance.
Quarterly results have been, and in the future may continue to be, significantly impacted by the timing of new restaurant openings (often dictated by factors outside of our control), including associated restaurant pre-opening costs and operating inefficiencies, as well as changes in our geographic concentration due to the opening of new restaurants. We typically incur the most significant portion of restaurant pre-opening expenses associated with a given restaurant within the five months immediately preceding and the month of the opening of the restaurant. As the regional and national economies in which we operate improve,Further, we may encounter
more increased competition in obtaining lease sites and, as a result, may be unable to negotiate similar levels of tenant incentives under our new leases. If we are unable to obtain similar levels of tenant incentives for a particular unit, we would expect to incur increased capital expenditures in advance of opening and pay lower rent with respect to the restaurant. Our experience has been that labor and operating costs associated with a newly opened restaurant for the first several months of operation are materially greater than what can be expected after that time, both in aggregate dollars and as a percentage of revenues. Our new restaurants commonly take nine months to one year to reach planned operating levels due to inefficiencies typically associated with new restaurants, including the training of new personnel, lack of market awareness, inability to hire sufficient qualified staff and other factors. Additionally, our quarterly results have been and in the future may be impacted by restaurant closures, including by continued lease obligations, employee termination benefits, other closure related obligations and impairment charges. Accordingly, the volume and timing of new restaurant openings and closures has had, and may continue to have, a meaningful impact on our profitability.results of operations. Due to the foregoing factors, results for any one quarter are not necessarily indicative of results to be expected for
any other quarter or for a full fiscal year, and these fluctuations may cause our operating results of operations to be below expectations of public market analysts and investors.
Opening new restaurants in existing markets may negatively affectharm sales at our existing restaurants.
The consumer target area of our restaurants varies by location, depending on a number of factors such as population density, local retail and business attractions, area demographics and geography. As a result, the opening of a new restaurant in or near markets in which we already have existing restaurants could adversely impactharm the sales of new or existing restaurants. Our core business strategy does not entail opening new restaurants that materially impact sales at our existing restaurants but we may selectively open new restaurants in and around areas of existing restaurants that are operating at or near capacity. There can be no assurance that sales cannibalization between our restaurants will not occur or become more significant in the future as we continue to expand our operations.
Our business operations and future development could be significantly disrupted if we lose key members of our management team.
The success of our business continues to depend to a significant degree upon the continued contributions of our senior officers and key employees, both individually and as a group. Our future performance will be substantially dependent in particular on our ability to retain and motivate Steve Hislop, our Chief Executive Officer, and our other senior officers. We currently have employment agreements in place with Messrs. Hislop, Howie and Hatcher and Mrs. Russell. The loss of the services of our CEO, other senior officers or other key employees could have a material adverse effect on our business and plans for future development. We currently have no effective replacement for any of these individuals due to their experience, reputation in the industry and special role in our operations. We also do not maintain any key man life insurance policies for any of our employees.
Our growth may strain our infrastructure and resources, which could slow our development of new restaurants and adversely affect our ability to manage our existing restaurants.
During fiscal years 2015, 20162018, 2019 and 20172020 we opened ten, twelvenine, six and elevenone restaurants, respectively. During 2018,2021, we plan to open a total of eightfour to twelve restaurants for the year.six restaurants. Our future growth may strain our administrative staff, management systems and resources, financial controls and information systems. Those demands on our infrastructure and resources may also adversely affect our ability to manage our existing restaurants. If we fail to continue to improve our infrastructure or to manage other factors necessary for us to meet our expansion objectives, our operatingbusiness, financial condition and results of operations could be materially and adversely affected.harmed. Likewise, if sales decline, we may be unable to reduce our infrastructure quickly enough to prevent sales deleveraging, which would adversely affectharm our profitability.business, financial condition and results of operations.
Our insurance policies may not provide adequate levels of coverage against all claims, and fluctuating insurance requirements and costs could negatively impact our profitability.
We believe our insurance coverage is customary for businesses of our size and type. However, there are types of losses we may incur that cannot be insured against or that we believe are not commercially reasonable to insure. These losses, if they occur, could have a material and adverse effect onharm our business, financial condition and results of operations. In addition, the cost of workers’ compensation insurance, general liability insurance and directors’ and officers’ liability insurance fluctuates based on our historical trends, market conditions and availability. Additionally, health insurance costs in general have risen significantly over the past few years and are expected to continue to increase. These increases, as well as any new federal legislation requiring employers to provide specified levelsregarding healthcare, could harm our business, financial condition and results of health insurance to all employees, could have a negative impact on our profitability,operations, and there can be no assurance that we will be able to successfully offset the effect of such increases with plan modifications and cost control measures, additional operating efficiencies or the pass-through of such increased costs to our customers.
Limitations in our Revolving Credit Facility may limit our ability to invest in the ongoing needs of our business and if we are unable to comply with our financial covenants, our liquidity and results of operations could be adversely affected.
At December 31, 2017 we had no outstanding indebtedness under our Revolving Credit Facility.
Our Revolving Credit Facility places certain conditions on us, including that it:
limits our flexibility in planning for, or reacting to, changes in our business or the industries in which we operate;
makes us more vulnerable to increases in interest rates, as borrowings under our Revolving Credit Facility are at variable rates;
limits our ability to obtain additional financing in the future for working capital or other purposes; and
could place us at a competitive disadvantage compared to our competitors that have less indebtedness.
Our Revolving Credit Facility places certain limitations on our ability to incur additional indebtedness. However, subject to the qualifications and exceptions in our Revolving Credit Facility, we may incur substantial additional indebtedness under that facility and may incur obligations that do not constitute indebtedness under that facility. The Revolving Credit Facility also places certain limitations on, among other things, our ability to enter into certain types of transactions, financing arrangements and investments, to make certain changes to our capital structure and to guarantee certain indebtedness. The Revolving Credit Facility also places certain restrictions on the payment of dividends and distributions. These restrictions limit or prohibit, among other things, our ability to:
pay dividends on, redeem or repurchase our stock or make other distributions;
incur or guarantee additional indebtedness;
sell stock in our subsidiaries;
create or incur liens;
make acquisitions or investments;
transfer or sell certain assets or merge or consolidate with or into other companies; and
enter into certain transactions with our affiliates.
Failure to comply with certain covenants or the occurrence of a change of control under our Revolving Credit Facility could result in the acceleration of our obligations under the Revolving Credit Facility, which would have an adverse effect on our liquidity, capital resources and results of operations.
Our Revolving Credit Facility also requires us to comply with certain financial covenants including a minimum fixed charge coverage ratio and a maximum total lease adjusted leverage ratio. Changes with respect to these financial covenants may increase our interest rate and failure to comply with these covenants could result in a default and an acceleration of our obligations under the Revolving Credit Facility, which would have an adverse effect on our liquidity, capital resources and results of operations.
We may be unable to obtain debt or other financing on favorable terms or at all.
There are inherent risks in our ability to borrow. Our lenders may be unable to lend to us or tighten their lending standards, which could make it more difficult for us to increase the available commitment under our Revolving Credit Facility, refinance our existing indebtedness or to obtain other financing on favorable terms or at all. Our financial condition and results of operations would be adversely affected if we were unable to draw funds under our Revolving Credit Facility because of a lender default or to obtain other cost-effective financing.
Longer term disruptions in the capital and credit markets as a result of uncertainty, changing or increased regulation, reduced alternatives, failures of significant financial institutions or other events could adversely affect our access to liquidity needed for our business. Any disruption could require us to take measures to conserve cash until the markets stabilize or until alternative credit arrangements or other funding for our business can be arranged. Such measures could include deferring capital expenditures (including the opening of new restaurants) and reducing or eliminating other discretionary uses of cash.
We may be required to record asset impairment charges in the future.
In accordance with accounting guidance as it relates to the impairment of long-lived assets, we review long-lived assets, such as property and equipment and intangibles subject to amortization, for impairment when events or circumstances indicate the carrying value of the assets may not be recoverable. In determining the recoverability of the asset value, an analysis is performed at the individual restaurant level and primarily includes an assessment of historical cash flows and other relevant factors and circumstances. Deficient restaurant-level cash flow (defined as restaurant net income plus depreciation, gain and/or loss on assets and pre-opening expense) over the previous 24-month period in a stabilized location is considered a potential impairment indicator. In such situations, the Company evaluates future cash flow projections in conjunction with qualitative factors and future operating plans. Recoverability of assets to be held and used is measured by a comparison of the carrying amount of the restaurant to the estimated undiscounted future cash flow expected to be generated by the restaurant. If the carrying amount of the restaurant exceeds estimated future cash flow, an impairment charge is recognized for the amount by which the asset’s carrying amount exceeds its fair value. As a result of the above-mentioned review process, we recognized a non-cash loss on asset impairment of $4.4 million related to three restaurants in fiscal 2015. We did not recognize an impairment charge during fiscal 2017 or 2016.
Economic weakness within our respective markets could adversely impact consumer discretionary spending and may result in lower restaurant sales. Unfavorable fluctuations in our commodity costs, supply costs and labor rates, which may or may not be within our control, may also impact our operating margins. Any of these factors could as a result affect the estimates used in our impairment analysis and require additional impairment tests and charges to earnings. We continue to assess the performance of our restaurants and monitor the need for future impairment. There can be no assurance that future impairment tests will not result in additional charges to earnings.
Security breaches of confidential customer information in connection with our electronic processing of credit and debit card transactions may adversely affectharm our business.business, financial condition and results of operations.
The majority of our restaurant sales are by credit or debit cards. Other restaurants and retailers have experienced security breaches in which credit and debit card information of their customers has been stolen. We may in the future become subject to lawsuits or other proceedings for purportedly fraudulent transactions arising out of the actual or alleged theft of our customers’ credit or debit card information. In addition, most states have enacted legislation requiring notification of security breaches involving personal information, including credit and debit card information. Any such claim, proceeding, or mandatory notification could cause us to incur significant unplanned expenses, which could have an adverse impact onharm our business, financial condition and results of operations. Further, adverse publicity resulting from these allegations may have a material adverse effect on uscould harm our business, financial condition and our restaurants.results of operations.
We may not be able to adequately protect our intellectual property, which, in turn, could harm the value of our brand and adversely affect our business.
Our ability to implement our business plan successfully depends in part on our ability to build brand recognition in the areas surrounding our locations using our trademarks and other proprietary intellectual property, including our brand names, logos and the unique ambience of our restaurants. We have registered or applied to register a number of our trademarks. We cannot assure you that our trademark applications will be approved. Also, as a result of the settlement agreement with an unaffiliated entity, Baja Chuy’s, we may not use “Chuy’s” in Nevada, California or Arizona, which may have an adverse effect on our growth plans in these states. Additionally, our brand value may be diluted as a result of their use of “Chuy’s” in these states. Third parties may also oppose our trademark applications, or otherwise challenge our use of the trademarks. In the event that our trademarks are successfully challenged, we could be forced to rebrand our goods and services, which could result in loss of brand recognition, and could require us to devote resources to advertising and marketing new brands.
We enforce our rights through a number of methods, including the issuance of cease-and-desist letters or making infringement claims in federal court. If our efforts to register, maintain and protect our trademarks or other intellectual property are
inadequate, or if any third party misappropriates, dilutes or infringes on our intellectual property, the value of our brand may be harmed, which could have a material adverse effect onharm our business and might prevent our brand from achieving or maintaining market acceptance. We may also face the risk of claims that we have infringed third parties’ intellectual property rights. A successful claim of infringement against us could result in our being required to pay significant damages or enter into costly licensing or royalty agreements in order to obtain the right to use a third party’s intellectual property, any of which could have a negative impact onharm our business, financial condition and results of operations and harm our future prospects.operations. If such royalty or licensing agreements are not available to us on acceptable terms or at all, we may be forced to stop the sale of certain products or services. Any claims of intellectual property infringement, even those without merit, could be expensive and time consuming to defend, require us to rebrand our services, if feasible, and divert management’s attention.
We also rely on trade secrets and proprietary know-how to protect our brand. Our methods of safeguarding this information may not be adequate. Moreover, we may face claims of misappropriation or infringement of third parties’ rights that could interfere with our use of this information. Defending these claims may be costly and, if unsuccessful, may prevent us from continuing to use this proprietary information in the future and may result in a judgment or monetary damages. We do not maintain confidentiality agreements with all of our team members or suppliers. Even with respect to the confidentiality agreements we have, we cannot assure you that those agreements will not be breached, that they will provide meaningful protection, or that adequate remedies will be available in the event of an unauthorized use or disclosure of our proprietary information. If competitors independently develop or otherwise obtain access to our trade secrets or proprietary know-how, the appeal of our restaurants could be reduced and our business could be harmed. In addition, if we default under our lease agreements at certain of our locations, our landlord at those locations, Young/Zapp GP, LLC (“Young/Zapp”) and its subsidiaries, may have the right to operate a Tex-Mex or Mexican food restaurant at that location using our recipes and our trade dress. If such default were to occur, the brand value of our recipes and our trade dress might suffer.
Information technology system failures or breaches of our network security could interrupt our operations and adversely affectharm our business.business, financial condition and results of operations.
We rely on our computer systems and network infrastructure across our operations, including point-of-sale processing at our restaurants. Our operations depend upon our ability to protect our computer equipment and systems against damage from physical theft, fire, power loss, telecommunications failure or other catastrophic events, as well as from internal and external security breaches, viruses, worms and other disruptions. Any damage or failure of our computer systems or network infrastructure that
causes an interruption in our operations could have a material adverse effect onor if software or third-party vendors that support our information technology environment are compromised, our business, financial condition and results of operations could be harmed and subject us to litigation or actions by regulatory authorities. Further, adverse publicity resulting from such an event may have a material adverse affect on usharm our business, financial condition and our restaurants.results of operations. Although we have employed both internal resources and external consultants to audit our systems, and test them for vulnerability, and we have implemented firewalls, data encryption and other security controls and intend to maintain and upgrade our security technology and operational procedures to prevent damage, breaches or other disruptions, these measures may not eliminate all risks.
A major natural or man-made disaster could have a material adverse effect on our business.
Most of our corporate systems, processes and corporate support for our restaurant operations are centralized at our headquarters in Austin, Texas, with certain systems and processes being concurrently stored at an offsite storage facility in accordance with our disaster recovery plan. As part of our disaster recovery plan, we have backup processes for our core systems at our co-location facility. If we are unable to fully implement this newour disaster recovery plan fails, we may experience failures or delays in recovery of data, delayed reporting and compliance, an inability to perform necessary corporate functions and other breakdowns in normal operating procedures that could have a material adverse effect onharm our business, financial condition and results of operations and create exposure to administrative and other legal claims against us.
We incur increasedRisks Relating to Our Workforce
Increases in our labor costs, and demands upon managementincluding as a result of complying with the laws and regulations affecting public companies, particularly after we are no longer an “emergingchanges in government regulation, could slow our growth company,” which could adversely affector harm our business, operating results and financial condition.business.
As a public company, we incur significant legal, accounting and other expenses. We are subject to the reporting requirementsa wide range of the Securities Exchange Actlabor costs. Because our labor costs are, as a percentage of 1934, the Sarbanes-Oxley Actrevenues, higher than other industries, we may be significantly harmed by labor cost increases. Unfavorable fluctuations in market conditions, availability of 2002 (the “Sarbanes-Oxley Act”), the Dodd-Frank Wall Street Reforminsurance or changes in state and/or federal regulations could significantly increase our labor costs. We are subject to federal, state, and Consumer Protection Act,local laws governing employment practices and the rulesworking conditions. These laws cover wage and hour practices, labor relations, paid and family leave, and workplace safety, among others. The number of laws and regulations being passed at the state and local level creates unique challenges as different standards apply to different locations, sometimes with conflicting requirements. In addition, we are subject to the risk of employment-related litigation at both the Nasdaq Stock Market. Thesestate and federal levels, including claims styled as class action lawsuits which are more costly to defend. Also, some employment related claims in the area of wage and hour disputes are not insurable risks.
In addition, many of our restaurant personnel are hourly workers subject to various minimum wage requirements or changes to tip credits. Mandated increases in minimum wage levels and changes to the tip credit, which are the amounts an employer is permitted to assume an employee receives in tips when calculating the employee’s hourly wage for minimum wage compliance purposes, have increasedrecently been and will continue to increase our legal, accountingbe proposed and financial compliance costs. Further, we expect that our managementimplemented at both federal and other personnel will needstate government levels. For example, some states do not require employees to divert attention from operationalpool tips in order to share those tips with wait staff, bartenders and other business matters to devote substantial time to these public company requirements.
At the end of fiscal 2017, we lost our status as an “emerging growth company” as defined in the Jumpstart Our Business Startups Act of 2012 (the "JOBs Act").bussing staff. As a result, we are no longer ablemay be required to take advantage of certain exemptions from various reporting requirements. We expect that the loss ofpay our "emerging growth company" statuswait staff, bartenders and compliance with thebussing staff in these states additional requirements willamounts to ensure they receive minimum wage. Continued minimum wage increases or changes to allowable tip credits may further increase our legallabor costs or effective tax rate.
Further, changes to immigration laws may increase our obligations for compliance and financial complianceoversight, which could subject us to additional costs and make our hiring process more cumbersome, or reduce the availability of potential employees. Although we require all workers to provide us with government-specified documentation evidencing their employment eligibility, some activitiesof our employees may, without our knowledge, be unauthorized workers. Unauthorized workers are subject to deportation and may subject us to fines or penalties, and if any of our workers are found to be unauthorized we could experience adverse publicity that negatively impacts our brand and may make it more difficult to hire and keep qualified employees. Termination of a significant number of employees that unbeknown to us were unauthorized employees may disrupt our operations, cause temporary increases in our labor costs as we train new employees and result in additional adverse publicity. Our business, financial condition and results of operations could be harmed as a result of any of these factors.
Labor shortages could increase our labor costs significantly or restrict our growth plans.
Our restaurants are highly dependent on qualified management and operating personnel. Qualified individuals have historically been in short supply and an inability to attract and retain them would limit the success of our existing restaurants as well as our development of new restaurants. We place a heavy emphasis on the qualification and training of our personnel and believe we spend significantly more on training our employees than our competitors. We can make no assurances that we will be able to attract and retain qualified individuals in the future which may have a more significant effect on our operation than those of our competitors. Additionally, the cost of attracting and retaining qualified individuals may be higher than we anticipate, and as a result, our business, financial condition and results of operations could be harmed.
Our business operations and future development could be significantly disrupted if we lose key members of our management team.
The success of our business continues to depend to a significant degree upon the continued contributions of our senior officers and key employees, both individually and as a group. Our future performance will be substantially dependent in particular on our ability to retain and motivate Steve Hislop, our Chief Executive Officer, Jon Howie, our Chief Financial Officer and John Mountfort, our Chief Operating Officer. We currently have employment agreements in place with Messrs. Hislop, Howie, Hatcher and Mountford. The loss of the services of our CEO, other senior officers or other key employees could have a material adverse effect on our business and plans for future development. We currently have no effective replacement for any of these individuals due to their experience, reputation in the industry and special role in our operations. We also do not maintain any key man life insurance policies for any of our employees. If we are unable to retain these key members of management, our business, financial condition and results of operations could be harmed.
Risks Relating to Legal, Regulatory, Tax and Accounting Issues
New legal or regulatory requirements, information or attitudes regarding diet and health or adverse opinions about the health effects of consuming our menu offerings, could affect consumer preferences and negatively impact our results of operations.
Government regulation and consumer eating habits may impact our business as a result of changes in attitudes regarding diet and health or new information regarding the health effects of consuming our menu offerings. These changes have resulted in, and may continue to result in, the enactment of laws and regulations that impact the ingredients and nutritional content of our menu offerings. We are required to publish the total number of calories of standard menu items on menus, along with a statement that puts this calorie information in the context of a total daily calorie intake. We are also required to provide to consumers, upon request, a written summary of detailed nutritional information for each standard menu item, and to provide a statement on menus about the availability of this information. An unfavorable report on, or reaction to, our menu ingredients, the size of our portions, or the nutritional content of our menu items could negatively influence the demand for our offerings. We cannot make any assurances regarding our ability to effectively respond to changes in consumer health perceptions or our ability to adapt our menu offerings to trends and eating habits, which could harm our business, financial condition and results of operations.
Further, many jurisdictions require that we have a food safety and quality management system in which food safety is addressed through the analysis and control of potential hazards from production, procurement and handling, to manufacturing, distribution and consumption of the finished product. We expect to incur certain costs to comply with these regulations and these costs may
be more than we anticipate. Our business, financial condition and results of operations may be harmed if we fail to comply with these laws or regulations or our food management system is unable to prevent an issue.
Federal, state and local laws and regulations may have a significant adverse impact on our operations.
We are required to operate in compliance with federal laws and regulations relating to alcoholic beverages administered by the Bureau of Alcohol, Tobacco, Firearms and Explosives of the U.S. Department of Justice, as well as the laws and licensing requirements for alcoholic beverages of states and municipalities where our restaurants are or will be located. In addition, each restaurant must obtain a food service license from local authorities. Failure to comply with federal, state or local regulations could cause our licenses to be revoked and force us to cease the sale of food or alcoholic beverages at certain locations. Any difficulties, delays or failures in obtaining such licenses, permits or approvals could delay or prevent the opening of a restaurant in a particular area or increase the costs associated therewith. In addition, in certain states, including states where we have existing restaurants or where we plan to open a restaurant, the number of liquor licenses available is limited, and licenses are traded on the open market. Liquor, beer and wine sales comprise a significant portion of our revenues. If we are unable to maintain our existing licenses, customer traffic and our business, financial condition and results of operations could be harmed. Or, if we choose to open a restaurant in those states where the number of licenses available is limited, the cost of a new license could be significant.
We apply for our liquor licenses with the advice of outside legal and licensing consultants. Because of the many and various state and federal licensing and permitting requirements, there is a significant risk that one or more regulatory agencies could determine that we have not complied with applicable licensing or permitting regulations or have not maintained the approvals necessary for us to conduct business within its jurisdiction. Any changes in the application or interpretation of existing laws may adversely impact our restaurants in that state, and could also cause us to lose, either temporarily or permanently, the licenses, permits and regulations necessary to conduct our restaurant operations, and subject us to fines and penalties.
We are also subject to numerous federal, state and local laws affecting our business, including (1) laws relating to (a) immigration, employment, minimum wages, breaks, overtime, tip credits, worker conditions and health care, (b) nutritional labeling, nutritional content, menu labeling and food safety and (c) information security, privacy, cashless payments, gift cards and consumer credit, protection and fraud, (2) the Americans with Disabilities Act, which, among other things, requires our restaurants to meet federally mandated requirements for the disabled, and (3) environmental regulations concerning the handling, storage and disposal of hazardous materials, such as cleaning solvents, and the operation of restaurants in environmentally sensitive locations may impact aspects of our operations. Our inability to comply with these laws could harm our business, financial condition and results of operations.
Restaurant companies have been the target of class-actions and other litigation alleging, among other things, violations of federal and state law.
We are subject to a variety of lawsuits, administrative proceedings and claims that arise in the ordinary course of our business. In recent years, a number of restaurant companies have been subject to claims by customers, employees and others regarding issues such as food safety, personal injury and premises liability, employment-related claims, harassment, discrimination, disability and other operational issues common to the foodservice industry. A number of these lawsuits have resulted in the payment of substantial damages by the defendants. An adverse judgment or settlement that is not insured or is in excess of insurance coverage could harm our business, financial condition and results of operations and could cause variability in our results compared to expectations. We carry insurance policies for a significant portion of our risks and associated liabilities with respect to workers’ compensation, general liability, employer’s liability, health benefits and other insurable risks; however, there can be no assurances that our insurance will cover all such claims. Regardless of whether any claims that may be brought against us are valid or whether we are ultimately determined to be liable, we could also be harmed by negative publicity, litigation costs resulting from the defense of these claims and the diversion of time consuming and costly.resources from our operations.
We are subject to state “dram shop” laws and regulations, which generally provide that a person injured by an intoxicated person may seek to recover damages from an establishment that wrongfully served alcoholic beverages to the intoxicated person. Recent litigation against restaurant chains has resulted in significant judgments, including punitive damages, under such “dram shop” statutes. While we carry liquor liability coverage as part of our existing comprehensive general liability insurance, we may still be subject to a judgment in excess of our insurance coverage, and we may not be able to obtain or continue to maintain such insurance coverage at reasonable costs, if at all. Regardless of whether any claims against us are valid or whether we are liable, we may be harmed by publicity resulting from such laws.
We may be required to record asset impairment charges in the future.
In accordance with accounting guidance as it relates to the impairment of long-lived assets, we review long-lived assets, such as property and equipment, operating lease assets and intangibles subject to amortization, for impairment when events or circumstances indicate the carrying value of the assets may not be recoverable. In determining the recoverability of the asset value, an analysis is performed at the individual restaurant level and primarily includes an assessment of historical cash flows
and other relevant factors and circumstances. Deficient restaurant-level cash flow (defined as restaurant net income plus depreciation, gain and/or loss on assets and pre-opening expense) over the previous 24-month period in a stabilized location is considered a potential impairment indicator. In such situations, the Company evaluates future cash flow projections in conjunction with qualitative factors and future operating plans. Recoverability of assets to be held and used is measured by a comparison of the carrying amount of the restaurant to the estimated undiscounted future cash flow expected to be generated by the restaurant. If the carrying amount of the restaurant exceeds estimated future cash flow, an impairment charge is recognized for the amount by which the asset’s carrying amount exceeds its fair value. As a result of the above-mentioned review process, we recognized a non-cash loss on asset impairment of $20.9 million, $12.7 million and $12.3 million in fiscal years 2020, 2019 and 2018, respectively.
Economic weakness within our respective markets could adversely impact consumer discretionary spending and may result in lower restaurant sales. Unfavorable fluctuations in our commodity costs, supply costs and labor rates, which may or may not be within our control, may also impact our operating margins. Any of these factors could as a result affect the estimates used in our impairment analysis and require additional impairment tests and charges to earnings. We continue to assess the performance of our restaurants and monitor the need for future impairment. There can be no assurance that future impairment tests will not result in additional charges to earnings, which could harm our business, financial condition and results of operations.
Failure of our internal control over financial reporting could adversely affectharm our business, financial condition and financial results.results of operations.
Our management is responsible for establishing and maintaining effective internal control over financial reporting under Section 404 of the Sarbanes-Oxley Act of 2002. Internal control over financial reporting is a process to provide reasonable assurance regarding the reliability of financial reporting for external purposes in accordance with GAAP. Because of its inherent limitations, internal control over financial reporting is not intended to provide absolute assurance that we would prevent or detect a misstatement of our financial statements or fraud. Any failure to maintain an effective system of internal control over financial reporting could limit our ability to report our financial results accurately and timely or to detect and prevent fraud. The identification of a material weakness could indicate a lack of controls adequate to generate accurate financial statements that, in turn, could cause a loss of investor confidence and decline in the market price of our common stock. We cannot assure you that we will be able to timely remediate any material weaknesses that may be identified in future periods or maintain all of the controls necessary for continued compliance. Likewise, we cannot assure you that we will be able to retain sufficient skilled finance and accounting personnel, especially in light of the increased demand for such personnel among publicly traded companies.
Federal, state and local tax laws may adversely impactharm our business, financial condition and results of operations and financial position.operations.
We are subject to federal, state and local taxes in the U.S. If the Internal Revenue Service (“IRS”) or other taxing authority disagrees with the positions we have taken on our tax returns, we could face additional tax liability, including interest and penalties. If material, payment of such additional amounts upon final adjudication of any disputes could have a material impact onharm our business, financial condition and results of operations and financial position.operations. In addition, complying with new tax laws, rules or regulations could impact our business, financial condition and results of operations, and increases to federal or state statutory tax rates and other changes in tax laws, rules or regulations may increase our effective tax rate. Any increase in our effective tax rate could harm our business, financial condition and results of operations.
Our reported financial results may be harmed by changes in accounting principles applicable to us.
Our reported financial results may be harmed by changes in accounting principles applicable to us. Generally accepted accounting principles in the U.S. (“GAAP”) are subject to interpretation by the Financial Accounting Standards Board (“FASB”), the American Institute of Certified Public Accountants, the SEC and various bodies formed to promulgate and interpret appropriate accounting principles. A change in these principles or interpretations could have a material impactsignificant effect on our reported financial results.results, and could affect the reporting of transactions completed before the announcement of a change.
Risks Relating to Our Indebtedness
Limitations in our Revolving Credit Facility may limit our ability to invest in the ongoing needs of our business and if we are unable to comply with our financial covenants, our liquidity and results of operations could be harmed.
At December 27, 2020 we had no outstanding indebtedness under our Revolving Credit Facility.
Our Revolving Credit Facility places certain conditions on us, including that it: (1) limits our flexibility in planning for, or reacting to, changes in our business or the industries in which we operate; (2) makes us more vulnerable to increases in interest rates, as borrowings under our Revolving Credit Facility are at variable rates; (3) limits our ability to obtain additional financing in the future for working capital or other purposes; and (4) could place us at a competitive disadvantage compared to our competitors.
Our Revolving Credit Facility places certain limitations on our ability to incur additional indebtedness. However, subject to the qualifications and exceptions in our Revolving Credit Facility, we may incur substantial additional indebtedness under that facility and may incur obligations that do not constitute indebtedness under that facility. The Revolving Credit Facility also places certain limitations on, among other things, our ability to enter into certain types of transactions, financing arrangements and investments, to make certain changes to our capital structure and to guarantee certain indebtedness. The Revolving Credit Facility also places certain restrictions on the payment of dividends and distributions. These restrictions limit or prohibit, among other things, our ability to: (1) pay dividends on, redeem or repurchase our stock or make other distributions; (2) incur or guarantee additional indebtedness; (3) sell stock in our subsidiaries; (4) create or incur liens; (5) make acquisitions or investments; (6) transfer or sell certain assets or merge or consolidate with or into other companies; and (7) enter into certain transactions with our affiliates.
Failure to comply with certain covenants or the occurrence of a change of control under our Revolving Credit Facility could result in the acceleration of our obligations under the Revolving Credit Facility, which would harm our business, liquidity, capital resources and results of operations.
Our Revolving Credit Facility also requires us to comply with a growth capital expenditure limitation, certain financial covenants including a minimum fixed charge coverage ratio, a maximum total leverage ratio, a minimum liquidity covenant and monthly sales, cash flow and liquidity reporting requirements. Changes with respect to these financial covenants may increase our interest rate and failure to comply with these covenants could result in a default and an acceleration of our obligations under the Revolving Credit Facility, which would harm our business, liquidity, capital resources and results of operations.
We may be unable to obtain debt or other financing on favorable terms or at all.
There are inherent risks in our ability to borrow. Our lenders may be unable to lend to us or tighten their lending standards, which could make it more difficult for us to increase the available commitment under our Revolving Credit Facility, refinance our existing indebtedness or to obtain other financing on favorable terms or at all. Our business, financial condition and results of operations would be harmed if we were unable to draw funds under our Revolving Credit Facility because of a lender default or to obtain other cost-effective financing.
Longer term disruptions in the capital and credit markets as a result of uncertainty, changing or increased regulation, reduced alternatives, failures of significant financial institutions or other events could adversely affect our access to liquidity needed for our business. Any disruption could require us to take measures to conserve cash until the markets stabilize or until alternative credit arrangements or other funding for our business can be arranged, which could harm our business, liquidity, capital resources and results of operations. Such measures could include deferring capital expenditures (including the opening of new restaurants) and reducing or eliminating other discretionary uses of cash.
Risks Relating to Ownership of ourOur Common Stock
The price of our common stock may be volatile and you could lose all or part of your investment.
Volatility in the market price of our common stock may prevent you from being able to sell your shares at or above the price you paid for your shares. The market price of our common stock could fluctuate significantly for various reasons, which may include:
•our quarterly or annual earnings or those of other companies in our industry;
•changes in laws or regulations, or new interpretations or applications of laws and regulations, that are applicable to our business;
•the public’s reaction to our press releases, our other public announcements and our filings with the SEC;
•changes in accounting standards, policies, guidance, interpretations or principles;
•additions or departures of our senior management personnel;
•sales of our common stock by our directors and executive officers;
•adverse market reaction to any indebtedness we may incur or securities we may issue in the future;
•actions by stockholders;
•the level and quality of research analyst coverage for our common stock, changes in financial estimates or investment recommendations by securities analysts following our business or failure to meet such estimates;
•the financial disclosure we may provide to the public, any changes in such disclosure or our failure to meet such disclosure;
•various market factors or perceived market factors, including rumors, whether or not correct, involving us, our distributors or suppliers or our competitors;
•acquisitions or strategic alliances by us or our competitors;
•short sales, hedging and other derivative transactions in our common stock;
•the operating and stock price performance of other companies that investors may deem comparable to us; and
•other events or factors, including public heath crises and changes in general conditions in the United States and global economies or financial markets (including those resulting from acts of God, war, incidents of terrorism or responses to such events).
Recently, the stock market has experienced considerable price and volume fluctuations. This volatility has had an impact on the market price of securities issued by many companies, including companies in our industry. The price of our common stock could fluctuate based upon factors that have little or nothing to do with our company, and these fluctuations could materially reduce our share price.
In the past, following periods of market volatility in the price of a company’s securities, security holders have often instituted class action litigation. If the market value of our common stock experiences adverse fluctuations and we become involved in this type of litigation, regardless of the outcome, we could incur substantial legal costs and our management’s attention could be diverted from the operation of our business, causing our business to suffer.
Future sales of our common stock by us, existing stockholders or holders of equity awards in the public market could lower our share price and the exercise of stock options and any additional capital raised by us through the sale of our common stock or the granting of additional equity-based compensation may dilute your ownership in us.
Sales of substantial amounts of our common stock in the public market by us, our existing stockholders except from registration or upon the exercise of outstanding stock options or stock options granted in the futureequity awards held by our directors and employees may adversely affect the market price of our common stock. Additional capital raised by us through the sale of our common stock or the granting of additional equity-based compensation may dilute your ownership in us. Such sales could also create public perception of difficulties or problems with our business. These sales might also make it more difficult for us to sell securities in the future at a time and price that we deem appropriate.
AsFor additional information regarding our outstanding awards, see Note 11 of December 31, 2017, we have 706,101 shares of common stock reserved for issuance under the 2012 Omnibus Equity Incentive Plan. Additionally there were 274,110 shares of common stock issuable upon exercise of outstanding options, of which 248,745 of these options were fully vested.Notes to Consolidated Financial Statements included elsewhere this annual report.
If securities analysts or industry analysts downgrade our shares, publish negative research or reports, or do not publish reports about our business, our share price and trading volume could decline.
The trading market for our common stock is influenced by the research and reports that industry or securities analysts publish about us, our business and our industry. If one or more analysts adversely change their recommendation regarding our shares or our competitors’ stock, our share price would likely decline. If one or more analysts cease coverage of us or fail to regularly publish reports on us, we could lose visibility in the financial markets, which in turn could cause our share price or trading volume to decline.
Anti-takeover provisions in our charter documents and under Delaware law could make an acquisition of us more difficult, limit attempts by our stockholders to replace or remove our current management and limit the market price of our common stock.
Provisions in our certificate of incorporation and bylaws, as amended and restated, may have the effect of delaying or preventing a change of control or changes in our management. Our amended and restated certificate of incorporation and amended and restated bylaws include provisions that:
•authorize our board of directors to issue, without further action by the stockholders, up to 15,000,000 shares of undesignated preferred stock;
•require that any action to be taken by our stockholders be effected at a duly called annual or special meeting and not by written consent;
•specify that special meetings of our stockholders can be called only by a majority of our board of directors, the Chair of our board of directors, or our Chief Executive Officer;
•establish an advance notice procedure for stockholder proposals to be brought before an annual meeting, including proposed nominations of persons for election to our board of directors;
•establish that our board of directors is divided into three classes, with each class serving three-year staggered terms;
•prohibit cumulative voting in the election of directors;
•provide that our directors may be removed only for cause by the holders of a supermajority of our outstanding shares of capital stock;
•provide that vacancies on our board of directors may be filled only by a majority of directors then in office, even though less than a quorum; and
•require the approval of our board of directors or the holders of a supermajority of our outstanding shares of capital stock to amend our bylaws and certain provisions of our certificate of incorporation.
These provisions may frustrate or prevent any attempts by our stockholders to replace or remove our current management by making it more difficult for stockholders to replace members of our board of directors, which is responsible for appointing the members of our management. In addition, because we are incorporated in Delaware, we are governed by the provisions of Section 203 of the Delaware General Corporation Law, which generally prohibits a Delaware corporation from engaging in any of a broad range of business combinations with any “interested” stockholder (any stockholder with 15% or more of our capital stock) for a period of three years following the date on which the stockholder became an “interested” stockholder.
Since we do not expect to pay any dividends for the foreseeable future, investors may be forced to sell their stock in order to realize a return on their investment.
Since we do not expect to pay any dividends for the foreseeable future, investors may be forced to sell their shares in order to realize a return on their investment. Other than thea special dividend paid in connection with entering into our old credit facility, which was terminated in connection with entering into our Revolving Credit Facility in November 2012,2011, we have not declared or paid any dividends on our common stock. We do not anticipate that we will pay any dividends to holders of our common stock for the foreseeable future. Any payment of cash dividends will be at the discretion of our board of directors and will depend on our financial condition, capital requirements, legal requirements, earnings and other factors. Our ability to pay dividends is restricted by the terms of our Revolving Credit Facility and might be restricted by the terms of any indebtedness that we incur in the future. Consequently, you should not rely on dividends in order to receive a return on your investment. See Item 5. “Market for Registrant’s Common Equity, Related Stockholder Matters and Issuer Purchases of Equity Securities—Dividend Policy.”
Our reported financial results may be adversely affected by changes in accounting principles applicable to us.
Our reported financial results may be adversely affected by changes in accounting principles applicable to us. Generally accepted accounting principles in the U.S. (“GAAP”) are subject to interpretation by the Financial Accounting Standards Board (“FASB”), the American Institute of Certified Public Accountants, the SEC and various bodies formed to promulgate and interpret appropriate accounting principles. A change in these principles or interpretations could have a significant effect on our reported financial results, and could affect the reporting of transactions completed before the announcement of a change. In addition, the SEC has announced a multi-year plan that could ultimately lead to the use of International Financial Reporting Standards by U.S. issuers in their SEC filings. Any such change could have a significant effect on our reported financial results.
Our ability to raise capital in the future may be limited.
Our ability to raise capital in the future may be limited. Our business and operations may consume resources faster than we anticipate. In the future, we may need to raise additional funds through the issuance of new equity securities, debt or a combination of both. Additional financing may not be available on favorable terms, or at all. If adequate funds are not available on acceptable terms, we may be unable to fund our capital requirements. If we issue new debt securities, the debt holders would have rights senior to common stockholders to make claims on our assets, and the terms of any debt could restrict our operations, including our ability to pay dividends on our common stock. If we issue additional equity securities, existing stockholders will experience dilution, and the new equity securities could have rights senior to those of our common stock. Because our decision to issue securities in any future offering will depend on market conditions and other factors beyond our control, we cannot predict or
estimate the amount, timing or nature of our future offerings. Thus, our stockholders bear the risk of our future securities offerings, diluting their interest and reducing the market price of our common stock.
Conflicts of interest may arise with some of our directors.
John Zapp, one of our founders, serves as Chairman of our board of directors. He could invest in entities that directly or indirectly compete with us. As a result of our relationship with John Zapp, when conflicts arise between his interests and the interests of our stockholders, he may not be disinterested.
| |
ITEM 1B. | UNRESOLVED STAFF COMMENTS |
ITEM 1B. UNRESOLVED STAFF COMMENTS
None
ITEM 2. PROPERTIES
As of March 7, 2018,December 27, 2020, we operated 91 Chuy’s92 restaurants located in the following states:
|
| | | | |
| LOCATION | NUMBER OF RESTAURANTS |
| Alabama | 2 |
|
| Arkansas | 3 |
|
| Colorado | 24 |
|
| Florida | 87 |
|
| Georgia | 42 |
|
| Illinois | 21 |
|
| Indiana | 23 |
|
Louisiana | 1 |
|
| Kentucky | 45 |
|
KansasLouisiana | 1 |
|
Maryland | 2 |
|
| Missouri | 1 |
|
| North Carolina | 43 |
|
| Ohio | 46 |
|
| Oklahoma | 3 |
|
| South Carolina | 1 |
|
| Tennessee | 6 |
|
| Texas | 3538 |
|
| Virginia | 6 |
|
| Total | 9192 |
|
| |
As of March 7, 2018December 27, 2020 we have also signed leases and are in development for 10five additional restaurantsrestaurants: one in New Tampa, Doral, KendallAmarillo, Texas; one in Southport, Indiana; one in Pembroke Pines, Florida; one in Brentwood, Tennessee; and Miami, Florida; Orland Park, Illinois; Lakewood and Greenwood Village, Colorado; Houston, Texas; Overland Park, Kansas and Huntsville, Alabama.one in White Bridge, Tennessee. We generally lease all of the land, parking lots and buildings used in our restaurant operations under various long-term operating lease agreements. For additional information regarding our obligations under our leases, see Note 910 to our Consolidated Financial Statements. See Item 1. "Business—Real Estate" for additional information regarding our properties.
All of our restaurant leases provide for base (fixed) rent, plus the majority provide for additional rent based on gross sales (as defined in each lease agreement) in excess of a stipulated amount, multiplied by a stated percentage. A significant percentage of our restaurant leases also provide for periodic escalation of minimum annual rent either based upon increases in the Consumer Price Index or a pre-determined schedule. Typically, the initial lease term is 10 or 15 years in length with two to three five-year extension options. The initial terms of our leases currently expire between 20192021 and 2039.2040. We are also generally obligated to pay certain real estate taxes, insurances, common area maintenance charges and various other expenses related to the properties. Our corporate headquarters is also leased and is located at 1623 Toomey Road, Austin, Texas 78704. We subleased additional office space from certain related parties to expand our corporate headquarters in fiscal year 2017.
Occasionally we are a party to various legal actions arising in the ordinary course of our business including claims resulting from “slip and fall” accidents, employment related claims and claims from customers or employees alleging illness, injury or other food quality, health or operational concerns. None of these types of litigation, most of which are covered by insurance, has had a material effect on us, and as of December 31, 2017, we are not a party to any material pendingITEM 3. LEGAL PROCEEDINGS
For information regarding legal proceedings, and are not aware of any claims that could have a materially adverse effect onsee Note 15 to our financial position, results of operations or cash flows.Consolidated Financial Statements.
| |
ITEM 4. | MINE SAFETY DISCLOSURES |
ITEM 4. MINE SAFETY DISCLOSURES
None
PART II
| |
ITEM 5. | MARKET FOR REGISTRANT’S COMMON EQUITY, RELATED STOCKHOLDER MATTERS AND ISSUER PURCHASES OF EQUITY SECURITIES |
ITEM 5. MARKET FOR REGISTRANT’S COMMON EQUITY, RELATED STOCKHOLDER MATTERS AND ISSUER PURCHASES OF EQUITY SECURITIES
Market Information
Our common shares are traded on the Nasdaq Global Select Market under the symbol “CHUY”. The following table sets forth, for the periods indicated, the high and low sales prices of our common stock, as reported by the Nasdaq Global Select Market:
|
| | | | | | | |
| | High | | Low |
| Fourth Quarter of 2017 (September 25, 2017 – December 31, 2017) | $ | 28.50 |
| | $ | 28.00 |
|
| Third Quarter of 2017 (June 26, 2017 – September 24, 2017) | $ | 25.70 |
| | $ | 18.00 |
|
| Second Quarter of 2017 (March 27, 2017 – June 25, 2017) | $ | 32.10 |
| | $ | 21.59 |
|
| First Quarter of 2017 (December 26, 2016 – March 26, 2017) | $ | 33.60 |
| | $ | 26.60 |
|
| Fourth Quarter of 2016 (September 26, 2016 – December 25, 2016) | $ | 35.30 |
| | $ | 25.87 |
|
| Third Quarter of 2016 (June 27, 2016 – September 25, 2016) | $ | 37.78 |
| | $ | 27.78 |
|
| Second Quarter of 2016 (March 28, 2016 – June 26, 2016) | $ | 35.94 |
| | $ | 28.43 |
|
| First Quarter of 2016 (December 28, 2015 – March 27, 2016) | $ | 37.34 |
| | $ | 27.00 |
|
On March 7, 2018, the closing price of our common stock on the Nasdaq Global Select Market was $27.40 per share.
Holders
As of March 7, 2018,1, 2021, there were approximately 8five holders of record of our common stock. The number of holders of record is based upon the actual numbers of holders registered at such date and does not include holders of shares in “street name” or persons, partnerships, associates, corporations or other entities in security position listings maintained by depositories.
Dividend Policy and Stock Repurchases
During the fiscal years ended December 31, 201727, 2020 and December 25, 201629, 2019 we did not declare or pay any dividends on our common stock. We currently expect to retain future earnings, if any, for use in the operation, growth of our business and, to the extent that our board of directors believes appropriate in light of market conditions, the repurchase of shares of our common stock pursuant to the board-approved share repurchase plan. We currently do not anticipate paying any cash dividends in the foreseeable future. Any future determination to pay cash dividends will be at the discretion of our board of directors and will depend on our financial condition, operating results, capital requirements and such other factors as our board of directors deems relevant. In addition, in certain circumstances, our Revolving Credit Facility restricts our ability to pay dividends. For additional information, see Item 7. “Management’s Discussion and Analysis of Financial Condition and Results of Operations—Liquidity and Capital Resources.”
On October 26, 2017, the Company's board of directors approved a share repurchase program under which it authorized the Company, at its discretion, to repurchase up to $30 million of its common shares outstanding through December 31, 2019. Repurchases of the Company's outstanding common stock will be made in accordance with applicable laws and may be made at management's discretion from time to time in the open market, through privately negotiated transactions or otherwise, including pursuant to Rule 10b5-1 trading plans. There is no guarantee as to the exact number of shares to be repurchased by the Company. The timing and extent of repurchases will depend upon several factors, including market and business conditions, regulatory requirements and other corporate considerations, and repurchases may be discontinued at any time. As of December 31, 2017, we had $30.0 million yet to be repurchased under this plan.
Purchases of Equity Securities by the Issuer
The table below provides information with respect to our purchase of shares of our common stock during the three months ended December 31, 2017:None
|
| | | | | | | | | | | | |
| Period | | Total Number of Shares Purchased (1) | | Average Price Paid Per Share | Total number of shares purchased as part of publicly announced plans or programs | Approximate dollar value of shares that may yet be purchased under the plans or programs (in millions) (2) |
| September 25, 2017 - October 22, 2017 | | — |
| | $ | — |
| — |
| $ | — |
|
| October 23, 2017 - November 19, 2017 | | 217 |
| | 23.4 |
| — |
| 30.0 |
|
| November 20, 2017 - December 31, 2017 | | — |
| | — |
| — |
| 30.0 |
|
| Total | | 217 |
| | $ | 23.4 |
| — |
| |
| |
(1) | Includes shares that were surrendered to the Company to satisfy tax withholding obligations in connection with vesting of restricted stock units. |
| |
(2) | On November 2, 2017, we announced that our Board of Directors authorized us to repurchase an indeterminate number of our common stock through December 31, 2019 at an aggregate market value of up to $30.0 million. |
Stock Performance Chart
The following graph compares the cumulative five-year stockholder return on our common stock relative to the Nasdaq Composite, the S&P 600 Restaurants Index and a peer group consisting of: Bloomin' Brands, Inc., Bravo Brio Restaurant Group, Brinker International, Inc., Buffalo Wild Wings, Inc., The Cheesecake Factory Incorporated, BJ's Restaurants, Inc., Famous Dave's of America, Inc., Red Robin Gourmet Burgers, Inc. and Texas Roadhouse, Inc. The peer group consists of companies which compete in the casual dining segment of the restaurant industry. The comparison assumes a $100 initial investment and the reinvestment of dividends. This graph is furnished and not filed with the SEC. Notwithstanding anything to the contrary set forth in any of our previous filings made under the Securities Act of 1933 or the Securities Exchange Act of 1934 that incorporate future filings made by us under those statutes, the below stock performance graph is not to be incorporated by reference in any prior filings, nor shall it be incorporated by reference into any future filings made by us under those statutes.
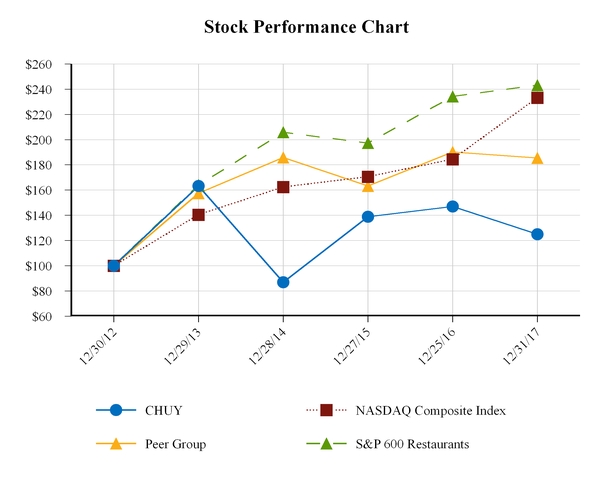
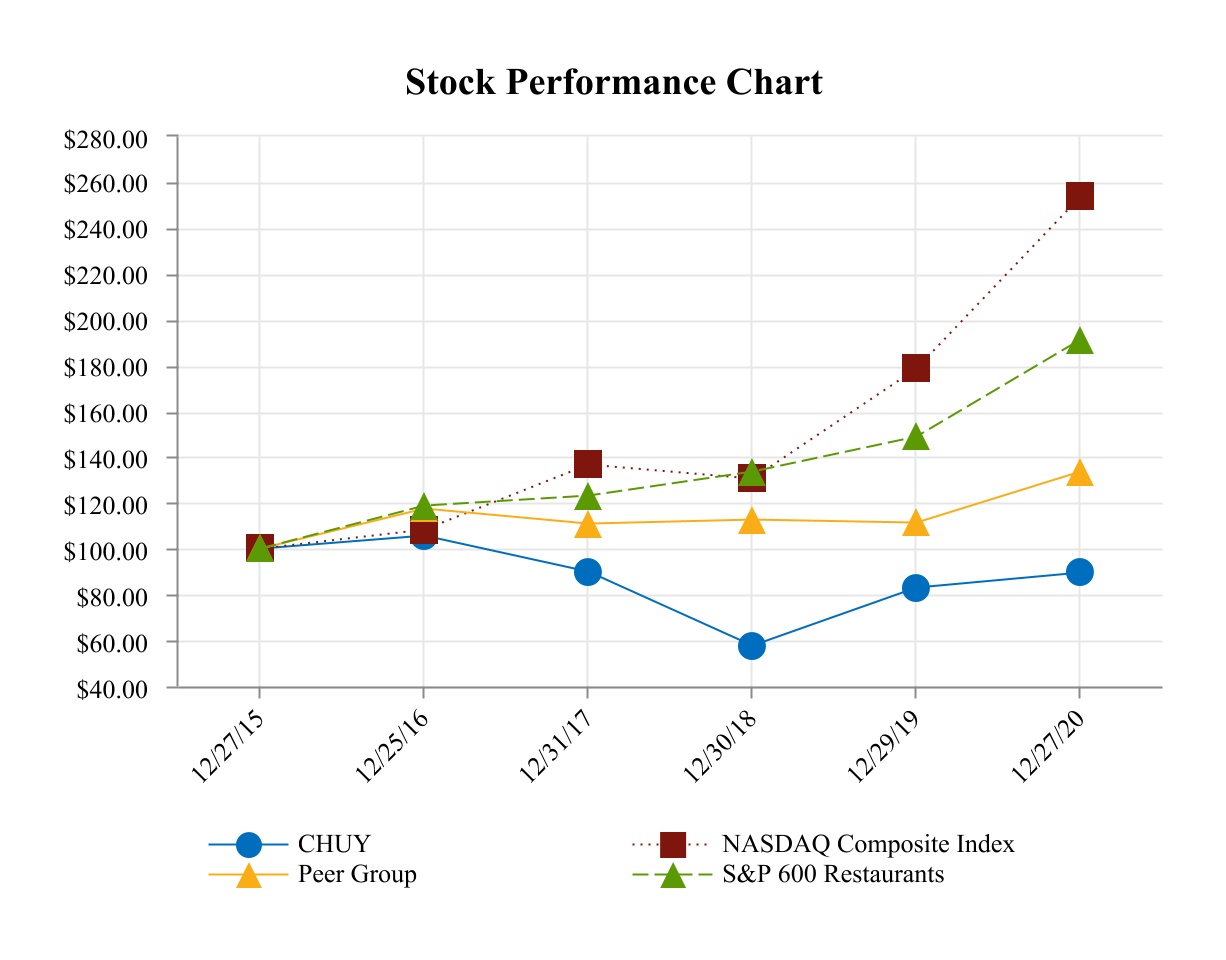
| | | | | | | | | | | | | | | | | | | | |
| 12/27/2015 | 12/25/2016 | 12/31/2017 | 12/30/2018 | 12/29/2019 | 12/27/2020 |
| Chuy's Holdings, Inc. | 100.00 | | 105.81 | | 90.08 | | 57.68 | | 82.95 | | 89.69 | |
| S&P 600 Restaurants | 100.00 | | 118.74 | | 123.26 | | 133.67 | | 148.82 | | 191.34 | |
| Peer Group | 100.00 | | 117.62 | | 110.96 | | 112.50 | | 111.19 | | 133.54 | |
| NASDAQ Composite Index | 100.00 | | 108.20 | | 136.74 | | 130.43 | | 178.40 | | 253.63 | |
|
| | | | | | | | | | | | | | | | | | |
| | 12/30/2012 | 12/29/2013 | 12/28/2014 | 12/27/2015 | 12/25/2016 | 12/31/2017 |
| Chuy's Holdings, Inc. | $ | 100.00 |
| $ | 163.31 |
| $ | 86.89 |
| $ | 138.83 |
| $ | 146.90 |
| $ | 125.06 |
|
| S&P 600 Restaurants | $ | 100.00 |
| $ | 163.95 |
| $ | 205.81 |
| $ | 197.30 |
| $ | 234.29 |
| $ | 243.20 |
|
Peer Group (1) | $ | 100.00 |
| $ | 157.43 |
| $ | 185.92 |
| $ | 163.18 |
| $ | 190.27 |
| $ | 185.54 |
|
| NASDAQ Composite Index | $ | 100.00 |
| $ | 140.41 |
| $ | 162.38 |
| $ | 170.54 |
| $ | 184.53 |
| $ | 233.20 |
|
(1) We believe a peer group performance provides a better comparison to the company's stock performance than the S&P 600 Restaurants Index because it consists of our direct competitors in the casual dining segment of the restaurant industry.
ITEM 6. SELECTED FINANCIAL DATA
The following selected consolidated financial and operating data for each of the five fiscal years in the period ended December 31, 201727, 2020 are derived from our audited consolidated financial statements. Not all periods shown below are discussed in this Annual Report on Form 10-K. This selected consolidated financial and operating data should be read in conjunction with the consolidated financial statements and accompanying notes, “Management’s Discussion and Analysis of Financial Condition and Results of Operations” and other financial information included elsewhere in the Annual Report on Form 10-K. Historical results are not necessarily indicative of future performance.
| | | | | | | | | | | | | | | | | | | | | | | | | | | | | |
| | Fiscal Years Ended (1) |
| December 27, 2020 | | December 29, 2019 | | December 30, 2018 | | December 31, 2017 | | December 25, 2016 |
| | (Amounts are shown in thousands, except per share and store amounts) |
| Consolidated Statements of Income: | | | | | | | | | |
| Revenue | $ | 320,952 | | | $ | 426,357 | | | $ | 398,200 | | | $ | 369,589 | | | $ | 330,613 | |
| Costs and Expenses: | | | | | | | | | |
| Cost of sales | 79,033 | | | 110,152 | | | 101,946 | | | 96,270 | | | 85,542 | |
| Labor | 98,184 | | | 150,779 | | | 144,325 | | | 128,846 | | | 110,730 | |
| Operating | 50,352 | | | 62,121 | | | 57,457 | | | 51,462 | | | 45,900 | |
| Occupancy | 29,406 | | | 32,151 | | | 30,028 | | | 25,642 | | | 22,204 | |
| General and administrative | 22,195 | | | 23,681 | | | 20,725 | | | 18,661 | | | 17,560 | |
| | | | | | | | | |
| | | | | | | | | |
| Marketing | 2,732 | | | 5,555 | | | 3,929 | | | 2,756 | | | 2,390 | |
| Restaurant pre-opening | 1,769 | | | 2,949 | | | 4,382 | | | 6,233 | | | 5,348 | |
| Legal settlement | — | | | 615 | | | — | | | — | | | — | |
| Impairment, closed restaurant and other costs | 26,794 | | | 14,179 | | | 12,336 | | | — | | | 1,517 | |
| Gain on insurance settlements | (1,000) | | | — | | | — | | | (1,362) | | | — | |
| Depreciation | 20,031 | | | 20,739 | | | 19,804 | | | 17,560 | | | 15,081 | |
| Total cost and expenses | 329,496 | | | 422,921 | | | 394,932 | | | 346,068 | | | 306,272 | |
| (Loss) income from operations | (8,544) | | | 3,436 | | | 3,268 | | | 23,521 | | | 24,341 | |
| | | | | | | | | |
| Interest expense, net | 257 | | | 122 | | | 83 | | | 65 | | | 63 | |
| (Loss) income before income taxes | (8,801) | | | 3,314 | | | 3,185 | | | 23,456 | | | 24,278 | |
| Income tax (benefit) expense | (5,507) | | | (2,901) | | | (2,354) | | | (5,500) | | | 7,034 | |
| Net (loss) income | $ | (3,294) | | | $ | 6,215 | | | $ | 5,539 | | | $ | 28,956 | | | $ | 17,244 | |
| Per Share Data: | | | | | | | | | |
| Basic net (loss) income per share | $ | (0.18) | | | $ | 0.37 | | | $ | 0.33 | | | $ | 1.71 | | | $ | 1.03 | |
| Diluted net (loss) income per share | $ | (0.18) | | | $ | 0.37 | | | $ | 0.32 | | | $ | 1.70 | | | $ | 1.02 | |
| Weighted average common stock outstanding | | | | | | | | | |
| Basic | 18,396,335 | | | 16,728,955 | | | 16,931,589 | | | 16,894,986 | | | 16,676,073 | |
| Diluted | 18,396,335 | | | 16,824,395 | | | 17,062,347 | | | 17,003,233 | | | 16,887,882 | |
| Consolidated Balance Sheets Data: | | | | | | | | | |
| Cash and cash equivalents | $ | 86,817 | | | $ | 10,074 | | | $ | 8,199 | | | $ | 8,785 | | | $ | 13,694 | |
Net working capital (deficit) (2) | 51,243 | | | (19,416) | | | (8,818) | | | 929 | | | (417) | |
Total assets (3) | 493,675 | | | 446,069 | | | 277,084 | | | 271,967 | | | 240,728 | |
| | | | | | | | | |
| Total stockholders’ equity | $ | 241,858 | | | $ | 194,936 | | | $ | 193,851 | | | $ | 188,962 | | | $ | 157,065 | |
| | | | | | | | | |
| Total restaurants in operation | 92 | | | 100 | | | 100 | | | 91 | | | 80 | |
(1)We utilize a 52- or 53-week accounting period which ends on the last Sunday of the calendar year. The fiscal year ended December 31, 2017 was comprised of 53 weeks and the other four fiscal years were comprised of 52 weeks.
(2)Net working capital (deficit) includes approximately $48.2 million net proceeds received in the Company's ATM offering during the year ended December 27, 2020.
(3)As a result of the adoption of Leases (Topic 842), total assets include approximately $159.2 million and $169.3 million of operating lease assets as of December 27, 2020 and December 29, 2019 respectively.
|
| | | | | | | | | | | | | | | | | | | |
| | Fiscal Years Ended (1) |
| | December 31, 2017 | | December 25, 2016 | | December 27, 2015 | | December 28, 2014 | | December 29, 2013 |
| | (Amounts are shown in thousands, except per share amounts) |
| Consolidated Statements of Income: | | | | | | | | | |
| Revenue | $ | 369,589 |
| | $ | 330,613 |
| | $ | 287,062 |
| | $ | 245,101 |
| | $ | 204,361 |
|
| Costs and Expenses: | | | | | | | | | |
| Cost of sales | 96,270 |
| | 85,542 |
| | 75,686 |
| | 69,159 |
| | 55,894 |
|
| Labor | 128,846 |
| | 110,730 |
| | 93,625 |
| | 82,665 |
| | 66,565 |
|
| Operating | 51,462 |
| | 45,900 |
| | 39,954 |
| | 33,897 |
| | 29,279 |
|
| Occupancy | 25,642 |
| | 22,204 |
| | 19,019 |
| | 15,167 |
| | 12,262 |
|
| General and administrative | 18,661 |
| | 17,560 |
| | 16,176 |
| | 11,693 |
| | 10,015 |
|
| Secondary offering costs | — |
| | — |
| | — |
| | — |
| | 925 |
|
| Marketing | 2,756 |
| | 2,390 |
| | 2,249 |
| | 1,719 |
| | 1,306 |
|
| Restaurant pre-opening | 6,233 |
| | 5,348 |
| | 4,417 |
| | 4,539 |
| | 3,883 |
|
| Impairment and closure costs | — |
| | 1,517 |
| | 4,360 |
| | — |
| | — |
|
| Gain on insurance settlements | (1,362 | ) | | — |
| | — |
| | — |
| | — |
|
| Depreciation and amortization | 17,560 |
| | 15,081 |
| | 12,827 |
| | 10,310 |
| | 8,858 |
|
| Total cost and expenses | 346,068 |
| | 306,272 |
| | 268,313 |
| | 229,149 |
| | 188,987 |
|
| Income from operations | 23,521 |
| | 24,341 |
| | 18,749 |
| | 15,952 |
| | 15,374 |
|
| Interest expense, net | 65 |
| | 63 |
| | 110 |
| | 124 |
| | 109 |
|
| Income before income taxes | 23,456 |
| | 24,278 |
| | 18,639 |
| | 15,828 |
| | 15,265 |
|
| Income tax (benefit) expense | (5,500 | ) | | 7,034 |
| | 5,743 |
| | 4,337 |
| | 4,196 |
|
| Net income | $ | 28,956 |
| | $ | 17,244 |
| | $ | 12,896 |
| | $ | 11,491 |
| | $ | 11,069 |
|
| Per Share Data: | | | | | | | | | |
| Basic net income per share | $ | 1.71 |
| | $ | 1.03 |
| | $ | 0.78 |
| | $ | 0.70 |
| | $ | 0.68 |
|
| Diluted net income per share | $ | 1.70 |
| | $ | 1.02 |
| | $ | 0.77 |
| | $ | 0.69 |
| | $ | 0.66 |
|
| Weighted average common stock outstanding | | | | | | | | | |
| Basic | 16,894,986 |
| | 16,676,073 |
| | 16,470,278 |
| | 16,427,732 |
| | 16,276,999 |
|
| Diluted | 17,003,233 |
| | 16,887,882 |
| | 16,739,387 |
| | 16,709,471 |
| | 16,677,387 |
|
| Consolidated Balance Sheets Data: | | | | | | | | | |
| Cash and cash equivalents | $ | 8,785 |
| | $ | 13,694 |
| | $ | 8,529 |
| | $ | 3,815 |
| | $ | 5,323 |
|
| Net working capital (deficit) | 929 |
| | (417 | ) | | (7,785 | ) | | (4,823 | ) | | (4,849 | ) |
| Total assets | 271,967 |
| | 240,728 |
| | 201,448 |
| | 179,212 |
| | 151,162 |
|
| Total debt | — |
| | — |
| | — |
| | 8,750 |
| | 6,000 |
|
| Total stockholders’ equity | $ | 188,962 |
| | $ | 157,065 |
| | $ | 133,057 |
| | $ | 118,188 |
| | $ | 104,488 |
|
| |
(1) | We utilize a 52- or 53-week accounting period which ends on the last Sunday of the calendar year. The fiscal year ended December 31, 2017 was comprised of 53 weeks and the other four fiscal years were comprised of 52 weeks. |
| |
ITEM 7. | MANAGEMENT'S DISCUSSION AND ANALYSIS OF FINANCIAL CONDITION AND RESULTS OF OPERATIONS |
ITEM 7. MANAGEMENT'S DISCUSSION AND ANALYSIS OF FINANCIAL CONDITION AND RESULTS OF OPERATIONS
The following discussion should be read in conjunction with Item 6. “Selected Financial Data” and our consolidated financial statements and the related notes to those statements included in Item 8. “Financial Statements and Supplementary Data.”
The following discussion contains, in addition to historical information, forward-looking statements that include risks and uncertainties. Our actual results may differ materially from those anticipated in these forward-looking statements as a result of certain factors, including those set forth under the heading Item 1A. “Risk Factors” and elsewhere in this report.
Although we believe that the expectations reflected in the forward-looking statements are reasonable based on our current knowledge of our business and operations, we cannot guarantee future results, levels of activity, performance or achievements. We assume no obligation to provide revisions to any forward-looking statements should circumstances change, except as may be required by law.
The following discussion summarizes the significant factors affecting the consolidated operating results, financial condition, liquidity and cash flows of our company as of and for the periods presented below.
COVID-19 Pandemic
During March 2020, the World Health Organization declared the COVID-19 outbreak to be a global pandemic and the United States declared a National Public Health Emergency. The COVID-19 pandemic has significantly impacted health and economic conditions throughout the United States. Federal, state and local governments took a variety of actions to contain the spread of COVID-19. Many jurisdictions where our restaurants are located required mandatory closures or imposed capacity limitations and other restrictions affecting our operations. As of December 27, 2020, the Company had reopened dining rooms at varying degrees of operating capacity in its 92 operating restaurants.
Selected monthly comparable restaurant sales and average weekly sales per restaurant for the fourth quarter and first quarter of 2021 to-date are as follows:
| | | | | | | | | | | | | | |
| Month Ending |
| 10/25/20 | 11/22/20 | 12/27/20 | 1/24/21 |
| Comparable Restaurant Sales | (14.2)% | (18.0)% | (21.8)% | (14.7)% |
| Average Weekly Sales per Restaurant | $68,464 | $64,473 | $64,655 | $69,399 |
| Number of Open Restaurants | 92 | 92 | 92 | 92 |
Comparable restaurant sales were negatively impacted by closures of dining rooms in Kentucky, Colorado and Illinois during the latter part of November and December due to the COVID-19 pandemic as well as reduced traffic during the Thanksgiving week and Christmas Day which fell on Friday, a higher volume day, as compared to Wednesday last year. Off-premise sales remained strong at a rate more than double pre-COVID-19 levels ranging from 30% to 35% of all revenue during the fourth quarter and the first quarter of 2021 to date.
During the fiscal year ended December 27, 2020, the Company took various steps to reduce non-essential spend, postpone restaurant development and rightsize operations in light of reduced sales volume to improve our store level profitability and increase our cash flows. The Company also enhanced its liquidity position by selling shares of its common stock in an "At-The-Market" ("ATM") offering and using a portion of the net proceeds to repay the $25.0 million outstanding under its revolving credit facility. As of December 27, 2020, the Company had $86.8 million in cash and cash equivalents, no debt and $25.0 million of availability under its revolving credit facility. Management believes the Company's strong financial position, combined with the measures taken during the pandemic, will allow the Company to meet its financial obligations over the next twelve months.
We cannot predict how soon we will be able to reopen all of our restaurants at full capacity, and our ability to reopen and stay open will depend in part on the actions of a number of governmental bodies over which we have no control. Moreover, once restrictions are lifted, it is unclear how quickly customers will return to our restaurants, which may be a function of continued concerns over safety and/or depressed consumer sentiment due to adverse economic conditions, including job losses.
Overview
We are a fast-growing,growing, full-service restaurant concept offering a distinct menu of authentic, freshly-prepared Mexican and Tex-Mex inspired food. We were founded in Austin, Texas in 1982 by Mike Young and John Zapp, and as of December 31, 2017,27, 2020, we operated 91 Chuy’s92 restaurants across 1917 states.
We are committed to providing value to our customers through offering generous portions of made-from-scratch, flavorful Mexican and Tex-Mex inspired dishes. We also offer a full-service bar in all of our restaurants providing our customers a wide
variety of beverage offerings. We believe the Chuy’s culture is one of our most valuable assets, and we are committed to preserving and continually investing in our culture and our customers’ restaurantdining experience.
Our restaurants have a common décor, but we believe each location is unique in format, offering an “unchained” look and feel, as expressed by our motto “If you’ve seen one Chuy’s, you’ve seen one Chuy’s!” We believe our restaurants have an upbeat, funky, eclectic, somewhat irreverent atmosphere while still maintaining a family-friendly environment.
Our Growth Strategies and Outlook
Our growth is based primarily on the following strategies:
•Pursue new restaurant development in major markets;
•Backfill smaller existing markets to build brand awareness;
•Deliver consistent same store sales by providing high-quality food and service at a considerable value; and
•Leverage our infrastructure.
We opened eleven restaurantsone restaurant in fiscal 2017.2020 and postponed the rest of the planned restaurant development to fiscal 2021 in response to the COVID-19 pandemic. During 2018,fiscal 2021, we plan to open a total of eightfour to twelve restaurants for the year.six restaurants. We have an established presence in Texas, the Southeast and the Midwest, with restaurants in multiple large markets in these regions. Our growth plan over the next five years focuses on developing additional locations in our existing core markets and major new markets while continuing to "backfill" our smaller existing markets in order to build our brand awareness. For additional discussion of our growth strategies and outlook, see Item 1. “Business—Our Business Strategies.”
Newly opened restaurants typically experience normal inefficiencies in the form of higher cost of sales, labor and direct operating and occupancy costs for several months after their opening in both percentage and dollar terms when compared with our more mature, established restaurants. Accordingly, the number and timing of newly opened restaurants has had, and is expected to continue to have, an impact on restaurant opening expenses, cost of sales, labor and occupancy and operating expenses. Additionally, initial restaurant openings in new markets may experience even greater inefficiencies for several months, if not longer, due to lower initial sales volumes, which results from initially low consumer awareness levels, and a lack of operating cost leverage until additional restaurants can be opened in these markets and build the overall consumer awareness in the market.
Performance Indicators
We use the following performance indicators in evaluating our performance:
Number of Restaurant Openings. Number of restaurant openings reflects the number of restaurants opened during a particular fiscal period. For restaurant openings we incur pre-opening costs, which are defined below, before the restaurant opens. Typically new restaurants open with an initial start-up period of higher than normalized sales volumes, which decrease to a steady level approximately six to twelve months after opening. However, operating costs during this initial six to twelve month period are also higher than normal, resulting in restaurant operating margins that are generally lower during the start-up period of operation and increase to a steady level approximately nine to twelve months after opening.
Comparable Restaurant Sales. We consider a restaurant to be comparable in the first full quarter following the eighteenth month of operations. Changes in comparable restaurant sales reflect changes in sales for the comparable group of restaurants over a specified period of time. Changes in comparable sales reflect changes in customer count trends as well as changes in average check. Our comparable restaurant base consisted of 70, 61 and 51 restaurants at December 31, 2017, December 25, 2016 and December 27, 2015, respectively.
Average Check. Average check is calculated by dividing revenue by total entrées sold for a given time period. Average check reflects menu price increases as well as changes in menu mix. Our management team uses this indicator to analyze trends in customers’ preferences, effectiveness of menu changes and price increases and per customer expenditures.
Average Weekly Customers. Average weekly customers is measured by the number of entrées sold per week. Our management team uses this metric to measure changes in customer traffic.
Average Unit Volume. Average unit volume consists of the average sales of our comparable restaurants over a certain period of time. This measure is calculated by dividing total comparable restaurant sales within a period of time by the total number of comparable restaurants within the relevant period. This indicator assists management in measuring changes in customer traffic, pricing and development of our brand.
Operating Margin. Operating margin represents income from operations as a percentage of our revenue. By monitoring and controlling our operating margins, we can gauge the overall profitability of our company.
The following table presents operating data for the periods indicated:
|
| | | | | | | | | | | |
| | Year Ended |
| | December 31, 2017 | | December 25, 2016 | | December 27, 2015 |
| Total restaurants (at end of period) | 91 |
| | 80 |
| | 69 |
|
| Total comparable restaurants (at end of period) | 70 |
| | 61 |
| | 51 |
|
| Average unit volumes (in thousands) | $ | 4,439 |
| (1) | $ | 4,581 |
| | $ | 4,729 |
|
| Change in comparable restaurant sales | (0.7 | )% | (1) | 0.8 | % | | 3.1 | % |
| Average check | $ | 14.75 |
| | $ | 14.48 |
| | $ | 14.23 |
|
| |
(1)
| We consider a restaurant to be comparable in the first full quarter following the eighteenth month of operations. Change in comparable restaurant sales reflect changes in sales for the comparable group of restaurants over a specified period of time. As a result, our comparable restaurant sales calculation above for 2017 is based on the comparable 52- week period. |
Our Fiscal Year
We operate on a 52- or 53-week fiscal year that ends on the last Sunday of the calendar year. Each quarterly period has 13 weeks, except for a 53-week year when the fourth quarter has 14 weeks. Our 2017 fiscal year consisted of 53 weeks, our 2016 and 2015 fiscal years each consisted of 52 weeks.
Key Financial Definitions
Revenue. Revenue primarily consists of food and beverage sales and also includes sales of our t-shirts, sweatshirts and hats. Revenue is presented net of discounts associated with each sale. Revenue in a given period is directly influenced by the number of operating weeks in such period, the number of restaurants we operate and comparable restaurant sales growth.
Cost of Sales. Cost of sales consists primarily of food, beverage and merchandise related costs. The components of cost of sales are variable in nature, change with sales volume and are subject to increases or decreases based on fluctuations in commodity costs.
Labor Costs. Labor costs include restaurant management salaries, front- and back-of-house hourly wages and restaurant-level manager bonus expense, employee benefits and payroll taxes.
Operating Costs. Operating costs consist primarily of restaurant-related operating expenses, such as supplies, utilities, repairs and maintenance, travel cost, insurance, credit card fees, recruiting, delivery service and security. These costs generally increase with sales volume but may increase or decrease as a percentage of revenue.
Occupancy Costs. Occupancy costs include rent charges, both fixed and variable, as well as common area maintenance costs, property insurance and taxes, the amortization of tenant allowances and the adjustment to straight-line rent. These costs are generally fixed but a portion may vary with an increase in sales when the lease contains percentage rent.
General and Administrative Expenses. General and administrative expenses include costs associated with corporate and administrative functions that support our operations, including senior and supervisory management and staff compensation (including stock-based compensation) and benefits, travel, legal and professional fees, information systems, corporate office rent and other related corporate costs.
Marketing. Marketing costs include costs associated with our restaurant marketing programs, community service and sponsorship activities, our menus and other promotional activities.
Restaurant Pre-Opening Costs. Restaurant pre-opening costs consist of costs incurred before opening a restaurant, including manager salaries, relocation costs, supplies, recruiting expenses, initial new market public relations costs, pre-opening activities, employee payroll and related training costs for new employees. Restaurant pre-opening costs also include rent recorded during the period between date of possession and the restaurant opening date.
Impairment and closure costs. Impairment costs include impairment of long-lived assets associated with restaurants where the carrying amount of the asset is not recoverable and exceeds the fair value of the asset. Closure costs consist of any costs associated with the closure of a restaurant, including lease termination costs, rent payments and other miscellaneous closing costs.
Depreciation and Amortization. Depreciation and amortization principally include depreciation on fixed assets, including equipment and leasehold improvements, and amortization of certain intangible assets for restaurants.
Interest Expense. Interest expense consists primarily of interest on our outstanding indebtedness and the amortization of our debt issuance costs reduced by capitalized interest.
Results of Operations
53 Weeks Ended December 31, 2017 Compared to the 52 Weeks Ended December 25, 2016
The following table presents, for the periods indicated, the consolidated statement of operations (in thousands):
|
| | | | | | | | | | | | | | | | | | | | |
| | Year Ended |
| | December 31, 2017 | | % of Revenue | | December 25, 2016 | | % of Revenue | | Change | | % Change |
| Revenue | $ | 369,589 |
| | 100.0 | % | | $ | 330,613 |
| | 100.0 | % | | $ | 38,976 |
| | 11.8 | % |
| Costs and expenses: | | | | | | | | | | | |
| Cost of sales | 96,270 |
| | 26.0 | % | | 85,542 |
| | 25.9 | % | | 10,728 |
| | 12.5 | % |
| Labor | 128,846 |
| | 34.9 | % | | 110,730 |
| | 33.5 | % | | 18,116 |
| | 16.4 | % |
| Operating | 51,462 |
| | 13.9 | % | | 45,900 |
| | 13.9 | % | | 5,562 |
| | 12.1 | % |
| Occupancy | 25,642 |
| | 6.9 | % | | 22,204 |
| | 6.7 | % | | 3,438 |
| | 15.5 | % |
| General and administrative | 18,661 |
| | 5.0 | % | | 17,560 |
| | 5.3 | % | | 1,101 |
| | 6.3 | % |
| Marketing | 2,756 |
| | 0.7 | % | | 2,390 |
| | 0.7 | % | | 366 |
| | 15.3 | % |
| Restaurant pre-opening | 6,233 |
| | 1.7 | % | | 5,348 |
| | 1.6 | % | | 885 |
| | 16.5 | % |
| Impairment and closure costs | — |
| | — | % | | 1,517 |
| | 0.5 | % | | (1,517 | ) | | * |
|
| Gain on insurance settlements | (1,362 | ) | | (0.3 | )% | | — |
| | — | % | | (1,362 | ) | | * |
|
| Depreciation and amortization | 17,560 |
| | 4.8 | % | | 15,081 |
| | 4.6 | % | | 2,479 |
| | 16.4 | % |
| Total costs and expenses | 346,068 |
| | 93.6 | % | | 306,272 |
| | 92.7 | % | | 39,796 |
| | 13.0 | % |
| Income from operations | 23,521 |
| | 6.4 | % | | 24,341 |
| | 7.3 | % | | (820 | ) | | (3.4 | )% |
| Interest expense, net | 65 |
| | 0.1 | % | | 63 |
| | — | % | | 2 |
| | 3.2 | % |
| Income before income taxes | 23,456 |
| | 6.3 | % | | 24,278 |
| | 7.3 | % | | (822 | ) | | (3.4 | )% |
| Income tax (benefit) expense | (5,500 | ) | | (1.5 | )% | | 7,034 |
| | 2.1 | % | | (12,534 | ) | | (178.2 | )% |
| Net income | $ | 28,956 |
| | 7.8 | % | | $ | 17,244 |
| | 5.2 | % | | $ | 11,712 |
| | 67.9 | % |
| | | | | | | | | | | | |
| * Not meaningful | | | | | | | | | | | |
Revenue. Revenue increased $39.0 million, or 11.8%, to $369.6 million for the year ended December 31, 2017, as compared to $330.6 million for the year ended December 25, 2016. The Company's fiscal year 2017 included 53 weeks compared 52 weeks in fiscal year 2016. Revenue attributed to the extra operating week was $7.3 million. In addition to the extra operating week, the increase was primarily driven by $44.6 million in incremental revenue from an additional 567 operating weeks provided by 23 new restaurants opened during and subsequent to the year ended December 25, 2016. This increase was partially offset by a decrease in our comparable sales, a $1.9 million decrease during the second half of the fiscal year as a result of Hurricanes Harvey and Irma as well as revenue from our non-comparable restaurants that are not included in the incremental revenue discussed above. Revenue related to non-comparable restaurants is historically lower as the stores transition out of the 'honeymoon' period that follows a restaurant's initial opening. The honeymoon period refers to the weeks following a restaurant's initial opening, during which sales are typically higher than normal.
Comparable restaurant sales decreased 0.7% during the year for the 52-weeks ended December 24, 2017 compared to the same period in 2016. The decrease in comparable restaurant sales was primarily driven by a 2.3% decrease in average weekly customers, partially offset by a 1.6% increase in average weekly check. Our comparable restaurant sales and average weekly customers were negatively affected by the weather conditions and sporting events by approximately 40 basis points ("bps") and strategic
cannibalization of approximately 40 bps from two Austin restaurants. This decrease was partially offset by about 20 bps as a result of an extra operating day in fiscal 2017 due to the Company’s restaurant closing schedule on Christmas Day in fiscal year 2016. Our total revenue mix attributed to bar sales increased to 18.4% during the year ended December 31, 2017 compared to 18.3% during the same period in 2016.
Cost of Sales. Cost of sales as a percentage of revenue increased to 26.0% during the year ended December 31, 2017, from 25.9% during the comparable period in 2016, primarily as a result of an increase in produce of approximately 20 bps, an increase in chicken of approximately 20 bps, increases in grocery and dairy costs of approximately 20 bps, partially offset by a decrease in beef costs of approximately 40 bps and a decrease in bar costs of approximately 10 bps.
Labor Costs. Labor costs as a percentage of revenue increased to 34.9% during the year ended December 31, 2017, from 33.5% during the comparable period in 2016, primarily due to new store labor inefficiencies, increased management labor as a result of delayed openings in new markets and hourly labor rate inflation of approximately 2.5%.
Operating Costs. Operating costs as a percentage of revenue remained relatively flat at 13.9% during the year ended December 31, 2017 compared to the same period in 2016. This remained flat because higher utilities and insurance costs of 30 bps and higher credit card and delivery charges of 5 bps were offset by hourly health care accrual adjustment of 30 bps and increased operating leverage due to an extra week in the current year.
Occupancy Costs. Occupancy costs as a percentage of revenue increased to 6.9% during the year ended December 31, 2017 from 6.7% during the comparable period in 2016, primarily as a result of higher rental expense at certain newly opened restaurants as we continue our expansion into larger markets, partially offset by 10 bps increase in operating leverage due to an extra week in the current year.
General and Administrative Expenses. General and administrative expenses increased $1.1 million, or 6.3%, to $18.7 million for the year ended December 31, 2017, as compared to $17.6 million during the comparable period in 2016. This increase was primarily driven by an increase in management salaries and equity compensation of $1.9 million due to additional headcount to support our growth, $0.3 million in additional rent expense driven by our corporate office expansion, $0.1 million of additional public company costs, and $0.3 million of various other miscellaneous administrative expenses, partially offset by a $1.5 million decrease in performance based bonuses.
Marketing Costs. Marketing costs as a percentage of revenue remained relatively flat at 0.7% during the year ended December 31, 2017 as compared to the same period in 2016.
Restaurant Pre-opening Costs. Restaurant pre-opening costs increased by $0.9 million, or 16.5%, to $6.2 million for the year ended December 31, 2017, as compared to $5.3 million during the comparable period in 2016. This increase is primarily due to timing of our development schedules and delayed openings in new markets in fiscal year 2017. During the year ended December 31, 2017 we incurred pre-opening costs for eleven new restaurants opened during 2017 as well as nine restaurants which will be opened during fiscal year 2018. During the year ended December 25, 2016 we incurred pre-opening costs for twelve new restaurants and four restaurants which opened in fiscal year 2017.
Impairment and closure costs. Closure costs were $1.5 million for the year ended December 25, 2016 related to the closure and relocation of one restaurant.
Gain on insurance settlements. During the third quarter of 2017, parts of Texas and the Southeast were struck by Hurricanes Harvey and Irma. As a result of the hurricanes, the Company incurred operating losses as well as property damage. The property damage was mainly related to a restaurant in the Houston region which was closed through the middle of the fourth quarter of 2017 and required a complete reconstruction. Most operating losses were offset by the recovery proceeds from our insurance in the same period they were incurred. The insurance settlements related to the property losses were resulted in a gain of $1.4 million recorded in the fourth quarter of 2017.
Depreciation and Amortization. Depreciation and amortization costs increased $2.5 million to $17.6 million for the year ended December 31, 2017, as compared to $15.1 million during the comparable period in 2016, primarily as the result of an increase in equipment and leasehold improvement costs associated with our new restaurants.
Income Tax Expense. Our effective income tax benefit rate is 23.4% for the year ended December 31, 2017 as compared to the effective income tax expense rate of 29.0% during the comparable period in 2016. The decrease in our effective tax rate is primarily related to a non-recurring deferred tax balance revaluation adjustment of $11.7 million recorded in the fourth quarter of 2017 as a result of a decrease in federal statutory tax rate from 35% to 21% effective January 1, 2018. Excluding the impact of the revaluation adjustment, our effective tax rate for fiscal year 2017 was 26.4% as compared to 29.0% for the comparable period in 2016. Our effective tax rate was impacted by several other favorable discrete tax items during the fiscal year 2017 as compared to fiscal year 2016. The effective tax rates differ from the statutory rates primarily due to wage and employment tax related credits, non-deductible expenses, and discrete items.
Net Income. As a result of the foregoing, net income increased by $11.7 million to $28.9 million for the year ended December 31, 2017 as compared to $17.2 million during the comparable period in 2016.
52 Weeks EndedDecember 25, 2016 Compared to the 52 Weeks Ended December 27, 2015
The following table presents, for the periods indicated, the consolidated statement of operations (in thousands):
|
| | | | | | | | | | | | | | | | | | | | |
| | Year Ended |
| | December 25, 2016 | | % of Revenue | | December 27, 2015 | | % of Revenue | | Change | | % Change |
| Revenue | $ | 330,613 |
| | 100.0 | % | | $ | 287,062 |
| | 100.0 | % | | $ | 43,551 |
| | 15.2 | % |
| Costs and expenses: | | | | | | | | | | | |
| Cost of sales | 85,542 |
| | 25.9 | % | | 75,686 |
| | 26.4 | % | | 9,856 |
| | 13.0 | % |
| Labor | 110,730 |
| | 33.5 | % | | 93,625 |
| | 32.6 | % | | 17,105 |
| | 18.3 | % |
| Operating | 45,900 |
| | 13.9 | % | | 39,954 |
| | 13.9 | % | | 5,946 |
| | 14.9 | % |
| Occupancy | 22,204 |
| | 6.7 | % | | 19,019 |
| | 6.6 | % | | 3,185 |
| | 16.7 | % |
| General and administrative | 17,560 |
| | 5.3 | % | | 16,176 |
| | 5.6 | % | | 1,384 |
| | 8.6 | % |
| Marketing | 2,390 |
| | 0.7 | % | | 2,249 |
| | 0.8 | % | | 141 |
| | 6.3 | % |
| Restaurant pre-opening | 5,348 |
| | 1.6 | % | | 4,417 |
| | 1.5 | % | | 931 |
| | 21.1 | % |
| Impairment and closure costs | 1,517 |
| | 0.5 | % | | 4,360 |
| | 1.6 | % | | (2,843 | ) | | (65.2 | )% |
| Depreciation and amortization | 15,081 |
| | 4.6 | % | | 12,827 |
| | 4.5 | % | | 2,254 |
| | 17.6 | % |
| Total costs and expenses | 306,272 |
| | 92.7 | % | | 268,313 |
| | 93.5 | % | | 37,959 |
| | 14.1 | % |
| Income from operations | 24,341 |
| | 7.3 | % | | 18,749 |
| | 6.5 | % | | 5,592 |
| | 29.8 | % |
| Interest expense | 63 |
| | — | % | | 110 |
| | — | % | | (47 | ) | | (42.7 | )% |
| Income before income taxes | 24,278 |
| | 7.3 | % | | 18,639 |
| | 6.5 | % | | 5,639 |
| | 30.3 | % |
| Income tax expense | 7,034 |
| | 2.1 | % | | 5,743 |
| | 2.0 | % | | 1,291 |
| | 22.5 | % |
| Net income | $ | 17,244 |
| | 5.2 | % | | $ | 12,896 |
| | 4.5 | % | | $ | 4,348 |
| | 33.7 | % |
Revenue. Revenue increased $43.6 million, or 15.2%, to $330.6 million for the year ended December 25, 2016, as compared to $287.1 million for the year ended December 27, 2015. This increase was primarily driven by $47.0 million in incremental revenue from an additional 596 operating weeks provided by 22 new restaurants opened during and subsequent to the year ended December 27, 2015 and increased revenue at our comparable restaurants. These increases were partially offset by a decrease in revenue related to non-comparable restaurants that are not included in the incremental revenue discussed above. Revenue related to non-comparable restaurants is historically lower as the stores transition out of the 'honeymoon' period that follows a restaurant's initial opening. The honeymoon period refers to the weeks following a restaurant's initial opening, during which sales are typically higher than normal.
Comparable restaurant sales increased 0.8% during the year ended December 25, 2016 compared to the same period in 2015. The increase in comparable restaurant sales was driven primarily by a 1.5% increase in average check, offset by a 0.7% decrease in average weekly customers. Our comparable restaurant sales and average weekly customers were negatively affected by approximately 20 to 40 bps during fiscal 2016 primarily due to unfavorable weather and Christmas shifting from Friday to Sunday. Our revenue mix attributed to bar sales increased to 18.3% during the year ended December 25, 2016 compared to 18.2% during the same period in 2015.
Cost of Sales. Cost of sales as a percentage of revenue decreased to 25.9% during the year ended December 25, 2016, from 26.4% during the comparable period in 2015, primarily as a result of decreases in grocery and chicken costs, partially offset by increases in produce and beef costs.
Labor Costs. Labor costs as a percentage of revenue increased to 33.5% during the year ended December 25, 2016, from 32.6% during the comparable period in 2015, primarily due to new store labor inefficiencies as we opened twelve new restaurants during 2016 compared to ten new store openings in 2015 and hourly labor rate inflation of approximately 4.0%.
Operating Costs. Operating costs as a percentage of revenue remained flat at 13.9% during the year ended December 25, 2016 from the comparable period in 2015.
Occupancy Costs. Occupancy costs as a percentage of revenue increased to 6.7% during the year ended December 25, 2016 from 6.6% during the comparable period in 2015, primarily as a result of higher rental expense as a percentage of sales in our newer locations, offset by lower real estate and personal property taxes in the current year.
General and Administrative Expenses. General and administrative expenses increased $1.4 million, or 8.6%, to $17.6 million for the year ended December 25, 2016, as compared to $16.2 million during the comparable period in 2015.This increase was primarily driven by an increase in management salaries and equity compensation of $1.7 million due to additional headcount to support our growth, $0.5 million in professional services and other miscellaneous administrative expenses offset by a $0.8 million decrease in performance based bonuses.
Marketing Costs. Marketing costs as a percentage of revenue remained relatively flat at 0.7% during the year ended December 25, 2016, compared to 0.8% during the comparable period in 2015.
Restaurant Pre-opening Costs. Restaurant pre-opening costs increased by $0.9 million, or 21.1%, to $5.3 million for the year ended December 25, 2016, as compared to $4.4 million during the comparable period in 2015. This increase is primarily the result of differences in the timing of our development schedule. During the year ended December 25, 2016, we incurred pre-opening costs for twelve new restaurants compared to ten new restaurants during the comparable period in 2015.
Impairment and closure costs. Closure costs were $1.5 million for the year ended December 25, 2016 related to the closure and relocation of one restaurant. Impairment charges were $4.4 million during the comparable period in 2015 related to three underperfoming restaurants.
Depreciation and Amortization. Depreciation and amortization costs increased $2.3 million to $15.1 million for the year ended December 25, 2016, as compared to $12.8 million during the comparable period in 2015, primarily as the result of an increase in equipment and leasehold improvement costs associated with our new restaurants.
Income Tax Expense. Our effective tax rate decreased to 29.0% for the year ended December 25, 2016 from 30.8% during the comparable period in 2015. The decrease in our effective tax rate is primarily related to an increase in employee tax credits as compared to taxable income for the year ended December 25, 2016 as compared to the comparable period in 2015. Additionally, we recorded a $0.4 million tax item to increase our deferred tax liabilities as a result of our federal statutory tax rate increasing from 34% to 35% during the comparable period in 2015. The effective tax rates differ from the statutory rates primarily due to wage and employment tax related credits, non-deductible expenses, and the above discrete item.
Net Income. As a result of the foregoing, net income increased $4.3 million to $17.2 million for the year ended December 25, 2016 from $12.9 million during the comparable period in 2015.
Liquidity
Our principal sources of cash are net cash provided by operating activities, which includes tenant improvement allowances from our landlords, and borrowings, if any, under our Revolving Credit Facility, which we entered into on November 30, 2012 and amended on October 30, 2015. Our need for capital resources is driven by our restaurant expansion plans, ongoing maintenance of our restaurants, investment in our corporate and information technology infrastructure, obligations under our operating leases and interest payments on our debt, if any. Based on our current growth plans, we believe our expected cash flows from operations, expected tenant improvement allowances and available borrowings under our Revolving Credit Facility will be sufficient to finance our planned capital expenditures and other operating activities for at least the next twelve months.
Consistent with many other restaurant and retail chain store operations, we use operating lease arrangements for our restaurants. We believe that these operating lease arrangements provide appropriate leverage of our capital structure in a financially efficient manner. We have entered into operating leases with certain related parties with respect to six of our restaurants and our corporate headquarters. In 2017, we also subleased additional office space from certain related parties to expand our corporate headquarters.
On October 26, 2017, the Company's board of directors approved a share repurchase program under which it authorized the Company, at its discretion, to repurchase up to $30.0 million of its common shares outstanding through December 31, 2019. Repurchases of the Company's outstanding common stock will be made in accordance with applicable laws and may be made at management's discretion from time to time in the open market, through privately negotiated transactions or otherwise, including pursuant to Rule 10b5-1 trading plans. There is no guarantee as to the exact number of shares to be repurchased by the Company. The timing and extent of repurchases will depend upon several factors, including market and business conditions, regulatory requirements and other corporate considerations, and repurchases may be discontinued at any time. As of December 31, 2017, we have $30.0 million yet to be repurchased under this plan.
Our liquidity may be adversely affected by a number of factors, including a decrease in customer traffic or average check per customer due to changes in economic conditions, as described in Item 1A. “Risk Factors.”
Cash Flows for the Years Ended December 31, 2017, December 25, 2016 and December 27, 2015
The following table summarizes the statements of cash flows for the years ended December 31, 2017, December 25, 2016 and December 27, 2015 (in thousands):
|
| | | | | | | | | | | |
| | Year Ended |
| | December 31, 2017 | | December 25, 2016 | | December 27, 2015 |
| Net cash provided by operating activities | $ | 44,382 |
| | $ | 42,638 |
| | $ | 45,393 |
|
| Net cash used in investing activities | (49,134 | ) | | (41,885 | ) | | (32,000 | ) |
| Net cash (used in) provided by financing activities | (157 | ) | | 4,412 |
| | (8,679 | ) |
| Net (decrease) increase in cash and cash equivalents | (4,909 | ) | | 5,165 |
| | 4,714 |
|
| Cash and cash equivalents at beginning of year | 13,694 |
| | 8,529 |
| | 3,815 |
|
| Cash and cash equivalents at end of period | $ | 8,785 |
| | $ | 13,694 |
| | $ | 8,529 |
|
Operating Activities. Net cash provided by operating activities increased $1.8 million to $44.4 million for the year ended December 31, 2017, from $42.6 million during the same period in 2016. Our business is almost exclusively a cash business. Almost all of our receipts come in the form of cash and cash equivalents and a large majority of our expenditures are paid within a 30 day period. The increase in net cash provided by operating activities during the year ended December 31, 2017 compared to the same period in 2016 was primarily due to an increase in net income of $11.7 million, partially offset by a decrease in non-cash reconciling items of $6.1 million and decreases in cash flow from operating assets and liabilities of $3.8 million. The decrease in non-cash items of $6.1 million was primarily due to a $10.8 million decrease in deferred taxes mainly related to H.R.1, commonly referred to as the Tax Cuts and Jobs Act, and a $1.4 million decrease in impairment and closure costs, partially offset by $3.3 million increase from excess tax benefits, $2.5 million increase related to depreciation and amortization and an increase of $0.3 million in other changes. The decrease in working capital of $3.8 million was primarily due to net changes in accounts receivable, accounts payable, accrued liabilities and deferred lease incentives of $7.9 million, of which $1.3 million relates to an insurance receivable recorded in the fourth quarter of 2017, partially offset by net changes in income tax receivables, prepaid expenses and other current assets as well as inventories of $4.1 million.
Net cash provided by operating activities decreased $2.8 million to $42.6 million for the year ended December 25, 2016, from $45.4 million during the same period in 2015. The decrease in net cash provided by operating activities during the year ended December 25, 2016 compared to the same period in 2015 was primarily due to decreases in non-cash reconciling items of $3.6 million and decreases in cash flow from operating assets and liabilities of $3.5 million partially offset by an increase in net income of $4.3 million. The decreases in non-cash reconciling items were primarily related to decreases in excess tax benefits from stock-based compensation of $3.2 million, decreases in impairment and closure costs of $3.0 million and decreases in deferred lease amortization of $0.4 million, offset by increases in depreciation and amortization of $2.3 million as a result of our continued expansion, increases in stock based compensation of $0.5 million and increases in deferred income taxes of $0.4 million. The net decreases from changes in operating assets and liabilities of $3.5 million primarily related to net changes in prepaid expenses and other current assets, income tax receivables and accounts receivable of $2.6 million and net decreases in accounts payable, accrued liabilities and deferred lease incentives of $0.8 million.
Investing Activities. Net cash used in investing activities increased $7.2 million to $49.1 million for the year ended December 31, 2017, from $41.9 million for the year ended 2016. This increase was mainly the result of the timing of our construction schedule and the related payments associated with the construction of our eleven new restaurants that opened during the year ended December 31, 2017, as well as expenditures related to the reconstruction of one restaurant that was severely damaged by Hurricane Harvey and eight additional unopened restaurants under construction at December 31, 2017 as compared to twelve new restaurants opened and four additional restaurants under construction during the comparable period in 2016. This increase was partially offset by $0.5 million of insurance proceeds from property claims.
Net cash used in investing activities increased $9.9 million to $41.9 million for the year ended December 25, 2016, from $32.0 million for the year ended 2015. This change was the result of the timing of our construction schedule and the related construction payments associated with the construction of our twelve new restaurants that opened during the year ended December 25, 2016, as well as expenditures related to four additional unopened restaurants under construction at December 25, 2016 as compared to ten new restaurants opened and six additional restaurants under construction during the comparable period in 2015.
Financing Activities. Net cash used in financing activities was $0.2 million for the year ended December 31, 2017 as compared to $4.4 million provided by financing activities during the same period in 2016. The decrease in net cash provided by financing activities was primarily the result of $3.3 million decrease in excess tax benefits, $0.2 million decrease in indirect repurchases of shares and $1.1 million decrease in proceeds from the exercise of stock options during the year ended December 31, 2017.
Net cash provided by financing activities increased $13.1 million to $4.4 million for the year ended December 25, 2016 from $8.7 million used in financing activities during the same period in 2015. This increase in net cash provided by financing activities was primarily the result of an $8.8 million decrease in net payments on the Revolving Credit facility, a $3.2 million increase in excess tax benefits and $1.3 million increase in proceeds from the exercise of stock options during the year ended December 25, 2016. These were partially offset by a decrease of $0.3 million related to the indirect repurchase of shares for minimum tax withholdings.
As of December 31, 2017, we leased six of our restaurant locations and our corporate office from entities owned by our founders and one of our executive officers. We had no other financing transactions, arrangements or other relationships with any unconsolidated affiliates or related parties. Additionally, we had no financing arrangements involving synthetic leases or trading activities involving commodity contracts.
Capital Resources
Long-Term Capital Requirements
Our capital requirements are primarily dependent upon the pace of our growth plan and resulting new restaurants. Our growth plan is dependent upon many factors, including economic conditions, real estate markets, restaurant locations and the nature of our lease agreements. Our capital expenditure outlays are also dependent on maintenance and remodel costs in our existing restaurants as well as information technology and other general corporate capital expenditures.
The capital resources required for a new restaurant depend on whether the restaurant is a ground-up construction or a conversion. For our new unit openings, we estimate the cost of a conversion or ground-up buildout will require a total cash investment of $2.6 million to $3.6 million (net of estimated tenant incentives of between zero and $1.0 million). In addition, we expect to spend approximately $400,000 to $475,000 per restaurant for restaurant pre-opening costs. We currently target a cash-on-cash return beginning in the third operating year of 30.0%, and a sales to investment ratio of 1.9:1 for our new restaurants.
For 2018, we currently estimate capital expenditure outlays will range between $30.0 million and $40.0 million, net of agreed upon tenant improvement allowances and excluding approximately $3.7 million to $5.5 million of restaurant pre-opening costs for new restaurants that are not capitalized. These capital expenditure estimates are based on average new restaurant capital expenditures of $2.9 million (net of estimated tenant improvement allowances) each for the opening of 8 to 12 new restaurants as well as $8.7 million to maintain and remodel our existing restaurants, expand our corporate office and for other general corporate purposes.
Based on our growth plans, we believe our combined expected cash flows from operations, available borrowings under our Revolving Credit Facility and expected tenant improvement allowances will be sufficient to finance our planned capital expenditures and other operating activities in fiscal 2018.
Short-Term Capital Requirements
Our operations have not required significant working capital and, like many restaurant companies, we operate with negative working capital. Restaurant sales are primarily paid for in cash or by credit card, and restaurant operations do not require significant inventories or receivables. In addition, we receive trade credit for the purchase of food, beverages and supplies, therefore reducing the need for incremental working capital to support growth. We had a net working capital surplus of $0.9 million at December 31, 2017, compared to a deficit of $0.4 million at December 25, 2016.
Revolving Credit Facility
On November 30, 2012, we entered into our $25.0 million Revolving Credit Facility with Wells Fargo Bank, National Association. On October 30, 2015, we entered into an amendment to our Revolving Credit Facility to, among other things, (1) extend the maturity date of the Revolving Credit Facility to October 30, 2020 from November 30, 2017 and (2) revise the applicable margins and leverage ratios that determine the commitment fees and interest rates payable by the Company under the Revolving Credit Facility. As of December 31, 2017 we had no outstanding indebtedness under our Revolving Credit Facility.
Under our Revolving Credit Facility, we may request to increase the size of our Revolving Credit Facility by up to $25.0 million, in minimum principal amounts of $5.0 million or the remaining amount of the $25.0 million if less than $5.0 million (the "Incremental Revolving Loan"), the Incremental Revolving Loan will be effective after 10 days written notice to the agent. In the event that any of the lenders fund the Incremental Revolving Loan, the terms and provisions of the Incremental Revolving Loan will be the same as under our Revolving Credit Facility.
Borrowings under the Revolving Credit Facility generally bear interest at a variable rate based upon our election, of (i) the base rate (which is the highest of prime rate, federal funds rate plus 0.5% or one month LIBOR plus 1%), or (ii) LIBOR, plus, in either case, an applicable margin based on our consolidated total lease adjusted leverage ratio (as defined in the Revolving Credit Facility agreement). Our Revolving Credit Facility also requires payment for commitment fees that accrue on the daily unused commitment of the lender at the applicable margin, which varies based on our consolidated total lease adjusted leverage ratio. In addition, the revolving line of credit requires compliance with a fixed charge coverage ratio, a lease adjusted leverage ratio and certain non-
financial covenants as well as places certain restrictions on the payment of dividends and distributions. Under the Revolving Credit Facility, Chuy's may declare and make dividend payments so long as (i) no default or event of default has occurred and is continuing or would result therefrom and (ii) immediately after giving effect to any such dividend payment, on a pro forma basis, the lease adjusted leverage ratio does not exceed 3.50 to 1.00.
As of December 31, 2017, we were in compliance with all covenants under our Revolving Credit Facility. Based on our capital expenditure plans, contractual commitments and cash flow from operations, we expect to be able to comply with these covenants in the near and long term.
Contractual Obligations
The following table summarizes contractual obligations at December 31, 2017 (in thousands):
|
| | | | | | | | | | | | | | | | | | | |
| | Payment Due By Period |
| | Total | | Less Than 1 Year | | 1-3 Years | | 3-5 Years | | More Than 5 Years |
| Contractual Obligations: | | | | | | | | | |
Long-Term Debt Obligations (1) | $ | 88 |
| | $ | 31 |
| | $ | 57 |
| | $ | — |
| | $ | — |
|
Operating Lease Obligations (2) | 404,691 |
| | 23,834 |
| | 48,886 |
| | 48,465 |
| | 283,506 |
|
Purchase Obligations (3) | 29,056 |
| | 28,515 |
| | 541 |
| | — |
| | — |
|
| Total | $ | 433,835 |
| | $ | 52,380 |
| | $ | 49,484 |
| | $ | 48,465 |
| | $ | 283,506 |
|
| |
(1) | Reflects fees on unused revolver commitments under our Revolving Credit Facility. As of December 31, 2017, no indebtedness was outstanding. All amounts under our Revolving Credit Facility are due October 30, 2020. |
| |
(2) | Reflects the aggregate minimum lease payments for our restaurant operations and corporate office. Operating lease obligations excludes contingent rent payments that may be due under certain of our leases based on a percentage of sales. |
| |
(3) | Includes contractual purchase commitments for the purchase of goods related to restaurant operations and commitments for construction of new restaurants. |
Off-Balance Sheet Arrangements
As part of our on-going business, we do not participate in transactions that generate relationships with unconsolidated entities or financial partnerships, such as entities referred to as structured finance or variable interest entities, which would have been established for the purpose of facilitating off-balance sheet arrangements or other contractually narrow or limited purposes. As of December 31, 2017, we are not involved in any variable interest entities transactions and do not otherwise have any off-balance sheet arrangements.
Critical Accounting Policies
Our consolidated financial statements and accompanying notes are prepared in accordance with accounting principles generally accepted in the United States of America. Preparing consolidated financial statements requires us to make estimates and assumptions that affect the reported amounts of assets, liabilities, revenue and expenses. These estimates and assumptions are affected by the application of our accounting policies. Our significant accounting policies are described in Note 2 to our Consolidated Financial Statements. Critical accounting estimates are those that require application of management’s most difficult, subjective or complex judgments, often as a result of matters that are inherently uncertain and may change in subsequent periods. While we apply our judgment based on assumptions believed to be reasonable under the circumstances, actual results could vary from these assumptions. It is possible that materially different amounts would be reported using different assumptions. The following is a description of what we consider to be our most significant critical accounting policies.
Leases and Leasehold Improvements. We lease land, buildings and/or certain equipment for the majority of our restaurants under noncancelable lease agreements. Our land and building leases typically have initial terms ranging from 10 to 15 years, and certain renewal options for two or more five-year periods. When determining the lease term, we include option periods for which failure to renew the lease imposes a penalty on us in such an amount that a renewal appears, at the inception of the lease, to be reasonably assured. The primary penalty to which we are subject is the economic detriment associated with the existence of leasehold improvements which might become impaired if we choose not to continue the use of the leased property.
Certain of our operating leases contain predetermined fixed escalations of the minimum rent during the original term of the lease. For these leases, we recognize the related rent expense on a straight-line basis over the lease term and record the difference between the amounts charged to operations and amounts paid as deferred rent. We may receive rent holidays, which would begin on the possession date and end on the date construction of the restaurant begins, during which no cash rent payments are typically due under the terms of the lease. Rent holidays are included in the lease term when determining straight-line rent expense.
Additionally, certain of our operating leases contain clauses that provide for additional contingent rent based on a percentage of sales greater than certain specified target amounts. We recognize contingent rent expense prior to the achievement of the specified target that triggers the contingent rent, provided achievement of the target is considered probable. This may result in some variability in rent expense as a percentage of revenues over the term of the lease in restaurants where we pay contingent rent.
We make judgments regarding the probable term for each restaurant property lease, which can impact the classification and accounting for a lease as capital or operating, the rent holiday and/or escalations in payments that are taken into consideration when calculating straight-line rent and the term over which leasehold improvements and deferred lease incentives for each restaurant are amortized. These judgments may produce materially different amounts of depreciation, amortization and rent expense than would be reported if different assumed lease terms were used.
Impairment of Long-Lived Assets. We review long-lived assets, such as property and equipment and intangibles, subject to amortization, for impairment when events or circumstances indicate the carrying value of the assets may not be recoverable. We have determined that our asset group for impairment testing is comprised of the assets and liabilities of each of our individual restaurants, as this is the lowest level of identifiable cash flows and primarily includes an assessment of historical cash flows and other relevant factors and circumstances. The other factors and circumstances include changes in the economic environment, changes in the manner in which assets are used, unfavorable changes in legal factors or business climate, incurring excess costs in construction of the asset, overall restaurant operating performance and projections for future performance. These estimates result in a wide range of variability on a year to year basis due to the nature of the criteria.
We regularly review restaurant-level cash flow over the previous 24-month period to determine if potential impairment indicators exist and if further testing is warranted. In such situations, we evaluate future undiscounted cash flow projections in conjunction with qualitative factors and future operating plans. Our impairment assessment process requires the use of estimates and assumptions regarding future undiscounted cash flows and operating outcomes, which are based upon a significant degree of management’s judgment. In performing our impairment testing, we forecast our future undiscounted cash flows by looking at recent restaurant level performance, restaurant level operating plans, sales trends, and cost trends for cost of sales, labor and operating expenses. We believe that this combination of information gives us a fair benchmark to estimate future undiscounted cash flows. We compare this cash flow forecast to the carrying value of the restaurant. Based on this analysis, if we believe the carrying amount of the assets are not recoverable, an impairment charge is recognized based upon the amount by which the long-lived assets carrying value exceeds fair value. As a result of the above mentioned review process, we recognized a $4.4 million non-cash loss on asset impairment related to three restaurants in fiscal 2015. We did not recognize an impairment charge during fiscal 2017 and 2016.
Economic deterioration within our respective markets may adversely impact consumer discretionary spending and may result in lower restaurant sales. Unfavorable fluctuations in our commodity costs, supply costs and labor rates, which may or may not be within our control, may also impact our operating margins. Any of these factors could as a result affect the estimates used in our impairment analysis and require additional impairment tests and charges to earnings. We continue to assess the performance of our restaurants and monitor the need for future impairment. There can be no assurance that future impairment tests will not result in additional charges to earnings.
Goodwill and Other Intangible Assets. Goodwill and indefinite life intangible assets are not amortized but are tested annually on the first day of the fourth quarter, or more frequently if events or changes in circumstances indicate that the assets might be impaired. In assessing the recoverability of goodwill and indefinite life intangible assets, the Company must make assumptions about the estimated future cash flows and other factors to determine the fair value of these assets.
For goodwill, the Company performs tests to assess potential impairments on the first day of the fourth quarter or during the year if an event or other circumstance indicates that goodwill may be impaired. The first step of the goodwill quantitative impairment test compares the implied estimated fair value of the reporting unit to the carrying amount, including goodwill. The Company considers all of its stores in total as one reporting unit. If the estimated fair value of the reporting unit is less than the carrying amount, then it is more likely than not that a goodwill impairment exits and a second step must be completed in order to determine the amount of the goodwill impairment. In the second step, the implied fair value of the goodwill is determined by allocating fair value to all of its assets and liabilities, other than goodwill, in a manner similar to a purchase price allocation. If the resulting implied fair value of the goodwill that results from the application of this second step is less than the carrying amount of the goodwill, an impairment charge is recorded for the difference. Our analysis indicated that no impairments of goodwill or indefinite-lived intangibles occurred during fiscal 2017, 2016 or 2015.
Similarly, for the impairment evaluation for indefinite life intangible assets, which includes our trade names, we first perform a quantitative assessment to determine whether the estimated fair value of the indefinite-lived intangible asset is less than its carrying value. We calculate the estimated fair value of the indefinite-lived intangible asset and compare it to the carrying value. Fair value is estimated primarily using future discounted cash flow projections in conjunction with qualitative factors and future operating plans. When the carrying value exceeds fair value, an impairment charge is recorded for the amount of the difference. An intangible asset is determined to have an indefinite useful life when there are no legal, regulatory, contractual, competitive, economic or other factors that may limit the period over which the asset is expected to contribute directly or indirectly to the future cash flows
of the Company. The Company also annually evaluates intangible assets that are not being amortized to determine whether events and circumstances continue to support an indefinite useful life. If an intangible asset that is not being amortized is determined to have a finite useful life, the asset will be amortized prospectively over the estimated remaining useful life and accounted for in the same manner as intangible assets subject to amortization.
Income Taxes. Income tax provisions consist of federal and state taxes currently due, plus deferred taxes. Deferred tax assets and liabilities are recognized for the future tax consequences attributable to temporary differences between the financial statement carrying amounts of existing assets and liabilities and their respective tax basis. Deferred tax assets and liabilities are measured using enacted tax rates expected to apply to taxable income in the years in which those temporary differences are expected to be recovered or settled. Deferred tax assets are recognized when management considers the realization of those assets in future periods to be more likely than not. Future taxable income, adjustments in temporary difference, available carryforward periods and changes in tax laws could affect these estimates.
Stock-Based Compensation. Compensation cost for stock options and deferred shares (these deferred shares were granted under the Chuy's Holdings, Inc. 2012 Omnibus Equity Incentive Plan, and are referred to as "restricted stock units") granted is determined based on the fair value of the security at the date of grant and is recognized, net of estimated forfeitures, over the award’s requisite service period on a straight-line basis. The fair value of the restricted stock units is the quoted market value of our common stock on the date of grant. We use the Black-Scholes valuation model to determine the fair value of our stock options, which requires assumptions to be made regarding our stock price volatility, the expected life of the award, risk-free interest rate, and expected dividend rates. The volatility assumptions were derived from the volatilities of comparable public restaurant companies. If factors change and we employ different assumptions, stock-based compensation expense may differ significantly from what we have recorded in the past. If there is a difference between the assumptions used in determining stock-based compensation expense and the actual factors which become known over time, we may change the input factors used in determining stock-based compensation costs for future grants. These changes, if any, may materially impact our results of operations in the period such changes are made. We expect to continue to grant stock options and restricted stock units in the future, and to the extent that we do, our actual stock-based compensation expense recognized in future periods will likely increase.
Recent Accounting Pronouncements
The information regarding recent accounting pronouncements materially affecting our consolidated financial statements is included in Note 2 to our consolidated financial statements.
Inflation
Our profitability is dependent, among other things, on our ability to anticipate and react to changes in the costs of key operating resources, including food and other raw materials, labor, energy and other supplies and services. Substantial increases in costs and expenses could impact our operating results to the extent that such increases cannot be passed along to our restaurant customers. The impact of inflation on food, labor, energy and occupancy costs can significantly affect the profitability of our restaurant operations.
Many of our restaurant staff members are paid hourly rates related to the federal minimum wage. Labor costs related to hourly wages have been impacted by and will continue to be impacted by mandated increases in minimum wage rates at the federal, state and local levels. Certain operating costs, such as taxes, insurance and other outside services increase with the general level of inflation and may also be subject to other cost and supply fluctuations outside of our control.
While we have been able to partially offset inflation and other changes in the costs of key operating resources by gradually increasing prices for our menu items, more efficient purchasing practices, productivity improvements and greater economies of scale, there can be no assurance that we will be able to continue to do so in the future. From time to time, competitive conditions could limit our menu pricing flexibility. In addition, macroeconomic conditions could make additional menu price increases imprudent. There can be no assurance that all future cost increases can be offset by increased menu prices or that increased menu prices will be fully absorbed by our restaurant customers without any resulting changes in their visit frequencies or purchasing patterns. A majority of the leases for our restaurants provide for contingent rent obligations based on a percentage of revenue. There can be no assurance that we will continue to generate increases in comparable restaurant sales in amounts sufficient to offset inflationary or other cost pressures.
Performance Indicators
We use the following performance indicators in evaluating our performance:
•Number of Restaurant Openings. Number of restaurant openings reflects the number of restaurants opened during a particular fiscal period. For restaurant openings we incur pre-opening costs, which are defined below, before the restaurant opens. Typically new restaurants open with an initial start-up period of higher than normalized sales volumes, which decrease to a steady level approximately six to twelve months after opening. However, operating costs during this initial six to twelve month period are also higher than normal, resulting in restaurant operating margins that are generally lower during the start-up period of operation and increase to a steady level approximately nine to twelve months after opening.
•Comparable Restaurant Sales. We consider a restaurant to be comparable in the first full quarter following the eighteenth month of operations. Changes in comparable restaurant sales reflect changes in sales for the comparable group of restaurants over a specified period of time. Changes in comparable sales reflect changes in customer count trends as well as changes in average check. Our comparable restaurant base consisted of 86, 88 and 81 restaurants at December 27, 2020, December 29, 2019 and December 30, 2018, respectively.
•Average Weekly Sales per Restaurant. Average Weekly Sales per Restaurant is calculated by dividing total weekly sales by number of operating restaurants in a given week.
•Average Check. Average check is calculated by dividing revenue by total entrées sold for a given time period. Average check reflects menu price increases as well as changes in menu mix. Our management team uses this indicator to analyze trends in customers’ preferences, effectiveness of changes in menu and price increases as well as per customer expenditures.
•Average Weekly Customers. Average weekly customers is measured by the number of entrées sold per week. Our management team uses this metric to measure changes in customer traffic.
•Average Unit Volume. Average unit volume consists of the average sales of our comparable restaurants over a certain period of time. This measure is calculated by dividing total comparable restaurant sales within a period of time by the total number of comparable restaurants within the relevant period. This indicator assists management in measuring changes in customer traffic, pricing and development of our brand.
•Operating Margin. Operating margin represents income from operations as a percentage of our revenue. By monitoring and controlling our operating margins, we can gauge the overall profitability of our company.
The following table presents operating data for the periods indicated:
| | | | | | | | | | | |
| | Year Ended |
| | December 27, 2020 | December 29, 2019 | December 30, 2018 |
| Total restaurants (at end of period) | 92 | | 100 | | 100 | |
| Total comparable restaurants (at end of period) | 86 | | 88 | | 81 | |
Average unit volumes (in thousands) (1) | $ | 3,477 | | $ | 4,318 | | $ | 4,264 | |
Change in comparable restaurant sales (1) | (22.1) | % | 2.6 | % | 0.5 | % |
| Average check | $ | 16.93 | | $ | 15.74 | | $ | 15.08 | |
(1)We consider a restaurant to be comparable in the first full quarter following the 18th month of operations. Change in comparable restaurant sales reflect changes in sales for the comparable group of restaurants over a specified period of time.
Our Fiscal Year
We operate on a 52- or 53-week fiscal year that ends on the last Sunday of the calendar year. Each quarterly period has 13 weeks, except for a 53-week year when the fourth quarter has 14 weeks. Our 2020, 2019 and 2018 fiscal years each consisted of 52 weeks.
Key Financial Definitions
Revenue. Revenue primarily consists of food and beverage sales and also includes sales of our t-shirts, sweatshirts and hats. Revenue is presented net of discounts associated with each sale. Revenue in a given period is directly influenced by the number of operating weeks in such period, the number of restaurants we operate and comparable restaurant sales growth.
Cost of sales. Cost of sales consists primarily of food, beverage and merchandise related costs. The components of cost of sales are variable in nature, change with sales volume and are subject to increases or decreases based on fluctuations in commodity costs.
Labor costs. Labor costs include restaurant management salaries, front- and back-of-house hourly wages and restaurant-level manager bonus expense and payroll taxes.
Operating costs. Operating costs consist primarily of restaurant-related operating expenses, such as supplies, utilities, repairs and maintenance, travel cost, insurance, employee benefits, credit card fees, recruiting, delivery service and security. These costs generally increase with sales volume but may increase or decrease as a percentage of revenue.
Occupancy costs. Occupancy costs include rent charges, both fixed and variable, as well as common area maintenance costs, property insurance and taxes, the amortization of tenant allowances and the adjustment to straight-line rent. These costs are generally fixed but a portion may vary with an increase in sales when the lease contains percentage rent.
General and administrative expenses. General and administrative expenses include costs associated with corporate and administrative functions that support our operations, including senior and supervisory management and staff compensation (including stock-based compensation) and benefits, travel, legal and professional fees, information systems, corporate office rent and other related corporate costs.
Marketing. Marketing costs include costs associated with our restaurant marketing programs, community service and sponsorship activities, our menus and other promotional activities.
Restaurant pre-opening costs. Restaurant pre-opening costs consist of costs incurred before opening a restaurant, including manager salaries, relocation costs, supplies, recruiting expenses, initial new market public relations costs, pre-opening activities, employee payroll and related training costs for new employees. Restaurant pre-opening costs also include rent recorded during the period between date of possession and the restaurant opening date.
Impairment, closed restaurant and other costs. Impairment costs include impairment of long-lived assets associated with restaurants where the carrying amount of the asset is not recoverable and exceeds the fair value of the asset. Closed restaurant costs consist of any costs associated with the closure of a restaurant such as lease termination costs, severance benefits, other miscellaneous closing costs as well as costs to maintain these closed restaurants through the lease termination date such as occupancy costs, including rent payments less sublease income, if any, and insurance and utility costs. Other costs consist of COVID-19 related charges due to idle development costs as a result of delaying restaurant openings to 2021.
Depreciation. Depreciation principally includes depreciation on fixed assets, including equipment and leasehold improvements.
Interest expense, net. Interest expense consists primarily of interest on our outstanding indebtedness, uncommitted credit facility fees and the amortization of our debt issuance costs reduced by interest income, if any.
Results of Operations
Year Ended December 27, 2020 Compared to the Year Ended December 29, 2019
The following table presents, for the periods indicated, the consolidated statement of operations (in thousands):
| | | | | | | | | | | | | | | | | | | | | | | | | | | | | | | | | | | |
| | Year Ended |
| | December 27, 2020 | | % of
Revenue | | December 29, 2019 | | % of
Revenue | | Change | | %
Change |
| Revenue | $ | 320,952 | | | 100.0 | % | | $ | 426,357 | | | 100.0 | % | | $ | (105,405) | | | (24.7) | % |
| Costs and expenses: | | | | | | | | | | | |
| Cost of sales | 79,033 | | | 24.6 | | | 110,152 | | | 25.8 | | | (31,119) | | | (28.3) | |
| Labor | 98,184 | | | 30.6 | | | 150,779 | | | 35.4 | | | (52,595) | | | (34.9) | |
| Operating | 50,352 | | | 15.7 | | | 62,121 | | | 14.6 | | | (11,769) | | | (18.9) | |
| Occupancy | 29,406 | | | 9.2 | | | 32,151 | | | 7.5 | | | (2,745) | | | (8.5) | |
| General and administrative | 22,195 | | | 6.9 | | | 23,681 | | | 5.6 | | | (1,486) | | | (6.3) | |
| Marketing | 2,732 | | | 0.9 | | | 5,555 | | | 1.3 | | | (2,823) | | | (50.8) | |
| Restaurant pre-opening | 1,769 | | | 0.6 | | | 2,949 | | | 0.7 | | | (1,180) | | | (40.0) | |
| Legal settlement | — | | | — | | | 615 | | | 0.1 | | | (615) | | | * |
| Impairment, closed restaurant and other costs | 26,794 | | | 8.3 | | | 14,179 | | | 3.3 | | | 12,615 | | | 89.0 | |
| Gain on insurance settlements | (1,000) | | | (0.3) | | | — | | | — | | | (1,000) | | | * |
| Depreciation | 20,031 | | | 6.2 | | | 20,739 | | | 4.9 | | | (708) | | | (3.4) | |
| Total costs and expenses | 329,496 | | | 102.7 | | | 422,921 | | | 99.2 | | | (93,425) | | | (22.1) | |
| (Loss) income from operations | (8,544) | | | (2.7) | | | 3,436 | | | 0.8 | | | (11,980) | | | * |
| Interest expense, net | 257 | | | — | | | 122 | | | — | | | 135 | | | * |
| (Loss) income before income taxes | (8,801) | | | (2.7) | | | 3,314 | | | 0.8 | | | (12,115) | | | * |
| Income tax benefit | (5,507) | | | (1.7) | | | (2,901) | | | (0.7) | | | (2,606) | | | 89.8 | |
| Net (loss) income | $ | (3,294) | | | (1.0) | % | | $ | 6,215 | | | 1.5 | % | | $ | (9,509) | | | * |
| | | | | | | | | | | |
| * Not meaningful | | | | | | | | | | | |
Revenue. Revenue was $321.0 million for the year ended December 27, 2020 compared to $426.4 million for the year ended December 29, 2019. The decrease in revenue was primarily attributed to a decline in customer traffic as a result of COVID-19 and closures of six restaurants during fiscal 2019 and nine restaurants during fiscal 2020. The Company operated on an off-premise only operating model beginning in late March 2020 through May 2020. Since then, the Company reopened and operated dining rooms at varying degrees of operating capacity in 92 of its restaurants. The decrease in revenue was partially offset by $11.3 million of incremental revenue from an additional 183 operating weeks provided by new restaurants.
Comparable restaurant sales decreased 22.1% for the year ended December 27, 2020 compared to the same period in 2019 primarily driven by a 27.3% decrease in average weekly customers, partially offset by a 5.2% increase in average check.
Cost of sales. Cost of sales as a percentage of revenue decreased to 24.6% during the year ended December 27, 2020 from 25.8% during the same period in 2019, primarily as a result of switching to a limited menu and eliminating the complimentary buffet style chips and salsa, or “Nacho Car,” which was partially offset by an increase of approximately 60 basis points in the cost of beef and approximately 10 basis points in the cost of dairy and cheese.
Labor costs. Labor costs as a percentage of revenue decreased to 30.6% during the year ended December 27, 2020, from 35.4% during the comparable period in 2019, primarily due to furloughing a substantial number of hourly employees as well as store management personnel to right-size our operations as the Company transitioned to an off-premise only operating model at the end of the first quarter of 2020. Hourly labor rate inflation in comparable stores was approximately 0.4%.
Operating costs. Operating costs as a percentage of revenue increased to 15.7% during the year ended December 27, 2020, from 14.6% during the comparable period in 2019. This increase is mainly driven by increases in delivery service charges and to-go supplies as a result of the growth in the Company's off-premise business, partially offset by lower credit card fees and liquor taxes.
Occupancy costs. Occupancy costs as a percentage of revenue increased to 9.2% during the year ended December 27, 2020 as compared to 7.5% for the same period in 2019, primarily as a result of sales deleverage on fixed occupancy expenses and higher property taxes.
General and administrative expenses. General and administrative expenses decreased $1.5 million, or 6.3%, to $22.2 million for the year ended December 27, 2020, as compared to $23.7 million during the comparable period in 2019. This decrease was primarily driven by a $0.9 million decrease in performance-based bonuses and $0.6 million decrease in travel during the COVID-19 pandemic.
Marketing costs. Marketing costs as a percentage of revenue decreased to 0.9% during the year ended December 27, 2020 from 1.3% during the comparable period in 2019. This decrease was primarily due to the suspension of the Company’s national-level marketing initiatives in response to COVID-19 while relying on more cost effective local store digital marketing efforts during the second and third quarter of 2020. The Company partially resumed it's advertising campaigns during the fourth quarter of 2020.
Restaurant pre-opening costs. Restaurant pre-opening costs decreased by $1.2 million, or 40.0% to $1.8 million for the year ended December 27, 2020 as compared to $2.9 million during the comparable period in 2019 due to a postponement of new store openings, during the COVID-19 pandemic, to fiscal 2021.
Impairment and closed restaurant costs. Impairment, closed restaurant and other costs increased to $26.8 million during the year ended December 27, 2020 from $14.2 million during the comparable period in 2019. As a result of the COVID-19 pandemic, the Company recorded non-cash impairment and other COVID-19 related charges of $21.7 million during fiscal 2020 relating to restaurant closures, discontinuation of the complimentary "Nacho Car" as well as write-offs of idle, or abandoned, development costs. During fiscal 2019, the Company recorded a $12.7 million non-cash impairment charge relating to closures of underperforming restaurants during the year. The Company also incurred $5.1 million and $1.5 million of closed restaurant costs, which include rent expense, utility and insurance costs, during fiscal 2020 and 2019, respectively.
Gain on insurance settlements. During fiscal 2020, the Company received a one-time insurance settlement in the amount of $1.0 million under its trade name restoration insurance policy.
Depreciation. Depreciation decreased $0.7 million to $20.0 million for the year ended December 27, 2020, as compared to $20.7 million during the comparable period in 2019, primarily due to a decrease in depreciation related to closed stores.
Income tax benefit. Income tax benefit was $5.5 million in fiscal 2020 and $2.9 million in fiscal 2019. The increase in the tax benefit was primarily driven by a net loss in fiscal 2020 as compared to net income in the same period last year. The tax benefit recorded in fiscal year 2020 related to the revaluation of deferred tax assets due to the administrative correction of the depreciation recovery period for qualified improvement property and the reinstatement of net operating loss carrybacks as a result of the CARES Act. The Company believes that it will realize all of its deferred tax assets and, therefore, no valuation allowance is required at this time.
In August 2020, the IRS issued a Notice of Proposed Adjustment to the Company asserting that the tenant allowances paid under our operating leases should be recorded as taxable income for years 2016 and prior. The Company disagrees with this position based on the underlying facts and circumstances as well as standard industry practice. The Company estimates if the IRS's position was upheld, the Company's tax liability could range between $0.5 million and $2.5 million.
Net (loss) income. As a result of the foregoing, net loss was $3.3 million in fiscal 2020 compared to net income of $6.2 million in fiscal 2019.
Year EndedDecember 29, 2019 Compared to the Year Ended December 30, 2018
The following table presents, for the periods indicated, the consolidated statement of operations (in thousands):
| | | | | | | | | | | | | | | | | | | | | | | | | | | | | | | | | | | |
| | Year Ended |
| | December 29, 2019 | | % of
Revenue | | December 30, 2018 | | % of
Revenue | | Change | | %
Change |
| Revenue | $ | 426,357 | | | 100.0 | % | | $ | 398,200 | | | 100.0 | % | | $ | 28,157 | | | 7.1 | % |
| Costs and expenses: | | | | | | | | | | | |
| Cost of sales | 110,152 | | | 25.8 | | | 101,946 | | | 25.6 | | | 8,206 | | | 8.0 | |
| Labor | 150,779 | | | 35.4 | | | 144,325 | | | 36.2 | | | 6,454 | | | 4.5 | |
| Operating | 62,121 | | | 14.6 | | | 57,457 | | | 14.4 | | | 4,664 | | | 8.1 | |
| Occupancy | 32,151 | | | 7.5 | | | 30,028 | | | 7.5 | | | 2,123 | | | 7.1 | |
| General and administrative | 23,681 | | | 5.6 | | | 20,725 | | | 5.2 | | | 2,956 | | | 14.3 | |
| Marketing | 5,555 | | | 1.3 | | | 3,929 | | | 1.0 | | | 1,626 | | | 41.4 | |
| Restaurant pre-opening | 2,949 | | | 0.7 | | | 4,382 | | | 1.1 | | | (1,433) | | | (32.7) | |
| Legal settlement | 615 | | | 0.1 | | | — | | | — | | | 615 | | | * |
| Impairment, closed restaurant and other costs | 14,179 | | | 3.3 | | | 12,336 | | | 3.1 | | | 1,843 | | | 14.9 | |
| | | | | | | | | | | |
| Depreciation | 20,739 | | | 4.9 | | | 19,804 | | | 5.1 | | | 935 | | | 4.7 | |
| Total costs and expenses | 422,921 | | | 99.2 | | | 394,932 | | | 99.2 | | | 27,989 | | | 7.1 | |
| Income from operations | 3,436 | | | 0.8 | | | 3,268 | | | 0.8 | | | 168 | | | 5.1 | |
| Interest expense | 122 | | | — | | | 83 | | | — | | | 39 | | | 47.0 | |
| Income before income taxes | 3,314 | | | 0.8 | | | 3,185 | | | 0.8 | | | 129 | | | 4.1 | |
| Income tax benefit | (2,901) | | | (0.7) | | | (2,354) | | | (0.6) | | | (547) | | | 23.2 | |
| Net income | $ | 6,215 | | | 1.5 | % | | $ | 5,539 | | | 1.4 | % | | $ | 676 | | | 12.2 | % |
| | | | | | | | | | | |
| * Not meaningful | | | | | | | | | | | |
Impairment, closed restaurant and other costsRevenue. Revenue increased 7.1% to $426.4 million for the year ended December 29, 2019, as compared to $398.2 million for the year ended December 30, 2018. The increase in revenue was primarily driven by $28.5 million in incremental revenue from an additional 359 operating weeks provided by new restaurants opened during and subsequent to the year ended December 30, 2018 as well as an increase in our comparable restaurant sales. These increases were partially offset by $2.9 million decrease in revenue as a result of the loss of 80 operating weeks as compared to fiscal year 2018 due to the store closures in 2019 and a decrease in revenue from our non-comparable restaurants that are not included in the incremental revenue discussed above. Revenue related to non-comparable restaurants is historically lower as the stores transition out of the 'honeymoon' period that follows a restaurant's initial opening.
Comparable restaurant sales increased 2.6% for the year ended December 29, 2019 compared to the same period in 2018. The increase was primarily driven by a 3.7% increase in average weekly check, partially offset by a 1.1% decrease in weekly average customers. Our total revenue mix attributed to bar sales was 18.1% and 18.4% during the years ended December 29, 2019 and December 31, 2018, respectively.
Cost of sales. Cost of sales as a percentage of revenue increased to 25.8% during the year ended December 29, 2019 from 25.6% during the same period in 2018, primarily as a result of increases in the cost of beef of approximately 40 basis points, produce of approximately 20 basis points, partially offset by decreases in the costs of chicken of approximately 10 basis points, grocery of approximately 10 basis points and bar costs of 10 basis points.
Labor costs. Labor costs as a percentage of revenue decreased to 35.4% during the year ended December 29, 2019, from 36.2% during the comparable period in 2018, primarily due to leverage on higher average check, increased labor efficiency at new store openings and lower training expense for new managers, partially offset by hourly labor rate inflation on comparable stores of approximately 3.3%.
Operating costs. Operating costs as a percentage of revenue increased to 14.6% during the year ended December 29, 2019, from 14.4% during the comparable period in 2018. This increase is mainly driven by higher insurance costs of approximately 10 basis points and higher credit card fees and delivery service charges of approximately 10 basis points.
Occupancy costs. Occupancy costs as a percentage of revenue remained flat at 7.5% during the year ended December 29, 2019 as compared to the same period in 2018.
General and administrative expenses. General and administrative expenses increased $3.0 million, or 14.3%, to $23.7 million for the year ended December 29, 2019, as compared to $20.7 million during the comparable period in 2018. This increase was primarily driven by $1.9 million increase in performance based bonuses and a $1.0 million increase in management salaries and equity compensation in part due to an additional headcount to support our growth.
Marketing costs. Marketing costs as a percentage of revenue increased to 1.3% during the year ended December 29, 2019 from 1.0% during the comparable period in 2018. This increase was a result of our new national-level marketing initiatives.
Restaurant pre-opening costs. Restaurant pre-opening costs decreased by $1.4 million, or 32.7% to $2.9 million for the year ended December 29, 2019 as compared to $4.4 million during the comparable period in 2018. This decrease is primarily driven by a decrease in the number of new restaurants under development in fiscal 2019, as compared to fiscal 2018 as well as timing of our openings. During the year ended December 29, 2019, we incurred pre-opening costs for six new restaurants opened during 2019 as well as five restaurants, one of which was opened during fiscal year 2020 and four of which were postponed to fiscal year 2021 as a result of COVID-19. During the year ended December 30, 2018, we incurred pre-opening costs for nine new restaurants opened during 2018 and four restaurants which opened in fiscal year 2019.
Legal settlement. During the fiscal year 2019, the Company recorded $0.6 million ($0.5 million, net of tax or $0.03 per diluted share) related to a pending legal settlement.
Impairment, closed restaurant and other costs. As a result of our impairment analysis and closures of under-performing restaurants during fiscal year 2019, the Company recorded a non-cash asset impairment charge of approximately $12.7 million and $1.5 million of costs related to closed restaurants during the year. As a result of our impairment analysis of under-performing restaurants during the fiscal year 2018, the Company identified six restaurants as impaired and recognized a non-cash asset impairment charge of approximately $12.3 million.
Depreciation. Depreciation increased $0.9 million to $20.7 million for the year ended December 29, 2019, as compared to $19.8 million during the comparable period in 2018, primarily as the result of an increase in equipment and leasehold improvement costs associated with our new restaurants.
Income tax benefit. Income tax benefit was $2.9 million in fiscal year 2019 and $2.4 million in fiscal year 2018. The tax benefit was primarily due to the tax impact of the non-cash loss on asset impairment and closed restaurant costs of $14.2 million as well as legal settlement accrual of $0.6 million in the fiscal year 2019 and the non-cash loss on asset impairment of $12.3 million in the fiscal year 2018. Excluding the impact of these adjustments, our effective tax rate for fiscal year 2019 was 3.0% compared to 3.5% in the same period last year.
Net income. As a result of the foregoing, net income increased by $0.7 million and 12.2% to $6.2 million for the year ended December 29, 2019 as compared to $5.5 million during the comparable period in 2018.
Liquidity
Our principal sources of cash are net cash provided by operating activities, which includes tenant improvement allowances from our landlords, and borrowings, if any, under our $25.0 million Revolving Credit Facility. Consistent with many other restaurant and retail store operations, we typically use operating lease arrangements for our restaurants. From time to time, we may also purchase the underlying land for development. We believe that our operating lease arrangements provide appropriate leverage of our capital structure in a financially efficient manner.
Our main requirements for liquidity are to support our working capital, restaurant expansion plans, ongoing maintenance of our existing restaurants, investment in infrastructure, obligations under our operating leases, interest payments on our debt, if any, and to repurchase shares of our common stock subject to market conditions. Repurchases of the Company's outstanding common stock will be made in accordance with applicable laws and may be made at management's discretion from time to time in the open market, through privately negotiated transactions or otherwise, including pursuant to Rule 10b5-1 trading plans. There is no guarantee as to the exact number of shares to be repurchased by the Company. The timing and extent of repurchases will depend upon several factors, including market and business conditions, regulatory requirements and other corporate considerations, and repurchases may be discontinued at any time. During the first quarter of 2020, and prior to the impact that COVID-19 had on the Company's business operations, the Company repurchased approximately 90,000 shares of its common stock for a total of $1.4 million. As of December 27, 2020, the Company had $28.6 million remaining under its $30.0 million repurchase program that expires on December 31, 2022. As a result of COVID-19, the Company temporarily suspended further share repurchase activity during 2020.
During the second quarter of 2020, the Company issued 3,041,256 shares of its common stock and received net proceeds of $48.2 million after deducting sales agent commissions and offering expenses payable by the Company. A portion of the net proceeds was used to repay the $25.0 million outstanding under the Company's revolving credit facility. The Company intends to use the remaining net proceeds from the ATM offering for general corporate purposes, including, but not limited to, increasing its liquidity as a result of the COVID-19 pandemic.
As of December 27, 2020, the Company had a strong financial position with $86.8 million in cash and cash equivalents, no debt and $25.0 million of availability under its revolving credit facility. During the fiscal year ended December 27, 2020, the Company took the following measures to enhance its liquidity position in response to the uncertainty caused by the COVID-19 pandemic:
•Temporarily suspended any further activity under its share repurchase program;
•Utilized CARES act provisions to obtain tax savings as well as deferred its portion of social security taxes to future years; and
•Negotiated rent abatements and concessions with the majority of its landlords in response to the COVID-19 pandemic.
Management believes that the Company's strong financial position, combined with the measures taken during the COVID-19 pandemic will allow the Company to meet its financial obligations for at least the next twelve months.
Our liquidity may be adversely affected by a number of factors, including a decrease in customer traffic or average check per customer due to changes in economic conditions, as described in Item 1A. “Risk Factors.”
Cash Flows for the Years Ended December 27, 2020, December 29, 2019 and December 30, 2018
The following table summarizes the statements of cash flows (in thousands):
| | | | | | | | | | | | | | | | | |
| | Year Ended |
| | December 27, 2020 | | December 29, 2019 | | December 30, 2018 |
| Net cash provided by operating activities | $ | 42,714 | | | $ | 43,431 | | | $ | 47,882 | |
| Net cash used in investing activities | (12,149) | | | (33,274) | | | (44,521) | |
| Net cash provided by (used in) financing activities | 46,178 | | | (8,282) | | | (3,947) | |
| Net increase (decrease) in cash and cash equivalents | 76,743 | | | 1,875 | | | (586) | |
| Cash and cash equivalents at beginning of year | 10,074 | | | 8,199 | | | 8,785 | |
| Cash and cash equivalents at end of period | $ | 86,817 | | | $ | 10,074 | | | $ | 8,199 | |
Operating Activities. Net cash provided by operating activities remained relatively flat at $42.7 million for the year ended December 27, 2020 compared to $43.4 million during the same period in 2019. Our business is almost exclusively a cash business. Almost all of our receipts come in the form of cash and cash equivalents and a large majority of our expenditures are paid within a 30 day period. The Company was able to sustain the net cash provided by operating activities near the prior year level despite an approximately 25.0% decrease in revenue mainly driven by a 370 basis point improvement in restaurant-level operating margin over fiscal 2019, various cost savings initiatives and cash management efforts during the COVID-19 pandemic.
Net cash provided by operating activities decreased $4.4 million to $43.4 million for the year ended December 29, 2019, from $47.9 million during the same period in 2018. The decrease in net cash provided by operating activities during the year ended December 29, 2019 compared to the same period in 2018 was primarily due to a $6.8 million decrease in lease incentive receivables and deferred lease incentives mainly driven by our development schedule as well as a planned reduction in contracted tenant allowances on new leases and a $1.8 million decrease in prepaid expenses driven by timing of payments. This total decrease of $8.6 million was partially offset by a $3.5 million increase in accrued liabilities mainly driven by higher bonus and property tax accruals, a $0.5 million increase in tax payable as a result of higher income taxes driven by higher taxable income and timing of other payments.
Investing Activities. Net cash used in investing activities decreased $21.1 million to $12.1 million for the year ended December 27, 2020, from $33.3 million for the year ended 2019. The decrease was primarily due to a cancellation of all non-essential capital expenditures and postponement of new store development post COVID-19 to fiscal 2021.
Net cash used in investing activities decreased $11.2 million to $33.3 million for the year ended December 29, 2019, from $44.5 million for the year ended 2018. This decrease is primarily driven by a decrease in the number of new restaurants under development in fiscal 2019 as compared to fiscal 2018 as well as timing of our openings. During the year ended December 29, 2019, we incurred development costs for construction of six new restaurants opened during 2019 as well as five restaurants, one of which was opened during fiscal year 2020 and four of which were postponed to fiscal year 2021 as a result of COVID-19. During the year ended December 30, 2018, we incurred development costs for the construction of nine new restaurants and four restaurants, which opened in fiscal year 2019.
Financing Activities. Net cash provided by financing activities increased $54.5 million to $46.2 million for the year ended December 27, 2020 from net cash used in financial activities of $8.3 million for the same period in 2019. The increase was
primarily due to $48.2 million in net proceeds received in the Company's ATM offering completed during the second quarter of 2020 and a $6.4 million decrease in stock repurchases as compared to the same period last year.
Net cash used in financing activities increased $4.4 million to $8.3 million for the year ended December 29, 2019 from $3.9 million for the same period in 2018. The increase in net cash used by financing activities was primarily the result of $4.2 million of repurchases of our common stock in the open market.
For the years ended December 27, 2020 and December 29, 2019, we had no other financing transactions, arrangements or other relationships with any unconsolidated affiliates or related parties. Additionally, we had no financing arrangements involving synthetic leases or trading activities involving commodity contracts.
Capital Resources
Long-Term Capital Requirements
Our capital requirements are primarily dependent upon the pace of our growth plan and resulting new restaurants. Our growth plan is dependent upon many factors, including economic conditions, real estate markets, restaurant locations and the nature of our lease agreements. Our capital expenditure outlays are also dependent on maintenance and remodel costs in our existing restaurants as well as information technology and other general corporate capital expenditures.
The capital resources typically required for a new restaurant depend on whether the restaurant is a ground-up construction or a conversion. For our new unit openings, we estimate the cost of a conversion or ground-up buildout will require a total cash investment of approximately $2.5 million to $3.5 million. In addition, we expect to spend approximately $0.5 million per restaurant for restaurant pre-opening costs.
During the next twelve to twenty-four months, we intend to negotiate terminations for all of our closed store operating leases. We estimate the cost of termination of these leases could range between approximately $12.0 to $20.0 million.
For 2021, we currently estimate capital expenditure outlays will range between $15.0 million and $25.0 million and approximately $2.0 million to $3.0 million of restaurant pre-opening costs for new restaurants. These capital expenditure estimates are based on the opening of four to six new restaurants and approximately $7.0 million to maintain and remodel our existing restaurants and for other general corporate purposes.
Based on our growth plans, we believe our existing cash balance combined with future expected cash flows from operations and available borrowings under our Revolving Credit Facility will be sufficient to finance our planned capital expenditures and other operating activities in fiscal 2021.
Short-Term Capital Requirements
Our operations have not required significant working capital and, like many restaurant companies, we generally operate with negative working capital. Restaurant sales are primarily paid for in cash or by credit card, and restaurant operations do not require significant inventories or receivables. In addition, we receive trade credit for the purchase of food, beverages and supplies, therefore reducing the need for incremental working capital to support growth.
We had a net working capital of $51.2 million at December 27, 2020 compared to a deficit of $19.4 million at December 29, 2019. The increase in the net working capital during fiscal year 2020 is primarily driven by $48.2 million net proceeds received in the Company's ATM offering completed during the second quarter of 2020 and improved restaurant level operating margins subsequent to the start of COVID-19 pandemic.
Revolving Credit Facility
On November 30, 2012, we entered into our $25.0 million Revolving Credit Facility with Wells Fargo Bank, National Association. On May 21, 2020, the Company entered into the second amendment (the “Amendment”) to its Revolving Credit Facility (as amended, the "Revolving Credit Facility") to (1) extend the maturity date to April 30, 2022, (2) relax compliance with the financial covenants during the COVID-19 pandemic through the new maturity date and (3) revise the applicable margins and leverage ratios that determine the commitment fees and interest payable by the Company.
Under our Revolving Credit Facility, we may request to increase the size of our Revolving Credit Facility by up to $25.0 million, in minimum principal amounts of $5.0 million or the remaining amount of the $25.0 million if less than $5.0 million (the "Incremental Revolving Loan"). In the event that any of the lenders fund the Incremental Revolving Loan, the terms and provisions of the Incremental Revolving Loan will be the same as under our Revolving Credit Facility.
Borrowings under the Revolving Credit Facility generally bear interest at a variable rate based upon the Company's election, of (i) the base rate (which is the highest of the prime rate, federal funds rate plus 0.5% and one month LIBOR plus 1.0%), or (ii) LIBOR, plus, in either case, an applicable margin based on the Company's consolidated total leverage ratio (as defined in the Amendment) with a LIBOR floor of 1.0%. The Revolving Credit Facility also requires payment for commitment fees that
accrue on the daily unused commitment of the lender at the applicable margin, which varies based on the Company's consolidated total leverage ratio.
The Revolving Credit Facility also requires compliance with a fixed charge coverage ratio, a consolidated total leverage ratio, growth capital expenditure limitation during fiscal years 2020 and 2021 and a minimum monthly liquidity requirement of $5.0 million. The Revolving Credit Facility also has certain restrictions on the payment of dividends and distributions. Under the Revolving Credit Facility, the Company may declare and make dividend payments so long as (i) no default or event of default has occurred and is continuing or would result therefrom and (ii) immediately after giving effect to any such dividend payment, on a pro forma basis, the lease adjusted leverage ratio does not exceed 3.50 to 1.00.
The obligations under the Company's Revolving Credit Facility are secured by a first priority lien on substantially all of the Company's asset. As of December 27, 2020, the Company had no borrowings under the Revolving Credit Facility, and we were in compliance with all covenants.
Contractual Obligations
The following table summarizes contractual obligations at December 27, 2020 (in thousands):
| | | | | | | | | | | | | | | | | | | | | | | | | | | | | |
| | Payment Due By Period |
| | Total | | Less Than 1 Year | | 1-3 Years | | 3-5 Years | | More Than 5 Years |
| Contractual Obligations: | | | | | | | | | |
Operating Lease Obligations (1) | $ | 364,238 | | | $ | 31,161 | | | $ | 57,398 | | | $ | 53,858 | | | $ | 221,821 | |
Purchase Obligations (2) | 22,279 | | | 22,279 | | | — | | | — | | | — | |
| Total | $ | 386,517 | | | $ | 53,440 | | | $ | 57,398 | | | $ | 53,858 | | | $ | 221,821 | |
(1)Reflects the aggregate minimum lease payments for our restaurant operations and corporate office, including approximately $2.1 million of legally binding minimum lease payments for leases signed but which we have not yet taken possession. Operating lease obligations excludes contingent rent payments that may be due under certain of our leases based on a percentage of sales.
(2)Includes contractual purchase commitments for the purchase of goods related to restaurant operations and commitments for construction of new restaurants.
Off-Balance Sheet Arrangements
As part of our on-going business, we do not participate in transactions that generate relationships with unconsolidated entities or financial partnerships, such as entities referred to as structured finance or variable interest entities, which would have been established for the purpose of facilitating off-balance sheet arrangements or other contractually narrow or limited purposes. As of December 27, 2020, we are not involved in any variable interest entities transactions and do not otherwise have any off-balance sheet arrangements.
Critical Accounting Policies
Our consolidated financial statements and accompanying notes are prepared in accordance with accounting principles generally accepted in the United States of America. Preparing consolidated financial statements requires us to make estimates and assumptions that affect the reported amounts of assets, liabilities, revenue and expenses. These estimates and assumptions are affected by the application of our accounting policies. Our significant accounting policies are described in Note 2 to our Consolidated Financial Statements. Critical accounting estimates are those that require application of management’s most difficult, subjective or complex judgments, often as a result of matters that are inherently uncertain and may change in subsequent periods. While we apply our judgment based on assumptions believed to be reasonable under the circumstances, actual results could vary from these assumptions. It is possible that materially different amounts would be reported using different assumptions. The following is a description of what we consider to be our most significant critical accounting policies.
Leases and leasehold improvements. The Company leases land and or buildings for its corporate offices and all of its restaurants under various long-term operating lease agreements. The Company determines if a contract contains a lease at inception. The lease term begins on the date that the Company takes possession under the lease, including the pre-opening period during construction, when in many cases the Company is not making rent payments. The initial lease terms range from 10 years to 15 years, most of which include renewal options of 10 to 15 years. The lease term is generally the minimum of the noncancelable period or the lease term including renewal options which are reasonably certain of being exercised up to a term of approximately 20 years. When determining the lease term, we include option periods for which failure to renew the lease imposes a penalty on us in such an amount that a renewal appears, at the inception of the lease, to be reasonably assured. The
primary penalty to which we are subject is the economic detriment associated with the existence of leasehold improvements which might become impaired if we choose not to continue the use of the leased property.
Operating lease assets and liabilities are recognized at the lease commencement date for material leases with a term of greater than 12 months. Operating lease liabilities represent the present value of future minimum lease payments. Since our leases do not provide an implicit rate, our operating lease liabilities are calculated using the Company's secured incremental borrowing rate at lease commencement. We have no outstanding debt, and as a result, we estimate this rate based on prevailing financial market conditions, comparable companies, credit analysis and management judgment. Minimum lease payments include only fixed lease components of the agreement, as well as variable rate payments that depend on an index, initially measured using the index at the lease commencement date.
Operating lease assets represent our right to use an underlying asset and are based upon the operating lease liabilities adjusted for prepaid or accrued lease payments, initial direct costs and lease incentives. Lease incentives are recognized when earned and reduce our operating lease asset. They are amortized through the operating lease assets as reductions of rent expense over the lease term.
Operating lease expense is recognized on a straight-line basis over the lease term. Variable lease payments that do not depend on a rate or index, escalation in the index subsequent to the initial measurement, payments associated with non-lease components such as common area maintenance, real estate taxes and insurance, and short-term lease payments (leases with a term with 12 months or less) are expensed as incurred. Certain of the Company’s operating leases contain clauses that provide for contingent rent based on a percentage of sales greater than certain specified target amounts. These variable payments are expensed when the achievement of the specified target that triggers the contingent rent is considered probable.
We make judgments regarding the probable term for each restaurant property lease, which can impact the classification and accounting for a lease as finance or operating, the rent holiday and/or escalations in payments that are taken into consideration when calculating straight-line rent and the term over which leasehold improvements and deferred lease incentives for each restaurant are amortized. These judgments may produce materially different amounts of depreciation and rent expense than would be reported if different assumed lease terms were used.
Impairment of long-lived assets. The Company reviews long-lived assets, such as property and equipment and intangibles, subject to amortization, for impairment when events or circumstances indicate the carrying value of the assets may not be recoverable. In determining the recoverability of the asset value, an analysis is performed at the individual restaurant level and primarily includes an assessment of historical undiscounted cash flows and other relevant factors and circumstances. The Company evaluates future cash flow projections in conjunction with qualitative factors and future operating plans and regularly reviews any restaurants with a deficient level of cash flows for the previous 24 months to determine if impairment testing is necessary. Recoverability of assets to be held and used is measured by a comparison of the carrying value of the restaurant to its estimated future undiscounted cash flows. If the estimated undiscounted future cash flows are less than the carrying value, we determine if there is an impairment loss by comparing the carrying value of the restaurant to its estimated fair value. Based on this analysis, if the carrying value of the restaurant exceeds its estimated fair value, an impairment charge is recognized by the amount by which the carrying value exceeds the fair value.
We make assumptions to estimate future cash flows and asset fair values. The estimated fair value is generally determined using the depreciated replacement cost method, the market approach, or discounted cash flow projections. Estimated future cash flows are highly subjective assumptions based on Company’s projections and understanding of our business, historical operating results, and trends in sales and restaurant level operating costs.
The Company’s impairment assessment process requires the use of estimates and assumptions regarding future cash flows and operating outcomes, which are based upon a significant degree of management judgment. The estimates used in the impairment analysis represent a Level 3 fair value measurement. The Company continues to assess the performance of restaurants and monitors the need for future impairment. Changes in the economic environment, real estate markets, capital spending, overall operating performance and underlying assumptions could impact these estimates and result in future impairment charges.
As a result of the above mentioned process, the Company recorded a non-cash loss on asset impairment of $20.9 million during the fiscal year ended December 27, 2020, $12.7 million during the fiscal year ended December 29, 2019 and $12.3 million during the fiscal year ended December 30, 2018.
Goodwill and other intangible assets. Goodwill and indefinite life intangible assets are not amortized but are tested annually at the end of the fiscal year, or more frequently if events or changes in circumstances indicate that the assets might be impaired. In assessing the recoverability of goodwill and indefinite life intangible assets, the Company must make assumptions about the estimated future cash flows and other factors to determine the fair value of these assets.
For goodwill, our assessment is performed at the reporting unit level. The Company considers all of its stores in total as one reporting unit. The goodwill impairment test compares the fair value of the reporting unit to the carrying amount, including
goodwill. If the fair value of the reporting unit is less than the carrying amount, an impairment charge is recorded for the difference, limited to the total amount of goodwill allocated to that reporting unit.
Similarly, for the impairment evaluation for indefinite life intangible assets, which includes our trade names, we determine whether the estimated fair value of the indefinite-lived intangible asset is less than its carrying value. We calculate the estimated fair value of the indefinite-lived intangible asset and compare it to the carrying value. Fair value is estimated primarily using future discounted cash flow projections in conjunction with qualitative factors and future operating plans. When the carrying value exceeds fair value, an impairment charge is recorded for the amount of the difference. An intangible asset is determined to have an indefinite useful life when there are no legal, regulatory, contractual, competitive, economic or other factors that may limit the period over which the asset is expected to contribute directly or indirectly to the future cash flows of the Company. The Company also annually evaluates intangible assets that are not being amortized to determine whether events and circumstances continue to support an indefinite useful life. If an intangible asset that is not being amortized is determined to have a finite useful life, the asset will be amortized prospectively over the estimated remaining useful life and accounted for in the same manner as intangible assets subject to amortization. Our analysis indicated that no impairments of goodwill or indefinite-lived intangibles occurred during fiscal 2020, 2019 or 2018.
Income taxes. Income tax provisions consist of federal and state taxes currently due, plus deferred taxes. Deferred tax assets and liabilities are recognized for the future tax consequences attributable to temporary differences between the financial statement carrying amounts of existing assets and liabilities and their respective tax basis. Deferred tax assets and liabilities are measured using enacted tax rates expected to apply to taxable income in the years in which those temporary differences are expected to be recovered or settled. Deferred tax assets are recognized when management considers the realization of those assets in future periods to be more likely than not. Future taxable income, adjustments in temporary difference, available carryforward periods and changes in tax laws could affect these estimates.
Recent Accounting Pronouncements
The information regarding recent accounting pronouncements materially affecting our consolidated financial statements is included in Note 2 to our Consolidated Financial Statements.
| |
ITEM 7A. | QUANTITATIVE AND QUALITATIVE DISCLOSURES ABOUT MARKET RISK |
ITEM 7A. QUANTITATIVE AND QUALITATIVE DISCLOSURES ABOUT MARKET RISK
Interest Rate Risk
We are subject to interest rate risk in connection with our long-term indebtedness. Our principal interest rate exposure relates to loans outstanding under our Revolving Credit Facility. All outstanding indebtedness under our Revolving Credit Facility bears interest at a variable rate based on LIBOR. Each quarter point change in interest rates on the variable portion of indebtedness under our Revolving Credit Facility would result in an annualized change to our interest expense of approximately $2,500 per every million dollars borrowed. As of December 31, 2017,27, 2020, we had no borrowings under our Revolving Credit Facility.
Commodity Price Risk
We are exposed to market price fluctuation in food product prices. Given the historical volatility of certain of our food product prices, including produce, chicken, beef and cheese, these fluctuations can materially impact our food and beverage costs. While we have taken steps to enter into long term agreements for some of the commodities used in our restaurant operations, there can be no assurance that future supplies and costs for such commodities will not fluctuate due to weather and other market conditions outside of our control.
Consequently, such commodities can be subject to unforeseen supply and cost fluctuations. Dairy costs can also fluctuate due to government regulation. Because we typically set our menu prices in advance of our food product prices, we cannot immediately take into account changing costs of food items. To the extent that we are unable to pass the increased costs on to our customers through price increases, our results of operations would be adversely affected. We do not use financial instruments to hedge our risk to market price fluctuations in our food product prices at this time.
| |
ITEM 8. | FINANCIAL STATEMENTS AND SUPPLEMENTARY DATA |
ITEM 8. FINANCIAL STATEMENTS AND SUPPLEMENTARY DATA
Our consolidated financial statements, notes thereto and the report of RSM US LLP, our independent registered public accounting firm, are set forth beginning on page F-1 hereto and are incorporated herein by reference.
| |
ITEM 9. | CHANGES IN AND DISAGREEMENTS WITH ACCOUNTANTS ON ACCOUNTING AND FINANCIAL DISCLOSURE |
ITEM 9. CHANGES IN AND DISAGREEMENTS WITH ACCOUNTANTS ON ACCOUNTING AND FINANCIAL DISCLOSURE
None
| |
ITEM 9A. | CONTROLS AND PROCEDURES |
ITEM 9A. CONTROLS AND PROCEDURES
Disclosure Controls and Procedures
We carried out an evaluation, under the supervision and with the participation of our chief executive officer and chief financial officer, of the effectiveness of the design and operation of our disclosure controls and procedures (as defined in Rule 13a-15(e) of the Securities Exchange Act of 1934) as of the end of the period covered by this report. Based on this evaluation, our principal executive officer and principal financial officer concluded that our disclosure controls and procedures (as defined in Rule 13a-15(e) of the Securities Exchange Act of 1934) are effective as of the end of the period covered by this report to provide reasonable assurance that material information required to be included in our periodic SEC reports is recorded, processed, summarized and reported within the time periods specified in the relevant SEC rules and forms.
Management’s Report on Internal Control Over Financial Reporting
Our management is responsible for establishing and maintaining adequate internal control over financial reporting. As defined in Exchange Act Rule 13a-15(f), internal control over financial reporting is a process designed by, or under the supervision of, our principal executive officer and principal financial officer and effected by our Board of Directors, management and other personnel, to provide reasonable assurance regarding the reliability of financial reporting and the preparation of financial statements for external purposes in accordance with GAAP and includes those policies and procedures that (i) pertain to the maintenance of records that in reasonable detail, accurately and fairly reflect the transactions and dispositions of the assets of the Company; (ii) provide reasonable assurance that transactions are recorded as necessary to permit preparation of financial statements in accordance with GAAP, and that receipts and expenditures of the Company are being made only in accordance with authorizations of management and directors of the Company; and (iii) provide reasonable assurance regarding prevention or timely detection of unauthorized acquisition, use or disposition of the Company’s assets that could have a material effect on the financial statements. The design of any system of control is based upon certain assumptions about the likelihood of future events, and there can be no assurance that any design will succeed in achieving its stated objectives under all future events, no matter how remote, or that the degree of compliance with the policies or procedures may not deteriorate. Because of its inherent limitations, internal control over financial reporting may not prevent or detect misstatements. Accordingly, even effective internal control over financial reporting can only provide reasonable assurance of achieving their control objectives. Also, projections of any evaluation of effectiveness to future periods are subject to the risk that controls may become inadequate because of changes in conditions, or that the degree of compliance with the policies or procedures may deteriorate.
Under the supervision and with the participation of our management, including our chief executive officer and chief financial officer, we carried out an evaluation of the effectiveness of our internal control over financial reporting as of December 31, 201727, 2020 based on the criteria in Internal Control — Integrated Framework (2013 Framework) issued by the Committee of Sponsoring Organizations of the Treadway Commission (“COSO”).Commission. Based on this evaluation, our management concluded that our internal control over financial reporting was effective as of December 31, 2017.27, 2020.
RSM US LLP, the Company's independent registered public accounting firm, has audited the financial statements included in this Annual Report on Form 10-K, and has issued an attestation report on our internal control over financial reporting, which is included herein.
Changes in Internal Control over Financial Reporting
There have been no changes in our internal control over financial reporting that occurred during our most recent fiscal quarter that have materially affected, or are reasonably likely to materially affect, our internal control over financial reporting.
Report of Independent Registered Public Accounting Firm
To the Stockholders and the Board of Directors of Chuy’s Holdings, Inc.
Opinion on the Internal Control Over Financial Reporting
We have audited Chuy’s Holdings, Inc. and its subsidiaries' (the Company) internal control over financial reporting as of December 31, 2017,27, 2020, based on criteria established in Internal Control - Control—Integrated Framework issued by the Committee of Sponsoring Organizations of the Treadway Commission in 2013. In our opinion, the Company maintained, in all material respects, effective internal control over financial reporting as of December 31, 2017,27, 2020, based on criteria established in Internal Control - Control—Integrated Framework issued by the Committee of Sponsoring Organizations of the Treadway Commission in 2013.
We have also audited, in accordance with the standards of the Public Company Accounting Oversight Board (United States) (PCAOB), the consolidated balance sheets of the Company as of December 31, 2017 and December 25, 2016, the related consolidated statements of income, stockholders' equity and cash flows for each of the three years in the period ended December 31, 2017 and the related notes to the consolidated financial statements (collectively, the financial statements) of the Company and our report dated March 15, 201811, 2021 expressed an unqualified opinion.
Basis for Opinion
The Company’s management is responsible for maintaining effective internal control over financial reporting and for its assessment of the effectiveness of internal control over financial reporting in the accompanying Management’s Report on Internal Control Over Financial Reporting. Our responsibility is to express an opinion on the Company’s internal control over financial reporting based on our audit. We are a public accounting firm registered with the PCAOB and are required to be independent with respect to the Company in accordance with U.S. federal securities laws and the applicable rules and regulations of the Securities and Exchange Commission and the PCAOB.
We conducted our audit in accordance with the standards of the PCAOB. Those standards require that we plan and perform the audit to obtain reasonable assurance about whether effective internal control over financial reporting was maintained in all material respects. Our audit included obtaining an understanding of internal control over financial reporting, assessing the risk that a material weakness exists, and testing and evaluating the design and operating effectiveness of internal control based on the assessed risk. Our audit also included performing such other procedures as we considered necessary in the circumstances. We believe that our audit provides a reasonable basis for our opinion.
Definition and Limitations of Internal Control Over Financial Reporting
A company's internal control over financial reporting is a process designed to provide reasonable assurance regarding the reliability of financial reporting and the preparation of financial statements for external purposes in accordance with generally accepted accounting principles. A company's internal control over financial reporting includes those policies and procedures that (1) pertain to the maintenance of records that, in reasonable detail, accurately and fairly reflect the transactions and dispositions of the assets of the company; (2) provide reasonable assurance that transactions are recorded as necessary to permit preparation of financial statements in accordance with generally accepted accounting principles, and that receipts and expenditures of the company are being made only in accordance with authorizations of management and directors of the company; and (3) provide reasonable assurance regarding prevention or timely detection of unauthorized acquisition, use or disposition of the company's assets that could have a material effect on the financial statements.
Because of its inherent limitations, internal control over financial reporting may not prevent or detect misstatements. Also, projections of any evaluation of effectiveness to future periods are subject to the risk that controls may become inadequate because of changes in conditions, or that the degree of compliance with the policies or procedures may deteriorate.
/s/ RSM US LLP
Dallas,Austin, Texas
March 15, 201811, 2021
| |
ITEM 9B. | OTHER INFORMATION |
ITEM 9B. OTHER INFORMATION
None
PART III
The information required by Items 10, 11, 12, 13 and 14 will be furnished (and are incorporated by reference) by an amendment hereto that will contain such information.
PART IV
ITEM 15: EXHIBITS AND FINANCIAL STATEMENT SCHEDULES
The following documents are filed as a part of this Report:
| |
(1) | Financial Statements - see Index to Financial Statements appearing on page F-1. |
| |
(2) | Financial Statement Schedules – None. |
| |
(3) | Exhibits - The exhibits listed on the accompanying Exhibit Index are filed or incorporated by reference as part of this report. |
(1)Financial Statements - see Index to Financial Statements appearing on page F-1.
(2)Financial Statement Schedules – None.
(3)Exhibits - The exhibits listed on the accompanying Exhibit Index are filed or incorporated by reference as part of this report.
Exhibit Index
|
| | | | | | | |
| Exhibit No. | | Description of Exhibit |
| | Amended and Restated Certificate of Incorporation (incorporated by reference to Exhibit 3.1 to the Company’s Current Report on Form 8-K, filed on July 27, 2012) |
| | Amended and Restated Bylaws (incorporated by reference to Exhibit 3.1 to the Company’s Current Report on Form 8-K, filed on October 30, 2013) |
| | Form of Common Stock Certificate (incorporated by reference to Exhibit 4.1 of Amendment No. 7 to the Registration Statement on Form S-1 (File No. 333-176097), filed on July 11, 2012) |
| | Description of Registrant's Common Stock (incorporated by reference to Exhibit 4.2 to the Company's Annual Report on Form 10-K, filed on March 10, 2020) |
| | Chuy's Holdings, Inc. 2020 Omnibus Incentive Plan (incorporated by reference to Exhibit 10.1 to the Company's Current Report on Form 8-K, filed on July 31, 2020) |
| | Form of Restricted Stock Unit Agreement (2020 Omnibus Incentive Plan) (incorporated by reference to Exhibit 10.2 to the Company's Quarterly Report on Form 10-Q, filed on November 6, 2020) |
| | Chuy’s Holdings, Inc. 2012 Omnibus Equity Incentive Plan (incorporated by reference to Exhibit 10.3 of Amendment No. 7 to the Registration Statement on Form S-1 (File No. 333-176097), filed on July 11, 2012) |
| | Form of Restricted Share Agreement (2012 Omnibus Equity Incentive Plan) (incorporated by reference to Exhibit 10.4 of Amendment No. 7 to the Registration Statement on Form S-1 (File No. 333-176097), filed on July 11, 2012) |
| | Form of Option Agreement (2012 Omnibus Equity Incentive Plan) (incorporated by reference to Exhibit 10.5 of Amendment No. 7 to the Registration Statement on Form S-1 (File No. 333-176097), filed on July 11, 2012) |
| | Form of Restricted Stock Unit Agreement (2012 Omnibus Equity Incentive Plan) (incorporated by reference to Exhibit 10.6 to the Company's Annual Report on form 10-K, filed on March 11, 2014) |
| | Form of Restricted Stock Unit Agreement (Amended 2015)(2012 Omnibus Equity Incentive Plan) (incorporated by reference to Exhibit 10.4 to the Company's Annual Report on Form 10-K, filed on March 12, 2015) |
| | Form of Option Agreement (Amended 2015)(2012 Omnibus Equity Incentive Plan)(incorporated by reference to Exhibit 10.2 to the Company's Quarterly Report on Form 10-Q, filed on May 8, 2015) |
| | Chuy’s Holdings, Inc. Amended and Restated 2006 Stock Option Plan (incorporated by reference to Exhibit 10.37 of Amendment No. 5 to the Registration Statement on Form S-1 (File No. 333-176097), filed on May 17, 2012) |
| | Chuy’s Holdings, Inc. 2006 Stock Option Plan (incorporated by reference to Exhibit 10.6 to the Company’s Registration Statement on Form S-1 (File No. 333-176097), filed on August 5, 2011) |
| | Form of Stock Option Award Agreement (2006 Stock Option Plan) (incorporated by reference to Exhibit 10.7 to the Company’s Registration Statement on Form S-1 (File No. 333-176097), filed on August 5, 2011) |
| | Form of Director and Officer Indemnification Agreement (incorporated by reference to Exhibit 10.8 of Amendment No. 7 to the Registration Statement on Form S-1 (File No. 333-176097), filed on July 11, 2012) |
| | Letter Agreement regarding Arbor Trails Chuy’s, dated November 7, 2006, by and between Chuy’s Opco, Inc. and Three Star Management, Ltd. (incorporated by reference to Exhibit 10.9 to the Company’s Registration Statement on Form S-1 (File No. 333-176097), filed on August 5, 2011) |
| | Recipe License Agreement, dated November 7, 2006, by and between Chuy’s Opco, Inc. and MY/ZP IP Group, Ltd. (incorporated by reference to Exhibit 10.10 to the Company’s Registration Statement on Form S-1 (File No. 333-176097), filed on August 5, 2011) |
| | Cross-Marketing License Agreement, dated November 7, 2006, by and between Chuy’s Opco, Inc. and MY/ZP IP Group, Ltd. (incorporated by reference to Exhibit 10.12 to the Company’s Registration Statement on Form S-1 (File No. 333-176097), filed on August 5, 2011) |
| | Management Agreement, dated November 7, 2006, by and between Chuy’s Opco, Inc. and Three Star Management, Ltd. (incorporated by reference to Exhibit 10.13 to the Company’s Registration Statement on Form S-1 (File No. 333-176097), filed on August 5, 2011) |
| | Management System License Agreement, dated November 7, 2006, by and between Chuy’s Opco, Inc. and MY/ZP IP Group, Ltd. (incorporated by reference to Exhibit 10.14 to the Company’s Registration Statement on Form S-1 (File No. 333-176097), filed on August 5, 2011) |
| | Parade Sponsorship Agreement, dated November 7, 2006, by and between Chuy’s Opco, Inc. and MY/ZP IP Group, Ltd. (incorporated by reference to Exhibit 10.15 to the Company’s Registration Statement on Form S-1 (File No. 333-176097), filed on August 5, 2011) |
| | Form of License Exercisable Upon Event of Default Under Lease Agreement (incorporated by reference to Exhibit 10.21 to the Company’s Registration Statement on Form S-1 (File No. 333-176097), filed on August 5, 2011) |
| | Lease Agreement, dated November 7, 2006, between Young Zapp Graceland, Ltd. and Chuy’s Opco, Inc. (incorporated by reference to Exhibit 10.23 to the Company’s Registration Statement on Form S-1 (File No. 333-176097), filed on August 5, 2011) |
|
| | |
| | Lease Agreement, dated January 1, 2002, between Young Zapp North Lamar, Ltd. and Chuy’s Opco, Inc., as amended, modified and assigned (incorporated by reference to Exhibit 10.24 to the Company’s Registration Statement on Form S-1 (File No. 333-176097), filed on August 5, 2011) |
| | Lease Agreement, dated November 1, 1998, between Young-Zapp Joint Venture II and Chuy’s Opco, Inc., as amended, modified and assigned (incorporated by reference to Exhibit 10.25 to the Company’s Registration Statement on Form S-1 (File No. 333-176097), filed on August 5, 2011) |
| | Lease Agreement, dated November 19, 1996, between Young Zapp Joint Venture-IV and Chuy’s Opco, Inc., as amended, modified and assigned (incorporated by reference to Exhibit 10.26 to the Company’s Registration Statement on Form S-1 (File No. 333-176097), filed on August 5, 2011) |
| | Lease Agreement, dated January 22, 2001, between Young Zapp JVRR, Ltd. and Chuy’s Opco, Inc., as amended, modified and assigned (incorporated by reference to Exhibit 10.27 to the Company’s Registration Statement on Form S-1 (File No. 333-176097), filed on August 5, 2011) |
| | Lease Agreement, dated June 1, 2003, between Young Zapp Shenandoah, Ltd. and Chuy’s Opco, Inc., as amended, modified and assigned (incorporated by reference to Exhibit 10.28 to the Company’s Registration Statement on Form S-1 (File No. 333-176097), filed on August 5, 2011) |
| | Lease Agreement, dated April 22, 2008, between Young Zapp Arbor Trails, Ltd. and Chuy’s Opco, Inc. (incorporated by reference to Exhibit 10.29 to the Company’s Registration Statement on Form S-1 (File No. 333-176097), filed on August 5, 2011) |
| | Sublease Agreement, dated December 1, 2016, between Young Zapp Graceland, Ltd. and Chuy’s Opco, Inc. |
| | Form of Right to Repurchase Agreement (incorporated by reference to Exhibit 10.30 of Amendment No. 2 to the Registration Statement on Form S-1 (File No. 333-176097), filed on October 27, 2011) |
| | Employment Agreement, dated November 16, 2011,March 11, 2019, between Chuy’s Holdings, Inc., Chuy’s Opco, Inc. and Steven J.Steve Hislop (incorporated by reference to Exhibit 10.31 of Amendment No. 310.27 to the Registration StatementCompany's Annual Report on Form S-1 (File No. 333-176097),10-K, filed on November 17, 2011)March 12, 2019) |
| | Employment Agreement, dated November 16, 2011,March 11, 2019, between Chuy’s Holdings, Inc., Chuy’s Opco, Inc. and Jon W. Howie (incorporated by reference to Exhibit 10.32 of Amendment No. 310.28 to the Registration StatementCompany's Annual Report on Form S-1 (File No. 333-176097),10-K, filed on November 17, 2011)March 12, 2019) |
| | Form of Employment Agreement, dated March 11, 2019, between Chuy’s Holdings, Inc., Chuy’s Opco, Inc. and certain employeesJohn Mountford (incorporated by reference to Exhibit 10.33 of Amendment No. 310.29 to the Registration StatementCompany's Annual Report on Form S-1 (File No. 333-176097),10-K, filed on November 17, 2011)March 12, 2019) |
| | Employment Agreement, dated March 11, 2019, between Chuy’s Holdings, Inc., Chuy’s Opco, Inc. and Michael Hatcher (incorporated by reference to Exhibit 10.30 to the Company's Annual Report on Form 10-K, filed on March 12, 2019) |
| | Chuy’s Holdings, Inc. Senior Management Incentive Plan (incorporated by reference to Exhibit 10.34 of Amendment No. 7 to the Registration Statement on Form S-1 (File No. 333-176097), filed on July 11, 2012) |
| | Credit Agreement, dated November 30, 2012, by and among Chuy’s Holdings, Inc., as borrower, the subsidiaries of Chuy’s Holdings, Inc., as guarantors, and Wells Fargo Bank, National Association, as administrative agent, swingline lender, issuing lender and lender (incorporated by reference to Exhibit 10.1 to the Company’s Current Report on Form 8-K, filed on December 6, 2012) |
| | | | | | | | |
| | First Amendment to the Credit Agreement, dated October 30, 2015, by and among Chuy’s Holdings, Inc., as borrower, the guarantors party thereto and Wells Fargo Bank, National Association, as administrative agent (incorporated by reference to Exhibit 10.1 to the Company’s Current Report on Form 8-K, filed on November 3, 2015) |
| | Second Amendment to Credit Agreement, dated May 21, 2020, by and among Chuy’s Holdings, Inc., as borrower, the guarantors party thereto and Wells Fargo Bank, N.A., as administrative agent (incorporated by reference to Exhibit 10.1 to the Company’s Current Report on Form 8-K, filed on May 26, 2020) |
| | Subsidiaries of Chuy’s Holdings, Inc. |
| | Consent of RSM US LLP |
| | Certification of Chief Executive Officer pursuant to Section 302 of the Sarbanes-Oxley Act of 2002 |
| | Certification of Chief Financial Officer pursuant to Section 302 of the Sarbanes-Oxley Act of 2002 |
| | Certification of Chief Executive Officer and Chief Financial Officer pursuant to 18 U.S.C. Section 1350, as adopted pursuant to Section 906 of the Sarbanes- OxleySarbanes-Oxley Act of 2002 |
101.INS+101.INS+ | | Inline XBRL Instance Document (The instance document does not appear in the interactive data file because its XBRL tags are embedded within the inline XBRL document) |
101.SCH+101.SCH+ | | Inline XBRL Taxonomy Extension Schema |
101.CAL+101.CAL+ | | Inline XBRL Taxonomy Extension Calculation Linkbase Document |
101.DEF+101.DEF+ | | Inline XBRL Taxonomy Extension Definition Linkbase Document |
101.LAB+101.LAB+ | | Inline XBRL Taxonomy Extension Label Linkbase Document |
101.PRE+101.PRE+ | | Inline XBRL Taxonomy Extension Presentation Linkbase Document |
| 104 | | Cover page Interactive Data File (formatted as Inline XBRL and contained in Exhibit 101) |
* Indicates management contract or compensatory plan or arrangement.
+ Filed herewith
++ Furnished herein
SIGNATURES
Pursuant to the requirements of Section 13 or 15(d) of the Securities Exchange Act of 1934, the registrant has duly caused this report to be signed on its behalf by the undersigned, thereunto duly authorized.
| | | | | | | | | | | | | | | | | |
| | | | | |
| Date: | March 11, 2021 | | | | |
Date: | March 15, 2018 | | CHUY’S HOLDINGS, INC. |
| | | |
| | | By: | | /s/ STEVEN J. HISLOP |
| | | | | Steven J. Hislop |
| | | | | President and Chief Executive Officer |
Pursuant to the requirements of the Securities Exchange Act of 1934, this report has been signed below by the following persons on behalf of the registrant and in the capacities and on the dates indicated.
| | | | | | | | | | | | | | |
| | | | |
| Name | | Title | | Date |
Name | | Title | | Date |
| /s/ STEVE HISLOP | | |
| Steve Hislop | | Chairman of the Board, Director, President and Chief Executive Officer (principal executive officer) | | 3/15/201811/2021 |
| /s/ JON HOWIE | | |
| Jon Howie | | Director, Vice President and Chief Financial Officer (principal financial and accounting officer) | | 3/15/201811/2021 |
/s/ JOHN ZAPP | | |
John Zapp | | Chairman of the Board, Director | | 3/15/2018 |
| /s/ STARLETTE JOHNSON | | |
| Starlette Johnson | | Director | | 3/15/201811/2021 |
| /s/ SAED MOHSENI | | |
| Saed Mohseni | | Director | | 3/15/201811/2021 |
| /s/ RANDALL DEWITT | | |
| Randall DeWitt | | Director | | 3/15/201811/2021 |
| /s/ IRA ZECHER | | | |
| Ira Zecher | | Director | | 3/15/201811/2021 |
INDEX TO CONSOLIDATED FINANCIAL STATEMENTS
Report of Independent Registered Public Accounting Firm
To the Stockholders and Board of Directors of Chuy's Holdings, Inc.
Opinion on the Financial Statements
We have audited the accompanying consolidated balance sheets of Chuy’s Holdings, Inc. and its subsidiaries (the Company) as of December 31, 201727, 2020 and December 25, 2016,29, 2019, the related consolidated statements of income, stockholders' equity and cash flows for each of the three years in the period ended December 31, 2017,27, 2020, and the related notes to the consolidated financial statements (collectively, the financial statements). In our opinion, the financial statements present fairly, in all material respects, the financial position of the Company as of December 31, 201727, 2020 and December 25, 2016,29, 2019, and the results of its operations and its cash flows for each of the three years in the period ended December 31, 2017,27, 2020, in conformity with accounting principles generally accepted in the United States of America.
We have also audited, in accordance with the standards of the Public Company Accounting Oversight Board (United States) (PCAOB), the Company's internal control over financial reporting as of December 31, 2017,27, 2020, based on criteria established in Internal Control - Control—Integrated Framework issued by the Committee of Sponsoring Organizations of the Treadway Commission in 2013, and our report dated March 15, 201811, 2021 expressed an unqualified opinion on the effectiveness of the Company's internal control over financial reporting.
Change in Accounting Principle
As discussed in Note 10 to the financial statements, the Company changed its method of accounting for leases effective December 31, 2018, due to the adoption of Accounting Standards Codification Topic 842, Leases.
Basis for Opinion
These financial statements are the responsibility of the Company’s management. Our responsibility is to express an opinion on the Company’s financial statements based on our audits. We are a public accounting firm registered with the PCAOB and are required to be independent with respect to the Company in accordance with U.S. federal securities laws and the applicable rules and regulations of the Securities and Exchange Commission and the PCAOB.
We conducted our audits in accordance with the standards of the PCAOB. Those standards require that we plan and perform the audits to obtain reasonable assurance about whether the financial statements are free of material misstatement, whether due to error or fraud. Our audits included performing procedures to assess the risks of material misstatement of the financial statements, whether due to error or fraud, and performing procedures that respond to those risks. Such procedures included examining, on a test basis, evidence regarding the amounts and disclosures in the financial statements. Our audits also included evaluating the accounting principles used and significant estimates made by management, as well as evaluating the overall presentation of the financial statements. We believe that our audits provide a reasonable basis for our opinion.
Critical Audit Matter
The critical audit matter communicated below is a matter arising from the current period audit of the financial statements that were communicated or required to be communicated to the audit committee and that: (1) relate to accounts or disclosures that are material to the financial statements and (2) involved our especially challenging, subjective, or complex judgments. The communication of the critical audit matter does not alter in any way our opinion on the financial statements, taken as a whole, and we are not, by communicating the critical audit matter below, providing separate opinions on the critical audit matter or on the accounts or disclosures to which they relate.
Impairment of long-lived assets
As described in Notes 2 and 12 to the consolidated financial statements, the Company assesses long-lived assets, such as property and equipment and operating lease assets, for impairment whenever events or changes in circumstances indicate that the carrying amount of the assets may not be recoverable. If the carrying amount of the restaurant asset group exceeds estimated future cash flows, an impairment charge may be recognized to the extent by which the restaurant asset group’s carrying amount exceeds its fair value. As of December 27, 2020, long-lived assets consisted of property and equipment, net of $185.1 million and operating lease assets, net of $159.2 million. During the year ended December 27, 2020, the Company recorded an impairment of long-lived assets of $20.9 million.
The Company makes assumptions to estimate future cash flows and to estimate the fair value of assets. We identified the assumptions used by management as a critical audit matter. Estimated future cash flows are based on the Company’s forecasts and understanding of their business, historical operating results and trends in revenue from restaurant operations and restaurant level operating costs. The Company generally uses the depreciated replacement cost method, the market approach, or discounted cash flow projections to estimate fair value. The estimates of undiscounted cash flows and fair value of restaurant asset groups required greater auditor judgment and the use of valuation specialists to assist the auditor in evaluating the assumptions used by management. Specifically, the undiscounted operating cash flow scenarios applied by the Company based on expected future performance, the revenue growth rate, operating margin assumptions, and the assumptions used to determine the fair value of the restaurant asset groups were especially challenging to evaluate as minor changes to those assumptions had a
potential significant effect on the Company’s assessment of the fair value of the restaurant asset groups and the amount of the related loss on asset impairment.
Our audit procedures related to the Company’s assumptions used to estimate future cash flows and fair value of the restaurant asset groups, included the following, among others:
•We obtained an understanding of the relevant controls related to the Company’s long-lived asset impairment assessment process and tested such controls for design and operating effectiveness, including controls related to the revenue growth rate, operating margin assumptions used by management to determine undiscounted cash flows, and the fair value of restaurant asset groups.
•We performed sensitivity analyses over the probability weighting scenarios applied by the Company based on expected future performance, the revenue growth rate and the operating margin assumptions.
•We evaluated the Company’s forecasted revenue growth rate and operating margin assumptions, including considerations of the effects related to the COVID-19 pandemic, for the restaurant asset groups by comparing the assumptions to the Company’s historical performance across all restaurant locations to assess the Company’s ability to accurately forecast.
•We evaluated the Company’s assumptions used to determine future cash flows for operating locations, potential lease-up period and sublease income for non-operating locations. We also assessed the discount rate used in the discounted cash flow projections to evaluate the impact of changes on the fair value of restaurant asset groups.
/s/ RSM US LLP
We have served as the Company’s auditor since 2006.
Dallas,Austin, Texas
March 15, 201811, 2021
CHUY’S HOLDINGS, INC.
Consolidated Balance Sheets
(In thousands, except share and per share data)
| | | | | | | | | | | |
| December 27, 2020 | | December 29, 2019 |
| Assets | | | |
| Current assets: | | | |
| Cash and cash equivalents | $ | 86,817 | | | $ | 10,074 | |
| Accounts receivable | 1,507 | | | 1,426 | |
| Lease incentives receivable | 200 | | | 250 | |
| Inventories | 1,449 | | | 1,657 | |
| Income tax receivable | 974 | | | 0 | |
| Prepaid expenses and other current assets | 3,614 | | | 3,376 | |
| Total current assets | 94,561 | | | 16,783 | |
| Property and equipment, net | 185,105 | | | 210,750 | |
| Operating lease assets | 159,156 | | | 169,299 | |
| Deferred tax asset, net | 7,806 | | | 2,601 | |
| Other assets and intangible assets, net | 1,078 | | | 667 | |
| Trade name | 21,900 | | | 21,900 | |
| Goodwill | 24,069 | | | 24,069 | |
| Total assets | $ | 493,675 | | | $ | 446,069 | |
| Liabilities and Stockholders' Equity | | | |
| Current liabilities: | | | |
| Accounts payable | $ | 2,977 | | | $ | 4,253 | |
| Accrued liabilities | 25,775 | | | 21,107 | |
| Operating lease liabilities | 14,566 | | | 10,307 | |
| Income tax payable | 0 | | | 532 | |
| | | |
| Total current liabilities | 43,318 | | | 36,199 | |
| | | |
| Operating lease liabilities, less current portion | 207,601 | | | 214,541 | |
| Other liabilities | 898 | | | 393 | |
| | | |
| | | |
| | | |
| Total liabilities | 251,817 | | | 251,133 | |
| | | |
| Contingencies | 0 | | 0 |
| Stockholders’ equity: | | | |
| Common stock, $0.01 par value; 60,000,000 shares authorized; 19,710,549 shares issued and outstanding at December 27, 2020 and 16,636,464 shares issued and outstanding at December 29, 2019 | 197 | | | 166 | |
| Preferred stock, $0.01 par value; 15,000,000 shares authorized and 0 shares issued or outstanding at December 27, 2020 and December 29, 2019 | 0 | | | 0 | |
| Paid-in capital | 144,897 | | | 94,712 | |
| Retained earnings | 96,764 | | | 100,058 | |
| Total stockholders’ equity | 241,858 | | | 194,936 | |
| Total liabilities and stockholders’ equity | $ | 493,675 | | | $ | 446,069 | |
|
| | | | | | | |
| | December 31, 2017 | | December 25, 2016 |
| Assets | | | |
| Current assets: | | | |
| Cash and cash equivalents | $ | 8,785 |
| | $ | 13,694 |
|
| Accounts receivable | 2,696 |
| | 1,132 |
|
| Lease incentives receivable | 6,351 |
| | 4,022 |
|
| Inventories | 1,605 |
| | 1,451 |
|
| Income tax receivable | 1,225 |
| | 2,183 |
|
| Prepaid expenses and other current assets | 5,924 |
| | 5,207 |
|
| Total current assets | 26,586 |
| | 27,689 |
|
| Property and equipment, net | 197,255 |
| | 165,150 |
|
| Other assets and intangible assets, net | 2,157 |
| | 1,920 |
|
| Trade name | 21,900 |
| | 21,900 |
|
| Goodwill | 24,069 |
| | 24,069 |
|
| Total assets | $ | 271,967 |
| | $ | 240,728 |
|
| Liabilities and Stockholders' Equity | | | |
| Current liabilities: | | | |
| Accounts payable | $ | 6,396 |
| | $ | 8,014 |
|
| Accrued liabilities | 16,488 |
| | 17,757 |
|
| Deferred lease incentives | 2,773 |
| | 2,335 |
|
| Total current liabilities | 25,657 |
| | 28,106 |
|
| Deferred tax liability, net | 6,438 |
| | 13,769 |
|
| Accrued deferred rent | 11,764 |
| | 9,169 |
|
| Deferred lease incentives, less current portion | 39,146 |
| | 32,619 |
|
| Total liabilities | 83,005 |
| | 83,663 |
|
| | | | |
| Commitments and contingencies |
| |
|
| Stockholders’ equity: | | | |
| Common stock, $0.01 par value; 60,000,000 shares authorized; 16,923,741 shares issued and outstanding at December 31, 2017 and 16,839,348 shares issued and outstanding at December 25, 2016 | 169 |
| | 168 |
|
| Preferred stock, $0.01 par value; 15,000,000 shares authorized and no shares issued or outstanding at December 31, 2017 and December 25, 2016 | — |
| | — |
|
| Paid-in capital | 100,140 |
| | 97,200 |
|
| Retained earnings | 88,653 |
| | 59,697 |
|
| Total stockholders’ equity | 188,962 |
| | 157,065 |
|
| Total liabilities and stockholders’ equity | $ | 271,967 |
| | $ | 240,728 |
|
See Notes to Consolidated Financial Statements
CHUY’S HOLDINGS, INC.
Consolidated Statements of Income
(In thousands, except share and per share data)
| | | | | | | | | | | | | | | | | |
| | Fiscal Year Ended |
| December 27, 2020 | | December 29, 2019 | | December 30, 2018 |
| Revenue | $ | 320,952 | | | $ | 426,357 | | | $ | 398,200 | |
| Costs and expenses: | | | | | |
| Cost of sales | 79,033 | | | 110,152 | | | 101,946 | |
| Labor | 98,184 | | | 150,779 | | | 144,325 | |
| Operating | 50,352 | | | 62,121 | | | 57,457 | |
| Occupancy | 29,406 | | | 32,151 | | | 30,028 | |
| General and administrative | 22,195 | | | 23,681 | | | 20,725 | |
| Marketing | 2,732 | | | 5,555 | | | 3,929 | |
| Restaurant pre-opening | 1,769 | | | 2,949 | | | 4,382 | |
| Legal settlement | 0 | | | 615 | | | 0 | |
| Impairment, closed restaurant and other costs | 26,794 | | | 14,179 | | | 12,336 | |
| Gain on insurance settlements | (1,000) | | | 0 | | | 0 | |
| Depreciation | 20,031 | | | 20,739 | | | 19,804 | |
| Total costs and expenses | 329,496 | | | 422,921 | | | 394,932 | |
| (Loss) income from operations | (8,544) | | | 3,436 | | | 3,268 | |
| | | | | |
| Interest expense, net | 257 | | | 122 | | | 83 | |
| (Loss) income before income taxes | (8,801) | | | 3,314 | | | 3,185 | |
| Income tax benefit | (5,507) | | | (2,901) | | | (2,354) | |
| Net (loss) income | $ | (3,294) | | | $ | 6,215 | | | $ | 5,539 | |
| Net (loss) income per common share: | | | | | |
| Basic | $ | (0.18) | | | $ | 0.37 | | | $ | 0.33 | |
| Diluted | $ | (0.18) | | | $ | 0.37 | | | $ | 0.32 | |
| Weighted-average shares outstanding: | | | | | |
| Basic | 18,396,335 | | | 16,728,955 | | | 16,931,589 | |
| Diluted | 18,396,335 | | | 16,824,395 | | | 17,062,347 | |
|
| | | | | | | | | | | |
| | Fiscal Year Ended |
| | December 31, 2017 | | December 25, 2016 | | December 27, 2015 |
| Revenue | $ | 369,589 |
| | $ | 330,613 |
| | $ | 287,062 |
|
| Costs and expenses: | | | | | |
| Cost of sales | 96,270 |
| | 85,542 |
| | 75,686 |
|
| Labor | 128,846 |
| | 110,730 |
| | 93,625 |
|
| Operating | 51,462 |
| | 45,900 |
| | 39,954 |
|
| Occupancy | 25,642 |
| | 22,204 |
| | 19,019 |
|
| General and administrative | 18,661 |
| | 17,560 |
| | 16,176 |
|
| Marketing | 2,756 |
| | 2,390 |
| | 2,249 |
|
| Restaurant pre-opening | 6,233 |
| | 5,348 |
| | 4,417 |
|
| Impairment and closure costs | — |
| | 1,517 |
| | 4,360 |
|
| Gain on insurance settlements | (1,362 | ) | | — |
| | — |
|
| Depreciation and amortization | 17,560 |
| | 15,081 |
| | 12,827 |
|
| Total costs and expenses | 346,068 |
| | 306,272 |
| | 268,313 |
|
| Income from operations | 23,521 |
| | 24,341 |
| | 18,749 |
|
| Interest expense, net | 65 |
| | 63 |
| | 110 |
|
| Income before income taxes | 23,456 |
| | 24,278 |
| | 18,639 |
|
| Income tax (benefit) expense | (5,500 | ) | | 7,034 |
| | 5,743 |
|
| Net income | $ | 28,956 |
| | $ | 17,244 |
| | $ | 12,896 |
|
| Net income per common share: | | | | | |
| Basic | $ | 1.71 |
| | $ | 1.03 |
| | $ | 0.78 |
|
| Diluted | $ | 1.70 |
| | $ | 1.02 |
| | $ | 0.77 |
|
| Weighted-average shares outstanding: | | | | | |
| Basic | 16,894,986 |
| | 16,676,073 |
| | 16,470,278 |
|
| Diluted | 17,003,233 |
| | 16,887,882 |
| | 16,739,387 |
|
See Notes to Consolidated Financial Statements
CHUY’S HOLDINGS, INC.
Consolidated Statements of Stockholders’ Equity
For the Fiscal Years Ended December 31, 2017, December 25, 2016 and December 27, 2015
(In thousands, except share and per share data)
| | | | | | | | | | | | | Common Stock | | Paid-in Capital | | Retained Earnings | | |
| | Common Stock | | Paid-in Capital | | Retained Earnings | | | Shares | | Amount | | Total |
| Shares | | Amount | | Total | |
| Balance, December 28, 2014 | 16,440,906 |
| | $ | 164 |
| | $ | 88,467 |
| | $ | 29,557 |
| | $ | 118,188 |
| |
| Balance, December 31, 2017 | | Balance, December 31, 2017 | 16,923,741 | | | $ | 169 | | | $ | 100,140 | | | $ | 88,653 | | | $ | 188,962 | |
| Stock-based compensation | — |
| | — |
| | 1,832 |
| | — |
| | 1,832 |
| Stock-based compensation | — | | | 0 | | | 3,297 | | | 0 | | | 3,297 | |
| Proceeds from exercise of stock options | 28,520 |
| | 1 |
| | 163 |
| | — |
| | 164 |
| Proceeds from exercise of stock options | 25,745 | | | 0 | | | 453 | | | 0 | | | 453 | |
| Excess tax benefit from stock-based compensation | — |
| | — |
| | 34 |
| | — |
| | 34 |
| |
| Repurchase of shares of common stock | | Repurchase of shares of common stock | (159,570) | | | (2) | | | (3,605) | | | 0 | | | (3,607) | |
| Settlement of restricted stock units | 23,590 |
| | — |
| | — |
| | — |
| | — |
| Settlement of restricted stock units | 95,581 | | | 1 | | | (1) | | | 0 | | | 0 | |
| Indirect repurchase of shares for minimum tax withholdings | (2,416 | ) | | — |
| | (57 | ) | | — |
| | (57 | ) | Indirect repurchase of shares for minimum tax withholdings | (29,124) | | | 1 | | | (794) | | | 0 | | | (793) | |
| Net Income | — |
| | — |
| | — |
| | 12,896 |
| | 12,896 |
| Net Income | — | | | 0 | | | 0 | | | 5,539 | | | 5,539 | |
| Balance, December 27, 2015 | 16,490,600 |
| | 165 |
| | 90,439 |
| | 42,453 |
| | 133,057 |
| |
| Balance, December 30, 2018 | | Balance, December 30, 2018 | 16,856,373 | | | 169 | | | 99,490 | | | 94,192 | | | 193,851 | |
| Adoption of ASC 842 (Leases) | | Adoption of ASC 842 (Leases) | — | | | 0 | | | 0 | | | (349) | | | (349) | |
| Stock-based compensation | — |
| | — |
| | 2,352 |
| | — |
| | 2,352 |
| Stock-based compensation | — | | | 0 | | | 3,501 | | | 0 | | | 3,501 | |
| Proceeds from exercise of stock options | 312,165 |
| | 3 |
| | 1,468 |
| | — |
| | 1,471 |
| Proceeds from exercise of stock options | 46,936 | | | 0 | | | 388 | | | 0 | | | 388 | |
| Excess tax benefit from stock-based compensation | — |
| | — |
| | 3,265 |
| | — |
| | 3,265 |
| |
| Repurchase of shares of common stock | | Repurchase of shares of common stock | (351,774) | | | (4) | | | (7,789) | | | 0 | | | (7,793) | |
| Settlement of restricted stock units | 46,004 |
| | — |
| | — |
| | — |
| | — |
| Settlement of restricted stock units | 123,496 | | | 1 | | | (1) | | | 0 | | | 0 | |
| Indirect repurchase of shares for minimum tax withholdings | (9,421 | ) | | — |
| | (324 | ) | | — |
| | (324 | ) | Indirect repurchase of shares for minimum tax withholdings | (38,567) | | | 0 | | | (877) | | | 0 | | | (877) | |
| Net Income | — |
| | — |
| | — |
| | 17,244 |
| | 17,244 |
| Net Income | — | | | 0 | | | 0 | | | 6,215 | | | 6,215 | |
| Balance, December 25, 2016 | 16,839,348 |
| | 168 |
| | 97,200 |
| | 59,697 |
| | 157,065 |
| |
| Balance, December 29, 2019 | | Balance, December 29, 2019 | 16,636,464 | | | 166 | | | 94,712 | | | 100,058 | | | 194,936 | |
| | Stock-based compensation | — |
| | — |
| | 3,098 |
| | — |
| | 3,098 |
| Stock-based compensation | — | | | 0 | | | 3,922 | | | 0 | | | 3,922 | |
| Proceeds from exercise of stock options | 35,170 |
| | — |
| | 340 |
| | — |
| | 340 |
| Proceeds from exercise of stock options | 20,918 | | | 0 | | | 234 | | | 0 | | | 234 | |
| Sale of common stock from ATM offering, net of fees and expenses | | Sale of common stock from ATM offering, net of fees and expenses | 3,041,256 | | | 31 | | | 48,136 | | | 0 | | | 48,167 | |
| Repurchase of shares of common stock | | Repurchase of shares of common stock | (90,144) | | | (1) | | | (1,421) | | | 0 | | | (1,422) | |
| Settlement of restricted stock units | 67,198 |
| | 1 |
| | (1 | ) | | — |
| | — |
| Settlement of restricted stock units | 146,325 | | | 1 | | | (1) | | | 0 | | | 0 | |
| Indirect repurchase of shares for minimum tax withholdings | (17,975 | ) | | — |
| | (497 | ) | | — |
| | (497 | ) | Indirect repurchase of shares for minimum tax withholdings | (44,270) | | | 0 | | | (685) | | | 0 | | | (685) | |
| Net Income | — |
| | — |
| | — |
| | 28,956 |
| | 28,956 |
| |
| Balance, December 31, 2017 | 16,923,741 |
| | $ | 169 |
| | $ | 100,140 |
| | $ | 88,653 |
| | $ | 188,962 |
| |
| Net loss | | Net loss | — | | | 0 | | | 0 | | | (3,294) | | | (3,294) | |
| Balance, December 27, 2020 | | Balance, December 27, 2020 | 19,710,549 | | | $ | 197 | | | $ | 144,897 | | | $ | 96,764 | | | $ | 241,858 | |
See Notes to Consolidated Financial Statements.
CHUY’S HOLDINGS, INC.
Consolidated Statements of Cash Flows
|
| | | | | | | | | | | |
| | Fiscal Year Ended |
| | December 31, 2017 | | December 25, 2016 | | December 27, 2015 |
| Cash flows from operating activities: | | | | | |
| Net income | $ | 28,956 |
| | $ | 17,244 |
| | $ | 12,896 |
|
| Adjustments to reconcile net income to net cash provided by operating activities: | | | | | |
| Depreciation and amortization | 17,560 |
| | 15,081 |
| | 12,827 |
|
| Amortization of loan origination costs | 34 |
| | 33 |
| | 43 |
|
| Impairment and closure costs | — |
| | 1,367 |
| | 4,360 |
|
| Stock-based compensation | 2,880 |
| | 2,193 |
| | 1,718 |
|
| Excess tax benefit from stock-based compensation | — |
| | (3,265 | ) | | (34 | ) |
| Gain on insurance related to property and equipment | (61 | ) | | — |
| | — |
|
| Loss on disposal of property and equipment | 107 |
| | 43 |
| | 108 |
|
| Amortization of deferred lease incentives | (2,517 | ) | | (2,125 | ) | | (1,684 | ) |
| Deferred income taxes | (7,331 | ) | | 3,488 |
| | 3,074 |
|
| Changes in operating assets and liabilities: | | | | | |
| Accounts receivable | (1,564 | ) | | (14 | ) | | (196 | ) |
| Inventories | (154 | ) | | (265 | ) | | (268 | ) |
| Income tax receivable | 958 |
| | (1,196 | ) | | (1,362 | ) |
| Prepaid expenses and other current assets | (717 | ) | | (2,574 | ) | | 448 |
|
| Accounts payable | (2,248 | ) | | (1,471 | ) | | (1,708 | ) |
| Accrued liabilities and deferred rent | 1,326 |
| | 5,975 |
| | 7,529 |
|
| Deferred lease incentives | 7,153 |
| | 8,124 |
| | 7,642 |
|
| Net cash provided by operating activities | 44,382 |
|
| 42,638 |
| | 45,393 |
|
| Cash flows from investing activities: | | | | | |
| Purchase of property and equipment, net | (49,185 | ) | | (41,566 | ) | | (31,628 | ) |
| Insurance proceeds from property claims | 501 |
| | — |
| | — |
|
| Purchase of other assets | (450 | ) | | (319 | ) | | (372 | ) |
| Net cash used in investing activities | (49,134 | ) | | (41,885 | ) | | (32,000 | ) |
| Cash flows from financing activities: | | | | | |
| Borrowings under revolving line of credit | — |
| | 2,000 |
| | 1,000 |
|
| Payments under revolving line of credit | — |
| | (2,000 | ) | | (9,750 | ) |
| Loan origination costs | — |
| | — |
| | (70 | ) |
| Excess tax benefit from stock-based compensation | — |
| | 3,265 |
| | 34 |
|
| Proceeds from the exercise of stock options | 340 |
| | 1,471 |
| | 164 |
|
| Indirect repurchase of shares for minimum tax withholdings | (497 | ) | | (324 | ) | | (57 | ) |
| Net cash (used in) provided by financing activities | (157 | ) | | 4,412 |
| | (8,679 | ) |
| Net (decrease) increase in cash and cash equivalents | (4,909 | ) | | 5,165 |
| | 4,714 |
|
| Cash and cash equivalents, beginning of period | 13,694 |
| | 8,529 |
| | 3,815 |
|
| Cash and cash equivalents, end of period | $ | 8,785 |
| | $ | 13,694 |
| | $ | 8,529 |
|
| | | | | | |
| Supplemental disclosure of non-cash investing and financing activities: | | | | | |
| Property and equipment and other assets acquired by accounts payable | $ | 630 |
| | $ | 2,191 |
| | $ | 3,081 |
|
| | | | | | |
| Supplemental cash flow disclosures: | | | | | |
| Cash paid for interest | $ | 39 |
| | $ | 33 |
| | $ | 95 |
|
| Cash paid for income taxes | $ | 908 |
| | $ | 1,385 |
| | $ | 4,091 |
|
| | | | | | | | | | | | | | | | | |
| | Fiscal Year Ended |
| | December 27, 2020 | | December 29, 2019 | | December 30, 2018 |
| Cash flows from operating activities: | | | | | |
| Net (loss) income | $ | (3,294) | | | $ | 6,215 | | | $ | 5,539 | |
| Adjustments to reconcile net income to net cash provided by operating activities: | | | | | |
| Depreciation | 20,031 | | | 20,739 | | | 19,804 | |
| Amortization of operating lease assets | 9,233 | | | 7,965 | | | 0 | |
| Amortization of loan origination costs | 53 | | | 33 | | | 33 | |
| Loss on asset impairment, closed restaurant and other costs | 22,138 | | | 12,693 | | | 12,336 | |
| Stock-based compensation | 3,702 | | | 3,286 | | | 3,096 | |
| | | | | |
| | | | | |
| Loss on disposal of property and equipment | 437 | | | 283 | | | 97 | |
| Amortization of deferred lease incentives | 0 | | | 0 | | | (2,869) | |
| Deferred income taxes | (5,205) | | | (5,096) | | | (3,837) | |
| Changes in operating assets and liabilities: | | | | | |
| Accounts receivable | (81) | | | 628 | | | 642 | |
| Lease incentive receivable | 50 | | | 1,347 | | | 4,754 | |
| Inventories | 208 | | | (116) | | | 64 | |
| Income tax receivable and payable | (1,506) | | | 1,135 | | | 622 | |
| Prepaid expenses and other assets | (397) | | | 995 | | | 2,188 | |
| Accounts payable | (1,302) | | | (2,594) | | | (1,454) | |
| Accrued and other liabilities | 5,173 | | | 4,279 | | | 733 | |
| Accrued deferred rent | 0 | | | 0 | | | 2,752 | |
| Operating lease liability | (6,526) | | | (8,361) | | | 0 | |
| Deferred lease incentives | 0 | | | 0 | | | 3,382 | |
| Net cash provided by operating activities | 42,714 | | | 43,431 | | | 47,882 | |
| Cash flows from investing activities: | | | | | |
| Purchase of property and equipment, net | (12,149) | | | (32,870) | | | (44,087) | |
| | | | | |
| Purchase of other assets | 0 | | | (404) | | | (434) | |
| Net cash used in investing activities | (12,149) | | | (33,274) | | | (44,521) | |
| Cash flows from financing activities: | | | | | |
| Net proceeds from sale of common stock | 48,167 | | | 0 | | | 0 | |
| Borrowings under revolving line of credit | 25,000 | | | 5,000 | | | 0 | |
| Payments under revolving line of credit | (25,000) | | | (5,000) | | | 0 | |
| Loan origination costs | (116) | | | 0 | | | 0 | |
| | | | | |
| Proceeds from the exercise of stock options | 234 | | | 388 | | | 453 | |
| Repurchase of shares of common stock | (1,422) | | | (7,793) | | | (3,607) | |
| Indirect repurchase of shares for minimum tax withholdings | (685) | | | (877) | | | (793) | |
| Net cash provided by (used in) financing activities | 46,178 | | | (8,282) | | | (3,947) | |
| Net increase (decrease) in cash and cash equivalents | 76,743 | | | 1,875 | | | (586) | |
| Cash and cash equivalents, beginning of period | 10,074 | | | 8,199 | | | 8,785 | |
| Cash and cash equivalents, end of period | $ | 86,817 | | | $ | 10,074 | | | $ | 8,199 | |
| | | | | |
| Supplemental disclosure of non-cash investing and financing activities: | | | | | |
| Property and equipment and other assets acquired by accounts payable | $ | 26 | | | $ | 384 | | | $ | 1,521 | |
| | | | | |
| Supplemental cash flow disclosures: | | | | | |
| Cash paid for interest | $ | 202 | | | $ | 77 | | | $ | 35 | |
| Cash paid for income taxes | $ | 1,232 | | | $ | 1,059 | | | $ | 862 | |
See Notes to Consolidated Financial Statements
Table of Contents
CHUY’S HOLDINGS, INC.
Notes to Consolidated Financial Statements
(Tabular dollar amounts in thousands, except share and per share data)
1. Description of Business
Chuy’s Holdings, Inc., a Delaware corporation (the “Company”), through its subsidiaries owns and operates restaurants inacross 17 states including Texas, and 19 states in the Southeastern and Midwestern United States. All of the Company’s restaurants operate under the name Chuy’s. The Company had 91, 80,operated 92 as of December 27, 2020, and 69100 restaurants as of December 31, 2017, December 25, 2016,29, 2019 and December 27, 2015, respectively.30, 2018.
Chuy’s was founded in Austin, Texas in 1982 and prior to 2006, operated as Chuy’s Comida Deluxe, Inc. (“Chuy’s”). The Company was incorporated in November 2006.
2. Summary of Significant Accounting Policies
Principles of Consolidationconsolidation
The accompanying consolidated financial statements include the accounts of the Company and its subsidiaries. All significant intercompany balances and transactions have been eliminated.
Certain amounts in the prior periods presented have been reclassified to conform to the current period financial statement presentation. These reclassifications have no effect on previously reported net income, income per share or stockholder's equity.
Fiscal Yearyear
The Company utilizes a 52- or 53-week fiscal year that ends on the last Sunday of the calendar year. The fiscal year ended December 31, 2017 consisted of 53 weeks and fiscal years ended December 25, 201627, 2020, December 29, 2019 and December 27, 201530, 2018 each consisted of 52 weeks.
COVID-19 pandemic
During March 2020, the World Health Organization declared the COVID-19 outbreak to be a global pandemic and the United States declared a National Public Health Emergency. The COVID-19 pandemic has significantly impacted health and economic conditions throughout the United States. Federal, state and local governments took a variety of actions to contain the spread of COVID-19. Many jurisdictions where our restaurants are located required mandatory closures or imposed capacity limitations and other restrictions affecting our operations. As of December 27, 2020, the Company had reopened dining rooms at varying degrees of operating capacity in 92 of its 101 restaurants and 9 restaurants remained temporarily closed.
During the year-ended December 27, 2020, the Company took various steps to reduce non-essential spend, postpone restaurant development and rightsize operations in light of reduced sales volume to improve our store level profitability and increase our cash flows. The Company also enhanced its liquidity position by selling shares of its common stock in an "At-The-Market" ("ATM") offering and using a portion of the net proceeds to repay the $25.0 million outstanding under its revolving credit facility. As of December 27, 2020, the Company had $86.8 million in cash and cash equivalents, no debt and $25.0 million of availability under its revolving credit facility. Management believes the Company's strong financial position, combined with the measures taken during the pandemic, will allow the Company to meet its financial obligations over the next twelve months.
We cannot predict how soon we will be able to reopen all of our restaurants at full capacity, and our ability to reopen and stay open will depend in part on the actions of a number of governmental bodies over which we have no control. Moreover, once restrictions are lifted, it is unclear how quickly customers will return to our restaurants, which may be a function of continued concerns over safety and/or depressed consumer sentiment due to adverse economic conditions, including job losses.
Accounting Estimatesestimates
The preparation of the consolidated financial statements in conformity with U.S. Generally Accepted Accounting Principles ("GAAP") requires management to make estimates and assumptions that affect certain reported amounts of assets and liabilities and disclosure of contingent assets and liabilities at the date of the financial statements and the reported amounts of revenues and expenses for the period. Actual results could differ from estimates.
Cash and Cash Equivalentscash equivalents
The Company considers all cash and short-term investments with original maturities of three months or less as cash equivalents. Amounts receivable from credit card processors are considered cash equivalents because they are both short in term and highly liquid in nature, and are typically converted to cash within three business days of the sales transactions.
Lease Incentives Receivableincentives receivable
Lease incentives receivable consist of receivables from landlords provided for under the lease agreements to reimburse the Company for leasehold improvements.
Table of Contents
CHUY’S HOLDINGS, INC.
Notes to Consolidated Financial Statements (Continued)
(Tabular dollar amounts in thousands, except share and per share data)
Inventories
Inventories consist of food, beverage, and merchandise and are stated at the lower of cost (first-in, first-out method) or market.
Property and Equipmentnet realizable value.
Property and equipment
Property and equipment, net are recorded at cost, less accumulated depreciation. Equipment consists primarily of restaurant equipment, furniture, fixtures and smallwares. Depreciation is calculated using the straight-line method over the estimated useful life of the related asset, which ranges from three3 to seven15 years. Expenditures for major additions and improvements are capitalized. Leasehold improvements are capitalized and amortized using the straight-line method over the shorter of the lease term, including option periods that are reasonably assured of renewal, or the estimated useful life of the asset, which ranges from five to 20 years.
Leases and leasehold improvements
The Company leases land and/and or buildings for its corporate officeoffices and all of its restaurants under various long-term operating lease agreements. The Company usesdetermines if a contract contains a lease life thatat inception. The lease term begins on the date that the Company takes possession under the lease, including the pre-opening period during construction, when in many cases the Company is not making rent payments.
Operating lease assets and liabilities are recognized at the lease commencement date for material leases with a term of greater than 12 months. Operating lease liabilities represent the present value of future minimum lease payments. Since our leases do not provide an implicit rate, our operating lease liabilities are calculated using the Company's secured incremental borrowing rate at lease commencement. We have no outstanding debt, and as a result, we estimate this rate based on prevailing financial market conditions, comparable companies, credit analysis and management judgment. Minimum lease payments (“Rent Holiday”).
Certaininclude only fixed lease components of the Company’sagreement, as well as variable rate payments that depend on an index, initially measured using the index at the lease commencement date.
Operating lease assets represent our right to use an underlying asset and are based upon the operating leases contain predetermined fixed escalations of the minimum rent during the original term oflease liabilities adjusted for prepaid or accrued lease payments, initial direct costs and lease incentives. Lease incentives are recognized when earned and reduce our operating lease asset related to the lease. For these leases and those with a Rent Holiday,They are amortized through the Company recognizesoperating lease assets as reductions of rent expense over the related rentlease term.
Operating lease expense is recognized on a straight-line basis over the lease term and records the difference between the amounts charged to operations and amounts paid, as accrued deferred rent.
In addition, certainterm. Certain of the Company’s operating leases contain clauses that provide for additional contingent rent based on a percentage of sales greater than certain specified target amounts. The Company recognizes contingent rent expense priorVariable lease payments that do not depend on a rate or index, escalation in the index subsequent to the initial measurement, payments associated with non-lease components such as common area maintenance, real estate taxes and insurance, and short-term lease payments (leases with less than a 12 month term) are expensed as incurred or when the achievement of the specified target that triggers the contingent rent provided achievement of the target is considered probable.
CHUY’S HOLDINGS, INC.
Notes to Consolidated Financial Statements (Continued)
(Tabular dollar amounts in thousands, except shareOther assets and per share data)
Leasehold improvements financed by the landlord through lease incentive allowances are capitalized with the lease incentive allowances recorded as deferred lease incentives. Such leasehold improvements are amortized on a straight-line basis over the lesser of the life of the asset or the defined lease term, which includes option periods which are reasonably assured of renewal. Deferred lease incentives are amortized on a straight-line basis over the same defined lease term, and are recorded as a reduction of occupancy expense.
Other Assets and Intangible Assetsintangible assets
Other assets and intangible assets include liquor licenses, lease acquisition costs and loan origination costs andwhich are all stated at cost, less any accumulated amortization.amortization, as well as deferred compensation plan assets which are stated at fair value.
Goodwill
Goodwill represents the excess of cost over the fair value of assets of the businesses acquired. Goodwill is not amortized, but is subject to impairment tests at least annually. The Company performs testsa quantitative test to assess potential impairments onat the first dayend of the fourth quarterfiscal year or during the year if an event or other circumstance indicates that goodwill may be impaired. The first step of the goodwill quantitative impairment test compares the implied estimated fair value of the reporting unit to the carrying amount, including goodwill. The Company considers all of its stores in total as one reporting unit. If the estimated fair value of the reporting unit is less than the carrying amount, then it is more likely than not that a goodwill impairment exits and a second step must be completed in order to determine the amount of the goodwill impairment. In the second step, the implied fair value of the goodwill is determined by allocating fair value to all of its assets and liabilities, other than goodwill, in a manner similar to a purchase price allocation. If the resulting implied fair value of the goodwill that results from the application of this second step is less than the carrying amount of the goodwill, an impairment charge is recorded for the difference.difference, limited to the total amount of goodwill allocated to that reporting unit. No goodwill impairment charges were recognized during 2017, 2016,2020, 2019, or 2015.2018.
Indefinite Life Intangibleslife intangibles
An intangible asset is determined to have an indefinite useful life when there are no legal, regulatory, contractual, competitive, economic or other factors that may limit the period over which the asset is expected to contribute directly or indirectly to the future cash flows of the Company. Intangible assets acquired in a business combination andare determined to have an indefinite useful life and are not amortized because there is no foreseeable limitamortized.
Table of Contents
CHUY’S HOLDINGS, INC.
Notes to the cash flows generated by the intangible asset,Consolidated Financial Statements (Continued)
(Tabular dollar amounts in thousands, except share and have no legal, contractual, regulatory, economic or competitive limiting factors.per share data)
The annual impairment evaluation for indefinite life intangible assets is performed at the end of the fiscal year and includes a quantitativean assessment to determine whether the fair value of the indefinite life intangible assets is less than their carrying value. We calculate the estimated fair value of the indefinite-lived intangible asset and compare it to the carrying value. Fair value is estimated primarily using future discounted cash flow projections in conjunction with qualitative factors and future operating plans. When the carrying value exceeds fair value, an impairment charge is recorded for the amount of the difference. An intangible asset is determined to have an indefinite useful life when there are no legal, regulatory, contractual, competitive, economic or other factors that may limit the period over which the asset is expected to contribute directly or indirectly to the future cash flows of the Company. The Company also annually evaluates intangible assets that are not being amortized to determine whether events and circumstances continue to support an indefinite useful life. If an intangible asset that is not being amortized is determined to have a finite useful life, the asset will be amortized prospectively over the estimated remaining useful life and accounted for in the same manner as intangible assets subject to amortization. No indefinite life intangible impairment charges were recognized during 2017, 2016,2020, 2019, or 2015.2018.
Impairment of Long-lived Assetslong-lived assets
The Company reviews long-lived assets, such as property and equipment, operating lease assets and intangibles, subject to amortization, for impairment when events or circumstances indicate the carrying value of the assets may not be recoverable. In determining the recoverability of the asset value, an analysis is performed at the individual restaurant level and primarily includes an assessment of historical undiscounted cash flows and other relevant factors and circumstances. The Company evaluates future cash flow projections in conjunction with qualitative factors and future operating plans and regularly reviews any restaurants with a deficient level of cash flows for the previous 24 months to determine if impairment testing is necessary. Recoverability of assets to be held and used is measured by a comparison of the carrying amountvalue of the restaurant to its estimated future undiscounted cash flows. If the estimated undiscounted future cash flows are less than the carrying value, we determine if there is an impairment loss by comparing the carrying value of the restaurant to its estimated fair value. Based on this analysis, if the carrying amountvalue of the restaurant exceeds theits estimated fair value, an impairment charge is recognized by the amount by which the carrying amountvalue exceeds the fair value.
As a result
We make assumptions to estimate future cash flows and asset fair values. The estimated fair value is generally determined using the depreciated replacement cost method, the market approach, or discounted cash flow projections. Estimated future cash flows are highly subjective assumptions based on Company’s projections and understanding of the above mentioned review process, the Company recognized a $4.4 million non-cash loss on asset impairment as a result of the performance related to three restaurantsour business, historical operating results, and trends in fiscal 2015. The Company did not recognize an impairment charge during fiscal 2017sales and 2016. restaurant level operating costs.
The Company’s impairment assessment process requires the use of estimates and assumptions regarding future cash flows and operating outcomes, which are based upon a significant degree of management judgment. The estimates used in the impairment analysis represent a Level 3 fair value measurement. The Company continues to assess the performance of restaurants and monitors
CHUY’S HOLDINGS, INC.
Notes to Consolidated Financial Statements (Continued)
(Tabular dollar amounts in thousands, except share and per share data)
the need for future impairment. Changes in the economic environment, real estate markets, capital spending, and overall operating performance and underlying assumptions could impact these estimates and result in future impairment charges.
As a result of the above mentioned process, the Company recorded a non-cash loss on asset impairment of $20.9 million during the fiscal year ended December 27, 2020, $12.7 million during the fiscal year ended December 29, 2019 and $12.3 million during the fiscal year December 30, 2018.
Estimated Fair Valuefair value of Financial Instrumentsfinancial instruments
The Company uses a three-tier value hierarchy, which classifies the inputs used in measuring fair values, in determining the fair value of the Company's non-financial assets and non-financial liabilities. These tiers include: Level 1, defined as observable inputs such as quoted prices for identical instruments in active markets; Level 2, defined as inputs other than quoted prices in active markets that are either directly or indirectly observable; and Level 3, defined as unobservable inputs in which little or no market data exists, therefore requiring an entity to develop its own assumptions. There were no changes in the methods or assumptions used in measuring fair value during the period.
The carrying amounts of cash and cash equivalents, accounts receivable and accounts payable at December 31, 201727, 2020 and December 25, 201629, 2019 approximate their fair value due to the short-term maturities of these financial instruments. These inputs are categorized as Level 1 inputs.
The Company provides a certain group of eligible employees the ability to participate in the Company's nonqualified deferred compensation plan. This plan allows participants to defer up to 80% of their salary and up to 100% of their bonus, on pre-tax basis, and contribute such amounts to one or more investment funds held in a rabbi trust. We report the accounts of the rabbi trust in other assets and intangible assets, net, and the corresponding liability in other liabilities on our consolidated balance sheets. The investments are considered trading securities and are reported at fair value based on quoted market prices. The deferred compensation plan assets and liabilities are measured and recorded at their fair value on recurring basis. The inputs are recognized as Level 1 inputs. The realized and unrealized gains and losses on these investments, as well as the offsetting
Table of Contents
CHUY’S HOLDINGS, INC.
Notes to Consolidated Financial Statements (Continued)
(Tabular dollar amounts in thousands, except share and per share data)
compensation expense, are recorded in general and administrative expense in the consolidated statements of income. At December 27, 2020, the Company had approximately $0.8 million of deferred compensation plan assets and $0.9 million of deferred plan liabilities. At December 29, 2019, the Company had approximately $0.4 million of both deferred compensation plan assets and liabilities.
In regards to the Company's impairment analysis, we generally estimate long-lived asset fair values, including property and equipment and leasehold improvements as well as operating lease assets and liabilities, using either depreciated replacement cost method, the cost and/market approach or the income approach.discounted cash flow projections. The inputs used to determine fair value relate primarily to the assumptions regarding the long-lived assets exit cost at their highest and best use and future assumptions regarding restaurant sales and profitability. These inputs are categorized as Level 3 inputs. The inputs used represent assumptions about what information market participants would use in pricing the assets and are based upon the best information available at the time of the analysis.
Loan Origination Costsorigination costs
Loan origination costs are capitalized and amortized over the term of the related debt and is included in Interest expense, net on the consolidated statements of income.
Revenue Recognitionrecognition
Revenue from restaurant operations (food, beverage and alcohol sales) and merchandise sales are recognized upon satisfaction of the single performance obligation which occurs upon payment by the customer at the time of sale. Revenues are reflected net of sales tax and certain discounts and allowances.
We offer our customers delivery at certain of our restaurants through third party delivery service's website or apps. We recognize this revenue when the control of the food is transferred to the delivery service, excluding any delivery fees charged to the customer. We receive payment subsequent to the transfer of food.
Proceeds from the sale of gift cards are recorded as deferred revenue at the time of sale and recognized as revenue upon redemption by the customer. Breakage is recognized on unredeemed gift cards based upon historical redemption patterns whenas revenue proportionate to the Company determines the likelihoodpattern of redemption of the gift card byredemptions less any legal obligation to remit the customer is remote.unredeemed gift cards to the relevant jurisdictions. We recorded $0.3$0.1 million, $0.1 million and $0.2 million of gift card breakage in the fiscal year 2017. Gift card breakage in previous periods presented was immaterial.years 2020, 2019 and 2018, respectively.
Marketing
The Company expenses the printing of menus and other promotional materials as incurred. The costs of community service and sponsorship activities are expensed on the expected timing of those events. Marketing expense was $2.8$2.7 million, $2.4$5.6 million, and $2.2$3.9 million for the years ended December 31, 2017,27, 2020, December 25, 201629, 2019 and December 27, 2015,30, 2018, respectively.
Restaurant Pre-opening Costspre-opening costs
Restaurant pre-opening costs consist primarily of manager salaries, relocation costs, supplies, recruiting expenses, travel and lodging, pre-opening activities, employee payroll and related training costs for employees at the new location. The Company expenses such pre-opening costs as incurred. Pre-opening costs also include rent recorded during the period between date of possession and the restaurant opening date.
Stock-Based CompensationStock-based compensation
The Company maintains an equity incentive plan under which it allows the Company's board of directors tocan grant stock options, restricted stock units, and other equity-based awards to directors, officers, and key employees of the Company. The plans provideplan provides for granting of options to purchase shares of common stock at an exercise price not less than the fair value of the stock on the date of grant. The Company recognizes stock-based compensation in accordance with the Financial Accounting Standards Board ("FASB") Accounting Standards Codification ("ASC") Topic 718 ("Topic 718"). Stock-based compensation cost includes compensation cost for all share-based payments granted based on the grant date fair value estimated in accordance with the provisions of Topic 718. Compensation cost is recognized on a straight-line basis net of estimated forfeitures, over the requisite service period of each award. The forfeitures are recognized when they occur.
Table of Contents
CHUY’S HOLDINGS, INC.
Notes to Consolidated Financial Statements (Continued)
(Tabular dollar amounts in thousands, except share and per share data)
Income Tax Matterstax matters
Income tax provisions are comprised of federal and state taxes currently due, plus deferred taxes. Deferred tax assets and liabilities are recognized for future tax consequences attributable to the temporary difference between the financial statement carrying amounts of existing assets and liabilities and their respective tax basis. Deferred tax assets and liabilities are measured using enacted tax rates expected to apply to taxable income in the years in which those temporary differences are expected to be recovered or settled. Deferred tax assets are recognized when management considers the realization of those assets in future periods to be more likely than not. Future taxable income, adjustments in temporary differences, available carryforward periods and changes in tax laws could affect these estimates.
Segment Reportingreporting
ASC Topic No. 280, "Segment Reporting," establishes standards for disclosures about products and services, geographic areas and major customers. The Company currently operates one1 reporting segment; full-service, casual dining, Mexican food restaurants. Additionally, we operate in one geographic area: the United States of America.
Revenue from customers is derived principally from food and beverage sales and the Company does not rely on any major customers as a source of revenue.
Recent Accounting Pronouncementsaccounting pronouncements
The Company's management reviewed all significant newly-issued accounting pronouncements and concluded that with the exception of the pronouncements below, they either are not applicable to the Company's operations or that no material effect is expected on the Company's consolidated financial statements as a result of future adoption.
Leases
In February 2016, the FASB issued Accounting Standards Update ("ASU") 2016-02, "Leases (Topic 842)." This update requires a lessee to recognize on the balance sheet the right-of-use assets and lease liabilities for leases with a lease term of more than twelve months. This update also requires additional disclosures about the amount, timing, and uncertainty of cash flows arising from leases. This ASU is effective for interim and annual periods beginning after December 15, 2018 and requires a modified retrospective approach to adoption for lessees existing at, or entered into after the beginning of the earliest comparative period presented in the financial statements, with certain practical expedients available.
We had operating leases with remaining rental payments of $404.7 million as of December 31, 2017. The discounted minimum remaining rental payments will be the starting point for determining the assets and liabilities for the rights and obligations created by those leases. While the Company is still evaluating the guidance and the impact on its consolidated financial statements, we expect the adoption of this standard will have a significant impact on the Company’s consolidated balance sheet as we will recognize the right-of-use assets and liabilities for current operating leases, but will likely have an insignificant impact on the consolidated statement of income or cash flows and overall liquidity. In preparation for the adoption of the guidance, the Company will implement controls and key systems changes to enable the preparation of financial information.
Revenue Recognition
In May 2014, the FASB issued ASU 2014-09, "Revenue with Contracts from Customers (Topic 606)." ASU 2014-09 supersedes the current revenue recognition guidance, including industry-specific guidance. The guidance introduces a five-step model to achieve its core principal of the entity recognizing revenue to depict the transfer of goods or services to customers at an amount that reflects the consideration to which the entity expects to be entitled in exchange for those goods or services. This ASU is effective for interim and annual periods beginning after December 15, 2017 and early adoption is permitted only for interim and annual periods beginning after December 15, 2016.
The Company's revenue is comprised of food and beverage sales. ASU 2014-09 will not have an impact on revenue recognition related to food and beverage sales. However, it requires gift card breakage to be recognized as revenue proportionate to the pattern of gift card redemptions. The Company records gift card breakage as a component of revenue.
We will adopt this guidance in the first quarter of 2018. The Company does not expect the adoption of this ASU to have a material impact on the Company’s consolidated financial statements.
Stock Compensation
In March 2016, the FASB issued ASU 2016-09, "Improvements to Employee Share-Based Payment Accounting (Topic 718)." This update simplifies several aspects of the accounting for share-based payment transactions, including income tax consequences, classification of awards as either equity or liabilities, and classification on the statement of cash flows. This ASU was effective for interim and annual periods beginning after December 15, 2016. The Company adopted ASU 2016-09 in the first quarter of 2017 and elected to apply this adoption prospectively. All excess tax benefits and deficiencies are recognized in the income tax
CHUY’S HOLDINGS, INC.
Notes to Consolidated Financial Statements (Continued)
(Tabular dollar amounts in thousands, except share and per share data)
expense line item on the Company's consolidated income statement, and are included within the changes in the income tax receivable line item on the consolidated statement of cash flows. The Company has elected to recognize forfeitures for awards with a requisite service period as they occur. The adoption of this ASU was immaterial to the Company's consolidated financial statements.
3. Net (Loss) Income Per Share
Basic net (loss) income per share of common stock was computed by dividing net (loss) income by the weighted-average number of shares of common stock outstanding for the period.
Diluted net (loss) income per share of common stock is computed on the basis of the weighted-average number of shares of common stock plus the effect of dilutive potential shares of common stock equivalents outstanding during the period using the treasury stock method for dilutive options and deferred sharesrestricted stock units (these shares were granted under the Chuy's Holdings, Inc. 2012 Omnibus Equity Incentive Plan (the "2012 Plan") and are referred to as "restricted stock units"the Chuy's Holdings, Inc. 2020 Omnibus Incentive Plan (the "2020 Plan")).
There were approximately 33,800, 1,00040,500, 25,800 and 26,0008,700 shares of common stock equivalents that have been excluded from the calculation of diluted net (loss) income per share because their inclusion would have been anti-dilutive for the years ended December 31, 2017,27, 2020, December 25, 201629, 2019 and December 27, 2015,30, 2018, respectively.
The computations of basic and diluted net (loss) income per share is as follows:
|
| | | | | | | | | | | |
| | Year Ended |
| | December 31, 2017 | | December 25, 2016 | | December 27, 2015 |
| BASIC | | | | | |
| Net income | $ | 28,956 |
| | $ | 17,244 |
| | $ | 12,896 |
|
| Weighted-average common shares outstanding | 16,894,986 |
| | 16,676,073 |
| | 16,470,278 |
|
| Basic net income per common share | $ | 1.71 |
| | $ | 1.03 |
| | $ | 0.78 |
|
| | | | | | |
| DILUTED | | | | | |
| Net income | $ | 28,956 |
| | $ | 17,244 |
| | $ | 12,896 |
|
| Weighted-average common shares outstanding | 16,894,986 |
| | 16,676,073 |
| | 16,470,278 |
|
| Dilutive effect of stock options | 108,247 |
| | 211,809 |
| | 269,109 |
|
| Weighted-average of diluted shares | 17,003,233 |
| | 16,887,882 |
| | 16,739,387 |
|
| Diluted net income per common share | $ | 1.70 |
| | $ | 1.02 |
| | $ | 0.77 |
|
4. Prepaid Expenses and Other Current Assets
The major classes of prepaid expenses and other current assets at December 31, 2017 and December 25, 2016 are summarized as follows: | | | | | | | | | | | | | | | | | |
| | Year Ended |
| | December 27, 2020 | | December 29, 2019 | | December 30, 2018 |
| BASIC | | | | | |
| Net (loss) income | $ | (3,294) | | | $ | 6,215 | | | $ | 5,539 | |
| | | | | |
| | | | | |
| | | | | |
| | | | | |
| Weighted-average common shares outstanding | 18,396,335 | | | 16,728,955 | | | 16,931,589 | |
| Basic net (loss) income per common share | $ | (0.18) | | | $ | 0.37 | | | $ | 0.33 | |
| | | | | |
| DILUTED | | | | | |
| Net (loss) income | $ | (3,294) | | | $ | 6,215 | | | $ | 5,539 | |
| | | | | |
| | | | | |
| | | | | |
| | | | | |
| Weighted-average common shares outstanding | 18,396,335 | | | 16,728,955 | | | 16,931,589 | |
| | | | | |
| Dilutive effect of stock options and restricted stock units | 0 | | | 95,440 | | | 130,758 | |
| Weighted-average of diluted shares | 18,396,335 | | | 16,824,395 | | | 17,062,347 | |
| Diluted net (loss) income per common share | $ | (0.18) | | | $ | 0.37 | | | $ | 0.32 | |
|
| | | | | | | |
| | December 31, 2017 | | December 25, 2016 |
| Deposits on equipment | $ | 948 |
| | $ | 1,143 |
|
| Prepaid expenses | 4,716 |
| | 3,694 |
|
| Other current assets | 260 |
| | 370 |
|
| Total prepaid expenses and other current assets | $ | 5,924 |
| | $ | 5,207 |
|
CHUY’S HOLDINGS, INC.
Notes to Consolidated Financial Statements (Continued)
(Tabular dollar amounts in thousands, except share and per share data)
4. Prepaid Expenses and Other Current Assets
The major classes of prepaid expenses and other current assets at December 27, 2020 and December 29, 2019 are summarized as follows:
| | | | | | | | | | | |
| | December 27, 2020 | | December 29, 2019 |
| Deposits on equipment | $ | 418 | | | $ | 782 | |
| Prepaid expenses | 2,950 | | | 2,394 | |
| Other current assets | 246 | | | 200 | |
| Total prepaid expenses and other current assets | $ | 3,614 | | | $ | 3,376 | |
5. Property and Equipment, Net
The major classes of property and equipment as of December 31, 201727, 2020 and December 25, 201629, 2019 are summarized as follows: | | | | | | | | | | | |
| December 27, 2020 | | December 29, 2019 |
| Leasehold improvements | $ | 196,345 | | | $ | 205,491 | |
| Furniture, fixtures and equipment | 97,149 | | | 98,895 | |
| Construction in progress | 14,613 | | | 13,072 | |
| Land | 1,898 | | | 1,898 | |
| 310,005 | | | 319,356 | |
| Less accumulated depreciation | (124,900) | | | (108,606) | |
| Total property and equipment, net | $ | 185,105 | | | $ | 210,750 | |
|
| | | | | | | |
| | December 31, 2017 | | December 25, 2016 |
| Leasehold improvements | $ | 174,767 |
| | $ | 143,494 |
|
| Furniture, fixtures and equipment | 85,043 |
| | 71,305 |
|
| Construction in progress | 13,684 |
| | 11,089 |
|
| | 273,494 |
| | 225,888 |
|
| Less accumulated depreciation | (76,239 | ) | | (60,738 | ) |
| Total property and equipment, net | $ | 197,255 |
| | $ | 165,150 |
|
Depreciation expense was $17.4 million, $15.0 million and $12.7 million for the years ended December 31, 2017, December 25, 2016, and December 27, 2015, respectively.
6. Other Assets and Intangible Assets, Net
The major classes of other assets and intangibles assets along with related accumulated amortization at December 31, 201727, 2020 and December 25, 201629, 2019 are summarized as follows:
| | | | | | | | | | | | | | | | | | | | | | | | | | | | | | | | | | | | | | |
| | Average Life at December 27, 2020 | 2020 | | 2019 |
| | Gross Amount | | Accumulated Amortization | | Net Amount | | Gross Amount | | Accumulated Amortization | | Net Amount |
| Finite-lived assets: | | | | | | | | | | | | |
| Loan origination costs | 1.3 | $ | 410 | | | $ | (320) | | | $ | 90 | | | $ | 294 | | | $ | (267) | | | $ | 27 | |
| | | | | | | | | | | | |
| Total finite-lived assets | | 410 | | | (320) | | | 90 | | | 294 | | | (267) | | | 27 | |
| Indefinite-lived assets: | | | | | | | | | | | | |
| Liquor license | | 214 | | | — | | | 214 | | | 214 | | | — | | | 214 | |
| Total indefinite-lived assets | | 214 | | | — | | | 214 | | | 214 | | | — | | | 214 | |
| | | | | | | | | | | | |
Other noncurrent assets (1) | | 774 | | | — | | | 774 | | | $ | 426 | | | — | | | 426 | |
| | | | | | | | | | | | |
| Total other assets and intangible assets | | $ | 1,398 | | | $ | (320) | | | $ | 1,078 | | | $ | 934 | | | $ | (267) | | | $ | 667 | |
|
| | | | | | | | | | | | | | | | | | | | | | | | |
| | Average Life at December 31, 2017 | 2017 | | 2016 |
| | Gross Amount | | Accumulated Amortization | | Net Amount | | Gross Amount | | Accumulated Amortization | | Net Amount |
| Finite-lived assets: | | | | | | | | | | | | |
| Loan origination costs | 2.9 | $ | 294 |
| | $ | (202 | ) | | $ | 92 |
| | $ | 294 |
| | $ | (169 | ) | | $ | 125 |
|
| Lease acquisition costs | 16.0 | 2,561 |
| | (571 | ) | | 1,990 |
| | 2,173 |
| | (453 | ) | | 1,720 |
|
| Total finite-lived assets | | 2,855 |
| | (773 | ) | | 2,082 |
| | 2,467 |
| | (622 | ) | | 1,845 |
|
| Indefinite-lived assets: | | | | | | | | | | | | |
| Liquor license | | 75 |
| | — |
| | 75 |
| | 75 |
| | — |
| | 75 |
|
| Total indefinite-lived assets | | 75 |
| | — |
| | 75 |
| | 75 |
| | — |
| | 75 |
|
| Total other assets and intangible assets | | $ | 2,930 |
| | $ | (773 | ) | | $ | 2,157 |
| | $ | 2,542 |
| | $ | (622 | ) | | $ | 1,920 |
|
Amortization expense was $0.2 million for the year ended December 31, 2017 and $0.1 million for both years ended December 25, 2016 and December 27, 2015.
The following table represents the total estimated amortization of finite-lived intangible assets for the five succeeding fiscal years and thereafter:
|
| | | |
| For the Fiscal Years Ending: | |
| 2018 | $ | 164 |
|
| 2019 | 174 |
|
| 2020 | 167 |
|
| 2021 | 140 |
|
| 2022 | 132 |
|
| Thereafter | 1,305 |
|
| | $ | 2,082 |
|
7. Long-Term Debt
Revolving Credit Facility
On November 30, 2012, the Company entered into a $25.0 million Revolving Credit Facility with Wells Fargo Bank, National Association. On October 30, 2015, weMay 21, 2020, the Company entered into anthe second amendment (the “Amendment”) to ourits Revolving Credit Facility (as amended, the "Revolving Credit Facility") to among other things, (1) extend the maturity date ofto April 30, 2022, (2) relax compliance with the Revolving Credit Facility to October 30, 2020 from November 30, 2017financial covenants during the COVID-19 pandemic through the new maturity date and (2)(3) revise the applicable margins and leverage ratios that determine the commitment fees and interest payable by the Company.
Table of Contents
CHUY’S HOLDINGS, INC.
Notes to Consolidated Financial Statements (Continued)
(Tabular dollar amounts in thousands, except share and per share data)
margins and leverage ratios that determine the commitment fees and interest rates payable by the Company under the Revolving Credit Facility. As of December 31, 2017 and December 25, 2016 the Company had no outstanding indebtedness under the Company's amended Revolving Credit Facility.
Under the Company'sour Revolving Credit Facility, the Companywe may request to increase the size of the Company'sour Revolving Credit Facility by up to $25.0 million, in minimum principal amounts of $5.0 million or the remaining amount of the $25.0 million if less than $5.0 million (the "Incremental Revolving Loan"), which Incremental Revolving Loan will be effective after 10 days written notice to the agent.. In the event that any of the lenders fund the Incremental Revolving Loan, the terms and provisions of the Incremental Revolving Loan will be the same as under the Company's Revolving Credit Facility.
Borrowings under the Revolving Credit Facility generally bear interest at a variable rate based upon the Company's election, of (i) the base rate (which is the highest of prime rate, federal funds rate plus 0.5% or one month LIBOR plus 1%), or (ii) LIBOR, plus, in either case, an applicable margin based on the Company's consolidated total lease adjusted leverage ratio (as defined in the Revolving Credit Facility agreement)Amendment) with a LIBOR floor of 1.0%. OurThe Revolving Credit Facility also requires payment for commitment fees that accrue on the daily unused commitment of the lender at the applicable margin, which varies based on ourthe Company's consolidated total lease adjusted leverage ratio.
The revolving line of creditRevolving Credit Facility also requires compliance with a fixed charge coverage ratio, a lease adjustedconsolidated total leverage ratio, growth capital expenditure limitation during fiscal years 2020 and certain non-financial covenants.2021 and a minimum monthly liquidity requirement of $5.0 million. The Revolving Credit Facility also placeshas certain restrictions on the payment of dividends and distributions. Under the Revolving Credit Facility, the Company may declare and make dividend payments so long as (i) no default or event of default has occurred and is continuing or would result therefrom and (ii) immediately after giving effect to any such dividend payment, on a pro forma basis, the lease adjusted leverage ratio does not exceed 3.50 to 1.00.
The obligations under the Company’sCompany's Revolving Credit Facility are secured by a first priority lien on substantially all of the Company’s assets.Company's asset. As of December 27, 2020, the Company had 0 borrowings under the Revolving Credit Facility, and we were in compliance with all covenants.
8. Accrued Liabilities
The major classes of accrued liabilities at December 31, 201727, 2020 and December 25, 201629, 2019 are summarized as follows:
| | | | | | | | | | | |
| | December 27, 2020 | | December 29, 2019 |
| Accrued compensation and related benefits | $ | 14,007 | | | $ | 9,342 | |
| Other accruals | 3,987 | | | 4,302 | |
| Property tax | 3,054 | | | 2,220 | |
| Deferred gift card revenue | 2,527 | | | 2,289 | |
| Sales and use tax | 2,200 | | | 2,954 | |
| | | |
| Total accrued liabilities | $ | 25,775 | | | $ | 21,107 | |
|
| | | | | | | |
| | December 31, 2017 | | December 25, 2016 |
| Accrued compensation and related benefits | $ | 5,964 |
| | $ | 7,572 |
|
| Other accruals | 4,037 |
| | 3,061 |
|
| Sales and use tax | 3,131 |
| | 2,200 |
|
| Deferred gift card revenue | 2,098 |
| | 2,074 |
|
| Property tax | 1,194 |
| | 1,191 |
|
| Accrued closure costs | 64 |
| | 1,659 |
|
| Total accrued liabilities | $ | 16,488 |
| | $ | 17,757 |
|
9. LeasesStockholders' Equity
ATM offering
During the second quarter of 2020, the Company issued 3,041,256 shares of its common stock and received net proceeds of $48.2 million after deducting sales agent commissions and offering expenses. A portion of the net proceeds was used to repay the $25.0 million outstanding under the Company Revolving Credit Facility. The Company leases land and buildingsintends to use the remaining net proceeds from the ATM offering for general corporate purposes, including, but not limited to, increasing its corporate office and allliquidity as a result of the COVID-19 pandemic.
Share repurchase program
On October 26, 2017, the Company's board of directors approved a share repurchase program under which it authorized the Company, at its discretion, to repurchase up to $30.0 million of its restaurantscommon stock through December 31, 2019. On October 31, 2019, the Company’s board of directors authorized a new share repurchase program under various long-term operating lease agreements. The initial lease terms range from 10 yearswhich the Company may, at its discretion, repurchase up to 15 yearsanother $30.0 million of its common shares outstanding. This repurchase program became effective on January 1, 2020, after the expiration of the previous share repurchase authorization, and currently expire between 2019 and 2039. The leases typically include renewal options for 10 to 15 years, which are exercisable atexpires on December 31, 2022. Repurchases of the Company's option. Someoutstanding common stock will be made in accordance with applicable laws and may be made at management's discretion from time to time in the open market, through privately negotiated transactions or otherwise, including pursuant to Rule 10b5-1 trading plans. There is no guarantee as to the exact number of the leases provide for base rent, plus additional rent based on gross sales, as defined in each lease agreement. The Company is also generally obligatedshares to pay certain real estate taxes, insurance and common area maintenance (“CAM”) charges, and various other expenses related to properties.
Rent expense is paid to various landlords including several companies owned and controlledbe repurchased by the Company’s foundersCompany. The timing and oneextent of its executive officers. In 2017, we also subleased additional office space from certain related parties to expand ourrepurchases will depend upon several factors, including market and business conditions, regulatory requirements and other corporate headquarters.considerations, and repurchases may be discontinued at any time.
Future minimum lease payments under noncancelable operating leases include renewal option periodsDuring the fiscal years ended 2020 and 2019, the Company repurchased approximately 90,144 and 351,774 shares of common stock for certain leases when such option periods are included for purposesa total cost of calculating straight line rents. At December 31, 2017, future minimum rentals for each$1.4 million and $7.8 million, respectively. As a result of COVID-19, the next five years and in total are as follows:company temporarily
Table of Contents
CHUY’S HOLDINGS, INC.
Notes to Consolidated Financial Statements (Continued)
(Tabular dollar amounts in thousands, except share and per share data)
suspended any further activity under the program during fiscal 2020 and did not repurchase any shares subsequent to the first quarter of 2020. As of December 27, 2020 the company had $28.6 million remaining to be purchased under the plan.
|
| | | | | | | | | | | |
| | Unrelated Parties | | Related Party | | Total |
| Fiscal year ending: | | | | | |
| 2018 | $ | 21,520 |
| | $ | 2,314 |
| | $ | 23,834 |
|
| 2019 | 22,845 |
| | 1,670 |
| | 24,515 |
|
| 2020 | 22,970 |
| | 1,401 |
| | 24,371 |
|
| 2021 | 23,314 |
| | 1,413 |
| | 24,727 |
|
| 2022 | 23,345 |
| | 393 |
| | 23,738 |
|
| Thereafter | 281,830 |
| | 1,676 |
| | 283,506 |
|
| Total minimum lease payments | $ | 395,824 |
| | $ | 8,867 |
| | $ | 404,691 |
|
The aboveCompany determines if a contract contains a lease at inception.The Company's material long-term operating lease agreements are for the land and buildings for our restaurants as well as our corporate offices. The lease term begins on the date that the Company takes possession under the lease, including the pre-opening period during the construction, when in many cases the Company is not making rent payments. The initial lease terms range from 10 years to 15 years, most of which include renewal options totaling 10 to 15 years. The lease term is generally the minimum of the noncancelable period or the lease term including renewal options which are reasonably certain of being exercised up to a term of approximately 20 years.
Operating lease assets and liabilities are recognized at the lease commencement date for material leases with a term of greater than 12 months. Operating lease liabilities represent the present value of future minimum rental amounts excludelease payments. Since our leases do not provide an implicit rate, our operating lease liabilities are calculated using the amortizationCompany's secured incremental borrowing rate at lease commencement. We estimate this rate based on prevailing financial market conditions, comparable companies, credit analysis and management judgment. Minimum lease payments include only fixed lease components of deferredthe agreement, as well as variable rate payments that depend on an index, initially measured using the index at the lease commencement date.
Operating lease assets represent our right to use an underlying asset and are based upon the operating lease liabilities adjusted for prepaid or accrued lease payments, initial direct costs and lease incentives. Lease incentives renewal options that are not reasonably assuredrecognized when construction milestones are met and reduce our operating lease asset. They are amortized through the operating lease assets as reductions of renewal, and contingent rent. The Company generally has escalating rentsrent expense over the term of the leases and records rentlease term.
Operating lease expense is recognized on a straight-line basis.
Rent expense, excludingbasis over the lease term. Variable lease payments that do not depend on a rate or index, escalation in the index subsequent to the initial measurement, payments associated with non-lease components such as common area maintenance, real estate taxes CAM charges,and insurance, and short-term lease payments (leases with a term with 12 months or less) are expensed as incurred. Certain of the Company’s operating leases contain clauses that provide for contingent rent based on a percentage of sales greater than certain specified target amounts. These variable payments are expensed when the achievement of the specified target that triggers the contingent rent is considered probable. As of December 27, 2020, all of the Company's leases were operating.
During the second quarter of 2020, the Company suspended lease payments for the months of April through June 2020 as a result of the COVID-19 pandemic. The Company was able to negotiate rent concessions, abatements and deferrals with landlords on a large portion of our operating leases. Financial Accounting Standards Board ("FASB") issued a clarification to accounting for lease concessions in response to the COVID-19 pandemic to reduce the operational challenges and complexity of lease accounting. The Company used the relief provisions provided by FASB and made an election to account for the lease concessions as if they were part of the original lease agreement. As a result of these negotiations, the Company recorded $2.9 million of deferred rent as part of our operating lease incentivesliability as of December 27, 2020. The recognition of rent concessions did not have a material impact on our consolidated financial statements.
Components of operating lease costs are included in occupancy, closed restaurant costs, restaurant pre-opening, general and administrative expense and property and equipment, net:
| | | | | | | | | | | |
| | Year Ended |
| Lease cost | | December 27, 2020 | December 29, 2019 |
Operating lease cost (a) | | $ | 26,419 | | $ | 25,478 | |
| Variable lease cost | | 515 | | 1,103 | |
| | $ | 26,934 | | $ | 26,581 | |
(a) Includes short-term operating lease costs which are immaterial.
Supplemental cash flow disclosures and other expenses related to operating leases for the years ended December 31, 2017, December 25, 2016 andlease information :
| | | | | | | | |
| Year Ended |
| December 27, 2020 | December 29, 2019 |
| Cash paid for operating lease liabilities | 23,021 | 25,781 | |
Operating lease assets obtained in exchange for operating lease liabilities (a) | 3,845 | 177,701 | |
(a) The year-ended December 27, 2015 consists of the following: |
| | | | | | | | | | | |
| | 2017 | | 2016 | | 2015 |
| Minimum rent—related parties | $ | 2,215 |
| | $ | 1,988 |
| | $ | 1,901 |
|
| Contingent rent—related parties | 621 |
| | 663 |
| | 646 |
|
| Total rent—related parties | 2,836 |
| | 2,651 |
| | 2,547 |
|
| Minimum rent—unrelated parties | 18,304 |
| | 15,419 |
| | 12,401 |
|
| Contingent rent—unrelated parties | 397 |
| | 312 |
| | 355 |
|
| Total rent—unrelated parties | 18,701 |
| | 15,731 |
| | 12,756 |
|
| Total minimum and contingent rent | $ | 21,537 |
| | $ | 18,382 |
| | $ | 15,303 |
|
10. Employee Benefit Plan
The Chuy’s Opco, Inc. 401(k) plan, (the “401(k) Plan”), is2020 includes a defined contribution plan covering all eligible employees. The 401(k) Plan provides for employee salary deferral contributions up$5.6 million reduction to the maximum amount allowable byoperating lease assets and liabilities mainly as a result of shortening the Internal Revenue Service,remaining life of certain leases as well as Company discretionary matching contributions. Company contributions relatinga $9.4 million increase due to the 401(k) Plan were approximately $292,000, $229,000 and $209,000 for the years ended December 31, 2017, December 25, 2016 and December 27, 2015, respectively.
11. Stock-Based Compensation
new lease commencements. The Company has outstanding awards under the 2006 Stock Option Plan (the “2006 Plan”). The outstanding options under the 2006 Plan are fully vested as of December 31, 2017. In connection with the Company's Initial Public Offering (the "IPO"), the Company terminated the 2006 Plan, and no further awards will be granted under the 2006 Plan. The termination of the 2006 Plan did not affect awards outstanding under the 2006 Plan at the time of its termination and the terms of the 2006 Plan continue to govern those outstanding awards.
In connection with the IPO, the Company adopted the Chuy's Holdings, Inc. 2012 Omnibus Equity Incentive Plan (the “2012 Plan”) which allows the Company’s board of directors to grant stock options, restricted stock, restricted stock units and other equity-based awards to directors, officers, and key employees of the Company. The 2012 Plan provides for granting of options to purchase shares of common stock at an exercise price not less than the fair value of the stock on the date of grant. The outstanding options under the 2012 Plan vest 20% on each of the first five anniversaries of the date of grant and have a maximum term of ten years. The outstanding restricted stock units vest ratably on each of the first four or five anniversaries of the date of grant. As of December 31, 2017, a total of 706,101 shares of common stock are reserved and remain available for issuance under the 2012 Plan.
Stock-based compensation cost recognized in the consolidated statements of income was $2.9 million, $2.2 million and $1.7 million for the years ended December 31, 2017, December 25, 2016 and December 27, 2015, respectively. Stock-based compensation recognized as capitalized development was approximately $218,000, $160,000 and $114,000 for the years ended December 31, 2017, December 25, 2016 and December 27, 2015, respectively. Capitalized stock-based compensation is included in Property and equipment, net on the consolidated balance sheets.
Table of Contents
CHUY’S HOLDINGS, INC.
Notes to Consolidated Financial Statements (Continued)
(Tabular dollar amounts in thousands, except share and per share data)
Stock Options
A summary of stock-based compensation activity and changes related to stock optionsyear-ended December 29, 2019 includes the transition adjustment for the adoption of Leases (Topic 842) of $170.3 million, new lease commencements of $11.7 million as well as a $4.3 million reduction to the operating lease assets and liabilities as a result of shortening the remaining life of certain leases.
The Company recorded $0.2 million and $0.9 million in deferred lease incentives during the fiscal year ended December 31, 201727, 2020 and December 29, 2019, respectively.
Supplemental balance sheet disclosures: | | | | | | | | | | | | | | | | | | | | |
| Operating leases | | Classification | | December 27, 2020 | | December 29, 2019 |
| Right-of-use assets | | Operating lease assets | | $ | 159,156 | | | $ | 169,299 | |
| | | | | | |
| Deferred Rent Payments | | Operating lease liability | | 2,169 | | | 0 | |
| Current lease liabilities | | Operating lease liability | | 12,397 | | | 10,307 | |
| | | | 14,566 | | | 10,307 | |
| | | | | | |
| Deferred Rent Payments | | Operating lease liability, less current portion | | 746 | | | 0 | |
| Non-current lease liabilities | | Operating lease liability, less current portion | | 206,855 | | | 214,541 | |
| | | | 207,601 | | | 214,541 | |
| | | | | | |
| Total lease liabilities | | | | $ | 222,167 | | | $ | 224,848 | |
| | | | | | |
| Weighted average remaining lease term (in years) | | 13.8 | | 15.0 |
| Weighted average discount rate | | 7.9 | % | | 7.8 | % |
Future minimum rent payments for our operating leases for each of the next five years as of December 27, 2020 are as follows: | | | | | |
| Fiscal years ending: | |
| 2021 | $ | 31,161 | |
| 2022 | 28,775 | |
| 2023 | 28,223 | |
| 2024 | 26,936 | |
| 2025 | 26,522 | |
| Thereafter | 220,521 | |
| Total minimum lease payments | 362,138 | |
| Less: imputed interest | 139,971 | |
| Present value of lease liabilities | $ | 222,167 | |
As of December 27, 2020, operating lease payments exclude approximately $2.1 million of legally binding minimum lease payments for leases signed but which we have not yet taken possession.
|
| | | | | | | | | | | | |
| | Shares | | Weighted Average Exercise Price | | Weighted Average Remaining Contractual Term (Years) | | Aggregate Intrinsic Value |
| Outstanding at December 25, 2016 | 316,027 |
| | $ | 18.64 |
| | | | |
| Granted | — |
| | — |
| | | | |
| Exercised | (35,170 | ) | | 9.67 |
| | | | |
| Forfeited | (6,747 | ) | | 28.91 |
| | | | |
| Outstanding at December 31, 2017 | 274,110 |
| | $ | 19.54 |
| | 4.16 | | $ | 2,429 |
|
| Exercisable as of December 31, 2017 | 248,745 |
| | $ | 18.59 |
| | 4.05 | | $ | 2,427 |
|
The aggregate intrinsic value inCompany has outstanding awards under the table above is obtainedChuy's Holdings, Inc. 2006 Stock Option Plan ("the "2006" Plan), the 2012 Plan and the 2020 Plan. On July 30, 2020, the Company’s stockholders approved the 2020 Plan, which replaced the 2012 Plan and no further awards may be granted under the 2012 Plan. The termination of the 2012 Plan did not affect outstanding awards granted under the 2012 Plan. The 2006 Plan was terminated by subtracting the weighted average exercise priceboard effective July 27, 2012, and no further awards may be granted under the plan after such date. The termination of the 2006 Plan did not affect outstanding awards granted under the 2006 Plan. Options granted under these plans vest over five years from the estimated fair valuedate of the underlying common stock asgrant and have a maximum term of ten years. As of December 31, 2017 and multiplying this result by27, 2020 the related numberCompany had 177,200 of stock options outstanding and exercisable atwith a remaining weighted average contractual term of two years.
Restricted stock units granted under the 2012 and 2020 Plan vest over four or five years from the date of grant. As of December 31, 2017. The estimated fair value27, 2020, a total of the1,113,780 shares of common stock aswere reserved and remained available for issuance under the 2020 Plan.
Table of December 31, 2017 usedContents
CHUY’S HOLDINGS, INC.
Notes to Consolidated Financial Statements (Continued)
(Tabular dollar amounts in thousands, except share and per share data)
Stock-based compensation cost recognized in the above calculationconsolidated statements of income was $28.05 per share, the closing price of the Company’s common stock on December 29, 2017, the last trading day of the year. The total intrinsic value of options exercised was $0.6approximately $3.7 million, $3.3 million and $9.1$3.1 million for the years ended December 31, 201727, 2020, December 29, 2019 and December 25, 2016,30, 2018, respectively. DuringStock-based compensation recognized as capitalized development was approximately $220,000, $215,000 and $201,000 for the years ended December 31, 2017,27, 2020, December 25, 201629, 2019 and December 27, 201530, 2018, respectively. Capitalized stock-based compensation is included in Property and equipment, net on the total fair value of options vested was $0.3 million, $0.5 million, and $0.6 million, respectively.
There was approximately $0.1 million of total unrecognized compensation costs related to options granted under the 2006 Plan and the 2012 Plan as of December 31, 2017. These costs will be recognized through the year 2019.
Restricted Stock Unitsconsolidated balance sheets.
A summary of stock-based compensation activity and changes related to restricted stock units for the year ended December 31, 201727, 2020 are as follows:
| | | | | | | | Shares | | Weighted
Average
Fair Value | | Weighted
Average
Remaining
Contractual
Term
(Years) |
| | Shares | | Weighted Average Fair Value | | Weighted Average Remaining Contractual Term (Years) | |
| Outstanding at December 25, 2016 | 206,750 |
| | $ | 31.57 |
| | | |
| Outstanding at December 29, 2019 | | Outstanding at December 29, 2019 | 406,205 | | | $ | 25.02 | | | |
| Granted | 129,751 |
| | 27.89 |
| | Granted | 285,389 | | | 14.81 | | |
| Vested | (67,167 | ) | | 32.13 |
| | Vested | (146,325) | | | 26.16 | | |
| Forfeited | (10,848 | ) | | 30.06 |
| | Forfeited | (26,729) | | | 18.38 | | |
| Outstanding at December 31, 2017 | 258,486 |
| | $ | 29.64 |
| | 2.63 | |
| Outstanding at December 27, 2020 | | Outstanding at December 27, 2020 | 518,540 | | | $ | 19.42 | | | 2.42 |
The fair value of the restricted stock units is the quoted market value of our common stock on the date of grant. As of December 31, 2017,27, 2020, total unrecognized stock-based compensation expense related to non-vested restricted stock units was approximately $5.3 million, which$7.1 million. This amount is expected to be recognized throughevenly over the year 2022.remaining vesting period of the grants.
12. Impairment, and ClosureClosed Restaurant And Other Costs
We recordedThe Company reviews long-lived assets, such as property and equipment and intangibles, subject to amortization, for impairment when events or circumstances indicate the carrying value of the assets may not be recoverable. In determining the recoverability of the asset value, an analysis is performed at the individual restaurant level and closure costsprimarily includes an assessment of $1.5 millionhistorical undiscounted cash flows and $4.4 millionother relevant factors and circumstances. The Company evaluates future cash flow projections in conjunction with qualitative factors and future operating plans and regularly reviews any restaurants with a deficient level of cash flows for the years ended December 25, 2016previous 24 months to determine if impairment testing is necessary. Recoverability of assets to be held and December 27, 2015, respectively, relatedused is measured by a comparison of the carrying value of the restaurant to long-livedits estimated future undiscounted cash flows. If the estimated undiscounted future cash flows are less than the carrying value, we determine if there is an impairment loss by comparing the carrying value of the restaurant to its estimated fair value. Based on this analysis, if the carrying value of the restaurant exceeds its estimated fair value, an impairment charge is recognized by the amount by which the carrying value exceeds the fair value.
We make assumptions to estimate future cash flows and asset impairmentsfair values. The estimated fair value is generally determined using the depreciated replacement cost method, the income approach, or costs associated withdiscounted cash flow projections. Estimated future cash flows are highly subjective assumptions based on the closureCompany’s projections and understanding of restaurants. There was noour business, historical operating results, and trends in sales and restaurant level operating costs.
The Company’s impairment or closure costs recognizedassessment process requires the use of estimates and assumptions regarding future cash flows and operating outcomes, which are based upon a significant degree of management judgment. The estimates used in the impairment analysis represent a Level 3 fair value measurement. The Company continues to assess the performance of restaurants and monitors the need for future impairment. Changes in the year ended December 31, 2017.economic environment, real estate markets, capital spending, overall operating performance and underlying assumptions could impact these estimates and result in future impairment charges.
Impairment and closure costs in 2016 included $1.5 million of closure costs associated with the closure and relocation of one restaurant.
Impairment and closure costs in 2015 included $4.4 million of impairment charges associated with three restaurants.
Table of Contents
CHUY’S HOLDINGS, INC.
Notes to Consolidated Financial Statements (Continued)
(Tabular dollar amounts in thousands, except share and per share data)
The Company recorded impairment, closed restaurant and other costs as follows: | | | | | | | | | | | | | | | | | |
| | Year Ended |
| | December 27, 2020 | | December 29, 2019 | | December 30, 2018 |
| Operating lease assets impairment | $ | 4,568 | | | $ | 480 | | | $ | 0 | |
| Property and equipment impairment | 16,282 | | | 12,212 | | | 12,336 | |
| Total impairment charge | 20,850 | | | 12,692 | | | 12,336 | |
| | | | | |
| Closed restaurant costs | 5,099 | | | 1,487 | | | 0 | |
| COVID-19 related charges | 845 | | | 0 | | | 0 | |
| Impairment, closed restaurant and other costs | $ | 26,794 | | | $ | 14,179 | | | $ | 12,336 | |
During the year ended December 27, 2020, the Company recorded a $20.9 million impairment charge as a result of restaurant closures, the discontinuation of the complimentary "Nacho Car" as well as the abandoned development costs mainly driven by the COVID-19 pandemic. The Company also recorded a $0.8 million COVID-19 related charge due to idle development costs as a result of delaying restaurant openings to 2021. During the years ended December 29, 2019 and December 30, 2018, the Company recorded asset impairment charges relating to closures of underperforming restaurants.
The Company also recorded $5.1 million and $1.5 million of closed restaurant costs, which include rent expense, utility and insurance costs during fiscal 2020 and 2019, respectively.
13. Gain on insurance settlements
During the third quarter of 2017, parts of Texas and Southeast were struck by Hurricanes Harvey and Irma. As a result of the hurricanes, the Company incurred operating losses as well as property damage. The property damage was mainly related to a restaurant in the Houston region which was closed through the middle of the fourth quarter of 2017 and required a complete reconstruction. Additionally, we incurred property damage from a fire that took place at one restaurant during the second quarter of 2017.
The Company recovered $2.3 million in insurance settlements, of which $1.0 million was received during the fourth quarter of 2017 and $1.3 million accrued in our accounts receivables at December 31, 2017. Approximately $0.5 million of insurance settlements was recognized as a reduction to certain direct expenses which were incurred as a result of the storms. The remainder was allocated to a replacement of damaged property and equipment resulting in a gain of $1.4 million recorded in the fourth quarter of 2017.
The Company's operating losses and property damages as well as related insurance settlements during the year ended December 31, 2017 were as follows:27, 2020, the Company received a one-time insurance settlement in the amount of $1.0 million under its trade name restoration insurance policy.
|
| | | |
| | December 31, 2017 |
| Insurance settlements | $ | (2,262 | ) |
| Costs and expenses | 460 |
|
| Assets disposed, net | 440 |
|
| Gain on insurance settlements | $ | (1,362 | ) |
14. Income Taxes
The provision for federal and state income taxes for the years ended December 31, 2017, December 25, 2016 and December 27, 2015 consisted of the following:
| | | | | | | | | | | | | | | | | |
| Year Ended |
| December 27, 2020 | | December 29, 2019 | | December 30, 2018 |
| Current: | | | | | |
| Federal | $ | (712) | | | $ | 1,151 | | | $ | 435 | |
| State | 410 | | | 1,042 | | | 1,048 | |
| Total current income tax (benefit) expense | (302) | | | 2,193 | | | 1,483 | |
| Deferred: | | | | | |
| Federal | (4,552) | | | (4,676) | | | (3,643) | |
| State | (653) | | | (418) | | | (194) | |
| Total deferred income tax benefit | (5,205) | | | (5,094) | | | (3,837) | |
| Total income tax benefit | $ | (5,507) | | | $ | (2,901) | | | $ | (2,354) | |
|
| | | | | | | | | | | |
| | 2017 | | 2016 | | 2015 |
| Current: | | | | | |
| Federal | $ | 972 |
| | $ | 2,933 |
| | $ | 1,724 |
|
| State | 859 |
| | 613 |
| | 945 |
|
| Total current income tax expense | 1,831 |
| | 3,546 |
| | 2,669 |
|
| Deferred: | | | | | |
| Federal | (7,761 | ) | | 2,827 |
| | 2,903 |
|
| State | 430 |
| | 661 |
| | 171 |
|
| Total deferred income tax (benefit) expense | (7,331 | ) | | 3,488 |
| | 3,074 |
|
| Total income tax (benefit) expense | $ | (5,500 | ) | | $ | 7,034 |
| | $ | 5,743 |
|
Table of Contents
In December 2017, the U.S. government enacted H.R.1, commonly referredCHUY’S HOLDINGS, INC.
Notes to as the Tax CutsConsolidated Financial Statements (Continued)
(Tabular dollar amounts in thousands, except share and Jobs Act ("Tax Act"). The Tax Act impacts the Company in many ways, most notably by a reduction in the federal statutory tax rate from 35% to 21% effective January 1, 2018. As a result of this change, we were required to revalue our deferred tax balances at the 21% rate, resulting in a non-recurring deferred tax balance adjustment with a corresponding decrease to the provision for income taxes of $11.7 million in the fourth quarter of 2017. The company recognized the income tax effects of the Tax Act in accordance with Staff Accounting Bulletin No. 118 ("SAB 118"), which provides guidance relating to the application of ASC Topic 740, Income Taxes, in the reporting period in which the Tax Act was signed into law. As such, the company’s financial results reflect the income tax effects of the Tax Act for which the accounting under ASC Topic 740 is complete and provisional amounts for those specific income tax effects of the Tax Act for which the accounting under ASC Topic 740 is incomplete but a reasonable estimate could be determined. The company did not identify items for which the income tax effects of the Tax Act have not been completed and no significant provisional estimates were made as of December 31, 2017.per share data)
Temporary differences between tax and financial reporting basis of assets and liabilities which give rise to the deferred income tax assets (liabilities) and their related tax effects as of December 31, 2017 and December 25, 2016 are as follows:
Table of Contents | | | | | | | | | | | |
| Year Ended |
| December 27, 2020 | | December 29, 2019 |
| Deferred tax assets: | | | |
| Accrued liabilities | $ | 464 | | | $ | 517 | |
| General business tax credits | 23,331 | | | 17,923 | |
| Operating lease liabilities | 50,714 | | | 52,773 | |
| Stock-based compensation | 861 | | | 969 | |
| Other | 326 | | | 230 | |
| Total deferred tax assets | 75,696 | | | 72,412 | |
| Deferred tax liability: | | | |
| Intangibles | (8,805) | | | (8,219) | |
| Prepaid expenses | (1,265) | | | (1,330) | |
| Property and equipment | (21,007) | | | (20,526) | |
| Operating lease assets | (36,813) | | | (39,736) | |
| Total deferred tax liabilities | (67,890) | | | (69,811) | |
| Deferred tax assets, net | $ | 7,806 | | | $ | 2,601 | |
CHUY’S HOLDINGS, INC.
Notes to Consolidated Financial Statements (Continued)
(Tabular dollar amounts in thousands, except share and per share data)
|
| | | | | | | |
| | 2017 | | 2016 |
| Deferred tax assets: | | | |
| Accrued liabilities | $ | 12,819 |
| | $ | 17,236 |
|
| General business tax credits | 13,653 |
| | 12,653 |
|
| Stock-based compensation | 1,024 |
| | 1,222 |
|
| Other | 238 |
| | 403 |
|
| Total deferred tax assets | 27,734 |
| | 31,514 |
|
| Deferred tax liability: | | | |
| Intangibles | (7,394 | ) | | (10,609 | ) |
| Prepaid expenses | (1,339 | ) | | (1,673 | ) |
| Property and equipment | (25,439 | ) | | (33,001 | ) |
| Total deferred tax liabilities | (34,172 | ) | | (45,283 | ) |
| Deferred tax liabilities, net | $ | (6,438 | ) | | $ | (13,769 | ) |
December 31, 2017 deferredDeferred tax balances were measured using a 21% federal statutory rate as a result of the Tax Act as compared to 35% in previous years.
We had approximately $9.2 million of tax benefits ($3.3 million net of tax) related to excess stock compensation which was recorded to additional paid-in-capital during the fiscal year ended December 25, 2016. Under the "tax law ordering" method, as described in ASC 740, this amount was also used as tax deductions and reduced taxable income for fiscal year ended December 25, 2016.rate. As of December 31, 2017,27, 2020, the Company has general business tax credits of $13.7$23.3 million expiring in 2035.2036 through 2041.
Deferred tax assets are reduced by a valuation allowance if, based on the weight of the available evidence, it is more likely than not that some or all of the deferred taxes will not be realized. Both positive and negative evidence is considered in forming management’s judgment as to whether a valuation allowance is appropriate, and more weight is given to evidence that can be objectively verified. The tax benefits relating to any reversal of the valuation allowance on the deferred tax assets would be recognized as a reduction of future income tax expense. The Company believes that it will realize all of the deferred tax assets. Therefore, no valuation allowance has been recorded.
On March 27, 2020, the Coronavirus Aid, Relief and Economic Security Act (“CARES Act”) temporarily restored the ability to carryback net operating losses (“NOL”) originating in 2018, 2019 and 2020 to offset taxable income in the five preceding years and eliminated the 80% taxable income limitation on such net operating loss deductions if utilized before 2021. Additionally, the CARES Act included an administrative correction of the depreciation recovery period for qualified improvement property ("QIP"), including certain restaurant leasehold improvement costs, that resulted in the acceleration of depreciation on these assets retroactive to 2018. The Company filed for a refund of overpaid taxes with regards to credits carried back to those years.
The following is a reconciliation of the expected federal income taxes at the statutory raterates of 35%21% for the fiscal yearsyear ended December 31, 2017,27, 2020, December 25, 2016,29, 2019 and December 27, 201530, 2018 to the actual provision for income taxes:
| | | | | | | | | | | | | | | | | |
| Year Ended |
| | December 27, 2020 | | December 29, 2019 | | December 30, 2018 |
| Expected income tax (benefit) expense | $ | (1,848) | | | $ | 696 | | | $ | 669 | |
| State tax expense, net of federal benefit | (192) | | | 493 | | | 675 | |
| FICA tip credit | (2,539) | | | (3,896) | | | (3,411) | |
Deferred tax balance adjustment (a) | (1,079) | | | 0 | | | 173 | |
| Stock compensation | 344 | | | (34) | | | 60 | |
| Other | (193) | | | (160) | | | (520) | |
| Income tax benefit | $ | (5,507) | | | $ | (2,901) | | | $ | (2,354) | |
(a) Deferred tax balance adjustment recorded during fiscal 2020 is associated with a carryback of federal NOLs due to the CARES Act administrative correction of the deprecation recovery period for QIP.
The Internal Revenue Service ("IRS") audited our tax return for the fiscal year 2016. In August 2020, the IRS issued a Notice of Proposed Adjustment to the Company asserting that the tenant allowances paid under our operating leases should be recorded
Table of Contents
CHUY’S HOLDINGS, INC.
Notes to Consolidated Financial Statements (Continued)
(Tabular dollar amounts in thousands, except share and per share data)
|
| | | | | | | | | | | |
| | 2017 | | 2016 | | 2015 |
| Expected income tax expense | $ | 8,210 |
| | $ | 8,497 |
| | $ | 6,524 |
|
| State tax expense, net of federal benefit | 838 |
| | 829 |
| | 725 |
|
| FICA tip credit | (2,250 | ) | | (1,936 | ) | | (1,924 | ) |
| Deferred tax balance adjustment | (11,696 | ) | | — |
| | — |
|
| Other | (602 | ) | | (356 | ) | | 418 |
|
| Income tax (benefit) expense | $ | (5,500 | ) | | $ | 7,034 |
| | $ | 5,743 |
|
as taxable income for years 2016 and prior. The Company disagrees with this position based on the underlying facts and circumstances as well as standard industry practice. The Company estimates if the IRS's position was upheld, the Company's tax liability could range between $0.5 million and $2.5 million. Federal tax standards require that a position taken or expected to be taken in a tax return be recognized in the financial statements when it is more likely than not (i.e. a likelihood of more than 50%) that the position would be sustained upon examination by tax authorities. A recognized taxIn accordance with the standards, the Company believes that it is more likely than not that the Company's position is measured atwill ultimately be sustained upon further examination, including the largest amountresolution of benefit that is greater than 50% likely of being realized upon settlement. The standards also require that changes in judgment that result in subsequent recognition, derecognitionthe IRS's appeal or change in a measurement of a tax position taken in a prior annual period (including any related interest and penalties) be recognized as a discrete item in the interim period in which the change occurs.litigation processes, if any. As of December 31, 201727, 2020 and December 25, 201629, 2019 the Company recognized no liability for uncertain tax positions.
It is the Company’s policy to include any penalties and interest related to income taxes in its income tax provision. However, the Company currently has no penalties or interest related to income taxes.
The tax years 2019, 2018 and 2017 remain open for IRS audit. The Company has received no notice of audit or any notifications from the IRS for any of the open tax years. 15. Commitments and Contingencies
The Company is involved in various claims and legal actions arising in the normalordinary course of business. In the opinion of management, the ultimate disposition of these matters will not have a material adverse effect on the Company’sour condensed consolidated financial position, results of operations, or cash flows.
16. Related Party Transactions
The Company leases its corporate office and six restaurant locations from entities owned by its founders and one of its executive officers. See Note 9 Leases.
In addition, the Company entered into a management agreement in November 2006 with Three Star Management, Ltd. (an entity owned by its founders) to provide management services, such as administrative, accounting and human resources support, to Three Star Management’s restaurants. In connection with this agreement, the Company received management fees of $40,000 for fiscal years 2017, 2016 and 2015.
17. Quarterly Financial Data (Unaudited)
The following tables set forth certain unaudited consolidated financial information for each of the four quarters in fiscal years 2017 and 2016:
|
| | | | | | | | | | | | | | | |
| | 2017 |
| | March 26 | | June 25 | | September 24 | | December 31 |
| Revenue | $ | 86,904 |
| | $ | 94,472 |
| | $ | 92,193 |
| | $ | 96,020 |
|
Income from operations (1) | 6,461 |
| | 7,358 |
| | 4,187 |
| | 5,515 |
|
Net income(1)(2) | 4,550 |
| | 5,329 |
| | 3,195 |
| | 15,882 |
|
| Basic net income per share | $ | 0.27 |
| | $ | 0.32 |
| | $ | 0.19 |
| | $ | 0.94 |
|
| Diluted net income per share | $ | 0.27 |
| | $ | 0.31 |
| | $ | 0.19 |
| | $ | 0.93 |
|
| | 2016 |
| | March 27 | | June 26 | | September 25 | | December 25 |
| Revenue | $ | 78,054 |
| | $ | 87,909 |
| | $ | 85,597 |
| | $ | 79,053 |
|
Income from operations (3) | 6,489 |
| | 8,330 |
| | 6,740 |
| | 2,782 |
|
Net income(3) | 4,532 |
| | 5,780 |
| | 4,599 |
| | 2,333 |
|
| Basic net income per share | $ | 0.27 |
| | $ | 0.35 |
| | $ | 0.27 |
| | $ | 0.14 |
|
| Diluted net income per share | $ | 0.27 |
| | $ | 0.34 |
| | $ | 0.27 |
| | $ | 0.14 |
|
| |
(1) | Contains a gain from the insurance settlements that increased income from operations by $1.4 million and net income by $1.0 million in the fourth quarter of 2017. |
| |
(2) | Contains a deferred tax balance adjustment that increased net income by $11.7 million in the fourth quarter of 2017. |
| |
(3) | Contains closure costs that decreased income from operations by $0.4 million and $1.1 million and net income by $0.3 million and $1.0 million related to one restaurant in the third and fourth quarter of 2016, respectively.
|
18. Subsequent Events
Subsequent to December 31, 2017, the Company opened one new restaurant on March 13, 2018, for a total of 92 restaurants in 19 states.