UNITED STATES
SECURITIES AND EXCHANGE COMMISSION
Washington, D.C. 20549
FORM 10-K
ANNUAL REPORT PURSUANT TO SECTION 13 or 15(d) OF THE SECURITIES EXCHANGE ACT OF 1934
For the fiscal year ended December 31, 20162017
OR
TRANSITION REPORT PURSUANT TO SECTION 13 OR 15(d) OF THE SECURITIES EXCHANGE ACT OF 1934
Commission file number 001-35713
WHEELER REAL ESTATE INVESTMENT TRUST, INC.
(Exact Name of Registrant as Specified in Its Charter)
|
| | |
| Maryland | | 45-2681082 |
(State or Other Jurisdiction of Incorporation or Organization) | | (I.R.S. Employer Identification No.) |
| | |
2529 Virginia Beach Blvd., Suite 200 Virginia Beach. Virginia | | 23452 |
| (Address of Principal Executive Offices) | | (Zip Code) |
(757) 627-9088
(Registrant’s Telephone Number, Including Area Code)
Securities registered pursuant to Section 12(b) of the Act:
Common Stock, $0.01 par value (NASDAQ Capital Market)
Series B convertible Preferred Stock, no par value (NASDAQ Capital Market)
Series D cumulative convertible Preferred Stock, no par value (NASDAQ Capital Market)
Warrants to acquire shares of Common Stock (NASDAQ Capital Market)
Securities registered pursuant to Section 12(g) of the Act:
None
Indicate by check mark if the registrant is a well-known seasoned issuer, as defined in Rule 405 of the Securities Act. Yes ¨ No þ
Indicate by check mark if the registrant is not required to file reports pursuant to Section 13 or Section 15(d) of the Act. Yes ¨ No þ
Indicate by check mark whether the registrant (1) has filed all reports required to be filed by Section 13 or 15(d) of the Securities Exchange Act of 1934 during the preceding 12 months (or for such shorter period that the registrant was required to file such reports), and (2) has been subject to such filing requirements for the past 90 days. Yes þ No ¨
Indicate by check mark whether the registrant has submitted electronically and posted on its corporate Web site, if any, every Interactive Data File required to be submitted and posted pursuant to Rule 405 of Regulation S-T during the preceding 12 months (or for such shorter period that the registrant was required to submit and post such files). Yes þ No ¨
Indicate by check mark if disclosure of delinquent filers pursuant to Item 405 of Regulation S-K is not contained herein, and will not be contained, to the best of registrant’s knowledge, in definitive proxy or information statements incorporated by reference in Part III of this Form 10-K or any amendment to this Form 10-K. ¨
Indicate by check mark whether the registrant is a large accelerated filer, an accelerated filer, a non-accelerated filer, or a smaller reporting company, or an emerging growth company. See the definitions of “large accelerated filer”, “accelerated filer” and, “smaller reporting company”
, and "emerging growth company" in Rule 12b-2 of the Exchange Act.:
|
| | | | | |
| Large accelerated file | | ¨ | þ | | Accelerated filer |
| | | | |
| Non-accelerated filer | | ¨ (Do not check if a smaller reporting company) | ¨ | | Smaller reporting company |
| | | | | |
| | | ¨
| | Emerging growth company |
If an emerging growth company indicate by check mark if the registrant has elected not to use the extended transition period for complying with any new or revised financial accounting standards provided pursuant to Section 13(a) of the Exchange Act. ¨
Indicate by check mark whether the registrant is a shell company (as defined in Rule 12b-2 of the Exchange Act). ¨
As of June 30, 20162017, the aggregate market value of the registrant’s Common Stock held by non-affiliates of the registrant was $102,575,002.$86,033,901.
As of February 27, 2017,March 5, 2018, there were 68,172,2658,946,399 shares of Common Stock, $0.01 par value per share, outstanding.
Table of Contents
|
| | | |
| |
| | | | |
| Item 1. | | | |
| | | | |
| Item 1A. | | | |
| | | | |
| Item 1B. | | | |
| | | | |
| Item 2. | | | |
| | | | |
| Item 3. | | | |
| | | | |
| Item 4. | | | |
| | |
| |
| | | | |
| Item 5. | | | |
| | | | |
| Item 6. | | | |
| | | | |
| Item 7. | | | |
| | | | |
| Item 7A. | | | |
| | | | |
| Item 8. | | | |
| | | | |
| Item 9. | | | |
| | | | |
| Item 9A. | | | |
| | | | |
| Item 9B. | | | |
| | |
| |
| | | | |
| Item 10. | | | |
| | | | |
| Item 11. | | | |
| | | | |
| Item 12. | | | |
| | | | |
| Item 13. | | | |
| | | | |
| Item 14. | | | |
| | | | |
| Item 15. | | | |
| | |
| |
FORWARD- LOOKING STATEMENTS
This Annual Report on Form 10-K ("Form 10-K") of Wheeler Real Estate Investment Trust, Inc. (the "Company" or "our Company") contains forward-looking statements, including discussion and analysis of our financial condition, anticipated capital expenditures required to complete projects, amounts of anticipated cash distributions to our shareholders in the future and other matters. These forward-looking statements are not historical facts but are the intent, belief or current expectations of our management based on its knowledge and understanding of our business and industry. Forward-looking statements are typically identified by the use of terms such as “may,” “will,” “should,” “potential,” “predicts,” “anticipates,” “expects,” “intends,” “plans,” “believes,” “seeks,” “estimates,” or the negative of such terms and variations of these words and similar expressions. These statements are not guarantees of future performance and are subject to risks, uncertainties and other factors, some of which are beyond our control, are difficult to predict and could cause actual results to differ materially from those expressed or forecasted in the forward-looking statements.
Forward-looking statements that were true at the time made may ultimately prove to be incorrect or false. You are cautioned to not place undue reliance on forward-looking statements, which reflect our management’s view only as of the date of this Form 10-K. We undertake no obligation to update or revise forward-looking statements to reflect changed assumptions, the occurrence of unanticipated events or changes to future operating results. Factors that could cause actual results to differ materially from any forward-looking statements made in this Form 10-K include:
our business and investment strategy;
our projected operating results;
actions and initiatives of the U.S. government and changes to U.S. government policies and the execution and impact of these actions, initiatives and policies;
the state of the U.S. economy generally and in specific geographic areas;
economic trends and economic recoveries;
our ability to obtain and maintain financing arrangements;
financing and advance rates for our target assets;
our expected leverage;
availability of investment opportunities in real estate-related investments;
changes in the values of our assets;
our ability to make distributions to our stockholders in the future;
our expected investments and investment decisions;
changes in interest rates and the market value of our target assets;
our ability to renew leases at amounts and terms comparable to existing lease arrangements;
our ability to proceed with potential development opportunities for us and third-parties;
effects of hedging instruments on our target assets;
the degree to which our hedging strategies may or may not protect us from interest rate volatility;
impact of and changes in governmental regulations, tax law and rates, accounting guidance and similar matters;
our ability to maintain our qualification as a real estate investment trust (“REIT”);
our ability to maintain our exemption from registration under the Investment Company Act of 1940, as amended (the "Investment Company Act");
availability of qualified personnel and management team;
the ability of our operating partnership, Wheeler REIT, L.P. (the "Operating Partnership") and each of our other partnerships and limited liability companies to be classified as partnerships or disregarded entities for federal income tax purposes;
our ability to amend our charter to increase or decrease the aggregate number of authorized shares of stock, to authorize us to issue additional authorized but unissued shares of our preferred stock, without par value ("Preferred Stock") and to classify or reclassify unissued shares of our Preferred Stock;
our understanding of our competition;
market trends in our industry, interest rates, real estate values or the general economy;
the imposition of federal taxes if we fail to qualify as a real estate investment trust (“REIT”) in any taxable year or forego an opportunity to ensure REIT status;
uncertainties related to the national economy, the real estate industry in general and in our specific markets;
legislative or regulatory changes, including changes to laws governing REITs;
adverse economic or real estate developments in Virginia, Florida, Georgia, Alabama, South Carolina, North Carolina, Oklahoma, Kentucky, Tennessee, West Virginia, New Jersey and Pennsylvania;
increases in interest rates and operating costs;
inability to obtain necessary outside financing;
litigation risks;
lease-up risks;
inability to obtain new tenants upon the expiration of existing leases;
inability to generate sufficient cash flows due to market conditions, competition, uninsured losses, changes in tax or other applicable laws; and
the need to fund tenant improvements or other capital expenditures out of operating cash flow.
These forward-looking statements should be read in light of these factors.
Part I
Item 1. Business.
Overview
Wheeler Real Estate Investment Trust, Inc. is a fully-integrated, self-managed commercial real estate investment company focused on acquiring and managing income-producing retail properties with a primary focus on grocery-anchored centers. Our strategy is to opportunistically acquire and reinvigoratemanage well-located, potentially dominant retail properties in secondary and tertiary markets that generate attractive risk-adjusted returns, with a particular emphasis on grocery-anchored retail centers. We target competitively protected properties in communities that have stable demographics and have historically exhibited favorable trends, such as strong population and income growth. We generally lease our properties to national and regional retailers that offer consumer goods and generate regular consumer traffic. We believe our tenants carry goods that are less impacted by fluctuations in the broader U.S. economy and consumers’ disposable income, generating more predictable property level cash flows.
As of December 31, 2016,2017, we own a portfolio consisting of seventy-fourseventy-three properties, including fifty-nine retail shopping centers and five freestanding retail properties totaling 4,906,511 gross4,902,381 total leasable square feet of which approximately 94%93% are leased (our "operating portfolio"), one office property, eightseven undeveloped land parcels totaling approximately 7069 acres and 1 redevelopment project. We believe the current market environment creates a substantial number of favorable investment opportunities in our target markets with attractive yields on investment and significant upside potential in terms of income and gain.
We have 5553 full-time employees. Our management team has experience and capabilities across the real estate sector with experience in the aggregate and expertise particularly in the retail asset class, which we believe provides for flexibility in pursuing attractive acquisition, development and repositioning opportunities. Because varying market conditions create opportunities at different times across the retail property sector, we believe our expertise enables us to target relatively more attractive investment opportunities throughout economic cycles. In addition, our fully integrated platform with in-house development capabilities allows us to pursue development and redevelopment projects with multiple uses. We believe that our ability to pursue these types of opportunities differentiates us from many competitors in our markets.
Our executive officers and the members of the management team have extensive experience in all aspects of the commercial real estate industry, specifically in our target/existing markets. Jon S. Wheeler, our prior Chairman and Chief Executive Officer, has over thirty-five years of experience in the real estate sector with particular experience in strategic financial and, market analyses and assessments of new or existing properties to maximize returns. Mr. Wheeler has overseen the acquisition of over ninety-three properties. Wilkes J. Graham became ourprior Chief Financial Officer (the "CFO"), Wilkes Graham were replaced with David Kelly as Chief Executive Officer (the "CEO") in January 2016. Prior to joining us, Mr. Graham spent 16 years2018 and Matthew Reddy as CFO in the real estate financial services industry. Since 2010 Mr. Graham worked with Compass Point Research & Trading, LLC (“Compass Point”), an independent, full-service investment firm focused exclusively on the financial services sector, where he served as Director of Research and as a Senior Sell-Side Equity Research Analyst.February 2018. David Kelly, our CEO previously served as the Chief Investment Officer (the "CIO"). He has over twenty-sixtwenty-seven years of experience in the real estate industry. Prior to joining us, he served for thirteen years as the Director of Real Estate for Supevalu, Inc., a Fortune 100 supermarket retailer. While at Supervalu, he focused on site selection and acquisitions from New England to the Carolinas, completing transactions totaling over $500 million. Matthew Reddy our CFO is a certified public accountant and has been with the Company since June 2015 as Chief Accounting Officer. Prior to joining Wheeler, Mr. Reddy was the Assistant Vice President of Online Products at Liberty Tax Service. While employed at Liberty, Mr. Reddy was also employed as Director of Finance from 2011 to 2014, and Manager of Financial Reporting from 2008 to 2011. Prior to joining Liberty, Mr. Reddy worked at KPMG LLP as a Senior Auditor. Andrew Franklin is our Senior Vice President of Operations and has over seventeeneighteen years of commercial real estate experience. Mr. Franklin is responsible for overseeing the property management, lease
administration and leasing divisions of
our growing portfolio of commercial assets. Prior to joining us, Mr. Franklin was a partner with Broad Reach Retail Partners where he ran the day to day operations of the company, managing the leasing team as well as overseeing the asset, property and construction management of the portfolio with assets totaling $50 Million. Mr. Franklin is a graduate of the University of Maryland, with a Bachelor of Science degree in Finance.
Business Objectives and Investment Strategy
Our primary business objective is to provide attractive risk adjusted returns to our shareholders by increasing cash flows at our existing properties and acquiring additional properties with attractive yields below replacement cost. We intend to achieve this objective utilizing the following investment strategy:
Focus on necessity-based retail. We intend to invest in retail properties that serve the essential day-to-day shopping needs of the surrounding communities. These necessity-based centers attract high levels of daily traffic resulting in cross-selling of goods and services from our tenants. The majority of our tenants provide non-cyclical consumer goods and services that are less impacted by fluctuations in the economy. According to the Food Marketing Institute,Statista, the average consumer in the US makes a trip to a grocery store 1.61.5 times per week. We believe targeting centers that provide essential goods and services such as groceries results in a stable, lower-risk portfolio of retail investment properties.
Target secondary and tertiary markets with strong demographics and demand. We believe these markets have limited competition from institutional buyers and relatively low levels of new construction. In evaluating potential acquisitions, we focus on areas with strong demographics such as population density, population growth, tenant sales trends and growth in household income, and we seek to identify properties in locations where there is a need for necessity-based retail and limited new supply. We generally will seek to avoid markets where we believe potential yields have decreased as a result of acquisition activity from institutional buyers.
Acquire properties that are the number one or number two centers in their respective markets. After we identify an attractive target market, we look to acquire the top center in that market. These centers will have anchor tenants with dominant market share, high sales per square feet, significant capital invested in their respective stores and limited proximity to competing centers.
Increase operating income through leasing strategies and expense management. We employ intensive lease management strategies to optimize occupancy. Management has strong expertise in acquiring and managing under-performing properties and increasing operating income through more effective leasing strategies and expense management such as common area maintenance ("CAM"), or CAM reimbursement and experience utilizing exterior parking for build to suit outparcels or pad sales. Our leases generally require the tenant to reimburse us for a substantial portion of the expenses incurred in operating, maintaining, repairing, and managing the shopping center and the common areas, along with the associated insurance costs and real estate taxes. Operating expenses that qualify for CAM reimbursement include, but are not limited to, landscaping, parking field maintenance and repairs, building maintenance and repairs, utilities and their associated maintenance and repair within the shopping center. The amount that each tenant pays is determined on a pro-rata basis as defined in our lease and our leases generally allow us to add an administrative fee of 15%. Some leases are structured such that there isthey include a price per square foot cap on paying CAM and additional fees and charges. Additionally, in some cases the tenant is either fully or partially responsible for all maintenance of the property, thereby limiting our obligationsfinancial exposure towards maintaining the center and increasing our net income. We refer to this arrangement as a “triple net lease.”
Selectively utilize our capital to improve retail properties. We intend to make capital investments where the return on such capital is accretive to our shareholders. We have significant expertise allocating capital to value-added improvements of retail properties to increase rents, extend long-term leases with anchor tenants and increasing occupancy. We will selectively allocate capital to revenue enhancing projects that we believe will improve the market position of a given property.
Selectively utilize our development capabilities for third parties. We intend to invest capital in development and re-development opportunities where we believe the return on such capital is accretive to our shareholders. We believe our experience in development will benefit us by providing opportunities to either develop properties for us at higher cap rates that result in positive returns to our operations or to develop for third parties which will result in development fee income for us. While this objective is not always possible, we generally want a development project to be at least 50%
pre-leased prior to commencement.
Acquire properties that meet our strict underwriting guidelines and process. Initially, our underwriting process begins with a cursory review of the asset to determine if there is a fit with our acquisition criteria. The offering
memorandum; seller’s financials; lease abstracts (anchor and small shop); rent roll; delinquency reports; assumable debt, if any; tenant sales reports; and the general physical structure of the asset are reviewed. By analyzing the trade area we can determine trade area demographics, how the target asset sits within the trade area compared to its competition and how that trade area is currently being serviced by the existing retail base. Provided the cursory review of the target asset is satisfactory we begin the primary underwriting. The acquisition analyst develops an eleven year cash flow analysis using Argus software utilizing lease abstracts, rent roll, financials provided by seller, and historical data from our own portfolio. Lease administration reviews the third-party abstracts of all leases giving particular attention to use restrictions/conflicts, lease termination rights, relocation rights and accuracy against the provided rent roll. Tenant interviews are done with all key tenants per a multi-point checklist. The property is reviewed internally by leasing, asset management and property management departments. Third party reports are generated for environmental, zoning, appraisal and property condition assessment. Legal reviews newly produced survey and title binder. Discussions are held with the local municipality, particularly economic development, zoning and planning to determine potential competitive activity, changes in traffic patterns and possible real estate tax exposure. Lastly, an on-site review of the asset by representatives of the Investment Committee of the Board of Directors Mr. Wheeler, and Mr. Kelly, our Chief Investment Officer,CEO, is required before the due diligence portion of any contract closes. In all, a checklist of over 100 items is reviewed and signed off prior to moving into the closing phase of the contract.
Policies With Respect to Certain Activities
The following is a discussion of certain of our investment, financing and other policies. These policies have been determined by our Board of Directors and, in general, may be amended or revised from time to time by our Board of Directors without a vote of our stockholders.
Investment Policies
Investments in Real Estate or Interests in Real Estate
We will conduct all of our investment activities through our Operating Partnership and its subsidiaries. Our investment objectives are to maximize the cash flow of our properties, acquire properties with cash flow growth potential, provide monthly cash distributions and achieve long-term capital appreciation for our stockholders through increases in the value of our company. Consistent with our policy to acquire assets for both income and capital gain, our Operating Partnership intends to hold its properties for investment with a view to long-term appreciation, to engage in the business of acquiring, developing and owning its properties and to make occasional sales of the properties as are consistent with our investment objectives. We have not established a specific policy regarding the relative priority of these investment objectives.
We expect to pursue our investment objectives primarily through the ownership by our Operating Partnership of our portfolio of properties and other acquired properties and assets. We currently intend to invest primarily in retail properties. Future investment or development activities will not be limited to any geographic area, property type or to a specified percentage of our assets. While we may diversify in terms of property locations, size and market, we do not have any limit on the amount or percentage of our assets that may be invested in any one property or any one geographic area. We intend to engage in such future investment activities in a manner that is consistent with the maintenance of our status as a REIT for U.S. federal income tax purposes. In addition, we may purchase or lease income-producing properties for long-term investment, expand and improve the properties we presently own or other acquired properties, or sell such properties, in whole or in part, when circumstances warrant.
We may also participate with third parties in property ownership, through joint ventures or other types of co-ownership. We also may acquire real estate or interests in real estate in exchange for the issuance of Common Stock, units, Preferred Stock or options to purchase stock. These types of investments may permit us to own interests in larger assets without unduly restricting our diversification and, therefore, provide us with flexibility in structuring our portfolio. We will not, however, enter into a joint venture or other partnership arrangement to make an investment that would not otherwise meet our investment policies.
Equity investments in acquired properties may be subject to existing mortgage financing and other indebtedness or to new indebtedness which may be incurred in connection with acquiring or refinancing these properties. Debt service on such financing or indebtedness will have a priority over any dividends with respect to our Common Stock. Investments are also
subject to our policy not to fall within the definition of an “investment company” under the Investment Company Act of 1940, as amended (the “1940 Act”).
Investments in Real Estate Mortgages
We do not intend presently or at any time in the future to invest in real estate mortgages.
Securities of or Interests in Persons Primarily Engaged in Real Estate Activities and Other Issuers
Although not presently contemplated, subject to the percentage of ownership limitations and the income and asset tests necessary for REIT qualification, we may in the future invest in securities of other REITs, other entities engaged in real estate activities or securities of other issuers where such investment would be consistent with our investment objectives. We may invest in the debt or equity securities of such entities, including for the purpose of exercising control over such entities. We have no current plans to invest in entities that are not engaged in real estate activities. While we may attempt to diversify our investments with respect to the retail properties owned by such entities, in terms of property locations, size and market, we do not have any limit on the amount or percentage of our assets that may be invested in any one entity, property or geographic area. Our investment objectives are to maximize cash flow of our investments, acquire investments with growth potential and provide cash distributions and long-term capital appreciation to our stockholders through increases in the value of our company. We have not established a specific policy regarding the relative priority of these investment objectives. We will not underwrite the securities of any other issuers and will limit our investment in such securities so that we will not fall within the definition of an “investment company” under the 1940 Act.
Investments in Other Securities
Other than as described above, we do not currently intend to invest in any additional securities such as bonds, Preferred Stock or Common Stock, although we reserve the right to do so if our Board of Directors determines that such action would be in our best interests.
Dispositions
In 2016,2017, we disposed of the Starbucks/Verizon property. Further, theground leases for Ruby Tuesday/Tuesday’s and Outback Steakhouse ground leases at Pierpont Centre, are currently listed for sale.the 2.14 acre land parcel at Carolina Place and the Steak n' Shake, 1.06 acre outparcel at Rivergate. The sales of the Steak n' Shake outparcel at Rivergate and the land parcel at Carolina Place do not represent a strategic shift that has a major effect on the Company's financial position or results of operations. The sale of the Ruby Tuesday's and intended sale of theseOutback Steakhouse free-standing properties reflects the execution of our strategy of acquiring multi-tenant properties, monetizing core-assets and using proceeds to re-invest in our specialized markets. We may dispose of additional properties based upon management’s periodic review of our portfolio, and the determination by our Board of Directors that such activity would be in our best interest. The tax consequences to our directors and executive officers that hold common units resulting from a proposed disposition of a property may influence their decision as to the desirability of such proposed disposition.
Financings and Leverage Policy
In the future, we anticipate using a number of different sources to finance our acquisitions and operations, including cash flows from operations, asset sales, seller financing, issuance of debt securities, private financings (such as additional bank credit facilities, which may or may not be secured by our assets), property-level mortgage debt, common or preferred equity issuances or any combination of these sources, to the extent available to us, or other sources that may become available from time to time. Any debt that we incur may be recourse or non-recourse and may be secured or unsecured. We also may take advantage of joint venture or other partnering opportunities as such opportunities arise in order to acquire properties that would otherwise be unavailable to us. We may use the proceeds of our borrowings to acquire assets, to refinance existing debt or for general corporate purposes.
Although we are not required by our governing documents to maintain a ratio of debt to total market capitalization at any particular level, our Board of Directors will review our ratio of debt to total capital on a quarterly basis, with the goal of
maintaining a reasonable rate consistent with our expected ratio of debt to total market capitalization going forward. Additionally, we intend, when appropriate, to employ prudent amounts of leverage and to use debt as a means of providing additional funds for the acquisition of assets, to refinance existing debt or for general corporate purposes. We expect to use leverage conservatively, assessing the appropriateness of new equity or debt capital based on market conditions, including prudent assumptions regarding future cash flow, the creditworthiness of tenants and future rental rates. Our charter and bylaws
do not limit the amount of debt that we may incur. Our Board of Directors has not adopted a policy limiting the total amount of debt that we may incur.
Our Board of Directors will consider a number of factors in evaluating the amount of debt that we may incur. If we adopt a debt policy, our Board of Directors may from time to time modify such policy in light of then-current economic conditions, relative costs of debt and equity capital, market values of our properties, general conditions in the market for debt and equity securities, fluctuations in the market price of our Common Stock, growth and acquisition opportunities and other factors. Our decision to use leverage in the future to finance our assets will be at our discretion and will not be subject to the approval of our stockholders, and we are not restricted by our governing documents or otherwise in the amount of leverage that we may use.
Lending Policies
In 2016, we loaned $11.0 million to a related party for the partial funding of the Sea Turtle Development project in Hilton Head, South Carolina and $1.0 million note receivable in consideration for the sale of a land parcel owned by the Company. The Company has recognized a $5.26 million non-cash impairment charge on the note receivable as of December 31, 2017. We do not have a policy limiting our ability to make loans to other persons. We may consider offering purchase money financing in connection with the sale of properties where the provision of that financing will increase the value to be received by us for the property sold. We also may make loans to joint ventures in which we participate. However, we do not intend to engage in significant lending activities. Any loan we make will be consistent with maintaining our status as a REIT.
Equity Capital Policies
To the extent that our Board of Directors approve additional capital raises, we may issue debt or equity securities, including additional units or senior securities of our Operating Partnership, retain earnings (subject to provisions in the Internal Revenue Code of 1986, as amended (the "Code") requiring distributions of income to maintain REIT qualification) or pursue a combination of these methods. As long as our Operating Partnership is in existence, we will generally contribute the proceeds of all equity capital raised by us to our Operating Partnership in exchange for additional interests in our Operating Partnership, which will dilute the ownership interests of the limited partners in our Operating Partnership.
Existing stockholders will have no preemptive rights to Common or Preferred Stock or units issued in any securities offering by us, and any such offering might cause a dilution of a stockholder’s investment in us. Although we have no current plans to do so, we may in the future issue shares of Common Stock or units in connection with acquisitions of property.
We may, under certain circumstances, purchase shares of our Common Stock or other securities in the open market or in private transactions with our stockholders, provided that those purchases are approved by our Board of Directors. Our BoardAny repurchase of Directors has no present intention of causing us to repurchase any shares of our Common Stock or other securities, and any such action would only be taken in conformity with applicable federal and state laws and the applicable requirements for qualification as a REIT.
Change in Investment and Financing Objectives and Policies
Our investment policies and objectives and the methods of implementing our investment objectives and policies, except to the extent set forth in our charter, may be altered by our Board of Directors, without the approval of our stockholders. If we change these policies, we will disclose these changes prior to the effective time of these changes. If we change these policies after the offering, we will inform our stockholders of the change within ten days after our Board of Directors alters our investment objectives and policies, by either a press release or notice of an “other event” on a Current Report on Form 8-K or another method deemed reasonable by our Board of Directors.
Conflict of Interest Policies
Overview. Conflicts of interest could arise in the future as a result of the relationships between us and our affiliates, on the one hand, and our Operating Partnership or any partner thereof, on the other. Our directors and officers have duties to our company under applicable Maryland law in connection with their management of our company. At the same time, we, as the general partner of our Operating Partnership, have fiduciary duties and obligations to our Operating Partnership and its other partners under Virginia law and the partnership agreement of our Operating Partnership (the "Partnership Agreement") in
connection with the management of our Operating Partnership. Our fiduciary duties and obligations, as the general partner of our Operating Partnership, may come into conflict with the duties of our directors and officers to our company.
Under Virginia law (where our Operating Partnership is formed), a general partner of a Virginia limited partnership has fiduciary duties of loyalty and care to the partnership and its partners and must discharge its duties and exercise its rights as general partner under the Partnership Agreement or Virginia law consistently with the obligation of good faith and fair dealing. The duty of loyalty requires a general partner of a Virginia general partnership to account to the partnership and hold as trustee for it any property, profit, or benefit derived by the general partner in the conduct of the partnership business or derived from a use by the general partner of partnership property, including the appropriation of a partnership opportunity, to refrain from dealing with the partnership in the conduct of the partnership’s business as or on behalf of a party having an interest adverse to the partnership and to refrain from competing with the partnership in the conduct of the partnership business, although the Partnership Agreement may identify specific types or categories of activities that do not violate the duty of loyalty. The Partnership Agreement provides that, in the event of a conflict between the interests of our Operating Partnership or any partner, on the one hand, and the separate interests of our company or our stockholders, on the other hand, we, in our capacity as the general partner of our Operating Partnership, are under no obligation not to give priority to the separate interests of our company or our stockholders, and that any action or failure to act on our part or on the part of our directors that gives priority to the separate interests of our company or our stockholders that does not result in a violation of the contract rights of the limited partners of the Operating Partnership under its Partnership Agreement does not violate the duty of loyalty that we, in our capacity as the general partner of our Operating Partnership, owe to the Operating Partnership and its partners. The duty of care requires a general partner to refrain from engaging in grossly negligent or reckless conduct, intentional misconduct or a knowing violation of law, and this duty may not be unreasonably reduced by the Partnership Agreement.
The Partnership Agreement provides that we are not liable to our Operating Partnership or any partner for monetary damages for losses sustained, liabilities incurred or benefits not derived by our Operating Partnership or any limited partner, except for liability for our intentional harm or gross negligence. The Partnership Agreement also provides that any obligation or liability in our capacity as the general partner of our Operating Partnership that may arise at any time under the Partnership Agreement or any other instrument, transaction or undertaking contemplated by the Partnership Agreement will be satisfied, if at all, out of our assets or the assets of our Operating Partnership only, and no obligation or liability of the general partner will be personally binding upon any of our directors, stockholders, officers, employees or agents, regardless of whether such obligation or liability is in the nature of contract, tort or otherwise, and none of our directors or officers will be liable or accountable in damages or otherwise to the partnership, any partner or any assignee of a partner for losses sustained, liabilities incurred or benefits not derived as a result of errors in judgment or mistakes of fact or law or any act or omission. Our Operating Partnership must indemnify us, our directors and officers, officers of our Operating Partnership and any other person designated by us against any and all losses, claims, damages, liabilities (whether joint or several), expenses (including, without limitation, attorneys’ fees and other legal fees and expenses), judgments, fines, settlements and other amounts arising from any and all claims, demands, actions, suits or proceedings, whether civil, criminal, administrative or investigative, that relate to the operations of the Operating Partnership, unless (1) an act or omission of the person was material to the matter giving rise to the action and either was committed in bad faith or was the result of active and deliberate dishonesty, (2) for any transaction for which such person actually received an improper personal benefit in violation or breach of any provision of the Partnership Agreement, or (3) in the case of a criminal proceeding, the person had reasonable cause to believe the act or omission was unlawful.
Our Operating Partnership must also pay or reimburse the reasonable expenses of any such person upon its receipt of a written affirmation of the person’s good faith belief that the standard of conduct necessary for indemnification has been met and a written undertaking to repay any amounts paid or advanced if it is ultimately determined that the person did not meet the standard of conduct for indemnification. Our Operating Partnership will not indemnify or advance funds to any person with respect to any action initiated by the person seeking indemnification without our approval (except for any proceeding brought to enforce such person’s right to indemnification under the Partnership Agreement) or if the person is found to be liable to our Operating Partnership on any portion of any claim in the action.
No reported decision of a Virginia appellate court has interpreted provisions similar to the provisions of the Partnership Agreement of our Operating Partnership that modify or reduce the fiduciary duties and obligations of a general partner or reduce or eliminate our liability for money damages to the Operating Partnership and its partners, and we have not obtained an opinion of counsel as to the enforceability of the provisions set forth in the Partnership Agreement that purport to modify or reduce our fiduciary duties that would be in effect were it not for the Partnership Agreement.
Sale or Refinancing of Properties. Upon the sale of certain of the properties to be owned by us, certain unitholders could incur adverse tax consequences which are different from the tax consequences to us and to holders of our Common Stock. Consequently, unitholders may have differing objectives regarding the appropriate pricing and timing of any such sale or repayment of indebtedness.
While we will have the exclusive authority under the Partnership Agreement to determine whether, when, and on what terms to sell a property or when to refinance or repay indebtedness, any such decision would require the approval of our Board of Directors.
Policies Applicable to All Directors and Officers. Our charter and bylaws do not restrict any of our directors, officers, stockholders or affiliates from having a pecuniary interest in an investment or transaction that we have an interest in or from conducting, for their own account, business activities of the type we conduct. We intend, however, to adopt policies that are designed to eliminate or minimize potential conflicts of interest, including a policy for the review, approval or ratification of any related party transactions. This policy will provide that the audit committee of our Board of Directors will review the relevant facts and circumstances of each related party transaction, including if the transaction is on terms comparable to those that could be obtained in arm’s length dealings with an unrelated third party before approving such transaction. We have adopted a code of business conduct and ethics, which provides that all of our directors, officers and employees are prohibited from taking for themselves opportunities that are discovered through the use of corporate property, information or position without our consent. However, we cannot assure you that these policies or provisions of law will always be successful in eliminating the influence of such conflicts, and if they are not successful, decisions could be made that might fail to reflect fully the interests of all stockholders.
Interested Director and Officer Transactions
Pursuant to the Maryland General Corporation Law (“MGCL”), a contract or other transaction between us and a director or between us and any other corporation or other entity in which any of our directors is a director or has a material financial interest is not void or voidable solely on the grounds of such common directorship or interest, the presence of such director at the meeting at which the contract or transaction is authorized, approved or ratified or the counting of the director’s vote in favor thereof, provided that:
the fact of the common directorship or interest is disclosed or known to our Board of Directors or a committee of our board, and our board or such committee authorizes, approves or ratifies the transaction or contract by the affirmative vote of a majority of disinterested directors, even if the disinterested directors constitute less than a quorum;
the fact of the common directorship or interest is disclosed or known to our stockholders entitled to vote thereon, and the transaction or contract is authorized, approved or ratified by a majority of the votes cast by the stockholders entitled to vote other than the votes of shares owned of record or beneficially by the interested director or corporation, firm or other entity; or
the transaction or contract is fair and reasonable to us at the time it is authorized, ratified or approved.
Furthermore, under Virginia law, we, as general partner, have a fiduciary duty of loyalty to our Operating Partnership and its partners and, consequently, such transactions also are subject to the duties that we, as general partner, owe to the Operating Partnership and its limited partners (as such duty has been modified by the Partnership Agreement). We have adopted a policy that requires that all contracts and transactions between us, our Operating Partnership or any of our subsidiaries, on the one hand, and any of our directors or executive officers or any entity in which such director or executive officer is a director or has a material financial interest, on the other hand, must be approved by the affirmative vote of a majority of our disinterested directors even if less than a quorum. Where appropriate, in the judgment of the disinterested directors, our Board of Directors may obtain a fairness opinion or engage independent counsel to represent the interests of non-affiliated security holders, although our Board of Directors will have no obligation to do so.
Policies With Respect To Other Activities
We have authority to offer Common Stock, Preferred Stock or options to purchase stock in exchange for property and to repurchase or otherwise acquire our Common Stock or other securities in the open market or otherwise, and we may engage in such activities in the future. We expect, but are not obligated, to issue Common Stock to holders of common units upon exercise of their redemption rights. Our Board of Directors has the authority, without further stockholder approval, to amend our charter to increase or decrease the number of authorized shares of Common Stock or Preferred Stock and authorize us to
issue additional shares of Common Stock or Preferred Stock, in one or more series, including senior securities, in any manner, and on the terms and for the consideration, it deems appropriate. We have not engaged in trading, underwriting or agency distribution or sale of securities of other issuers other than our Operating Partnership and do not intend to do so. At all times, we intend to make investments in such a manner as to qualify as a REIT, unless because of circumstances or changes in the Code, or the Treasury regulations, our Board of Directors determines that it is no longer in our best interest to qualify as a REIT. In addition, we intend to make investments in such a way that we will not be treated as an investment company under the 1940 Act.
Reporting Policies
We make available to our stockholders our annual reports, including our audited consolidated financial statements. We are subject to the information reporting requirements of the Exchange Act. Pursuant to those requirements, we will be required to file annual and periodic reports, proxy statements and other information, including audited consolidated financial statements, with the SEC.
Item 1A. Risk Factors.
Set forth below are the risk factors that we believe are material to our investors. You should carefully consider the following risks in evaluating our Company and our business. The occurrence of any of the following risks could materially and adversely affect our business, prospects, financial condition, results of operations and our ability to make cash distributions to our stockholders, which could cause you to lose all or a part of your investment. Some statements in this report, including statements in the following risk factors, constitute forward-looking statement. Please refer to the section entitled "Forward-Looking Statements.”
Risks Related to Our Business and Operations
Construction and development projects are subject to risks that materially increase the costs of completion.
In the event that we decide to develop and construct new properties or redevelop existing properties, we will be subject to risks and uncertainties associated with construction and development. These risks include, but are not limited to, risks related to obtaining all necessary zoning, land-use, building occupancy and other governmental permits and authorizations, risks related to the environmental concerns of government entities or community groups, risks related to changes in economic and market conditions between development commencement and stabilization, risks related to construction labor disruptions, adverse weather, acts of God or shortages of materials which could cause construction delays and risks related to increases in the cost of labor and materials which could cause construction costs to be greater than projected and adversely impact the amount of our development fees or our results of operations or financial condition.
Our portfolio of properties is dependent upon regional and local economic conditions and is geographically concentrated in the Northeast, Mid-Atlantic, Southeast and Southwest, which may cause us to be more susceptible to adverse developments in those markets than if we owned a more geographically diverse portfolio.
Our properties are located in Alabama, Virginia, North Carolina, Florida, Georgia, South Carolina, West Virginia, Kentucky, Oklahoma, Tennessee, New Jersey and Pennsylvania, which exposes us to greater economic risks than if we owned a more geographically diverse portfolio. If there is a downturn in the economy in our markets, our operations and our revenue and cash available for distribution, including cash available to pay distributions to our stockholders, could be materially adversely affected. We cannot assure you that our markets will grow or that underlying real estate fundamentals will be favorable to owners and operators of retail properties. Our operations may also be affected if competing properties are built in our markets. Moreover, submarkets within any of our markets may be dependent upon a limited number of industries. Any adverse economic or real estate developments in the Mid-Atlantic, Northeast, Southeast or Southwest markets, or any decrease in demand for retail space resulting from the regulatory environment, business climate or energy or fiscal problems, could
adversely impact our financial condition, results of operations, cash flow, our ability to satisfy our debt service obligations and our ability to pay distributions to our stockholders.
As of December 31, 2016,2017, we had approximately $315.0$313.78 million of indebtedness outstanding, which may expose us to the risk of default under our debt obligations.
As of December 31, 2016,2017, our total indebtedness was approximately $315.0$313.78 million, a substantial portion of which is guaranteed by our Operating Partnership, and we may incur additional debt to finance future acquisition and development activities. Payments of principal and interest on borrowings may leave us with insufficient cash resources to operate our properties or to pay the dividends currently contemplated or necessary to maintain our REIT qualification. Our level of debt and the limitations imposed on us by our debt agreements could have significant adverse consequences, including the following:
|
| | | |
| | l | | our cash flow may be insufficient to meet our required principal and interest payments; |
|
| | | |
| | l | | we may be unable to borrow additional funds as needed or on favorable terms, which could, among other things, adversely affect our ability to meet operational needs; |
|
| | | |
| | l | | we may be unable to refinance our indebtedness at maturity or the refinancing terms may be less favorable than the terms of our original indebtedness; |
|
| | | |
| | l | | we may be forced to dispose of one or more of our properties, possibly on unfavorable terms or in violation of certain covenants to which we may be subject; |
|
| | | |
| | l | | we may violate financial covenants in our loan documents, which would entitle the lenders to accelerate our debt obligations; and |
|
| | | |
| | l | | our default under any loan with cross default provisions could result in a default on other indebtedness. |
If any one of these events were to occur, our financial condition, results of operations, cash flow and per share trading price of our securities could be adversely affected. Furthermore, foreclosures could create taxable income without accompanying cash proceeds, which could hinder our ability to meet the REIT distribution requirements imposed by the Code.
Failure to reduce our revolving line of credit with KeyBank may cause a default under its terms.
As of December 31, 2017, we had approximately $68.03 million of indebtedness outstanding on our $75.00 million KeyBank Line of Credit, which we are required to pay down to $52.50 million prior to July 1, 2018. If we are unable to refinance properties off the line of credit in order to return the total commitment to $52.50 million, we may use funds from our operations to pay down the indebtedness on the line of credit. A pay down from funds from our operations may leave us with insufficient cash resources to operate our properties or to pay the dividends currently contemplated or necessary to maintain our REIT qualification. This could have significant adverse consequences, including the following: our cash flow may be insufficient to make required principal and interest payments on our indebtedness; we may be unable to borrow additional funds as needed or on favorable terms, which could, among other things, adversely affect our ability to meet operational needs; we
may be unable to refinance our indebtedness at maturity or the refinancing terms may be less favorable than the terms of our original indebtedness; and we may be forced to dispose of one or more of our properties, possibly on unfavorable terms or in violation of certain covenants to which we may be subject. If any one of these events were to occur, our financial condition, results of operations, cash flows and the trading price of our securities could be adversely affected. In addition, we may not have sufficient funds from operations to pay down the line of credit, which may cause a default under its terms, resulting in a foreclosure of properties that secure the line of credit. Furthermore, foreclosures could create taxable income without accompanying cash proceeds, which could hinder our ability to meet the REIT distribution requirements imposed by the Code.
The majority of our properties are retail shopping centers and depend on anchor stores or major tenants to attract shoppers and could be adversely affected by the loss of, or a store closure by, one or more of these tenants.
Large, regionally or nationally recognized tenants typically anchor our properties. At any time, our tenants may experience a downturn in their business that may significantly weaken their financial condition. As a result, our tenants, including our anchor and other major tenants, may fail to comply with their contractual obligations to us, seek concessions in order to continue operations or declare bankruptcy, any of which could result in the termination of such tenants’ leases and the loss of rental income attributable to the terminated leases. In addition, certain of our tenants may cease operations while continuing to pay rent, which could decrease customer traffic, thereby decreasing sales for our other tenants at the applicable retail property. In addition to these potential effects of a business downturn, mergers or consolidations among large retail establishments could result in the closure of existing stores or duplicate or geographically overlapping store locations, which could include stores at our retail properties.
Loss of, or a store closure by, an anchor or major tenant could significantly reduce our occupancy level or the rent we receive from our retail properties, and we may not have the right to re-lease vacated space or we may be unable to re-lease vacated space at attractive rents or at all. Moreover, in the event of default by a major tenant or anchor store, we may experience delays and costs in enforcing our rights as landlord to recover amounts due to us under the terms of our agreements with those parties. The occurrence of any of the situations described above, particularly if it involves an anchor tenant with leases in multiple locations, could seriously harm our performance and could adversely affect the value of the applicable retail property.
Some of the leases at our retail properties contain “co-tenancy” or “go-dark” provisions, which, if triggered, may allow tenants to pay reduced rent, cease operations or terminate their leases, any of which could adversely affect our performance or the value of the applicable retail property.
Some of the leases at our retail properties contain “co-tenancy” provisions that condition a tenant’s obligation to remain open, the amount of rent payable by the tenant or the tenant’s obligation to continue occupancy on certain conditions, including: (1) the presence of a certain anchor tenant or tenants; (2) the continued operation of an anchor tenant’s store; and (3) minimum occupancy levels at the applicable retail property. If a co-tenancy provision is triggered by a failure of any of these or other applicable conditions, a tenant could have the right to cease operations, to terminate its lease early or to a reduction of its rent. In periods of prolonged economic decline, there is a higher than normal risk that co-tenancy provisions will be triggered as there is a higher risk of tenants closing stores or terminating leases during these periods. In addition to these co-tenancy provisions, certain of the leases at our retail properties contain “go-dark” provisions that allow the tenant to cease operations while continuing to pay rent. This could result in decreased customer traffic at the applicable retail property, thereby decreasing sales for our other tenants at that property, which may result in our other tenants being unable to pay their minimum rents or expense recovery charges. These provisions also may result in lower rental revenue generated under the applicable leases. To the extent co-tenancy or go-dark provisions in our retail leases result in lower revenue or tenant sales or tenants’ rights to terminate their leases early or to a reduction of their rent, our performance or the value of the applicable retail property could be adversely affected.
We may be unable to renew leases, lease vacant space or re-let space as leases expire, thereby increasing or prolonging vacancies, which could adversely affect our financial condition, results of operations, cash flow and per share trading price of our Common Stock.
As of December 31, 2016,2017, leases representing approximately 7.17%9.39% of the square footage and approximately 9.07%9.99% of the annualized base rent of the properties in our portfolio will expire during the twelve months ending December 31, 2017,2018, and an additional 6.01%8.07% of the square footage of the properties in our portfolio was available. We cannot assure you that leases will be renewed or that our properties will be re-let at net effective rental rates equal to or above the current average net effective rental rates or that substantial rent abatements, tenant improvements, early termination rights or below-market renewal options will not be offered to attract new tenants or retain existing tenants. If the rental rates for our properties decrease, our existing tenants do not renew their leases or we do not re-let a significant portion of our available space and space for which leases will expire, our financial condition, results of operations, cash flow ability to make distributions and per share trading price of our securities could be adversely affected.
We may be unable to identify and complete acquisitions of properties that meet our criteria, which may impede our growth and ability to pay dividends as expected.
Our business strategy involves the acquisition of income producing assets such as strip centers, neighborhood centers, grocery-anchored centers, community centers, free-standing retail properties and development properties. These activities require us to identify suitable acquisition candidates or investment opportunities that meet our criteria and are compatible with our growth strategies. We continue to evaluate the market of available properties and may attempt to acquire properties when strategic opportunities exist. However, we may be unable to acquire properties identified as potential acquisition opportunities. Our ability to acquire properties on favorable terms, or at all, may be exposed to the following significant risks:
|
| | | |
| | l | | we may incur significant costs and divert management attention in connection with evaluating and negotiating potential acquisitions, including ones that we are subsequently unable to complete; |
|
| | | |
| | l | | even if we enter into agreements for the acquisition of properties, these agreements are subject to conditions to closing, which we may be unable to satisfy; and |
|
| | | |
| | l | | we may be unable to finance the acquisition on favorable terms or at all. |
If we are unable to finance property acquisitions or acquire properties on favorable terms, or at all, our financial condition, results of operations, cash flow and per share trading price of our securities could be adversely affected. In addition, failure to identify or complete acquisitions of suitable properties could slow our growth and hinder our ability to pay dividends as expected.
We face significant competition for acquisitions of real properties, which may reduce the number of acquisition opportunities available to us and increase the costs of these acquisitions.
The current market for acquisitions continues to be extremely competitive. This competition may increase the demand for the types of properties in which we typically invest and, therefore, reduce the number of suitable acquisition opportunities available to us and increase the prices paid for such acquisition properties. We also face significant competition for attractive acquisition opportunities from an indeterminate number of investors, including publicly traded and privately held REITs, private equity investors and institutional investment funds, some of which have greater financial resources than we do, a greater ability to borrow funds to acquire properties and the ability to accept more risk than we can prudently manage, including risks with respect to the geographic proximity of investments and the payment of higher acquisition prices. This competition will increase if investments in real estate become more attractive relative to other forms of investment. Competition for investments may reduce the number of suitable investment opportunities available to us and may have the effect of increasing prices paid for such acquisition properties and/or reducing the rents we can charge and, as a result, adversely affecting our operating results.
Our future acquisitions may not yield the returns we expect, and we may otherwise be unable to operate these properties to meet our financial expectations, which could adversely affect our financial condition, results of operations, cash flow and per share trading price of our securities.
Our future acquisitions and our ability to successfully operate the properties we acquire in such acquisitions may be exposed to the following significant risks:
|
| | | |
| | l | | even if we are able to acquire a desired property, competition from other potential acquirers may significantly increase the purchase price; |
|
| | | |
| | l | | we may acquire properties that are not accretive to our results upon acquisition, and we may not successfully manage and lease those properties to meet our expectations; |
|
| | | |
| | l | | our cash flow may be insufficient to meet our required principal and interest payments or make expected distributions; |
|
| | | |
| | l | | we may spend more than budgeted amounts to make necessary improvements or renovations to acquired properties; |
|
| | | |
| | l | | we may be unable to quickly and efficiently integrate new acquisitions, particularly acquisitions of portfolios of properties, into our existing operations, and as a result our results of operations and financial condition could be adversely affected; |
|
| | | |
| | l | | market conditions may result in higher than expected vacancy rates and lower than expected rental rates; and |
|
| | | |
| | l | | we may acquire properties subject to liabilities and without any recourse, or with only limited recourse, with respect to unknown liabilities such as liabilities for cleanup of undisclosed environmental contamination, claims by tenants, vendors or other persons dealing with the former owners of the properties, liabilities incurred in the ordinary course of business and claims for indemnification by general partners, directors, officers and others indemnified by the former owners of the properties. |
If we cannot operate acquired properties to meet our financial expectations, our financial condition, results of operations, cash flow and per share trading price of our securities could be adversely affected.
We may not be able to control our operating costs or our expenses may remain constant or increase, even if our revenues do not increase, causing our results of operations to be adversely affected.
Factors that may adversely affect our ability to control operating costs include the need to pay for insurance and other operating costs, including real estate taxes, which could increase over time, the need periodically to repair, renovate and re-
leasere-lease space, the cost of compliance with governmental regulation, including zoning, environmental and tax laws, the potential for liability under applicable laws, interest rate levels, principal loan amounts and the availability of financing. If our operating costs increase as a result of any of the foregoing factors, our results of operations may be adversely affected.
The expense of owning and operating a property is not necessarily reduced when circumstances such as market factors and competition cause a reduction in income from the property. As a result, if revenues decline, we may not be able to reduce our expenses accordingly. Costs associated with real estate investments, such as real estate taxes, insurance, loan payments and maintenance, generally will not be reduced even if a property is not fully occupied or other circumstances cause our revenues to decrease. If we are unable to decrease operating costs when demand for our properties decreases and our revenues decline, our financial condition, results of operations and our ability to make distributions to our stockholders may be adversely affected.
High mortgage interest rates and/or unavailability of mortgage debt may make it difficult for us to finance or refinance properties, which could reduce the number of properties we can acquire, our net income and the amount of cash distributions we can make.
If mortgage debt is unavailable at reasonable rates, we may not be able to finance the purchase of properties. If we place mortgage debt on properties, we may be unable to refinance the properties when the loans become due, or to refinance on favorable terms. If interest rates are higher when we refinance our properties, our income could be reduced. If any of these events occur, our cash flow could be reduced. This, in turn, could reduce cash available for distribution to our stockholders and may hinder our ability to raise more capital by issuing more stock or by borrowing more money.
Mortgage debt obligations expose us to the possibility of foreclosure, which could result in the loss of our investment in a property or group of properties subject to mortgage debt.
Incurring mortgage and other secured debt obligations increases our risk of property losses because defaults on indebtedness secured by properties may result in foreclosure actions initiated by lenders and ultimately our loss of the property securing any loans for which we are in default. Any foreclosure on a mortgaged property or group of properties could adversely affect the overall value of our portfolio of properties. For tax purposes, a foreclosure on any of our properties that is subject to a nonrecourse mortgage loan would be treated as a sale of the property for a purchase price equal to the outstanding balance of the debt secured by the mortgage. If the outstanding balance of the debt secured by the mortgage exceeds our tax basis in the
property, we would recognize taxable income on foreclosure, but would not receive any cash proceeds, which could hinder our ability to meet the REIT distribution requirements imposed by the Code.
Failure to hedge effectively against interest rate changes may adversely affect our financial condition, results of operations, cash flow and per share trading price of our securities.
Subject to maintaining our qualification as a REIT, we may enter into hedging transactions to protect us from the effects of interest rate fluctuations on floating rate debt. We currently do not have any hedges in place. Our hedging transactions may include entering into interest rate cap agreements or interest rate swap agreements. These agreements involve risks, such as the risk that such arrangements would not be effective in reducing our exposure to interest rate changes or that a court could rule that such an agreement is not legally enforceable. In addition, interest rate hedging can be expensive, particularly during periods of rising and volatile interest rates. Hedging could reduce the overall returns on our investments. Failure to hedge effectively against interest rate changes could materially adversely affect our financial condition, results of operations, cash flow and per share trading price of our securities. In addition, while such agreements would be intended to lessen the impact of rising interest rates on us, they could also expose us to the risk that the other parties to the agreements would not perform, we could incur significant costs associated with the settlement of the agreements or that the underlying transactions could fail to qualify as highly-effective cash flow hedges under generally accepted accounting principles in the United States of America.
Adverse economic and geopolitical conditions and dislocations in the credit markets could have a material adverse effect on our financial condition, results of operations, cash flow, ability to make distributions to our stockholders and per share trading price of our securities.
Our business may be affected by market and economic challenges experienced by the U.S. economy or real estate industry as a whole, including the recent dislocations in the credit markets and general global economic downturn. These conditions, or similar conditions existing in the future, may adversely affect our financial condition, results of operations, cash flow and per share trading price of our securities as a result of the following potential consequences, among others:
|
| | | |
| | l | | decreased demand for retail space, which would cause market rental rates and property values to be negatively impacted; |
|
| | | |
| | l | | reduced values of our properties may limit our ability to dispose of assets at attractive prices or to obtain debt financing secured by our properties and may reduce the availability of unsecured loans; and |
|
| | | |
| | l | | our ability to obtain financing on terms and conditions that we find acceptable, or at all, may be limited, which could reduce our ability to pursue acquisition and development opportunities and refinance existing debt, reduce our returns from our acquisition and development activities and increase our future interest expense. |
In addition, any economic downturn may adversely affect the businesses of many of our tenants. As a result, we may see increases in bankruptcies of our tenants and increased defaults by tenants, and we may experience higher vacancy rates and delays in re-leasing vacant space, which could negatively impact our business and results of operations.
We are subject to risks that affect the general retail environment, such as weakness in the economy, the level of consumer spending, the adverse financial condition of large retailing companies and competition from discount and internetInternet retailers, any of which could adversely affect market rents for retail space and the willingness or ability of retailers to lease space in our shopping centers.
With the exception of our Riversedge North property, which houses our corporate offices, all of our improved properties are in the retail real estate market. This means that we are subject to factors that affect the retail sector generally, as well as the market for retail space. The retail environment and the market for retail space have been, and could continue to be, adversely affected by weakness in the national, regional and local economies, the level of consumer spending and consumer confidence, the adverse financial condition of some large retailing companies, the ongoing consolidation in the retail sector, the excess amount of retail space in a number of markets and increasing competition from discount retailers, outlet malls, internetInternet retailers and other online businesses. Increases in consumer spending via the Internet may significantly affect our retail tenants’ ability to generate sales in their stores. In addition, some of our retail tenants face competition from the expanding market for digital
content and hardware. New and enhanced technologies, including new digital technologies and new web services technologies, may increase competition for certain of our retail tenants.
Any of the foregoing factors could adversely affect the financial condition of our tenants and the willingness of retailers to lease space in our shopping centers. In turn, these conditions could negatively affect market rents for retail space and could materially and adversely affect our financial condition, results of operations, cash flow, the trading price of our common shares and our ability to satisfy our debt service obligations and to pay distributions to our stockholders.
We face significant competition in the leasing market, which may decrease or prevent increases of the occupancy and rental rates of our properties.
We compete with numerous developers, owners and operators of real estate, many of which own properties similar to ours in the same submarkets in which our properties are located. If our competitors offer space at rental rates below current market rates, or below the rental rates we currently charge our tenants, we may lose existing or potential tenants and we may be pressured to reduce our rental rates below those we currently charge or to offer more substantial rent abatements, tenant improvements, early termination rights or below-market renewal options in order to retain tenants when our tenants’ leases expire. As a result, our financial condition, results of operations, cash flow and per share trading price of our Common Stock could be adversely affected.
We may be required to make rent or other concessions and/or significant capital expenditures to improve our properties in order to retain and attract tenants, causing our financial condition, results of operations, cash flow, ability to make distributions to our stockholders and per share trading price of our securities to be adversely affected.
To the extent adverse economic conditions continue in the real estate market and demand for retail space falls, we expect that, upon expiration of leases at our properties, we may be required to make rent or other concessions to tenants, accommodate requests for renovations, build-to-suit remodeling and other improvements or provide additional services to our tenants. As a result, we may have to make significant capital or other expenditures in order to retain tenants whose leases expire and to attract new tenants in sufficient numbers. Additionally, we may need to raise capital to make such expenditures. If we are unable to do
so or capital is otherwise unavailable, we may be unable to make the required expenditures. This could result in non-renewals by tenants upon expiration of their leases, which could cause an adverse effect to our financial condition, results of operations, cash flow and per share trading price of our securities.
The actual rents we receive for the properties in our portfolio may be less than our asking rents, which could negatively impact our ability to generate cash flow growth.
As a result of various factors, including competitive pricing pressure in our submarkets, adverse conditions in the Northeast, Mid-Atlantic, Southeast and Southwest real estate markets, a general economic downturn and the desirability of our properties compared to other properties in our submarkets, we may be unable to realize the asking rents across the properties in our portfolio. In addition, the degree of discrepancy between our asking rents and the actual rents we are able to obtain may vary both from property to property and among different leased spaces within a single property. If we are unable to obtain rental rates that are on average comparable to our asking rents across our portfolio, then our ability to generate cash flow growth will be negatively impacted. In addition, depending on asking rental rates at any given time as compared to expiring leases in our portfolio, from time to time rental rates for expiring leases may be higher than starting rental rates for new leases.
We have and may continue to acquire properties or portfolios of properties through tax deferred contribution transactions, which could result in stockholder dilution and limit our ability to sell such assets.
We have and in the future we may continue to acquire properties or portfolios of properties through tax deferred contribution transactions in exchange for partnership interests in our Operating Partnership, which may result in stockholder dilution. This acquisition structure may have the effect of, among other things, reducing the amount of tax depreciation we could deduct over the tax life of the acquired properties, and may require that we agree to protect the contributors’ ability to defer recognition of taxable gain through restrictions on our ability to dispose of the acquired properties and/or the allocation of partnership debt to the contributors to maintain their tax bases. These restrictions could limit our ability to sell an asset at a time, or on terms, that would be favorable absent such restrictions.
Our real estate development activities are subject to risks particular to development, such as unanticipated expenses, delays and other contingencies, any of which could adversely affect our financial condition, results of operations, cash flow and the per share trading price of our securities.
We may engage in development and redevelopment activities with respect to certain of our properties. To the extent that we do so, we will be subject to the following risks associated with such development and redevelopment activities:
|
| | | |
| | l | | unsuccessful development or redevelopment opportunities could result in direct expenses to us; |
|
| | | |
| | l | | construction or redevelopment costs of a project may exceed original estimates, possibly making the project less profitable than originally estimated, or unprofitable; |
|
| | | |
| | l | | time required to complete the construction or redevelopment of a project or to lease up the completed project may be greater than originally anticipated, thereby adversely affecting our cash flow and liquidity; |
|
| | | |
| | l | | contractor and subcontractor disputes, strikes, labor disputes or supply disruptions; |
|
| | | |
| | l | | failure to achieve expected occupancy and/or rent levels within the projected time frame, if at all; |
|
| | | |
| | l | | delays with respect to obtaining or the inability to obtain necessary zoning, occupancy, land use and other governmental permits, and changes in zoning and land use laws; |
|
| | | |
| | l | | occupancy rates and rents of a completed project may not be sufficient to make the project profitable; |
|
| | | |
| | l | | our ability to dispose of properties developed or redeveloped with the intent to sell could be impacted by the ability of prospective buyers to obtain financing given the current state of the credit markets; and |
|
| | | |
| | l | | the availability and pricing of financing to fund our development activities on favorable terms or at all. |
These risks could result in substantial unanticipated delays or expenses and, under certain circumstances, could prevent completion of development or redevelopment activities once undertaken, any of which could have an adverse effect on our financial condition, results of operations, cash flow, ability to make distributions to our stockholders and the per share trading price of our securities.
The turnover in our senior management could have a material adverse effect on our business.
On January 4, 2018, Wilkes Graham tendered his resignation as our CFO. Our Board of Directors named, Matthew Reddy, the Company’s then acting Chief Accounting Officer as CFO. In addition, on January 29, 2018, our Board or Directors terminated Jon Wheeler as the Company’s Chairman, CEO and President. Our Board of Directors named, David Kelly, the Company’s then acting CIO as CEO. While we believe Mr. Kelly and Mr. Reddy are adequate replacements they have limited experience acting as CEO and CFO, respectively. If Mr. Kelly or Mr. Reddy are unable to adequately perform their new duties it could have a material adverse effect on our Company. In addition, the process of learning their new positions will require them to devote time and resources to such efforts that might otherwise be spent on the operation of our business.
Our success depends onupon our retaining and recruiting key personnel whosepersonnel.
Our future success depends heavily upon the continued service is not guaranteed, and the loss of one or more of our key personnel could adversely affectexecutives. In particular, we rely on the expertise and experience of David Kelly, our ability to managePresident and CEO, Matthew Reddy, our CFO and Andy Franklin, our Chief Operating Officer ("the COO"). We rely on their industry expertise and experience in our business operations, and in particular, their business vision, financial and accounting, management skills, and working relationship with our employees, our major shareholders, the regulatory authorities, and many of our tenants. If they became unable or unwilling to implementcontinue in their present
positions, or they left our growth strategies, or could create a negative perception in the capital markets.
Our abilityCompany, we may not be able to manage anticipated future growth depends, in large part, upon the effortsreplace him them, our business may be significantly disrupted and our financial condition and results of key personnel, particularly Mr. Wheeler, who has experience with the market, beneficial relationships and exercises substantial influence over our operational, financing, acquisition and disposition activity. Among the reasons that Mr. Wheeler is important to our success is that he has a national and regional industry reputation that attracts business and investment opportunities and assists us in negotiations with lenders, existing and potential tenants and industry personnel. If we lose his services, our relationships with such persons could diminish.operations may be materially adversely affected.
We may be subject to on-going or future litigation, including existing claims relating to the entities that own the properties described in this annual filing and otherwise in the ordinary course of business, which could have a material adverse effect on our financial condition, results of operations, cash flow and per share trading price of our securities.
We may be subject to on-going litigation, including existing claims relating to the entities that own the properties and operate the businesses described in this annual filing and otherwise in the ordinary course of business. Some of these claims may result in significant defense costs and potentially significant judgments against us, some of which are not, or cannot be, insured against. We generally intend to vigorously defend ourselves; however, we cannot be certain of the ultimate outcomes of currently asserted claims or of those that may arise in the future. Resolution of these types of matters against us may result in our having to pay significant fines, judgments, or settlements, which, if uninsured, or if the fines, judgments, and settlements exceed insured levels, could adversely impact our earnings and cash flows, thereby having an adverse effect on our financial condition, results of operations, cash flow and per share trading price of our Common Stock. Certain litigation or the resolution of certain litigation may affect the availability or cost of some of our insurance coverage, which could adversely impact our results of operations and cash flows, expose us to increased risks that would be uninsured, and/or adversely impact our ability to attract officers and directors.
We may not be able to rebuild our existing properties to their existing specifications if we experience a substantial or comprehensive loss of such properties.
In the event that we experience a substantial or comprehensive loss of one of our properties, we may not be able to rebuild such property to its existing specifications. Further, reconstruction or improvement of such a property would likely require significant upgrades to meet zoning and building code requirements. Environmental and legal restrictions could also restrict the rebuilding of our properties.
Potential losses may not be covered by insurance or may exceed policy limits and we could incur significant costs and lose our equity in the damaged properties.
We carry comprehensive liability insurance policies, covering all of our properties. Our insurance coverage contains policy specifications and insured limits customarily carried for similar properties and business activities. If a loss or damages are suffered at one or more of our properties, our insurer may attempt to limit or void our coverage by arguing that the loss resulted from facts or circumstances not covered by our policy. Furthermore, if we experience a loss that is uninsured or that exceeds our policy limits, we could incur significant costs and lose the capital invested in the damaged or otherwise adversely affected properties as well as the anticipated future cash flows from those properties.
We have a limited operating history as a REIT and a publicly traded company. We have limited financing sources, and we may not be able to successfully operate as a REIT or a publicly traded company.
We have a limited operating history as a REIT and a publicly traded company. We cannot assure you that the past experience of Mr. WheelerKelly and our management team will be sufficient to successfully operate our company as a REIT or a publicly traded company, including the requirements to timely meet disclosure requirements of the SEC, and comply with the Sarbanes-Oxley Act of 2002 and REIT requirements imposed by the Code. Failure to operate successfully as a public company or maintain our qualification as a REIT would have an adverse effect on our financial condition, results of operations, cash flow and per share trading price of our Common Stock.
Additionally, we have limited financing sources. If our capital resources are insufficient to support our operations, we will not be successful. You should consider our prospects in light of the risks, uncertainties and difficulties frequently encountered by companies that are, like us, in the early stages of development. To be successful in this market, we must, among other things:
|
| | | |
| | l | | identify and acquire additional investments that further our investment strategies; |
|
| | | |
| | l | | increase awareness of our REIT within the investment products market; |
|
| | | |
| | l | | attract, integrate, motivate and retain qualified personnel to manage our day-to-day operations; and |
|
| | | |
| | l | | respond to competition for our targeted real estate properties and other investment as well as for potential investors. |
We cannot guarantee that we will succeed in achieving these goals, and our failure to do so could cause you to lose all or a portion of your investment.
Our estimated cash available for distribution is insufficient to cover our anticipated annual dividends and distributions paid from sources other than our cash flow from operations will result in us having fewer funds available for the acquisition of properties, which may adversely affect our ability to fund future distributions with cash flow from operations and may adversely affect your overall return.
Our operating cash flow currently is insufficient to cover our anticipated monthly and quarterly distributions to common stockholders and preferred stockholders. We have paid distributions from sources other than from our cash flow from operations. Until we acquire additional properties, we will not generate sufficient cash flow from operations to pay our anticipated monthly and quarterly distributions. Moreover, our Board of Directors may change this policy, in its sole discretion, at any time.
By funding distributions from our cash on hand or borrowings we will have less funds available for acquiring properties. As a result, the return you realize on your investment may be reduced. Funding distributions from borrowings could restrict the amount we can borrow for investments, which may affect our profitability. Funding distributions with the sale of assets or the proceeds of offerings may affect our ability to generate cash flows. Funding distributions from the sale of securities could dilute your interest in us if we sell shares of our Common Stock or securities convertible or exercisable into shares of our Common Stock to third party investors. Payment of distributions from the mentioned sources could restrict our ability to generate sufficient cash flow from operations, affect our profitability and/or affect the distributions payable to you, any or all of which may have an adverse effect on your investment.
Joint venture investments could be adversely affected by our lack of sole decision-making authority, our reliance on co-venturers’ financial condition and disputes between our co-venturers and us.
We may co-invest in the future with other third parties through partnerships, joint ventures or other entities, acquiring non-controlling interests in or sharing responsibility for managing the affairs of a property, partnership, joint venture or other entity. Consequently, with respect to any such arrangement we may enter into in the future, we would not be in a position to exercise sole decision-making authority regarding the property, partnership, joint venture or other entity. Investments in partnerships, joint ventures or other entities may, under certain circumstances, involve risks not present were a
third party not involved, including the possibility that partners or co-venturers might become bankrupt or fail to fund their share of required capital contributions. Partners or co-venturers may have economic or other business interests or goals which are inconsistent with our business interests or goals, and may be in a position to take actions contrary to our policies or objectives, and they may have competing interests in our markets that could create conflict of interest issues. Such investments may also have the potential risk of impasses on decisions, such as a sale, because neither we nor the partner or co-venturer would have full control over the partnership or joint venture. In addition, a sale or transfer by us to a third party of our interests in the joint venture may be subject to consent rights or rights of first refusal, in favor of our joint venture partners, which would in each case restrict our ability to dispose of our interest in the joint venture. Where we are a limited partner or non-managing member in any partnership or limited liability company, if such entity takes or expects to take actions that could jeopardize our status as a REIT or require us to pay tax, we may be forced to dispose of our interest in such entity. Disputes between us and partners or co-venturers may result in litigation or arbitration that would increase our expenses and prevent our officers and/or directors from focusing their time and effort on our business. Consequently, actions by or disputes with partners or co-venturers might result in subjecting properties owned by the partnership or joint venture to additional risk. In addition, we may in certain circumstances be liable for the actions of our third-party partners or co-venturers. Our joint ventures may be subject to debt and, in the current volatile credit market, the refinancing of such debt may require equity capital calls.
Our growth depends on external sources of capital that are outside of our control and may not be available to us on commercially reasonable terms or at all, which could limit our ability, among other things, to meet our capital and operating needs or make the cash distributions to our stockholders necessary to maintain our qualification as a REIT.
In order to maintain our qualification as a REIT, we are required under the Code, among other things, to distribute annually at least 90% of our REIT taxable income, determined without regard to the dividends paid deduction and excluding any net capital gain. In addition, we will be subject to income tax at regular corporate rates to the extent that we distribute less than 100% of our REIT taxable income, including any net capital gains. Because of these distribution requirements, we may not be able to fund future capital needs, including any necessary acquisition financing, from operating cash flow. Consequently, we intend to rely on third-party sources to fund our capital needs. We may not be able to obtain such financing on favorable terms or at all and any additional debt we incur will increase our leverage and likelihood of default. Our access to third-party sources of capital depends, in part, on:
|
| | | |
| | l | | general market conditions; |
|
| | | |
| | l | | the market’s perception of our growth potential; |
|
| | | |
| | l | | our current debt levels; |
|
| | | |
| | l | | our current and expected future earnings; |
|
| | | |
| | l | | our cash flow and cash distributions; and |
|
| | | |
| | l | | the market price per share of our securities. |
Recently, the capital markets have been subject to significant disruptions. If we cannot obtain capital from third-party sources, we may not be able to acquire or develop properties when strategic opportunities exist, meet the capital and operating needs of our existing properties, satisfy our debt service obligations or make the cash distributions to our stockholders necessary to maintain our qualification as a REIT.
FailureWe may not comply with the Asset Coverage Ratio contained in the terms of our Series D Preferred Stock.
The terms of our Series D Preferred Stock require us to maintain a certain level of asset coverage. More specifically, we are required to maintain an asset coverage percentage of at least 200% on the last business day of each calendar quarter. This percentage is calculated by dividing (i) our total assets plus accumulated depreciation minus our total liabilities and indebtedness as reported in our financial statements (exclusive of the book value of any Redeemable and Term Preferred Stock) by (ii) the aggregate liquidation preference, plus an amount equal to all accrued and unpaid dividends, of the outstanding shares of our Series D Preferred Stock and any outstanding shares of Redeemable and Term Preferred Stock. If we fail to satisfy the Asset Coverage Ratio (as defined in Note 9 to the consolidated financial statements beginning on page 126 of this Annual Report on Form 10-K"), we must cure the failure during the period that expires at the close of business on the date that is 30 calendar days following the filing date of our Annual Report on Form 10-K or Quarterly Report on Form 10-Q, as applicable, for that quarter. If we fail to cure the failure prior to the Asset Coverage Cure Date (as defined in Note 9 to the consolidated financial statements beginning on page 121 of this Annual Report on Form 10-K"), the terms of our Series D Preferred Stock require us to redeem, within 90 calendar days of the Asset Coverage Cure Date, shares of Redeemable and Term Preferred Stock, which may include Series D Preferred Stock, at least equal to the lesser of (i) the minimum number of shares of Redeemable and Term Preferred Stock that will result in us having an Asset Coverage Ratio of at least 200% and (ii) the maximum number of shares of Redeemable and Term Preferred Stock that can be redeemed solely out of funds legally available for such redemption.
There can be no guarantee that we will continue to comply with the Asset Coverage Ratio in the future. To the extent we fail to satisfy the Asset Coverage Ratio and are required to redeem shares of our Series D Preferred Stock, our business and its operations may be materially and adversely impacted.
If a major tenant declares bankruptcy or experiences a downturn in its business, we may be unable to make rental paymentscollect balances due under relevant leases.
We may experience concentration in one or more tenants across several of the properties in our portfolio. At any time, our tenants may experience a downturn in their business that may significantly weaken their financial condition. As a result, our tenants, including our anchor and other major tenants, may fail to comply with their contractual obligations to us, becauseseek concessions in order to continue operations or declare bankruptcy, any of which could result in the termination of such tenants’ leases and the loss of rental income attributable to the terminated leases. In addition, certain of our tenants may cease operations while continuing to pay rent, which could decrease customer traffic, thereby decreasing sales for our other tenants at the applicable retail property. In addition to these potential effects of a deteriorationbusiness downturn, mergers or consolidations among large retail establishments could result in the closure of its financial condition,existing stores or duplicate or geographically overlapping store locations, which could include stores at our retail properties.
Loss of, or a terminationstore closure by, an anchor or major tenant could significantly reduce our occupancy level or the rent we receive from our retail properties. In addition, we may not be able to re-lease vacated space at attractive rents or at all. Moreover, in the event of its lease,default by a non-renewalmajor tenant or anchor store, we may experience delays and costs in enforcing our rights as landlord to recover amounts due to us under the terms of its lease or otherwise,our agreements with those parties. The occurrence of any of the situations described above, particularly if it involves an anchor tenant with leases in multiple locations, could seriously harm our resultsperformance and could adversely affect the value of operations.the applicable retail property.
AtAny of our tenants, or any guarantor of one of our tenant’s lease obligations, could become subject to a bankruptcy proceeding pursuant to Title 11 of the United States Code (the “Bankruptcy Code”). If a tenant becomes a debtor under the Bankruptcy Code, federal law prohibits us from evicting such tenant based solely upon the commencement of such bankruptcy. Further, such a bankruptcy filing could prevent us from attempting to collect pre-bankruptcy debts from the bankrupt tenant or its properties or taking other debt enforcement actions, unless we receive an enabling order from the bankruptcy court. Generally, post-bankruptcy debts are required by statute to be paid currently, which would include payments on our leases that come due after the date of the bankruptcy filing. Such a bankruptcy filing also could cause a decrease, delay or cessation of current rental payments, reducing our operating cash flows and the amount of cash available for distributions to stockholders. Prior to emerging from bankruptcy, the tenant will need to decide whether to assume or reject its leases. Generally, and unless otherwise agreed to by the tenant and the lessor, if a tenant assumes a lease, all pre-bankruptcy balances and unpaid post-bankruptcy amounts owed under the lease must be paid in full. If a given lease or guaranty is not assumed, our operating cash flows and the amount of cash available for distribution to stockholders may be adversely affected. If a lease is rejected by a tenant in bankruptcy, we are entitled to general unsecured claims for damages. If a lease is rejected, we may not receive any further rent payments from the tenant, and the amount of our general unsecured claim for future rent would be capped at the rent reserved under the lease, without acceleration, for the greater of one year or 15% of the remaining term of the lease, but not greater than three years, plus rent and damages already due but unpaid. We would only receive recovery on our general unsecured claim in the event that funds or other consideration were available for distribution to general unsecured creditors, and then only in the same percentage as that realized on other general unsecured claims. We may also be unable to re-lease a terminated or rejected property or to re-lease it on comparable or more favorable terms.
As of December 31, 2016,2017, approximately 33.23%32.01% of the contractual base rental revenue of our total portfolio was derived from our ten largest tenants. OurThe largest tenant as of December 31, 2017, Bi-Lo, accountedLLC (“BI-LO”), a subsidiary of Southeastern Grocers, LLC (“Southeastern Grocers”), leased fourteen BI-LO grocery store locations from us with an aggregate of 516,173 leased square feet for an aggregate annualized base rent of approximately 12.11%$4.8 million, which together represents 10.53% of the contractual base rental revenueour gross leasable area and 11.24% of our total annualized base rent. One of these locations, representing 47,260 square feet and approximately $454,000 in annualized based rent, is currently closed. However, we expect that BI-LO will continue to pay the rent for this location through the remainder of the lease term, which expires in March 2018. In addition, BI-LO closed a second store in our portfolio atin 2017, representing 37,900 square feet and approximately $569,000 in annualized base rent. On December 31, 2016. At19, 2017, we entered into a lease with nationally recognized fitness center operator Planet Fitness to backfill 24,050 square feet of the 37,900 square foot vacancy created by this store closure. In addition, subsidiaries of Southeastern Grocers lease three Winn Dixie locations and two Harvey’s locations from us with an aggregate of 208,175 leased square feet for an aggregate annualized base rent of approximately $1.5 million, which together represents 4.25% of our gross leasable area and 3.39% of our total annualized base rent. Recent media reports have indicated that Southeastern Grocers and BI-LO may be in financial distress and considering filing for bankruptcy protection. If BI-LO, Southeastern Grocers or any time,of its subsidiaries fail to comply with their contractual obligations to us, seek concessions in order to continue operations or file for bankruptcy protection, our tenants may experienceefforts to collect rental payments could be delayed and, ultimately, precluded. Any decrease or cessation of rental payments would result in a downturnreduction in their businessesour cash flow and the amount of cash available to distribute to our stockholders.
In the event of a bankruptcy filing by Southeastern Grocers or any of its subsidiaries, there can be no assurance that Southeastern Grocers, any of its subsidiaries or the bankruptcy trustee would assume our leases. If any lease is not assumed or we cannot lease the space to another tenant, our cash flow and the amounts available for distributions to our stockholders may significantly weaken their financial condition, whetherbe adversely affected.
Our business and the market price of our common stock could be negatively affected as a result of general economic conditions or otherwise. Asthe actions of activist stockholders.
Joseph Stilwell, NS Advisors, LLC and Westport Capital Partners LLC have each filed a result, our tenants may failSchedule 13D announcing that they each plan to make rental payments when due, delay lease commencements, decline to extend or renew leases upon expiration or declare bankruptcy. Any of these actions could result in the termination of the tenants’ leases or the failure to renew a lease and the loss of rental income attributable to the terminated leases. The occurrence of any of the situations described above could materially adversely affect our results of operations.
Lenders may require us to enter into restrictive covenants relatingnominate two director candidates for election to our operations, whichboard of directors at our 2018 annual meeting of stockholders. Our business, operating results or financial condition could limit our ability to make distributions to our stockholders.be harmed by these potential proxy contests because, among other things:
|
| | | |
| l | | Responding to proxy contests is costly and time-consuming, is a significant distraction for our board of directors, management and employees, and diverts the attention of our board of directors and senior management from the pursuit of our business strategy, which could adversely affect our results of operations and financial condition; |
|
| | | |
| l | | Perceived uncertainties as to our future direction, our ability to execute on our strategy, or changes to the composition of our board of directors or senior management team, including our CEO, may lead to the perception of a change in the direction of our business, instability or lack of continuity which may be exploited by our competitors, and may result in the loss of potential business opportunities and make it more difficult to attract and retain qualified personnel and business partners; |
|
| | | |
| l | | The expenses for legal and advisory fees and administrative and associated costs incurred in connection with responding to proxy contests and any related litigation may be substantial; and |
|
| | | |
| l | | We may choose to initiate, or may become subject to, litigation as a result of the proxy contests or matters arising from the proxy contests, which would serve as a further distraction to our board of directors, management and employees and would require us to incur significant additional costs. |
In providing financing to us, a lender may impose restrictions on us that would affect our ability to incur additional debt, make certain investments, reduce liquidity below certain levels, make distributions to our stockholders and otherwise affect our distribution and operating policies. In general, we expect that our loan agreements will restrict our ability to encumber or otherwise transfer our interest inaddition, the respective property without the prior consent of the lender. Such loan documents may contain other negative covenants that may limit our ability to discontinue insurance coverage or impose other limitations. Any such restriction or limitation may limit our ability to make distributions to you. Further, such restrictions could make it difficult for us to satisfy the requirements necessary to qualify as a REIT.
Certain events may expose us to the risk of default under our debt obligations.
Portions of the documentation for certain of the loans secured by properties in our portfolio are vaguely drafted and subject to multiple interpretations, and certain of our financing activities could be interpreted to violate covenants in some of our loan agreements. To the extent a court or arbiter were to agree that those interpretations are accurate, the applicable lender could have the ability to accelerate such debt obligations. If any one of these events were to occur, our financial condition, results of operations, liquidity, ability to make distributions and tradingmarket price of our securities could be subject to significant fluctuations or otherwise be adversely affected.affected by the uncertainties described above or the outcome of the proxy contests.
The federal government’s “green lease” policies may adversely affect us.
In recent years, the federal government has instituted “green lease” policies that allow a government tenant to require leadership in energy and environmental design for commercial interiors, or LEED®-CI, certification in selecting new premises or renewing leases at existing premises. In addition, the Energy Independence and Security Act of 2007 allows the General Services Administration to prefer buildings for lease that have received an “Energy Star” label. Obtaining such certifications and labels may be costly and time consuming, but our failure to do so may result in our competitive disadvantage in acquiring new or retaining existing government tenants.
Technological developments may impact customer traffic at certain tenants’ stores and ultimately sales at such stores.
We may be adversely affected by developments of new technology that may cause the business of certain of our tenants to become substantially diminished or functionally obsolete, with the result that such tenants may be unable to pay rent, become insolvent, file for bankruptcy protection, close their stores or terminate their leases. Examples of the potentially adverse effects of new technology on retail businesses include, amongst other things, the advent of online movie rentals on video stores, the effect of e-books and small screen readers on book stores, and increased sales of many products online.
Substantial recent annual increases in online sales have also caused many retailers to sell products on line on their websites with pick-ups at a store or warehouse or through deliveries. With special reference to our principal tenants, online grocery orders are available and especially useful in urban areas, but have not yet become a major factor affecting grocers in our portfolio.
Natural disasters and severe weather conditions could have an adverse impact on our cash flow and operating results.
Some of our properties could be subject to potential natural or other disasters. In addition, we may acquire properties that are located in areas that are subject to natural disasters, such as earthquakes and droughts. Properties could also be affected by increases in the frequency or severity of tornados,tornadoes, hurricanes or other storms, whether such increases are caused by global climate changes or other factors. The occurrence of natural disasters or severe weather conditions can increase investment costs to repair or replace damaged properties, increase operating costs, increase future property insurance costs, and/or negatively
impact the tenant demand for lease space. If insurance is unavailable to us, or is unavailable on acceptable terms, or if our insurance is not adequate to cover business interruption or losses from such events, our earnings, liquidity and/or capital resources could be adversely affected.
We face risks relating to cybersecurity attacks, loss of confidential information and other business disruptions.
Our business is at risk from and may be impacted by cybersecurity attacks, including attempts to gain unauthorized access to our confidential data, and other electronic security breaches. Such cyber attacks can range from individual attempts to gain unauthorized access to our information technology systems to more sophisticated security threats. While we employ a number of measures to prevent, detect and mitigate these threats, there is no guarantee such efforts will be successful in preventing a cyber attack. A cybersecurity attack could compromise the confidential information of our employees, tenants and vendors. A successful attack could disrupt and otherwise adversely affect our business operations.
Risks Related to the Real Estate Industry
There are inherent risks associated with real estate investments and with the real estate industry, each of which could have an adverse impact on our financial performance and the value of our properties.
Real estate investments are subject to various risks and fluctuations and cycles in value and demand, many of which are beyond our control. Our financial performance and the value of our properties can be affected by many of these factors, including the following:
|
| | | |
| | l | | adverse changes in financial conditions of buyers, sellers and tenants of our properties, including bankruptcies, financial difficulties or lease defaults by our tenants; |
|
| | | |
| | l | | the national, regional and local economy, which may be negatively impacted by concerns about increasing interest rates, inflation, deflation and government deficits, high unemployment rates, decreased consumer confidence, industry slowdowns, reduced corporate profits, liquidity concerns in our markets and other adverse business concerns; |
|
| | | |
| | l | | local real estate conditions, such as an oversupply of, or a reduction in, demand for retail space and the availability and creditworthiness of current and prospective tenants; |
|
| | | |
| | l | | vacancies or ability to rent retail space on favorable terms, including possible market pressures to offer tenants rent abatements, tenant improvements, early termination rights or below-market renewal options; |
|
| | | |
| | l | | changes in operating costs and expenses, including, without limitation, increasing labor and material costs, insurance costs, energy prices, environmental restrictions, real estate taxes and costs of compliance with laws, regulations and government policies, which we may be restricted from passing on to our tenants; |
|
| | | |
| | l | | fluctuations in interest rates, which could adversely affect our ability, or the ability of buyers and tenants of our properties, to obtain financing on favorable terms or at all; |
|
| | | |
| | l | | competition from other real estate investors with significant capital, including other real estate operating companies, publicly traded REITs and institutional investment funds; |
|
| | | |
| | l | | inability to refinance our indebtedness, which could result in a default on our obligation; |
|
| | | |
| | l | | the convenience and quality of competing retail properties; |
|
| | | |
| | l | | inability to collect rent from tenants; |
|
| | | |
| | l | | our ability to secure adequate insurance; |
|
| | | |
| | l | | our ability to secure adequate management services and to maintain our properties; |
|
| | | |
| | l | | changes in, and changes in enforcement of, laws, regulations and governmental policies, including, without limitation, health, safety, environmental, zoning and tax laws, government fiscal policies and the Americans with Disabilities Act of 1990 (the “ADA”); and |
|
| | | |
| | l | | civil unrest, acts of war, terrorist attacks and natural disasters, including earthquakes, wind damage and floods, which may result in uninsured and underinsured losses. |
In addition, because the yields available from equity investments in real estate depend in large part on the amount of rental income earned, as well as property operating expenses and other costs incurred, a period of economic slowdown or recession, or declining demand for real estate, or the public perception that any of these events may occur, could result in a general decline in rents or an increased incidence of defaults among our existing leases, and, consequently, our properties, including any held by joint ventures, may fail to generate revenues sufficient to meet operating, debt service and other expenses. As a result, we may have to borrow amounts to cover fixed costs, and our financial condition, results of operations, cash flow, per share market price of our securities and ability to satisfy our principal and interest obligations and to make distributions to our stockholders may be adversely affected.
Our performance and value are subject to risks associated with real estate assets and the real estate industry, including local oversupply, reduction in demand or adverse changes in financial conditions of buyers, sellers and tenants of properties, which could decrease revenues or increase costs, which would adversely affect our financial condition, results of operations, cash flow, ability to make distributions to our stockholders and the per share trading price of our securities.
Our ability to pay expected dividends to our stockholders depends on our ability to complete future acquisitions as well as our ability to generate revenues in excess of expenses, scheduled principal payments on debt and capital expenditure requirements. Events and conditions generally applicable to owners and operators of real property that are beyond our control may decrease cash available for distribution and the value of our properties. These events include many of the risks set forth above under “-Risks Related to Our Business and Operations,” as well as the following:
|
| | | |
| | l | | local oversupply or reduction in demand for retail space; |
|
| | | |
| | l | | adverse changes in financial conditions of buyers, sellers and tenants of properties; |
|
| | | |
| | l | | vacancies or our inability to rent space on favorable terms, including possible market pressures to offer tenants rent abatements, tenant improvements, early termination rights or below-market renewal options, and the need to periodically repair, renovate and re-let space; |
|
| | | |
| | l | | increased operating costs, including insurance premiums, utilities, real estate taxes and state and local taxes; |
|
| | | |
| | l | | civil unrest, acts of war, terrorist attacks and natural disasters, including earthquakes and floods, which may result in uninsured or underinsured losses; |
|
| | | |
| | l | | decreases in the underlying value of our real estate; |
|
| | | |
| | l | | changing submarket demographics; and |
|
| | | |
| | l | | changing traffic patterns. |
In addition, periods of economic downturn or recession, rising interest rates or declining demand for real estate, or the public perception that any of these events may occur, could result in a general decline in rents or an increased incidence of defaults under existing leases, which would adversely affect our financial condition, results of operations, cash flow, ability to make distributions to our stockholders and per share trading price of our securities.
Illiquidity of real estate investments could significantly impede our ability to respond to adverse changes in the performance of our properties and harm our financial condition.
The real estate investments made, and to be made, by us are relatively difficult to sell quickly. As a result, our ability to promptly sell one or more properties in our portfolio in response to changing economic, financial and investment conditions is limited. Return of capital and realization of gains, if any, from an investment generally will occur upon disposition or refinancing of the underlying property. We may be unable to realize our investment objectives by sale, other disposition or refinancing at attractive prices within any given period of time or may otherwise be unable to complete any exit strategy. In particular, our ability to dispose of one or more properties within a specific time period is subject to weakness in or even the lack of an established market for a property, changes in the financial condition or prospects of prospective purchasers, changes in national or international economic conditions, and changes in laws, regulations or fiscal policies of jurisdictions in which the property is located.
In addition, the Code imposes restrictions on a REIT’s ability to dispose of properties that are not applicable to other types of real estate companies. In particular, the tax laws applicable to REITs effectively require that we hold our properties for investment, rather than primarily for sale in the ordinary course of business, which may cause us to foregoforgo or defer sales of properties that otherwise would be in our best interest. Therefore, we may not be able to vary our portfolio in response to economic or other conditions promptly or on favorable terms, which may adversely affect our financial condition, results of operations, cash flow, ability to make distributions to our stockholders and per share trading price of our securities.
Our property taxes could increase due to property tax rate changes or reassessment, which would adversely impact our cash flows.
Although we believe we qualify as a REIT for U.S. federal income tax purposes, we will be required to pay some state and local taxes on our properties. The real property taxes on our properties may increase as property tax rates change or as our properties are assessed or reassessed by taxing authorities. The amount of property taxes we pay in the future may increase substantially from what we have paid in the past. If the property taxes we pay increase, our cash flow would be adversely impacted, and our ability to pay any expected dividends to our stockholders could be adversely affected.
Our properties may contain asbestos or develop harmful mold, which could lead to liability for adverse health effects and costs of remediating the problem, which could adversely affect the value of the affected property and our ability to make distributions to our stockholders.
We are required by federal regulations with respect to our properties to identify and warn, via signs and labels, of potential hazards posed by workplace exposure to installed asbestos-containing materials (“ACMs”), and potential ACMs. We may be subject to an increased risk of personal injury lawsuits by workers and others exposed to ACMs and potential ACMs at our properties as a result of these regulations. The regulations may affect the value of any of our properties containing ACMs and potential ACMs. Federal, state and local laws and regulations also govern the removal, encapsulation, disturbance, handling and disposal of ACMs and potential ACMs when such materials are in poor condition or in the event of construction, remodeling, renovation or demolition of a property.
When excessive moisture accumulates in buildings or on building materials, mold growth may occur, particularly if the moisture problem remains undiscovered or is not addressed over a period of time. Some molds may produce airborne toxins or irritants. Concern about indoor exposure to mold has been increasing because exposure to mold may cause a variety of adverse health effects and symptoms, including allergic or other reactions.
The presence of ACMs or significant mold at any of our properties could require us to undertake a costly remediation program to contain or remove the ACMs or mold from the affected property. In addition, the presence of ACMs or significant mold could expose us to claims of liability to our tenants, their or our employees, and others if property damage or health concerns arise.
Acquired properties may be located in new markets where we may face risks associated with investing in an unfamiliar market.
We may acquire properties in markets that are new to us. When we acquire properties located in new markets, we may face risks associated with a lack of market knowledge or understanding of the local economy, forging new business relationships in the area and unfamiliarity with local government and permitting procedures. We work to mitigate such risks through extensive diligence and research and associations with experienced service providers. However, there can be no guarantee that all such risks will be eliminated.
We may acquire properties with lock-out provisions, or agree to such provisions in connection with obtaining financing, which may prohibit us from selling or refinancing a property during the lock-out period.
We may acquire properties in exchange for common units of our Operating Partnership and agree to restrictions on sales or refinancing, called “lock-out” provisions, which are intended to preserve favorable tax treatment for the owners of such properties who sell them to us. In addition, we may agree to lock-out provisions in connection with obtaining financing for the acquisition of properties. Lock-out provisions could materially restrict us from selling, otherwise disposing of or refinancing properties. These restrictions could affect our ability to turn our investments into cash and thus affect cash available for distributions to our stockholders. Lock-out provisions could impair our ability to take actions during the lock-out period that would otherwise be in the best interests of our stockholders and, therefore, could adversely impact the market value of our Common Stock. In particular, lock-out provisions could preclude us from participating in major transactions that could result in a disposition of our assets or a change in control even though that disposition or change in control might be in the best interests of our stockholders.
As an owner of real estate, we could incur significant costs and liabilities related to environmental matters.
Under various federal, state and local laws and regulations relating to the environment, as a current or former owner or operator of real property, we may be liable for costs and damages resulting from the presence or discharge of hazardous or toxic substances, waste or petroleum products at, on, in, under or migrating from such property, including costs to investigate, clean up such contamination and liability for harm to natural resources. Such laws often impose liability without regard to whether the owner or operator knew of, or was responsible for, the presence of such contamination, and the liability may be joint and several. These liabilities could be substantial and the cost of any required remediation, removal, fines or other costs could exceed the value of the property and/or our aggregate assets. In addition, the presence of contamination or the failure to remediate contamination at our properties may expose us to third-party liability for costs of remediation and/or personal or property damage or materially adversely affect our ability to sell, lease or develop our properties or to borrow using the properties as collateral. In addition, environmental laws may create liens on contaminated sites in favor of the government for damages and costs it incurs to address such contamination. Moreover, if contamination is discovered on our properties, environmental laws may impose restrictions on the manner in which property may be used or businesses may be operated, and these restrictions may require substantial expenditures.
Additionally, we possess Phase I Environmental Site Assessments for all of the properties in our portfolio. However, the assessments are limited in scope (e.g., they do not generally include soil sampling, subsurface investigations, hazardous materials surveys or lead-based paint inspections or asbestos inspections) and may have failed to identify all environmental conditions or concerns. Furthermore, the Phase I Environmental Site Assessment reports for all of the properties in our portfolio are limited to the information available to the licensed site professional at the time of the investigation, and, as such, may not disclose all potential or existing environmental contamination liabilities at the properties in our portfolio arising after the date of such investigation. As a result, we could potentially incur material liability for these issues, which could adversely impact our
financial condition, results of operations, cash flow and the per share trading price of our Common Stock. Some of the Phase I Environmental Site Assessments in our possession indicate the possibility of lead-based paint and asbestos containing materials located on and within buildings on some of our properties and polychlorinated biphenyl-containing electrical transformers located or adjacent to some of our properties. However, management believes that the potential liabilities resulting from removing these items would be immaterial.
As the owner of the buildings on our properties, we could face liability for the presence of hazardous materials (e.g., asbestos or lead) or other adverse conditions (e.g., poor indoor air quality) in our buildings. Environmental laws govern the presence, maintenance, and removal of hazardous materials in buildings, and if we do not comply with such laws, we could face fines for such noncompliance. Also, we could be liable to third parties (e.g., occupants of the buildings) for damages related to exposure to hazardous materials or adverse conditions in our buildings, and we could incur material expenses with
respect to abatement or remediation of hazardous materials or other adverse conditions in our buildings. In addition, some of our tenants routinely handle and use hazardous or regulated substances and wastes as part of their operations at our properties, which are subject to regulation. Such environmental and health and safety laws and regulations could subject us or our tenants to liability resulting from these activities. Environmental liabilities could affect a tenant’s ability to make rental payments to us, and changes in laws could increase the potential liability for noncompliance. This may result in significant unanticipated expenditures or may otherwise materially and adversely affect our operations, or those of our tenants, which could in turn have an adverse effect on us.
We cannot assure you that costs or liabilities incurred as a result of environmental issues will not affect our ability to make distributions to you or that such costs or other remedial measures will not have an adverse effect on our financial condition, results of operations, cash flow and per share trading price of our Common Stock. If we do incur material environmental liabilities in the future, we may face significant remediation costs, and we may find it difficult to sell any affected properties.
We may incur significant costs complying with various federal, state and local laws, regulations and covenants that are applicable to our properties.
The properties in our portfolio are subject to various covenants and federal, state and local laws and regulatory requirements, including permitting and licensing requirements. Local regulations, including municipal or local ordinances, zoning restrictions and restrictive covenants imposed by community developers may restrict our use of our properties and may require us to obtain approval from local officials or restrict our use of our properties and may require us to obtain approval from local officials of community standards organizations at any time with respect to our properties, including prior to acquiring a property or when undertaking renovations of any of our existing properties. Among other things, these restrictions may relate to fire and safety, seismic or hazardous material abatement requirements. There can be no assurance that existing laws and regulatory policies will not adversely affect us or the timing or cost of any future acquisitions or renovations, or that additional regulation will not be adopted that increase such delays or result in additional costs. Our growth strategy may be affected by our ability to obtain permits, licenses and zoning relief. Our failure to obtain such permits, licenses and zoning relief or to comply with applicable laws could have an adverse effect on our financial condition, results of operations, cash flow and per share trading price of our Common Stock.
In addition, federal and state laws and regulations, including laws such as the ADA and the Fair Housing Amendment Act of 1988 (the “FHAA”), impose further restrictions on our properties and operations. Under the ADA and the FHAA, all public accommodations must meet federal requirements related to access and use by disabled persons. Some of our properties may currently be in non-compliance with the ADA or the FHAA. If one or more of the properties in our portfolio is not in compliance with the ADA, the FHAA or any other regulatory requirements, we may be required to incur additional costs to bring the property into compliance and we might incur governmental fines or the award of damages to private litigants. In addition, we do not know whether existing requirements will change or whether future requirements will require us to make significant unanticipated expenditures that will adversely impact our financial condition, results of operations, cash flow, ability to make distributions to our stockholders and per share trading price of our securities.
The Sea Turtle Development notes receivable are subject to significant risks and losses related to the underlying collateral which could have a material adverse effect on our financial condition and results of operations.
As discussed in greater detail in "Item 7. Management's Discussion and Analysis of Financial Condition and Results of Operations," we have originated notes receivable to Sea Turtle Development which take the form of subordinated loans secured
by second mortgages on the underlying development. This type of loan involves a higher degree of risk than first lien position mortgages because the loan may become unsecured as a result of foreclosure by the senior lender. In addition, these loans have higher loan-to-value ratios than conventional mortgage loans, resulting in less equity in the property and increasing the risk of loss of principal. If the borrower defaults on our loan or in the event of a borrower bankruptcy our loan will be satisfied only after the senior debt is paid in full. As a result, we may not recover some or all of our initial investment. In the event of default, significant losses related to loan investments could have a material adverse effect on our financial condition and results of operations.
Risks Related to Our Organization Structure
Conflicts of interest may exist or could arise in the future between the interests of our stockholders and the interests of holders of units in our Operating Partnership, which may impede business decisions that could benefit our stockholders.
Conflicts of interest may exist or could arise in the future as a result of the relationships between us and our affiliates, on the one hand, and our Operating Partnership or any partner thereof, on the other. Our directors and officers have duties to our company under Maryland law in connection with their management of our company. At the same time, we, as the general partner of our Operating Partnership, have fiduciary duties and obligations to our Operating Partnership and its limited partners under Virginia law and the partnership agreement of our Operating Partnership (the “Partnership Agreement”) in connection with the management of our Operating Partnership. Our fiduciary duties and obligations as the general partner of our Operating Partnership may come into conflict with the duties of our directors and officers to our company.
Under Virginia law, a general partner of a Virginia limited partnership has fiduciary duties of loyalty and care to the partnership and its partners and must discharge its duties and exercise its rights as general partner under the Partnership Agreement or Virginia law consistently with the obligation of good faith and fair dealing. The Partnership Agreement provides that, in the event of a conflict between the interests of our Operating Partnership or any partner, on the one hand, and the
separate interests of our company or our stockholders, on the other hand, we, in our capacity as the general partner of our Operating Partnership, are under no obligation not to give priority to the separate interests of our company or our stockholders, and that any action or failure to act on our part or on the part of our directors that gives priority to the separate interests of our company or our stockholders that does not result in a violation of the contract rights of the limited partners of the Operating Partnership under its Partnership Agreement does not violate the duty of loyalty that we, in our capacity as the general partner of our Operating Partnership, owe to the Operating Partnership and its partners.
Additionally, the Partnership Agreement provides that we will not be liable to the Operating Partnership or any partner for monetary damages for losses sustained, liabilities incurred or benefits not derived by the Operating Partnership or any limited partner, except for liability for our intentional harm or gross negligence. Our Operating Partnership must indemnify us, our directors and officers, officers of our Operating Partnership and our designees from and against any and all claims that relate to the operations of our Operating Partnership, unless (1) an act or omission of the person was material to the matter giving rise to the action and either was committed in bad faith or was the result of active and deliberate dishonesty, (2) the person actually received an improper personal benefit in violation or breach of the Partnership Agreement or (3) in the case of a criminal proceeding, the indemnified person had reasonable cause to believe that the act or omission was unlawful. Our Operating Partnership must also pay or reimburse the reasonable expenses of any such person upon its receipt of a written affirmation of the person’s good faith belief that the standard of conduct necessary for indemnification has been met and a written undertaking to repay any amounts paid or advanced if it is ultimately determined that the person did not meet the standard of conduct for indemnification. Our Operating Partnership will not indemnify or advance funds to any person with respect to any action initiated by the person seeking indemnification without our approval (except for any proceeding brought to enforce such person’s right to indemnification under the Partnership Agreement) or if the person is found to be liable to our Operating Partnership on any portion of any claim in the action.
We may pursue less vigorous enforcement of terms of the contribution and subscription agreements or purchase and sale agreements with members of our management and our affiliates because of our dependence on them and conflicts of interest.
Mr. Wheeler has in the past and may in the future be a party, whether directly or indirectly, to contribution and subscription agreements or purchase and sale agreements with us pursuant to which we acquired or will acquire interests in properties and assets. In addition, our other executive officers are parties to employment agreements with us. We may choose not to enforce, or to enforce less vigorously, our rights under these agreements because of our desire to maintain our ongoing relationships with members of our management and their affiliates, which could negatively impact our stockholders.
Our Board of Directors may change our investment and financing policies without stockholder approval and we may become more highly leveraged, which may increase our risk of default under our debt obligations.
Our investment and financing policies are exclusively determined by our Board of Directors. Accordingly, our stockholders do not control these policies. Further, while our Board of Directors will review our ratio of debt to total capital on a quarterly basis, with the goal of maintaining a reasonable rate consistent with our expected ratio of debt to total market capitalization going forward, our charter and bylaws do not limit the amount or percentage of indebtedness, funded or otherwise, that we may incur. Our Board of Directors may alter or eliminate our current policy on borrowing at any time without stockholder approval. If this policy changed, we could become more highly leveraged, which could result in an increase
in our debt service. Higher leverage also increases the risk of default on our obligations. In addition, a change in our investment policies, including the manner in which we allocate our resources across our portfolio or the types of assets in which we seek to invest, may increase our exposure to interest rate risk, real estate market fluctuations and liquidity risk. Changes to our policies with regard to the foregoing could adversely affect our financial condition, results of operations, cash flow and per share trading price of our Common Stock.
Our rights and the rights of our stockholders to take action against our directors and officers are limited.
As permitted by Maryland law, our charter eliminates the liability of our directors and officers to us and our stockholders for money damages, except for liability resulting from:
|
| | | |
| | l | | actual receipt of an improper benefit or profit in money, property or services; or |
|
| | | |
| | l | | a final judgment based upon a finding of active and deliberate dishonesty by the director or officer that was material to the cause of action adjudicated. |
As a result, we and our stockholders may have more limited rights against our directors and officers than might otherwise exist. Accordingly, in the event that actions taken in good faith by any of our directors or officers impede the performance of our company, your ability to recover damages from such director or officer will be limited.
We are a holding company with no direct operations and, as such, we will rely on funds received from our Operating Partnership to pay liabilities, and the interests of our stockholders will be structurally subordinated to all liabilities and obligations of our Operating Partnership and its subsidiaries.
We are a holding company and will conduct substantially all of our operations through our Operating Partnership. We do not have, apart from an interest in our Operating Partnership, any independent operations. As a result, we will rely on distributions from our Operating Partnership to pay any dividends we might declare on shares of our Common Stock. We will also rely on distributions from our Operating Partnership to meet any of our obligations, including any tax liability on taxable income allocated to us from our Operating Partnership. In addition, because we are a holding company, your claims as stockholders will be structurally subordinated to all existing and future liabilities and obligations (whether or not for borrowed money) of our Operating Partnership and its subsidiaries. Therefore, in the event of our bankruptcy, liquidation or reorganization, our assets and those of our Operating Partnership and its subsidiaries will be available to satisfy the claims of our stockholders only after all of our and our Operating Partnership’s and our other subsidiaries’ liabilities and obligations have been paid in full.
Our Operating Partnership may issue additional partnership units to third parties without the consent of our stockholders, which would reduce our ownership percentage in our Operating Partnership and would have a dilutive effect on the amount of distributions made to us by our Operating Partnership and, therefore, the amount of distributions we can make to our stockholders.
As of December 31, 2016,2017, we own 93.21%94.34% of the outstanding common units of our Operating Partnership, and we may, in connection with our acquisition of properties or otherwise, issue additional partnership units to third parties. Such issuances would reduce our ownership percentage in our Operating Partnership and affect the amount of distributions made to us by our Operating Partnership and, therefore, the amount of distributions we can make to our stockholders. Because you will not directly own partnership units, you will not have any voting rights with respect to any such issuances or other partnership level activities of our Operating Partnership.
Loss of exclusion from regulation pursuant to the Investment Company Act of 1940 would adversely affect us.
We conduct our operations so that our company and each of its subsidiaries are exempt from registration as an investment company under the Investment Company Act of 1940, or the Investment Company Act. Under Section 3(a)(1)(A) of the Investment Company Act, a company is an “investment company” if it is, or holds itself out as being, engaged primarily, or proposes to engage primarily, in the business of investing, reinvesting or trading in securities. Under Section 3(a)(1)(C) of the Investment Company Act, a company is deemed to be an “investment company” if it is engaged, or proposes to engage, in the business of investing, reinvesting, owning, holding or trading in securities and owns or proposes to acquire “investment
securities” having a value exceeding 40% of the value of its total assets (exclusive of government securities and cash items) on an unconsolidated basis, or the 40% test.
We conduct our operations so that our company and most, if not all, of our subsidiaries will comply with the 40% test. We will continuously monitor our holdings on an ongoing basis to determine the compliance of our company and each subsidiary with this test. In addition, we believe that neither our company nor any of our subsidiaries will be considered investment companies under Section 3(a)(1)(A) of the Investment Company Act because they will not engage primarily, or propose to engage primarily, or hold themselves out as being engaged primarily in the business of investing, reinvesting or trading in securities. Rather, our company and its subsidiaries are primarily engaged in non-investment company businesses related to real estate. Our business will be materially and adversely affected if we fail to qualify for this exclusion from regulation pursuant to the Investment Company Act.
Risks Related to Our Status as a REIT
Failure to qualify as a REIT would have significant adverse consequences to us and the value of our Common Stock.
We have elected to be taxed, and we operate in a manner that will allow us to qualify, as a REIT for U.S. federal income tax purposes. We have not requested, and do not plan to request, a ruling from the Internal Revenue Service (the “IRS”) that we qualify as a REIT, and the statements in this annual filing are not binding on the IRS or any court. Therefore, we cannot assure you that we qualify as a REIT, or that we will remain qualified as such in the future. If we lose our REIT status, we will face serious tax consequences that would substantially reduce the funds available for distribution to you for each of the years involved because:
|
| | | |
| | l | | we would not be allowed a deduction for distributions to stockholders in computing our taxable income and would be subject to U.S. federal income tax at regular corporate rates; |
|
| | | |
| | l | | we also could be subject to the federal alternative minimum tax and possibly increased state and local taxes; and |
|
| | | |
| | l | | unless we are entitled to relief under applicable statutory provisions, we could not elect to be taxed as a REIT for five taxable years following the year during which we were disqualified. |
Any such corporate tax liability could be substantial and would reduce our cash available for, among other things, our operations and distributions to stockholders. In addition, if we fail to qualify as a REIT, we will not be required to make distributions to our stockholders. As a result of all these factors, our failure to qualify as a REIT also could impair our ability to expand our business and raise capital, and could materially and adversely affect the value of our Common Stock.
Qualification as a REIT involves the application of highly technical and complex Code provisions for which there are only limited judicial and administrative interpretations. The complexity of these provisions and of the applicable Treasury regulations that have been promulgated under the Code, or the Treasury Regulations, is greater in the case of a REIT that, like us, holds its assets through a partnership. The determination of various factual matters and circumstances not entirely within our control may affect our ability to qualify as a REIT. In order to qualify as a REIT, we must satisfy a number of requirements, including requirements regarding the ownership of our stock, requirements regarding the composition of our assets and a requirement that at least 95% of our gross income in any year must be derived from qualifying sources, such as “rents from real property.” Also, we must make distributions to stockholders aggregating annually at least 90% of our REIT taxable income, excluding net capital gains. In addition, legislation, new regulations, administrative interpretations or court decisions may materially adversely affect our investors, our ability to qualify as a REIT for U.S. federal income tax purposes or the desirability of an investment in a REIT relative to other investments.
Even if we continue to qualify as a REIT for U.S. federal income tax purposes, we may be subject to some federal, state and local income, property and excise taxes on our income or property and, in certain cases, a 100% penalty tax, in the event we sell property as a dealer. In addition, our taxable REIT subsidiaries will be subject to tax as regular corporations in the jurisdictions they operate.
If our Operating Partnership fails to continue to qualify as a partnership for U.S. federal income tax purposes, we would cease to qualify as a REIT and suffer other adverse consequences.
We believe that our Operating Partnership will continue to be treated as a partnership for U.S. federal income tax purposes. As a partnership, our Operating Partnership will not be subject to U.S. federal income tax on its income. Instead, each of its partners, including us, will be allocated, and may be required to pay tax with respect to, its share of our Operating Partnership’s income. We cannot assure you, however, that the IRS will not challenge the status of our Operating Partnership or any other subsidiary partnership in which we own an interest as a partnership for U.S. federal income tax purposes, or that a court would not sustain such a challenge. If the IRS were successful in treating our Operating Partnership or any such other subsidiary partnership as an entity taxable as a corporation for U.S. federal income tax purposes, we would fail to meet the gross income tests and certain of the asset tests applicable to REITs and, accordingly, we would likely cease to continue to qualify as a REIT. Also, the failure of our Operating Partnership or any subsidiary partnerships to continue to qualify as a partnership could cause it to become subject to federal and state corporate income tax, which would reduce significantly the amount of cash available for debt service and for distribution to its partners, including us.
To maintain our REIT status, we may be forced to borrow funds during unfavorable market conditions, and the unavailability of such capital on favorable terms at the desired times, or at all, may cause us to curtail our investment activities and/or to dispose of assets at inopportune times, which could adversely affect our financial condition, results of operations, cash flow, ability to make distributions to our stockholders and per share trading price of our securities.
To continue to qualify as a REIT, we generally must distribute to our stockholders at least 90% of our REIT taxable income each year, excluding net capital gains, and we will be subject to regular corporate income taxes to the extent that we distribute less than 100% of our REIT taxable income each year. In addition, we will be subject to a 4% nondeductible excise tax on the amount, if any, by which distributions paid by us in any calendar year are less than the sum of 85% of our ordinary income, 95% of our capital gain net income and 100% of our undistributed income from prior years. In order to maintain our REIT status and avoid the payment of income and excise taxes, we may need to borrow funds to meet the REIT distribution requirements even if the then- prevailing market conditions are not favorable for these borrowings. These borrowing needs could result from, among other things, differences in timing between the actual receipt of cash and inclusion of income for U.S. federal income tax purposes, or the effect of non-deductible capital expenditures, the creation of reserves or required debt or amortization payments. These sources, however, may not be available on favorable terms or at all. Our access to third-party sources of capital depends on a number of factors, including the market’s perception of our growth potential, our current debt levels, the market price of our Common Stock, and our current and potential future earnings. We cannot assure you that we will have access to such capital on favorable terms at the desired times, or at all, which may cause us to curtail our investment activities and/or to dispose of assets at inopportune times, and could adversely affect our financial condition, results of operations, cash flow, ability to make distributions to our stockholders and per share trading price of our securities.
We may in the future choose to pay dividends in our securities, in which case you may be required to pay tax in excess of the cash you receive.
We may distribute taxable dividends that are payable in our securities. Taxable stockholders receiving such dividends will be required to include the full amount of the dividend as ordinary income to the extent of our current and accumulated earnings and profits for U.S. federal income tax purposes. As a result, a U.S. stockholder may be required to pay tax with respect to such dividends in excess of the cash received. If a U.S. stockholder sells the stock it receives as a dividend in order to pay this tax, the sales proceeds may be less than the amount included in income with respect to the dividend, depending on the market price of our stock at the time of the sale. For more information on the tax consequences of distributions with respect to our securities, see “Material U.S. Federal Income Tax Considerations.” Furthermore, with respect to non-U.S. stockholders, we may be required to withhold U.S. tax with respect to such dividends, including in respect of all or a portion of such dividend that is payable in stock. In addition, if a significant number of our stockholders determine to sell shares of our stock in order to pay taxes owed on dividends, such sales may have an adverse effect on the per share trading price of our securities.
Dividends payable by REITs do not qualify for the reduced tax rates available for some dividends.
The maximum tax rate applicable to income from “qualified dividends” payable to U.S. stockholders that are individuals, trusts and estates is 20%. Dividends payable by REITs, however, generally are not eligible for the 20% rate. Although these rules do not adversely affect the taxation of REITs or dividends payable by REITs, to the extent that the 20% rate continues to apply to regular corporate qualified dividends, investors who are individuals, trusts and estates may perceive investments in
REITs to be relatively less attractive than investments in the stocks of non-REIT corporations that pay dividends, which could adversely affect the value of the shares of REITs, including the per share trading price of our Common Stock.
The tax imposed on REITs engaging in “prohibited transactions” may limit our ability to engage in transactions that would be treated as sales for U.S. federal income tax purposes.
A REIT’s net income from prohibited transactions is subject to a 100% excise tax. In general, prohibited transactions are sales or other dispositions of property, other than foreclosure property, held primarily for sale to customers in the ordinary course of business. Although we do not intend to hold any properties that would be characterized as held for sale to customers in the ordinary course of our business, unless a sale or disposition qualifies under certain statutory safe harbors, such characterization is a factual determination and no guarantee can be given that the IRS would agree with our characterization of our properties or that we will always be able to make use of the available safe harbors.
Complying with REIT requirements may affect our profitability and may force us to liquidate or forgo otherwise attractive investments.
To qualify as a REIT, we must continually satisfy tests concerning, among other things, the nature and diversification of our assets, the sources of our income and the amounts we distribute to our stockholders. We may be required to liquidate or forgo otherwise attractive investments in order to satisfy the asset and income tests or to qualify under certain statutory relief provisions. We also may be required to make distributions to stockholders at disadvantageous times or when we do not have funds readily available for distribution. As a result, having to comply with the distribution requirement could cause us to: (1) sell assets in adverse market conditions; (2) borrow on unfavorable terms; or (3) distribute amounts that would otherwise be invested in future acquisitions, capital expenditures or repayment of debt. Accordingly, satisfying the REIT requirements could have an adverse effect on our business results, profitability and ability to execute our business plan. Moreover, if we are compelled to liquidate our investments to meet any of these asset, income or distribution tests, or to repay obligations to our lenders, we may be unable to comply with one or more of the requirements applicable to REITs or may be subject to a 100% tax on any resulting gain if such sales constitute prohibited transactions.
Legislative or other actions affecting REITs could have a negative effect on us, including our ability to qualify as a REIT or the U.S. federal income tax consequences of such qualification.
The rules dealing with U.S. federal income taxation are constantly under review by persons involved in the legislative process and by the IRS and the U.S. Department of the Treasury. Changes to the tax laws, with or without retroactive application, could adversely affect our investors or us. We cannot predict how changes in the tax laws might affect our investors or us. New legislation, Treasury Regulations, administrative interpretations or court decisions could significantly and negatively affect our ability to qualify as a REIT or the U.S. federal income tax consequences of such qualification.
Item 1B. Unresolved Staff Comments.
None.
Item 2. Properties.
Our Portfolio
At December 31, 2016,2017, we owned seventy-fourseventy-three properties, including sixty-four income producing properties located in Virginia, North Carolina, South Carolina, Florida, Georgia, Kentucky, Oklahoma, Tennessee, Alabama, New Jersey, Pennsylvania and West Virginia, containing a total of 4,906,5114,902,381 gross leaseableleasable square feet of retail space, which we refer to as our operating portfolio. The following table presents an overview of our properties, based on information as of December 31, 2016.2017.
Portfolio
| | | Property | Location | | Number
of
Tenants | | Gross Leasable Area ("GLA") | | Percentage
Leased | | Annualized
Base Rent (1) | | Annualized
Base Rent
per Leased
Square
Foot | Location | | Number
of
Tenants | | Total Leasable Square Feet | | Percentage
Leased (1) | | Percentage
Occupied | | Annualized
Base Rent (2) | | Annualized Base Rent per Occupied Square Foot |
| Alex City Marketplace | Alexander City, AL | | 18 |
| | 147,791 |
| | 99.2 | % | | $ | 1,081,763 |
| | $ | 7.38 |
| Alexander City, AL | | 18 |
| | 147,791 |
| | 99.2 | % | | 99.2 | % | | $ | 1,133,080 |
| | $ | 7.73 |
|
Amscot Building (2)(3) | Tampa, FL | | 1 |
| | 2,500 |
| | 100.0 | % | | 115,849 |
| | 46.34 |
| Tampa, FL | | 1 |
| | 2,500 |
| | 100.0 | % | | 100.0 | % | | 115,849 |
| | 46.34 |
|
| Beaver Ruin Village | Lilburn, GA | | 27 |
| | 74,038 |
| | 85.4 | % | | 1,046,318 |
| | 16.55 |
| Lilburn, GA | | 27 |
| | 74,038 |
| | 84.0 | % | | 84.0 | % | | 1,065,286 |
| | 17.13 |
|
| Beaver Ruin Village II | Lilburn, GA | | 4 |
| | 34,925 |
| | 100.0 | % | | 410,403 |
| | 11.75 |
| Lilburn, GA | | 4 |
| | 34,925 |
| | 100.0 | % | | 100.0 | % | | 416,584 |
| | 11.93 |
|
Berkley (3)(4) | Norfolk, VA | | — |
| | — |
| | — | % | | — |
| | — |
| Norfolk, VA | | — |
| | — |
| | — | % | | — | % | | — |
| | — |
|
| Berkley Shopping Center | Norfolk, VA | | 11 |
| | 47,945 |
| | 94.2 | % | | 358,414 |
| | 7.94 |
| Norfolk, VA | | 10 |
| | 47,945 |
| | 91.7 | % | | 91.7 | % | | 340,560 |
| | 7.75 |
|
| Brook Run Shopping Center | Richmond, VA | | 18 |
| | 147,738 |
| | 90.7 | % | | 1,496,685 |
| | 11.18 |
| Richmond, VA | | 19 |
| | 147,738 |
| | 92.1 | % | | 92.1 | % | | 1,511,306 |
| | 11.10 |
|
Brook Run Properties (3)(4) | Richmond, VA | | — |
| | — |
| | — | % | | — |
| | — |
| Richmond, VA | | — |
| | — |
| | — | % | | — | % | | — |
| | — |
|
| Bryan Station | Lexington, KY | | 8 |
| | 54,397 |
| | 92.7 | % | | 507,008 |
| | 10.06 |
| Lexington, KY | | 10 |
| | 54,397 |
| | 99.8 | % | | 99.8 | % | | 582,113 |
| | 10.72 |
|
| Butler Square | Mauldin, SC | | 16 |
| | 82,400 |
| | 100.0 | % | | 789,180 |
| | 9.58 |
| Mauldin, SC | | 16 |
| | 82,400 |
| | 98.2 | % | | 98.2 | % | | 804,183 |
| | 9.93 |
|
| Cardinal Plaza | Henderson, NC | | 6 |
| | 50,000 |
| | 91.0 | % | | 430,250 |
| | 9.46 |
| Henderson, NC | | 7 |
| | 50,000 |
| | 94.0 | % | | 94.0 | % | | 447,350 |
| | 9.52 |
|
| Carolina Place (3) | Onley, VA | | — |
| | — |
| | — | % | | — |
| | — |
| |
| Chesapeake Square | Onley, VA | | 12 |
| | 99,848 |
| | 81.7 | % | | 688,193 |
| | 8.43 |
| Onley, VA | | 13 |
| | 99,848 |
| | 79.5 | % | | 79.5 | % | | 679,232 |
| | 8.55 |
|
| Clover Plaza | Clover, SC | | 9 |
| | 45,575 |
| | 100.0 | % | | 348,512 |
| | 7.65 |
| Clover, SC | | 9 |
| | 45,575 |
| | 100.0 | % | | 100.0 | % | | 354,044 |
| | 7.77 |
|
| Columbia Fire Station (5) | Columbia, SC | | — |
| | — |
| | — | % | | — |
| | — |
| |
| Columbia Fire Station (6) | | Columbia, SC | | — |
| | — |
| | — | % | | — | % | | — |
| | — |
|
| Conyers Crossing | Conyers, GA | | 14 |
| | 170,475 |
| | 99.4 | % | | 966,678 |
| | 5.71 |
| Conyers, GA | | 15 |
| | 170,475 |
| | 100.0 | % | | 100.0 | % | | 1,004,179 |
| | 5.89 |
|
| Courtland Commons (3) | Courtland, VA | | — |
| | — |
| | — | % | | — |
| | — |
| |
| Courtland Commons (4) | | Courtland, VA | | — |
| | — |
| | — | % | | — | % | | — |
| | — |
|
| Crockett Square | Morristown, TN | | 3 |
| | 107,122 |
| | 92.5 | % | | 812,322 |
| | 8.20 |
| Morristown, TN | | 4 |
| | 107,122 |
| | 100.0 | % | | 100.0 | % | | 920,322 |
| | 8.59 |
|
| Cypress Shopping Center | Boiling Springs, SC | | 17 |
| | 80,435 |
| | 98.3 | % | | 844,116 |
| | 10.68 |
| Boiling Springs, SC | | 17 |
| | 80,435 |
| | 98.3 | % | | 98.3 | % | | 865,610 |
| | 10.95 |
|
| Darien Shopping Center | Darien, GA | | 1 |
| | 26,001 |
| | 100.0 | % | | 208,008 |
| | 8.00 |
| Darien, GA | | 1 |
| | 26,001 |
| | 100.0 | % | | 100.0 | % | | 208,008 |
| | 8.00 |
|
| Devine Street | Columbia, SC | | 2 |
| | 38,464 |
| | 100.0 | % | | 549,668 |
| | 14.29 |
| Columbia, SC | | 2 |
| | 38,464 |
| | 100.0 | % | | 100.0 | % | | 318,500 |
| | 8.28 |
|
| Edenton Commons (3) | Edenton, NC | | — |
| | — |
| | — | % | | — |
| | — |
| |
| Edenton Commons (4) | | Edenton, NC | | — |
| | — |
| | — | % | | — | % | | — |
| | — |
|
| Folly Road | Charleston, SC | | 5 |
| | 47,794 |
| | 100.0 | % | | 720,863 |
| | 15.08 |
| Charleston, SC | | 6 |
| | 47,794 |
| | 100.0 | % | | 100.0 | % | | 721,552 |
| | 15.10 |
|
| Forrest Gallery | Tullahoma, TN | | 27 |
| | 214,451 |
| | 83.2 | % | | 1,138,754 |
| | 6.38 |
| Tullahoma, TN | | 28 |
| | 214,451 |
| | 95.3 | % | | 95.3 | % | | 1,366,992 |
| | 6.69 |
|
| Fort Howard Shopping Center | Rincon, GA | | 17 |
| | 113,652 |
| | 96.0 | % | | 971,889 |
| | 8.90 |
| Rincon, GA | | 17 |
| | 113,652 |
| | 75.1 | % | | 75.1 | % | | 728,150 |
| | 8.53 |
|
| Franklin Village | Kittanning, PA | | 29 |
| | 151,673 |
| | 100.0 | % | | 1,143,829 |
| | 7.54 |
| Kittanning, PA | | 29 |
| | 151,673 |
| | 100.0 | % | | 100.0 | % | | 1,203,743 |
| | 7.94 |
|
| Franklinton Square | Franklinton, NC | | 13 |
| | 65,366 |
| | 90.7 | % | | 537,182 |
| | 9.06 |
| Franklinton, NC | | 14 |
| | 65,366 |
| | 93.0 | % | | 93.0 | % | | 541,086 |
| | 8.90 |
|
| Freeway Junction | Stockbridge, GA | | 15 |
| | 156,834 |
| | 96.2 | % | | 1,096,623 |
| | 7.27 |
| Stockbridge, GA | | 15 |
| | 156,834 |
| | 96.9 | % | | 96.9 | % | | 1,120,756 |
| | 7.38 |
|
| Georgetown | Georgetown, SC | | 2 |
| | 29,572 |
| | 100.0 | % | | 267,215 |
| | 9.04 |
| Georgetown, SC | | 2 |
| | 29,572 |
| | 100.0 | % | | 100.0 | % | | 267,215 |
| | 9.04 |
|
| Graystone Crossing | Tega Cay, SC | | 11 |
| | 21,997 |
| | 100.0 | % | | 524,588 |
| | 23.85 |
| Tega Cay, SC | | 11 |
| | 21,997 |
| | 100.0 | % | | 100.0 | % | | 537,329 |
| | 24.43 |
|
| Grove Park | Orangeburg, SC | | 15 |
| | 106,557 |
| | 87.8 | % | | 669,417 |
| | 7.07 |
| Orangeburg, SC | | 14 |
| | 106,557 |
| | 86.9 | % | | 86.9 | % | | 704,674 |
| | 7.61 |
|
| Harbor Point (3) | Grove, OK | | — |
| | — |
| | — | % | | — |
| | — |
| |
| Harbor Point (4) | | Grove, OK | | — |
| | — |
| | — | % | | — | % | | — |
| | — |
|
| Harrodsburg Marketplace | Harrodsburg, KY | | 9 |
| | 60,048 |
| | 100.0 | % | | 441,940 |
| | 7.36 |
| Harrodsburg, KY | | 9 |
| | 60,048 |
| | 100.0 | % | | 100.0 | % | | 401,440 |
| | 6.69 |
|
| Jenks Plaza | Jenks, OK | | 5 |
| | 7,800 |
| | 100.0 | % | | 151,779 |
| | 19.46 |
| Jenks, OK | | 4 |
| | 7,800 |
| | 64.1 | % | | 64.1 | % | | 101,764 |
| | 20.35 |
|
| Laburnum Square | Richmond, VA | | 22 |
| | 109,405 |
| | 100.0 | % | | 938,268 |
| | 8.58 |
| Richmond, VA | | 21 |
| | 109,405 |
| | 100.0 | % | | 100.0 | % | | 978,186 |
| | 8.94 |
|
| Ladson Crossing | Ladson, SC | | 14 |
| | 52,607 |
| | 95.4 | % | | 731,085 |
| | 14.56 |
| Ladson, SC | | 14 |
| | 52,607 |
| | 95.4 | % | | 95.4 | % | | 739,374 |
| | 14.73 |
|
| | | Property | Location | | Number
of
Tenants | | Gross Leasable Area ("GLA") | | Percentage
Leased | | Annualized
Base Rent (1) | | Annualized
Base Rent
per Leased
Square
Foot | Location | | Number
of
Tenants | | Total Leasable Square Feet | | Percentage
Leased (1) | | Percentage
Occupied | | Annualized
Base Rent (2) | | Annualized Base Rent per Occupied Square Foot |
| LaGrange Marketplace | LaGrange, GA | | 13 |
| | 76,594 |
| | 96.1 | % | | $ | 411,085 |
| | $ | 5.59 |
| LaGrange, GA | | 14 |
| | 76,594 |
| | 95.3 | % | | 95.3 | % | | $ | 385,743 |
| | $ | 5.28 |
|
| Lake Greenwood Crossing | Greenwood, SC | | 6 |
| | 47,546 |
| | 87.4 | % | | 408,841 |
| | 9.84 |
| Greenwood, SC | | 6 |
| | 47,546 |
| | 87.4 | % | | 87.4 | % | | 409,417 |
| | 9.85 |
|
| Lake Murray | Lexington, SC | | 5 |
| | 39,218 |
| | 100.0 | % | | 349,510 |
| | 8.91 |
| Lexington, SC | | 5 |
| | 39,218 |
| | 100.0 | % | | 100.0 | % | | 352,185 |
| | 8.98 |
|
Laskin Road (3)(4) | Virginia Beach, VA | | — |
| | — |
| | — | % | | — |
| | — |
| Virginia Beach, VA | | — |
| | — |
| | — | % | | — | % | | — |
| | — |
|
| Litchfield Market Village | Pawleys Island, SC | | 18 |
| | 86,740 |
| | 83.9 | % | | 1,063,340 |
| | 14.61 |
| Pawleys Island, SC | | 17 |
| | 86,740 |
| | 83.8 | % | | 83.8 | % | | 1,088,817 |
| | 14.98 |
|
| Lumber River Village | Lumberton, NC | | 11 |
| | 66,781 |
| | 100.0 | % | | 511,006 |
| | 7.65 |
| Lumberton, NC | | 10 |
| | 66,781 |
| | 96.4 | % | | 96.4 | % | | 483,813 |
| | 7.51 |
|
| Monarch Bank | Virginia Beach, VA | | 1 |
| | 3,620 |
| | 100.0 | % | | 265,796 |
| | 73.42 |
| Virginia Beach, VA | | 1 |
| | 3,620 |
| | 100.0 | % | | 100.0 | % | | 126,702 |
| | 35.00 |
|
| Moncks Corner | Moncks Corner, SC | | 1 |
| | 26,800 |
| | 100.0 | % | | 324,390 |
| | 12.10 |
| Moncks Corner, SC | | 1 |
| | 26,800 |
| | 100.0 | % | | 100.0 | % | | 323,451 |
| | 12.07 |
|
| Nashville Commons | Nashville, NC | | 12 |
| | 56,100 |
| | 99.9 | % | | 575,977 |
| | 10.28 |
| Nashville, NC | | 12 |
| | 56,100 |
| | 99.9 | % | | 99.9 | % | | 585,453 |
| | 10.45 |
|
| New Market Crossing | Mt. Airy, NC | | 11 |
| | 116,976 |
| | 89.3 | % | | 931,517 |
| | 8.92 |
| Mt. Airy, NC | | 13 |
| | 116,976 |
| | 96.1 | % | | 96.1 | % | | 966,962 |
| | 8.61 |
|
| Parkway Plaza | Brunswick, GA | | 5 |
| | 52,365 |
| | 96.9 | % | | 536,069 |
| | 10.56 |
| Brunswick, GA | | 4 |
| | 52,365 |
| | 81.7 | % | | 81.7 | % | | 488,280 |
| | 11.41 |
|
| Perimeter Square | Tulsa, OK | | 7 |
| | 58,277 |
| | 95.1 | % | | 733,601 |
| | 13.23 |
| Tulsa, OK | | 8 |
| | 58,277 |
| | 85.2 | % | | 51.8 | % | | 374,167 |
| | 12.41 |
|
| Pierpont Centre | Morgantown, WV | | 20 |
| | 122,259 |
| | 100.0 | % | | 1,450,993 |
| | 11.87 |
| Morgantown, WV | | 17 |
| | 122,259 |
| | 89.3 | % | | 89.3 | % | | 1,294,431 |
| | 11.85 |
|
| Port Crossing | Harrisonburg, VA | | 9 |
| | 65,365 |
| | 97.9 | % | | 799,589 |
| | 12.49 |
| Harrisonburg, VA | | 9 |
| | 65,365 |
| | 97.9 | % | | 97.9 | % | | 806,576 |
| | 12.60 |
|
| Ridgeland | Ridgeland, SC | | 1 |
| | 20,029 |
| | 100.0 | % | | 140,203 |
| | 7.00 |
| Ridgeland, SC | | 1 |
| | 20,029 |
| | 100.0 | % | | 100.0 | % | | 140,203 |
| | 7.00 |
|
| Riverbridge Shopping Center | Carrollton, GA | | 11 |
| | 91,188 |
| | 98.5 | % | | 660,038 |
| | 7.35 |
| Carrollton, GA | | 11 |
| | 91,188 |
| | 98.5 | % | | 98.5 | % | | 682,628 |
| | 7.60 |
|
Riversedge North (4)(5) | Virginia Beach, VA | | — |
| | — |
| | — | % | | — |
| | — |
| Virginia Beach, VA | | — |
| | — |
| | — | % | | — | % | | — |
| | — |
|
| Rivergate Shopping Center | Macon, GA | | 32 |
| | 205,810 |
| | 97.3 | % | | 2,936,715 |
| | 14.67 |
| Macon, GA | | 30 |
| | 201,680 |
| | 96.6 | % | | 96.6 | % | | 2,753,254 |
| | 14.13 |
|
| Sangaree Plaza | Summerville, SC | | 9 |
| | 66,948 |
| | 100.0 | % | | 577,360 |
| | 8.62 |
| Summerville, SC | | 8 |
| | 66,948 |
| | 87.4 | % | | 87.4 | % | | 538,060 |
| | 9.20 |
|
| Shoppes at Myrtle Park | Bluffton, SC | | 11 |
| | 56,380 |
| | 98.2 | % | | 913,674 |
| | 16.50 |
| Bluffton, SC | | 12 |
| | 56,380 |
| | 75.4 | % | | 32.8 | % | | 366,347 |
| | 19.82 |
|
| Shoppes at TJ Maxx | Richmond, VA | | 18 |
| | 93,624 |
| | 100.0 | % | | 1,128,459 |
| | 12.05 |
| Richmond, VA | | 18 |
| | 93,624 |
| | 100.0 | % | | 100.0 | % | | 1,124,749 |
| | 12.01 |
|
| South Lake | Lexington, SC | | 10 |
| | 44,318 |
| | 100.0 | % | | 419,349 |
| | 9.46 |
| Lexington, SC | | 10 |
| | 44,318 |
| | 100.0 | % | | 100.0 | % | | 278,550 |
| | 6.29 |
|
| South Park | Mullins, SC | | 2 |
| | 60,734 |
| | 71.2 | % | | 491,245 |
| | 11.37 |
| Mullins, SC | | 2 |
| | 60,734 |
| | 71.2 | % | | 71.2 | % | | 491,245 |
| | 11.37 |
|
| South Square | Lancaster, SC | | 5 |
| | 44,350 |
| | 89.9 | % | | 321,742 |
| | 8.07 |
| Lancaster, SC | | 4 |
| | 44,350 |
| | 70.8 | % | | 70.8 | % | | 256,255 |
| | 8.16 |
|
| St. George Plaza | St. George, SC | | 4 |
| | 59,279 |
| | 69.7 | % | | 273,186 |
| | 6.61 |
| St. George, SC | | 3 |
| | 59,279 |
| | 62.0 | % | | 62.0 | % | | 273,786 |
| | 7.45 |
|
| St. Matthews | St. Matthews, SC | | 5 |
| | 29,015 |
| | 87.2 | % | | 307,382 |
| | 12.14 |
| St. Matthews, SC | | 5 |
| | 29,015 |
| | 87.2 | % | | 87.2 | % | | 307,693 |
| | 12.16 |
|
| Sunshine Plaza | Lehigh Acres, FL | | 22 |
| | 111,189 |
| | 98.2 | % | | 999,936 |
| | 9.16 |
| Lehigh Acres, FL | | 19 |
| | 111,189 |
| | 91.1 | % | | 91.1 | % | | 911,068 |
| | 8.99 |
|
| Surrey Plaza | Hawkinsville, GA | | 5 |
| | 42,680 |
| | 100.0 | % | | 292,995 |
| | 6.86 |
| Hawkinsville, GA | | 5 |
| | 42,680 |
| | 100.0 | % | | 100.0 | % | | 286,245 |
| | 6.71 |
|
| Tampa Festival | Tampa, FL | | 20 |
| | 137,987 |
| | 98.1 | % | | 1,224,605 |
| | 9.05 |
| Tampa, FL | | 19 |
| | 137,987 |
| | 98.8 | % | | 98.8 | % | | 1,266,566 |
| | 9.29 |
|
| The Shoppes at Eagle Harbor | Carrollton, VA | | 7 |
| | 23,303 |
| | 100.0 | % | | 456,539 |
| | 19.59 |
| Carrollton, VA | | 7 |
| | 23,303 |
| | 100.0 | % | | 100.0 | % | | 456,737 |
| | 19.60 |
|
| Tri-County Plaza | Royston, GA | | 7 |
| | 67,577 |
| | 90.5 | % | | 445,450 |
| | 7.28 |
| Royston, GA | | 6 |
| | 67,577 |
| | 89.2 | % | | 89.2 | % | | 431,969 |
| | 7.17 |
|
Tulls Creek (3)(4) | Moyock, NC | | — |
| | — |
| | — | % | | — |
| | — |
| Moyock, NC | | — |
| | — |
| | — | % | | — | % | | — |
| | — |
|
| Twin City Commons | Batesburg-Leesville, SC | | 5 |
| | 47,680 |
| | 100.0 | % | | 453,763 |
| | 9.52 |
| Batesburg-Leesville, SC | | 5 |
| | 47,680 |
| | 100.0 | % | | 100.0 | % | | 454,315 |
| | 9.53 |
|
| Village of Martinsville | Martinsville, VA | | 18 |
| | 297,950 |
| | 96.1 | % | | 2,230,040 |
| | 7.79 |
| Martinsville, VA | | 18 |
| | 297,950 |
| | 96.1 | % | | 96.1 | % | | 2,218,658 |
| | 7.75 |
|
| Walnut Hill Plaza | Petersburg, VA | | 10 |
| | 87,239 |
| | 70.4 | % | | 501,891 |
| | 8.17 |
| Petersburg, VA | | 8 |
| | 87,239 |
| | 65.0 | % | | 65.0 | % | | 447,119 |
| | 7.88 |
|
| Waterway Plaza | Little River, SC | | 10 |
| | 49,750 |
| | 100.0 | % | | 477,718 |
| | 9.60 |
| Little River, SC | | 10 |
| | 49,750 |
| | 100.0 | % | | 100.0 | % | | 418,228 |
| | 8.41 |
|
| Westland Square | West Columbia, SC | | 9 |
| | 62,735 |
| | 77.0 | % | | 443,336 |
| | 9.18 |
| West Columbia, SC | | 9 |
| | 62,735 |
| | 77.1 | % | | 77.1 | % | | 443,952 |
| | 9.18 |
|
| Winslow Plaza | Sicklerville, NJ | | 14 |
| | 40,695 |
| | 87.0 | % | | 523,908 |
| | 14.80 |
| Sicklerville, NJ | | 15 |
| | 40,695 |
| | 89.9 | % | | 89.9 | % | | 558,894 |
| | 15.27 |
|
| Total Portfolio | | 705 |
| | 4,906,511 |
| | 94.0 | % | | $ | 44,568,047 |
| | $ | 9.66 |
| | 699 |
| | 4,902,381 |
| | 92.8 | % | | 91.9 | % | | $ | 42,970,985 |
| | $ | 9.53 |
|
| |
| (1) | Reflects leases executed through January 10, 2018 that commence subsequent to the end of the current period. |
| |
| (2) | Annualized base rent per leased square foot, excludesassumes base rent as of the end of the current year, excluding the impact of tenant concessions.concessions and rent abatements. |
| |
(2)(3) | We own the Amscot building, but we do not own the land underneath the buildings and instead lease the land pursuant to ground leases with parties that are affiliates of our former CEO, Jon Wheeler. As discussed in the financial statements in Item 15, these ground leases require us to make annual rental payments and contain escalation clauses and renewal options. |
| |
(3)(4) | This information is not available because the property is undeveloped. |
| |
(4)(5) | This property is our corporate headquarters that we 100% occupy. |
| |
(5)(6) | This information is not available because the property is a redevelopment property. |
Outstanding Indebtedness
As of December 31, 2016,2017, our outstanding indebtedness was approximately $315.0 million, including debt associated with assets held for sale.$313.8 million. The following table sets forth information with respect to such indebtedness:
| | | | Amount of Debt
Outstanding as of
December 31, 2016 | | Weighted
Average
Interest Rate | | Maturity
Date | | Amortization
Period (Mths) | | Annual
Debt
Service | | Balance at
Maturity | Amount of Debt
Outstanding as of
December 31, 2017 ($ in 000s) | | Weighted
Average
Interest Rate | | Maturity
Date | | Amortization
Period (Mths) | | Annual
Debt
Service ($ in 000s) | | Balance at
Maturity ($ in 000s) |
| Bank Line of Credit | | $ | 3,000 |
| | 4.37 | % | | December 2017 | | N/A | | $ | 131 |
| | $ | 3,000 |
|
| Shoppes at Eagle Harbor | $ | 3,492,178 |
| | 4.34 | % | | 3/11/2018 | | 240 | | $ | 301,200 |
| | $ | 3,341,602 |
| 3,341 |
| | 4.34 | % | | March 2018 | | 240 | | 301 |
| | 3,316 |
|
| Monarch Bank Building | 1,319,767 |
| | 4.15 | % | | 12/30/2017 | | 240 | | 113,676 |
| | 1,275,495 |
| |
| Revere Loan | | 6,808 |
| | 8.00 | % | | April 2018 | | N/A | | 545 |
| | 6,808 |
|
| Lumber River | | 1,500 |
| | 4.32 | % | | June 2018 | | N/A | | 65 |
| | 1,473 |
|
| KeyBank Line of Credit | | 15,532 |
| | 4.05 | % | | July 2018 | | N/A | | 628 |
| | 15,532 |
|
| Senior convertible notes | | 1,369 |
| | 9.00 | % | | December 2018 | | N/A | | 123 |
| | 1,369 |
|
| Harbor Point | | 553 |
| | 5.85 | % | | December 2018 | | 240 | | 132 |
| | 460 |
|
| Perimeter Square | 4,500,000 |
| | 4.06 | % | | 8/6/2026 | | N/A | | 182,700 |
| | 4,500,000 |
| 5,382 |
| | 5.50 | % | | December 2018 | | N/A | | 296 |
| | 5,382 |
|
| Riversedge North | 914,026 |
| | 6.00 | % | | 1/16/2019 | | 360 | | 105,624 |
| | 807,912 |
| 863 |
| | 6.00 | % | | January 2019 | | 360 | | 106 |
| | 808 |
|
| Monarch Bank Building | | 1,266 |
| | 4.85 | % | | June 2019 | | 300 | | 88 |
| | 1,228 |
|
| DF I-Moyock | | 194 |
| | 5.00 | % | | July 2019 | | 60 | | 128 |
| | — |
|
| Rivergate | | 22,689 |
| | 4.32 | % | | December 2019 | | N/A | | 981 |
| | 21,593 |
|
| KeyBank Line of Credit | | 52,500 |
| | 4.05 | % | | December 2019 | | N/A | | 2,124 |
| | 52,500 |
|
| LaGrange Marketplace | | 2,317 |
| | 5.50 | % | | March 2020 | | 120 | | 181 |
| | 2,195 |
|
| Folly Road | | 6,181 |
| | 4.00 | % | | March 2020 | | N/A | | 247 |
| | 5,902 |
|
| Columbia Fire Station construction loan | | 3,421 |
| | 4.00 | % | | May 2020 | | N/A | | 137 |
| | 3,261 |
|
| Shoppes at TJ Maxx | | 5,727 |
| | 3.88 | % | | May 2020 | | 300 | | 407 |
| | 5,278 |
|
| Walnut Hill Plaza | 3,439,587 |
| | 5.50 | % | | 7/31/2017 | | 240 | | 291,276 |
| | 3,389,004 |
| 3,903 |
| | 5.50 | % | | September 2022 | | N/A | | 215 |
| | 3,447 |
|
| Twin City Commons | 3,169,620 |
| | 4.86 | % | | 1/6/2023 | | 360 | | 213,924 |
| | 2,767,570 |
| 3,111 |
| | 4.86 | % | | January 2023 | | 360 | | 214 |
| | 2,768 |
|
| Shoppes at TJ Maxx | 5,907,597 |
| | 3.88 | % | | 5/1/2020 | | 300 | | 406,560 |
| | 5,294,355 |
| |
| Vantage South Bank Line of Credit | 3,000,000 |
| | 4.25 | % | | 9/16/2017 | | N/A | | 127,500 |
| | 3,000,000 |
| |
| Key Bank Line of Credit | 74,077,250 |
| | 3.24 | % | | 5/29/2018 | | N/A | | 2,397,303 |
| | 74,077,250 |
| |
| Tampa Festival | | 8,368 |
| | 5.56 | % | | September 2023 | | 360 | | 610 |
| | 7,452 |
|
| Forrest Gallery | 8,802,243 |
| | 5.40 | % | | 9/6/2023 | | 360 | | 611,676 |
| | 7,794,407 |
| 8,669 |
| | 5.40 | % | | September 2023 | | 360 | | 612 |
| | 7,764 |
|
| Tampa Festival | 8,502,198 |
| | 5.56 | % | | 9/6/2023 | | 360 | | 609,568 |
| | 7,483,025 |
| |
| Winslow Plaza | 4,620,000 |
| | 4.82 | % | | 12/1/2025 | | N/A | | 222,684 |
| | 4,620,000 |
| |
| South Carolina Food Lions Note | | 12,050 |
| | 5.25 | % | | January 2024 | | 360 | | 820 |
| | 10,793 |
|
| Cypress Shopping Center | 6,585,228 |
| | 4.70 | % | | 7/6/2024 | | 240 | | 412,320 |
| | 5,700,457 |
| 6,485 |
| | 4.70 | % | | July 2024 | | 240 | | 412 |
| | 5,700 |
|
| Port Crossing | | 6,263 |
| | 4.84 | % | | August 2024 | | 240 | | 417 |
| | 5,410 |
|
| Freeway Junction | | 7,994 |
| | 4.60 | % | | September 2024 | | 240 | | 502 |
| | 6,993 |
|
| Harrodsburg Marketplace | 3,616,999 |
| | 4.55 | % | | 9/1/2024 | | 240 | | 229,344 |
| | 3,058,982 |
| 3,553 |
| | 4.55 | % | | September 2024 | | 240 | | 229 |
| | 3,044 |
|
| Port Crossing | 6,370,373 |
| | 4.84 | % | | 8/1/2024 | | 240 | | 417,456 |
| | 5,423,413 |
| |
| LaGrange Marketplace | 2,369,225 |
| | 5.50 | % | | 3/1/2020 | | 120 | | 180,779 |
| | 2,205,004 |
| |
| Freeway Junction | 8,119,327 |
| | 4.60 | % | | 9/6/2024 | | 240 | | 375,180 |
| | 6,976,171 |
| |
| DF I-Moyock | 309,319 |
| | 5.00 | % | | 7/30/2019 | | 60 | | 127,980 |
| | 10,643 |
| |
| Graystone Crossing | 3,990,048 |
| | 4.55 | % | | 10/1/2024 | | 240 | | 188,067 |
| | 3,428,208 |
| 3,928 |
| | 4.55 | % | | October 2024 | | 240 | | 245 |
| | 3,428 |
|
| Bryan Station | 4,618,932 |
| | 4.52 | % | | 11/1/2024 | | 240 | | 209,048 |
| | 3,968,506 |
| 4,547 |
| | 4.52 | % | | November 2024 | | 240 | | 282 |
| | 3,960 |
|
| Crockett Square | 6,337,500 |
| | 4.47 | % | | 12/5/2024 | | N/A | | 283,286 |
| | 6,337,500 |
| 6,338 |
| | 4.47 | % | | December 2024 | | N/A | | 283 |
| | 6,338 |
|
| Harbor Point | 649,366 |
| | 5.85 | % | | 12/5/2018 | | 240 | | 132,288 |
| | 476,899 |
| |
| Pierpont Centre | 9,800,000 |
| | 4.15 | % | | 2/6/2025 | | N/A | | 406,700 |
| | 8,902,005 |
| 8,113 |
| | 4.15 | % | | February 2025 | | N/A | | 337 |
| | 6,858 |
|
| Alex City Marketplace | 5,750,000 |
| | 3.95 | % | | 4/6/2025 | | N/A | | 227,355 |
| | 5,750,000 |
| 5,750 |
| | 3.95 | % | | April 2025 | | N/A | | 227 |
| | 5,750 |
|
| Butler Square | 5,640,000 |
| | 3.90 | % | | 5/6/2025 | | N/A | | 219,791 |
| | 5,640,000 |
| 5,640 |
| | 3.90 | % | | May 2025 | | N/A | | 220 |
| | 5,640 |
|
| Brook Run Shopping Center | 10,950,000 |
| | 4.08 | % | | 6/2/2025 | | N/A | | 446,300 |
| | 10,950,000 |
| 10,950 |
| | 4.08 | % | | June 2025 | | N/A | | 447 |
| | 10,950 |
|
| Beaver Ruin I and II | 9,400,000 |
| | 4.73 | % | | 7/1/2025 | | N/A | | 444,620 |
| | 9,400,000 |
| |
| Columbia Fire House | 487,408 |
| | 8.00 | % | | 12/31/2017 | | N/A | | 38,993 |
| | 523,827 |
| |
| Sunshine Plaza | 5,900,000 |
| | 4.57 | % | | 8/6/2025 | | N/A | | 269,630 |
| | 5,900,000 |
| |
| Barnett Properties | 8,770,000 |
| | 4.30 | % | | 9/6/2025 | | N/A | | 377,110 |
| | 8,770,000 |
| |
| Grove Park | 3,800,000 |
| | 4.52 | % | | 10/1/2025 | | N/A | | 171,760 |
| | 3,800,000 |
| |
| Parkway Plaza | 3,500,000 |
| | 4.57 | % | | 10/1/2025 | | N/A | | 159,950 |
| | 3,500,000 |
| |
| Conyers Crossing | 5,960,000 |
| | 4.67 | % | | 10/6/2025 | | N/A | | 278,332 |
| | 5,960,000 |
| |
| Fort Howard | 7,100,000 |
| | 4.57 | % | | 10/6/2025 | | N/A | | 324,470 |
| | 7,100,000 |
| |
| Chesapeake Square | 4,577,709 |
| | 4.70 | % | | 8/1/2026 | | 120 | | 286,288 |
| | 3,761,924 |
| |
| Beaver Ruin Village I and II | | 9,400 |
| | 4.73 | % | | July 2025 | | N/A | | 445 |
| | 9,400 |
|
| Sunshine Shopping Plaza | | 5,900 |
| | 4.57 | % | | August 2025 | | N/A | | 270 |
| | 5,900 |
|
|
| | | | | | | | | | | | | | | | | | |
| | Amount of Debt
Outstanding as of
December 31, 2016 | | Weighted
Average
Interest Rate | | Maturity
Date | | Amortization
Period (Mths) | | Annual
Debt
Service | | Balance at
Maturity |
| Revere Loan | $ | 7,450,000 |
| | 8.00 | % | | 4/30/2017 | | N/A | | $ | 596,000 |
| | $ | 7,450,000 |
|
| Senior convertible notes | 1,400,000 |
| | 9.00 | % | | 12/15/2018 | | N/A | | 126,000 |
| | 1,400,000 |
|
| South Carolina Food Lions Note | 12,224,489 |
| | 5.25 | % | | 1/6/2024 | | 360 | | 819,839 |
| | 10,793 |
|
| Sangaree/Tri-County/Berkley | 9,400,000 |
| | 4.78 | % | | 12/1/2026 | | N/A | | 449,320 |
| | 8,682,652 |
|
| Franklin | 8,515,000 |
| | 4.93 | % | | 1/6/2027 | | N/A | | 419,619 |
| | 7,539,373 |
|
| Rivergate | 24,212,500 |
| | 3.67 | % | | 12/21/2019 | | N/A | | 887,727 |
| | 23,879,076 |
|
| Riverbridge | 4,000,000 |
| | 4.48 | % | | 12/6/2026 | | N/A | | 179,360 |
| | 4,000,000 |
|
| Lumber River | 1,500,000 |
| | 3.67 | % | | 6/20/2018 | | N/A | | 54,996 |
| | 1,484,987 |
|
| | $ | 315,047,889 |
| | | | | | | | | | |
|
| | | | | | | | | | | | | | | | | | |
| | Amount of Debt
Outstanding as of
December 31, 2017 ($ in 000s) | | Weighted
Average
Interest Rate | | Maturity
Date | | Amortization
Period (Mths) | | Annual
Debt
Service ($ in 000s) | | Balance at
Maturity ($ in 000s) |
| Barnett Portfolio | $ | 8,770 |
| | 4.30 | % | | September 2025 | | N/A | | $ | 377 |
| | $ | 8,770 |
|
| Fort Howard Shopping Center | 7,100 |
| | 4.57 | % | | October 2025 | | N/A | | 324 |
| | 7,100 |
|
| Conyers Crossing | 5,960 |
| | 4.67 | % | | October 2025 | | N/A | | 278 |
| | 5,960 |
|
| Grove Park Shopping Center | 3,800 |
| | 4.52 | % | | October 2025 | | N/A | | 172 |
| | 3,800 |
|
| Parkway Plaza | 3,500 |
| | 4.57 | % | | October 2025 | | N/A | | 160 |
| | 3,500 |
|
| Winslow Plaza | 4,620 |
| | 4.82 | % | | December 2025 | | N/A | | 223 |
| | 4,171 |
|
| Chesapeake Square | 4,507 |
| | 4.70 | % | | August 2026 | | 120 | | 286 |
| | 3,753 |
|
| Berkley/Sangaree/Tri-County | 9,400 |
| | 4.78 | % | | December 2026 | | N/A | | 449 |
| | 8,654 |
|
| Riverbridge | 4,000 |
| | 4.48 | % | | December 2026 | | N/A | | 179 |
| | 4,000 |
|
| Franklin | 8,516 |
| | 4.93 | % | | January 2027 | | N/A | | 420 |
| | 7,539 |
|
| | $ | 313,778 |
| | | | | | | | | | |
Major Tenants
The following table sets forth information regarding the ten largest tenants in our operating portfolio based on annualized base rent as of December 31, 2016.2017.
| | | Tenants | Annualized Base Rent ($ in 000s) | | % of Total Annualized Base Rent | | Total Gross Leaseable Square Feet | | % of Gross Leasable Square Feet | | Base Rent Per Leased Square Foot | Annualized Base Rent ($ in 000s) | | % of Total Annualized Base Rent | | Total Occupied Square Feet | | Square Footage Percent Occupied | | Base Rent Per Occupied Square Foot |
| Bi-Lo | $ | 5,398 |
| | 12.11 | % | | 554,073 |
| | 11.29 | % | | $ | 9.74 |
| |
| BI-LO (1) | | $ | 4,829 |
| | 11.24 | % | | 516,173 |
| | 10.53 | % | | $ | 9.36 |
|
| Food Lion | 2,691 |
| | 6.04 | % | | 325,576 |
| | 6.64 | % | | 8.27 |
| 2,691 |
| | 6.26 | % | | 325,576 |
| | 6.64 | % | | 8.27 |
|
| Kroger (2) | | 1,309 |
| | 3.05 | % | | 186,064 |
| | 3.80 | % | | 7.04 |
|
| Winn Dixie (1) | | 1,031 |
| | 2.40 | % | | 133,575 |
| | 2.72 | % | | 7.72 |
|
| Piggly Wiggly | 1,356 |
| | 3.04 | % | | 136,343 |
| | 2.78 | % | | 9.95 |
| 978 |
| | 2.28 | % | | 136,343 |
| | 2.78 | % | | 7.17 |
|
| Kroger | 1,294 |
| | 2.90 | % | | 186,064 |
| | 3.79 | % | | 6.95 |
| |
| Winn Dixie | 1,236 |
| | 2.77 | % | | 179,175 |
| | 3.65 | % | | 6.90 |
| |
| Hobby Lobby | 675 |
| | 1.51 | % | | 114,298 |
| | 2.33 | % | | 5.91 |
| 675 |
| | 1.57 | % | | 114,298 |
| | 2.33 | % | | 5.91 |
|
Harris Teeter | 578 |
| | 1.30 | % | | 39,946 |
| | 0.81 | % | | 14.47 |
| 578 |
| | 1.35 | % | | 39,946 |
| | 0.81 | % | | 14.47 |
|
| Lowes Foods | 571 |
| | 1.28 | % | | 54,838 |
| | 1.12 | % | | 10.41 |
| 571 |
| | 1.33 | % | | 54,838 |
| | 1.12 | % | | 10.41 |
|
| Family Dollar | 546 |
| | 1.23 | % | | 75,291 |
| | 1.53 | % | | 7.25 |
| 548 |
| | 1.28 | % | | 75,291 |
| | 1.54 | % | | 7.28 |
|
| Dollar Tree | 470 |
| | 1.05 | % | | 59,533 |
| | 1.21 | % | | 7.89 |
| |
| Goodwill | | 538 |
| | 1.25 | % | | 71,620 |
| | 1.46 | % | | 7.51 |
|
| | $ | 14,815 |
| | 33.23 | % | | 1,725,137 |
| | 35.15 | % | | $ | 8.59 |
| $ | 13,748 |
| | 32.01 | % | | 1,653,724 |
| | 33.73 | % | | $ | 8.31 |
|
(1) These tenants are both owned by Southeastern Grocers.
(2) These tenants are both owned by The Kroger Company.
Lease Expirations
The following table sets forth information with respect to the lease expirations of our properties as of December 31, 2016.2017.
| | | Lease Expiration Year | Number of
Expiring
Leases | | Total Expiring
Gross Leaseable Area | | Percent of
Total Gross Leaseable Area | | Expiring
Annualized Base
Rent (in 000s) | | Percent of
Total Annualized
Base Rent | | Expiring
Base Rent
Per Leased
Square Foot | Number of
Expiring
Leases | | Total Expiring
Gross Leaseable Area | | Percent of
Total Gross Leaseable Area | | Expiring
Annualized Base
Rent (in 000s) | | Percent of
Total Annualized
Base Rent | | Expiring
Base Rent
Per Leased
Square Foot |
| Available | — |
| | 294,869 |
| | 6.01 | % | | $ | — |
| | — |
| | $ | — |
| — |
| | 395,422 |
| | 8.07 | % | | $ | — |
| | — |
| | $ | — |
|
| 2017 | 112 |
| | 351,660 |
| | 7.17 | % | | 4,043 |
| | 9.07 | % | | 11.50 |
| |
| 2018 | 133 |
| | 757,654 |
| | 15.44 | % | | 7,039 |
| | 15.79 | % | | 9.29 |
| 115 |
| | 460,155 |
| | 9.39 | % | | 4,292 |
| | 9.99 | % | | 9.33 |
|
| 2019 | 144 |
| | 740,276 |
| | 15.09 | % | | 7,250 |
| | 16.27 | % | | 9.79 |
| 140 |
| | 713,230 |
| | 14.55 | % | | 7,158 |
| | 16.66 | % | | 10.04 |
|
| 2020 | 113 |
| | 910,696 |
| | 18.56 | % | | 8,143 |
| | 18.27 | % | | 8.94 |
| 139 |
| | 887,603 |
| | 18.11 | % | | 8,044 |
| | 18.72 | % | | 9.06 |
|
| 2021 | 77 |
| | 531,905 |
| | 10.84 | % | | 4,970 |
| | 11.15 | % | | 9.34 |
| 89 |
| | 578,364 |
| | 11.80 | % | | 5,305 |
| | 12.35 | % | | 9.17 |
|
| 2022 | 42 |
| | 250,841 |
| | 5.11 | % | | 2,560 |
| | 5.74 | % | | 10.21 |
| 99 |
| | 429,834 |
| | 8.77 | % | | 4,786 |
| | 11.14 | % | | 11.13 |
|
| 2023 | 17 |
| | 318,627 |
| | 6.49 | % | | 2,638 |
| | 5.92 | % | | 8.28 |
| 37 |
| | 452,104 |
| | 9.22 | % | | 3,731 |
| | 8.68 | % | | 8.25 |
|
| 2024 | 18 |
| | 145,502 |
| | 2.97 | % | | 1,433 |
| | 3.22 | % | | 9.85 |
| 19 |
| | 113,484 |
| | 2.31 | % | | 1,105 |
| | 2.57 | % | | 9.74 |
|
| 2025 | 16 |
| | 251,511 |
| | 5.13 | % | | 2,430 |
| | 5.45 | % | | 9.66 |
| 18 |
| | 264,323 |
| | 5.39 | % | | 2,815 |
| | 6.55 | % | | 10.65 |
|
| 2026 and thereafter | 33 |
| | 352,970 |
| | 7.19 | % | | 4,062 |
| | 9.12 | % | | 11.51 |
| |
| 2026 | | 20 |
| | 278,223 |
| | 5.68 | % | | 2,418 |
| | 5.63 | % | | 8.69 |
|
| 2027 and thereafter | | 23 |
| | 329,639 |
| | 6.71 | % | | 3,317 |
| | 7.71 | % | | 10.06 |
|
| | | | 4,906,511 |
| | 100.00 | % | | $ | 44,568 |
| | 100.00 | % | | $ | 9.66 |
| | | 4,902,381 |
| | 100.00 | % | | $ | 42,971 |
| | 100.00 | % | | $ | 9.53 |
|
Property Management and Leasing Strategy
We administer our property management and substantially all of our leasing activities and operating and administrative functions (including leasing, legal, acquisitions, development, data processing, finance and accounting). On-site functions such as maintenance, landscaping, sweeping, plumbing and electrical are subcontracted out at each location and, to the extent permitted by their respective leases, the cost of these functions is passed on to the tenants.
We believe that focused property management, leasing and customer retention are essential to maximizing the sales per square foot, operating cash flow and value of our properties. Our primary goal in property management is to maintain an attractive shopping environment on a cost effective basis for our tenants.
The majority of our property management and leasing functions are supervised and administered by us. We maintain regular contact with our tenants and frequently visit each asset to ensure the proper implementation and execution of our market strategies. As part of our ongoing property management, we conduct regular physical property reviews to improve our properties, react to changing market conditions and ensure proper maintenance.
Our leasing representatives have become experienced in the markets in which we operate by becoming familiar with current tenants as well as potential local, regional and national tenants that would complement our current tenant base. We study demographics, customer sales and merchandising mix to optimize the sales performance of our centers and thereby increase rents. We believe this hands-on approach maximizes the value of our shopping centers.
Depreciation
The following table sets forth depreciation information for our properties, including assets held for sale, as of December 31, 2016.2017. | | | | Federal Tax
Basis | | Depreciation
Rate | | Method of
Depreciation | | Useful Life
Claimed | Federal Tax
Basis | | Depreciation
Rate | | Method of
Depreciation | | Useful Life
Claimed |
| Shoppes at TJ Maxx | $ | 7,130,144 |
| | 4.05 | % | | Straight-Line | | 5-39 Years | $ | 7,273 |
| | 3.88 | % | | Straight-Line | | 5-39 Years |
| Walnut Hill Plaza | 3,606,700 |
| | 3.10 | % | | Straight-Line | | 5-39 Years | 3,607 |
| | 4.73 | % | | Straight-Line | | 5-39 Years |
| Lumber River Village | 4,489,610 |
| | 2.98 | % | | Straight-Line | | 5-39 Years | 4,490 |
| | 2.97 | % | | Straight-Line | | 5-39 Years |
| Perimeter Square | 5,318,340 |
| | 3.13 | % | | Straight-Line | | 5-39 Years | 5,559 |
| | 3.08 | % | | Straight-Line | | 5-39 Years |
| The Shoppes at Eagle Harbor | 4,477,700 |
| | 2.76 | % | | Straight-Line | | 5-39 Years | 4,478 |
| | 2.71 | % | | Straight-Line | | 5-39 Years |
| Riversedge North | 2,295,510 |
| | 2.58 | % | | Straight-Line | | 5-39 Years | 2,296 |
| | 2.57 | % | | Straight-Line | | 5-39 Years |
| Monarch Bank | 1,986,363 |
| | 2.90 | % | | Straight-Line | | 5-39 Years | 1,986 |
| | 2.90 | % | | Straight-Line | | 5-39 Years |
| Amscot Building | 492,828 |
| | 2.77 | % | | Straight-Line | | 5-39 Years | 493 |
| | 2.77 | % | | Straight-Line | | 5-39 Years |
| Twin City Crossing | 3,045,189 |
| | 3.16 | % | | Straight-Line | | 5-39 Years | 3,065 |
| | 3.13 | % | | Straight-Line | | 5-39 Years |
| Surrey Plaza | 1,856,515 |
| | 4.00 | % | | Straight-Line | | 5-39 Years | 1,857 |
| | 3.63 | % | | Straight-Line | | 5-39 Years |
| Tampa Festival | 6,988,042 |
| | 3.72 | % | | Straight-Line | | 5-39 Years | 7,306 |
| | 3.85 | % | | Straight-Line | | 5-39 Years |
| Forrest Gallery | 7,678,701 |
| | 3.79 | % | | Straight-Line | | 5-39 Years | 8,310 |
| | 3.23 | % | | Straight-Line | | 5-39 Years |
| Jenks Plaza | 917,898 |
| | 3.59 | % | | Straight-Line | | 5-39 Years | 995 |
| | 2.98 | % | | Straight-Line | | 5-39 Years |
| Winslow Plaza | 3,803,235 |
| | 4.68 | % | | Straight-Line | | 5-39 Years | 3,823 |
| | 4.07 | % | | Straight-Line | | 5-39 Years |
| Clover Plaza | 1,222,554 |
| | 2.88 | % | | Straight-Line | | 5-39 Years | 1,223 |
| | 2.84 | % | | Straight-Line | | 5-39 Years |
| St. George Plaza | 1,271,236 |
| | 3.18 | % | | Straight-Line | | 5-39 Years | 1,289 |
| | 3.05 | % | | Straight-Line | | 5-39 Years |
| South Square | 1,911,330 |
| | 2.62 | % | | Straight-Line | | 5-39 Years | 1,911 |
| | 2.56 | % | | Straight-Line | | 5-39 Years |
| Westland Square | 1,721,941 |
| | 2.80 | % | | Straight-Line | | 5-39 Years | 1,731 |
| | 2.75 | % | | Straight-Line | | 5-39 Years |
| Waterway Plaza | 1,252,534 |
| | 2.99 | % | | Straight-Line | | 5-39 Years | 1,259 |
| | 2.88 | % | | Straight-Line | | 5-39 Years |
| Cypress Shopping Center | 4,610,542 |
| | 2.94 | % | | Straight-Line | | 5-39 Years | 4,845 |
| | 3.14 | % | | Straight-Line | | 5-39 Years |
| Harrodsburg Marketplace | 2,484,653 |
| | 3.20 | % | | Straight-Line | | 5-39 Years | 2,485 |
| | 3.26 | % | | Straight-Line | | 5-39 Years |
| Port Crossing Shopping Center | 7,014,172 |
| | 4.61 | % | | Straight-Line | | 5-39 Years | 7,014 |
| | 4.55 | % | | Straight-Line | | 5-39 Years |
| LaGrange Marketplace | 2,649,323 |
| | 4.17 | % | | Straight-Line | | 5-39 Years | 2,655 |
| | 3.82 | % | | Straight-Line | | 5-39 Years |
| Freeway Junction | 6,754,803 |
| | 3.25 | % | | Straight-Line | | 5-39 Years | 6,768 |
| | 2.93 | % | | Straight-Line | | 5-39 Years |
| Graystone Crossing | 2,856,365 |
| | 2.84 | % | | Straight-Line | | 5-39 Years | 2,856 |
| | 2.77 | % | | Straight-Line | | 5-39 Years |
| Bryan Station | 2,756,142 |
| | 3.32 | % | | Straight-Line | | 5-39 Years | 2,813 |
| | 3.05 | % | | Straight-Line | | 5-39 Years |
| Crockett Square | 6,833,298 |
| | 3.21 | % | | Straight-Line | | 5-39 Years | 6,998 |
| | 3.15 | % | | Straight-Line | | 5-39 Years |
| Pierpont Centre | 9,263,152 |
| | 2.98 | % | | Straight-Line | | 5-39 Years | 9,231 |
| | 3.35 | % | | Straight-Line | | 5-39 Years |
| Alex City Marketplace | 7,849,638 |
| | 3.17 | % | | Straight-Line | | 5-39 Years | 8,563 |
| | 3.02 | % | | Straight-Line | | 5-39 Years |
| Butler Square | 6,411,277 |
| | 2.83 | % | | Straight-Line | | 5-39 Years | 6,433 |
| | 2.82 | % | | Straight-Line | | 5-39 Years |
| Brook Run Shopping Center | 13,363,644 |
| | 5.73 | % | | Straight-Line | | 5-39 Years | 13,394 |
| | 5.61 | % | | Straight-Line | | 5-39 Years |
| Brook Run Properties (1) | 7,686 |
| | — | % | | (1) | | (1) | 8 |
| | — | % | | (1) | | (1) |
| Laskin Road (1) | 203,829 |
| | — | % | | (1) | | (1) | 204 |
| | — | % | | (1) | | (1) |
| Beaver Ruin Village | 8,287,028 |
| | 3.14 | % | | Straight-Line | | 5-39 Years | 8,287 |
| | 3.07 | % | | Straight-Line | | 5-39 Years |
| Beaver Ruin Village II | 2,814,398 |
| | 2.93 | % | | Straight-Line | | 5-39 Years | 2,814 |
| | 2.80 | % | | Straight-Line | | 5-39 Years |
| Sunshine Shopping Plaza | 6,387,746 |
| | 3.24 | % | | Straight-Line | | 5-39 Years | 6,384 |
| | 3.19 | % | | Straight-Line | | 5-39 Years |
| Cardinal Plaza | 2,475,266 |
| | 3.53 | % | | Straight-Line | | 5-39 Years | 2,475 |
| | 3.48 | % | | Straight-Line | | 5-39 Years |
| Franklinton Square | 2,966,171 |
| | 4.36 | % | | Straight-Line | | 5-39 Years | 2,966 |
| | 3.70 | % | | Straight-Line | | 5-39 Years |
| Nashville Commons | 3,526,051 |
| | 3.53 | % | | Straight-Line | | 5-39 Years | 3,526 |
| | 3.20 | % | | Straight-Line | | 5-39 Years |
| Chesapeake Square | 4,394,007 |
| | 4.26 | % | | Straight-Line | | 5-39 Years | 4,426 |
| | 4.49 | % | | Straight-Line | | 5-39 Years |
| Grove Park Shopping Center | 4,589,698 |
| | 4.15 | % | | Straight-Line | | 5-39 Years | 4,590 |
| | 3.63 | % | | Straight-Line | | 5-39 Years |
| | | | Federal Tax Basis | | Depreciation Rate | | Method of Depreciation | | Useful Life Claimed | Federal Tax Basis | | Depreciation Rate | | Method of Depreciation | | Useful Life Claimed |
| Parkway Plaza | $ | 4,244,262 |
| | 3.18 | % | | Straight-Line | | 5-39 Years | $ | 4,244 |
| | 3.13 | % | | Straight-Line | | 5-39 Years |
| Conyers Crossing | 6,819,984 |
| | 4.09 | % | | Straight-Line | | 5-39 Years | 6,820 |
| | 4.00 | % | | Straight-Line | | 5-39 Years |
| Fort Howard Shopping Center | 7,350,084 |
| | 3.19 | % | | Straight-Line | | 5-39 Years | 7,369 |
| | 3.17 | % | | Straight-Line | | 5-39 Years |
| Columbia Fire House (1) | 671,798 |
| | — | % | | (1) | | (1) | 4,334 |
| | — | % | | (1) | | (1) |
| WHLR Macpherson, LLC (1) | 7,412 |
| | — | % | | (1) | | (1) | 7 |
| | — | % | | (1) | | (1) |
| LBP Lasalle, LLC (1) | 42,494 |
| | — | % | | (1) | | (1) | |
| LBP Milltown, LLC (1) | 196,009 |
| | — | % | | (1) | | (1) | 196 |
| | — | % | | (1) | | (1) |
| LBP Vauxhall, LLC (1) | 2,422 |
| | — | % | | (1) | | (1) | 1 |
| | — | % | | (1) | | (1) |
| LBP Hamburg, LLC (1) | 4,728 |
| | — | % | | (1) | | (1) | |
| Darien Shopping Center | 1,053,891 |
| | 3.23 | % | | Straight-Line | | 5-39 Years | 1,055 |
| | 3.10 | % | | Straight-Line | | 5-39 Years |
| Devine Street | 1,941,328 |
| | 2.94 | % | | Straight-Line | | 5-39 Years | 1,941 |
| | 2.79 | % | | Straight-Line | | 5-39 Years |
| Folly Road | 4,548,102 |
| | 2.98 | % | | Straight-Line | | 5-39 Years | 4,707 |
| | 2.77 | % | | Straight-Line | | 5-39 Years |
| Georgetown | 1,916,742 |
| | 3.06 | % | | Straight-Line | | 5-39 Years | 1,917 |
| | 2.94 | % | | Straight-Line | | 5-39 Years |
| Ladson Crossing | 3,920,233 |
| | 3.39 | % | | Straight-Line | | 5-39 Years | 3,958 |
| | 3.17 | % | | Straight-Line | | 5-39 Years |
| Lake Greenwood Crossing | 2,499,295 |
| | 3.08 | % | | Straight-Line | | 5-39 Years | 2,499 |
| | 2.92 | % | | Straight-Line | | 5-39 Years |
| Lake Murray | 1,537,005 |
| | 4.01 | % | | Straight-Line | | 5-39 Years | 1,537 |
| | 3.85 | % | | Straight-Line | | 5-39 Years |
| Litchfield Market Village | 6,581,014 |
| | 3.60 | % | | Straight-Line | | 5-39 Years | 6,581 |
| | 3.38 | % | | Straight-Line | | 5-39 Years |
| Moncks Corner | 1,109,345 |
| | 3.20 | % | | Straight-Line | | 5-39 Years | 1,109 |
| | 3.07 | % | | Straight-Line | | 5-39 Years |
| Ridgeland | 376,154 |
| | 3.78 | % | | Straight-Line | | 5-39 Years | 376 |
| | 3.63 | % | | Straight-Line | | 5-39 Years |
| Shoppes at Myrtle Park | 5,360,320 |
| | 3.28 | % | | Straight-Line | | 5-39 Years | 5,371 |
| | 3.05 | % | | Straight-Line | | 5-39 Years |
| South Lake | 2,025,143 |
| | 4.00 | % | | Straight-Line | | 5-39 Years | 2,025 |
| | 3.63 | % | | Straight-Line | | 5-39 Years |
| South Park | 2,966,711 |
| | 3.09 | % | | Straight-Line | | 5-39 Years | 2,972 |
| | 2.97 | % | | Straight-Line | | 5-39 Years |
| St. Matthews | 1,940,823 |
| | 3.17 | % | | Straight-Line | | 5-39 Years | 1,946 |
| | 2.79 | % | | Straight-Line | | 5-39 Years |
| Berkley Shopping Center | 2,865,073 |
| | 4.33 | % | | Straight-Line | | 5-39 Years | 2,856 |
| | 3.60 | % | | Straight-Line | | 5-39 Years |
| Sangaree Plaza | 2,940,347 |
| | 5.81 | % | | Straight-Line | | 5-39 Years | 2,957 |
| | 5.04 | % | | Straight-Line | | 5-39 Years |
| Tri-County Plaza | 3,421,233 |
| | 5.43 | % | | Straight-Line | | 5-39 Years | 3,421 |
| | 4.45 | % | | Straight-Line | | 5-39 Years |
| Riverbridge Shopping Center | 5,384,071 |
| | 4.46 | % | | Straight-Line | | 5-39 Years | 5,384 |
| | 3.33 | % | | Straight-Line | | 5-39 Years |
| Laburnum Square | 5,928,511 |
| | 4.06 | % | | Straight-Line | | 5-39 Years | 5,980 |
| | 3.17 | % | | Straight-Line | | 5-39 Years |
| Franklin Village | 9,425,632 |
| | 5.42 | % | | Straight-Line | | 5-39 Years | 9,426 |
| | 2.93 | % | | Straight-Line | | 5-39 Years |
| Village at Martinsville | 12,879,497 |
| | — | % | | Straight-Line | | 5-39 Years | 12,882 |
| | 3.45 | % | | Straight-Line | | 5-39 Years |
| New Market Crossing | 5,216,464 |
| | — | % | | Straight-Line | | 5-39 Years | 5,232 |
| | 3.24 | % | | Straight-Line | | 5-39 Years |
| Rivergate Shopping Center | 31,696,747 |
| | — | % | | Straight-Line | | 5-39 Years | 30,704 |
| | 3.07 | % | | Straight-Line | | 5-39 Years |
| Wheeler Real Estate, LLC | 53,541 |
| | 10.20 | % | | Straight-Line | | 5-39 Years | 54 |
| | 10.42 | % | | Straight-Line | | 5-39 Years |
| Wheeler Interests, LLC | 8,734 |
| | 19.33 | % | | Straight-Line | | 5-39 Years | 9 |
| | 23.11 | % | | Straight-Line | | 5-39 Years |
| Wheeler Real Estate Investment Trust, Inc. | 489,411 |
| | 16.62 | % | | Straight-Line | | 5-39 Years | 487 |
| | 18.38 | % | | Straight-Line | | 5-39 Years |
| Wheeler REIT, LP | 53,606 |
| | 4.72 | % | | Straight-Line | | 5-39 Years | — |
| | — | % | | Straight-Line | | 5-39 Years |
| | $ | 307,443,425 |
| | | | $ | 313,043 |
| | | |
(1) Amount consists of assets not yet placed in service.
Item 3. Legal Proceedings.
We are subject to various legal proceedings and claims that arise in the ordinary course of business. These matters are generally covered by insurance. While the resolution of these matters cannot be predicted with certainty, management believes the final outcome of such matters will not have a material adverse effect on our financial position, results of operations or liquidity.
Item 4. Mine Safety Disclosures.
Not applicable.
Part II
Item 5. Market for Registrant’s Common Equity, Related Shareholder Matters and Issuer Purchases of Equity Securities.
Market Information.
Our Common Stock is traded on the NASDAQ Capital Market under the symbol “WHLR”. On February 27, 2017,March 5, 2018, the closing price of our Common Stock reported on the NASDAQ Capital Market was $1.83$4.95 per share. All per share amounts for all periods presented reflect our Reverse Stock Split, which was effective March 31, 2017. The high and low Common Stock sales prices per share during the periods indicated were as follows:
| | Price per share of Common Stock: | | Quarter Ended | Mar. 31 | | June 30 | | Sept. 30 | | Dec. 31 | | Year | Mar. 31 | | June 30 | | Sept. 30 | | Dec. 31 | | Year |
| Fiscal Year 2016 | | | | | | | | | | |
| Fiscal Year 2017 | | | | | | | | | | |
| High | $ | 1.93 |
| | $ | 1.60 |
| | $ | 1.95 |
| | $ | 1.80 |
| | $ | 1.95 |
| $ | 14.64 |
| | $ | 14.40 |
| | $ | 12.07 |
| | $ | 12.30 |
| | $ | 14.64 |
|
| Low | $ | 1.10 |
| | $ | 1.20 |
| | $ | 1.54 |
| | $ | 1.50 |
| | $ | 1.10 |
| $ | 13.28 |
| | $ | 7.95 |
| | $ | 9.63 |
| | $ | 8.18 |
| | $ | 7.95 |
|
| | | | | | | | | | | | | | | | | | | |
| Quarter Ended | | | | | | | | | | | | | | | | | | |
| Fiscal Year 2015 | | | | | | | | | | |
| Fiscal Year 2016 | | | | | | | | | | |
| High | $ | 4.14 |
| | $ | 2.45 |
| | $ | 2.10 |
| | $ | 2.03 |
| | $ | 4.14 |
| $ | 15.44 |
| | $ | 12.80 |
| | $ | 15.60 |
| | $ | 14.40 |
| | $ | 15.60 |
|
| Low | $ | 2.27 |
| | $ | 1.98 |
| | $ | 1.68 |
| | $ | 1.60 |
| | $ | 1.60 |
| $ | 8.80 |
| | $ | 9.60 |
| | $ | 12.32 |
| | $ | 12.00 |
| | $ | 8.80 |
|
Our Series B Preferred Stock is traded on the NASDAQ Capital Market under the symbol “WHLRP”. On February 27, 2017,March 5, 2018, the closing price of our Series B Preferred Stock reported on the NASDAQ Capital Market was $24.68$13.98 per share. Our Series B Preferred Stock began trading on April 30, 2014. The high and low Preferred Stock sales prices per share during the periods indicated were as follows:
| | Price per share of Series B Preferred Stock: | | Quarter Ended | Mar. 31 | | June 30 | | Sept. 30 | | Dec. 31 | | Year | Mar. 31 | | June 30 | | Sept. 30 | | Dec. 31 | | Year |
| Fiscal Year 2016 | | | | | | | | | | |
| Fiscal Year 2017 | | | | | | | | | | |
| High | $ | 23.14 |
| | $ | 22.13 |
| | $ | 22.22 |
| | $ | 23.00 |
| | $ | 23.14 |
| $ | 24.89 |
| | $ | 24.76 |
| | $ | 23.12 |
| | $ | 22.65 |
| | $ | 24.89 |
|
| Low | $ | 16.52 |
| | $ | 18.48 |
| | $ | 20.78 |
| | $ | 20.63 |
| | $ | 16.52 |
| $ | 22.13 |
| | $ | 19.51 |
| | $ | 20.68 |
| | $ | 17.69 |
| | $ | 17.69 |
|
| | | | | | | | | | | | | | | | | | | |
| Quarter Ended | | | | | | | | | | | | | | | | | | |
| Fiscal Year 2015 | | | | | | | | | | |
| Fiscal Year 2016 | | | | | | | | | | |
| High | $ | 24.96 |
| | $ | 25.45 |
| | $ | 24.56 |
| | $ | 23.50 |
| | $ | 25.45 |
| $ | 23.14 |
| | $ | 22.13 |
| | $ | 22.22 |
| | $ | 23.00 |
| | $ | 23.14 |
|
| Low | $ | 18.75 |
| | $ | 23.02 |
| | $ | 22.05 |
| | $ | 22.13 |
| | $ | 18.75 |
| $ | 16.52 |
| | $ | 18.48 |
| | $ | 20.78 |
| | $ | 20.63 |
| | $ | 16.52 |
|
Our Series D Preferred Stock is traded on the NASDAQ Capital Market under the symbol “WHLRD”. On February 27, 2017,March 5, 2018, the closing price of our Series D Preferred Stock reported on the NASDAQ Capital Market was $25.60$16.60 per share. Our Series D Preferred Stock began trading on September 21, 2016. The high and low Preferred Stock sales prices per share during the periods indicated were as follows:
| | Price per share of Series D Preferred Stock: | | Quarter Ended | Mar. 31 | | June 30 | | Sept. 30 | | Dec. 31 | | Year | Mar. 31 | | June 30 | | Sept. 30 | | Dec. 31 | | Year |
| Fiscal Year 2017 | | | | | | | | | | |
| High | | $ | 26.10 |
| | $ | 26.44 |
| | $ | 26.50 |
| | $ | 22.84 |
| | $ | 26.50 |
|
| Low | | $ | 23.12 |
| | $ | 21.99 |
| | $ | 21.60 |
| | $ | 19.02 |
| | $ | 19.02 |
|
| | | | | | | | | | | |
| Quarter Ended | | | | | | | | | | |
| Fiscal Year 2016 | | | | | | | | | | | | | | | |
| High | N/A | | N/A | | $ | 25.50 |
| | $ | 25.50 |
| | $ | 25.50 |
| N/A |
| | N/A |
| | $ | 25.50 |
| | $ | 25.50 |
| | $ | 25.50 |
|
| Low | N/A | | N/A | | $ | 24.50 |
| | $ | 23.01 |
| | $ | 23.01 |
| N/A |
| | N/A |
| | $ | 24.50 |
| | $ | 23.01 |
| | $ | 23.01 |
|
| | | | | | | | |
Total Stockholder Return Graph
The following graph sets forth the cumulative total stockholder return on Wheeler’s common shares, assuming reinvestment of dividends, to our stockholders duringfor the period November 16, 2012, the date our Common Stock began trading on the New York Stock Exchange, throughfive years ending December 31, 2016,2017, in comparison to cumulative total stockholder returns for the Russell 2000 Index Total Return and the index of equity real estate investments trusts prepared by the National Association of Real Estate Investment Trusts (“NAREIT”). The stock performance graph assumes that $100 was invested on November 16, 2012. The FTSE NAREIT All Equity Index Total Return includes all tax qualified real estate investment trusts with more than 50% of total assets in qualifying real estate assets other than mortgage secured by real property. The information in this paragraph and the following graph shall not be deemed to be “soliciting material” or to be “filed” with the SEC or subject to Regulation 14A or 14C, other than as provided in Item 201 of Regulation S-K, or to the liabilities of Section 18 of the Exchange Act, except to the extent we specifically request that such information be treated as soliciting material or specifically incorporate it by reference into a filing under the Securities Act or the Exchange Act.
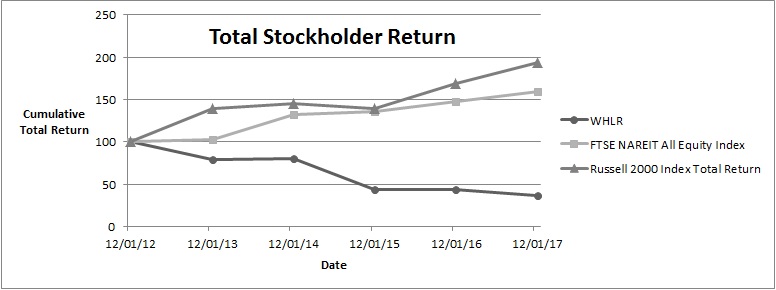
| | | | Cumulative Total Return for the Period Ending | Cumulative Total Return for the Period Ending |
| Index | 11/16/12 | | 12/31/12 | | 12/31/13 | | 12/31/14 | | 12/31/15 | | 12/31/16 | 12/31/12 | | 12/31/13 | | 12/31/14 | | 12/31/15 | | 12/31/16 | | 12/31/17 |
| WHLR | $ | 100 |
| | $ | 118.31 |
| | $ | 89.26 |
| | $ | 90.33 |
| | $ | 49.03 |
| | $ | 49.56 |
| $ | 100.00 |
| | $ | 78.64 |
| | $ | 79.58 |
| | $ | 43.19 |
| | $ | 43.66 |
| | $ | 36.39 |
|
| Russell 2000 | 100 |
| | 109.71 |
| | 152.31 |
| | 159.76 |
| | 152.71 |
| | 185.25 |
| 100.00 |
| | 138.82 |
| | 145.62 |
| | 139.19 |
| | 168.85 |
| | 193.58 |
|
| FTSE NAREIT All Equity Index | 100 |
| | 106.74 |
| | 109.78 |
| | 140.55 |
| | 144.52 |
| | 157.00 |
| 100.00 |
| | 102.86 |
| | 131.68 |
| | 135.40 |
| | 147.09 |
| | 159.85 |
|
Approximate Number of Holders of Our Common Shares
As of February 27, 2017March 5, 2018 there were 176178 holders of record of our common shares, 0 holders of our Series B preferredPreferred Stock shares, and 0 holders of our Series D Preferred Stock. These numbers exclude our Common Stock, Series B Preferred Stock and Series D Preferred Stock owned by shareholders holding under nominee security position listings.
Dividend Policy
We pay cashIn the second quarter of 2017 we began paying dividends to holders of our Common Stock on a monthly basis. Starting as early as April 2017, the Company plans to declare and pay cash dividends to common stockholders on a quarterly basis. Prior to this time we paid monthly dividends. We intend to make quarterly dividend distributions that will enable us to meet the distribution requirements applicable to REITs and to eliminate or minimize our obligation to pay income and excise taxes. We may in the future also choose to pay dividends in shares of our Common Stock. While we intendThe Board of Directors determined to maintainsuspend the annual $0.21 per shareCommon Stock dividend that we currently pay for the foreseeable future, our current cash flow does not support this amount. Accordingly, we may be forced to reduce the annual dividend if the cash flow deficit continues for an extended periodremainder of time.2018. See “Management’s Discussion and Analysis of Financial Condition and Results of Operations-Future Liquidity Needs.”
Dividend Payments
We have made dividend payments to holders of our Common Stock and holders of common units in our Operating Partnership as follows in 2017 and 2016, and 2015:all periods presented adjusted for our Reverse Stock Split, which was effective March 31, 2017:
|
| | | | | | | |
| Dividend Period | Record Date | | Payment Date | | Payment Amount per Share or Unit |
| January 1, 2017 - January 31, 2017 | 1/31/2017 | | 2/28/2017 | | $ | 0.1400 |
|
| February 1, 2017 - February 28, 2017 | 2/28/2017 | | 3/31/2017 | | $ | 0.1400 |
|
| March 1, 2017 - March 31, 2017 | 3/31/2017 | | 4/28/2017 | | $ | 0.1400 |
|
| April 1, 2017 - June 30, 2017 | 6/30/2017 | | 7/15/2017 | | $ | 0.3400 |
|
| July 1, 2017 - September 30, 2017 | 9/29/2017 | | 10/15/2017 | | $ | 0.3400 |
|
| October 1, 2017 - December 31, 2017 | 12/28/2017 | | 1/15/2018 | | $ | 0.3400 |
|
| | | Dividend Period | Record Date | | Payment Date | | Payment Amount per Share or Unit | Record Date | | Payment Date | | Payment Amount per Share or Unit |
| January 1, 2016 - January 31, 2016 | 1/31/2016 | | 2/29/2016 | | $ | 0.0175 |
| 1/31/2016 | | 2/29/2016 | | $ | 0.1400 |
|
| February 1, 2016 - February 29, 2016 | 2/29/2016 | | 3/31/2016 | | $ | 0.0175 |
| 2/29/2016 | | 3/31/2016 | | $ | 0.1400 |
|
| March 1, 2016 - March 31, 2016 | 3/31/2016 | | 4/30/2016 | | $ | 0.0175 |
| 3/31/2016 | | 4/30/2016 | | $ | 0.1400 |
|
| April 1, 2016 - April 30, 2016 | 4/30/2016 | | 5/31/2016 | | $ | 0.0175 |
| 4/30/2016 | | 5/31/2016 | | $ | 0.1400 |
|
| May 1, 2016 - May 31, 2016 | 5/31/2016 | | 6/30/2016 | | $ | 0.0175 |
| 5/31/2016 | | 6/30/2016 | | $ | 0.1400 |
|
| June 1, 2016 - June 30, 2016 | 6/30/2016 | | 7/31/2016 | | $ | 0.0175 |
| 6/30/2016 | | 7/31/2016 | | $ | 0.1400 |
|
| July 1, 2016 - July 31, 2016 | 7/31/2016 | | 8/31/2016 | | $ | 0.0175 |
| 7/31/2016 | | 8/31/2016 | | $ | 0.1400 |
|
| August 1, 2016 - August 31, 2016 | 8/31/2016 | | 9/30/2016 | | $ | 0.0175 |
| 8/31/2016 | | 9/30/2016 | | $ | 0.1400 |
|
| September 1, 2016 - September 30, 2016 | 9/30/2016 | | 10/31/2016 | | $ | 0.0175 |
| 9/30/2016 | | 10/31/2016 | | $ | 0.1400 |
|
| October 1, 2016 - October 31, 2016 | 10/31/2016 | | 11/30/2016 | | $ | 0.0175 |
| 10/31/2016 | | 11/30/2016 | | $ | 0.1400 |
|
| November 1, 2016 - November 30, 2016 | 11/30/2016 | | 12/30/2016 | | $ | 0.0175 |
| 11/30/2016 | | 12/30/2016 | | $ | 0.1400 |
|
| December 1, 2016 - December 31, 2016 | 12/30/2016 | | 1/29/2017 | | $ | 0.0175 |
| 12/30/2016 | | 1/29/2017 | | $ | 0.1400 |
|
|
| | | | | | | |
| Dividend Period | Record Date | | Payment Date | | Payment Amount per Share or Unit |
| January 1, 2015 - January 31, 2015 | 1/31/2015 | | 2/28/2015 | | $ | 0.0350 |
|
| February 1, 2015 - February 28, 2015 | 2/28/2015 | | 3/31/2015 | | $ | 0.0350 |
|
| March 1, 2015 - March 31, 2015 | 3/31/2015 | | 4/30/2015 | | $ | 0.0175 |
|
| April 1, 2015 - April 30, 2015 | 4/30/2015 | | 5/31/2015 | | $ | 0.0175 |
|
| May 1, 2015 - May 31, 2015 | 5/31/2015 | | 6/30/2015 | | $ | 0.0175 |
|
| June 1, 2015 - June 30, 2015 | 6/30/2015 | | 7/31/2015 | | $ | 0.0175 |
|
| July 1, 2015 - July 31, 2015 | 7/31/2015 | | 8/31/2015 | | $ | 0.0175 |
|
| August 1, 2015 - August 31, 2015 | 8/31/2015 | | 9/30/2015 | | $ | 0.0175 |
|
| September 1, 2015 - September 30, 2015 | 9/30/2015 | | 10/31/2015 | | $ | 0.0175 |
|
| October 1, 2015 - October 31, 2015 | 10/31/2015 | | 11/30/2015 | | $ | 0.0175 |
|
| November 1, 2015 - November 30, 2015 | 11/30/2015 | | 12/31/2015 | | $ | 0.0175 |
|
| December 1, 2015 - December 31, 2015 | 12/31/2015 | | 1/31/2016 | | $ | 0.0175 |
|
We have made dividend payments to holders of our Series B Preferred Stock as follows in 20162017 and 2015:2016:
|
| | | | | | | |
| Dividend Period | Record Date | | Payment Date | | Payment Amount
per Share or Unit |
| January 1, 2016 - March 31, 2016 | 3/31/2016 | | 4/15/2016 | | $ | 0.5625 |
|
| April 1, 2016 - June 30, 2016 | 6/30/2016 | | 7/15/2016 | | $ | 0.5625 |
|
| July 1, 2016 - September 30, 2016 | 9/30/2016 | | 10/15/2016 | | $ | 0.5625 |
|
| October 1, 2016 - December 31, 2016 | 12/30/2016 | | 1/15/2017 | | $ | 0.5625 |
|
|
| | | | | | | |
| Dividend Period | Record Date | | Payment Date | | Payment Amount
per Share or Unit |
| January 1, 2017 - March 31, 2017 | 3/31/2017 | | 4/15/2017 | | $ | 0.5625 |
|
| April 1, 2017 - June 30, 2017 | 6/30/2017 | | 7/15/2017 | | $ | 0.5625 |
|
| July 1, 2017 - September 30, 2017 | 9/29/2017 | | 10/15/2017 | | $ | 0.5625 |
|
| October 1, 2017 - December 31, 2017 | 12/30/2017 | | 1/15/2018 | | $ | 0.5625 |
|
|
| | | | | | | |
| Dividend Period | Record Date | | Payment Date | | Payment Amount
per Share or Unit |
| January 1, 2015 - March 31, 2015 | 3/31/2015 | | 4/15/2015 | | $ | 0.5625 |
|
| April 1, 2015 - June 30, 2015 | 6/30/2015 | | 7/15/2015 | | $ | 0.5625 |
|
| July 1, 2015- September 30, 2015 | 9/30/2015 | | 10/15/2015 | | $ | 0.5625 |
|
| October 1, 2015 - December 31, 2015 | 12/31/2015 | | 1/15/2016 | | $ | 0.5625 |
|
|
| | | | | | | |
| Dividend Period | Record Date | | Payment Date | | Payment Amount
per Share or Unit |
| January 1, 2016 - March 31, 2016 | 3/31/2016 | | 4/15/2016 | | $ | 0.5625 |
|
| April 1, 2016 - June 30, 2016 | 6/30/2016 | | 7/15/2016 | | $ | 0.5625 |
|
| July 1, 2016 - September 30, 2016 | 9/30/2016 | | 10/15/2016 | | $ | 0.5625 |
|
| October 1, 2016 - December 31, 2016 | 12/30/2016 | | 1/15/2017 | | $ | 0.5625 |
|
We have made dividend payments to holders of our Series D Preferred Stock as follows in 2017 and 2016 (1):
|
| | | | | | | |
| Dividend Period | Record Date | | Payment Date | | Payment Amount
per Share or Unit |
| January 1, 2017 - March 31, 2017 | 3/31/2017 | | 4/15/2017 | | $ | 0.5469 |
|
| April 1, 2017 - June 30, 2017 | 6/30/2017 | | 7/15/2017 | | $ | 0.5469 |
|
| July 1, 2017 - September 30, 2017 | 9/29/2017 | | 10/15/2017 | | $ | 0.5469 |
|
| October 1, 2017 - December 31, 2017 | 12/30/2017 | | 1/15/2018 | | $ | 0.5469 |
|
|
| | | | | | | |
| Dividend Period | Record Date | | Payment Date | | Payment Amount
per Share or Unit |
| January 1, 2016 - March 31, 2016 | 3/31/2016 | | 4/15/2016 | | $ | — |
|
| April 1, 2016 - June 30, 2016 | 6/30/2016 | | 7/15/2016 | | $ | — |
|
| July 1, 2016 - September 30, 2016 | 9/30/2016 | | 10/15/2016 | | $ | 0.0608 |
|
| October 1, 2016 - December 31, 2016 | 12/30/2016 | | 1/15/2017 | | $ | 0.5469 |
|
(1) There is no dividend history for the Series D Preferred Stock prior to September 21, 2016 because it was not issued until September 21, 2016.
Security Authorized For Issuance Under Equity Compensation Plan
The following table sets forth information as of December 31, 2016 regarding our compensation plans and the Common Stock we may issue under the plan.
|
| | | | | | | | |
Equity Compensation Plan Information Table |
Plan Category | Number of securities to be issued upon exercise of outstanding options, warrants and rights | | Weighted-average exercise price of outstanding options, warrants and rights | | Number of securities remaining available for future issuance under equity compensation plans |
Equity compensation plans approved by stockholders (1)
| — |
| | — |
| | 5,383,742 |
|
Equity compensation plans not approved by stockholders | — |
| | — |
| | — |
|
Total | — |
| | — |
| | 5,383,742 |
|
(1) Includes our 2015 and 2016 Long-Term Incentive Plans, which authorized a maximum of 1,000,000 and 5,000,000 shares, respectively, of our Common Stock for issue. Awards are granted by the Compensation Committee.
Item 6. Selected Financial Data.
The following selected historical consolidated financial information should be read in conjunction with “Management’s Discussion and Analysis of Financial Condition and Results of Operations” and the historical consolidated financial statements as of December 31, 20162017 and 20152016 and for each of the years in the three-year period ended December 31, 20162017 and the related notes included elsewhere in this Annual Report on Form 10-K, as adoptions of new ASU's have been considered when presenting prior period amounts. All per share amounts, common units amounts for all periods presented reflect our one-for-eight reverse stock split (the “Reverse Stock Split”), which was effective March 31, 2017.
We completed our initial public offering on November 16, 2012. The selected historical consolidated financial information as of and for the years ended December 31, 2017, 2016, 2015, 2014 2013 and 20122013 has been derived from our audited historical financial statements, except for FFO and AFFO. Due to the timing of the initial public offering, the 2012 financials include Wheeler Real Estate Investment Trust, Inc., the Operating Partnership, the original eight entities included in the REIT formation along with the three entities acquired during 2012.
| | | | | Year Ended December 31, | | Year Ended December 31, |
| Operating Data: | Operating Data: | 2016 | | 2015 | | 2014 | | 2013 | | 2012 | Operating Data: | 2017 | | 2016 | | 2015 | | 2014 | | 2013 |
| | | | (in thousands, except per share data) |
| | Total Revenues | $ | 44,160,408 |
| | $ | 27,615,458 |
| | $ | 14,850,778 |
| | $ | 7,611,023 |
| | $ | 2,416,971 |
| Total Revenues | $ | 58,535 |
| | $ | 44,160 |
| | $ | 27,615 |
| | $ | 14,851 |
| | $ | 7,611 |
|
| | Operating Loss | (291,136 | ) | | (12,452,283 | ) | | (6,168,241 | ) | | (1,750,950 | ) | | (244,544 | ) | Operating Income (Loss) | 542 |
| | (291 | ) | | (12,452 | ) | | (6,168 | ) | | (1,751 | ) |
| | Net Loss from Continuing Operations | (13,062,774 | ) | | (21,377,297 | ) | | (12,053,474 | ) | | (3,857,915 | ) | | (1,205,472 | ) | Net Loss from Continuing Operations | (14,296 | ) | | (13,062 | ) | | (21,377 | ) | | (12,053 | ) | | (3,858 | ) |
| | Net Income (Loss) from Discontinued Operations | 824,748 |
| | 2,603,895 |
| | 307,659 |
| | (517,311 | ) | | (185 | ) | Net Income (Loss) from Discontinued Operations | 1,518 |
| | 824 |
| | 2,604 |
| | 308 |
| | (517 | ) |
| | Net Loss | (12,238,026 | ) | | (18,773,402 | ) | | (11,745,815 | ) | | (4,375,226 | ) | | (1,205,657 | ) | Net Loss | (12,778 | ) | | (12,238 | ) | | (18,773 | ) | | (11,745 | ) | | (4,375 | ) |
| | Net loss attributable to noncontrolling interests | (1,035,456 | ) | | (1,252,723 | ) | | (1,195,560 | ) | | (714,972 | ) | | (43,880 | ) | Net loss attributable to noncontrolling interests | (684 | ) | | (1,035 | ) | | (1,253 | ) | | (1,195 | ) | | (715 | ) |
| | Net Loss Attributable to Wheeler REIT | (11,202,570 | ) | | (17,520,679 | ) | | (10,550,255 | ) | | (3,660,254 | ) | | (1,161,777 | ) | Net Loss Attributable to Wheeler REIT | (12,094 | ) | | (11,203 | ) | | (17,520 | ) | | (10,550 | ) | | (3,660 | ) |
| | Net Loss Attributable to Wheeler REIT Common Shareholders | (15,915,739 | ) | | (103,792,717 | ) | | (13,268,512 | ) | | (3,801,672 | ) | | (1,161,777 | ) | Net Loss Attributable to Wheeler REIT Common Shareholders | (22,063 | ) | | (15,916 | ) | | (103,793 | ) | | (13,269 | ) | | (3,802 | ) |
| | | | | | | | | | | | | | | | | | | | | |
| | Loss per share from continuing operations (basis and diluted) | $ | (0.25 | ) | | $ | (2.73 | ) | | $ | (1.83 | ) | | $ | (0.74 | ) | | $ | (0.35 | ) | Loss per share from continuing operations (basis and diluted) | $ | (2.70 | ) | | $ | (1.98 | ) | | $ | (21.78 | ) | | $ | (14.71 | ) | | $ | (5.96 | ) |
| | Income (loss) per share from discontinued operations | 0.01 |
| | 0.06 |
| | 0.03 |
| | (0.08 | ) | | 0.00 |
| Income (loss) per share from discontinued operations | 0.16 |
| | 0.09 |
| | 0.46 |
| | 0.27 |
| | (0.62 | ) |
| | | (0.24 | ) | | (2.67 | ) | | (1.80 | ) | | (0.82 | ) | | (0.35 | ) | | (2.54 | ) | | (1.89 | ) | | (21.32 | ) | | (14.44 | ) | | (6.58 | ) |
| | | | | | | | | | | | | | | | | | | | | |
| | Weighted-average number of shares (basic and diluted) | 67,362,991 |
| | 38,940,463 |
| | 7,352,433 |
| | 4,620,600 |
| | 3,301,502 |
| Weighted-average number of shares (basic and diluted) | 8,654,240 |
| | 8,420,374 |
| | 4,867,559 |
| | 919,054 |
| | 577,575 |
|
| | Dividends declared per common share | $ | 0.21 |
| | $ | 0.23 |
| | $ | 0.42 |
| | $ | 0.48 |
| | $ | — |
| Dividends declared per common share | $ | 1.44 |
| | $ | 1.68 |
| | $ | 1.82 |
| | $ | 3.37 |
| | $ | 3.81 |
|
| | | | | | | | | | | | | | | | | | | | | |
| Balance Sheet Data: | Balance Sheet Data: | | | | | | | | | | Balance Sheet Data: | | | | | | | | | |
| | Investment properties, net | $ | 388,880,290 |
| | $ | 238,764,631 |
| | $ | 128,994,061 |
| | $ | 77,894,756 |
| | $ | 39,380,841 |
| Investment properties, net | $ | 384,334 |
| | $ | 388,880 |
| | $ | 238,765 |
| | $ | 128,994 |
| | $ | 77,895 |
|
| | Assets held for sale | 365,880 |
| | 1,692,473 |
| | 26,780,912 |
| | 27,586,432 |
| | 4,584,663 |
| Assets held for sale | — |
| | 366 |
| | 1,692 |
| | 26,781 |
| | 27,586 |
|
| | Total Assets | 489,046,335 |
| | 309,243,242 |
| | 201,454,223 |
| | 123,624,949 |
| | 51,717,739 |
| Total Assets | 457,674 |
| | 489,046 |
| | 309,243 |
| | 201,454 |
| | 123,625 |
|
| | Loans payable | 305,972,679 |
| | 184,629,082 |
| | 119,094,005 |
| | 72,716,927 |
| | 27,827,432 |
| Loans payable, net | 308,122 |
| | 305,973 |
| | 184,629 |
| | 119,094 |
| | 72,717 |
|
| | Liabilities associated with assets held for sale | 1,350,000 |
| | 1,992,318 |
| | 18,968,920 |
| | 19,008,800 |
| | 3,342,449 |
| Liabilities associated with assets held for sale | — |
| | 1,350 |
| | 1,992 |
| | 18,969 |
| | 19,009 |
|
| | Series D cumulative convertible Preferred Stock | 52,530,051 |
| | — |
| | — |
| | — |
| | — |
| Series D Cumulative Convertible Preferred Stock | 53,236 |
| | 52,530 |
| | — |
| | — |
| | — |
|
| | | | | | | | | | | | | | | | | | | | | |
| Other Data: | Other Data: | | | | | | | | | | Other Data: | | | | | | | | | |
| | Funds from Operations (a) | $ | 7,710,625 |
| | $ | (3,415,163 | ) | | $ | (3,525,325 | ) | | $ | (908,269 | ) | | $ | (383,505 | ) | Funds from Operations (a) | $ | 10,930 |
| | $ | 7,711 |
| | $ | (3,415 | ) | | $ | (3,525 | ) | | $ | (908 | ) |
| | Adjusted Funds From Operations (b) | 8,668,449 |
| | 848,269 |
| | (1,426,894 | ) | | 648,149 |
| | (404,866 | ) | Adjusted Funds From Operations (b) | 12,261 |
| | 8,670 |
| | 847 |
| | (1,427 | ) | | 648 |
|
| | Net cash from operating activities | 10,442,931 |
| | (5,326,113 | ) | | (2,475,947 | ) | | 1,109,511 |
| | 677,039 |
| Net cash from operating activities | 24,761 |
| | 10,442 |
| | (5,326 | ) | | (2,476 | ) | | 1,110 |
|
| | Net cash from investing activities | (60,537,298 | ) | | (54,859,005 | ) | | (19,595,047 | ) | | (24,280,774 | ) | | (9,009,568 | ) | Net cash from investing activities | (2,979 | ) | | (60,537 | ) | | (54,859 | ) | | (19,595 | ) | | (24,281 | ) |
| | Net cash from financing activities | 44,480,163 |
| | 60,822,853 |
| | 30,844,017 |
| | 22,227,277 |
| | 10,276,031 |
| Net cash from financing activities | (22,968 | ) | | 44,480 |
| | 60,823 |
| | 30,844 |
| | 22,227 |
|
| | | | | | | | | | | | | | | | | | | | | |
| |
| (a) | We completed our initial public offering on November 16, 2012. The selected historical consolidated financial information as of and for the years ended December 31, 2016, 2015, 2014, 2013 and 2012 has been derived from our audited historical financial statements, except for FFO and AFFO. Due to the timing of the initial public offering, the 2012 financials include Wheeler Real Estate Investment Trust, Inc., the Operating Partnership, the original eight entities included in the REIT formation along with the three entities acquired during 2012. We use Funds from Operations ("FFO"), a non-GAAP measure, as an alternative measure of our operating performance, specifically as it relates to results of operations and liquidity. We compute FFO in accordance with standards established by the Board of Governors of NAREIT in its March 1995 White Paper (as amended in November 1999 and April 2002). As defined by NAREIT, FFO represents net income (computed in accordance with GAAP), excluding gains (or losses) from sales of property, plus real estate related depreciation and amortization (excluding amortization of loan origination costs) and after adjustments for unconsolidated partnerships and joint ventures. Most industry analysts and equity REITs, including us, consider FFO to be an appropriate supplemental measure of operating performance because, by excluding gains or losses on dispositions and excluding depreciation and amortization, FFO is a helpful tool that can assist in the comparison of the operating performance of a company’s real estate between periods, or as compared to different companies. Management uses FFO as a supplemental measure to conduct and evaluate our business because there are certain limitations associated with using GAAP net income alone as the primary measure of our operating performance. Historical cost accounting for real estate assets in accordance with GAAP implicitly assumes that the value of real estate assets diminishes predictably over time, while historically real estate values have risen or fallen with market conditions. Accordingly, we believe FFO provides a valuable alternative measurement tool to GAAP when presenting our operating results. |
with market conditions. Accordingly, we believe FFO provides a valuable alternative measurement tool to GAAP when presenting our operating results.
| |
| (b) | See Item 7 - "Management Discussion and Analysis of Financial Condition and Results of Operations" for a reconciliation of FFO to AFFO, both non-GAAP measurements. We believe the computation of FFO in accordance with NAREIT's definition includes certain items that are not indicative of the results provided by our operating portfolio and affect the comparability of our period-over-period performance. These items include, but are not limited to, legal settlements, non-cash share-based compensation expense and non-cash amortization on loans and acquisition costs. Therefore, in addition to FFO, management uses Adjusted FFO ("AFFO"), which we define to exclude such items. Management believes that these adjustments are appropriate in determining AFFO as they are not indicative of the operating performance of our assets. In addition, we believe that AFFO is a useful supplemental measure for the investing community to use in comparing us to other REITs as many REITs provide some form of adjusted or modified FFO. However, there can be no assurance that AFFO presented by us is comparable to the adjusted or modified FFO of other REITs. |
with NAREIT's definition includes certain items that are not indicative of the results provided by our operating portfolio and affect the comparability of our period-over-period performance. These items include, but are not limited to, legal settlements, non-cash share-based compensation expense and non-cash amortization on loans and acquisition costs. Therefore, in addition to FFO, management uses Adjusted FFO ("AFFO"), which we define to exclude such items. Management believes that these adjustments are appropriate in determining AFFO as they are not indicative of the operating performance of our assets. In addition, we believe that AFFO is a useful supplemental measure for the investing community to use in comparing us to other REITs as many REITs provide some form of adjusted or modified FFO. However, there can be no assurance that AFFO presented by us is comparable to the adjusted or modified FFO of other REITs.
Item 7. Management’s Discussion and Analysis of Financial Condition and Results of Operations.
You should read the following discussion of our financial condition and results of operations in conjunction with our audited consolidated financial statements and the notes thereto included in this Form 10-K. All per share amounts, common units and shares outstanding and stock-based compensation amounts for all periods presented reflect our one-for-eight Reverse Stock Split, which was effective at approximately 5:00 pm Eastern Time on March 31, 2017 (the "Effective Time"). For more detailed information regarding the basis of presentation for the following information, you should read the notes to the audited consolidated financial statements included in this Form 10-K.
Company Overview
We are a Maryland corporation formed with the principle objective of acquiring, financing, developing, leasing, owning and managing income producing, strip centers, neighborhood centers, grocery-anchored centers, community centers and free-standing retail properties. Our strategy is to opportunistically acquire quality, well-located, predominantly retail properties in secondary and tertiary markets that generate attractive risk-adjusted returns. We generally target competitively protected properties located within developed areas, commonly referred to as in-fill, that possess minimal competition risk and are surrounded by communities that have strong demographics and dynamic, diversified economies that will continue to generate jobs and future demand for commercial real estate. Our primary target markets include the Northeast, Mid-Atlantic, Southeast and Southwest.
Our portfolio is comprised of fifty-nine retail shopping centers, five free-standing retail properties, our office building, eightseven undeveloped land parcels, and one redevelopment project. SixteenFifteen of these properties are located in Virginia, three are located in Florida, seven are located in North Carolina, twenty-five are located in South Carolina, twelve are located in Georgia, two are located in Kentucky, two are located in Tennessee, one is located in New Jersey, three are located in Oklahoma, one is located in Alabama, one is located in West Virginia and one is located Pennsylvania. Our operating portfolio has a total GLAGross Leasable Area ("GLA") of 4,906,5114,902,381 square feet and an occupancy level of approximately 94%91.93%.
Recent Trends and Activities
There have been several significant events in 20162017 that have positively impacted our company. These events are summarized below.
Property Acquisitions2017 Dispositions
On June 27, 2017, the Company completed the sale of the 2.14 acre land parcel at Carolina Place for a contract price of $250 thousand, resulting in a loss of $12 thousand with net proceeds of $238 thousand.
A-C PortfolioOn June 26, 2017, the Company completed the sale of the Steak n' Shake, a 1.06 acre outparcel at Rivergate, for a contract price of approximately $2.25 million, resulting in a gain of $1.03 million with net proceeds of $2.18 million.
The sales of the Steak n' Shake outparcel at Rivergate and the land parcel at Carolina Place do not represent a strategic shift that has a major effect on the Company's financial position or results of operations. Accordingly, the operating results of these properties remains classified within continuing operations for all periods presented.
On April 12, 2016,February 28, 2017, the Company completed its acquisitionsales of 14 retail shopping centers located in GeorgiaRuby Tuesday’s and South Carolina (collectively the “A-C Portfolio”)Outback Steakhouse at Pierpont Centre for an aggregate purchasea contract price of $71.00approximately $2.29 million, paid throughresulting in a combinationgain of cash, debt$1.50 million. The Company has defeased the $1.69 million loan payable at a cost of $223 thousand. The operating results of these properties are classified as discontinued operations for all period presented as they reflect the execution of our strategy of acquiring multi-tenant properties, monetizing core-assets and the issuance of 888,889 common unitsusing proceeds to re-invest in the Operating Partnership. Collectively, the A-C Portfolio properties total 605,358 square feet in leaseable space, and were 92% leased as of the acquisition date by 77 primarily retail tenants. Each property is anchored by either a Bi-Lo, Harris Teeter or Piggly Wiggly grocery store.our specialized markets.
Financing Activities
The A-C Portfolio consists of the following properties:
|
| | | |
Property Name | Location | Square Feet |
|
Darien Shopping Center | Darien, GA | 26,001 |
|
Devine Street | Columbia, SC | 38,464 |
|
Folly Road | Charleston, SC | 47,794 |
|
Georgetown | Georgetown, SC | 29,572 |
|
Ladson Crossing | Ladson, SC | 52,607 |
|
Lake Greenwood Crossing | Greenwood, SC | 47,546 |
|
Lake Murray | Lexington, SC | 39,218 |
|
Litchfield Market Village | Pawleys Island, SC | 86,740 |
|
Moncks Corner | Moncks Corner, SC | 26,800 |
|
Ridgeland | Ridgeland, SC | 20,029 |
|
Shoppes at Myrtle Park | Bluffton, SC | 56,380 |
|
South Lake | Lexington, SC | 44,318 |
|
South Park | Mullins, SC | 60,874 |
|
St. Matthews | St. Matthews, SC | 29,015 |
|
Berkley Shopping CenterKey Bank Credit Agreement
On November 10, 2016, we completed our acquisitionAugust 7, 2017, the Company executed a Third Amendment (the "Third Amendment") to the KeyBank Credit Agreement (the "Credit Agreement"). The Third Amendment changed the interest payment date to the first day of Berkley Shopping Center,each calendar month and decreased the total commitment on the revolving credit line by $25.00 million to $50.00 million effective October 7, 2017. The Company and KeyBank agreed Shoppes at Myrtle Park shall continue to be included in the calculation of the Borrowing Base Availability (as defined in the Credit Agreement) through December 21, 2017. On October 6, 2017, the Company executed a 47,945 square foot shopping center located in Norfolk, Virginia ("Berkley"Fourth Amendment to the Credit Agreement (the "Fourth Amendment") from a related party. The Fourth Amendment provided for a contract price of $4.18sixty day extension from October 7, 2017 to December 6, 2017 upon which the $75.00 million total commitment on the revolving credit line was to decrease to $50.00 million. Berkley was 100% leased as of the acquisition date and is anchored by a Farm Fresh grocery store. We acquired Berkley from a related party through a combination of cash and the issuance of 221,476 common units in the Operating Partnership.
Sangaree Plaza and Tri-County Plaza
On November 10, 2016, we completed our acquisition of Sangaree Plaza and Tri-County Plaza, a 66,948 and 67,577 square foot shopping center, respectively located in Summerville, South Carolina and Royston, Georgia, respectively ("Sangaree/Tri-County") from a related party for a total contract price of $10.77 million. Sangaree/Tri-County was 95.2% leased as of the acquisition date and are anchored by Bi-Lo grocery store. We acquired Sangaree/Tri-County from a related party through a combination of cash and the issuance of 122,250 common units in the Operating Partnership.
Riverbridge Shopping Center
On November 15, 2016, the Company completed its acquisition of Riverbridge Shopping Center ("Riverbridge"), a 91,188 square foot shopping center located in Carollton, Georgia for a contract price of $7.00 million. Riverbridge was 98.5% leased as of the acquisition date and is anchored by Ingles. The Company acquired Riverbridge through a combination of cash and debt.
Laburnum Square
On December 7, 2016, the Company completed our acquisition of Laburnum Square, a 109,405 square foot shopping center located in Richmond, Virginia ("Laburnum") for a contract price of $10.50 million, paid through a combination of cash and debt. Laburnum was 96.9% leased as of the acquisition date and is anchored by Kroger.
Franklin Village
On December 12, 2016, the Company completed our acquisition of Franklin Village, a 151,673 square foot shopping center located in Kittanning, Pennsylvania ("Franklin") for a contract price of $13.10 million, paid through a combination of cash and debt. Franklin was 98.0% leased as of the acquisition date and is anchored by Shop ‘n Save.
Village at Martinsville
On December 16, 2016, the Company completed our acquisition of Village at Martinsville, a 297,950 square foot shopping center located in Martinsville, Virginia ("Martinsville") for a contract price of $23.53 million, paid through a combination of cash and debt. Martinsville was 97.0% leased as of the acquisition date and is anchored by Kroger.
New Market Crossing
On December 20, 2016, the Company completed our acquisition of New Market Crossing, a 116,976 square foot shopping center located in Mt. Airy, North Carolina ("New Market") for a contract price of $9.00 million, paid through a combination of cash and debt. New Market was 93% leased as of the acquisition date and is anchored by Lowes Food Store.
Rivergate Shopping Center
On December 21, 2016, the Company completed our acquisition of Rivergate Shopping Center, a 205,810 square foot shopping center located in Macon, Georgia ("Rivergate") for a contract price of $37.25 million, paid through a combination of cash and debt. Rivergate was 96.0% leased as of the acquisition date and is anchored by Publix.
Note Receivable
On September 29, 2016,2017, the Company entered into an $11.00Amended and Restated Credit Agreement to the Credit Agreement (the “Amended and Restated Credit Agreement”). The Amended and Restated Credit Agreement provides for an increase in borrowing capacity from $50.00 million note receivableto $52.50 million and also increases the accordion feature by $50.00 million to $150.00 million. Additionally, the Amended and Restated Credit Agreement provides for the partial fundingan extension of the Sea Turtle Development andrequirement to reduce the outstanding borrowings under the facility from $68.03 million to $52.50 million by July 1, 2018. The revolving facility will mature on December 21, 2019, but may be extended at the Company’s option for an $1.00 million note receivable in consideration foradditional one-year period, subject to certain customary conditions. The interest rate remains the sale of 10.39 acres of land owned by the Company. Both promissory notes are collateralized by a 2nd deed of trustsame at LIBOR plus 250 basis points based on the propertyCompany’s Consolidated Leverage Ratio (as defined in the Amended and accrue interestRestated Credit Agreement).
On March 2, 2018, KeyBank reduced the liquidity requirement from $5.00 million to $3.50 million through March 31, 2018. The liquidity requirement reverts back to $5.00 million subsequent to March 31, 2018 until such time as the Total Commitment (as defined in the Amended and Restated Credit Agreement) has been reduced to $52.50 million and $3.50 million at a rate of 12% annually. Interest only payments at a rate of 8% are due on the notes at the beginning of every calendar quarter starting October 2016. Interest at a rate of 4% accrues and is due at maturity. The notes mature the earlier of September 29, 2021 disposition of the property. The balance on the notes receivable at December 31, 2016 is $12.00 million.all times thereafter.
Financing Activities
Key Bank CreditRevere Loan Agreement
On May 29, 2015,1, 2017, the Operating Partnership entered into a $45.00extended the $7.45 million million revolving credit line (the "Credit Agreement") with KeyBank National Association ("KeyBank"). PursuantRevere Term Loan maturity to the Credit Agreement, outstanding borrowings accrue monthly interest which is paid at a rate of the one-month London Interbank Offer Rate ("LIBOR") plus a margin ranging from 1.75% to 2.50% depending on the Company's consolidated leverage ratio. On April 12, 2016, the Operating Partnership entered into a First Amendment and Joinder Agreement (“First Amendment”) to the Credit Agreement. The First Amendment increased the $45.00 million revolving credit line with KeyBank to $67.20 million and the Company utilized this additional borrowing capacity to acquire the A-C Portfolio. Pursuant to30, 2018, as permitted within the terms of the First Amendment,loan agreement, with a $450 thousand principal payment and $140 thousand extension fee. In June 2017, upon the monthly interestcompletion of the increased credit facility is adjusted to LIBOR plus a marginsale of 5.00% until such time that the Company can meet certain repayment and leverage conditions. The Company used Series B proceeds to reduce its borrowings under the Credit Agreement to $46.10 million and the margin reduced backCarolina Place, as discussed in Note 3 to the stated rangeaudited consolidated financial statements, a $167 thousand principal payment was made on the loan. On August 29, 2017, a $25 thousand principal payment was made on the loan as a result of the original Credit Agreement on August 15, 2016. On December 7, 2016, the Operating Partnership entered into a Second Amendment and Joinder Agreement ("Second Amendment") to the Credit Agreement. The Second Amendment increased the line of credit to $75.0 million. Pursuant to the terms of the Second Amendment, the pricing reverts back to the original Credit Agreement. The unutilized amounts available to the Company under the Credit Agreement accrue fees which are paid at a rate of 0.30%.Walnut Hill Plaza amendment discussed below.
Senior Convertible Notes
As of December 31, 2016, the Company has borrowed $74.08 million under the Credit Agreement, which is collateralized by the A-C Portfolio, Laburnum, Martinsville and New Market. At December 31, 2016, the outstanding borrowings are accruing interest at 3.24%. The Credit Agreement contains certain financial covenants that the Company must meet, including minimum leverage, fixed charge coverage and debt service coverage ratios as well as a minimum tangible net
worth requirement. The Company was in compliance with the financial covenants as of December 31, 2016. The Credit Agreement also contains certain events of default that if they occur may cause KeyBank to terminate the Credit Agreement and declare amounts owed to become immediately payable. As of December 31, 2016, the Company has not incurred an event of default. This credit agreement matures in May 2018.
Senior Subordinated Debt
On January 29, 2016, the Company paid off $2.16 million in senior subordinated debt from cash on hand.
Revere Loan Agreement
In connection with the closing of the A-C Portfolio, the Operating Partnership, as borrower, and Revere High Yield Fund, LP, a Delaware limited partnership (“Revere”), as lender, entered into a Term Loan Agreement dated as of April 8, 2016 (“Revere Term Loan”) in the principal amount of $8.00 million. The Revere Term Loan has a maturity date of April 30, 2017, and an interest rate of 8% per annum. The Company and certain of its subsidiaries serve as guarantors under the Revere Term Loan. The proceeds of the Revere Term Loan were used as partial consideration for the purchase of the A-C Portfolio. A warrant (“Warrant”) to purchase an aggregate of 6,000,000 shares of the Company’s Common Stock (under circumstances described below under the section “Revere Warrant Agreement”) serves as collateral for the Revere Term Loan. As of December 31, 2016, the remaining outstanding amount under the Revere Term Loan is $7.45 million.
Revere Warrant Agreement
In connection with the Revere Term Loan, the Company and Revere entered into a Warrant Agreement dated as of April 8, 2016 (“Revere Warrant Agreement”), pursuant to which the Company agreed to issue the Warrant to Revere. The terms of the Revere Warrant Agreement provide that solely in the event of an Event of Default (as defined in the Revere Term Loan) under the Revere Term Loan, Revere shall have the right to purchase an aggregate of up to 6,000,000 shares of the Company’s Common Stock for an exercise price equal to $0.0001 per share. The Warrant is exercisable at any time and from time to time during the period starting on April 8, 2016 and expiring on April 30, 2017 at 11:59 p.m., Virginia Beach, Virginia time, solely in the event of an Event of Default under the Revere Term Loan. The Company will not receive any proceeds from the issuance of the Warrant; rather the Warrant serves as collateral for the Revere Term Loan, the proceeds of which were used as partial consideration for the A-C Portfolio. The Warrant is treated as embedded equity and separate disclosure is not necessary.
Senior Convertible Notes Amendment
Effective as of April 28, 2016, the Company and certain investors: Calapasas West Partners, L.P.; Full Value Partners, L.P.; Full Value Special Situations Fund, L.P.; MCM Opportunity Partners, L.P.; Mercury Partners, L.P.; Opportunity Partners, L.P.; Special Opportunities Fund, Inc.; and Steady Gain Partners, L.P. (collectively the “Bulldog Investors”) amended the convertible 9% senior notes (“Amended Convertible Notes”) to purchase shares of the Company’s Common Stock. Prior to the amendment, the aggregate principal amount of the Convertible Notes was $3.00 million.
Pursuant to the terms of the Amended Convertible Notes, upon thirty (30) calendar days’ notice (“Notice”), the Company may prepay any portion of the outstanding Principal Amount and accrued and unpaid interest, if any, without penalty. In addition, upon Notice the Bulldog Investors may now exercise their right to convert all or any portion of the outstanding Principal Amount and any accrued but unpaid interest into shares of Common Stock any time prior to the repayment in full of the Amended Convertible Notes. The maximum number of shares of Common Stock issuable upon conversion of the Amended Convertible Notes is 1,417,079 shares. As of December 31, 2016, the Bulldog Investors converted approximately $1.60$1.64 million of principal amount into 1,397,0101,417,079 shares, pre-reverse split of the Company's Common Stock.
Chesapeake Square Refinance
On July 11, 2016,Stock, the Company executed a promissory note for $4.60 million to refinance the Chesapeake Square collateralized portionmaximum number of the KeyBank Credit Agreement totaling $3.90 million. The new loan matures in August 2026 with monthly principal and interest payments due at an interest rate of 4.70%.
shares allowed.
Perimeter Square Refinance
On July 29, 2016,June 14, 2017, the Company executed a promissory note for $4.50$6.25 million to refinance the Perimeter promissory noteloan totaling $4.10$4.50 million. The new loan matures in August 2026December 2018 with principalmonthly interest only payments. Principal is due at maturity andmaturity. The loan bears interest at 4.06%5.50%.
Rivergate
With the sale of the Steak n' Shake outparcel at Rivergate, as discussed in Note 3 to the audited consolidated financial statements, a $1.52 million principal payment was made on the Rivergate loan.
Berkley, Sangaree/Tri-CountyFolly Road Refinance
On November 10, 2016,March 22, 2017, the Company executed a promissory note for $9.40$8.57 million forto refinance the purchaseFolly Road collateralized portion of Berkley, Sangaree/Tri-County.the KeyBank Credit Agreement totaling $6.05 million. The loan matures in December 2026March 2020 with monthly
interest only payments due through 2021April 2018 at which time monthly principal and interest payments begin.begin based on a 25 year amortization. The loan bears interest at 4.78%4.00%.
RiverbridgeColumbia Fire House Construction Loan
On November 15, 2016,May 3, 2017, the Company executed a promissory note for $4.00$4.30 million forrelated to construction at Columbia Fire House ("Columbia Fire House Construction Loan") at which time the purchase of Riverbridge.original Columbia Fire House note ("Columbia Fire House Loan") was paid down to $262 thousand. The loan matures in December 2026 with principal due at maturity and bears interest at 4.48%.
Franklin
On December 12, 2016, the Company executed a promissory note for $8.52 million for the purchase of Franklin. The loan matures in January 2027May 2020 with monthly interest only payments due through January 2020November 2018 at which time monthly principal and interest payments begin.begin based on a 20 year amortization. The loan bears interest at 4.93%4.00%.
Lumber RiverWalnut Hill Plaza Amendment
On July 18, 2017, the Company extended the $3.39 million Walnut Hill Plaza loan maturity to October 31, 2017.
On August 29, 2017, the Company amended the Walnut Hill Plaza promissory note for $3.90 million. The amended loan matures in September 2022 with monthly interest only payments through August 2018 at which time monthly principal and interest payments of $26,850 begin based on a 20 year amortization. The loan bears interest at 5.50%.
Bank Line of Credit
On September 16, 2017, the Company extended the $3.00 million bank line of credit to December 15, 2017.
Monarch Bank Building
On December 20, 2016,12, 2017, the Company executed a promissory note for $1.50 million. The newextended the $1.27 million Monarch Bank Building loan matures into June 20182019 with monthly principal and interest only payments of $7,340 at a rate of 295 basis points over one month LIBOR through 2017. Principal payments begin in 2018.4.85%.
Harbor Point RenewalColumbia Fire Station
On December 2, 2016,21, 2017, the Company renewedpaid $262 thousand to satisfy the promissory note for $0.65 million on Harbor Point for two years. The loan matures on December 5, 2018 with monthly principal and interest payments. The loan bears interest at 5.85%.in full.
RivergateLoan Covenants
On December 21, 2016, the Company executed a promissory note for $24.2 million for the purchase of Rivergate. The loan matures in December 2019 with interest only payments at a rate of 295 basis points on one month LIBOR for the first year and principal and interest for the next two years.
Certain of the Company’s loans payable have covenants with which the Company is required to comply. As of December 31, 2016,2017, the Company has received a waiver through loan maturity for the debt to tangible net worth ratio on the Bank Line of Credit and a waiver of the interest coverage ratio on the Revere Loan as of December 31, 2017 which was adversely impacted by the impairment on note receivable and reserve on related party receivables recognized during fourth quarter 2017. As of December 31, 2017, the Company believes it is in compliance with all other applicable covenants.
Sea Turtle Development and Related Receivables
In 2016, the Company loaned $11.00 million for the partial funding of Pineland Station Shopping Center in Hilton Head, South Carolina to be known in the future as Sea Turtle Development and loaned $1.00 million for the sale of land to be used in the development. The Company has recognized a $5.26 million impairment charge on the notes receivable and fully reserved $1.34 million in accrued interest of which $895 thousand was due at note maturity.
Subsequent to December 31, 2017, the Company's agreement to perform development, leasing, property and asset management services for Sea Turtle Development in Hilton Head, South Carolina was terminated. Sea Turtle Development is a related party as Jon Wheeler, the Company's former CEO and shareholder of the Company, is the managing member. Prior to the termination of the agreements, development fees of 5% of hard costs incurred were paid to the Company. Leasing, property and asset management fees were consistent with those charged for services provided to non-related properties. The Company has fully reserved $390 thousand in amounts due from Sea Turtle Development for these services at December 31, 2017.
The determination to fully reserve amounts due from Sea Turtle Development and recognize a note impairment are a result of uncertainty surrounding the recoverability of those amounts. As of December 31, 2017, the Company believes the estimated fair market value of the development at stabilization at a future date will not provide for the cash required to repay
the entire note receivable due the Company in the event of a sale. The Company’s estimated fair value of the project is based upon cash flow models that include development costs to date, anticipated cost to complete, executed leases, and financing available to complete and stabilize the project. Capitalization rates utilized in these models are based upon rates that the Company believes to be within a reasonable range of current market rates for the respective project. The notes are collateralized by a 2nd deed of trust on the property. If the holder of the 1st deed of trust proceeds to foreclosure, this may have an adverse effect on assumptions used in the Company's fair value analysis leading to further impairment.
Other Related Party Receivables
The Company has reserved $636 thousand of amounts due from non-REIT properties for asset management and lease commissions based on available cash flows at the respective properties and payment history.
New Leases, Leasing Renewals and Expirations
NewThe following table presents selected lease activity statistics for our properties.
|
| | | | | | | |
| | Twelve Months Ended December 31, |
| | 2017 | | 2016 |
| Renewals: | | | |
| Leases renewed with rate increase (sq feet) | 296,005 |
| | 181,850 |
|
| Leases renewed with rate decrease (sq feet) | 53,669 |
| | 1,200 |
|
| Leases renewed with no rate change (sq feet) | 220,787 |
| | 103,213 |
|
| Total leases renewed (sq feet) | 570,461 |
| | 286,263 |
|
| | | | |
| Leases renewed with rate increase (count) | 76 |
| | 50 |
|
| Leases renewed with rate decrease (count) | 6 |
| | 1 |
|
| Leases renewed with no rate change (count) | 30 |
| | 18 |
|
| Total leases renewed (count) | 112 |
| | 69 |
|
| | | | |
| Option exercised (count) | 60 |
| | 26 |
|
| | | | |
| Weighted average on rate increases (per sq foot) | $ | 0.75 |
| | $ | 0.81 |
|
| Weighted average on rate decreases (per sq foot) | $ | (1.07 | ) | | $ | (0.25 | ) |
| Weighted average rate (per sq foot) | $ | 0.29 |
| | $ | 0.52 |
|
| Weighted average change over prior rates | 3.10 | % | | 4.90 | % |
| | | | |
| New Leases: | | | |
| New leases (sq feet) | 160,341 |
| | 148,328 |
|
| New leases (count) | 55 |
| | 47 |
|
| Weighted average rate (per sq foot) | $ | 11.87 |
| | $ | 12.00 |
|
| | | | |
| Gross Leasable Area ("GLA") expiring during the next 12 months | 9.39 | % | | 7.17 | % |
Anchor Lease Modifications
In September 2017, the Company modified leases during the year ended December 31, 2016 were comprisedwith two anchor tenants. The lease modifications include a reduction of forty-seven deals totaling 148,328lease term from 2028 to 2023 on 34,264 square feet with aand no change in the 2018 lease expiration term on 33,218 square feet. The overall weighted average rate of $12.00base rent reduction is $5.59 per square foot. The commission rate per square foot equated to $4.61.
Renewals during the year ended December 31, 2016 were comprised of sixty-nine deals totaling 286,263 square feet with a weighted average increase of $0.52 per square foot, representing an increase of 4.9% over prior rates. The rates on negotiated renewals resulted in a weighted average increase of $0.81 per square foot on fifty-one renewals, a $0.25 per square foot decrease on one renewal and no changes on eighteen renewals. Twenty-six of these renewals represented options being exercised.
Approximately 7.17% of our gross leasable area is subject to leases that expire during the twelve months ending December 31, 2017 that have not already been renewed. Based on recent market trends, we believe that these leases will be renewed at amounts and terms comparable to existing lease agreements.
Funds from Operations
We use Funds From Operations (“FFO”)FFO, a non-GAAP measure, as an alternative measure of our operating performance, specifically as it relates to results of operations and liquidity. We compute FFO in accordance with standards established by the Board of Governors of the National Association of Real Estate Investment Trusts (“NAREIT”)NAREIT in its March 1995 White Paper (as amended in November 1999 and April 2002). As defined by NAREIT, FFO represents net income (computed in accordance with accounting principles generally accepted in the United States, or “GAAP”)GAAP), excluding gains (or losses) from sales of property, plus real estate related depreciation and amortization (excluding amortization of loan origination costs) and after adjustments for unconsolidated partnerships and joint ventures. Most industry analysts and equity REITs, including us, consider FFO to be an appropriate supplemental measure of operating performance because, by excluding gains or losses on dispositions and excluding depreciation, FFO is a helpful tool that can assist in the comparison of the operating performance of a company’s real estate between periods, or as compared to different companies. Management uses FFO as a supplemental measure to conduct and evaluate our business because there are certain limitations associated with using GAAP net income alone as the primary measure of our operating performance. Historical cost accounting for real estate assets in accordance with GAAP implicitly assumes that the value of real estate assets diminishes predictably over time, while historically real estate values have risen or fallen with market conditions. Accordingly, we believe FFO provides a valuable alternative measurement tool to GAAP when presenting our operating results.
Critical Accounting Policies
The following discussion and analysis of our financial condition and results of operations are based upon our consolidated financial statements included in this Form 10-K, which have been prepared in accordance with accounting principles generally accepted in the United States. The preparation of these consolidated financial statements requires us to make estimates and judgments that affect the reported amounts of assets, liabilities, revenues and expenses. On an on-going basis, we evaluate our estimates based on historical experience and on various other assumptions that are believed to be reasonable under the circumstances, the results of which form the basis for making judgments about the carrying values of assets and liabilities that are not readily apparent from other sources. Actual results may differ from these estimates under different assumptions or conditions.
The critical accounting policies summarized in this section are discussed in further detail in the notes to the financial statements appearing elsewhere in this Form 10-K. We believe that the application of these policies on a consistent basis enables us to provide useful and reliable financial information about our operating results and financial condition.
Revenue Recognition
Principal components of our total revenues include base and percentage rents and tenant reimbursements. We accrue minimum (base) rent on a straight-line basis over the terms of the respective leases which results in an unbilled rent asset or deferred rent liability being recorded on the balance sheet. Certain lease agreements contain provisions that grant additional rents based on tenants’ sales volumes (contingent or percentage rent) which we recognize when the tenants achieve the specified targets as defined in their lease agreements. We periodically review the valuation of the asset/liability resulting from the straight-line accounting treatment of our leases in light of any changes in lease terms, financial condition or other factors concerning our tenants.
Rents and Other Tenant Receivables
We record a tenant receivable for amounts due from tenants such as base rents, tenant reimbursements and other charges allowed under the lease terms. We periodically review tenant receivables for collectability and determine the need for an allowance for the uncollectible portion of accrued rents and other accounts receivable based upon customer creditworthiness (including expected recovery of a claim with respect to any tenants in bankruptcy), historical bad debt levels and current economic trends. We consider a receivable past due once it becomes delinquent per the terms of the lease; our standard lease form considers a rent charge past due after five days. A past due receivable triggers certain events such as notices, fees and other allowable and required actions per the lease.
Acquired Properties and Lease Intangibles
We allocate the purchase price of the acquired properties to land, building and improvements, identifiable intangible assets and to the acquired liabilities based on their respective fair values. Identifiable intangibles include amounts allocated to
acquired out-of-market leases, tenant relationships and the value of in-place leases. We determine fair value based on estimated cash flow projections that utilize appropriate discount and capitalization rates and available market information. Estimates of future cash flows are based on a number of factors including the historical operating results, known trends and specific market and economic conditions that may affect the property. Management also estimates costs to execute similar leases including leasing commissions, tenant improvements, legal and other related expenses. Such amounts are based on estimates and forecasts which, by their nature, are highly subjective and may result in future changes in the event forecasts are not realized.
Impairment of Long-Lived Assets
We periodically review investment properties for impairment on a property-by-property basis whenever events or changes in circumstances indicate that the carrying value of investment properties may not be recoverable, with an evaluation performed at least annually. These circumstances include, but are not limited to, declines in the property’s cash flows, occupancy and fair market value. We measure any impairment of investment property when the estimated undiscounted operating income before depreciation and amortization, is less than the carrying value of the property. To the extent impairment has occurred, we charge to income the excess of carrying value of the property over its estimated fair value. We estimate fair value using unobservable data such as operating income, estimated capitalization rates or multiples, leasing prospects and local market information. We may decide to sell properties that are held for use and the sale prices of these properties may differ from their carrying values. We did not record any impairment charges during the years ended December 31, 2017, 2016 2015 and 2014.2015.
Notes Receivable
Notes receivable represent financing to Sea Turtle Development as discussed in Note 4 of the audited consolidated financial statements for development of the project. The notes are secured by the underlying real estate known as Sea Turtle Development. The Company evaluates the collectability of both the interest on and principal of the notes receivable based primarily upon the projected fair market value of the project at stabilization. The notes receivable are determined to be impaired when, based upon current information, it is no longer probable that the Company will be able to collect all contractual amounts due from the borrower. The amount of impairment loss recognized is measured as the difference between the carrying amount of the loan and its estimated realizable value.
Liquidity and Capital Resources
At December 31, 2016,2017, our consolidated cash and cash equivalents totaled $4.86$3.68 million compared to consolidated cash and cash equivalents of $10.48$4.86 million at December 31, 2015.2016. Cash flows from operating activities, investing activities and financing activities for the years ended December 31, 20162017 and 20152016 are as follows:follows (in thousands):
| | | | Years Ended December 31, | | Year Over Year Change | Years Ended December 31, | | Year Over Year Change |
| | 2016 | | 2015 | | $ | | % | 2017 | | 2016 | | $ | | % |
| Operating activities | $ | 10,442,931 |
| | $ | (5,326,113 | ) | | $ | 15,769,044 |
| | 296.07 | % | $ | 24,761 |
| | $ | 10,442 |
| | $ | 14,319 |
| | 137.13 | % |
| Investing activities | $ | (60,537,298 | ) | | $ | (54,859,005 | ) | | $ | (5,678,293 | ) | | (10.35 | )% | $ | (2,979 | ) | | $ | (60,537 | ) | | $ | 57,558 |
| | 95.08 | % |
| Financing activities | $ | 44,480,163 |
| | $ | 60,822,853 |
| | $ | (16,342,690 | ) | | (26.87 | )% | $ | (22,968 | ) | | $ | 44,480 |
| | $ | (67,448 | ) | | (151.64 | )% |
Operating Activities
During the yeartwelve months ended December 31, 2016,2017, our cash flows provided byfrom operating activities were $10.44$24.76 million, compared to cash flows used infrom operating activities of $5.33$10.44 million during the yeartwelve months ended December 31, 2015. Operating cash flows were2016, representing an increase of $14.32 million. This increase is primarily impacted by the $6.54 million decrease in our consolidated net loss due toresult of the factors discussed in the "Results of Operations" section below, specifically theincremental increase in FFO of $9.23$7.02 million from new stores that were acquiredstore properties earned during the respective periods. The $7.02 million increase in 2015new store FFO represents an increase in new store net loss of $172 thousand, gain on disposal of properties of $1.03 million offset by increase of $8.23 million in depreciation and 2016.amortization during the respective periods. Also impacting operating cash flows is the fluctuation in acquisition deposits included within deferred costs and the timing of the respective acquisitions accompanied by an increasea decrease in prepaid rents, primarily due to new stores.cash restricted for operating property reserves.
Investing Activities
During the yeartwelve months ended December 31, 2016,2017, our cash flows used in investing activities were $60.54$2.98 million, compared to cash flows used in investing activities of $54.86$60.54 million during the year ended December 31, 2015. We acquired $186.33 million of assets in 2016 compared to $141 million in 2015. The A-C portfolio acquisition, consisting of fourteen retail property acquisitions, was accomplished utilizing an 85% loan to value ratio versus a typical ratio of 55% to 65% required on most Commercial Mortgage Backed Security ("CMBS") loans. This resulted in less cash outflows relating to property acquisitions for year ended December 31, 2016. Cash paid for capital property reserves decreased by $0.53 million due to prior year reserved balances being released upon completion of required activities offset by reserves required on 2016 acquisitions. In
addition, for the yeartwelve months ended December 31, 2016, there were $9.40representing an increase of $57.56 million due to the following:
$49.16 million decrease in cash outflows used for the acquisition of the twenty-three properties in 2016;
$9.40 million decrease in cash outflows for the issuance of the Sea Turtle Development notes receivable in 2016;
$2.42 million increase in cash received as a result of the sale of a land parcel at Carolina Place and an increase of $1.43the Steak n' Shake outparcel at Rivergate in 2017;
$1.50 million for capital expenditures on existing properties. Cash flows used in investing activities was further impacted by a decrease in cash outflows for capital property reserves;
$486 thousand increase in cash received for disposal of $7.33properties as a result of the 2017 sale of the Ruby Tuesdays/Outback at Pierpont Shopping Center offset by the 2016 sale of Starbucks/Verizon; and
Offset by $5.41 million for properties disposed during the respective periods.increase in cash outflows on capital expenditures in 2017;
Financing Activities
During the yeartwelve months ended December 31, 2017, our cash flows used in financing activities were $22.97 million, compared to $44.48 million of cash flows provided by financing activities during the twelve months ended December 31, 2016, our cash flows from financing activities were $44.48representing a decrease of $67.45 million compared to $60.82 million of cash flows from financing activities during the year ended December 31, 2015. The primary factor contributingdue to the comparative fluctuationfollowing:
$75.69 million decrease in financing cash flows wasproceeds from sale of preferred stock due to the Series C Preferred Stock offering in March 2015, which generated proceeds of $83.42 million as compared to Series B Preferred Stock offering proceeds of $23.38 million and Series D Preferred Stock offeringofferings occurring in 2016;
$2.71 million decrease in loan proceeds of $52.4due to the $8.00 million Revere Loan occurring in 2016 offset by a $1.87 million increase in refinancing proceeds and the $3.42 million Columbia Fire House Construction Loan occurring in 2017;
$3.05 million in 2016. The 2016 capital raises contributed to an increase inadditional cash outflows for dividends paid of $3.50 million for the year ended December 31, 2016 when compared to the year ended December 31, 2015. The increase in payments on deferred financing costs of $2.41 million isand distributions primarily as a direct result of the increase in loan proceeds to $21.60increased number of Series B Preferred Stock and Series D Preferred Stock shares outstanding year over year;
Partially offset by $11.57 million for the year ended December 31, 2016 which is primarily attributable to the twenty-three acquisitions in 2016. The increasedecrease in loan principal payments due to the 2016 KeyBank pay-down of $12.97$21.1 million offset by the 2017 refinancing of loans along with paydown of the Rivergate loan and Revere Loan as a result of Steak n' Shake and Carolina Place sales; and
$4.11 million decrease in payments for deferred financing costs primarily related to the pay downacquisition of the KeyBank line of credit and the refinancing of Chesapeake Square and Perimeter Square.fourteen A-C Portfolio properties in 2016 compared to costs associated with less 2017 refinances.
We intend to continue managing our debt prudently so as to maintain a conservative capital structure and minimize leverage within our company. As of December 31, 20162017 and 2015,2016, our debt balances, excluding unamortized debt issuance costs, consisted of the following:
following (in thousands):
| | | | December 31, | December 31, |
| | 2016 | | 2015 | 2017 | | 2016 |
| Fixed-rate notes | $ | 211,538,914 |
| | $ | 180,048,494 |
| $ | 216,240 |
| | $ | 211,539 |
|
| Adjustable-rate mortgages | 28,081,725 |
| | 2,418,212 |
| 29,506 |
| | 28,082 |
|
| Fixed-rate notes, assets held for sale | 1,350,000 |
| | 1,982,042 |
| — |
| | 1,350 |
|
| Floating-rate line of credit | 74,077,250 |
| | 6,873,750 |
| 68,032 |
| | 74,077 |
|
| Total debt | $ | 315,047,889 |
| | $ | 191,322,498 |
| $ | 313,778 |
| | $ | 315,048 |
|
The increasedecrease in total mortgage indebtedness at December 31, 20162017 is primarily due to $134.40 million in debt from acquisitions made during 2016 compared to $75.66 million in 2015 related to acquisitions.the sale of Ruby Tuesday's and Outback Steakhouse at Pierpont Centre. The weighted average interest rate and term of our fixed-rate debt are 4.79%4.78% and 7.916.24 years, respectively, at December 31, 2016.2017. We have $17.45$39.81 million of debt maturing, including scheduled principal repayments, during the year ending December 31, 2017.2018. While we anticipate being able to refinance all the loans at reasonable market terms upon maturity, our inability to do so may materially impact our financial position and results of operations. See the financial statementsNote 7 included elsewhere in this Form 10-K for additional mortgage indebtedness details.
Future Liquidity Needs
In addition to the funding of our ongoing operations, the primary liquidity needs of the Company at December 31, 20162017 are $17.45$39.81 million in debt maturities and principal payments due within the following year including debt service
payments, Series B and Series D Preferred Stock dividends (approximately $9.2$12.1 million), margin covenant requirements as detailed in our Amended and Restated Credit Agreement with KeyBankas described in Note 7 and the $0.21 per share (approximately $15.4 million) targeted annual Common Stock dividend we are currently paying on a monthly basis. At December 31, 2016, the Revere Term Loan had a balance of $7.45 million and any payoff of this amount would trigger a payment of the incremental unpaid portion of the $640 thousand contractually guaranteed interest due through April 30, 2017 plus a $240 thousand exit fee. The loan is payable April 30, 2017; however with a principal payment of $450 thousand, the loan can be extended until April 30, 2018. The entire principal balance of $7.45 million is includedSeries D Asset Coverage Test. Included in the $17.4$39.81 million of debt maturities dueand principal payments is the $15.53 million maturity of the KeyBank Line of Credit. Management is in the process of refinancing properties off the KeyBank Line of Credit to reduce the line to under $52.50 million prior to December 31, 2017 described above.July 1, 2018 in accordance with the Amended and Restated Credit Agreement. Management is in the process of reviewing a term sheet for the refinancing of the Revere Loan, Shoppes at Eagle Harbor and Riversedge, approximately $11.11 million. The KeyBank Line of Credit and all loans due are collateralized by properties within our portfolio. Management is currently working with lenders to refinance these loans. Based on our proven ability to refinance debt and obtain alternative sources of capital, and existing market conditions, we believe it to be probable that our plans to meet these obligations will be successful.
In 2016,addition to refinancing of debt, the Company raised $23.38 million and $52.38 millionis in the process of marketing the seven undeveloped non-income producing land parcels. The proceeds can be used to pay debt in addition to a savings of approximately $52 thousand annually in net proceedsoperating income, primarily a result of real estate taxes. As part of an overall cost reduction strategy, the Company plans to close the Charleston office a savings of $100 thousand annually. The Company continues to work to increase cash flows from the Series B Preferred Stockproperties through increasing occupancy by reducing tenant turnover, obtaining rental rate increases on new leases and Series D Preferred Stock offerings, respectively. The proceeds were primarily used for the paydown of the Key Bank Credit Agreement and acquisition of nine properties for a total purchase price of $115.3 million paid through a combination of cash, debt and common units.
monitoring operating expenses.
Our success in refinancing the debt, and executing on our growth strategy will dictate our liquidity needs going forward. If we are unable to execute in these areas, our ability to grow and pay future dividends may be limited without additional capital.
We believe significant opportunities exist in the current commercial real estate environment that will enable us to sufficiently leverage our capital and execute our growth plan. Several factors are contributing to an increased supply in available properties for acquisition, including a significant level of maturities of CMBS debt, strategic shifts by larger REITs to reduce debt levels and exit certain markets, and the negative impact on the real estate industry as a result of the economic downtown experienced in recent years. We believe the public REIT model provides a unique growth vehicle whereby we can either acquire properties through traditional third party acquisitions using a combination of cash generated in the capital markets and debt financing; contributions of properties by third parties in exchange for common units issued by the Operating Partnership; and contributions of existing properties owned by Mr. Wheeler and his affiliates in exchange for common units issued by the Operating Partnership. Additionally, access to public market capital enhances our ability to formulate acquisition structures and terms that better meet our growth strategies.
In addition to liquidity required to fund debt payments distributions and acquisitions,distributions we may incur some level of capital expenditures during the year for our existing properties that cannot be passed on to our tenants. The majority of these expenditures occur subsequent to acquiring a new property that requires significant improvements to maximize occupancy and lease rates, with an existing property that needs a facelift to improve its marketability or when tenant improvements are required to make a space fit a particular tenant’s needs. Significant capital expenditures could also impact our ability to grow and pay future dividends.
Off-Balance Sheet Arrangements
As of December 31, 2016,2017, we have no off-balance sheet arrangements that are likely to have a material effect on our financial condition, revenues or expenses, results of operations, liquidity, capital resources or capital expenditures.
Contractual Obligations
As of December 31, 2017, we had the following material contractual obligations including estimated interest payments on our debt.
|
| | | | | | | | | | | | | | | | | | | |
| | Payments due by period |
| | Less than 1 year | | 1-3 years | | 3-5 years | | More than 5 years | | Total |
| | (in thousands) |
| Fixed-rate notes | $ | 19,149 |
| | $ | 20,227 |
| | $ | 7,441 |
| | $ | 169,423 |
| | $ | 216,240 |
|
| Adjustable-rate mortgages | 5,126 |
| | 24,380 |
| | — |
| | — |
| | 29,506 |
|
| Floating-rate line of credit | 15,532 |
| | 52,500 |
| | — |
| | — |
| | 68,032 |
|
Interest payments (A) | 13,699 |
| | 21,016 |
| | 16,510 |
| | 18,074 |
| | 69,299 |
|
| Ground lease payments | 530 |
| | 932 |
| | 973 |
| | 9,666 |
| | 12,101 |
|
| Total | $ | 54,036 |
| | $ | 119,055 |
| | $ | 24,924 |
| | $ | 197,163 |
| | $ | 395,178 |
|
(A) Represents interest payments expected to be incurred on the Company's debt as of December 31, 2017. For adjustable-rate mortgages and the floating line of credit, the rate in effect at December 31, 2017 is assumed to remain in effect until the maturity of the respective obligation.
Contractual Obligations
|
| | | | | | | | | | | | | | | | | | | |
| | Payments due by period |
| | Less than 1 year | | 1-3 years | | 3-5 years | | More than 5 years | | Total |
| Fixed-rate notes | $ | 17,395,403 |
| | $ | 9,117,448 |
| | $ | 8,535,718 |
| | $ | 176,490,345 |
| | $ | 211,538,914 |
|
| Adjustable-rate notes | 51,766 |
| | 25,824,956 |
| | 2,205,003 |
| | — |
| | 28,081,725 |
|
| Fixed-rate notes, AFHS | — |
| | — |
| | 52,481 |
| | 1,297,519 |
| | 1,350,000 |
|
| Floating-rate line of credit | — |
| | 74,077,250 |
| | — |
| | — |
| | 74,077,250 |
|
| Ground lease payments | 520,199 |
| | 1,016,774 |
| | 905,593 |
| | 10,010,953 |
| | 12,453,519 |
|
| | $ | 17,967,368 |
| | $ | 110,036,428 |
| | $ | 11,698,795 |
| | $ | 187,798,817 |
| | $ | 327,501,408 |
|
Recent Accounting Pronouncements
See Note 2 to the consolidated financial statements beginning on page 82100 of this Annual Report on Form 10-K.
Year Ended December 31, 2017 Compared to the Year Ended December 31, 2016
Results of Operations
The following table presents a comparison of the consolidated statements of operations for the years ended December 31, 2017 and 2016, respectively (in thousands, except Property Data).
|
| | | | | | | | | | | | | | |
| | For the Years Ended December 31, | | Year over Year Changes |
| | 2017 | | 2016 | | $/# | | % |
| | |
| PROPERTY DATA: | | | | | | | |
Number of properties owned and leased at period end (1) | 64 |
| | 64 |
| | — |
| | — | % |
Aggregate gross leasable area at period end(1) | 4,902,381 |
| | 4,906,511 |
| | (4,130 | ) | | (0.08 | )% |
Occupancy rate at period end (1) | 91.9 | % | | 94.0 | % | | (2.1 | )% | | (2.23 | )% |
| FINANCIAL DATA: | | | | | | | |
| Rental revenues | $ | 44,156 |
| | $ | 33,165 |
| | $ | 10,991 |
| | 33.14 | % |
| Asset management fees | 927 |
| | 855 |
| | 72 |
| | 8.42 | % |
| Commissions | 899 |
| | 964 |
| | (65 | ) | | (6.74 | )% |
| Tenant reimbursements | 11,032 |
| | 8,649 |
| | 2,383 |
| | 27.55 | % |
| Development income | 537 |
| | 244 |
| | 293 |
| | 120.08 | % |
| Other revenues | 984 |
| | 283 |
| | 701 |
| | 247.70 | % |
| Total Revenue | 58,535 |
| | 44,160 |
| | 14,375 |
| | 32.55 | % |
| EXPENSES: | | | | | | | |
| Property operations | 15,389 |
| | 11,898 |
| | 3,491 |
| | 29.34 | % |
| Non-REIT management and leasing services | 927 |
| | 1,567 |
| | (640 | ) | | (40.84 | )% |
| Depreciation and amortization | 26,231 |
| | 20,637 |
| | 5,594 |
| | 27.11 | % |
| Provision for credit losses | 2,821 |
| | 425 |
| | 2,396 |
| | 563.76 | % |
| Impairment of notes receivable | 5,261 |
| | — |
| | 5,261 |
| | — | % |
| Corporate general & administrative | 7,364 |
| | 9,924 |
| | (2,560 | ) | | (25.80 | )% |
| Total Operating Expenses | 57,993 |
| | 44,451 |
| | 13,542 |
| | 30.47 | % |
| Operating Income (Loss) | 542 |
| | (291 | ) | | 833 |
| | 286.25 | % |
| Gain on disposal of properties | 1,021 |
| | — |
| | 1,021 |
| | — | % |
| Interest income | 1,443 |
| | 692 |
| | 751 |
| | 108.53 | % |
| Interest expense | (17,165 | ) | | (13,356 | ) | | (3,809 | ) | | (28.52 | )% |
| Net Loss from Continuing Operations Before Income Taxes | (14,159 | ) | | (12,955 | ) | | (1,204 | ) | | (9.29 | )% |
| Income tax expense | (137 | ) | | (107 | ) | | (30 | ) | | (28.04 | )% |
| Net Loss from Continuing Operations | (14,296 | ) | | (13,062 | ) | | (1,234 | ) | | (9.45 | )% |
| Discontinued Operations | | | | | | | |
| Income from discontinued operations | 16 |
| | 136 |
| | (120 | ) | | (88.24 | )% |
| Gain on disposal of properties | 1,502 |
| | 688 |
| | 814 |
| | 118.31 | % |
| Net Income from Discontinued Operations | 1,518 |
| | 824 |
| | 694 |
| | 84.22 | % |
| Net Loss | (12,778 | ) | | (12,238 | ) | | (540 | ) | | (4.41 | )% |
| Net loss attributable to noncontrolling interests | (684 | ) | | (1,035 | ) | | 351 |
| | 33.91 | % |
| Net Loss Attributable to Wheeler REIT | $ | (12,094 | ) | | $ | (11,203 | ) | | $ | (891 | ) | | (7.95 | )% |
(1) Excludes the undeveloped land parcels and Riversedge North, our corporate headquarters, and the redevelopment property. Includes assets held for
sale.
Total Revenue
Total revenue was $58.54 million for the year ended December 31, 2017 compared to $44.16 million for the year ended December 31, 2016, a $14.38 million increase. The increase in rental revenues and tenant reimbursements of $13.37 million is attributable to a full period of operations reported for the twenty-three retail acquisitions made during the year ended December 31, 2016. The increase in development income and other revenues is due to $293 thousand of incremental development fees for the Sea Turtle Development along with $701 thousand of incremental lease termination fees, of which $460 thousand is a result of the BI-LO closure at Shoppes at Myrtle Park.
Total Operating Expenses
Total operating expenses for the year ended December 31, 2017 were $57.99 million, representing an increase of $13.54 million over the year ended December 31, 2016. Total operating expenses increased due to a non-cash impairment charge of $5.26 million on notes receivable to Sea Turtle Development along with an increase of $2.40 million in provision for credit losses primarily attributable to Sea Turtle Development and other related party receivables. Overall increases of $5.59 million were noted in depreciation and amortization and $3.49 million in property operations resulting from the additional expenses associated with the twenty-three retail properties acquired in 2016. These amounts were offset by a decrease of $2.56 million in general and administrative expenses. General and administrative expenses during the year ended December 31, 2017 included approximately $2.04 million of non-recurring expenses related to acquisitions, capital events and other miscellaneous costs.
Gain on Disposal of Properties - Operations
Gain on disposal of properties from continuing operations was $1.02 million for the year ended December 31, 2017, which represents an increase of $1.02 million. The increase is primarily attributed to the sale of the Steak n' Shake, a 1.06 acre outparcel at Rivergate.
Interest Income
Interest income was $1.44 million for the year ended December 31, 2017, which represents an increase of $751 thousand as compared to $692 thousand for the year ended December 31, 2016. The increase is primarily attributed to interest income on the Sea Turtle Development note receivable earned during the year ended December 31, 2017. Accrued interest income of $443 thousand, currently due and $895 thousand, due at maturity related to Sea Turtle Development was reserved at December 31, 2017 and included in provision for credit losses.
Interest Expense
Interest expense increased $3.81 million or 28.52% for the year ended December 31, 2017, compared to $13.36 million for the year ended December 31, 2016. The increase is primarily attributed to the incremental debt service associated with the additional borrowings utilized to acquire the twenty-three retail properties representing new stores since January 1, 2016.
Discontinued Operations
Net income from discontinued operations totaled $1.52 million for the year ended December 31, 2017, compared to a net income of $824 thousand for the year ended December 31, 2016. The income for both years primarily resulted from the gain on sale of assets held for sale. Starbucks/Verizon was sold in 2016 while Ruby Tuesday’s and Outback Steakhouse at Pierpont Centre was sold in 2017.
Same Store and New Store Operating Income
Net operating income (“NOI”) is a widely-used non-GAAP financial measure for REITs. The Company believes that NOI is a useful measure of the Company's property operating performance. The Company defines NOI as property revenues (rental and other revenues) less property and related expenses (property operation and maintenance and real estate taxes). Because NOI excludes general and administrative expenses, depreciation and amortization, interest expense, interest income, provision for income taxes, gain or loss on sale or capital expenditures and leasing costs, it provides a performance measure,
that when compared year over year, reflects the revenues and expenses directly associated with owning and operating commercial real estate properties and the impact to operations from trends in occupancy rates, rental rates and operating costs, providing perspective not immediately apparent from net income. The Company uses NOI to evaluate its operating performance since NOI allows the Company to evaluate the impact of factors, such as occupancy levels, lease structure, lease rates and tenant base, have on the Company's results, margins and returns. NOI should not be viewed as a measure of the Company's overall financial performance since it does not reflect general and administrative expenses, depreciation and amortization, involuntary conversion, interest expense, interest income, provision for income taxes, gain or loss on sale or disposition of assets, and the level of capital expenditures and leasing costs necessary to maintain the operating performance of the Company's properties. Other REITs may use different methodologies for calculating NOI, and accordingly, the Company's NOI may not be comparable to that of other REITs.
The following table is a reconciliation of same store and new store NOI from the most directly comparable GAAP financial measure of net income (loss). Same stores consist of those properties we owned during all periods presented in their entirety, while new stores consist of those properties acquired during the periods presented. The discussion below focuses on same store results of operations since the twenty-three 2016 retail acquisitions occurred at various points throughout the respective periods but have a full annual period of results in 2017.
Same store discontinued operations financial information reflects the activity for the following properties:
Outback Steakhouse and Ruby Tuesday ground leases at Pierpont Centre (acquired January 14, 2015, sold February 28, 2017)
|
| | | | | | | | | | | | | | | | | | | | | | | |
| | Years Ended December 31, |
| | Same Store | | New Store | | Total |
| | 2017 | | 2016 | | 2017 | | 2016 | | 2017 | | 2016 |
| | (in thousands) |
| Net Loss | $ | (10,770 | ) | | $ | (10,402 | ) | | $ | (2,008 | ) | | $ | (1,836 | ) | | $ | (12,778 | ) | | $ | (12,238 | ) |
| Adjustments: | | | | | | | | | | | |
| Net Income from Discontinued Operations | (1,518 | ) | | (824 | ) | | — |
| | — |
| | (1,518 | ) | | (824 | ) |
| Income tax expense | 137 |
| | 107 |
| | — |
| | — |
| | 137 |
| | 107 |
|
| Interest expense | 10,488 |
| | 10,582 |
| | 6,677 |
| | 2,774 |
| | 17,165 |
| | 13,356 |
|
| Interest income | (1,442 | ) | | (692 | ) | | (1 | ) | | — |
| | (1,443 | ) | | (692 | ) |
| Loss (gain) on disposal of properties | 12 |
| | — |
| | (1,033 | ) | | — |
| | (1,021 | ) | | — |
|
| Corporate general & administrative | 7,026 |
| | 8,816 |
| | 338 |
| | 1,108 |
| | 7,364 |
| | 9,924 |
|
| Provision for credit losses | 2,711 |
| | 422 |
| | 110 |
| | 3 |
| | 2,821 |
| | 425 |
|
| Impairment of notes receivable | 5,261 |
| | — |
| | — |
| | — |
| | 5,261 |
| | — |
|
| Depreciation and amortization | 14,749 |
| | 17,388 |
| | 11,482 |
| | 3,249 |
| | 26,231 |
| | 20,637 |
|
| Non-REIT management and leasing services | 927 |
| | 1,567 |
| | — |
| | — |
| | 927 |
| | 1,567 |
|
| Development income | (537 | ) | | (244 | ) | | — |
| | — |
| | (537 | ) | | (244 | ) |
| Asset management and commission revenues | (1,826 | ) | | (1,819 | ) | | — |
| | — |
| | (1,826 | ) | | (1,819 | ) |
| Property Net Operating Income | $ | 25,218 |
| | $ | 24,901 |
| | $ | 15,565 |
| | $ | 5,298 |
| | $ | 40,783 |
| | $ | 30,199 |
|
| | | | | | | | | | | | |
| Property revenues | $ | 34,797 |
| | $ | 34,865 |
| | $ | 21,375 |
| | $ | 7,232 |
| | $ | 56,172 |
| | $ | 42,097 |
|
| Property expenses | 9,579 |
| | 9,964 |
| | 5,810 |
| | 1,934 |
| | 15,389 |
| | 11,898 |
|
| Property Net Operating Income | $ | 25,218 |
| | $ | 24,901 |
| | $ | 15,565 |
| | $ | 5,298 |
| | $ | 40,783 |
| | $ | 30,199 |
|
Property Revenues
Total same store property revenues for the year ended December 31, 2017 were relatively flat at $34.80 million, compared to $34.87 million for the year ended December 31, 2016.
The year ended December 31, 2017 represents a full period of operations reported for the twenty-three retail acquisitions made in 2016. These properties (new stores) contributed $21.38 million in revenues for the year ended December 31, 2017, compared to $7.23 million in revenue for the year ended December 31, 2016.
Property Expenses
Total same store property expenses for the year ended December 31, 2017 were $9.58 million, compared to $9.96 million for the year ended December 31, 2016, representing a decrease of $385 thousand or 3.86%. The decrease was primarily due to decreases in real estate taxes and grounds and landscaping. Total property expenses increased primarily due to new store increases of $1.93 million.
There were no significant unusual or non-recurring items included in new store property expenses for the year ended December 31, 2017.
Property Net Operating Income
Total property net operating income was $40.78 million for the year ended December 31, 2017, compared to $30.20 million for the year ended December 31, 2016 representing an increase of $10.58 million over 2016. New stores accounted for the majority of this increases by generating $15.57 million in property net operating income for the year ended December 31, 2017, compared to $5.30 million for the year ended December 31, 2016.
Funds from Operations
We use FFO, a non-GAAP measure, as an alternative measure of our operating performance, specifically as it relates to results of operations and liquidity. We compute FFO in accordance with standards established by the Board of Governors of NAREIT in its March 1995 White Paper (as amended in November 1999 and April 2002). As defined by NAREIT, FFO represents net income (computed in accordance with GAAP), excluding gains (or losses) from sales of property, plus real estate related depreciation and amortization (excluding amortization of loan origination costs) and after adjustments for unconsolidated partnerships and joint ventures. Most industry analysts and equity REITs, including us, consider FFO to be an appropriate supplemental measure of operating performance because, by excluding gains or losses on dispositions and excluding depreciation, FFO is a helpful tool that can assist in the comparison of the operating performance of a company’s real estate between periods, or as compared to different companies. Management uses FFO as a supplemental measure to conduct and evaluate our business because there are certain limitations associated with using GAAP net income alone as the primary measure of our operating performance. Historical cost accounting for real estate assets in accordance with GAAP implicitly assumes that the value of real estate assets diminishes predictably over time, while historically real estate values have risen or fallen with market conditions. Accordingly, we believe FFO provides a valuable alternative measurement tool to GAAP when presenting our operating results
Below is a comparison of same store FFO, which is a non-GAAP measurement, for the years ended December 31, 2017 and 2016 (in thousands):
|
| | | | | | | | | | | | | | | | | | | | | | | | | | | | | | |
| | Years Ended December 31, |
| | Same Stores | | New Stores | | Total | | Year Over Year Changes |
| | 2017 | | 2016 | | 2017 | | 2016 | | 2017 | | 2016 | | $ | | % |
| Net loss | $ | (10,770 | ) | | $ | (10,402 | ) | | $ | (2,008 | ) | | $ | (1,836 | ) | | $ | (12,778 | ) | | $ | (12,238 | ) | | $ | (540 | ) | | (4.41 | )% |
| Depreciation and amortization of real estate assets | 14,749 |
| | 17,388 |
| | 11,482 |
| | 3,249 |
| | 26,231 |
| | 20,637 |
| | 5,594 |
| | 27.11 | % |
| Loss (gain) on disposal of properties | 12 |
| | — |
| | (1,033 | ) | | — |
| | (1,021 | ) | | — |
| | (1,021 | ) | | — | % |
| Gain on disposal of properties-discontinued operations | (1,502 | ) | | (688 | ) | | — |
| | — |
| | (1,502 | ) | | (688 | ) | | (814 | ) | | (118.31 | )% |
| FFO | $ | 2,489 |
| | $ | 6,298 |
| | $ | 8,441 |
| | $ | 1,413 |
| | $ | 10,930 |
| | $ | 7,711 |
| | $ | 3,219 |
| | 41.75 | % |
During the year ended December 31, 2017, same store FFO decreased $3.81 million, primarily due to $5.26 million non-cash impairment charges on notes receivable and an increase of $2.40 million in provision for credit losses offset by
decreases of $1.79 million in corporate general and administrative expenses, increases in property net operating income of $317 thousand, and an increase in interest income of $750 thousand. Total FFO increased $3.22 million, for the year ended December 31, 2017, primarily due to the expansion of operations resulting from the twenty-three acquisitions occurring subsequent to January 1, 2016, representing new stores, that contributed incremental FFO of $7.03 million when compared to the year ended December 31, 2016.
We believe that the computation of FFO in accordance with NAREIT’s definition includes certain items that are not indicative of the results provided by our operating portfolio and affect the comparability of our period-over-period performance. These items include, but are not limited to, legal settlements, non-cash share-based compensation expense, non-cash amortization on loans and acquisition costs. Therefore, in addition to FFO, management uses AFFO, which we define to exclude such items. Management believes that these adjustments are appropriate in determining AFFO as they are not indicative of the operating performance of our assets. In addition, we believe that AFFO is a useful supplemental measure for the investing community to use in comparing us to other REITs as many REITs provide some form of adjusted or modified FFO. However, there can be no assurance that AFFO presented by us is comparable to the adjusted or modified FFO of other REITs.
Total AFFO for the years ended December 31, 2017 and 2016 is shown in the table below (in thousands):
|
| | | | | | | |
| | Years Ended December 31, |
| | 2017 | | 2016 |
| FFO | $ | 10,930 |
| | $ | 7,711 |
|
| Preferred Stock dividends | (9,969 | ) | | (4,713 | ) |
| Preferred Stock accretion adjustments | 809 |
| | 417 |
|
| FFO available to common shareholders and common unitholders | 1,770 |
| | 3,415 |
|
| Impairment of notes receivable | 5,261 |
| | — |
|
| Acquisition costs | 1,101 |
| | 2,029 |
|
| Capital related costs | 663 |
| | 514 |
|
| Other non-recurring and non-cash expenses | 294 |
| | 664 |
|
| Share-based compensation | 870 |
| | 1,454 |
|
| Straight-line rent | (712 | ) | | (386 | ) |
| Loan cost amortization | 3,087 |
| | 2,126 |
|
| Accrued interest income | 415 |
| | (415 | ) |
| Above/below market lease amortization | 453 |
| | 29 |
|
| Recurring capital expenditures and tenant improvement reserves | (941 | ) | | (760 | ) |
| AFFO | $ | 12,261 |
| | $ | 8,670 |
|
Acquisition expenses of $1.10 million and $2.03 million at December 31, 2017 and 2016, respectively, were primarily related to $591 thousand and $433 thousand, for the years ended December 31, 2017 and 2016, respectively, of compensation paid to personnel working directly on acquisitions related activities and other costs associated with due diligence of potential acquisitions currently in our pipeline. Other nonrecurring and non-cash expenses are miscellaneous costs we believe will not be incurred on a going forward basis including expenses such as vacation accrual, severance and consulting fees which are no longer under contract and are not expected to be under contract for the foreseeable future. Accrued interest income represents interest income due at maturity for the year ended December 31, 2016 which has been fully reserved as of December 31, 2017 and included as reduction to FFO as of December 31, 2017.
Impairment on notes receivable relates to a non-cash impairment charge of $5.26 million on notes receivable related to Sea Turtle Development that is not indicative of our core portfolio of properties and future operations.
The preferred stock accretion adjustments represent the amortization of offering costs associated with raising the Series B Preferred Stock and Series D Preferred Stock.
Year Ended December 31, 2016 Compared to the Year Ended December 31, 2015
Results of Operations
The following table presents a comparison of the consolidated statements of operations for the years ended December 31, 2016 and 2015, respectively.respectively (in thousands, except Property Data).
| | | | For the Years Ended December 31, | | Year over Year Changes | For the Years Ended December 31, | | Year over Year Changes |
| | 2016 | | 2015 | | $/# | | % | 2016 | | 2015 | | $/# | | % |
| PROPERTY DATA: | | | | | | | | | | | | | | |
Number of properties owned and leased at period end (1) | 64 |
| | 42 |
| | 22 |
| | 52.38 | % | 64 |
| | 42 |
| | 22 |
| | 52.38 | % |
Aggregate gross leasable area at period end(1) | 4,906,511 |
| | 3,151,358 |
| | 1,755,153 |
| | 55.70 | % | 4,906,511 |
| | 3,151,358 |
| | 1,755,153 |
| | 55.70 | % |
Occupancy rate at period end (1) | 94.0 | % | | 94.2 | % | | — |
| | (0.2 | )% | 94.0 | % | | 94.2 | % | | — |
| | (0.22 | )% |
| FINANCIAL DATA: | | | | | | | | | | | | | | |
| Rental revenues | $ | 33,164,924 |
| | $ | 20,553,870 |
| | $ | 12,611,054 |
| | 61.36 | % | $ | 33,165 |
| | $ | 20,554 |
| | $ | 12,611 |
| | 61.36 | % |
| Asset management fees | 854,857 |
| | 588,990 |
| | 265,867 |
| | 45.14 | % | 855 |
| | 589 |
| | 266 |
| | 45.16 | % |
| Commissions | 963,936 |
| | 361,984 |
| | 601,952 |
| | 166.29 | % | 964 |
| | 362 |
| | 602 |
| | 166.30 | % |
| Other non-property income | 244,084 |
| | — |
| | 244,084 |
| | — | % | |
| Tenant reimbursements and other revenues | 8,932,607 |
| | 6,110,614 |
| | 2,821,993 |
| | 46.18 | % | |
| Tenant reimbursements | | 8,649 |
| | 5,885 |
| | 2,764 |
| | 46.97 | % |
| Development income | | 244 |
| | — |
| | 244 |
| | — | % |
| Other revenues | | 283 |
| | 225 |
| | 58 |
| | 25.78 | % |
| Total Revenue | 44,160,408 |
| | 27,615,458 |
| | 16,544,950 |
| | 59.91 | % | 44,160 |
| | 27,615 |
| | 16,545 |
| | 59.91 | % |
| EXPENSES: | | | | | | | | | | | | | | |
| Property operations | 11,898,190 |
| | 8,351,456 |
| | 3,546,734 |
| | 42.47 | % | 11,898 |
| | 8,351 |
| | 3,547 |
| | 42.47 | % |
| Non-REIT management and leasing services | 1,567,128 |
| | 1,174,833 |
| | 392,295 |
| | 33.39 | % | 1,567 |
| | 1,175 |
| | 392 |
| | 33.36 | % |
| Depreciation and amortization | 20,636,940 |
| | 16,882,462 |
| | 3,754,478 |
| | 22.24 | % | 20,637 |
| | 16,882 |
| | 3,755 |
| | 22.24 | % |
| Provision for credit losses | 424,925 |
| | 243,029 |
| | 181,896 |
| | 74.85 | % | 425 |
| | 243 |
| | 182 |
| | 74.90 | % |
| Corporate general & administrative | 9,924,361 |
| | 13,415,961 |
| | (3,491,600 | ) | | (26.03 | )% | 9,924 |
| | 13,416 |
| | (3,492 | ) | | (26.03 | )% |
| Total Operating Expenses | 44,451,544 |
| | 40,067,741 |
| | 4,383,803 |
| | 10.94 | % | 44,451 |
| | 40,067 |
| | 4,384 |
| | 10.94 | % |
| Operating Loss | (291,136 | ) | | (12,452,283 | ) | | 12,161,147 |
| | 97.66 | % | (291 | ) | | (12,452 | ) | | 12,161 |
| | 97.66 | % |
| Interest income | 691,937 |
| | 118,747 |
| | 573,190 |
| | 482.70 | % | 692 |
| | 119 |
| | 573 |
| | 481.51 | % |
| Interest expense | (13,356,111 | ) | | (9,043,761 | ) | | (4,312,350 | ) | | (47.68 | )% | (13,356 | ) | | (9,044 | ) | | (4,312 | ) | | (47.68 | )% |
| Net Loss from Continuing Operations Before Income Taxes | (12,955,310 | ) | | (21,377,297 | ) | | 8,421,987 |
| | 39.40 | % | (12,955 | ) | | (21,377 | ) | | 8,422 |
| | 39.40 | % |
| Income tax expense | (107,464 | ) | | — |
| | (107,464 | ) | | — | % | (107 | ) | | — |
| | (107 | ) | | — | % |
| Net Loss from Continuing Operations | (13,062,774 | ) | | (21,377,297 | ) | | 8,314,523 |
| | 38.89 | % | (13,062 | ) | | (21,377 | ) | | 8,315 |
| | 38.90 | % |
| Discontinued Operations | | | | | | | | | | | | | | |
| Income from operations | 136,459 |
| | 499,781 |
| | (363,322 | ) | | (72.70 | )% | |
| Income from discontinued operations | | 136 |
| | 500 |
| | (364 | ) | | (72.80 | )% |
| Gain on disposal of properties | 688,289 |
| | 2,104,114 |
| | (1,415,825 | ) | | (67.29 | )% | 688 |
| | 2,104 |
| | (1,416 | ) | | (67.30 | )% |
| Net Income from Discontinued Operations | 824,748 |
| | 2,603,895 |
| | (1,779,147 | ) | | (68.33 | )% | 824 |
| | 2,604 |
| | (1,780 | ) | | (68.36 | )% |
| Net Loss | (12,238,026 | ) | | (18,773,402 | ) | | 6,535,376 |
| | 34.81 | % | (12,238 | ) | | (18,773 | ) | | 6,535 |
| | 34.81 | % |
| Net loss attributable to noncontrolling interests | (1,035,456 | ) | | (1,252,723 | ) | | 217,267 |
| | 17.34 | % | (1,035 | ) | | (1,253 | ) | | 218 |
| | 17.40 | % |
| Net Loss Attributable to Wheeler REIT | $ | (11,202,570 | ) | | $ | (17,520,679 | ) | | $ | 6,318,109 |
| | 36.06 | % | $ | (11,203 | ) | | $ | (17,520 | ) | | $ | 6,317 |
| | 36.06 | % |
(1) Excludes the undeveloped land parcels and Riversedge North, our corporate headquarters, and the redevelopment property. Includes assets held for
sale.
Total Revenue
Total revenue was $44.16 million for the year ended December 31, 2016 compared to $27.62 million for the year ended December 31, 2015, a $16.55 million increase. The increase in rental revenues and tenant reimbursements of $15.38 million is attributable to a full period of operations reported for the fifteen retail acquisitions made in 2015 and partial periods of operations for the twenty-three retail acquisitions made in the year ended December 31, 2016. Increases in development income and commissions is due to $244 thousand in development fees for the Sea Turtle Development and an increase of $602 thousand in leasing commissions.
Total Operating Expenses
Total operating expenses for the year ended December 31, 2016 were $44.45 million, representing an increase of $4.38 million over the year ended December 31, 2015. Total operating expenses increased due to an overall increase of $3.76 million in depreciation and amortization and $3.55 million in property operations resulting from the additional expenses associated with the thirty-eight retail properties acquired since January 1, 2015, offset by a decrease of $3.49 million in general and administrative expenses. General and administrative expenses during the year ended December 31, 2016 included approximately $3.21 million of non-recurring expenses related to acquisitions, capital events and other miscellaneous costs.
Interest Income
Interest income was $692 thousand for the year ended December 31, 2016, which represents an increase of $573 thousand million as compared to $119 thousand million for the year ended December 31, 2015. The increase is primarily attributed to interest income on the Sea Turtle Development note receivable earned during the year ended December 31, 2016.
Interest Expense
Interest expense increased $4.31 million or 47.68% for the year ended December 31, 2016, compared to $9.04 million for the year ended December 31, 2015. The increase is primarily attributed to the incremental debt service associated with the additional borrowings utilized to acquire the thirty-eight retail properties representing new stores since January 1, 2015.
Discontinued Operations
Net income from discontinued operations totaled $824 thousand for the year ended December 31, 2016, compared to a net income of $2.60 million for the year ended December 31, 2015. The income for both years primarily resulted from the gain on sale of assets held for sale. Harps at Harbor Point, Bixby Commons and Jenks Reasors were sold in 2015 while Starbucks/Verizon was sold in 2016.
Same Store and New Store Operating Income
NOI is a widely-used non-GAAP financial measure for REITs. The Company believes that NOI is a useful measure of the Company's property operating performance. The Company defines NOI as property revenues (rental and other revenues) less property and related expenses (property operation and maintenance and real estate taxes). Because NOI excludes general and administrative expenses, depreciation and amortization, interest expense, interest income, provision for income taxes, gain or loss on sale or capital expenditures and leasing costs, it provides a performance measure, that when compared year over year, reflects the revenues and expenses directly associated with owning and operating commercial real estate properties and the impact to operations from trends in occupancy rates, rental rates and operating costs, providing perspective not immediately apparent from net income. The Company uses NOI to evaluate its operating performance since NOI allows the Company to evaluate the impact of factors, such as occupancy levels, lease structure, lease rates and tenant base, have on the Company's results, margins and returns. NOI should not be viewed as a measure of the Company's overall financial performance since it does not reflect general and administrative expenses, depreciation and amortization, involuntary conversion, interest expense, interest income, provision for income taxes, gain or loss on sale or disposition of assets, and the level of capital expenditures and leasing costs necessary to maintain the operating performance of the Company's properties. Other REITs may use different methodologies for calculating NOI, and accordingly, the Company's NOI may not be comparable to that of other REITs.
The following table provides a reconciliation of same store and new store NOI from the most directly comparable GAAP financial information.measure, net income (loss). Same stores consist of those properties acquired we owned during all periods
presented in their entirety, while new stores consist of those properties acquired during the periods presented. The discussion below focuses on same store results of operations since all twenty-three of our 2016 retail acquisitions occurred subsequent to December 31, 2015.
Same store discontinued operations financial information reflects the activity of the following properties:
Harps at Harbor Point (acquired December 14, 2012, sold in 2015)
Bixby Commons (acquired June 11, 2013, sold in 2015)
Jenks Reasors (acquired September 25, 2013, sold in 2015)
Starbucks/Verizon (acquired October 21, 2013, sold in 2015)
2016)
New store discontinued operations financial information reflects the activity for the following properties:
Outback Steakhouse and Ruby Tuesday ground leases at Pierpont Centre (acquired January 14, 2015)
| | | | Years Ended December 31, | Years Ended December 31, |
| | Same Store | | New Store | | Total | Same Store | | New Store | | Total |
| | 2016 | | 2015 | | 2016 | | 2015 | | 2016 | | 2015 | 2016 | | 2015 | | 2016 | | 2015 | | 2016 | | 2015 |
| | | (in thousands) |
| Net Loss | | $ | (10,449 | ) | | $ | (13,921 | ) | | $ | (1,789 | ) | | $ | (4,852 | ) | | $ | (12,238 | ) | | $ | (18,773 | ) |
| Adjustments: | | | | | | | | | | | | |
| Net Income (Loss) from Discontinued Operations | | (715 | ) | | (2,610 | ) | | (109 | ) | | 6 |
| | (824 | ) | | (2,604 | ) |
| Income tax expense | | 107 |
| | — |
| | — |
| | — |
| | 107 |
| | — |
|
| Interest expense | | 9,571 |
| | 7,250 |
| | 3,785 |
| | 1,794 |
| | 13,356 |
| | 9,044 |
|
| Interest income | | (692 | ) | | (119 | ) | | — |
| | — |
| | (692 | ) | | (119 | ) |
| Corporate general & administrative | | 8,689 |
| | 12,410 |
| | 1,235 |
| | 1,006 |
| | 9,924 |
| | 13,416 |
|
| Provision for credit losses | | 344 |
| | 163 |
| | 81 |
| | 80 |
| | 425 |
| | 243 |
|
| Depreciation and amortization | | 7,068 |
| | 9,548 |
| | 13,569 |
| | 7,334 |
| | 20,637 |
| | 16,882 |
|
| Non-REIT management and leasing services | | 1,567 |
| | 1,175 |
| | — |
| | — |
| | 1,567 |
| | 1,175 |
|
| Development income | | (244 | ) | | — |
| | — |
| | — |
| | (244 | ) | | — |
|
| Asset management and commission revenues | | (1,819 | ) | | (951 | ) | | — |
| | — |
| | (1,819 | ) | | (951 | ) |
| Property Net Operating Income | | $ | 13,427 |
| | $ | 12,945 |
| | $ | 16,772 |
| | $ | 5,368 |
| | $ | 30,199 |
| | $ | 18,313 |
|
| | | | | | | | | | | | | |
| Property revenues | $ | 19,198,324 |
| | $ | 19,040,099 |
| | $ | 22,899,207 |
| | $ | 7,624,385 |
| | $ | 42,097,531 |
| | $ | 26,664,484 |
| $ | 19,198 |
| | $ | 19,040 |
| | $ | 22,899 |
| | $ | 7,624 |
| | $ | 42,097 |
| | $ | 26,664 |
|
| Property expenses | 5,770,471 |
| | 6,094,245 |
| | 6,127,719 |
| | 2,257,211 |
| | 11,898,190 |
| | 8,351,456 |
| 5,771 |
| | 6,095 |
| | 6,127 |
| | 2,256 |
| | 11,898 |
| | 8,351 |
|
| Property Net Operating Income | 13,427,853 |
| | 12,945,854 |
| | 16,771,488 |
| | 5,367,174 |
| | 30,199,341 |
| | 18,313,028 |
| $ | 13,427 |
| | $ | 12,945 |
| | $ | 16,772 |
| | $ | 5,368 |
| | $ | 30,199 |
| | $ | 18,313 |
|
| Asset management and commission revenues | 1,818,793 |
| | 950,974 |
| | — |
| | — |
| | 1,818,793 |
| | 950,974 |
| |
| Other non-property income | 244,084 |
| | — |
| | — |
| | — |
| | 244,084 |
| | — |
| |
| Other Income | 2,062,877 |
| | 950,974 |
| | — |
| | — |
| | 2,062,877 |
| | 950,974 |
| |
| Non-REIT management and leasing services | 1,567,128 |
| | 1,174,833 |
| | — |
| | — |
| | 1,567,128 |
| | 1,174,833 |
| |
| Depreciation and amortization | 7,068,209 |
| | 9,548,148 |
| | 13,568,731 |
| | 7,334,314 |
| | 20,636,940 |
| | 16,882,462 |
| |
| Provision for credit losses | 343,959 |
| | 163,270 |
| | 80,966 |
| | 79,759 |
| | 424,925 |
| | 243,029 |
| |
| Corporate general & administrative | 8,689,660 |
| | 12,410,146 |
| | 1,234,701 |
| | 1,005,815 |
| | 9,924,361 |
| | 13,415,961 |
| |
| Total Other Operating Expenses | 17,668,956 |
| | 23,296,397 |
| | 14,884,398 |
| | 8,419,888 |
| | 32,553,354 |
| | 31,716,285 |
| |
| Interest income | 691,822 |
| | 118,740 |
| | 115 |
| | 7 |
| | 691,937 |
| | 118,747 |
| |
| Interest expense | (9,571,443 | ) | | (7,249,810 | ) | | (3,784,668 | ) | | (1,793,951 | ) | | (13,356,111 | ) | | (9,043,761 | ) | |
| Net Loss from Continuing Operations Before Income Taxes | (11,057,847 | ) | | (16,530,639 | ) | | (1,897,463 | ) | | (4,846,658 | ) | | (12,955,310 | ) | | (21,377,297 | ) | |
| Income tax expense | (107,464 | ) | | — |
| | — |
| | — |
| | (107,464 | ) | | — |
| |
| Net Loss from Continuing Operations | (11,165,311 | ) | | (16,530,639 | ) | | (1,897,463 | ) | | (4,846,658 | ) | | (13,062,774 | ) | | (21,377,297 | ) | |
| Discontinued Operations | | | | | | | | | | | | |
| Income (loss) from operations | 27,538 |
| | 505,516 |
| | 108,921 |
| | (5,735 | ) | | 136,459 |
| | 499,781 |
| |
| Gain on disposal of properties | 688,289 |
| | 2,104,114 |
| | — |
| | — |
| | 688,289 |
| | 2,104,114 |
| |
| Net Income (Loss) from Discontinued Operations | 715,827 |
| | 2,609,630 |
| | 108,921 |
| | (5,735 | ) | | 824,748 |
| | 2,603,895 |
| |
| Net Loss | $ | (10,449,484 | ) | | $ | (13,921,009 | ) | | $ | (1,788,542 | ) | | $ | (4,852,393 | ) | | $ | (12,238,026 | ) | | $ | (18,773,402 | ) | |
Property Revenues
Total same store property revenues for the year ended December 31, 2016 were $19.20 million, compared to $19.04 million for the year ended December 31, 2015, representing an increase of $0.16 million, or 0.83%. Same store revenues fluctuated primarily due to positive rent spreads on renewals.
The year ended December 31, 2016 represents a full period of operations reported for the fifteen retail acquisitions made in 2015 and partial periods of operations for the twenty-three retail acquisitions made in the year ended December 31, 2016. These properties (new stores) contributed $22.90 million in revenues for the year ended December 31, 2016, compared to $7.62 million in revenue for the year ended December 31, 2015. Going forward we believe these properties will generate a significant amount of revenue for our company and we will benefit from future contractual rent increases.
Property Expenses
Total same store property expenses for the year ended December 31, 2016 were $5.77 million, compared to $6.09 million for the year ended December 31, 2015. The decrease was primarily due to a decrease in parking lot repairs of $340 thousand, a decrease in management fees of $80 thousand, offset by a $104 thousand increase in real estate taxes due to property reassessments of prior acquisitions and an increase of $85 thousand in insurance expense. Total property expenses increased primarily due to new store increases of $3.88 million.
There were no significant unusual or non-recurring items included in new store property expenses for the year ended December 31, 2016.
Property Net Operating Income
Total property net operating income was $30.20 million for the year ended December 31, 2016, compared to $18.31 million for the year ended December 31, 2015. The 2016 results represent an increase of $11.89 million over 2015 primarily due to the increases in property revenues discussed above. New stores accounted for the majority of these increases by generating $16.77 million in property net operating income for the year ended December 31, 2016, compared to $5.37 million for the year ended December 31, 2015.
Other Income
Total other income was $2.06 million for the year ended December 31, 2016 compared to $951 thousand for the year ended December 31, 2015, a $1.11 million increase due to $244 thousand in development fees for the Sea Turtle Development and an increase of $602 thousand in leasing commissions.
Other Operating Expenses
Same store other operating expenses for the year ended December 31, 2016 were $17.67 million, representing a decrease of $5.63 million over the year ended December 31, 2015. The decrease in same store other operating expenses for the year ended December 31, 2016 primarily resulted from a decrease of $2.48 million in depreciation and amortization and a decrease of $3.72 million in general and administrative expenses. The decrease in same store depreciation and amortization expense for the year ended December 31, 2016 resulted from additional assets becoming fully depreciated and amortized subsequent to the December 31, 2015 periods. The decrease in same store general and administrative expenses for the year ended December 31, 2016 primarily resulted from decreases in acquisition costs, capital related costs and professional fees. These decreases were offset by an increase of $0.39 million in Non-REIT management and leasing fees due to leasing of Sea Turtle Development for the year ended December 31, 2016.
Total other operating expenses increased by $0.84 million for the year ended December 31, 2016 due to an overall increase in depreciation and amortization resulting from the additional expense associated with the thirty-eight retail properties acquired since January 1, 2015, offset by a decrease in general and administrative expenses. General and administrative expenses during the year ended December 31, 2016 included approximately $3.21 million of non-recurring expenses related to acquisitions, capital events and other miscellaneous costs which are detailed below.
|
| | | | | |
| | | | 2016 |
| Acquisition costs | | | $ | 2,028,742 |
|
| Capital related costs | | | 513,562 |
|
| Other | | | 663,618 |
|
| | | | $ | 3,205,922 |
|
Acquisition expenses were primarily related to financial statement audits, appraisals and legal matters for the twenty-three 2016 acquisitions, and sourcing and due diligence of potential acquisitions currently in our pipeline. Other nonrecurring expenses are miscellaneous costs we believe will not be incurred on a going forward basis including severance pay and consultant expenses which are no longer under contract.
Interest Income
Same store interest income was $0.69 million for the year ended December 31, 2016, which represents an increase of $0.57 million as compared to $0.12 million for the year ended December 31, 2015. The increase is primarily attributed to interest income on the Sea Turtle Development note receivable earned during the year ended December 31, 2016.
Interest Expense
Same store interest expense increased $2.32 million or 32.02% for the year ended December 31, 2016, compared to $7.25 million for the year ended December 31, 2015. Same store interest expense is primarily attributable to incremental debt service associated with additional borrowings. Total interest expense for the year ended December 31, 2016 increased by $4.31 million. The increase is primarily attributed to the incremental debt service associated with the additional borrowings utilized to acquire the thirty-eight retail properties representing new stores since January 1, 2015.
Discontinued Operations
Net income from discontinued operations totaled $0.82 million for the year ended December 31, 2016, compared to a net income of $2.60 million for the year ended December 31, 2015. The income for both years primarily resulted from the gain on sale of assets held for sale. Harps at Harbor Point, Bixby Commons and Jenks Reasors were sold in 2015 while Starbucks/Verizon was sold in 2016.
Funds from Operations
We use Funds from Operations ("FFO"),FFO, a non-GAAP measure, as an alternative measure of our operating performance, specifically as it relates to results of operations and liquidity. We compute FFO in accordance with standards established by the Board of Governors of NAREIT in its March 1995 White Paper (as amended in November 1999 and April 2002). As defined by NAREIT, FFO represents net income (computed in accordance with GAAP), excluding gains (or losses) from sales of property, plus real estate related depreciation and amortization (excluding amortization of loan origination costs) and after adjustments for unconsolidated partnerships and joint ventures. Most industry analysts and equity REITs, including us, consider FFO to be an appropriate supplemental measure of operating performance because, by excluding gains or losses on dispositions and excluding depreciation, FFO is a helpful tool that can assist in the comparison of the operating performance of a company’s real estate between periods, or as compared to different companies. Management uses FFO as a supplemental measure to conduct and evaluate our business because there are certain limitations associated with using GAAP net income alone as the primary measure of our operating performance. Historical cost accounting for real estate assets in accordance with GAAP implicitly assumes that the value of real estate assets diminishes predictably over time, while historically real estate values have risen or fallen with market conditions. Accordingly, we believe FFO provides a valuable alternative measurement tool to GAAP when presenting our operating results.
Below is a comparison of same store FFO, which is a non-GAAP measurement, for the years ended December 31, 2016 and 2015:2015 (in thousands):
| | | | Years Ended December 31, | Years Ended December 31, |
| | Same Stores | | New Stores | | Total | | Year Over Year Changes | Same Stores | | New Stores | | Total | | Year Over Year Changes |
| | 2016 | | 2015 | | 2016 | | 2015 | | 2016 | | 2015 | | $ | | % | 2016 | | 2015 | | 2016 | | 2015 | | 2016 | | 2015 | | $ | | % |
| Net loss | $ | (10,449,484 | ) | | $ | (13,921,009 | ) | | $ | (1,788,542 | ) | | $ | (4,852,393 | ) | | $ | (12,238,026 | ) | | $ | (18,773,402 | ) | | $ | 6,535,376 |
| | 34.81 | % | $ | (10,449 | ) | | $ | (13,921 | ) | | $ | (1,789 | ) | | $ | (4,852 | ) | | $ | (12,238 | ) | | $ | (18,773 | ) | | $ | 6,535 |
| | 34.81 | % |
| Depreciation and amortization of real estate assets from continuing operations | 7,068,209 |
| | 9,548,148 |
| | 13,568,731 |
| | 7,334,314 |
| | 20,636,940 |
| | 16,882,462 |
| | 3,754,478 |
| | 22.24 | % | 7,068 |
| | 9,548 |
| | 13,569 |
| | 7,334 |
| | 20,637 |
| | 16,882 |
| | 3,755 |
| | 22.24 | % |
| Depreciation and amortization of real estate assets from discontinued operations | — |
| | 510,818 |
| | — |
| | 69,073 |
| | — |
| | 579,891 |
| | (579,891 | ) | | (100.00 | )% | — |
| | 511 |
| | — |
| | 69 |
| | — |
| | 580 |
| | (580 | ) | | (100.00 | )% |
| Depreciation of real estate assets | 7,068,209 |
| | 10,058,966 |
| | 13,568,731 |
| | 7,403,387 |
| | 20,636,940 |
| | 17,462,353 |
| | 3,174,587 |
| | 18.18 | % | |
| Depreciation and amortization of real estate assets | | 7,068 |
| | 10,059 |
| | 13,569 |
| | 7,403 |
| | 20,637 |
| | 17,462 |
| | 3,175 |
| | 18.18 | % |
| Gain on sale of discontinued operations | (688,289 | ) | | (2,104,114 | ) | | — |
| | — |
| | (688,289 | ) | | (2,104,114 | ) | | 1,415,825 |
| | 67.29 | % | (688 | ) | | (2,104 | ) | | — |
| | — |
| | (688 | ) | | (2,104 | ) | | 1,416 |
| | 67.29 | % |
| Total FFO | $ | (4,069,564 | ) | | $ | (5,966,157 | ) | | $ | 11,780,189 |
| | $ | 2,550,994 |
| | $ | 7,710,625 |
| | $ | (3,415,163 | ) | | $ | 11,125,788 |
| | 325.78 | % | |
| FFO | | $ | (4,069 | ) | | $ | (5,966 | ) | | $ | 11,780 |
| | $ | 2,551 |
| | $ | 7,711 |
| | $ | (3,415 | ) | | $ | 11,126 |
| | 325.78 | % |
During the year ended December 31, 2016, same store FFO increased $1.90 million, primarily due to decreases of $3.72 million in corporate general and administrative expenses, increases in property net operating income of $0.48 million, partially offset by increases in interest expense of $2.32 million. Total FFO increased $11.13 million, for the year ended December 31, 2016, primarily due to the expansion of operations resulting from the thirty-eight acquisitions occurring subsequent to January 1, 2015, representing new stores, that contributed incremental FFO of $9.23 million when compared to the year ended December 31, 2015.
We believe that the computation of FFO in accordance with NAREIT’s definition includes certain items that are not indicative of the results provided by our operating portfolio and affect the comparability of our period-over-period performance. These items include, but are not limited to, legal settlements, non-cash share-based compensation expense, non-cash amortization on loans and acquisition costs. Therefore, in addition to FFO, management uses AFFO, which we define to exclude such items. Management believes that these adjustments are appropriate in determining AFFO as they are not indicative of the operating performance of our assets. In addition, we believe that AFFO is a useful supplemental measure for the investing community to use in comparing us to other REITs as many REITs provide some form of adjusted or modified FFO. However, there can be no assurance that AFFO presented by us is comparable to the adjusted or modified FFO of other REITs.
Total AFFO for the years ended December 31, 2016 and 2015 is shown in the table below:
| | | | Years Ended December 31, | Years Ended December 31, |
| | 2016 | | 2015 | 2016 | | 2015 |
| FFO | $ | 7,710,625 |
| | $ | (3,415,163 | ) | $ | 7,711 |
| | $ | (3,415 | ) |
| Preferred Stock dividends | (4,713,169 | ) | | (13,627,532 | ) | (4,713 | ) | | (13,628 | ) |
| Preferred Stock accretion adjustments | 416,598 |
| | 8,925,221 |
| 417 |
| | 8,925 |
|
| FFO available to common shareholders and common unitholders | 3,414,054 |
| | (8,117,474 | ) | 3,415 |
| | (8,118 | ) |
| Acquisition costs | 2,028,742 |
| | 3,871,037 |
| 2,029 |
| | 3,871 |
|
| Capital related costs | 513,562 |
| | 2,655,474 |
| 514 |
| | 2,655 |
|
| Other non-recurring and non-cash expenses | 663,618 |
| | 770,757 |
| 664 |
| | 771 |
|
| Share-based compensation | 1,454,410 |
| | 547,000 |
| 1,454 |
| | 547 |
|
| Straight-line rent | (385,965 | ) | | (270,873 | ) | (386 | ) | | (271 | ) |
| Loan cost amortization | 2,125,582 |
| | 1,300,901 |
| 2,126 |
| | 1,301 |
|
| Accrued interest income | (415,025 | ) | | — |
| (415 | ) | | — |
|
| Above/below market lease amortization | 29,371 |
| | 616,665 |
| 29 |
| | 617 |
|
| Perimeter legal accrual | — |
| | 133,282 |
| — |
| | 133 |
|
| Recurring capital expenditures and tenant improvement reserves | (759,900 | ) | | (658,500 | ) | (760 | ) | | (659 | ) |
| AFFO | $ | 8,668,449 |
| | $ | 848,269 |
| $ | 8,670 |
| | $ | 847 |
|
Acquisition expenses were primarily related to financial statement audits, appraisals and legal matters for the twenty-three 2016 acquisitions, and sourcing and due diligence of potential acquisitions currently in our pipeline. Other nonrecurring expenses are miscellaneous costs we believe will not be incurred on a going forward basis including severance pay and consultant expenses which are no longer under contract.
Preferred Stock dividends for the year ended December 31, 2015 include approximately $1.98 million of dividends (excluding the impact of accretion adjustments) related to the Series C Preferred Stock. The Preferred Stock accretion adjustments represent the amortization of offering costs associated with raising the Series B, Series C, and Series D Preferred Stock. Other non-recurring expenses primarily relate to those costs that are related to miscellaneous items that we do not anticipate incurring on a going forward basis.
Year Ended December 31, 2015 Compared to the Year Ended December 31, 2014
Results of Operations
The following table presents a comparison of the consolidated statements of operations for the years ended December 31, 2015 and 2014, respectively.
|
| | | | | | | | | | | | | | |
| | For the Years Ended December 31, | | Year over Year Changes |
| | 2015 | | 2014 | | $/# | | % |
| PROPERTY DATA: | | | | | | | |
Number of properties owned and operated (1) | 42 |
| | 30 |
| | 12 |
| | 40.00 | % |
Aggregate gross leasable area (1) | 3,151,358 |
| | 1,904,146 |
| | 1,247,212 |
| | 65.50 | % |
Ending occupancy rate (1) | 94.2 | % | | 95.6 | % | | — |
| | (1.50 | )% |
| FINANCIAL DATA: | | | | | | | |
| Rental revenues | $ | 20,553,870 |
| | $ | 11,348,955 |
| | $ | 9,204,915 |
| | 81.11 | % |
| Asset management fees | 588,990 |
| | 296,290 |
| | 292,700 |
| | 98.79 | % |
| Commissions | 361,984 |
| | 158,876 |
| | 203,108 |
| | 127.84 | % |
| Tenant reimbursements and other revenues | 6,110,614 |
| | 3,046,657 |
| | 3,063,957 |
| | 100.57 | % |
| Total Revenue | 27,615,458 |
| | 14,850,778 |
| | 12,764,680 |
| | 85.95 | % |
| EXPENSES: | | | | | | | |
| Property operations | 8,351,456 |
| | 4,123,439 |
| | 4,228,017 |
| | 102.54 | % |
| Non-REIT management and leasing services | 1,174,833 |
| | — |
| | 1,174,833 |
| | — | % |
| Depreciation and amortization | 16,882,462 |
| | 7,387,729 |
| | 9,494,733 |
| | 128.52 | % |
| Provision for credit losses | 243,029 |
| | 60,841 |
| | 182,188 |
| | 299.45 | % |
| Corporate general & administrative | 13,415,961 |
| | 9,447,010 |
| | 3,968,951 |
| | 42.01 | % |
| Total Operating Expenses | 40,067,741 |
| | 21,019,019 |
| | 19,048,722 |
| | 90.63 | % |
| Operating Loss | (12,452,283 | ) | | (6,168,241 | ) | | (6,284,042 | ) | | (101.88 | )% |
| Interest income | 118,747 |
| | 23,315 |
| | 95,432 |
| | 409.32 | % |
| Interest expense | (9,043,761 | ) | | (5,908,548 | ) | | (3,135,213 | ) | | (53.06 | )% |
| Net Loss from Continuing Operations | (21,377,297 | ) | | (12,053,474 | ) | | (9,323,823 | ) | | (77.35 | )% |
| Discontinued Operations | | | | | | | |
| Income from operations | 499,781 |
| | 307,659 |
| | 192,122 |
| | 62.45 | % |
| Gain on disposal of properties | 2,104,114 |
| | — |
| | 2,104,114 |
| | — | % |
| Net Income from Discontinued Operations | 2,603,895 |
| | 307,659 |
| | 2,296,236 |
| | 746.36 | % |
| Net Loss | (18,773,402 | ) | | (11,745,815 | ) | | (7,027,587 | ) | | (59.83 | )% |
| Net loss attributable to noncontrolling interests | (1,252,723 | ) | | (1,195,560 | ) | | (57,163 | ) | | (4.78 | )% |
| Net Loss Attributable to Wheeler REIT | $ | (17,520,679 | ) | | $ | (10,550,255 | ) | | $ | (6,970,424 | ) | | (66.07 | )% |
(1) Excludes the undeveloped land parcels and Riversedge North, our corporate headquarters, and the redevelopment property. Includes assets held for
sale.
Same Store and New Store Operating Income
The following table provides same store and new store financial information. Same stores consist of those properties we owned during all periods presented in their entirety, while new stores consist of those properties acquired during the periods presented.
Same store discontinued operations financial information reflects the activity of the following properties:
Harps at Harbor Point (acquired December 14, 2012)
Bixby Commons (acquired June 11, 2013)
Jenks Reasors (acquired September 25, 2013)
Starbucks/Verizon (acquired October 21, 2013)
New store discontinued operations financial information reflects the activity for the following entities:
Outback Steakhouse and Ruby Tuesday ground leases at Pierpont Centre (acquired January 14, 2015)
The following table provides same store and new store financial information. |
| | | | | | | | | | | | | | | | | | | | | | | |
| | Years Ended December 31, |
| | Same Store | | New Store | | Total |
| | 2015 | | 2014 | | 2015 | | 2014 | | 2015 | | 2014 |
| Property revenues | $ | 12,665,368 |
| | $ | 12,202,705 |
| | $ | 13,999,116 |
| | $ | 2,192,907 |
| | $ | 26,664,484 |
| | $ | 14,395,612 |
|
| Property expenses | 3,919,921 |
| | 3,595,182 |
| | 4,431,535 |
| | 528,257 |
| | 8,351,456 |
| | 4,123,439 |
|
| Property Net Operating Income | 8,745,447 |
| | 8,607,523 |
| | 9,567,581 |
| | 1,664,650 |
| | 18,313,028 |
| | 10,272,173 |
|
| Asset management and commission revenues | — |
| | — |
| | 950,974 |
| | 455,166 |
| | 950,974 |
| | 455,166 |
|
| Other Income | — |
| | — |
| | 950,974 |
| | 455,166 |
| | 950,974 |
| | 455,166 |
|
| Non-REIT management and leasing services | — |
| | — |
| | 1,174,833 |
| | — |
| | 1,174,833 |
| | — |
|
| Depreciation and amortization | 5,428,204 |
| | 5,903,392 |
| | 11,454,258 |
| | 1,484,337 |
| | 16,882,462 |
| | 7,387,729 |
|
| Provision for credit losses | 151,997 |
| | 41,624 |
| | 91,032 |
| | 19,217 |
| | 243,029 |
| | 60,841 |
|
| Corporate general & administrative | 11,316,307 |
| | 5,235,451 |
| | 2,099,654 |
| | 4,211,559 |
| | 13,415,961 |
| | 9,447,010 |
|
| Total Other Operating Expenses | 16,896,508 |
| | 11,180,467 |
| | 14,819,777 |
| | 5,715,113 |
| | 31,716,285 |
| | 16,895,580 |
|
| Interest income | 118,478 |
| | 23,296 |
| | 269 |
| | 19 |
| | 118,747 |
| | 23,315 |
|
| Interest expense | (5,001,840 | ) | | (5,112,038 | ) | | (4,041,921 | ) | | (796,510 | ) | | (9,043,761 | ) | | (5,908,548 | ) |
| Net Loss from Continuing Operations | (13,034,423 | ) | | (7,661,686 | ) | | (8,342,874 | ) | | (4,391,788 | ) | | (21,377,297 | ) | | (12,053,474 | ) |
| Discontinued Operations | | | | | | | | | | | |
| Income (loss) from operations | 505,516 |
| | 307,659 |
| | (5,735 | ) | | — |
| | 499,781 |
| | 307,659 |
|
| Gain on disposal of properties | 2,104,114 |
| | — |
| | — |
| | — |
| | 2,104,114 |
| | — |
|
| Net Income (Loss) from Discontinued Operations | 2,609,630 |
| | 307,659 |
| | (5,735 | ) | | — |
| | 2,603,895 |
| | 307,659 |
|
| Net Loss | $ | (10,424,793 | ) | | $ | (7,354,027 | ) | | $ | (8,348,609 | ) | | $ | (4,391,788 | ) | | $ | (18,773,402 | ) | | $ | (11,745,815 | ) |
Property Revenues
Total same store property revenue for the year ended December 31, 2015 was $12.67 million, compared to $12.20 million for the year ended December 31, 2014. Same store revenues increased primarily due to increases in tenant reimbursements, contractual rent adjustments, positive rent spreads on renewals and increases in occupancy. These increases were offset by Wheeler Interests ceasing to pay rent to Riversedge North due to the internalization of the Operating Companies. Riversedge North contributed $336,000 to property revenues for the year ended December 31, 2014. Excluding the impact of Riversedge North on the 2014 property revenues, same store property revenues increased approximately $894,000 for the year ended December 31, 2015 as compared to the prior period.
The year ended December 31, 2015 represents a full period of operations reported for the thirteen retail acquisitions made in 2014, and partial periods of operations for the twenty acquisitions made in the year ended December 31, 2015. These properties (new stores) contributed $14.00 million in revenues for the year ended December 31, 2015, compared to $2.19 million in revenue for the year ended December 31, 2014. Going forward we believe these properties will generate a significant amount of revenue for us and we will benefit from expansion opportunities.
Property Expenses
Total same store operating expenses for the year ended December 31, 2015 were $3.92 million, compared to $3.60 million for the year ended December 31, 2014. The increase was primarily due to approximately $139,000 of parking lot repairs, an increase of approximately $84,000 in real estate taxes due to property reassessments of prior acquisitions, and an increase of approximately $42,000 in insurance expense.
There were no significant unusual or non-recurring items included in new store property expenses for the year.
Property Net Operating Income
Total property net operating income was $18.31 million for the year ended December 31, 2015, compared to $10.27 million for the year ended December 31, 2014. The 2015 results represent an increase of $8.04 million over 2014 primarily due to the increases in property revenues discussed above. New stores accounted for the majority of these increases by generating $9.57 million in property net operating income for the year ended December 31, 2015, compared to $1.66 million for the year ended December 31, 2014. The increase in new store property net operating income primarily resulted from the timing of 2014 and 2015 acquisitions. The 2014 acquisitions occurred subsequent to June 30, 2014, while the twenty 2015 acquisitions occurred on or prior to September 30, 2015.
Other Operating Expenses
Same store other operating expenses for the year ended December 31, 2015 were $16.90 million, representing an increase of $5.72 million over the year ended December 31, 2014. The increase in same store operating expenses resulted from an increase of $6.08 million in general and administrative expenses, primarily relating to additional expenses associated with internalizing the Operating Companies in the fourth quarter of 2014, acquisition costs and capital related costs detailed below. This was offset by a decrease of $0.48 million in depreciation and amortization expense. The decrease in same store depreciation and amortization expense resulted from more assets becoming fully depreciated and amortized.
Total general and administrative expenses for the year ended December 31, 2015 increased by $3.97 million as compared to the 2014 period. Total general and administrative expenses of $13.42 million for the year ended December 31, 2015 included approximately $7.37 million of non-recurring expenses related to acquisitions, capital events, legal expenses, commissions, marketing, professional fees, employee recruitment and other miscellaneous items which are detailed below.
|
| | | | | |
| | | | 2015 |
| Acquisition costs | | | $ | 3,871,037 |
|
| Capital related costs | | | 2,655,474 |
|
| Perimeter legal accrual | | | 133,282 |
|
| Commission expenses | | | 51,159 |
|
| Marketing/promotional | | | 177,630 |
|
| Professional fees | | | 230,434 |
|
| Employee recruitment | | | 66,500 |
|
| Other | | | 180,906 |
|
| | | | $ | 7,366,422 |
|
Acquisition expenses were primarily related to financial statement audits, appraisals and legal matters for the acquisitions completed in the year ended December 31, 2015 and sourcing and due diligence of potential acquisitions currently in our pipeline. Capital related costs resulted from the March 2015 Series C Preferred Stock offering and subsequent conversion, and the Series A Preferred Stock and Series B Preferred Stock Exchange Offer completed in July 2015. General and administrative expenses for the year ended December 31, 2015 reflect the internalization of the Operating Companies, including approximately $3.38 million of compensation and benefits expenses in 2015 compared to $1.33 million that were incurred for only two months in 2014 and other operating costs resulting from internalizing the Operating Companies.
Interest Expense
Same store interest expense was $5.00 million for the year ended December 31, 2015, which represents a decrease of $0.11 million or 2.16%, as compared to $5.11 million for the year ended December 31, 2014. The decrease primarily resulted from the $3.00 million reduction in senior convertible debt, the repayment of the Lumber River loan and a decline in outstanding debt for same stores. Total interest expense for the year ended December 31, 2015 increased $3.14 million or 53.06% compared to the year ended December 31, 2014, primarily due to the issuance of $75.66 million and $46.68 million of acquisition-related debt in 2015 and 2014, respectively.
Discontinued Operations
Net income from discontinued operations totaled $2.60 million for the year ended December 31, 2015, compared to $0.31 million for the year ended December 31, 2014. The increase in net income is primarily a result of the 2015 sales of Jenks Reasors, Harps at Harbor Point and Bixby Commons which resulted in gains on sale totaling $2.10 million. Additionally, the increase in net income is a result of classifying the same store discontinued operation assets as assets held for sale in August 2015, which required us to no longer recognize depreciation and amortization for the remainder of 2015 compared to a full year of depreciation and amortization in 2014, resulting in a decrease of $0.25 million. The increase was also driven by a reduction in interest expense of $0.19 million due to the sales of Harps, Bixby Commons and Jenks Reasors in October 2015, compared to a full year of interest expense in 2014 and $0.13 million of rent from the Ruby Tuesday and Outback Steakhouse ground leases at Pierpont Centre. These amounts were offset by a decrease of $0.39 million in rent due to the sales of the three aforementioned properties in October 2015.
Funds from Operations
We use Funds from Operations ("FFO"), a non-GAAP measure, as an alternative measure of our operating performance, specifically as it relates to results of operations and liquidity. We compute FFO in accordance with standards established by the Board of Governors of NAREIT in its March 1995 White Paper (as amended in November 1999 and April 2002). As defined by NAREIT, FFO represents net income (computed in accordance with GAAP), excluding gains (or losses) from sales of property, plus real estate related depreciation and amortization (excluding amortization of loan origination costs) and after adjustments for unconsolidated partnerships and joint ventures. Most industry analysts and equity REITs, including us, consider FFO to be an appropriate supplemental measure of operating performance because, by excluding gains or losses on dispositions and excluding depreciation, FFO is a helpful tool that can assist in the comparison of the operating performance of a company’s real estate between periods, or as compared to different companies. Management uses FFO as a supplemental measure to conduct and evaluate our business because there are certain limitations associated with using GAAP net income alone as the primary measure of our operating performance. Historical cost accounting for real estate assets in accordance with GAAP implicitly assumes that the value of real estate assets diminishes predictably over time, while historically real estate values have risen or fallen with market conditions. Accordingly, we believe FFO provides a valuable alternative measurement tool to GAAP when presenting our operating results.
Below is a comparison of same store FFO, which is a non-GAAP measurement, for the years ended December 31, 2015 and 2014:
|
| | | | | | | | | | | | | | | | | | | | | | | | | | | | | | |
| | Years Ended December 31, |
| | Same Stores | | New Stores | | Total | | Year Over Year
Changes |
| | 2015 | | 2014 | | 2015 | | 2014 | | 2015 | | 2014 | | $ | | % |
| Net loss | $ | (10,424,793 | ) | | $ | (7,354,027 | ) | | $ | (8,348,609 | ) | | $ | (4,391,788 | ) | | $ | (18,773,402 | ) | | $ | (11,745,815 | ) | | $ | (7,027,587 | ) | | (59.83 | )% |
| Depreciation and amortization of real estate assets from continuing operations | 5,428,204 |
| | 5,903,392 |
| | 11,454,258 |
| | 1,484,337 |
| | 16,882,462 |
| | 7,387,729 |
| | 9,494,733 |
| | 128.52 | % |
| Depreciation and amortization of real estate assets from discontinued operations | 510,818 |
| | 832,761 |
| | 69,073 |
| | — |
| | 579,891 |
| | 832,761 |
| | (252,870 | ) | | (30.37 | )% |
| Depreciation of real estate assets | 5,939,022 |
| | 6,736,153 |
| | 11,523,331 |
| | 1,484,337 |
| | 17,462,353 |
| | 8,220,490 |
| | 9,241,863 |
| | 112.42 | % |
| Gain on sale of discontinued operations | (2,104,114 | ) | | — |
| | — |
| | — |
| | (2,104,114 | ) | | — |
| | (2,104,114 | ) | | — | % |
| Total FFO | $ | (6,589,885 | ) | | $ | (617,874 | ) | | $ | 3,174,722 |
| | $ | (2,907,451 | ) | | $ | (3,415,163 | ) | | $ | (3,525,325 | ) | | $ | 110,162 |
| | 3.12 | % |
During the year ended December 31, 2015, same store FFO decreased $5.97 million as compared to the year ended December 31, 2014 primarily due to an increase of $6.08 million in same store corporate general and administrative expenses for the year ended December 31, 2015. Total FFO increased by $0.11 million primarily due to a new store property net operating income increase of $7.90 million and a new store corporate general and administrative expense decrease of $2.11 million. This is offset by an increase in new store interest expense of $3.25 million, the impact of new store Non-REIT management and leasing services and the above same store explanation. The change in interest expense and corporate general and administrative expenses is discussed in the “Other Operating Expenses” section above.
We believe the computation of FFO in accordance with NAREIT's definition includes certain items that are not indicative of the results provided by our operating portfolio and affect the comparability of our period-over-period performance. These items include, but are not limited to, legal settlements, non-cash share-based compensation expense and non-cash amortization on loans and acquisition costs. Therefore, in addition to FFO, management uses Adjusted FFO ("AFFO"), which we define to exclude such items. Management believes that these adjustments are appropriate in determining AFFO as they are not indicative of the operating performance of our assets. In addition, we believe that AFFO is a useful supplemental measure for the investing community to use in comparing us to other REITs as many REITs provide some form of adjusted or modified FFO. However, there can be no assurance that AFFO presented by us is comparable to the adjusted or modified FFO of other REITs.
Total AFFO for the years ended December 31, 2015 and 2014 is shown in the table below:
|
| | | | | | | |
| | Years Ended December 31, |
| | 2015 | | 2014 |
| Total FFO | $ | (3,415,163 | ) | | $ | (3,525,325 | ) |
| Preferred Stock dividends | (13,627,532 | ) | | (2,718,257 | ) |
| Preferred Stock accretion adjustments | 8,925,221 |
| | 379,584 |
|
| Total FFO available to common shareholders and common unitholders | (8,117,474 | ) | | (5,863,998 | ) |
| Acquisition costs | 3,871,037 |
| | 3,787,900 |
|
| Capital related costs | 2,655,474 |
| | — |
|
| Other non-recurring and non-cash expenses | 770,757 |
| | — |
|
| Share-based compensation | 547,000 |
| | 456,988 |
|
| Straight-line rent | (270,873 | ) | | (247,220 | ) |
| Loan cost amortization | 1,300,901 |
| | 787,228 |
|
| Above/below market lease amortization | 616,665 |
| | 85,808 |
|
| Perimeter legal accrual | 133,282 |
| | — |
|
| Tenant improvement reserves | (302,600 | ) | | (194,400 | ) |
| Recurring capital expenditures | (355,900 | ) | | (239,200 | ) |
| AFFO | $ | 848,269 |
| | $ | (1,426,894 | ) |
(1) We adjusted the previously reported 2014 AFFO to be consistent with the 2015 AFFO presentation, primarily as it relates to the treatment of Preferred Stock accretion adjustments, straight-line rent, tenant improvement reserves and capital expenditures.
Preferred Stock dividends for the year ended December 31, 2015 include approximately $1.98 million of dividends (excluding the impact of accretion adjustments) related to the Series C Preferred Stock.
The Preferred Stock accretion adjustments represent the amortization of offering costs associated with raising the Series B and Series C Preferred Stock. The Series C Preferred Stock adjustment represents the majority of the total since the related offering costs were amortized until June 11, 2015, when we closed on the Series C Preferred Stock conversion.
The capital related costs primarily related to the Series C Preferred Stock conversion and Series A Preferred Stock and Series B Preferred Stock tender offer, which were not incurred in 2014. Other non-recurring expenses primarily relate to those costs that are related to specific items that we do not anticipate incurring on a going forward basis. These amounts were considered immaterial for 2014 so we did not factor them into AFFO. The Perimeter legal matter was settled in November 2015 so we will not incur these expenses going forward.
Year Ended December 31, 2014 Compared to the Year Ended December 31, 2013
Results of Operations
The following table presents a comparison of the consolidated statements of operations for the years ended December 31, 2014 and 2013, respectively.
|
| | | | | | | | | | | | | | |
| | For the Years Ended December 31, | | Year over Year Changes |
| | 2014 | | 2013 | | $/# | | % |
| PROPERTY DATA: | | | | | | | |
Number of properties owned and operated (1) | 30 |
| | 22 |
| | 8 |
| | 36.36 | % |
Aggregate gross leasable area (1) | 1,904,146 |
| | 1,284,022 |
| | 620,124 |
| | 48.30 | % |
Ending occupancy rate (1) | 95.6 | % | | 94.0 | % | | — | % | | 1.70 | % |
| FINANCIAL DATA: | | | | | | | |
| Rental revenues | $ | 11,348,955 |
| | $ | 6,078,172 |
| | $ | 5,270,783 |
| | 86.72 | % |
| Asset management fees | 296,290 |
| | — |
| | 296,290 |
| | — | % |
| Commissions | 158,876 |
| | — |
| | 158,876 |
| | — | % |
| Tenant reimbursements and other revenues | 3,046,657 |
| | 1,532,851 |
| | 1,513,806 |
| | 98.76 | % |
| Total Revenue | 14,850,778 |
| | 7,611,023 |
| | 7,239,755 |
| | 95.12 | % |
| EXPENSES: | | | | | | | |
| Property operations | 4,123,439 |
| | 1,658,405 |
| | 2,465,034 |
| | 148.64 | % |
| Depreciation and amortization | 7,387,729 |
| | 3,002,201 |
| | 4,385,528 |
| | 146.08 | % |
| Provision for credit losses | 60,841 |
| | 106,828 |
| | (45,987 | ) | | (43.05 | )% |
| Corporate general & administrative | 9,447,010 |
| | 4,594,539 |
| | 4,852,471 |
| | 105.61 | % |
| Total Other Operating Expenses | 21,019,019 |
| | 9,361,973 |
| | 11,657,046 |
| | 124.51 | % |
| Operating Loss | (6,168,241 | ) | | (1,750,950 | ) | | (4,417,291 | ) | | (252.28 | )% |
| Interest income | 23,315 |
| | 338 |
| | 22,977 |
| | 6,797.93 | % |
| Interest expense | (5,908,548 | ) | | (2,107,303 | ) | | (3,801,245 | ) | | (180.38 | )% |
| Net Loss from Continuing Operations | (12,053,474 | ) | | (3,857,915 | ) | | (8,195,559 | ) | | (212.43 | )% |
| Discontinued Operations | | | | | | | |
| Net Income (Loss) from Discontinued Operations | 307,659 |
| | (517,311 | ) | | 824,970 |
| | 159.47 | % |
| Net Loss | (11,745,815 | ) | | (4,375,226 | ) | | (7,370,589 | ) | | (168.46 | )% |
| Net loss attributable to noncontrolling interests | (1,195,560 | ) | | (714,972 | ) | | (480,588 | ) | | (67.22 | )% |
| Net Loss Attributable to Wheeler REIT | $ | (10,550,255 | ) | | $ | (3,660,254 | ) | | $ | (6,890,001 | ) | | (188.24 | )% |
(1) Excludes the undeveloped land parcels and Riversedge North, our corporate headquarters, and the redevelopment property. Includes assets held for
sale.
Same Store and New Store Operating Income
The following table provides same store and new store financial information. Same stores consist of those properties we owned during all periods presented in their entirety. Same store discontinued operations financial information reflects the activity of Harps at Harbor Point, which was acquired on December 14, 2012.
New store discontinued operations financial information reflects the activities of the following properties:
Bixby Commons (acquired June 11, 2013)
Jenks Reasors (acquired September 25, 2013)
Starbucks/Verizon (acquired October 21, 2013)
The following table provides same store and new store financial information:
|
| | | | | | | | | | | | | | | | | | | | | | | |
| | Years Ended December 31, |
| | Same Store | | New Store | | Total |
| | 2014 | | 2013 | | 2014 | | 2013 | | 2014 | | 2013 |
| Property revenues | $ | 6,006,928 |
| | $ | 6,175,153 |
| | $ | 8,388,684 |
| | $ | 1,435,870 |
| | $ | 14,395,612 |
| | $ | 7,611,023 |
|
| Property expenses | 1,343,057 |
| | 1,264,790 |
| | 2,780,382 |
| | 393,615 |
| | 4,123,439 |
| | 1,658,405 |
|
| Property Net Operating Income | 4,663,871 |
| | 4,910,363 |
| | 5,608,302 |
| | 1,042,255 |
| | 10,272,173 |
| | 5,952,618 |
|
| Asset Management and Commission Revenues | — |
| | — |
| | 455,166 |
| | — |
| | 455,166 |
| | — |
|
| Other Income | — |
| | — |
| | 455,166 |
| | — |
| | 455,166 |
| | — |
|
| Depreciation and amortization | 1,849,776 |
| | 2,498,477 |
| | 5,537,953 |
| | 503,724 |
| | 7,387,729 |
| | 3,002,201 |
|
| Provision for credit losses | (25,332 | ) | | 106,828 |
| | 86,173 |
| | — |
| | 60,841 |
| | 106,828 |
|
| Corporate general & administrative | 5,049,414 |
| | 3,122,880 |
| | 4,397,596 |
| | 1,471,659 |
| | 9,447,010 |
| | 4,594,539 |
|
| Total Other Operating Expenses | 6,873,858 |
| | 5,728,185 |
| | 10,021,722 |
| | 1,975,383 |
| | 16,895,580 |
| | 7,703,568 |
|
| Interest income | 23,287 |
| | 223 |
| | 28 |
| | 115 |
| | 23,315 |
| | 338 |
|
| Interest expense | (3,027,354 | ) | | (1,733,680 | ) | | (2,881,194 | ) | | (373,623 | ) | | (5,908,548 | ) | | (2,107,303 | ) |
| Net Loss from Continuing Operations | (5,214,054 | ) | | (2,551,279 | ) | | (6,839,420 | ) | | (1,306,636 | ) | | (12,053,474 | ) | | (3,857,915 | ) |
| Net Income (Loss) from Discontinued Operations | 32,884 |
| | 24,688 |
| | 274,775 |
| | (541,999 | ) | | 307,659 |
| | (517,311 | ) |
| Net Loss | $ | (5,181,170 | ) | | $ | (2,526,591 | ) | | $ | (6,564,645 | ) | | $ | (1,848,635 | ) | | $ | (11,745,815 | ) | | $ | (4,375,226 | ) |
Property Revenues
Total same store property revenues for the year ended December 31, 2014 were $6.01 million, compared to $6.18 million for the year ended December 31, 2013, representing a decrease of $0.17 million, or 2.72%. The decrease in same store revenues primarily resulted from Riversedge not paying rent and tenant reimbursements during November and December 2014 due to the internalization of the Operating Companies, and a reduction in amortization of below market leases. Seven of the centers representing same stores are 100% leased and two are in excess of 95% leased, resulting in nominal fluctuations in revenues at these centers.
The year ended December 31, 2014 represents a partial year of operations for the thirteen acquisitions made in 2014. The 2014 and 2013 acquisitions contributed $8.39 million in revenues for the year ended December 31, 2014. Going forward we believe these properties will generate a significant amount of revenue for our company and we will benefit from future contractual rent increases.
Property Expenses
Total same store operating expenses for the year ended December 31, 2014 were $1.34 million, compared to $1.26 million for the year ended December 31, 2013, respectively. The increase was primarily due to increases in repairs and maintenance and utility expenses which typically fluctuate from period to period depending on timing and weather.
Other Operating Expenses
Same store other operating expenses for the year ended December 31, 2014 were $6.87 million, representing an increase of $1.15 million over the year ended December 31, 2013. The increase is primarily associated with professional fees and other expenses as a result of being a publicly traded company, property acquisitions and legal matters, and two months of operating expenses resulting from internalizing the Operating Companies during October 2014. The expenses related to being a publicly traded company primarily consisted of costs associated with legal, audit, tax, Board of Directors fees, directors’ and officers’ insurance, investor relations, REIT management fees and consulting fees.
Total acquisition expenses for same and new stores were $3.79 million, which included $2.7 million in acquisition fees, and approximately $879,000 for legal, accounting and other professional costs associated with these acquisitions. This compares to $2.18 million of acquisition related costs incurred during 2013.
Same store depreciation and amortization expense for the year ended December 31, 2014 decreased $0.65 million, or 25.96%, resulting from more assets becoming fully depreciated and amortized.
Interest Expense
Same store interest expense increased $1.29 million or 74.62% for the year ended December 31, 2014, compared to $1.73 million for the year ended December 31, 2013. The increase primarily resulted from interest of approximately $1.08 million on the $12.16 million of senior convertible and non-convertible notes issued in December 2013 and January 2014. Total interest expense for the year ended December 31, 2014 increased $3.80 million or 180.38% compared to the year ended December 31, 2013, primarily due to the $46.7 million increase in debt resulting from the acquisitions made in 2014.
Discontinued Operations
Net income from discontinued operations totaled $0.31 million for the year ended December 31, 2014, compared to a net loss of $0.52 million for the year ended December 31, 2013. The loss for the year ended December 31, 2013 primarily resulted from the acquisition expenses, depreciation and amortization recognized on these properties coupled with a partial year of revenue. The net income in 2014 reflects a full year of operations for these properties.
Funds from Operations
Below is a comparison of same store FFO, which is a non-GAAP measurement, for the years ended December 31, 2014 and 2013:
|
| | | | | | | | | | | | | | | | | | | | | | | | | | | | | | |
| | Years Ended December 31, |
| | Same Stores | | New Stores | | Total | | Year Over Year
Changes |
| | 2014 | | 2013 | | 2014 | | 2013 | | 2014 | | 2013 | | $ | | % |
| Net loss | $ | (5,181,170 | ) | | $ | (2,526,591 | ) | | $ | (6,564,645 | ) | | $ | (1,848,635 | ) | | $ | (11,745,815 | ) | | $ | (4,375,226 | ) | | $ | (7,370,589 | ) | | (168.46 | )% |
| Depreciation and amortization of real estate assets from continuing operations | 1,849,776 |
| | 2,498,477 |
| | 5,537,953 |
| | 503,724 |
| | 7,387,729 |
| | 3,002,201 |
| | 4,385,528 |
| | 146.08 | % |
| Depreciation and amortization of real estate assets from discontinued operations | 123,236 |
| | 185,104 |
| | 709,525 |
| | 279,652 |
| | 832,761 |
| | 464,756 |
| | 368,005 |
| | 79.18 | % |
| Depreciation of real estate assets | 1,973,012 |
| | 2,683,581 |
| | 6,247,478 |
| | 783,376 |
| | 8,220,490 |
| | 3,466,957 |
| | 4,753,533 |
| | 137.11 | % |
| Total FFO | $ | (3,208,158 | ) | | $ | 156,990 |
| | $ | (317,167 | ) | | $ | (1,065,259 | ) | | $ | (3,525,325 | ) | | $ | (908,269 | ) | | $ | (2,617,056 | ) | | (288.14 | )% |
During the year ended December 31, 2014, same store FFO decreased $3.37 million as compared to the year ended December 31, 2013, primarily due to an increase of $1.93 million in same store corporate general and administrative expenses for the year ended December 31, 2014. The increase in corporate general and administrative expenses is discussed in the “Other Operating Expenses” section above.
We believe that the computation of FFO in accordance with NAREIT’s definition includes certain items that are not indicative of the results provided by our operating portfolio and affect the comparability of our period-over-period performance. These items include, but are not limited to, legal settlements, non-cash share-based compensation expense, non-cash amortization on loans and acquisition costs. Therefore, in addition to FFO, management uses AFFO, which we define to exclude such items. Management believes that these adjustments are appropriate in determining AFFO as they are not
indicative of the operating performance of our assets. In addition, we believe that AFFO is a useful supplemental measure for the investing community to use in comparing us to other REITs as many REITs provide some form of adjusted or modified FFO. However, there can be no assurance that AFFO presented by us is comparable to the adjusted or modified FFO of other REITs.
|
| | | | | | | |
| | Years Ended December 31, |
| | 2014 | | 2013 |
| Total FFO | $ | (3,525,325 | ) | | $ | (908,269 | ) |
| Preferred Stock dividends | (2,718,257 | ) | | (141,418 | ) |
| Preferred Stock accretion adjustments | 379,584 |
| | — |
|
| Total FFO available to common shareholders and common unitholders | (5,863,998 | ) | | (1,049,687 | ) |
| Acquisition costs | 3,787,900 |
| | 2,179,000 |
|
| Share-based compensation | 456,988 |
| | — |
|
| Straight-line rent | (247,220 | ) | | (33,822 | ) |
| Loan cost amortization | 787,228 |
| | 185,103 |
|
| Above/below market lease amortization | 85,808 |
| | (658,245 | ) |
| Perimeter legal accrual | — |
| | 267,000 |
|
| Tenant improvement reserves | (194,400 | ) | | (109,600 | ) |
| Recurring capital expenditures | (239,200 | ) | | (131,600 | ) |
| AFFO | $ | (1,426,894 | ) | | $ | 648,149 |
|
(1) We adjusted the previously reported 2013 AFFO to be consistent with the 2014 AFFO presentation, primarily as it relates to the treatment of Preferred Stock accretion adjustments, straight-line rent, tenant improvement reserves and capital expenditures.
Item 7A. Quantitative and Qualitative Disclosures About Market Risk.
The primary market risk to which we are exposed is interest rate risk. Our primary interest rate exposure is LIBOR. We primarily use fixed interest rate financing to manage our exposure to fluctuations in interest rates.
At December 31, 2016,2017, approximately $212.89$216.24 million, or 67.57%68.91%, of our debt had fixed interest rates and approximately $102.16$97.54 million, or 32.43%31.09%, had variable interest rates. Assuming no increase in the level of our variable rate debt, if interest rates increased by 1.0%, our cash flow would decrease by approximately $1.02 million$975 thousand per year. At December 31, 2016,2017, LIBOR was approximately 77156 basis points. Assuming no increase in the level of our variable rate debt, if LIBOR was reduced to zero basis points, our cash flow would increase by approximately $0.79$1.52 million per year.
Item 8. Financial Statements and Supplementary Data.
The information required by this Item 8 is incorporated by reference to our Financial Statements beginning on page 7589 of this Annual Report on Form 10-K.
Item 9. Changes in and Disagreements with Accountants on Accounting and Financial Disclosure.
None.
Item 9A. Controls and Procedures.
Disclosure Controls and Procedures
Our management, under the supervision and with the participation of our principal executive and financial officer, has evaluated the effectiveness of our disclosure controls and procedures in ensuring that the information required to be disclosed in our filings under the Securities Exchange Act of 1934, as amended, is recorded, processed, summarized and reported within the time periods specified in the SEC’s rules and forms, including ensuring that such information is accumulated and communicated to our company’s management, as appropriate, to allow timely decisions regarding required disclosure. Based on such evaluation, our principal executive and financial officer have concluded that such disclosure controls and procedures were effective as of December 31, 20162017 (the end of the period covered by this Annual Report).
Management’s Annual Report on Internal Control Over Financial Reporting
Our management is responsible for establishing and maintaining adequate internal control over financial reporting. Internal control over financial reporting, as defined in rules promulgated under the Exchange Act, is a process designed by, or under the supervision of, our Chief Executive OfficerCEO and Chief Financial OfficerCFO and effected by our Board of Directors, management and other personnel to provide reasonable assurance regarding the reliability of financial reporting and the preparation of financial statements for external purposes in accordance with GAAP. Internal control over financial reporting includes those policies and procedures that:
pertain to the maintenance of records that in reasonable detail accurately and fairly reflect the transactions and dispositions of our assets;
provide reasonable assurance that transactions are recorded as necessary to permit preparation of financial statements in accordance with GAAP, and that our receipts and expenditures are being made only in accordance with authorizations of our management and our Board of Directors; and
provide reasonable assurance regarding prevention or timely detection of unauthorized acquisition, use or disposition of our assets that could have a material effect on our financial statements.
Our internal control over financial reporting is evaluated on a regular basis by personnel in our organization. The overall goals of these various evaluation activities are to monitor our internal control over financial reporting and to make modifications as necessary, as disclosure and internal controls are intended to be dynamic systems that change (including improvements and corrections) as conditions warrant. Part of this evaluation is to determine whether there were any significant deficiencies or material weaknesses in our internal control over financial reporting, or whether we had identified any acts of fraud involving personnel who have a significant role in our internal control over financial reporting. Significant deficiencies are control issues that could have a significant adverse effect on the ability to record, process, summarize and report financial
data in the financial statements. Material weaknesses are particularly serious conditions where the internal control over financial reporting does not reduce to a relatively low level the risk that misstatements caused by error or fraud may occur in amounts that would be material in relation to the financial statements and not be detected within a timely period by employees in the normal course of performing their assigned functions.
Management conducted an assessment of the effectiveness of our company’s internal control over financial reporting as of December 31, 2016,2017, utilizing the framework established in “INTERNAL CONTROL-INTEGRATED FRAMEWORK”
issued by the Committee of Sponsoring Organizations of the Treadway Commission (2013). Based on this assessment, management has determined that our internal controls over financial reporting as of December 31, 20162017 were effective.
All internal control systems, no matter how well designed, have inherent limitations. Therefore, even those systems determined to be effective can provide only reasonable assurance with respect to financial statement preparation and presentation. Also, projections of any evaluation of effectiveness to future periods are subject to the risk that controls may become inadequate because of changes in conditions, or that the degree of compliance with the policies or procedures may deteriorate.
The effectiveness of the Company's internal control over financial reporting as of December 31, 2017 has been audited by Cherry Bekaert LLP, an independent registered public accounting firm, as stated in their report included in Part III, Item 15 of this Annual Report on Form 10-K.
Changes in Internal Control Over Financial Reporting
DuringThere were no changes in the year ended December 31, 2014, ourCompany's internal control over financial reporting was strengthened throughfor the implementation of an automated and fully integrated accounts payable system.three months ended December 31, 2017 that materially affected or are reasonably likely to materially affect the Company's internal control over financial reporting.
Item 9B. Other Information
Not applicable.
PART III
Item 10. Directors, Executive Officers and Corporate Governance.
Our Directors and Executive Officers
Our board of directors consists of eight members, including a majority of directors who are independent within the meaning of the listing standards of the NASDAQ Capital Market. Pursuant to our charter, each of our directors will be elected by our stockholders to serve until the next annual meeting of our stockholders and until his or her successor is duly elected and qualifies. Subject to rights pursuant to any employment agreements, officers serve at the pleasure of our board of directors.
The following table sets forth certain information concerning our directors, executive officers and certain other officers:
|
| | | | | |
| Name | | Age | | | Position |
| David Kelly | | 53 | | | Chief Executive Officer and Director (previously Chief Investment Officer) |
| Matthew T. Reddy | | 36 | | | Chief Financial Officer (previously Chief Accounting Officer) |
| M. Andrew Franklin | | 37 | | | Chief Operating Officer (previously Senior Vice President of Operations) |
| Kurt R. Harrington (1) | | 65 | | | Director |
| William W. King (1) | | 78 | | | Director |
| Stewart J. Brown (1) | | 70 | | | Director |
| John McAuliffe (1) | | 63 | | | Director |
| Carl B. McGowan, Jr. (1) | | 70 | | | Director |
| Jeffrey Zwerdling (1) | | 73 | | | Director |
| John Sweet (1) | | 73 | | | Director |
(1) Independent director.
Biographical Summaries of Directors and Executive Officers
The following are biographical summaries of the experience of our directors and executive officers.
David Kelly was appointed as CEO in January 2018, replacing Jon S. Wheeler, and has served as a director of the Company since 2011. Mr. Kelly has over 25 years of experience in the real estate industry. Mr. Kelly previously served as CIO. Prior to joining the Company, Mr. Kelly served as a Principal with Kelly Development, LLC, a real estate development firm he founded in March 2011, which specializes in the acquisition and management of retail properties in the Mid-Atlantic region. Prior to founding Kelly Development, Mr. Kelly served as the Director of Real Estate for Supervalu, Inc., a Fortune 100 supermarket retailer, from 1998 through 2011. Prior to his time with Supervalu, Mr. Kelly served as an Asset Manager from 1993 through 1998. Mr. Kelly currently serves on the Board of Directors of the Norfolk, Virginia SPCA. He earned a Bachelor of Science in Finance degree from Bentley College (now Bentley University). Mr. Kelly was selected as a director based upon his years of experience in the real estate industry as well as his real estate management experience within a publicly traded company.
Matthew T. Reddy was named as CFO in February 2018, replacing Wilkes Graham. Mr. Reddy previously served as our Chief Accounting Officer since June 2015. Prior to joining the Company, Mr. Reddy worked at Liberty Tax, Inc. (“Liberty”), serving as Assistant Vice President of Online Products from 2014 to 2015, where his responsibilities included coordination and leadership of Liberty’s online tax business. While employed at Liberty, Mr. Reddy was also employed as Director of Finance from 2011 to 2014, and Manager of Financial Reporting from 2008 to 2011. His primary responsibilities in these positions included overseeing corporate forecasting, assisting in the planning and analysis of business and financial strategies, and managing Liberty’s accounting team. Prior to joining Liberty, Mr. Reddy worked at KPMG LLP as a Senior Auditor. Mr. Reddy is a Certified Public Accountant and holds a degree in accounting from James Madison University.
M. Andrew Franklin was promoted to COO in February 2018. He previously served as the Senior Vice President of Operations since January 2017. Mr. Franklin has over 18 years of commercial real estate experience. Mr. Franklin is responsible for overseeing the property management, lease administration and leasing divisions of our growing portfolio of commercial assets. Prior to joining us, Mr. Franklin was a partner with Broad Reach Retail Partners where he ran the day to day operations of the company, managing the leasing team as well as overseeing the asset, property and construction management of the portfolio with assets totaling $50 Million. Mr. Franklin is a graduate of the University of Maryland, with a Bachelor of Science degree in Finance.
Kurt R. Harrington has served as a director of our company since 2015. Mr. Harrington was recently the Executive Vice President, Chief Financial Officer and Treasurer, of Arlington Asset Investment Corp. (NYSE: AI), a position he had held since January 2000. Mr. Harrington was also the Executive Vice President, Chief Financial Officer and Treasurer of FBR & Co. between January 2000 and February 2008 and served as Chief Financial Officer and Treasurer of FBR Asset Investment Corporation from September 1999 to March 2003. Mr. Harrington joined Arlington Asset Investment Corp. as Vice President of Finance and Treasurer in March 1997. He was previously the Chief Financial Officer of Jupiter National, Inc., a publicly traded, closed-end venture capital company. From 1980 to 1990, Mr. Harrington served in a number of senior financial accounting, reporting and business planning positions at MCI Communications Corporation and Marriott Corporation, in Washington, D.C. He began his career with the public accounting firms of Meahl, McNamara & Co., Boston, Massachusetts and later, PricewaterhouseCoopers LLP, Washington, D.C. Mr. Harrington received his Certified Public Accountant certification in 1978. Mr. Harrington was the treasurer and a trustee of Nichols College from October 2004 to October 2016, and is a Director of Global Medical REIT, Inc. (NYSE:GMRE). Mr. Harrington was selected as a director because of his years of management and public company experience.
William W. King has served as a director of the Company since 2011. William W. King served as the Executive Director of the Virginia Maritime Heritage Foundation from September 2009 through August 2016. The 501(c) (3) corporation owned and operated the schooner Virginia. From July 1988 through June 2008, Mr. King served as the Headmaster of Norfolk Collegiate School, an independent, co-educational, K-12 college preparatory day school. From July 2008 until June 2009 he was an Assistant to the Headmaster. He served on the school’s board of trustees from 1984-2009, and as an Honorary Trustee from 2012-present. Prior to his service at Norfolk Collegiate School, Mr. King was Executive Vice President of SRMS, a management consulting corporation that primarily contracted for services for the U.S. Navy and the U.S. Air Force. Mr. King
served in the United States Navy from 1962 until 1984, when he retired in the grade of Captain. Mr. King graduated from the University of Virginia in 1963 with a Bachelor of Science in Finance degree, and the Navy Postgraduate School in 1977 with a Master of Science in Financial Management, and from Old Dominion University in 1995 with a Certificate of Advanced Studies in Educational Leadership and Administration. He currently serves on the Board of Directors of Chesapeake Bay Academy, the Future of Hampton Roads, Inc. and Horizons Hampton Roads all of which are 501(c) (3) corporations with an educational mission. Mr. King was selected as a director because of his previous leadership experience.
Stewart J. Brown has served as a director since 2015. Mr. Brown has over 45 years of financial and organizational management experience in executive management positions within the real estate, banking, and finance industries, most recently as Chairman of the Credit/Risk Committee for Community and Southern Bank and is a member of the board’s Joint Audit Committee. Mr. Brown has also served as the past Chairman of the Board of Lodgian, Inc. of Atlanta and Opportunity Bank of Dallas. Mr. Brown also served for over 32 years as an officer in the US Army in a variety of assignments. Mr. Brown received his Bachelor’s degree in Political Science and Economics from UC Santa Barbara and has an MBA from NYU’s Leonard N. Stern’s School of Business. Based upon his leadership and organizational development expertise, we have determined that Mr. Brown should serve as a director.
John McAuliffe has served as a director since 2015. Mr. McAuliffe previously served as a director from November 2012 until April 2013. Mr. McAuliffe has over 36 years of experience in the financial services industry. Presently, Mr. McAuliffe serves as a Lead Investment Banker with Newbridge Securities Corporation, a full-service securities brokerage and investment banking firm. Prior to joining Newbridge Securities Corporation in 2005, Mr. McAuliffe ran his own consulting firm which provided advisory and structural development services to the management of small to medium sized publicly traded companies. Throughout his career, Mr. McAuliffe has participated in excess of over 200 capital raises and has been involved in all aspects of the capital formation process serving in a variety of positions ranging from institutional salesman to the Managing Director of an investment banking firm. Mr. McAuliffe received his Bachelor of Science degree in political science and economics from State University of New York at Brockport. Mr. McAuliffe was chosen as a director because of his leadership and investment banking experience.
Carl B. McGowan, Jr., PhD, CFA has served as a director of the Company since 2013. Dr. McGowan brings over 30 years of extensive financial experience to the Board. Dr. McGowan joined the faculty of Norfolk State University in 2005 and presently serves as the Faculty Distinguished Professor of Finance. From 2004-2005, Dr. McGowan served as a Visiting Associate Professor of Finance at the University of Sharjah in the United Arab Emirates. From 2003-2004, Dr. McGowan served as the RHB Bank Distinguished Chair in Finance at the University of Kebangsaan in Malaysia. Dr. McGowan has a Bachelor of Arts in International Relations (Syracuse), an MBA in Finance (Eastern Michigan), and a PhD in Business Administration (Michigan State). Dr. McGowan has conducted extensive research in the areas of corporate finance and international finance, with specific studies relating to real estate operations. In addition to over 150 conference presentations, Dr. McGowan has published 68 articles in numerous peer-reviewed journals including: The Journal of Real Estate Research, The American Journal of Business Education, Applied Financial Economics, Decision Science, Financial Practice and Education, The Financial Review, International Business and Economics Research Journal, The International Review of Financial Analysis, The Journal of Applied Business Research, The Journal of Business Case Studies, The Journal of Diversity Management, Managerial Finance, Managing Global Transitions, The Southwestern Economic Review, and Urban Studies. Dr. McGowan was chosen as a director based upon his diverse experience and well-known authority in finance and economics, which will be valuable as we pursue the continued growth of the Company.
Jeffery M. Zwerdling has served as a director of the Company since 2013 and lead independent director since 2015. Mr. Zwerdling is founder and managing partner of the law firm of Zwerdling, Oppleman & Adams which was formed in 1972 in Richmond, Virginia. Mr. Zwerdling’s areas of concentration include corporate law, commercial and residential real estate, personal estate planning, and general litigation. From 1999-2012 he served as President and Director of The Corporate Centre, a 225,000 square foot office park complex located in Richmond, Virginia. In May of 2013, Mr. Zwerdling was appointed to the Board of Directors of Capitol Securities Management Inc. (“CSM”). CSM is a Financial Industry Regulatory Authority registered broker dealer whose assets exceed $4 billion. Mr. Zwerdling was commissioned as a Second Lieutenant in the United States Army in 1967, served in the Army Reserve and Virginia National Guard, and received his honorable discharge after obtaining the rank of Captain in 1981. Mr. Zwerdling holds a Bachelor of Science Degree from Virginia Commonwealth University and received a Juris Doctor Degree from the College of William and Mary School of Law. He was an organizational
investor in Southern Community Bank & Trust, now Village Bank. In 1998, Mr. Zwerdling was elected to the Board of Directors of Supertel Hospitality, Inc., a public company which trades on the Nasdaq Stock Exchange. Supertel is a real estate investment trust (REIT) which is a focused-service segment of the lodging industry. During his tenure at Supertel, Mr. Zwerdling served on various committees, including the Acquisitions and Dispositions Committee, and was a member and former chairman of the Audit Committee. Prior to being appointed a Director of the Company in September 2013, Mr. Zwerdling served as a Board Observer for the Company. He is a Master Mason of Fraternal Lodge No. 53, belongs to the Scottish Rite of Freemasonry, and is a Noble of the Acca Temple Shrine of Richmond, Virginia. Mr. Zwerdling was chosen as a director based upon his legal experience in real estate matters and his vast experiences with real estate investment trusts.
John Sweet has served as a director of the Company since 2016. Mr. Sweet has forty years of investment banking and corporate finance experience. Mr. Sweet is the co-founder and Chief Investment Officer at Physicians Realty Trust (NYSE:DOC), a self-managed healthcare real estate investment trust. Prior to founding Physicians Realty Trust in 2013, Mr. Sweet was a Managing Director for the privately owned, full-service, specialty investment firm, Ziegler. While at Ziegler, Mr. Sweet assisted in the financing and then management of a medical office building investment fund which became the initial core portfolio for Physicians Realty Trust. In 2002, Mr. Sweet also co-founded Windrose Medical Properties Trust, a publicly traded medical office REIT that was sold to Healthcare REIT (NASDAQ:HCN) in 2006. John has been involved at a senior financial level in publicly traded and private companies, family offices and investment banking firm over the course of his career. He has also served on the boards of philanthropic and charitable organizations and was in the Army from 1968-1970. Mr. Sweet received his Bachelor’s degree in Business Administration from St. John Fisher College and an MBA. from Rochester Institute of Technology. Mr. Sweet was chosen as a director based on his leadership and experience managing a publically-traded REIT.
Corporate Governance Profile
Our board consists of eight directors, seven of whom are independent as determined in accordance with the listing standards established by the NASDAQ Capital Market, and our board makes an affirmative determination as to the independence of each of our directors on an annual basis. We have adopted a code of business ethics and corporate governance principles.
Role of the Board in Risk Oversight
One of the key functions of our Board of Directors is informed oversight of our risk management process. Our Board of Directors administers this oversight function directly, with support from its five standing committees, the Audit Committee, the Nominating and Corporate Governance Committee, the Compensation Committee, the Investment Committee, Finance Committee, and the Operating Committee, each of which addresses risks specific to their respective areas of oversight. In particular, our Audit Committee has the responsibility to consider and discuss our major financial risk exposures and the steps our management has taken to monitor and control these exposures, including guidelines and policies to govern the process by which risk assessment and management is undertaken. The Audit Committee also monitors compliance with legal and regulatory requirements, in addition to oversight of the performance of our internal audit function. Our Nominating and Corporate Governance Committee monitors the effectiveness of our corporate governance guidelines, including whether they are successful in preventing illegal or improper liability-creating conduct. Our Compensation Committee assesses and monitors whether any of our compensation policies and programs has the potential to encourage excessive risk-taking. Our Investment Committee is responsible for reviewing and analyzing strategic real estate acquisitions and investments. Our Finance Committee is responsible for overseeing the financial policies and practices of the Company. Our Operating Committee is responsible for strengthening oversight of the Company's operations and increasing interactions with management.
Selection of Nominees for the Board
The Nominating and Corporate Governance Committee will consider candidates for Board membership suggested by its members and other Board members, as well as management and stockholders. The committee may also retain a third-party executive search firm to identify candidates upon request of the committee from time to time. A stockholder who wishes to recommend a prospective nominee for the Board should notify the Company’s Corporate Secretary or any member of the Nominating and Corporate Governance Committee in writing with whatever supporting material the stockholder considers appropriate. The Nominating and Corporate Governance Committee will also consider whether to nominate any person nominated by a stockholder pursuant to the provisions of the Company’s Bylaws relating to stockholder nominations.
Once the Nominating and Corporate Governance Committee has identified a prospective nominee, the committee will make an initial determination as to whether to conduct a full evaluation of the candidate. This initial determination will be based on whatever information is incorporatedprovided to the committee with the recommendation of the prospective candidate, as well as the committee’s own knowledge of the prospective candidate, which may be supplemented by reference frominquiries to the person making the recommendation or others. The preliminary determination will be based primarily on the need for additional Board members to fill vacancies or expand the size of the Board and the likelihood that the prospective nominee can satisfy the evaluation factors described below. If the committee determines, in consultation with the Chairman of the Board and other Board members as appropriate, that additional consideration is warranted, it may request the third-party search firm to gather additional information about the prospective nominee’s background and experience and to report its findings to the committee. The committee will then evaluate the prospective nominee against the standards and qualifications generally set out in the Company’s Proxy StatementCorporate Governance Guidelines, including:
|
| | | |
| • | | the ability of the prospective nominee to represent the interests of the stockholders of the Company; |
|
| | | |
| • | | the prospective nominee’s standards of integrity, commitment and independence of thought and judgment; |
|
| | | |
| • | | the prospective nominee’s ability to dedicate sufficient time, energy, and attention to the diligent performance of his or her duties, including the prospective nominee’s service on other public company boards, as specifically set out in the Company’s Corporate Governance Guidelines; |
|
| | | |
| • | | the extent to which the prospective nominee contributes to the range of talent, skill and expertise appropriate for the Board; |
|
| | | |
| • | | the extent to which the prospective nominee helps the Board reflect the diversity of the Company’s stockholders, employees, customers, guests and communities; and |
|
| | | |
| • | | the willingness of the prospective nominee to meet any minimum equity interest holding guideline. |
The Nominating and Corporate Governance Committee also considers such other relevant factors as it deems appropriate, including the current composition of the Board, the balance of management and independent directors, the need for Audit Committee expertise and the evaluations of other prospective nominees. In connection with this evaluation, the Nominating and Corporate Governance Committee determines whether to interview the prospective nominee, and if warranted, one or more members of the committee, and others as appropriate, interview prospective nominees in person or by telephone. After completing this evaluation and interview, the Nominating and Corporate Governance Committee makes a recommendation to the full Board as to the persons who should be nominated by the Board, and the Board determines the nominees after considering the recommendation and report of the committee.
The Bylaws of the Company provide that any stockholder entitled to vote at the Annual Meeting in the election of directors generally may nominate one or more persons for election as directors at a meeting only if written notice of such stockholders’ intention to make such nomination has been delivered personally to, or has been mailed to and received by the Secretary at the principal office of the Company not later than 10 days following the notice of the annual meeting. If a stockholder has a suggestion for candidates for election, the stockholder should follow this procedure. Each notice from a stockholder must set forth (i) the name and address of the stockholder who intends to make the nomination and the name of the person to be nominated, (ii) the class and number of shares of stock held of record, owned beneficially and represented by proxy by such stockholder as of the record date for the meeting and as of the date of such notice, (iii) a representation that the stockholder intends to appear in person or by proxy at the meeting to nominate the person specified in the notice, (iv) a description of all arrangements or understandings between such stockholder and each nominee and any other person (naming those persons) pursuant to which the nomination is to be made by such stockholder, (v) such other information regarding each nominee proposed by such stockholder as would be required to be included in a proxy statement filed pursuant to the proxy rules, and (vi) the consent of each nominee to serve as a director of the Company if so elected. The chairman of the Annual Meeting may refuse to acknowledge the nomination of any person not made in compliance with this procedure. The Company has not adopted a specific policy regarding the consideration of director nominees recommended by stockholders and believes this is appropriate because there are not any differences in the manner in which the Nominating and Corporate Governance Committee evaluates nominees for director based on whether the nominee is recommended by a stockholder or the Nominating and Corporate Governance Committee.
Determinations of Director Independence
The Board of Directors reviews the independence of each director yearly. During this review, the Board of Directors considers transactions and relationships between each director (and his or her immediate family and affiliates) and the Company and its management to determine whether any such relationships or transactions are inconsistent with a determination that the director is independent in light of applicable law, listing standards and the Company’s director independence standards. The Company believes that it maintains a majority of independent directors who are deemed to be independent under the definition of independence provided by NASDAQ Listing Rule 5605(a)(2).
Board Meetings During Fiscal 2017
The Board met five times during fiscal year 2017. No directors attended fewer than 75% of the meetings of the aggregate of: (i) The total number of meetings of the Board (held during the period for which he or she has been a director); and (ii) the total number of meetings held by all committees of the Board on which he or she served (during the periods that he or she served). Under the Company’s Corporate Governance Guidelines, each director is expected to dedicate sufficient time, energy and attention to ensure the diligent performance of his or her duties, including by attending meetings of the stockholders of the Company, the Board and Committees of which he or she is a member.
Board Committees
Our Board of Directors has established six standing committees: an Audit Committee, a Nominating and Corporate Governance Committee, a Compensation Committee, an Investment Committee, Finance Committee and an Operating Committee. The principal functions of each committee are briefly described below. Each of these committees is comprised exclusively of independent directors. Additionally, our board of directors may from time to time establish certain other committees to facilitate the management of our company.
Audit Committee.
Our Audit Committee consists of three of our independent directors: Carl B. McGowan, Jr., William W. King and Kurt Harrington. Dr. McGowan, the chairman of our Audit Committee, qualifies as an “audit committee financial expert” as that term is defined by the applicable SEC regulations and NASDAQ Capital Market corporate governance requirements. In addition, each of the Audit Committee members is “financially sophisticated” as that term is defined by the NASDAQ Capital Market corporate governance requirements. The functions of the Audit Committee are described below under the heading “Report of the Audit Committee.” The charter of the Audit Committee was adopted on November 16, 2012, and is available on the Company’s Investor Relations tab of our website (www.whlr.us). All of the members of the Audit Committee are independent within the meaning of SEC regulations, the listing standards of the Nasdaq Stock Market and the Company’s Corporate Governance Principles. The Audit Committee met four times in 2017.
Nominating and Corporate Governance Committee.
Our Nominating and Corporate Governance Committee consists of three of our independent directors: Stewart J. Brown, Carl B. McGowan, Jr., and Kurt R. Harrington. Mr. Harrington has been designated as chair of this committee. The Nominating and Corporate Governance Committee is responsible for developing and implementing policies and practices relating to corporate governance, including reviewing and monitoring implementation of the Company’s Corporate Governance Guidelines. In addition, the Nominating and Corporate Governance Committee develops and reviews background information on candidates for the Board and makes recommendations to the Board regarding such candidates. The Nominating and Corporate Governance Committee also prepares and supervises the Board’s annual review of director independence and the Board’s performance self-evaluation. The charter of the Nominating and Corporate Governance Committee was adopted on November 16, 2012 and updated in 2016, and is available on the Company’s Investor Relations website (www.whlr.us). All of the members of the Nominating and Corporate Governance Committee are independent within the meaning of the listing standards of the Nasdaq Stock Market and the Company’s Corporate Governance Principles. The Nominating and Corporate Governance Committee met once in 2017.
Compensation Committee.
Our Compensation Committee consists of three of our independent directors: John McAuliffe, Jeffrey Zwerdling, and John Sweet. Mr. Sweet has been designated as chair of the Compensation Committee. The Compensation Committee is responsible for overseeing the policies of the Company relating to compensation to be paid by the Company to the Company’s principal executive officer and any other officers designated by the Board, and to make recommendations to the Board with respect to such policies, produce necessary reports on executive compensation for inclusion in the 2017 Annual MeetingCompany’s proxy statement in accordance with applicable rules and regulations and to monitor the development and implementation of Stockholderssuccession plans for the principal executive officer and other key executives and make recommendations to be filedthe Board with respect to such plans.
The charter of the Compensation Committee was adopted on November 16, 2012 and updated in 2014 and 2016, and is available on the Company’s Investor Relations website (www.whlr.us). All of the members of the Compensation Committee are independent within the meaning of the listing standards of the Nasdaq Stock Market and the Company’s Corporate Governance Principles. The Compensation Committee may not delegate its authority to other persons. While the Company’s executives will communicate with the SECCompensation Committee regarding executive compensation issues, the Company’s executive officers do not participate in any executive compensation decisions. The Compensation Committee met three times in 2017.
The Compensation Committee retained Mercer as its independent compensation consultant to assist in executive compensation issues. Specifically, Mercer assisted the Compensation Committee in its review and design of the Company’s executive compensation program for executives and directors. Mercer was engaged by the Compensation Committee after review and consideration of other proposals submitted by prospective compensation consultants. The Compensation Committee engaged Mercer based upon the value and the scope of services that they provide. The Compensation Committee instructed Mercer to provide market assessment of executive and officer compensation, and provide appropriate executive compensation plan designs. Mercer reported directly to the Compensation Committee and performs no laterother work for the Company.
The Compensation Committee has analyzed whether the work of Mercer as a compensation consultant has raised any conflict of interest, taking into consideration the following factors:
|
| | |
| i. | The provision of other services to the Company by Mercer; |
|
| | |
| ii. | The amount of fees from the Company paid to Mercer as a percentage of the firm’s total revenue; |
|
| | |
| iii. | Mercer policies and procedures that are designed to prevent conflicts of interest; |
|
| | |
| iv. | Any business or personal relationship of Mercer or the individual compensation advisors employed by the firm with an executive officer of the Company; |
|
| | |
| v. | Any business or personal relationship of the individual compensation advisors with any member of the Compensation Committee; and |
|
| | |
| vi. | Any stock of the Company owned by Mercer or the individual compensation advisors employed by the firm. |
The Compensation Committee has determined, based on its analysis of the above factors, that the work of Mercer and the individual compensation advisors employed by Mercer as compensation consultants to the Company has not created any conflict of interest.
Investment Committee.
Our Investment Committee consists of four independent directors: William W. King, Stewart J. Brown, Jeffrey Zwerdling and John Sweet. Jeff Zwerdling has been designated as the chair of this committee. The Investment Committee is responsible for reviewing and analyzing strategic real estate acquisitions and investments. In addition, the Investment Committee makes recommendations to the Board regarding the potential real estate acquisitions and investments. The Investment Committee was formed on September 25, 2013 and has not adopted a charter. All of the members of the Investment Committee are independent within the meaning of the listing standards of the Nasdaq Stock Market and the Company’s Corporate Governance Principles. The Investment Committee met once in 2017 in addition to tours of various potential acquisitions.
Finance Committee.
Our Finance Committee consists of four independent directors: Kurt Harrington, Stewart J. Brown, John McAuliffe and John Sweet. Mr. McAuliffe has been designated as chair of this committee. The Finance Committee is responsible for overseeing the financial policies and practices of the Company. In addition, the Finance Committee oversees the budget process of the Company, including the review of budget policies, practices, and annual budget schedule. The Finance Committee provides regular review of the budget throughout the year and recommends to the Board any changes, additions or deletions to the financial policies and practices as it deems appropriate. The Finance Committee was formed in February 2016 and has not adopted a charter. All of the members of the Finance Committee are independent within the meaning of the listing standards of the Nasdaq Stock Market and the Company’s Corporate Governance Principles except Mr. Kelly.
Operating Committee.
Our Operating Committee consists of three independent directors: Jeffrey Zwerdling, John McAuliffe, and John Sweet. Mr. Sweet has been designated as chair of this committee. The Operating Committee is designed to strengthen Board oversight of the Company's operations and increase interaction with management. The charter of the Operating Committee was adopted on August 16, 2017 and is available on the Company’s Investor Relations website (www.whlr.us). All of the members of the Operating Committee are independent within the meaning of the listing standards of the Nasdaq Stock Market and the Company’s Corporate Governance Principles. The Operating Committee met once in 2017.
Compliance with Section 16(a) of Reporting Requirements
Based solely on a review of Forms 3 and 4 and any amendments thereto furnished us pursuant to Rule 16a-3(e) under the Securities Exchange Act of 1934, or representations that no Forms 5 were required, we believe that with respect to fiscal 2017 our officers, directors, and beneficial owners of more than 10% of our equity timely complied with all applicable Section 16(a) filing requirements, except a late Form 4 was filed for David Kelly on April 30,3, 2017 reporting the March 27, 2017 purchase of 645 shares of common stock. One of our directors, Jeffrey Zwerdling, filed a late Form 4 on March 20, 2017 reporting the purchase of 15,000 shares of common stock on March 13, 2017. Lastly, on February 13, 2017 a late Form 3 was filed for M. Andrew Franklin, our Chief Operations Officer, and should have been filed on January 10, 2017. In addition, Stewart Brown, Kurt Harrington, John Sweet, William King, John McAuliffe, Carl McGowan and Jeffrey Zwerdling, filed late Form 4 reports on July 19, 2017 reporting their first quarter board fees, granted to them in common stock on May 10, 2017.
Code of Ethics
The Company has adopted a Code of Business Conduct and Ethics, which applies to all directors, officers and employees. The text of the document is available on the Company’s Investor Relations tab of our website (www.whlr.us). The Company intends to post any amendments to or waivers from its Code of Ethics (to the extent applicable to the Company’s CEO and CFO) at this location on its website.
Item 11. Executive Compensation.
Compensation Discussion and Analysis
Introduction
This information is incorporated by referenceCompensation Discussion and Analysis discusses the principles underlying our executive compensation policies and decisions. This discussion relates to the Company’s named executive officers (“NEOs”). The Company’s NEOs for 2017 were:
Jon S. Wheeler, CEO and Chairman of the Board;
Wilkes J. Graham, CFO; and
Dave Kelly, CIO
For 2017, the Company determined there were no other employees of the Company that qualified as NEOs under the applicable rules and regulations of the SEC.
Subsequent Events
On January 29, 2018, Jon Wheeler was terminated as CEO and Chairman of the Board. Mr. Wheeler subsequently resigned from the Company’s Proxy StatementCompany's Board of Directors.
On January 29, 2018, David Kelly was named CEO.
On January 4, 2018 Wilkes Graham resigned as CFO and subsequently terminated his employment on January 23, 2018 to accept a position with respecta privately-held real estate development company as their CFO.
On January 29, 2018, Matthew Reddy, formerly the Chief Accounting Officer of the Company, was named CFO.
Overview and Philosophy
We believe in “pay for performance” compensation programs in which a majority of our executives’ compensation is tied to company success in meeting predetermined performance objectives and creating long-term shareholder value. This strategy motivates our executives to achieve our annual and long-term strategic and financial goals, aligns our executives with our shareholders and recognizes the executives’ contributions in delivering strong corporate performance. We set levels of compensation for each executive that are competitive with the market in order to ensure that we can attract and retain high-caliber executives in the marketplace in which we compete for talent.
Our compensation policies and programs are built upon the strong foundation of corporate governance and compensation best practices, including:
|
| | | |
| WHAT WE DO: | | WHAT WE DON'T DO: |
þ
| Pay for Performance. The Compensation Committee seeks to align the interests of the executive officers with the interests of the stockholders by linking executive pay to individual performance and specified financial objectives. | x | No Guaranteed Annual Salary Increases or Minimum Bonuses. All salary increases are made at the discretion of the Compensation Committee and we do not pay minimum bonuses. |
þ
| Independent Compensation Consultant. The Compensation Committee retained a third party compensation consultant, Mercer, in 2015 and 2017 to advise the Compensation Committee and ensure best practices regarding our executive compensation.
| x | No Excessive Perquisites. We do not provide any excessive perquisites or personal benefits to our executive officers or directors.
|
þ
| Annual Compensation Committee Assessments. Each year, the Compensation Committee assesses: (i) its structure, (ii) performance, (iii) its role and the responsibilities articulated in the committee charter, (iv) the composition of the committee, and (v) the conduct of committee meetings. | x | No Supplemental Retirement Benefits for Executives. We do not have any supplemental executive retirement plans.
|
Role of Compensation Committee
Executive compensation is overseen by the Compensation Committee, which we created in connection with our IPO in 2012. Our Compensation Committee consists of three of our independent directors: John Sweet, John McAuliffe and Jeffrey Zwerdling. Mr. Sweet has been designated as chair of the Compensation Committee. The committee is responsible for establishing, implementing, and continually monitoring adherence to our compensation philosophy as applied to our NEOs.
Compensation Methodology
The Compensation Committee of the Board is responsible for approving all compensation for our NEOs and periodically reviews all elements of compensation to ensure that we remain competitive in the market and that overall compensation, including the means by which payment is made, is aligned with our business objectives, our performance and the interests of our shareholders. The Compensation Committee conducts an annual review of our CEO’s performance and takes those results into consideration when setting his compensation. The principles that guide our executive compensation program are to reward and incentivize executives for developing and executing on strategies to increase shareholder value, drive financial growth and increase brand awareness in our markets.
Our executive compensation program is designed to attract and retain outstanding executives, provide a compensation package that is appropriate to each NEO relative to the compensation paid to similar executives at comparable publicly-traded REITs, and reward them for creating long-term shareholder value. We believe the overall compensation of our NEOs should primarily reflect their accomplishments as a management team in achieving established key objectives. We also believe the achievement of these key objectives will ultimately align the interests of our executives with those of our shareholders.
In keeping with this principle and compensation philosophy, our executive pay program comprises a combination of base salary, annual cash incentive bonuses and equity incentive awards. A significant portion of the compensation package is at risk and dependent on the performance of the Company and the NEO, ultimately aligning the NEOs interests with those of stockholders.
Our CEO plays a significant role in setting compensation for our other members of senior management, including NEOs, by providing the Compensation Committee with an evaluation of their performance, together with recommendations for the amount of the annual cash incentive bonus and the size of equity awards. The committee also obtains input from a third party consultant, Mercer, as well as the National Association of Real Estate Investment Trusts annual compensation survey report, regarding trends in compensation packages for executives of similarly positioned REITs in the industry and has the discretion to accept, reject or modify the CEO’s recommendations.
Compensation Committee meetings are regularly attended by committee members and are occasionally attended by the CEO by invitation of the committee. Meetings may be attended by other Company executives and consultants as appropriate. The committee holds executive sessions without members of management present. The Chairman of the committee reports to the Board on the committee’s decisions.
The committee approves the base salary, annual cash incentive bonus, and equity incentive awards to the
Company’s NEOs.
Peer Group
The committee utilizes Mercer to assist in the determination of a peer group. Peer group data is used for compensation benchmarking and general comparison purposes. The peer group was selected from all U.S. publicly traded companies that are in the real estate investment trust industry (“REIT”), had total assets within a reasonable range, focused on REITs with assets, assets invested, revenue, and employees within one third to three times that of the Company. The focus was on REITs that are not third-party managed and did not consider mortgage REITs. The Company’s peer group as determined by Mercer includes the following:
|
| | |
| - Urstadt Biddle Properties | | - Whitestone REIT |
| - National Storage Affiliates | | - One Liberty Properties, Inc. |
| - Monmouth Real Estate Investment | | - Armada Hoffler Properties |
| - Easterly Government Properties | | - UMH Properties, Inc. |
| - BRT Realty Trust | | - Care Trust REIT, Inc. |
| - Getty Realty Corp | | - First Real Estate Investment Trust |
| - Agree Realty Corp | | - Sotherly Hotels, Inc. |
Executive Summary
Long-term Strategic Growth Plan
For 2017, Annual Meetingthe Company and its Board of StockholdersDirectors established a long-term strategic growth plan that included very specific initiatives which included, among others:
The significant reduction of cash general and administrative overhead;
The lowering of our weighted average cost of capital;
The diversification of our tenant base and expanding geographically;
Covering our $1.44 annualized Common Stock dividend with AFFO; and
Continuing progress in leasing vacant space and leasing renewals for the existing portfolio.
Accomplishments
In executing the long-term strategic plan in 2017, the Company believes it has achieved several important improvements and key initiatives, as described below:
Leasing spread of 3.1% on renewals;
Executed 160,341 square feet of new leases and renewed 570,461 square feet;
Reported 1.3% same-store net operating income growth for 2017; and
Reported a decrease of $2.3 million in corporate general and administrative overhead to be filedmore in line with our peer group average of 10% or less of gross revenues.
Discussion on Components of Compensation
Base Salary
Salary is intended to attract and retain executives and to provide compensation that is commensurate with the SEC no later than April 30,NEO’s scope of responsibility and effectiveness. The Compensation Committee reviews base salaries annually and determines if a salary increase is to be rewarded to the executive. The Compensation Committee takes into account relevant factors, including individual performance and market compensation data. The Compensation Committee made the following base salary compensation decisions for 2017:
As CEO, Mr. Wheeler’s annual base salary remained unchanged from 2016, $475,000;
Mr. Graham, CFO received an annual base salary of $350,000; and
As CIO, Mr. Kelly’s annual base salary for 2017 was $300,000 which was an increase in the amount of $50,000 over his base salary for 2016 due to the additional responsibilities associated with his new position as CIO.
Annual Cash Incentive Bonus
Cash incentive bonuses are designed to align the executive’s compensation with the Company’s short-term business goals. Our Compensation Committee typically determines incentive payments in the first quarter following the relevant year of performance.
For 2017, the Compensation Committee determined that our CEO, CFO, and CIO were not successful in
meeting certain critical 2017 thresholds of the long-term strategic plan and did not award any cash bonuses for 2017.
Stock Incentive Awards and Timing
Stock awards are approved at the discretion of the Compensation Committee based on the NEOs achievement of stated performance objectives and parameters established by their respective employment agreements. We believe that further enhancing the executive’s equity position in the Company creates a strong long-term alignment of interests between those individuals and our stockholders, however for 2017; no stock awards were made to NEOs.
Target Base Salary, Cash and Stock Incentive
|
| | | | | | | | | | | | | | | | | |
| NEO | | 2017 Base Salary | | Short-Term Cash Incentive Target (% of Salary) | | Short-Term Cash Incentive Target Amount | | Short-Term Stock Incentive Target (% of Salary) | | Short-Term Stock Incentive Amount | | Total Short-Term Incentive Target (% of Salary) | | Total Short-Term Incentive Amount |
| Jon S. Wheeler | | $475,000 | | 50 | % | | $237,500 | | 50 | % | | $237,500 | | 100 | % | | $475,000 |
| Wilkes J. Graham | | $350,000 | | 30 | % | | $105,000 | | 50 | % | | $175,000 | | 80 | % | | $280,000 |
| David Kelly | | $300,000 | | 30 | % | | $90,000 | | 50 | % | | $150,000 | | 80 | % | | $240,000 |
Actual Base Salary, Cash and Stock Incentive
|
| | | | | | | | | | | | | | | | | |
| NEO | | 2017 Base Salary | | Short-Term Cash Incentive Target (% of Salary) | | Short-Term Cash Incentive Target Amount | | Short-Term Stock Incentive Target (% of Salary) | | Short-Term Stock Incentive Amount | | Total Short-Term Incentive Target (% of Salary) | | Total Short-Term Incentive Amount |
| Jon S. Wheeler | | $475,000 | | — | % | | $0 | | — | % | | $0 | | — | % | | $0 |
| Wilkes J. Graham | | $350,000 | | — | % | | $0 | | — | % | | $0 | | — | % | | $0 |
| David Kelly | | $300,000 | | — | % | | $0 | | — | % | | $0 | | — | % | | $0 |
Severance
No severance was paid in 2017, nor subsequently.
Perquisites
The only material perquisites provided to our NEOs relate to reimbursement for expenses incurred and, for Mr. Graham beginning in 2016, a $1,500/ month housing allowance. The housing allowance was for a period of eighteen months and ended in June 2017. No other material perquisites are provided. In addition, our NEOs are not entitled to U.S. Federal
income tax gross-ups on any perquisites that are provided.
Retirement Benefits
NEOs are given the opportunity to participate in the Company’s tax-qualified 401(k) plans providing for employer and employee contributions. In 2017, the Company matched 100% of the first 4% of eligible employee compensation.
Employment Agreements
Subsequent to December 31, 2017, employment agreements with Mr. Wheeler and Mr. Graham have been terminated. Mr. Kelly was awarded a three year employment agreement in February 2018.
Subsequent Events
The Company reported fourth quarter AFFO of $0.18 per common share and common unit versus a projected AFFO of $0.35-$0.40 per common share and common unit. The reduction of approximately $0.17 per common share and common unit are primarily a result of a $2.4 million reserve on related party receivables, of this reserve $1.7 million is directly related to Sea Turtle Development. Sea Turtle Development is a related party as Jon Wheeler, the Company's former CEO and shareholder of the Company, is the managing member and has an equity interest. The Company loaned Sea Turtle Development $12 million in 2016 and had agreements to perform development, leasing property and asset management services for Sea Turtle Development. A reserve was recognized on amounts due from Sea Turtle Development as a result of uncertainty surrounding the recoverability of the amounts owed at December 31, 2017.
Due to the material nature of the potential losses to the Company, the Compensation Committee and the full Board of Directors determined that no bonuses were to be paid to NEOs for 2017.
Compensation Committee Interlocks and Insider Participation
Our Compensation Committee consists of three of our independent directors: Jon Sweet, Jon McAuliffe, Jeffrey Zwerdling. Mr. Sweet has been designated as chair of the Compensation Committee. There are no compensation committee interlocks and no member of the Compensation Committee serves, or has in the past served, as an employee or officer of the Company.
Compensation Committee Report
The Compensation Committee of the Board has reviewed and discussed the Compensation Discussion and Analysis required by Item 402(b) of Regulation S-K with management and, based on such review and discussions, the Compensation Committee recommended to the Board that the Compensation Discussion and Analysis be included in this Annual Report on Form 10-K.
Submitted by:
Jon Sweet, Chairman
John McAuliffe
Jeffrey Zwerdling
Employment Agreements With The Company’s Executive Officers
Generally
In 2018, we entered into employment agreements with David Kelly, CEO, Matthew Reddy, CFO, and M. Andrew Franklin, COO. The employment agreements for Jon S. Wheeler, former CEO, and Wilkes Graham, former CFO, were terminated in January 2018. In addition, Robin Hanisch, our former Corporate Secretary's, employment agreement was terminated in December 2017. We believe that the protections contained in our current executive employment agreements help to ensure the day-to-day stability necessary to our executives to enable them to properly focus their attention on their duties and responsibilities with the Company and provide security with regard to some of the most uncertain events relating to continued
employment, thereby limiting concern and uncertainty and promoting productivity. Each of our employment agreements with our executive officers provides for a term of three years.
Employment Agreement of David Kelly
Employment Agreement and Salary. On February 14, 2018, the Company on its behalf and on behalf of its subsidiaries, including Wheeler REIT, L.P. entered into an employment agreement with David Kelly (the “Kelly Employment Agreement”) for a period of three years beginning on February 14, 2018, and ending on February 13, 2021 (the “Initial Term”). At the end of the Initial Term, the Kelly Employment Agreement will automatically renew for subsequent one-year terms (each an “Annual Term”) unless terminated pursuant to the terms of the Kelly Employment Agreement. Under the terms of the Kelly Employment Agreement, Mr. Kelly shall be employed as the Company’s President and CEO and is required to devote his best efforts to the Company’s business and affairs and in return will receive the following:
|
| |
| • | Base compensation of $400,000 per annum; and |
| • | Reimbursement of reasonable and necessary business expenses, and Mr. Kelly is eligible to participate in any current or future bonus, incentive and other compensation plans available to the Company’s executives. |
Severance Terms. Under the Kelly Employment Agreement, if Mr. Kelly’s employment is terminated by the Company without “Cause” (as defined in the Kelly Employment Agreement) then Mr. Kelly shall generally be entitled to severance pay of the greater of (i) salary continuation payments at Mr. Kelly's current salary, less mandatory deductions, for six months plus one additional month for each full calendar quarter remaining in the then-current term of Mr. Kelly's employment or (ii) salary continuation equal to the sum of Mr. Kelly's then current base salary for a period equal to the remainder of the term of the Kelly Employment Agreement. Mr. Kelly will also be entitled to any annual bonuses that would have been earned based solely on his continued employment for the remainder of the term of the Kelly Employment Agreement. In addition, Mr. Kelly is entitled to disability, accident and health insurance for a 12 month period following termination substantially similar to those insurance benefits Mr. Kelly is receiving immediately prior to the date of termination or the cash equivalent, offset by any comparable benefits actually received by Mr. Kelly.
In the event Mr. Kelly terminates his employment with “Good Reason” (as defined in the Kelly Employment Agreement), but not a "Change in Control" (as defined in the Kelly Employment Agreement) then Mr. Kelly shall generally be entitled to the greater of current base salary, less mandatory deductions (i) for the remainder of the term or (ii) 12 months, plus any earned but unpaid bonus for the fiscal year prior to the year in which termination occurs. In addition, Mr. Kelly is entitled to disability, accident and health insurance for a 12 month period following termination substantially similar to those insurance benefits Mr. Kelly is receiving immediately prior to the date of termination or the cash equivalent, offset by any comparable benefits actually received by Mr. Kelly.
In the event Mr. Kelly terminates his employment with Good Reason, which follows a Change in Control or by the Company without Cause and such termination occurs within six months of a Change of Control then Mr. Kelly shall generally be entitled to a lump sum payment equal to 2.99 times Mr. Kelly’s annual base salary less mandatory deductions payable within 90 calendar days of the termination. In addition, Mr. Kelly is entitled to health care coverage pursuant to COBRA at Mr. Kelly's expense for up to 18 months.
Mr. Kelly shall not be entitled to any benefits under the Kelly Employment Agreement in the case of the Company terminating his employment for Cause or Mr. Kelly terminating his employment without Good Reason.
Death and Disability. In the event of a termination of employment on account of death occurring during the Initial Term or Annual Term then Mr. Kelly’s estate shall generally be entitled to: (a) Mr. Kelly’s regular base salary (determined on the date of death) for a period of twelve months following death; (b) the amount of any bonus remaining payable by the Company to Mr. Kelly for its fiscal year prior to death; and (c) any accrued and unpaid bonus determined by the Board of Directors for the year in which the death occurs prorated for the number of completed calendar months served prior to death.
In the event of a “Disability” (as defined in the Kelly Employment Agreement) by Mr. Kelly for 120 consecutive days or longer at any point during his employment, then the Company will pay to Mr. Kelly his regular base salary for a twelve month period following the date on which the Disability first begins, net of any benefits received by Mr. Kelly under any disability policy obtained by the Company or Mr. Kelly, the premiums for which are paid by the Company. Mr. Kelly will also be entitled to any bonus remaining payable by the Company to Mr. Kelly for its fiscal year prior to the date the Disability began and any unpaid bonus determined by the Board of Directors for the fiscal year in which the disability occurs prorated for the number of completed calendar months served prior to the date of Disability.
Miscellaneous Provisions. The Kelly Employment Agreement provides for confidentiality and nondisclosure provisions, whereby Mr. Kelly is required to keep confidential the Company’s trade secrets that he acquired during the course of his employment. His employment contract also contains a non-solicitation of employees clause for a duration of (18) months following the last day of his employment with the Company.
Employment Agreement of Matthew Reddy
Employment Agreement and Salary. On February 14, 2018, the Company on its behalf and on behalf of its subsidiaries, including Wheeler REIT, L.P. entered into an employment agreement with Matthew Reddy (the “Reddy Employment Agreement”) for a period of three years beginning on February 14, 2018, and ending on February 13, 2021 (the “Initial Term”). At the end of the Initial Term, the Reddy Employment Agreement will automatically renew for subsequent one-year terms (each an “Annual Term”) unless terminated pursuant to the terms of the Reddy Employment Agreement. Under the terms of the Reddy Employment Agreement, Mr. Reddy shall be employed as the Company’s CFO and is required to devote his best efforts to the Company’s business and affairs and in return will receive the following:
|
| |
| • | Base compensation of $250,000 per annum; and |
| • | Reimbursement of reasonable and necessary business expenses, and Mr. Reddy is eligible to participate in any current or future bonus, incentive and other compensation plans available to the Company’s executives. |
Severance Terms. Under the Reddy Employment Agreement, if Mr. Reddy’s employment is terminated by the Company without “Cause” (as defined in the Reddy Employment Agreement) then Mr. Reddy shall generally be entitled to severance pay of the greater of (i) salary continuation payments at Mr. Reddy's current salary, less mandatory deductions, for six months plus one additional month for each full calendar quarter remaining in the then-current term of Mr. Reddy's employment or (ii) salary continuation equal to the sum of Mr. Reddy's then current base salary for a period equal to the remainder of the term of the Reddy Employment Agreement. Mr. Reddy will also be entitled to any annual bonuses that would have been earned based solely on his continued employment for the remainder of the term of the Reddy Employment Agreement. In addition, Mr. Reddy is entitled to disability, accident and health insurance for a 12 month period following termination substantially similar to those insurance benefits Mr. Reddy is receiving immediately prior to the date of termination or the cash equivalent, offset any by comparable benefits actually received by Mr. Reddy.
In the event Mr. Reddy terminates his employment with “Good Reason” (as defined in the Reddy Employment Agreement), but not a “Change in Control” (as defined in the Reddy Employment Agreement) then Mr. Reddy shall generally be entitled to the greater of current base salary, less mandatory deductions (i) for the remainder of the term or (ii) 12 months, plus any earned but unpaid bonus for the fiscal year prior to the year in which termination occurs. In addition, Mr. Reddy is entitled to disability, accident and health insurance for a 12 month period following termination substantially similar to those insurance benefits Mr. Reddy is receiving immediately prior to the date of termination or the cash equivalent, offset by any comparable benefits actually received by Mr. Reddy.
In the event Mr. Reddy terminates his employment with Good Reason, which follows a Change in Control or by the Company without Cause and such termination occurs within six months of a Change in Control then Mr. Reddy shall generally be entitled to a lump sum payment equal to 2.99 times Mr. Reddy’s annual base salary less mandatory deductions payable within 90 calendar days of the termination. In addition, Mr. Reddy is entitled to health care coverage pursuant to COBRA at Mr. Reddy's expense for up to 18 months.
Mr. Reddy shall not be entitled to any benefits under the Reddy Employment Agreement in the case of the Company terminating his employment for Cause or Mr. Reddy terminating his employment without Good Reason.
Death and Disability. In the event of a termination of employment on account of death occurring during the Initial Term or Annual Term then Mr. Reddy’s estate shall generally be entitled to: (a) Mr. Reddy’s regular base salary (determined on the date of death) for a period of twelve months following death; (b) the amount of any bonus remaining payable by the Company to Mr. Reddy for its fiscal year prior to death; and (c) any accrued and unpaid bonus determined by the Board of Directors for the year in which the death occurs prorated for the number of completed calendar months served prior to death.
In the event of a “Disability” (as defined in the Reddy Employment Agreement) by Mr. Reddy for 120 consecutive days or longer at any point during his employment, then the Company will pay to Mr. Reddy his regular base salary for a twelve month period following the date on which the Disability first begins, net of any benefits received by Mr. Reddy under any disability policy obtained by the Company or Mr. Reddy, the premiums for which are paid by the Company. Mr. Reddy will also be entitled to any bonus remaining payable to Mr. Reddy for his fiscal year prior to the date the Disability began and any
unpaid bonus for the fiscal year in which the disability occurs prorated for the number of completed calendar months served prior to the date of Disability.
Miscellaneous Provisions. The Reddy Employment Agreement provides for confidentiality and nondisclosure provisions, whereby Mr. Reddy is required to keep confidential the Company’s trade secrets that he acquired during the course of his employment. His employment contract also contains a non-solicitation of employees clause for a duration of (18) months following the last day of his employment with the Company.
Employment Agreement of M. Andrew Franklin
Employment Agreement and Salary. On February 14, 2018, the Company on its behalf and on behalf of its subsidiaries, including Wheeler REIT, L.P. entered into an employment agreement with M. Andrew Franklin (the “Franklin Employment Agreement”) for a period of three years beginning on February 14, 2018, and ending on February 13, 2021 (the “Initial Term”). At the end of the Initial Term, the Franklin Employment Agreement will automatically renew for subsequent one-year terms (each an “Annual Term”) unless terminated pursuant to the terms of the Franklin Employment Agreement. Under the terms of the Franklin Employment Agreement, Mr. Franklin shall be employed as the Company’s COO and is required to devote his best efforts to the Company’s business and affairs and in return will receive the following:
|
| |
| • | Base compensation of $250,000 per annum; and |
| • | Reimbursement of reasonable and necessary business expenses, and Mr. Franklin is eligible to participate in any current or future bonus, incentive and other compensation plans available to the Company’s executives. |
Severance Terms. Under the Franklin Employment Agreement, if Mr. Franklin’s employment is terminated by the Company without “Cause” (as defined in the Franklin Employment Agreement) then Mr. Franklin shall generally be entitled to severance pay of the greater of (i) salary continuation payments at Mr. Franklin's current salary, less mandatory deductions, for six months plus one additional month for each full calendar quarter remaining in the then-current term of Mr. Franklin's employment or (ii) salary continuation equal to the sum of Mr. Franklin's then current base salary for a period equal to the remainder of the term of the Franklin Employment Agreement. Mr. Franklin will also be entitled to any annual bonuses that would have been earned based solely on his continued employment for the remainder of the term of the Franklin Employment Agreement. In addition, Mr. Franklin is entitled to disability, accident and health insurance for a 12 month period following termination substantially similar to those insurance benefits Mr. Franklin is receiving immediately prior to the date of termination or the cash equivalent, offset by any comparable benefits actually received by Mr. Franklin.
In the event Mr. Franklin terminates his employment with “Good Reason” (as defined in the Franklin Employment Agreement), but not a “Change in Control” (as defined in the Franklin Employment Agreement) then Mr. Franklin shall generally be entitled to the greater of current base salary, less mandatory deductions (i) for the remainder of the term or (ii) 12 months, plus any earned but unpaid bonus for the fiscal year prior to the year in which termination occurs. In addition, Mr. Franklin is entitled to disability, accident and health insurance for a 12 month period following termination substantially similar to those insurance benefits Mr. Franklin is receiving immediately prior to the date of termination or the cash equivalent, offset by any comparable benefits actually received by Mr. Franklin.
In the event Mr. Franklin terminates his employment with Good Reason, which follows a Change in Control or by the Company without Cause and such termination occurs within six months of a Change of Control then Mr. Franklin shall generally be entitled to a lump sum payment equal to 2.99 times Mr. Franklin’s annual base salary less mandatory deductions payable within 90 calendar days of the termination. In addition, Mr. Franklin is entitled to health care coverage pursuant to COBRA at Mr. Franklin's expense for up to 18 months.
Mr. Franklin shall not be entitled to any benefits under the Franklin Employment Agreement in the case of the Company terminating his employment for Cause or Mr. Franklin terminating his employment without Good Reason.
Death and Disability. In the event of a termination of employment on account of death occurring during the Initial Term or Annual Term then Mr. Franklin’s estate shall generally be entitled to: (a) Mr. Franklin’s regular base salary (determined on the date of death) for a period of twelve months following death; (b) the amount of any bonus remaining payable by the Company to Mr. Franklin for its fiscal year prior to death; and (c) any accrued and unpaid bonus determined by the Board of Directors for the year in which the death occurs prorated for the number of completed calendar months served prior to death.
In the event of a “Disability” (as defined in the Franklin Employment Agreement) by Mr. Franklin for 120 consecutive days or longer at any point during his employment, then the Company will pay to Mr. Franklin his regular base salary for a twelve month period following the date on which the Disability first begins, net of any benefits received by Mr. Franklin under any disability policy obtained by the Company or Mr. Franklin, the premiums for which are paid by the Company. Mr. Franklin
will also be entitled to any bonus remaining payable to Mr. Franklin for his fiscal year prior to the date the Disability began and any unpaid bonus for the fiscal year in which the disability occurs prorated for the number of completed calendar months served prior to the date of Disability.
Miscellaneous Provisions. The Franklin Employment Agreement provides for confidentiality and nondisclosure provisions, whereby Mr. Franklin is required to keep confidential the Company’s trade secrets that he acquired during the course of his employment. His employment contract also contains a non-solicitation of employees clause for a duration of (18) months following the last day of his employment with the Company.
Stock Plans
2015 Long-Term Incentive Plan
Pursuant to our 2015 Long-Term Incentive Plan, we may award incentives covering an aggregate of 125,000 shares of our Common Stock. As of March 7, 2018, we have issued 41,104 shares under the plan to employees, directors and outside contractors for services provided.
2016 Long-Term Incentive Plan
Pursuant to our 2016 Long-Term Incentive Plan, we may award incentives covering an aggregate of 625,000 shares of our Common Stock. As of March 7, 2018, we have issued 477,413 under the plan to employees, directors and outside contractors for services provided.
Security Authorized For Issuance Under Equity Compensation Plan
The following table sets forth information as of December 31, 2017 regarding our compensation plans and the Common Stock we may issue under the plan.
|
| | | | | | | | |
| Equity Compensation Plan Information Table |
| Plan Category | Number of securities to be issued upon exercise of outstanding options, warrants and rights | | Weighted-average exercise price of outstanding options, warrants and rights | | Number of securities remaining available for future issuance under equity compensation plans |
Equity compensation plans approved by stockholders (1) | — |
| | — |
| | 561,976 |
|
| Equity compensation plans not approved by stockholders | — |
| | — |
| | — |
|
| Total | — |
| | — |
| | 561,976 |
|
(1) Includes our 2015 and 2016 Long-Term Incentive Plans, which authorized a maximum of 125,000 and 625,000 shares, respectively, of our Common Stock for issue. Awards are granted by the Compensation Committee.
Grants of Plan Based Awards in 2017
The following Common Stock share awards were made in 2017. Awards were made in 2017 to the named executive officers under the 2016 Long Term Incentive Plan.
|
| | | | | | | | | |
| Name | | Grant Date | | All Other Stock Awards: Number of shares of stock or units (1) | | Grant Date Fair Value |
| Jon S. Wheeler | | February 8, 2017 | | 8,732 |
| | $ | 118,750 |
|
| Wilkes Graham | | February 8, 2017 | | 6,434 |
| | 87,501 |
|
| David Kelly | | February 8, 2017 | | 3,677 |
| | 50,000 |
|
| Matthew Reddy | | February 8, 2017 | | 3,033 |
| | 41,251 |
|
| Andrew Franklin | | February 8, 2017 | | 3,677 |
| | 50,000 |
|
| Total | | | | 25,553 |
| | $ | 347,502 |
|
(1) Dividends are paid on all issued shares of Common Stock at the same rate and time as paid to all other holders of our shares of Common Stock as declared by our Board.
Potential Payments Upon Termination or Change in Control
See “Employment Agreements With The Company’s Executive Officers.”
Outstanding Equity Awards at Fiscal-Year End
The Company has no outstanding Equity Awards at the end of the 2017 fiscal year.
Compensation Tables
Summary Compensation Table
The table below summarizes the total compensation for the fiscal years indicated paid or awarded to each of the NEOs, calculated in accordance with SEC rules and regulations.
|
| | | | | | | | | | | | | | | | | | | | | | | |
| Name and Principal Position | Fiscal
Year | | Salary ($) | | Bonus | | Stock
Awards | | Option
Awards | | Non-Equity
Incentive Plan
Compensation | | All Other
Compensation | | Total ($) |
| Jon S. Wheeler | 2017 | | 475,000 |
| | — |
| | — |
| | — |
| | — |
| | 8,618 |
| (1 | ) | 483,618 |
|
| Former Principal Executive Officer (5) | 2016 | | 475,000 |
| | 118,750 |
| | 118,750 |
| | — |
| | — |
| | 7,695 |
| (1 | ) | 720,195 |
|
| | 2015 | | 493,269 |
| | — |
| | 26,259 |
| | — |
| | — |
| | 18,000 |
| (1 | ) | 537,528 |
|
| | | | | | | | | | | | | | | | |
| David Kelly | 2017 | | 298,077 |
| | — |
| | — |
| | — |
| | — |
| | 11,007 |
| (1 | ) | 309,084 |
|
| Chief Executive Officer (3) | 2016 | | 186,539 |
| | 280,000 |
| | 50,000 |
| | — |
| | — |
| | 10,807 |
| (1 | ) | 527,346 |
|
| | 2015 | | 181,731 |
| | 269,375 |
| | 19,603 |
| | — |
| | — |
| | 13,867 |
| (1 | ) | 484,576 |
|
| | | | | | | | | | | | | | | | |
| Wilkes Graham | 2017 | | 350,000 |
| | — |
| | — |
| | — |
| | — |
| | 10,603 |
| (4 | ) | 360,603 |
|
| Former Chief Financial Officer (2) | 2016 | | 333,077 |
| | 52,500 |
| | 112,500 |
| | — |
| | — |
| | 22,254 |
| (4 | ) | 520,331 |
|
| | | | | | | | | | | | | | | | |
(1) Company's match on 401(k) plan and Group Term Life
(2) Mr. Graham joined the Company in January 2016 and resigned in January 2018.
(3) Mr. Kelly was appointed to this position in 2018, prior to this we was the Chief Investment Officer.
(4) Includes Group Term Life and housing allowance.
(5) Mr. Wheeler was terminated in January 2018.
CEO Pay Ratio
Mr. Wheeler had fiscal 2017 total compensation of $483,618, as reflected in the Summary Compensation Table. We estimate that the median annual compensation for all Wheeler employees, excluding our former CEO, was $55,619 for the year ended December 31, 2017. As a result, Mr. Wheeler’s 2017 annual compensation was approximately nine times that of the median annual compensation for all employees. For purposes of calculating the 2017 ratio the Company included in its calculation of compensation: base salary, hourly wages, commissions, annual bonus amounts and stock-based compensation attributable to 2017 performance, and Company's 401(k) match. For purposes of this calculation, the Company had 62 employees, excluding the CEO.
Director Compensation
Directors who are officers of our Company do not receive any compensation for their services. Non-employee directors are entitled to receive $32,500 per year for serving as directors and may receive stock grants from our Company. The Board set annual retainers for the Audit, Compensation, Nominating and Governance, Investment, and Finance committee chairs at $7,500, $6,000, $6,000, $6,000, and $6,000, respectively. The Board set an annual retainer for the lead director at $12,500. We reimburse each of our directors for his or her travel expenses incurred in connection with his or her attendance at full board of directors and committee meetings. In 2017, Directors agreed to receive stock grants in lieu of cash for their services. The following table summarizes directors’ compensation for 2017:
|
| | | | | | | | | | | |
| Name | Fees Earned
or Paid in
Cash | | Stock
Awards | | Total |
| Stewart J. Brown | $ | — |
| | $ | 98,248 |
| | $ | 98,248 |
|
| Kurt R. Harrington | — |
| | 98,250 |
| | 98,250 |
|
| William W. King | — |
| | 98,248 |
| | 98,248 |
|
| John McAuliffe | — |
| | 101,275 |
| | 101,275 |
|
| Carl B. McGowan, Jr. | — |
| | 102,790 |
| | 102,790 |
|
| Jeffrey M. Zwerdling | — |
| | 113,871 |
| | 113,871 |
|
| John Sweet | — |
| | 98,250 |
| | 98,250 |
|
Item 12. Security Ownership of Certain Beneficial Owners and Management and Related Shareholder Matters.
ThisSecurities Authorized for Issuance Under Equity Compensation Plans
See "Stock Plans" in Item 11.
Security Ownership of Certain Beneficial Owners and Management
The following tables set forth certain information regarding the beneficial ownership of shares of our common stock and shares of common stock into which common units are exchangeable for (1) each person who is incorporated by reference from the Company’s Proxy Statementbeneficial owner of 5% or more of our outstanding common stock, (2) each of our directors and named executive officers, and (3) all of our directors and executive officers as a group. Each person or entity named in the tables has sole voting and investment power with respect to all of the 2017 Annual Meetingshares of Stockholdersour common stock shown as beneficially owned by such person, except as otherwise set forth in the notes to the tables. The extent to which a person will hold shares of common stock as opposed to units is set forth in the footnotes below.
The SEC has defined “beneficial ownership” of a security to mean the possession, directly or indirectly, of voting power and/or investment power over such security. A stockholder is also deemed to be, filedas of any date, the beneficial owner of all securities that such stockholder has the right to acquire within 60 days after that date through (1) the exercise of any option, warrant or right, (2) the conversion of a security, (3) the power to revoke a trust, discretionary account or similar arrangement or (4) the automatic termination of a trust, discretionary account or similar arrangement. In computing the number of shares beneficially owned by a person and the percentage ownership of that person, common shares subject to options or other rights (as set forth above) held by that person that are exercisable as of this filing or will become exercisable within 60 days thereafter, are deemed outstanding, while such shares are not deemed outstanding for purposes of computing percentage ownership of any other person. As of March 5, 2018, we had 178 stockholders of record. This number excludes our common shares owned by shareholders holding under nominee security position listings.
Unless otherwise indicated, the address of each named person is c/o Wheeler Real Estate Investment Trust, Inc., Riversedge North, 2529 Virginia Beach Blvd., Suite 200, Virginia Beach, Virginia 23452.
|
| | | | | | | | |
| | Number of Shares and Common Units Beneficially Owned | | Percentage of All Shares(1) | | Percentage of All Shares and Common Units(2) |
| David Kelly | 11,679 |
| | * |
| | * |
|
| M. Andrew Franklin | 4,295 |
| | * |
| | * |
|
| Matthew Reddy | 3,690 |
| | * |
| | * |
|
| Carl B. McGowan, Jr. | 15,062 |
| | * |
| | * |
|
| William W. King | 14,255 |
| | * |
| | * |
|
| Jeff Zwerdling | 71,614 |
| (3) | * |
| | * |
|
| Kurt R. Harrington | 14,824 |
| | * |
| | * |
|
| John Sweet | 12,995 |
| | * |
| | * |
|
| Stewart Brown | 12,649 |
| | * |
| | * |
|
| John McAuliffe | 14,774 |
| | * |
| | * |
|
| All directors, director nominees and executive officers as a group (3 persons) | 175,837 |
| (4) | 1.97 | % | | 1.84 | % |
| |
| (1) | Based upon 8,946,399 shares of common stock outstanding on March 5, 2018. In addition, amounts for individuals assume that all Series B convertible preferred stock held by the individual are converted into common stock and all warrants held by the person are exercised. |
| |
| (2) | Based upon 8,946,399 shares of our common stock and 626,329 common units, which units may be redeemed for cash or, at our option, exchanged for shares of our common stock outstanding on March 5, 2018. |
| |
| (3) | Includes 54,868 shares of common stock, 14,000 shares of Series B convertible preferred stock convertible into 8,750 shares of common stock, 16,800 warrants to purchase 2,100 shares of common stock, and 4,000 Shares of Series D convertible preferred stock convertible into 5,896 shares of Series D convertible preferred stock. |
| |
| (4) | Includes 159,091 shares of common stock and 16,746 common units. |
Based upon our records and the information reported in filing with the SEC, no laterthe following were beneficial owners of more than April 30, 2017.5% of our shares of Common Stock as of March 5, 2018.
|
| | | | | | | | |
| Name and Address of Beneficial Owner | Amount and Nature of Beneficial Ownership (1) | | Percentage of Our Outstanding Shares (2) | | Percentage of Our Outstanding Shares and Common Units (3) |
Stilwell Value Partners VII, L.P. (4) 111 Broadway, 12th Floor New York, NY 10006-1901 | 849,983 |
| | 9.50 | % | | 8.88 | % |
LDR Capital Management, LLC (5) 444 Madison Ave., 34th Floor New York, NY 10022 | 529,632 |
| | 5.92 | % | | 5.53 | % |
Forward Management, LLC (6) 101 California Street, 16th Floor San Francisco, CA 94111 | 538,563 |
| | 6.02 | % | | 5.63 | % |
Corbin Capital Partners, L.P. (7) 590 Madison Avenue New York, NY 10022 | 485,899 |
| | 5.43 | % | | 5.08 | % |
Westport Capital Partners, LLC (8) 40 Danbury Road Wilton, CT 06897 | 813,641 |
| | 9.09 | % | | 8.50 | % |
FMR, LLC (9) 245 Summer Street Boston, MA 02210 | 1,092,673 |
| | 12.21 | % | | 11.41 | % |
NS Advisors, LLC (10) 274 Riverside Associates Westport, CT 06880 | 593,192 |
| | 6.63 | % | | 6.20 | % |
| Total of 5% or more shareholders as a group (7 entities) | 4,903,583 |
| | 54.80 | % | | 51.23 | % |
| |
| (1) | The amount of Common Stock reflected in this column has been adjusted to reflect the Company’s one for eight reverse stock split that became effective on March 31, 2017. |
| |
| (2) | Based upon 8,946,399 shares of common stock outstanding on March 5, 2018. |
| |
| (3) | Based upon 8,946,399 shares of our common stock and 626,329 common units, which units may be redeemed for cash or, at our option, exchanged for shares of our common stock outstanding on March 5, 2018. |
| |
| (4) | Based solely upon the Schedule 13D/A filed with the SEC by the beneficial owner on January 17, 2018 reporting beneficial ownership as of January 17, 2018 of 849,983 shares. Stillwell Activist Fund, L.P., Stillwell Activist Investments, L.P., Stillwell Value LLC and Joseph Stillwell possess shared voting and dispositive power over 849,983 shares with Stillwell Value Partners VII, L.P.. |
| |
| (5) | Based solely upon the Schedule 13G filed with the SEC by the beneficial owner on February 13, 2017 reporting beneficial ownership as of December 31, 2016. LDR Capital Management possesses shared voting and dispositive power over 4,237,059 shares with Lawrence Raiman. In addition, based solely upon the Schedule 13G, Lawrence Raiman is the sole manager, President and Chief Executive Officer of LDR and therefore may be deemed to have beneficial ownership over the shares. The 4,237,059 shares became 529,632 shares upon the effectiveness of the Company's one for eight reverse stock split. |
| |
| (6) | Based solely upon the Schedule 13G filed with the SEC by the beneficial owner on January 18, 2018 reporting beneficial ownership as of December 31, 2017, includes the shares reported by Salient Select Income Fund. |
| |
| (7) | Based solely upon the Schedule 13G filed with the SEC by the beneficial owner on January 31, 2018 reporting beneficial ownership as of December 31, 2017. Corbin Capital Partners Group, L.P. possesses shared voting and dispositive power over 485,899 shares. In addition, based solely upon the Schedule 13G, Corbin Capital Partners, L.P. may be deemed to have beneficial ownership over the shares, and Corbin Equity Fund, L.P. may be deemed to have beneficial ownership over 395,687 of the shares. |
| |
| (8) | Based solely upon the Schedule 13D/A filed with the SEC by the beneficial owner on December 20, 2017 reporting beneficial ownership as of December 18, 2017. Westport Capital Partners, LLC possesses shared voting and dispositive power over 813,641 shares. In addition, based solely upon the Schedule 13D, Russel Bernard, Sean Armstrong, Wm. Gregory Geiger, Jordan Socaransky and Marc Porosoff are members of the investment committee of Westport Capital Partners, LLC and may be deemed to have beneficial ownership over the shares. The 813,641 shares include 353,387 shares held by the record owner WCP Real Estate Fund IV, L.P, 177,862 shares held by the record owner WCP Real Estate Fund IV (ERISA), L.P., and 250,000 shares of common stock and 51,828 shares of the |
Company's Series B convertible preferred stock that are convertible into 32,392 share of common stock held in certain managed accounts of record holders as to which Westport Capital Partners, LLC serves as the investment manager.
| |
| (9) | Based solely upon the Schedule 13G filed with the SEC by the beneficial owner on February 12, 2018 reporting beneficial ownership as of February 9, 2018 of 1,092,673 shares. Includes the shares reported by Abigail Johnson and Fidelity Real Estate Income Fund. |
| |
| (10) | Based solely upon the Schedule 13D/A filed with the SEC by the beneficial owner on January 26, 2018 reporting beneficial ownership as of December 31, 2017 of 593,192 shares. NS Advisors possesses shared voting power of 580,728 with Andrew R. Jones. In addition, Andrew R. Jones possesses sole voting power of an additional 12,464 shares owned through his IRA. |
Item 13. Certain Relationships and Related Transactions, and Director Independence.
This informationPartnership Agreement
In connection with the completion of our initial public offering, we entered into a partnership agreement with various persons receiving common units in the formation transactions, including our former Chairman and CEO Mr. Wheeler, his affiliates and certain former executive officers or our Company. As a result, these persons became limited partners of our operating partnership, Wheeler REIT, L.P. (the “Operating Partnership”).
Pursuant to the partnership agreement with our Operating Partnership, limited partners of the Operating Partnership and some assignees of limited partners will have the right, beginning 12 months after acquiring the common units, to require our Operating Partnership to redeem part or all of their common units for cash equal to the then-current market value of an equal number of shares of our Common Stock (determined in accordance with and subject to adjustment under the Partnership Agreement), or, at our election, to exchange their common units for shares of our Common Stock on a one-for-one basis, subject to certain adjustments and the restrictions on ownership and transfer of our stock set forth in our charter.
Employment Agreements
Our CEO, CFO and COO have entered into three-year employment agreements, which in addition to the items noted throughout this Compensation Discussion and Analysis, include disability and termination provisions, among other provisions. See “Employment Agreements With The Company’s Executive Officers” for a summary of the terms of Mr. Kelly and Mr. Reddy’s and Mr. Franklin's employment agreements.
Indemnification of Officers and Directors
Our charter and bylaws provide for certain indemnification rights for our directors and officers and we will enter into an indemnification agreement with each of our executive officers and directors, providing for procedures for indemnification and advancements by us of certain expenses and costs relating to claims, suits or proceedings arising from their service to us or, at our request, service to other entities, as officers or directors to the maximum extent permitted by Maryland law.
Other Related Party Transactions
The following summarizes related party activity as of and for the years ended December 31, 2017, 2016 and 2015. The amounts disclosed below reflect the activity between the Company and Mr. Wheeler's affiliates (in thousands).
|
| | | | | | | | | | | |
| | December 31, |
| | 2017 | | 2016 | | 2015 |
| Amounts paid to affiliates | $ | 48 |
| | $ | 125 |
| | $ | 986 |
|
| Amounts received from affiliates | $ | 2,517 |
| | $ | 1,347 |
| | $ | 777 |
|
| Amounts due from affiliates | $ | — |
| | $ | 1,456 |
| | $ | 481 |
|
| Notes receivable | $ | 6,739 |
| | $ | 12,000 |
| | $ | — |
|
As discussed in Note 4 to the consolidated financial statements, the Company has loaned $11.00 million for the partial funding of Pineland Station Shopping Center in Hilton Head, South Carolina to be known in the future as Sea Turtle Development and loaned $1.00 million for the sale of land to be used in the development. The Company has recognized a $5.26 million impairment charge on the note receivable as discussed in greater detail in Note 4. The impairment charge is incorporated by referencepresented as “impairment of note receivable” on the consolidated statement of operations. Subsequent to December 31, 2017, the Company's agreement to perform development, leasing, property and asset management services for Sea Turtle Development was terminated. Prior to the termination of the agreements, development fees of 5% of hard costs incurred were paid to the Company. Leasing, property and asset management fees were consistent with those charged for services provided to non-related properties.
The Company has reserved $2.36 million in amounts due from affiliates at December 31, 2017, as follows:
|
| | | |
| Sea Turtle Development | |
| Accrued interest on note receivable - due at maturity | $ | 895 |
|
| Accrued interest on note receivable | 443 |
|
| Leasing Commissions | 190 |
|
| Development fees | 182 |
|
| Other | 18 |
|
| Other non-REIT Properties | 636 |
|
| | $ | 2,364 |
|
Of the gross $833 thousand currently due from Sea Turtle Development $323 thousand was earned during the three months ended December 31, 2017. Amounts due from Sea Turtle Development are reserved due to uncertainty surrounding the collectability given current cash flow models. Cash flow models on the project include development costs to date, anticipated cost to complete, executed leases, and financing available to complete and stabilize the project. Capitalization rates utilized in these models are based upon rates that the Company believes to be within a reasonable range of current market rates for the respective project.
Amounts due from other non-REIT properties have been reserved based on strained cash flow at the respective properties and payment history. The reserve is included in “provision for credit losses” on the consolidated statements of operations.
At December 31, 2016, $657 thousand in accrued interest on the notes receivable was included in amounts due from affiliates, of this $415 thousand was due at maturity. Amounts due from affiliates also include $166 thousand in development fees at December 31, 2016.
In 2016, in connection with the acquisition of Berkley and Sangaree/Tri-County, the Operating Partnership entered into a tax protection agreement that obligates the Operating Partnership to reimburse Jon Wheeler, the Company's former CEO for his tax liabilities resulting from the Company’s Proxy Statementrecognition of certain taxable income or gain in the event the Operating Partnership takes certain action prior to November 10, 2023 with respect to Sangaree Plaza, Tri-County Plaza and Berkley.
Acquisition of Portfolio Properties
Each portfolio property that we acquired through the 2017 Annual MeetingOperating Partnership upon the completion of Stockholders to be filedour initial public offering and the formation transactions and certain other properties subsequently acquired were owned directly or indirectly by partnerships, limited liability companies or corporations (the “Ownership Entities”) in which Mr. Wheeler and his affiliates, certain of our other directors and executive officers and their affiliates and other third parties owned a direct or indirect interest (the “Prior Investors”). In connection with the SEC no later than April 30, 2017.acquisition of these Ownership Entities, the Operating Partnership entered into (1) contribution agreements with these Prior Investors, pursuant to which they contributed their interests in the Ownership Entities to the Operating Partnership and/or (2) purchase and sale agreements with the Ownership Entities. The Prior Investors, including Mr. Wheeler and his affiliates, certain of our other directors and executive officers and their affiliates, received cash and/or common units in exchange for their interests in the Ownership Entities. The value of the consideration paid to each of the Prior Investors in the Ownership Entities, in each case, was based upon the terms of the applicable contribution agreements and/or purchase and sale agreements. The purchase price paid for these properties was determined by analyzing factors such as, but not limited to, net operating income, fair market capitalization rates, leverage, occupancy rates, anchor tenant credit and alternative uses of capital. In some instances, we did not obtain independent third-party appraisals before purchasing such properties.
The following table represents portfolio properties acquired from Mr. Wheeler and his affiliates during the year ended December 31, 2017 and 2016.
|
| | | | | | | | | | |
| Portfolio Property | | Transaction Cost (1) | | Related Person | | Dollar Value of Related Person's Interest (2) |
| | | | | | | |
| Berkley Shopping Center | | $ | 4,182,000 |
| | Jon S. Wheeler - Chairman & CEO | | $ | 30,086 |
|
| | | | | Ann L. McKinney - Director | | 398 |
|
| | | | | | | |
| Sangaree Plaza and Tri-County Plaza | | $ | 10,765,000 |
| | Jon S. Wheeler - Chairman & CEO | | $ | 47,706 |
|
| | | | | Ann L. McKinney - Director | | 1,405 |
|
(1) Includes the value of debt we assumed or entered into in certain of these transactions.
Item 14. Principal Accounting Fees and Services
This informationThe Audit Committee has appointed Cherry Bekaert LLP as the independent registered public accounting firm of the Company for the 2017 fiscal year and to conduct quarterly reviews through March 31, 2018. The Company’s Bylaws do not require that stockholders ratify the appointment of Cherry Bekaert LLP as the Company’s independent registered public accounting firm. Cherry Bekaert LLP has served as the Company’s independent public accounting firm for each of the fiscal years ended December 31, 2011 through December 31, 2017. The Audit Committee will consider the outcome of this vote in its decision to appoint an independent registered public accounting firm next year. The Company, however, is incorporatednot bound by referencethe stockholders’ decision. Even if the selection is ratified, the Audit Committee, in its sole discretion, may change the appointment at any time during the year if it determines that such a change would be in the best interest of the Company and its stockholders.
A representative of Cherry Bekaert LLP will attend the Annual Meeting. The representative will have an opportunity to make a statement if he or she desires to do so and will be available to respond to appropriate questions from the Company’s Proxy Statement with respectstockholders.
The following table summarizes fees paid to independent registered public accounting firm for the years ended December 31, 2017 and 2016:
|
| | | | | | | |
| Name | 2017 | | 2016 |
| | (in thousands) |
Audit Fees (1) | $ | 335 |
| | $ | 271 |
|
Audited Related Fees (2) | 15 |
| | 85 |
|
Tax Fees (3) | 134 |
| | 120 |
|
| All Other Fees | — |
| | 6 |
|
| Total | $ | 484 |
| | $ | 482 |
|
(1) Audit fees includes annual audits, quarterly reviews, SOX and property audits.
(2) Audit related fees for services related to the 2017 Annual Meeting of StockholdersREIT's financing offering documents and associated filings.
(3) Tax fees related primarily to be filed withtax advisory services related to REIT status.
Audit Committee Pre-Approval Policies
Before Cherry Bekaert was engaged by the SEC no later than April 30, 2017.Company to render audit or non-audit services, the engagement was approved by the Company's Audit Committee. All services rendered by Cherry Bekaert have been so approved.
Item 15. Exhibits and Financial Statement Schedules
1. Financial Statements. The following financial statements filed as a part of this Annual Report on Form 10-K is as follows:
2. Financial Statement Schedules.
| |
| a. | Schedule II- Valuation and Qualifying Accounts |
| |
| b. | Schedule III- Real Estate and Accumulated Depreciation |
All other financial statements schedules have been omitted because the required information of such schedules is not present, is not present in amounts sufficient to require a schedule or is included in the consolidated financial statements.
3. Exhibits. The list of exhibits filed as a part of this Annual Report on Form 10-K in response to Item 601 of Regulation S-K is submitted on the Exhibit Index attached hereto and incorporated herein by reference.
SIGNATURE
Pursuant to the requirements of the Securities Exchange Act of 1934, the Registrant has duly caused this report to be signed on its behalf by the undersigned thereunto duly authorized.
|
| | |
| | | |
| WHEELER REAL ESTATE INVESTMENT TRUST, INC. |
| | |
| By: | | /s/ WILKES J. GRAHAMMATTHEW REDDY |
| | | Wilkes J. GrahamMatthew Reddy |
| | | Chief Financial Officer |
Date: February 28, 2017March 7, 2018
POWER OF ATTORNEY
Pursuant to the requirements of the Securities Exchange Act of 1934, as amended, this Report has been signed below by the following persons on behalf of the Registrant and in the capacity and on the dates indicated. Each person whose signature appears below hereby constitutes and appoints each of Jon S. Wheeler and Wilkes J. Graham as his or her attorney-in-fact and agent, with full power of substitution and resubstitution for him or her in any and all capacities, to sign any or all amendments to this Report and to file same, with exhibits thereto and other documents in connection therewith, granting unto such attorney-in-fact and agent full power and authority to do and perform each and every act and thing requisite and necessary in connection with such matters and hereby ratifying and confirming all that such attorney-in-fact and agent or his or her substitutes may do or cause to be done by virtue hereof.
|
| | | |
| Signature | Title | Date |
/S/ JON S. WHEELERDAVID KELLY | Chairman of the Board of Directors and Chief Executive Officer and Director (Principal Executive Officer) | February 28, 2017March 7, 2018 |
Jon. S. WheelerDavid Kelly | | |
/S/ WILKES J. GRAHAMMATTHEW REDDY | Chief Financial Officer (Principal Financial and Accounting Officer) | February 28, 2017March 7, 2018 |
Wilkes J. GrahamMatthew Reddy | | | |
| /S/ STEWART J. BROWN | Director | February 28, 2017March 7, 2018 |
| Stewart J. Brown | | | |
/S/ DAVID KELLY | Director | February 28, 2017 |
David Kelly | | | |
| /S/ WILLIAM W. KING | Director | February 28, 2017March 7, 2018 |
| William W. King | | | |
| /S/ KURT R. HARRINGTON | Director | February 28, 2017March 7, 2018 |
| Kurt R. Harrington | | | |
| /S/ JOHN MCAULIFFE | Director | February 28, 2017March 7, 2018 |
| John McAuliffe | | | |
| /S/ CARL B. MCGOWAN, JR. | Director | February 28, 2017March 7, 2018 |
| Carl B. McGowan, Jr. | | | |
| /S/ JOHN SWEET | Director | February 28, 2017March 7, 2018 |
| John Sweet | | | |
| /S/ JEFFREY ZWERDLING | Director | February 28, 2017March 7, 2018 |
| Jeffrey Zwerdling | | | |
Report of Independent Registered Public Accounting Firm
To the Board of Directors and Shareholders of
Wheeler Real Estate Investment Trust, Inc. and Subsidiaries
Virginia Beach, Virginia
Opinions on the Financial Statements and Internal Control over Financial Reporting
We have audited the accompanying consolidated balance sheets of Wheeler Real Estate Investment Trust, Inc. and Subsidiaries (the “Company”) as of December 31, 20162017 and 20152016, and the related consolidated statements of operations, equity, and cash flows for each of the years in the three-year period ended December 31, 2016. In connection with our audits of2017, and the related notes and schedules (collectively referred to as the consolidated financial statements, westatements). We also have also audited the consolidated financial statement schedules as listed in the accompanying index. The Company’s management is responsible for these consolidated financial statements and the consolidated financial statement schedules. Our responsibility is to express an opinion on these consolidated financial statements and consolidated financial statement schedules based on our audits.
We conducted our audits in accordance with the standards of the Public Company Accounting Oversight Board (United States). Those standards require that we plan and perform the audit to obtain reasonable assurance about whether the financial statements are free of material misstatement. The Company is not required to have, nor were we engaged to perform, an audit of its internal control over financial reporting. Our audits included consideration of internal control over financial reporting as a basis for designing audit procedures that are appropriateof December 31, 2017, based on criteria established in Internal Control—Integrated Framework (2013) issued by the circumstances, but not for the purposeCommittee of expressing an opinion on the effectivenessSponsoring Organizations of the Company’s internal control over financial reporting. Accordingly, we express no such opinion. An audit also includes examining, on a test basis, evidence supporting the amounts and disclosures in the consolidated financial statements, assessing the accounting principles used and significant estimates made by management, as well as evaluating the overall financial statement presentation. We believe that our audits provide a reasonable basis for our opinion.Treadway Commission (“COSO”).
In our opinion, the consolidated financial statements referred to above present fairly, in all material respects, the financial position of Wheeler Real Estate Investment Trust, Inc. and Subsidiariesthe Company as of December 31, 20162017 and 20152016, and the results of theirits operations and theirits cash flows for each of the years in the three-year period ended December 31, 2016,2017, in conformity with accounting principles generally accepted in the United States of America. Also, in our opinion, the related consolidated financial statement schedules, when considered in relation to the basic consolidated financial statements taken as a whole, present fairly,Company maintained, in all material respects, effective internal control over financial reporting as of December 31, 2017, based on criteria established in Internal Control—Integrated Framework (2013) issued by COSO.
Basis for Opinion
The Company’s management is responsible for these consolidated financial statements, for maintaining effective internal control over financial reporting, and for its assessment of the information set forth therein.effectiveness of internal control over financial reporting included in the accompanying Management’s Annual Report on Internal Control over Financial Reporting included in Item 9A – Controls and Procedures in the Company’s 2017 Annual Report on Form 10-K. Our responsibility is to express an opinion on the Company’s consolidated financial statements and an opinion on the Company’s internal control over financial reporting based on our audits. We are a public accounting firm registered with the Public Company Accounting Oversight Board (United States) (“PCAOB”) and are required to be independent with respect to the Company in accordance with the U.S. federal securities laws and the applicable rules and regulations of the Securities and Exchange Commission and the PCAOB.
We conducted our audits in accordance with the standards of the PCAOB. Those standards require that we plan and perform the audits to obtain reasonable assurance about whether the consolidated financial statements are free of material misstatement, whether due to error or fraud, and whether effective internal control over financial reporting was maintained in all material respects.
Our audits of the consolidated financial statements included performing procedures to assess the risks of material misstatement of the consolidated financial statements, whether due to error or fraud, and performing procedures that respond to those risks. Such procedures included examining, on a test basis, evidence regarding the amounts and disclosures in the consolidated financial statements. Our audits also included evaluating the accounting principles used and significant estimates made by management, as well as evaluating the overall presentation of the consolidated financial statements. Our audit of internal control over financial reporting included obtaining an understanding of internal control over financial reporting, assessing the risk that a material weakness exists, and testing and evaluating the design and operating effectiveness of internal control based on the assessed risk. Our audits also included performing such other procedures as we considered necessary in the circumstances. We believe that our audits provide a reasonable basis for our opinions.
Definition and Limitations of Internal Control over Financial Reporting
A company’s internal control over financial reporting is a process designed to provide reasonable assurance regarding the reliability of financial reporting and the preparation of consolidated financial statements for external purposes in accordance with generally accepted accounting principles. A company’s internal control over financial reporting includes those policies and procedures that (1) pertain to the maintenance of records that, in reasonable detail, accurately and fairly reflect the transactions and dispositions of the assets of the company; (2) provide reasonable assurance that transactions are recorded as necessary to permit preparation of consolidated financial statements in accordance with generally accepted accounting principles, and that receipts and expenditures of the company are being made only in accordance with authorizations of management and directors of the company; and (3) provide reasonable assurance regarding prevention or timely detection of unauthorized acquisition, use, or disposition of the company’s assets that could have a material effect on the consolidated financial statements.
/s/
Because of its inherent limitations, internal control over financial reporting may not prevent or detect misstatements. Also, projections of any evaluation of effectiveness to future periods are subject to the risk that controls may become inadequate because of changes in conditions, or that the degree of compliance with the policies or procedures may deteriorate.
Cherry Bekaert, LLP
We have served as the Company’s auditor since 2012.
Virginia Beach, Virginia
February 28, 2017March 7, 2018
Wheeler Real Estate Investment Trust, Inc. and Subsidiaries
Consolidated Balance Sheets
(in thousands, except par value and share data)
| | | | December 31, | December 31, |
| | 2016 | | 2015 | 2017 | | 2016 |
| ASSETS: | | | | | | |
| Investment properties, net | $ | 388,880,290 |
| | $ | 238,764,631 |
| $ | 384,334 |
| | $ | 388,880 |
|
| Cash and cash equivalents | 4,863,372 |
| | 10,477,576 |
| 3,677 |
| | 4,863 |
|
| Restricted cash | 9,652,178 |
| | 7,592,984 |
| 8,609 |
| | 9,652 |
|
| Rents and other tenant receivables, net | 3,983,949 |
| | 2,970,380 |
| 5,619 |
| | 3,984 |
|
| Related party receivables | 1,456,131 |
| | 482,320 |
| |
| Notes receivable | 12,000,000 |
| | — |
| |
| Related party receivables, net | | — |
| | 1,456 |
|
| Notes receivable, net | | 6,739 |
| | 12,000 |
|
| Goodwill | 5,485,823 |
| | 5,485,823 |
| 5,486 |
| | 5,486 |
|
| Assets held for sale | 365,880 |
| | 1,692,473 |
| — |
| | 366 |
|
| Above market lease intangible, net | 12,962,169 |
| | 6,517,529 |
| 8,778 |
| | 12,962 |
|
| Deferred costs and other assets, net | 49,396,543 |
| | 35,259,526 |
| 34,432 |
| | 49,397 |
|
| Total Assets | $ | 489,046,335 |
| | $ | 309,243,242 |
| $ | 457,674 |
| | $ | 489,046 |
|
| LIABILITIES: | | | | | | |
| Loans payable, net | $ | 305,972,679 |
| | $ | 184,629,082 |
| $ | 308,122 |
| | $ | 305,973 |
|
| Liabilities associated with assets held for sale | 1,350,000 |
| | 1,992,318 |
| — |
| | 1,350 |
|
| Below market lease intangible, net | 12,680,405 |
| | 7,721,335 |
| 9,616 |
| | 12,680 |
|
| Accounts payable, accrued expenses and other liabilities | 11,320,614 |
| | 7,533,769 |
| 10,624 |
| | 7,735 |
|
| Dividends payable | | 5,480 |
| | 3,586 |
|
| Total Liabilities | 331,323,698 |
| | 201,876,504 |
| 333,842 |
| | 331,324 |
|
| Commitments and contingencies | — |
| | — |
| — |
| | — |
|
| Series D Cumulative Convertible Preferred Stock (no par value, 4,000,000 and 0 shares authorized, 2,237,000 and 0 shares issued and outstanding, respectively; $55.93 million aggregate liquidation preference) | 52,530,051 |
| | — |
| |
| Series D Cumulative Convertible Preferred Stock (no par value, 4,000,000 shares authorized, 2,237,000 shares issued and outstanding; $55.93 million aggregate liquidation preference) | | 53,236 |
| | 52,530 |
|
| | | | | | | |
| EQUITY: | | | | | | |
| Series A Preferred Stock (no par value, 4,500 shares authorized, 562 shares issued and outstanding) | 452,971 |
| | 452,971 |
| 453 |
| | 453 |
|
| Series B Convertible Preferred Stock (no par value, 5,000,000 and 3,000,000 shares authorized, 1,871,244 and 729,119 shares issued and outstanding, respectively; $46.78 million and $18.23 million aggregate liquidation preference, respectively) | 40,732,621 |
| | 17,085,147 |
| |
| Common Stock ($0.01 par value, 150,000,000 and 150,000,000 shares authorized, 68,030,549 and 66,259,673 shares issued and outstanding, respectively) | 680,305 |
| | 662,596 |
| |
| Series B Convertible Preferred Stock (no par value, 5,000,000 authorized, 1,875,848 and 1,871,244 shares issued and outstanding, respectively; $46.90 million and $46.78 million aggregate liquidation preference, respectively) | | 40,915 |
| | 40,733 |
|
| Common Stock ($0.01 par value, 18,750,000 shares authorized, 8,744,189 and 8,503,819 shares issued and outstanding, respectively) | | 87 |
| | 85 |
|
| Additional paid-in capital | 223,344,937 |
| | 220,370,984 |
| 226,978 |
| | 223,939 |
|
| Accumulated deficit | (170,377,414 | ) | | (140,306,846 | ) | (204,925 | ) | | (170,377 | ) |
| Total Shareholders’ Equity | 94,833,420 |
| | 98,264,852 |
| 63,508 |
| | 94,833 |
|
| Noncontrolling interests | 10,359,166 |
| | 9,101,886 |
| 7,088 |
| | 10,359 |
|
| Total Equity | 105,192,586 |
| | 107,366,738 |
| 70,596 |
| | 105,192 |
|
| Total Liabilities and Equity | $ | 489,046,335 |
| | $ | 309,243,242 |
| $ | 457,674 |
| | $ | 489,046 |
|
See accompanying notes to consolidated financial statements.
Wheeler Real Estate Investment Trust, Inc. and Subsidiaries
Consolidated Statements of Operations
(in thousands, except per share data)
| | | | Years Ended December 31, | Years Ended December 31, |
| | 2016 | | 2015 | | 2014 | 2017 | | 2016 | | 2015 |
| REVENUE: | | | | | | | | | | |
| Rental revenues | $ | 33,164,924 |
| | $ | 20,553,870 |
| | $ | 11,348,955 |
| $ | 44,156 |
| | $ | 33,165 |
| | $ | 20,554 |
|
| Asset management fees | 854,857 |
| | 588,990 |
| | 296,290 |
| 927 |
| | 855 |
| | 589 |
|
| Commissions | 963,936 |
| | 361,984 |
| | 158,876 |
| 899 |
| | 964 |
| | 362 |
|
| Tenant reimbursements and other revenues | 9,176,691 |
| | 6,110,614 |
| | 3,046,657 |
| |
| Tenant reimbursements | | 11,032 |
| | 8,649 |
| | 5,885 |
|
| Development and other revenues | | 1,521 |
| | 527 |
| | 225 |
|
| Total Revenue | 44,160,408 |
| | 27,615,458 |
| | 14,850,778 |
| 58,535 |
| | 44,160 |
| | 27,615 |
|
| OPERATING EXPENSES: | | | | | | | | | | |
| Property operations | 11,898,190 |
| | 8,351,456 |
| | 4,123,439 |
| 15,389 |
| | 11,898 |
| | 8,351 |
|
| Non-REIT management and leasing services | 1,567,128 |
| | 1,174,833 |
| | — |
| 927 |
| | 1,567 |
| | 1,175 |
|
| Depreciation and amortization | 20,636,940 |
| | 16,882,462 |
| | 7,387,729 |
| 26,231 |
| | 20,637 |
| | 16,882 |
|
| Provision for credit losses | 424,925 |
| | 243,029 |
| | 60,841 |
| 2,821 |
| | 425 |
| | 243 |
|
| Impairment of notes receivable | | 5,261 |
| | — |
| | — |
|
| Corporate general & administrative | 9,924,361 |
| | 13,415,961 |
| | 9,447,010 |
| 7,364 |
| | 9,924 |
| | 13,416 |
|
| Total Operating Expenses | 44,451,544 |
| | 40,067,741 |
| | 21,019,019 |
| 57,993 |
| | 44,451 |
| | 40,067 |
|
| Operating Loss | (291,136 | ) | | (12,452,283 | ) | | (6,168,241 | ) | |
| Operating Income (Loss) | | 542 |
| | (291 | ) | | (12,452 | ) |
| Gain on disposal of properties | | 1,021 |
| | — |
| | — |
|
| Interest income | 691,937 |
| | 118,747 |
| | 23,315 |
| 1,443 |
| | 692 |
| | 119 |
|
| Interest expense | (13,356,111 | ) | | (9,043,761 | ) | | (5,908,548 | ) | (17,165 | ) | | (13,356 | ) | | (9,044 | ) |
| Net Loss from Continuing Operations Before Income Taxes | (12,955,310 | ) | | (21,377,297 | ) | | (12,053,474 | ) | (14,159 | ) | | (12,955 | ) | | (21,377 | ) |
| Income tax expense | (107,464 | ) | | — |
| | — |
| (137 | ) | | (107 | ) | | — |
|
| Net Loss from Continuing Operations | (13,062,774 | ) | | (21,377,297 | ) | | (12,053,474 | ) | (14,296 | ) | | (13,062 | ) | | (21,377 | ) |
| Discontinued Operations | | | | | | | | | | |
| Income from discontinued operations | 136,459 |
| | 499,781 |
| | 307,659 |
| 16 |
| | 136 |
| | 500 |
|
| Gain on disposal of properties | 688,289 |
| | 2,104,114 |
| | — |
| 1,502 |
| | 688 |
| | 2,104 |
|
| Net Income from Discontinued Operations | 824,748 |
| | 2,603,895 |
| | 307,659 |
| 1,518 |
| | 824 |
| | 2,604 |
|
| Net Loss | (12,238,026 | ) | | (18,773,402 | ) | | (11,745,815 | ) | (12,778 | ) | | (12,238 | ) | | (18,773 | ) |
| Less: Net loss attributable to noncontrolling interests | (1,035,456 | ) | | (1,252,723 | ) | | (1,195,560 | ) | (684 | ) | | (1,035 | ) | | (1,253 | ) |
| Net Loss Attributable to Wheeler REIT | (11,202,570 | ) | | (17,520,679 | ) | | (10,550,255 | ) | (12,094 | ) | | (11,203 | ) | | (17,520 | ) |
| Preferred Stock dividends | (4,713,169 | ) | | (13,627,532 | ) | | (2,718,257 | ) | (9,969 | ) | | (4,713 | ) | | (13,628 | ) |
| Deemed dividend related to beneficial conversion feature of Preferred Stock | — |
| | (72,644,506 | ) | | — |
| — |
| | — |
| | (72,645 | ) |
| Net Loss Attributable to Wheeler REIT Common Shareholders | $ | (15,915,739 | ) | | $ | (103,792,717 | ) | | $ | (13,268,512 | ) | $ | (22,063 | ) | | $ | (15,916 | ) | | $ | (103,793 | ) |
| | | | | | | | | | | |
| Loss per share from continuing operations (basic and diluted) | $ | (0.25 | ) | | $ | (2.73 | ) | | $ | (1.83 | ) | $ | (2.70 | ) | | $ | (1.98 | ) | | $ | (21.78 | ) |
| Income per share from discontinued operations | 0.01 |
| | 0.06 |
| | 0.03 |
| 0.16 |
| | 0.09 |
| | 0.46 |
|
| | $ | (0.24 | ) | | $ | (2.67 | ) | | $ | (1.80 | ) | $ | (2.54 | ) | | $ | (1.89 | ) | | $ | (21.32 | ) |
| Weighted-average number of shares: | | | | | | | | | | |
| Basic and Diluted | 67,362,991 |
| | 38,940,463 |
| | 7,352,433 |
| 8,654,240 |
| | 8,420,374 |
| | 4,867,559 |
|
| | | | | | | | | | | |
| Dividends declared per common share | $ | 0.21 |
| | $ | 0.23 |
| | $ | 0.42 |
| $ | 1.44 |
| | $ | 1.68 |
| | $ | 1.82 |
|
| | | | | | | | | | | |
See accompanying notes to consolidated financial statements.
Wheeler Real Estate Investment Trust, Inc. and Subsidiaries
Consolidated Statements of Equity
(in thousands, except share data)
| | | | Series A Preferred Stock | | Series B Preferred Stock | | Series C Preferred Stock | | Common Stock | | Additional Paid-in | | Accumulated | | Total Shareholders’ | | Noncontrolling Interests | | Total | Series A Preferred Stock | | Series B Preferred Stock | | Series C Preferred Stock | | Common Stock | | Additional Paid-in | | Accumulated | | Total Shareholders’ | | Noncontrolling Interests | | Total |
| | Shares | | Value | | Shares | | Value | | Shares | | Value | | Shares | | Value | | Capital | | Deficit | | Equity | | Units | | Value | | Equity | Shares | | Value | | Shares | | Value | | Shares | | Value | | Shares | | Value | | Capital | | Deficit | | Equity | | Units | | Value | | Equity |
| Balance, December 31, 2013 | 1,809 |
| | $ | 1,458,050 |
| | — |
| | $ | — |
| | — |
| | $ | — |
| | 7,121,000 |
| | $ | 71,210 |
| | $ | 28,169,693 |
| | $ | (11,298,253 | ) | | $ | 18,400,700 |
| | 2,072,352 |
| | $ | 7,206,109 |
| | $ | 25,606,809 |
| |
| Proceeds from issuance of Series B Preferred Stock, net of expenses | — |
| | — |
| | 1,649,000 |
| | 37,242,941 |
| | — |
| | | | — |
| | — |
| | — |
| | — |
| | 37,242,941 |
| | — |
| | — |
| | 37,242,941 |
| |
| Accretion of Series B Preferred Stock discount | — |
| | — |
| | — |
| | 379,584 |
| | — |
| | | | — |
| | — |
| | — |
| | — |
| | 379,584 |
| | — |
| | — |
| | 379,584 |
| |
| Conversion of Series B Preferred Stock to Common Stock | — |
| | — |
| | (100 | ) | | (2,271 | ) | | — |
| | | | 500 |
| | 5 |
| | 2,266 |
| | — |
| | — |
| | — |
| | — |
| | — |
| |
| Conversion of Operating Partnership units to Common Stock | — |
| | — |
| | — |
| | — |
| | — |
| | | | 285,645 |
| | 2,856 |
| | 1,325,287 |
| | — |
| | 1,328,143 |
| | (285,645 | ) | | (1,328,143 | ) | | — |
| |
| Issuance of Common Stock under Share Incentive Plan | — |
| | — |
| | — |
| | — |
| | — |
| | | | 105,834 |
| | 1,058 |
| | 455,930 |
| | — |
| | 456,988 |
| | — |
| | — |
| | 456,988 |
| |
| Noncontrolling interest investments | — |
| | — |
| | — |
| | — |
| | — |
| | | | — |
| | — |
| | — |
| | — |
| | — |
| | 1,780,916 |
| | 7,990,234 |
| | 7,990,234 |
| |
| Adjustment for noncontrolling interest in operating partnership | — |
| | — |
| | — |
| | — |
| | — |
| | | | — |
| | — |
| | 1,123,884 |
| | — |
| | 1,123,884 |
| | — |
| | (1,123,884 | ) | | — |
| |
| Dividends and distributions | — |
| | — |
| | — |
| | — |
| | — |
| | | | — |
| | — |
| | — |
| | (5,811,726 | ) | | (5,811,726 | ) | | — |
| | (995,588 | ) | | (6,807,314 | ) | |
| Net loss | — |
| | — |
| | — |
| | — |
| | — |
| | | | — |
| | — |
| | — |
| | (10,550,255 | ) | | (10,550,255 | ) | | — |
| | (1,195,560 | ) | | (11,745,815 | ) | |
| Balance, December 31, 2014 | 1,809 |
| | 1,458,050 |
| | 1,648,900 |
| | 37,620,254 |
| | — |
| | — |
| | 7,512,979 |
| | 75,129 |
| | 31,077,060 |
| | (27,660,234 | ) | | 42,570,259 |
| | 3,567,623 |
| | 10,553,168 |
| | 53,123,427 |
| 1,809 |
| | $ | 1,458 |
| | 1,648,900 |
| | $ | 37,620 |
| | — |
| | $ | — |
| | 939,122 |
| | $ | 9 |
| | $ | 31,142 |
| | $ | (27,660 | ) | | $ | 42,569 |
| | 445,952 |
| | $ | 10,551 |
| | $ | 53,120 |
|
| Accretion of Series B Preferred Stock discount | — |
| | — |
| | — |
| | 2,341,114 |
| | — |
| | — |
| | — |
| | — |
| | — |
| | — |
| | 2,341,114 |
| | — |
| | — |
| | 2,341,114 |
| — |
| | — |
| | — |
| | 2,341 |
| | — |
| | — |
| | — |
| | — |
| | — |
| | — |
| | 2,341 |
| | — |
| | — |
| | 2,341 |
|
| Conversion of Series B Preferred Stock to Common Stock | — |
| | — |
| | (54,300 | ) | | (1,239,196 | ) | | — |
| | — |
| | 271,500 |
| | 2,715 |
| | 1,236,481 |
| | — |
| | — |
| | — |
| | — |
| | — |
| — |
| | — |
| | (54,300 | ) | | (1,239 | ) | | — |
| | — |
| | 33,938 |
| | — |
| | 1,239 |
| | — |
| | — |
| | — |
| | — |
| | — |
|
| Reclass of Series C Preferred Stock to equity | — |
| | — |
| | — |
| | — |
| | 93,000 |
| | 86,415,894 |
| | — |
| | — |
| | — |
| | — |
| | 86,415,894 |
| | — |
| | — |
| | 86,415,894 |
| — |
| | — |
| | — |
| | — |
| | 93,000 |
| | 86,416 |
| | — |
| | — |
| | — |
| | — |
| | 86,416 |
| | — |
| | — |
| | 86,416 |
|
| Accretion of Series C Preferred Stock | — |
| | — |
| | — |
| | — |
| | — |
| | 6,584,106 |
| | — |
| | — |
| | — |
| | — |
| | 6,584,106 |
| | — |
| | — |
| | 6,584,106 |
| — |
| | — |
| | — |
| | — |
| | — |
| | 6,584 |
| | — |
| | — |
| | — |
| | — |
| | 6,584 |
| | — |
| | — |
| | 6,584 |
|
| Conversion of Series C Preferred Stock to Common Stock | — |
| | — |
| | — |
| | — |
| | (93,000 | ) | | (93,000,000 | ) | | 46,500,000 |
| | 465,000 |
| | 92,535,000 |
| | — |
| | — |
| | — |
| | — |
| | — |
| — |
| | — |
| | — |
| | — |
| | (93,000 | ) | | (93,000 | ) | | 5,812,500 |
| | 58 |
| | 92,942 |
| | — |
| | — |
| | — |
| | — |
| | — |
|
| Conversion of Operating Partnership units to Common Stock | — |
| | — |
| | — |
| | — |
| | — |
| | — |
| | 213,040 |
| | 2,130 |
| | 480,399 |
| | — |
| | 482,529 |
| | (213,040 | ) | | (482,529 | ) | | — |
| — |
| | — |
| | — |
| | — |
| | — |
| | — |
| | 26,630 |
| | — |
| | 482 |
| | — |
| | 482 |
| | (26,630 | ) | | (482 | ) | | — |
|
| Conversion of Preferred Stock to Common Stock through tender offer | | (1,247 | ) | | (1,005 | ) | | (865,481 | ) | | (21,637 | ) | | — |
| | — |
| | 1,430,250 |
| | 14 |
| | 22,628 |
| | — |
| | — |
| | — |
| | — |
| | — |
|
| Issuance of Common Stock under Share Incentive Plan | | — |
| | — |
| | — |
| | — |
| | — |
| | — |
| | 40,019 |
| | 1 |
| | 696 |
| | — |
| | 697 |
| | — |
| | — |
| | 697 |
|
| Noncontrolling interest investments | | — |
| | — |
| | — |
| | — |
| | — |
| | — |
| | — |
| | — |
| | — |
| | — |
| | — |
| | 87,589 |
| | 1,575 |
| | 1,575 |
|
| Discount on UPREIT shares | | — |
| | — |
| | — |
| | — |
| | — |
| | — |
| | — |
| | — |
| | — |
| | — |
| | — |
| | — |
| | (1,181 | ) | | (1,181 | ) |
| Adjustment for noncontrolling interest in operating partnership | | — |
| | — |
| | — |
| | — |
| | — |
| | — |
| | — |
| | — |
| | (824 | ) | | — |
| | (824 | ) | | — |
| | 824 |
| | — |
|
| Dividends and distributions | | — |
| | — |
| | — |
| | — |
| | — |
| | — |
| | — |
| | — |
| | — |
| | (22,481 | ) | | (22,481 | ) | | — |
| | (933 | ) | | (23,414 | ) |
| Deemed distribution | | — |
| | — |
| | — |
| | — |
| | — |
| | — |
| | — |
| | — |
| | 72,645 |
| | (72,645 | ) | | — |
| | — |
| | — |
| | — |
|
| Net loss | | — |
| | — |
| | — |
| | — |
| | — |
| | — |
| | — |
| | — |
| | — |
| | (17,520 | ) | | (17,520 | ) | | — |
| | (1,253 | ) | | (18,773 | ) |
| Balance, December 31, 2015 | | 562 |
| | 453 |
| | 729,119 |
| | 17,085 |
| | — |
| | — |
| | 8,282,459 |
| | 82 |
| | 220,950 |
| | (140,306 | ) | | 98,264 |
| | 506,911 |
| | 9,101 |
| | 107,365 |
|
| Proceeds from issuance of Series B Preferred Stock | | — |
| | — |
| | 1,142,225 |
| | 23,385 |
| | — |
| | — |
| | — |
| | — |
| | — |
| | — |
| | 23,385 |
| | — |
| | — |
| | 23,385 |
|
| Accretion of Series B Preferred Stock discount | | — |
| | — |
| | — |
| | 265 |
| | — |
| | — |
| | — |
| | — |
| | — |
| | — |
| | 265 |
| | — |
| | — |
| | 265 |
|
| Conversion of Series B Preferred Stock to Common Stock | | — |
| | — |
| | (100 | ) | | (2 | ) | | — |
| | — |
| | 63 |
| | — |
| | 2 |
| | — |
| | — |
| | — |
| | — |
| | — |
|
Wheeler Real Estate Investment Trust, Inc. and Subsidiaries
Consolidated Statements of Equity
(continued)(in thousands, except share data, continued)
| | | | Series A Preferred Stock | | Series B Preferred Stock | | Series C Preferred Stock | | Common Stock | | Additional Paid-in | | Accumulated | | Total Shareholders’ | | Noncontrolling Interests | | Total | Series A Preferred Stock | | Series B Preferred Stock | | Series C Preferred Stock | | Common Stock | | Additional Paid-in | | Accumulated | | Total Shareholders’ | | Noncontrolling Interests | | Total |
| | Shares | | Value | | Shares | | Value | | Shares | | Value | | Shares | | Value | | Capital | | Deficit | | Equity | | Units | | Value | | Equity | Shares | | Value | | Shares | | Value | | Shares | | Value | | Shares | | Value | | Capital | | Deficit | | Equity | | Units | | Value | | Equity |
| Conversion of Preferred Stock to Common Stock through tender offer | (1,247 | ) | | (1,005,079 | ) | | (865,481 | ) | | (21,637,025 | ) | |
|
| | — |
| | 11,442,002 |
| | 114,420 |
| | 22,527,659 |
| | — |
| | (25 | ) | | — |
| | — |
| | (25 | ) | |
| Issuance of Common Stock under Share Incentive Plan | — |
| | — |
| | — |
| | — |
| | — |
| | — |
| | 320,152 |
| | 3,202 |
| | 693,798 |
| | — |
| | 697,000 |
| | | | | | 697,000 |
| |
| Noncontrolling interest investments | — |
| | — |
| | — |
| | — |
| | — |
| | — |
| | — |
| | — |
| | — |
| | — |
| | — |
| | 700,709 |
| | 1,574,551 |
| | 1,574,551 |
| |
| Discount on UPREIT shares | — |
| | — |
| | — |
| | — |
| | — |
| | — |
| | — |
| | — |
| | — |
| | — |
| | — |
| | — |
| | (1,181,250 | ) | | (1,181,250 | ) | |
| Adjustment for noncontrolling interest in operating partnership | — |
| | — |
| | — |
| | — |
| | — |
| | — |
| | — |
| | — |
| | (823,919 | ) | | — |
| | (823,919 | ) | | — |
| | 823,919 |
| | — |
| |
| Dividends and distributions | — |
| | — |
| | — |
| | — |
| | — |
| | — |
| | — |
| | — |
| | — |
| | (22,481,427 | ) | | (22,481,427 | ) | | — |
| | (933,250 | ) | | (23,414,677 | ) | |
| Deemed distribution | — |
| | — |
| | — |
| | — |
| | — |
| | — |
| | — |
| | — |
| | 72,644,506 |
| | (72,644,506 | ) | | — |
| | — |
| | — |
| | — |
| |
| Net loss | — |
| | — |
| | — |
| | — |
| | — |
| | — |
| | — |
| | — |
| | — |
| | (17,520,679 | ) | | (17,520,679 | ) | | — |
| | (1,252,723 | ) | | (18,773,402 | ) | |
| Balance, December 31, 2015 | 562 |
| | 452,971 |
| | 729,119 |
| | 17,085,147 |
| | — |
| | — |
| | 66,259,673 |
| | 662,596 |
| | 220,370,984 |
| | (140,306,846 | ) | | 98,264,852 |
| | 4,055,292 |
| | 9,101,886 |
| | 107,366,738 |
| |
| Proceeds from issuance of Series B Preferred Stock | — |
| | — |
| | 1,142,225 |
| | 23,384,902 |
| | — |
| | — |
| | — |
| | — |
| | — |
| | — |
| | 23,384,902 |
| | — |
| | — |
| | 23,384,902 |
| |
| Accretion of Series B Preferred Stock discount | — |
| | — |
| | — |
| | 265,072 |
| | — |
| | — |
| | — |
| | — |
| | — |
| | — |
| | 265,072 |
| | — |
| | — |
| | 265,072 |
| |
| Conversion of Series B Preferred Stock to Common Stock | — |
| | — |
| | (100 | ) | | (2,500 | ) | | — |
| | — |
| | 500 |
| | 5 |
| | 2,495 |
| | — |
| | — |
| | — |
| | — |
| | — |
| |
| Conversion of senior convertible notes to Common Stock | — |
| | — |
| | — |
| | — |
| | — |
| | — |
| | 1,397,010 |
| | 13,970 |
| | 1,590,180 |
| | — |
| | 1,604,150 |
| | — |
| | — |
| | 1,604,150 |
| — |
| | $ | — |
| | — |
| | $ | — |
| | — |
| | $ | — |
| | 174,626 |
| | $ | 2 |
| | $ | 1,602 |
| | $ | — |
| | $ | 1,604 |
| | — |
| | $ | — |
| | $ | 1,604 |
|
| Issuance of Common Stock under Share Incentive Plan | — |
| | — |
| | — |
| | — |
| | — |
| | — |
| | 373,366 |
| | 3,734 |
| | 574,516 |
| | — |
| | 578,250 |
| | | | | | 578,250 |
| — |
| | — |
| | — |
| | — |
| | — |
| | — |
| | 46,671 |
| | 1 |
| | 578 |
| | — |
| | 579 |
| | — |
| | — |
| | 579 |
|
| Noncontrolling interest investments | — |
| | — |
| | — |
| | — |
| | — |
| | — |
| | — |
| | — |
| | — |
| | — |
| | — |
| | 2,040,342 |
| | 4,272,765 |
| | 4,272,765 |
| — |
| | — |
| | — |
| | — |
| | — |
| | — |
| | — |
| | — |
| | — |
| | — |
| | — |
| | 255,043 |
| | 4,273 |
| | 4,273 |
|
| Adjustment for noncontrolling interest in operating partnership | — |
| | — |
| | — |
| | — |
| | — |
| | — |
| | — |
| | — |
| | 806,762 |
| | — |
| | 806,762 |
| | — |
| | (806,762 | ) | | — |
| — |
| | — |
| | — |
| | — |
| | — |
| | — |
| | — |
| | — |
| | 807 |
| | — |
| | 807 |
| | — |
| | (807 | ) | | — |
|
| Dividends and distributions | — |
| | — |
| | — |
| | — |
| | — |
| | — |
| | — |
| | — |
| | — |
| | (18,867,998 | ) | | (18,867,998 | ) | | — |
| | (1,173,267 | ) | | (20,041,265 | ) | — |
| | — |
| | — |
| | — |
| | — |
| | — |
| | — |
| | — |
| | — |
| | (18,868 | ) | | (18,868 | ) | | — |
| | (1,173 | ) | | (20,041 | ) |
| Net loss | — |
| | — |
| | — |
| | — |
| | — |
| | — |
| | — |
| | — |
| | — |
| | (11,202,570 | ) | | (11,202,570 | ) | | — |
| | (1,035,456 | ) | | (12,238,026 | ) | — |
| | — |
| | — |
| | — |
| | — |
| | — |
| | — |
| | — |
| | — |
| | (11,203 | ) | | (11,203 | ) | | — |
| | (1,035 | ) | | (12,238 | ) |
| Balance, December 31, 2016 | 562 |
| | $ | 452,971 |
| | 1,871,244 |
| | $ | 40,732,621 |
| | — |
| | $ | — |
| | 68,030,549 |
| | $ | 680,305 |
| | $ | 223,344,937 |
| | $ | (170,377,414 | ) | | $ | 94,833,420 |
| | 6,095,634 |
| | $ | 10,359,166 |
| | $ | 105,192,586 |
| 562 |
| | 453 |
| | 1,871,244 |
| | 40,733 |
| | — |
| | $ | — |
| | 8,503,819 |
| | 85 |
| | 223,939 |
| | (170,377 | ) | | $ | 94,833 |
| | 761,954 |
| | 10,359 |
| | 105,192 |
|
| Proceeds from issuance of Series B Preferred Stock, net of expenses | | — |
| | — |
| | 4,604 |
| | 96 |
| | — |
| | — |
| | — |
| | — |
| | — |
| | — |
| | 96 |
| | — |
| | — |
| | 96 |
|
| Accretion of Series B Preferred Stock discount | | — |
| | — |
| | — |
| | 86 |
| | — |
| | — |
| | — |
| | — |
| | — |
| | — |
| | 86 |
| | — |
| | — |
| | 86 |
|
| Conversion of senior convertible notes to Common Stock | | — |
| | — |
| | — |
| | — |
| | — |
| | — |
| | 2,509 |
| | — |
| | 31 |
| | — |
| | 31 |
| | — |
| | — |
| | 31 |
|
| Conversion of operating partnership units to Common Stock | | — |
| | — |
| | — |
| | — |
| | — |
| | — |
| | 126,870 |
| | 1 |
| | 1,370 |
| | — |
| | 1,371 |
| | (126,870 | ) | | (1,371 | ) | | — |
|
| Issuance of Common Stock under Share Incentive Plan | | — |
| | — |
| | — |
| | — |
| | — |
| | — |
| | 110,991 |
| | 1 |
| | 1,415 |
| | — |
| | 1,416 |
| | — |
| | — |
| | 1,416 |
|
| Redemption of fractional units as a result of reverse stock split | | — |
| | — |
| | — |
| | — |
| | — |
| | — |
| | — |
| | — |
| | — |
| | — |
| | — |
| | (66 | ) | | (1 | ) | | (1 | ) |
| Adjustment for noncontrolling interest in operating partnership | | — |
| | — |
| | — |
| | — |
| | — |
| | — |
| | — |
| | — |
| | 223 |
| | — |
| | 223 |
| | — |
| | (223 | ) | | — |
|
| Dividends and distributions | | — |
| | — |
| | — |
| | — |
| | — |
| | — |
| | — |
| | — |
| | — |
| | (22,454 | ) | | (22,454 | ) | | — |
| | (992 | ) | | (23,446 | ) |
| Net loss | | — |
| | — |
| | — |
| | — |
| | — |
| | — |
| | — |
| | — |
| | — |
| | (12,094 | ) | | (12,094 | ) | | — |
| | (684 | ) | | (12,778 | ) |
| Balance, December 31, 2017 | | 562 |
| | $ | 453 |
| | 1,875,848 |
| | $ | 40,915 |
| | — |
| | $ | — |
| | 8,744,189 |
| | $ | 87 |
| | $ | 226,978 |
| | $ | (204,925 | ) | | $ | 63,508 |
| | 635,018 |
| | $ | 7,088 |
| | $ | 70,596 |
|
See accompanying notes to consolidated financial statements.
Wheeler Real Estate Investment Trust, Inc. and Subsidiaries
Consolidated Statements of Cash Flows
(in thousands)
| | | | For the Years Ended December 31, | For the Years Ended December 31, |
| | 2016 | | 2015 | | 2014 | 2017 | | 2016 | | 2015 |
| CASH FLOWS FROM OPERATING ACTIVITIES: | | | | | | | | | | |
| Net loss | $ | (12,238,026 | ) | | $ | (18,773,402 | ) | | $ | (11,745,815 | ) | $ | (12,778 | ) | | $ | (12,238 | ) | | $ | (18,773 | ) |
Adjustments to reconcile consolidated net loss to net cash used in operating activities | | | | | | |
| Adjustments to reconcile consolidated net loss to net cash from (used in) operating activities | | | | | | |
| Depreciation | 7,883,393 |
| | 5,370,116 |
| | 2,696,064 |
| 10,590 |
| | 7,883 |
| | 5,370 |
|
| Amortization | 12,753,547 |
| | 11,512,346 |
| | 4,691,665 |
| 15,641 |
| | 12,754 |
| | 11,512 |
|
| Loan cost amortization | 2,125,582 |
| | 1,190,574 |
| | 611,927 |
| 3,087 |
| | 2,126 |
| | 1,191 |
|
| Above (below) market lease amortization, net | 29,371 |
| | 620,324 |
| | 91,752 |
| 453 |
| | 29 |
| | 620 |
|
| Share-based compensation | 1,454,410 |
| | 697,000 |
| | 456,988 |
| 870 |
| | 1,454 |
| | 547 |
|
| Gain on disposal of properties | (688,289 | ) | | (2,104,114 | ) | | — |
| (1,021 | ) | | — |
| | — |
|
| Gain on disposal of properties-discontinued operations | | (1,502 | ) | | (688 | ) | | (2,104 | ) |
| Provision for credit losses | 424,925 |
| | 243,029 |
| | 60,841 |
| 2,821 |
| | 425 |
| | 243 |
|
| Impairment of notes receivable | | 5,261 |
| | — |
| | — |
|
| Changes in assets and liabilities, net of acquisitions | | | | | | | | | | |
| Rent and other tenant receivables, net | (1,065,240 | ) | | (1,449,996 | ) | | 369,380 |
| (990 | ) | | (1,065 | ) | | (1,450 | ) |
| Unbilled rent | (383,817 | ) | | (258,037 | ) | | (234,066 | ) | (1,101 | ) | | (384 | ) | | (258 | ) |
| Related party receivables | (973,811 | ) | | (9,547 | ) | | (681,699 | ) | (909 | ) | | (974 | ) | | (10 | ) |
| Cash restricted for operating property reserves | (657,904 | ) | | (1,293,825 | ) | | (674,021 | ) | 920 |
| | (658 | ) | | (1,294 | ) |
| Deferred costs and other assets, net | (695,486 | ) | | (1,828,519 | ) | | 1,446,276 |
| (53 | ) | | (695 | ) | | (1,829 | ) |
| Accounts payable, accrued expenses and other liabilities | 2,475,526 |
| | 78,967 |
| | (384,109 | ) | 3,440 |
| | 2,474 |
| | 230 |
|
| Net operating cash flows provided by discontinued operations | (1,250 | ) | | 678,971 |
| | 818,870 |
| |
| Net operating cash flows provided by (used in) discontinued operations | | 32 |
| | (1 | ) | | 679 |
|
| Net cash from (used in) operating activities | 10,442,931 |
| | (5,326,113 | ) | | (2,475,947 | ) | 24,761 |
| | 10,442 |
| | (5,326 | ) |
| CASH FLOWS FROM INVESTING ACTIVITIES: | | | | | | | | | | |
| Investment property acquisitions | (49,158,867 | ) | | (62,027,081 | ) | | (17,640,587 | ) | — |
| | (49,159 | ) | | (62,027 | ) |
| Capital expenditures | (1,958,159 | ) | | (531,258 | ) | | (521,405 | ) | (7,367 | ) | | (1,958 | ) | | (531 | ) |
| Issuance of notes receivable | (9,404,159 | ) | | — |
| | — |
| — |
| | (9,404 | ) | | — |
|
| Increase in capital property reserves | (1,401,290 | ) | | (1,926,753 | ) | | (1,433,055 | ) | |
| (Increase) decrease in capital property reserves | | 101 |
| | (1,401 | ) | | (1,927 | ) |
| Cash received from disposal of properties | 1,385,177 |
| | 8,711,699 |
| | — |
| 2,416 |
| | — |
| | — |
|
| Cash received from disposal of properties-discontinued operations | | 1,871 |
| | 1,385 |
| | 8,712 |
|
| Net investing cash flows from discontinued operations | — |
| | 914,388 |
| | — |
| — |
| | — |
| | 914 |
|
| Net cash used in investing activities | (60,537,298 | ) | | (54,859,005 | ) | | (19,595,047 | ) | (2,979 | ) | | (60,537 | ) | | (54,859 | ) |
| CASH FLOWS FROM FINANCING ACTIVITIES: | | | | | | | | | | |
| Payments for deferred financing costs | (5,173,977 | ) | | (2,768,152 | ) | | (1,261,258 | ) | (1,065 | ) | | (5,174 | ) | | (2,768 | ) |
| Dividends and distributions paid | (17,692,166 | ) | | (14,192,289 | ) | | (5,432,518 | ) | (20,742 | ) | | (17,692 | ) | | (14,192 | ) |
| Proceeds from sales of Preferred Stock, net of expenses | 75,763,427 |
| | 83,415,894 |
| | 37,242,941 |
| 78 |
| | 75,763 |
| | 83,416 |
|
| Conversion of Preferred Stock | — |
| | (25 | ) | | — |
| |
| Loan proceeds | 21,600,000 |
| | 11,493,750 |
| | 8,384,436 |
| 18,886 |
| | 21,600 |
| | 11,494 |
|
| Loan principal payments | (30,005,758 | ) | | (17,033,559 | ) | | (8,036,354 | ) | (18,438 | ) | | (30,006 | ) | | (17,034 | ) |
| Net financing cash flows (used in) from discontinued operations | (11,363 | ) | | (92,766 | ) | | (53,230 | ) | |
| Net cash from financing activities | 44,480,163 |
| | 60,822,853 |
| | 30,844,017 |
| |
| Net financing cash flows used in discontinued operations | | (1,687 | ) | | (11 | ) | | (93 | ) |
| Net cash (used in) from financing activities | | (22,968 | ) | | 44,480 |
| | 60,823 |
|
| INCREASE (DECREASE) IN CASH AND CASH EQUIVALENTS | (5,614,204 | ) | | 637,735 |
| | 8,773,023 |
| (1,186 | ) | | (5,615 | ) | | 638 |
|
| CASH AND CASH EQUIVALENTS, beginning of year | 10,477,576 |
| | 9,839,841 |
| | 1,066,818 |
| 4,863 |
| | 10,478 |
| | 9,840 |
|
| CASH AND CASH EQUIVALENTS, end of year | $ | 4,863,372 |
| | $ | 10,477,576 |
| | $ | 9,839,841 |
| $ | 3,677 |
| | $ | 4,863 |
| | $ | 10,478 |
|
| Supplemental Disclosures: | | | | | | | | | | |
| Other Cash Transactions: | | | | | | | | | | |
| Cash paid for taxes | | $ | 230 |
| | $ | — |
| | $ | — |
|
| Cash paid for interest | $ | 11,014,514 |
| | $ | 8,310,322 |
| | $ | 5,711,110 |
| $ | 13,936 |
| | $ | 11,015 |
| | $ | 8,310 |
|
| Non-cash Transactions: | | | | | | | | | | |
| Debt incurred for acquisitions | $ | 134,397,750 |
| | $ | 77,002,464 |
| | $ | 46,678,328 |
| $ | — |
| | $ | 134,398 |
| | $ | 77,002 |
|
| Noncontrolling interests resulting from the issuance of common units | $ | 4,272,765 |
| | $ | 1,574,551 |
| | $ | 7,990,234 |
| $ | — |
| | $ | 4,273 |
| | $ | 1,575 |
|
| Conversion of common units to Common Stock | | $ | 1,371 |
| | $ | — |
| | $ | 482 |
|
| Conversion of senior convertible debt into Series C Preferred Stock | $ | — |
| | $ | 3,000,000 |
| | $ | — |
| $ | — |
| | $ | — |
| | $ | 3,000 |
|
| Conversion of senior convertible debt into Common Stock | $ | 1,600,000 |
| | $ | — |
| | $ | — |
| $ | 31 |
| | $ | 1,600 |
| | $ | — |
|
| Accretion of Preferred Stock discounts | $ | 416,598 |
| | $ | 8,925,220 |
| | $ | 379,584 |
| $ | 809 |
| | $ | 417 |
| | $ | 8,925 |
|
| Deemed dividend for beneficial conversion feature | $ | — |
| | $ | 72,644,506 |
| | $ | — |
| $ | — |
| | $ | — |
| | $ | 72,645 |
|
| Note receivable in consideration of land | $ | 1,000,000 |
| | $ | — |
| | $ | — |
| $ | — |
| | $ | 1,000 |
| | $ | — |
|
See accompanying notes to consolidated financial statements.
Wheeler Real Estate Investment Trust, Inc. and Subsidiaries
Notes to Consolidated Financial Statements
1. Organization and Basis of Presentation and Consolidation
Wheeler Real Estate Investment Trust, Inc. (the “Trust” or “REIT”) is a Maryland corporation formed on June 23, 2011. The Trust serves as the general partner of Wheeler REIT, L.P. (the “Operating Partnership”) which was formed as a Virginia limited partnership on April 5, 2012. As of December 31, 2016,2017, the Trust, through the Operating Partnership, owned and operated sixty-four centers, one office, eightseven undeveloped properties and one redevelopment project. SixteenFifteen of these properties are located in Virginia, three are located in Florida, seven are located in North Carolina, twenty-five are located in South Carolina, twelve are located in Georgia, two are located in Kentucky, two are located in Tennessee, one is located in New Jersey, one is located in Alabama, one is located in West Virginia, three are located in Oklahoma and one is located in Pennsylvania. The Company’s portfolio had total net rentable space of approximately 4,907,0004,902,000 square feet and an occupancy level of approximately 93.99%91.93% at December 31, 2016.2017. Accordingly, the use of the word “Company” refers to the Trust and its consolidated subsidiaries, except where the context otherwise requires. The Company includes the Trust, the Operating Partnership, the entities included in the REIT formation and the entities acquired since November 2012 (See Note 3 “Investment Properties”). The Company prepared the accompanying consolidated financial statements in accordance with accounting principles generally accepted in the United States of America, or GAAP. All material balances and transactions between the consolidated entities of the Company have been eliminated.
The Company was formed with the principal objective of acquiring, financing, developing, leasing, owning and managing income producing, strip centers, neighborhood, grocery-anchored, community and free-standing retail properties. Its strategy is to acquire high quality, well-located, dominant retail properties that generate attractive risk-adjusted returns. The Company targets competitively protected properties in communities that have stable demographics and have historically exhibited favorable trends, such as strong population and income growth. The Company considers competitively protected properties to be located in the most prominent shopping districts in their respective markets, ideally situated at major “Main and Main” intersections. The Company generally leases its properties to national and regional supermarket chains and selects retailers that offer necessity and value oriented items and generate regular consumer traffic. The Company’s tenants carry goods that are less impacted by fluctuations in the broader U.S. economy and consumers’ disposable income, which it believes generates more predictable property-level cash flows.
On October 24, 2014, the Trust, through the Operating Partnership, acquired (i) Wheeler Interests, LLC (“WI”), an acquisition and asset management firm, (ii) Wheeler Real Estate, LLC (“WRE”), a real estate leasing, management and administration firm and (iii) WHLR Management, LLC (“WM” and collectively with WI and WRE the “Operating Companies”), a real estate business operations firm, from Jon S. Wheeler, the Company's then Chairman and CEO, resulting in the Company becoming an internally-managed REIT. Accordingly, the responsibility for identifying targeted real estate investments, the handling of the disposition of real estate investments our Board of Directors chooses to sell, administering our day-to-day business operations, including but not limited to, leasing, property management, payroll and accounting functions, acquisitions, asset management and administration are now handled internally.
Prior to being acquired by the Company, the Operating Companies served as the external manager for the Company and its properties (the “REIT Properties”) and performed property management and leasing functions for certain related and non-related third parties (the “Non-REIT Properties”). The Company will continue to perform these services for the Non-REIT Properties through the Operating Companies, primarily through WRE. Accordingly, the Company converted WRE to a Taxable REIT Subsidiary (“TRS”) to accommodate serving the Non-REIT Properties since applicable REIT regulations consider the income derived from these services to be “bad” income subject to taxation. The regulations allow for costs incurred by the Company commensurate with the services performed for the Non-REIT Properties to be allocated to a TRS.
During January 2014, the Company acquired Wheeler Development, LLC (“WD”) and converted it to a TRS. The Company began performing development activities for both REIT Properties and Non-REIT Properties during 2015.
Wheeler Real Estate Investment Trust, Inc. and Subsidiaries
Notes to Consolidated Financial Statements (Continued)
2. Summary of Significant Accounting Policies
Investment Properties
The Company records investment properties and related intangibles at fair value upon acquisition. Investment properties include both acquired and constructed assets. Improvements and major repairs and maintenance are capitalized when the repair and maintenance substantially extends the useful life, increases capacity or improves the efficiency of the asset. All other repair and maintenance costs are expensed as incurred. The Company capitalizes interest on projects during periods of construction until the projects reach the completion point that corresponds with their intended purpose.
The Company allocates the purchase price of acquisitions to the various components of the asset based upon the fair value of each component which may be derived from various observable or unobservable inputs and assumptions. Also, the Company may utilize third party valuation specialists. These components typically include buildings, land and any intangible assets related to out-of-market leases, tenant relationships and in-place leases the Company determines to exist. The Company determines fair value based on estimated cash flow projections that utilize appropriate discount and capitalization rates and available market information. Estimates of future cash flows are based on a number of factors including the historical operating results, known trends and specific market and economic conditions that may affect the property. Factors considered by management in the analysis of determining the as-if-vacant property value include an estimate of carrying costs during the expected lease-up periods considering market conditions, and costs to execute similar leases. In estimating carrying costs, management includes real estate taxes, insurance and estimates of lost rentals at market rates during the expected lease-up periods, tenant demand and other economic conditions. Management also estimates costs to execute similar leases including leasing commissions, tenant improvements, legal and other related expenses. Intangibles related to out-of-market leases, tenant relationships and in-place lease value are recorded at fair value as acquired lease intangibles and are amortized as an adjustment to rental revenue or amortization expense, as appropriate, over the remaining terms of the underlying leases. Premiums or discounts on acquired out-of-market debt are amortized to interest expense over the remaining term of such debt.
The Company records depreciation on buildings and improvements utilizing the straight-line method over the estimated useful life of the asset, generally 5 to 40 years. The Company reviews depreciable lives of investment properties periodically and makes adjustments to reflect a shorter economic life, when necessary. Tenant allowances, tenant inducements and tenant improvements are amortized utilizing the straight-line method over the term of the related lease or occupancy term of the tenant, if shorter.
Amounts allocated to buildings are depreciated over the estimated remaining life of the acquired building or related improvements. The Company amortizes amounts allocated to tenant improvements, in-place lease assets and other lease-related intangibles over the remaining life of the underlying leases. The Company also estimates the value of other acquired intangible assets, if any, and amortizes them over the remaining life of the underlying related intangibles.
The Company reviews investment properties for impairment on a property-by-property basis whenever events or changes in circumstances indicate that the carrying value of investment properties may not be recoverable, but at least annually. These circumstances include, but are not limited to, declines in the property’s cash flows, occupancy and fair market value. The Company measures any impairment of investment property when the estimated undiscounted operating income before depreciation and amortization, plus its residual value, is less than the carrying value of the property. Estimated undiscounted operating income before depreciation and amortization includes various level 3 fair value assumptions including renewal and renegotiations of current leases, estimates of operating costs and fluctuating market conditions. The renewal and renegotiations of leases in some cases must be approved by additional third parties outside the control of the Company and the tenant. If such renewed or renegotiated leases are approved at amounts below correct estimates, then impairment adjustments may be necessary in the future. To the extent impairment has occurred, the Company charges to income the excess of the carrying value of the property over its estimated fair value. The Company estimates fair value using unobservable data such as operating income, estimated capitalization rates, or multiples, leasing prospects and local market information. The Company may decide to sell properties that are held for use and the sale prices of these properties may differ from their carrying values. The Company did not record any impairment adjustments to its properties during the years ended December 31, 2017, 2016 2015 and 2014.2015.
Wheeler Real Estate Investment Trust, Inc. and Subsidiaries
Notes to Consolidated Financial Statements (Continued)
2. Summary of Significant Accounting Policies (continued)
Conditional Asset Retirement Obligation
A conditional asset retirement obligation represents a legal obligation to perform an asset retirement activity in which the timing and/or method of settlement depends on a future event that may or may not be with the Company’s control. Currently, the Company does not have any conditional asset retirement obligations. However, any such obligations identified in the future would result in the Company recording a liability if the fair value of the obligation can be reasonably estimated. Environmental studies conducted at the time the Company acquired its properties did not reveal any material environmental liabilities, and the Company is unaware of any subsequent environmental matters that would have created a material liability.
Wheeler Real Estate Investment Trust, Inc. and Subsidiaries
Notes to Consolidated Financial Statements (Continued)
2. Summary of Significant Accounting Policies (continued)
The Company believes that its properties are currently in material compliance with applicable environmental, as well as non-environmental, statutory and regulatory requirements. The Company did not record any conditional asset retirement obligation liabilities during the years ended December 31, 2017, 2016 2015 and 2014.2015.
Cash and Cash Equivalents and Restricted Cash
The Company considers all highly liquid investments purchased with an original maturity of 90 days or less to be cash and cash equivalents. Cash equivalents are carried at cost, which approximates fair value. Cash equivalents consist primarily of bank operating accounts and money markets. Financial instruments that potentially subject the Company to concentrations of credit risk include its cash and cash equivalents and its trade accounts receivable. The Company places its cash and cash equivalents with institutions of high credit quality.
Restricted cash represents amounts held by lenders for real estate taxes, insurance, reserves for capital improvements
and tenant security deposits. The Company presents changes in cash restricted for real estate taxes, insurance and tenant
security deposits as operating activities in the consolidated statement of cash flows. The Company presents changes
in cash restricted for capital improvements as investing activities in the consolidated statement of cash flows.
The Company places its cash and cash equivalents and restricted cash on deposit with financial institutions in the United States, which are insured by the Federal Deposit Insurance Company ("FDIC") up to $250 thousand. The Company's credit loss in the event of failure of these financial institutions is represented by the difference between the FDIC limit and the total amounts on deposit. Management monitors the financial institutions credit worthiness in conjunction with balances on deposit to minimize risk.
Tenant Receivables and Unbilled Rent
Tenant receivables include base rents, tenant reimbursements and receivables attributable to recording rents on a straight-line basis. The Company determines an allowance for the uncollectible portion of accrued rents and accounts receivable based upon customer credit-worthiness (including expected recovery of a claim with respect to any tenants in bankruptcy), historical bad debt levels, and current economic trends. The Company considers a receivable past due once it becomes delinquent per the terms of the lease. The Company’s standard lease form considers a rent charge past due after five days. A past due receivable triggers certain events such as notices, fees and other allowable and required actions per the lease. As of December 31, 20162017 and 2015,2016, the Company’s allowance for uncollectible accountstenant receivables totaled $691$705 thousand and $411$691 thousand, respectively. During the years ended December 31, 2017, 2016 2015 and 2014,2015, the Company recorded provisions for credit lossesbad debt expenses in the amount of $457 thousand, $425 thousand $243 thousand and $61$243 thousand, respectively, related to tenant receivables that were specifically identified as potentially uncollectible based on the an assessment of the tenant’s credit-worthiness. During the years ended December 31, 2017, 2016 2015 and 2014,2015, the Company did not realize any recoveries related to tenant receivables previously chargedwritten off.
Notes Receivable
Notes receivable represent financing to Sea Turtle Development as discussed in Note 4 for development of the project. The notes are secured by the underlying real estate known as Sea Turtle Development. The Company evaluates the collectability of both the interest on and principal of the notes receivable based primarily upon the projected fair market value of the project at stabilization. The notes receivable are determined to be impaired when, based upon current information, it is no longer probable that the Company will be able to collect all contractual amounts due from the borrower. The amount of impairment loss recognized is measured as the difference between the carrying amount of the loan and its estimated realizable value.
Wheeler Real Estate Investment Trust, Inc. and Subsidiaries
Notes to Consolidated Financial Statements (Continued)
2. Summary of Significant Accounting Policies (continued)
Goodwill
Goodwill is deemed to have an indefinite economic life and is not subject to amortization. Goodwill is tested annually for impairment and is tested for impairment more frequently if events and circumstances indicate that the asset might be impaired. To test for impairment, the Company first assesses qualitative factors, such as current macroeconomic conditions and our overall financial and operating performance, to determine the likelihood that the fair value of a reporting unit is less than its carrying amount. If the Company determines it is more likely than not that the fair value of a reporting unit is less than its carrying amount, the Company proceeds with the two-step approach to evaluating impairment. First, the Company estimates the fair value of the reporting unit and compares it to the reporting unit’s carrying value. If the carrying value exceeds fair value, the Company proceeds with the second step, which requires us to assign the fair value of the reporting unit to all of the assets and liabilities of the reporting unit as if it had been acquired in a business combination at the date of the impairment test. The excess fair value of the reporting unit over the amounts assigned to the assets and liabilities is the implied value of goodwill and is used to determine the amount of impairment. The Company would recognize an impairment loss to the extent the carrying value of goodwill exceeds the implied value. See Note 5 for assessment of Goodwill impairment for the year ended December 31, 2017.
Above and Below Market Lease Intangibles, net
The Company determines the above and below market lease intangibles upon acquiring a property. Above and below
market lease intangibles are amortized over the life of the respective leases. Amortization of above and below market lease
intangibles is recorded as a component of rental revenues.
Deferred Costs and Other Assets, net
The Company’s deferred costs and other assets consist primarily of leasing commissions, leases in place, capitalized legal and marketing costs and tenant relationship intangibles associated with acquisitions. The Company’s lease origination costs consist primarily of the portion of property acquisitions allocated to lease originations and commissions paid in connection with lease originations.
Wheeler Real Estate Investment Trust, Inc. and Subsidiaries
Notes to Consolidated Financial Statements (Continued)
2. Summary of Significant Accounting Policies (continued)
The Company generally records amortization of lease origination costs on a straight-line basis over the terms of the related leases. Details of these deferred costs, net of amortization and other assets are as follows:follows (in thousands):
| | | | December 31, | December 31, |
| | 2016 | | 2015 | 2017 | | 2016 |
| Leases in place, net | | $ | 25,118 |
| | $ | 35,654 |
|
| Tenant relationships, net | | 6,804 |
| | 10,944 |
|
| Lease origination costs, net | $ | 1,095,849 |
| | $ | 1,376,652 |
| 1,077 |
| | 1,096 |
|
| Leases in place, net | 35,654,536 |
| | 19,091,917 |
| |
| Other | | 810 |
| | 518 |
|
| Deposits on acquisitions | 1,086,250 |
| | 2,012,996 |
| 547 |
| | 1,086 |
|
| Legal and marketing costs, net | 99,071 |
| | 129,325 |
| 76 |
| | 99 |
|
| Tenant relationships, net | 10,944,148 |
| | 12,060,172 |
| |
| Other | 516,689 |
| | 588,464 |
| |
| Total Deferred Costs and Other Assets, net | $ | 49,396,543 |
| | $ | 35,259,526 |
| $ | 34,432 |
| | $ | 49,397 |
|
Amortization of lease origination costs, leases in place, legal and marketing costs and tenant relationships represent a component of depreciation and amortization expense. As of December 31, 20162017 and December 31, 2015,2016, the Company’s intangible accumulated amortization totaled $28.55$41.83 million and $16.60$28.55 million, respectively. During the years ended December 31, 2017, 2016 2015 and 2014,2015, the Company’s intangible amortization expense totaled $15.64 million, $12.75 million, and $11.51 million, and $4.69respectively. Amortization expense for the year ended December 31, 2017 includes $1.74 million respectively.of accelerated amortization on intangibles related to the BI-LO early lease termination at the Shoppes at Myrtle Park. Future amortization of lease origination costs, leases in place, legal and marketing costs and tenant relationships is as follows:follows (in thousands):
Wheeler Real Estate Investment Trust, Inc. and Subsidiaries
Notes to Consolidated Financial Statements (Continued)
2. Summary of Significant Accounting Policies (continued)
| | | For the Years Ended December 31, | Lease Origination Costs, net | | Leases In Place, net | | Legal & Marketing Costs, net | | Tenant Relationships, net | | Total | Leases In Place, net | | Tenant Relationships, net | | Lease Origination Costs, net | | Legal & Marketing Costs, net | | Total |
| 2017 | $ | 304,839 |
| | $ | 9,621,844 |
| | $ | 22,773 |
| | $ | 3,896,311 |
| | $ | 13,845,767 |
| |
| 2018 | 215,947 |
| | 7,239,794 |
| | 17,061 |
| | 2,650,590 |
| | 10,123,392 |
| $ | 7,122 |
| | $ | 2,613 |
| | $ | 253 |
| | $ | 17 |
| | $ | 10,005 |
|
| 2019 | 148,957 |
| | 5,272,065 |
| | 13,521 |
| | 1,674,310 |
| | 7,108,853 |
| 5,176 |
| | 1,646 |
| | 187 |
| | 14 |
| | 7,023 |
|
| 2020 | 106,257 |
| | 3,786,120 |
| | 11,263 |
| | 961,777 |
| | 4,865,417 |
| 3,698 |
| | 940 |
| | 143 |
| | 11 |
| | 4,792 |
|
| 2021 | 90,489 |
| | 2,467,379 |
| | 8,702 |
| | 545,527 |
| | 3,112,097 |
| 2,380 |
| | 523 |
| | 126 |
| | 9 |
| | 3,038 |
|
| 2022 | | 1,931 |
| | 406 |
| | 85 |
| | 6 |
| | 2,428 |
|
| Thereafter | 229,360 |
| | 7,267,334 |
| | 25,751 |
| | 1,215,633 |
| | 8,738,078 |
| 4,811 |
| | 676 |
| | 283 |
| | 19 |
| | 5,789 |
|
| | $ | 1,095,849 |
| | $ | 35,654,536 |
| | $ | 99,071 |
| | $ | 10,944,148 |
| | $ | 47,793,604 |
| $ | 25,118 |
| | $ | 6,804 |
| | $ | 1,077 |
| | $ | 76 |
| | $ | 33,075 |
|
Revenue Recognition
The Company retains substantially all of the risks and benefits of ownership of the investment properties and accounts for its leases as operating leases. The Company accrues minimum rents on a straight-line basis over the terms of the respective leases which results in an unbilled rent asset or deferred rent liability being recorded on the balance sheet. At December 31, 20162017 and 2015,2016, there were $1.2$2.34 million and $880 thousand$1.24 million in an unbilled rent asset which is included in rents and other tenant receivables, net. Additionally, certain of the lease agreements contain provisions that grant additional rents based on tenants’ sales volumes (contingent or percentage rent). Percentage rents are recognized when the tenants achieve the specified targets as defined in their lease agreements. During the years ended December 31, 2017, 2016 2015 and 2014,2015, the Company recognized percentage rents of $199 thousand, $289 thousand $163 thousand and $90$163 thousand, respectively.
The Company’s leases generally require the tenant to reimburse the Company for a substantial portion of its expenses incurred in operating, maintaining, repairing, insuring and managing the shopping center and common areas (collectively defined as Common Area Maintenance or “CAM” expenses). The Company includes these reimbursements along with other revenue derived from late fees and seasonal events, under the Consolidated Statements of Operations caption "Tenant reimbursements and other revenues.reimbursements." This significantly reduces the Company’s exposure to increases in costs and operating expenses resulting from inflation or other outside factors. The Company accrues reimbursements from tenants for recoverable portions of all these expenses as revenue in the period the applicable expenditures are incurred. The Company calculates the tenant’s share of operating costs by multiplying the total amount of the operating costs by a fraction, the numerator of which is the total number of square feet being leased by the tenant, and the denominator of which is the average total square footage of all leasable buildings at the property. The Company also receives escrow payments for these reimbursements from substantially
Wheeler Real Estate Investment Trust, Inc. and Subsidiaries
Notes to Consolidated Financial Statements (Continued)
2. Summary of Significant Accounting Policies (continued)
all its tenants throughout the year. The Company recognizes differences between estimated recoveries and the final billed amounts in the subsequent year. These differences were not material for the years ended December 31, 2017, 2016 2015 and 2014.2015.
The Company recognizes lease termination fees in the periodyear that the lease is terminated and collection of the fees is reasonably assured. Upon early lease termination, the Company provides for losses related to unrecovered intangibles and other assets. During the years ended December 31, 2017, 2016 and 2015, the Company recognized lease termination fees of $560 thousand, $26 thousand and $0 thousand, respectively. The 2017 amount is primarily a result of the BI-LO at Shoppes at Myrtle Park lease termination. The Company includes termination fees under the Consolidated Statement of Operations caption "Development and other revenues."
Income Taxes
The Company has elected to be taxed as a REIT under Sections 856 through 860 of the Internal Revenue Code and applicable Treasury regulations relating to REIT qualification. In order to maintain this REIT status, the regulations require the Company to distribute at least 90% of its taxable income to shareholders and meet certain other asset and income tests, as well as other requirements. The TRS' have accrued $15 thousand and $107 thousand at December 31, 2017 and 2016, respectively, for 2016 federal and state income tax expenses. If the Company fails to qualify as a REIT, it will be subject to tax at regular corporate rates for the years in which it fails to qualify. If the Company loses its REIT status it could not elect to be taxed as a REIT for five years unless the Company’s failure to qualify was due to reasonable cause and certain other conditions were satisfied.
Management has evaluated the effect of the guidance provided by GAAP on Accounting for Uncertainty of Income Taxes and has determined that the Company had no uncertain income tax positions.
Wheeler Real Estate Investment Trust, Inc. and Subsidiaries
Notes to Consolidated Financial Statements (Continued)
2. Summary of Significant Accounting Policies (continued)
Taxable REIT Subsidiary Cost Allocation
The Company’s overall philosophy regarding cost allocation centers around the premise that the Trust exists to acquire, lease and manage properties for the benefit of its investors. Accordingly, a majority of the Company’s operations occur at the property level. Each property must carry its own weight by absorbing the costs associated with generating its revenues. Additionally, leases generally allow the Company to pass through to the tenant most of the costs involved in operating the property, including, but not limited to, the direct costs associated with owning and maintaining the property (landscaping, repairs and maintenance, taxes, insurance, etc.), property management and certain administrative costs.
Service vendors bill the majority of the direct costs of operating the properties directly to the REIT Properties and Non-REIT Properties and each property pays them accordingly. The Non-REIT Properties pay WRE property management and/or asset management fees of 3% and 2% of collected revenues, respectively. The Non-REIT Properties also pay WRE leasing commissions based on the total contractual revenues to be generated under the new/renewed lease agreement (6% for new leases and 3% for renewals). Non-REIT properties pay development fees of 5% of hard costs.
Compensation and benefits paid to employees of the Company represent the largest component of costsCosts incurred to acquire, manage, lease and administer the properties. The Company believes that every employee position existsNon-REIT Properties are allocated to either directly or indirectly to perform these functions. Therefore, the Company allocatesTRS. These costs include compensation and benefits, to the various functions of the Company based on an estimate of how each employee spends their time. The Company allocates actual costs attributed to property management, costs to the TRS on a pro rata basis based on total property revenues generated by the Non-REIT Properties. The Company allocates actual leasing costs to the TRS on a pro rata basis based on total leasing commissions generated by the Non-REIT Properties. Currently, the TRS does not acquire properties for third parties so the Company does not allocate acquisition related costs to the TRS. Additionally, the Company allocates certainand other corporate, general and administrative expenses associated with generating the TRS' revenues.
Financial Instruments
The carrying amount of financial instruments included in assets and liabilities approximates fair market value due to their immediate or short-term maturity.
Wheeler Real Estate Investment Trust, Inc. and Subsidiaries
Notes to Consolidated Financial Statements (Continued)
2. Summary of Significant Accounting Policies (continued)
Use of Estimates
The Company has made estimates and assumptions that affect the reported amounts of assets and liabilities, disclosure of contingent assets and liabilities at the date of the financial statements, and revenues and expenses during the reported period. The Company’s actual results could differ from these estimates.
Advertising Costs
The Company expenses advertising and promotion costs as incurred. The Company incurred advertising and promotion costs of $237 thousand, $228 thousand $218 thousand and $177$218 thousand for the years ended December 31, 2017, 2016 2015 and 2014,2015, respectively.
Assets Held For Sale and Discontinued Operations
The Company records assets as held for sale when management has committed to a plan to sell the assets, actively seeks a buyer for the assets, and the consummation of the sale is considered probable and is expected within one year.
Assets held for sale are presented as discontinued operations in all periods presented if the disposition represents a strategic shift that has, or will have, a major effect on the Company's financial position or results of operations. This includes the net gain (or loss) upon disposal of property held for sale, the property's operating results, depreciation and interest expense.
Wheeler Real Estate Investment Trust, Inc. and Subsidiaries
Notes to Consolidated Financial Statements (Continued)
2. Summary of Significant Accounting Policies (continued)
Corporate General and Administrative Expense
A detail for the "Corporate general & administrative" line item from the consolidated statements of operations is presented below:below (in thousands):
| | | | | December 31, | | December 31, |
| | | 2016 | | 2015 | | 2014 | | 2017 | | 2016 | | 2015 |
| Acquisition and development costs | | $ | 2,017,930 |
| | $ | 3,871,037 |
| | $ | 3,787,907 |
| |
| Compensation and benefits | | | $ | 2,433 |
| | $ | 3,727 |
| | $ | 3,376 |
|
| Professional fees | | 1,683,234 |
| | 1,596,870 |
| | 2,247,052 |
| | 1,606 |
| | 1,683 |
| | 1,597 |
|
| Compensation and benefits | | 3,726,996 |
| | 3,376,402 |
| | 1,326,434 |
| |
| Acquisition costs | | | 1,101 |
| | 2,018 |
| | 3,871 |
|
| Corporate administration | | 1,110,810 |
| | 1,186,948 |
| | 1,218,033 |
| | 962 |
| | 1,111 |
| | 1,187 |
|
| Capital related costs | | 513,562 |
| | 2,655,474 |
| | — |
| | 663 |
| | 514 |
| | 2,655 |
|
| Travel | | 481,211 |
| | 445,732 |
| | 540,991 |
| | 272 |
| | 481 |
| | 446 |
|
| Advertising | | 228,016 |
| | 218,180 |
| | 176,950 |
| | 237 |
| | 228 |
| | 218 |
|
| Taxes and licenses | | 162,602 |
| | 65,318 |
| | 149,643 |
| |
| Taxes and Licenses | | | 90 |
| | 162 |
| | 66 |
|
| Total | | $ | 9,924,361 |
| | $ | 13,415,961 |
| | $ | 9,447,010 |
| | $ | 7,364 |
| | $ | 9,924 |
| | $ | 13,416 |
|
Noncontrolling Interests
Noncontrolling interests is the portion of equity in the Operating Partnership not attributable to the Trust. The ownership interests not held by the parent are considered noncontrolling interests. Accordingly, noncontrolling interests have been reported in equity on the consolidated balance sheets but separate from the Company’s equity. On the consolidated statements of operations, the subsidiaries are reported at the consolidated amount, including both the amount attributable to the Company and noncontrolling interests. Consolidated statements of changes in equity include beginning balances, activity for the period and ending balances for shareholders’ equity, noncontrolling interests and total equity.
The noncontrolling interest of the Operating Partnership common unit holders is calculated by multiplying the noncontrolling interest ownership percentage at the balance sheet date by the Operating Partnership’s net assets (total assets less total liabilities). The noncontrolling interest percentage is calculated at any point in time by dividing the number of units not owned by the Company by the total number of units outstanding. The noncontrolling interest ownership percentage will change as additional units are issued or as units are exchanged for the Company’s $0.01 par value per share common stock ("Common Stock.Stock"). In accordance with GAAP, any changes in the value from period to period are charged to additional paid-in capital.
Wheeler Real Estate Investment Trust, Inc. and Subsidiaries
Notes to Consolidated Financial Statements (Continued)
2. Summary of Significant Accounting Policies (continued)
Recent Accounting Pronouncements
In May 2014, the FASB issued ASU 2014-09, “Revenue from Contracts with Customers,” which supersedes the revenue recognition requirements of Accounting Standards Codification (“ASC”) Topic 605, “Revenue Recognition” and most industry-specific guidance on revenue recognition throughout the ASC. The new standard is principles based and provides a five step model to determine when and how revenue is recognized. The core principle of the new standard is that revenue should be recognized when a company transfers promised goods or services to customers in an amount that reflects the consideration to which the company expects to be entitled in exchange for those goods or services. The new standard also requires disclosure of qualitative and quantitative information surrounding the amount, nature, timing and uncertainty of revenues and cash flows arising from contracts with customers. In March 2016, the FASB issued ASU No. 2016-08, "Revenue from Contracts with Customers (Topic 606): Principal versus Agent Considerations (Reporting Revenue Gross versus Net), which clarifies the implementation guidance on principal versus agent considerations. In April 2016, the FASB issued ASU 2016-10, "Revenue from contracts with customers (Topic 606): Identifying Performance Obligations and Licensing," which provides further guidance on identifying performance obligations and intellectual property licensing implementation. In June 2016, the FASB issued ASU 2016-12, “Revenue from Contracts with Customers (Topic 606): Narrow-Scope Improvements and Practical Expedients”, which relates to assessing collectability, presentation of sales taxes, noncash consideration and completed contracts and contract modifications in transition. In December 2016, the FASB issued 2016-20, "Technical Corrections and Improvements to Topic 606, Revenue from Contracts with Customers," which clarifies or corrects unintended application of the standard. Companies are permitted to adopt the ASUs as early as fiscal years beginning after December 15, 2016, but the adoption is required for fiscal years beginning after December 15, 2017. In September 2017, the FASB issued ASU 2017-13, "Revenue Recognition (Topic 605)," "Revenue from Contracts with Customers (Topic 606)," "Leases (Topic 840)," and "Leases (Topic 842)." These amendments provide additional clarification and implementation guidance on the previously issued ASU 2014-09, "Revenue from Contracts with Customers (Topic 606)." These new standards will be effective for the Company in the first quarter of the year ending December 31, 2018 and can be applied either retrospectively to all periods presented or as a cumulative-effect adjustment as of the date of adoption.
The Company is currently evaluating the impact of this standard. The majority of the Company’s revenue is based on real estate lease contracts which are not within the scope of this ASU. The Company has identified its non-lease revenue streams and initial analysis indicates the adoption of this standard will not have a material impact on our financial position or results of operations.
In August 2014, The Company will increase disclosures around revenue recognition in the FASB issued ASU 2014-15, "Presentation of Financial Statements - Going Concern (Subtopic 205-40)." This ASU defines management's responsibilitynotes to evaluate whether there is substantial doubt about an organization's abilityconsolidated financial statements to continuecomply with the standard upon adoption. The Company will adopt the standard January 1, 2018 as a going concern and provides guidance on required financial statement footnote disclosures. This ASU is effective for annual periods ending after December 15, 2016. The Company adopted this ASU as of December 31, 2016. We added additional disclosures in Note 7 as a result of the adoption of this ASU.
In April 2015, the FASB issued ASU 2015-03, "Interest - Imputation of Interest (Subtopic 835-30): Simplifying the Presentation of Debt Issuance Costs." This new guidance requires the presentation of unamortized debt issuance costs to be shown in the liabilities section of the consolidated balance sheets as a reduction of the principal amount of the associated debt, rather than as an asset. ASU 2015-03 is effective for fiscal years beginning after December 15, 2015 and early adoption is permitted, including adoption in an interim period. The new standard must be applied using a retrospective approach by restating prior period comparative consolidated balance sheets. The Company adopted the ASU effective January 1, 2016 and applied it on a retrospective basis for all debt issuance costs, including those pertaining to the Company’s revolving credit facility. As a result, unamortized debt issuance costs of $4.71 million as of December 31, 2015, have been reclassified from other assets and presented as a deduction of indebtedness in the consolidated balance sheet.
In September 2015, the FASB issued ASU 2015-16, "Business Combinations (Topic 805): Simplifying the Accounting for Measurement-Period Adjustments." This new guidance requires that the acquirer recognizes adjustments to preliminary acquisition values and account for the cumulative effect of any required adjustments in the period in which they are determined. ASU 2015-16 is effective for fiscal years beginning after December 15, 2015 and early adoption is permitted, including adoption in an interim period. The new standard must be applied using a prospective approach for adjustments that occur after the effective date. The Company adopted the ASU effective January 1, 2016.cumulative-effect adjustment.
In February 2016, the FASB issued ASU 2016-02, "Leases (Topic 842)." ASU 2016-02 is intended to improve financial reporting about leasing transactions. The ASU affects all companies and other organizations that lease assets such as real estate, airplanes, and manufacturing equipment. The ASU will require organizations that lease assets referred to as “Lessees” to recognize on the balance sheet the assets and liabilities for the rights and obligations created by those leases. An organization is to provide disclosures designed to enable users of financial statements to understand the amount, timing, and
Wheeler Real Estate Investment Trust, Inc. and Subsidiaries
Notes to Consolidated Financial Statements (Continued)
2. Summary of Significant Accounting Policies (continued)
uncertainty of cash flows arising from leases. These disclosures include qualitative and quantitative requirements concerning additional information about the amounts recorded in the financial statements. Under the new guidance, a lessee will be required to recognize assets and liabilities for leases with lease terms of more than 12 months. Consistent with current GAAP, the recognition, measurement, and presentation of expenses and cash flows arising from a lease by a lessee primarily will depend on its classification as a finance or operating lease. However, unlike current GAAP which requires only capital leases to be recognized on the balance sheet the new ASU will require both types of leases (i.e. operating and capital) to be recognized on the balance sheet. The FASB lessee accounting model will continue to account for both types of leases. The capital lease will be accounted for in substantially the same manner as capital leases are accounted for under existing GAAP. The operating lease will be accounted for in a manner similar to operating leases under existing GAAP, except that lessees will recognize a lease liability and a lease asset for all of those leases.
In September 2017, the FASB issued ASU 2017-13, "Revenue Recognition (Topic 605)," "Revenue from Contracts with Customers (Topic 606)," "Leases (Topic 840)," and "Leases (Topic 842)," which provides additional implementation guidance on the previously issued ASU 2016-02. "Leases (Topic 842)."
The leasing standard will be effective for calendar year-end public companies beginning after December 15, 2018. Public companies will be required to adopt the new leasing standard for fiscal years, and interim periods within those fiscal years, beginning after December 15, 2018. Early adoption will be permitted for all companies and organizations upon issuance
Wheeler Real Estate Investment Trust, Inc. and Subsidiaries
Notes to Consolidated Financial Statements (Continued)
2. Summary of Significant Accounting Policies (continued)
of the standard. For calendar year-end public companies, this means an adoption date of January 1, 2019 and retrospective application to previously issued annual and interim financial statements for 2018 and 2017. Lessees with a large portfolio of leases are likely to see a significant increase in balance sheet assets and liabilities. While we are currently assessing the impact of the standard on our financial position and results of operations we expect the primary impact to be on those ground leases which we are the lessor. The new standard will result in the recording of right of use assets and lease obligations. See Note 10 for the Company’s current lease commitments. The Company is currently evaluating the impact of ASU 2016-02 on its financial statements.
In March 2016, the FASB issued ASU 2016-09, “Compensation - Stock Compensation (Topic 718): Improvements to Employee Share-Based Payment Accounting.” This ASU simplifies several aspects of the accounting for share-based payment transactions, including the income tax consequences, classification of awards as either equity or liabilities and classification on the statement of cash flows. This ASU is effective for annual periods beginning after December 15, 2016 and early adoption is permitted. The new standard can be applied using either a prospective transition method or a retrospective transition method. The Company will adoptadopted this ASU inas of January 1, 2017 and doesapplied prospectively. The adoption did not expecthave a material impact on the adoption of this ASU to materially impact its financial position or results of operations.
In August 2016, the FASB issued ASU 2016-15, “Statement of Cash Flows (Topic 230): Classification of certain cash receipts and cash payments (a consensus of the Emerging Issues Task Force).” The ASU addresses eight specific cash flow issues in an effort to reduce diversity in practice. This ASU is effective for annual and interim reporting periods beginning after December 15, 2017 and early adoption is permitted. The new standard is to be applied retrospectively for all period presented. The Company will adoptadopted this ASU in 2018as of January 1, 2017 and doesapplied prospectively. The adoption did not expecthave a material impact on the adoption to materially impact its consolidated statements of cash flows.
In November 2016, the FASB issued ASU 2016-18, “Statement of Cash Flows (Topic 230): Restricted Cash (a consensus of the FASB Emerging Issues Task Force).” The ASU provides guidance on the presentation of restricted cash or restricted cash equivalents in the statement of cash flows in an effort to reduce diversity in practice. The standard requires a reconciliation of total cash, cash equivalents and restricted cash in the cash flow statement or in the notes to the financial statements. This ASU is effective for annual and interim reporting periods beginning after December 15, 2017 and early adoption is permitted. The new standard is to be applied retrospectively for all period presented. The Company will adopt this ASU in 2018 and does not expect the adoption to materially impact its consolidated statements of cash flows.
In January 2017, the FASB issued ASU 2017-01, “Business Combinations (Topic 805): Clarifying the Definition of a Business.” The ASU clarifies the definition of a business with the objective of adding guidance to assist entities with evaluating whether transactions should be accounted for as acquisitions (or disposals) of assets or businesses. This ASU is effective for annual and interim reporting periods beginning after December 15, 2017 and early adoption is permitted. The new standard is to be applied prospectively. The adoption of this standard will most likely result in less real estate acquisitions qualifying as
businesses and, accordingly, acquisition costs for those acquisitions that are not businesses will be capitalized rather than expensed. The Company is currently evaluating the impact of ASU-2017-01 on its financial statements.will adopt this ASU in 2018.
In February 2015, the FASB issued ASU 2015-02 related to ASC Topic 810, “Consolidation (Topic 810): Amendments to the Consolidation Analysis.” This new guidance changes the identification of variable interests, the variable interest entity (“VIE”) characteristics for a limited partnership or similar entity, and primary beneficiary determination. The guidance also eliminates the presumption that a general partner controls a limited partnership. The ASU is effective for annual periods beginning after December 15, 2015. The Company has adopted this ASU with no material impact on the Company’s consolidated financial statements expected. In October 2016, the FASB issued ASU 2016-17, “Consolidation (Topic 810) Interests Held through Related Parties That are under Common Control,” which amends the consolidation guidance on how a reporting entity that is the single decision maker of a VIE should treat indirect interests in the entity held through related parties
Wheeler Real Estate Investment Trust, Inc. and Subsidiaries
Notes to Consolidated Financial Statements (Continued)
2. Summary of Significant Accounting Policies (continued)
that are under common control with the reporting entity when determining whether it is the primary beneficiary of that VIE. The primary beneficiary of a VIE is the reporting entity that has a controlling financial interest in a VIE and, therefore, consolidates the VIE. A reporting entity has an indirect interest in a VIE if it has a direct interest in a related party that, in turn, has a direct interest in the VIE. The ASU is effective for annual periods beginning after December 15, 2016. The Company will adoptadopted this ASU in 2017 and doesas of January 1, 2017. The adoption did not expecthave a material impact on the adoption of this ASU to materially impact its financial position or results of operations.
Wheeler Real Estate Investment Trust, Inc. and Subsidiaries
Notes to Consolidated Financial Statements (Continued)
2. Summary of Significant Accounting Policies (continued)
In January 2017, the FASB issued ASU 2017-04, “Intangibles - Goodwill and Other (Topic 350): Simplifying the test for Goodwill Impairment.” The amendments in ASU 2017-04 eliminate the current two-step approach used to test goodwill for impairment and require an entity to apply a one-step quantitative test and record the amount of goodwill impairment as the excess of a reporting unit's carrying amount over its fair value, not to exceed the total amount of goodwill allocated to the reporting unit. This ASU is effective for annual and interim reporting periods beginning after December 15, 2019 and early adoption is permitted on testing dates after January 1, 2017. The new standard is to be applied prospectively. The Company will adopt this ASU in 2020 and does not expect the adoption to materially impact its financial position or results of operations.
In February 2017, the FASB issued ASU 2017-05, “Other Income-Gains and Losses from the Derecognition of Nonfinancial Assets (Subtopic 610-20): Clarifying the Scope of Asset Derecognition Guidance and Accounting for Partial Sales of Nonfinancial Assets.” This amendment provides guidance for partial sales of nonfinancial assets. This ASU is effective for annual periods beginning after December 15, 2017. Early adoption is permitted. The standard is to be applied retrospectively or modified retrospectively. The Company will adopt this ASU in 2018. The Company is evaluating the impact that ASU 2017-05 will have on its financial position and results of operations.
In May 2017, the FASB issued ASU 2017-09, “Compensation - Stock Compensation (Topic 718): Scope of Modification Accounting.” This updates clarifies when modification accounting guidance in Topic 718 should be applied to a change in terms or conditions of a share-based payment award. This ASU is effective for annual and interim periods beginning after December 15, 2017 with early adoption permitted. The new standard is to be applied prospectively to an award modified on or after the adoption date. The Company will adopt this ASU in 2018 and does not expect the update to have a material impact on its financial position or results of operations.
Other accounting standards that have been issued or proposed by the FASB or other standard-setting bodies are not currently applicable to the Company or are not expected to have a significant impact on the Company’s financial position, results of operations and cash flows.
Reclassifications
Certain reclassifications have been made to prior periodAll per share amounts, to make their presentation comparable with the current period. These reclassifications had no impact on net income. During the first quarter of 2016, the Company identified thatcommon units, shares outstanding and stock based compensation amounts for all periods presented reflect our one-for-eight reverse stock split (the “Reverse Stock Split”), which was effective March 31, 2017. U.S. dollar amounts are presented in previous filings the change in cash restricted for property reserves and payments for deferred financing costs had been reportedthousands (“000’s”) except per share amounts or as cash flows from operating activities and should have been presented as investing and financing activities, respectively. In the third quarter of 2016, the Company reclassed payments to related parties from financing to operating activities. The Company corrected the previously presented cash flows for these items in the current presentation and in doing so, the consolidated statements of cash flows for the year ended December 31, 2015 has been adjusted to increase net cash flows from operating activities by $3.98 million with corresponding decreases in net cash flows from investing and financing activities of $1.93 million and $2.75 million, respectively. For the year ended December 31, 2014, the consolidated statements of cash flows has been adjusted to increase net cash flows from operating activities by $1.97 million with corresponding decreases in net cash flows from investing and financing activities of $1.43 million and $0.57 million, respectively. The Company has evaluated the effect of the incorrect presentation in prior periods, both qualitatively and quantitatively, and concluded that it did not have a material impact on, nor require amendment of, any previously filed annual or quarterly consolidated financial statements.otherwise noted.
Wheeler Real Estate Investment Trust, Inc. and Subsidiaries
Notes to Consolidated Financial Statements (Continued)
3. Investment Properties
Investment properties consist of the following:following (in thousands):
| | | | December 31, | December 31, |
| | 2016 | | 2015 | 2017 | | 2016 |
| Land and land improvements | $ | 90,530,841 |
| | $ | 50,777,143 |
| $ | 91,108 |
| | $ | 90,531 |
|
| Land held for development | 11,419,859 |
| | 12,353,963 |
| 11,228 |
| | 11,420 |
|
| Buildings and improvements | 307,411,330 |
| | 188,338,469 |
| 313,043 |
| | 307,411 |
|
| Investment properties at cost | 409,362,030 |
| | 251,469,575 |
| 415,379 |
| | 409,362 |
|
| Less accumulated depreciation and amortization | (20,481,740 | ) | | (12,704,944 | ) | |
| Less accumulated depreciation | | (31,045 | ) | | (20,482 | ) |
| Investment properties, net | $ | 388,880,290 |
| | $ | 238,764,631 |
| $ | 384,334 |
| | $ | 388,880 |
|
The Company’s depreciation expense on investment properties was $10.59 million, $7.88 million $5.37 million and $2.70$5.37 million for the years ended December 31, 2017, 2016 2015 and 2014,2015, respectively.
A significant portion of the Company’s land, buildings and improvements serve as collateral for its mortgage loans payable portfolio. Accordingly, restrictions exist as to each property’sthe encumbered property's transferability, use and other common rights typically associated with property ownership.
Property Acquisitions
2014 Acquisitions
Cypress Shopping Center
On July 1, 2014, the Company completed its acquisition of Cypress Shopping Center, an 80,435 square foot grocery-anchored shopping center located in Boiling Springs, South Carolina (“Cypress”) for a contract price of $8.30 million, paid through a combination of cash and debt. Cypress was 92% leased as of the acquisition date and its major tenants include Bi-Lo and Dollar General.
Harrodsburg Marketplace
On July 1, 2014, the Company completed its acquisition of Harrodsburg Marketplace, a 60,048 square foot grocery-anchored shopping center located in Harrodsburg, Kentucky ("Harrodsburg") for a contract price of $5.00 million, paid through a combination of cash and debt. Harrodsburg was 97% leased as of the acquisition date and its major tenants include Kroger and Arby's.
Port Crossing Shopping Center
On July 3, 2014, the Company completed the acquisition of Port Crossing Shopping Center, a 65,365 square foot grocery-anchored shopping center located in Harrisonburg, Virginia ("Port Crossing") for a contract price of $9.31 million. Port Crossing was 92% leased as of the acquisition date and is anchored by a Food Lion grocery store. The Company acquired the property from a related party through a combination of cash, the issuance of 157,429 common units in the Operating Partnership and the assumption of outstanding debt.
LaGrange Marketplace
On July 25, 2014, the Company completed the acquisition of LaGrange Marketplace, a 76,594 square foot grocery-anchored shopping center located in LaGrange, Georgia ("LaGrange") for a contract price of $3.70 million. LaGrange was 93% leased as of the acquisition date and is anchored by a Food Depot grocery store. The Company acquired the property from a related party through a combination of cash, the issuance of 105,843 common units in the Operating Partnership and the assumption of outstanding debt.
Wheeler Real Estate Investment Trust, Inc. and Subsidiaries
Notes to Consolidated Financial Statements (Continued)
3. Investment Properties (continued)
DF I-Courtland
On August 15, 2014, the Company completed its acquisition of DF I-Courtland, LLC ("DF I-Courtland") from a related party, consisting of a 1.01 acre parcel of undeveloped real estate located in Courtland, Virginia, for a contract price of $0.89 million. The Company believes that this parcel can accommodate a 8,400 square foot facility. There are currently no development plans for DF I-Courtland, but management believes that it could support a retail facility that would be complementary to the Company's existing portfolio.
DF I-Moyock
On August 15, 2014, the Company completed its acquisition of DF I-Moyock, LLC ("DF I-Moyock") from a related party, consisting of a 1.28 acre parcel of undeveloped real estate located in Moyock, North Carolina, for a contract price of $0.91 million. The Company believes that this parcel can accommodate a 9,000 square foot facility. There are currently no development plans for DF I-Moyock, but management believes that it could support a retail facility that would be complementary to the Company's existing portfolio.
Edenton Commons
On August 15, 2014, the Company completed its acquisition of Edenton Commons ("Edenton Commons") from a related party, consisting of a 53.82 acre parcel of undeveloped real estate located in Edenton, North Carolina, for a contract price of $2.40 million. The Company believes that this parcel can accommodate a 225,000 square foot facility. There are currently no development plans for Edenton Commons, but management believes that it could support a retail facility that would be complementary to the Company's existing portfolio.
Freeway Junction
On September 4, 2014, the Company completed the acquisition of Freeway Junction, a 156,834 square foot shopping center located in Stockbridge, Georgia ("Freeway Junction") for a contract price of $10.45 million, paid through a combination of cash and debt. Freeway Junction was 98% leased as of the acquisition date and is anchored by Northern Tool, Ollie's Bargain Outlet, Goodwill and Farmer's Furniture.
Graystone Crossing
On September 26, 2014, the Company completed the acquisition of Graystone Crossing, a 21,997 square foot shopping center located in Tega Cay, South Carolina ("Graystone Crossing") for a contract price of $5.40 million, paid through a combination of cash and debt. Graystone Crossing was 100% leased as of the acquisition date and is anchored by T-Mobile, Tropical Smoothie Cafe, and Edible Arrangements.
Bryan Station
On October 2, 2014, the Company completed its acquisition of Bryan Station, an 54,397 square foot retail center located in Lexington, Kentucky (“Bryan Station”) for a contract price of $6.10 million, paid through a combination of cash and debt. Bryan Station was 100% leased as of the acquisition date and its major tenants include Planet Fitness and Shoe Carnival.
Contribution of Operating Companies' Membership Interests
On October 24, 2014, the Operating Partnership entered into a Membership Interest Contribution Agreement ("Contribution Agreement") with Jon S. Wheeler, ("Mr. Wheeler"), the Company's Chairman and CEO, for the contribution of Mr. Wheeler's membership interests in WI, WRE and WM. These entities were wholly owned by Mr. Wheeler at the time of the Contribution Agreement. The purpose of the Contribution Agreement was to internalize the management of the Trust. Pursuant to the terms of the Contribution Agreement, Mr. Wheeler received 1,516,853 common units of the Operating Partnership worth $6.75 million at the time of issuance.
Wheeler Real Estate Investment Trust, Inc. and Subsidiaries
Notes to Consolidated Financial Statements (Continued)
3. Investment Properties (continued)
Crockett Square
On November 5, 2014, the Company completed its acquisition of Crockett Square, a 107,122 square foot retail center located in Morristown, Tennessee ("Crockett Square") for a contract price of $9.75 million, paid through a combination of cash and debt. Crockett Square was 100% leased as of the acquisition date and its major tenants include Hobby Lobby, Dollar Tree, Pier 1 Imports and Ross Dress for Less.
Harbor Point
On November 21, 2014, the Company completed its acquisition of Harbor Point Associates, LLC ("Harbor Point") from a related party, consisting of a 7.2 acre parcel of undeveloped real estate located in Grove, Oklahoma, for a contract price of $2.40 million. The Company believes that this parcel can accommodate a 45,700 square foot facility. There are currently no development plans for Harbor Point, but management believes that it could support a retail facility that would be complementary to the Company's existing portfolio.
DF I-Berkley
On December 1, 2014, the Company completed its acquisition of DF I-Berkley, LLC ("DF I-Berkley") from a related party, a parcel of approximate 1.0 acre of undeveloped real estate located in Norfolk, Virginia, for a contract price of $250 thousand. The Company believes that this parcel can accommodate a 6,500 square foot facility. There are currently no development plans for DF I-Berkley, but management believes that it could support a retail facility that would be complementary to the Company's existing portfolio.
The following summarizes the consideration paid and the fair values of assets acquired and liabilities assumed in conjunction with the acquisitions described above, along with a description of the methods used to determine fair value. In determining fair values, the Company considered many factors including, but not limited to, cash flows, market cap rates, location, occupancy rates, appraisals, other acquisitions and management’s knowledge of the current acquisition market for similar properties.
|
| | | |
| | 2014 Total Acquisitions |
| Fair value of assets acquired and liabilities assumed: | |
| Investment property (a) | $ | 53,081,904 |
|
| Tenant and other receivables and other assets (b) | 306,814 |
|
| Lease intangibles and other assets (b) | 10,188,493 |
|
| Goodwill (b) | 5,485,823 |
|
| Accounts payable, accrued expenses and other liabilities (c) | (623,167 | ) |
| Above market leases (d) | 3,973,846 |
|
| Below market leases (d) | (1,991,645 | ) |
| Fair value of net assets acquired | $ | 70,422,068 |
|
| Purchase consideration: | |
| Consideration paid with cash and debt | $ | 63,616,509 |
|
| Consideration paid with common units | 6,805,559 |
|
| Total consideration (e) | $ | 70,422,068 |
|
a. Represents the fair value of the net investment properties acquired which includes land, buildings, site improvements and tenant improvements. The fair value was determined using following approaches:
i. the market approach valuation methodology for land by considering similar transactions in the markets;
Wheeler Real Estate Investment Trust, Inc. and Subsidiaries
Notes to Consolidated Financial Statements (Continued)
3. Investment Properties (continued)
ii. a combination of the cost approach and income approach valuation methodologies for buildings, including replacement cost evaluations, “go dark” analyses and residual calculations incorporating the land values; and
iii. the cost approach valuation methodology for site and tenant improvements, including replacement costs and prevailing quoted market rates.
b. Represents the fair value of lease intangibles and other assets. Lease intangibles include leasing commissions, in place leases and legal and marketing fees associated with replacing existing leases. The income approach was used to determine the fair value of these intangible assets which included estimated market rates and expenses. It was determined that carrying value approximated fair value for other asset amounts. Any remaining value which could not be allocated to identifiable intangibles was allocated to goodwill. Goodwill recognized from the acquisition represents, among other things, the future economic benefits arising from expected synergies and is consistent with the Company's stated intentions to become an internally managed REIT. The acquired goodwill is fully deductible for income tax purposes.
c. Represents the fair value of accounts payable, accrued expenses and other liabilities. It was determined that carrying value approximated fair value for all amounts in these categories.
d. Represents the fair value of above/below market leases. The income approach was used to determine the fair value of above/below market leases using market rental rates for similar properties.
e. Represents the components of purchase consideration paid.
For the year ended December 1, 2014, the Company incurred approximately $3.79 million in acquisition expenses. These costs are included on the consolidated statements of operations under the caption “Corporate general & administrative.”
2015 Acquisitions
Laskin Road Land
On January 9, 2015, the Company completed its acquisition of 1.5 acres of undeveloped land located on Laskin Road in Virginia Beach, Virginia ("Laskin Road") for a contract price of $1.64 million. The Company acquired Laskin Road for future development opportunities. The Company paid cash of $150 thousand with the balance of the contract price to be paid in common units on the earlier of the one year anniversary of the acquisition or the completion of any development activities. The number of units issued was to be determined using the 10-day moving average of the Company's Common Stock price immediately prior to issuance. On January 19, 2016, 807,727 common units were issued by the Operating Partnership to satisfy this liability.
Pierpont Centre
On January 14, 2015, the Company completed its acquisition of Pierpont Centre, a 122,259 square foot shopping center located in Morgantown, West Virginia ("Pierpont Centre") for a contract price of $13.89 million, paid through a combination of cash and debt. Pierpont Centre was 100% leased as of the acquisition date and its major tenants include GNC, Hallmark, Michael's, Ruby Tuesday and Outback Steakhouse.
Brook Run Properties
On March 27, 2015, the Company completed its acquisition of Brook Run Properties, LLC ("Brook Run Properties") from a related party, consisting of a 2.0 acre parcel of undeveloped real estate located adjacent to the Brook Run Shopping Center in Richmond, Virginia, for a contract price of $300 thousand in cash. The Company acquired the property for potential development and to compliment the adjacent shopping center.
Alex City Marketplace
On April 1, 2015, the Company completed its acquisition of Alex City Marketplace, a 147,791 square foot shopping center located in Alexander City, Alabama ("Alex City Marketplace") for a contract price of $10.25 million, paid through a
Wheeler Real Estate Investment Trust, Inc. and Subsidiaries
Notes to Consolidated Financial Statements (Continued)
3. Investment Properties (continued)
combination of cash and debt. Alex City Marketplace was 86% leased as of the the acquisition date and its major tenants include Winn Dixie and Goody's.
Butler Square
On April 15, 2015, the Company completed its acquisition of Butler Square, a 82,400 square foot shopping center located in Mauldin, South Carolina ("Butler Square") for a contract price of $9.40 million, paid through a combination of cash and debt. Butler Square was 100% leased as of the acquisition date and its major tenants include Bi-Lo and Dollar Tree.
Brook Run Shopping Center
On June 2, 2015, the Company completed its acquisition of Brook Run Shopping Center, a 147,738 square foot shopping center located in Richmond, Virginia ("Brook Run") for a contract price of $18.50 million. Brook Run was 92% leased as of the acquisition date and its major tenants include Martin's Food Store and CVS. The Company acquired Brook Run from a related party through a combination of cash, the issuance of 574,743 common units in the Operating Partnership and debt.
Beaver Ruin Village
On July 1, 2015, the Company completed its acquisition of Beaver Ruin Village, a 74,048 square foot shopping center located in Lilburn, Georgia ("Beaver Ruin Village") for a contract price of $12.35 million, paid through a combination of cash and debt. Beaver Ruin Village was 91% leased as of the acquisition date and its major tenants include Chase Bank, Firehouse Subs and State Farm Insurance.
Beaver Ruin Village II
On July 1, 2015, the Company completed its acquisition of Beaver Ruin Village II, a 34,925 square foot shopping center located in Lilburn, Georgia ("Beaver Ruin Village II") for a contract price of $4.38 million, paid through a combination of cash and debt. Beaver Ruin Village II was 100% leased as of the acquisition date and its major tenants include AutoZone and Metro PCS.
Columbia Fire Station
On July 1, 2015, the Company completed its acquisition of Columbia Fire Station, consisting of two vacant buildings on a 1.0 acre land parcel located in Columbia, South Carolina ("Columbia Fire Station") for a contract price of $2.40 million, paid through a combination of cash and debt. The Company plans to redevelop this property for retail use.
Chesapeake Square
On July 10, 2015, the Company completed its acquisition of Chesapeake Square, a 99,848 square foot shopping center located in Onley, Virginia ("Chesapeake Square") for a contract price of $6.34 million. Chesapeake Square was 76% leased as of the acquisition date and is anchored by a Food Lion grocery store. The Company acquired Chesapeake Square from a related party through a combination of cash and the issuance of 125,966 common units in the Operating Partnership.
Sunshine Plaza
On July 21, 2015, the Company completed its acquisition of Sunshine Plaza, a 111,189 square foot shopping center located in Lehigh Acres, Florida ("Sunshine Plaza") for a contract price of $10.35 million. Sunshine Plaza was 96% leased as of the acquisition date and is anchored by a Winn-Dixie grocery store. The Company acquired Sunshine Plaza through a combination of cash and debt.
Carolina Place
On July 24, 2015, the Company completed its acquisition of Carolina Place from a related party, consisting of a 2.14 acre parcel of land adjacent to Chesapeake Square for a contract price of $250 thousand in cash. The Company acquired the property for potential development and to compliment the adjacent shopping center.
Wheeler Real Estate Investment Trust, Inc. and Subsidiaries
Notes to Consolidated Financial Statements (Continued)
3. Investment Properties (continued)
Hilton Head Land
On August 14, 2015, the Company completed its acquisition of 10.39 acres located in Hilton Head, South Carolina ("Hilton Head Land") for a contract price of $1.00 million paid in cash. The Company acquired the property for potential development and to compliment an adjacent redevelopment project (See notes 4 and 11).
Barnett Portfolio
On August 21, 2015, the Company completed its acquisition of Cardinal Plaza, located in Henderson, North Carolina, Franklinton Square, located in Franklinton, North Carolina and Nashville Commons, located in Nashville, North Carolina (collectively known as the "Barnett Portfolio") for a contract price of $15.33 million. The Barnett Porfolio properties total 171,466 square feet, were 91% leased as of the acquisition date and all are anchored by Food Lion grocery stores. The Company acquired the Barnett Portfolio through a combination of cash and debt.
Grove Park
On September 9, 2015, the Company completed its acquisition of Grove Park Shopping Center, a 106,557 square foot shopping center located in Orangeburg, South Carolina ("Grove Park") for a contract price of $6.60 million. Grove Park was 90% leased as of the acquisition date and is anchored by a Bi-Lo grocery store. The Company acquired Grove Park through a combination of cash and debt.
Parkway Plaza
On September 15, 2015, the Company completed its acquisition of Parkway Plaza Shopping Center, a 52,365 square foot shopping center and 2.1 acres of adjacent undeveloped land located in Brunswick, Georgia ("Parkway Plaza") for a contract price of $6.08 million Parkway Plaza was 97% leased as of the acquisition date and is anchored by a Winn Dixie grocery store. The Company acquired Parkway Plaza through a combination of cash and debt.
Fort Howard Square
On September 30, 2015, the Company completed its acquisition of Fort Howard Square Shopping Center, a 113,652 square foot shopping center located in Rincon, Georgia ("Fort Howard Square") for a contract price of $11.50 million. Fort Howard Square was 95% leased as of the acquisition date and is anchored by nationally recognized tenants Goodwill and Dollar Tree. The Company acquired Fort Howard Square through a combination of cash and debt.
Conyers Crossing
On September 30, 2015, the Company completed its acquisition of Conyers Crossing Shopping Center, a 170,475 square foot shopping center located in Conyers, Georgia ("Conyers Crossing") for a contract price of $10.75 million. Conyers Crossing was 99% leased as of the acquisition date and is anchored by nationally recognized tenants Hobby Lobby and Burlington Coat Factory. The Company acquired Conyers Crossing through a combination of cash and debt.
The following summarizes the consideration paid and the fair values of assets acquired and liabilities assumed in conjunction with the acquisitions described above, along with a description of the methods used to determine fair value. In determining fair values, the Company considered many factors including, but not limited to, cash flows, market cap rates, location, occupancy rates, appraisals, other acquisitions and management’s knowledge of the current acquisition market for similar properties.
Wheeler Real Estate Investment Trust, Inc. and Subsidiaries
Notes to Consolidated Financial Statements (Continued)
3. Investment Properties (continued)
|
| | | | | | |
| | | | | 2015 Total Acquisitions |
| Fair value of assets acquired and liabilities assumed: | |
| | Investment property (a) | $ | 114,211,725 |
|
| | Lease intangibles and other assets (b) | 26,827,214 |
|
| | Above market leases (b) | 4,166,440 |
|
| | Below market leases (b) | (4,021,671 | ) |
| | | | | |
| | Fair value of net assets acquired | $ | 141,183,708 |
|
| | | | | |
| Purchase consideration: | | |
| | Consideration paid with cash and debt | $ | 138,115,158 |
|
| | Consideration paid with common units | 3,068,550 |
|
| | | | | |
| | Total consideration (c) | $ | 141,183,708 |
|
| |
a. | Represents the fair value of the investment property acquired which includes land, buildings, site improvements and tenant improvements. The fair value was determined using the following approaches: |
i. the market approach valuation methodology for land by considering similar transactions in the markets;
ii. a combination of the cost approach and income approach valuation methodologies for buildings, including replacement cost evaluations, "go dark" analyses and residual calculations incorporating the land values; and
| |
iii. | the cost approach valuation methodology for site and tenant improvements, including replacement costs and prevailing quoted market rates. |
| |
b. | Represents the fair value of lease intangibles and other assets. Lease intangibles include leasing commissions, leases in place, above/below market leases and legal and marketing fees associated with replacing existing leases. The income approach was used to determine the preliminary fair value of these intangible assets which included estimated market rates and expenses. It was determined that carrying value approximated fair value for other asset amounts. |
| |
c. | Represents the components of purchase consideration paid. Consideration paid with common units includes units issued for acquisitions and those amounts currently due for acquisitions that, per the original contract, are to be settled by issuing common units subsequent to December 31, 2015. |
For the year ended December 31, 2015, the Company incurred approximately $3.87 million in acquisition expenses. These costs are included on the consolidated statements of operations under the caption “Corporate general & administrative.”
2016 Acquisitions
A-C Portfolio
On April 12, 2016, the Company completed its acquisition of 14 retail shopping centers located in Georgia and South Carolina (collectively the “A-C Portfolio”) for an aggregate purchase price of $71.00 million, paid through a combination of cash, debt and the issuance of 888,889111,111 common units in the Operating Partnership. Collectively, the A-C Portfolio properties total 605,358 square feet in leaseable space, and were 92% leased as of the acquisition date by 77 primarily retail tenants. Each property is anchored by either a Bi-Lo,Bi-LO, Harris Teeter, or Piggly Wiggly grocery store.
Wheeler Real Estate Investment Trust, Inc. and Subsidiaries
Notes to Consolidated Financial Statements (Continued)
3. Investment Properties (continued)
store or Planet Fitness.
The A-C Portfolio consists of the following properties:
|
| | | |
| Property Name | Location | Square Feet |
|
| Darien Shopping Center | Darien, GA | 26,001 |
|
| Devine Street | Columbia, SC | 38,464 |
|
| Folly Road | Charleston, SC | 47,794 |
|
| Georgetown | Georgetown, SC | 29,572 |
|
| Ladson Crossing | Ladson, SC | 52,607 |
|
| Lake Greenwood Crossing | Greenwood, SC | 47,546 |
|
| Lake Murray | Lexington, SC | 39,218 |
|
| Litchfield Market Village | Pawleys Island, SC | 86,740 |
|
| Moncks Corner | Moncks Corner, SC | 26,800 |
|
| Ridgeland | Ridgeland, SC | 20,029 |
|
| Shoppes at Myrtle Park | Bluffton, SC | 56,380 |
|
| South Lake | Lexington, SC | 44,318 |
|
| South Park | Mullins, SC | 60,874 |
|
| St. Matthews | St. Matthews, SC | 29,015 |
|
Wheeler Real Estate Investment Trust, Inc. and Subsidiaries
Notes to Consolidated Financial Statements (Continued)
3. Investment Properties (continued)
Berkley Shopping Center
On November 10, 2016, we completed our acquisition of Berkley Shopping Center, a 47,945 square foot shopping center located in Norfolk, Virginia ("Berkley") from a related party for a contract price of $4.18 million. Berkley was 100% leased as of the acquisition date and is anchored by a Farm Fresh grocery store. We acquired Berkley from a related party through a combination of cash and the issuance of 221,47627,685 common units in the Operating Partnership.
Sangaree Plaza and Tri-County Plaza
On November 10, 2016, we completed our acquisition of Sangaree Plaza and Tri-County Plaza, a 66,948 and 67,577 square foot shopping center, respectively located in Summerville, South Carolina and Royston, Georgia, respectively ("Sangaree/Tri-County") from a related party for a total contract price of $10.77 million. Sangaree/Tri-County was 95% leased as of the acquisition date and are anchored by Bi-LoBi-LO grocery store. We acquired Sangaree/Tri-County from a related party through a combination of cash and the issuance of 122,25015,281 common units in the Operating Partnership.
Riverbridge Shopping Center
On November 15, 2016, the Company completed its acquisition of Riverbridge Shopping Center ("Riverbridge"), a 91,188 square foot shopping center located in Carollton, Georgia for a contract price of $7.00 million. Riverbridge was 99% leased as of the acquisition date and is anchored by Ingles. The Company acquired Riverbridge through a combination of cash and debt.
Laburnum Square
On December 7, 2016, the Company completed our acquisition of Laburnum Square, a 109,405 square foot shopping center located in Richmond, Virginia ("Laburnum") for a contract price of $10.50 million, paid through a combination of cash and debt. Laburnum was 97% leased as of the acquisition date and is anchored by Kroger.
Wheeler Real Estate Investment Trust, Inc. and Subsidiaries
Notes to Consolidated Financial Statements (Continued)
3. Investment Properties (continued)
Franklin Village
On December 12, 2016, the Company completed our acquisition of Franklin Village, a 151,673 square foot shopping center located in Kittanning, Pennsylvania ("Franklin") for a contract price of $13.10 million, paid through a combination of cash and debt. Franklin was 98% leased as of the acquisition date and is anchored by Shop ‘n Save.
Village at Martinsville
On December 16, 2016, the Company completed our acquisition of Village at Martinsville, a 297,950 square foot shopping center located in Martinsville, Virginia ("Martinsville") for a contract price of $23.53 million, paid through a combination of cash and debt. Martinsville was 97% leased as of the acquisition date and is anchored by Kroger.
New Market Crossing
On December 20, 2016, the Company completed our acquisition of New Market Crossing, a 116,976 square foot shopping center located in Mt. Airy, North Carolina ("New Market") for a contract price of $9.00 million, paid through a combination of cash and debt. New Market was 93% leased as of the acquisition date and is anchored by Lowes Food Store.
Rivergate Shopping Center
On December 21, 2016, the Company completed our acquisition of Rivergate Shopping Center, a 205,810 square foot shopping center located in Macon, Georgia ("Rivergate") for a contract price of $37.25 million, paid through a combination of cash and debt. Rivergate was 96% leased as of the acquisition date and is anchored by Publix.
The following summarizes the consideration paid and the fair values of assets acquired and liabilities assumed in conjunction with the acquisitions described above, along with a description of the methods used to determine fair value. In determining fair values, the Company considered many factors including, but not limited to, cash flows, market cap rates,
Wheeler Real Estate Investment Trust, Inc. and Subsidiaries
Notes to Consolidated Financial Statements (Continued)
3. Investment Properties (continued)
location, occupancy rates, appraisals, other acquisitions and management’s knowledge of the current acquisition market for similar properties.
| | | | | 2016 Total Acquisitions | | 2016 Total Acquisitions |
| Preliminary fair value of assets acquired and liabilities assumed: | | |
| Fair value of assets acquired and liabilities assumed: | | Fair value of assets acquired and liabilities assumed: | (in thousands) |
| | Investment property (a) | $ | 157,024,946 |
| Investment property (a) | $ | 157,025 |
|
| | Lease intangibles and other assets (b) | 27,790,922 |
| Lease intangibles and other assets (b) | 27,791 |
|
| | Above market leases (b) | 8,770,554 |
| Above market leases (b) | 8,771 |
|
| | Below market leases (b) | (7,256,422 | ) | Below market leases (b) | (7,257 | ) |
| | | | | |
| | Preliminary fair value of net assets acquired | $ | 186,330,000 |
| Fair value of net assets acquired | $ | 186,330 |
|
| | | | | |
| Purchase consideration: | Purchase consideration: | | | Purchase consideration: | | |
| | Consideration paid with cash and debt | $ | 183,556,617 |
| Consideration paid with cash and debt | $ | 183,557 |
|
| | Consideration paid with common units | 2,773,383 |
| Consideration paid with common units | 2,773 |
|
| | | | | |
| | Total consideration (c) | $ | 186,330,000 |
| Total consideration (c) | $ | 186,330 |
|
| |
| a. | Represents the preliminary fair value of the investment property acquired which includes land, buildings, site improvements and tenant improvements. The fair value was determined using the following approaches: |
i. the market approach valuation methodology for land by considering similar transactions in the markets;
Wheeler Real Estate Investment Trust, Inc. and Subsidiaries
Notes to Consolidated Financial Statements (Continued)
3. Investment Properties (continued)
ii. a combination of the cost approach and income approach valuation methodologies for buildings, including replacement cost evaluations, "go dark" analysesanalysis and residual calculations incorporating the land values; and
| |
| iii. | the cost approach valuation methodology for site and tenant improvements, including replacement costs and prevailing quoted market rates. |
| |
| b. | Represents the preliminary fair value of lease intangibles and other assets. Lease intangibles include leasing commissions, leases in place, above/below market leases and legal and marketing fees associated with replacing existing leases. The income approach was used to determine the preliminary fair value of these intangible assets which included estimated market rates and expenses. It was determined that carrying value approximated fair value for other asset amounts. |
| |
| c. | Represents the components of purchase consideration paid. |
For the year ended December 31, 2016, the Company incurred $2.02 million in acquisition expenses. These costs are included on the consolidated statements of operations under the caption "Corporate general & administrative."
Wheeler Real Estate Investment Trust, Inc. and Subsidiaries
Notes to Consolidated Financial Statements (Continued)
3. Investment Properties (continued)
Unaudited pro forma consolidated financial information is presented below for all 2014, 2015 and 2016 acquisitions, excluding DF I-Courtland, Edenton Commons, DF-I Moyock, Harbor Point, DF I-Berkley, Laskin Road, Brook Run Properties, Columbia Fire Station, Carolina Place, and Hilton Head Land.acquisitions. The unaudited pro forma information presented below illustrates the Company’s pro forma financial results assuming the acquisitions had been consummated as of the beginning of the earliest period presented. The pro forma results include adjustments for depreciation and amortization associated with acquired tangible and intangible assets, straight-line rent adjustments and interest expense related to debt incurred. Unaudited pro forma financial information has not been presented for DF I-Courtland, Edenton Commons, DF-I Moyock, Harbor Point, DF I-Berkley, Laskin Road, Brook Run Properties, Columbia Fire Station, Carolina Place, and Hilton Head Land as the Company’s management has determined that their inclusion would not be meaningful due to limited or no unrelated third party operating history.
| | | | Years Ended December 31, | Years Ended December 31, |
| | 2016 | | 2015 | | 2014 | 2017 | | 2016 |
| Rental revenue | $ | 44,599,771 |
| | $ | 42,536,082 |
| | $ | 41,754,669 |
| |
| | | (in thousands) |
| Rental revenues | | $ | 44,782 |
| | $ | 43,883 |
|
| Net loss from continuing operations | $ | (8,179,288 | ) | | $ | (21,068,953 | ) | | $ | (23,699,840 | ) | $ | (11,267 | ) | | $ | (14,164 | ) |
| Net loss attributable to Wheeler REIT | $ | (6,672,134 | ) | | $ | (16,529,827 | ) | | $ | (18,258,949 | ) | $ | (9,226 | ) | | $ | (12,101 | ) |
| Net loss attributable to Wheeler REIT common shareholders | $ | (11,385,303 | ) | | $ | (102,801,865 | ) | | $ | (20,977,206 | ) | $ | (19,196 | ) | | $ | (16,814 | ) |
| Basic loss per share | $ | (0.17 | ) | | $ | (2.64 | ) | | $ | (2.85 | ) | $ | (2.22 | ) | | $ | (2.00 | ) |
| Diluted loss per share | $ | (0.17 | ) | | $ | (2.64 | ) | | $ | (2.85 | ) | $ | (2.22 | ) | | $ | (2.00 | ) |
2017 Dispositions
On June 27, 2017, the Company completed the sale of the 2.14 acre land parcel at Carolina Place for a contract price of $250 thousand, resulting in a loss of $12 thousand with net proceeds of $238 thousand.
On June 26, 2017, the Company completed the sale of the Steak n' Shake, a 1.06 acre outparcel at Rivergate, for a contract price of approximately $2.25 million, resulting in a gain of $1.03 million with net proceeds of $2.18 million.
The sales of the Steak n' Shake outparcel at Rivergate and the land parcel at Carolina Place do not represent a strategic shift that has a major effect on the Company's financial position or results of operations. Accordingly, the operating results of these properties remains classified within continuing operations for all periods presented.
4. Notes Receivable
The Company, through WD, is performing development services for a related party of the Company, for the redevelopment of Pineland Station Shopping Center in Hilton Head, South Carolina to be known in the future as Sea Turtle Marketplace (“Sea Turtle Development”). Sea Turtle Development is a related party as discussed in Note 11.
On September 29, 2016, the Company entered into an $11.00 million note receivable of which $1.6 million had been advanced as of December 31, 2015 for the partial funding of the Sea Turtle Development and ana $1.00 million note receivable in consideration for the sale of 10.39 acres of land owned by the Company. Both promissory notes are collateralized by a 2nd deed of trust on the property and accrue interest at a rate of 12% annually. Interest only payments at a rate of 8% are due on the notes at the beginning of every calendar quarter starting October 2016. Interest at a rate of 4% accrues and is due at maturity. The notes mature the earlier of September 29, 2021 or the disposition of the property.
Subsequent to December 31, 2017, the Company, through Wheeler Development, was terminated from performing development services by WD-1, for the redevelopment of Pineland Station Shopping Center in Hilton Head, South Carolina known as Sea Turtle Marketplace (“Sea Turtle Development”). Sea Turtle Development is a related party as Jon Wheeler, the Company's former CEO and shareholder of the Company, is the managing member as discussed in Note 11 and Note 13.
As of December 31, 2017, the Company believes the estimated fair market value of the development at stabilization at a future date will not provide for the cash required to repay the entire notes receivable due the Company in the event of a sale. The balanceCompany’s estimated fair value of the project is based upon cash flow models that include development costs to date, anticipated cost to complete, executed leases, and financing available to complete and stabilize the project. Capitalization rates utilized in these models are based upon rates that the Company believes to be within a reasonable range of current market rates for the respective project. These valuation assumptions are based on the three-level valuation hierarchy for fair value measurement and represent Level 3 inputs. Level 3 inputs are unobservable inputs that are supported by little or no market activity and that are significant to the fair value of the assets or liabilities. Given the uncertainty surrounding the recoverability of the $12.00 million notes receivable the Company has recognized a $5.26 million impairment charge. The impairment charge is presented as “impairment of notes receivable” on the consolidated statements of operations. In addition, the $1.34 million of accrued interest associated with the notes receivable at December 31, 2016has been fully reserved and is $12.00 million.included in “provision for credit losses” on the consolidated statements of operations. The notes are collateralized by a 2nd deed of trust on the property. If the holder of
Wheeler Real Estate Investment Trust, Inc. and Subsidiaries
Notes to Consolidated Financial Statements (Continued)
4. Notes Receivable (continued)
the 1st deed of trust proceeds to foreclosure, this may have an adverse effect on assumptions used in the Company's fair value analysis leading to further impairment.
5. Goodwill
As part of the acquisition of the Operating Companies on October 24, 2014, the Company recorded preliminary goodwill of $7.00 million. In June 2015, the Company finalized its valuation of the Operating Companies. In accordance with the valuation, the Company has recorded a fair value discount of $1.18 million to the $6.75 million in common units issued for the acquisition of
Wheeler Real Estate Investment Trust, Inc. and Subsidiaries
Notes to Consolidated Financial Statements (Continued)
5. Goodwill (continued)
the Operating Companies due to the one year restriction on their conversion into shares of Common Stock, and reallocated a portion of goodwill$337 thousand to finite-lived intangibles during the year ended December 31, 2015 as follows:
|
| | | | | | | |
| | December 31, |
| | 2016 | | 2015 |
| Balance, beginning of year | $ | 5,485,823 |
| | $ | 7,004,072 |
|
| Fair value discount on common units issued for acquisition | — |
| | (1,181,250 | ) |
| Allocation to finite-lived intangibles | — |
| | (336,999 | ) |
| Balance, end of year | $ | 5,485,823 |
| | $ | 5,485,823 |
|
6. Assets Held for Sale and Discontinued Operations
In August 2015, the Company’s management and Board of Directors committed to a plan to sell Bixby Commons, Jenks Reasors, Harps at Harbor Point, Starbucks/Verizon and the ground leases for Ruby Tuesday’s and Outback Steakhouse at Pierpont Centre (the “Freestanding Properties”) as part of the Company’s continuous evaluation of strategic alternatives. Accordingly, the Freestanding Properties have been classified as held for sale and the results of their operations have been classified as discontinued operations for all periods presented. Management expects thatAs of December 31, 2017, the salesales of theall Freestanding Properties will occur within one yearhave occurred and the Company will receive no residual cash flows once the Freestanding Properties are disposed.flow.
On October 19, 2015, the Company completed its sale of Jenks Reasors for a contract price of approximately $12.16 million, resulting in a gain of approximately $820 thousand.
On October 20, 2015, the Company completed its sale of Harps at Harbor Point for a contract price of approximately $5.03 million, resulting in a gain of approximately $642 thousand.
On October 27, 2015, the Company completed its sale of Bixby Commons for a contract price of approximately
$10.98 $10.98 million, resulting in a gain of approximately $642 thousand.
On June 29, 2016, the Company completed its sale of Starbucks/Verizon for a contract price of approximately $2.10 million, resulting in a gain of approximately $688 thousand.
On February 28, 2017, the Company completed its sales of Ruby Tuesday’s and Outback Steakhouse at Pierpont Centre for a contract price of approximately $2.29 million, resulting in a gain of $1.50 million. The Company has defeased the $1.69 million loan payable at a cost of $223 thousand.
As of December 31, 20162017 and 2015,2016, assets held for sale consisted of the following:following (in thousands):
| | | | | December 31, | | December 31, |
| | | 2016 | | 2015 | | 2017 | | 2016 |
| Investment properties, net | | $ | 216,792 |
| | $ | 1,284,888 |
| | $ | — |
| | $ | 217 |
|
| Rents and other tenant receivables, net | | — |
| | 38,945 |
| |
| Above market lease intangible, net | | 2,616 |
| | 2,616 |
| | — |
| | 3 |
|
| Deferred costs and other assets, net | | 146,472 |
| | 366,024 |
| | — |
| | 146 |
|
| Total assets held for sale | | $ | 365,880 |
| | $ | 1,692,473 |
| | $ | — |
| | $ | 366 |
|
As of December 31, 2016 and 2015, liabilities associated with assets held for sale consisted of the following:
|
| | | | | | | | |
| | | December 31, |
| | | 2016 | | 2015 |
| Loans payable | | $ | 1,350,000 |
| | $ | 1,966,806 |
|
| Below market lease intangible, net | | — |
| | 14,758 |
|
| Accounts payable, accrued expenses and other liabilities | — |
| | 10,754 |
|
| Total liabilities associated with assets held for sale | $ | 1,350,000 |
| | $ | 1,992,318 |
|
Wheeler Real Estate Investment Trust, Inc. and Subsidiaries
Notes to Consolidated Financial Statements (Continued)
6. Assets Held for Sale and Discontinued Operations (continued)
As of December 31, 2017 and 2016, liabilities associated with assets held for sale consisted of the following (in thousands):
|
| | | | | | | | |
| | | December 31, |
| | | 2017 | | 2016 |
| Loans payable | | $ | — |
| | $ | 1,350 |
|
| Total liabilities associated with assets held for sale | $ | — |
| | $ | 1,350 |
|
The consolidated statements of operations reflect reclassifications of revenue, property operating expenses, corporate general and administrative expenses and interest expense from continuing operations to income from discontinued operations for all periods presented. All interest expense disclosed below is directly related to the debt incurred to acquire the Freestanding Properties.
The following is a summary of the income from discontinued operations for the years ended December 31, 2017, 2016 and 2015 and 2014:(in thousands):
| | | | | Years Ended December 31, | | Years Ended December 31, |
| | | 2016 | | 2015 | | 2014 | | 2017 | | 2016 | | 2015 |
| Revenues | | $ | 284,378 |
| | $ | 2,042,722 |
| | $ | 2,285,159 |
| | $ | 26 |
| | $ | 284 |
| | $ | 2,043 |
|
| Expenses | | 78,572 |
| | 827,860 |
| | 1,072,622 |
| | 1 |
| | 79 |
| | 828 |
|
| Operating income | | 205,806 |
| | 1,214,862 |
| | 1,212,537 |
| | 25 |
| | 205 |
| | 1,215 |
|
| Interest expense | | (69,347 | ) | | (715,081 | ) | | (904,878 | ) | | 9 |
| | 69 |
| | 715 |
|
| Income from discontinued operations before gain on disposals | Income from discontinued operations before gain on disposals | | 136,459 |
| | 499,781 |
| | 307,659 |
| Income from discontinued operations before gain on disposals | | 16 |
| | 136 |
| | 500 |
|
| Gain on disposal of properties | | 688,289 |
| | 2,104,114 |
| | — |
| | 1,502 |
| | 688 |
| | 2,104 |
|
| Income from discontinued operations | Income from discontinued operations | | $ | 824,748 |
| | $ | 2,603,895 |
| | $ | 307,659 |
| Income from discontinued operations | | $ | 1,518 |
| | $ | 824 |
| | $ | 2,604 |
|
Wheeler Real Estate Investment Trust, Inc. and Subsidiaries
Notes to Consolidated Financial Statements (Continued)
7. Loans Payable
The Company’s loans payable related to continuing operations consist of the following:following (in thousands except monthly payment):
| | | | Monthly | | Interest | | | | December 31, | | | | | | December 31, |
| Property/Description | Payment | | Rate | | Maturity | | 2016 | | 2015 | | Monthly Payment | | Interest Rate | | Maturity | | 2017 | | 2016 |
Bank Line of Credit (1) | | | Interest only |
| | Libor + 300 basis points |
| | December 2017 | | $ | 3,000 |
| | $ | 3,000 |
|
| Columbia Fire Station | | | Interest only |
| | 8.00 | % | | December 2017 | | — |
| | 487 |
|
| Shoppes at Eagle Harbor | $ | 25,100 |
| | 4.34 | % | | March 2018 | | $ | 3,492,178 |
| | $ | 3,634,085 |
| | $ | 25,100 |
| | 4.34 | % | | March 2018 | | 3,341 |
| | 3,492 |
|
| Monarch Bank Building | $ | 9,473 |
| | 4.15 | % | | December 2017 | | 1,319,767 |
| | 1,376,452 |
| |
| Revere Loan | | | Interest only |
| | 8.00 | % | | April 2018 | | 6,808 |
| | 7,450 |
|
| Lumber River | | | Interest only |
| | Libor + 295 basis points |
| | June 2018 | | 1,500 |
| | 1,500 |
|
| KeyBank Line of Credit | | | Interest only |
| | Libor + 250 basis points |
| | July 2018 | | 15,532 |
| | 74,077 |
|
| Senior convertible notes | | | Interest only |
| | 9.00 | % | | December 2018 | | 1,369 |
| | 1,400 |
|
| Harbor Point | | | $ | 11,024 |
| | 5.85 | % | | December 2018 | | 553 |
| | 649 |
|
| Perimeter Square | Interest Only |
| | 4.06 | % | | August 2026 | | 4,500,000 |
| | 4,166,406 |
| | Interest only |
| | 5.50 | % | | December 2018 | | 5,382 |
| | 4,500 |
|
| Riversedge North | $ | 8,802 |
| | 6.00 | % | | January 2019 | | 914,026 |
| | 962,281 |
| | $ | 8,802 |
| | 6.00 | % | | January 2019 | | 863 |
| | 914 |
|
| Monarch Bank Building | | | $ | 7,340 |
| | 4.85 | % | | June 2019 | | 1,266 |
| | 1,320 |
|
| DF I-Moyock | | | $ | 10,665 |
| | 5.00 | % | | July 2019 | | 194 |
| | 309 |
|
| Rivergate | | | Interest only |
| | Libor + 295 basis points |
| | December 2019 | | 22,689 |
| | 24,213 |
|
| KeyBank Line of Credit | | | Interest only |
| | Libor + 250 basis points |
| | December 2019 | | 52,500 |
| | — |
|
| LaGrange Marketplace | | | $ | 15,065 |
| | Libor + 375 basis points |
| | March 2020 | | 2,317 |
| | 2,369 |
|
| Folly Road | | | Interest only |
| | 4.00 | % | | March 2020 | | 6,181 |
| | — |
|
| Columbia Fire Station construction loan | | | Interest only |
| | 4.00 | % | | May 2020 | | 3,421 |
| | — |
|
| Shoppes at TJ Maxx | | | $ | 33,880 |
| | 3.88 | % | | May 2020 | | 5,727 |
| | 5,908 |
|
| Walnut Hill Plaza | $ | 24,273 |
| | 5.50 | % | | July 2017 | | 3,439,587 |
| | 3,535,606 |
| | Interest only |
| | 5.50 | % | | September 2022 | | 3,903 |
| | 3,440 |
|
| Twin City Commons | $ | 17,827 |
| | 4.86 | % | | January 2023 | | 3,169,620 |
| | 3,225,473 |
| | $ | 17,827 |
| | 4.86 | % | | January 2023 | | 3,111 |
| | 3,170 |
|
| Shoppes at TJ Maxx | $ | 33,880 |
| | 3.88 | % | | May 2020 | | 5,907,597 |
| | 6,081,272 |
| |
| Bank Line of Credit | Interest only |
| | 4.25 | % | | September 2017 | | 3,000,000 |
| | — |
| |
| KeyBank Line of Credit | Interest only |
| | 3.24 | % | | May 2018 | | 74,077,250 |
| | 6,873,750 |
| |
| Tampa Festival | | | $ | 50,797 |
| | 5.56 | % | | September 2023 | | 8,368 |
| | 8,502 |
|
| Forrest Gallery | $ | 50,973 |
| | 5.40 | % | | September 2023 | | 8,802,243 |
| | 8,926,712 |
| | $ | 50,973 |
| | 5.40 | % | | September 2023 | | 8,669 |
| | 8,802 |
|
| Tampa Festival | $ | 50,797 |
| | 5.56 | % | | September 2023 | | 8,502,198 |
| | 8,627,294 |
| |
| Winslow Plaza | Interest only |
| | 4.82 | % | | December 2025 | | 4,620,000 |
| | 4,620,000 |
| |
| South Carolina Food Lions Note | | | $ | 68,320 |
| | 5.25 | % | | January 2024 | | 12,050 |
| | 12,224 |
|
| Cypress Shopping Center | $ | 34,360 |
| | 4.70 | % | | July 2024 | | 6,585,228 |
| | 6,625,000 |
| | $ | 34,360 |
| | 4.70 | % | | July 2024 | | 6,485 |
| | 6,585 |
|
| Port Crossing | | | $ | 34,788 |
| | 4.84 | % | | August 2024 | | 6,263 |
| | 6,370 |
|
| Freeway Junction | | | $ | 41,798 |
| | 4.60 | % | | September 2024 | | 7,994 |
| | 8,119 |
|
| Harrodsburg Marketplace | $ | 19,112 |
| | 4.55 | % | | September 2024 | | 3,616,999 |
| | 3,677,501 |
| | $ | 19,112 |
| | 4.55 | % | | September 2024 | | 3,553 |
| | 3,617 |
|
| Port Crossing | $ | 34,788 |
| | 4.84 | % | | August 2024 | | 6,370,373 |
| | 6,471,636 |
| |
| LaGrange Marketplace | $ | 15,065 |
| | 5.50 | % | | March 2020 | | 2,369,225 |
| | 2,418,212 |
| |
| Freeway Junction | $ | 31,265 |
| | 4.60 | % | | September 2024 | | 8,119,327 |
| | 8,150,000 |
| |
| DF I-Edenton | $ | 250,000 |
| 1 |
| 3.75 | % | | September 2016 | | — |
| | 650,000 |
| |
| DF I-Moyock | $ | 10,665 |
| | 5.00 | % | | July 2019 | | 309,319 |
| | 418,538 |
| |
| Graystone Crossing | $ | 15,672 |
| | 4.55 | % | | October 2024 | | 3,990,048 |
| | 4,000,000 |
| | $ | 20,386 |
| | 4.55 | % | | October 2024 | | 3,928 |
| | 3,990 |
|
| Bryan Station | $ | 17,421 |
| | 4.52 | % | | November 2024 | | 4,618,932 |
| | 4,625,000 |
| | $ | 23,489 |
| | 4.52 | % | | November 2024 | | 4,547 |
| | 4,619 |
|
| Crockett Square | Interest only |
| | 4.47 | % | | December 2024 | | 6,337,500 |
| | 6,337,500 |
| | Interest only |
| | 4.47 | % | | December 2024 | | 6,338 |
| | 6,338 |
|
| Harbor Point | $ | 11,024 |
| | 5.85 | % | | December 2018 | | 649,366 |
| | 732,685 |
| |
| Pierpont Centre | Interest only |
| | 4.15 | % | | February 2025 | | 8,450,000 |
| | 8,450,000 |
| | Interest only |
| | 4.15 | % | | February 2025 | | 8,113 |
| | 8,450 |
|
| Alex City Marketplace | Interest only |
| | 3.95 | % | | April 2025 | | 5,750,000 |
| | 5,750,000 |
| | Interest only |
| | 3.95 | % | | April 2025 | | 5,750 |
| | 5,750 |
|
| Butler Square | Interest only |
| | 3.90 | % | | May 2025 | | 5,640,000 |
| | 5,640,000 |
| | Interest only |
| | 3.90 | % | | May 2025 | | 5,640 |
| | 5,640 |
|
| Brook Run Shopping Center | Interest only |
| | 4.08 | % | | June 2025 | | 10,950,000 |
| | 10,950,000 |
| | Interest only |
| | 4.08 | % | | June 2025 | | 10,950 |
| | 10,950 |
|
| Beaver Ruin Village I and II | Interest only |
| | 4.73 | % | | July 2025 | | 9,400,000 |
| | 9,400,000 |
| | Interest only |
| | 4.73 | % | | July 2025 | | 9,400 |
| | 9,400 |
|
| Columbia Fire Station | Interest only |
| | 8.00 | % | | December 2017 | | 487,408 |
| | 450,053 |
| |
| Sunshine Shopping Plaza | Interest only |
| | 4.57 | % | | August 2025 | | 5,900,000 |
| | 5,900,000 |
| | Interest only |
| | 4.57 | % | | August 2025 | | 5,900 |
| | 5,900 |
|
| Barnett Portfolio | Interest only |
| | 4.30 | % | | September 2025 | | 8,770,000 |
| | 8,770,000 |
| | Interest only |
| | 4.30 | % | | September 2025 | | 8,770 |
| | 8,770 |
|
| Fort Howard Shopping Center | | | Interest only |
| | 4.57 | % | | October 2025 | | 7,100 |
| | 7,100 |
|
| Conyers Crossing | | | Interest only |
| | 4.67 | % | | October 2025 | | 5,960 |
| | 5,960 |
|
| Grove Park Shopping Center | Interest only |
| | 4.52 | % | | October 2025 | | 3,800,000 |
| | 3,800,000 |
| | Interest only |
| | 4.52 | % | | October 2025 | | 3,800 |
| | 3,800 |
|
| Parkway Plaza | Interest only |
| | 4.57 | % | | October 2025 | | 3,500,000 |
| | 3,500,000 |
| | Interest only |
| | 4.57 | % | | October 2025 | | 3,500 |
| | 3,500 |
|
| Conyers Crossing | Interest only |
| | 4.67 | % | | October 2025 | | 5,960,000 |
| | 5,960,000 |
| |
| Fort Howard Shopping Center | Interest only |
| | 4.57 | % | | October 2025 | | 7,100,000 |
| | 7,100,000 |
| |
| Winslow Plaza | | | Interest only |
| | 4.82 | % | | December 2025 | | 4,620 |
| | 4,620 |
|
| Chesapeake Square | $ | 23,857 |
| | 4.70 | % | | August 2026 | | 4,577,709 |
| | — |
| | $ | 23,857 |
| | 4.70 | % | | August 2026 | | 4,507 |
| | 4,578 |
|
| Revere Loan | Interest only |
| | 8.00 | % | | April 2017 | | 7,450,000 |
| | — |
| |
| Senior convertible notes | Interest only |
| | 9.00 | % | | December 2018 | | 1,400,000 |
| | 3,000,000 |
| |
| Senior non-convertible notes | Interest only |
| | 9.00 | % | | January 2016 | | — |
| | 2,160,000 |
| |
| South Carolina Food Lions Note | $ | 68,320 |
| | 5.25 | % | | January 2024 | | 12,224,489 |
| | 12,375,000 |
| |
| Sangaree/Tri-County/Berkley | Interest only |
| | 4.78 | % | | December 2026 | | 9,400,000 |
| | — |
| |
| Berkley/Sangaree/Tri-County | | | Interest only |
| | 4.78 | % | | December 2026 | | 9,400 |
| | 9,400 |
|
| Riverbridge | | | Interest only |
| | 4.48 | % | | December 2026 | | 4,000 |
| | 4,000 |
|
| Franklin | Interest only |
| | 4.93 | % | | January 2027 | | 8,515,000 |
| | — |
| | Interest only |
| | 4.93 | % | | January 2027 | | 8,516 |
| | 8,516 |
|
| Rivergate | Interest only |
| | 3.67 | % | | December 2019 | | 24,212,500 |
| | — |
| |
| Riverbridge | Interest only |
| | 4.48 | % | | December 2026 | | 4,000,000 |
| | — |
| |
| Lumber River | Interest only |
| | 3.67 | % | | June 2018 | | 1,500,000 |
| | — |
| |
| Total Principal Balance | | | | 313,697,889 |
| | 189,340,456 |
| | | | | | 313,778 |
| | 313,698 |
|
| Unamortized debt issuance cost | | | | (7,725,210 | ) | | (4,711,374 | ) | | | | | | (5,656 | ) | | (7,725 | ) |
| Total Loans Payable | | | | $ | 305,972,679 |
| | $ | 184,629,082 |
| | | | | | $ | 308,122 |
| | $ | 305,973 |
|
(1)$250,000 plus accrued On January 10, 2018, the Company extended the $3.00 million bank line of credit to June 15, 2018 with interest paid quarterly until maturity.only payments due monthly at a rate of
Libor + 3.00% with a floor of 4.25%.
Wheeler Real Estate Investment Trust, Inc. and Subsidiaries
Notes to Consolidated Financial Statements (Continued)
7. Loans Payable (continued)
Key Bank Credit Agreement
On May 29, 2015, the Operating Partnership entered into a $45.00 million million revolving credit line (the "Credit Agreement") with KeyBank National Association ("KeyBank"). Pursuant to the Credit Agreement, outstanding borrowings accrue monthly interest which is paid at a rate of the one-month London Interbank Offer Rate ("LIBOR") plus a margin ranging from 1.75% to 2.50% depending on the Company's consolidated leverage ratio. On April 12, 2016, the Operating Partnership entered into a First Amendment and Joinder Agreement (“First Amendment”) to the Credit Agreement. The First Amendment increased the $45.00 million revolving credit line with KeyBank to $67.20 million and the Company utilized this additional borrowing capacity to acquire the A-C Portfolio. Pursuant to the terms of the First Amendment, the monthly interest of the increased credit facility is adjusted to LIBOR plus a margin of 5.00% until such time that the Company can meet certain repayment and leverage conditions. The Company used proceeds from the 2016 Series B proceedsPreferred Stock Offering to reduce its borrowings under the Credit Agreement to $46.10 million and the margin reduced back to the stated range of the original Credit Agreement on August 15, 2016. On December 7, 2016, the Operating Partnership entered into a Second Amendment and Joinder Agreement ("Second Amendment") to the Credit Agreement. The Second Amendment increased the line of credit to $75.0 million. Pursuant to the terms of the Second Amendment, the pricing reverts back to the original Credit Agreement. On August 7, 2017, the Company executed a Third Amendment to the KeyBank Credit Agreement (the "Third Amendment"). The Third Amendment changed the interest payment date to the first day of each calendar month and decreased the total commitment on the revolving credit line by $25.00 million to $50.00 million effective October 7, 2017. The Company and KeyBank agreed Shoppes at Myrtle Park shall continue to be included in the calculation of the Borrowing Base Availability (as defined in the Credit Agreement) through December 21, 2017. On October 6, 2017, the Company executed a Fourth Amendment to the KeyBank Credit Agreement (the "Fourth Amendment"). The Fourth Amendment provided for a sixty day extension from October 7, 2017 to December 6, 2017 upon which the $75.00 million total commitment on the revolving credit line was to decrease to $50.00 million.
On December 21, 2017, the Company entered into an Amended and Restated Credit Agreement to the Credit Agreement (the “Amended and Restated Credit Agreement”). The Amended and Restated Credit Agreement provides for an increase in borrowing capacity from $50.00 million to $52.50 million and also increases the accordion feature by $50.00 million to $150.00 million. Additionally, the Amended and Restated Credit Agreement provides for an extension of the requirement to reduce the outstanding borrowings under the facility from $68.03 million to $52.50 million by July 1, 2018. The revolving facility will mature on December 21, 2019, but may be extended at the Company’s option for an additional one-year period, subject to certain customary conditions. The interest rate remains the same at LIBOR plus 250 basis points based on the Company’s Consolidated Leverage Ratio (as defined in the Amended and Restated Credit Agreement). The unutilized amounts available to the Company under the Credit Agreement accrue fees which are paid at a rate of 0.30%0.25%.
On March 2, 2018, KeyBank reduced the liquidity requirement from $5.00 million to $3.50 million through March 31, 2018. The liquidity requirement reverts back to $5.00 million subsequent to March 31, 2018 until such time as the Total Commitment (as defined in the Amended and Restated Credit Agreement) has been reduced to $52.50 million and $3.50 million at all times thereafter.
As of December 31, 2016,2017, the Company has borrowed $74.08$68.03 million under the Credit Agreement, which is collateralized by the A-C Portfolio, Laburnum, Martinsville and New Market.16 properties. At December 31, 2016,2017, the outstanding borrowings are accruing interest at 3.24%4.05%. The Amended and Restated Credit Agreement contains certain financial covenants that the Company must meet, including minimum leverage, fixed charge coverage and debt service coverage ratios as well as a minimum tangible net worth requirement. The Company was in compliance with the financial covenants as of December 31, 2016.2017. The Amended and Restated Credit Agreement also contains certain events of default that if they occur may cause KeyBank to terminate the Amended and Restated Credit Agreement and declare amounts owed to become immediately payable. As of December 31, 2016,2017, the Company has not incurred an event of default. The credit arrangement matures May 2018.
Other 2014 Financing Activity
On January 31, 2014, the Company completed a second closing (“Second Closing”) consisting of the private placement of $2.16 million of non-convertible senior notes and warrants to purchase shares of the Company’s Common Stock. The non-convertible senior notes have an interest rate of 9.00% per annum (payable monthly) and mature on January 31, 2016. The warrants issued permit the purchase of an aggregate of 227,372 shares of the Company’s Common Stock, have an exercise price of $4.75 per share, expire on January 31, 2019 and, along with the warrants issued in the first closing on December 16, 2013, were not exercisable unless the Company obtained shareholder approval for this transaction and the issuance of the Common Stock underlying the warrants. The Company's shareholders approved the transaction and the issuance of the Common Stock underlying the warrants at its annual meeting in June 2014.
In connection with the private placement transaction, the Company and the Buyers entered into a Registration Rights Agreement, dated as of December 16, 2013 (the “December 2013 Registration Rights Agreement”). Pursuant to the December 2013 Registration Rights Agreement, the Company agreed to file and maintain a registration statement with the Securities and Exchange Commission for the resale of the shares of Common Stock underlying the convertible notes and the warrants. Interest on the convertible and nonconvertible senior notes of 9% per annum will be payable monthly.
On July 2, 2014, the Company entered into a promissory note for $660 thousand to refinance Starbucks/Verizon loan. The loan required monthly principal and interest payments of $4,383 based on a 20 year amortization and a 5.00% fixed interest rate, with a maturity of July 2, 2019. The loan was paid off in June 2016 at the time the property was sold.
The Walnut Hill loan matured on April 11, 2014, and was subsequently extended until July 31, 2014. On July 31, 2014, the Company entered into a promissory note for $3.65 million to refinance the note that matured. The new loan matures on July 30, 2017 and requires monthly principal and interest payments of $24,273 based on a 20 year amortization and a 5.50% fixed interest rate.
On September 16, 2014, the Company entered into a promissory note for a $3.00 million line of credit. The line of credit matures on September 16, 2017, provides for an interest rate of 4.25% per annum and is guaranteed by a Deed of Trust
Wheeler Real Estate Investment Trust, Inc. and Subsidiaries
Notes to Consolidated Financial Statements (Continued)
7. Loans Payable (continued)
and Assignment of Rents on real property. Concurrently with this transaction, the Company paid off its $2.00 million line of credit with Monarch Bank.
Other 2015 Financing Activity
On May 1, 2015, the Lumber River Plaza note was paid in full from cash on hand.
On November 24, 2015, the Company entered into a promissory note for $4.62 million to refinance the Winslow Plaza loan. The new loan matures on December 1, 2025 with principal due at maturity and bears interest at 4.82%.
Other 2016 Financing Activity
Senior Subordinated Debt
On January 29, 2016, the Company paid off $2.16 million in senior subordinated debt from cash on hand.
Revere Loan Agreement
In connection with the closing of the A-C Portfolio, the Operating Partnership, as borrower, and Revere High Yield Fund, LP, a Delaware limited partnership (“Revere”), as lender, entered into a Term Loan Agreement dated as of April 8, 2016 (“
Wheeler Real Estate Investment Trust, Inc. and Subsidiaries
Notes to Consolidated Financial Statements (Continued)
7. Loans Payable (continued)
(“Revere Term Loan”) in the principal amount of $8.0 million. The Revere Term Loan has a maturity date of April 30, 2017 and an interest rate of 0.088.00% per annum. The Company and certain of its subsidiaries serve as guarantors under the Revere Term Loan. The proceeds of the Revere Term Loan were used as partial consideration for the purchase of the A-C Portfolio. A warrant (“Warrant”) to purchase an aggregate of 6,000,000750,000 shares of the Company’s Common Stock (under circumstances described below under the section “Revere Warrant Agreement”) serves as collateral for the Revere Term Loan.
On May 1, 2017, the Operating Partnership extended the remaining $7.45 million Revere Term Loan maturity to April 30, 2018, as permitted within the terms of the loan agreement, with a $450 thousand principal payment and $140 thousand extension fee. In June 2017, upon the completion of the sale of Carolina Place, as discussed in Note 3, a $167 thousand principal payment was made on the loan. On August 29, 2017, a $25 thousand principal payment was made on the loan as a result of the Walnut Hill Plaza amendment discussed below. As of December 31, 2017 and 2016, the remaining outstanding amount underbalance on the Revere Term Loan isloan was $6.81 million and $7.45 million.million, respectively.
Revere Warrant Agreement
In connection with the Revere Term Loan, the Company and Revere entered into a Warrant Agreement dated as of April 8, 2016 (“Revere Warrant Agreement”), pursuant to which the Company agreed to issue the Warrant to Revere. The terms of the Revere Warrant Agreement provide that solely in the event of an Event of Default (as defined in the Revere Term Loan) under the Revere Term Loan, Revere shall have the right to purchase an aggregate of up to 6,000,000750,000 shares of the Company’s Common Stock for an exercise price equal to $0.0001 per share. The Warrant is exercisable at any time and from time to time during the period starting on April 8, 2016 and expiring on April 30, 2017 at 11:59 p.m., Virginia Beach, Virginia time, solely in the event of an Event of Default under the Revere Term Loan. The Company will not receive any proceeds from the issuance of the Warrant; rather the Warrant serves as collateral for the Revere Term Loan, the proceeds of which were used as partial consideration for the A-C Portfolio. The issuance of the Warrant is exempt from registration pursuant to the exemption provided by Rule 506 of Regulation D under the Securities Act of 1933, as amended based upon the above facts, because Revere is an accredited investor and because the issuance of the Warrant was a private transaction by the Company and did not involve any public offering. The Warrant is treated as embedded equity and separate disclosure is not necessary.
Senior Convertible Notes Amendment
Effective as of April 28, 2016, the Company and certain investors: Calapasas West Partners, L.P.; Full Value Partners, L.P.; Full Value Special Situations Fund, L.P.; MCM Opportunity Partners, L.P.; Mercury Partners, L.P.; Opportunity Partners, L.P.; Special Opportunities Fund, Inc.; and Steady Gain Partners, L.P. (collectively the “Bulldog Investors”) amended the convertible 9% senior notes (“Amended Convertible Notes”) to purchase shares of the Company’s Common Stock. Prior to the amendment, the aggregate principal amount of the Convertible Notes ("Convertible Notes") was $3,000,000.
Pursuant to the terms of the Amended Convertible Notes, upon thirty (30) calendar days’ notice (“Notice”), the Company may prepay any portion of the outstanding Principal Amount and accrued and unpaid interest, if any, without penalty. In addition, upon Notice the Bulldog Investors may now exercise their right to convert all or any portion of the outstanding Principal Amount and any accrued but unpaid interest into shares of Common Stock any time prior to the repayment in full of the Amended Convertible Notes. The maximum number of shares of Common Stock issuable upon conversion of the Amended
Wheeler Real Estate Investment Trust, Inc. and Subsidiaries
Notes to Consolidated Financial Statements (Continued)
7. Loans Payable (continued)
Convertible Notes is 1,417,079 shares. As of December 31, 2016,2017, the Bulldog Investors converted approximately $1.60$1.64 million of principal amount into 1,397,0101,417,079 shares, pre-reverse split of the Company's Common Stock.Stock, the maximum number of shares allowed.
Chesapeake Square Refinance
On July 11, 2016, the Company executed a promissory note for $4.60 million to refinance the Chesapeake Square collateralized portion of the KeyBank Credit Agreement totaling $3.90 million. The new loan matures in August 2026 with monthly principal and interest payments due at an interest rate of 4.70%.
Perimeter Square Refinance
On July 29, 2016, the Company executed a promissory note for $4.50 million to refinance the Perimeter promissory note totaling $4.10 million. The new loan matures in August 2026 with principal due at maturity and bears interest at 4.06%.
Wheeler Real Estate Investment Trust, Inc. and Subsidiaries
Notes to Consolidated Financial Statements (Continued)
7. Loans Payable (continued)
On June 14, 2017, the Company executed a promissory note for $6.25 million to refinance the Perimeter loan totaling $4.50 million. The loan matures December 2018 with monthly interest only payments. Principal is due at maturity. The loan bears interest at 5.50%. As of December 31, 2017, $5.38 million has been borrowed on the note with the remaining $870 thousand available for tenant improvements.
Berkley, Sangaree/Tri-County
On November 10, 2016, the Company executed a promissory note for $9.40 million for the purchase of Berkley, Sangaree/Tri-County. The loan matures in December 2026 with monthly interest only payments due through 2021 at which time monthly principal and interest payments begin. The loan bears interest at 4.78%.
Riverbridge
On November 15, 2016, the Company executed a promissory note for $4.00 million for the purchase of Riverbridge. The loan matures in December 2026 with principal due at maturity and bears interest at 4.48%.
Franklin
On December 12, 2016, the Company executed a promissory note for $8.52 million for the purchase of Franklin. The loan matures in January 2027 with monthly interest only payments due through January 2020 at which time monthly principal and interest payments begin. The loan bears interest at 4.93%.
Lumber River
On December 20, 2016, the Company executed a promissory note for $1.50 million. The new loan matures in June 2018 with interest only payments at a rate of 295 basis points over one month LIBOR through 2017. Principal payments begin in 2018.
Harbor Point Renewal
On December 2, 2016, the Company renewed the promissory note for $0.65 million649 thousand on Harbor Point for two years. The loan matures on December 5, 2018 with monthly principal and interest payments. The loan bears interest at 5.85%.
Rivergate
On December 21, 2016, the Company executed a promissory note for $24.20 million for the purchase of Rivergate. The loan matures in December 2019 with interest only payments at a rate of 295 basis points on one month LIBOR for the first year and principal and interest for the next two years.
CertainWith the sale of the Company’s loans payable have covenants with whichSteak n' Shake outparcel at Rivergate, as discussed in Note 3, a $1.52 million principal payment was made on the Rivergate loan. The balance on the Rivergate loan was $22.69 million at December 31, 2017.
Folly Road Refinance
On March 22, 2017, the Company is requiredexecuted a promissory note for $8.57 million to comply.refinance the Folly Road collateralized portion of the KeyBank Credit Agreement totaling $6.05 million. The loan matures in March 2020 with monthly interest only payments due through April 2018 at which time monthly principal and interest payments begin based on a 25 year amortization. The loan bears interest at 4.00%. As of December 31, 2016,2017, $6.18 million has been borrowed on the note with the remaining $2.39 million available for construction and development.
Columbia Fire House Construction Loan
On May 3, 2017, the Company believes it isexecuted a promissory note for $4.30 million related to construction at Columbia Fire House ("Columbia Fire House Construction Loan") at which time the original Columbia Fire House note ("Columbia Fire House Loan") was paid down to $262 thousand. The loan matures in complianceMay 2020 with all applicable covenants.
monthly interest only payments through November 2018 at which time monthly principal and interest payments begin based on a 20 year amortization. The loan bears
Wheeler Real Estate Investment Trust, Inc. and Subsidiaries
Notes to Consolidated Financial Statements (Continued)
7. Loans Payable (continued)
interest at 4.00%. As of December 31, 2017, $3.42 million has been borrowed on the note with the remaining $879 thousand available for construction and development.
Walnut Hill Plaza Amendment
On July 18, 2017, the Company extended the $3.39 million Walnut Hill Plaza loan maturity to October 31, 2017.
On August 29, 2017, the Company amended the Walnut Hill Plaza promissory note for $3.90 million. The amended loan matures in September 2022 with monthly interest only payments through August 2018 at which time monthly principal and interest payments of $26,850 begin based on a 20 year amortization. The loan bears interest at 5.50%.
Bank Line of Credit
On September 16, 2017, the Company extended the $3.00 million bank line of credit to December 15, 2017. Subsequent to year end the bank line of credit was extended, see Note 13.
Monarch Bank Building
On December 12, 2017, the Company extended the $1.27 million Monarch Bank Building loan to June 2019 with monthly principal and interest payments of $7,340 at a rate of 4.85%.
Columbia Fire Station
On December 21, 2017, the Company paid $262 thousand to satisfy the loan in full.
Loan Covenants
Certain of the Company’s loans payable have covenants with which the Company is required to comply. As of December 31, 2017, the Company has received a waiver through loan maturity for the debt to tangible net worth ratio on the Bank Line of Credit and a waiver of the interest coverage ratio on the Revere Loan as of December 31, 2017 which was adversely impacted by the impairment on note receivable and reserve on related party receivables recognized during fourth quarter 2017. As of December 31, 2017, the Company believes it is in compliance with all other applicable covenants.
Debt Maturity
The Company’s scheduled principal repayments on indebtedness as of December 31, 20162017 are as follows:follows (in thousands):
| | | | For the Years Ended December 31, | For the Years Ended December 31, |
| 2017 | $ | 17,447,169 |
| |
| 2018 | 82,642,065 |
| $ | 39,807 |
|
| 2019 | 26,377,589 |
| 78,576 |
|
| 2020 | 9,089,332 |
| 18,531 |
|
| 2021 | 1,651,389 |
| 1,907 |
|
| 2022 | | 5,534 |
|
| Thereafter | 176,490,345 |
| 169,423 |
|
| Total principal maturities | $ | 313,697,889 |
| |
| Total principal repayments and debt maturities | | $ | 313,778 |
|
The Company has considered our short-term (one year or less) liquidity needs and the adequacy of our estimated cash flows from operating activities and other expected financing sources to meet these needs. In particular, we have considered our scheduled debt maturities and principal payments for the year ended December 31, 2018 of $39.81 million, which includes the $15.53 million maturity of the KeyBank Line of Credit. Management is in 2017the process of $17.45refinancing properties off the KeyBank Line of Credit to reduce the line to under $52.50 million prior to July 1, 2018 in accordance with the Amended and Restated Credit Agreement. Management is in the process of reviewing a term sheet for the refinancing of Revere, Shoppes at Eagle Harbor and Riversedge, approximately $11.11 million. Included in this amountAll loans due to mature are $15.63 million of loans with a 2017 maturity date. Each of these loans is collateralized by properties within our
Wheeler Real Estate Investment Trust, Inc. and Subsidiaries
Notes to Consolidated Financial Statements (Continued)
7. Loans Payable (continued)
portfolio. TheAdditionally, the Company expects to meet thesethe short-term liquidity requirements, including maturing loans, through a combination of the following:
available cash and cash equivalents;
cash flows from operating activities;
borrowings under our revolving credit facility;
refinancing of maturing debtdebt; and
dispositionintended sale of non-core assetsseven undeveloped land parcels and sale of additional properties, if necessary.
The Company expectsManagement is currently working with lenders to completerefinance the sale of the ground leases for Ruby Tuesday’s and Outback Steakhouse at Pierpont Center in the first quarter of 2017 which will provide additional cash flow for liquidity needs. The Company is also currently in the process of refinancing the $15.63 million in maturing loans. These are expected to close in April 2017.loans noted above. The loans are expected to have customary interest rates and loan terms.similar to current loans. They are subject to formal lender commitment, definitive documentation and customary conditions.
Wheeler Real Estate Investment Trust, Inc. and Subsidiaries
Notes to Consolidated Financial Statements (Continued)
8. Rentals under Operating Leases
Future minimum rentalsrents to be received under noncancelable tenant operating leases for each of the next five years and thereafter, excluding CAM and percentage rent based on tenant sales volume, as of December 31, 20162017 are as follows:follows (in thousands):
| | | | For the Years Ended December 31, | For the Years Ended December 31, |
| 2017 | $ | 43,424,296 |
| |
| 2018 | 37,556,763 |
| $ | 41,786 |
|
| 2019 | 30,807,419 |
| 36,626 |
|
| 2020 | 23,595,593 |
| 29,626 |
|
| 2021 | 17,092,466 |
| 22,759 |
|
| 2022 | | 17,828 |
|
| Thereafter | 47,121,556 |
| 47,312 |
|
| Total minimum rents | $ | 199,598,093 |
| $ | 195,937 |
|
9. Equity and Mezzanine Equity
Common Stock One-for-Eight Reverse Stock Split
On February 27, 2017, we announced that our Board of Directors had approved the Reverse Stock Split. The Reverse Stock Split took effect at approximately 5:00 p.m. Eastern Time on March 31, 2017 (the “Effective Time”). At the Effective Time, every eight issued and outstanding shares of Common Stock were converted into one share of Common Stock, and as a result, the number of outstanding shares of Common Stock was reduced from approximately 68,707,755 to approximately 8,588,470. At the Effective Time, the number of authorized shares of Common Stock was also reduced, on a one-for-eight basis, from 150,000,000 to 18,750,000. The par value of each share of Common Stock remained unchanged. No fractional shares were issued in connection with the Reverse Stock Split. Instead, the Company's transfer agent, aggregated all fractional shares that otherwise would have been issued as a result of the Reverse Stock Split and those shares were sold into the market. Shareholders who would otherwise hold a fractional share of the Company's stock received a cash payment from the net proceeds of the sale in lieu of such fractional shares. All share and share-related information presented in this Annual Report on Form 10-K have been retroactively adjusted to reflect the decreased number of shares resulting from the Reverse Stock Split.
The Company has authority to issue 159,000,00033,750,000 shares of stock, consisting of 150,000,00018,750,000 shares of $0.01 par value Common Stock (“Common Stock”), and 15,000,000 shares of preferred stock of which 5,000,000 shares ofhave been classified as no par value Series B Preferred Stock (“Series B Preferred Stock”) and”), 4,000,000 shares ofas Redeemable Preferred Stock ("RedeemableSeries D Preferred") and 4,500 shares of Series A Preferred Stock")Stock ("Series A Preferred). The Company increased the number of shares of Common Stock authorized from 15,000,0001,875,000 to 75,000,0009,375,000 during June 2013, and from 75,000,0009,375,000 to 150,000,00018,750,000 during June 2015.
Substantially all of our business is conducted through the Company’s Operating Partnership. The Trust is the sole general partner of the Operating Partnership and owned a 93.21%94.34% interest in the Operating Partnership as of December 31, 2016.2017. Limited partners in the Operating Partnership have the right to redeem their common units for cash or, at our option, common shares at a ratio of one common unit for one common share. Distributions to common unit holders are paid at the same rate per unit as dividends per share to the Trust’s common shareholders. As of December 31, 20162017 and 2015,2016, there were 89,749,55311,226,868 and 44,018,768,11,218,694, respectively, of common units outstanding with the Trust owning 83,653,91910,591,850 and 39,963,476,10,456,740, respectively, of these common units.
Series A Preferred Stock
On June 10, 2013,At December 31, 2017 and December 31, 2016, the Company completed a $4.5 million private placement transaction with 21 accredited investors (the “Buyers”). Pursuant to the Securities Purchase Agreement, dated as of June 10, 2013 (the “June 2013 Securities Purchase Agreement”), the Company issued an aggregate of 4,500had 562 shares of Series A Preferred Stock, no par value Series A
Preferred issued and outstanding,4,500 authorized and a $1,000 liquidation preference per share, ("Series A Preferred") to the Buyers.or $562 thousand in aggregate. The Series A Preferred accrues cumulative dividends at a rate of 9% per annum, which is paid quarterly. In accordance with the June 2013 Securities Purchase Agreement, 2,691 shares of Series A Preferred converted automatically into 656,998 shares of the Company’s Common Stock upon the August 26, 2013 completion of the Company’s secondary offering (“Secondary Offering”) at a price equal to $4.085 per share, or 95% of the $4.30 per share price at which the Common Stock was sold in the Offering (the “Primary Conversion”).
The Company has the right to redeem the remaining 562 shares of Series A Preferred, on a pro rata basis, at any time at a price equal to 103% of the purchase price for the Series A Preferred plus any accrued but unpaid dividends. Since the Series A Preferred features certain redemption rights that were considered by the Company to be outside of the Company’s control and subject to the occurrence of uncertain future events, the initial Series A Preferred amount of $4,157,000 was previously presented as a liability in the Company’s consolidated balance sheet. Upon completion of the Primary Conversion, the remaining Series A Preferred was reclassified to the shareholders’ equity section of the Company’s consolidated balance sheet, since the Series A Preferred no longer possessed the redemption features previously considered outside the Company’s control.
In connection with the investment, the Company and the Buyers entered into a Registration Rights Agreement, dated as of June 10, 2013 (the “June 2013 Registration Rights Agreement”). Pursuant to the June 2013 Registration Rights Agreement, the Company agreed to file and maintain a registration statement with the Securities and Exchange Commission for the resale of the Common Stock underlying the Series A Preferred acquired by the Buyers. The 656,998 shares were registered on September 23, 2013.
Wheeler Real Estate Investment Trust, Inc. and Subsidiaries
Notes to Consolidated Financial Statements (Continued)
9. Equity (continued)
2014 Series B Preferred Stock Offerings
On April 29, 2014, the Company completed its Series B Convertible Preferred Stock Offering (“Series B Offering”), in which 144,000 units were issued, consisting of 720,000 shares of Series B Convertible Preferred Stock, no par value, $1,000 liquidation preference per share (the "Series B Preferred") and warrants to purchase 864,000 of the Company’s Common Stock. On May 21, 2014, the Company's underwriters exercised their over-allotment option, in which 21,600 units were issued, consisting of 108,000 additional shares of Series B Preferred, and an additional 129,600 warrants. The Series B Preferred bears interest at a rate of 9% per annum and has a conversion price of $5.00 per share of Common Stock. The Series B Preferred will automatically convert into shares of the Company’s Common Stock if the 20-day volume weighted adjusted closing price of the Company's Common Stock exceeds $7.25 per share on the NASDAQ Capital Market. Each warrant permits investors to purchase one share of Common Stock at an exercise price of $5.50 per share, subject to adjustment. Net proceeds from the Series B Offering totaled $18.67 million, which included the impact of the underwriters' selling commissions and legal, accounting and other professional fees. Proceeds from the Series B Offering were used for acquisitions and for general corporate purposes.
On September 17, 2014, the Company completed a follow-on Series B Preferred Offering ("Follow-on Offering"), in which 144,000 units were issued, consisting of 720,000 shares of Series B Preferred and warrants to purchase 864,000 shares of the Company's Common Stock. On September 23, 2014, the Company's underwriters exercised their over-allotment option, in which 20,200 units were issued, consisting of 101,000 additional shares of Series B Preferred, and an additional 129,000 warrants. Net proceeds from the Follow-on Offering totaled $18.57 million, which included the impact of the underwriters' selling commissions and legal, accounting and other professional fees. Proceeds from the Follow-on Offering were used for acquisitions and for general corporate purposes.
On April 24, 2014, in contemplation of the Series B Offering, the Company increased the number of preferred shares authorized from 500,000 to 5,000,000, and authorized 1,000,000 shares of Series B Preferred for the Offering. On August 19, 2014, the number of Series B Preferred authorized was increased from 1,000,000 to 3,000,000 in contemplation of the Follow-on Offering.
Series C Preferred Stock Offering
On March 19, 2015, the Company entered into securities purchase agreements dated as of March 19, 2015 (the “Securities Purchase Agreements”), with certain accredited investors (the “Investors”), pursuant to which, among other things, the Company sold an aggregate of 93,000 shares of Series C Mandatorily Convertible Cumulative Perpetual Preferred Stock, liquidation value $1,000 per share (the “Series C Preferred Stock”Preferred”), in a private placement (the “Private Placement”) to the Investors in exchange for aggregate consideration of $93.00 million, consisting of $90.00 million in cash and the exchange of $3.00 million in senior convertible debt. Each share of Series C Preferred Stock was sold to the Investors at an offering price of $1,000 per share. Net proceeds from the Private Placement totaled $83.42 million, which included the impact of the underwriters' selling commissions and legal, accounting and other professional fees. The Company is using the net offering proceeds to acquire properties and for general working capital.
From March 19, 2015 until June 11, 2015, the holders of Series C Preferred Stock were entitled to receive, when, and if authorized by the Company’s Board of Directors and declared by the Company out of legally available funds, a dividend, on an as converted basis, that mirrors any dividend payable on shares of Common Stock and also were entitled to share in any other distribution made on the Common Stock on an as converted basis (other than dividends or other distributions payable in Common Stock). Any dividends or other distributions on the Series C Preferred Stock during this time period were to be paid, on an as converted basis, pro rata from the date of issuance.
The Series C Preferred Stock was automatically converted into shares of Common Stock on June 11, 2015, which was the fifth business day following the June 4, 2015 approval by the requisite holders of the Common Stock of the conversion of the Series C Preferred Stock into Common Stock and the issuance of Common Stock upon such conversion. Each share of Series C Preferred Stock converted into 50062.5 shares of Common Stock at the conversion price of $2.00$16.00 per share. The conversion of the Series C Preferred Stock into Common Stock at this rate was considered to be a beneficial conversion feature, resulting in a deemed distribution of $59.52 million, which is included in the consolidated statement of equity and also in the consolidated statement of cash flows as a non-cash transaction.
Wheeler Real Estate Investment Trust, Inc. and Subsidiaries
Notes to Consolidated Financial Statements (Continued)
9. Equity (continued)
Series A and Series B Preferred Stock Exchange Offer
On June 15, 2015, the Company entered into an exchange offer (the “Exchange Offer”) to holders of its Series A Preferred and Series B Preferred. The Exchange Offer permitted tendering shareholders to exchange their shares of Series A Preferred or Series B Preferred for an aggregate of up to 20,853,2502,606,656 of newly issued shares of the Company’s Common Stock.
Each share of Series A Preferred was exchangeable for 50062.5 shares of Common Stock, and each share of the Series B Preferred Stock was exchangeable for 12.51.5625 shares of Common Stock. On July 20, 2015, the Company completed the Exchange Offer, under which 1,247 shares of Series A Preferred and 865,481 shares of Series B Preferred were tendered for 11,442,0021,430,250 newly issued shares of the Company's Common Stock. The Company paid cash in lieu of any fractional shares of Common Stock upon the exchange of the Series A Preferred and Series B Preferred. The Exchange Offer was considered to be a beneficial conversion feature, resulting in a deemed distribution of $13.12 million, which is included in the consolidated statement of equity and also in the consolidated statement of cash flows as a non-cash transaction.
2015 Long-Term Incentive Plan
On June 4, 2015, the Company's shareholders approved the 2015 Long-Term Incentive Plan (the "2015 Incentive Plan"). The 2015 Incentive Plan allows for issuance of up to 1,000,000 shares of the Company's Common Stock to employees, directors, officers and consultants for services rendered to the Company. The 2015 Incentive Plan replaced the 2012 Stock Incentive Plan ("Stock Incentive Plan").
Equity Issuances under Stock Incentive Plan and 2015 Incentive Plan
During the year ended December 31, 2016, the Company issued 336,557 shares to employees, directors, officers and consultants for services rendered to the Company. The market value of these shares at the time of issuance was approximately $578 thousand. As of December 31, 2016, there are 420,551 shares available for issuance under the Company’s 2015 Incentive Plan.
During the year ended December 31, 2015, the Company issued 320,152 shares to employees, directors, officers and consultants for services rendered to the Company. 77,260 of these shares were issued under the Stock Incentive Plan, and 242,892 of these shares were issues under the 2015 Incentive Plan. The market value of these shares at the time of issuance was approximately $697 thousand.
During the year ended December 31, 2014, the Company issued 105,834 shares to employees, directors, officers and consultants under the Stock Incentive Plan for services rendered to the Company. The market value of these shares at the time of issuance was approximately $457 thousand.
2016 Long-Term Incentive Plan
On June 15, 2016, the Company's shareholders approved the 2016 Long-Term Incentive Plan (the "2016 Incentive Plan"). The 2016 Incentive Plan allows for issuance of up to 5,000,000 shares of the Company's Common Stock to employees, directors, officers and consultants for services rendered to the Company. During the year ended December 31, 2016, the Company issued 36,809 shares to employees, directors, officers and consultants for services rendered to the Company. The market value of these shares at the time of issuance was approximately $60 thousand. As of December 31, 2016, there are 4,963,191 shares available for issuance under the Company’s 2016 Incentive Plan.
2016 Series B Preferred Stock Offering
On July 7, 2016 the Company filed a shelf registration statement relating to the potential issuance of up to $50.00 million of our Series B Preferred Stock.Preferred. On July 21, 2016, the Company entered into an Equity Distribution Agreement (the "Equity Distribution Agreement") with a third party agent to sell such securities. As of December 31, 2016,2017, the Company has issued 1,142,2251,146,829 shares of Series B Preferred, Stock1,142,225 in 2016 and 4,604 in 2017, pursuant to the Equity Distribution Agreement in addition to the 729,119
Wheeler Real Estate Investment Trust, Inc. and Subsidiaries
Notes to Consolidated Financial Statements (Continued)
9. Equity (continued)
shares that were currently issued and outstanding. The Series B Preferred Stock has no redemption rights. However, the Series B Preferred Stock is subject to a mandatory conversion once the 20-trading day volume-weighted average closing price of our Common Stock, $0.01 par value per share, exceeds $7.25$58 per share; once this weighted average closing price is met, each share of our Series B Preferred Stock will automatically convert into shares of our Common Stock at a conversion price equal to $5.00$40.00 per share. In addition, holders of our Series B Preferred Stock also have the option, at any time, to convert shares of our Series B Preferred Stock into shares of our Common Stock at a conversion price of $5.00$40.00 per share of Common Stock. Upon any voluntary or involuntary liquidation, dissolution or winding up of our company, the holders of shares of our Series B Preferred Stock shall be entitled to be paid out of our assets a liquidation preference of $25.00 per share, plus an amount equal to all accumulated, accrued and unpaid dividends to and including the date of payment. The Series Preferred B Stock has no maturity date and will remain outstanding indefinitely unless subject to a mandatory or voluntary conversion as described above.
Wheeler Real Estate Investment Trust, Inc. and Subsidiaries
Notes to Consolidated Financial Statements (Continued)
9. Equity (continued)
Net proceeds from the Series B Preferred Stock offering totaled $96 thousand and $23.40 million which includes the impact of the underwriters’ selling concessions and legal, accounting and other professional fees.fees for years ended December 31, 2017 and 2016, respectively.
In conjunction with the 2014 issuances of Series B Preferred 1,986,600 warrants were issued. Each warrant permits investors to purchase 0.125 share of Common Stock at an exercise price of $44 per share of Common Stock, subject to adjustment. The warrants expire in April 2019.
At December 31, 2017 and December 31, 2016, the Company had 1,875,848 and 1,871,244 shares, respectively, and
5,000,000 shares of no par value Series B Preferred issued and authorized with a $25.00 liquidation preference per share, or $46.90 million and $46.78 million in aggregate, respectively. The Series B Preferred bears interest at a rate of 9% per annum.
Series D Preferred Stock Offering-Stock- Redeemable Preferred Stock
In 2016, the Company issued and sold 2,237,000 shares of Series D Preferred, Stock, liquidation value $25.00 per share, (the “Series D Preferred Stock”), in a combination of two public offerings. In September 2016, 1,600,000 shares of Series D Preferred Stock were sold to investors at an offering price of $25.00 per share. In December 2016, 637,000 shares of Series D Preferred Stock were sold to investors at an offering price of $24.00 per share. Until September 21, 2023, the holders of the Series D Preferred Stock are entitled to receive cumulative cash dividends at a rate of 8.75% per annum of the $25.00 liquidation preference per share (equivalent to the fixed annual amount of $2.1875 per share) (the “Initial Rate”). Commencing September 21, 2023, the holder’s will be entitled to cumulative cash dividends at an annual dividend rate of the Initial Rate increased by 2% of the liquidation preference per annum on each subsequent anniversary thereafter, subject to a maximum annual dividend rate of 14%. Dividends are payable quarterly in arrears on or before January 15th, April 15th, July 15th and October 15th of each year. On or after September 21, 2021, the Company, may at its option, redeem the Series D Preferred, Stock, for cash at a redemption price of $25.00 per share, plus an amount equal to all accrued and unpaid dividends, if any, to and including the redemption date. The holder of the Series D Preferred Stock may convert shares at any time into shares of the Company’s Common Stock at an initial conversion rate of $2.12$16.96 per share of Common Stock. On September 21, 2023, the holders of the Series D Preferred Stock may, at their option, elect to cause the Company to redeem any or all of their shares at a redemption price of $25.00 per share, plus an amount equal to all accrued and unpaid dividends, if any, to and including the redemption date, payable in cash or in shares of Common Stock, or any combination thereof, at the holder’s option.
The Series D Preferred Stock requires the Company maintain asset coverage of at least 200%. If we fail to maintain asset coverage of at least 200% calculated by determining the percentage value of (i) our total assets plus accumulated depreciation minus our total liabilities and indebtedness as reported in our financial statements prepared in accordance with accounting principles generally accepted in the United States (“GAAP”) (exclusive of the book value of any Redeemable and Term Preferred Stock (defined below)) over (ii) the aggregate liquidation preference, plus an amount equal to all accrued and unpaid dividends, of outstanding shares of our Series D Preferred Stock and any outstanding shares of term preferred stock or preferred stock providing for a fixed mandatory redemption date or maturity date (collectively referred to as “Redeemable and Term Preferred Stock”) on the last business day of any calendar quarter (“Asset Coverage Ratio”), and such failure is not cured by the close of business on the date that is 30 calendar days following the filing date of our Annual Report on Form 10-K or Quarterly Report on Form 10-Q, as applicable, for that quarter, or the “Asset Coverage Cure Date,” then we will be required to redeem, within 90 calendar days of the Asset Coverage Cure Date, shares of Redeemable and Term Preferred Stock, which may include Series D Preferred Stock, at least equal to the lesser of (i) the minimum number of shares of Redeemable and Term Preferred Stock that will result in us having a coverage ratio of at least 200% and (ii) the maximum number of shares of Redeemable and Term Preferred Stock that can be redeemed solely out of funds legally available for such redemption. In connection with any redemption for failure to maintain the Asset Coverage Ratio, we may, in our sole option, redeem any shares of Redeemable and Term Preferred Stock we select, including on a non-pro rata basis. We may elect not to redeem any Series D Preferred Stock to cure such failure as long as we cure our failure to meet the Asset Coverage Ratio by or on the Asset Coverage Cure Date. If shares of Series D Preferred Stock are to be redeemed for failure to maintain the Asset Coverage Ratio, such shares will be redeemed solely in cash at a redemption price equal to $25.00 per share plus an amount equal to all accrued but unpaid dividends, if any, on such shares (whether or not declared) to and including the redemption date.
Net proceeds from the public offering totaled $52.4 million, which includes the impact of the underwriters' selling commissions and legal, accounting and other professional fees.
Wheeler Real Estate Investment Trust, Inc. and Subsidiaries
Notes to Consolidated Financial Statements (Continued)
9. Equity (continued)
At December 31, 2017 and December 31, 2016, the Company had 2,237,000 issued and 4,000,000 authorized shares of no par value Series D Preferred with a $25.00 liquidation preference per share, or $55.93 million in aggregate. Accretion of Series D Preferred Stock discount was $0.2 million$723 thousand, $0 thousand and $0 thousand for the yearyears ended December 31, 2016.2017, 2016 and 2015, respectively.
Earnings per share
Basic earnings per share for the Company’s common shareholders is calculated by dividing income (loss) from continuing operations, excluding amounts attributable to preferred stockholders and the net loss attributable to noncontrolling interests, by the Company’s weighted-average numbershares of Common Stock outstanding during the period. Diluted earnings per share is computed by dividing the net income (loss) attributable to common shareholders, excluding amounts attributable to preferred shareholders and the net lossincome (loss) attributable to noncontrolling interests, by the weighted-average number of common shares including any dilutive shares.
As of December 31, 2017, 2016 and 2015, and 2014, 4,055,292, 3,354,883 and 1,787,798, respectively, of the Operating Partnership’s common units outstanding to noncontrolling interests were eligiblebelow shares are able to be converted into shares of Common Stock on a one-to-one basis. Additionally, as of December 31, 2016, 2015 and 2014, 1,871,244, 729,119 and 1,648,900 shares of Series B Preferred, respectively, and 2,237,000, 0 and 0 shares of Series D Preferred Stock, respectively, and $1.40 million, $3.00 million and $6.00 million of senior convertible debt, respectively, are eligible to be converted into 35,756,006, 5,062,674 and 9,661,579 shares, respectively, of the Company's Common Stock. Also,The common units, convertible preferred stock, cumulative convertible preferred stock, and warrants to purchase 2,635,025 shares ofhave been excluded from the Company's Common Stock were outstanding at December 31, 2016, 2015 and 2014.Company’s diluted earnings per share calculation because their inclusion would be antidilutive. In addition 6,000,000to the below, 750,000 shares of the Company's Common Stock may be issued upon exercise of a warrant, solely in the event of a default under a loan agreement in which we serve as a guarantor. The
|
| | | | | | | | | | | | | | | | | |
| | December 31, 2017 | | December 31, 2016 | | December 31, 2015 |
| | Outstanding shares | | Potential Dilutive Shares | | Outstanding shares | | Potential Dilutive Shares | | Outstanding shares | | Potential Dilutive Shares |
| | | | | | |
| Common units | 635,018 |
| | 635,018 |
| | 761,954 |
| | 506,911 |
| | 506,911 |
| | 419,360 |
|
| Series B Preferred Stock | 1,875,848 |
| | 1,172,405 |
| | 1,871,244 |
| | 1,169,528 |
| | 729,119 |
| | 455,699 |
|
| Series D Preferred Stock | 2,237,000 |
| | 3,297,465 |
| | 2,237,000 |
| | 3,297,465 |
| | — |
| | — |
|
| Warrants to purchase Common Stock | | | 329,378 |
| | | | 329,378 |
| | | | 329,453 |
|
| Senior Convertible Notes | | | | | 2,509 |
| | 2,509 |
| | 177,135 |
| | 177,135 |
|
Dividends
Dividends were made to holders of common units, convertible Preferred Stock, cumulative convertible Preferred Stock, seniorcommon shares and preferred shares as follows (in thousands):
|
| | | | | | | | | | | | |
| | | Years Ended December 31, |
| | | 2017 | | 2016 | | 2015 |
| Common unit and common shareholders | | $ | 13,477 |
| | $ | 15,328 |
| | $ | 9,786 |
|
| Preferred shareholders | | 9,969 |
| | 4,713 |
| | 13,628 |
|
| Total | | $ | 23,446 |
| | $ | 20,041 |
| | $ | 23,414 |
|
On December 14, 2017, the Company declared a quarterly $0.34 per share dividend payable on or about January 15, 2018 to common shareholders and unit holders of record as of December 28, 2017. Accordingly, the Company has accrued $3.19 million as of December 31, 2017 for this dividend.
During the three months ended December 31, 2017, the Company declared quarterly dividends of $2.29 million to preferred shareholders of record as of December 30, 2017 to be paid on January 15, 2018. Accordingly, the Company has accrued $2.29 million as of December 31, 2017 for this dividend.
Wheeler Real Estate Investment Trust, Inc. and Subsidiaries
Notes to Consolidated Financial Statements (Continued)
9. Equity (continued)
convertible debt and warrants have been excluded from the Company’s diluted earnings per share calculation because their inclusion would be antidilutive.
Dividends2015 Long-Term Incentive Plan
Dividends were madeOn June 4, 2015, the Company's shareholders approved the 2015 Long-Term Incentive Plan (the "2015 Incentive Plan"). The 2015 Incentive Plan allows for issuance of up to holders125,000 shares of common units, common sharesthe Company's Common Stock to employees, directors, officers and preferred shares as follows:consultants for services rendered to the Company. The 2015 Incentive Plan replaced the 2012 Stock Incentive Plan ("Stock Incentive Plan").
|
| | | | | | | | | | | | |
| | | Years Ended December 31, |
| | | 2016 | | 2015 | | 2014 |
| Common unit and common shareholders | | $ | 15,328,096 |
| | $ | 9,787,145 |
| | $ | 4,089,057 |
|
| Preferred shareholders | | 4,713,169 |
| | 13,627,532 |
| | 2,718,257 |
|
| Total | | $ | 20,041,265 |
| | $ | 23,414,677 |
| | $ | 6,807,314 |
|
OnDuring the year ended December 20, 2016,31, 2017, the Company declared a $0.0175 per share dividendissued 11,465 shares to common share and common unit holdersemployees for services rendered to the Company. The market value of record asthese shares at the time of December 30, 2016 to be paid on January 31, 2017. Accordingly, the Company has accrued $1.30 million asissuance was approximately $155 thousand. As of December 31, 20162017, there are 41,104 shares available for this dividend.issuance under the Company’s 2015 Incentive Plan.
During the three monthsyear ended December 31, 2016, the Company declared quarterly dividendsissued 42,069 shares to preferred shareholdersemployees, directors, officers and consultants for services rendered to the Company. The market value of $2.29 million to shareholdersthese shares at the time of record as ofissuance was approximately $578 thousand.
During the year ended December 30, 2016 to be paid on January 15, 2017. Accordingly,31, 2015, the Company has accrued $2.29 million asissued 40,019 shares to employees, directors, officers and consultants for services rendered to the Company. 9,658 of these shares were issued under the Stock Incentive Plan, and 30,362 of these shares were issues under the 2015 Incentive Plan. The market value of these shares at the time of issuance was approximately $697 thousand.
2016 Long-Term Incentive Plan
On June 15, 2016, the Company's shareholders approved the 2016 Long-Term Incentive Plan (the "2016 Incentive Plan"). The 2016 Incentive Plan allows for issuance of up to 625,000 shares of the Company's Common Stock to employees, directors, officers and consultants for services rendered to the Company.
During the year ended December 31, 2017, the Company issued 99,527 shares to directors and consultants for services rendered to the Company. The market value of these shares at the time of issuance was approximately $1.26 million. As of December 31, 2017, there are 520,872 shares available for issuance under the Company’s 2016 for this dividend.Incentive Plan.
During the year ended December 31, 2016, the Company issued 4,601 shares to employees, directors, officers and consultants for services rendered to the Company. The market value of these shares at the time of issuance was approximately $60 thousand.
Wheeler Real Estate Investment Trust, Inc. and Subsidiaries
Notes to Consolidated Financial Statements (Continued)
10. Commitments and Contingencies
Lease Commitments
As of December 31, 2016, the Amscot property isThe following properties are subject to a ground leaseleases which terminates in 2045. The ground lease requires the Company to make a fixed annual rental payment and includes escalation clauses and renewal options. The Company incurred ground lease expense included in property operations expense of $18 thousand, $18 thousand and $18 thousand during the years ended December 31, 2016, 2015 and 2014, respectively.options as follows (in thousands):
As of December 31, 2016, the Beaver Ruin Village property is subject to a ground lease which terminates in 2054. The ground lease requires the Company to make a fixed annual rental payment and includes escalation clauses and renewal options. The Company incurred ground lease expense included in property operations expense of $46 thousand, $23 thousand and $0 during the years ended December 31, 2016, 2015 and 2014, respectively.
As of December 31, 2016, the Beaver Ruin Village II property is subject to a ground lease which terminates in 2056. The ground lease requires the Company to make a fixed annual rental payment and includes escalation clauses and renewal options. The Company incurred ground lease expense included in property operations expense of $18 thousand, $9 thousand and $0 during the years ended December 31, 2016, 2015 and 2014, respectively.
As of December 31, 2016, the Company leases office space in Charleston, South Carolina, subject to a lease that terminates in 2019. The lease requires the Company to make a fixed annual rental payment and includes escalation clauses and renewal options. The Company incurred lease expense included in corporate general and administrative expenses of $92 thousand, $118 thousand and $30 thousand during the years ended December 31, 2016, 2015 and 2014, respectively.
As of December 31, 2016, the Moncks Corner property is subject to a ground lease which terminates in 2040. The ground lease requires the Company to make a fixed annual rental payment and includes escalation clauses and renewal options. The Company incurred ground lease expense included in property operations expense of $87 thousand, $0 and $0 during the years ended December 31, 2016, 2015 and 2014, respectively.
As of December 31, 2016, the Devine Street property is subject to a ground lease which terminates in 2035. The ground lease requires the Company to make a fixed annual rental payment and includes escalation clauses and renewal options. The Company incurred ground lease expense included in property operations expense of $180 thousand, $0 and $0 during the years ended December 31, 2016, 2015 and 2014, respectively. |
| | | | | | | | | | | | | |
| | For the Years Ended December 31, | | Expiration Year |
| | 2017 | | 2016 | | 2015 | | |
| Amscot | $ | 18 |
| | $ | 18 |
| | $ | 18 |
| | 2045 |
| Beaver Ruin Village | 46 |
| | 46 |
| | 23 |
| | 2054 |
| Beaver Ruin Village II | 19 |
| | 18 |
| | 9 |
| | 2056 |
| Leased office space Charleston, SC | 100 |
| | 92 |
| | 118 |
| | 2019 |
| Moncks Corner | 121 |
| | 87 |
| | — |
| | 2040 |
| Devine Street | 251 |
| | 180 |
| | — |
| | 2035 |
| Total Ground Leases | $ | 555 |
| | $ | 441 |
| | $ | 168 |
| | |
Future minimum lease payments due under the operating leases, including applicable automatic extension options, are as follows (unaudited)(unaudited, in thousands):
| | | | For the Years Ended December 31, | For the Years Ended December 31, |
| 2017 | $ | 520,199 |
| |
| 2018 | 524,142 |
| $ | 530 |
|
| 2019 | 492,632 |
| 499 |
|
| 2020 | 426,805 |
| 433 |
|
| 2021 | 478,788 |
| 485 |
|
| 2022 | | 488 |
|
| Thereafter | 10,010,953 |
| 9,666 |
|
| | $ | 12,453,519 |
| |
| Total minimum lease payments | | $ | 12,101 |
|
Insurance
The Company carries comprehensive liability, fire, extended coverage, business interruption and rental loss insurance covering all of the properties in its portfolio under a blanket insurance policy, in addition to other coverages, such as trademark and pollution coverage that may be appropriate for certain of its properties. Additionally, the Company carries a directors’, officers’, entity and employment practices liability insurance policy that covers such claims made against the Company and its
Wheeler Real Estate Investment Trust, Inc. and Subsidiaries
Notes to Consolidated Financial Statements (Continued)
directors and officers. The Company believes the policy specifications and insured limits are appropriate and adequate for its properties given the relative risk of loss, the cost of the coverage and industry practice; however, its insurance coverage may not be sufficient to fully cover its losses.
Concentration of Credit Risk
The Company is subject to risks incidental to the ownership and operation of commercial real estate. These risks include, among others, the risks normally associated with changes in the general economic climate, trends in the retail industry, creditworthiness of tenants, competition for tenants and customers, changes in tax laws, interest rates, the availability of financing and potential liability under environmental and other laws.
The Company’s portfolio of properties is dependent upon regional and local economic conditions and is geographically concentrated in the Northeast, Mid-Atlantic, Southeast and Southwest, which markets represented approximately 4%, 23%, 71%72% and 2%1%, respectively, of the total annualized base rent of the properties in its portfolio as of December 31, 2016.2017. The Company’s geographic concentration may cause it to be more susceptible to adverse developments in those markets than if it owned a more geographically diverse portfolio. Additionally, the Company’s retail shopping center
Wheeler Real Estate Investment Trust, Inc. and Subsidiaries
Notes to Consolidated Financial Statements (Continued)
10. Commitments and Contingencies (continued)
properties depend on anchor stores or major tenants to attract shoppers and could be adversely affected by the loss of, or a store closure by, one or more of these tenants.
Regulatory and Environmental
As the owner of the buildings on our properties, the Company could face liability for the presence of hazardous materials (e.g., asbestos or lead) or other adverse conditions (e.g., poor indoor air quality) in its buildings. Environmental laws govern the presence, maintenance, and removal of hazardous materials in buildings, and if the Company does not comply with such laws, it could face fines for such noncompliance. Also, the Company could be liable to third parties (e.g., occupants of the buildings) for damages related to exposure to hazardous materials or adverse conditions in its buildings, and the Company could incur material expenses with respect to abatement or remediation of hazardous materials or other adverse conditions in its buildings. In addition, some of the Company’s tenants routinely handle and use hazardous or regulated substances and wastes as part of their operations at our properties, which are subject to regulation. Such environmental and health and safety laws and regulations could subject the Company or its tenants to liability resulting from these activities. Environmental liabilities could affect a tenant’s ability to make rental payments to the Company, and changes in laws could increase the potential liability for noncompliance. This may result in significant unanticipated expenditures or may otherwise materially and adversely affect the Company’s operations. The Company is not aware of any material contingent liabilities, regulatory matters or environmental matters that may exist.
Litigation
The Company is involved in various legal proceedings arising in the ordinary course of its business, including, but not limited to commercial disputes. The Company believes that such litigation, claims and administrative proceedings will not have a material adverse impact on its financial position or its results of operations. The Company records a liability when it considers the loss probable and the amount can be reasonably estimated.
11. Related Party Transactions
Prior to the October 24, 2014 acquisition, the Operating Companies and their affiliated companies provided administrative services to the Company, including management, administrative, accounting, marketing, development and design services. Pursuant to the terms of the Company’s administrative services agreement with WM, responsibilities included administering the Company’s day-to-day business operations, identifying and acquiring targeted real estate investments, overseeing the management of the investments, and handling the disposition of the real estate investments. The Company benefits from Mr. Wheeler's affiliates that specialize in other real estate investment activities, including (i) Wheeler Capital, LLC, a capital investment firm specializing in venture capital, financing, and small business loans, (ii) Wheeler Construction, LLC, a construction management company and (iii) TESR, LLC, a tenant relations company, serving as a liaison between property management, lease administration and leasing and working to provide information on the health and fiscal viability of each tenant.
Wheeler Real Estate Investment Trust, Inc. and Subsidiaries
Notes to Consolidated Financial Statements (Continued)
Prior to being acquired in October 2014, WI leased the Company’s Riversedge property under a 10-year operating lease expiring in November 2017, with four five year renewal options available. The lease required monthly base rent payments of $24,000 and provided for annual increases throughout the term of the lease and subsequent option periods. Additionally, WI reimbursed the Company for a portion of the property’s operating expenses and real estate taxes.
The following summarizes related party activity as of and for the years ended December 31, 2017, 2016 2015 and 2014.2015. The amounts disclosed below reflect the activity between the Company and Mr. Wheeler's affiliates and the Operating Companies through the date of acquisition. All amounts subsequent to the acquisition date have been eliminated in consolidation.(in thousands).
| | | | December 31, | December 31, |
| | 2016 | | 2015 | | 2014 | 2017 | | 2016 | | 2015 |
| Amounts paid to affiliates | $ | 125,320 |
| | $ | 986,495 |
| | $ | 4,011,138 |
| $ | 48 |
| | $ | 125 |
| | $ | 986 |
|
| Amounts received from affiliates | $ | 1,156,461 |
| | $ | 777,218 |
| | $ | 120,746 |
| $ | 2,517 |
| | $ | 1,347 |
| | $ | 777 |
|
| Amounts due from affiliates | $ | 1,456,131 |
| | $ | 481,298 |
| | $ | 463,281 |
| $ | — |
| | $ | 1,456 |
| | $ | 481 |
|
| Notes receivable | $ | 12,000,000 |
| | $ | — |
| | $ | — |
| $ | 6,739 |
| | $ | 12,000 |
| | $ | — |
|
As discussed in Note 4, the Company has loaned $11.00 million for the partial funding of Pineland Station Shopping Center in Hilton Head, South Carolina to be known in the future as Sea Turtle Development and loaned $1.00 million for the sale of land to be used in the development. The Company has recognized a $5.26 million impairment charge on the note receivable as discussed in greater detail in Note 4. The impairment charge is performingpresented as “impairment of notes receivable” on the consolidated statements of operations. Subsequent to December 31, 2017, the Company's agreement to perform development, leasing, property and asset management services for Sea Turtle Development. Development was terminated. Prior to the termination of the agreements, development fees of 5% of hard costs incurred arewere paid to the Company. Leasing, property and asset management fees arewere consistent with those charged for services provided to non-related properties.
Wheeler Real Estate Investment Trust, Inc. and Subsidiaries
Notes to Consolidated Financial Statements (Continued)
The Company has reserved $2.36 million in amounts due from affiliates at December 31, 2017, as follows:
|
| | | |
| Sea Turtle Development | |
| Accrued interest on note receivable - due at maturity | $ | 895 |
|
| Accrued interest on note receivable - currently due | 443 |
|
| Leasing Commissions | 190 |
|
| Development fees | 182 |
|
| Other | 18 |
|
| Other non-REIT Properties | 636 |
|
| | $ | 2,364 |
|
Of the gross $833 thousand currently due from Sea Turtle Development $323 thousand was earned during the three months ended December 31, 2017. Amounts due from affiliatesSea Turtle Development are reserved due to uncertainty surrounding the collectability given current cash flow models. Cash flow models on the project include development costs to date, anticipated cost to complete, executed leases, and financing available to complete and stabilize the project. Capitalization rates utilized in these models are based upon rates that the Company believes to be within a reasonable range of current market rates for the respective project.
Amounts due from other non-REIT properties have been reserved based on available cash flows at the respective properties and payment history. The reserve is included in “provision for credit losses” on the consolidated statements of operations. Subsequent to December 31, 2017, the management agreements for these properties have or are in the process of being terminated.
At December 31, 2016, $657 thousand in accrued interest on the notes receivable andwas included in amounts due from affiliates, of this $415 thousand was due at maturity. Amounts due from affiliates also include $166 thousand in development fees at December 31, 2016. These amounts are included in "related party receivables, net" on the consolidated balance sheets.
In 2016, in connection with the acquisition of Berkley and Sangaree/Tri-County, the Operating Partnership entered into a tax protection agreement that obligates the Operating Partnership to reimburse Jon Wheeler, the Company's former CEO, for his tax liabilities resulting from the recognition of certain taxable income or gain in the event the Operating Partnership takes certain action prior to November 10, 2023 with respect to Sangaree Plaza, Tri-County Plaza and Berkley.
Wheeler Real Estate Investment Trust, Inc. and Subsidiaries
Notes to Consolidated Financial Statements (Continued)
12. Selected Quarterly Financial Data (Unaudited)
The following tables summarize certain selected quarterly financial data for 2017 and 2016 and 2015:(in thousands, except per share data):
| | | | 2016 Quarters | 2017 Quarters |
| | First | | Second | | Third | | Fourth | First | | Second | | Third | | Fourth |
Total Revenues (1) | $ | 9,137,524 |
| | $ | 11,084,373 |
| | $ | 11,910,678 |
| | 12,027,833 |
| |
Operating Income (Loss) (1) | (1,163,630 | ) | | (14,371 | ) | | 1,667,119 |
| | (780,254 | ) | |
| Total Revenues | | $ | 14,322 |
| | $ | 14,719 |
| | $ | 15,198 |
| | 14,296 |
|
| Operating Income (Loss) | | 1,173 |
| | 2,542 |
| | 1,779 |
| | (4,952 | ) |
| Net loss from continuing operations | (3,582,307 | ) | | (3,755,583 | ) | | (1,673,056 | ) | | (4,051,828 | ) | (2,689 | ) | | (715 | ) | | (2,173 | ) | | (8,719 | ) |
| Net income from discontinued operations | 20,525 |
| | 743,843 |
| | 39,919 |
| | 20,461 |
| |
| Net income (loss) from discontinued operations | | 1,529 |
| | (11 | ) | | — |
| | — |
|
| Net loss attributable to Wheeler REIT common shareholders | (3,740,206 | ) | | (3,210,128 | ) | | (2,752,056 | ) | | (6,213,349 | ) | (3,602 | ) | | (3,207 | ) | | (4,558 | ) | | (10,696 | ) |
| Loss per share from continuing operations (basic and diluted) | (0.06 | ) | | (0.06 | ) | | (0.04 | ) | | (0.09 | ) | (0.59 | ) | | (0.37 | ) | | (0.52 | ) | | (1.22 | ) |
| Income per share from discontinued operations | 0.00 |
| | 0.01 |
| | 0.00 |
| | 0.00 |
| 0.17 |
| | — |
| | — |
| | — |
|
| | | | | | | | | | | | | | | |
| | 2015 Quarters | 2016 Quarters |
| | First | | Second | | Third | | Fourth | First | | Second | | Third | | Fourth |
| Total Revenues | $ | 5,142,686 |
| | $ | 6,009,626 |
| | $ | 7,229,546 |
| | $ | 9,233,600 |
| $ | 9,138 |
| | $ | 11,084 |
| | $ | 11,911 |
| | $ | 12,027 |
|
| Operating Loss | (2,137,903 | ) | | (3,472,719 | ) | | (5,077,581 | ) | | (1,764,080 | ) | |
| Operating Income (Loss) | | (1,164 | ) | | (13 | ) | | 1,666 |
| | (780 | ) |
| Net loss from continuing operations | (4,269,556 | ) | | (5,379,720 | ) | | (7,375,650 | ) | | (4,352,371 | ) | (3,583 | ) | | (3,754 | ) | | (1,674 | ) | | (4,051 | ) |
| Net income from discontinued operations | 46,367 |
| | 84,482 |
| | 217,234 |
| | 2,255,812 |
| 21 |
| | 743 |
| | 40 |
| | 20 |
|
| Net loss attributable to Wheeler REIT common shareholders | (6,263,036 | ) | | (72,709,124 | ) | | (22,134,127 | ) | | (2,686,430 | ) | (3,740 | ) | | (3,210 | ) | | (2,752 | ) | | (6,214 | ) |
| Loss per share from continuing operations (basic and diluted) | (0.81 | ) | | (4.13 | ) | | (0.35 | ) | | (0.07 | ) | |
| Income per share from discontinued operations | 0.01 |
| | 0.00 |
| | 0.00 |
| | 0.03 |
| |
Loss per share from continuing operations (basic and diluted) (1) | | (0.45 | ) | | (0.46 | ) | | (0.32 | ) | | (0.73 | ) |
Income per share from discontinued operations (1) | | — |
| | 0.08 |
| | — |
| | — |
|
(1) Adjusted the previously reported amounts for first and second quarter 2016 and all four quarters in 20152016 for interest incomeReverse Stock Split to be consistent with 2016 third and fourth quarter2017 presentations.
13. Subsequent Events
Resignation of our CFO, Wilkes Graham and appointment of Matthew Reddy as CFO
On February 27, 2017,January 4, 2018, Wilkes Graham tendered his resignation as the Company’s announced itsCFO of the company. Such resignation was to be effective on or before March 4, 2018. On January 23, 2018, the Company received communication on behalf of Mr. Graham indicating that he had terminated his employment immediately for Good Reason (as defined in his employment agreement). The Company disagrees Mr. Graham had Good Reason to terminate his employment. Further, the terms of his employment contract provide that the effective date of termination would occur 60 days following written notice of termination from Mr. Graham with or without Good Reason, and not immediately. Accordingly, the Company has expressly reserved all claims that it may possess in relation to Mr. Graham’s employment. The Board of Directors approved(the “Board”) named Matthew Reddy, the Company’s Chief Accounting Officer as Chief Financial Officer. There is no family relationship between Mr. Reddy and any director, executive officer, or person nominated or chosen by us to become a reverse stock split of one-for-eight to be effective March 31, 2017 (the “Effective Time”). At the Effective Time, every eight issued and outstanding shares of Common Stockdirector or executive officer of the Company will be converted into one share of Common Stock of the Company. In addition, at the Effective Time, the number of authorized shares of Common Stock will also be reduced on a one-for-eight basis. The par value of each share of Common Stock will remain unchanged. Trading in Wheeler's Common Stock on a split adjusted basis is expected to begin at the market open on April 3, 2017. Wheeler's Common Stock will continue trading on the NASDAQ under the symbol “WHLR” but will be assigned a new CUSIP number. No adjustments have been made to the historical financial statements as the reverse split has not been completed.company.
The Company has amended its dividend payment schedule such that future Common Stock dividends will be paid quarterly commencing in the second quarterSale of 2017.Chipotle at Conyers Crossing
On February 28, 2017,January 12, 2018, the Company completed its salesthe sale of Ruby Tuesday’s and Outback Steakhousethe Chipotle ground lease at Pierpont CentreConyers Crossing for a contract price of approximately $2.29$1.27 million, resulting in a gain of $1.05 million with net proceeds of $1.16 million.
2018 Series D Preferred Stock Offering- Redeemable Preferred Stock
In January 2018, the Company, issued and sold 1,363,636 shares of Series D Preferred, in a public offering. Each share of Series D Preferred Stock was sold to investors at an offering price of $16.50 per share. Net proceeds from the public offering totaled $21.16 million, which includes the impact of the underwriters' selling commissions and legal, accounting and other professional fees.
Bank Line of Credit Renewal
On January 10, 2018, the Company extended the $3.00 million bank line of credit to June 15, 2018 with interest only payments due monthly at a rate of Libor + 3.00% with a floor of 4.25%.
JANAF Acquisition
On January 18, 2018, the Company acquired JANAF, a retail shopping center located in Norfolk, Virginia, for a purchase price of $85.65 million, paid through a combination of cash, debt assumption and the issuance of 150,000 shares of Common Stock. The shopping center, anchored by BJ's Wholesale Club, totals 887,917 square feet and was 94% leased at the acquisition date.
The following summarizes the consideration paid and the fair values of assets acquired and liabilities assumed in conjunction with the acquisitions described above, along with a description of the methods used to determine fair value. In determining fair values, the Company considered many factors including, but not limited to, cash flows, market cap rates, location, occupancy rates, appraisals, other acquisitions and management’s knowledge of the current acquisition market for similar properties.
|
| | | | | | |
| | | | | JANAF |
| | | | | (in thousands, unaudited)
|
| Fair value of assets acquired and liabilities assumed: | |
| | Investment property (a) | $ | 77,383 |
|
| | Lease intangibles and other assets (b) | 11,040 |
|
| | Above market leases (c) | 2,079 |
|
| | Below market leases (c) | (4,852 | ) |
| | Debt assumption (d) | | | (58,867 | ) |
| | Net fair value of assets acquired and liabilities assumed: | $ | 26,783 |
|
| | | | | |
| Purchase consideration: | | |
| | Consideration paid with cash and debt | $ | 25,653 |
|
| | Consideration paid with assumption of debt | 58,867 |
|
| | Consideration paid with common stock | 1,130 |
|
| | | | | |
| | Total consideration (e) | $ | 85,650 |
|
| |
| a. | Represents the fair value of the net investment properties acquired which includes land, buildings, site improvements and tenant improvements. The fair value was determined using following approaches: |
i. the market approach valuation methodology for land by considering similar transactions in the markets;
ii. a combination of the cost approach and income approach valuation methodologies for buildings, including replacement cost evaluations, “go dark” analyses and residual calculations incorporating the land values; and
| |
| iii. | the cost approach valuation methodology for site and tenant improvements, including replacement costs and prevailing quoted market rates. |
| |
| b. | Represents the fair value of lease intangibles and other assets. Lease intangibles includes in place leases and ground lease sandwich interests associated with replacing existing leases. The income approach was used to determine the fair value of these intangible assets which included estimated market rates and expenses. It was determined that carrying value approximated fair value for other asset amounts. |
| |
| c. | Represents the fair value of above/below market leases. The income approach was used to determine the fair value of above/below market leases using market rental rates for similar properties. |
| |
| d. | Assumption of $53.71 million of debt at a rate of 4.49%, maturing July 2023 with monthly principal and interest payments of $333,159 and assumption of $5.16 million of debt at a rate of 4.95%, maturing January 2026 with monthly principal and interest payments of $29,964. |
| |
| e. | Represents the components of purchase consideration paid. |
Unaudited pro forma financial information in the aggregate is presented below for the acquisition of JANAF. The unaudited pro forma information presented below includes the effects of the JANAF acquisition and those acquisitions noted in Note 3, as if they had been consummated as of the beginning of the prior fiscal year. The pro forma results include adjustments for depreciation and amortization associated with acquired tangible and intangible assets, straight-line rent adjustments, interest expense related to debt incurred and assumed. The unaudited pro forma financial information is presented for informational purposes only and may not be indicative of the results of operations that would have been achieved if these acquisition had taken place in January 1, 2017 or 2016.
|
| | | | | | | |
| | Years Ended December 31, |
| | 2017 | | 2016 |
| | (in thousands, unaudited) |
| Rental revenues | $ | 53,227 |
| | $ | 52,130 |
|
| Net loss from continuing operations | $ | (11,424 | ) | | $ | (15,261 | ) |
| Net loss attributable to Wheeler REIT | $ | (9,374 | ) | | $ | (13,097 | ) |
| Net loss attributable to Wheeler REIT common shareholders | $ | (22,327 | ) | | $ | (20,793 | ) |
| Basic loss per share | $ | (2.54 | ) | | $ | (2.43 | ) |
| Diluted loss per share | $ | (2.54 | ) | | $ | (2.43 | ) |
JANAF - Bravo Loan
On January 18, 2018, the Company executed a promissory note for $6.5 million for the purchase of JANAF at a rate of 4.65%. The loan matures in January 2021 with interest due monthly.
CEO Transition
On January 29, 2018, the Board of the Company terminated Jon S. Wheeler as the Company’s Chairman, CEO and President. In addition, in connection with the termination of Mr. Wheeler, the Board appointed David Kelly, the Company’s then acting CIO, as CEO and President. The Company has defeaseddoes not plan to fill the $1.35 million loan payableCIO position at a cost of $561 thousand.this time.
Board of Directors
On January 29, 2018, Mr. Wheeler resigned from his position as a member of the Company’s Board of Directors to
pursue other interests. Mr. Wheeler was not a member of any committees of the Company.
Chief Operating Officer Appointment
In February 2018, M. Andrew Franklin, the Company's then acting Senior Vice President of Operations was appointed, as Chief Operating Officer.
Wheeler Real Estate Investment Trust, Inc. and Subsidiaries
Schedule II-Valuation and Qualifying Accounts
December 31, 20162017
| | | Description | Balance at Beginning of Year | | Charged to Costs and Expense | | Deductions from Reserves | | Balance at End of Year | Balance at Beginning of Year | | Charged to Costs and Expense | | Deductions from Reserves | | Balance at End of Year |
| | | (in thousands) |
| Allowance for doubtful accounts: | | | | | | | | | | | | | | |
| Year Ended December 31, 2017 | | $ | 691 |
| | $ | 2,821 |
| | $ | (443 | ) | | $ | 3,069 |
|
| Year Ended December 31, 2016 | $ | 411,394 |
| | $ | 424,925 |
| | $ | (145,333 | ) | | $ | 690,986 |
| 411 |
| | 425 |
| | (145 | ) | | 691 |
|
| Year Ended December 31, 2015 | 186,517 |
| | 243,029 |
| | (18,152 | ) | | 411,394 |
| |
| Year Ended December 31, 2014 | 182,078 |
| | 60,841 |
| | (56,402 | ) | | 186,517 |
| |
Wheeler Real Estate Investment Trust, Inc. and Subsidiaries
Schedule III-Real Estate and Accumulated Depreciation
December 31, 20162017
| | | | Initial Cost | | Costs Capitalized Subsequent to Acquisition | | Gross Amount at which Carried at End of Period | Initial Cost | | Costs Capitalized Subsequent to Acquisition | | Gross Amount at which Carried at End of Period |
| Property Name | Land | | Building and Improvements | | Improvements (net) | | Carrying Costs | | Land | | Building and Improvements | | Total | Land | | Building and Improvements | | Improvements (net) | | Carrying Costs | | Land | | Building and Improvements | | Total |
| (in thousands) | | (in thousands) |
| Amscot Building | $ | — |
| | $ | 461,700 |
| | $ | 31,128 |
| | $ | — |
| | $ | — |
| | $ | 492,828 |
| | $ | 492,828 |
| $ | — |
| | $ | 462 |
| | $ | 31 |
| | $ | — |
| | $ | — |
| | $ | 493 |
| | $ | 493 |
|
| Lumber River Village | 800,413 |
| | 4,486,787 |
| | 145,221 |
| | — |
| | 942,811 |
| | 4,489,610 |
| | 5,432,421 |
| 800 |
| | 4,487 |
| | 146 |
| | — |
| | 943 |
| | 4,490 |
| | 5,433 |
|
| Monarch Bank | 496,591 |
| | 1,908,659 |
| | 77,704 |
| | — |
| | 496,591 |
| | 1,986,363 |
| | 2,482,954 |
| 497 |
| | 1,909 |
| | 77 |
| | — |
| | 497 |
| | 1,986 |
| | 2,483 |
|
| Perimeter Square | 1,566,431 |
| | 5,081,193 |
| | 237,147 |
| | — |
| | 1,566,431 |
| | 5,318,340 |
| | 6,884,771 |
| 1,566 |
| | 5,081 |
| | 478 |
| | — |
| | 1,566 |
| | 5,559 |
| | 7,125 |
|
| Riversedge North | 909,898 |
| | 2,207,571 |
| | 693,233 |
| | — |
| | 909,898 |
| | 2,900,804 |
| | 3,810,702 |
| 910 |
| | 2,208 |
| | 638 |
| | — |
| | 910 |
| | 2,846 |
| | 3,756 |
|
| Surrey Plaza | 380,731 |
| | 1,856,515 |
| | — |
| | — |
| | 380,731 |
| | 1,856,515 |
| | 2,237,246 |
| 381 |
| | 1,857 |
| | — |
| | — |
| | 381 |
| | 1,857 |
| | 2,238 |
|
| The Shoppes at TJ Maxx | 2,115,119 |
| | 6,719,386 |
| | 410,758 |
| | — |
| | 2,115,119 |
| | 7,130,144 |
| | 9,245,263 |
| 2,115 |
| | 6,719 |
| | 554 |
| | — |
| | 2,115 |
| | 7,273 |
| | 9,388 |
|
| The Shoppes at Eagle Harbor | 785,040 |
| | 4,219,464 |
| | 258,236 |
| | — |
| | 785,040 |
| | 4,477,700 |
| | 5,262,740 |
| 785 |
| | 4,219 |
| | 259 |
| | — |
| | 785 |
| | 4,478 |
| | 5,263 |
|
| Twin City Commons | 800,272 |
| | 3,040,956 |
| | 4,233 |
| | — |
| | 800,272 |
| | 3,045,189 |
| | 3,845,461 |
| 800 |
| | 3,041 |
| | 24 |
| | — |
| | 800 |
| | 3,065 |
| | 3,865 |
|
| Walnut Hill Plaza | 733,748 |
| | 2,413,832 |
| | 1,192,868 |
| | — |
| | 733,748 |
| | 3,606,700 |
| | 4,340,448 |
| 734 |
| | 2,414 |
| | 1,193 |
| | — |
| | 734 |
| | 3,607 |
| | 4,341 |
|
| Tampa Festival | 4,653,354 |
| | 6,691,097 |
| | 338,557 |
| | — |
| | 4,694,966 |
| | 6,988,042 |
| | 11,683,008 |
| 4,653 |
| | 6,691 |
| | 657 |
| | — |
| | 4,695 |
| | 7,306 |
| | 12,001 |
|
| Forrest Gallery | 3,015,372 |
| | 7,454,580 |
| | 224,121 |
| | — |
| | 3,015,372 |
| | 7,678,701 |
| | 10,694,073 |
| 3,015 |
| | 7,455 |
| | 855 |
| | — |
| | 3,015 |
| | 8,310 |
| | 11,325 |
|
| Jenks Plaza | 498,260 |
| | 917,898 |
| | — |
| | — |
| | 498,260 |
| | 917,898 |
| | 1,416,158 |
| 498 |
| | 918 |
| | 77 |
| | — |
| | 498 |
| | 995 |
| | 1,493 |
|
| Winslow Plaza | 1,324,983 |
| | 3,684,181 |
| | 164,054 |
| | — |
| | 1,369,983 |
| | 3,803,235 |
| | 5,173,218 |
| 1,325 |
| | 3,684 |
| | 184 |
| | — |
| | 1,370 |
| | 3,823 |
| | 5,193 |
|
| Clover Plaza | 356,338 |
| | 1,196,704 |
| | 25,850 |
| | — |
| | 356,338 |
| | 1,222,554 |
| | 1,578,892 |
| 356 |
| | 1,197 |
| | 26 |
| | — |
| | 356 |
| | 1,223 |
| | 1,579 |
|
| St. George Plaza | 705,645 |
| | 1,264,212 |
| | 7,024 |
| | — |
| | 705,645 |
| | 1,271,236 |
| | 1,976,881 |
| 706 |
| | 1,264 |
| | 25 |
| | — |
| | 706 |
| | 1,289 |
| | 1,995 |
|
| South Square | 352,587 |
| | 1,911,330 |
| | — |
| | — |
| | 352,587 |
| | 1,911,330 |
| | 2,263,917 |
| 353 |
| | 1,911 |
| | — |
| | — |
| | 353 |
| | 1,911 |
| | 2,264 |
|
| Westland Square | 886,829 |
| | 1,709,665 |
| | 12,276 |
| | — |
| | 886,829 |
| | 1,721,941 |
| | 2,608,770 |
| 887 |
| | 1,710 |
| | 21 |
| | — |
| | 887 |
| | 1,731 |
| | 2,618 |
|
| Waterway Plaza | 1,279,700 |
| | 1,247,952 |
| | 4,582 |
| | — |
| | 1,279,700 |
| | 1,252,534 |
| | 2,532,234 |
| 1,280 |
| | 1,248 |
| | 11 |
| | — |
| | 1,280 |
| | 1,259 |
| | 2,539 |
|
| Cypress Shopping Center | 2,063,671 |
| | 4,578,838 |
| | 31,704 |
| | — |
| | 2,063,671 |
| | 4,610,542 |
| | 6,674,213 |
| 2,064 |
| | 4,579 |
| | 266 |
| | — |
| | 2,064 |
| | 4,845 |
| | 6,909 |
|
| Harrodsburg Marketplace | 1,431,484 |
| | 2,484,653 |
| | 77,506 |
| | — |
| | 1,508,990 |
| | 2,484,653 |
| | 3,993,643 |
| 1,431 |
| | 2,485 |
| | 78 |
| | — |
| | 1,509 |
| | 2,485 |
| | 3,994 |
|
| Port Crossing Shopping Center | 791,933 |
| | 6,920,539 |
| | 93,633 |
| | — |
| | 791,933 |
| | 7,014,172 |
| | 7,806,105 |
| 792 |
| | 6,921 |
| | 93 |
| | — |
| | 792 |
| | 7,014 |
| | 7,806 |
|
| LaGrange Marketplace | 390,180 |
| | 2,647,956 |
| | 1,367 |
| | — |
| | 390,180 |
| | 2,649,323 |
| | 3,039,503 |
| 390 |
| | 2,648 |
| | 7 |
| | — |
| | 390 |
| | 2,655 |
| | 3,045 |
|
| DF I-Courtland | 893,852 |
| | — |
| | — |
| | — |
| | 893,852 |
| | — |
| | 893,852 |
| 894 |
| | — |
| | — |
| | — |
| | 894 |
| | — |
| | 894 |
|
| Edenton Commons | 2,395,000 |
| | — |
| | — |
| | — |
| | 2,395,000 |
| | — |
| | 2,395,000 |
| 2,395 |
| | — |
| | — |
| | — |
| | 2,395 |
| | — |
| | 2,395 |
|
| DF I-Moyock | 908,066 |
| | — |
| | — |
| | — |
| | 908,066 |
| | — |
| | 908,066 |
| 908 |
| | — |
| | — |
| | — |
| | 908 |
| | — |
| | 908 |
|
| Freeway Junction | 1,521,133 |
| | 6,754,803 |
| | — |
| | — |
| | 1,521,133 |
| | 6,754,803 |
| | 8,275,936 |
| 1,521 |
| | 6,755 |
| | 13 |
| | — |
| | 1,521 |
| | 6,768 |
| | 8,289 |
|
| Graystone Crossing | 922,439 |
| | 2,856,365 |
| | — |
| | — |
| | 922,439 |
| | 2,856,365 |
| | 3,778,804 |
| 922 |
| | 2,856 |
| | — |
| | — |
| | 922 |
| | 2,856 |
| | 3,778 |
|
| Bryan Station | 1,658,454 |
| | 2,756,142 |
| | — |
| | — |
| | 1,658,454 |
| | 2,756,142 |
| | 4,414,596 |
| 1,658 |
| | 2,756 |
| | 57 |
| | — |
| | 1,658 |
| | 2,813 |
| | 4,471 |
|
| Crockett Square | 1,546,482 |
| | 6,833,967 |
| | 17,831 |
| | — |
| | 1,564,982 |
| | 6,833,298 |
| | 8,398,280 |
| 1,546 |
| | 6,834 |
| | 183 |
| | — |
| | 1,565 |
| | 6,998 |
| | 8,563 |
|
| Harbor Point | 2,400,000 |
| | — |
| | 68,620 |
| | — |
| | 2,468,620 |
| | — |
| | 2,468,620 |
| 2,400 |
| | — |
| | 69 |
| | — |
| | 2,469 |
| | — |
| | 2,469 |
|
| DF I-Berkley | 250,000 |
| | — |
| | — |
| | — |
| | 250,000 |
| | — |
| | 250,000 |
| 250 |
| | — |
| | — |
| | — |
| | 250 |
| | — |
| | 250 |
|
| Laskin Road | 1,644,000 |
| | — |
| | 209,212 |
| | — |
| | 1,649,383 |
| | 203,829 |
| | 1,853,212 |
| 1,644 |
| | — |
| | 209 |
| | — |
| | 1,649 |
| | 204 |
| | 1,853 |
|
| Pierpont Centre | 675,317 |
| | 9,253,152 |
| | 10,000 |
| | — |
| | 675,317 |
| | 9,263,152 |
| | 9,938,469 |
| 484 |
| | 9,221 |
| | 10 |
| | — |
| | 484 |
| | 9,231 |
| | 9,715 |
|
| Brook Run Properties | 300,000 |
| | — |
| | 7,686 |
| | — |
| | 300,000 |
| | 7,686 |
| | 307,686 |
| 300 |
| | — |
| | 8 |
| | — |
| | 300 |
| | 8 |
| | 308 |
|
| Alex City Marketplace | 453,746 |
| | 7,836,903 |
| | 12,735 |
| | — |
| | 453,746 |
| | 7,849,638 |
| | 8,303,384 |
| 454 |
| | 7,837 |
| | 726 |
| | — |
| | 454 |
| | 8,563 |
| | 9,017 |
|
| Butler Square | 1,023,990 |
| | 6,400,682 |
| | 10,595 |
| | — |
| | 1,023,990 |
| | 6,411,277 |
| | 7,435,267 |
| 1,024 |
| | 6,401 |
| | 32 |
| | — |
| | 1,024 |
| | 6,433 |
| | 7,457 |
|
| Brook Run Shopping Center | 2,208,501 |
| | 12,918,517 |
| | 445,127 |
| | — |
| | 2,208,501 |
| | 13,363,644 |
| | 15,572,145 |
| 2,209 |
| | 12,919 |
| | 475 |
| | — |
| | 2,209 |
| | 13,394 |
| | 15,603 |
|
| Beaver Ruin Village | 2,604,155 |
| | 8,283,904 |
| | 3,124 |
| | — |
| | 2,604,155 |
| | 8,287,028 |
| | 10,891,183 |
| 2,604 |
| | 8,284 |
| | 3 |
| | — |
| | 2,604 |
| | 8,287 |
| | 10,891 |
|
| Beaver Ruin Village II | 1,153,127 |
| | 2,809,398 |
| | 5,000 |
| | — |
| | 1,153,127 |
| | 2,814,398 |
| | 3,967,525 |
| 1,153 |
| | 2,809 |
| | 5 |
| | — |
| | 1,153 |
| | 2,814 |
| | 3,967 |
|
| | | | Initial Cost | | Costs Capitalized Subsequent to Acquisition | | Gross Amount at which Carried at End of Period | Initial Cost | | Costs Capitalized Subsequent to Acquisition | | Gross Amount at which Carried at End of Period |
| Property Name | Land | | Building and Improvements | | Improvements (net) | | Carrying Costs | | Land | | Building and Improvements | | Total | Land | | Building and Improvements | | Improvements (net) | | Carrying Costs | | Land | | Building and Improvements | | Total |
| Columbia Fire Station | $ | 2,304,937 |
| | $ | — |
| | $ | 671,798 |
| | $ | — |
| | $ | 2,304,937 |
| | $ | 671,798 |
| | $ | 2,976,735 |
| $ | 2,305 |
| | $ | — |
| | $ | 4,334 |
| | $ | — |
| | $ | 2,305 |
| | $ | 4,334 |
| | $ | 6,639 |
|
| Chesapeake Square | 894,835 |
| | 4,111,707 |
| | 287,670 |
| | — |
| | 900,205 |
| | 4,394,007 |
| | 5,294,212 |
| 895 |
| | 4,112 |
| | 638 |
| | — |
| | 1,219 |
| | 4,426 |
| | 5,645 |
|
| Sunshine Plaza | 1,182,887 |
| | 6,368,471 |
| | 19,275 |
| | — |
| | 1,182,887 |
| | 6,387,746 |
| | 7,570,633 |
| 1,183 |
| | 6,368 |
| | 16 |
| | — |
| | 1,183 |
| | 6,384 |
| | 7,567 |
|
| Carolina Place | 250,000 |
| | — |
| | — |
| | — |
| | 250,000 |
| | — |
| | 250,000 |
| |
| Barnett Portfolio | 3,107,136 |
| | 8,912,082 |
| | 140,909 |
| | — |
| | 3,192,639 |
| | 8,967,488 |
| | 12,160,127 |
| 3,107 |
| | 8,912 |
| | 141 |
| | — |
| | 3,193 |
| | 8,967 |
| | 12,160 |
|
| Grove Park | 722,150 |
| | 4,589,698 |
| | — |
| | — |
| | 722,150 |
| | 4,589,698 |
| | 5,311,848 |
| 722 |
| | 4,590 |
| | — |
| | — |
| | 722 |
| | 4,590 |
| | 5,312 |
|
| Parkway Plaza | 772,030 |
| | 4,229,713 |
| | 14,549 |
| | — |
| | 772,030 |
| | 4,244,262 |
| | 5,016,292 |
| 772 |
| | 4,230 |
| | 14 |
| | — |
| | 772 |
| | 4,244 |
| | 5,016 |
|
| Fort Howard Square | 1,889,590 |
| | 7,350,084 |
| | — |
| | — |
| | 1,889,590 |
| | 7,350,084 |
| | 9,239,674 |
| 1,890 |
| | 7,350 |
| | 19 |
| | — |
| | 1,890 |
| | 7,369 |
| | 9,259 |
|
| Conyers Crossing | 2,101,459 |
| | 6,819,984 |
| | — |
| | — |
| | 2,101,459 |
| | 6,819,984 |
| | 8,921,443 |
| 2,101 |
| | 6,820 |
| | — |
| | — |
| | 2,101 |
| | 6,820 |
| | 8,921 |
|
| LBP Milltown | — |
| | — |
| | 196,009 |
| | — |
| | — |
| | 196,009 |
| | 196,009 |
| — |
| | — |
| | 196 |
| | — |
| | — |
| | 196 |
| | 196 |
|
| LBP Vauxhall | — |
| | — |
| | 2,422 |
| | — |
| | — |
| | 2,422 |
| | 2,422 |
| — |
| | — |
| | 1 |
| | — |
| | — |
| | 1 |
| | 1 |
|
| McPherson | — |
| | — |
| | 7,412 |
| | — |
| | — |
| | 7,412 |
| | 7,412 |
| — |
| | — |
| | 7 |
| | — |
| | — |
| | 7 |
| | 7 |
|
| LBP Hamburg | — |
| | — |
| | 4,728 |
| | — |
| | — |
| | 4,728 |
| | 4,728 |
| |
| LBP LaSalle | — |
| | — |
| | 42,494 |
| | — |
| | — |
| | 42,494 |
| | 42,494 |
| |
| Darien Shopping Center | 187,561 |
| | 1,053,891 |
| | — |
| | — |
| | 187,561 |
| | 1,053,891 |
| | 1,241,452 |
| 188 |
| | 1,054 |
| | 1 |
| | — |
| | 188 |
| | 1,055 |
| | 1,243 |
|
| Devine Street | 364,990 |
| | 1,941,328 |
| | — |
| | — |
| | 364,990 |
| | 1,941,328 |
| | 2,306,318 |
| 365 |
| | 1,941 |
| | — |
| | — |
| | 365 |
| | 1,941 |
| | 2,306 |
|
| Folly Road | 5,992,378 |
| | 4,526,942 |
| | 21,160 |
| | — |
| | 5,992,378 |
| | 4,548,102 |
| | 10,540,480 |
| 5,992 |
| | 4,527 |
| | 180 |
| | — |
| | 5,992 |
| | 4,707 |
| | 10,699 |
|
| Georgetown | 741,821 |
| | 1,916,742 |
| | — |
| | — |
| | 741,821 |
| | 1,916,742 |
| | 2,658,563 |
| 742 |
| | 1,917 |
| | — |
| | — |
| | 742 |
| | 1,917 |
| | 2,659 |
|
| Ladson Crossing | 2,980,739 |
| | 3,920,233 |
| | — |
| | — |
| | 2,980,739 |
| | 3,920,233 |
| | 6,900,972 |
| 2,981 |
| | 3,920 |
| | 38 |
| | — |
| | 2,981 |
| | 3,958 |
| | 6,939 |
|
| Lake Greenwood Crossing | 550,369 |
| | 2,499,295 |
| | — |
| | — |
| | 550,369 |
| | 2,499,295 |
| | 3,049,664 |
| 550 |
| | 2,499 |
| | — |
| | — |
| | 550 |
| | 2,499 |
| | 3,049 |
|
| Lake Murray | 446,516 |
| | 1,537,005 |
| | — |
| | — |
| | 446,516 |
| | 1,537,005 |
| | 1,983,521 |
| 447 |
| | 1,537 |
| | — |
| | — |
| | 447 |
| | 1,537 |
| | 1,984 |
|
| Litchfield I | 568,081 |
| | 929,375 |
| | — |
| | — |
| | 568,081 |
| | 929,375 |
| | 1,497,456 |
| 568 |
| | 929 |
| | — |
| | — |
| | 568 |
| | 929 |
| | 1,497 |
|
| Litchfield II | 568,081 |
| | 936,104 |
| | — |
| | — |
| | 568,081 |
| | 936,104 |
| | 1,504,185 |
| 568 |
| | 936 |
| | — |
| | — |
| | 568 |
| | 936 |
| | 1,504 |
|
| Litchfield Market Village | 2,970,115 |
| | 4,715,535 |
| | — |
| | — |
| | 2,970,115 |
| | 4,715,535 |
| | 7,685,650 |
| 2,970 |
| | 4,716 |
| | — |
| | — |
| | 2,970 |
| | 4,716 |
| | 7,686 |
|
| Moncks Corner | — |
| | 1,109,345 |
| | — |
| | — |
| | — |
| | 1,109,345 |
| | 1,109,345 |
| — |
| | 1,109 |
| | — |
| | — |
| | — |
| | 1,109 |
| | 1,109 |
|
| Ridgeland | 203,003 |
| | 376,154 |
| | — |
| | — |
| | 203,003 |
| | 376,154 |
| | 579,157 |
| 203 |
| | 376 |
| | — |
| | — |
| | 203 |
| | 376 |
| | 579 |
|
| Shoppes at Myrtle Park | 3,182,282 |
| | 5,360,320 |
| | — |
| | — |
| | 3,182,282 |
| | 5,360,320 |
| | 8,542,602 |
| 3,182 |
| | 5,360 |
| | 11 |
| | — |
| | 3,182 |
| | 5,371 |
| | 8,553 |
|
| South Lake | 804,317 |
| | 2,025,143 |
| | — |
| | — |
| | 804,317 |
| | 2,025,143 |
| | 2,829,460 |
| 804 |
| | 2,025 |
| | — |
| | — |
| | 804 |
| | 2,025 |
| | 2,829 |
|
| South Park | 943,162 |
| | 2,966,711 |
| | — |
| | — |
| | 943,162 |
| | 2,966,711 |
| | 3,909,873 |
| 943 |
| | 2,967 |
| | 5 |
| | — |
| | 943 |
| | 2,972 |
| | 3,915 |
|
| St. Matthews | 337,510 |
| | 1,940,821 |
| | — |
| | — |
| | 337,510 |
| | 1,940,821 |
| | 2,278,331 |
| 338 |
| | 1,941 |
| | 5 |
| | — |
| | 338 |
| | 1,946 |
| | 2,284 |
|
| Berkley | 1,005,288 |
| | 2,865,073 |
| | — |
| | — |
| | 1,005,288 |
| | 2,865,073 |
| | 3,870,361 |
| 1,005 |
| | 2,865 |
| | (9 | ) | | — |
| | 1,005 |
| | 2,856 |
| | 3,861 |
|
| Sangaree | 2,301,837 |
| | 2,922,332 |
| | 18,015 |
| | — |
| | 2,301,837 |
| | 2,940,347 |
| | 5,242,184 |
| 2,302 |
| | 2,922 |
| | 236 |
| | — |
| | 2,503 |
| | 2,957 |
| | 5,460 |
|
| Tri-County | 410,959 |
| | 3,421,233 |
| | — |
| | — |
| | 410,959 |
| | 3,421,233 |
| | 3,832,192 |
| 411 |
| | 3,421 |
| | 141 |
| | — |
| | 552 |
| | 3,421 |
| | 3,973 |
|
| Riverbridge | 773,626 |
| | 5,384,071 |
| | — |
| | — |
| | 773,626 |
| | 5,384,071 |
| | 6,157,697 |
| 774 |
| | 5,384 |
| | 58 |
| | — |
| | 832 |
| | 5,384 |
| | 6,216 |
|
| Laburnum Square | 3,734,792 |
| | 5,928,511 |
| | — |
| | — |
| | 3,734,792 |
| | 5,928,511 |
| | 9,663,303 |
| 3,736 |
| | 5,928 |
| | 50 |
| | — |
| | 3,734 |
| | 5,980 |
| | 9,714 |
|
| Franklin Village | 2,608,111 |
| | 9,425,632 |
| | — |
| | — |
| | 2,608,111 |
| | 9,425,632 |
| | 12,033,743 |
| 2,608 |
| | 9,426 |
| | — |
| | — |
| | 2,608 |
| | 9,426 |
| | 12,034 |
|
| Village at Martinsville | 5,207,633 |
| | 12,879,497 |
| | — |
| | — |
| | 5,207,633 |
| | 12,879,497 |
| | 18,087,130 |
| 5,208 |
| | 12,879 |
| | 3 |
| | — |
| | 5,208 |
| | 12,882 |
| | 18,090 |
|
| New Market Crossing | 992,886 |
| | 5,216,464 |
| | — |
| | — |
| | 992,886 |
| | 5,216,464 |
| | 6,209,350 |
| 993 |
| | 5,216 |
| | 16 |
| | — |
| | 993 |
| | 5,232 |
| | 6,225 |
|
| Rivergate Shopping Center | 1,654,385 |
| | 31,696,747 |
| | — |
| | — |
| | 1,654,385 |
| | 31,696,747 |
| | 33,351,132 |
| 1,570 |
| | 30,694 |
| | 10 |
| | — |
| | 1,570 |
| | 30,704 |
| | 32,274 |
|
| Totals | $ | 101,652,307 |
| | $ | 301,685,744 |
| | $ | 6,247,573 |
| | $ | — |
| | $ | 102,142,199 |
| | $ | 307,443,425 |
| | $ | 409,585,624 |
| $ | 101,127 |
| | $ | 300,651 |
| | $ | 13,601 |
| | $ | — |
| | $ | 102,336 |
| | $ | 313,043 |
| | $ | 415,379 |
|
Wheeler Real Estate Investment Trust, Inc. and Subsidiaries
Schedule III-Real Estate and Accumulated Depreciation
| | | Property Name | Encumbrances | | Accumulated Depreciation | | Date of Construction | | Date Acquired | | Depreciation Life | Encumbrances | | | Accumulated Depreciation | | Date of Construction | | Date Acquired | | Depreciation Life |
| | | (in thousands) | | | | | | |
| Amscot Building | (3 | ) | | $ | 189,136 |
| | 5/15/2004 | | | | 5-40 years | (3 | ) | (5 | ) | | $ | 203 |
| | 5/15/2004 | | 5-40 years |
| Lumber River Village | 1,500,000 |
| | 612,998 |
| | 11/16/2012 | | 5-40 years | 1,500 |
| | | 747 |
| | 11/16/2012 | | 5-40 years |
| Monarch Bank | 1,380,000 |
| | 1,075,295 |
| | 12/28/2007 | | 5-40 years | 1,266 |
| (5 | ) | | 1,133 |
| | 12/28/2007 | | 5-40 years |
| Perimeter Square | 4,500,000 |
| | 733,874 |
| | 11/16/2012 | | 5-40 years | 5,382 |
| (5 | ) | | 905 |
| | 11/16/2012 | | 5-40 years |
| Riversedge North | 962,000 |
| | 1,130,019 |
| | 4/17/2008 | | 12/21/2012 | | 5-40 years | 863 |
| | | 1,293 |
| | 4/17/2008 | | 12/21/2012 | | 5-40 years |
| Surrey Plaza | (3 | ) | | 310,912 |
| | 12/21/2012 | | 5-40 years | (3 | ) | (5 | ) | | 378 |
| | 12/21/2012 | | 5-40 years |
| The Shoppes at TJ Maxx | 6,080,000 |
| | 1,059,242 |
| | 11/16/2012 | | 5-40 years | 5,727 |
| | | 1,341 |
| | 11/16/2012 | | 5-40 years |
| The Shoppes at Eagle Harbor | 3,630,000 |
| | 996,175 |
| | 9/9/2008 | | 11/16/2012 | | 5-40 years | 3,341 |
| (5 | ) | | 1,117 |
| | 9/9/2008 | | 11/16/2012 | | 5-40 years |
| Twin City Commons | 3,230,000 |
| | 397,148 |
| | 12/18/2012 | | 5-40 years | 3,111 |
| | | 493 |
| | 12/18/2012 | | 5-40 years |
| Walnut Hill Plaza | 3,540,000 |
| | 1,541,085 |
| | 12/14/2007 | | 5-40 years | 3,903 |
| (5 | ) | | 1,712 |
| | 12/14/2007 | | 5-40 years |
| Tampa Festival | 8,630,000 |
| | 855,633 |
| | 8/26/2013 | | 5-40 years | 8,368 |
| | | 1,137 |
| | 8/26/2013 | | 5-40 years |
| Forrest Gallery | 8,930,000 |
| | 963,327 |
| | 8/29/2013 | | 5-40 years | 8,669 |
| | | 1,232 |
| | 8/29/2013 | | 5-40 years |
| Jenks Plaza | (3 | ) | | 159,292 |
| | 12/17/2013 | | 5-40 years | (3 | ) | (5 | ) | | 189 |
| | 12/17/2013 | | 5-40 years |
| Winslow Plaza | 4,620,000 |
| | 525,064 |
| | 12/19/2013 | | 5-40 years | 4,620 |
| | | 681 |
| | 12/19/2013 | | 5-40 years |
| Clover Plaza | 2,100,000 |
| | 107,633 |
| | 12/23/2013 | | 5-40 years | 2,049 |
| | | 142 |
| | 12/23/2013 | | 5-40 years |
| St. George Plaza | 2,650,000 |
| | 123,392 |
| | 12/23/2013 | | 5-40 years | 2,584 |
| | | 163 |
| | 12/23/2013 | | 5-40 years |
| South Square | 2,160,000 |
| | 152,754 |
| | 12/23/2013 | | 5-40 years | 2,104 |
| | | 202 |
| | 12/23/2013 | | 5-40 years |
| Westland Square | 2,760,000 |
| | 151,005 |
| | 12/23/2013 | | 5-40 years | 2,684 |
| | | 199 |
| | 12/23/2013 | | 5-40 years |
| Waterway Plaza | 2,700,000 |
| | 116,601 |
| | 12/23/2013 | | 5-40 years | 2,629 |
| | | 153 |
| | 12/23/2013 | | 5-40 years |
| Cypress Shopping Center | 6,630,000 |
| | 338,811 |
| | 7/1/2014 | | 5-40 years | 6,485 |
| | | 491 |
| | 7/1/2014 | | 5-40 years |
| Harrodsburg Marketplace | 3,680,000 |
| | 195,079 |
| | 7/1/2014 | | 5-40 years | 3,553 |
| | | 276 |
| | 7/1/2014 | | 5-40 years |
| Port Crossing Shopping Center | 6,470,000 |
| | 800,040 |
| | 7/3/2014 | | 5-40 years | 6,263 |
| | | 1,119 |
| | 7/3/2014 | | 5-40 years |
| LaGrange Marketplace | 2,420,000 |
| | 267,979 |
| | 7/25/2014 | | 5-40 years | 2,317 |
| (5 | ) | | 370 |
| | 7/25/2014 | | 5-40 years |
| DF I-Courtland (undeveloped land) | — |
| | — |
| | 8/15/2014 | | N/A |
|
| (5 | ) | | — |
| | 8/15/2014 | | N/A |
| Edenton Commons (undeveloped land) | 650,000 |
| | — |
| | 8/15/2014 | | N/A |
|
| (5 | ) | | — |
| | 8/15/2014 | | N/A |
| DF I-Moyock (undeveloped land) | 419,000 |
| | — |
| | 8/15/2014 | | N/A | 194 |
| (5 | ) | | — |
| | 8/15/2014 | | N/A |
| Freeway Junction | 8,150,000 |
| | 561,231 |
| | 9/4/2014 | | 5-40 years | 7,994 |
| | | 759 |
| | 9/4/2014 | | 5-40 years |
| Graystone Crossing | 4,000,000 |
| | 183,686 |
| | 9/26/2014 | | 5-40 years | 3,928 |
| | | 263 |
| | 9/26/2014 | | 5-40 years |
| Bryan Station | 4,630,000 |
| | 205,998 |
| | 10/2/2014 | | 5-40 years | 4,547 |
| | | 292 |
| | 10/2/2014 | | 5-40 years |
| Crockett Square | 6,340,000 |
| | 500,159 |
| | 11/5/2014 | | 5-40 years | 6,338 |
| | | 720 |
| | 11/5/2014 | | 5-40 years |
| Harbor Point (undeveloped land) | 733,000 |
| | — |
| | 11/21/2014 | | N/A | 553 |
| (5 | ) | | — |
| | 11/21/2014 | | N/A |
| DF I-Berkley (undeveloped land) | — |
| | — |
| | 12/1/2014 | | N/A |
|
| (5 | ) | | — |
| | 12/1/2014 | | N/A |
| Laskin Road (undeveloped land) | — |
| | — |
| | 1/9/2015 | | N/A |
|
| (5 | ) | | — |
| | 1/9/2015 | | N/A |
| Pierpont Centre | 9,800,000 |
| | 597,739 |
| | 1/14/2015 | | 5-40 years | 8,113 |
| | | 900 |
| | 1/14/2015 | | 5-40 years |
| Brook Run Properties (undeveloped land) | — |
| | — |
| | 3/27/2015 | | N/A |
|
| (5 | ) | | — |
| | 3/27/2015 | | N/A |
| Alex City Marketplace | 5,750,000 |
| | 463,283 |
| | 4/1/2015 | | 5-40 years | 5,750 |
| | | 721 |
| | 4/1/2015 | | 5-40 years |
| Butler Square | 5,640,000 |
| | 320,881 |
| | 4/15/2015 | | 5-40 years | 5,640 |
| | | 503 |
| | 4/15/2015 | | 5-40 years |
| Brook Run Shopping Center | 10,950,000 |
| | 1,186,151 |
| | 6/2/2015 | | 5-40 years | 10,950 |
| | | 1,937 |
| | 6/2/2015 | | 5-40 years |
| Beaver Ruin Village | (4 | ) | | 387,899 |
| | 7/1/2015 | | 5-40 years | (4 | ) | | | 643 |
| | 7/1/2015 | | 5-40 years |
| Beaver Ruin Village II | (4 | ) | | 123,384 |
| | 7/1/2015 | | 5-40 years | (4 | ) | | | 202 |
| | 7/1/2015 | | 5-40 years |
| Columbia Fire Station (undeveloped land) | 450,000 |
| | — |
| | 7/1/2015 | | N/A | |
| Columbia Fire Station (redevelopment property) | | 3,421 |
| (5 | ) | | — |
| | 7/1/2015 | | N/A |
| Chesapeake Square | 4,600,000 |
| | 285,967 |
| | 7/10/2015 | | 5-40 years | 4,507 |
| | | 485 |
| | 7/10/2015 | | 5-40 years |
| Sunshine Plaza | 5,900,000 |
| | 291,513 |
| | 7/21/2015 | | 5-40 years | 5,900 |
| | | 494 |
| | 7/21/2015 | | 5-40 years |
| Carolina Place (undeveloped land) | — |
| | — |
| | 7/24/2015 | | N/A | |
| | | Property Name | Encumbrances | | Accumulated Depreciation | | Date of Construction | | Date Acquired | | Depreciation Life | Encumbrances | | | Accumulated Depreciation | | Date of Construction | | Date Acquired | | Depreciation Life |
| | | (in thousands) | |
| Barnett Portfolio | 8,770,000 |
| | $ | 457,147 |
| | 8/21/2015 | | 5-40 years | $ | 8,770 |
| | | $ | 766 |
| | 8/21/2015 | | 5-40 years |
| Grove Park | 3,800,000 |
| | 257,059 |
| | 9/9/2015 | | 5-40 years | 3,800 |
| | | 424 |
| | 9/9/2015 | | 5-40 years |
| Parkway Plaza | 3,500,000 |
| | 179,300 |
| | 9/15/2015 | | 5-40 years | 3,500 |
| | | 312 |
| | 9/15/2015 | | 5-40 years |
| Fort Howard Square | 7,100,000 |
| | 292,636 |
| | 9/30/2015 | | 5-40 years | 7,100 |
| | | 519 |
| | 9/30/2015 | | 5-40 years |
| Conyers Crossing | 5,960,000 |
| | 348,799 |
| | 9/30/2015 | | 5-40 years | 5,960 |
| | | 622 |
| | 9/30/2015 | | 5-40 years |
| Darien Shopping Center | (1 | ) | | 24,531 |
| | 4/12/2016 | | 5-40 years | (1 | ) | | | 57 |
| | 4/12/2016 | | 5-40 years |
| Devine Street | (1 | ) | | 41,137 |
| | 4/12/2016 | | 5-40 years | (1 | ) | | | 95 |
| | 4/12/2016 | | 5-40 years |
| Folly Road | (1 | ) | | 97,618 |
| | 4/12/2016 | | 5-40 years | 6,181 |
| | | 228 |
| | 4/12/2016 | | 5-40 years |
| Georgetown | (1 | ) | | 42,316 |
| | 4/12/2016 | | 5-40 years | (1 | ) | | | 99 |
| | 4/12/2016 | | 5-40 years |
| Ladson Crossing | (1 | ) | | 95,758 |
| | 4/12/2016 | | 5-40 years | (1 | ) | | | 221 |
| | 4/12/2016 | | 5-40 years |
| Lake Greenwood Crossing | (1 | ) | | 55,485 |
| | 4/12/2016 | | 5-40 years | (1 | ) | | | 128 |
| | 4/12/2016 | | 5-40 years |
| Lake Murray | (1 | ) | | 44,407 |
| | 4/12/2016 | | 5-40 years | (1 | ) | | | 104 |
| | 4/12/2016 | | 5-40 years |
| Litchfield I | (1 | ) | | 25,355 |
| | 4/12/2016 | | 5-40 years | (1 | ) | | | 59 |
| | 4/12/2016 | | 5-40 years |
| Litchfield II | (1 | ) | | 28,922 |
| | 4/12/2016 | | 5-40 years | (1 | ) | | | 67 |
| | 4/12/2016 | | 5-40 years |
| Litchfield Market Village | (1 | ) | | 116,428 |
| | 4/12/2016 | | 5-40 years | (1 | ) | | | 266 |
| | 4/12/2016 | | 5-40 years |
| Moncks Corner | (1 | ) | | 25,578 |
| | 4/12/2016 | | 5-40 years | (1 | ) | | | 60 |
| | 4/12/2016 | | 5-40 years |
| Ridgeland | (1 | ) | | 10,233 |
| | 4/12/2016 | | 5-40 years | (1 | ) | | | 24 |
| | 4/12/2016 | | 5-40 years |
| Shoppes at Myrtle Park | (1 | ) | | 126,709 |
| | 4/12/2016 | | 5-40 years | (1 | ) | | | 290 |
| | 4/12/2016 | | 5-40 years |
| South Lake | (1 | ) | | 58,385 |
| | 4/12/2016 | | 5-40 years | (1 | ) | | | 132 |
| | 4/12/2016 | | 5-40 years |
| South Park | (1 | ) | | 66,122 |
| | 4/12/2016 | | 5-40 years | (1 | ) | | | 154 |
| | 4/12/2016 | | 5-40 years |
| St. Matthews | (1 | ) | | 44,394 |
| | 4/12/2016 | | 5-40 years | (1 | ) | | | 99 |
| | 4/12/2016 | | 5-40 years |
| Berkley | (2 | ) | | 17,315 |
| | 11/10/2016 | | 5-40 years | (2 | ) | | | 115 |
| | 11/10/2016 | | 5-40 years |
| Sangaree | (2 | ) | | 23,851 |
| | 11/10/2016 | | 5-40 years | (2 | ) | | | 172 |
| | 11/10/2016 | | 5-40 years |
| Tri-County | (2 | ) | | 25,965 |
| | 11/10/2016 | | 5-40 years | (2 | ) | | | 178 |
| | 11/10/2016 | | 5-40 years |
| Riverbridge | 4,000,000 |
| | 30,278 |
| | 11/15/2016 | | 5-40 years | 4,000 |
| | | 209 |
| | 11/15/2016 | | 5-40 years |
| Laburnum Square | (1 | ) | | 15,831 |
| | 12/7/2016 | | 5-40 years | (1 | ) | | | 205 |
| | 12/7/2016 | | 5-40 years |
| Franklin Village | 8,515,000 |
| | 26,598 |
| | 12/12/2016 | | 5-40 years | 8,516 |
| | | 303 |
| | 12/12/2016 | | 5-40 years |
| Village at Martinsville | (1 | ) | | — |
| | 12/16/2016 | | 5-40 years | (1 | ) | | | 444 |
| | 12/16/2016 | | 5-40 years |
| New Market Crossing | (1 | ) | | — |
| | 12/20/2016 | | 5-40 years | (1 | ) | | | 170 |
| | 12/20/2016 | | 5-40 years |
| Rivergate Shopping Center | 24,212,500 |
| | — |
| | 12/21/2016 | | 5-40 years | 22,689 |
| | | 928 |
| | 12/21/2016 | | 5-40 years |
| Totals | | | $ | 20,488,542 |
| | | | | $ | 31,045 |
| |
(1) Properties secure a $75.0$68.0 million mortgage note.
(2) Properties secure a $9.4 million mortgage note.
(3) These properties secure a $3.0 million bank line of credit.
(4) Properties secure a $9.4 million mortgage note.
(5) Properties secure the $6.8 million Revere loan.
| | | | | | | | | 2017 | | 2016 |
| | 2016 | | 2015 | (in thousands) |
| Balance at beginning of period | $ | 252,831,140 |
| | $ | 160,627,402 |
| $ | 409,585 |
| | $ | 252,831 |
|
| Additions during the period: | | | | | | |
| Acquisitions | 157,024,946 |
| | 113,950,630 |
| — |
| | 157,025 |
|
| Improvements | 1,787,071 |
| | 1,301,313 |
| 7,367 |
| | 1,787 |
|
| Disposals | (2,057,533 | ) | | (23,048,205 | ) | (1,573 | ) | | (2,058 | ) |
| Balance at end of period | $ | 409,585,624 |
| | $ | 252,831,140 |
| $ | 415,379 |
| | $ | 409,585 |
|
EXHIBIT INDEX
|
| | |
| | | |
| Exhibit | | |
| | |
| | |
3.1 | | |
| | |
| | |
| | | |
| | |
| | | |
| | |
| |
| | |
| | |
| | |
| | | |
| | |
| | |
| | |
| | | |
| | |
| | | |
| | |
| | | |
| | |
| | |
| | |
| | | |
| | |
| | | |
| | |
| | | |
| | |
| | | |
| | |
| | | |
| | |
| | | |
| | |
| | | |
| | |
| | | |
| | |
| | | |
| | |
| | | |
| | |
| | |
| | |
| | | |
| | |
| | | |
| | |
| | | |
| | |
| | | |
| | |
| | |
| | |
| | | |
| | |
| | |
| | Employment Agreement with Steven M. Belote (12) |
| |
10.10 | | Employment Agreement with Robin A. Hanisch (12) |
| |
10.11 | | |
| | |
|
| | |
10.12 | | Subordination |
| | | |
10.13 | | Membership Interest Contribution |
| | | |
10.14 | | |
| | |
| | |
| | |
| | |
| | | |
| | Purchase and Sale Agreement dated November 30, 2015, by and among WHLR-ACD Acquisition Company, LLC and certain seller, for the purchase of the AC Portfolio. (9) |
| | |
10.16 | | P&W SC/GA Properties I, LLC Contribution and Subscription Agreement, Wheeler REIT, L.P. dated November 10, 2016 (21) |
| | |
10.17 | | South Main Streets, LLC Contribution and Subscription Agreement, Wheeler REIT, L.P. dated November 10, 2016 (21) |
| | |
10.18 | | |
| | | |
10.19 | | |
| | | |
10.20 | | |
| | | |
10.21 | | Credit Agreement, dated May 29, 2015, between Wheeler REIT, L.P. and KeyBank National Association. (11) |
| |
10.22 | | Subscription Agreement by and between Wheeler REIT, LP and A-C Development, LLC dated April 12, 2016. (13) |
| |
10.23 | | |
| |
10.24 | | First Amendment and Joinder Agreement to KeyBank Credit Agreement dated April 12, 2016. (13) |
| |
10.25 | | Second Amendment and Joinder Agreement to KeyBank Credit Agreement dated May 29, 2015. (19) |
| |
10.26 | | Tax Protection Agreement dated February 8, 2017 (15)(11) |
| | | |
12.1 | | Statement of Computation of Ratios (22) |
| | | |
14.1 | | Code of Ethics (2) |
| | | |
21.1 | | Purchase and Sale Agreement dated November 3, 2016 between WHLR-JANAF, LLC, JANAF Shopping Center, LLC, JANAF Shops, LLC, JANAF HQ, LLC, and JANAF Crossing, LLC. (20) |
| | |
| | |
| | |
| | |
| | |
| | |
| | |
| | |
| | |
| | |
| | |
| | |
| | |
| | |
| | |
| | |
| | |
| | |
| | |
| | |
| | |
| | |
| | |
| | |
| | |
| | |
| | |
| | |
| | |
| | |
| | |
| | |
| | |
| | |
| | |
| | |
| | |
| | |
| | |
| | |
| | |
|
| | |
| | |
| | |
| | |
| | |
| | |
| | |
| | |
| | |
| | | |
| 101.INS XBRL | | Instance Document (22)(23) |
| | | |
|
| | |
| 101.SCH | | XBRL Taxonomy Extension Schema Document (22)(23) |
| | | |
| | |
| | | |
| | |
| | | |
| | |
| | | |
| | |
| |
| (1) | Filed as an exhibit to the Registrant's report on Form 8-K, filed on August 8, 2016 and hereby incorporated by reference. |
| |
| (2) | Filed as an exhibit to the Registrant's Registration Statement on Form S-11 (Registration No. 333-177262) previously filed pursuant to the Securities Act of 1933 and hereby incorporated by reference. |
| |
| (3) | Filed as an exhibit to the Registrant's Registration Statement on Form S-11 (Registration No. 333-194831) previously filed pursuant to the Securities Act of 1933 and hereby incorporated by reference. |
| |
| (4) | Filed as an exhibit to the Registrant's Report on Form 8-K, filed on December 18, 2013 and hereby incorporated by reference. |
| |
| (5) | Filed as an exhibit to the Registrant's Registration Statement on Form S-11 (Registration No. 333-198245) previously filed pursuant to the Securities Act of 1933 and hereby incorporated by reference. |
| |
| (6) | Filed as an exhibit to the Registrant's Report on Form 8-K, filed on April 15, 2015 and hereby incorporated by reference. |
| |
| (7) | Filed as an exhibit to the Registrant's Report on Form 8-K, filed on June 8, 2015 and hereby incorporated by reference. |
| |
| (8) | Filed as an exhibit to the Registrant's report on Form 8-K, filed on October 30, 2014 and hereby incorporated by reference. |
| |
| (9) | Filed as an exhibit to the Registrant's Report on Form 8-K, filed on December 2,March 19, 2015 and hereby incorporated by reference. |
| |
| (10) | Filed as an exhibit to the Registrant's Report on Form 8-K, filed on March 19, 201516, 2016 and hereby incorporated by reference. |
| |
| (11) | Filed as an exhibit to the Registrant's Report on Form 8-K, filed on June 2, 2015 and hereby incorporate by reference. |
| |
(12) | Filed as an exhibit to the Registrant's Report on Form 8-K, filed on March 16, 2016 and hereby incorporated by reference. |
| |
(13) | Filed as an exhibit to the Registrant's Report on Form 8-K,8-K/A, filed on April 12, 2016 and hereby incorporated by reference. |
| |
(14)(12) | Filed as an exhibit to the Registrant's Report on Form 8-K, filed on May 2, 2016 and hereby incorporated by reference. |
| |
(15)(13) | Filed as an exhibit to the Registrant's Report on Form 8-K, filed on February 10, 2017 and hereby incorporated by reference. |
| |
(16)(14) | Filed as an exhibit to the Registrant's Report on Form 8-K, filed on June 16, 2016 and hereby incorporated by reference. |
| |
(17)(15) | Filed as an exhibit to the Registrant's Report on Form 8-K, filed on September 20, 2016.2016 and hereby incorporated by reference. |
| |
| (16) | Filed as an exhibit to the Registrant's Report on Form 8-K, filed on July 15, 2016 and hereby incorporated by reference. |
| |
| (17) | Filed as an exhibit to the Registrant's Report on Form 8-K, filed on December 5, 2016 and hereby incorporated by reference. |
| |
| (18) | Filed as an exhibit to the Registrant's Report on Form 8-K, filed on July 15, 2016.April 3, 2017 and hereby incorporated by reference. |
| |
| (19) | Filed as an exhibit to the Registrant's Report on Form 8-K/A,8-K, filed on December 12, 201622, 2017 and hereby incorporated by reference. |
| |
| (20) | Filed as an exhibit to the Registrant's Report on Form 8-K, filed on December 5, 2016.January 9, 2018 and hereby incorporated by reference. |
| |
| (21) | Filed as an exhibit to the Registrant's Report on Form 8-K, filed on November 16, 2016January 23, 2018 and hereby incorporated by reference. |
| |
| (22) | Filed as an exhibit to the Registrant's Report on Form 8-K, filed on February 20, 2018 and hereby incorporated by reference. |