UNITED STATES
SECURITIES AND EXCHANGE COMMISSION
Washington, D.C. 20549
FORM 10-K
(Mark one)
| | | | | |
| ☒ | ANNUAL REPORT PURSUANT TO SECTION 13 OR 15(d) OF THE SECURITIES EXCHANGE ACT OF 1934 |
For the fiscal year ended: December 31, 20212023
or
| | | | | |
| ☐ | TRANSITION REPORT PURSUANT TO SECTION 13 OR 15(d) OF THE SECURITIES EXCHANGE ACT OF 1934 |
For the transition period from to
Commission File Number: 001-35764
Commission File Number: 333-206728-02
PBF ENERGY INC.
PBF ENERGY COMPANY LLC
(Exact name of registrant as specified in its charter)
| | | | | | | | | | | |
| Delaware | | 45-3763855 |
| Delaware | | 61-1622166
| | | |
| (State or other jurisdiction of incorporation or organization) | | (I.R.S. Employer Identification No.) |
| | |
| One Sylvan Way, Second Floor | | |
| Parsippany | New Jersey | | 07054 |
| (Address of principal executive offices) | | (Zip Code) |
(973) 455-7500
(Registrants’ telephone number, including area code)
Securities registered pursuant to Section 12(b) of the Act.
| | | | | | | | | | | |
| Title of Each Class | Trading Symbol | Name of Each Exchange on Which Registered |
| Class A Common Stock, par value $.001 | PBF | New York Stock Exchange |
Securities registered pursuant to Section 12(g) of the Act: None.
Indicate by check mark if the registrant is a well-known seasoned issuer, as defined in Rule 405 of the Securities Act.
PBF Energy Inc. x Yes o No
PBF Energy Company LLC oYes x No
Indicate by check mark if the registrant is not required to file reports pursuant to Section 13 or Section 15(d) of the Act.
PBF Energy Inc. o Yes x No
PBF Energy Company LLC oYes x No
Indicate by check mark whether the registrant (1) has filed all reports required to be filed by Section 13 or 15(d) of the Securities Exchange Act of 1934 during the preceding 12 months (or for such shorter period that the registrant was required to file such reports), and (2) has been subject to such filing requirements for the past 90 days.
PBF Energy Inc. x Yes o No
PBF Energy Company LLC x Yes o No
Indicate by check mark whether the registrant has submitted electronically every Interactive Data File required to be submitted and posted pursuant to Rule 405 of Regulation S-T (§232.405 of this chapter) during the preceding 12 months (or for such shorter period that the registrant was required to submit and post such files).
PBF Energy Inc. x Yes o No
PBF Energy Company LLC x Yes o No
Indicate by check mark whether the registrant is a large accelerated filer, an accelerated filer, a non-accelerated filer, a smaller reporting company or an emerging growth company. See the definitions of “large accelerated filer,” “accelerated filer,” “smaller reporting company” and “emerging growth company” in Rule 12b-2 of the Exchange Act.
| | | | | | | | | | | | | | | | | | | | | | | | | | | | | | | | |
PBF Energy Inc. | Large accelerated
filer | ☒ | Accelerated filer | ☐ | Non-accelerated filer | ☐ | Smaller reporting
company | ☐ | Emerging growth company | ☐ |
PBF Energy Company LLC | Large accelerated
filer | ☐ | Accelerated filer | ☐ | Non-accelerated filer | ☒ | Smaller reporting
company | ☐ | Emerging growth company | ☐ |
If an emerging growth company, indicate by check mark if the registrant has elected not to use the extended transition period for complying with any new or revised financial accounting standards provided pursuant to Section 13(a) of the Exchange Act.
PBF Energy Inc. o
PBF Energy Company LLC o
Indicate by check mark whether the registrant has filed a report on and attestation to its management’s assessment of the effectiveness of its internal control over financial reporting under section 404(b) of the Sarbanes-Oxley Act (15 U.S.C. 7262(b)) by the registered public accounting firm that prepared or issued its audit report.
PBF Energy Inc. ☒
PBF Energy Company LLCIf securities are registered pursuant to Section 12(b) of the Act, indicate by check mark whether the financial statements of the registrant included in the filing reflect the correction of an error to previously issued financial statements. ☒o
Indicate by check mark whether any of those error corrections are restatements that required a recovery analysis of incentive-based compensation received by any of the registrant’s executive officers during the relevant recovery period pursuant to §240.10D-1(b). o
Indicate by check mark whether the registrant is a shell company (as defined in Rule 12b-2 of the Exchange Act).
PBF Energy Inc. ☐ Yes ☒ No
PBF Energy Company LLC ☐Yes ☒ No
The aggregate market value of the Common Stock of PBF Energy Inc. held by non-affiliates as of June 30, 2021,2023, the last business day of the registrant’s most recently completed second fiscal quarter, was approximately $1.1$5.0 billion based upon the New York Stock Exchange Composite Transaction closing price.
As of February 10, 2022,9, 2024, PBF Energy Inc. had outstanding 120,338,300119,558,480 shares of Class A common stock and 1512 shares of Class B common stock. PBF Energy Inc. is the sole managing member of, and owner of an equity interest representing approximately 99.2% of the outstanding economic interest in PBF Energy Company LLC as of December 31, 2021. There is no trading in the membership interest of PBF Energy Company LLC and therefore an aggregate market value based on such is not determinable. PBF Energy Company LLC has no common stock outstanding.
DOCUMENTS INCORPORATED BY REFERENCE
PBF Energy Inc. intends to file with the Securities and Exchange Commission a definitive Proxy Statement for its Annual Meeting of Stockholders within 120 days after December 31, 2021.2023. Portions of the Proxy Statement are incorporated by reference in Part III of this Form 10-K to the extent stated herein.
PBF ENERGY INC. AND PBF ENERGY COMPANY LLC
TABLE OF CONTENTS
| | | | | | | | | | | |
| PART I | |
| | | |
| | | |
| | | |
| | | |
| | | |
| | | |
| | | |
| | | |
| | | |
| PART II | |
| | | |
| | | |
| | | |
| | | |
| | | |
| | | |
| | | |
| | | |
| | | |
| |
| PART III | |
| | | |
| | | |
| | | |
| | | |
| | | |
| | | |
| | | |
| PART IV | |
| | | |
| | | |
| | | |
| |
GLOSSARY OF SELECTED TERMS
Unless otherwise noted or indicated by context, the following terms used in this Annual Report on Form 10-K have the following meanings:
“AB 32” refers to the greenhouse gas emission control regulations in the state of California to comply with Assembly Bill 32.
“ANS” refers to Alaskan North Slope crude oil reflective of West Coast economics, characterized by API gravity between 28° and 35°.
“ASCI” refers to the Argus Sour Crude Index, a pricing index used to approximate market prices for sour, heavy crude oil.
“Bakken” refers to both a crude oil production region generally covering North Dakota, Montana and Western Canada, and the crude oil that is produced in that region.
“barrel” refers to a common unit of measure in the oil industry, which equates to 42 gallons.
“blendstocks” refers to various compounds that are combined with gasoline or diesel from the crude oil refining process to make finished gasoline and diesel; these may include natural gasoline, FCC unit gasoline, ethanol, reformate or butane, among others.
“bpd” is an abbreviation for barrels per day.
“CAM Pipeline” or “CAM Connection Pipeline” refers to the Clovelly-Alliance-Meraux pipeline in Louisiana.
“CARB” refers to the California Air Resources Board; gasoline and diesel fuel sold in the state of California are regulated by CARB and require stricter quality and emissions reduction performance than required by other states.
“catalyst” refers to a substance that alters, accelerates, or instigates chemical changes, but is not produced as a product of the refining process.
“coke” refers to a coal-like substance that is produced from heavier crude oil fractions during the refining process.
“complexity” refers to the number, type and capacity of processing units at a refinery, measured by the Nelson Complexity Index, which is often used as a measure of a refinery’s ability to process lower quality crude in an economic manner.
“COVID-19” refers to the 2019 outbreak of the novel coronavirus pandemic.
“crack spread” refers to a simplified calculation that measures the difference between the price for light products and crude oil. For example, we reference (a) the 2-1-1 crack spread, which is a general industry standard utilized by our Delaware City, Paulsboro and Chalmette refineries that approximates the per barrel refining margin resulting from processing two barrels of crude oil to produce one barrel of gasoline and one barrel of heating oil or ULSD, (b) the 4-3-1 crack spread, which is a benchmark utilized by our Toledo and Torrance refineries that approximates the per barrel refining margin resulting from processing four barrels of crude oil to produce three barrels of gasoline and one-half barrel of jet fuel and one-half barrel of ULSD and (c) the 3-2-1 crack spread, which is a benchmark utilized by our Martinez refinery that approximates the per barrel refining margin resulting from processing three barrels of crude oil to produce two barrels of gasoline and three-quarters of a barrel jet fuel and one-quarter of a barrel ULSD.
“Dated Brent” refers to Brent blend oil, a light, sweet North Sea crude oil, characterized by an American Petroleum Institute (“API”) gravity of 38° and a sulfur content of approximately 0.4 weight percent that is used as a benchmark for other crude oils.
“distillates” refers primarily to diesel, heating oil, kerosene and jet fuel.
“DNREC” refers to the Delaware Department of Natural Resources and Environmental Control.
“downstream” refers to the downstream sector of the energy industry generally describing oil refineries, marketing and distribution companies that refine crude oil and sell and distribute refined products. The opposite of the downstream sector is the upstream sector, which refers to exploration and production companies that search for and/or produce crude oil and natural gas underground or through drilling or exploratory wells.
“Eni” refers to Eni Sustainable Mobility US Inc., a subsidiary of Eni SpA.
“EPA” refers to the United States Environmental Protection Agency.
“ESG” refers to environmental, social, and governance matters.
“ethanol” refers to a clear, colorless, flammable oxygenated liquid. Ethanol is typically produced chemically from ethylene, or biologically from fermentation of various sugars from carbohydrates found in agricultural crops. It is used in the United States as a gasoline octane enhancer and oxygenate.
“Ethanol Permit” refers to the Coastal Zone Act permit for ethanol issued to our Delaware City refinery.
“ExxonMobil” refers to Exxon Mobil Oil Corporation.
“FASB” refers to the Financial Accounting Standards Board which develops U.S. generally accepted accounting principles.
“FCC” refers to fluid catalytic cracking.
“feedstocks” refers to crude oil and partially refined products that are processed and blended into refined products.
“GAAP” refers to U.S. generally accepted accounting principles developed by FASBthe Financial Accounting Standards Board for nongovernmental entities.
“GHG” refers to greenhouse gas.
“Group I base oils or lubricants” refers to conventionally refined products characterized by sulfur content less than 0.03% with a viscosity index between 80 and 120. Typically, these products are used in a variety of automotive and industrial applications.
“heavy crude oil” refers to a relatively inexpensive crude oil with a low API gravity characterized by high relative density and viscosity. Heavy crude oils require greater levels of processing to produce high value products such as gasoline and diesel.
“IDRs” refer to incentive distribution rights.
“IPO” refers to the initial public offering of PBF Energy Class A common stock which closed on December 18, 2012.
“IRA” refers to the Inflation Reduction Act; a U.S. federal law enacted on August 16, 2022 that resulted in significant law changes related to tax, climate change, energy, and health care. The tax provision includes, but is not limited to, a corporate alternative minimum tax of 15%, excise tax of 1% on certain corporate stock buy-backs, energy-related tax credits and incentives, and additional Internal Revenue Service (“IRS”) funding.
“J. Aron” refers to J. Aron & Company, a subsidiary of The Goldman Sachs Group, Inc.
“KV” refers to Kilovolts.
“LCM” refers to a GAAP requirement for inventory to be valued at the lower of cost or market.
“light crude oil” refers to a relatively expensive crude oil with a high API gravity characterized by low relative density and viscosity. Light crude oils require lower levels of processing to produce high value products such as gasoline and diesel.
“light-heavy differential” refers to the price difference between light crude oil and heavy crude oil.
“light products” refers to the group of refined products with lower boiling temperatures, including gasoline and distillates.
“LLS” refers to Light Louisiana Sweet benchmark for crude oil reflective of Gulf coast economics for light sweet domestic and foreign crudes. It is characterized by an API gravity of between 35° and 40° and a sulfur content of approximately .35 weight percent.
“LPG” refers to liquefied petroleum gas.
“Maya” refers to Maya crude oil, a heavy, sour crude oil characterized by an API gravity of approximately 22° and a sulfur content of approximately 3.3 weight percent that is used as a benchmark for other heavy crude oils.
“MLP” refers to the master limited partnership.
“MMBTU” refers to million British thermal units.
“MOEM Pipeline” refers to a pipeline that originates at a terminal in Empire, Louisiana approximately 30 miles north of the mouth of the Mississippi River. The MOEM Pipeline is 14 inches in diameter, 54 miles long and transports crude from South Louisiana to the Chalmette refinery and transports Heavy Louisiana Sweet (HLS) and South Louisiana Intermediate (SLI) crude.
“MW” refers to Megawatt.
“Nelson Complexity Index” refers to the complexity of an oil refinery as measured by the Nelson Complexity Index, which is calculated on an annual basis by the Oil and Gas Journal. The Nelson Complexity Index assigns a complexity factor to each major piece of refinery equipment based on its complexity and cost in comparison to crude distillation, which is assigned a complexity factor of 1.0. The complexity of each piece of refinery equipment is then calculated by multiplying its complexity factor by its throughput ratio as a percentage of crude distillation capacity. Adding up the complexity values assigned to each piece of equipment, including crude distillation, determines a refinery’s complexity on the Nelson Complexity Index. A refinery with a complexity of 10.0 on the Nelson Complexity Index is considered ten times more complex than crude distillation for the same amount of throughput.
“NYH” refers to the New York Harbor market value of petroleum products.
“OSHA” refers to the Occupational Safety and Health Administration of the U.S. Department of Labor.
“PADD” refers to Petroleum Administration for Defense Districts.
“refined products” refers to petroleum products, such as gasoline, diesel and jet fuel, that are produced by a refinery.
“Renewable Fuel Standard” or “RFS” refers to the Renewable Fuel Standard issued pursuant to the Energy Independence and Security Act of 2007 implementing mandates to blend renewable fuels into petroleum fuels produced and sold in the United States.
“RINs” refers to renewable fuel credits required for compliance with the Renewable Fuel Standard.
“Saudi Aramco” refers to Saudi Arabian Oil Company.
“SEC” refers to the United States Securities and Exchange Commission.
“sour crude oil” refers to a crude oil that is relatively high in sulfur content, requiring additional processing to remove the sulfur. Sour crude oil is typically less expensive than sweet crude oil.
“Sunoco” refers to Sunoco, LLC.
“sweet crude oil” refers to a crude oil that is relatively low in sulfur content, requiring less processing to remove the sulfur than sour crude oil. Sweet crude oil is typically more expensive than sour crude oil.
“Syncrude” refers to a blend of Canadian synthetic oil, a light, sweet crude oil, typically characterized by API gravity between 30° and 32° and a sulfur content of approximately 0.1-0.2 weight percent.
“TCJA” refers to the U.S. government comprehensive tax legislation enacted on December 22, 2017 and commonly referred to as the Tax Cuts and Jobs Act.
“throughput” refers to the volume processed through a unit or refinery.
“turnaround” refers to a periodically required shutdown and comprehensive maintenance event to refurbish and maintain a refinery unit or units that involves the cleaning, repair, and inspection of such units and occurs generally on a periodic cycle.
“ULSD” refers to ultra-low-sulfur diesel.
“WCS” refers to Western Canadian Select, a heavy, sour crude oil blend typically characterized by API gravity between 20° and 22° and a sulfur content of approximately 3.5 weight percent that is used as a benchmark for heavy Western Canadian crude oil.
“WTI” refers to West Texas Intermediate crude oil, a light, sweet crude oil, typically characterized by API gravity between 38° and 40° and a sulfur content of approximately 0.3 weight percent that is used as a benchmark for other crude oils.
“WTS” refers to West Texas Sour crude oil, a sour crude oil characterized by API gravity between 30° and 33° and a sulfur content of approximately 1.28 weight percent that is used as a benchmark for other sour crude oils.
“yield” refers to the percentage of refined products that is produced from crude oil and other feedstocks.
Explanatory Note
This Annual Report on Form 10-K is filed by PBF Energy Inc. (“PBF Energy”) and PBF Energy Company LLC (“PBF LLC”). Each Registrant hereto is filing on its own behalf all of the information contained in this report that relates to such Registrant. Each Registrant hereto is not filing any information that does not relate to such Registrant, and therefore makes no representation as to any such information. PBF Energywhich is a holding company whose primary asset is an equity interest in PBF LLC.Energy Company LLC (“PBF LLC”). PBF Energy is the sole managing member of, and owner of an equity interest representing approximately 99.2%99.3% of the outstanding economic interests in PBF LLC as of December 31, 2021.2023. PBF Energy operates and controls all of the business and affairs and consolidates the financial results of PBF LLC and its subsidiaries. PBF LLC is a holding company for the companies that directly and indirectly own and operate theour business. As of December 31, 2021, PBF LLC also holds a 47.9% limited partner interest and a non-economic general partner interest in PBF Logistics LP (“PBFX”), a publicly-traded MLP.
PART I
This Annual Report on Form 10-K is filed by PBF Energy and PBF LLC. Discussions or areas of this report that either apply only to PBF Energy or PBF LLC are clearly noted in such sections. Unless the context indicates otherwise, the terms “Company”, “we,” “us,” and “our” refer to both PBF Energy and PBF LLC and its consolidated subsidiaries, including PBF LLC, PBF Holding Company LLC (“PBF Holding”), PBF Investments LLC, (“PBF Investments”), Toledo Refining Company LLC, Paulsboro Refining Company LLC (“PRC”), Delaware City Refining Company LLC (“DCR”), Chalmette Refining, L.L.C. (“Chalmette Refining”), PBF Energy Western Region LLC (“PBF Western Region”), Torrance Refining Company LLC (“Torrance Refining”), Torrance Logistics Company LLC, Martinez Refining Company LLC (“MRC”), PBF Logistics GP LLC (“PBFPBFX GP”) and PBFX.PBF Logistics LP (“PBFX”) and its subsidiaries.
In this Annual Report on Form 10-K, we make certain forward-looking statements, including statements regarding our plans, strategies, objectives, expectations, intentions, and resources, under the safe harbor provisions of the Private Securities Litigation Reform Act of 1995 to the extent such statements relate to the operations of an entity that is not a limited liability company or a partnership. You should read our forward-looking statements together with our disclosures under the heading: “Cautionary Statement for the Purpose of Safe Harbor Provisions of the Private Securities Litigation Reform Act of 1995.” When considering forward-looking statements, you should keep in mind the risk factors and other cautionary statements set forth in this Annual Report on Form 10-K under “Risk Factors” in Item 1A.
ITEM. 1ITEM 1. BUSINESS
Overview and Corporate Structure
We are one of the largest independent petroleum refiners and suppliers of unbranded transportation fuels, heating oil, petrochemical feedstocks, lubricants and other petroleum products in the United States. We sell our products throughout the Northeast, Midwest, Gulf Coast and West Coast of the United States, as well as in other regions of the United States, Canada and Mexico and are able to ship products to other international destinations. As of December 31, 2021, weWe own and operate six domestic oil refineries and related assets. Based onassets and own a 50% interest in a biorefinery co-located with the current configuration (as disclosedChalmette refinery in the “Refining” section below)Louisiana (the “Renewable Diesel Facility”) through our SBR equity method investment. Our refineries have a combined processing capacity, known as throughput, of approximately 1,000,000 bpd, and a weighted-average Nelson Complexity Index of 13.212.7 based on current operating conditions. The complexity and throughput capacity of our refineries are subject to change dependent upon configuration changes we make to respond to market conditions, as well as a result of investments made to improve our facilities and maintain compliance with environmental and governmental regulations. We operate in two reportable business segments: Refining and Logistics. Our six oil refineries are all engaged in the refining of crude oil and other feedstocks into petroleum products, and represent the Refining segment. PBFX operates certain logistical assets such as crude oil and refined products terminals, pipelines, and storage facilities, which represent the Logistics segment.
PBF Energy is a holding company whose primary asset is a controlling equity interest in PBF LLC. We are the sole managing member of PBF LLC and operate and control all of the business and affairs of PBF LLC. We consolidate the financial results of PBF LLC and its subsidiaries and record a noncontrolling interest in our consolidated financial statements representing the economic interests of the members of PBF LLC other than PBF Energy.Energy (as defined below). PBF LLC is a holding company for the companies that directly or indirectly own and operate our business. PBF Holding is a wholly-owned subsidiary of PBF LLC and is the parent company for our refining operations. PBF Energy, through its ownershipPBFX is an indirect wholly-owned subsidiary of PBF LLC also consolidates the financial results of PBFXthat owns and records a noncontrolling interest for the economic interests in PBFX held by the public common unitholders of PBFX.operates logistics assets that support our refining operations.
As of December 31, 2021,2023, PBF Energy held 120,340,808120,461,851 PBF LLC Series C Units and our current and former executive officers and directors and certain employees and others held 927,990862,780 PBF LLC Series A Units (we refer to all of the holders of the PBF LLC Series A Units as “the members of PBF LLC other than PBF Energy”). As a result, the holders of PBF Energy’s issued and outstanding shares of its Class A common stock have approximately 99.2%99.3% of the voting power in PBF Energy, and the members of PBF LLC other than PBF Energy through their holdings of Class B common stock have approximately 0.8%0.7% of the voting power in PBF Energy.
As of December 31, 2021, PBF LLC held a 47.9% limited partner interest (consisting of 29,953,631 common units) in PBFX, with the remaining 52.1% limited partner interest held by the public unitholders. PBF LLC also indirectly owns a non-economic general partner interest in PBFX through its wholly-owned subsidiary, PBF GP, the general partner of PBFX.
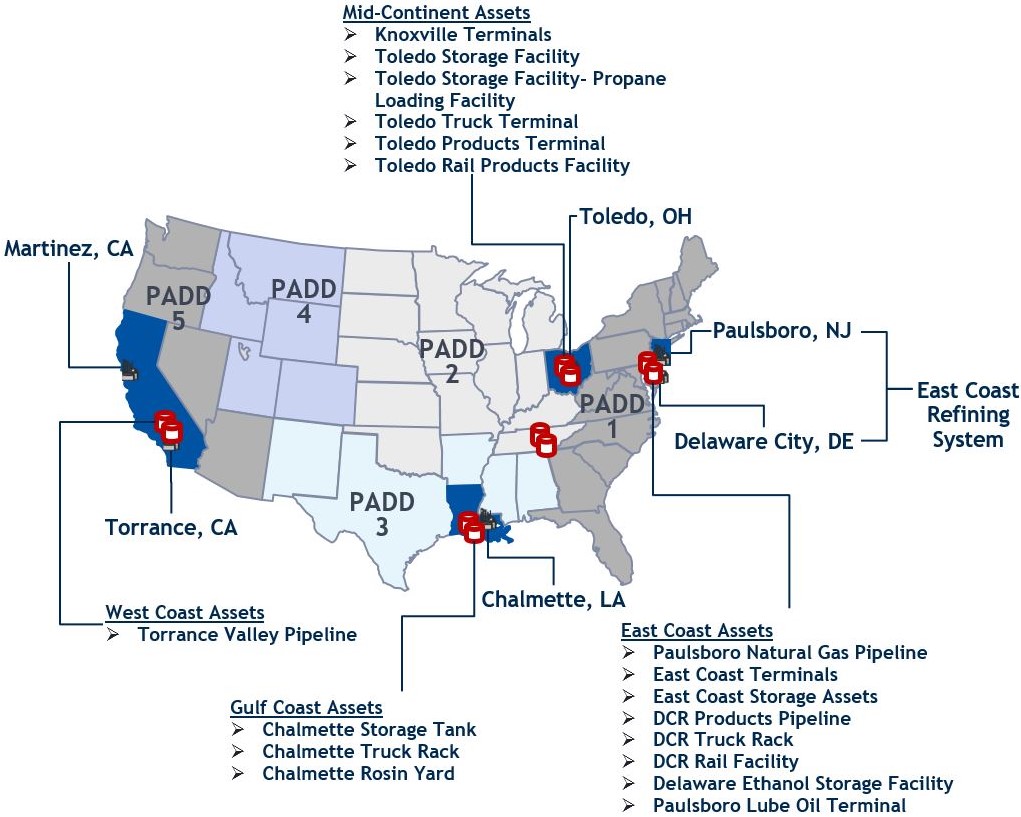
The following map details the locations of our refineries and the location of PBFX’s assets as of December 31, 2021 (each as defined below):
Refining
Our six refineries are located in Delaware City, Delaware, Paulsboro, New Jersey, Toledo, Ohio, Chalmette, Louisiana, Torrance, California and Martinez, California. In 2020, we reconfigured our Delaware and Paulsboro refineries (the “East Coast Refining Reconfiguration”), temporarily idling certain of our major processing units at the Paulsboro refinery, in order to operate the two refineries as one functional unit that we refer to as the “East Coast Refining System”. Each refinery is briefly described in the table below:
| | Refinery | Refinery | Region | Nelson Complexity Index (1) | Throughput Capacity (in barrels per day) (1) | PADD | Crude Processed (2) | Source (2) | Refinery | Region | Nelson Complexity Index (1) | Throughput Capacity (in barrels per day) (1) | PADD | Crude Processed (2) | Source (2) |
| Delaware City | Delaware City | East Coast | 13.6 | 180,000 | 1 | light sweet through heavy sour | water, rail | Delaware City | East Coast | 13.6 | 180,000 | 1 | light sweet through heavy sour | water, rail |
| Paulsboro | Paulsboro | East Coast | 10.4(3) | 105,000(3) | 1 | light sweet through heavy sour | water | Paulsboro | East Coast | 8.8(3) | 155,000(3) | 1 | light sweet through heavy sour | water |
| Toledo | Toledo | Mid-Continent | 11.0 | 180,000 | 2 | light sweet | pipeline, truck, rail | Toledo | Mid-Continent | 11.0 | 180,000 | 2 | light sweet | pipeline, truck, rail |
| Chalmette | Chalmette | Gulf Coast | 13.0 | 185,000 | 3 | light sweet through heavy sour | water, pipeline | Chalmette | Gulf Coast | 13.0 | 185,000 | 3 | light sweet through heavy sour | water, pipeline |
| Torrance | Torrance | West Coast | 13.8 | 166,000 | 5 | medium and heavy | pipeline, water, truck | Torrance | West Coast | 13.8 | 166,000 | 5 | medium and heavy | pipeline, water, truck |
| Martinez | Martinez | West Coast | 16.1 | 157,000 | 5 | medium and heavy | pipeline and water | Martinez | West Coast | 16.1 | 157,000 | 5 | medium and heavy | pipeline and water |
________
(1) Reflects operating conditions at each refinery as of the date of this filing. Changes in complexity and throughput capacity reflect the result of current market conditions, such as our East Coast Refining Reconfiguration, in addition to investments made to improve our facilities and maintain compliance with environmental and governmental regulations. Configurations at each of our refineries are evaluated periodically and updated accordingly.
(2) Reflects the typical crude and feedstocks and related sources utilized under normal operating conditions and prevailing market environments.
(3) Under normal operating conditions and prevailing market environments, our Nelson Complexity Index and throughput capacity for the Paulsboro refinery would be 13.1 and 180,000, respectively. As a result of the reconfiguration of our East Coast Refining Reconfiguration,refineries in 2020, and subsequent restart of several idled processing units at the Paulsboro refinery in 2022, our Nelson Complexity Index and throughput capacity were reduced.adjusted.
Logistics
PBFX, is a fee-based, growth-oriented, publicly-traded Delaware MLP formed byan indirect wholly-owned subsidiary of PBF Energy to ownand PBF LLC, owns or lease, operate, developleases, operates, develops and acquireacquires crude oil and refined products terminals, pipelines, storage facilities and similar logistics assets. PBFX engages in the receiving, handling, storage and transferring of crude oil, refined products, natural gas and intermediates from sources located throughout the United States and Canada for PBF Energy in support of its refineries, as well as for third-party customers. The majority of PBFX’s revenues are derived from long-term, fee-based commercial agreements with PBF Holding, which include minimum volume commitments, for receiving, handling, storing and transferring crude oil, refined products and natural gas. PBF Energy also has agreements with PBFX that establish fees for certain general and administrative services and operational and maintenance services provided by PBF Holding to PBFX. These transactions, other than those with third parties, are eliminated by us in consolidation.
See “Item 1A. Risk Factors” and “Item 13. Certain Relationships and Related Transactions, and Director Independence.”
Recent Developments
COVID-19Renewable Diesel Facility
On June 27, 2023, the Company and Market DevelopmentsEni completed the closing of the equity method investment transaction and the capitalization of SBR, a jointly held investee designed to own, develop, and operate the Renewable Diesel Facility. We contributed the SBR business, which had a total estimated fair value of $1.69 billion, excluding working capital. Eni has contributed $845.6 million of total consideration, which consisted of $431.0 million of cash distributed to us at close and an additional $414.6 million of cash contributed after the commercial start up of the pre-treatment unit in July 2023. SBR now owns the Renewable Diesel Facility. During the year ended December 31, 2023, we recorded a gain of $925.1 million resulting from the difference between the fair value of the consideration received, including our 50% noncontrolling interest, and the carrying value of the related assets contributed. As stipulated in the agreements with Eni, we managed project execution and will continue to serve as the operator of the facility. Please see “Note 6 - Equity Investment in SBR” of our Notes to Consolidated Financial Statements, for additional information.
The ongoing COVID-19 pandemic continuesfacility has the capacity to negatively impact worldwide economicproduce 20,000 bpd of renewable diesel from corn oil, soybean oil, fats and commercial activity.greases. The COVID-19 pandemicproduced renewable diesel generates federal RINs and the related governmentalLow Carbon Fuel Standard (“LCFS”) credits when sold in California or similar markets. The Company can purchase these credits from SBR in order to help manage its RFS and consumer responses, resulted in significant business and operational disruptions, including business and school closures, supply chain disruptions, travel restrictions, stay-at-home orders and limitations on the availability of workforces, significantly lowering global demand for refined petroleum and petrochemical products. We have seen the demand for these products starting to rebound in 2021LCFS compliance obligations as a result of the lifting or easing of governmental restrictions and the distribution of COVID-19 vaccines and other protective measures. Despite these signs of improvements, the resulting economic consequences of the COVID-19 pandemic remain uncertain and will depend on the ongoing severity, location and duration of the pandemic and variants thereof, the effectiveness of the vaccine programs, and the related impact on overall economic activity, all of which cannot be predicted with certainty at this time.
We continue to adjust our operational plans to the evolving market conditions and continue to monitor and maintain lower operating expenses through significant reductions in discretionary activities and third-party services. In the fourth quarter of 2020, we successfully reconfigured our East Coast Refining System to maintain the most profitable elements of two refineries while reducing costs and improving our competitive position.
We also remain focused on enhancing the profitability and reliability of our core operations. While our refining capital expenditures in 2022 are projected to increase in comparison to 2021, we continue to focus on capital discipline, with turnaround and other mandatory spend accounting for the majority of total planned refining capital expenses for 2022. Consistent with our prior year approach, we will be responsive with regards to the pace of capital expenditures and scope of turnarounds depending on market conditions. Our 2022 estimate for maintenance, environmental, regulatory and safety capital expenditures are estimated to remain in line with our historical average of $150.0 million to $200.0 million. For the first half of 2022, we expect to incur turnaround-related capital expenditures of approximately $200.0 million to $225.0 million, primarily relating to turnarounds at our East and West Coast refineries.
Renewable Diesel Project
We are currently progressing on our renewable diesel project that will be located at our Chalmette refinery. The project will incorporate certain existing idled assets at the refinery, including an idle hydrocracker, along with a newly-constructed pre-treatment unit to establish a 20,000 barrel per day renewable diesel production facility. To date the project has been focused on completing engineering, permitting, securing longer-lead time equipment and commencing initial site preparations. We are also currently engaging in discussions with potential strategic and financial partners for the project.petroleum fuel producer.
Available Information
Our website address is www.pbfenergy.com. Information contained on our website is not part of this Annual Report on Form 10-K. Our Annual Reports on Form 10-K, Quarterly Reports on Form 10-Q, Current Reports on Form 8-K, and any other materials filed with (or furnished to) the SEC by us are available on our website (under “Investors”) free of charge, soon after we file or furnish such material. In this same location, we also post our corporate governance guidelines, code of business conduct and ethics, and the charters of the committees of our Board of Directors. These documents are available free of charge in print to any stockholder that makes a written request to the Secretary, PBF Energy Inc., One Sylvan Way, Second Floor, Parsippany, New Jersey 07054.
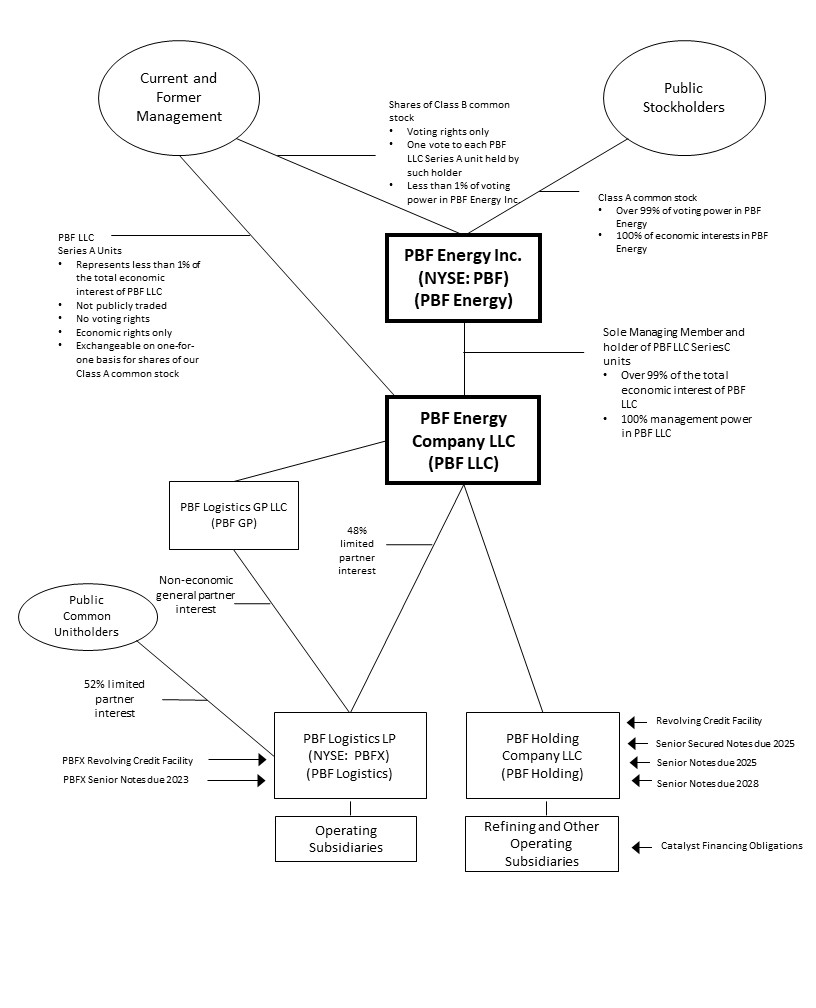
The diagram below depicts our organizational structure as of December 31, 2021:2023:
Operating Segments
We operate in two reportable business segments: Refining and Logistics. Our six oil refineries, including certain related logistics assets that are not owned by PBFX, are engaged in the refining of crude oil and other feedstocks into petroleum products, and are aggregated intorepresent the Refining segment. PBFX operates certain logistics assets such as crude oil and refined products terminals, pipelines and storage facilities. Certain of PBFX’s assets were previously operated and owned by various subsidiaries of PBF Holding and were acquired by PBFX in a series of transactions since its inception. PBFX is reported in the Logistics segment. A substantial majority of PBFX’s revenues are derived from long-term, fee-based commercial agreements with PBF Holding and its subsidiaries and these intersegment related revenues are eliminated in consolidation. See “Note 2219 - Segment Information” of our Notes to Consolidated Financial Statements, for detailed information on our operating results by business segment.
Refining Segment
We own and operate six refineries (two of which are operated as a single unit) that provide us with geographic and market diversity. We produce a variety of products at each of our refineries, including gasoline, ULSD, heating oil, jet fuel, lubricants, petrochemicals and asphalt. We sell our products throughout the Northeast, Midwest, Gulf Coast and West Coast of the United States, as well as in other regions of the United States, Canada and Mexico, and are able to ship products to other international destinations.
Our refinery assets as of December 31, 20212023 are described below.
East Coast Refining System (Delaware City Refinery and Paulsboro Refinery)
Overview. The Delaware City refinery is located on an approximately 5,000-acre site, with access to waterborne cargoes and an extensive distribution network of pipelines, barges and tankers, truck and rail. The Delaware City refinery is a fully integrated operation that receives crude via rail at our crude unloading facilities, owned by PBFX, or via ship or barge at the docks owned by the Delaware City refinery located on the Delaware River. The crude and other feedstocks are stored in an extensive tank farm prior to processing. In addition, there is a 15-lane, 76,000 bpd capacity truck loading rack (the “DCR Truck Rack”) located adjacent to the refinery and a 23-mile interstate pipeline (the “DCR Products Pipeline”) that are used to distribute clean products. The DCR Products Pipeline and DCR Truck Rack were sold to PBFX and PBFX owns additional assets that support the Delaware City refinery. The Paulsboro refinery is located on approximately 950-acres on the Delaware River in Paulsboro, New Jersey, near Philadelphia and approximately 30 miles away from Delaware City. Paulsboro receives crude and feedstocks via its marine terminal on the Delaware River.
As a result of its configuration and process units, Delaware City has the capability of processing a slate of heavy crudes with a high concentration of high sulfur crudes, as well as other high sulfur feedstock when economically viable, and is one of the largest and most complex refineries on the East Coast. The Delaware City refinery is one of two heavy crude processing refineries, the other being our Paulsboro refinery, on the East Coast of the United States. The Delaware City coking capacity is equal to approximately 25% of crude capacity.
The Delaware City refinery primarily processes a variety of medium to heavy, sour crude oils, but can run light, sweet crude oils as well. The refinery has large conversion capacity with its 82,000 bpd FCC unit, 54,500 bpd fluid coking unit and 24,000 bpd hydrocracking unit.
The following table approximates the East Coast Refining System’s current major process unit capacities. Unit capacities are shown in barrels per stream day.
| | | | | | | | |
| Delaware City Refinery Units | | Nameplate
Capacity |
| Crude Distillation Unit | | 180,000 | |
| Vacuum Distillation Unit | | 105,000 | |
| Fluid Catalytic Cracking Unit | | 82,000 | |
| Hydrotreating Units | | 180,000 | |
| Hydrocracking Unit | | 24,000 | |
| Catalytic Reforming Unit | | 43,000 | |
| Benzene / Toluene Extraction Unit | | 15,000 | |
| Butane Isomerization Unit | | 6,000 | |
| Alkylation Unit | | 12,500 | |
| Polymerization Unit | | 16,000 | |
| Fluid Coking Unit | | 54,500 | |
| | | | | | | | |
| Paulsboro Refinery Units | | Nameplate
Capacity |
Crude Distillation Units (1) | | 105,000155,000 | |
Vacuum Distillation Units (1) | | 50,000 | |
Fluid Catalytic Cracking Unit (1) | | Idled |
Hydrotreating Units (1) | | 61,000102,000 | |
Catalytic Reforming Unit (1) | | 29,000 | | Idled
Alkylation Unit (1) | | Idled |
| Lube Oil Processing Unit | | 12,000 | |
Delayed Coking Unit (1) | | Idled |
| Propane Deasphalting Unit | | 11,000 | |
__________________________
(1) Current nameplate capacity was fully or partially reduced to reflect the idled units as part of the East2020 reconfiguration of our Delaware City and Paulsboro refineries (the “East Coast Refining Reconfiguration.Reconfiguration”).
Feedstocks and Supply Arrangements. We source our crude oil and feedstock needs for Delaware Citythe East Coast Refining System through waterborne deliveries, primarily through short-term and spot market agreements. We also have a crude supply contract with Saudi Aramco, pursuantthe term of which is currently year to which we have purchasedyear, for up to approximately 100,000 bpd of crude oil from Saudi Aramco that is processed at the Paulsboro refinery. The crude purchased under this contract is priced off the ASCI.
Refined Product Yield and Distribution. The Delaware City refinery predominantly produces gasoline, jet fuel, ULSD and ultra-low sulfur heating oil as well as certain other products. Products produced at the Delaware City refinery are transferred to customers through pipelines, barges or at its truck rack. We market and sell all of our refined products independently to a variety of customers on the spot market or through term agreements. The Paulsboro refinery predominantly manufactures Group I base oils or lubricants and asphalt, jet fuel, and jet fuel.ULSD. Products produced at the Paulsboro refinery are transferred to customers primarily through pipelines, barges, or at its truck rack. We market and sell all of our refined products independently to a variety of customers on the spot market or through term agreements.
Inventory Intermediation Agreement. On October 25, 2021,July 31, 2023, we entered into aearly terminated the third amended and restated inventory intermediation agreement with J. Aron, (the “Third Inventory Intermediation Agreement”), previously entered into by and among PBF Holding and its subsidiaries, DCR, PRC and Chalmette Refining (collectively, the “PBF Entities”) and J. Aron to support the operations of the Delaware City, Paulsboro and Chalmette refineries (collectively, the “PBF Entities”). The Third Inventory Intermediation Agreement expires on December 31, 2024, which term may be further extended by mutual consent of the parties to December 31, 2025.PBF Entities.
Pursuant to the Third Inventory Intermediation Agreement, J. Aron purchaseshad purchased and holdsheld title to certain inventory, including crude oil, intermediate and certain finished products (the “J. Aron Products”), purchased or produced by the Paulsboro and Delaware City refineries (and, at the election of the PBF Entities, the Chalmette refinery) (the "Refineries"“Refineries”) and delivered into our storage tanks at the Refineries (the “Storage Tanks”). The J. Aron Products are sold back to us asFollowing the J. Aron Products are discharged out of our Storage Tanks. At expiration orearly termination, we purchased, and now own all of the Third Inventory Intermediation Agreement, we will have to repurchase the inventories outstanding under the Third Inventory Intermediation Agreement at that time.inventory previously held by J. Aron.
Tankage Capacity. The Delaware City refinery has total storage capacity of approximately 10.0 million barrels. Of the total, approximately 3.6 million barrels of storage capacity are dedicated to crude oil and other feedstock storage with the remaining 6.4 million barrels allocated to finished products, intermediates and other products. The Paulsboro refinery has total storage capacity of approximately 7.5 million barrels. Of the total, approximately 2.1 million barrels are dedicated to crude oil storage with the remaining 5.4 million barrels allocated to finished products, intermediates and other products.
Energy and Other Utilities. Under normal operating conditions, the Delaware City refinery consumes approximately 75,000 MMBTU per day of natural gas supplied via pipeline from third parties. The Delaware City refinery has a 280 MW power plant located on site that consists of two natural gas-fueled turbines with combined capacity of approximately 140 MW and four turbo generators with combined nameplate capacity of approximately 140 MW. Collectively, this power plant produces electricity in excess of Delaware City’s refinery load of approximately 90 MW. Excess electricity is sold into the Pennsylvania-New Jersey-Maryland, or PJM, grid. Steam is primarily produced by a combination of three dedicated boilers, two heat recovery steam generators on the gas turbines, and is supplemented by secondary boilers at the FCC and Coker. Hydrogen is currently provided via the refinery’s steam methane reformer and continuous catalytic reformer.
Under normal operating conditions, for the reconfiguration, the Paulsboro refinery currently consumes approximately 38,00040,000 MMBTU per day of natural gas supplied via pipeline from third parties. The Paulsboro refinery is mostly self-sufficient for electrical power through a mix of gas and steam turbine generators. The Paulsboro refinery generation supplies all of the 20MW total refinery load. There are circumstances where available generation is greater than the total refinery load, and the Paulsboro refinery can export up to about 40MW of power to the utility grid if warranted. If necessary, supplemental electrical power is available on a guaranteed basis from the local utility. The Paulsboro refinery is connected to the grid via three separate 69KV aerial feeders and has the ability to run entirely on imported power. Steam is produced in three boilers and a heat recovery steam generator fed by the exhaust from the gas turbine. In addition, there are a number of waste heat boilers and furnace stack economizers throughout the refinery that supplement the steam generation capacity. The Paulsboro refinery’s hydrogen needs are met by the steam methane reformer asand the catalytic reformer was idled.reformer.
Toledo Refinery
Overview. The Toledo refinery primarily processes a slate of light, sweet crudes from Canada, the Mid-Continent, the Bakken region and the U.S. Gulf Coast. The Toledo refinery is located on a 282-acre site near Toledo, Ohio, approximately 60 miles from Detroit. Crude is delivered to the Toledo refinery through three primary pipelines: (1) Enbridge from the north, (2) Patoka from the west and (3) Mid-Valley from the south. Crude is also delivered to a nearby terminal by rail and from local sources by truck to a truck unloading facility within the refinery.
The following table approximates the Toledo refinery’s current major process unit capacities. Unit capacities are shown in barrels per stream day.
| | | | | | | | |
| Toledo Refinery Units | | Nameplate
Capacity |
| Crude Distillation Unit | | 180,000 | |
| Fluid Catalytic Cracking Unit | | 82,000 | |
| Hydrotreating Units | | 95,000 | |
| Hydrocracking Unit | | 52,000 | |
| Catalytic Reforming Units | | 52,000 | |
| Alkylation Unit | | 11,000 | |
| Polymerization Unit | | 7,000 | |
| UDEX Unit | | 16,300 | |
Feedstocks and Supply Arrangements. We source our crude oil and feedstock needs for the Toledo refinery through connections to the Marysville Pipeline and Maumee Pipeline, and via truck rack, primarily through short-term and spot market agreements.
Refined Product Yield and Distribution. The Toledo refinery produces finished products, including gasoline, jet and ULSD, in addition to a variety of high-value petrochemicals including benzene, toluene, xylene, nonene and tetramer. The Toledo refinery is connected, via pipelines, to an extensive distribution network throughout Ohio, Illinois, Indiana, Kentucky, Michigan, Pennsylvania and West Virginia. The finished products are transported on pipelines owned by Sunoco Logistics Partners L.P. and Buckeye Partners L.P. In addition, we have proprietary connections to a variety of smaller pipelines and spurs that help us optimize our clean products distribution. A significant portion of the Toledo refinery’s gasoline and ULSD are distributed through various terminals in this network.
We have an agreement with Sunoco whereby Sunoco purchases gasoline and distillate products representing approximately one-third of the Toledo refinery’s gasoline and distillates production. The agreement expires in March 2022,June 2025, subject to certain early termination rights. We are currently in active negotiations with Sunoco on renewal of this contract. We sell the bulk of the petrochemicals produced at the Toledo refinery through short-term contracts or on the spot market and the majority of the petrochemical distribution is done via rail.
Tankage Capacity. The Toledo refinery has total storage capacity of approximately 4.5 million barrels. The Toledo refinery receives its crude through pipeline connections and a truck rack. Of the total, approximately 1.3 million barrels are dedicated to crude oil storage with the remaining 3.2 million barrels allocated to intermediates and products.
Energy and Other Utilities. Under normal operating conditions, the Toledo refinery consumes approximately 25,000 MMBTU per day of natural gas supplied via pipeline from third parties. The Toledo refinery purchases its electricity from the PJM grid and has a long-term contract to purchase hydrogen and steam from a local third-party supplier. In addition to the third-party steam supplier, the Toledo refinery consumes a portion of the steam that is generated by its various process units.
Chalmette Refinery
Overview. The Chalmette refinery is located on a 400-acre site near New Orleans, Louisiana. It is a dual-train coking refinery and is capable of processing both light and heavy crude oil through its 185,000 bpd crude units and downstream units. Chalmette Refining owns 100% of the MOEM Pipeline, providing access to the Empire Terminal, as well as the CAM Connection Pipeline, providing access to the Louisiana Offshore Oil Port facility through a third-party pipeline. Chalmette Refining also owns 80% of each of the Collins Pipeline Company and T&M Terminal Company, both located in Collins, Mississippi, which provide a clean products outlet for the refinery to the Plantation and Colonial Pipelines. In addition, there is also a marine terminal capable of importing waterborne feedstocks and loading or unloading finished products. There is also a clean products truck rack that provides access to local markets and crude storage that are owned by PBFX.storage. The Renewable Diesel Facility is also located at our Chalmette refinery. The facility incorporates a repurposed hydrocracker, along with a newly-constructed pre-treatment unit to establish a capacity to produce 20,000 bpd renewable diesel.
The following table approximates the Chalmette refinery’s current major process unit capacities. Unit capacities are shown in barrels per stream day.
| | | | | | | | |
| Chalmette Refinery Units | | Nameplate
Capacity |
| Crude Distillation Units | | 185,000 | |
| Vacuum Distillation Unit | | 114,000 | |
| Fluid Catalytic Cracking Unit | | 75,000 | |
| Hydrotreating Units | | 189,000 | |
| Delayed Coking Unit | | 42,000 | |
| Catalytic Reforming Unit | | 42,000 | |
| Alkylation Unit | | 17,000 | |
| Aromatics Extraction Unit | | 17,000 | |
Feedstocks and Supply Arrangements. We source our crude oil and feedstock needs for the Chalmette refinery through connections to the CAM Pipeline and MOEM Pipeline, as well as our marine terminal, and via waterborne deliveries, primarily through short-term and spot market agreements.
Refined Product Yield and Distribution. The Chalmette refinery predominantly produces gasoline and diesel fuels and also manufactures high-value petrochemicals including benzene and xylene. Products produced at the Chalmette refinery are transferred to customers through pipelines, the marine terminal and truck rack. The majority of our clean products are delivered to customers via pipelines. Our ownership of the Collins pipeline and T&M terminal provides the Chalmette refinery with strategic access to Southeast and East Coast markets through third-party logistics.
Inventory Intermediation Agreement. At the election of the PBF Entities, certain inventory at the Chalmette refinery may be held by J. Aron pursuant toOn July 31, 2023, we early terminated the Third Inventory Intermediation Agreement. Refer to East Coast Refining System (Delaware City Refineryrefinery and Paulsboro Refinery)refinery), above, for further details.
Tankage Capacity. The Chalmette refinery has a total tankage capacity of approximately 8.1 million barrels. Of this total, approximately 2.6 million barrels are allocated to crude oil storage with the remaining 5.5 million barrels allocated to intermediates and products.
Energy and Other Utilities. Under normal operating conditions, the Chalmette refinery consumes approximately 25,000 MMBTU per day of natural gas supplied via pipeline from third parties. The Chalmette refinery purchases its electricity from a local utility and has a long-term contract to purchase hydrogen from a third-party supplier.
Torrance Refinery
Overview. The Torrance refinery is located on 750-acres in Torrance, California. It is a high-conversion crude, delayed-coking refinery capable of processing both heavy and medium crude oils through its crude unit and downstream units. In addition to refining assets, the Torrance refinery acquisition included a number of high-quality logistics assets including a sophisticated network of crude and products pipelines, product distribution terminals and refinery crude and product storage facilities. The most significant logistics asset is a crude gathering and transportation system which delivers San Joaquin Valley crude oils directly from the field to the refinery, which is now owned by PBFX.refinery. Additionally, there are several pipelines serving the refinery that provide access to sources of waterborne crude oils including the Ports of Long Beach and Los Angeles, as well as clean product outlets with a direct pipeline that supplies jet fuel to the Los Angeles airport that are held by affiliates of the refinery.
The following table approximates the Torrance refinery’s current major process unit capacities. Unit capacities are shown in barrels per stream day.
| | | | | | | | |
| Torrance Refinery Units | | Nameplate
Capacity |
| Crude Distillation Unit | | 166,000 | |
| Vacuum Distillation Unit | | 102,000 | |
| Fluid Catalytic Cracking Unit | | 90,000 | |
| Hydrotreating Units | | 155,500 | |
| Hydrocracking Unit | | 25,000 | |
| Alkylation Unit | | 25,500 | |
| Delayed Coking Unit | | 58,000 | |
Feedstocks and Supply Arrangements. TheWe source our crude oil and feedstock needs for the Torrance refinery primarily processes a variety of medium and heavy crude oils. We have a crude supply agreement with ExxonMobil for approximately 60,000 bpd of crude oil that can be processed at our Torrance refinery. This crude supply agreement has an automatic renewal feature, unless either party gives thirty-six months written termination notice. Additionally, we obtain crude and feedstocks from other sourcesmainly through connections to third-party pipelines as well as ship docksour own pipeline, and via waterborne deliveries and truck racks.racks, primarily through short-term and spot market agreements.
Refined Product Yield and Distribution. The Torrance refinery predominantly produces gasoline, jet fuel and diesel fuels. Products produced at the Torrance refinery are transferred to customers through pipelines, the marine terminal and truck rack. The majority of clean products are delivered to customers via pipelines. We currently market and sell all of our refined products independently to a variety of customers either on the spot market or through term agreements.
Tankage Capacity. The Torrance refinery has a total tankage capacity of approximately 8.6 million barrels. Of this total, approximately 2.1 million barrels are allocated to crude oil storage with the remaining 6.5 million barrels allocated to intermediates and products.
Energy and Other Utilities. Under normal operating conditions, the Torrance refinery consumes approximately 47,000 MMBTU per day of natural gas supplied via pipeline from third parties. The Torrance refinery generates some power internally using a combination of steam and gas turbines and purchases any additional needed power from the local utility. The Torrance refinery has a long-term contract to purchase hydrogen from a third-party supplier.
Martinez Refinery
Overview. The Martinez refinery is located on an 860-acre site in the City of Martinez, 30 miles northeast of San Francisco, California. The refinery is a high-conversion, dual-coking facility with a Nelson Complexity Index of 16.1, making itand one of the most complex refineries in the United States. The facility is strategically positioned in Northern California and provides for operating and commercial synergies with the Torrance refinery located in Southern California. In addition to refining assets, the Martinez refinery includes a number of high-quality onsite logistics assets including a deep-water marine facility, product distribution terminals and refinery crude and product storage facilities with approximately 8.8 million barrels of shell capacity.
The following table approximates the Martinez refinery’s current major process unit capacities. Unit capacities are shown in barrels per stream day.
| | | | | | | | |
| Martinez Refinery Units | | Nameplate
Capacity |
| Crude Distillation Unit | | 157,000 | |
| Vacuum Distillation Unit | | 102,000 | |
| Fluid Catalytic Cracking Unit | | 72,000 | |
| Hydrotreating Units | | 268,000 | |
| Hydrocracking Unit | | 42,900 | |
| Alkylation Unit | | 12,500 | |
| Delayed Coking Unit | | 25,500 | |
| Flexi Coking Unit | | 22,500 | |
| Isomerization Unit | | 15,000 | |
Feedstocks and Supply Arrangements. We source our crude oil and feedstock needs for the Martinez refinery through connections to the Crimson San Pablo Bay Pipeline, and via waterborne deliveries, primarily through short-term and spot market agreements. We also have entered into various five-year crude supply agreements with Shell Oil ProductsTrading (US) Company (primarily serving the Martinez refinery) for up to 95,000 bpd, which, upon expiration of one of the agreements in early 2024, will be reduced to up to approximately 150,00065,000 bpd, in the aggregate, to support our West Coast and Mid-Continent refinery operations. Additionally, we obtain crude and feedstocks from other sources through connections to third-party pipelines as well as ship docks.early 2025.
Refined Product Yield and Distribution. We entered into certain offtake agreements for our West Coast system with Shell Oil Products for clean products with varying terms up to 15 years. We currently market and sell all of our refined products independently to a variety of customers either on the spot market or through term agreements.
Tankage Capacity. Martinez has a total tankage capacity of approximately 8.8 million barrels. Of this total, approximately 2.5 million barrels are allocated to crude oil storage with the remaining 6.3 million barrels allocated to intermediates and products.
Energy and Other Utilities. Under normal operating conditions, the Martinez refinery consumes approximately 80,000 MMBTU per day of natural gas (including natural gas consumed in hydrogen production) supplied via pipeline from third parties. The Martinez refinery generates some power internally using a combination of steam and gas turbines and purchases any additional needed power from the local utility. The Martinez refinery has a long-term contract to purchase hydrogen from a third-party supplier.
Logistics Segment
We formed PBFX, a publicly-traded MLP, to ownan indirect wholly-owned subsidiary of PBF Energy and PBF LLC, that owns or lease, operate, developleases, operates, develops and acquireacquires crude oil and refined products terminals, pipelines, storage facilities and similar logistics assets. PBFX’s operations are aggregated intorepresent the Logistics segment. PBFX engages in the receiving, handling, storage and transferring of crude oil, refined products, natural gas and intermediates from sources located throughout the United States and Canada for PBF Energy in support of its refineries, as well as for third-party customers. A substantial majorityPBFX’s revenue from third-party transactions constituted approximately 9.5% of PBFX’sits revenues are derivedin 2023. All other revenues were generated from long-term, fee-based commercial agreements with PBF Holding, which include minimum volume commitments for receiving, handling, storing and transferring crude oil, refined products and natural gas. PBFX’s third-party revenue is primarily derived from its third-party acquisitions. PBF EnergyHolding. We also hashave agreements with PBFX that establish fees for certain general and administrative services and operational and maintenance services provided by PBF Holding to PBFX. These transactions, other than those with third parties, are eliminated by PBF Energy and PBF LLCus in consolidation.
As of December 31, 2021, PBFX’s assets consist of the following:
| | | | | | | | | | | |
Asset | Capacity | Products Handled | PBF Location Supported |
Transportation and Terminaling | | |
DCR Rail Facility (a)(b) | various throughput capacity (a) | Crude | East Coast Refining System |
Toledo Truck Terminal (b) | 22,500 bpd unloading capacity | Crude | Toledo Refinery |
Toledo Storage Facility - propane loading facility (b) | 11,000 bpd throughput capacity | Propane | Toledo Refinery |
DCR Products Pipeline (b) | 125,000 bpd pipeline capacity | Refined products | Delaware City Refinery |
DCR Truck Rack (b) | 76,000 bpd throughput capacity | Gasoline, distillates and LPGs | Delaware City Refinery |
East Coast Terminals | various throughput capacity and approximately 4.2 million barrel aggregate shell capacity | Refined products | East Coast Refining System |
Torrance Valley Pipeline (b) | 110,000 bpd pipeline capacity and approximately 700,000 barrel aggregate shell capacity (c) | Crude | Torrance Refinery |
Paulsboro Natural Gas Pipeline (b) | 60,000 dth/d pipeline capacity | Natural gas | Paulsboro Refinery |
Toledo Products Terminal | various throughput capacity and 110,000 barrel aggregate shell capacity | Refined products | Toledo Refinery |
Knoxville Terminals | various throughput capacity and 520,000 barrel aggregate shell capacity | Gasoline, distillates and LPGs | Chalmette Refinery |
Toledo Rail Products Facility (b)(d) | 16,000 bpd loading capacity | Crude, LPGs, gasoline and distillates | Toledo Refinery |
Chalmette Truck Rack (b) | 20,000 bpd loading capacity | Gasoline and distillates | Chalmette Refinery |
Chalmette Rosin Yard (b) | 17,000 bpd unloading capacity | LPGs | Chalmette Refinery |
Paulsboro Lube Oil Terminal (b) | various throughput capacity and 309,000 barrel aggregate shell capacity | Lubes | Paulsboro Refinery |
Delaware Ethanol Storage Facility (b) | various throughput capacity and 100,000 barrel aggregate shell capacity | Ethanol | Delaware City Refinery |
Storage | | | |
Toledo Storage Facility (b) | approximately 3.9 million barrel aggregate shell capacity (e) | Crude, refined products and intermediates | Toledo Refinery |
Chalmette Storage Tank | 625,000 barrel shell capacity | Crude | Chalmette Refinery |
East Coast Storage Assets | approximately 4.0 million barrel aggregate shell capacity (f) and various throughput capacity | Crude, feedstock, asphalt and refined products | East Coast Refining System |
___________________
(a)Included within the DCR Rail Facility are the DCR Rail Terminal, a rail unloading terminal with an unloading capacity of 130,000 bpd, and the DCR West Rack, an unloading facility with an unloading capacity of 40,000 bpd.
(b)These assets represent the assets that PBFX acquired from PBF LLC.
(c)Includes storage capacity at the PBFX Midway, Emidio and Belridge stations.
(d)Of the approximately 3.9 million barrel aggregate shell capacity, approximately 1.3 million barrels are dedicated to crude and approximately 2.6 million barrels are allocated to refined products and intermediates.
(e)Of the approximately 4.0 million barrel aggregate shell capacity, approximately 3.0 million barrels are dedicated to crude and feedstocks and approximately 1.0 million barrels are allocated to asphalt.
Principal Products
Our refineries make various grades of gasoline, distillates (including diesel fuel, jet fuel and ULSD) and other products from crude oil, other feedstocks, and blending components. We sell these products through our commercial accounts and sales with major oil companies. For the years ended December 31, 2021, 20202023, 2022 and 2019,2021, gasoline and distillates accounted for 86.2%88.7%, 84.7%88.5% and 86.8%86.2% of our revenues, respectively.
Customers
We sell a variety of refined products to a diverse customer base. The majority of our refined products are primarily sold through short-term contracts or on the spot market. In addition, we have product offtake arrangements for a portion of our clean products. For the years ended December 31, 20212023 and December 31, 2020,2022 only one customer, Shell plc (“Shell”), accounted for 10% or more of our revenues (approximately 15%14% and 13%14%, respectively). For the year ended December 31, 2019, no single customer accounted for 10% or more of our revenues. As of December 31, 20212023 and December 31, 2020,2022, only one customer, Shell, accounted for 10% or more of our total trade accounts receivable (approximately 26%19% and 16%19%, respectively).
Seasonality
Traditionally, demand for gasoline and diesel is generally higher during the summer months than during the winter months due to seasonal increases in highway traffic and construction work. Decreased demand during the winter months can lower gasoline and diesel prices. However, due to the COVID-19 pandemic and related governmental responses,global supply disruptions, the effects of seasonality on our operating results have been less impactful in 2021 and 2020.recent years.
Competition
The refining business is very competitive. We compete directly with various other refining companies on the East, Gulf and West Coasts and in the Mid-Continent, with integrated oil companies, with foreign refiners that import products into the United States and with producers and marketers in other industries supplying alternative forms of energy and fuels to satisfy the requirements of industrial, commercial and individual consumers. Some of our competitors have expanded the capacity of their refineries and internationally new refineries are coming on line which could also affect our competitive position.
Profitability in the refining industry depends largely on refined product margins, which can fluctuate significantly, as well as crude oil prices and differentials between the prices of different grades of crude oil, operating efficiency and reliability, product mix and costs of product distribution and transportation. Certain of our competitors that have larger and more complex refineries may be able to realize lower per-barrel costs or higher margins per barrel of throughput. Several of our principal competitors are integrated national or international oil companies that are larger and have substantially greater resources. Because of their integrated operations and larger capitalization, these companies may be more flexible in responding to volatile industry or
market conditions, such as shortages of feedstocks or intense price fluctuations. Refining margins are frequently impacted by sharp changes in crude oil costs, which may not be immediately reflected in product prices.
The refining industry is also highly competitive with respect to feedstock supply. Unlike certain of our competitors that have access to proprietary controlled sources of crude oil production available for use at their own refineries, we obtain all of our crude oil and substantially all other feedstocks from unaffiliated sources. The availability and cost of crude oil and feedstock are affected by global supply and demand. We have no crude oil reserves and are not engaged in the exploration or production of crude oil. We believe, however, that we will be able to obtain adequate crude oil and other feedstocks at generally competitive prices for the foreseeable future.
Pursuant to its Renewable Fuel Standard,RFS, EPA has implemented mandates to blend renewable fuels into the petroleum fuels produced and sold in the United States. However, unlike certain of our competitors,Because we currently do not directly produce renewable fuels, and increasing the volume of renewable fuels that must be blended into our products displacescould displace an increasing volume of our refineries’ product pool, potentially resulting in lower earnings and profitability. In addition, in order to meet certain of these and future EPA requirements, we may be required to continue to purchase RINs, which historically had, and we expect to have, fluctuating costs based on market conditions.
Corporate Offices
We currently lease approximately 63,000 square feet for our principal corporate offices in Parsippany, New Jersey. The lease for our principal corporate offices expires in 2023.2026. Functions performed in the Parsippany office include overall corporate management, refinery and health, safety and environmental management, planning and strategy, corporate finance, commercial operations, logistics, contract administration, marketing, investor relations, governmental affairs, accounting, tax, treasury, information technology, legal and human resources support functions.
We lease approximately 8,800 square feet for our regional corporate office in Long Beach, California. The lease for our Long Beach office expires in 2026. Functions performed in the Long Beach office include overall regional corporate management, planning and strategy, commercial operations, logistics, contract administration, marketing and governmental affairs.
We lease approximately 5,00011,000 square feet for our regional corporate office in The Woodlands, Texas. The lease for The Woodlands office expires in 2032. Functions performed in The Woodlands include pipeline control center operations, logistics support functions and logisticscommercial operations engineering and regulatoryin support functions.of SBR.
Employees and Human Capital
Safety
We believe our responsibility to our employees, neighbors, shareholders, other stakeholders and the environment is only fulfilled through our commitment to safety and reliability. Through rigorous training, sharing of expertise across our sites, continuous monitoring and through promoting a culture of excellence in operations, we continuously strive to keep our people, the communities in which we operate in and the environment safe.
Our focus on safety is also evident in our response to the COVID-19 pandemic. We continue to utilize our COVID-19 response team to implement additional social distancing measures across the workplace, enhance personal protective equipment and sanitize our facilities. With the guidance of our COVID-19 response team, we were able to safely return our workforce to their primary locations, and we will continue to rely on our COVID-19 response team and assess the evolution of the COVID-19 pandemic as we evaluate and implement further measures to keep our employees safe.
We are subject to the requirements of OSHA and comparable state statutes that regulate the protection of the health and safety of workers. In addition, the OSHA Hazard Communication Standard requires that information be maintained about hazardous materials used or produced in operations and that this information be provided to employees, state and local government authorities and citizens. We believe that our operations are in compliance with OSHA requirements, including general industry standards, record keeping requirements and monitoring of occupational exposure to regulated substances.
Development and Retention
The development, attraction and retention of employees is a critical success factor for our Company. To support the advancement of our employees, we offer rigorous training and development programs and encourage the sharing of expertise across our sites. We actively promote inclusion and diversity in our workforce at each of our locations and provide our employees with opportunities to give back through engagement in our local communities through supportive educational programs, philanthropic and volunteer activities.
We believe that a combination of competitive compensation and career growth and development opportunities help increase employee morale and reduce voluntary turnover. Our comprehensive benefit packages are competitive in the marketplace and we believe in recognizing and rewarding talent through our various cash and equity compensation programs.
Headcount
As of December 31, 2021,2023, we had approximately 3,4183,776 employees, of which 1,8331,965 are covered by collective bargaining agreements. Our hourly employees are covered by collective bargaining agreements through the United Steel Workers (“USW”), the Independent Oil Workers (“IOW”) and the International Brotherhood of Electrical Workers (“IBEW”). We consider our relations with the represented employees to be satisfactory.
| | | | | | | | | | | | | | | | | | | | | | | | | | | | | |
| Location | | Number of employees | | Employees covered by collective bargaining agreements | | Collective bargaining agreements | | Expiration date | |
| Headquarters | | 374 | | — | | N/A | | N/A | |
| Delaware City refinery | | 520 | | 363 | | USW | | January 2022 | * |
| Paulsboro refinery | | 225 | | 141 | | IOW | | March 2022 | |
| Toledo refinery | | 476 | | 298
6 | | USW
USW | | February 2022
February 2022 | *
* |
| Chalmette refinery | | 527 | | 305 | | USW | | January 2022 | * |
| Torrance refinery | | 544 | | 298
10 | | USW
IBEW | | January 2022
January 2022 | *
* |
| Torrance logistics | | 98 | | 41
4 | | USW
USW | | May 2024
January 2022 |
* |
| Martinez refinery | | 565 | | 312
23 | | USW
IBEW | | February 2022
February 2022 | *
* |
| PBFX | | 89 | | 22
10 | | USW-East Coast Storage Assets
USW- East Coast Terminals | | January 2022
April 2024 | *
|
| Total employees | | 3,418 | | 1,833 | | | | | |
*These collective bargaining agreements have expired. Terms related to new collective bargaining agreements have been agreed to on local bargaining issues and are pending settlement of the National Oil Bargaining Program which will set contract term, wages, health care contributions and any other agreed upon issues prior to being executed.During this interim period, the terms of the expired agreements will remain in place under rolling 24-hour extensions until new agreements are finalized. | | | | | | | | | | | | | | | | | | | | | | | | | | | |
| Location | | Number of employees | | Employees covered by collective bargaining agreements | | Collective bargaining agreements | | Expiration date | |
| Headquarters | | 470 | | — | | N/A | | N/A | |
| Delaware City refinery | | 535 | | 374 | | USW | | January 2026 | |
| Paulsboro refinery | | 301 | | 189 | | IOW | | March 2026 | |
| Toledo refinery | | 524 | | 327 | | USW | | February 2026 | |
| Chalmette refinery | | 587 | | 335 | | USW | | January 2026 | |
| Torrance refinery | | 592 | | 304
15 | | USW
IBEW | | January 2026
January 2026 | |
| Torrance logistics | | 97 | | 10
28
13 | | USW
USW
USW | | April 2024
January 2026
March 2028 | |
| Martinez refinery | | 580 | | 307
15 | | USW
IBEW | | February 2026
February 2026 | |
| Other Logistics assets | | 90 | | 23
10
15 | | USW-East Coast Storage Assets
USW- East Coast Terminals
USW- East Coast Terminals | | January 2026
April 2024
March 2028 | |
| Total employees | | 3,776 | | 1,965 | | | | | |
Information About Our Executive Officers
The following is a list of our executive officers as of February 17, 2022:15, 2024:
| | | | | | | | | | | | | | |
| Name | | Age (as of December 31, 2021)2023 ) | | Position |
| Thomas Nimbley | | 7072 | | Chief Executive Officer andChairman, Chairman of the Board of Directors |
| Matthew Lucey | | 4850 | | President, Chief Executive Officer |
C. Erik YoungKaren B. Davis | | 4467 | | Senior Vice President, Chief Financial Officer |
| Paul Davis | | 5961 | | Senior Vice President, Western RegionSupply, Trading and Optimization |
| Thomas O’Connor | | 4951 | | Senior Vice President, CommercialCommodity Risk and Strategy |
| Trecia Canty | | 5254 | | Senior Vice President, General Counsel & Corporate Secretary |
| Steven Steach | | 6567 | | Senior Vice President, Refining |
| Wendy Ho Tai | | 57 | | Senior Vice President, Human Resources |
| Jim Fedena | | 59 | | Senior Vice President, Logistics, Renewable Fuels, and Strategic Assets |
Thomas Nimbley has served as Chairman of the Board since June 30, 2016 and Executive Chairman since July 2023. He served as our Chief Executive Officer sincefrom June 2010 through June 2023 and on our Board of Directors since October 2014. He has served as the Chairman of our Board since July 2016. He was our Executive Vice President, Chief Operating Officer from MarchApril 2010 through June 2010. In his capacity as our Chief Executive Officer, Mr. Nimbley also serves as a director and the Chief Executive OfficerChairman of certain of our subsidiaries and our affiliates, including Chairman of the Board of PBF GP.subsidiaries. Prior to joining us, Mr. Nimbley served as a Principal for Nimbley Consultants LLC from June 2005 to March 2010, where he provided consulting services and assisted on the acquisition of two refineries. He previously served as Senior Vice President and head of Refining for Phillips Petroleum Company (“Phillips”) and, subsequently, Senior Vice President and head of Refining for ConocoPhillipsConocoPhillips’ (“ConocoPhillips”) domestic refining system (13 locations) following the merger of Phillips and Conoco Inc. Before joining Phillips at the time of its acquisition of Tosco Corporation (“Tosco”) in September 2001, Mr. Nimbley served in various positions with Tosco and its subsidiaries starting in April 1993.
Matthew Lucey has served as our President since January 2015 and Chief Executive Officer since July 2023. Mr. Lucey is also a director and the Chief Executive Officer of certain of our subsidiaries. Mr. Lucey was our Executive Vice President from April 2014 to December 2014. Mr. Lucey2014 and served as our Senior Vice President, Chief Financial Officer from April 2010 to March 2014. Mr. Lucey joined us as our Vice President, Finance in April 2008. Mr. Lucey is also a director of certain of our subsidiaries, including PBF GP. Prior thereto, Mr. Lucey served as a Managing Director of M.E. Zukerman & Co., a New York-based private equity firm specializing in several sectors of the broader energy industry, from 2001 to 2008. Before joining M.E. Zukerman & Co., Mr. Lucey spent six years in the banking industry.
C. Erik Young Karen B. Davishas served as our Senior Vice President, and Chief Financial Officer since April 2014 after joining us in December 2010February 20, 2023 and has been serving as Director, Strategic Planning where he was responsible for both corporate development and capital markets initiatives. Mr. Youngour Principal Accounting Officer since May 11, 2023. She served as interim Chief Financial Officer from January 1, 2023 to February 19, 2023. Ms. Davis is also a director of certain of our subsidiaries, includingsubsidiaries. Ms. Davis previously served as Executive Vice President and Chief Financial Officer of Western Refining, Inc. and its affiliated entities, Western Refining Logistics LP and Northern Tier Energy, LP through May 2017. During her career, she has served in various chief financial officer and financial reporting officer positions with various public and private companies throughout the United States. Ms. Davis served as an independent director of PBF GP. PriorEnergy from January 1, 2020 to joiningDecember 31, 2022 and the Company, Mr. Young spent eleven years in corporate finance, strategic planningChairperson of the Audit Committee from October 1, 2020 to December 31, 2022. From 2017 through 2019, she served as an independent director of PBFX GP, where she was a member of the Audit and mergers and acquisitions roles across a variety of industries. He began his career in investment banking before joining J.F. Lehman & Company, a private equity investment firm, in 2001.the Conflicts Committees.
Paul Davis has served as our Senior Vice President, Supply, Trading and Optimization since April 2022. He previously served as President, PBF Western Region sincefrom September 2017.2017 to April 2022. Mr. Davis joined us in April of 2012 and held various executive roles in our commercial operations, including Co-Head of Commercial, prior to serving as Senior Vice President, Western Region Commercial Operations from September 2015 to September 2017. Previously, Mr. Davis was responsible for managing the U.S. clean
products commercial operations for Hess Energy Trading Company from 2006 to 2012. Prior to that, Mr. Davis was responsible for Premcor’s U.S. Midwest clean products disposition group. Mr. Davis has over 29 years of experience in commercial operations in crude oil and refined products, including 16 years with the ExxonMobil in various operational and commercial positions, including sourcing refinery feedstocks and crude oil and the disposition of refined products, as well as optimization roles within refineries.
Thomas O’Connor has served as our Senior Vice President, Commodity Risk and Strategy since April 2022. He previously served as Senior Vice President, Commercial sincefrom September 2015.2015 to April 2022. Mr. O’Connor joined us as Senior Vice President in September 2014 with responsibility for business development and growing the business of PBFX, and from January to September 2015, served as our Co-Head of commercial activities. Prior to joining us, Mr. O’Connor worked at Morgan Stanley since 2000 in various positions, most recently as a Managing Director and Global Head of Crude Oil Trading and Global Co-Head of Oil Flow Trading. Prior to joining Morgan Stanley, Mr. O’Connor worked for Tosco from 1995 to 2000 in the Atlantic Basin Fuel Oil and Feedstocks group.
Trecia Canty has served as our Senior Vice President, General Counsel and Corporate Secretary since September 2015. In her role, Ms. Canty is responsible for the legal department and outside counsel, which provide a broad range of support for the Company’s business activities, including corporate governance, compliance, litigations and mergers and acquisitions. Previously, Ms. Canty was named Vice President, Senior Deputy General Counsel and Assistant Secretary in October 2014 and led our commercial and finance legal operations since joining us in November 2012. Ms. Canty is also a director of certain of our subsidiaries. Prior to joining us, Ms. Canty served as Associate General Counsel, Corporate and Assistant Secretary of Southwestern Energy Company, where her responsibilities included finance and mergers and acquisitions, securities and corporate compliance and corporate governance. She also provided legal support to the midstream marketing and logistics businesses. Prior to joining Southwestern Energy Company in 2004, she was an associate with Cleary, Gottlieb, Steen & Hamilton.
Steven Steach has served as our Senior Vice President, Refining since February 1, 2022 and has responsibility for our refining operations. He originally joined us in November 2015 in advance of the acquisition of the Torrance Refineryrefinery and served as the Vice President and Refinery Manager of the Torrance Refineryrefinery from its acquisition on July 1, 2016 until January 31, 2022. Before joining PBF, Mr. Steach was Refinery Manager for ConocoPhillips in Billings, MT, for four years. Prior to Billings, Mr. Steach was Operations Manager for ConocoPhillips at their Los Angeles Refineryrefinery for a total of nine years, including Site Manager at the Carson plant.
Wendy Ho Tai has served as our Senior Vice President, Human Resources since April 2022. She previously served as Vice President, Human Resources from March 2015 to April 2022 and as Senior Director, Compensation and Benefits from October 2010 to February 2015. In her tenure, Ms. Ho Tai has established the PBF benefit plans, implemented the HR information system and assisted in the integration of the employees of all acquisitions. Previously, Ms. Ho Tai held human resources management positions with Petro, Inc. and MarketSmart Interactive.
Jim Fedena has served as our Senior Vice President, Logistics, Renewable Fuels, and Strategic Assets since April 2022. He previously served as a Senior Vice President of Health, Safety and Environment from June 2010 to January 2013. From June 2010 through February 2011, he also served as the Delaware City refinery Manager during the reactivation period and, from January 2013 to April 2022, he served as Senior Vice President – Logistics. Prior to joining PBF Energy he served as managing partner for PJF Associates providing consulting services for private equity firms on refining acquisitions in North America and Europe. Mr. Fedena has over 30 years of oil industry experience in refining, pipelines, and terminal operations. He also served in various positions with Premcor, ConocoPhillips, Phillips, Tosco and Coastal with responsibility for health, safety and environmental programs.
Environmental, Health and Safety Matters
Our refineries, pipelines and related operations are subject to extensive and frequently changing federal, state and local laws and regulations, including, but not limited to, those relating to the discharge of materials into the environment or that otherwise relate to the protection of the environment, waste management and the characteristics and the compositions of fuels. Compliance with existing and anticipated laws and regulations can increase the overall cost of operating the refineries, including remediation, operating costs and capital costs to construct, maintain and upgrade equipment and facilities. Permits are also required under these laws for the operation of our refineries, pipelines and related operations and these permits are subject to revocation, modification and renewal. Compliance with applicable environmental laws, regulations and permits will continue to have an impact on our operations, results of operations and capital requirements. We believe that our current operations are in substantial compliance with existing environmental laws, regulations and permits.
We incorporate by reference into this Item the environmental disclosures contained in the following sections of this report:
•Item 1A. “Risk Factors”
◦Our results of operations continue to be impacted by significant costs to comply with renewable fuels mandates. The market prices for RINs have been volatile and may harm our profitability;
◦We may have capital needs for which our internally generated cash flows and other sources of liquidity may not be adequate;
◦We may incur significant liability under, or costs and capital expenditures to comply with, environmental and health and safety regulations, which are complex and change frequently;
◦Potential further laws and regulations related to climate change could have a material adverse impact on our operations and adversely affect our facilities;
◦Regulation of emissions of greenhouse gases could force us to incur increased capital expenditures and operating costs that could have a material adverse effect on our results of operations and financial condition;
◦Environmental clean-up and remediation costs of our sites and environmental litigation could decrease our net cash flow, reduce our results of operations and impair our financial condition;
◦Our pipelines are subject to federal and/or state regulations, which could reduce profitability and the amount of cash we generate;
◦We could incur substantial costs or disruptions in our business if we cannot obtain or maintain necessary permits and authorizations or otherwise comply with health, safety, environmental and other laws and regulations;
◦Enhanced scrutiny on ESG matters and developments related to climate change may negatively impact our business and our access to capital markets;
◦We are subject to strict laws and regulations regarding employee and process safety, and failure to comply with these laws and regulations could have a material adverse effect on our results of operations, financial condition and profitability.
•Item 3. “Legal Proceedings”,
•Item 8. “Financial Statements and Supplementary Data”
◦ Note 98 - Accrued Expenses,
◦ Note 12 - Other Long-Term Liabilities and
◦ Note 1411 - Commitments and Contingencies
Applicable Federal and State Regulatory Requirements
As is the case with all companies engaged in industries similar to ours, we face potential exposure to future claims and lawsuits involving environmental and safety matters. These matters include soil and water contamination, air pollution, personal injury and property damage allegedly caused by substances which we manufactured, handled, used, released or disposed of.
Current and future environmental regulations are expected to require additional expenditures, including expenditures for investigation and remediation, which may be significant, at our refineries and at our other facilities. To the extent that future expenditures for these purposes are material and can be reasonably determined, these costs are disclosed and accrued.
Our operations are also subject to various laws and regulations relating to occupational health and safety. We maintain safety training and maintenance programs as part of our ongoing efforts to ensure compliance with applicable laws and regulations. Compliance with applicable health and safety laws and regulations has required and continues to require substantial expenditures.
We cannot predict what additional health, safety and environmental legislation or regulations will be enacted or become effective in the future or how existing or future laws or regulations will be administered or interpreted with respect to our operations. Compliance with more stringent laws or regulations or adverse changes in the interpretation of existing requirements or discovery of new information such as unknown contamination could have an adverse effect on the financial position and the results of our operations and could require substantial expenditures for the installation and operation of systems and equipment that we do not currently possess.
We incorporate by reference into this Item the federal and state regulatory requirements disclosures contained in the following sections of this report:
•Item 8. “Financial Statements and Supplementary Data”
◦ Note 1411 - Commitments and Contingencies
ITEM 1A. RISK FACTORS
Summary of Risk Factors
Investing in our common stock involves a degree of risk. These risks are discussed more fully below and include, but are not limited to, the following, any of which could have a material adverse effect on our financial condition, results of operations and cash flows:
Risks Related to the COVID-19 Pandemic
•The COVID-19 pandemic and its effects on our liquidity, business, financial condition and results of operations;
•Decline in demand for our refined products;
•Worsening of market conditions related to the COVID-19 pandemic.
Risks Relating to Our Business and Industry
•The price volatility of crude oil, other feedstocks, blendstocks, refined products and fuel and utility services;
•Volatility in commodity prices and refined product demand;
•Crude oil differentials and related factors, which fluctuate substantially;
•Significant interruptions or casualty losses at any of our refineries and related assets or logistics terminals, pipelines or other facilities;
•Interruptions of supply and distribution at our refineries;
•Renewable fuels mandates and the cost of RINs;
•Existence of capital needs for which our internally generated cash flows and other sources of liquidity may not be adequate;
•Regulation of emissions of greenhouse gases and other environmental and health and safety regulations;
•Enhanced scrutiny on ESG matters;
•Volatility and uncertainty in the credit and capital markets;
•Any political instability, military strikes, sustained military campaigns, terrorist activity, changes in foreign policy, or other catastrophic events;
•A cyber-attack on, or other failure of, our technology infrastructure;
•Competition from companies who have not been adversely impacted as much as we have been by the COVID-19 pandemic;
•Delays or cost increases related to capital spending programs;
•Product liability and operational liability claims and litigation;
•Prospect that dividend payments may not be reinstated;
•Acquisition or integration of new assets into our business;
•Labor disruptions that would interfere with our operations;
•Discontinuation of employment of any of our senior executives or other key employees;
•Our activity in commodity derivatives markets.
Risks Related to Our Indebtedness
•Our substantial levels of indebtedness;
•Our ability to secure necessary financing on acceptable terms;
•Changes in our credit ratings;
•Limitations on our operations arising out of restrictive covenants in our debt instruments;
•Anti-takeover provisions in our indentures.
Risks Related to Our Organizational Structure and PBF Energy Class A Common Stock
•PBF Energy’s dependence upon distributions from PBF LLC and its subsidiaries to pay taxes and meet its other obligations;
•The rights of other members of PBF LLC may conflict with the interests of PBF Energy Class A common stockholders;
•Obligations under the Tax Receivable Agreement, as defined below;
•Anti-takeover provisions in our certificate of incorporation and bylaws and under Delaware law;
•Volatility of our stock price;
•Potential dilution of our current stockholders.
Risks Related to Our Ownership of PBFX
•Obligations for minimum volume commitments in our commercial agreements with PBFX;
•Potential tax consequences related to our involvement in PBFX.
Risk Factors
You should carefully read the risks and uncertainties described below. The risks and uncertainties described below are not the only ones facing our company. Additional risks and uncertainties may also impair our business operations. If any of the following risks actually occur, our business, financial condition, results of operations or cash flows would likely suffer. In that case, the trading price of PBF Energy Class A common stock could fall.
Risks Related to the COVID-19 Pandemic
The outbreak of the COVID-19 pandemic significantly and adversely affected our liquidity, business, financial condition and results of operations starting in the first quarter of 2020. While we have seen the demand for our products return in 2021, there can be no assurance that our liquidity, business, financial condition and results of operations will revert to pre-COVID-19 pandemic levels going forward.
The outbreak of the COVID-19 pandemic starting in the first quarter of 2020, negatively impacted, and may continue to impact, worldwide economic and commercial activity and financial markets. The COVID-19 pandemic, and variants thereof, and the related governmental responses resulted in significant business and operational disruptions, including business and school closures, supply chain disruptions, travel restrictions, stay-at-home orders and limitations on the availability of workforces, inclusive of mandatory quarantine periods, and has resulted in significantly lower global demand for refined petroleum and petrochemical products. Although demand for these products started to recover throughout the year ended December 31, 2021 following the lifting or easing of certain restrictions and the distribution of COVID-19 vaccines and other protective measures, there can be no assurance that future periods will not be negatively impacted by the continuing effect of the COVID-19 pandemic, including resurgences and variants of the virus.
In addition, the impact of the COVID-19 pandemic has created simultaneous shocks in oil supply and demand resulting in an economic challenge to our industry which has not occurred since our formation. It is impossible to estimate the duration or significance of the financial impact that will result from the COVID-19 pandemic. However, the extent of the impact of the COVID-19 pandemic on our business, financial condition, results of operations and liquidity will depend largely on future developments, including the duration and severity of the pandemic and variants thereof, particularly within the geographic areas where we operate, the effectiveness of vaccine programs, and the related impact on overall economic activity, all of which cannot be predicted with certainty at this time.
We continue to work with federal, state and local health authorities to respond to COVID-19 cases in the regions we operate and are taking or supporting measures to try to limit the spread of the virus and to mitigate the burden on the healthcare system. Many of these measures will continue to have an adverse impact on our business and financial results that we are not currently able to fully quantify. For example, we are carefully
evaluating projects and non-essential work at our refineries. Based on market conditions, our refineries have been operating at reduced rates, while constantly monitoring and adjusting our production to correlate to increases in product demand. We lowered our capital program for 2021 and will continue to plan to do so in 2022 as compared to historic levels. We have planned a level of capital expenditures we believe will allow us to satisfy and comply with all required safety, environmental and planned regulatory capital commitments and other regulatory requirements, although there are no assurances that we will be able to continue to do so. Non-compliance with applicable environmental and safety requirements, including as a result of reduced staff due to an outbreak at one of our refineries, may impair our operations, may subject us to fines or penalties assessed by governmental authorities and/or may result in an environmental or safety incident. We may also be subject to liability as a result of claims against us by impacted workers or third parties.
Demand for our refined products can significantly decline due to changes in global and regional economic conditions.
Business closings and layoffs in the markets we operate have adversely affected demand for our refined products. Deterioration of general economic conditions or weak demand levels could require additional actions on our part to lower our operating costs, including temporarily or permanently ceasing to operate units at our facilities, as experienced in 2020 in the case of the East Coast Refining Reconfiguration. There may be significant incremental costs associated with such actions. Further deterioration of global and regional economic conditions may harm our liquidity and ability to repay our outstanding debt and the trading price of PBF Energy’s Class A common stock.
The persistence or worsening or market conditions related to the COVID-19 pandemic may require us to raise additional capital to meet our obligations and operate our business.
Our borrowing base under PBF Holding’s asset-based revolving credit facility (the “Revolving Credit Facility”) could be reduced if market conditions deteriorate or crude prices decrease significantly. Our borrowing base availability under the Revolving Credit Facility was $3,400.0 million as of December 31, 2021. If current market conditions return to levels experienced during the height of the COVID-19 pandemic, or worsen, we may require additional capital to meet our obligations as well as to operate our business, and additional financing and/or assets sales may not be possible on favorable terms or at all. Potential economic factors resulting from the COVID-19 pandemic, which could lead to increasing unemployment rates, substantially reduced travel and reduced business and consumer spending, could also affect our business.
Risks Relating to Our Business and Industry
•The price volatility of crude oil, other feedstocks, blendstocks, refined products and fuel and utility services may have a material adverse effect on our revenues, profitability, cash flows and liquidity.
Our profitability, cash flows and liquidity from operations depend primarily on the margin above operating expenses (including the cost of refinery feedstocks, such as crude oil, intermediate partially refined products, and natural gas liquids that are processed and blended into refined products) at which we are able to sell refined products. Refining is primarily a margin-based business and, to increase profitability, it is important to maximize the yields of high value finished products while minimizing the costs of feedstock and operating expenses. When the margin between refined product prices and crude oil and other feedstock costs contracts, as we experienced in 2020, our earnings, profitability and cash flows are negatively affected. Historically, refining margins have been volatile, and are likely to continue to be volatile, as a result of a variety of factors, including fluctuations in the prices of crude oil, other feedstocks, refined products and fuel and utility services. An increase or decrease in the price of crude oil will likely result in a similar increase or decrease in prices for refined products; however, there may be a time lag in the realization, or no such realization, of the similar increase or decrease in prices for refined products. The effect of changes in crude oil prices on our refining margins therefore depends in part on how quickly and how fully refined product prices adjust to reflect these changes.
The nature of our business has required us to maintain substantial crude oil, feedstock and refined product inventories. Although we reduced our crude oil, feedstock and refined product inventories in 2020 to strengthen our financial position in response to the COVID-19 pandemic, inventory has slowly returned to normalized levels in 2021. Because crude oil, feedstock and refined products are commodities, we have no control over the changing market value of these inventories. Our crude oil, feedstock and refined product inventories are valued at the lower of cost or market value under the last-in-first-out (“LIFO”) inventory valuation methodology. If the market value of our crude oil, feedstock and refined product inventory declines to an amount less than our LIFO cost, we would record a write-down of inventory and a non-cash impact to cost of products and other. For example, during the year ended December 31, 2020, we recorded an adjustment to value our inventories to the lower of cost or market which decreased income from operations and net income by $268.0 million and $196.7 million, respectively, reflecting the net change in the LCM inventory reserve from $401.6 million at December 31, 2019 to $669.6 million at December 31, 2020. At December 31, 2021, the replacement value of inventories exceeded the LIFO carrying value, therefore no LCM inventory reserve was recorded.
Prices of crude oil, other feedstocks, blendstocks, and refined products depend on numerous factors beyond our control, including the supply of and demand for crude oil, other feedstocks, gasoline, diesel, ethanol, asphalt and other refined products. Such supply and demand are affected by a variety of economic, market, environmental and political conditions.
Our direct operating expense structure also impacts our profitability. Our major direct operating expenses include employee and contract labor, maintenance and energy. Our predominant variable direct operating cost is energy, which is comprised primarily of fuel and other utility services. The volatility in costs of fuel, principally natural gas, and other utility services, principally electricity, used by our refineries and other operations affect our operating costs. Fuel and utility prices have been, and will continue to be, affected by factors outside our control, such as supply and demand for fuel and utility services in both local and regional markets. Natural gas prices have historically been volatile and, typically, electricity prices fluctuate with natural gas prices. Future increases in fuel and utility prices may have a negative effect on our refining margins, profitability and cash flows.
Our working capital, cash flows and liquidity can be significantly impacted by volatilityVolatility in commodity prices and refined product demand.
Payment terms for our crude oil purchases are typically longer than those terms we extend to our customers for sales of refined products. Additionally, reductions in crude oil purchases tend to lag demand decreases for our refined products. As a result of this timing differential, the payables for our crude oil purchases are generally proportionally larger than the receivables for our refined product sales. As we are normally in a net payables position, a decrease in commodity prices generally results in a use of working capital. Given we process a significant volume of crude oil, the impact can materially affect our working capital, cash flows and liquidity.
Our profitability is affected by crudeCrude oil differentials and related factors, which fluctuate substantially.substantially;
A significant portion of our profitability is derived from the ability to purchase and process crude oil feedstocks that historically have been less expensive than benchmark crude oils, such as the heavy, sour crude oils processed at our Delaware City, Paulsboro, Chalmette, Torrance and Martinez refineries. For our Toledo refinery, aside from recent crude differential volatility, purchased crude prices have historically been slightly above the WTI benchmark, however, such crude slate typically results in favorable refinery production yield. For all locations, these crude oil differentials can vary significantly from quarter to quarter depending on overall economic conditions and trends and conditions within the markets for crude oil and refined products. Any change in these crude oil differentials may have an impact on our earnings. Our rail investment and strategy to acquire cost advantaged Mid-Continent and Canadian crude, which are priced based on WTI, could be adversely affected when the WTI/Dated Brent or related differentials narrow. A narrowing of the WTI/Dated Brent differential may result in our Toledo refinery losing a portion of its crude oil price advantage over certain of our competitors, which negatively impacts our profitability. In addition, efforts in Canada to control the imbalance between its production and capacity to export crude may continue to result in price volatility and the narrowing of the WTI/WCS differential, which is a proxy for the difference between light U.S. and heavy Canadian crude oil, and may reduce our refining margins and adversely affect our profitability and earnings. Divergent views have been expressed as to the expected magnitude of changes to these crude differentials in future periods. Any continued or further narrowing of these differentials could have a material adverse effect on our business and profitability.
Additionally, governmental and regulatory actions, including continued resolutions by the Organization of the Petroleum Exporting Countries to restrict crude oil production levels and executive actions by the current U.S. presidential administration to restrict the advancement of certain energy infrastructure projects such as the Keystone XL pipeline or Enbridge's Line 5 pipeline, may continue to impact crude oil prices and crude oil differentials. Any increase in crude oil prices or unfavorable movements in crude oil differentials due to such actions or changing regulatory environment may negatively impact our ability to acquire crude oil at economical prices and could have a material adverse effect on our business and profitability.
A significant interruption•Significant interruptions or casualty losslosses at any of our refineries and related assets or logistics terminals, pipelines or other facilities could reduce our production, particularly if not fully coveredowned by our insurance. Failureus or by one or more insurers to honor its coverage commitments for an insured event could materially and adversely affect our future cash flows, operating results and financial condition.
Our business currently consists of owning and operating six refineries and related assets, as well as logistics terminals, pipelines and other facilities. As a result, our operations could be subject to significant interruption if any of our refineries or other facilities were to experience a major accident, be damaged by severe weather or other natural disaster, or otherwise be forced to shut down or curtail production due to unforeseen events, such as acts of God, nature, orders of governmental authorities, supply chain disruptions impacting our crude rail facilities or other logistics assets, power outages, acts of terrorism, fires, toxic emissions and maritime hazards. Any such shutdown or disruption would reduce the production from that refinery. There is also risk of mechanical failure and equipment shutdowns both in general and following unforeseen events. Further, in such situations, undamaged refinery processing units may be dependent on or interact with damaged sections of our refineries and, accordingly, are also subject to being shut down. In the event any of our refineries is forced to shut down for a significant period of time, it would have a material adverse effect on our earnings, our other results of operations and our financial condition as a whole.
As protection against these hazards, we maintain insurance coverage against some, but not all, such potential losses and liabilities, including claims against us by third parties relating to our operations and products. We may not be able to maintain or obtain insurance of the type and amount we desire at reasonable rates. As a result of market conditions, premiums and deductibles for certain of our insurance policies may increase substantially. In some instances, certain insurance could become unavailable or available only for reduced amounts of coverage. For example, coverage for hurricane damage can be limited, and coverage for terrorism risks can include broad exclusions. If we were to incur a significant liability for which we were not fully insured, it could have a material adverse effect on our financial position.
Our insurance program includes a number of insurance carriers. Significant disruptions in financial markets could lead to a deterioration in the financial condition of many financial institutions, including insurance companies and, therefore, we may not be able to obtain the full amount of our insurance coverage for insured events. Even where we have insurance in place, there can be no assurance that the carriers will honor their obligations under the policies.
Our refineries are subject to interruptionsInterruptions of supply and distribution as a result ofat our reliance on pipelines and railroads for transportation of crude oil and refined products.refineries;
Our Toledo, Chalmette, Torrance and Martinez refineries receive a significant portion of their crude oil through our owned, as well as third-party, pipelines. These pipelines include the Enbridge system, Capline and Mid-Valley pipelines for supplying crude to our Toledo refinery, the MOEM Pipeline (which is owned by our subsidiary) and CAM Pipeline for supplying crude to our Chalmette refinery•Renewable fuels mandates and the San Joaquin Pipeline, San Pablo Bay Pipeline, San Ardo and Coastal Pipeline systems for supplying crude to our Torrance and Martinez refineries. Additionally, our Toledo, Chalmette, Torrance and Martinez refineries deliver a significant portion of the refined products through pipelines. These pipelines include pipelines such as the Sunoco Logistics Partners L.P. and Buckeye Partners L.P. pipelines at the Toledo refinery, the Collins pipeline (which is owned by our subsidiary) at our Chalmette refinery, the Jet Pipeline to the Los Angeles International Airport, the Product Pipeline to Vernon and the Product Pipeline to Atwood at our Torrance refinery and the KinderMorgan SFPP North Pipeline at our Martinez refinery. We could experience an interruption of supply or delivery, or an increased cost of receiving crude oil and delivering refined products to market, if the ability of these pipelines to transport crude oil or refined products is disrupted because of accidents, weather interruptions, governmental regulation, terrorism, other third-party action or casualty or other events.
The Delaware City rail unloading facilities and the assets acquired in connection with the PBFX acquisition of CPI Operations LLC (the “East Coast Storage Assets”), allow our East Coast Refining System to source WTI-based crudes from Western Canada and the Mid-Continent, which may provide significant cost advantages versus traditional Brent-based international crudes in certain market environments. Any disruptions or restrictions to our supply of crude by rail due to problems with third-party logistics infrastructure or operations or as a result of increased regulations, could increase our crude costs and negatively impact our results of operations and cash flows.
In addition, due to the common carrier regulatory obligation applicable to interstate oil pipelines, capacity allocation among shippers can become contentious in the event demand is in excess of capacity. Therefore, nominations by new shippers or increased nominations by existing shippers may reduce the capacity available to us. Any prolonged interruption in the operation or curtailment of available capacity of the pipelines that we rely upon for transportation of crude oil and refined products could have a further material adverse effect on our business, financial condition, results of operations and cash flows.
Our resultsExistence of operations continue to be impacted by significant costs to comply with renewable fuels mandates. The market prices for RINs have been volatile and may harm our profitability.
Pursuant to the Energy Policy Act of 2005 and the Energy Independence and Security Act of 2007, EPA has issued the Renewable Fuel Standard, implementing mandates to blend renewable fuels into the petroleum fuels produced and sold in the United States. Under the Renewable Fuel Standard, the volume of renewable fuels that obligated refineries must blend into their finished petroleum fuels historically has increased on an annual basis. In addition, certain states have passed legislation that requires minimum biodiesel blending in finished distillates. On October 13, 2010, EPA raised the maximum amount of ethanol allowed under federal law from 10% to 15% for cars and light trucks manufactured since 2007. The maximum amount allowed under federal law currently remains at 10% ethanol for all other vehicles. Existing laws and regulations could change, and the minimum volumes of renewable fuels that must be blended with refined petroleum fuels may increase. Because we do not produce renewable fuels, increasing the volume of renewable fuels that must be blended into our products displaces an increasing volume of our refinery’s product pool, potentially resulting in lower earnings and profitability. In addition, in order to meet certain of these and future EPA requirements, we may be required to purchase RINs, which may have fluctuating costs based on market conditions. The price of RINS was significant in 2021 and could increase further in 2022. We incurred approximately $726.0 million in RINs costs during the year ended December 31, 2021 as compared to $326.4 million and $122.7 million during the years ended December 31, 2020 and 2019, respectively. The fluctuations in our RINs costs are due primarily to volatility in prices for ethanol-linked RINs and increases in our production of on-road transportation fuels since 2012. Our RINs purchase obligation is dependent on our actual shipment of on-road transportation fuels domestically and the amount of blending achieved which can cause variability in our profitability. EPA’s proposed volumes of renewable fuels that obligated refineries must blend into their final petroleum fuels are expected to be finalized by the end of the first quarter of 2022. As a result, we could also experience fluctuating compliance costs in the future if the volumes finalized by EPA differ from what has been proposed.
We may have capital needs for which our internally generated cash flows and other sources of liquidity may not be adequate.adequate;
If we cannot generate sufficient cash flows or otherwise secure sufficient liquidity to support our short-term and long-term capital requirements, we may not be able to meet our payment obligations or our future debt obligations, comply with certain deadlines•Regulation related to environmental regulationsclimate change and standards, or pursue our business strategies, including acquisitions, in which case our operations may not perform as we currently expect. We have substantial short-term capital needs and may have substantial long-term capital needs. Our short-term working capital needs are primarily related to financing certainemissions of our crude oil and refined products inventory not covered by our various supply agreements and the Third Inventory Intermediation Agreement.
If we cannot adequately handle our crude oil and feedstock requirements or if we are required to obtain our crude oil supply at our other refineries without the benefit of the existing supply arrangements or the applicable counterparty defaults in its obligations, our crude oil pricing costs may increase as the number of days between when we pay for the crude oil and when the crude oil is delivered to us increases. Termination of our Third Inventory Intermediation Agreement with J. Aron, which is currently scheduled to expire in 2024, would require us to finance the J. Aron Products covered by the agreement, which financing may not be available at terms that are as favorable or at all. We are obligated to repurchase from J. Aron all volumes of the J. Aron Products upon expiration or earlier termination of this agreement, which may have a material adverse impact on our liquidity, working capital and financial condition. Further, if we are not able to market and sell our finished products to credit worthy customers, we may be subject to delays in the collection of our accounts receivable and exposure to additional credit risk. Such increased exposure could negatively impact our liquidity due to our increased working capital needs as a result of the increase in the amount of crude oil inventory and accounts receivable we would have to carry on our balance sheet. Our long-term needs for cash include those to repay our indebtednessgreenhouse gases and other contractual obligations, support ongoing capital expenditures for equipment maintenance and upgrades, including during turnarounds at our refineries, and to complete our routine and normally scheduled maintenance, regulatory, and security expenditures.
In addition, from time to time, we are required to spend significant amounts for repairs when one or more processing units experiences temporary shutdowns. We continue to utilize significant capital to upgrade equipment, improve facilities, and reduce operational, safety and environmental risks. In connection with the Paulsboro, Torrance and Martinez acquisitions, we assumed certain significant environmental obligations, and we have assumed a portion of certain environmental liabilities that may arise in connection with the Martinez acquisition and may similarly do so in future acquisitions. We will likely incur substantial compliance costs in connection with new or changing environmental, health and safety regulations. See “Item 7. Management’s Discussion and Analysis of Financial Condition and Results of Operations.” Our liquidity and financial condition will affect our ability to satisfy any and all of these needs or obligations.
We may incur significant liability under, or costs and capital expenditures to comply with, environmental and health and safety regulations, which are complex and change frequently.
Our operations are subject to federal, state and local laws regulating, among other things, the use and/or handling of petroleum and other regulated materials, the emission and discharge of materials into the environment, waste management, and remediation of discharges of petroleum and petroleum products, characteristics and composition of gasoline and distillates and other matters otherwise relating to the protection of the environment and the health and safety of the surrounding community. Our operations are also subject to extensive laws and regulations relating to occupational health and safety.
We cannot predict what additional environmental, health and safety legislation or regulations may be adopted in the future, or how existing or future laws or regulations may be administered or interpreted with respect to our operations. Many of these laws and regulations have become increasingly stringent over time, and the cost of compliance with these requirements can be expected to increase over time. For example, on July 21, 2021, the board of Bay Area Air Quality Management District (“BAAQMD”) voted to adopt proposed amendments to “Regulation 6-5: Particulate Emissions from Refinery Fluidized Catalytic Cracking Units - 2021 Amendment” (“Rule 6-5 Amendment”) requiring compliance with more stringent standards for particulate emissions from FCC units at refineries in the Bay Area by 2026. The regulation does not require that any specific technology be utilized to meet the new standards. The costs incurred by us to achieve the new emissions standards at our Martinez refinery within the required timeframe may be significant, and there can be no assurance that the measures we implement will achieve the required emissions reductions.
Certain environmental laws impose strict, and in certain circumstances, joint and several, liability for costs of investigation and cleanup of spills, discharges or releases on owners and operators of, as well as persons who arrange for treatment or disposal of regulated materials at, contaminated sites. Under these laws, we may incur liability or be required to pay penalties for past contamination, and third parties may assert claims against us for damages allegedly arising out of any past or future contamination. The potential penalties and clean-up costs for past or future spills, discharges or releases, the failure of prior owners of our facilities to complete their clean-up obligations, the liability to third parties for damage to their property, or the need to address newly-discovered information or conditions that may require a response could be significant, and the payment of these amounts could have a material adverse effect on our business, financial condition, cash flows and results of operations.
Potential further laws and regulations related to climate change could have a material adverse impact on our operations and adversely affect our facilities.
Some scientists have concluded that increasing concentrations of GHGs in the Earth’s atmosphere may produce climate changes that have significant physical effects, such as increased frequency and severity of storms, droughts, floods and other climatic events. We believe the issue of climate change will likely continue to receive scientific and political attention, with the potential for further laws and regulations that could materially adversely affect our ongoing operations.
In addition, as many of our facilities are located near coastal areas, rising sea levels may disrupt our ability to operate those facilities or transport crude oil and refined products. Extended periods of such disruption could have an adverse effect on our results of operation. We could also incur substantial costs to protect or repair these facilities.
Regulation of emissions of greenhouse gases could force us to incur increased capital expenditures and operating costs and could have a material adverse effect on our results of operations and financial condition.
Both houses of Congress have actively considered legislation to reduce emissions of GHGs, such as carbon dioxide and methane, including proposals to: (i) establish a cap and trade system, (ii) create a federal renewable energy or “clean” energy standard requiring electric utilities to provide a certain percentage of power from such sources, and (iii) create enhanced incentives for use of renewable energy and increased efficiency in energy supply and use. In addition, EPA is taking steps to regulate GHGs under the existing federal Clean Air Act. EPA has already adopted regulations limiting emissions of GHGs from motor vehicles, addressing the permitting of GHG emissions from stationary sources, and requiring the reporting of GHG emissions from specified large GHG emission sources, including refineries. These and similar regulations could require us to incur costs to monitor and report GHG emissions or reduce emissions of GHGs associated with our operations. In addition, various states, individually as well as in some cases on a regional basis, have taken steps to control GHG emissions, including adoption of GHG reporting requirements, cap and trade systems and renewable portfolio standards (such as AB 32). On September 23, 2020 the Governor of California issued an executive order effectively banning the sale of new gasoline-powered passenger cars and trucks by 2035 and requiring zero-emission medium to heavy duty vehicles by 2045 everywhere feasible. The executive order requires state agencies to build out sufficient electric vehicle charging infrastructure. It is not possible at this time to predict the ultimate form, timing or extent of federal or state regulation. In the event we do incur increased costs as a result of increased efforts to control GHG emissions, we may not be able to pass on any of these costs to our customers. Regulatory requirements also could adversely affect demand for the refined products that we produce. Any increased costs or reduced demand could materially and adversely affect our business and results of operations.
Requirements to reduce emissions could result in increased costs to operate and maintain our facilities as well as implement and manage new emission controls and programs put in place. For example, in September 2016, the state of California enacted Senate Bill 32 which further reduces greenhouse gas emissions targets to 40 percent below 1990 levels by 2030. Two regulations implemented to achieve these goals are Cap-and-Trade and the Low Carbon Fuel Standard (“LCFS”). In 2012, CARB implemented Cap-and-Trade. This program currently places a cap on GHGs and we are required to acquire a sufficient number of credits to cover emissions from our refineries and our in-state sales of gasoline and diesel. In 2009, CARB adopted the LCFS, which required a 10% reduction in the carbon intensity of gasoline and diesel by 2020•. In 2018, CARB amended the LCFS to require a 20% reduction by 2030. Compliance is achieved through blending lower carbon intensity biofuels into gasoline and diesel or by purchasing credits. Compliance with each of these programs is facilitated through a market-based credit system. If sufficient credits are unavailable for purchase or we are unable to pass through costs to our customers, we have to pay a higher price for credits or if we are otherwise unable to meet our compliance obligations, our financial condition and results of operations could be adversely affected.
On September 23, 2020, the California Governor issued Executive Order N-79-20 (“N-79-20 Order”) intended to further reduce GHGs within the state. The N-79-20 Order sets a 2035 goal of no sale of internal combustion engines for passenger cars and pickup trucks within California, and a 2045 goal of no sale of internal combustion engine medium- and heavy-duty trucks, and off-road vehicles and equipment. However, the N-79-20 Order would still allow used internal combustion engine vehicles to be used and sold after these dates. The N-79-20 Order encourages zero emissions technologies such as electric vehicles, and accelerated deployment of affordable fueling and charging options. It is currently uncertain how the N-79-20 Order may be ultimately implemented by various California regulatory agencies. In the event we do incur increased costs as a result of increased efforts to control GHG emissions through future adopted regulatory requirements, we may not be able to pass these costs to our customers. These future regulatory requirements also could adversely
affect demand for the refined products that we produce. Any increased costs or reduced demand could materially and adversely affect our business and results of operations.
Environmental clean-up and remediation costs of our sites and environmental litigation could decrease our net cash flow, reduce our results of operations and impair our financial condition.
We may be subject to liability for the investigation and clean-up of environmental contamination at each of the properties that we own, lease, occupy or operate and at off-site locations where we arrange for the treatment or disposal of regulated materials. We may become involved in litigation or other proceedings related to the foregoing. If we were to be held responsible for damages in any such litigation or proceedings, such costs may not be covered by insurance and may be material. Historical soil and groundwater contamination has been identified at our refineries. Currently, remediation projects for such contamination are underway in accordance with regulatory requirements at our refineries. In connection with the acquisitions of certain of our refineries and logistics assets, the prior owners have retained certain liabilities or indemnified us for certain liabilities, including those relating to pre-acquisition soil and groundwater conditions, and in some instances we have assumed certain liabilities and environmental obligations, including certain existing and potential remediation obligations. If the prior owners fail to satisfy their obligations for any reason, or if significant liabilities arise in the areas in which we assumed liability, we may become responsible for remediation expenses and other environmental liabilities, which could have a material adverse effect on our business, financial condition, results of operations and cash flow. As a result, in addition to making capital expenditures or incurring other costs to comply with environmental laws, we also may be liable for significant environmental litigation or for investigation and remediation costs and other liabilities arising from the ownership or operation of these assets by prior owners, which could materially adversely affect our business, financial condition, results of operations and cash flow. See “Item 1. Business—Environmental, Health and Safety Matters” and “Item 7. Management’s Discussion and Analysis of Financial Condition and Results of Operations—Contractual Obligations and Commitments”.
We may also face liability arising from current or future claims alleging personal injury or property damage due to exposure to chemicals or other regulated materials, such as various perfluorinated compounds, including perfluorooctanoate, perfluorooctane sulfonate, perfluorohexane sulfonate, or other per-and polyfluoroalkyl substances (collectively, “PFAS”), asbestos, benzene, silica dust and petroleum hydrocarbons, at or from our facilities. We may also face liability for personal injury, property damage, natural resource damage or clean-up costs for the alleged migration of contamination from our properties. A significant increase in the number or success of these claims could materially adversely affect our business, financial condition, results of operations and cash flow. Recently, we have been voluntarily cooperating with various local, state and federal agencies in their review of the environmental and health effects of PFAS and additional PFAS-related laws may be developed at the local, state and federal level that could lead to our incurring liability for damages or other costs, civil or criminal proceedings, the imposition of fines and penalties, or other remedies or otherwise affect our business.Governmental inquiries or lawsuits involving PFAS could lead to our incurring liability for damages or other costs, civil or criminal proceedings, the imposition of fines and penalties, or other remedies, as well as restrictions on or added costs for our business operations going forward, including in the form of restrictions on discharges at our manufacturing facilities or otherwise. We may be subject to asserted or unasserted claims and governmental regulatory proceedings and inquiries related to the use of PFAS in a variety of jurisdictions.
Our pipelines are subject to federal and/or state regulations, which could reduce profitability and the amount of cash we generate.
Our transportation activities are subject to regulation by multiple governmental agencies. The regulatory burden on the industry increases the cost of doing business and affects profitability. Additional proposals and proceedings that affect the oil industry are regularly considered by Congress, the states, the Federal Energy Regulatory Commission, the United States Department of Transportation, and the courts. We cannot predict when or whether any such proposals may become effective or what impact such proposals may have. Projected operating costs related to our pipelines reflect the recurring costs resulting from compliance with these regulations, and these costs may increase due to future acquisitions, changes in regulation, changes in use, or discovery of existing but unknown compliance issues.
We could incur substantial costs or disruptions in our business if we cannot obtain or maintain necessary permits and authorizations or otherwise comply with health, safety, environmental and other laws and regulations.
Our operations require numerous permits and authorizations under various laws and regulations. These authorizations and permits are subject to revocation, renewal or modification and can require operational changes to limit impacts or potential impacts on the environment and/or health and safety. A violation of authorization or permit conditions or other legal or regulatory requirements could result in substantial fines, criminal sanctions, permit revocations, injunctions, and/or facility shutdowns. In addition, major modifications of our operations could require modifications to our existing permits or upgrades to our existing pollution control equipment. Any or all of these matters could have a negative effect on our business, results of operations and cash flows.
We may incur significant liabilities under, or costs and capital expenditures to comply with, health, safety, environmental and other laws and regulations, which are complex and change frequently. Our operations are subject to federal, state and local laws regulating, among other things, the handling of petroleum and other regulated materials, the emission and discharge of materials into the environment, waste management, and remediation of discharges of petroleum and petroleum products, characteristics and composition of gasoline and distillates and other matters otherwise relating to the protection of the environment. Our operations are also subject to extensive laws and regulations relating to occupational health and safety, in addition to laws and regulations affecting the transportation of crude oil by rail in North America.
We cannot predict what additional environmental, health and safety legislation or regulations may be adopted in the future, or how existing or future laws or regulations may be administered or interpreted with respect to our operations. Many of these laws and regulations are becoming increasingly stringent, and the cost of compliance with these requirements can be expected to increase over time.
Certain environmental laws impose strict, and in certain circumstances joint and several liability for, costs of investigation and cleanup of such spills, discharges or releases on owners and operators of, as well as persons who arrange for treatment or disposal of regulated materials at contaminated sites. Under these laws, we may incur liability or be required to pay penalties for past contamination, and third parties may assert claims against us for damages allegedly arising out of any past or future contamination. The potential penalties and clean-up costs for past or future releases or spills, the failure of prior owners of our facilities to complete their clean-up obligations, the liability to third parties for damage to their property, or the need to address newly-discovered information or conditions that may require a response could be significant, and the payment of these amounts could have a material adverse effect on our business, financial condition and results of operations.
Enhanced scrutiny on ESG matters may negatively impactmatters;
•Rate of inflation and its impacts on supply and demand, pricing, and supply chain disruption;
•Actions taken by our business and our accesscompetitors, including adjustments to capital markets.
Enhanced scrutiny on ESG matters may impact our business as it relatesrefining capacity or renewable fuels production in response to the use of refined products, climate change, increasing public expectations on companies to address climate change, and potential use of substitutes or replacements to our products may result in increased costs, reduced demand for our products, reduced profits, increased regulations and litigation, and adverse impacts on our stock price and access to capital markets. In addition, organizations that provide information to investors on corporate governance and related matters have developed ratings for evaluating companies on their approach to ESG matters. Such ratings are used by some investors to inform and advise their investment and voting decisions. Also, some stakeholders may advocate for divestment of fossil fuel investments and encourage lenders to limit funding to companies engaged in the manufacturing of refined products. Unfavorable ESG ratings and investment community divestment initiatives may lead to negative investor and public sentiment toward the Company and to the diversion of capital from our industry, which could have a negative impact on our stock price and our access to, and costs of, capital.market conditions;
We may not be able to obtain funding on acceptable terms or at all because of volatilityVolatility and uncertainty in the credit and capital markets. This may hinder or prevent us from meeting our future capital needs.
In the past, global financial markets, and economic conditions have been, and may again be, subject to disruption and volatile due to a variety of factors, including uncertainty in the financial services sector, low consumer confidence, falling commodity prices, geopolitical issues and generally weak economic conditions. In addition, the fixed income markets have experienced periods of extreme volatility that have negatively impacted market liquidity conditions, including as a result of the impact of the COVID-19 pandemic. As a result, the cost of raising money in the debt and equity capital markets has increased substantially at times while the availability of funds from those markets diminished significantly. In particular,higher interest rates;
•Any political instability, including as a result of concerns aboutRussia’s military action in Ukraine, the stabilityoutbreak of financial markets generally, which may be subject to unforeseen disruptions,armed hostilities in the cost of obtaining moneymiddle east, disruption in international shipping resulting from recent attacks by armed groups on cargo ships in the credit markets may increase as many lenders and institutional investors increase interest rates, enact tighter lending standards, refuse to refinance existing debt on similar terms or at all and reduce or, in some cases, cease to provide funding to borrowers. Due to these factors, we cannot be certain that new debt or equity financing will be available on acceptable terms. If funding is not available when needed, or is available only on unfavorable terms, we may be unable to meet our obligations as they come due. Moreover, without adequate funding, we may be unable to execute our growth strategy, complete future acquisitions, take advantage of other business opportunities or respond to competitive pressures, any of which could have a material adverse effect on our revenues and results of operations.
Any political instability,Red Sea, military strikes, sustained military campaigns, terrorist activity, changes in foreign policy, or other catastrophic events could have a material adverse effect on our business, results of operations and financial condition.
Any political instability, military strikes, sustained military campaigns, terrorist activity, changes in foreign policy in areas or regions of the world where we acquire crude oil and other raw materials or sell our refined products may affect our business in unpredictable ways, including forcing us to increase security measures and causing disruptions of supplies and distribution markets. We may also be subject to United States trade and economic sanctions laws, which change frequently as a result of foreign policy developments, and which may necessitate changes to our crude oil acquisition activities. Further, like other industrial companies, our facilities may be the target of terrorist activities or subject to catastrophic events such as natural disasters and pandemic illness. Any act of war, terrorism, or other catastrophic events that resulted in damage to, or otherwise disrupts the operating activities of, any of our refineries or third-party facilities upon which we are dependent for our business operations could have a material adverse effect on our business, results of operations and financial condition.
A cyber-attack on, or other failure of, our technology infrastructure could affect our business and assets, and have a material adverse effect on our financial condition, results of operations and cash flows.
We are becoming increasingly dependent on our technology infrastructure and certain critical information systems which process, transmit and store electronic information, including information we use to safely and effectively operate our respective assets and businesses. These information systems include data network and telecommunications, internet access, our websites, and various computer hardware equipment and software applications, including those that are critical to the safe operation of our refineries and logistics assets. We have invested, and expect to continue to invest, significant time, manpower and capital in our technology infrastructure and information systems. These information systems are subject to damage or interruption from a number of potential sources including natural disasters, software viruses or other malware, power failures, cybersecurity threats to gain unauthorized access to sensitive information, cyber-attacks, which may render data systems unusable, and physical threats to the security of our facilities and infrastructure. Additionally, our business is highly dependent on financial, accounting and other data processing systems and other communications and information systems, including our enterprise resource planning tools. We process a large number of transactions on a daily basis and rely upon the proper functioning of computer systems. Furthermore, we rely on information systems across our respective operations, including the management of supply chain and various other processes and transactions. As a result, a disruption on any information systems at our refineries or logistics assets, may cause disruptions to our collective operations.
The potential for such security threats or system failures has subjected our operations to increased risks that could have a material adverse effect on our business. To the extent that these information systems are under our control, we have implemented measures such as virus protection software, emergency recovery processes and a formal disaster recovery plan to address the outlined risks. However, security measures for information systems cannot be guaranteed to be failsafe, and our formal disaster recovery plan and other implemented measures may not prevent delays or other complications that could arise from an information systems failure. If a key system were hacked or otherwise interfered with by an unauthorized user, or were to fail or experience unscheduled downtime for any reason, even if only for a short period, or any compromise of our data security or our inability to use or access these information systems at critical points in time, it could unfavorably impact the timely and efficient operation of our business, damage our reputation and subject us to additional costs and liabilities. The increase in companies and individuals working remotely has increased the frequency and scope of cyber-attacks and the risk of potential cybersecurity incidents, both deliberate attacks and unintentional events. While, to date, we have not had a significant cybersecurity breach or attack that had a material impact on our business or results of operations, if we were to be subject to a material successful cyber intrusion, it could result in remediation or service restoration costs, increased cyber protection costs, lost revenues, litigation or regulatory actions by governmental authorities, increased insurance premiums, reputational damage and damage to our competitiveness, financial condition, results of operations and cash flows.
Cyber-attacks against us or others in our industry could result in additional regulations, and U.S. government warnings have indicated that infrastructure assets, including pipelines, may be specifically targeted by certain groups. These attacks include, without limitation, malicious software, ransomware, attempts to gain unauthorized access to data, and other electronic security breaches. These attacks may be perpetrated by state-sponsored groups, “hacktivists”, criminal organizations or private individuals (including employee malfeasance). Current efforts by the federal government, including the Strengthening the Cybersecurity of Federal Networks and Critical Infrastructure executive order, the issuance of new cybersecurity requirements for critical pipeline owners and operators issued by the Department of Homeland Security’s Transportation Security Administration following a cyber-attack on a major petroleum pipeline in 2021, and any potential future regulations could lead to increased regulatory compliance costs, insurance coverage cost or capital expenditures. We cannot predict the potential impact to our business or the energy industry resulting from additional regulations.
Further, our business interruption insurance may not compensate us adequately for losses that may occur. We do not carry insurance specifically for cybersecurity events; however, certain of our insurance policies may allow for coverage for a cyber-event resulting in ensuing property damage from an otherwise insured peril. If we were to incur a significant liability for which we were not fully insured, it could have a material adverse effect on our financial position, results of operations and cash flows. In addition, the proceeds of any such insurance may not be paid in a timely manner and may be insufficient if such an event were to occur.
Competition from companies who have not been adversely impacted as much as we have been by the COVID-19 pandemic, produce their own supply of feedstocks, have extensive retail outlets, make alternative fuels or have greater financial and other resources than we do could materially and adversely affect our business and results of operations.
Our refining operations compete with domestic refiners and marketers in regions of the United States in which we operate, as well as with domestic refiners in other regions and foreign refiners that import products into the United States. In addition, we compete with other refiners, producers and marketers in other industries that supply their own renewable fuels or alternative forms of energy and fuels to satisfy the requirements of our industrial, commercial and individual consumers. Many of our competitors have not been adversely impacted by the COVID-19 pandemic as much as we have been impacted. Certain of our competitors have larger and more complex refineries, and may be able to realize lower per-barrel costs or higher margins per barrel of throughput. Several of our principal competitors are integrated national or international oil companies that are larger and have substantially greater resources than we do and access to proprietary sources of controlled crude oil production. Unlike these competitors, we obtain substantially all of our feedstocks from unaffiliated sources. We are not engaged in the petroleum exploration and production business and therefore do not produce any of our crude oil feedstocks. We do not have a retail business and therefore are dependent upon others for outlets for our refined products. Because of their integrated operations and larger capitalization, these companies may be more flexible in responding to volatile industry or market conditions, such as shortages of crude oil supply and other feedstocks or intense price fluctuations and they may also be able to obtain more favorable trade credit terms.
Newer or upgraded refineries will often be more efficient than our refineries, which may put us at a competitive disadvantage. We have taken significant measures to maintain our refineries including the installation of new equipment and redesigning older equipment to improve our operations. However, these actions involve significant uncertainties, since upgraded equipment may not perform at expected throughput levels, the yield and product quality of new equipment may differ from design specifications and modifications may be needed to correct equipment that does not perform as expected. Any of these risks associated with new equipment, redesigned older equipment or repaired equipment could lead to lower revenues or higher costs or otherwise have an adverse effect on future results of operations and financial condition. Over time, our refineries or certain refinery units may become obsolete, or be unable to compete, because of the construction of new, more efficient facilities by our competitors.
We must make substantial capital expenditures on our operating facilities to maintain their reliability and efficiency. If we are unable to complete capital projects at their expected costs and/or in a timely manner, or if the market conditions assumed in our project economics deteriorate, our financial condition, results of operations or cash flows could be materially and adversely affected.
Delays or cost increases related to capital spending programs involving engineering, procurement and construction of new facilities (or improvements and repairs to our existing facilities and equipment, including turnarounds) could adversely affect our ability to achieve targeted internal rates of return and operating results. Such delays or cost increases may arise as a result of unpredictable factors in the marketplace, many of which are beyond our control, including:
•denial or delay in obtaining regulatory approvals and/or permits;programs;
•unplanned increases in the cost of construction materials or labor;
•disruptions in transportation of modular components and/or construction materials;
•severe adverse weather conditions, natural disasters or other events (such as equipment malfunctions, explosions, fires or spills) affecting our facilities, or those of vendors and suppliers;
•shortages of sufficiently skilled labor, or labor disagreements resulting in unplanned work stoppages;
•market-related increases in a project’s debt or equity financing costs; and/or
•non-performance or force majeure by, or disputes with, vendors, suppliers, contractors or sub-contractors involved with a project.
Our refineries contain many processing units, a number of which have been in operation for many years. Equipment, even if properly maintained, may require significant capital expenditures and expenses to keep it operating at optimum efficiency. One or more of the units may require unscheduled downtime for unanticipated maintenance or repairs that are more frequent than our scheduled turnarounds for such units. Scheduled and unscheduled maintenance could reduce our revenues during the period of time that the units are not operating.
Our forecasted internal rates of return are also based upon our projections of future market fundamentals, which are not within our control, including changes in general economic conditions, impact of new regulations, available alternative supply and customer demand. Any one or more of these factors could have a significant impact on our business. If we were unable to make up the delays associated with such factors or to recover the related costs, or if market conditions change, it could materially and adversely affect our financial position, results of operations or cash flows.
We are subject to strict laws and regulations regarding employee and process safety, and failure to comply with these laws and regulations could have a material adverse effect on our results of operations, financial condition and profitability.
We are subject to the requirements of the OSHA, and comparable state statutes that regulate the protection of the health and safety of workers. In addition, OSHA requires that we maintain information about hazardous materials used or produced in our operations and that we provide this information to employees, state and local governmental authorities, and local residents. Failure to comply with OSHA requirements, including general industry standards, process safety standards and control of occupational exposure to regulated substances, could result in claims against us that could have a material adverse effect on our results of operations, financial condition and the cash flows of the business if we are subjected to significant fines or compliance costs.
PBF Energy has suspended its quarterly dividend and does not anticipate that it will declare dividends in the foreseeable future.
On March 30, 2020, PBF Energy announced that it has suspended its quarterly cash dividend of $0.30 per share on its Class A common stock, as part of its strategic plan to respond to the impact of the COVID-19 outbreak and related market activity. PBF Energy is not obligated under any applicable laws, its governing documents or any contractual agreements with its existing and prior owners or otherwise to declare or pay any dividends or other distributions (other than the obligations of PBF LLC to make tax distributions to its members). Any future declaration, amount and payment of any dividends will be at the sole discretion of our Board of Directors, however, because the impact of the COVID-19 outbreak and related market activity is difficult to predict, we do not anticipate that our Board of Directors will determine to declare a dividend in the foreseeable future. Our Board of Directors may take into account, among other things, general economic conditions, our financial condition and operating results, our available cash and current and anticipated cash needs, capital requirements, plans for expansion, including acquisitions, tax, legal, regulatory and contractual restrictions and implications, including under our subsidiaries’ outstanding debt documents, and such other factors as our Board of Directors may deem relevant in determining whether to declare or pay any dividend. Because PBF Energy is a holding company with no material assets (other than the equity interests of its direct subsidiary), its cash flow and ability to pay dividends is dependent upon the financial results and cash flows of its indirect subsidiaries PBF Holding and PBFX and their respective operating subsidiaries and the distribution or other payment of cash to it in the form of dividends or otherwise. The direct and indirect subsidiaries of PBF
Energy are separate and distinct legal entities and have no obligation to make any funds available to it other than in the case of certain intercompany transactions. As a result, if PBF Energy does not declare or pay dividends you may not receive any return on an investment in PBF Energy Class A common stock unless you sell PBF Energy Class A common stock for a price greater than that which you paid for it.
Product liability andclaims, operational liability claims and litigation could adversely affect our business and results of operations.
Product liability and liability arising from our operations are significant risks. Substantial damage awards have been made in certain jurisdictions against manufacturers and resellers of petroleum products based upon claims for injuries and property damage caused by the use of or exposure to various products. Failure of our products to meet required specifications or claims that a product is inherently defective could result in product liability claims from our shippers and customers, and also arise from contaminated or off-specification product in commingled pipelines and storage tanks and/or defective fuels. We may also be subject to personal injury claims arising from incidents that occur in connection with or relating to our operations. Product liability and personal injury claims against us could have aother material adverse effect on our business, financial condition or results of operations.
Compliance with and changes in tax laws could adversely affect our performance.
We are subject to extensive tax liabilities, including federal, state, local and foreign taxes such as income, excise, sales/use, payroll, franchise, property, gross receipts, withholding and ad valorem taxes. New tax laws and regulations and changes in existing tax laws and regulations are continuously being enacted or proposed that could result in increased expenditures for tax liabilities in the future. These liabilities are subject to periodic audits by the respective taxing authorities, which could increase our tax liabilities. Subsequent changes to our tax liabilities as a result of these audits may also subject us to interest and penalties. There can be no certainty that our federal, state, local or foreign taxes could be passed on to our customers.
Acquisitions that we may undertake in the future involve a number of risks, any of which could cause us not to realize the anticipated benefits.
We may not be successful in acquiring additional assets, and any acquisitions that we do consummate may not produce the anticipated benefits or may have adverse effects on our business and operating results. We may selectively consider strategic acquisitions in the future within the refining and mid-stream sector based on performance through the cycle, advantageous access to crude oil supplies, attractive refined products market fundamentals and access to distribution and logistics infrastructure. Our ability to do so will be dependent upon a number of factors, including our ability to identify acceptable acquisition candidates, consummate acquisitions on acceptable terms, successfully integrate acquired assets and obtain financing to fund acquisitions and to support our growth and many other factors beyond our control. Risks associated with acquisitions include those relating to the diversion of management time and attention from our existing business, liability for known or unknown environmental conditions or other contingent liabilities and greater than anticipated expenditures required for compliance with environmental, safety or other regulatory standards or for investments to improve operating results, and the incurrence of additional indebtedness to finance acquisitions or capital expenditures relating to acquired assets. We may also enter into transition services agreements in the future with sellers of any additional refineries we acquire. Such services may not be performed timely and effectively, and any significant disruption in such transition services or unanticipated costs related to such services could adversely affect our business and results of operations. In addition, it is likely that, when we acquire refineries, we will not have access to the type of historical financial information that we will require regarding the prior operation of the refineries. As a result, it may be difficult for investors to evaluate the probable impact of significant acquisitions on our financial performance until we have operated the acquired refineries for a substantial period of time.
A portion of our workforce is unionized, and we may face laborLabor disruptions that would interfere with our operations.operations;
Most hourly employees at our refineries are covered by collective bargaining agreements through the USW, the IOW and the IBEW. Certain•Discontinuation of these agreements have expired while others are scheduled to expire on various dates in 2022 through 2024 (See “Item 1. Business” - Employees). For the agreements that expired, terms related to new collective bargaining agreements have been agreed to on local bargaining issues and are pending settlementemployment of the National Oil Bargaining Program which will set contract term, wages, health care contributions and any other agreed upon issues prior to being executed.During this interim period, the terms of the expired agreements will remain in place under rolling 24-hour extensions until new agreements are finalized. Future negotiations prior to the expiration of our collective agreements may result in labor unrest for which a strike or work stoppage is possible. Strikes and/or work stoppages could negatively affect our operational and financial results and may increase operating expenses at the refineries.
Our business may suffer if any of our senior executives or other key employees discontinues employment with us. Furthermore, a shortage of skilled labor or disruptions in our labor force may make it difficult for us to maintain labor productivity.
Our future success depends to a large extent on the services of our senior executives and other key employees. Our business depends on our continuing ability to recruit, train and retain highly qualified employees in all areas of our operations, including engineering, accounting, business operations, finance and other key back-office and mid-office personnel. Furthermore, our operations require skilled and experienced employees with proficiency in multiple tasks. The competition for these employees is intense, and the loss of these executives or employees could harm our business. If any of these executives or other key personnel resigns or becomes unable to continue in his or her present role and is not adequately replaced, our business operations could be materially adversely affected.
Our hedging activities may limit our potential gains, exacerbate potential losses and involve other risks.
We may enter into commodity derivatives contracts to hedge our crude price risk or crack spread risk with respect to a portion of our expected gasoline and distillate production on a rolling basis or to hedge our exposure to the price of natural gas, which is a significant component of our refinery operating expenses. Consistent with that policy we may hedge some percentage of our future crude and natural gas supply. We may enter into hedging arrangements with the intent to secure a minimum fixed cash flow stream on the volume of products hedged during the hedge term and to protect against volatility in commodity prices. Our hedging arrangements may fail to fully achieve these objectives for a variety of reasons, including our failure to have adequate hedging arrangements, if any, in effect at any particular time and the failure of our hedging arrangements to produce the anticipated results. We may not be able to procure adequate hedging arrangements due to a variety of factors. Moreover, such transactions may limit our ability to benefit from favorable changes in crude oil, refined product and natural gas prices.
In addition, our hedging activities may expose us to the risk of financial loss in certain circumstances, including instances in which:
•the volumes of our actual use of crude oil or natural gas or production of the applicable refined products is less than the volumes subject to the hedging arrangement;employees;
•accidents, interruptions in feedstock transportation, inclement weather or other events cause unscheduled shutdowns or otherwise adversely affect our refineries, or those of our suppliers or customers;
•changesOur activity in commodity prices have a material impact on collateral and margin requirements under our hedging arrangements, resulting in us being subject to margin calls;derivatives markets.
•the counterparties to our derivative contracts fail to perform under the contracts; or
•a sudden, unexpected event materially impacts the commodity or crack spread subject to the hedging arrangement.
As a result, the effectiveness of our hedging strategy could have a material impact on our financial results. See “Item 7A. Quantitative and Qualitative Disclosures About Market Risk.”
In addition, these hedging activities involve basis risk. Basis risk in a hedging arrangement occurs when the price of the commodity we hedge is more or less variable than the index upon which the hedged commodity is based, thereby making the hedge less effective. For example, a New York Mercantile Exchange index used for hedging certain volumes of our crude oil or refined products may have more or less variability than the actual cost or price we realize for such crude oil or refined products. We may not hedge all the basis risk inherent in our hedging arrangements and derivative contracts.
Our commodity derivative activities could result in period-to-period earnings volatility.
We do not currently apply hedge accounting to any of our commodity derivative contracts and, as a result, unrealized gains and losses will be charged to our earnings based on the increase or decrease in the market value of such unsettled positions. These gains and losses may be reflected in our income statement in periods that differ from when the settlement of the underlying hedged items are reflected in our income statement. Such derivative gains or losses in earnings may produce significant period-to-period earnings volatility that is not necessarily reflective of our underlying operational performance.
Risks Related to Our Indebtedness
•Our levels of indebtedness;
•Our ability to secure necessary financing on acceptable terms;
•Changes in our credit ratings;
•Limitations on our operations arising out of restrictive covenants in our debt instruments;
•Anti-takeover provisions in our indentures.
Risks Related to Our Organizational Structure and PBF Energy Class A Common Stock
•PBF Energy’s dependence upon distributions from PBF LLC and its subsidiaries to pay taxes and meet its other obligations;
•The rights of other members of PBF LLC may conflict with the interests of PBF Energy Class A common stockholders;
•Obligations under the Tax Receivable Agreement, as defined below;
•Prospect that dividend payments may not be declared in the future;
•Anti-takeover provisions in our certificate of incorporation and bylaws and under Delaware law;
•Volatility of our stock price;
•Potential dilution of our current stockholders.
Risk Factors
You should carefully read the risks and uncertainties described below. The risks and uncertainties described below are not the only ones facing our Company. Additional risks and uncertainties may also impair our business operations. If any of the following risks actually occur, our business, financial condition, results of operations or cash flows would likely suffer. In that case, the trading price of PBF Energy Class A common stock could fall.
Risks Relating to Our Business and Industry
Demand for our refined products can significantly decline due to changes in global and regional economic conditions.
Business closings and layoffs in the markets we operate may adversely affect demand for our refined products. Deterioration of general economic conditions or weak demand levels could require additional actions on our part to lower our operating costs, including temporarily or permanently ceasing to operate units at our facilities. There may be significant incremental costs associated with such actions. Deterioration of global and regional economic conditions may harm our liquidity and ability to repay our outstanding debt and the trading price of PBF Energy’s Class A common stock.
The price volatility of crude oil, other feedstocks, blendstocks, refined products and fuel and utility services may have a material adverse effect on our revenues, profitability, cash flows and liquidity.
Our profitability, cash flows and liquidity from operations depend primarily on the margin above operating expenses (including the cost of refinery feedstocks, such as crude oil, intermediate partially refined products, and natural gas liquids that are processed and blended into refined products) at which we are able to sell refined products. Refining is primarily a margin-based business and, to increase profitability, it is important to maximize the yields of high value finished products while minimizing the costs of feedstock and operating expenses. When the margin between refined product prices and crude oil and other feedstock costs contracts, our earnings, profitability and cash flows are negatively affected. Historically, refining margins have been volatile, and are likely to continue to be volatile, as a result of a variety of factors, including fluctuations in the prices of crude oil, other feedstocks, refined products and fuel and utility services. An increase or decrease in the price of crude oil will likely result in a similar increase or decrease in prices for refined products; however, there may be a time lag in the realization, or no such realization, of the similar increase or decrease in prices for refined products. The effect of changes in crude oil prices on our refining margins therefore depends in part on how quickly and how fully refined product prices adjust to reflect these changes.
The nature of our business has required us to maintain substantial crude oil, feedstock and refined product inventories. Because crude oil, feedstock and refined products are commodities, we have no control over the changing market value of these inventories. Our crude oil, feedstock and refined product inventories are valued at the LCM value under the last-in-first-out (“LIFO”) inventory valuation methodology. At December 31, 2023 and December 31, 2022, the replacement value of inventories exceeded the LIFO carrying value, therefore no LCM inventory reserve was recorded. If the market value of our crude oil, feedstock and refined product inventory declines to an amount less than our LIFO cost, we would record a write-down of inventory and a non-cash impact to cost of products and other.
Prices of crude oil, other feedstocks, blendstocks, and refined products depend on numerous factors beyond our control, including the supply of and demand for crude oil, other feedstocks, gasoline, diesel, ethanol, asphalt and other refined products. Such supply and demand are affected by a variety of economic, market, environmental and political conditions.
Our direct operating expense structure also impacts our profitability. Our major direct operating expenses include employee and contract labor, maintenance and energy. Our predominant variable direct operating cost is energy, which is comprised primarily of fuel and other utility services. The volatility in costs of fuel, principally natural gas, and other utility services, principally electricity, used by our refineries and other operations affect our operating costs. Fuel and utility prices have been, and will continue to be, affected by factors outside our control, such as supply and demand for fuel and utility services in both local and regional markets. Natural gas prices have historically been volatile and, typically, electricity prices fluctuate with natural gas prices. Future increases in fuel and utility prices may have a negative effect on our refining margins, profitability and cash flows.
In addition, the operations, profitability and cash flows of SBR may similarly be impacted by volatility of renewable feedstock costs and operating expenses, which may negatively impact the anticipated benefits and operating synergies from the Renewable Diesel Facility or our equity method investment in SBR. See “We may not be able to successfully integrate the operations of our 50-50 equity method investment into our business, or realize the anticipated benefits of this investment” risk factor below.
Our working capital, cash flows and liquidity can be significantly impacted by volatility in commodity prices and refined product demand.
Payment terms for our crude oil purchases are typically longer than those terms we extend to our customers for sales of refined products. Additionally, reductions in crude oil purchases tend to lag demand decreases for our refined products. As a result of this timing differential, the payables for our crude oil purchases are generally proportionally larger than the receivables for our refined product sales. As we are normally in a net payables position, a decrease in commodity prices generally results in a use of working capital. Given we process a significant volume of crude oil, the impact can materially affect our working capital, cash flows and liquidity.
Our profitability is affected by crude oil differentials and related factors, which fluctuate substantially.
A significant portion of our profitability is derived from the ability to purchase and process crude oil feedstocks that historically have been less expensive than benchmark crude oils, such as the heavy, sour crude oils processed at our Delaware City, Paulsboro, Chalmette, Torrance and Martinez refineries. For our Toledo refinery, aside from recent crude differential volatility, purchased crude prices have historically been above the WTI benchmark, however, such crude slate typically results in favorable refinery production yield. For all locations, these crude oil differentials can vary significantly from quarter to quarter depending on overall economic conditions and trends and conditions within the markets for crude oil and refined products. Any change in these crude oil differentials may have an impact on our earnings. Our rail investment and strategy to acquire cost advantaged Mid-Continent and Canadian crude, which are priced based on WTI, could be adversely affected when the WTI/Dated Brent or related differentials narrow. A narrowing of the WTI/Dated Brent differential may result in our Toledo refinery losing a portion of its crude oil price advantage over certain
of our competitors, which negatively impacts our profitability. In addition, imbalances between the production and capacity to export crude in Canada may continue to result in price volatility and the narrowing of the WTI/WCS differential, which is a proxy for the difference between light U.S. and heavy Canadian crude oil, and may reduce our refining margins and adversely affect our profitability and earnings. Divergent views have been expressed as to the expected magnitude of changes to these crude differentials in future periods. Any continued or further narrowing of these differentials could have a material adverse effect on our business and profitability.
Additionally, governmental and regulatory actions, including continued resolutions by the Organization of the Petroleum Exporting Countries to restrict crude oil production levels and executive actions by the current U.S. presidential administration to restrict the advancement of certain energy infrastructure projects such as the Keystone XL pipeline or Enbridge's Line 5 pipeline, may continue to impact crude oil prices and crude oil differentials. Any increase in crude oil prices or unfavorable movements in crude oil differentials due to such actions or changing regulatory environment may negatively impact our ability to acquire crude oil at economical prices and could have a material adverse effect on our business and profitability.
A significant interruption or casualty loss at any of our refineries and related assets or logistics terminals, pipelines or other facilities owned by us or by SBR, could reduce production, particularly if not fully covered by our insurance. Failure by one or more insurers to honor its coverage commitments for an insured event could materially and adversely affect our future cash flows, operating results and financial condition.
Our business currently consists of owning and operating six refineries and related assets, as well as logistics terminals, pipelines and other facilities and our investment in SBR. As a result, our operations could be subject to significant interruption if any of our refineries or other facilities were to experience a major accident, be damaged by severe weather or other natural disaster, or otherwise be forced to shut down or curtail production due to unforeseen events, such as acts of God, nature, orders of governmental authorities, supply chain disruptions impacting our crude rail facilities or other logistics assets, power outages, acts of terrorism, fires, toxic emissions and maritime hazards. Any such shutdown or disruption would reduce the production from that refinery. There is also risk of mechanical failure and equipment shutdowns both in general and following unforeseen events. Further, in such situations, undamaged refinery processing units may be dependent on or interact with damaged sections of our refineries and, accordingly, are also subject to being shut down. In the event any of our refineries is forced to shut down for a significant period of time, it would have a material adverse effect on our earnings, our other results of operations and our financial condition as a whole. In addition, a shutdown or disruption of our Chalmette refinery could impact the operations of SBR.
As protection against these hazards, we maintain insurance coverage for our refineries against some, but not all, such potential losses and liabilities, including claims against us by third parties relating to our operations and products. We or SBR may not be able to maintain or obtain insurance of the type and amount desired at reasonable rates. As a result of market conditions, premiums and deductibles for certain of our insurance policies may increase substantially. In some instances, certain insurance could become unavailable or available only for reduced amounts of coverage. For example, coverage for hurricane damage can be limited, and coverage for terrorism risks can include broad exclusions. If we or SBR were to incur a significant liability that was not fully insured, it could have a material adverse effect on our financial position.
Our insurance program includes a number of insurance carriers. Significant disruptions in financial markets could lead to a deterioration in the financial condition of many financial institutions, including insurance companies and, therefore, we may not be able to obtain the full amount of our insurance coverage for insured events. Even where we have insurance in place, there can be no assurance that the carriers will honor their obligations under the policies.
Our refineries are subject to interruptions of supply and distribution, including due to severe weather events, as a result of our reliance on pipelines and railroads for transportation of crude oil and refined products.
Our Toledo, Chalmette, Torrance and Martinez refineries receive a significant portion of their crude oil through our owned, as well as third-party, pipelines. These pipelines include the Enbridge system, Capline and Mid-Valley pipelines for supplying crude to our Toledo refinery, the MOEM Pipeline and CAM Pipeline for supplying crude to our Chalmette refinery and the San Joaquin Pipeline, San Pablo Bay Pipeline, San Ardo and Coastal Pipeline systems for supplying crude to our Torrance and Martinez refineries. Additionally, our Toledo, Chalmette, Torrance and Martinez refineries deliver a significant portion of the refined products through pipelines. These pipelines include pipelines such as the Sunoco Logistics Partners L.P. and Buckeye Partners L.P. pipelines at the Toledo refinery, the Collins pipeline at our Chalmette refinery, the Jet Pipeline to the Los Angeles International Airport, the Product Pipeline to Vernon and the Product Pipeline to Atwood at our Torrance refinery and the KinderMorgan SFPP North Pipeline at our Martinez refinery. We could experience an interruption of supply or delivery, or an increased cost of receiving crude oil and delivering refined products to market, if the ability of these pipelines to transport crude oil or refined products is disrupted because of accidents, weather interruptions, governmental regulation, terrorism, other third-party action or casualty or other events.
The Delaware City rail unloading facilities and the assets acquired in connection with the acquisition of CPI Operations LLC (the “East Coast Storage Assets”), allow our East Coast Refining System to source WTI-based crudes from Western Canada and the Mid-Continent, which may provide significant cost advantages versus traditional Brent-based international crudes in certain market environments. Any disruptions or restrictions to our supply of crude by rail due to problems with third-party logistics infrastructure or operations or as a result of increased regulations, could increase our crude costs and negatively impact our results of operations and cash flows.
Due to the common carrier regulatory obligation applicable to interstate oil pipelines, capacity allocation among shippers can become contentious in the event demand is in excess of capacity. Therefore, nominations by new shippers or increased nominations by existing shippers may reduce the capacity available to us. Any prolonged interruption in the operation or curtailment of available capacity of the pipelines that we rely upon for transportation of crude oil and refined products could have a further material adverse effect on our business, financial condition, results of operations and cash flows.
In addition, substantial weather-related conditions could impact our relationships and arrangements with our major customers and suppliers by materially affecting the normal flow of crude oil and refined products, especially seaborne transactions. For example, severe weather events could damage transportation infrastructures and lead to interruptions of our operations, including our ability to deliver our products, or increases in costs to receive crude oil.
Our results of operations continue to be impacted by significant costs to comply with renewable fuels mandates. The market prices for RINs have been volatile and may harm our profitability.
Pursuant to the Energy Policy Act of 2005 and the Energy Independence and Security Act of 2007, EPA has issued the RFS, implementing mandates to blend renewable fuels into the petroleum fuels produced and sold in the United States. Under the RFS, the volume of renewable fuels that obligated refineries must blend into their finished petroleum fuels historically has increased on an annual basis. In addition, certain states have passed legislation that requires minimum biodiesel blending in finished distillates. On October 13, 2010, EPA raised the maximum amount of ethanol allowed under federal law from 10% to 15% for cars and light trucks manufactured since 2007. The maximum amount allowed under federal law currently remains at 10% ethanol for all other vehicles. Existing laws and regulations could change, and the minimum volumes of renewable fuels that must be blended with refined petroleum fuels may increase. Because we do not directly produce renewable fuels, increasing the volume of renewable fuels that must be blended into our products could displace an increasing volume of our refinery’s product pool, potentially resulting in lower earnings and profitability. In addition, in order to meet certain of these and future EPA requirements, we may be required to purchase RINs,
which may have fluctuating costs based on market conditions. Our results continue to be impacted by significant costs to comply with the RFS. While we have entered into agreements with SBR that allow us to purchase RINs at our election, we incurred approximately $762.3 million in RINs costs during the year ended December 31, 2023 as compared to $1,225.5 million and $726.0 million during the years ended December 31, 2022 and 2021, respectively. The fluctuations in our RINs costs are due primarily to volatility in prices for ethanol-linked RINs and increases in our production of on-road transportation fuels since 2012. Our RINs purchase obligation is dependent on our actual shipment of on-road transportation fuels domestically and the amount of blending achieved which can cause variability in our profitability. On June 21, 2023, EPA finalized the volumes of renewable fuels that obligated refineries must blend into their final petroleum fuels for years 2023, 2024, and 2025, and finalized volume requirements and percentage standards under the RFS program for 2023, 2024, and 2025, as well as making a series of important modifications to strengthen and expand the RFS program. As a result, we could also experience fluctuating compliance costs in the future if the volumes finalized by EPA differ from what has been proposed.
We may have capital needs for which our internally generated cash flows and other sources of liquidity may not be adequate.
If we cannot generate sufficient cash flows or otherwise secure sufficient liquidity to support our short-term and long-term capital requirements, we may not be able to meet our payment obligations or our future debt obligations, comply with certain deadlines related to environmental regulations and standards, or pursue our business strategies, including acquisitions, in which case our operations may not perform as we currently expect. We have substantial short-term capital needs and may have substantial long-term capital needs. Our short-term working capital needs are primarily related to financing certain of our crude oil and refined products inventory.
If we cannot adequately handle our crude oil and feedstock requirements or if we are required to obtain our crude oil supply at our other refineries without the benefit of the existing supply arrangements or the applicable counterparty defaults in its obligations, our crude oil pricing costs may increase as the number of days between when we pay for the crude oil and when the crude oil is delivered to us increases. Following our early termination of the Third Inventory Intermediation Agreement, we will fund all future inventory purchases with existing working capital or other available sources of liquidity. Further, if we are not able to market and sell our finished products to credit worthy customers, we may be subject to delays in the collection of our accounts receivable and exposure to additional credit risk. Such increased exposure could negatively impact our liquidity due to our increased working capital needs as a result of the increase in the amount of crude oil inventory and accounts receivable we would have to carry on our balance sheet. Our long-term needs for cash include those to repay our indebtedness and other contractual obligations, support ongoing capital expenditures for equipment maintenance and upgrades, including during turnarounds at our refineries, and to complete our routine and normally scheduled maintenance, regulatory and security expenditures.
In addition, from time to time, we are required to spend significant amounts for repairs when one or more processing units experiences temporary shutdowns. We continue to utilize significant capital to upgrade equipment, improve facilities, and reduce operational, safety and environmental risks. In connection with the Paulsboro, Torrance and Martinez acquisitions, we assumed certain significant environmental obligations, and we have assumed a portion of certain environmental liabilities that may arise in connection with the Martinez acquisition and may similarly do so in future acquisitions. We will likely incur substantial compliance costs in connection with new or changing environmental, health and safety regulations. See “Item 7. Management’s Discussion and Analysis of Financial Condition and Results of Operations.” Our liquidity and financial condition will affect our ability to satisfy any and all of these needs or obligations.
We may incur significant liability under, or costs and capital expenditures to comply with, regulatory, environmental and health and safety regulations, which are complex and change frequently.
Our operations are subject to federal, state and local laws regulating, among other things, the use and/or handling of petroleum and other regulated materials, the emission and discharge of materials into the environment, waste management, and remediation of discharges of petroleum and petroleum products, characteristics and composition of gasoline and distillates and other matters otherwise relating to the protection of the environment and the health and safety of the surrounding community. Our operations are also subject to extensive laws and regulations relating to occupational health and safety.
We cannot predict what additional environmental, health and safety legislation or regulations may be adopted in the future, or how existing or future laws or regulations may be administered or interpreted with respect to our operations. Many of these laws and regulations have become increasingly stringent over time, and the cost of compliance with these requirements can be expected to increase over time. In addition, a failure to comply with these laws and regulations could adversely impact our ability to operate. For example, MRC is subject to amendments to “Regulation 6-5: Particulate Emissions from Refinery Fluidized Catalytic Cracking Units - 2021 Amendment” (“Rule 6-5 Amendment”) requiring compliance with more stringent standards for particulate emissions from FCC units at refineries in the Bay Area that will be effective in 2026. Although MRC believes that it will achieve compliance through the alternative emissions monitoring system (“AEMS”) approved by the Bay Area Air Quality Management District (“BAAQMD”) and subject to validation as part of the settlement agreement entered into on February 12, 2024, there can be no assurance that the AEMS will be validated or achieve the required emissions reductions or that we will not incur significant additional costs to comply with the Rule 6-5 Amendment.
Certain environmental laws impose strict, and in certain circumstances, joint and several, liability for costs of investigation and cleanup of spills, discharges or releases on owners and operators of, as well as persons who arrange for treatment or disposal of regulated materials at, contaminated sites. Under these laws, we may incur liability or be required to pay penalties for past contamination, and third parties may assert claims against us for damages allegedly arising out of any past or future contamination. The potential penalties and clean-up costs for past or future spills, discharges or releases, the failure of prior owners of our facilities to complete their clean-up obligations, the liability to third parties for damage to their property, or the need to address newly-discovered information or conditions that may require a response could be significant, and the payment of these amounts could have a material adverse effect on our business, financial condition, cash flows and results of operations.
See also “Recent record refining industry profits have raised the concern of public policy experts and federal and state policymakers, who have questioned whether these profits are justified, or whether they constituted a “windfall” to the industry and have enacted or could enact legislation that could adversely affect our operations and our profitability” risk factor below for additional regulatory risks that are not environmental, health or safety-related.
Potential further laws and regulations related to climate change could have a material adverse impact on our operations and adversely affect our facilities.
Some scientists have concluded that increasing concentrations of GHGs in the Earth’s atmosphere may produce climate changes that have significant physical effects, such as increased frequency and severity of storms, droughts, floods and other climatic events. We believe the issue of climate change will likely continue to receive scientific and political attention, with the potential for further laws and regulations that could materially adversely affect our ongoing operations.
In addition, as many of our facilities are located near coastal areas, rising sea levels may disrupt our ability to operate those facilities or transport crude oil and refined products. Extended periods of such disruption could have an adverse effect on our results of operation. We could also incur substantial costs to protect or repair these facilities.
Regulation of emissions of greenhouse gases could force us to incur increased capital expenditures and operating costs and could have a material adverse effect on our results of operations and financial condition.
Both houses of Congress have actively considered legislation to reduce emissions of GHGs, such as carbon dioxide and methane, including proposals to: (i) establish a cap and trade system, (ii) create a federal renewable energy or “clean” energy standard requiring electric utilities to provide a certain percentage of power from such sources, and (iii) create enhanced incentives for use of renewable energy and increased efficiency in energy supply and use. In addition, EPA is taking steps to regulate GHGs under the existing federal Clean Air Act. EPA has adopted regulations limiting emissions of GHGs from motor vehicles, and is currently proposing new mobile source regulations further limiting GHG emissions for light- and medium-duty vehicles and heavy-duty highway vehicles. EPA has also adopted regulations addressing the permitting of GHG emissions from stationary sources, and requiring the reporting of GHG emissions from specified large GHG emission sources, including refineries. These and similar regulations could require us to incur costs to monitor and report GHG emissions or reduce emissions of GHGs associated with our operations. In addition, various states, individually as well as in some cases on a regional basis, have taken steps to control GHG emissions, including adoption of GHG reporting requirements, cap and trade systems and renewable portfolio standards (such as AB 32). On September 23, 2020 the Governor of California issued an executive order effectively banning the sale of new gasoline-powered passenger cars and trucks by 2035 and requiring zero-emission medium to heavy duty vehicles by 2045 everywhere feasible. The executive order requires state agencies to build out sufficient electric vehicle charging infrastructure. It is not possible at this time to predict the ultimate form, timing or extent of federal or state regulation. In the event we do incur increased costs as a result of increased efforts to control GHG emissions, we may not be able to pass on any of these costs to our customers. Regulatory requirements also could adversely affect demand for the refined products that we produce. Any increased costs or reduced demand could materially and adversely affect our business and results of operations.
Requirements to reduce emissions could result in increased costs to operate and maintain our facilities as well as implement and manage new emission controls and programs put in place. For example, in September 2016, the state of California enacted Senate Bill 32, which further reduces greenhouse gas emissions targets to 40 percent below 1990 levels by 2030. Two regulations implemented to achieve these goals are Cap-and-Trade and the LCFS. In 2012, CARB implemented Cap-and-Trade. This program currently places a cap on GHGs and we are required to acquire a sufficient number of credits to cover emissions from our refineries and our in-state sales of gasoline and diesel. In 2009, CARB adopted the LCFS, which required a 10% reduction in the carbon intensity of gasoline and diesel by 2020. In 2018, CARB amended the LCFS to require a 20% reduction by 2030. Compliance is achieved through blending lower carbon intensity biofuels into gasoline and diesel or by purchasing credits. Compliance with each of these programs is facilitated through a market-based credit system. If sufficient credits are unavailable for purchase or we are unable to pass through costs to our customers, we have to pay a higher price for credits or if we are otherwise unable to meet our compliance obligations, our financial condition and results of operations could be adversely affected.
As noted above, on September 23, 2020, the California Governor issued Executive Order N-79-20 (“N-79-20 Order”) intended to further reduce GHGs within the state. The N-79-20 Order sets a 2035 goal of no sale of internal combustion engines for passenger cars and pickup trucks within California, and a 2045 goal of no sale of internal combustion engine medium- and heavy-duty trucks, and off-road vehicles and equipment. However, the N-79-20 Order would still allow used internal combustion engine vehicles to be used and sold after these dates. In an effort to accomplish the 2035 goal, on August 25, 2022, CARB voted unanimously to adopt the Advanced Clean Cars II (“ACCII”) regulations. According to CARB, the ACCII regulations will rapidly scale down light-duty passenger car, truck, and SUV emissions starting with the 2026 model year through 2035. The regulations are two-pronged. First, they amend the California Zero-emission Vehicle Regulation to require an increasing number of zero-emission vehicles, and rely on advanced vehicle technologies, including battery-electric, hydrogen fuel cell electric, and plug-in hybrid electric vehicles, to meet air quality and climate change emissions standards. Second, the regulations amend the California Low-emission Vehicle Regulations to include increasingly stringent standards for gasoline cars and heavier passenger trucks to continue to reduce smog-forming emissions while the sector transitions toward 100% electrification by 2035.
Similar to the ACCII, on April 28, 2023, CARB voted unanimously to adopt the Advanced Clean Fleet (“ACF”) regulations with the goal of achieving a zero-emission truck and bus fleet by 2045 everywhere feasible, and significantly earlier for certain market segments such as last mile delivery and drayage applications. The initial focus of ACF is on high-priority fleets with vehicles that are suitable for early electrification, their subhaulers, and entities that hire them. As to the 2045 goal, it is currently uncertain how the N-79-20 Order may be ultimately implemented by various California regulatory agencies. In the event we do incur increased costs as a result of increased efforts to control GHG emissions through future adopted regulatory requirements, we may not be able to pass these costs to our customers. These future regulatory requirements also could adversely affect demand for the refined products that we produce. Any increased costs or reduced demand could materially and adversely affect our business and results of operations.
Environmental clean-up and remediation costs of our sites and environmental litigation, including related to climate change, could decrease our net cash flow, reduce our results of operations and impair our financial condition.
We may be subject to liability for the investigation and clean-up of environmental contamination at each of the properties that we own, lease, occupy or operate and at off-site locations where we arrange for the treatment or disposal of regulated materials. We may become involved in litigation or other proceedings related to the foregoing. If we were to be held responsible for damages in any such litigation or proceedings, such costs may not be covered by insurance and may be material. Historical soil and groundwater contamination has been identified at our refineries. Currently, remediation projects for such contamination are underway in accordance with regulatory requirements at our refineries. In connection with the acquisitions of certain of our refineries and logistics assets, the prior owners have retained certain liabilities or indemnified us for certain liabilities, including those relating to pre-acquisition soil and groundwater conditions, and in some instances we have assumed certain liabilities and environmental obligations, including certain existing and potential remediation obligations. If the prior owners fail to satisfy their obligations for any reason, or if significant liabilities arise in the areas in which we assumed liability, we may become responsible for remediation expenses and other environmental liabilities, which could have a material adverse effect on our business, financial condition, results of operations and cash flow. As a result, in addition to making capital expenditures or incurring other costs to comply with environmental laws, we also may be liable for significant environmental litigation or for investigation and remediation costs and other liabilities arising from the ownership or operation of these assets by prior owners, which could materially adversely affect our business, financial condition, results of operations and cash flow. See “Item 1. Business—Environmental, Health and Safety Matters” and “Item 7. Management’s Discussion and Analysis of Financial Condition and Results of Operations—Material Cash Requirements”.
We may also face liability arising from current or future claims alleging personal injury or property damage due to exposure to chemicals or other regulated materials, such as various perfluorinated compounds, including perfluorooctanoate, perfluorooctane sulfonate, perfluorohexane sulfonate, or other per-and polyfluoroalkyl substances (collectively, “PFAS”), asbestos, benzene, silica dust and petroleum hydrocarbons, at or from our facilities. We may also face liability for personal injury, property damage, natural resource damage or clean-up costs for the alleged migration of contamination from our properties. A significant increase in the number or success of these claims could materially adversely affect our business, financial condition, results of operations and cash flow. Recently, we have been voluntarily cooperating with various local, state and federal agencies in their review of the environmental and health effects of PFAS and additional PFAS-related laws may be developed at the local, state and federal level that could lead to our incurring liability for damages or other costs, civil or criminal proceedings, the imposition of fines and penalties, or other remedies or otherwise affect our business. Governmental inquiries or lawsuits involving PFAS could lead to our incurring liability for damages or other costs, civil or criminal proceedings, the imposition of fines and penalties, or other remedies, as well as restrictions on or added costs for our business operations going forward, including in the form of restrictions on discharges at our manufacturing facilities or otherwise. We may be subject to asserted or unasserted claims and governmental regulatory proceedings and inquiries related to the use of PFAS in a variety of jurisdictions.
Changes in law or interpretation of settled law and changes in policy, including with respect to climate change, other environmental regulations or regulations mandating efficiency standards or the use of alternative fuels or uncompetitive fuel components, could adversely affect our operations and results by increasing our cost of compliance, delaying or eliminating available business opportunities and/or preventing or limiting existing operations. Our operations also may give rise to federal, state or local government enforcement proceedings alleging non-compliance with applicable laws or regulations.
We operate in jurisdictions where very large and unpredictable punitive damage awards may occur in the context of litigation. Private plaintiffs may also initiate legal action against us for alleged environmental impacts. These parties may attempt to use the legal system to promote public policy agendas (including seeking to reduce the production and sale of hydrocarbon products through litigation targeting the company or other industry participants), gain political notoriety, or obtain monetary awards from the company. For example, in recent years, private litigation has been increasingly initiated against oil and gas companies by local and state agencies and private parties alleging climate change impacts arising from their operations and seeking damages and equitable relief. We have not had any climate change litigation initiated against us to date and we cannot reasonably predict whether any such litigation will be initiated against us or, if initiated, what the outcome would be. If any such litigation were to be initiated against us, at a minimum, we would incur legal and other expenses to defend such lawsuits, which amounts could be significant. If we failed to prevail in any such litigation and were required to pay significant damages and/or materially alter the manner in which we conduct our business, there could be a material adverse impact on our operations, financial condition or results of operations.
Our pipelines are subject to federal and/or state regulations, which could reduce profitability and the amount of cash we generate.
Our transportation activities are subject to regulation by multiple governmental agencies. The regulatory burden on the industry increases the cost of doing business and affects profitability. Additional proposals and proceedings that affect the oil industry are regularly considered by Congress, the states, the Federal Energy Regulatory Commission, the United States Department of Transportation, and the courts. We cannot predict when or whether any such proposals may become effective or what impact such proposals may have. Projected operating costs related to our pipelines reflect the recurring costs resulting from compliance with these regulations, and these costs may increase due to future acquisitions, changes in regulation, changes in use, or discovery of existing but unknown compliance issues.
Recent record refining industry profits have raised the concern of public policy experts and federal and state policymakers, who have questioned whether these profits are justified, or whether they constituted a “windfall” to the industry and have enacted or could enact legislation that could adversely affect our operations and our profitability.
Beginning in 2022, record refining industry profits raised the concern of many public policy experts and federal and state policymakers, who have questioned whether these profits were justified, or whether they constituted a “windfall” to the industry and have proposed legislation that if enacted could adversely affect our profitability. In September 2022, California adopted Senate Bill No. 1322 (“SB 1322”), which requires refineries in California to report monthly on the volume and cost of the crude oil they buy, the quantity and price of the wholesale gasoline they sell, and the gross gasoline margin per barrel, among other information. The provisions of SB 1322 were effective January 2023. In March 2023, California adopted Senate Bill No. 2 (such statute, together with any regulations contemplated or issued thereunder, “SBx 1-2”), which, among other things, (i) authorized the establishment of a maximum gross gasoline refining margin and the imposition of a financial penalty for profits above a maximum gross gasoline refining margin, (ii) significantly expanded the reporting obligations under SB 1322 and the Petroleum Industry Information Reporting Act of 1980, which include reporting requirements to the California Energy Commission (“CEC”) for all participants in the petroleum industry supply chain in California (e.g., refiners, marketers, importers, transporters, terminals, producers, renewables producers, pipelines, and ports), (iii) created the Division of Petroleum Market Oversight
within the CEC to analyze the data provided under SBx 1-2, and (iv) authorized the CEC to regulate the timing and other aspects of refinery turnaround and maintenance activities in certain instances. SBx 1-2 imposes increased and substantial reporting requirements, which include daily, weekly, monthly, and annual reporting of detailed operational and financial data on all aspects of our operations in California. The operational data includes any plans for turnaround and maintenance activities at our two California refineries and the way we expect to address the potential impacts on feedstock and product inventories in California as a result of such turnaround and maintenance activities. The provisions of SBx 1-2 became effective June 26, 2023.
In September 2023, the Governor of the State of California directed the CEC to begin the regulatory processes concerning (i) potential penalties for exceeding a maximum gross gasoline refining margin and (ii) the timing of refinery turnarounds and maintenance. Consequently, the CEC adopted an order requiring an informational proceeding on a maximum gross gasoline refining margin and penalty under SBx 1-2. It also adopted an order initiating rulemaking activity under SBx 1-2 that will be focused on refinery maintenance and turnarounds.
To the extent that the CEC establishes a maximum gross gasoline refining margin and imposes a financial penalty for profits above such maximum gross gasoline refining margin, our financial results and profitability could be adversely affected. Our results of operations and our financial performance could also be adversely impacted to the extent that restrictions on turnaround and maintenance activities are imposed by the CEC. We cannot reasonably predict the impact that the full implementation of SBx1-2 will have on our California operations or our Company nor can we predict the impact that similarly focused legislation or actions in other jurisdictions in which we operate our refineries may have. The recently adopted legislation in California, and the future enactment of similar legislation in any of the other jurisdictions could adversely impact our business, results of operations, profitability and cash.
We could incur substantial costs or disruptions in our business if we cannot obtain or maintain necessary permits and authorizations or otherwise comply with health, safety, environmental and other laws and regulations.
Our operations require numerous permits and authorizations under various laws and regulations. These authorizations and permits are subject to revocation, renewal or modification and can require operational changes to limit impacts or potential impacts on the environment and/or health and safety. A violation of authorization or permit conditions or other legal or regulatory requirements could result in substantial fines, criminal sanctions, permit revocations, injunctions, and/or facility shutdowns. In addition, major modifications of our operations could require modifications to our existing permits or upgrades to our existing pollution control equipment. Any or all of these matters could have a negative effect on our business, results of operations and cash flows.
We may incur significant liabilities under, or costs and capital expenditures to comply with, health, safety, environmental and other laws and regulations, which are complex and change frequently. Our operations are subject to federal, state and local laws regulating, among other things, the handling of petroleum and other regulated materials, the emission and discharge of materials into the environment, waste management, and remediation of discharges of petroleum and petroleum products, characteristics and composition of gasoline and distillates and other matters otherwise relating to the protection of the environment. Our operations are also subject to extensive laws and regulations relating to occupational health and safety, in addition to laws and regulations affecting the transportation of crude oil by rail in North America.
We cannot predict what additional environmental, health and safety legislation or regulations may be adopted in the future, or how existing or future laws or regulations may be administered or interpreted with respect to our operations. Many of these laws and regulations are becoming increasingly stringent, and the cost of compliance with these requirements can be expected to increase over time.
Certain environmental laws impose strict, and in certain circumstances joint and several liability for, costs of investigation and cleanup of such spills, discharges or releases on owners and operators of, as well as persons who arrange for treatment or disposal of regulated materials at contaminated sites. Under these laws, we may incur liability or be required to pay penalties for past contamination, and third parties may assert claims against us for damages allegedly arising out of any past or future contamination. The potential penalties and clean-up costs for past or future releases or spills, the failure of prior owners of our facilities to complete their clean-up obligations, the liability to third parties for damage to their property, or the need to address newly-discovered information or conditions that may require a response could be significant, and the payment of these amounts could have a material adverse effect on our business, financial condition and results of operations.
We may not be able to successfully integrate the operations of our 50-50 equity method investment into our business, or realize the anticipated benefits of this investment.
On June 27, 2023, we closed on the jointly held investment in SBR, which owns the Renewable Diesel Facility, together with our partner, Eni. Following its completion, we have certain obligations and liabilities related to SBR as the construction manager, operator and provider of services. Further, SBR is operated as a separate entity and we do not fully control its operations. There can be no assurance that we will realize the anticipated benefits and operating synergies of the Renewable Diesel Facility or the equity method investment. Our estimates regarding the earnings, operating cash flow, capital expenditures and liabilities resulting from this investment may prove to be incorrect. This equity method investment involves risks, including:
•diversion of management time and attention from our existing business;
•reliance on Eni and their financial condition;
•risk that Eni does not always share our goals and objectives; and
•certain obligations that we have to fund capital expenditures relating to this investment.
Enhanced scrutiny on ESG matters and developments related to climate change may negatively impact our business and our access to capital markets.
Enhanced scrutiny on ESG matters may impact our business as it relates to the use of refined products, climate change, increasing public expectations on companies to address climate change, and potential use of substitutes or replacements to our products may result in increased costs, reduced demand for our products, reduced profits, increased regulations and litigation, and adverse impacts on our stock price and access to capital markets. In addition, organizations that provide information to investors on corporate governance and related matters have developed ratings for evaluating companies on their approach to ESG matters. Such ratings are used by some investors to inform and advise their investment and voting decisions. Also, some stakeholders may advocate for divestment of fossil fuel investments and encourage lenders to limit funding to companies engaged in the manufacturing of refined products. Unfavorable ESG ratings and investment community divestment initiatives may lead to negative investor and public sentiment toward the Company and to the diversion of capital from our industry, which could have a negative impact on our stock price and our access to, and costs of, capital. This scrutiny, coupled with changes in consumer behavior, attitudes and preferences with respect to the generation and consumption of energy and the use of fossil fuels, may continue to result in (a) the enactment of climate change related regulations, policies and initiatives, including alternative energy requirements, (b) further technological advances related to the generation, storage and consumption of energy through alternative methods such as wind and solar and (c) increased demand for and/or availability of non-fossil fuel energy sources and related consumer products such as electric and hybrid vehicles and renewable power supplies. These developments may also lead to reduced demand for our products, a reduction in our revenue, higher costs and an overall decrease in our profitability.
Additionally, increased attention and scrutiny regarding climate change has resulted in increased investor attention and an increased risk of public and private litigation, which could increase our costs and/or otherwise negatively affect our operations and overall profitability, and cause the market price of our Class A common stock to decline.
Some of our competitors may have a competitive advantage by providing alternative energy sources or by owning their own retail sites.
We compete with other companies and industries that may provide alternative means to satisfy fuel and energy requirements to their customers or own their own retail network. The refining industry is highly competitive with respect to petroleum product capacity and feedstock supply. We compete with many companies for available supplies of crude oil and other feedstocks, and for third-party retail outlets for our refined petroleum products. Such companies that produce alternative energy sources or own their own retail sites may be better positioned to deal with changes in refining capacity, depressed refining margins or feedstock shortages.
We may be negatively affected by the rate of inflation and its impact on the global economy.
Current inflation within the economy has resulted in increased interest rates and capital costs, contributed to supply shortages, increased the cost of living and labor, and other related items. As a result of inflation, which may continue, we expect to continue to encounter higher increases in the cost of feedstocks, labor, materials, and other inputs necessary in the refining of crude oil and other feedstocks. Although we may take actions to counteract the impacts of inflation, if these actions are not effective it could have a material adverse effect on our business, results of operations and financial condition. Additionally, higher future inflation or concerns of a recession could impact the demand for our products and services.
We may not be able to obtain funding on acceptable terms or at all, including because of volatility and uncertainty in the credit and capital markets. This may hinder or prevent us from meeting our future capital needs.
In the past, global financial markets and economic conditions have been, and may again be, subject to disruption and volatile due to a variety of factors, including uncertainty in the financial services sector, low consumer confidence, falling commodity prices, geopolitical issues and generally weak economic conditions. In addition, the fixed income and bank markets could experience periods of extreme volatility that may negatively impact market liquidity conditions. As a result, the cost of raising money in the debt and equity capital markets could increase substantially at times while the availability of funds from those markets diminishes significantly. In particular, as a result of concerns about the stability of financial markets generally, which may be subject to unforeseen disruptions, the cost of obtaining money from the credit markets may increase as many lenders and institutional investors increase interest rates, enact tighter lending standards, refuse to refinance existing debt on similar terms or at all and reduce or, in some cases, cease to provide funding to borrowers. Due to these factors, we cannot be certain that new debt or equity financing will be available on acceptable terms. If funding is not available when needed, or is available only on unfavorable terms, we may be unable to meet our obligations as they come due. Moreover, without adequate funding, we may be unable to execute our business strategy, complete future acquisitions or growth projects, take advantage of other business opportunities or respond to competitive pressures, any of which could have a material adverse effect on our revenues and results of operations.
Any political instability, military strikes, sustained military campaigns, terrorist activity, changes in foreign policy, or other catastrophic events could have a material adverse effect on our business, results of operations and financial condition.
U.S. and global markets are experiencing volatility and disruption following the escalation of geopolitical tensions and Russia’s military action in Ukraine starting in February 2022, the outbreak of armed hostilities in the middle east and disruptions in international shipping resulting from recent attacks by armed groups on cargo ships in the Red Sea. Although the length and impact of these ongoing military conflicts is highly unpredictable, these wars have led to market disruptions, including significant volatility in the financial markets and the global macroeconomic and geopolitical environment. Furthermore, a protracted conflict between Ukraine and Russia, or any escalation of this conflict, may result in additional financial and economic sanctions and import and/or export controls imposed on Russia by the United States, the UK, the EU, Canada and others, such as the United States ban on import of Russian oil effective March 8, 2022 and the EU ban on oil products from Russia effective February 5, 2023, which may have adverse impacts on the wider global economy and market conditions and could, in turn, have a material adverse impact on our business, financial condition, cash flows and results of operations and could cause the market value of PBF Energy’s Class A common stock to decline.
Any further political instability, military strikes, sustained military campaigns, terrorist activity, changes in foreign policy in areas or regions of the world where we acquire crude oil and other raw materials or sell our refined products may affect our business in unpredictable ways, including forcing us to increase security measures and causing disruptions of supplies and distribution markets. We may also be subject to United States trade and economic sanctions laws, which change frequently as a result of foreign policy developments, and which may necessitate changes to our crude oil acquisition activities. Further, like other industrial companies, our facilities may be the target of terrorist activities or subject to catastrophic events such as natural disasters and pandemic illness. Any act of war, terrorism, or other catastrophic events that resulted in damage to, or otherwise disrupts the operating activities of, any of our refineries or third-party facilities upon which we are dependent for our business operations could have a material adverse effect on our business, results of operations and financial condition.
A cyber-attack on, or other failure of, our technology infrastructure could affect our business and assets, and have a material adverse effect on our financial condition, results of operations and cash flows.
We are becoming increasingly dependent on our technology infrastructure and certain critical information systems which process, transmit and store electronic information, including information we use to safely and effectively operate our respective assets and businesses. These information systems include data network and telecommunications, internet access, our websites, and various computer hardware equipment and software applications, including those that are critical to the safe operation of our refineries and logistics assets. We have invested, and expect to continue to invest, significant time, manpower and capital in our technology infrastructure and information systems. These information systems are subject to damage or interruption from a number of potential sources including natural disasters, software viruses or other malware, power failures, cybersecurity threats to gain unauthorized access to sensitive information, cyber-attacks, which may render data systems unusable, and physical threats to the security of our facilities and infrastructure. Additionally, our business is highly dependent on financial, accounting and other data processing systems and other communications and information systems, including our enterprise resource planning tools. We process a large number of transactions on a daily basis and rely upon the proper functioning of computer systems. Furthermore, we rely on information systems across our respective operations, including the management of supply chain and various other processes and transactions. As a result, a disruption on any information systems at our refineries or logistics assets, may cause disruptions to our collective operations.
The potential for such security threats or system failures has subjected our operations to increased risks that could have a material adverse effect on our business. To the extent that these information systems are under our control, we have implemented measures such as virus protection software, emergency recovery processes and a formal disaster recovery plan to address the outlined risks. However, security measures for information systems cannot be guaranteed to be failsafe, and our formal disaster recovery plan and other implemented measures may not prevent delays or other complications that could arise from an information systems failure. If a key system were hacked or otherwise interfered with by an unauthorized user, or were to fail or experience unscheduled downtime for any reason, even if only for a short period, or any compromise of our data security or our inability to use or access these information systems at critical points in time, it could unfavorably impact the timely and efficient operation of our business, damage our reputation and subject us to additional costs and liabilities. The increase in companies and individuals working remotely has increased the frequency and scope of cyber-attacks and the risk of potential cybersecurity incidents, both deliberate attacks and unintentional events. While, to date, we have not had a significant cybersecurity breach or attack that had a material impact on our business or results of operations, if we were to be subject to a material successful cyber intrusion, it could result in remediation or service restoration costs, increased cyber protection costs, lost revenues, litigation or regulatory actions by governmental authorities, increased insurance premiums, reputational damage and damage to our competitiveness, financial condition, results of operations and cash flows.
Cyber-attacks against us or others in our industry could result in additional regulations, and U.S. government warnings have indicated that infrastructure assets, including pipelines, may be specifically targeted by certain groups. These attacks include, without limitation, malicious software, ransomware, attempts to gain unauthorized access to data, and other electronic security breaches. These attacks may be perpetrated by state-sponsored groups, “hacktivists”, criminal organizations or private individuals (including employee malfeasance). Current efforts by the federal government, including the Strengthening the Cybersecurity of Federal Networks and Critical Infrastructure executive order, the issuance of new cybersecurity requirements for critical pipeline owners and operators issued by the Department of Homeland Security’s Transportation Security Administration following a cyber-attack on a major petroleum pipeline in 2021, and any potential future regulations could lead to increased regulatory compliance costs, insurance coverage cost or capital expenditures. We cannot predict the potential impact to our business or the energy industry resulting from additional regulations.
Further, our business interruption insurance may not compensate us adequately for losses that may occur. We do not carry insurance specifically for cybersecurity events; however, certain of our insurance policies may allow for coverage for a cyber-event resulting in ensuing property damage from an otherwise insured peril. If we were to incur a significant liability for which we were not fully insured, it could have a material adverse effect on our financial position, results of operations and cash flows. In addition, the proceeds of any such insurance may not be paid in a timely manner and may be insufficient if such an event were to occur.
Competition from companies that produce their own supply of feedstocks, have extensive retail outlets, make alternative fuels or have greater financial and other resources than we do could materially and adversely affect our business and results of operations.
Our refining operations compete with domestic refiners and marketers in regions of the United States in which we operate, as well as with domestic refiners in other regions and foreign refiners that import products into the United States. In addition, we compete with other refiners, producers and marketers in other industries that provide means to satisfy the energy and fuel requirements of our industrial, commercial and individual consumers. Certain of our competitors have larger and more complex refineries, and may be able to realize lower per-barrel costs or higher margins per barrel of throughput. Several of our principal competitors are integrated national or international oil companies that are larger and have substantially greater resources than we do and access to proprietary sources of controlled crude oil production. Unlike these competitors, we obtain substantially all of our feedstocks from unaffiliated sources. We are not engaged in the petroleum exploration and production business and therefore do not produce any of our crude oil feedstocks. We do not have a retail business and therefore are dependent upon others for outlets for our refined products. Because of their integrated operations and larger capitalization, these companies may be more flexible in responding to volatile industry or market conditions, such as shortages of crude oil supply and other feedstocks or intense price fluctuations and they may also be able to obtain more favorable trade credit terms.
Newer or upgraded refineries will often be more efficient than our refineries, which may put us at a competitive disadvantage. We have taken significant measures to maintain our refineries including the installation of new equipment and redesigning older equipment to improve our operations. However, these actions involve significant uncertainties, since upgraded equipment may not perform at expected throughput levels, the yield and product quality of new equipment may differ from design specifications and modifications may be needed to correct equipment that does not perform as expected. Any of these risks associated with new equipment, redesigned older equipment or repaired equipment could lead to lower revenues or higher costs or otherwise have an adverse effect on future results of operations and financial condition. Over time, our refineries or certain refinery units may become obsolete, or be unable to compete, because of the construction of new, more efficient facilities by our competitors.
We must make substantial capital expenditures on our operating facilities to maintain their reliability and efficiency. If we are unable to complete capital projects at their expected costs and/or in a timely manner, or if the market conditions assumed in our project economics deteriorate, our financial condition, results of operations or cash flows could be materially and adversely affected.
Delays or cost increases related to capital spending programs involving engineering, procurement and construction of new facilities (or improvements and repairs to our existing facilities and equipment, including turnarounds) could adversely affect our ability to achieve targeted internal rates of return and operating results. Such delays or cost increases may arise as a result of unpredictable factors in the marketplace, many of which are beyond our control, including:
•denial or delay in obtaining regulatory approvals and/or permits;
•unplanned increases in the cost of construction materials or labor;
•disruptions in transportation of modular components and/or construction materials;
•severe adverse weather conditions, natural disasters or other events (such as equipment malfunctions, explosions, fires or spills) affecting our facilities, or those of vendors and suppliers;
•shortages of sufficiently skilled labor, or labor disagreements resulting in unplanned work stoppages;
•market-related increases in a project’s debt or equity financing costs; and/or
•non-performance or force majeure by, or disputes with, vendors, suppliers, contractors or sub-contractors involved with a project.
Our refineries contain many processing units, a number of which have been in operation for many years. Equipment, even if properly maintained, may require significant capital expenditures and expenses to keep it operating at optimum efficiency. One or more of the units may require unscheduled downtime for unanticipated maintenance or repairs that are more frequent than our scheduled turnarounds for such units. Scheduled and unscheduled maintenance could reduce our revenues during the period of time that the units are not operating.
Our forecasted internal rates of return are also based upon our projections of future market fundamentals, which are not within our control, including changes in general economic conditions, inflation, slow growth, recession, impact of new regulations, available alternative supply and customer demand. Any one or more of these factors could have a significant impact on our business. If we were unable to make up the delays associated with such factors or to recover the related costs, or if market conditions change, it could materially and adversely affect our financial position, results of operations or cash flows.
We are subject to strict laws and regulations regarding employee and process safety, and failure to comply with these laws and regulations could have a material adverse effect on our results of operations, financial condition and profitability.
We are subject to the requirements of the OSHA, and comparable state statutes that regulate the protection of the health and safety of workers. In addition, OSHA requires that we maintain information about hazardous materials used or produced in our operations and that we provide this information to employees, state and local governmental authorities, and local residents. Failure to comply with OSHA requirements, including general industry standards, process safety standards and control of occupational exposure to regulated substances, could result in claims against us that could have a material adverse effect on our results of operations, financial condition and the cash flows of the business if we are subjected to significant fines or compliance costs.
Product liability and operational liability claims and litigation could adversely affect our business and results of operations.
Product liability and liability arising from our operations are significant risks. Substantial damage awards have been made in certain jurisdictions against manufacturers and resellers of petroleum products based upon claims for injuries and property damage caused by the use of or exposure to various products. Failure of our products to meet required specifications or claims that a product is inherently defective could result in product liability claims from third parties, including our shippers and customers, and also arise from contaminated or off-specification product in commingled pipelines and storage tanks and/or defective fuels. We may also be subject to personal injury claims arising from incidents that occur in connection with or relating to our operations. Product liability and personal injury claims against us could have a material adverse effect on our business, financial condition or results of operations.
Compliance with and changes in tax laws could adversely affect our performance.
We are subject to extensive tax liabilities, including federal, state, local and foreign taxes such as income, excise, sales/use, payroll, franchise, property, gross receipts, withholding and ad valorem taxes. New tax laws and regulations and changes in existing tax laws and regulations, such as the IRA, are continuously being enacted or proposed and could result in increased expenditures for tax liabilities in the future. These liabilities are subject to periodic audits by the respective taxing authorities, which could increase our tax liabilities. Subsequent changes to our tax liabilities as a result of these audits may also subject us to interest and penalties. There can be no certainty that our federal, state, local or foreign taxes could be passed on to our customers.
Acquisitions or other investments that we may undertake in the future involve a number of risks, any of which could cause us not to realize the anticipated benefits.
We may not be successful in acquiring additional assets or making investments in new business, and any acquisitions or other investments that we do consummate may not produce the anticipated benefits or may have adverse effects on our business and operating results. We may selectively consider strategic acquisitions and other investments in the future within the refining, mid-stream and renewable diesel or alternative energy sectors based on performance through the cycle, advantageous access to crude oil supplies, attractive refined products market fundamentals and access to distribution and logistics infrastructure. For example, we are part of Mid-Atlantic Clean Hydrogen Hub (“MACH2”), a broad consortium exploring the development of a clean energy and logistics hub on 2,500 acres adjacent to our Delaware City refinery, that was selected by the Department of Energy to receive up to $750.0 million to advance the development of a clean hydrogen production and distribution hub. In connection with MACH2, we are considering investments in renewable electricity, green hydrogen production, development of 10 million square feet of distribution warehouses and office space, and hydrogen fueling facilities for a large fleet of medium duty trucks. Our ability to acquire additional assets or invest in new businesses will be dependent upon a number of factors, including our ability to identify acceptable acquisition or investment opportunities, consummate acquisitions or other investments on acceptable terms, successfully integrate acquired assets and obtain financing to fund acquisitions and to support our growth and many other factors beyond our control. Risks associated with acquisitions and other investments include those relating to the diversion of management time and attention from our existing business, liability for known or unknown environmental conditions or other contingent liabilities and greater than anticipated expenditures required for compliance with environmental, safety or other regulatory standards or for investments to improve operating results, and the incurrence of additional indebtedness to finance acquisitions or capital expenditures relating to acquired assets. We may also enter into transition services agreements in the future with sellers of any additional refineries we acquire or otherwise invest in. Such services may not be performed timely and effectively, and any significant disruption in such transition services or unanticipated costs related to such services could adversely affect our business and results of operations. In addition, it is likely that, when we acquire or otherwise invest in refineries, we will not have access to the type of historical financial information that we will require regarding the prior operation of the refineries. As a result, it may be difficult for investors to evaluate the probable impact of significant acquisitions or other investments on our financial performance until we have operated the acquired refineries for a substantial period of time.
A portion of our workforce is unionized, and we may face labor disruptions that would interfere with our operations.
Most hourly employees at our refineries are covered by collective bargaining agreements through the USW, the IOW and the IBEW. These agreements are scheduled to expire on various dates in 2024 through 2028 (See “Item 1. Business” - Employees). Future negotiations prior to the expiration of our collective agreements may result in labor unrest for which a strike or work stoppage is possible. Strikes and/or work stoppages could negatively affect our operational and financial results and may increase operating expenses at the refineries.
Our business may suffer if any of our senior executives or other key employees discontinues employment with us. Furthermore, a shortage of skilled labor or disruptions in our labor force may make it difficult for us to maintain labor productivity.
Our future success depends to a large extent on the services of our senior executives and other key employees. Our business depends on our continuing ability to recruit, train and retain highly qualified employees in all areas of our operations, including engineering, accounting, business operations, finance and other key back-office and mid-office personnel. Furthermore, our operations require skilled and experienced employees with proficiency in multiple tasks. The competition for these employees is intense, and the loss of these executives or employees could harm our business. If any of these executives or other key personnel resigns or becomes unable to continue in his or her present role and is not adequately replaced, our business operations could be materially adversely affected.
Our hedging activities may limit our potential gains, exacerbate potential losses and involve other risks.
We may enter into commodity derivatives contracts to hedge our crude price risk or crack spread risk with respect to a portion of our expected gasoline and distillate production on a rolling basis or to hedge our exposure to the price of natural gas, which is a significant component of our refinery operating expenses. Consistent with that policy we may hedge some percentage of our future crude and natural gas supply. We may enter into hedging arrangements with the intent to secure a minimum fixed cash flow stream on the volume of products hedged during the hedge term and to protect against volatility in commodity prices. Our hedging arrangements may fail to fully achieve these objectives for a variety of reasons, including our failure to have adequate hedging arrangements, if any, in effect at any particular time and the failure of our hedging arrangements to produce the anticipated results. We may not be able to procure adequate hedging arrangements due to a variety of factors. Moreover, such transactions may limit our ability to benefit from favorable changes in crude oil, refined product and natural gas prices.
In addition, our hedging activities may expose us to the risk of financial loss in certain circumstances, including instances in which:
•the volumes of our actual use of crude oil or natural gas or production of the applicable refined products is less than the volumes subject to the hedging arrangement;
•accidents, interruptions in feedstock transportation, inclement weather or other events cause unscheduled shutdowns or otherwise adversely affect our refineries, or those of our suppliers or customers;
•changes in commodity prices have a material impact on collateral and margin requirements under our hedging arrangements, resulting in us being subject to margin calls;
•the counterparties to our derivative contracts fail to perform under the contracts; or
•a sudden, unexpected event materially impacts the commodity or crack spread subject to the hedging arrangement.
As a result, the effectiveness of our hedging strategy could have a material impact on our financial results. See “Item 7A. Quantitative and Qualitative Disclosures About Market Risk.”
In addition, these hedging activities involve basis risk. Basis risk in a hedging arrangement occurs when the price of the commodity we hedge is more or less variable than the index upon which the hedged commodity is based, thereby making the hedge less effective. For example, a New York Mercantile Exchange index used for hedging certain volumes of our crude oil or refined products may have more or less variability than the actual cost or price we realize for such crude oil or refined products. We may not hedge all the basis risk inherent in our hedging arrangements and derivative contracts.
Our commodity derivative activities could result in period-to-period earnings volatility.
We do not currently apply hedge accounting to any of our commodity derivative contracts and, as a result, unrealized gains and losses will be charged to our earnings based on the increase or decrease in the market value of such unsettled positions. These gains and losses may be reflected in our income statement in periods that differ from when the settlements of the underlying hedged items are reflected in our income statement. Such derivative gains or losses in earnings may produce significant period-to-period earnings volatility that is not necessarily reflective of our underlying operational performance.
Risks Related to Our Indebtedness
Our substantial indebtedness could adversely affect our financial condition and prevent us from fulfilling our obligations under our indebtedness.
Our indebtedness may significantly affect our financial flexibility in the future. As of December 31, 2021,2023, we have total debt of $4,330.8$1,298.4 million, excluding unamortized deferred debt issuance costs of $35.0$52.5 million, and our PBF LLC Affiliate note payable with PBF Energy that eliminates in consolidation at the PBF Energy level, and we could incur additional borrowings under our PBF Holding’s asset-based revolving credit facilities.facility (the “Revolving Credit Facility”). We may incur additional indebtedness in the future including additional secured indebtedness, subject to the satisfaction of any debt incurrence and, if applicable, lien incurrence limitation covenants in our existing financing agreements. Although we were in compliance with incurrence covenants during the year ended December 31, 2021, to the extent that any of our activities triggered these covenants, there are no assurances that conditions could not change significantly, and that such changes could adversely impact our ability to meet some of these incurrence covenants at the time that we needed to. Failure to meet the incurrence covenants could impose certain incremental restrictions on, among other matters, our ability to incur new debt (including secured debt) and also may limit the extent to which we may pay future dividends, make new investments, repurchase our stock or incur new liens.
The level of our indebtedness has several important consequences for our future operations, including that:
•a portion of our cash flow from operations will be dedicated to the payment of principal of, and interest on, our indebtedness and will not be available for other purposes;
•under certain circumstances, covenants contained in our existing debt arrangements limit our ability to borrow additional funds, dispose of assets and make certain investments;
•in certain circumstances these covenants also require us to meet or maintain certain financial tests, which may affect our flexibility in planning for, and reacting to, changes in our industry, such as being able to take advantage of acquisition opportunities when they arise;
•our ability to obtain additional financing for working capital, capital expenditures, acquisitions, general corporate and other purposes may be limited; and
•we may be at a competitive disadvantage to those of our competitors that are less leveraged; and we may be more vulnerable to adverse economic and industry conditions.
Our indebtedness increases the risk that we may default on our debt obligations, certain of which contain cross-default and/or cross-acceleration provisions. Our, and our subsidiaries’, ability to meet future principal obligations will be dependent upon our future performance, which in turn will be subject to general economic conditions, industry cycles and financial, business and other factors affecting our operations, many of which are beyond our control. Our business may not continue to generate sufficient cash flow from operations to repay our indebtedness. If we are unable to generate sufficient cash flow from operations, we may be required to sell assets, to refinance all or a portion of our indebtedness or to obtain additional financing. Refinancing may not be possible and additional financing may not be available on commercially acceptable terms, or at all.
We may not be able to secure necessary financing on acceptable terms, or at all.
We currently have notes outstanding with varying maturity dates beginning in 20232028 and ending in 2028.2030. Additionally, our most significant credit facilities - the Revolving Credit Facility and the PBFX amended and restated revolving credit facility (the “PBFX Revolving Credit Facility”) - both have maturity datesmatures in 2023.2028. We can make no assurance that we will be able to refinance our outstanding indebtednessthese agreements on acceptable terms prior to their maturity dates. Market disruptions or other credit factors, such as those experienced in relation to the COVID-19 pandemic,rising inflation and higher interest rates, may increase our cost of borrowing or adversely affect our ability to refinance our obligations as they become due. Further, ESG concerns and other pressures on the oil and gas industry could lead to increased costs of financing or limit our access to the capital markets. If we are unable to refinance our indebtedness or access additional credit, or if short-term or long-term borrowing costs significantly increase, our ability to finance current operations and meet our short-term and long-term obligations could be adversely affected.
Despite our substantial level of indebtedness, we and our subsidiaries may be able to incur substantially more debt, which could exacerbate the risks described above.
We and our subsidiaries may beare able to incur additional indebtedness in the future including additional secured or unsecured debt. Although our debt instruments and financing arrangements contain restrictions on the incurrence of additional indebtedness, these restrictions are subject to a number of qualifications and exceptions, and the indebtedness incurred in compliance with these restrictions could be substantial. To the extent new debt is added to our current debt levels, the leverage risks described above would increase. Also, these restrictions do not prevent us from incurring obligations that do not constitute indebtedness.
Our future credit ratings could adversely affect our business, the cost of our borrowing, and our ability to obtain credit in the future.
Changes in our credit profile could affect the way crude oil and other suppliers view our ability to make payments and induce them to shorten the payment terms for our purchases or require us to post security or letters of credit prior to payment. Due to the large dollar amounts and volume of our crude oil and other feedstock purchases, any imposition by these suppliers of more burdensome payment terms on us may have a material adverse effect on our liquidity and our ability to make payments to our suppliers. This, in turn, could reduce our access to supply and cause us to be unable to operate one or more of our refineries at full capacity.
The 6.0% senior unsecured notes due 2028 (the “2028 Senior Notes”) and the 7.25%7.875% senior unsecured notes due 20252030 (the “2025“2030 Senior Notes”) are rated Caa1Ba3 by Moody’s, B by S&P, and B- by Fitch. The 9.25% senior secured notes due 2025 (the “2025 Senior Secured Notes”) are rated B2 by Moody’s, BB-BB by S&P, and BB by Fitch. The 6.875% PBFX senior notes due 2023 (the “PBFX 2023 Senior Notes”) are rated B3 by Moody’s, B by S&P, and B+ by Fitch. During 2021, Moody’s and S&P downgraded our corporate family rating as well as our unsecured and secured notes ratings, with all ratings on negative outlook. If the current market conditions persist or deteriorate, we expect that the credit rating agencies will continue to re-evaluate our corporate credit rating and the ratings of our unsecured and secured notes. AdverseAny adverse changes in our credit ratings may also negatively impact the terms of credit we receive from our suppliers and require us to prepay or post collateral. FurtherAdditionally, adverse actions taken by the rating agencies on our corporate credit rating or the rating of our notes may further increase our cost of borrowings or hinder our ability to raise financing in the capital markets
or have an unfavorable impact on the credit terms we have with our suppliers, which could impair our ability to grow our business, increase ourmaintain adequate levels of liquidity and make cash distributions to our shareholders.
Restrictive covenants in our debt instruments, including the indentures governing our notes, may limit our ability to undertake certain types of transactions, which could adversely affect our business, financial condition, results of operations and our ability to service our indebtedness.
Various covenants in our current and future debt instruments and other financing arrangements, including the indentures governing our notes, may restrict our and our subsidiaries’ financial flexibility in a number of ways. Our current indebtedness and the indentures that govern our notes subject us to significant financial and other restrictive covenants, including restrictions on our ability to incur additional indebtedness, place liens upon assets, pay dividends or make certain other restricted payments and investments, consummate certain asset sales or asset swaps, conduct businesses other than our current businesses, or sell, assign, transfer, lease, convey or otherwise dispose of all or substantially all of our assets. Some of our debt instruments also require our subsidiaries to satisfy or maintain certain financial condition tests in certain circumstances. Our ability to meet these financial condition tests can be affected by events beyond our control and we may not meet such tests. In addition, a failure to comply with the provisions of our existing debt could result in an event of default that could enable our lenders, subject to the terms and conditions of such debt, to declare the outstanding principal, together with accrued interest, to be immediately due and payable. Events beyond our control including the impact of the COVID-19 pandemic and related governmental responses and developments in the global oil markets, may affect our ability to comply with our covenants. If we were unable to repay the accelerated amounts, our lenders could proceed against the collateral granted to them to secure such debt. If the payment of our debt is accelerated, defaults under our other debt instruments, if any, may be triggered, and our assets may be insufficient to repay such debt in full.
Provisions in our indentures and other agreements could discourage an acquisition of us by a third-party.
Certain provisions of our indentures could make it more difficult or more expensive for a third-party to acquire us. Upon the occurrence of certain transactions constituting a “change of control” as described in the indentures governing the 2025 Senior Notes, the 2025 Senior Secured Notes, the 2028 Senior Notes and the PBFX 20232030 Senior Notes, holders of our notes could require us to repurchase all outstanding notes at 101% of the principal amount thereof, plus accrued and unpaid interest, if any, at the date of repurchase. Certain other significant agreements of ours such as our agreement governing the Revolving Credit Facility (the “Revolving Credit Agreement”), and the Tax Receivable Agreement (as defined below) and the Third Intermediation Agreement with J. Aron also contain provisions related to a change in control that could make it more difficult or expensive for a third-party to acquire us.
Risks Related to Our Organizational Structure and PBF Energy Class A Common Stock
PBF Energy is the managing member of PBF LLC and its only material asset is its interest in PBF LLC. Accordingly, PBF Energy depends upon distributions from PBF LLC and its subsidiaries to pay its taxes, meet its other obligations and/or pay dividends in the future.
PBF Energy is a holding company, and all of its operations are conducted through subsidiaries of PBF LLC. PBF Energy has no independent means of generating revenue and no material assets other than its ownership interest in PBF LLC. We depend on the earnings and cash flow of our subsidiaries to meet our obligations, including our indebtedness, tax liabilities and obligations to make payments under a tax receivable agreement entered into with PBF LLC Series A and PBF LLC Series B unitholders (the “Tax Receivable Agreement”). If we do not receive such cash distributions, dividends or other payments from our subsidiaries, we may be unable to meet our obligations and/or pay dividends.
PBF Energy, as the sole managing partner of PBF LLC, may cause PBF LLC to make distributions to its members in an amount sufficient to enable PBF Energy to cover all applicable taxes at assumed tax rates, to make payments owed by PBF Energy under the Tax Receivable Agreement, and to pay other obligations and dividends, if any, declared by PBF Energy. To the extent we need funds and any of our subsidiaries is restricted from making such distributions under applicable law or regulation or under the terms of our financing or other contractual arrangements, or is otherwise unable to provide such funds, such restrictions could materially adversely affect our liquidity and financial condition.
The Revolving Credit Facility, the 2028 Senior Notes, the 20252030 Senior Notes, the 2025 Senior Secured Notes, and certain of our other outstanding debt arrangements include a restricted payment covenant, which restricts the ability of PBF Holding to make distributions to us, and we anticipate our future debt will contain a similar restriction. PBFX Revolving Credit Facility and PBFX’s indenture governing its PBFX 2023 Senior Notes also contain covenants that limit or restrict PBFX’s ability and the ability of its restricted subsidiaries to make distributions and other restricted payments and restrict PBFX’s ability to incur liens and enter into burdensome agreements. In addition, there may be restrictions on payments by our subsidiaries under applicable laws, including laws that require companies to maintain minimum amounts of capital and to make payments to stockholders only from profits. For example, PBF Holding is generally prohibited under Delaware law from making a distribution to a member to the extent that, at the time of the distribution, after giving effect to the distribution, liabilities of the limited liability company (with certain exceptions) exceed the fair value of its assets, and PBFX is subject to a similar prohibition.assets. As a result, we may be unable to obtain that cash to satisfy our obligations and make payments to PBF Energy stockholders, if any.
The rights of other members of PBF LLC may conflict with the interests of PBF Energy Class A common stockholders.
The interests of the other members of PBF LLC, which include current and former directors and officers, may not in all cases be aligned with PBF Energy Class A common stockholders’ interests. For example, these members may have different tax positions whichthat could influence their positions, including regarding whether and when we dispose of assets and whether and when we incur new or refinance existing indebtedness, especially in light of the existence of the Tax Receivable Agreement. In addition, the structuring of future transactions may take into consideration these tax or other considerations even where no similar benefit would accrue to PBF Energy Class A common stockholders or us. See “Certain Relationships and Related Transactions—IPO Related Agreements” in our 20222024 Proxy Statement incorporated herein by reference.
Under the Tax Receivable Agreement, PBF Energy is required to pay the former and current holders of PBF LLC Series A Units and PBF LLC Series B Units, or other permitted assignees, for certain realized or assumed tax benefits PBF Energy may claim arising in connection with prior offerings and future exchanges of PBF LLC Series A Units for shares of its Class A common stock and related transactions. The indentures governing the senior notes allow PBF LLC, under certain circumstances, to make distributions sufficient for PBF Energy to pay its obligation under the Tax Receivable Agreement.
PBF Energy is party to a Tax Receivable Agreement that provides for the payment from time to time by PBF Energy to the current and former holders of PBF LLC Series A Units and PBF LLC Series B Units, or other permitted assignees, of 85% of the benefits, if any, that PBF Energy is deemed to realize as a result of (i) the increases in tax basis resulting from its acquisitions of PBF LLC Series A Units, including such acquisitions in connection with its prior offerings or in the future and (ii) certain other tax benefits related to its entering into the Tax Receivable Agreement, including tax benefits attributable to payments under the Tax Receivable Agreement. See “Item 13. Certain Relationships and Related Transactions, and Director Independence.”
PBF Energy has recognized, as of December 31, 2021,2023, a total liability for the Tax Receivable Agreement of $48.3$336.6 million, reflectingof which $43.0 million is recorded as a current liability and was paid in January 2024 related to the estimated undiscounted amounts that PBF Energy expects to pay under the agreement, net of a deferred2022 tax asset valuation allowance recognized in accordance with FASB Accounting Standards Codification (“ASC”) 740, Income Taxes (“ASC 740”).year. As future taxable income is recorded, increases in our Tax Receivable Agreement liability may be necessary in conjunction with the revaluation of deferred tax assets. If PBF Energy does not have taxable income, PBF Energy generally is not required (absent a change of control or circumstances requiring an early termination payment) to make payments under the Tax Receivable Agreement for that taxable year because no benefit will have been actually realized. However, any tax benefits that do not result in realized benefits in a given tax year will likely generate tax attributes that may be utilized to generate benefits in previous or future tax years. The utilization of such tax attributes will result in payments under the Tax Receivable Agreement. The foregoing are merely estimates based on assumptions that are subject to change due to various factors, including, among other factors, the timing of exchanges of PBF LLC Series A Units for shares of PBF Energy Class A common stock as contemplated by the Tax Receivable Agreement, the price of PBF Energy Class A common stock at the time of such exchanges, the extent to which such exchanges are taxable, and the amount and timing of PBF Energy’s income. The actual payments under the Tax Receivable Agreement could differ materially. It is possible that future transactions or events could increase the actual tax benefits realized and the corresponding Tax Receivable Agreement payments. There may be a material negative effect on our liquidity if, as a result of timing discrepancies or otherwise, (i) the payments under the Tax Receivable Agreement exceed the actual benefits PBF Energy realizes in respect of the tax attributes subject to the Tax Receivable Agreement, and/or (ii) distributions to PBF Energy by PBF LLC are not sufficient to permit PBF Energy, after it has paid its taxes and other obligations, to make payments under the Tax Receivable Agreement. The payments under the Tax Receivable Agreement are not conditioned upon any recipient’s continued ownership of us.
In certain cases, payments by PBF Energy under the Tax Receivable Agreement may be accelerated and/or significantly exceed the actual benefits it realizes in respect of the tax attributes subject to the Tax Receivable Agreement. These provisions may deter a change in control of the Company.
The Tax Receivable Agreement provides that upon certain changes of control, or if, at any time, PBF Energy elects an early termination of the Tax Receivable Agreement, PBF Energy’s (or its successor’s) obligations with respect to exchanged or acquired PBF LLC Series A Units (whether exchanged or acquired before or after such transaction) would be based on certain assumptions, including (i) that PBF Energy would have sufficient taxable income to fully utilize the deductions arising from the increased tax deductions and tax basis and other benefits related to entering into the Tax Receivable Agreement and (ii) that the subsidiaries of PBF LLC will sell certain nonamortizable assets (and realize certain related tax benefits) no later than a specified date. Moreover, in each of these instances, PBF Energy would be required to make an immediate payment equal to the present value (at a discount rate equal to the London Interbank Offering Rate (“LIBOR”)LIBOR plus 100 basis points) of the anticipated future tax benefits (based on the foregoing assumptions). Accordingly, payments under the Tax Receivable
Agreement may be made years in advance of the actual realization, if any, of the anticipated future tax benefits and may be significantly greater than the actual benefits PBF Energy realizes in respect of the tax attributes subject to the Tax Receivable Agreement. In these situations, PBF Energy’s obligations under the Tax Receivable Agreement could have a substantial negative impact on our liquidity. PBF Energy may not be able to finance its obligations under the Tax Receivable Agreement and its existing indebtedness may limit its subsidiaries’ ability to make distributions to PBF Energy to pay these obligations. These provisions may deter a potential sale of our Company to a third-party and may otherwise make it less likely that a third-party would enter into a change of control transaction with us.
Moreover, payments under the Tax Receivable Agreement will be based on the tax reporting positions that PBF Energy determines in accordance with the Tax Receivable Agreement. PBF Energy will not be reimbursed for any payments previously made under the Tax Receivable Agreement if the Internal Revenue ServiceIRS subsequently disallows part or all of the tax benefits that gave rise to such prior payments. As a result, in certain circumstances, payments could be made under the Tax Receivable Agreement that are significantly in excess of the benefits that PBF Energy actually realized in respect of (i) the increases in tax basis resulting from our purchases or exchanges of PBF LLC Series A Units and (ii) certain other tax benefits related to PBF Energy entering into the Tax Receivable Agreement, including tax benefits attributable to payments under the Tax Receivable Agreement.
PBF Energy cannot assure you that it will continue to declare dividends or have the available cash to make dividend payments.
Although PBF Energy currently intends to continue to pay quarterly cash dividends on its Class A common stock, the declaration, amount and payment of any dividends will be at the sole discretion of our Board of Directors. PBF Energy is not obligated under any applicable laws, its governing documents or any contractual agreements with its existing and prior owners or otherwise to declare or pay any dividends or other distributions (other than the obligations of PBF LLC to make tax distributions to its members). Our Board of Directors may take into account, among other things, general economic conditions, our financial condition and operating results, our available cash and current and anticipated cash needs, capital requirements, plans for expansion, including acquisitions, tax, legal, regulatory and contractual restrictions and implications, including under our subsidiaries’ outstanding debt documents, and such other factors as our Board of Directors may deem relevant in determining whether to declare or pay any dividend. Because PBF Energy is a holding company with no material assets (other than the equity interests of its direct subsidiary), its cash flow and ability to pay dividends is dependent upon the financial results and cash flows of its indirect subsidiaries PBF Holding and PBFX and their respective operating subsidiaries and the distribution or other payment of cash to it in the form of dividends or otherwise. The direct and indirect subsidiaries of PBF Energy are separate and distinct legal entities and have no obligation to make any funds available to it other than in the case of certain intercompany transactions. As a result, if PBF Energy does not declare or pay dividends you may not receive any return on an investment in PBF Energy Class A common stock unless you sell PBF Energy Class A common stock for a price greater than that which you paid for it.
Anti-takeover and certain other provisions in our certificate of incorporation and bylaws and Delaware law may discourage or delay a change in control.
Our certificate of incorporation and bylaws contain provisions whichthat could make it more difficult for stockholders to effect certain corporate actions. Among other things, these provisions:
•authorize the issuance of undesignated preferred stock, the terms of which may be established and the shares of which may be issued without stockholder approval;
•prohibit stockholder action by written consent;
•restrict certain business combinations with stockholders who obtain beneficial ownership of a certain percentage of our outstanding common stock;
•provide that special meetings of stockholders may be called only by the chairman of the Board of Directors, the chief executive officer or the Board of Directors, and establish advance notice procedures for the nomination of candidates for election as directors or for proposing matters that can be acted upon at stockholder meetings; and
•provide that our stockholders may only amend our bylaws with the approval of 75% or more of all of the outstanding shares of our capital stock entitled to vote.
These anti-takeover provisions and other provisions of Delaware law may have the effect of delaying or deterring a change of control of our company.Company. Certain provisions could also discourage proxy contests and make it more difficult for you and other stockholders to elect directors of your choosing and to cause us to take other corporate actions you desire. These provisions could limit the price that certain investors might be willing to pay in the future for shares of PBF Energy Class A common stock.
The market price of PBF Energy Class A common stock may be volatile, whichand you could cause the valuelose all or part of your investment to decline.investment.
The market price of PBF Energy Class A common stock has in the past been and may continue to be highly volatile and subject to wide fluctuations due to a number of factors including:
•market conditions in the oil refining industry and volatility in commodity prices and the ongoing impact of COVID-19;prices;
•changes in, or failure to meet, earnings estimates of securities analysts;
•variations in actual or anticipated operating results or dividends, if any, to stockholders;
•the impact of disruptions to crude or feedstock supply to any of our refineries or our Renewable Diesel Facility, including disruptions due to problems with third-party logistics infrastructure;
•litigation and government investigations;
•the timing and announcement of any potential acquisitions or divestitures and subsequent impact of any future acquisitions or divestitures on our capital structure, financial condition or results of operations;
•changes or proposed changes in laws or regulations or differing interpretations or enforcement thereof;
•general economic and stock market conditions; and
•the availability for sale, or sales by PBF Energy or its senior management, of a significant number of shares of its Class A common stock in the public market.
In recent years, the stock market in general, and the market for energy companies in particular, has experienced significant price and volume fluctuations that have often been unrelated or disproportionate to the operating performance of those companies. This volatility has had a significant impact on the market price of securities issued by many companies, including companies in our industry. In addition, the stock markets generally may experience significant volatility, often unrelated to the operating performance of the individual companies whose securities are publicly-traded. These and other factors may cause the market price of PBF Energy Class A common stock to decrease significantly, which in turn would adversely affect the value of your investment.
In the past, following periods of volatility in the market price of a company’s securities, stockholders have often instituted class action securities litigation against those companies. Such litigation, if instituted, could result in substantial costs and a diversion of management’s attention and resources, which could significantly harm our profitability and reputation.
Our current stockholders could experience dilution, which could further depress the price of our Class A common stock.
We continue to require substantial working capital to fund our business. We may sell equity securities or convertible securities or other derivative securities in the public or private markets if we continue to needassist in funding our capital andneeds even when conditions or terms are not otherwise favorable, including at prices at or below the then current market price of our shares of Class A common stock. As a result, stockholders may experience substantial dilution, and the market price of our Class A common stock could decline as a result of the introduction of a large number of shares of our Class A common stock, or securities convertible into or exchangeable or exercisable for our Class A common stock, into the market or the perception that these sales could occur. Sales of a large number of shares of our Class A common stock, or securities convertible into or exchangeable or exercisable for our Class A common stock, or the possibility that these sales may occur, also might make it more difficult for us to sell equity securities in the future at a time and at a price that we deem appropriate. In addition, any equity securities we issue may have rights, preferences or privileges senior to those of our Class A common stock, and our current debt agreements contain, and any agreements for future debt or preferred equity financings, if available, are likely to contain, covenants limiting or restricting our ability to take specific actions, such as incurring additional debt. Holders of Class A common stock are not entitled to preemptive rights or other protections against dilution. Because our decision to issue securities in any future offering will depend on our capital needs as well as market conditions and other factors beyond omour control, we cannot predict or estimate the amount, timing, nature or impact of future issuances, if any. Our Class A common stockholders bear the risk of our future offerings reducing the per share market price of our Class A common stock.
Risks Related to Our Ownership of PBFX
We depend upon PBFX for a substantial portion of our refineries’ logistics needs and have obligations for minimum volume commitments in our commercial agreements with PBFX.
We depend on PBFX to receive, handle, store and transfer crude oil, petroleum products and natural gas for us from our operations and sources located throughout the United States and Canada in support of certain of our refineries under long-term, fee-based commercial agreements with our subsidiaries. These commercial agreements have an initial term ranging from one to fifteen years and generally include minimum quarterly commitments and inflation escalators. If we fail to meet the minimum commitments during any calendar quarter, we will be required to make a shortfall payment quarterly to PBFX equal to the volume of the shortfall multiplied by the applicable fee.
PBFX’s operations are subject to all of the risks and operational hazards inherent in receiving, handling, storing and transferring crude oil, petroleum products and natural gas, including: damages to its facilities, related equipment and surrounding properties caused by floods, fires, severe weather, explosions and other natural disasters and acts of terrorism; mechanical or structural failures at PBFX’s facilities or at third-party facilities on which its operations are dependent; curtailments of operations relative to severe seasonal weather; inadvertent damage to our facilities from construction, farm and utility equipment; and other hazards. Any of these events or factors could result in severe damage or destruction to PBFX’s assets or the temporary or permanent shut-down of PBFX’s facilities. If PBFX is unable to serve our logistics needs, our ability to operate our refineries and receive crude oil and distribute products could be adversely impacted, which could adversely affect our business, financial condition and results of operations.
In addition, as of December 31, 2021, PBF LLC owns 29,953,631 common units representing 47.9% limited partner interest in PBFX. The inability of PBFX to continue operations, perform under its commercial arrangements with our subsidiaries or the occurrence of any of these risks or operational hazards, could also adversely impact the value of our investment in PBFX and, because PBFX is a consolidated entity, our business, financial condition and results of operations.
PBF Energy will be required to pay taxes on its share of taxable income from PBF LLC and its other subsidiary flow-through entities, (including PBFX), regardless of the amount of cash distributions PBF Energy receives from PBF LLC.
The holders of limited liability company interests in PBF LLC, including PBF Energy, generally have to include for purposes of calculating their U.S. federal, state and local income taxes their share of any taxable income of PBF LLC, regardless of whether such holders receive cash distributions from PBF LLC. PBF Energy ultimately may not receive cash distributions from PBF LLC equal to its share of the taxable income of PBF LLC or even equal to the actual tax due with respect to that income. For example, PBF LLC is required to include in taxable income PBF LLC’s allocable share of PBFX’s taxable income and gains (such share to be determined pursuant to the partnership agreement of PBFX), regardless of the amount of cash distributions received by PBF LLC from PBFX, and such taxable income and gains will flow-through to PBF Energy to the extent of its allocable share of the taxable income of PBF LLC. As a result, at certain times, the amount of cash otherwise ultimately available to PBF Energy on account of its indirect interest in PBFX may not be sufficient for PBF Energy to pay the amount of taxes it will owe on account of its indirect interests in PBFX.
If PBFX was to be treated as a corporation, rather than as a partnership, for U.S. federal income tax purposes or if PBFX was otherwise subject to entity-level taxation, PBFX’s cash available for distribution to its unitholders, including to us, would be reduced, likely causing a substantial reduction in the value of units, including the units held by us.
The present U.S. federal income tax treatment of publicly-traded partnerships, including PBFX, or an investment in its common units may be modified by administrative, legislative or judicial interpretation at any time. For example, from time to time the U.S. Congress considers substantive changes to the existing federal income tax laws that would affect publicly-traded partnerships. Any modification to the U.S. federal income tax laws and interpretations thereof may or may not be applied retroactively and could make it more difficult or impossible for PBFX to meet the exception to be treated as a partnership for U.S. federal income tax purposes. We are unable to predict whether any of these changes, or other proposals, will ultimately be enacted. Any such changes could negatively impact the value of an investment in PBFX common units.
If PBFX were treated as a corporation for U.S. federal income tax purposes, it would pay U.S. federal income tax on income at the corporate tax rate, which is currently a maximum of 21% under the TCJA, and would likely be liable for state income tax at varying rates. Distributions to PBFX unitholders would generally be taxed again as corporate distributions, and no income, gains, losses, deductions or credits would flow through to PBFX unitholders. Because taxes would be imposed upon PBFX as a corporation, the cash available for distribution to PBFX unitholders would be substantially reduced. Therefore, PBFX’s treatment as a corporation would result in a material reduction in the anticipated cash flow and after-tax return to PBFX unitholders, likely causing a substantial reduction in the value of the units.
All of the executive officers and a majority of the directors of PBF GP are also current or former officers or directors of PBF Energy. Conflicts of interest could arise as a result of this arrangement.
PBF Energy indirectly owns and controls PBF GP, and appoints all of its officers and directors. All of the executive officers and a majority of the directors of PBF GP are also current or former officers or directors of PBF Energy. These individuals will devote significant time to the business of PBFX. Although the directors and officers of PBF GP have a fiduciary duty to manage PBF GP in a manner that is beneficial to PBF Energy, as directors and officers of PBF GP they also have certain duties to PBFX and its unitholders. Conflicts of interest may arise between PBF Energy and its affiliates, including PBF GP, on the one hand, and PBFX and its unitholders, on the other hand. In resolving these conflicts of interest, PBF GP may favor its own interests and the interests of PBFX over the interests of PBF Energy. In certain circumstances, PBF GP may refer any conflicts of interest or potential conflicts of interest between PBFX, on the one hand, and PBF Energy, on the other hand, to its conflicts committee (which must consist entirely of independent directors) for resolution, which conflicts committee must act in the best interests of the public unitholders of PBFX. As a result, PBF GP may manage the business of PBFX in a way that may differ from the best interests of PBF Energy or its stockholders.
ITEM 1B. UNRESOLVED STAFF COMMENTS
None.
ITEM 1C. CYBERSECURITY
Cybersecurity risk management and strategy
Our cybersecurity risk management program is managed by our Chief Information Officer (“CIO”) who reports to our Chief Financial Officer and provides regular updates to the Board. Our CIO establishes our overall Information Technology (“IT”) security strategy, oversees our information, cyber, and technology security and manages our IT department, which includes our Cybersecurity team. His responsibilities include developing, implementing, and enforcing security policies to protect critical data. The head of our Cybersecurity team, our Director of Information Security, who reports to our CIO, runs the day-to-day management of our cybersecurity risks. Our IT department overall assists in implementing cybersecurity strategies and policies under the direction of the Cybersecurity team, as applicable.
Our cybersecurity risk management program aligns with the National Institute of Standards and Technology Cyber Security Framework, which establishes five areas of focus: identify, protect, detect, respond and recover. Our cybersecurity risk management program is designed to manage industry-specific threats, as well as threats arising from the overall evolving cybersecurity landscape and consists of two principal areas of focus: (i) enterprise systems, which consists of all business systems used in our daily operations and (ii) operational technology, which consists of all process control, supervisory control and data acquisition systems. Key elements of our cybersecurity management program include:
•identifying, monitoring and mitigating the cybersecurity risks to our systems, assets, data and capabilities;
•a critical response process for cybersecurity incidents, including the process for detection, investigation, containment and remediation of any such incidents;
•establishment of disaster recovery plans;
•testing, at least bi-annually, of select critical systems for disaster recovery and periodic walk-throughs of procedures for disaster recovery;
•identity access policies that aim to identify and monitor for potential cyber intrusions;
•periodic security tests, including monthly internal vulnerability scans, weekly external vulnerability scans, monthly phishing campaigns and recurring penetration testing by third-party cybersecurity firms;
•table-top exercises, at least quarterly, for incident response preparedness for the Cybersecurity team and Information Technology department; and
•annual drills for potential threats on various aspects of our technology assets based on the then-existing IT threat landscape for our industry.
Pursuant to our incident response plan, the Cybersecurity team has defined roles in responding to all cybersecurity incidents to provide an efficient and organized approach to handling cybersecurity threats, with the CIO receiving all reports and status updates regarding cybersecurity threats. The incident response plan provides a documented framework for when and how the CIO informs and updates our Board, the executive officers and other internal parties and when external parties are notified or consulted about a cybersecurity threat and the status thereof.
We also utilize third-party cybersecurity vendors to assist us with various aspects of our cybersecurity risk management program. For example, in order to support our cybersecurity incident response procedures, we have retained several third-party cybersecurity firms to monitor the IT threat landscape for our industry. As part of our efforts to manage the risk of cybersecurity threats associated with the use of third parties, we monitor and evaluate the cybersecurity risk profiles of third-party technology providers and consider such risk profiles when selecting third-party technology providers. Any third-party service provider that is granted access to our network is required to comply with our policies regarding information technology and cybersecurity. We also engage several third-party cybersecurity firms to perform independent assessments of the effectiveness of our cybersecurity risk management program and assist us in the continued review of our cybersecurity risk management program in order to reflect the evolving landscape of cybersecurity.
To date, there have been no significant risks from cybersecurity threats, including as a result of any significant cybersecurity breaches or attacks that have materially affected our business, results of operations or financial condition. However, if we were to be subject to a material successful cyber intrusion, it could result in remediation or service restoration costs, increased cybersecurity protection costs, lost revenues, litigation or regulatory actions by governmental authorities, increased insurance premiums, reputational damage and damage to our competitiveness, financial condition, results of operations and cash flows. See “Item 1A. Risk Factors−Risks Relating to Our Business and Industry−A cyber-attack on, or other failure of, our technology infrastructure could affect our business and assets, and have a material adverse effect on our financial condition, results of operations and cash flows.”
Cybersecurity governance
Our CIO has 30 years of experience in highly regulated industries managing information security in complex, matrixed environments, seven of which are in his current role with the Company. He has created and maintained enterprise-level information security programs for our Company and other US and international companies in the refining industry.
The CIO, along with the head of our Cybersecurity team, periodically reports, no less than quarterly, to our Board and our executive officers regarding the state of our cybersecurity risk management program, including information on the status of ongoing efforts to manage and mitigate cybersecurity risks, as well as recent cybersecurity trends and events and any updates to cybersecurity matters.
The Audit Committee reviews our disclosures with respect to cybersecurity and information technology risks. The Audit Committee also reviews with management guidelines and policies to govern the process by which risk assessment and risk management is undertaken, including but not limited to cybersecurity and information technology risks. As part of the Company’s enterprise-wide risk management program, our Internal Audit team also reports to our Audit Committee regarding assessments of our cybersecurity and information technology risks, at least annually, based on regular updates by our CIO regarding such risks. Our Internal Audit team periodically reports to our executive officers and the Audit Committee regarding such risks.
ITEM 2. PROPERTIES
See “Item 1. Business”.
ITEM 3. LEGAL PROCEEDINGS
On December 28, 2016, DNREC issued the Ethanol Permit to DCR allowing the utilization of existing tanks and existing marine loading equipment at their existing facilities to enable denatured ethanol to be loaded from storage tanks to marine vessels and shipped to offsite facilities. On January 13, 2017, the issuance of the Ethanol Permit was appealed by two environmental groups. On February 27, 2017, the Coastal Zone Industrial Control Board (the “Coastal Zone Board”) held a public hearing and dismissed the appeal, determining that the appellants did not have standing. The appellants filed an appeal of the Coastal Zone Board’s decision with the Delaware Superior Court (the “Superior Court”) on March 30, 2017. On January 19, 2018, the Superior Court rendered an Opinion regarding the decision of the Coastal Zone Board to dismiss the appeal of the Ethanol Permit for the ethanol project. The judge determined that the record created by the Coastal Zone Board was insufficient for the Superior Court to make a decision, and therefore remanded the case back to the Coastal Zone Board to address the deficiency in the record. Specifically, the Superior Court directed the Coastal Zone Board to address any evidence concerning whether the appellants’ claimed injuries would be affected by the increased quantity of ethanol shipments. On remand, the Coastal Zone Board met on January 28, 2019 and reversed its previous decision on standing ruling that the appellants have standing to appeal the issuance of the Ethanol Permit. The parties to the action filed a joint motion with the Coastal Zone Board, requesting that the Coastal Zone Board concur with the parties’ proposal to secure from the Superior Court confirmation that all rights and claims are preserved for any subsequent appeal to the Superior Court, and that the matter then be scheduled for a hearing on the merits before the Coastal Zone Board. The Coastal Zone Board notified the parties in January of 2020 that it concurred with the parties’ proposed course of action. The appellants and DCR subsequently filed a motion with the Superior Court requesting relief consistent with what was described to the Coastal Zone Board. In March of 2020, the Superior Court issued a letter relinquishing jurisdiction over the matter, and concurring with the parties’ proposal to allow the case to proceed to a hearing on the merits before the Coastal Zone Board. The parties must now jointly propose to the Coastal Zone Board a schedule for prehearing activity and a merits hearing to resolve the matter. The parties must, therefore, submit to the Coastal Zone Board a joint proposed schedule to govern future proceedings related to the merits hearing to resolve the matter.
On September 11, 2020, DCR received two Citations and Notification of Penalties, with sub-parts, from OSHA related to a combustion incident occurring on March 11, 2020. The citation seeks to impose penalties in the amount of $401,923 related to alleged violations of the Occupation Safety and Health Act of 1970. An informal conference with OSHA on October 2, 2020 was unsuccessful in resolving the matter, and, as a result, DCR filed a Notice of Contest with OSHA contesting the citations in their entirety at the end of the informal conference. OSHA filed its Complaint on December 13, 2020, and DCR filed its response on January 4, 2021. OSHA and DCR participated in mandatory meditation on February 2, 2021, which was unsuccessful. On February 25, 2021, the Occupational Safety and Health Review Commission granted the parties’ Joint Motion for Additional Time for the Parties to Discuss Settlement. The Court has since granted multiple additional extensions. On May 27, 2021, the parties notified the court that settlement negotiations are continuing and have continued to provide updates on the settlement negotiations. Subsequently, OSHA and DCR reached a settlement agreement with an assessed penalty of $401,923 and DCR agreed to undertake certain abatement measures. On January 24, 2022, DCR and the United Steelworkers signed the settlement agreement, and on January 25, 2022, OSHA executed the agreement.
On September 27, 2021, DCR received a Notice of Administrative Penalty Assessment and Secretary’s Order from DNREC, seeking to impose penalties in the amount of $285,000 related to alleged Title V permit violations occurring in 2019 and 2020. On October 15, 2021, DCR filed a Notice of Appeal before Delaware’s Environmental Appeals Board, contesting the Secretary’s findings and requesting a hearing. On November 2, 2021, the Environmental Appeals Board scheduled a Pre-Hearing Conference for April 8, 2022 and Hearing Date for April 26, 2022. On November 30, 2021, settlement negotiations commenced, which are continuing to date.
In connection with the acquisition of the Torrance refinery and related logistics assets, we assumed certain pre-existing environmental liabilities related to certain environmental remediation obligations to address existing soil and groundwater contamination and monitoring activities, which reflect the estimated cost of the remediation obligations. In addition, in connection with the acquisition of the Torrance refinery and related logistics assets, we purchased a ten-year, $100.0 million environmental insurance policy to insure against unknown environmental liabilities.
Subsequent to the acquisition, NoticesWe currently have multiple outstanding notices of Violationsviolation (“NOVs”) were issued by regulatory authorities for various alleged regulation and permit violations at our refineries. It is not possible to predict the South Coast Air Quality Management District (“SCAQMD”), Divisionoutcome of Occupational Safety and Healthany of these NOVs or the amount of the State of California, the City of Torrance, the City of Torrance Fire Department, and the Los Angeles County Sanitation District related to alleged operational violations, emission discharges and/or flaring incidents at the refinery and the logistics assets both before and after our acquisition. EPApenalties that will be assessed in November 2016 conducted a Risk Management Plan (“RMP”) inspection following the acquisition related to Torrance operations and issued preliminary findings in March 2017 concerning RMP potential operational violations. Effective January 9, 2020, we and EPA entered into a Consent Agreement and Final Order (“CAFO”), which contains no admission by us for any alleged violations in the CAFO, includes a release from all alleged violations in the CAFO, requires the payment of a penalty of $125,000 in January 2020 and also requires the implementation of a supplemental environmental project (“SEP”) of at least $219,000 that must be completed by December 15, 2021. The SEP consisted of configuring the northeast fire water monitor to automatically deploy water upon detection of a release. We completed this reconfiguration on December 15, 2021 and expended at least $219,000 as required by the CAFO. On February 11, 2022, we submitted the final SEP Completion Report to EPA, which should fully resolve this matter.
EPA and the California Department of Toxic Substances Control (“DTSC”) in December 2016 conducted a Resource Conservation and Recovery Act (“RCRA”) inspection following the acquisition related to Torrance operations and also issued in March 2017 preliminary findings concerning RCRA potential operational violations. On June 14, 2018, the Torrance refinery and DTSC reached settlement regarding the oil bearing materials. Following this settlement, in June 2018, DTSC referred the remaining alleged RCRA violations from EPA’s and DTSC’s December 2016 inspection to the California Attorney General. On April 7, 2021, we were notified that these alleged remaining six federal RCRA violations had been referred to EPA for resolution. On June 2, 2021, EPA conducted a further inspection to the December 2016 RCRA inspection. On August 13, 2021, we received EPA’s additional report indicating that the six federal RCRA findings were closed with no further enforcement action. The remaining alleged state RCRA violation is still pending with the California Attorney General.
On February 4, 2021, we received a letter from the SCAQMD proposing to settle a NOV relating to 15 Title V deviations alleged to have occurred in the second half of 2017 for $1.3 million. On October 8, 2021, we reached settlement in principle with the SCAQMD to pay a penalty of $250,000 for 14 of the Title V deviations and a penalty of $1.3 million for the remaining deviation, which covers the period of 2017 through 2021 and settlement agreements are in process.
On December 4, 2020, the Pennsylvania Department of Environmental Protection ("PaDEP") issued a draft Consent Order and Agreement (“CAO”) to PBF Logistics Products Terminals LLC (“PLPT”) with respect to two alleged violations at the Philadelphia terminal for failure to: 1) test and inspect regulated piping as required in accordance with industry standards; and 2) have a professional engineering certification that all above ground storage tanks meet the applicable performance standards and requirements as a result of an alleged release of oil on January 10, 2020 into the Schuylkill River resulting from a pipe leak that was not contained by emergency containment structure. The draft order included a proposed penalty of $800,000. On December 15, 2021, we entered into a final CAO and agreed to pay the $800,000 penalty. Under the final CAO, we capped our future liability at $250,000 if PaDEP brought a subsequent enforcement action under the Pennsylvania Clean Streams Law (“CSL”) for environmental damage allegedly caused by the release of oil from PLPT’s operational violations. Under the final CAO, we also reserved our rights to challenge any subsequent enforcement action brought by PaDEP under the CSL. On January 13, 2022, we received from
PaDEP, a Consent Assessment of Civil Penalty alleging violations under the CSL of over $1.0 million. However, because of the CAO cap, the PaDEP’s penalty demand to settle these alleged violations is $250,000. We are currently reviewing the alleged violations and settlement offer.
In connection with self-reported flaring eventsany NOV. If any one or more of them were decided against us, we believe that occurred at the Paulsboro Refinery between 2016 and 2020, in October 2021, the New Jersey Department of Environmental Protection (“NJDEP”) initiated discussions with PRC regarding potential penalties for alleged violations related to the self-reported flaring events. Although a formal NOV has not been issued, NJDEP provided a calculation sheet of potential penalties totaling approximately $1.6 million. We are currently challenging certain of those potential penalties and are in discussions with NJDEP regarding a potential settlement.
As the ultimate outcomes of the matters discussed above are uncertain, we cannot currently estimate the final amount or timing of their resolution but any such amount is not expected to have athere would be no material impacteffect on our financial position, results of operations, or cash flows,liquidity. SEC regulations require us to disclose certain information about proceedings arising under federal, state, or local provisions regulating the discharge of materials into the environment or protecting the environment if we reasonably believe that such proceedings will result in monetary sanctions of $300,000 or more. On November 24, 2022, the Martinez refinery experienced a spent catalyst release that is currently being investigated by the BAAQMD, Contra Costa County (“CCC”), the Department of Justice and EPA, and the California Department of Fish and Game (“DFG”). On July 11, 2023 and October 6, 2023, the Martinez refinery experienced unintentional releases of petroleum coke dust and has received inquiries or notices of investigation from the BAAQMD, the California Department of Industrial Relations, Division of Occupational Safety and Health, the CCC, and the EPA. The BAAQMD has issued 35 NOVs relating to the spent catalyst incident to date. The CCC has issued two NOVs related to the spent catalyst incident. The BAAQMD also issued an NOV relating to the July 11, 2023 coke dust incident and an NOV relating to the October 6, 2023 coke dust incident. For the spent catalyst incident, the DFG, CCC, and the BAAQMD have referred their findings and/or NOVs issued to date to the CCC District Attorney. On November 16, 2023, the CCC District Attorney and BAAQMD announced a joint civil enforcement action against us that will include enforcement of claims from the November 24, 2022 spent catalyst release, as well as additional enforcement claims. On December 15, 2023, the BAAQMD issued a NOV related to odors from flaring that occurred on the same date. On December 18, 2023, the BAAQMD issued four NOVs related to a fire incident that occurred on December 17, 2023. For both the spent catalyst, coke dust, flaring and fire incidents, no penalties have been assessed but it is reasonable to expect that, individually or in the aggregate.aggregate, the amount of such penalties may exceed $300,000.
On September 27, 2023, MRC received from the San Francisco Bay Regional Water Quality Control Board (“RWQCB”) an Administrative Civil Liability (“ACL”) assessment in the amount of $13.8 million for allegedly: (1) exceeding its effluent limitations and discharging to the Carquinez Strait without authorization in October 2022, January 2023, and June 2023; and (2) failing to submit Climate Change Adaptation information. On January 12, 2024, MRC met with the RWQCB to discuss its response to their ACL assessment. Based on the discussions and the information provided by MRC, the RWQCB proposed reducing the ACL assessment to approximately $4.5 million and noted that, for any settlement, 50% of the penalty could be in the form of an Enhanced Compliance Actions settlement (“ECA”), Supplemental Environmental Project (“SEP”), or a combination of the two. On January 19, 2024, MRC agreed to accept the reduced ACL, with 50% of the approximately $4.5 million dedicated to an ECA and SEP. Once the parties finalize the settlement agreement and stipulation for entry of administrative civil liability order, it will be presented to the RWQCB’s Board for final approval.
On February 17, 2017, in Arnold Goldstein, et al. v. Exxon Mobil Corporation, et alal.., we and PBF LLC, and our subsidiaries, PBF Western Region and Torrance Refining and the manager of our Torrance refinery along with ExxonMobil were named as defendants in a class action and representative action complaint filed on behalf of Arnold Goldstein, John Covas, Gisela Janette La Bella and others similarly situated.complaint. The complaint was filed in the Superior Court of the State of California, County of Los Angeles and alleges negligence, strict liability, ultra-hazardous activity, a continuing private nuisance, a permanent private nuisance, a continuing public nuisance, a permanent public nuisance and trespass resulting from the February 18, 2015 electrostatic precipitator (“ESP”) explosion at the Torrance refinery, which was then owned and operated by ExxonMobil. The operation of the Torrance refinery by the PBF entities subsequent to our acquisition in July 2016 is also referenced in the complaint. To the extent that plaintiffs’ claims relate to the ESP explosion, ExxonMobil retained responsibility for any liabilities that would arise from the lawsuit pursuant to the agreement relating to the acquisition of the Torrance refinery. On July 2, 2018, the courtCourt granted leave to plaintiffs to file a Second Amended Complaint alleging groundwater contamination. With the filing of the Second Amended Complaint, plaintiffs added an additional plaintiff, Hany Youssef. On October 15, 2019, the judge granted certification to two limited classes of property owners with Youssef as the sole class representative and named plaintiff, rejecting two other proposed subclasses based on negligence and on strict liability for ultrahazardous activities. The certified subclasses relate to trespass claims for ground contamination and nuisance for air emissions. On February 5, 2021, our motion for Limited Extension of Discovery Cut-Off and a Motion by plaintiffs for Leave to File Third Amended Complaint were heard by the court. On May 5, 2021, the Court granted plaintiffs leave to amend their complaint for the third time to substitute Navarro for Youssef. On May 12, 2021, plaintiffs filed their Third Amended Complaint (“TAC”)July 5, 2022, the Court issued a final order ruling that contained significant changesPlaintiffs’ Motion to Substitute Navarro as Class Representative was denied and new claims, including individual claims,decertifying both of Plaintiffs’ proposed Air and Ground Subclasses. The order provided that were not included in the case will proceed with Navarro as the sole plaintiff. On September 22, 2022, the Ninth Circuit Court of Appeals affirmed. On February 27, 2023, the Court issued an order granting our motion for judgment on the pleadings and dismissed Plaintiff’s trespass claim with prejudice and granted Plaintiff leave to amend plaintiffs presentedhis nuisance claims in conformity with the order if he can do so consistent with Rule 11 of the Federal Rules of Civil Procedures. On March 27, 2023, Plaintiff filed a Fourth Amended Complaint relating to the Court.remaining nuisance claims. On June 9, 2021,May 23, 2023, the Court denied our motion to dismiss on the pleadings for Plaintiff’s failure to establish standing to bring the nuisance claims. After completing further discovery, on August 28, 2023, we filed a Motion to Dismiss/Strikefor Summary Judgment. On October 18, 2023, the TAC. On June 23, 2021, plaintiffs filed their opposition toCourt issued an order granting our Motion to Dismiss/Strike, to which we filed our reply on July 2, 2021. A hearing on the Motion to Dismiss/Strike the TAC was held on August 2, 2021 and the court orderedmotion, adjudged that the TAC be struckPlaintiff take nothing, and that the parties meet and conferaction be dismissed with respectprejudice. The order also allows us to recover the costs of suit pursuant to a bill of costs. On October 30, 2023, Plaintiff filed a notice of appeal to the complaint. After meeting and conferring, plaintiffs agreed to submit a corrected TAC with changes reflecting the removal of Youssef and the substitution of Navarro as the named Plaintiff. On August 23, 2021, the Court approved the parties’ stipulation to take Navarro’s deposition on September 23, 2021. Also, on August 23, 2021, the Court approved the parties’ stipulation to continue the pretrial dates with the new deadlines. On October 8, 2021, plaintiffs filed their Motion to Appoint Navarro as Class Representative. On October 29, 2021, we filed our opposition to this motion. On November 15, 2021, plaintiffs filed their reply. On February 8, 2022, the Court held a hearing on plaintiff’s Motion to Appoint Navarro as Class Representative but did not act on the motion. Instead, the court ordered the parties to submit draft orders forNinth Circuit regarding the Court’s consideration. All other dates are stayed pending the Court issuing its order.order granting summary judgment. Plaintiff’s opening brief is due March 22, 2024 and our answering brief is due April 22, 2024. We presently believe the outcome of this litigation will not have a material impact on our financial position, results of operations, or cash flows.
On September 7, 2018, in Jeprece Roussell, et al. v. PBF Consultants, LLC, et al., the plaintiff filed an action in the 19th Judicial District Court for the Parish of East Baton Rouge, alleging numerous causes of action, including wrongful death, premises liability, negligence, and gross negligence against PBF Holding, PBFX Operating Company LLC, Chalmette Refining, two individual employees of the Chalmette refinery (the defendants), two entities, PBF Consultants, LLC and PBF Investments that are Louisiana companies that are not associated with our companies, as well as Clean Harbors, Inc. and Clean Harbors Environmental Services, Inc. (collectively, “Clean Harbors”), Mr. Roussell’s employer. Mr. Roussell was fatally injured on March 31, 2018 while employed by Clean Harbors and performing clay removal work activities inside a clay treating vessel located at the Chalmette refinery. Plaintiff sought unspecified compensatory damages for pain and suffering, past and future mental anguish, impairment, past and future economic loss, attorney’s fees and court costs. On October 8, 2021, we and our insurers reached an agreement in principle to settle this litigation and the related matters. Our portion of the settlement was accrued as of September 30, 2021 and did not have a material impact on our financial position, results of operations, or cash flows. Settlement documents have been executed and payments have been made. A Motion to Dismiss with Prejudice was filed by the parties on February 3, 2022.
On September 7, 2021, MRC filed a Verified Petition for Writ of Mandate and Complaint for Declaratory and Injunctive Relief against the BAAQMD requesting the Court to declare as invalid, unenforceable, and ultra vires the BAAMQD’s July 21, 2021, adoption of amendments to Rule 6-5 Amendment. MRC is also seeking a writ of mandate ordering the BAAQMD to vacate and rescind the adoption of the Rule 6-5 Amendment, as well as appropriate declaratory relief, injunctive relief, and reasonable costs incurred by MRC to bring this Petition/Complaint. In the Petition/Complaint MRC alleges that: its feasible alternative Particulate Matter (“PM”) reduction proposal, thatwhich would achieve significant PM reductions while avoiding the significant costs and environmental impacts of the BAAQMD’s adopted PM limit, was improperly removed from consideration and not presented to the BAAQMD Board when the Rule 6-5 Amendment was adopted with the current PM standard; when adopting the Rule 6-5 Amendment, the BAAQMD flagrantly ignored numerous mandatory requirements of the California Environmental Quality Act (“CEQA”) and the California Health and Safety Code; the BAAQMD’s adoption of the Rule 6-5 Amendment also violated California common law; and these failings render the Rule 6-5 Amendment ultra vires, illegal, and unenforceable. We held mandatory settlement conferences with the BAAQMD on October 27, 2021 and December 15, 2021. On December 9, 2022, MRC filed a Motion to Augment/Correct the Administrative Record regarding various documents that the BAAQMD is currently withholding and do not plan to include in the administrative record. On February 2, 2023, although the Court partially denied our motion concerning documents where the BAAQMD asserted the attorney client privilege, the Court held that CEQA places a heavy burden on the BAAQMD in justifying withholding documents based on the deliberative privilege. At the Court’s request, the parties agreed to a process whereby they jointly identified approximately 50 of the withheld/redacted documents for the Court to review. The Court ruled on those documents on February 22, 2023, ordering full disclosure of two types of documents related to the BAAQMD’s cost-estimates for the rule. In compliance with the Court’s order, in March 2023, the BAAQMD produced additional or less-redacted versions of previously produced documents. On May 26, 2023, MRC filed its opening brief. The BAAQMD’s opposition brief was filed on July 21, 2023. MRC filed its reply brief on August 18, 2023. The bench trial scheduled for December 21, 2023, was rescheduled to February 29, 2024. On February 12, 2024, the parties entered a settlement agreement pursuant to which MRC is dismissing its Petition/Complaint and the BAAQMD has approved MRC’s AEMS, to be validated within the first year after the effective date of the rule. We presently believe the settlement will not have a material impact on our financial position, results of operations, or cash flows.
On August 16, 2023, in Joseph Piscitelli and Lara Zanzucchi v. Martinez Refining Company LLC, our subsidiary MRC was named as a defendant in a class action and representative action complaint which contains allegations of public and private nuisance, trespass, and negligence arising from MRC’s operations. MRC filed its answer to the complaint on October 31, 2023. The initial Court hearing to discuss discovery issues was held on January 2, 2024. At the hearing, the Court raised the issue of mediation and directed the parties to meet and confer and agree to stipulate to a mediation deadline. On January 9, 2024, the parties filed a stipulation agreeing to consider private mediation by September 20, 2024. On January 17, 2024, the Court issued a scheduling order setting the class certification hearing for April 10, 2025. The parties are currently engaged in discovery. We presently believe the outcome will not have a material impact on our financial position, results of operations, or cash flows.
On December 15, 2023, in Alena Cruz and Shannon Payne vs. PBF Energy Inc., et. al, we and our subsidiaries PBF Energy Western Region and MRC were named as defendants in a class action and representative action complaint filed by Alena Cruz and Shannon Payne, and on behalf of all others similarly situated. The complaint contains allegations of Clean Air Act violations, claims for medical and environmental monitoring, liability for ultrahazardous activities, negligence, and public and private nuisance from MRC’s operations. The proposed class is all individuals who reside and/or work in the City of Martinez, including the surrounding communities of Alhambra Valley and Franklin Canyon, as well as El Sobrante, Hercules, Benicia, and Richmond, who have allegedly been exposed to obligationselevated levels of spent catalyst discharged from MRC’s operations during the period November 24, 2022 to purchase RINs.the present. On December 21, 2023, Plaintiffs granted an extension until February 5, 2024 for MRC to respond to the initial complaint. On February 15, 2017, we received notification that EPA records indicated that PBF Holding used potentially invalid RINs that were in fact verified under EPA’s RIN Quality Assurance Program (“QAP”) by an independent auditor as QAP A RINs. Under5, 2024, MRC filed a motion to dismiss on the regulations use of potentially invalid QAP A RINs providespleadings. Plaintiffs’ opposition to the user with an affirmative defense from civil penalties provided certain conditions are met.motion is due February 16, 2024. MRC’s reply to Plaintiffs’ opposition is due February 23, 2024. The motion hearing date is currently scheduled for March 14, 2024. We have assertedpresently believe the affirmative defense and if accepted by EPAoutcome will not be required to replace these RINs and will not be subject to civil penalties under the program. It is reasonably possible that EPA will not accept our defense and may assess penalties in these matters, but any such amount is not expected to have a material impact on our financial position, results of operations, or cash flows.
The federal Comprehensive Environmental Response, Compensation and Liability Act of 1980 (“CERCLA”), also known as “Superfund,” imposes liability, without regard to fault or the legality of the original conduct, on certain classes of persons who are considered to be responsible for the release of a “hazardous substance” into the environment. These persons include the current or former owner or operator of the disposal site or sites where the release occurred and companies that disposed of or arranged for the disposal of the hazardous substances. Under CERCLA, such persons may be subject to joint and several liability for investigation and the costs of cleaning up the hazardous substances that have been released into the environment, for damages to natural resources and for the costs of certain health studies. As discussed more fully above, certain of our sites are subject to these laws and we may be held liable for investigation and remediation costs or claims for natural resource damages. It is not uncommon for neighboring landowners and other third parties to file claims for personal injury and property damage allegedly caused by hazardous substances or other pollutants released into the environment. Analogous state laws impose similar responsibilities and liabilities on responsible parties. In our current normal operations, we have generated waste, some of which falls within the statutory definition of a “hazardous substance” and some of which may have been disposed of at sites that may require cleanup under Superfund.
As the ultimate outcomes of the pending matters discussed above are uncertain, we cannot currently estimate the final amount or timing of their resolution, but any such amount is not expected to have a material impact on our financial position, results of operations, or cash flows, individually or in the aggregate.
ITEM 4. MINE SAFETY DISCLOSURES
None.
PART II
ITEM 5. MARKET FOR REGISTRANT’S COMMON EQUITY, RELATED STOCKHOLDER MATTERS, AND ISSUER PURCHASES OF EQUITY SECURITIES
Market Information
PBF Energy Class A common stock trades on the New York Stock Exchange under the symbol “PBF”. PBF Energy Class B common stock is not publicly-traded.
As of February 10, 20229, 2024 there were 31283 holders of record of PBF Energy Class A common stock and 1512 holders of record of PBF Energy Class B common stock.
Dividend and Distribution Policy
Subject to the following paragraphs, PBF Energy currently intends to continue to pay quarterly cash dividends of approximately $0.25 per share on its Class A common stock.
PBF Energy is a holding company and has no material assets other than its ownership interests of PBF LLC. In order for PBF Energy to pay any dividends, it needs to cause PBF LLC to make distributions to it and the holders of PBF LLC Series A Units, and PBF LLC needs to cause PBF Holding and/or PBFX to make distributions to it, in at least an amount sufficient to cover cash dividends, if any, declared by PBF Energy. Each of PBF Holding and PBFX is generally prohibited under Delaware law from making a distribution to a member to the extent that, at the time of the distribution, after giving effect to the distribution, liabilities of the limited liability company (with certain exceptions) exceed the fair value of its assets. As a result, PBF LLC may be unable to obtain cash from PBF Holding and/or PBFX to satisfy its obligations and make distributions to PBF Energy for dividends, if any, to PBF Energy’s stockholders. If PBF LLC makes such distributions to PBF Energy, the holders of PBF LLC Series A Units will also be entitled to receive pro rata distributions.
The ability of PBF Holding to pay dividends and make distributions to PBF LLC is, and in the future may be, limited by covenants in its Revolving Credit Facility, the 20252030 Senior Secured Notes, the 2028 Senior Notes, the 2025 Senior Notes and other debt instruments. Subject to certain exceptions, the Revolving Credit Facility and the indentures governing the senior notes prohibit PBF Holding from making distributions to PBF LLC if certain defaults exist. In addition, both the indentures and the Revolving Credit Facility contain additional restrictions limiting PBF Holding’s ability to make distributions to PBF LLC.
While it is impossiblePBF Holding made $1,582.8 million in distributions to estimatePBF LLC during the duration or ultimate financial impactyear ended December 31, 2023. In addition, during the year ended December 31, 2023 PBF LLC used $106.6 million to make non-tax distributions to its members, of which $105.8 million was distributed to PBF Energy and the COVID-19 pandemic on our business, our results have been adversely impacted. As partbalance was distributed to PBF LLC’s other members. PBF Energy used this $105.8 million to pay cash dividends of our strategic plan to navigate these current extraordinary and volatile markets, we have suspended PBF Energy’s quarterly dividend on$0.20 per share of its Class A common stock. We will continue to monitorstock on March 16, 2023, May 31, 2023 and evaluate our dividend policy as market conditions developAugust 31, 2023, and our business outlook becomes clearer, however, we do not anticipate that our Boardcash dividends of Directors will declare a dividend in the foreseeable future.$0.25 per share on November 30, 2023.
The declaration, amount and payment of any future dividends on shares of PBF Energy Class A common stock will be at the sole discretion of PBF Energy’s Board of Directors, and we are not obligated under any applicable laws, our governing documents or any contractual agreements with our existing owners or otherwise to declare or pay any dividends or other distributions (other than the obligations of PBF LLC to make tax distributions to its members).
PBF Logistics LP
Due to the uncertainty of the full impact of the COVID-19 pandemic will have on its business, PBFX has decided to reduce their quarterly distribution to its minimum quarterly distribution of $0.30 per unit, which represents a shift in its distribution strategy to build cash flow coverage, de-lever the business and strengthen its financial resources as they continue to pursue potential organic growth projects or strategic acquisition opportunities. PBFX intends to continue to pay at least the minimum quarterly distribution to the holders of its common units, including PBF LLC, of at least $0.30 per unit per quarter, or $1.20 per unit on an annualized basis, to the extent PBFX has sufficient cash from operations after the establishment of cash reserves and the payment of costs and expenses, including reimbursements of expenses to PBFX’s general partner. However, there is no guarantee that PBFX will pay the minimum quarterly distribution or any amount on the units they own in any quarter. Even if PBFX’s cash distribution policy is not modified or revoked, the amount of distributions paid under the policy and the decision to make any distribution is determined by its general partner, taking into consideration the terms of PBFX’s partnership agreement and debt facilities.
During 2020, PBF Energy announced that it had suspended its quarterly dividend of $0.30 per share on its Class A common stock as part of its strategic plan to respond to the impact of the COVID-19 outbreak. As a result, there were no dividends or distributions for the year ended December 31, 2021. There were no tax distributions to PBF LLC’s other members in 2021. PBF Holding made $2.7 million in distributions to PBF LLC during the year ended December 31, 2021. In addition, PBFX made aggregate quarterly distributions of $76.0 million ($1.20 per unit) during the year ended December 31, 2021 to holders of its common units, of which $35.9 million was paid to PBF LLC.
PBF LLC expects to continue to make tax distributions to its members in accordance with its amended and restated limited liability company agreement.
Stock Performance Graph
In accordance with SEC rules, the information contained in the Stock Performance Graph below shall not be deemed to be “soliciting material,” or to be “filed” with the SEC, or subject to the SEC’s Regulation 14A or 14C, other than as provided under Item 201(e) of Regulation S-K, or to the liabilities of Section 18 of the Securities Exchange Act of 1934, as amended, except to the extent that we specifically request that the information be treated as soliciting material or specifically incorporate it by reference into a document filed under the Securities Act of 1933, as amended.
This performanceThe graph andbelow matches the related textual information are based on historical data and are not indicativecumulative 5-year total return of future performance. The following line graph comparesholders of PBF Energy Inc.'s common stock with the cumulative total return on anreturns of the S&P 500 index and a customized peer group of six companies that includes: Delek US Holdings, Inc., HF Sinclair Corporation, Marathon Petroleum Corp, Phillips 66, CVR Energy, Inc. and Valero Energy Corporation. The graph assumes that the value of the investment in our common stock, againstin each index, and in the cumulative total return of the S&P 500 Composite Index and an index of peer companies (that we selected) for the periods commencing December 31, 2016 through December 31, 2021. Our peer group consists(including reinvestment of the following companies that are engaged in refining operations in the U.S.: CVR Energy Inc.dividends), Delek US Holdings Inc., HollyFrontier Corp, Marathon Petroleum Corp, Phillips 66was $100 on 12/31/2018 and Valero Energy Corp.tracks it through 12/31/2023.
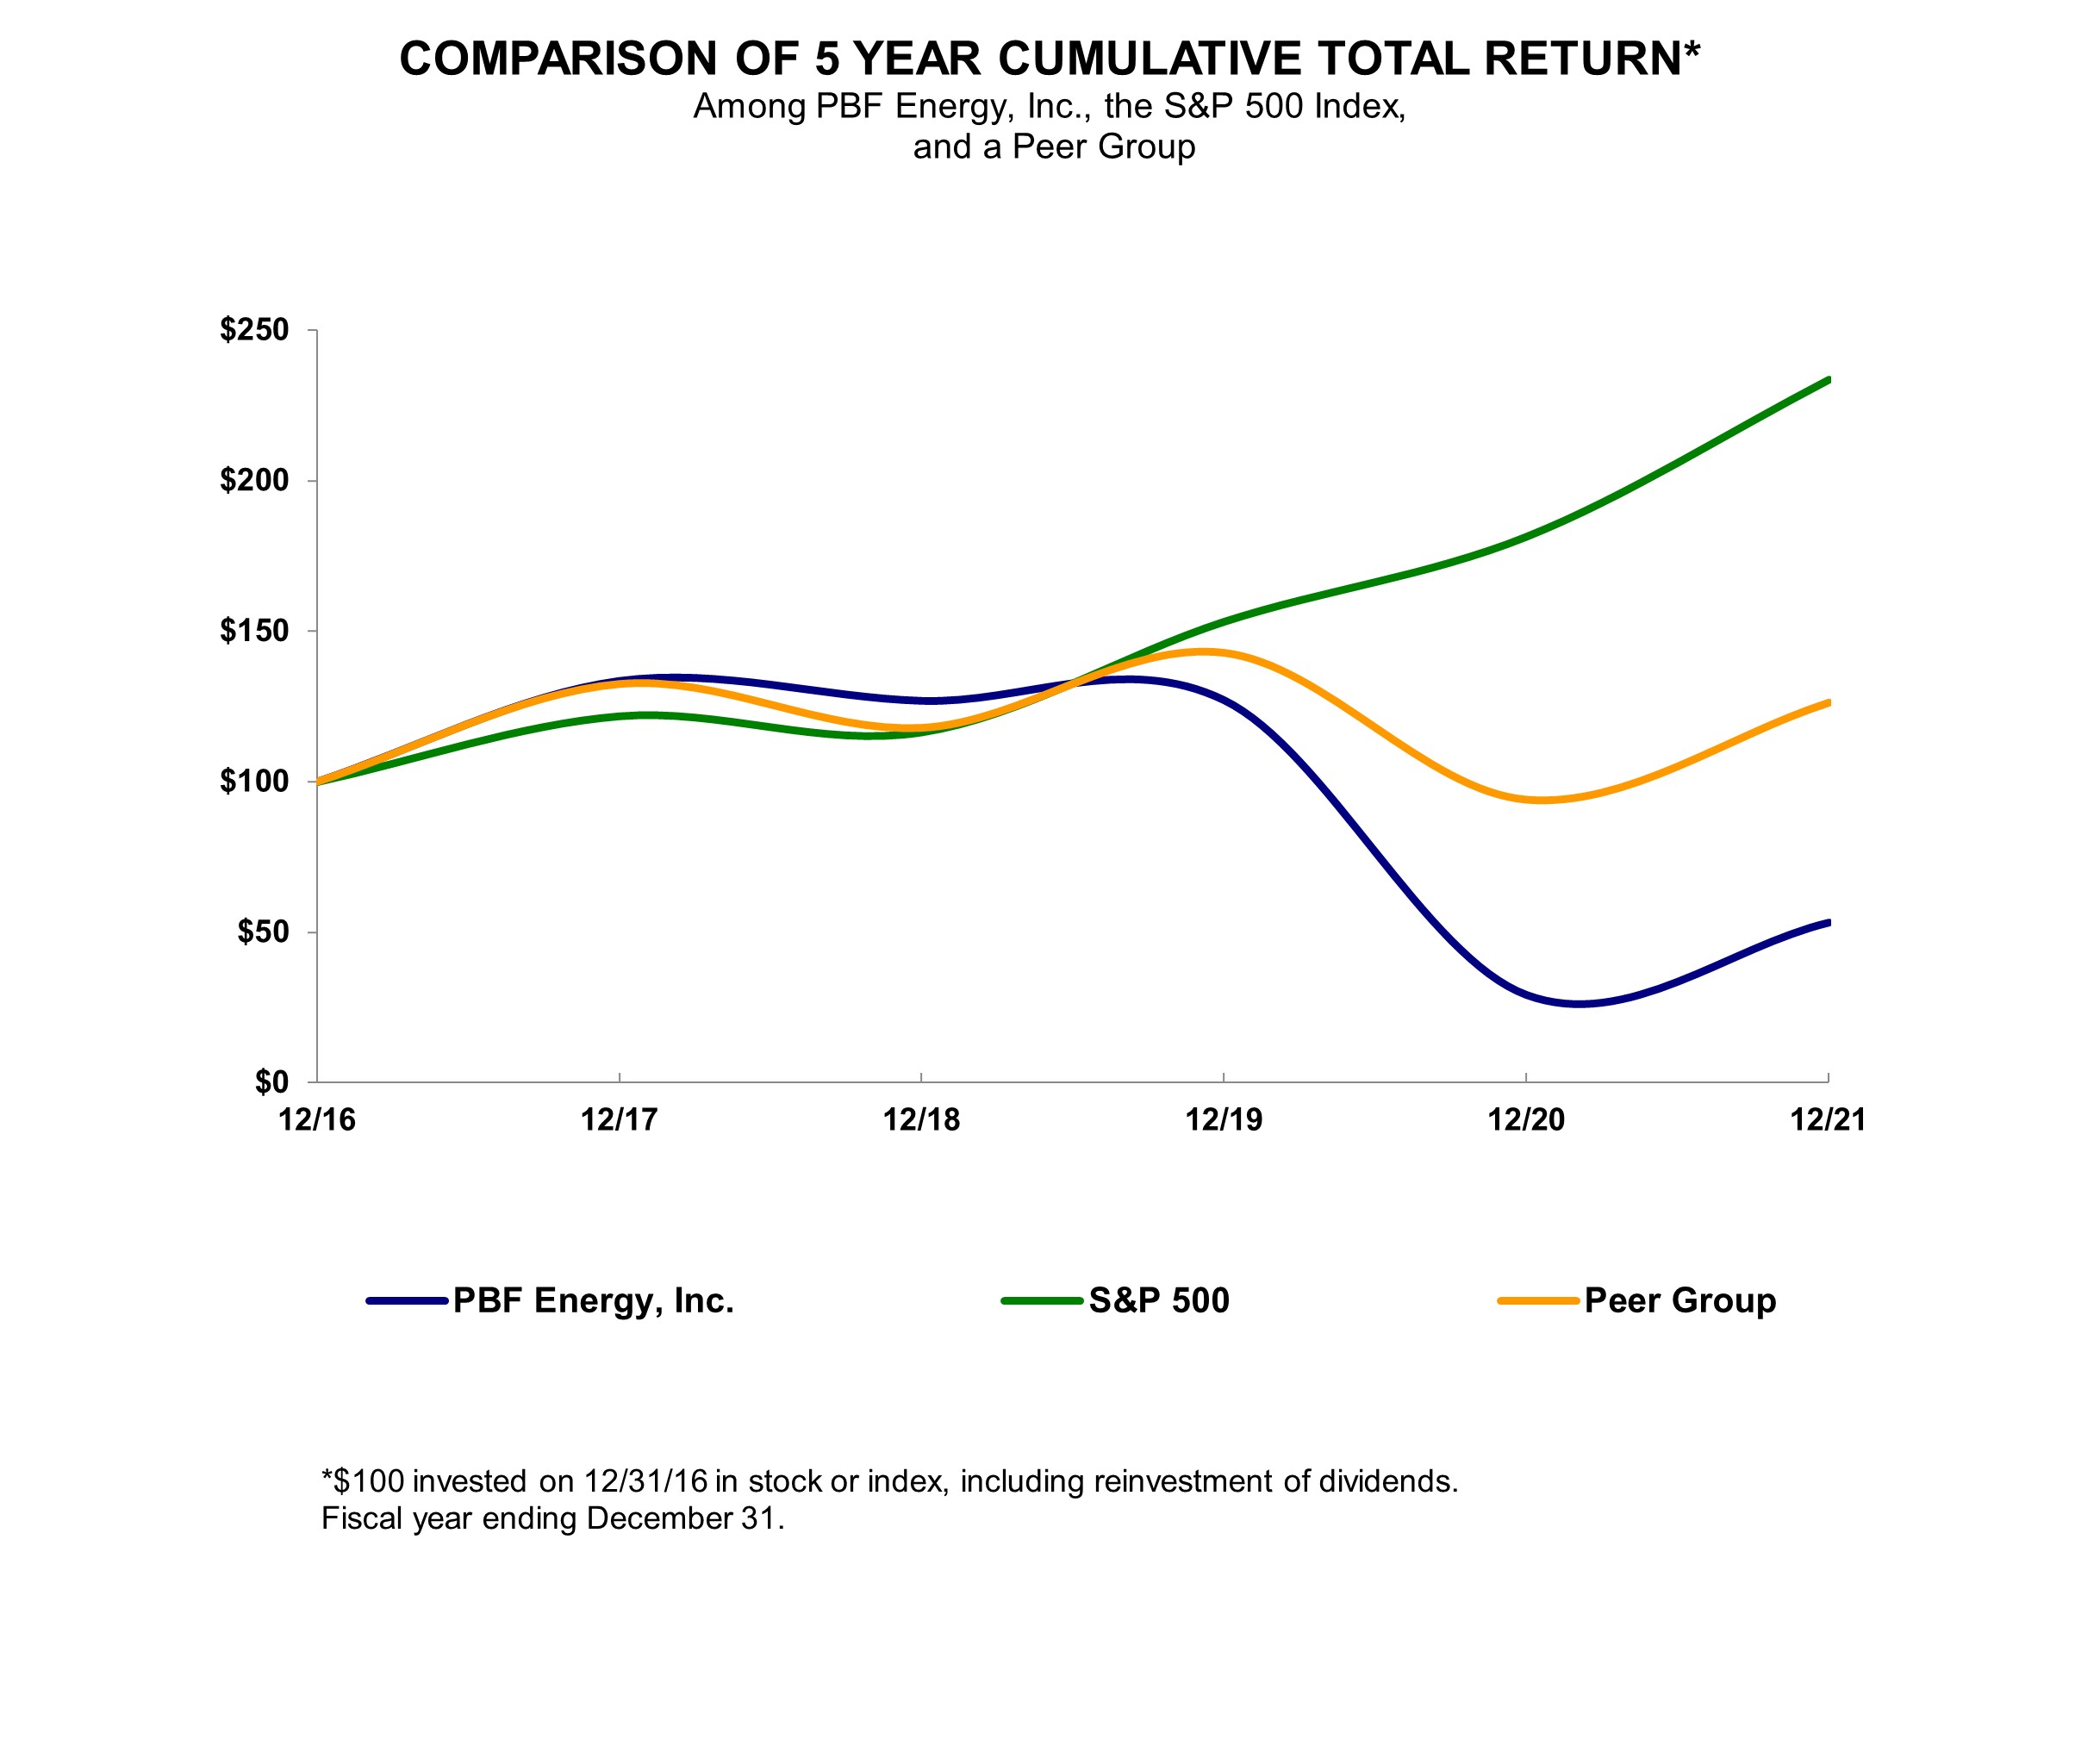

| | 12/31/2016 | | 12/31/2017 | | 12/31/2018 | | 12/31/2019 | | 12/31/2020 | | 12/31/2021 |
| 12/31/2018 | | | 12/31/2018 | | 12/31/2019 | | 12/31/2020 | | 12/31/2021 | | 12/31/2022 | | 12/31/2023 |
| PBF Energy Class A common stock | PBF Energy Class A common stock | $ | 100.00 | | | $ | 133.57 | | | $ | 126.97 | | | $ | 127.18 | | | $ | 29.13 | | | $ | 53.22 | |
| S&P 500 | S&P 500 | 100.00 | | | 121.83 | | | 116.49 | | | 153.17 | | | 181.35 | | | 233.41 | |
| Peer Group | Peer Group | 100.00 | | | 132.54 | | | 117.97 | | | 142.91 | | | 94.07 | | | 126.35 | |
Recent Sales of Unregistered Securities—Exchange of PBF LLC Series A Units for PBF Energy Class A Common Stock
In the fourth quarter of 2021, there were 66,2022023, 53,009 PBF LLC Series A Units were exchanged for 66,20253,009 shares of PBF Energy Class A common stock in transactions exempt from registration under Section 4(a)(2) of the Securities Act. We received no other consideration in connection with any exchanges. No exchanges were made by any of our directors or current executive officers.
The following table summarizes PBF Energy’s Class A common stock share repurchase activity during the fourth quarter of 2023:
| | | | | | | | | | | | | | | | | | | | | | | | | | |
| Period | | Total Number of Shares Purchased (1) | | Average Price Paid per Share (2) | | Total Number of Shares Purchased as Part of Publicly Announced Plan (3) | | Approximately Dollar Value of Shares that May Yet Be Purchased Under Plan (in millions) |
| October 1-31, 2023 | | 993,619 | | | $ | 47.50 | | | 993,619 | | | $ | 413.7 | |
| November 1-30, 2023 | | 856,822 | | | $ | 44.73 | | | 856,822 | | | $ | 375.4 | |
| December 1-31, 2023 | | 1,485,576 | | | $ | 43.26 | | | 1,485,576 | | | $ | 311.1 | |
| Total | | 3,336,017 | | | $ | 44.90 | | | 3,336,017 | | | $ | 311.1 | |
(1) The shares purchased include only those shares that have settled as of the period end date.
(2) Average price per share excludes transaction commissions.
(3) On December 12, 2022, our Board of Directors authorized the repurchase of up to $500.0 million of PBF Energy’s Class A common stock (as amended from time to time, the "Repurchase Program"). On May 3, 2023, our Board of Directors approved an increase in the repurchase authorization amount under the Repurchase Program from $500.0 million to $1.0 billion and extended the program expiration date to December 2025. On February 13, 2024, our Board of Directors approved an increase in the repurchase authorization amount under the Repurchase Program from $1.0 billion to $1.75 billion. These repurchases may be made from time to time through various methods, including open market transactions, block trades, accelerated share repurchases, privately negotiated transactions or otherwise, certain of which have been effected through Rule 10b5-1 plans. The timing and number of shares repurchased depended on a variety of factors, including price, capital availability, legal requirements and economic and market conditions. We were not obligated to purchase any shares under the Repurchase Program, and repurchases could be suspended or discontinued at any time without prior notice.
ITEM 6. [RESERVED]
ITEM 7. MANAGEMENT’S DISCUSSION AND ANALYSIS OF FINANCIAL CONDITION AND RESULTS OF OPERATIONS
The following review of our results of operations and financial condition should be read in conjunction with “Item 1. Business”, “Item 1A. Risk Factors”, “Item 2. Properties”, and “Item 8. Financial Statements and Supplementary Data,” respectively, included in this Annual Report on Form 10-K.
In this Item 7, we discuss results for the years ended December 31, 2023 and 2022 and comparisons of the results for the years ended December 31, 2023 and 2022. Discussions of results for the year ended December 31, 2021 and comparisons of the results for the years ended December 31, 2022 and 2021 can be found in "Management's Discussion and Analysis of Financial Condition and Results of Operations" in Part II, Item 7 of the Company's annual report on Form 10-K for the year ended December 31, 2022.
CAUTIONARY STATEMENT FOR THE PURPOSE OF SAFE HARBOR PROVISIONS OF THE PRIVATE SECURITIES LITIGATION REFORM ACT OF 1995
This Annual Report on Form 10-K contains certain “forward-looking statements,” as defined in the Private Securities Litigation Reform Act of 1995 (“PSLRA”), of expected future developments that involve risks and uncertainties. You can identify forward-looking statements because they contain words such as “believes,” “expects,” “may,” “should,” “seeks,” “approximately,” “intends,” “plans,” “estimates,” “anticipates” or similar expressions that relate to our strategy, plans or intentions. All statements we make relating to our estimated and projected earnings, margins, costs, expenditures, cash flows, growth rates and financial results or to our strategies, objectives, intentions, resources and expectations regarding future industry trends are forward-looking statements made under the safe harbor provisions of the PSLRA except to the extent such statements relate to the operations of a partnership or limited liability company. In addition, we, through our senior management, from time to time make forward-looking public statements concerning our expected future operations and performance and other developments. These forward-looking statements are subject to risks and uncertainties that may change at any time, and, therefore, our actual results may differ materially from those that we expected. We derive many of our forward-looking statements from our operating budgets and forecasts, which are based uponon many detailed assumptions. While we believe that our assumptions are reasonable, we caution that it is very difficult to predict the impact of known factors, and, of course, it is impossible for us to anticipate all factors that could affect our actual results.
Important factors that could cause actual results to differ materially from our expectations, which we refer to as “cautionary statements,” are disclosed under “Item 1A. Risk Factors,” and “Item 7. Management’s Discussion and Analysis of Financial Condition and Results of Operations” and elsewhere in this Annual Report on Form 10-K. All forward-looking information in this Annual Report on Form 10-K and subsequent written and oral forward-looking statements attributable to us, or persons acting on our behalf, are expressly qualified in their entirety by the cautionary statements. Some of the factors that we believe could affect our results include:
•the effect of the COVID-19 pandemic, including resurgences and variants of the virus, as well as related governmental and consumer responses on our business, financial condition and results of operations;
•supply, demand, prices and other market conditions for our products or crude oil, including volatility in commodity prices or constraints arising from federal, state or local governmental actions or environmental and/or social activists that reduce crude oil production or availability in the regions in which we operate our pipelines and facilities;
•rate of inflation and its impacts on supply and demand, pricing, and supply chain disruption;
•the effects related to, or resulting from, geopolitical conflict around the world, including Russia's military action in Ukraine, the outbreak of armed hostilities in the middle east and disruptions in international shipping resulting from recent attacks by armed groups on cargo ships in the Red Sea, including the imposition of additional sanctions and export controls, the potential expansion of such conflicts to other nations or regions, as well as the broader impacts to financial markets and the global macroeconomic and geopolitical environment;
•the effectiveness of our crude oil sourcing strategies, including our crude by rail strategy and related commitments;
•our obligation to buy RINs and market risks related to the volatility in the price of RINs required to comply with the Renewable Fuel StandardRFS and GHG emission credits required to comply with various GHG emission programs, such as AB 32;
•our ability to operate our businesses efficiently, manage capital expenditures and costs (including general and administrative expenses) and generate earnings and cash flow;
•our expectations with respect to our capital improvementspending and turnaround projects;
•the impact of current and future laws, rulings and governmental regulations, including restrictions on the exploration and/or production of crude oil in the state of California, the implementation of rules and regulations regarding transportation of crude oil by rail or in response to the potential impacts of climate change, decarbonization and future energy transition;transition and public policy in opposition to recent refining industry profits;
•adverse impacts related to legislation by the federal government lifting the restrictions on exporting U.S. crude oil;oil or subjecting us to trade and sanctions laws, which change frequently as a result of foreign policy developments, and which may necessitate changes to our crude oil acquisition activities;
•our ability to targetmanage our costs and execute expense reduction measures and achieve opportunities to improve our liquidity, including continued repurchases of our outstanding debt securities or otherwise further reducing our debt, and/or potential sales of non-operating assets or other real property;expenses;
•political pressure and influence of environmental groups and other stakeholders on decisions and policies related to the refining and processing of crude oil and refined products, and the related adverse impacts from changes in our regulatory environment, such as the effects of compliance with AB 32, or from actions taken by environmental interest groups;
•the risk of cyber-attacks;
•our increased dependence on technology;
• the effects of competition in our markets;
•the possibility that we maymight reduce or not reinstate dividend payments;pay dividends in the future;
•the inability of our subsidiaries to freely pay dividends or make distributions to us;
•our ability to make acquisitions or investments, including in renewable diesel production, and to realize the benefits from such acquisitions or investments;
•our ability to successfully manage the operations of SBR, which owns the Renewable Diesel Facility, together with our partner, Eni;
•liabilities arising from recent acquisitions or investments, that are unforeseen or exceed our expectations;
•our expectations and timing with respect to our acquisition and investment activity and whether such acquisitions and investments are accretive or dilutive to shareholders;
• adverse developments in our relationship with both our key employees and unionized employees;
•our substantial indebtedness, including the impact of potential downgrades to our corporate credit rating secured notes andand/or unsecured notes;
•changes in currency exchange rates, interest rates and capital costs;
•restrictive covenants in our indebtedness that may adversely affect our operational flexibility;
•counterparty credit and performance risk exposure related to our supply and inventory intermediation arrangement;
•termination of our Third Inventory Intermediation Agreement with J. Aron, which is scheduled to expire in December 2024 and could have a material adverse effect on our liquidity, as we would be required to finance our crude oil, intermediate and refined products inventory covered by the agreement. Additionally, we are obligated to repurchase from J. Aron certain J. Aron Products upon termination of the agreement;arrangements, if any;
•payments by PBF Energy to the current and former holders of PBF LLC Series A Units and PBF LLC Series B Units, or their permitted assignees, under PBF Energy’s Tax Receivable Agreement for certain tax benefits we may claim;
•our assumptions regarding payments arising under PBF Energy’s Tax Receivable Agreement and other arrangements relating to our organizational structure are subject to change due to various factors, including, among other factors, the timing of exchanges of PBF LLC Series A Units for shares of PBF Energy Class A common stock as contemplated by the Tax Receivable Agreement, the price of PBF Energy Class A common stock at the time of such exchanges, the extent to which such exchanges are taxable, and the amount and timing of our income; and
•the impact of disruptions to crude or feedstock supply to any of our refineries including disruptions related to PBFXor our Renewable Diesel Facility, or with third-party logistics infrastructure or operations, including pipeline, marine and rail transportation;
•risks associated with the operation of PBFX as a separate, publicly-traded entity;
•potential tax consequences related to our investment in PBFX; and
•any decisions we continue to make with respect to our energy-related logistics assets that may be transferred to PBFX.transportation.
We caution you that the foregoing list of important factors may not contain all of the material factors that are important to you. In addition, in light of these risks and uncertainties, the matters referred to in the forward-looking statements contained in this Annual Report on Form 10-K may not in fact occur. Accordingly, investors should not place undue reliance on those statements.
Our forward-looking statements speak only as of the date of this Annual Report on Form 10-K. Except as required by applicable law, including the securities laws of the United States, we do not intend to update or revise any forward-looking statements. All subsequent written and oral forward-looking statements attributable to us or persons acting on our behalf are expressly qualified in their entirety by the foregoing.
Executive Summary
Our business operations are conducted by PBF LLC and itsour subsidiaries. We own and operate six domestic oil refineries and related assets located in Delaware City, Delaware, Paulsboro, New Jersey, Toledo, Ohio, Chalmette, Louisiana, Torrance, California, and Martinez, California. Based on current configuration (subsequent toCalifornia, and own a 50% interest in the East Coast Refining Reconfiguration),Renewable Diesel Facility through our SBR equity method investment. Our refineries have a combined processing capacity, known as throughput, of approximately 1,000,000 bpd, and a weighted-average Nelson Complexity Index of 13.212.7 based on current operating conditions. The complexity and throughput capacity of our refineries are subject to change dependent upon configuration changes we make to respond to market conditions, as well as a result of investments made to improve our facilities and maintain compliance with environmental and governmental regulations. We operate in two reportable business segments: Refining and Logistics. Our six oil refineries are all engaged in the refining of crude oil and other feedstocks into petroleum products, and are aggregated intorepresent the Refining segment. PBFX operates certain logistical assets such as crude oil and refined products terminals, pipelines, and storage facilities, which are aggregated intorepresent the Logistics segment.
Factors Affecting Comparability
Our results over the past three years have been affected by the following events, the understanding of which will aid in assessing the comparability of our period to period financial performance and financial condition.
COVID-19Debt and Market DevelopmentsCredit Facilities
PBF Holding Revolving Credit Facility
On August 23, 2023, we entered into the Revolving Credit Agreement. The impactRevolving Credit Agreement amended and restated the previously existing revolving credit agreement dated as of May 2, 2018 (as amended from time to time, the “Prior Credit Agreement”). Among other things, the Revolving Credit Agreement extended the Revolving Credit Facility through August 2028 and increased the maximum commitment amount under the facility to $3.5 billion from $2.85 billion. The commitment fees on the unused portion, the interest rate on advances and the fees for letters of credit are generally consistent with the Prior Credit Agreement.
There were no outstanding borrowings under the revolving credit facilities as of December 31, 2023 or December 31, 2022.
PBFX Revolving Credit Facility
On June 20, 2023, we terminated the $500.0 million PBFX senior secured revolving credit facility (the “PBFX Revolving Credit Facility”), which was originally set to mature on July 30, 2023. There were no outstanding borrowings under the PBFX Revolving Credit Facility as of the unprecedented global health and economic crisis sparked bytermination date.
There were no outstanding borrowings on the COVID-19 pandemic was amplified latePBFX Revolving Credit Facility as of December 31, 2022.
Senior Notes
On August 21, 2023, we issued $500.0 million in the quarter ended March 31, 2020 due to movements made by the world’s largest oil producers to increase market share. This created simultaneous shocks in oil supply and demand resulting in an economic challenge to our industry which has not occurred since our formation. This combination resulted in significant demand reduction for our refined products and atypical volatility in oil commodity prices. In 2021, as a resultaggregate principal amount of the lifting or easing2030 Senior Notes. The net proceeds from this offering were approximately $488.8 million after deducting the initial purchasers’ discount and offering expenses. We used the net proceeds, together with cash on hand, to fully redeem the outstanding 7.25% senior unsecured notes due 2025 (the “2025 Senior Notes”), including accrued and unpaid interest, on September 13, 2023.
On September 13, 2023, we exercised our rights under the indenture governing the 2025 Senior Notes to redeem all of restrictions by many governmental authoritiesthe outstanding 2025 Senior Notes at a price of 100% of the aggregate principal amount thereof, plus accrued and unpaid interest through the distributiondate of COVID-19 vaccinesredemption. The aggregate redemption price for all 2025 Senior Notes approximated $664.5 million plus accrued and other protective measures,unpaid interest.
On February 2, 2023, we exercised our rights under the demandindenture governing PBFX’s 6.875% senior notes (the “PBFX 2023 Senior Notes”) to redeem all of the outstanding PBFX 2023 Senior Notes at a price of 100% of the aggregate principal amount thereof, plus accrued and unpaid interest through the date of redemption. The aggregate redemption price for refined products started to recover, consequently improving our refining margins in comparison to the prior year. While our results forPBFX 2023 Senior Notes approximated $525.0 million, inclusive of unamortized premium and deferred financing costs. The redemption was funded using cash on hand.
During the year ended December 31, 20212022, we exercised our rights under the indenture governing the 9.25% senior secured notes due 2025 (the “2025 Senior Secured Notes”) to redeem all of the outstanding 2025 Senior Secured Notes at a price of 104.625% of the aggregate principal amount thereof plus accrued and unpaid interest. The aggregate redemption price for all 2025 Senior Secured Notes approximated $1.3 billion plus accrued and unpaid interest. The difference between the carrying value of the 2025 Senior Secured Notes on the date they were impacted by lower demandredeemed and the amount for refined products, we experienced gradual improvements when compared towhich they were redeemed was $69.9 million and was recorded as a Loss on extinguishment of debt in the Consolidated Statements of Operations.
During the year ended December 31, 20202022, we made a number of open market repurchases of our 2028 Senior Notes and favorable impacts on our revenues, cost of products sold, operating income and liquidity. Although we currently continue to operate our refineries at reduced rates, throughput rates across our refining system have increased2025 Senior Notes that resulted in the currentextinguishment of $24.9 million in principal of the 2028 Senior Notes and $5.0 million in principal of the 2025 Senior Notes. Total cash consideration paid to repurchase the principal amount outstanding of the 2028 Senior Notes and the 2025 Senior Notes, excluding accrued interest, totaled $25.9 million and we recognized a $3.8 million gain on the extinguishment of this debt during the year to correlate with the gradual increases in demand.
Debt and Credit Facilities
Senior Notesended December 31, 2022.
During the year ended December 31, 2021, we made a number of open market repurchases of our 2028 Senior Notes and our 2025 Senior Notes that resulted in the extinguishment of $173.5 million in principal of the 2028 Senior Notes and $55.5 million in principal of the 2025 Senior Notes. Total cash consideration paid to repurchase the principal amount outstanding of the 2028 Senior Notes and the 2025 Senior Notes, excluding accrued interest, totaled $146.8 million and we recognized a $79.9 million gain on the extinguishment of debt during the year ended December 31, 2021.
On May 13, 2020, we issued $1.0 billion in aggregate principal amount of the initial 2025 Senior Secured Notes. The net proceeds from this offering were approximately $982.9 million after deducting the initial purchasers’ discount and offering expenses. We used the net proceeds for general corporate purposes.
On December 21, 2020, we issued additional $250.0 million, in aggregate principal amount of the 2025 Senior Secured Notes. The net proceeds from this offering were approximately $245.7 million after deducting the initial purchasers’ discount and offering expenses. We used the net proceeds for general corporate purposes.
On January 24, 2020, we issued $1.0 billion in aggregate principal amount of the 2028 Senior Notes. The net proceeds from this offering were approximately $987.0 million after deducting the initial purchasers’ discount and offering expenses. We used $517.5 million of the proceeds to fully redeem our 7.00% senior notes due 2023 (the “2023 Senior Notes”) and the balance to fund a portion of the cash consideration for Martinez Acquisition (as defined below).
On February 14, 2020, we exercised our rights under the indenture governing the 2023 Senior Notes to redeem all of the outstanding 2023 Senior Notes at a price of 103.5% of the aggregate principal amount thereof plus accrued and unpaid interest. The aggregate redemption price for all 2023 Senior Notes approximated $517.5 million plus accrued and unpaid interest. The difference between the carrying value of the 2023 Senior Notes on the date they were redeemed and the amount for which they were redeemed was $22.2 million and has been classified as Loss on extinguishment of debt in the Consolidated Statements of Operations for the year ending December 31, 2020.
Catalyst Financing Obligations
In September and October 2021, we settled certain precious metal financing arrangements, resulting in a reduction to debt of approximately $31.7 million.
On September 25, 2020, we closed on agreements to sell a portion of our precious metals catalyst to certain major commercial banks for approximately $51.9 million and subsequently leased the catalyst back. The precious metals financing arrangements cover a portion of the catalyst used in our East Coast Refining System, Martinez and Toledo refineries.
The volumes of the precious metal catalyst and the interest rates are fixed over the term of each financing arrangement. We are obligated to repurchase the precious metals catalyst at fair market value upon expiration of these leases. For all leases not renewed at maturity, we have the ability and intent to finance such debt through availability under our revolving credit facilities.
PBF Holding Revolving Credit Facility
During the year ended December 31, 2020,2023, we used advances undersettled our Revolving Credit Facility to fundremaining outstanding precious metal financing arrangement, which represented a portionreduction of the Martinez Acquisition (as defined below) and for other general corporate purposes. The outstanding borrowings under the Revolving Credit Facility asdebt of December 31, 2021 and December 31, 2020 were $900.0approximately $3.1 million.
PBFX Revolving Credit Facility
During the yearyears ended December 31, 2021 and December 31, 2020, PBFX made net repayments2022, we settled certain of $100.0 million and $83.0 million on the PBFX Revolving Credit Facility. The outstanding borrowings under the PBFX Revolving Credit Facility were $100.0 million asour precious metals financing arrangements, resulting in reductions of December 31, 2021.debt of approximately $56.2 million.
Refer to “Note 109 - Credit Facilities and Debt” of our Notes to Consolidated Financial Statements, for further information.
Inventory Intermediation Agreement
Prior to 2023, PBF Holding and its subsidiaries, the PBF Entities, entered into the Third Inventory Intermediation Agreement with J. Aron. Pursuant to the Third Inventory Intermediation Agreement, J. Aron purchased and held title to the J. Aron Products purchased or produced by the Refineries and delivered into the Storage Tanks. The J. Aron Products were sold back to us as the J. Aron Products were discharged out of the Storage Tanks.
On June 28, 2023, the PBF Entities entered into a second amendment to the Third Inventory Intermediation Agreement to amend certain provisions in order to allow for the early termination of the Third Inventory Intermediation Agreement effective as of July 31, 2023. In conjunction with this early termination, we made a payment of $268.0 million for the inventory previously held by J. Aron, inclusive of $13.5 million of related costs associated with exiting the agreement.
Renewable Diesel Facility
On June 27, 2023, we closed on the jointly held investment in SBR. In connection with this investment, we contributed the SBR business, with an estimated fair value of $1.69 billion, excluding working capital. Eni contributed $845.6 million in cash, which consisted of $431.0 million of cash distributed to us at close and an additional $414.6 million of cash contributed after the commercial start up of the pre-treatment unit in July 2023. During the year ended December 31, 2023, we recorded a gain of $925.1 million resulting from the difference between the fair value of the consideration received, including our 50% noncontrolling interest, and the carrying value of the related assets contributed.
Share Repurchase Program
On December 12, 2022, our Board of Directors authorized the Repurchase Program. On May 3, 2023, our Board of Directors approved an increase in the repurchase authorization amount under the Repurchase Program from $500.0 million to $1.0 billion and extended the program expiration date to December 2025. On February 13, 2024, our Board of Directors approved an increase in the repurchase authorization amount under the Repurchase Program from $1.0 billion to $1.75 billion. During the year ended December 31, 2023, we purchased 12,367,073 shares of PBF Energy's Class A common stock for $532.5 million, inclusive of commissions paid, through open market transactions. During the year ended December 31, 2022, we purchased 4,192,555 shares of PBF Energy's Class A common stock for $156.4 million, inclusive of commissions paid, through open market transactions.
Land Sales
During the year ended December 31, 2023, we closed on a third-party sale of a parcel of real property acquired as part of the Torrance Refinery, but not part of the refinery itself. The sale resulted in a gain of approximately $1.7 million, included within Gain on sale of assets in the Consolidated Statements of Operations.
On December 20, 2021, PBFX closed on a third-party sale of real property at the refined products terminals in the greater Philadelphia area (“East Coast Terminals”). The sale resulted in a gain of approximately $2.8 million in the fourth quarter of 2021, included within Gain on sale of assets in the Consolidated Statements of Operations.
Merger Transaction
On DecemberNovember 30, 20202022, PBF Energy, PBF LLC, PBFX Holdings Inc., a Delaware corporation and August 1, 2019, wewholly-owned subsidiary of PBF LLC (“PBFX Holdings”), Riverlands Merger Sub LLC, a Delaware limited liability company and wholly owned subsidiary of PBF LLC, PBFX, and PBF Logistics GP LLC closed on third-party sales of parcels of real propertya definitive agreement (the “Merger Agreement”) pursuant to which PBF Energy and PBF LLC acquired as partall of the Torrance refinery, butpublicly held common units in PBFX representing limited partner interests in the master limited partnership not partalready owned by certain wholly-owned subsidiaries of PBF Energy and its affiliates (the “Merger Transaction”). Subsequent to closing on the Merger Transaction, PBFX became an indirect wholly-owned subsidiary of PBF Energy and PBF LLC.
At the effective time of the refinery itself. The salesclosing of the Merger Transaction, pursuant to the terms of the Merger Agreement, each PBFX Public Common Unit was converted into the right to receive: (i) 0.270 of a share of Class A Common Stock, par value $0.001 per share, of PBF Energy, (ii) $9.25 in cash, without interest and (iii) any cash in lieu of fractional shares of PBF Energy Common Stock to which the holder thereof became entitled upon surrender of such PBFX Public Common Units in accordance with the Merger Agreement. Such Merger Agreement consideration totaled $303.7 million in cash and resulted in gainsthe issuance of approximately $8.1 million8,864,684 shares of PBF Energy Class A common stock. The PBFX Common Units owned by PBF LLC and $33.1 millionPBFX Holdings and the non-economic general partner interest remain outstanding and were unaffected by the Merger Transaction. There was no change in ownership of the fourth quarter of 2020 and third quarter of 2019, respectively, included within Gain on sale of assets in the Consolidated Statements of Operations.non-economic general partner interest.
East Coast Refining Reconfiguration
On December 31, 2020,In 2022, we completed the East Coast Refining Reconfiguration. As part of the reconfiguration process, we temporarily idled certain of our majorrestarted several processing units at the Paulsboro refinery, resultingthat were temporarily idled in lower overall throughput and inventory levels in addition to decreases in capital and operating costs.2020 as part of the East Coast Refining Reconfiguration. Based on this reconfiguration and subsequent restart of several processing units, our East Coast throughput capacity currently approximates 285,000335,000 barrels per day.
Turnaround Costs and Assets under Construction
As of December 31, 2020, we accelerated the recognition of approximately $56.2 million of unamortized deferred turnaround amortization costs associated with these idled units. Additionally, we abandoned certain projects related to assets under construction related to these idled assets, resulting in an impairment charge of approximately $11.9 million in the fourth quarter of 2020.
Capital Project Abandonments
In connection with our ongoing strategic initiative to address the COVID-19 pandemic, including our East Coast Refining Reconfiguration, we reassessed our refinery wide slate of capital projects that were either in process or not yet placed into service as of December 31, 2020. Based on this reassessment and our strategic plan to reduce capital expenditures, we decided to abandon various capital projects across the refining system, resulting in an impairment charge of approximately $79.9 million in the fourth quarter of 2020.
Severance Costs
Following the onset of the COVID-19 pandemic, we implemented a number of cost reduction initiatives to strengthen our financial flexibility and rationalize overhead expenses, including workforce reduction. During the second quarter of 2020, we reduced headcount across our refineries, which resulted in approximately $12.9 million of severance related costs. Additionally, as a result of the East Coast Refining Reconfiguration, we incurred charges in the fourth quarter of 2020 of approximately $11.8 million of severance related expenses. These severance costs were included in general and administrative expenses.
Tax Receivable Agreement
In connection with PBF Energy’sour IPO, PBF Energywe entered into a Tax Receivable Agreement pursuant to which PBF Energy iswe are required to pay the members of PBF LLC or their permitted assignees, who exchange their units for PBF Energy Class A common stock or whose units PBF Energy purchases, approximately 85% of the cash savings in income taxes that PBF Energy realizeswe realize as a result of the increase in the tax basis of itsour interest in PBF LLC, including tax benefits attributable to payments made under the Tax Receivable Agreement. PBF Energy hasWe have recognized, as of December 31, 2021,2023, a liability for the Tax Receivable Agreement of $336.6 million ($338.6 million and $48.3 million as of December 31, 2022 and December 31, 2021, respectively) reflecting theour estimate of the undiscounted amounts that PBF Energy expectswe expect to pay under the agreement, net of the impact of a deferred tax asset valuation allowance recognized in accordance with ASC 740.agreement. As of December 31, 2020, there2023, $43.0 million of the Tax Receivable Agreement obligation was zerorecorded as a Current liability recognizedand represents the amount paid in January 2024 related to the Tax Receivable Agreement.2022 tax year. As future taxable income is recognized, increases in our Tax Receivable Agreement liability may be necessary in conjunction with the revaluation of deferred tax assets. Refer to “Note 1411 - Commitments and Contingencies” and “Note 2118 - Income Taxes” of our Notes to Consolidated Financial Statements for more details.
Early Return of Railcars
In the fourth quarter of 2020 we agreed to voluntarily return a portion of railcars under an operating lease in order to rationalize certain components of our railcar fleet. Under the terms of the lease amendment, we agreed to pay amounts in lieu of satisfaction of return conditions (the “early termination penalty”). As a result, we recognized an expense of $12.5 million within Cost of sales, consisting of charges for the early termination penalty and charges related to the remaining lease payments associated with the railcars identified within the amended lease, all of which were idled and out of service as of December 31, 2020.
Sale of Hydrogen Plants
On April 17, 2020, we closed on the sale of five hydrogen plants to Air Products and Chemicals, Inc. (“Air Products”) in a sale-leaseback transaction for gross cash proceeds of $530.0 million and recognized a gain of $471.1 million. In connection with the sale, we entered into a transition services agreement, which was followed by the execution of long-term supply agreements in August 2020, through which Air Products will exclusively supply hydrogen, steam, carbon dioxide and other products to the Martinez, Torrance and Delaware City refineries for a term of fifteen years.
Martinez Acquisition
We acquired the Martinez refinery and related logistics assets from Shell Oil Products on February 1, 2020 for an aggregate purchase price of $1,253.4 million (the “Martinez Acquisition”), including final working capital of $216.1 million and the obligation to make certain post-closing earn-out payments to Shell Oil Products based on certain earnings thresholds of the Martinez refinery for a period of up to four years (the “Martinez Contingent Consideration”). The transaction was financed through a combination of cash on hand, including proceeds from the 2028 Senior Notes, and borrowings under the Revolving Credit Facility.
The Martinez refinery is located on an 860-acre site in the City of Martinez, 30 miles northeast of San Francisco, California. The refinery is a high-conversion 157,000 bpd, dual-coking facility with a Nelson Complexity Index of 16.1, making it one of the most complex refineries in the United States. The facility is strategically positioned in Northern California and provides for operating and commercial synergies with the Torrance refinery located in Southern California. In addition to refining assets, the Martinez Acquisition includes a number of high-quality onsite logistics assets including a deep-water marine facility, product distribution terminals and refinery crude and product storage facilities with approximately 8.8 million barrels of shell capacity.
Inventory Intermediation Agreement
On October 25, 2021, PBF Holding and its subsidiaries, the PBF Entities, entered into the Third Inventory Intermediation Agreement with J. Aron, pursuant to which the terms of the existing inventory intermediation agreements were amended and restated in their entirety, including, among other things, pricing and an extension of the terms. The Third Inventory Intermediation Agreement extends the term to December 31, 2024, which term may be further extended by mutual consent of the parties to December 31, 2025.
Pursuant to the Third Inventory Intermediation Agreement, J. Aron will continue to purchase and hold title to the J. Aron Products purchased or produced by the Refineries and delivered into the Storage Tanks. Furthermore, J. Aron agrees to sell the J. Aron Products back to PRC and DCR (and, at the election of the PBF Entities, Chalmette Refining) as the J. Aron Products are discharged out of the Storage Tanks. We exercised our right to include the Chalmette refinery under the Third Inventory Intermediation Agreement in November 2021. J. Aron has the right to store the J. Aron Products purchased in tanks under the Third Inventory Intermediation Agreement and will retain these storage rights for the term of the agreement. We intend to utilize the crude oil and will market and sell the refined products independently to third parties.
PBFX Equity Offerings
On April 24, 2019, PBFX entered into subscription agreements to sell an aggregate of 6,585,500 common units to certain institutional investors in a registered direct offering (the “2019 Registered Direct Offering”) for gross proceeds of approximately $135.0 million. The 2019 Registered Direct Offering closed on April 29, 2019.
As of December 31, 2021, PBF LLC held a 47.9% limited partner interest in PBFX with the remaining 52.1% limited partner interest owned by public common unitholders.
PBFX Assets and Transactions
PBFX’s assets consist of various logistics assets (as described in “Item 1. Business”). Apart from business associated with certain third-party acquisitions, PBFX’s revenues are derived from long-term, fee-based commercial agreements with subsidiaries of PBF Holding, which include minimum volume commitments, for receiving, handling, transferring and storing crude oil, refined products and natural gas. These transactions are eliminated by PBF Energy and PBF LLC in consolidation.
Since the inception of PBFX in 2014, PBF LLC and PBFX have entered into a series of drop-down transactions. Such transactions and third-party acquisitions made by PBFX occurring in the three years ended December 31, 2021 are discussed below.
TVPC Acquisition
On April 24, 2019, PBFX entered into a contribution agreement with PBF LLC, pursuant to which PBF LLC contributed to PBFX all of the issued and outstanding limited liability company interests of TVP Holding Company LLC (“TVP Holding”) for total consideration of $200.0 million (the “TVPC Acquisition”). Prior to the TVPC Acquisition, TVP Holding owned a 50% membership interest in Torrance Valley Pipeline Company LLC (“TVPC”). Subsequent to the closing of the TVPC Acquisition on May 31, 2019, PBFX owns 100% of the membership interests in TVPC. The transaction was financed through a combination of proceeds from the 2019 Registered Direct Offering and borrowings under the PBFX Revolving Credit Facility.
PBFX IDR Restructuring Agreement
On February 28, 2019, PBFX closed on the transaction contemplated by the equity restructuring agreement (the “IDR Restructuring Agreement”) with PBF LLC and PBF GP, pursuant to which PBFX’s IDRs held by PBF LLC were canceled and converted into 10,000,000 newly issued PBFX common units. Subsequent to the closing of the IDR Restructuring Agreement, no distributions were made to PBF LLC with respect to the IDRs and the newly issued PBFX common units are entitled to normal distributions by PBFX.
Renewable FuelsFuel Standard
We are subject to obligations to purchase RINs required to comply with the Renewable Fuels Standard.RFS. Our overall RINs obligation is based on a percentage of domestic shipments of on-road fuels as established by EPA. To the degree we are unable to blend the required amount of biofuels to satisfy our RINs obligation, RINs must be purchased on the open market to avoid penalties and fines. We record our RINs obligation on a net basis in Accrued expenses when our RINs liability is greater than the amount of RINs earned and purchased in a given period and in Prepaid and other current assets when the amount of RINs earned and purchased is greater than the RINs liability. We incurred approximately $726.0$762.3 million in RINs costs during the year ended December 31, 20212023 as compared to $326.4$1,225.5 million and $122.7$726.0 million during the years ended December 31, 20202022 and 2019,2021, respectively. The fluctuations in RINs costs are due primarily to volatility in prices for ethanol-linked RINs and increaseschanges in our production of on-road transportation fuels since 2012.fuels. Our RINs purchase obligation is dependent on our actual shipment of on-road transportation fuels domestically and the amount of blending achieved.
Factors Affecting Operating Results
Overview
Our earnings and cash flows from operations are primarily affected by the relationship between refined product prices and the prices for crude oil and other feedstocks. The cost to acquire crude oil and other feedstocks and the price of refined products ultimately sold depends on numerous factors beyond our control, including the supply of, and demand for, crude oil, gasoline, diesel and other refined products, which, in turn, depend on, among other factors, changes in global and regional economies, weather conditions, global and regional political affairs, production levels, the availability of imports, the marketing of competitive fuels, pipeline capacity, prevailing exchange rates and the extent of government regulation. Our revenue and income from operations fluctuate significantly with movements in industry refined product prices, our materials cost fluctuate significantly with movements in crude oil prices and our other operating expenses fluctuate with movements in the price of energy to meet the power needs of our refineries. In addition, the effect of changes in crude oil prices on our operating results is influenced by how the prices of refined products adjust to reflect such changes.
Crude oil and other feedstock costs and the prices of refined products have historically been subject to wide fluctuation. Expansion and upgrading of existing facilities and installation of additional refinery distillation or conversion capacity, price volatility, governmental regulations, international political and economic developments and other factors beyond our control are likely to continue to play an important role in refining industry economics. These factors can impact, among other things, the level of inventories in the market, resulting in price volatility and a reduction or increase in product margins. Moreover, the industry typically experiences seasonal fluctuations in demand for refined products, such as for gasoline and diesel, during the summer driving season and for home heating oil during the winter.
Benchmark Refining Margins
In assessing our operating performance, we compare the refining margins (revenue less materials cost) of each of our refineries against a specific benchmark industry refining margin based on crack spreads. Benchmark refining margins take into account both crude and refined product prices. When these prices are combined in a formula they provide a single value—a gross margin per barrel—that, when multiplied by throughput, provides an approximation of the gross margin generated by refining activities.
The performance of our East Coast refineries generally follows the Dated Brent (NYH) 2-1-1 benchmark refining margin. Our Toledo refinery generally follows the WTI (Chicago) 4-3-1 benchmark refining margin. Our Chalmette refinery generally follows the LLS (Gulf Coast) 2-1-1 benchmark refining margin. Our Torrance refinery generally follows the ANS (West Coast) 4-3-1 benchmark refining margin. Our Martinez refinery generally follows the ANS (West Coast) 3-2-1 benchmark refining margin.
While the benchmark refinery margins presented below under “Results of Operations—Market Indicators” are representative of the results of our refineries, each refinery’s realized gross margin on a per barrel basis will differ from the benchmark due to a variety of factors affecting the performance of the relevant refinery to its corresponding benchmark. These factors include the refinery’s actual type of crude oil throughput, product yield differentials and any other factors not reflected in the benchmark refining margins, such as transportation costs, storage costs, credit fees, fuel consumed during production and any product premiums or discounts, as well as inventory fluctuations, timing of crude oil and other feedstock purchases, a rising or declining crude and product pricing environment and commodity price management activities. As discussed in more detail below, each of our refineries, depending on market conditions, has certain feedstock-cost and product-value advantages and disadvantages as compared to the refinery’s relevant benchmark.
Credit Risk Management
Credit risk refers to the risk that a counterparty will default on its contractual obligations resulting in financial loss to us. Our exposure to credit risk is reflected in the carrying amount of the receivables that are presented in our Consolidated Balance Sheets. To minimize credit risk, all customers are subject to extensive credit verification procedures and extensions of credit above defined thresholds are to be approved by the senior management. Our intention is to trade only with recognized creditworthy third parties. In addition, receivable balances are monitored on an ongoing basis. We also limit the risk of bad debts by obtaining security such as guarantees or letters of credit.
We continually monitor our market risk exposure including the impact andfor market developments related to the COVID-19 pandemic and the related governmental and consumer responses which have introducedthat could introduce significant volatility in the financial markets.
Other Factors
We currently source our crude oil for our refineries on a global basis through a combination of market purchases and short-term purchase contracts, and through our crude oil supply agreements. We believe purchases based on market pricing has given us flexibility in obtaining crude oil at lower prices and on a more accurate “as needed” basis. Since our East Coast refineries access their crude slates from the Delaware River via ship or barge and through our rail facilities at Delaware City, these refineries have the flexibility to purchase crude oils from the Mid-Continent and Western Canada, as well as a number of different countries. We have not sourced crude oil under our crude supply arrangement with Petróleos de Venezuela S.A. (“PDVSA”) since 2017 as PDVSA has suspended deliveries due to our inability to agree to mutually acceptable payment terms and because of U.S. government sanctions against PDVSA.
Currently, crude oil delivered by rail is consumed at our East Coast refineries. The Delaware City rail unloading facilities, and the East Coast Storage Assets, allow our East Coast refineries to source WTI-based crude oils from Western Canada and the Mid-Continent, which we believe, at times, may provide cost advantages versus traditional Brent-based international crude oils. In support of this rail strategy, we have at times entered into agreements to lease or purchase crude railcars. Certain of these railcars were subsequently sold to a third-party, which has leased the railcars back to us for periods of between four and seven years. In subsequent periods, we have sold or returned railcars to optimize our railcar portfolio. Our railcar fleet at times, provides transportation flexibility within our crude oil sourcing strategy that allows our East Coast refineries to process cost advantaged crude from Canada and the Mid-Continent.
Our operating cost structure is also important to our profitability. Major operating costs include costs relating to employees and contract labor, energy, maintenance and environmental compliance, and emission control regulations, including the cost of RINs required for compliance with the Renewable Fuels Standard.RFS. The predominant variable cost is energy, in particular, the price of utilities, natural gas and electricity.
Our operating results are also affected by the reliability of our refinery operations. Unplanned downtime of our refinery assets generally results in lost margin opportunity and increased maintenance expense. The financial impact of planned downtime, such as major turnaround maintenance, is managed through a planning process that considers such things as the margin environment, the availability of resources to perform the needed maintenance and feed logistics, whereas unplanned downtime does not afford us this opportunity.
Furthermore, during 2020 our operating results were negatively impacted by the ongoing COVID-19 pandemic which has caused a significant decline in the demand for our refined products and a decrease in the prices for crude oil and refined products, both of which have negatively impacted our revenues, cost of sales and operating income.
Refinery-Specific Information
The following section includes refinery-specific information related to our operations, crude oil differentials, ancillary costs, and local premiums and discounts.
East Coast Refining System (Delaware City and Paulsboro Refineries). The benchmark refining margin for the East Coast Refining System is calculated by assuming that two barrels of Dated Brent crude oil are converted into one barrel of gasoline and one barrel of diesel. We calculate this benchmark using the NYH market value of reformulated blendstock for oxygenate blending (“RBOB”) and ULSD against the market value of Dated Brent and refer to the benchmark as the Dated Brent (NYH) 2-1-1 benchmark refining margin. The East Coast Refining System has a product slate of approximately 44%39% gasoline, 32%35% distillate, 2% high-value Group I lubricants, 2%1% high-value petrochemicals, with the remaining portion of the product slate comprised of lower-value products (4% petroleum coke, 4% LPGs, 9%15% black oil and 3%4% other). For this reason, we believe the Dated Brent (NYH) 2-1-1 is an appropriate benchmark industry refining margin. The majority of East Coast refining revenues are generated off NYH-based market prices.
The East Coast Refining System’s realized gross margin on a per barrel basis is projected to differ from the Dated Brent (NYH) 2-1-1 benchmark refining margin due to the following factors:
•the system processes a slate of primarily medium and heavy sour crude oils, which has constituted approximately 60%50% to 70%75% of total throughput. The remaining throughput consists of sweet crude oil and other feedstocks and blendstocks. In addition, we have the capability to process a significant volume of light, sweet crude oil depending on market conditions. Our total throughput costs have historically priced at a discount to Dated Brent; and
•as a result of the heavy, sour crude slate processed at our East Coast Refining System, we produce lower value products including sulfur, carbon dioxide and petroleum coke. These products are priced at a significant discount to RBOB and ULSD.
•the Paulsboro refinery produces Group I lubricants, which carry a premium sales price to RBOB and ULSD, and the black oil is sold as asphalt, which may be sold at a premium or discount to Dated Brent based on the market.
Toledo Refinery. The benchmark refining margin for the Toledo refinery is calculated by assuming that four barrels of WTI crude oil are converted into three barrels of gasoline, one-half barrel of ULSD and one-half barrel of jet fuel. We calculate this refining margin using the Chicago market values of CBOB and ULSD and the United States Gulf Coast value of jet fuel against the market value of WTI and refer to this benchmark as the WTI (Chicago) 4-3-1 benchmark refining margin. Our Toledo refinery has a product slate of approximately 56%50% gasoline, 30%37% distillate, 5%4% high-value petrochemicals (including nonene, tetramer, benzene, xylene and toluene) with the remaining portion of the product slate comprised of lower-value products (5%(4% LPGs 2%and 5% black oil and 2% other)oil). For this reason, we believe the WTI (Chicago) 4-3-1 is an appropriate benchmark industry refining margin. The majority of Toledo revenues are generated off Chicago-based market prices.
The Toledo refinery’s realized gross margin on a per barrel basis has historically differed from the WTI (Chicago) 4-3-1 benchmark refining margin due to the following factors:
•the Toledo refinery processes a slate of domestic sweet and Canadian synthetic crude oil. Historically, Toledo’s blended average crude costs have differed from the market value of WTI crude oil;
•the Toledo refinery configuration enables it to produce more barrels of product than throughput which generates a pricing benefit; and
•the Toledo refinery generates a pricing benefit on some of its refined products, primarily its petrochemicals.
Chalmette Refinery. The benchmark refining margin for the Chalmette refinery is calculated by assuming two barrels of LLS crude oil are converted into one barrel of gasoline and one barrel of diesel. We calculate this benchmark using the US Gulf Coast market value of 87 conventional gasoline and ULSD against the market value of LLS and refer to this benchmark as the LLS (Gulf Coast) 2-1-1 benchmark refining margin. Our Chalmette refinery has a product slate of approximately 45%47% gasoline and 33%34% distillate, 2%1% high-value petrochemicals with the remaining portion of the product slate comprised of lower-value products (8%(6% black oil, 5% LPGs, 4%2% petroleum coke, and 3%5% other). For this reason, we believe the LLS (Gulf Coast) 2-1-1 is an appropriate benchmark industry refining margin. The majority of Chalmette revenues are generated off Gulf Coast-based market prices.
The Chalmette refinery’s realized gross margin on a per barrel basis has historically differed from the LLS (Gulf Coast) 2-1-1 benchmark refining margin due to the following factors:
•the Chalmette refinery has generallyrecently processed a slate of primarily mediumlight and heavy sourmedium crude oils, which has historically constitutedrepresents approximately 50%60% to 75% of total throughput. The remaining throughput consists of sweetheavy crude oiloils and other feedstocks and blendstocks; and
•as a result of the heavy, sour crude slate processed at Chalmette, we produce lower-value products including sulfur and petroleum coke. These products are priced at a significant discount to 87 conventional gasoline and ULSD.
The PRL (pre-treater, reformer, light ends) project was completed in 2017 which has increased high-octane, ultra-low sulfur reformate and chemicals production. The new crude oil tank was also commissioned in 2017 and is allowing additional gasoline and diesel exports, reduced RINs compliance costs and lower crude ship demurrage costs.
Additionally, the idled 12,000 barrel per day coker unit was restarted in the fourth quarter of 2019 to increase the refinery’s long-term feedstock flexibility to capture the potential benefit in the price for heavy and high-sulfur feedstocks. The unit has increased the refinery’s total coking capacity to approximately 40,000 barrels per day.
Torrance Refinery. The benchmark refining margin for the Torrance refinery is calculated by assuming that four barrels of ANS crude oil are converted into three barrels of gasoline, one-half barrel of diesel and one-half barrel of jet fuel. We calculate this benchmark using the West Coast Los Angeles market value of California reformulated blendstock for oxygenate blending (“CARBOB”), CARB diesel and jet fuel and refer to the benchmark as the ANS (West Coast) 4-3-1 benchmark refining margin. Our Torrance refinery has a product slate of approximately 63%54% gasoline and 21%29% distillate with the remaining portion of the product slate comprised of lower-value products (3% LPG, 3%(5% black oil, 2% LPG and 10% other). For this reason, we believe the ANS (West Coast) 4-3-1 is an appropriate benchmark industry refining margin. The majority of Torrance revenues are generated off West Coast Los Angeles-based market prices.
The Torrance refinery’s realized gross margin on a per barrel basis has historically differed from the ANS (West Coast) 4-3-1 benchmark refining margin due to the following factors:
•the Torrance refinery has generally processed a slate of primarily heavy sour crude oils, which has historically constituted approximately 80%65% to 90%80% of total throughput. The Torrance crude slate has the lowest API gravity (typically an API)API gravity of less than 20 degrees) of all of our refineries. The remaining throughput consists of other feedstocks and blendstocks; and
•as a result of the heavy, sour crude slate processed at Torrance, we produce lower-value products including petroleum coke and sulfur. These products are priced at a significant discount to gasoline and diesel.
Martinez Refinery. The benchmark refining margin for the Martinez refinery is calculated by assuming that three barrels of ANS crude oil are converted into two barrels of gasoline, one-quarter barrel of diesel and three-quarter barrel of jet fuel. We calculate this benchmark using the West Coast San Francisco market value of CARBOB, CARB diesel and jet fuel and refer to the benchmark as the ANS (West Coast) 3-2-1 benchmark refining margin. Our Martinez refinery has a product slate of approximately 60%57% gasoline and 30%31% distillate with the remaining portion of the product slate comprised of lower-value products (4% black oil petroleum coke, 4% LPG and 2%4% other). For this reason, we believe the ANS (West Coast) 3-2-1 is an appropriate benchmark industry refining margin. The majority of Martinez revenues are generated off West Coast San Francisco-based market prices.
The Martinez refinery’s realized gross margin on a per barrel basis has historically differed from the ANS (West Coast) 4-3-1 benchmark refining margin due to the following factors:
•the Martinez refinery has generally processed a slate of primarily heavy sour crude oils, which has historically constituted approximately 80%45% to 90%70% of total throughput. The remaining throughput consists of other feedstocks and blendstocks; and
•as a result of the heavy, sour crude slate processed at Martinez, we produce lower-value products including petroleum coke and sulfur. These products are priced at a significant discount to gasoline and CARB diesel.
Results of Operations
The tables below reflect our consolidated financial and operating highlights for the years ended December 31, 2021, 20202023, 2022 and 20192021 (amounts in millions, except per share data). Differences between the results of operations of PBF Energy and PBF LLC primarily pertain to income taxes, interest expense and noncontrolling interest as shown below. Earnings per share information applies only to the financial results of PBF Energy. We operate in two reportable business segments: Refining and Logistics. Our oil refineries, excluding the assets ownedoperated by PBFX, are all engaged in the refining of crude oil and other feedstocks into petroleum products, and are aggregated intorepresent the Refining segment. PBFX is a publicly-traded MLPan indirect wholly-owned subsidiary of PBF Energy that operates certain logistics assets such as crude oil and refined products terminals, pipelines and storage facilities. PBFX’s operations are aggregated intorepresent the Logistics segment. We do not separately discuss our results by individual segments as apart from PBFX’s third-party acquisitions, our Logistics segment did not have any significant third-party revenues and a significant portion of its operating results are eliminated in consolidation.
| | PBF Energy | PBF Energy | | Year Ended December 31, | PBF Energy | | Year Ended December 31, |
| | | | 2021 | | 2020 | | 2019 | | | 2023 | | 2022 | | 2021 |
| Revenues | Revenues | | $ | 27,253.4 | | | $ | 15,115.9 | | | $ | 24,508.2 | |
| | Cost and expenses: | Cost and expenses: | |
| Cost and expenses: | |
| Cost and expenses: | |
| Cost of products and other | |
| Cost of products and other | |
| Cost of products and other | Cost of products and other | | 23,826.8 | | | 14,275.6 | | | 21,387.5 | |
| Operating expenses (excluding depreciation and amortization expense as reflected below) | Operating expenses (excluding depreciation and amortization expense as reflected below) | | 2,085.9 | | | 1,918.3 | | | 1,782.3 | |
| Depreciation and amortization expense | Depreciation and amortization expense | | 453.5 | | | 551.7 | | | 425.3 | |
| Cost of sales | Cost of sales | | 26,366.2 | | | 16,745.6 | | | 23,595.1 | |
| General and administrative expenses (excluding depreciation and amortization expense as reflected below) | General and administrative expenses (excluding depreciation and amortization expense as reflected below) | | 247.3 | | | 248.5 | | | 284.0 | |
| Depreciation and amortization expense | Depreciation and amortization expense | | 13.3 | | | 11.3 | | | 10.8 | |
| Change in fair value of contingent consideration | | 32.4 | | | (93.7) | | | (0.8) | |
| Impairment expense | | — | | | 98.8 | | | — | |
| Gain on sale of assets | | (3.0) | | | (477.8) | | | (29.9) | |
| Change in fair value of contingent consideration, net | |
| Equity loss in investee | |
| Gain on formation of SBR equity method investment | |
| | (Gain) loss on sale of assets | |
| (Gain) loss on sale of assets | |
| (Gain) loss on sale of assets | |
| Total cost and expenses | Total cost and expenses | | 26,656.2 | | | 16,532.7 | | | 23,859.2 | |
| | Income (loss) from operations | | 597.2 | | | (1,416.8) | | | 649.0 | |
| Income from operations | |
| Income from operations | |
| Income from operations | |
| | Other income (expense): | Other income (expense): | |
| Other income (expense): | |
| Other income (expense): | |
| Interest expense, net | |
| Interest expense, net | |
| Interest expense, net | Interest expense, net | | (317.5) | | | (258.2) | | | (159.6) | |
| Change in Tax Receivable Agreement liability | Change in Tax Receivable Agreement liability | | (48.3) | | | 373.5 | | | — | |
| Change in fair value of catalyst obligations | Change in fair value of catalyst obligations | | 8.5 | | | (11.8) | | | (9.7) | |
| Gain (loss) on extinguishment of debt | | 79.9 | | | (22.2) | | | — | |
| (Loss) gain on extinguishment of debt | |
| Other non-service components of net periodic benefit cost | Other non-service components of net periodic benefit cost | | 7.8 | | | 4.3 | | | (0.2) | |
| Income (loss) before income taxes | | 327.6 | | | (1,331.2) | | | 479.5 | |
| Income before income taxes | |
| Income tax expense | Income tax expense | | 12.1 | | | 2.1 | | | 104.3 | |
| Net income (loss) | | 315.5 | | | (1,333.3) | | | 375.2 | |
| Net income | |
| Less: net income attributable to noncontrolling interests | Less: net income attributable to noncontrolling interests | | 84.5 | | | 59.1 | | | 55.8 | |
| Net income (loss) attributable to PBF Energy Inc. stockholders | | $ | 231.0 | | | $ | (1,392.4) | | | $ | 319.4 | |
| Net income attributable to PBF Energy Inc. stockholders | |
| | Consolidated gross margin | |
| Consolidated gross margin | |
| Consolidated gross margin | Consolidated gross margin | | $ | 887.2 | | | $ | (1,629.7) | | | $ | 913.1 | |
| Gross refining margin (1) | Gross refining margin (1) | | $ | 3,087.7 | | | $ | 496.8 | | | $ | 2,801.2 | |
Gross refining margin (1) | |
Gross refining margin (1) | |
| | Net income available to Class A common stock per share: | Net income available to Class A common stock per share: | |
| Net income available to Class A common stock per share: | |
| Net income available to Class A common stock per share: | |
| Basic | |
| Basic | |
| Basic | Basic | | $ | 1.92 | | | $ | (11.64) | | | $ | 2.66 | |
| Diluted | Diluted | | $ | 1.90 | | | $ | (11.64) | | | $ | 2.64 | |
——————————
(1) See Non-GAAP Financial Measures.
| | | | | | | | | | | | | | | | | | | | |
| PBF LLC | | Year Ended December 31, |
| | 2021 | | 2020 | | 2019 |
| Revenues | | $ | 27,253.4 | | | $ | 15,115.9 | | | $ | 24,508.2 | |
| | | | | | |
| Cost and expenses: | | | | | | |
| Cost of products and other | | 23,826.8 | | | 14,275.6 | | | 21,387.5 | |
| Operating expenses (excluding depreciation and amortization expense as reflected below) | | 2,085.9 | | | 1,918.3 | | | 1,782.3 | |
| Depreciation and amortization expense | | 453.5 | | | 551.7 | | | 425.3 | |
| Cost of sales | | 26,366.2 | | | 16,745.6 | | | 23,595.1 | |
| General and administrative expenses (excluding depreciation and amortization expense as reflected below) | | 245.2 | | | 247.7 | | | 282.3 | |
| Depreciation and amortization expense | | 13.3 | | | 11.3 | | | 10.8 | |
| Change in fair value of contingent consideration | | 32.4 | | | (93.7) | | | (0.8) | |
| Impairment expense | | — | | | 98.8 | | | — | |
| Gain on sale of assets | | (3.0) | | | (477.8) | | | (29.9) | |
| Total cost and expenses | | 26,654.1 | | | 16,531.9 | | | 23,857.5 | |
| | | | | | |
| Income (loss) from operations | | 599.3 | | | (1,416.0) | | | 650.7 | |
| | | | | | |
| Other income (expense): | | | | | | |
| Interest expense, net | | (327.8) | | | (268.5) | | | (169.1) | |
| Change in fair value of catalyst obligations | | 8.5 | | | (11.8) | | | (9.7) | |
| Gain (loss) on extinguishment of debt | | 79.9 | | | (22.2) | | | — | |
| Other non-service components of net periodic benefit cost | | 7.8 | | | 4.3 | | | (0.2) | |
| Income (loss) before income taxes | | 367.7 | | | (1,714.2) | | | 471.7 | |
| Income tax (benefit) expense | | (14.0) | | | 6.1 | | | (8.3) | |
| Net income (loss) | | 381.7 | | | (1,720.3) | | | 480.0 | |
| Less: net income attributable to noncontrolling interests | | 82.1 | | | 76.2 | | | 51.5 | |
| Net income (loss) attributable to PBF Energy Company LLC | | $ | 299.6 | | | $ | (1,796.5) | | | $ | 428.5 | |
Operating Highlights
| | | |
| | | | | Year Ended December 31, | | Year Ended December 31, |
| | | | 2021 | | 2020 | | 2019 | |
| Key Operating Information | Key Operating Information | | | | | | | |
| Key Operating Information | |
| Key Operating Information | |
| Production (bpd in thousands) | |
| Production (bpd in thousands) | |
| Production (bpd in thousands) | Production (bpd in thousands) | | 852.2 | | | 737.1 | | | 825.2 | | |
| Crude oil and feedstocks throughput (bpd in thousands) | Crude oil and feedstocks throughput (bpd in thousands) | | 834.5 | | | 727.7 | | | 823.1 | | |
| Crude oil and feedstocks throughput (bpd in thousands) | |
| Crude oil and feedstocks throughput (bpd in thousands) | |
| Total crude oil and feedstocks throughput (millions of barrels) | |
| Total crude oil and feedstocks throughput (millions of barrels) | |
| Total crude oil and feedstocks throughput (millions of barrels) | Total crude oil and feedstocks throughput (millions of barrels) | | 304.6 | | | 266.3 | | | 300.4 | | |
| Consolidated gross margin per barrel of throughput | Consolidated gross margin per barrel of throughput | | $ | 2.91 | | | $ | (6.12) | | | $ | 3.04 | | |
| Consolidated gross margin per barrel of throughput | |
| Consolidated gross margin per barrel of throughput | |
Gross refining margin, excluding special items, per barrel of throughput (1) | Gross refining margin, excluding special items, per barrel of throughput (1) | | $ | 7.94 | | | $ | 3.23 | | | $ | 8.51 | | |
Gross refining margin, excluding special items, per barrel of throughput (1) | |
Gross refining margin, excluding special items, per barrel of throughput (1) | |
| Refinery operating expense, per barrel of throughput | |
| Refinery operating expense, per barrel of throughput | |
| Refinery operating expense, per barrel of throughput | Refinery operating expense, per barrel of throughput | | $ | 6.56 | | | $ | 6.89 | | | $ | 5.61 | | |
| Crude and feedstocks (% of total throughput) (2) | Crude and feedstocks (% of total throughput) (2) | | |
| Crude and feedstocks (% of total throughput) (2) | |
| Crude and feedstocks (% of total throughput) (2) | |
| Heavy | |
| Heavy | |
| Heavy | Heavy | | 34 | % | | 42 | % | | 32 | % | |
| Medium | Medium | | 31 | % | | 26 | % | | 28 | % | |
| Medium | |
| Medium | |
| Light | |
| Light | |
| Light | Light | | 18 | % | | 17 | % | | 26 | % | |
| Other feedstocks and blends | Other feedstocks and blends | | 17 | % | | 15 | % | | 14 | % | |
| Other feedstocks and blends | |
| Other feedstocks and blends | |
| Total throughput | |
| Total throughput | |
| Total throughput | Total throughput | | 100 | % | | 100 | % | | 100 | % | |
| | Yield (% of total throughput) | Yield (% of total throughput) | | |
| | Yield (% of total throughput) | |
| | Yield (% of total throughput) | |
| Gasoline and gasoline blendstocks | |
| Gasoline and gasoline blendstocks | |
| Gasoline and gasoline blendstocks | Gasoline and gasoline blendstocks | | 53 | % | | 51 | % | | 49 | % | |
| Distillates and distillate blendstocks | Distillates and distillate blendstocks | | 30 | % | | 30 | % | | 32 | % | |
| Distillates and distillate blendstocks | |
| Distillates and distillate blendstocks | |
| Lubes | |
| Lubes | |
| Lubes | Lubes | | 1 | % | | 1 | % | | 1 | % | |
| Chemicals | Chemicals | | 2 | % | | 1 | % | | 2 | % | |
| Chemicals | |
| Chemicals | |
| Other | |
| Other | |
| Other | Other | | 16 | % | | 18 | % | | 16 | % | |
| Total yield | Total yield | | 102 | % | | 101 | % | | 100 | % | |
| Total yield | |
| Total yield | |
——————————
(1) See Non-GAAP Financial Measures.
(2) We define heavy crude oil as crude oil with an API gravity of less than 24 degrees. We define medium crude oil as crude oil with an API gravity between 24 and 35 degrees. We define light crude oil as crude oil with an API gravity higher than 35 degrees.
The table below summarizes certain market indicators relating to our operating results as reported by Platts, a division of The McGraw-Hill Companies. Effective RIN basket price is recalculated based on information as reported by Argus.
| | | | | Year Ended December 31, | | | Year Ended December 31, |
| | | | 2021 | | 2020 | | 2019 | | | 2023 | | 2022 | | 2021 |
| (dollars per barrel, except as noted) |
| | (dollars per barrel, except as noted) | | | | (dollars per barrel, except as noted) |
| Dated Brent crude oil | Dated Brent crude oil | | $ | 70.89 | | | $ | 41.62 | | | $ | 64.34 | |
| West Texas Intermediate (WTI) crude oil | West Texas Intermediate (WTI) crude oil | | $ | 68.10 | | | $ | 39.25 | | | $ | 57.03 | |
| Light Louisiana Sweet (LLS) crude oil | Light Louisiana Sweet (LLS) crude oil | | $ | 69.59 | | | $ | 41.13 | | | $ | 62.67 | |
| Alaska North Slope (ANS) crude oil | Alaska North Slope (ANS) crude oil | | $ | 70.56 | | | $ | 42.20 | | | $ | 65.00 | |
| Crack Spreads | Crack Spreads | |
| Dated Brent (NYH) 2-1-1 | Dated Brent (NYH) 2-1-1 | | $ | 16.84 | | | $ | 9.11 | | | $ | 12.68 | |
| Dated Brent (NYH) 2-1-1 | |
| Dated Brent (NYH) 2-1-1 | |
| WTI (Chicago) 4-3-1 | WTI (Chicago) 4-3-1 | | $ | 16.34 | | | $ | 6.30 | | | $ | 15.25 | |
| LLS (Gulf Coast) 2-1-1 | LLS (Gulf Coast) 2-1-1 | | $ | 16.03 | | | $ | 7.59 | | | $ | 12.43 | |
| ANS (West Coast-LA) 4-3-1 | ANS (West Coast-LA) 4-3-1 | | $ | 20.10 | | | $ | 11.30 | | | $ | 18.46 | |
| ANS (West Coast-SF) 3-2-1 | ANS (West Coast-SF) 3-2-1 | | $ | 20.55 | | | $ | 9.99 | | | $ | 17.16 | |
| Crude Oil Differentials | Crude Oil Differentials | |
| Dated Brent (foreign) less WTI | |
| Dated Brent (foreign) less WTI | |
| Dated Brent (foreign) less WTI | Dated Brent (foreign) less WTI | | $ | 2.80 | | | $ | 2.37 | | | $ | 7.31 | |
| Dated Brent less Maya (heavy, sour) | Dated Brent less Maya (heavy, sour) | | $ | 6.47 | | | $ | 5.37 | | | $ | 6.76 | |
| Dated Brent less WTS (sour) | Dated Brent less WTS (sour) | | $ | 2.63 | | | $ | 2.33 | | | $ | 8.09 | |
| Dated Brent less ASCI (sour) | Dated Brent less ASCI (sour) | | $ | 3.90 | | | $ | 1.81 | | | $ | 3.73 | |
| WTI less WCS (heavy, sour) | WTI less WCS (heavy, sour) | | $ | 14.19 | | | $ | 10.72 | | | $ | 13.61 | |
| WTI less Bakken (light, sweet) | WTI less Bakken (light, sweet) | | $ | (0.14) | | | $ | 2.41 | | | $ | 0.66 | |
| WTI less Syncrude (light, sweet) | WTI less Syncrude (light, sweet) | | $ | 2.25 | | | $ | 2.13 | | | $ | 0.18 | |
| WTI less LLS (light, sweet) | WTI less LLS (light, sweet) | | $ | (1.50) | | | $ | (1.88) | | | $ | (5.64) | |
| WTI less ANS (light, sweet) | WTI less ANS (light, sweet) | | $ | (2.46) | | | $ | (2.95) | | | $ | (7.97) | |
| Effective RIN basket price | |
| Natural gas (dollars per MMBTU) | Natural gas (dollars per MMBTU) | | $ | 3.73 | | | $ | 2.13 | | | $ | 2.53 | |
|
20212023 Compared to 20202022
Overview— PBF Energy net income was $315.5$2,162.0 million for the year ended December 31, 20212023 compared to net lossincome of $(1,333.3)$2,972.8 million for the year ended December 31, 2020. PBF LLC net income was $381.7 million for the year ended December 31, 2021 compared to net loss of $(1,720.3) million for the year ended December 31, 2020.2022. Net income attributable to PBF Energy stockholders was $231.0$2,140.5 million, or $1.90$16.52 per diluted share, for the year ended December 31, 20212023 ($1.9016.52 per share on a fully-exchanged, fully-diluted basis based on adjusted fully-converted net income, or $(2.50)$11.32 per share on a fully-exchanged, fully-diluted basis based on adjusted fully-converted net lossincome excluding special items, as described below in Non-GAAP Financial Measures) compared to net lossincome attributable to PBF Energy stockholders of $(1,392.4)$2,876.8 million, or $(11.64)$22.84 per diluted share, for the year ended December 31, 20202022 ($(11.64)22.84 per share on a fully-exchanged, fully-diluted basis based on adjusted fully-converted net loss,income, or $(11.78)$23.36 per share on a fully-exchanged, fully-diluted basis based on adjusted fully-converted net lossincome excluding special items, as described below in Non-GAAP Financial Measures). The net income attributable to PBF Energy stockholders represents PBF Energy’s equity interest in PBF LLC’s pre-tax income, less applicable income tax expense. PBF Energy’s weighted-average equity interest in PBF LLC was 99.2% and 99.1%99.3% for both the yearsyear ended December 31, 20212023 and 2020, respectively.2022.
Our results for the year ended December 31, 20212023 were positively impacted by special items consisting of a non-cash, pre-tax LCM inventory adjustmentgain on the formation of approximately $669.6the SBR equity method investment of $925.1 million, or $496.2$684.6 million net of tax, a pre-tax gain on the extinguishmentchange in fair value of debtcontingent consideration of $45.8 million, or $33.9 million net of tax, related to changes in our earn-out obligation associated with the repurchaseacquisition of a portionthe Martinez refinery and logistic assets (the “Martinez Contingent Consideration”), pre-tax benefit associated with the change in the Tax Receivable Agreement liability of our 2028 Senior Notes and 2025 Senior Notes of $79.9$2.0 million, or $59.2$1.5 million net of tax and a gain on the sale of certain PBFXa parcel of land at our Torrance refinery of $2.8$1.7 million or $2.1$1.3 million net of tax, partially offset by our share of the SBR LCM inventory reserve of $38.7 million, or $28.6 million net of tax, a $5.7 million, or $4.2 million net of tax, loss on extinguishment of debt related to the redemption of our 2025 Senior Notes and a $37.4 million tax benefitthe amendment and restatement of the Revolving Credit Facility, and exit costs associated with the remeasurementearly termination of certain deferred tax assets, offsetthe Third Inventory Intermediation Agreement of $13.5 million, or $10.0 million, net of tax. Our results for the year ended December 31, 2022 were negatively impacted by special items consisting of pre-tax charges associated with the change in the Tax Receivable Agreement liability of $290.3 million, or $215.1 million net of tax, a net loss on the extinguishment of debt mainly associated with the redemption of our 2025 Senior Secured Notes of $66.1 million, or $49.0 million net of tax, and net changes in fair value of contingent consideration of $48.3 million, or $35.8 million net of tax, andpartially offset by a change in fair value of the Martinez Contingent Consideration and the contingent consideration related to the PBFX acquisition of the East Coast Storage Assets from Crown Point International, LLC (“Crown Point”) (the “East Coast Storage Assets Acquisition”) of $32.4$233.8 million or $24.0 million net of tax. Our results for the year ended December 31, 2020 were positively impacted by special items consisting of a gain on the sale of hydrogen plants of $471.1 million, or $345.8 million net of tax a pre-tax gain on the sale of land at our Torrance refinery of $8.1 million, or $5.9 million net of tax, a change in fair value of the Martinez Contingent Consideration and the contingent consideration associated with the East Coast Storage Asset Acquisition (the “PBFX Contingent Consideration”) of $93.7 million, or $68.8 million net of tax and a pre-tax change in the Tax Receivable Agreement liability of $373.5 million, or $274.1 million net of tax. Our results for the year ended December 31, 2020 were negatively impacted by special items consisting of a non-cash, pre-tax LCM inventory adjustment of approximately $268.0 million, or $196.7 million net of tax, pre-tax, debt extinguishment costs associated with the early redemption of the 2023 Senior Notes of $22.2 million, or $16.3 million net of tax, severance costs related to reductions in workforce of $24.7 million, or $18.1 million net of tax, impairment expense of $98.8 million or $72.5 million net of tax, related to the write-down of certain assets and project abandonments, early return of certain leased railcars of $12.5 million or $9.2 million net of tax, accelerated turnaround amortization costs of $56.2 million or $41.3 million net of tax, a LIFO inventory decrement of $83.0 million or $60.9 million net of tax, reconfiguration charges of $5.3 million or $3.9 million net of tax and $259.1 million of tax expensebenefit associated with the remeasurement of certain deferred tax assets.
Excluding the impact of these special items, our results were positively impacted by increases in the demand for our refined products and improved margins for refined product, which have positively impacted our revenues, cost of products sold and operating income. Whenwhen comparing theour results to the year ended December 31, 2020, demand for2022, we experienced an overall decrease in our products has startedrefining margins due to recover, evidenced by higher throughput volumesunfavorable movements in crack spreads and barrels sold at the majority of the refineries,crude oil differentials, as well as higher refining margins. Additionally,planned and unplanned maintenance, primarily at our results forWest Coast refineries. These decreasing metrics combined with the year ended December 31, 2021 were positivelytiming of our maintenance activities have negatively impacted by lower generalour revenues, gross margin, and administrative expenses when comparedoperating income in comparison to the prior year. DuringRefined product margins primarily benefited in 2022 from global supply disruptions, caused in large part by the year ended December 31, 2020 our results were negatively impacted by higher generalconflict between Russia and administrative expenses associated with integration costs in connection with the Martinez Acquisition and accelerated amortization costs associated with the East Coast Refining Reconfiguration.
Revenues— Revenues totaled $27.3$38.3 billion for the year ended December 31, 20212023 compared to $15.1$46.8 billion for the year ended December 31, 2020, an increase2022, a decrease of approximately $12.2$8.5 billion or 80.8%18.2%. Revenues per barrel sold were $80.79$100.85 and $49.43$123.26 for the years ended December 31, 20212023 and 2020,2022, respectively, an increasea decrease of 63.4%18.2% directly related to higherlower hydrocarbon commodity prices. For the year ended December 31, 2021,2023, the total throughput rates at our East Coast, Mid-Continent, Gulf Coast and West Coast refineries averaged approximately 250,900327,600 bpd, 134,100136,400 bpd, 163,300174,200 bpd and 286,200271,200 bpd, respectively. For the year ended December 31, 2020,2022, the total throughput rates at our East Coast, Mid-Continent, Gulf Coast and West Coast refineries averaged approximately 263,000300,300 bpd, 96,700148,500 bpd, 137,700180,700 bpd and 230,300295,600 bpd, respectively. For the year ended December 31, 2021,2023, the total barrels sold at our East Coast, Mid-Continent, Gulf Coast and West Coast refineries averaged approximately 292,500373,700 bpd, 142,600148,700 bpd, 170,400187,300 bpd and 318,700340,800 bpd, respectively. For the year ended December 31, 2020,2022, the total barrels sold at our East Coast, Mid-Continent, Gulf Coast and West Coast refineries averaged approximately 296,200353,800 bpd, 114,500158,200 bpd, 159,700190,600 bpd and 265,200338,400 bpd, respectively.
TheOverall average throughput rates at our refineries were higherlower in the year ended December 31, 20212023 due to increased maintenance activity and lower demand compared to the same period in 2020, with the exception of lower rates in the East Coast as a result of the East Coast Refining Reconfiguration, which took place in the fourth quarter of 2020.2022. We operatedplan to continue operating our refineries at reduced rates beginning in March 2020,based on demand and increased throughput rates across our entire refining system to correlate with the gradual increases in demand experienced during the year ended December 31, 2021, while still running below historic levels. We plan on continuing to operate our refineries at lower utilization levels until such time that sustained product demand justifies higher production.current market conditions. Total refined product barrels sold were slightly higher than throughput rates, reflecting sales from inventory as well as sales and purchases of refined products outside our refineries.
Consolidated Gross Margin—gross margin— Consolidated gross margin totaled $887.2$2,398.6 million for the year ended December 31, 2021,2023, compared to $(1,629.7)$4,678.6 million for the year ended December 31, 2020, an increase2022, a decrease of $2,516.9$2,280.0 million. Gross refining margin (as described below in Non-GAAP Financial Measures) totaled $3,087.7$5,287.7 million, or $10.14$16.07 per barrel of throughput, for the year ended December 31, 20212023 compared to $496.8$7,429.9 million, or $1.86$22.00 per barrel of throughput, for the year ended December 31, 2020, an increase2022, a decrease of approximately $2,590.9$2,142.2 million. Gross refining margin excluding special items totaled $2,418.1 million, or $7.94 per barrel of throughput, for the year ended December 31, 2021 compared to $860.3 million, or $3.23 per barrel of throughput, for the year ended December 31, 2020, an increase of $1,557.8 million.
Consolidated gross margin and gross refining margin were positively impacted by a non-cash LCM adjustment of $669.6 million on a net basis resulting from the increasedecreased due to unfavorable movements in crack spreads and crude oil and refined product prices fromdifferentials at the yearmajority of our refineries. During the years ended December 31, 2020 to the year ended2023 and December 31, 2021. Gross refining margin, excluding the impact of special items, increased due to favorable movements in certain crude differentials and an overall increase in throughput rates and refining margins. For the year ended December 31, 2020, special items impacting2022, our margin calculations included an unfavorable non-cash LCM inventory adjustment of approximately $268.0 million on a net basis, resulting from a decrease in crude oil and refined product prices from the year ended December 31, 2019, a LIFO inventory decrement charge of $83.0 million mainly related to our East Coast LIFO inventory layer and the reduction to our East Coast inventory experienced as part of the East Coast Refining Reconfiguration, and early return of certain leased railcars of $12.5 million.were not impacted by special items.
Additionally, our results continue to be impacted by significant costs to comply with the Renewable Fuel Standard.RFS. Total Renewable Fuel StandardRFS compliance costs were $726.0$762.3 million for the year ended December 31, 2021 in comparison2023 compared to $326.4$1,225.5 million for the year ended December 31, 2020.2022.
Average industry margins were mostly favorableunfavorable during the year ended December 31, 20212023 compared withto the prior year, primarily due to varying timingdecreased refining margins as a result of unfavorable movements in crack spreads and extentcrude oil differentials at the majority of the impacts of the COVID-19 pandemic on regional demand and commodity prices. For the year ended December 31, 2021, we experienced an increase in demand for our products in connection with the lifting or easing of restrictions by many governmental authorities and the distribution of COVID-19 vaccines and other protective measures.refineries.
Favorable movements in these benchmark crude differentials typically result in lower crude costs and positively impact our earnings, while reductions in these benchmark crude differentials typically result in higher crude costs and negatively impact our earnings.
On the East Coast, the Dated Brent (NYH) 2-1-1 industry crack spread was approximately $16.84$29.67 per barrel, or 84.9% higher,26.3% lower, in the year ended December 31, 2021,2023, as compared to $9.11$40.26 per barrel in the same period in 2020.2022. Our margins were positively impacted from our refinery specific slate on the East Coast by strengthened Dated Brent/MayaWTI/Bakken differential, which increased by $1.10$2.77 per barrel, offset by weakened WTI/BakkenDated Brent/Maya differential, which decreased by $2.55$0.24 per barrel in comparisoncompared to the same period in 2020.2022. The WTI/WCS differential increaseddecreased to $14.19$18.32 per barrel in 20212023 compared to $10.72$21.30 per barrel in 2020,2022, which favorablyunfavorably impacted our cost of heavy Canadian crude.
Across the Mid-Continent, the WTI (Chicago) 4-3-1 industry crack spread was $16.34$23.71 per barrel, or 159.4% higher,24.9% lower, in the year ended December 31, 2021,2023, as compared to $6.30$31.56 per barrel in the prior year. Our margins were negativelypositively impacted from our refinery specific slate in the Mid-Continent by a decreasingan increasing WTI/Bakken differential, which averaged a premium of $0.14$1.28 per barrel in the year ended December 31, 2021,2023, as compared to a discountpremium of $2.41$4.05 per barrel in the prior year. This decrease was slightly offset by strengtheningAdditionally, the WTI/Syncrude differential which averaged $2.25a premium of $0.91 per barrel for the year ended December 31, 20212023 as compared to $2.13a premium of $3.04 per barrel in the prior year.
On the Gulf Coast, the LLS (Gulf Coast) 2-1-1 industry crack spread was $16.03$29.13 per barrel, or 111.2% higher,22.4% lower, in the year ended December 31, 20212023 as compared to $7.59$37.56 per barrel in the prior year. Margins on the Gulf Coast were positivelynegatively impacted from our refinery specific slate by a strengtheningweakening WTI/LLS differential, which averaged a premium of $1.50$2.48 per barrel for the year ended December 31, 20212023 as compared to a premium of $1.88$2.22 per barrel in the prior year.
On the West Coast, the ANS (West Coast) 4-3-1 industry crack spread was $20.10$36.88 per barrel, or 77.9% higher,11.4% lower, in the year ended December 31, 20212023 as compared to $11.30$41.64 per barrel in the prior year. Additionally, the ANS (West Coast) 3-2-1 industry crack spread was $20.55$36.89 per barrel, or 105.7% higher,11.9% lower, in the year ended December 31, 20212023 as compared to $9.99$41.89 per barrel in the prior year. Our margins on the West Coast were positivelynegatively impacted from our refinery specific slate by a strengtheningweakening WTI/ANS differential, which averaged a premium of $2.46$4.70 per barrel for the year ended December 31, 20212023 as compared to a premium of $2.95$4.17 per barrel in the prior year.
Operating Expensesexpenses— Operating expenses totaled $2,085.9$2,694.9 million for the year ended December 31, 20212023 compared to $1,918.3$2,599.0 million for the year ended December 31, 2020,2022, an increase of approximately $167.6$95.9 million, or 8.7%3.7%. Of the total $2,085.9$2,694.9 million ofin operating expenses, for the year ended December 31, 2021, $1,999.1$2,581.3 million, or $6.56$7.85 per barrel of throughput, related to expenses incurred by the Refining segment, while the remaining $86.8$113.6 million related to expenses incurred by the Logistics segment ($1,835.22,495.6 million or $6.89$7.39 per barrel of throughput, and $83.1$103.4 million of operating expenses for the year ended December 31, 20202022 related to the Refining and Logistics segments, respectively). IncreasesThe increase in operating expenses werewas mainly attributable to increases in natural gas volumes and price across our refineries when compared to the year ended December 31, 2020. Additionally, we experienced higher maintenance and operational costs primarily due to increased production when compared to the prior year. These increases wereunplanned downtime, partially offset by cost-savings realized in 2021 as a result of the East Coast Refining Reconfiguration (East Coast operatinglower energy expenses decreaseddriven by $18.7 million when compared to 2020) as well as reductions in discretionary activities and third-party services, which are in line with our cost reduction initiatives taken to strengthen our financial flexibility.lower natural gas prices.
General and Administrative Expensesadministrative expenses— General and administrative expenses totaled $247.3$362.5 million for the year ended December 31, 2021,2023, compared to $248.5$468.7 million for the year ended December 31, 2020,2022, a decrease of $1.2$106.2 million or 0.5%22.7%. The slight decrease inOur general and administrative expenses for the year ended December 31, 2021were lower in comparison to the prior year ended December 31, 2020 primarily relateddue to reductions in outside service costs offset by increases in salaries, wages and benefits and other fixed expenses. Our generallower employee-related expenses, including lower incentive compensation. General and administrative expensescosts are comprised of personnel, facilities and other infrastructure costs necessary to support our refineries and related logistics assets.
Depreciation and Amortization ExpenseGain on formation of SBR equity method investment— Depreciation and amortization expense totaled $466.8There was a gain of $925.1 million for the year ended December 31, 2021 (including $453.5 million recorded within Cost2023, resulting from the difference between the carrying value and fair value of sales) comparedthe assets associated with the business contributed to $563.0SBR.
(Gain) loss on sale of assets— There was a net gain of $1.3 million for the year ended December 31, 2020 (including $551.7 million recorded within Cost of sales), a decrease of $96.2 million. The decrease was a result of reduced depreciation and amortization expense associated with certain units temporarily idled as a result of the East Coast Refining Reconfiguration.
Change in Fair Value of Contingent Consideration— Change in fair value of contingent consideration represented a loss of $32.4 million and a gain of $93.7 million for the years ended December 31, 2021 and December 31, 2020, respectively. These losses and gains were related to the changes in estimated fair value of the Martinez Contingent Consideration and the PBFX Contingent Consideration, both associated with acquisition related earn-out obligations.
Impairment expense— There was no impairment expense for the year ended December 31, 2021. Impairment expense totaled $98.8 million for the year ended December 31, 2020, and was associated with the write-down of certain assets as a result of the East Coast Refining Reconfiguration, other refinery wide project abandonments and the write-down of certain PBFX long-lived assets.
Gain on Sale of Assets— There was a gain of $3.0 million for the year ended December 31, 20212023 related primarily to a third-party sale of PBFX real property. There was a gain of $477.8 million for the year ended December 31, 2020 related primarily to the sale of five hydrogen plants and the sale of a parcel of land at our Torrance refinery. There was a loss of $0.9 million for the year ended December 31, 2022 related primarily to the sale of non-operating refinery assets.
Depreciation and amortization expense— Depreciation and amortization expense totaled $571.5 million for the year ended December 31, 2023 (including $560.0 million recorded within Cost of sales) compared to $511.1 million for the year ended December 31, 2022 (including $503.6 million recorded within Cost of sales), an increase of $60.4 million. The increase was a result of a general increase in our fixed asset base due to capital projects and turnarounds completed since the end of the prior year.
Change in fair value of contingent consideration, net— Change in fair value of contingent consideration represented a gain of $45.8 million and a loss of $48.3 million for the years ended December 31, 2023 and December 31, 2022, respectively. These gains and losses were primarily related to changes in the estimated fair value of the Martinez Contingent Consideration.
Change in Tax Receivable Agreement Liabilityliability— Change The change in the Tax Receivable Agreement liability for the year ended December 31, 2021,2023, represented a lossbenefit of $48.3$2.0 million. ChangeChanges in the Tax Receivable Agreement liability for the year ended December 31, 2020,2022 represented a gaincharge of $373.5 million. These losses and gains were primarily the$290.3 million as a result of achanges in the deferred tax asset valuation allowance recorded in accordance with Accounting Standards Codification (“ASC”) 740, Income Taxes (“ASC 740,740”), related to the reduction of deferred tax assets associated with the payments made or expected to be made in connection with the Tax Receivable Agreement liability and based on future taxable income.liability.
Change in Fair Valuefair value of Catalyst Obligationscatalyst obligations— Change in fair value of catalyst obligations represented a gain of $8.5$1.1 million for the year ended December 31, 2021,2023, compared to a loss of $11.8$2.0 million for the year ended December 31, 2020.2022. These gains and losses relate to the change in fair value of the precious metals underlying the sale and leaseback of our refineries’ precious metal catalysts, which we arewere obligated to repurchase at fair market value upon lease termination.
(Loss) gain on extinguishment of debt— We incurredThere was a gainloss on extinguishment of debt of $79.9$5.7 million in the year ended December 31, 20212023, related to the redemption of the 2025 Senior Notes and the amendment and restatement of the Revolving Credit Agreement. There was a loss on extinguishment of debt of $66.1 million incurred in the year ended December 31, 2022 related to the redemption of all of the outstanding 2025 Senior Secured Notes, slightly offset by a gain related to the repurchase of a portion of our 2028 Senior Notes and 2025 Senior Notes. We incurred debt extinguishment costs of $22.2 million in the year ended December 31, 2020 related to the redemption of our 2023 Senior Notes.
Interest Expense, net— PBF Energy interest expense totaled $317.5 million for the year ended December 31, 2021, compared to $258.2 million for the year ended December 31, 2020, an increase of $59.3 million. This net increase is mainly attributable to higher interest costs associated with the issuance of the 2025 Senior Secured Notes in May 2020 and December 2020, partially offset by lower interest expense associated with the repurchase of a portioneach of the 2028 Senior Notes and 2025 Senior Notes.
Interest expense, net— Interest expense totaled $63.8 million for the year ended December 31, 2023, compared to $246.0 million for the year ended December 31, 2022, a decrease of $182.2 million. The net decrease is mainly attributable to the redemption of the 2025 Senior Secured Notes during the third quarter of 2022, the redemption of the PBFX 2023 Senior Notes during the first quarter of 2023, the redemption of the 2025 Senior Notes in the third quarter of 2023, and the offering of our 2030 Senior Notes during the third quarter of 2023 at a reduced principal amount, as well as no outstanding balance on our Revolving Credit Facility. Additionally, the early termination of the Third Inventory Intermediation Agreement in 2023 further reduced our interest expense. There was also a $54.5 million increase in interest income earned during the year ended December 31, 2023 driven by higher interest rates in comparison to the prior year. Interest expense includes interest on long-term debt, including the PBFX credit facilities, costs related to the sale and leaseback of our precious metal catalysts, financing costs and subsequent one-time exit costs of $13.5 million associated with the Third Inventory Intermediation Agreement with J. Aron, which was terminated effective as of July 31, 2023, letter of credit fees associated with the purchase of certain crude oils and the amortization of deferred financing costs. PBF LLC interest expense totaled $327.8 million and $268.5 million for the year ended December 31, 2021 and December 31, 2020, respectively (inclusive of $10.3 million, respectively, of incremental interest expense on the affiliate note payable with PBF Energy that eliminates in consolidation at the PBF Energy level).
Income Tax Expense—tax expense— PBF LLC is organized as a limited liability company and PBFX is an MLP,a partnership, both of which are treated as “flow-through” entities for federal income tax purposes and therefore are not subject to income tax. However, two subsidiaries of Chalmette Refining and our Canadian subsidiary, PBF Energy Limited, (“PBF Ltd.”), are treated as C-Corporations for income tax purposes and may incur income taxes with respect to their earnings, as applicable. The members of PBF LLC are required to include their proportionate share of PBF LLC’s taxable income or loss, which includes PBF LLC’s allocable share of PBFX’s pre-tax income or loss, on their respective tax returns. PBF LLC generally makes distributions to its members, per the terms of PBF LLC’s amended and restated limited liability company agreement, related to such taxes on a pro-rata basis. PBF Energy recognizes an income tax expense or benefit in our consolidated financial statements based on PBF Energy’s allocable share of PBF LLC’s pre-tax income or loss, which was approximately 99.2% and 99.1%,99.3% on a weighted-average basis for both the yearsyear ended December 31, 20212023 and 2020, respectively.2022. PBF Energy’s Consolidated Financial Statements do not reflect any benefit or provision for income taxes on the pre-tax income or loss attributable to the noncontrolling interests in PBF LLC or PBFX (although, as described above, PBF LLC must make tax distributions to all its members on a pro-rata basis). PBF Energy’s effective tax rate, including the impact of noncontrolling interests, for the years ended December 31, 20212023 and 20202022 was 3.7%25.1% and 0.2%16.4%, respectively. The lower effective tax rate forin 2022 resulted from the year ended December 31, 2021 was significantly impacted byreversal of the change inremaining balance of a deferred tax asset valuation allowance, which resulted in a tax benefit of $49.9 million for the year ended December 31, 2021, compared to a charge of $358.4 million for the year ended December 31, 2020.allowance.
Noncontrolling Interest— PBF Energy is the sole managing member of, and has a controlling interest in, PBF LLC. As the sole managing member of PBF LLC, PBF Energy operates and controls all of the business and affairs of PBF LLC and its subsidiaries. PBF Energy consolidates the financial results of PBF LLC and its subsidiaries, including PBFX. With respect to the consolidation of PBF LLC, the Company recordswe record a noncontrolling interest for the economic interest in PBF LLC held by members other than PBF Energy, and with respect to the consolidation of PBFX, the Company recordswe recorded a noncontrolling interest for the economic interests in PBFX held by the public unitholders of PBFX prior to the close of the Merger Transaction, and with respect to the consolidation of PBF Holding, the Company recordswe record a 20% noncontrolling interest for the ownership interests in two subsidiaries of Chalmette Refining held by a third-party. The total noncontrolling interest on the Consolidated Statements of Operations represents the portion of the Company’s earnings or loss attributable to the economic interests held by members of PBF LLC other than PBF Energy, by the public common unitholders of PBFX prior to the close of the Merger Transaction and by the third-party stockholders of certain of Chalmette Refining’s subsidiaries. The total noncontrolling interest on the Consolidated Balance Sheets represents the portion of the Company’s net assets attributable to the economic interests held by the members of PBF LLC other than PBF Energy, by the public common unitholders of PBFX and by the third-party stockholders of the two Chalmette Refining subsidiaries. PBF Energy’s weighted-average equity noncontrolling interest ownership percentage in PBF LLC for both the yearsyear ended December 31, 20212023 and 20202022 was approximately 0.8% and 0.9%, respectively.0.7%. The carrying amount of the noncontrolling interest on our Consolidated Balance Sheets attributable to the noncontrolling interest is not equal to the noncontrolling interest ownership percentage due to the effect of income taxes and related agreements that pertain solely to PBF Energy.
2020 Compared to 2019
Overview— PBF Energy net loss was $(1,333.3) million for the year ended December 31, 2020 compared to net income of $375.2 million for the year ended December 31, 2019. PBF LLC net loss was $(1,720.3) million for the year ended December 31, 2020 compared to net income of $480.0 million for the year ended December 31, 2019. Net loss attributable to PBF Energy stockholders was $(1,392.4) million, or $(11.64) per diluted share, for the year ended December 31, 2020 ($(11.64) per share on a fully-exchanged, fully-diluted basis based on adjusted fully-converted net loss, or $(11.78) per share on a fully-exchanged, fully-diluted basis based on adjusted fully-converted net loss excluding special items, as described below in Non-GAAP Financial Measures) compared to net income attributable to PBF Energy stockholders of $319.4 million, or $2.64 per diluted share, for the year ended December 31, 2019 ($2.64 per share on a fully-exchanged, fully-diluted basis based on adjusted fully-converted net income, or $0.90 per share on a fully-exchanged, fully-diluted basis based on adjusted fully-converted net income excluding special items, as described below in Non-GAAP Financial Measures). The net income attributable to PBF Energy stockholders represents PBF Energy’s equity interest in PBF LLC’s pre-tax income, less applicable income tax expense. PBF Energy’s weighted-average equity interest in PBF LLC was 99.1% and 99.0% for the years ended December 31, 2020 and 2019, respectively.
Our results for the year ended December 31, 2020 were positively impacted by special items consisting of a gain on the sale of hydrogen plants of $471.1 million, or $345.8 million net of tax, a pre-tax gain on the sale of land at our Torrance refinery of $8.1 million, or $5.9 million net of tax, a change in fair value of both the Martinez Contingent Consideration and the PBFX Contingent Consideration of $93.7 million, or $68.8 million net of tax and a pre-tax change in the Tax Receivable Agreement liability of $373.5 million, or $274.1 million net of tax. Our results for the year ended December 31, 2020 were negatively impacted by special items consisting of a non-cash, pre-tax LCM inventory adjustment of approximately $268.0 million, or $196.7 million net of tax, pre-tax, debt extinguishment costs associated with the early redemption of the 2023 Senior Notes of $22.2 million, or $16.3 million net of tax, severance costs related to reductions in workforce of $24.7 million, or $18.1 million net of tax, impairment expense of $98.8 million or $72.5 million net of tax, related to the write-down of certain assets and project abandonments, early return of certain leased railcars of $12.5 million or $9.2 million net of tax, accelerated turnaround amortization costs of $56.2 million or $41.3 million net of tax, a LIFO inventory decrement of $83.0 million or $60.9 million net of tax, reconfiguration charges of $5.3 million or $3.9 million net of tax and $259.1 million of tax expense associated with the remeasurement of certain deferred tax assets. Our results for the year ended December 31, 2019 were positively impacted by special items consisting of a non-cash, pre-tax LCM inventory adjustment of approximately $250.2 million, or $188.0 million net of tax and a pre-tax gain on the sale of land at our Torrance refinery of $33.1 million, or $24.9 million net of tax. The LCM inventory adjustments were recorded due to movements in the price of crude oil and refined products in the periods presented.
Excluding the impact of these special items, our results were negatively impacted by the COVID-19 pandemic which caused a significant decline in the demand for our refined products and a decrease in the prices for crude oil and refined products, both of which negatively impacted our revenues, cost of products sold and operating income. In addition, during the year ended December 31, 2020 we experienced unfavorable movements in certain crude differentials and overall lower throughput volumes and barrels sold across our refineries, as well as lower refining margins. All our operating regions experienced lower refining margins for the year ended December 31, 2020 compared to the prior year. Our results for the year ended December 31, 2020 were negatively impacted by higher general and administrative expenses associated with integration costs associated with the Martinez Acquisition and increased depreciation and amortization expense associated with the Martinez Acquisition and accelerated amortization costs associated with the East Coast Refining Reconfiguration.
Revenues— Revenues totaled $15.1 billion for the year ended December 31, 2020 compared to $24.5 billion for the year ended December 31, 2019, a decrease of approximately $9.4 billion, or 38.4%. Revenues per barrel sold were $49.43 and $69.93 for the years ended December 31, 2020 and 2019, respectively, a decrease of 29.3% directly related to lower hydrocarbon commodity prices. For the year ended December 31, 2020, the total throughput rates at our East Coast, Mid-Continent, Gulf Coast and West Coast refineries averaged approximately 263,000 bpd, 96,700 bpd, 137,700 bpd and 230,300 bpd, respectively. For the year ended December 31, 2019, the total throughput rates at our East Coast, Mid-Continent, Gulf Coast and West Coast refineries averaged approximately 336,400 bpd, 153,000 bpd, 177,900 bpd and 155,800 bpd, respectively. For the year ended December 31, 2020, the total barrels sold at our East Coast, Mid-Continent, Gulf Coast and West Coast refineries averaged approximately 296,200 bpd, 114,500 bpd, 159,700 bpd and 265,200 bpd, respectively. For the year ended December 31, 2019, the total barrels sold at our East Coast, Mid-Continent, Gulf Coast and West Coast refineries averaged approximately 382,500 bpd, 163,900 bpd, 225,300 bpd and 188,600 bpd, respectively.
The throughput rates at our refineries were lower in the year ended December 31, 2020 compared to the same period in 2019. Our Martinez refinery was not acquired until the first quarter of 2020 and is therefore not included in 2019 West Coast throughput. We operated our refineries at reduced rates beginning in March 2020, and, based on market conditions, we continued to operate our refineries at lower utilization. Total refined product barrels sold were higher than throughput rates, reflecting sales from inventory, as well as sales and purchases of refined products outside our refineries.
Consolidated Gross Margin— Consolidated gross margin totaled $(1,629.7) million for the year ended December 31, 2020, compared to $913.1 million for the year ended December 31, 2019, a decrease of $2,542.8 million. Gross refining margin (as described below in Non-GAAP Financial Measures) totaled $496.8 million, or $1.86 per barrel of throughput, for the year ended December 31, 2020 compared to $2,801.2 million, or $9.34 per barrel of throughput, for the year ended December 31, 2019, a decrease of approximately $2,304.4 million. Gross refining margin excluding special items totaled $860.3 million, or $3.23 per barrel of throughput for the year ended December 31, 2020 compared to $2,551.0 million or $8.51 per barrel of throughput, for the year ended December 31, 2019, a decrease of $1,690.7 million.
Consolidated gross margin and gross refining margin were negatively impacted in the year ended December 31, 2020 by a non-cash LCM inventory adjustment of approximately $268.0 million on a net basis, resulting from the decrease in crude oil and refined product prices from the year ended 2019, a LIFO inventory decrement charge of $83.0 million mainly related to our East Coast LIFO inventory layer and the reduction to our East Coast inventory experienced as part of the East Coast Refining Reconfiguration, and early return of certain leased railcars of $12.5 million. Gross refining margin, excluding the impact of special items, decreased due to unfavorable movements in certain crude differentials and an overall decrease in throughput rates. For the year ended December 31, 2019, special items impacting our margin calculations included a favorable non-cash LCM inventory adjustment of approximately $250.2 million on a net basis, resulting from an increase in crude oil and refined product prices from the year ended December 31, 2018.
Additionally, our results continue to be impacted by significant costs to comply with the Renewable Fuel Standard. Total Renewable Fuel Standard costs were $326.4 million for the year ended December 31, 2020 in comparison to $122.7 million for the year ended December 31, 2019.
Average industry margins were mixed during the year ended December 31, 2020 compared with the year ended 2019, primarily due to the impacts of the COVID-19 pandemic on regional demand and commodity prices in 2020, in addition to impacts related to 2019 planned turnarounds, all of which were completed in the first half of 2019.
Favorable movements in these benchmark crude differentials typically result in lower crude costs and positively impact our earnings, while reductions in these benchmark crude differentials typically result in higher crude costs and negatively impact our earnings.
On the East Coast, the Dated Brent (NYH) 2-1-1 industry crack spread was approximately $9.11 per barrel, or 28.2% lower, in the year ended December 31, 2020, as compared to $12.68 per barrel in the same period in 2019. Our margins were negatively impacted from our refinery specific slate on the East Coast by weakened Dated Brent/Maya differential, which decreased by $1.39 per barrel, in comparison to the same period in 2019. Additionally, WTI/WCS differential decreased to $10.72 per barrel in 2020 compared to $13.61 per barrel in 2019, which unfavorably impacted our cost of heavy Canadian crude. The WTI/Bakken differentials increased by $1.75 per barrel when compared to 2019.
Across the Mid-Continent, the WTI (Chicago) 4-3-1 industry crack spread was $6.30 per barrel, or 58.7% lower, in the year ended December 31, 2020, as compared to $15.25 per barrel in 2019. Our margins were positively impacted from our refinery specific slate in the Mid-Continent by an increasing WTI/Bakken differential, which averaged $2.41 per barrel in the year ended December 31, 2020, as compared to $0.66 per barrel in 2019. Additionally, the WTI/Syncrude differential averaged $2.13 per barrel for the year ended December 31, 2020 as compared to $0.18 per barrel in 2019.
On the Gulf Coast, the LLS (Gulf Coast) 2-1-1 industry crack spread was $7.59 per barrel, or 38.9% lower, in the year ended December 31, 2020 as compared to $12.43 per barrel in 2019. Margins on the Gulf Coast were positively impacted from our refinery specific slate by a strengthening WTI/LLS differential, which averaged a premium of $1.88 per barrel for the year ended December 31, 2020 as compared to a premium of $5.64 per barrel in 2019.
On the West Coast, the ANS (West Coast) 4-3-1 industry crack spread was $11.30 per barrel, or 38.8% lower, in the year ended December 31, 2020 as compared to $18.46 per barrel in 2019. Additionally, margins on the West Coast were positively impacted from our refinery specific slate by a strengthening WTI/ANS differential, which averaged a premium of $2.95 per barrel for the year ended December 31, 2020 as compared to a premium of $7.97 per barrel in 2019.
Operating Expenses— Operating expenses totaled $1,918.3 million for the year ended December 31, 2020 compared to $1,782.3 million for the year ended December 31, 2019, an increase of approximately $136.0 million, or 7.6%. Of the total $1,918.3 million of operating expenses for the year ended December 31, 2020, $1,835.2 million, or $6.89 per barrel of throughput, related to expenses incurred by the Refining segment, while the remaining $83.1 million related to expenses incurred by the Logistics segment ($1,684.3 million or $5.61 per barrel of throughput, and $98.0 million of operating expenses for the year ended December 31, 2019 related to the Refining and Logistics segments, respectively). Increases in operating expenses were due to costs associated with the Martinez refinery and related logistics assets which totaled approximately $356.1 million for the year ended December 31, 2020. Total operating expenses for the year ended December 31, 2020 excluding our Martinez refinery, decreased due to our cost reduction initiatives taken to strengthen our financial flexibility and offset the negative impact of COVID-19, such as significant reductions in discretionary activities and third-party services. Operating expenses related to our Logistics segment decreased as a result of lower discretionary spending, including maintenance and outside service costs, in response to the COVID-19 pandemic, as well as lower environmental clean-up remediation costs and lower utility expenses due to reduced energy usage.
General and Administrative Expenses— General and administrative expenses totaled $248.5 million for the year ended December 31, 2020, compared to $284.0 million for the year ended December 31, 2019, a decrease of $35.5 million or 12.5%. The decrease in general and administrative expenses for the year ended December 31, 2020 in comparison to the year ended December 31, 2019 primarily related to reduction in our workforce as a result of the East Coast Refining Reconfiguration and reduction in overhead expenses through temporary salary reductions for a large portion of our workforce. These cost decreases were offset by headcount reduction severance costs across the refineries as well as integration costs pertaining to the Martinez Acquisition. Our general and administrative expenses are comprised of personnel, facilities and other infrastructure costs necessary to support our refineries and related logistics assets.
Gain on Sale of Assets— There was a gain of $477.8 million for the year ended December 31, 2020 related primarily to the sale of five hydrogen plants and the sale of a parcel of land at our Torrance refinery. There was a gain on sale of assets of $29.9 million for the year ended December 31, 2019, primarily attributable to the sale of a parcel of land at our Torrance refinery.
Depreciation and Amortization Expense— Depreciation and amortization expense totaled $563.0 million for the year ended December 31, 2020 (including $551.7 million recorded within Cost of sales) compared to $436.1 million for the year ended December 31, 2019 (including $425.3 million recorded within Cost of sales), an increase of $126.9 million. The increase was a result of additional depreciation expense associated with the assets acquired in the Martinez Acquisition and a general increase in our fixed asset base due to capital projects and turnarounds completed since the third quarter of 2019. Additionally, amortization expense recorded in 2020 includes $56.2 million of accelerated unamortized deferred turnaround costs associated with assets that were idled as part of the East Coast Refining Reconfiguration.
Change in Fair Value of Contingent Consideration— Change in fair value of contingent consideration represented a gain of $93.7 million and $0.8 million for the years ended December 31, 2020 and December 31, 2019, respectively. This change represented the decrease in the estimated fair value of the Martinez Contingent Consideration and the PBFX Contingent Consideration, both associated with acquisition related earn-out obligations.
Change in Fair Value of Catalyst Obligations— Change in fair value of catalyst obligations represented a loss of $11.8 million for the year ended December 31, 2020, compared to a loss of $9.7 million for the year ended December 31, 2019. These losses related to the change in value of the precious metals underlying the sale and leaseback of our refineries’ precious metal catalysts, which we are obligated to repurchase at fair market value on the catalyst financing arrangement termination dates.
Impairment expense— Impairment expense totaled $98.8 million for the year ended December 31, 2020, and was associated with the write-down of certain assets as a result of the East Coast Refining Reconfiguration, other refinery wide project abandonments and the write-down of certain PBFX long-lived assets. There was no such expense recorded in the year ended December 31, 2019.
Change in Tax Receivable Agreement Liability— Change in Tax Receivable Agreement liability for the year ended December 31, 2020, represented a gain of $373.5 million. This gain was primarily the result of a deferred tax asset valuation allowance recorded in accordance with ASC 740, related to the reduction of deferred tax assets associated with the payments made or expected to be made in connection with the Tax Receivable Agreement liability and based on future taxable income. There was no change in the Tax Receivable Agreement liability for the year ended December 31, 2019.
Debt Extinguishment Costs— Debt extinguishment costs of $22.2 million incurred in the year ended December 31, 2020 relate to the early redemption of our 2023 Senior Notes. There were no such costs in the same period of 2019.
Interest Expense, net— PBF Energy interest expense totaled $258.2 million for the year ended December 31, 2020, compared to $159.6 million for the year ended December 31, 2019, an increase of $98.6 million. This net increase is mainly attributable to higher interest costs associated with the issuance of the 2028 Senior Notes in January 2020, the issuance of the 2025 Senior Secured Notes in May 2020 and December 2020, as well as higher outstanding borrowings on our Revolving Credit Facility. Interest expense included interest on long-term debt including the PBFX credit facilities, costs related to the sale and leaseback of our precious metal catalysts, financing costs associated with the previous inventory intermediation agreements with J. Aron, letter of credit fees associated with the purchase of certain crude oils and the amortization of deferred financing costs. PBF LLC interest expense totaled $268.5 million and $169.1 million for the year ended December 31, 2020 and December 31, 2019, respectively (inclusive of $10.3 million and $9.5 million, respectively, of incremental interest expense on the affiliate note payable with PBF Energy that eliminates in consolidation at the PBF Energy level).
Income Tax Expense— PBF LLC is organized as a limited liability company and PBFX is an MLP, both of which are treated as “flow-through” entities for federal income tax purposes and therefore are not subject to income tax. However, two subsidiaries of Chalmette Refining and PBF Ltd., are treated as C-Corporations for income tax purposes and may incur income taxes with respect to their earnings, as applicable. The members of PBF LLC are required to include their proportionate share of PBF LLC’s taxable income or loss, which includes PBF LLC’s allocable share of PBFX’s pre-tax income or loss, on their respective tax returns. PBF LLC generally makes distributions to its members, per the terms of PBF LLC’s amended and restated limited liability company agreement, related to such taxes on a pro-rata basis. PBF Energy recognizes an income tax expense or benefit in our consolidated financial statements based on PBF Energy’s allocable share of PBF LLC’s pre-tax income or loss, which was approximately 99.1% and 99.0%, on a weighted-average basis for the years ended December 31, 2020 and 2019, respectively. PBF Energy’s Consolidated Financial Statements do not reflect any benefit or provision for income taxes on the pre-tax income or loss attributable to the noncontrolling interests in PBF LLC or PBFX (although, as described above, PBF LLC must make tax distributions to all its members on a pro-rata basis). PBF Energy’s effective tax rate, including the impact of noncontrolling interest, for the years ended December 31, 2020 and 2019 was 0.2% and 21.8%, respectively. The effective tax rate for the year ended December 31, 2020 was significantly impacted by the recording of a $358.4 million deferred tax asset valuation allowance.
Noncontrolling Interest— PBF Energy is the sole managing member of, and has a controlling interest in, PBF LLC. As the sole managing member of PBF LLC, PBF Energy operates and controls all of the business and affairs of PBF LLC and its subsidiaries. PBF Energy consolidates the financial results of PBF LLC and its subsidiaries, including PBFX. With respect to the consolidation of PBF LLC, the Company records a noncontrolling interest for the economic interest in PBF LLC held by members other than PBF Energy, and with respect to the consolidation of PBFX, the Company records a noncontrolling interest for the economic interests in PBFX held by the public unitholders of PBFX, and with respect to the consolidation of PBF Holding, the Company records a 20% noncontrolling interest for the ownership interests in two subsidiaries of Chalmette Refining held by a third-party. The total noncontrolling interest on the Consolidated Statements of Operations represents the portion of the Company’s earnings or loss attributable to the economic interests held by members of PBF LLC other than PBF Energy, by the public common unitholders of PBFX and by the third-party stockholders of certain of Chalmette Refining’s subsidiaries. The total noncontrolling interest on the Consolidated Balance Sheets represents the portion of the Company’s net assets attributable to the economic interests held by the members of PBF LLC other than PBF Energy, by the public common unitholders of PBFX and by the third-party stockholders of the two Chalmette Refining subsidiaries. PBF Energy’s weighted-average equity noncontrolling interest ownership percentage in PBF LLC for the years ended December 31, 2020 and 2019 was approximately 0.9% and 1.0%, respectively. The carrying amount of the noncontrolling interest on our Consolidated Balance Sheets attributable to the noncontrolling interest is not equal to the noncontrolling interest ownership percentage due to the effect of income taxes and related agreements that pertain solely to PBF Energy.
Non-GAAP Financial Measures
Management uses certain financial measures to evaluate our operating performance that are calculated and presented on the basis of methodologies other than in accordance with GAAP (“Non-GAAP”). These measures should not be considered a substitute for, or superior to, measures of financial performance prepared in accordance with GAAP, and our calculations thereof may not be comparable to similarly entitled measures reported by other companies. Such Non-GAAP financial measures are presented only in the context of PBF Energy’s results and are not presented or discussed in respect to PBF LLC.
Special Items
The Non-GAAP measures presented include Adjusted Fully-Converted Net Income (Loss) excluding special items, gross refining margin excluding special items, EBITDA excluding special items and gross refining marginnet debt to capitalization ratio excluding special items. Special items for the periods presented relate to LCM inventory adjustments, our share of the SBR LCM inventory adjustment, net changes in fair value of contingent consideration, loss (gain) on extinguishment of debt and costs associated with the early termination of the Third Inventory Intermediation Agreement, changes in the Tax Receivable Agreement liability, (gain) lossgains on extinguishment of debt,land sales, gain on saleformation of hydrogen plants, severancethe SBR equity method investment, and reconfiguration costs, impairment expense, net tax (benefit) expensebenefit on remeasurement of deferred tax assets, gains on land sales, charges associated with the early return of certain leased railcars, turnaround acceleration costs, and a LIFO inventory decrement.assets. See “Notes to Non-GAAP Financial Measures” below for more details on all special items disclosed. Although we believe that Non-GAAP financial measures, excluding the impact of special items, provide useful supplemental information to investors regarding the results and performance of our business and allow for helpful period-over-period comparisons, such Non-GAAP measures should only be considered as a supplement to, and not as a substitute for, or superior to, the financial measures prepared in accordance with GAAP.
Adjusted Fully-Converted Net Income (Loss) and Adjusted Fully-Converted Net Income (Loss) Excluding Special Items
PBF Energy utilizes results presented on an Adjusted Fully-Converted basis that reflectsreflect an assumed exchange of all PBF LLC Series A Units for shares of PBF Energy Class A common stock. In addition, we present results on an Adjusted Fully-Converted basis excluding special items as described above. We believe that these Adjusted Fully-Converted measures, when presented in conjunction with comparable GAAP measures, are useful to investors to compare PBF Energy results across different periods and to facilitate an understanding of our operating results.
Neither Adjusted Fully-Converted Net Income (Loss) nor Adjusted Fully-Converted Net Income (Loss) excluding special items should be considered an alternative to net income (loss) presented in accordance with GAAP. Adjusted Fully-Converted Net Income (Loss) and Adjusted Fully-Converted Net Income (Loss) excluding special items presented by other companies may not be comparable to our presentation, since each company may define these terms differently. The differences between Adjusted Fully-Converted and GAAP results are as follows:
| | | | | |
| 1. | Assumed exchange of all PBF LLC Series A Units for shares of PBF Energy Class A common stock. As a result of the assumed exchange of all PBF LLC Series A Units, the noncontrolling interest related to these units is converted to controlling interest. Management believes that it is useful to provide the per-share effect associated with the assumed exchange of all PBF LLC Series A Units. |
| | | | | |
| 2. | Income Taxes. Prior to PBF Energy’s IPO, PBF Energy was organized as a limited liability company treated as a “flow-through” entity for income tax purposes, and even after PBF Energy’s IPO, not all of its earnings are subject to corporate-level income taxes. Adjustments have been made to the Adjusted Fully-Converted tax provisions and earnings to assume that PBF Energy had adopted its post-IPO corporate tax structure for all periods presented and is taxed as a C-corporation in the U.S. at the prevailing corporate rates. These assumptions are consistent with the assumption in clause 1 above that all PBF LLC Series A Units are exchanged for shares of PBF Energy Class A common stock, as the assumed exchange would change the amount of PBF Energy’s earnings that are subject to corporate income tax. |
The following table reconciles PBF Energy’s Adjusted Fully-Converted results with its results presented in accordance with GAAP for the years ended December 31, 2021, 20202023, 2022 and 20192021 (in millions, except share and per share amounts):
| | | | | | | | | | | | | | | | | | | | |
| | | Year Ended December 31, |
| | | 2021 | | 2020 | | 2019 |
| Net income (loss) attributable to PBF Energy Inc. stockholders | | $ | 231.0 | | | $ | (1,392.4) | | | $ | 319.4 | |
| Less: Income allocated to participating securities | | — | | | 0.1 | | | 0.5 | |
| Income (loss) available to PBF Energy Inc. stockholders - basic | | 231.0 | | | (1,392.5) | | | 318.9 | |
Add: Net income (loss) attributable to noncontrolling interests(1) | | 2.4 | | | (17.1) | | | 4.3 | |
Less: Income tax (expense) benefit (2) | | (0.6) | | | 4.6 | | | (1.0) | |
| Adjusted fully-converted net income (loss) | | $ | 232.8 | | | $ | (1,405.0) | | | $ | 322.2 | |
Special Items:(3) | | | | | | |
| Add: Non-cash LCM inventory adjustment | | (669.6) | | | 268.0 | | | (250.2) | |
| Add: Change in fair value of contingent consideration | | 32.4 | | | (93.7) | | | — | |
| Add: Gain on sale of hydrogen plants | | — | | | (471.1) | | | — | |
| Add: Gain on land sales | | (2.8) | | | (8.1) | | | (33.1) | |
| Add: Impairment expense | | — | | | 98.8 | | | — | |
| Add: LIFO inventory decrement | | — | | | 83.0 | | | — | |
| Add: Turnaround acceleration costs | | — | | | 56.2 | | | — | |
| Add: Severance and reconfiguration costs | | — | | | 30.0 | | | — | |
| Add: Early railcar return expense | | — | | | 12.5 | | | — | |
| Add: (Gain) loss on extinguishment of debt | | (79.9) | | | 22.2 | | | — | |
| Add: Change in Tax Receivable Agreement liability | | 48.3 | | | (373.5) | | | — | |
| | | | | | |
| Add: Net tax (benefit) expense on remeasurement of deferred tax assets | | (37.4) | | | 259.1 | | | — | |
| Less: Recomputed income tax on special items | | 173.9 | | | 99.9 | | | 70.4 | |
| Adjusted fully-converted net income (loss) excluding special items | | $ | (302.3) | | | $ | (1,421.7) | | | $ | 109.3 | |
| | | | | | |
| Weighted-average shares outstanding of PBF Energy Inc. | | 120,240,009 | | | 119,617,998 | | | 119,887,646 | |
Conversion of PBF LLC Series A Units (4) | | 988,730 | | | 1,042,667 | | | 1,207,581 | |
Common stock equivalents (5) | | 1,409,415 | | | — | | | 758,072 | |
| | | | | | |
| Fully-converted shares outstanding—diluted | | 122,638,154 | | | 120,660,665 | | | 121,853,299 | |
| | | | | | |
| Diluted net income (loss) per share | | $ | 1.90 | | | $ | (11.64) | | | $ | 2.64 | |
Adjusted fully-converted net income (loss) per fully exchanged, fully diluted shares outstanding (5) | | $ | 1.90 | | | $ | (11.64) | | | $ | 2.64 | |
| Adjusted fully-converted net income (loss) excluding special items per fully exchanged, fully diluted shares outstanding | | $ | (2.50) | | | $ | (11.78) | | | $ | 0.90 | |
| | | | | | | | | | | | | | | | | | | | |
| | | Year Ended December 31, |
| | | 2023 | | 2022 | | 2021 |
| Net income attributable to PBF Energy Inc. stockholders | | $ | 2,140.5 | | | $ | 2,876.8 | | | $ | 231.0 | |
| Less: Income allocated to participating securities | | — | | | — | | | — | |
| Income available to PBF Energy Inc. stockholders - basic | | 2,140.5 | | | 2,876.8 | | | 231.0 | |
Add: Net income attributable to noncontrolling interest(1) | | 20.5 | | | 27.9 | | | 2.4 | |
Less: Income tax expense (2) | | (5.3) | | | (7.2) | | | (0.6) | |
| Adjusted fully-converted net income | | $ | 2,155.7 | | | $ | 2,897.5 | | | $ | 232.8 | |
Special Items:(3) | | | | | | |
| Add: LCM inventory adjustment | | — | | | — | | | (669.6) | |
| Add: LCM inventory adjustment - SBR | | 38.7 | | | — | | | — | |
| Add: Change in fair value of contingent consideration, net | | (45.8) | | | 48.3 | | | 32.4 | |
| | | | | | |
| Add: Gain on land sales | | (1.7) | | | — | | | (2.8) | |
| | | | | | |
| | | | | | |
| | | | | | |
| | | | | | |
| | | | | | |
| Add: Loss (gain) on extinguishment of debt and termination of Inventory Intermediation Agreement | | 19.2 | | | 66.1 | | | (79.9) | |
| Add: Change in Tax Receivable Agreement liability | | (2.0) | | | 290.3 | | | 48.3 | |
| Add: Gain on formation of SBR equity method investment | | (925.1) | | | — | | | — | |
| Add: Net tax benefit on remeasurement of deferred tax assets | | — | | | (233.8) | | | (37.4) | |
| Less: Recomputed income tax on special items | | 238.3 | | | (104.9) | | | 173.9 | |
| Adjusted fully-converted net income (loss) excluding special items | | $ | 1,477.3 | | | $ | 2,963.5 | | | $ | (302.3) | |
| | | | | | |
| Weighted-average shares outstanding of PBF Energy Inc. | | 124,953,858 | | | 122,598,076 | | | 120,240,009 | |
Conversion of PBF LLC Series A Units (4) | | 899,519 | | | 917,991 | | | 988,730 | |
Common stock equivalents (5) | | 4,656,071 | | | 3,344,039 | | | 1,409,415 | |
| | | | | | |
| Fully-converted shares outstanding—diluted | | 130,509,448 | | | 126,860,106 | | | 122,638,154 | |
| | | | | | |
| Diluted net income per share | | $ | 16.52 | | | $ | 22.84 | | | $ | 1.90 | |
Adjusted fully-converted net income per fully exchanged, fully diluted shares outstanding (5) | | $ | 16.52 | | | $ | 22.84 | | | $ | 1.90 | |
Adjusted fully-converted net income (loss) excluding special items per fully exchanged, fully diluted shares outstanding (3) (5) | | $ | 11.32 | | | $ | 23.36 | | | $ | (2.50) | |
——————————
See Notes to Non-GAAP Financial Measures.
Gross Refining Margin and Gross Refining Margin Excluding Special Items
Gross refining margin is defined as consolidated gross margin excluding refinery depreciation, refinery operating expense,expenses, and gross margin of PBFX. We believe both gross refining margin and gross refining margin excluding special items are important measures of operating performance and provide useful information to investors because they are helpful metric comparisons to the industry refining margin benchmarks, as the refining margin benchmarks do not include a charge for refinery operating expenses and depreciation. In order to assess our operating performance, we compare our gross refining margin (revenues less cost of products and other) to industry refining margin benchmarks and crude oil prices as defined in the table below.
Neither gross refining margin nor gross refining margin excluding special items should be considered an alternative to consolidated gross margin, income from operations, net cash flows from operating activities or any other measure of financial performance or liquidity presented in accordance with GAAP. Gross refining margin and gross refining margin excluding special items presented by other companies may not be comparable to our presentation, since each company may define these terms differently. The following table presents our GAAP calculation of gross margin and a reconciliation of gross refining margin to the most directly comparable GAAP financial measure, consolidated gross margin, on a historical basis, as applicable, for each of the periods indicated (in millions, except per barrel amounts):
| | Year Ended December 31, |
| 2021 | | 2020 | | 2019 |
| $ | per barrel of throughput | | $ | per barrel of throughput | | $ | per barrel of throughput |
| | Year Ended December 31, | | | | Year Ended December 31, |
| | 2023 | | | | 2023 | | 2022 | | 2021 |
| | $ | | | | $ | per barrel of throughput | | $ | per barrel of throughput | | $ | per barrel of throughput |
| Calculation of consolidated gross margin: | Calculation of consolidated gross margin: | | | | | | |
| Revenues | |
| Revenues | |
| Revenues | Revenues | | $ | 27,253.4 | | $ | 89.46 | | | $ | 15,115.9 | | $ | 56.76 | | | $ | 24,508.2 | | $ | 81.58 | |
| Less: Cost of sales | Less: Cost of sales | | 26,366.2 | | 86.55 | | | 16,745.6 | | 62.88 | | | 23,595.1 | | 78.54 | |
| Consolidated gross margin | Consolidated gross margin | | $ | 887.2 | | $ | 2.91 | | | $ | (1,629.7) | | $ | (6.12) | | | $ | 913.1 | | $ | 3.04 | |
| Reconciliation of consolidated gross margin to gross refining margin: | Reconciliation of consolidated gross margin to gross refining margin: | |
| Consolidated gross margin | Consolidated gross margin | | $ | 887.2 | | $ | 2.91 | | | $ | (1,629.7) | | $ | (6.12) | | | $ | 913.1 | | $ | 3.04 | |
| Consolidated gross margin | |
| Consolidated gross margin | |
| Add: PBFX operating expense | Add: PBFX operating expense | | 103.4 | | 0.35 | | | 99.9 | | 0.38 | | | 118.7 | | 0.40 | |
| Add: PBFX depreciation expense | Add: PBFX depreciation expense | | 37.8 | | 0.13 | | | 53.7 | | 0.19 | | | 38.6 | | 0.13 | |
| Less: Revenues of PBFX | Less: Revenues of PBFX | | (355.5) | | (1.17) | | | (360.3) | | (1.35) | | | (340.2) | | (1.13) | |
| Add: Refinery operating expense | | 1,999.1 | | 6.56 | | | 1,835.2 | | 6.89 | | | 1,684.3 | | 5.61 | |
| Add: Refinery operating expenses | |
| Add: Refinery depreciation expense | Add: Refinery depreciation expense | | 415.7 | | 1.36 | | | 498.0 | | 1.87 | | | 386.7 | | 1.29 | |
| Gross refining margin | Gross refining margin | | $ | 3,087.7 | | $ | 10.14 | | | $ | 496.8 | | $ | 1.86 | | | $ | 2,801.2 | | $ | 9.34 | |
Special Items: (3) | Special Items: (3) | |
| Add: Non-cash LCM inventory adjustment | | (669.6) | | (2.20) | | | 268.0 | | 1.01 | | | (250.2) | | (0.83) | |
| Add: LIFO inventory decrement | | — | | — | | | 83.0 | | 0.31 | | | — | | — | |
| Add: Early railcar return expense | | — | | — | | | 12.5 | | 0.05 | | | — | | — | |
| Add: LCM inventory adjustment | |
| Add: LCM inventory adjustment | |
| Add: LCM inventory adjustment | |
| | Gross refining margin excluding special items | Gross refining margin excluding special items | | $ | 2,418.1 | | $ | 7.94 | | | $ | 860.3 | | $ | 3.23 | | | $ | 2,551.0 | | $ | 8.51 | |
| | Gross refining margin excluding special items | |
| | Gross refining margin excluding special items | |
——————————
See Notes to Non-GAAP Financial Measures.
EBITDA, EBITDA Excluding Special Items and Adjusted EBITDA
Our management uses EBITDA (earningsearnings before interest, income taxes, depreciation and amortization)amortization (“EBITDA”), EBITDA excluding special items and Adjusted EBITDA as measures of operating performance to assist in comparing performance from period to period on a consistent basis and to readily view operating trends, as a measure for planning and forecasting overall expectations and for evaluating actual results against such expectations, and in communications with our Board of Directors, creditors, analysts and investors concerning our financial performance. Our outstanding indebtedness for borrowed money and other contractual obligations also include similar measures as a basis for certain covenants under those agreements which may differ from the Adjusted EBITDA definition described below.
EBITDA, EBITDA excluding special items and Adjusted EBITDA are not presentations made in accordance with GAAP and our computation of EBITDA, EBITDA excluding special items and Adjusted EBITDA may vary from others in our industry. In addition, Adjusted EBITDA contains some, but not all, adjustments that are taken into account in the calculation of the components of various covenants in the agreements governing our senior notes and other credit facilities. EBITDA, EBITDA excluding special items and Adjusted EBITDA should not be considered as alternatives to income from operations or net income as measures of operating performance. In addition, EBITDA, EBITDA excluding special items and Adjusted EBITDA are not presented as, and should not be considered, an alternative to cash flows from operations as a measure of liquidity. Adjusted EBITDA is defined as EBITDA before adjustments for items such as stock-based compensation expense, the non-cash change in the fair value of catalyst obligations, gain on sale of hydrogen plants, the write down of inventory to the LCM, our share of the SBR LCM inventory adjustment, changes in the Tax Receivable Agreement liability, due to factors out of PBF Energy’s control such as changes in tax rates, (gain) loss on extinguishment of debt related to refinancing activities,net change in the fair value of contingent consideration, gain on land sales, loss (gain) on extinguishment of debt, gain on the formation of the SBR equity method investment and certain other non-cash items. Other companies, including other companies in our industry, may calculate EBITDA, EBITDA excluding special items and Adjusted EBITDA differently than we do, limiting their usefulness as comparative measures. EBITDA, EBITDA excluding special items and Adjusted EBITDA also have limitations as analytical tools and should not be considered in isolation, or as a substitute for analysis of our results as reported under GAAP. Some of these limitations include that EBITDA, EBITDA excluding special items and Adjusted EBITDA:
•do not reflect depreciation expense or our cash expenditures, or future requirements, for capital expenditures or contractual commitments;
•do not reflect changes in, or cash requirements for, our working capital needs;
•do not reflect our interest expense, or the cash requirements necessary to service interest or principal payments, on our debt;
•do not reflect realized and unrealized gains and losses from certain hedging activities, which may have a substantial impact on our cash flow;
•do not reflect certain other non-cash income and expenses; and
•exclude income taxes that may represent a reduction in available cash.
The following tables reconcile net income (loss) as reflected in PBF Energy’s results of operations to EBITDA, EBITDA excluding special items and Adjusted EBITDA for the periods presented (in millions):
| | | | | | | | | | | | | | | | | | | | | | | |
| | | Year Ended December 31, |
| | | 2021 | | 2020 | | 2019 |
| Reconciliation of net income (loss) to EBITDA and EBITDA excluding special items: | | | | | |
| Net income (loss) | $ | 315.5 | | | $ | (1,333.3) | | | $ | 375.2 | |
| Add: Depreciation and amortization expense | 466.8 | | | 563.0 | | | 436.1 | |
| Add: Interest expense, net | 317.5 | | | 258.2 | | | 159.6 | |
| Add: Income tax expense | 12.1 | | | 2.1 | | | 104.3 | |
| EBITDA | $ | 1,111.9 | | | $ | (510.0) | | | $ | 1,075.2 | |
Special Items: (3) | | | | | |
| Add: Non-cash LCM inventory adjustment | (669.6) | | | 268.0 | | | (250.2) | |
| Add: Change in fair value of contingent consideration | 32.4 | | | (93.7) | | | — | |
| Add: Gain on sale of hydrogen plants | — | | | (471.1) | | | — | |
| Add: Gain on land sales | (2.8) | | | (8.1) | | | (33.1) | |
| Add: Impairment expense | — | | | 98.8 | | | — | |
| Add: LIFO inventory decrement | — | | | 83.0 | | | — | |
| Add: Severance and reconfiguration costs | — | | | 30.0 | | | — | |
| Add: Early railcar return expense | — | | | 12.5 | | | — | |
| Add: (Gain) loss on extinguishment of debt | (79.9) | | | 22.2 | | | — | |
| Add: Change in Tax Receivable Agreement liability | 48.3 | | | (373.5) | | | — | |
| | | | | |
| EBITDA excluding special items | $ | 440.3 | | | $ | (941.9) | | | $ | 791.9 | |
| | | | | | | |
| Reconciliation of EBITDA to Adjusted EBITDA: | | | | | |
| EBITDA | $ | 1,111.9 | | | $ | (510.0) | | | $ | 1,075.2 | |
| Add: Stock based compensation | 35.6 | | | 34.2 | | | 37.3 | |
| Add: Change in fair value of catalyst obligations | (8.5) | | | 11.8 | | | 9.7 | |
Add: Non-cash LCM inventory adjustment (3) | (669.6) | | | 268.0 | | | (250.2) | |
Add: Change in fair value of contingent consideration (3) | 32.4 | | | (93.7) | | | — | |
Add: Gain on sale of hydrogen plants (3) | — | | | (471.1) | | | — | |
Add: Gain on land sales (3) | (2.8) | | | (8.1) | | | (33.1) | |
Add: Impairment expense (3) | — | | | 98.8 | | | — | |
Add: LIFO inventory decrement (3) | — | | | 83.0 | | | — | |
Add: Severance and reconfiguration costs (3) | — | | | 30.0 | | | — | |
Add: Early railcar return expense (3) | — | | | 12.5 | | | — | |
Add: (Gain) loss on extinguishment of debt (3) | (79.9) | | | 22.2 | | | — | |
Add: Change in Tax Receivable Agreement liability (3) | 48.3 | | | (373.5) | | | — | |
| | | | | |
| Adjusted EBITDA | $ | 467.4 | | | $ | (895.9) | | | $ | 838.9 | |
| | | | | | | | | | | | | | | | | | | | | | | |
| | | Year Ended December 31, |
| | | 2023 | | 2022 | | 2021 |
| Reconciliation of net income to EBITDA and EBITDA excluding special items: | | | | | |
| Net income | $ | 2,162.0 | | | $ | 2,972.8 | | | $ | 315.5 | |
| Add: Depreciation and amortization expense | 571.5 | | | 511.1 | | | 466.8 | |
| Add: Interest expense, net | 63.8 | | | 246.0 | | | 317.5 | |
| Add: Income tax expense | 723.8 | | | 584.8 | | | 12.1 | |
| EBITDA | $ | 3,521.1 | | | $ | 4,314.7 | | | $ | 1,111.9 | |
Special Items: (3) | | | | | |
| Add: LCM inventory adjustment | — | | | — | | | (669.6) | |
| Add: LCM inventory adjustment - SBR | 38.7 | | | — | | | — | |
| Add: Change in fair value of contingent consideration, net | (45.8) | | | 48.3 | | | 32.4 | |
| | | | | |
| Add: Gain on land sales | (1.7) | | | — | | | (2.8) | |
| | | | | |
| | | | | |
| | | | | |
| | | | | |
| Add: Loss (gain) on extinguishment of debt | 5.7 | | | 66.1 | | | (79.9) | |
| Add: Change in Tax Receivable Agreement liability | (2.0) | | | 290.3 | | | 48.3 | |
| Add: Gain on formation of SBR equity method investment | (925.1) | | | — | | | — | |
| EBITDA excluding special items | $ | 2,590.9 | | | $ | 4,719.4 | | | $ | 440.3 | |
| | | | | | | |
| Reconciliation of EBITDA to Adjusted EBITDA: | | | | | |
| EBITDA | $ | 3,521.1 | | | $ | 4,314.7 | | | $ | 1,111.9 | |
| Add: Stock based compensation | 51.5 | | | 54.3 | | | 35.6 | |
| Add: Change in fair value of catalyst obligations | (1.1) | | | 2.0 | | | (8.5) | |
Add: LCM inventory adjustment (3) | — | | | — | | | (669.6) | |
Add: LCM inventory adjustment - SBR (3) | 38.7 | | | — | | | — | |
Add: Change in fair value of contingent consideration, net (3) | (45.8) | | | 48.3 | | | 32.4 | |
| | | | | |
Add: Gain on land sales (3) | (1.7) | | | — | | | (2.8) | |
| | | | | |
| | | | | |
| | | | | |
| | | | | |
Add: Loss (gain) on extinguishment of debt (3) | 5.7 | | | 66.1 | | | (79.9) | |
Add: Change in Tax Receivable Agreement liability (3) | (2.0) | | | 290.3 | | | 48.3 | |
Add: Gain on formation of SBR equity method investment (3) | (925.1) | | | — | | | — | |
| Adjusted EBITDA | $ | 2,641.3 | | | $ | 4,775.7 | | | $ | 467.4 | |
——————————
See Notes to Non-GAAP Financial Measures.
The total debt to capitalization ratio is calculated by dividing total debt by the sum of total debt and total equity. This ratio is a measurement that management believes is useful to investors in analyzing our leverage. Net debt and the net debt to capitalization ratio are Non-GAAP measures. Net debt is calculated by subtracting cash and cash equivalents from total debt. Total capitalization is calculated by adding total debt and total equity. We believe these measurements are also useful to investors since we have the ability to and may decide to use a portion of our cash and cash equivalents to retire or pay down our debt. Additionally, we have also presented the total debt to capitalization and net debt to capitalization ratios excluding the cumulative effects of special items on equity.
| | | | | | | | | | | | | | | | | | | | | | | |
| | | | | December 31, | | December 31, |
| | | | | 2023 | | 2022 |
| Balance Sheet Data: | | | | |
| Cash and cash equivalents | $ | 1,783.5 | | | $ | 2,203.6 | |
| Inventories | 3,183.1 | | | 2,763.6 | |
| Total assets | 14,387.8 | | | 13,549.1 | |
| Total debt | 1,245.9 | | | 1,959.1 | |
| Net debt | | | | (537.6) | | | (244.5) | |
| Total capitalization | 7,877.2 | | | 7,015.1 | |
| Total equity | 6,631.3 | | | 5,056.0 | |
| Total equity excluding special items (6) | $ | 5,557.4 | | | $ | 4,660.5 | |
| | | | | | | |
| Total debt to capitalization ratio | 16 | % | | 28 | % |
| Total debt to capitalization ratio, excluding special items (6) | 18 | % | | 30 | % |
| Net debt to capitalization ratio* | (9) | % | | (5) | % |
| Net debt to capitalization ratio, excluding special items* (6) | (11) | % | | (6) | % |
| | | | | | | |
| * Negative ratio exists at December 31, 2023 and December 31, 2022 as cash is in excess of debt. |
——————————
See Notes to Non-GAAP Financial Measures.
Notes to Non-GAAP Financial Measures
The following notes are applicable to the Non-GAAP Financial Measures above:
(1) Represents the elimination of the noncontrolling interest associated with the ownership by the members of PBF LLC other than PBF Energy, as if such members had fully exchanged their PBF LLC Series A Units for shares of PBF Energy Class A common stock.
(2) Represents an adjustment to reflect PBF Energy’s annualized statutory corporate tax rate of approximately 25.9%, 26.6%26.0% for 2023 and 24.9%25.9% for the2022 and 2021, 2020 and 2019 periods, respectively, applied to the net income (loss) attributable to noncontrolling interest for all periods presented. The adjustment assumes the full exchange of existing PBF LLC Series A Units as described in (1) above.
(3) Special items:
LCM inventory adjustmentInventory Adjustment - LCM is a GAAP requirement related to inventory valuation that mandates inventory to be stated at the lower of cost or market. Our inventories are stated at the lower of cost or market. Cost is determined using the LIFO inventory valuation methodology, in which the most recently incurred costs are charged to cost of sales and inventories are valued at base layer acquisition costs. Market is determined based on an assessment of the current estimated replacement cost and net realizable selling price of the inventory. In periods where the market price of our inventory declines substantially, cost values of inventory may exceed market values. In such instances, we record an adjustment to write down the value of inventory to market value in accordance with GAAP. In subsequent periods, the value of inventory is reassessed, and an LCM inventory adjustment is recorded to reflect the net change in the LCM inventory reserve between the prior period and the current period. The net impact of these LCM inventory adjustments areis included in the Refining segment’s income from operations, but are excluded from the operating results presented, as applicable, in order to make such information comparable between periods.
The following table includes the LCM inventory reserve as of each date presented (in millions):
| | 2021 | | 2020 | | 2019 |
| 2023 | | | 2023 | | 2022 | | 2021 |
| January 1, | January 1, | $ | 669.6 | | | $ | 401.6 | | | $ | 651.8 | |
| | December 31, | December 31, | — | | | 669.6 | | | 401.6 | |
| December 31, | |
| December 31, | |
The following table includes the corresponding impact of changes in the LCM inventory reserve on income (loss) from operations and net income (loss) for the periods presented (in millions):
| | | | | | | | | | | | | | | | | |
| Year Ended December 31, |
| 2021 | | 2020 | | 2019 |
| Net LCM inventory adjustment benefit (charge) in income (loss) from operations | $ | 669.6 | | | $ | (268.0) | | | $ | 250.2 | |
| Net LCM inventory adjustment benefit (charge) in net income (loss) | 496.2 | | | (196.7) | | | 188.0 | |
| | | | | | | | | | | | | | | | | |
| Year Ended December 31, |
| 2023 | | 2022 | | 2021 |
| Net LCM inventory adjustment benefit in income from operations | $ | — | | | $ | — | | | $ | 669.6 | |
| Net LCM inventory adjustment benefit in net income | — | | | — | | | 496.2 | |
SBR LCM Inventory Adjustment - For 2023, an LCM write-down of $77.4 million is included in SBR’s results of operations. Our Equity loss in investee includes our 50% share of this adjustment. This LCM write-down decreased PBF Energy’s income from operations and net income by $38.7 million and $28.6 million, respectively. This amount is excluded from the table above.
Change in fair value of contingent consideration, net - During the year ended December 31, 2023, we recorded a net change in fair value of the Martinez Contingent Consideration, which increased income from operations and net income by $45.8 million and $33.9 million, respectively. During the year ended December 31, 2022, we recorded a net change in fair value of the Martinez Contingent Consideration, offset by the recognition of contingent assets associated with the acquisition. These changes in estimate decreased income from operations and net income by $48.3 million and $35.8 million, respectively. During the year ended December 31, 2021, we recorded a change in fair value of the contingent consideration related to both the Martinez Contingent Consideration and the PBFXearn-out obligation associated with the acquisition of CPI Operations LLC (the “PBFX Contingent Consideration,Consideration”), which decreased income from operations and net income by $32.4 million and $24.0 million, respectively. During the year ended December 31, 2020, we recorded a change in fair value of the contingent consideration related to the Martinez Contingent Consideration and the PBFX Contingent Consideration which increased income from operations and net income by $93.7 million and $68.8 million, respectively. Change in fair value of contingent consideration during the year ended December 31, 2019 was not significant.
GainLoss (gain) on Saleextinguishment of Hydrogen Plantsdebt and termination of Inventory Intermediation Agreement- During the year ended December 31, 2020,2023, we recorded a gainpre-tax loss on extinguishment of debt related to the saleredemption of five hydrogen plants. The gain increasedour 2025 Senior Notes and the amendment and restatement of the Revolving Credit Facility, which decreased income from operationsbefore income taxes and net income by $471.1$5.7 million and $345.8$4.2 million, respectively. There were no such gains inDuring the yearsyear ended December 31, 20212022, we recorded a net pre-tax loss on extinguishment of debt related to the redemption of the 2025 Senior Secured Notes, partially offset by the gain recognized on the repurchase of a portion of each of the 2028 Senior Notes and December 31, 2019.
Gain on land sales -the 2025 Senior Notes, which decreased income before income taxes and net income by $66.1 million and $49.0 million, respectively. During the year ended December 31, 2021, we recorded a gain on sale of PBFX real-property at the East Coast Terminals, which increased income from operations and net income by $2.8 million and $2.1 million, respectively. During the years ended December 31, 2020 and December 31, 2019, we recorded gains on the sale of two separate parcels of real property acquired as part of the Torrance refinery, but not part of the refinery itself. The gain on sale increased income from operations and net income by $8.1 million and $5.9 million, respectively, during the year ended December 31, 2020. The gain on sale increased income from operations and net income by $33.1 million and $24.9 million, respectively, during the year ended December 31, 2019.
Impairment expense - During the year ended December 31, 2020, we recorded an impairment charge which decreased income from operations and net income by $98.8 million and $72.5 million, respectively, resulting from the write-down of certain assets as a result of the East Coast Refining Reconfiguration, project abandonments and the write-down of certain PBFX long-lived assets. There were no such impairment charges during the years ended December 31, 2021 and December 31, 2019.
LIFO inventory decrement - As part of our overall reduction in throughput in 2020 and our reduction in inventory volume as of December 31, 2020, the Company recorded a pre-tax charge to cost of products and other related to a LIFO inventory layer decrement. The majority of the decrement related to our East Coast LIFO inventory layer and the reduction to our East Coast inventory experienced as part of the East Coast Refining Reconfiguration. These charges decreased income from operations and net income by $83.0 million and $60.9 million, respectively, for the year ended December 31, 2020. Decrements recorded in the years ended December 31, 2021 and December 31, 2019 were not significant.
Turnaround acceleration costs - During the year ended December 31, 2020, we accelerated the recognition of turnaround amortization associated with units that were temporarily idled as part of the East Coast Refining Reconfiguration. These costs decreased income from operations and net income by $56.2 million and $41.3 million, respectively. There were no such costs in the years ended December 31, 2021 and December 31, 2019.
Severance and reconfiguration costs - During the year ended December 31, 2020, we recorded severance charges related to reductions in our workforce. These charges decreased income from operations and net income by $24.7 million and $18.1 million, respectively. There were no such costs in the years ended December 31, 2021 and December 31, 2019. During the year ended December 31, 2020, we recorded reconfiguration charges related to the temporary idling of certain assets as part of our East Coast Refining System. These charges decreased income from operations and net income by $5.3 million and $3.9 million, respectively. There were no such costs in the years ended December 31, 2021 and December 31, 2019.
Early return of railcars - During the year ended December 31, 2020, we recognized certain expenses within Cost of sales associated with the voluntary early return of certain leased railcars. These charges decreased income from operations and net income by $12.5 million and $9.2 million, respectively, during the year ended December 31, 2020. There were no such expenses recorded in the years ended December 31, 2021 and December 31, 2019.
(Gain) Loss on Extinguishment of debt - During the year ended December 31, 2021, we recorded a pre-tax gain on extinguishment of debt related to the repurchase of a portion of each of the 2028 Senior Notes and the 2025 Senior Notes, which increased income before income taxes and net income by $79.9 million and $59.2 million, respectively.
During the year ended December 31, 2020, we recorded pre-tax debt extinguishment costs related to2023, in conjunction with the redemptionearly termination of the 2023 Senior NotesThird Inventory Intermediation Agreement, we incurred certain one-time exit costs, which decreased income before income taxes and net income by $22.2$13.5 million and $16.3$10.0 million, respectively. These costs are included within Interest expense, net, in our Consolidated Statement of Operations.
Gain on land sales - During the year ended December 31, 2023, we recorded a gain on the sale of a separate parcel of real property acquired as part of the Torrance refinery, but not part of the refinery itself, which increased income from operations and net income by $1.7 million and $1.3 million, respectively. During the year ended December 31, 2021, we recorded a gain on the sale of PBFXreal-property at the East Coast Terminals, which increased income from operations and net income by $2.8 million and $2.1 million, respectively. There were no such gains or losses in the year ended December 31, 2019.2022.
Gain on formation of SBR equity method investment - During the year ended December 31, 2023, we recorded a net gain resulting from the difference between the carrying value and the fair value of the assets associated with the business contributed to SBR, which increased income from operations and net income by $925.1 million and $684.6 million, respectively. There were no such gains in any other periods presented.
Change in Tax Receivable Agreement liability - During the year ended December 31, 2023, we recorded a change in the Tax Receivable Agreement liability that increased income before income taxes and net income by $2.0 million and $1.5 million, respectively. During the year ended December 31, 2022, we recorded a change in the Tax Receivable Agreement liability that decreased income before income taxes and net income by $290.3 million and $215.1 million, respectively. During the year ended December 31, 2021, PBF Energy recorded a change in the Tax Receivable Agreement liability that decreased income before income taxes and net income by $48.3 million and $35.8 million, respectively. During the year ended December 31, 2020, PBF Energy recorded a change in the Tax Receivable Agreement liability that increased income before taxes and net income by $373.5 million and $274.1 million, respectively. There was no such change during the year ended December 31, 2019. The changes in the Tax Receivable Agreement liability reflect charges or benefits attributable to changes in PBF Energy’s obligation under the Tax Receivable Agreement due to factors out of our control such as changes in tax rates, as well as periodic adjustments to our liability based, in part, on an updated estimate of the amounts that we expect to pay, using assumptions consistent with those used in our concurrent estimate of the deferred tax asset valuation allowance.
Recomputed income tax on special items - The income tax impact on special items, other than the net tax expense special item discussed below, is calculated using the tax rates shown in (2) above.
Net tax (benefit) expensebenefit on remeasurement of deferred tax assets - The deferred tax valuation allowance was reduced to zero as of December 31, 2022, therefore, there was no impact to our financial statements related to the remeasurement of deferred tax assets as of December 31, 2023. During the year ended December 31, 2022, we recorded a decrease to our deferred tax valuation allowance of $308.5 million (reducing our deferred tax valuation allowance to zero), in accordance with ASC 740, of which $233.8 million related to a tax benefit with respect to the remeasurement of deferred tax assets and the balance related to our net changes in the Tax Receivable Agreement liability. During the year ended December 31, 2021, we recorded a deferred tax valuation allowance of $308.5 million in accordance with ASC 740 (a decrease of $49.9 million when compared to December 31, 2020, which includesincluded a tax benefit of approximately $12.5 million related to our net change in the Tax Receivable Agreement liability and a net tax benefit of $37.4 million related primarily to the remeasurement of deferred tax assets). During
Recomputed income tax on special items - The income tax impact on these special items, other than the year ended December 31, 2020, we recorded a deferred tax valuation allowance of $358.4 million. This amount includes tax expense of approximately $99.3 million related to our net change in the Tax Receivable Agreement liability or a net tax expense of $259.1 million related primarily tobenefit special item discussed above, is calculated using the remeasurement of deferred tax assets. There was no such expenserates shown in the year ended December 31, 2019.
(4) Represents an adjustment to weighted-average diluted shares outstanding to assume the full exchange of existing PBF LLC Series A Units as described in (1) above.
(5) Represents weighted-average diluted shares outstanding assuming the conversion of all common stock equivalents, including options and warrants for PBF LLC Series A Units and performance share units and options for shares of PBF Energy Class A common stock as calculated under the treasury stock method (to the extent the impact of such exchange would not be anti-dilutive) for the years ended December 31, 2021, 20202023, 2022 and 2019,2021, respectively. Common stock equivalents exclude the effects of performance share units and options and warrants to purchase 12,568,275, 14,446,89418,431, 3,877,035 and 6,765,52612,568,275 shares of PBF Energy Class A common stock and PBF LLC Series A Units because they are anti-dilutive for the years ended December 31, 2021, 20202023, 2022 and 2019,2021, respectively. For periods showing a net loss, all common stock equivalents and unvested restricted stock are considered anti-dilutive.
| | | | | | | | | | | | | | | | | | | | |
| | | | December 31, | | December 31, |
| | | | 2023 | | 2022 |
| | | | (in millions) |
| Total equity | $ | 6,631.3 | | | $ | 5,056.0 | |
| Special Items (Note 4) | | | |
| | | |
| Add: LCM inventory adjustment - SBR | 38.7 | | | — | |
| Add: Change in fair value of contingent consideration, net | (58.8) | | | (13.0) | |
| Add: Gain on land sales | (89.5) | | | (87.8) | |
| Add: Gain on formation of SBR equity method investment | (925.1) | | | — | |
| Add: Loss on extinguishment of debt and termination of Inventory Intermediation Agreement | 53.1 | | | 33.9 | |
| Add: Change in Tax Receivable Agreement liability | (327.3) | | | (325.3) | |
| Add: Cumulative historical equity adjustments (a) | (130.2) | | | (130.2) | |
| Less: Recomputed income tax on special items | 365.2 | | | 126.9 | |
| Net impact of special items to equity | (1,073.9) | | | (395.5) | |
| Total equity excluding special items | $ | 5,557.4 | | | $ | 4,660.5 | |
(a) Refer to the Company’s 2022 Annual Report on Form 10-K (“Notes to Non-GAAP Financial Measures” within Management’s Discussion and Analysis of Financial Condition and Results of Operations) for a listing of special items included in cumulative historical equity adjustments prior to 2023.
Liquidity and Capital Resources
Overview
Our primary sources of liquidity are our cash flows from operations, cash and cash equivalents and borrowing availability under our credit facilities,facility, as described below. Starting in the first quarter of 2020, the COVID-19 pandemic and the related worldwide economic slowdown, including travel restrictions and stay-at-home orders, resulted in a significant decrease in the demand for and market prices ofWe believe that our products, which in turn negatively impacted our results ofcash flows from operations and overall liquidity. In 2021, demandavailable capital resources will be sufficient to meet our and our subsidiaries’ capital expenditures, working capital needs, dividend payments, debt service requirements, share repurchases under our share repurchase program, as well as PBF Energy’s obligations under the Tax Receivable Agreement, for refined products startedthe next twelve months. However, our ability to recover following the lifting or easing of these restrictions by many governmental authoritiesgenerate sufficient cash flow from operations depends, in part, on petroleum oil market pricing and the distribution of COVID-19 vaccinesgeneral economic, political and other protective measures. We continue to be focused on assessing and adapting to the challenging operating environment and evaluatingfactors beyond our strategic measures to improve liquidity and strengthencontrol. As of December 31, 2023, we are in compliance with all covenants, including financial covenants, in all our balance sheet. Our response to the current economic environment and its impact on our liquidity is more fully described in the “Liquidity” section below.debt agreements.
Cash Flow Analysis
Cash Flows from Operating Activities
Net cash provided by operating activities was $477.3$1,338.5 million for the year ended December 31, 20212023 compared to net cash used inprovided by operating activities of $631.6$4,772.0 million for the year ended December 31, 2020.2022. Our overall increaseoperating cash flows for the year ended December 31, 2023 included our net income of $2,162.0 million, depreciation and amortization of $591.6 million, deferred income taxes of $537.0 million, stock-based compensation of $51.5 million, pension and other post-retirement benefit costs of $47.9 million, loss from equity method investment of $45.3 million and loss on extinguishment of debt primarily related to the redemption of our 2025 Senior Notes and the amendment and restatement of the Revolving Credit Facility of $5.7 million, partially offset by a gain on formation of the SBR equity method investment of $925.1 million, net change in the fair value of the Martinez Contingent Consideration of $45.8 million, change in the Tax Receivable Agreement liability of $2.0 million, gain on sale of assets of $1.3 million, and a change in the fair value of our catalyst obligations of $1.1 million. In addition, net changes in operating assets and liabilities reflected uses of cash providedof $1,127.2 million driven by inventory purchases and payments for accrued expenses. The change in accrued expenses was due primarily to a decrease in renewable energy and emissions obligations, as a result of a decrease in our unfunded RINs obligation.
Our operating activities wascash flows for the year ended December 31, 2022 included our net income of $2,972.8 million, and net changes in operating assets and liabilities reflecting cash proceeds of $341.0 million, primarily driven by timing of payments for accrued expenses. Change in accrued expenses was due primarily to an increase in renewable energy credit and emissions obligations, as a result of an increase in our unfunded RINs obligation as of December 31, 2022. Our overall increase in cash provided by operating activities also included depreciation and amortization of $533.9 million, deferred income taxes of $420.2 million, change in the Tax Receivable Agreement liability of $290.3 million, net loss on extinguishment of debt primarily related to the redemption of our 2025 Senior Secured Notes of $66.1 million, stock-based compensation of $54.3 million, net change in the fair value of contingent consideration of $48.3 million, pension and other post-retirement benefit costs of $47.6 million, changes in the fair value of our catalyst obligations of $2.0 million, and loss on sale of assets of $0.9 million, partially offset by a net non-cash charges related to the change in the fair value of our inventory repurchase obligations of $5.4 million.
Net cash provided by operating activities was $4,772.0 million for the year ended December 31, 2022 compared to net cash provided by operating activities of $477.3 million for the year ended December 31, 2021. Our operating cash flows for the year ended December 31, 2021 included our net income of $315.5 million, depreciation and amortization of $483.8 million, net changes in operating assets and liabilities reflectingreflected cash proceeds of $268.6 million primarily driven by accrued expenses due to an increase in renewable energy credit and emissions obligations, as a result of an increase in our unfunded RIN’s obligations as of December 31, 2021, pension and other post-retirement benefitbenefits costs of $50.8 million, change in the Tax Receivable Agreement liability of $48.3 million, stock-based compensation of $35.6 million, change in the fair value of contingent consideration of $32.4 million, and deferred income taxes of $11.7 million, partially offset by a net non-cash benefit of $669.6 million relatingrelated to an LCM inventory adjustment, gain on extinguishment of debt related to the repurchase of a portion of our 2028 Senior Notes and 2025 Senior Notes of $79.9 million, changeschange in the fair value of our catalyst obligations of $8.5 million, net non-cash charges related to the change in the fair value of our inventory repurchase obligations of $8.4 million, and gain on sale of assets of $3.0 million. Our operating cash flows for the year ended December 31, 2020 included our net loss of $1,333.3 million, gain on sale of assets of $477.8 million mainly related to the sale of the hydrogen plants and the sale of land at our Torrance refinery, change in the Tax Receivable Agreement liability of $373.5 million, net non-cash charges relating to the change in the fair value of our inventory repurchase obligations of $12.6 million and change in the fair value of the contingent consideration of $93.7 million, partially offset by depreciation and amortization of $581.1 million, net non-cash charge of $268.0 million related to an LCM inventory adjustment, impairment expense of $98.8 million, pension and other post-retirement benefits costs of $55.7 million, stock-based compensation of $34.2 million, debt extinguishment costs related to the early redemption of our 2023 Senior Notes of $22.2 million, change in the fair value of our catalyst obligations of $11.8 million and deferred income taxes of $1.6 million. In addition, net changes in operating assets and liabilities reflects cash inflows of $585.9 million driven by the timing of inventory purchases, payments for accrued expenses and accounts payable and collections of accounts receivable.
Net cash used in operating activities was $631.6 million for the year ended December 31, 2020 compared to net cash provided by operating activities of $933.5 million for the year ended December 31, 2019. Our operating cash flows for the year ended December 31, 2019 included our net income of $375.2 million, depreciation and amortization of $447.5 million, deferred income tax expense of $103.7 million, pension and other post-retirement benefits costs of $44.8 million, stock-based compensation of $37.3 million, net non-cash charges relating to the change in the fair value of our inventory repurchase obligations of $25.4 million, and changes in the fair value of our catalyst obligations of $9.7 million, partially offset by a net non-cash benefit of $250.2 million relating to an LCM inventory adjustment, a gain on sale of assets of $29.9 million and change in fair value of contingent consideration of $0.8 million. In addition, net changes in operating assets and liabilities reflected cash inflows of approximately $170.8 million driven by the timing of inventory purchases, payments for accrued expenses and accounts payable and collections of accounts receivable.
Cash Flows from Investing Activities
Net cash used in investing activities was $388.5$338.6 million for the year ended December 31, 20212023 compared to $1,026.5$1,010.9 million for the year ended December 31, 2020.2022. The net cash flows used in investing activities for the year ended December 31, 20212023 was comprised of capital expenditures totaling $659.6 million, expenditures for refinery turnarounds of $473.5 million, expenditures for other assets of $40.5 million and contributions to our equity method investee of $15.4 million, partially offset by return of capital from our equity method investee of $846.0 million and proceeds from the sale of assets of $4.4 million. Net cash outflowsused in investing activities for the year ended December 31, 2022 was comprised of capital expenditures totaling $633.3 million, expenditures for refinery turnarounds of $311.6 million and expenditures for other assets of $66.0 million.
Net cash used in investing activities was $1,010.9 million for the year ended December 31, 2022 compared to $388.5 million for the year ended December 31, 2021. Net cash used in investing activities for the year ended December 31, 2021 was comprised of capital expenditures totaling $249.1 million, expenditures for refinery turnarounds of $117.7 million and expenditures for other assets of $28.9 million, partially offset by proceeds from the sale of assets $7.2 million. Net cash used in investing activities for the year ended December 31, 2020 was comprised of cash outflows of $1,176.2 million used to fund the Martinez Acquisition, capital expenditures totaling $196.2 million, expenditures for refinery turnarounds of $188.1 million and expenditures for other assets of $9.1 million, partially offset by proceeds from sale of assets of $543.1$7.2 million.
Net cash used in investing activities was $1,026.5 million for the year ended December 31, 2020 compared to $712.6 million for the year ended December 31, 2019. Net cash used in investing activities for the year ended December 31, 2019 was comprised of cash outflows of $404.9 million for capital expenditures, expenditures for refinery turnarounds of $299.3 million and expenditures for other assets of $44.7 million, partially offset by proceeds of $36.3 million related to the sale of land at our Torrance refinery.
Cash Flows from Financing Activities
Net cash used in financing activities was $1,420.0 million for the year ended December 31, 2023 compared to net cash used in financing activities of $2,899.0 million for the year ended December 31, 2022. For the year ended December 31, 2023, net cash used in financing activities consisted of the redemption of our 2025 Senior Notes of $666.2 million, share repurchases of PBF Energy’s Class A common stock of $532.5 million, redemption of the PBFX 2023 Senior Notes of $525.0 million, dividends and distributions of $111.1 million, payments related to the Martinez Contingent Consideration of $80.1 million, deferred financing costs and other costs of $35.8 million, payments on finance leases of $14.1 million, and settlement of the final precious metal catalyst obligation of $3.1 million, partially offset by cash proceeds of $496.6 million from the issuance of the 2030 Senior Notes, net of discount, transactions made in connection with stock-based compensation plans of $38.3 million, and proceeds from insurance premium financing of $13.0 million. For the year ended December 31, 2022, net cash used in financing activities consisted of the redemption of the 2025 Senior Secured Notes of $1,307.4 million, net repayments on the Revolving Credit Facility of $900.0 million, the purchase of PBFX publicly held shares in connection with the Merger Transaction of $303.7 million, share repurchases of PBF Energy’s Class A common stock of $156.4 million, net repayments on the PBFX Revolving Credit Facility of $100.0 million, dividends and distributions of $73.6 million, settlements of precious metal catalyst obligations of $56.2 million, deferred financing costs and other costs of $31.3 million, $25.9 million related to the repurchase of the principal amount outstanding of the 2028 Senior Notes and the 2025 Senior Notes, excluding accrued interest, payments on finance leases of $11.3 million, and PBFX Contingent Consideration payments of $3.1 million, partially offset by transactions made in connection with stock-based compensation plans of $67.8 million, and proceeds from insurance premium financing of $2.1 million.
Net cash used in financing activities was $2,899.0 million for the year ended December 31, 2022 compared to net cash used in financing activities of $356.8 million for the year ended December 31, 2021 compared to net cash provided by financing activities of $2,452.7 million for the year ended December 31, 2020.2021. For the year ended December 31, 2021, net cash used in financing activities consisted of $146.8 million related to the repurchase of the principal amount outstanding of the 2028 Senior Notes and the 2025 Senior Notes, excluding accrued interest, net repayments on the PBFX Revolving Credit Facility of $100.0 million, distributions and dividends of $39.7 million, net settlements of precious metal catalyst obligations of $31.7 million, payments on finance leases of $17.8 million, PBFX Contingent Consideration payments of $12.2 million, principal amortization payments onof the $35.0 million term loan (the “PBFPBF Rail Term Loan”)Loan of $7.4 million, and deferred financing costs and other of $1.2 million. For the year ended December 31, 2020, net cash provided by financing activities consisted of cash proceeds of $1,228.7 million from the issuance of the 2025 Senior Secured Notes net of related issuance costs, cash proceeds of $469.9 million from the issuance of the 2028 Senior Notes net of cash paid to redeem the 2023 Senior Notes and related issuance costs, net borrowings under our Revolving Credit Facility of $900.0 million, and proceeds from catalyst financing arrangements of $51.9 million, partially offset by net repayments on the PBFX Revolving Credit Facility of $83.0 million, net settlements of precious metal catalyst obligations of $8.8 million, distributions and dividends of $82.2 million, principal amortization payments of the PBF Rail Term Loan of $7.2 million, payments on finance leases of $12.4 million, taxes paid for net settlement of equity-based compensation of $2.1 million, repurchases of our common stock in connection with tax withholding obligations upon the vesting of certain restricted stock awards of $1.6 million and deferred financing costs and other of $0.5 million.
Net cash provided by financing activities was $2,452.7 million for the year ended December 31, 2020 compared to net cash used in financing activities of $3.3 million for the year ended December 31, 2019. For the year ended December 31, 2019, net cash used in financing activities consisted primarily of distributions and dividends of $209.2 million, principal amortization payments of the PBF Rail Term Loan of $7.0 million, settlements of catalyst obligations of $6.5 million, taxes paid for net settlement of equity-based compensation of $4.8 million, repurchases of our common stock in connection with tax withholding obligations upon the vesting of certain restricted stock awards of $4.9 million and deferred payment for the East Coast Storage Assets Acquisition of $32.0 million, partially offset by $132.5 million in net proceeds from the issuance of PBFX common units, net borrowings from the PBFX Revolving Credit Facility of $127.0 million and deferred financing costs and other of $1.6 million. Additionally, during the year ended December 31, 2019, we borrowed and repaid $1,350.0 million under our Revolving Credit Facility resulting in no net change to amounts outstanding for the year ended December 31, 2019.
The cash flow activity of PBF LLC for the years ended December 31, 2021, 2020 and 2019 is materially consistent with that of PBF Energy discussed above, other than changes in deferred income taxes and certain working capital items, which are different from PBF Energy due to certain tax related items not applicable to PBF LLC. Additionally, PBF LLC reflects net borrowings of $1.1 million, $0.1 million and $3.1 million for the years ended December 31, 2021, 2020 and 2019, respectively, related to an affiliate loan with PBF Energy, included in cash flows from financing activities, which eliminates in consolidation at PBF Energy.
Capitalization
Our capital structure was comprised of the following as of December 31, 20212023 (in millions):
| | | | | |
| December 31, 20212023 |
Debt: (1) | |
| PBF LLC debt |
| Affiliate note payable | $375.2 | |
| PBF Holding debt |
2025 Senior Secured Notes | 1,250.0 | |
| 2028 Senior Notes | 826.5 $ | 801.6 | |
20252030 Senior Notes | 669.5500.0 | |
| Revolving Credit Facility | 900.0— | |
Catalyst financing arrangements | 58.4 | |
PBF HoldingTotal debt | 3,704.4 | |
PBFX debt | |
PBFX 2023 Senior Notes$ | 525.01,301.6 | |
| PBFX Revolving Credit Facility | 100.0 |
| PBFX debt | 625.0
| |
| |
| Unamortized deferred financing costs | (35.0)(52.5) | |
Unamortized premiumdiscount | 1.4 (3.2) | |
Total PBF LLC debt, net of unamortized deferred financing costs and premiumdiscount | 4,671.0 $ | 1,245.9 | |
| |
Less: Affiliate note payableTotal Equity | (375.2)$ | 6,631.3 | |
Total PBF Energy debt, net of unamortized deferred financing costs and premiumCapitalization (2) | $ | 4,295.87,877.2 | |
| |
Total PBF Energy Equity | $ | 2,532.8 | |
Total PBF Energy Capitalization (3)
| $ | 6,828.6 | |
Total PBF Energy Debt to Capitalization Ratio | 63 | % |
(1) Refer to “Note 109 - Credit Facilities and Debt” and “Note 11 - Affiliate Note Payable - PBF LLC” of our Notes to Consolidated Financial Statements for further disclosure related to debt.
(2) Excludes the PBF LLC affiliate note payable that is eliminated at the PBF Energy level.
(3) Total Capitalization refers to the sum of debt excluding intercompany debt, plus total Equity.equity.
20212023 Debt Related Transactions
DuringSenior Notes
On September 13, 2023, we exercised our rights under the year ended December 31, 2021, we made a number of open market repurchases of our 2028 Senior Notes and our 2025 Senior Notes that resulted in the extinguishment of $173.5 million in principal of the 2028 Senior Notes and $55.5 million in principal of the 2025 Senior Notes. Total cash consideration paid to repurchase the principal amount outstanding of the 2028 Senior Notes andindenture governing the 2025 Senior Notes excludingto redeem all of the outstanding 2025 Senior Notes at a price of 100% of the aggregate principal amount thereof, plus accrued and unpaid interest totaled $146.8through the date of redemption. The aggregate redemption price for all 2025 Senior Notes approximated $664.5 million plus accrued and unpaid interest.
On August 21, 2023, we recognizedissued $500.0 million in aggregate principal amount of the 2030 Senior Notes. The net proceeds from this offering were approximately $488.8 million after deducting the initial purchasers’ discount and offering expenses. We used the net proceeds, together with cash on hand, to fully redeem the outstanding 2025 Senior Notes, as described above.
On February 2, 2023, we exercised our rights under the indenture governing the PBFX 2023 Senior Notes to redeem all of the outstanding PBFX 2023 Senior Notes at a $79.9price of 100% of the aggregate principal, plus accrued and unpaid interest through the date of redemption. The aggregate redemption price for the PBFX 2023 Senior Notes approximated $525.0 million, gaininclusive of unamortized premium and deferred financing costs. The redemption was funded using cash on hand.
Revolving Credit Facility
On August 23, 2023, we entered into the Revolving Credit Agreement. The Revolving Credit Agreement amended and restated the Prior Credit Agreement. Among other things, the Revolving Credit Agreement extended the Revolving Credit Facility through August 2028 and increased the maximum commitment amount under the facility to $3.5 billion from $2.85 billion. The commitment fees on the extinguishmentunused portion, the interest rate on advances and the fees for letters of debt duringcredit are generally consistent with the year ended December 31, 2021.We also made net repayments onPrior Credit Agreement.
On June 20, 2023, we terminated the PBFX Revolving Credit Facility. There were no outstanding borrowings under the PBFX Revolving Credit Facility as of $100.0 million andthe termination date.
Precious metal catalyst obligations
During 2023, we also settled certain of our remaining outstanding precious metalmetals financing arrangements,arrangement, resulting in a reduction toof debt of approximately $31.7$3.1 million.
We may, at any timeRefer to “Note 9 – Credit Facilities and from time to time, seek to continue to repurchase or retire our outstanding debt securities through cash purchases (and/or exchanges for equity or debt), in open-market purchases, block trades, privately negotiated transactions or otherwise, upon such terms and at such prices as we may determine. We will evaluate any such transactions in light of then-existing market conditions, taking into account our current liquidity and prospects for future access to capital, the trading pricesDebt” of our debt securities, legal requirements and contractual restrictions and economic and market conditions. The amounts involved in any such transactions, individually or in the aggregate, may be material. We are not obligatedNotes to repurchase any of our debt securities other than as set forth in the applicable indentures, and repurchases may be suspended or discontinued at any time without prior notice.Consolidated Financial Statements, for further information.
Revolving Credit FacilitiesFacility Overview
One of our primary sources of liquidity areis available borrowings availablecapacity under our revolving credit facilities.Revolving Credit Facility. As of December 31, 2021, PBF Energy2023, we had $1,341.5$1,783.5 million of cash and cash equivalents a $900.0 millionand no outstanding balancebalances under the Revolving Credit Facility and $100.0 million outstanding under the PBFX Revolving Credit Facility. PBF LLC cash and cash equivalents totaled $1,339.8 million as of December 31, 2021.
We had available capacity under revolving credit facilitiesour Revolving Credit Facility as follows at December 31, 20212023 (in millions):
| | | | | | | | | | | | | | | | | | | | | | | | | | | | | | | | |
| | Total Commitment | | Amount Borrowed as of December 31, 2021 | | Outstanding Letters of Credit | | Borrowing Base Availability | | Expiration Date |
| Revolving Credit Facility (a) | | $ | 3,400.0 | | | $ | 900.0 | | | $ | 380.1 | | | $ | 3,400.0 | | | May 2023 |
| PBFX Revolving Credit Facility | | 500.0 | | | 100.0 | | | 3.5 | | | 396.5 | | | July 2023 |
| Total Credit Facilities | | $ | 3,900.0 | | | $ | 1,000.0 | | | $ | 383.6 | | | $ | 3,796.5 | | | |
| | | | | | | | | | | | | | | | | | | | | | | | | | | | | | | | |
| | Total Commitment | | Amount Borrowed as of December 31, 2023 | | Outstanding Letters of Credit | | Borrowing Base Availability | | Expiration Date |
| Revolving Credit Facility (a) | | $ | 3,500.0 | | | $ | — | | | $ | 55.0 | | | $ | 3,445.0 | | | August 2028 |
(a) The amount available for borrowings and letters of credit under the Revolving Credit Facility is calculated according to a “borrowing base” formula based on (i) 90% of the book value of Eligible Accounts with respect to investment grade obligors plus (ii) 85% of the book value of Eligible Accounts with respect to non-investment grade obligors plus (iii) 80% of the cost of Eligible Hydrocarbon Inventory plus (iv) 100% of Cash and Cash Equivalents in deposit accounts subject to a control agreement, in each case as defined in the Revolving Credit Agreement. The borrowing base is subject to customary reserves and eligibility criteria and in any event cannot exceed $3.4$3.5 billion.
Additional Information on Indebtedness
Our debt, including our revolving credit facilitiesRevolving Credit Facility and senior notes, include certain typical financial covenants and restrictions on our subsidiaries’ ability to, among other things, incur or guarantee new debt, engage in certain business activities including transactions with affiliates and asset sales, make investments or distributions, engage in mergers or pay dividends in certain circumstances. These covenants are subject to a number of important exceptions and qualifications. We are in compliance as of December 31, 20212023 with all covenants, including financial covenants, in all of our debt agreements. For further discussion of our indebtedness and these covenants and restrictions, see “Note 109 - Credit Facilities and Debt” of our Notes to Consolidated Financial Statements.
Liquidity
As of December 31, 2021,2023, our operational liquidity was more than $2.4$4.6 billion ($2.3(more than $4.9 billion as of December 31, 2020)2022), which consists of $1.3$1.8 billion of cash, excluding cash held at PBFX, and more than $1.1$2.8 billion of borrowing availability under our Revolving Credit Facility, which includes our cash on hand. In addition, as of December 31, 2021, PBFX had approximately $430.4 million of liquidity ($331.4 million as of December 31, 2020), including approximately $33.9 million in cash, and access to approximately $396.5 million under the PBFX Revolving Credit Facility.
Due to the unprecedented events caused by the COVID-19 pandemic and the negative impact on our liquidity, we executed a plan to strengthen our balance sheet and increase our flexibility and responsiveness by incorporating certain adjustments to our operations and other cost saving measures. We remain committed to our plan in the current year with notable events within the past twelve months highlighted below:
•Extinguishment of $229.0 million of our 2028 Senior Notes and 2025 Senior Notes to date, which will result in annual cash interest savings of approximately $14.4 million.
•In October 2021, executed the Third Inventory Intermediation Agreement with J. Aron through 2024, covering certain crude oil, intermediate and finished products across our East Coast and Chalmette refineries;
•On December 31, 2020, we completed the operational reconfiguration of our East Coast Refining System comprised of our Delaware City and Paulsboro refineries. The reconfiguration resulted in the temporary idling of certain Paulsboro refinery units and overall lower throughput and inventory levels. Recurring annual operating and capital expenditures savings are expected to be approximately $100.0 million and $50.0 million, respectively, relative to average historic levels;
•Implemented and/or continued various cost reduction and cash preservation initiatives, including a significant decrease in 2021 capital expenditures and reducing 2021 operating expenses driven by minimizing discretionary activities and third-party services; and
•Continued the temporary suspension of our quarterly dividend of $0.30 per share, anticipated to preserve approximately $35.0 million of cash each quarter, to support the balance sheet.
We are actively responding to the impacts of the COVID-19 pandemic and ongoing rebalancing in the global oil markets. We continue to adjust our operational plans to the evolving market conditions and continue to target and execute reduction measures. We also remain committed to assessing other opportunities that could improve our liquidity, including by further reducing debt and/or potential sales of non-operating assets or other real property, although there can be no assurance that we will do so.
While it is impossible to estimate the duration or complete financial impact of the COVID-19 pandemic, we believe that the strategic actions we have taken, plus our cash flows from operations and available capital resources will be sufficient to meet our and our subsidiaries’ capital expenditures, working capital needs, and debt service requirements, for the next twelve months. We cannot assure you that our assumptions used to estimate our liquidity requirements will be correct because the impact that the COVID-19 pandemic is having on us and our industry is ongoing and unprecedented. The extent of the impact of the COVID-19 pandemic on our business, financial condition, results of operations and liquidity will depend largely on future developments, including the severity, location and duration of the pandemic and variants thereof, the effectiveness of the vaccine programs and other actions undertaken by national, regional and local governments and health officials to contain the virus or treat its effects, and how quickly and to what extent economic conditions improve and normal business and operating conditions resume. As a result, we may require additional capital, and, from time to time, may pursue funding strategies in the capital markets or through private transactions to strengthen our liquidity and/or fund strategic initiatives. Such additional financing may not be available at favorable terms or at all.
We may incur additional indebtedness in the future, including additional secured indebtedness, subject to the satisfaction of any debt incurrence and, if applicable, lien incurrence limitation covenants in our existing financing agreements. Although we were in compliance with incurrence covenants during the year ended December 31, 2021, to the extent that any of our activities triggered these covenants,2023, there are no assurances that conditions could not change significantly, and that such changes could adversely impact our abilityin the future we will be able to meet some of these incurrence covenants at the time that we needed to. Failure to meet the incurrence covenants could impose certain incremental restrictions on, among other matters, our ability to incur new debt (including secured debt) and also may limit the extent to which we may pay future dividends, make newacquisitions or investments, repurchase our outstanding debt or stock or incur new liens.
Share Repurchases
On December 12, 2022, our Board of Directors authorized the repurchase of up to $500.0 million of PBF Energy's Class A common stock. On May 3, 2023 our Board of Directors approved an increase in the repurchase authorization amount under the Repurchase Program from $500.0 million to $1.0 billion and extended the program expiration date to December 2025. On February 13, 2024, our of Directors approved an increase in the repurchase authorization amount under the Repurchase Program from $1.0 billion to $1.75 billion. To date, we have purchased approximately 17,606,986 shares of PBF Energy's Class A common stock under the Repurchase Program for $736.8 million, inclusive of commissions paid, through open market transactions. We may make additional share repurchases in the future, but we are not obligated to purchase any shares under the Repurchase Program, and repurchases could be suspended or discontinued at any time without prior notice.
Working Capital
PBF Energy’sOur working capital at December 31, 20212023 was approximately $1,439.5$2,379.3 million, consisting of $5,199.2$6,596.6 million in total current assets and $3,759.7$4,217.3 million in total current liabilities. PBF Energy’sOur working capital at December 31, 20202022 was $1,415.9$1,345.6 million, consisting of $3,867.4$6,546.3 million in total current assets and $2,451.5 million in total current liabilities. PBF LLC’s working capital at December 31, 2021 was approximately $1,385.6 million, consisting of $5,197.5 million in total current assets and $3,811.9 million in total current liabilities. PBF LLC’s working capital at December 31, 2020 was $1,374.1 million, consisting of $3,865.2 million in total current assets and $2,491.1$5,200.7 million in total current liabilities.
Crude and Feedstock Supply Agreements
Certain of our purchases of crude oil under our agreements with foreign national oil companies require that we post letters of credit, if open terms are exceeded, and arrange for shipment. We pay for the crude when invoiced, at which time any applicable letters of credit are lifted. We have a contract with Saudi Aramco pursuant to which we have been purchasing up to approximately 100,000 bpd of crude oil from Saudi Aramco that is processed at our Paulsboro refinery. In connection with the acquisition of the Chalmette refinery we entered into a contract with PDVSA for the supply of 40,000 to 60,000 bpd of crude oil that can be processed at any of our East or Gulf Coast refineries. We have not sourced crude oil under this agreement since 2017 when PDVSA suspended deliveries due to the parties’ inability to agree to mutually acceptable payment terms and because of U.S. government sanctions against PDVSA. Notwithstanding the suspension, the U.S. government sanctions imposed against PDVSA and Venezuela prevented us from purchasing crude oil under this agreement. In connection with the closing of the acquisition of the Torrance refinery, we entered into a crude supply agreement with ExxonMobil for approximately 60,000 bpd of crude oil that can be processed at our Torrance refinery. We currently purchase all of our crude and feedstock needs independently from a variety ofvarious suppliers, on theprimarily through short-term and spot market or throughagreements. We also have a crude supply agreement with Saudi Aramco, the term agreementsof which is currently year to year, for our Delaware Cityup to approximately 100,000 bpd that is processed at the Paulsboro refinery and Toledo refineries.
We currently have various crude supply agreements with terms through 2025 with Shell Oil ProductsTrading (US) Company (primarily serving our Martinez refinery) for approximately 145,000 bpd, in the aggregate, to support our West Coast and Mid-Continent refinery operations. In addition, we have certain offtake agreements for our West Coast system with the same counterparty for clean products with varying terms up to 15 years.approximately 95,000 bpd, which, upon expiration of one of the agreements in early 2024, will be reduced to up to approximately 65,000 bpd, through early 2025.
Inventory Intermediation Agreement
On October 25, 2021, PBF Holding and its subsidiaries, the PBF Entities, entered intoJuly 31, 2023, we early terminated the Third Inventory Intermediation Agreement with J. Aron. In conjunction with the early termination, we made an aggregate settlement payment of $268.0 million for the inventory previously held by J. Aron, pursuant to whichinclusive of $13.5 million of related costs associated with exiting the terms of the previous inventory intermediation agreements were amended and restated in their entirety, including, among other things, pricing and an extension of terms. The Third Inventory Intermediation Agreement extends the term to December 31, 2024, which term may be further extended by mutual consent of the parties to December 31, 2025. If not extended or replaced, at expiration, we will be required to repurchase the inventories outstanding under the Third Inventory Intermediation Agreement at that time. We intend to either extend or replace the Third Inventory Intermediation Agreement prior to its expiration.agreement.
At December 31, 2021, the LIFO value of the J. Aron Products included within Inventories in our Consolidated Balance Sheets was $445.2 million. We accrue a corresponding liability for such crude oil, intermediates and finished products.
Capital Spending
Capital spending was $395.7$1,173.6 million for the year ended December 31, 2021, which2023 and was primarily comprised of annual maintenance and turnaround costs at our Delaware City, Toledo, Chalmette, Torrance and Martinez refineries and spending related to the construction of our Renewable Diesel Facility co-located with our Chalmette refinery of approximately $312.7 million. Capital spending also included costs associated with safety related enhancements and facility improvements at our refineries and approximately $8.6 million of capital expenditures related to PBFX. Our 2022 estimate for maintenance, environmental, regulatory and safety capital expenditures are estimated to remain in line with our historical average of $150.0 million to $200.0 million. For the first half of 2022, welogistics assets. We currently expect to incur turnaround-related capital expenditures of approximately $200.0 million to $225.0 million primarily relating to turnarounds at our East and West Coast refineries. In addition, PBFX expects to spend an aggregate of approximately $20.0$800.0 million to $28.0$850.0 million in net capital2024 for facility improvements and refinery maintenance and turnarounds, as well as expenditures during 2022.
to meet environmental, regulatory and safety requirements.Material Cash Requirements
Our material cash requirements include the following known contractual and other obligations as of December 31, 20212023 that are expected to be paid within the next year and thereafter (in millions). The table below does not include any intercompany contractual obligations with PBFX as our related party transactions are eliminated upon consolidation of our financial statements.
| | | | | | | | | | | | | | | | | | | | | | | | | | | | | | | | |
| | Payments due by period |
| | Total | | Less than
1 year | | 1-3 Years | | 3-5 Years | | More than
5 years |
| PBF Energy: | | | | | | | | | | |
Credit facilities and debt (a) | | $ | 4,329.4 | | | $ | 58.4 | | | $ | 1,525.0 | | | $ | 1,919.5 | | | $ | 826.5 | |
| Interest payments on Credit facilities and debt | | 1,013.5 | | | 294.2 | | | 463.6 | | | 181.3 | | | 74.4 | |
| | | | | | | | | | |
Leases and other rental-related commitments (b) | | 2,409.0 | | | 266.0 | | | 415.4 | | | 363.4 | | | 1,364.2 | |
| | | | | | | | | | |
Purchase obligations (c) | | 20,237.8 | | | 8,239.8 | | | 11,359.1 | | | 400.4 | | | 238.5 | |
| | | | | | | | | | |
| | | | | | | | | | |
| | | | | | | | | | |
| Construction obligations | | 127.5 | | | 127.5 | | | — | | | — | | | — | |
Environmental obligations (d) | | 163.6 | | | 14.9 | | | 29.5 | | | 16.6 | | | 102.6 | |
Pension and post-retirement obligations (e) | | 330.3 | | | 26.1 | | | 33.4 | | | 33.5 | | | 237.3 | |
| | | | | | | | | | |
Contingent consideration (f) | | 42.6 | | | 2.9 | | | 39.7 | | | — | | | — | |
| Total material cash requirements for PBF Energy | | $ | 28,653.7 | | | $ | 9,029.8 | | | $ | 13,865.7 | | | $ | 2,914.7 | | | $ | 2,843.5 | |
| Adjustments for PBF LLC: | | | | | | | | | | |
| | | | | | | | | | |
Add: Affiliate Note Payable (g) | | 375.2 | | | — | | | — | | | — | | | 375.2 | |
| | | | | | | | | | |
| Total material cash requirements for PBF LLC | | $ | 29,028.9 | | | $ | 9,029.8 | | | $ | 13,865.7 | | | $ | 2,914.7 | | | $ | 3,218.7 | |
| | | | | | | | | | | | | | | | | | | | |
| | Payments Due by Period |
| | Short-Term | | Long-Term | | Total |
Credit facilities and debt (a) | | $ | — | | | $ | 1,301.6 | | | $ | 1,301.6 | |
| Interest payments on credit facilities and debt | | 91.8 | | | 409.8 | | | 501.6 | |
Leases and other rental-related commitments (b) | | 382.6 | | | 1,906.7 | | | 2,289.3 | |
Purchase obligations (c) | | 5,840.8 | | | 624.6 | | | 6,465.4 | |
| Construction obligations | | 145.0 | | | — | | | 145.0 | |
Environmental obligations (d) | | 16.0 | | | 150.6 | | | 166.6 | |
Pension and post-retirement obligations (e) | | 32.0 | | | 365.1 | | | 397.1 | |
Tax Receivable Agreement obligation (f) | | 43.0 | | | 293.6 | | | 336.6 | |
| Total material cash requirements | | $ | 6,551.2 | | | $ | 5,052.0 | | | $ | 11,603.2 | |
___________________________
(a) Credit facilities and debt
Credit facilities and debt represent (i) the repayment of the outstanding borrowings under the Revolving Credit Facility; (ii) the repayment of indebtedness incurred in connection with the 2025 Senior Secured Notes, 20282030 Senior Notes and 20252028 Senior Notes; (iii) the repayment of our catalyst financing obligations on their maturity dates; and (iv) the repayment of outstanding amounts under the PBFX Revolving Credit Facility and the PBFX 2023 Senior Notes. With the exception of our catalyst financing obligations, we have no debt maturing before 2023 as of December 31, 2021.2025.
Refer to “Note 109 - Credit Facilities and Debt” of our Notes to Consolidated Financial Statements for further disclosure related to debt.
(b) Leases and other rental-related commitments
Operating and Finance lease obligations include options to extend terms that are reasonably certain of being exercised. We have entered into certain agreements for the supply of hydrogen that contain both lease and non-lease components. The table above also includes such non-lease components of these agreements. See “Note 1512 - Leases” of our Notes to Consolidated Financial Statements for further details and disclosures regarding our operating and finance lease obligations.
We also enter into contractual obligations with third parties for the right to use property for locating pipelines and accessing certain of our assets (also referred to as land easements) in the normal course of business. Our obligations regarding such land easements are included within Leases and other rental-related commitments in the table above.
(c) Purchase obligations
We have obligations to repurchase the J. Aron Products under the Third Inventory Intermediation Agreement with J. Aron as further explained in “Note 2 - Summary of Significant Accounting Policies”, “Note 6 - Inventories” and “Note 9 - Accrued Expenses” of our Notes to Consolidated Financial Statements. Additionally, purchasePurchase obligations include commitments to purchase crude oil from certain counterparties under supply agreements, contracts for the transportation of crude oil and supply of hydrogen, nitrogen, oxygen, chemicals, steam, or natural gas to certain of our refineries, contracts for the treatment of wastewater, contracts for pipeline capacity, and forward purchase commitments to acquire AB 32, RINs or LCFS credits from third parties.
The amounts included in this table exclude our crude supply agreement with PDVSA. We have not sourced crude oil under this agreement since the third quarter of 2017 as PDVSA has suspended deliveries due to the parties inability to agree to mutually acceptable payment terms and because of U.S. government sanctions against PDVSA.
(d) Environmental obligations
In connection with certain of our refinery and logistics acquisitions, we have assumed certain environmental remediation obligations to address matters that were outstanding at the time of such acquisitions. In addition, in connection with most of these acquisitions, we have purchased environmental insurance policies to insure against unknown environmental liabilities at each site. The obligations in the table above reflect our undiscounted best estimate in cost and tenure to remediate our outstanding obligations and are further discussed in “Note 1411 - Commitments and Contingencies” of our Notes to Consolidated Financial Statements.
(e) Pension and post-retirement obligations
Pension and post-retirement obligations include only those amounts we expect to pay out in benefit payments and are further explained in “Note 1916 - Employee Benefit Plans” of our Notes to Consolidated Financial Statements.
(f) Contingent ConsiderationTax Receivable Agreement obligation
Contingent consideration includes our obligationsThe table reflects PBF Energy’s estimated timing of payments under the Tax Receivable Agreement, assuming that we earn sufficient taxable income to pay certain contractual earn-outs entered into as part of acquisitions. Our earn-out obligation relatedrealize all tax benefits that are subject to the Martinez Acquisition includes the estimated undiscounted Contingent Consideration amounts payableTax Receivable Agreement as of December 31, 2023. Refer to Shell Oil Products related to the annual earn-out payments through 2023. Our earn-out obligation related to the East Coast Storage Assets Acquisition and our amount payable to Crown Point relates to our year one earn-out obligation payable in 2022 with no future estimated earn-out obligations for years thereafter.
(g) Affiliate Note Payable
As described in “Note 11 - Affiliate Note PayableCommitments and Contingencies” and “Note 18 - PBF LLC”Income Taxes” of our Notes to the Consolidated Financial Statements, asstatements for further discussion of the Tax Receivable Agreement. The short-term portion of our Tax Receivable Agreement obligation at December 31, 2021, PBF LLC had an outstanding note payable with PBF Energy for an aggregate principal amount of $375.2 million. The note has an interest rate of 2.5% and matures2023 was paid in April 2030, but may be prepaid in whole or in part at any time, at the option of PBF LLC without penalty or premium. This affiliate note payable is a cash obligation of PBF LLC only and eliminates in consolidation for PBF Energy.January 2024.
Tax Distributions
PBF LLC is required to make periodic tax distributions to the members of PBF LLC, including PBF Energy, pro rata in accordance with their respective percentage interests for such period (as determined under the amended and restated limited liability company agreement of PBF LLC), subject to available cash and applicable law and contractual restrictions (including pursuant to our debt instruments) and based on certain assumptions. Generally, these tax distributions will be an amount equal to our estimate of the taxable income of PBF LLC for the year multiplied by an assumed tax rate equal to the highest effective marginal combined U.S.
federal, state and local income tax rate prescribed for an individual or corporate resident in New York, New York (taking into account the nondeductibility of certain expenses). If, with respect to any given calendar year, the aggregate periodic tax distributions were less than the actual taxable income of PBF LLC multiplied by the assumed tax rate, PBF LLC will make a “true up” tax distribution, no later than March 15 of the following year, equal to such difference, subject to the available cash and borrowings of PBF LLC. As these distributions are conditional, they have been excluded from the table above.
Critical Accounting Policies
The following summary provides further information about our critical accounting policies that involve critical accounting estimates and should be read in conjunction with “Note 2 - Summary of Significant Accounting Policies” of our Notes to Consolidated Financial Statements. The following accounting policies involve estimates that are considered critical due to the level of subjectivity and judgment involved, as well as the impact on our financial position and results of operations. We believe that all of our estimates are reasonable. Unless otherwise noted, estimates of the sensitivity to earnings that would result from changes in the assumptions used in determining our estimates is not practicable due to the number of assumptions and contingencies involved, and the wide range of possible outcomes.
Inventory
Inventories are carried at the lower of cost or market. The cost of crude oil, feedstocks, blendstocks and refined products is determined under the LIFO method using the dollar value LIFO method with increments valued based on average cost during the year. The cost of supplies and other inventories is determined principally on the weighted average cost method. In addition, the use of the LIFO inventory method may result in increases or decreases to cost of sales in years that inventory volumes decline as the result of charging cost of sales with LIFO inventory costs generated in prior periods. At December 31, 20212023 and December 31, 2022 the replacement value of inventories exceeded the LIFO carrying value. At December 31, 2020, market values had fallen below historical LIFO inventory costs and, as a result, we recorded an LCM or market inventory valuation reserve of $669.6 million. The LCM or market inventory valuation reserve, or a portion thereof, is subject to reversal as a reduction to cost of products sold in subsequent periods as inventories giving rise to the reserve are sold, and a new reserve is established. Such a reduction to cost of products sold could be significant if inventory values return to historical cost price levels. Additionally, further decreases in overall inventory values could result in additional charges to cost of products sold should the LCM or market inventory valuation reserve be increased.
Environmental Matters
Liabilities for future clean-up costs are recorded when environmental assessments and/or clean-up efforts are probable, and the costs can be reasonably estimated. Other than for periodic assessments, the timing and magnitude of these accruals generally are based on the completion of investigations or other studies or a commitment to a formal plan of action. Environmental liabilities are based on best estimates of probable future costs using currently available technology and applying current regulations, as well as our own internal environmental policies. The actual settlement of our liability for environmental matters could materially differ from our estimates due to a number of uncertainties such as the extent of contamination, changes in environmental laws and regulations, potential improvements in remediation technologies and the participation of other responsible parties. While we believe that our current estimates of the amounts and timing of the costs related to the remediation of these liabilities are reasonable, we have had limited prior exposure to certain of these environmental obligations due to our short operating history with certain of our assets. Itit is possible that our estimates of the costs and duration of the environmental remediation activities related to these liabilities could materially change.
Evaluation of Variable Interest Entities ("VIEs")Business Combinations
We useOur consolidated financial statements include the acquisition method of accounting for the recognition of assets acquired and liabilities assumed in business combinations at their estimated fair values as of the date of acquisition. Any excess consideration transferred over the estimated fair values of the identifiable net assets acquired is recorded as goodwill. Significant judgment is required in estimating the fair value of assets acquired. As a result, in the case of significant acquisitions, we obtain the assistance of third-party valuation specialists in estimating fair values of tangible and intangible assets based on available historical information and on expectations and assumptions about the future, considering the perspective of marketplace participants. While management believes those expectations and assumptions are reasonable, they are inherently uncertain. Unanticipated market or macroeconomic events and circumstances may occur, which could affect the accuracy or validity of the estimates and assumptions.
Certainfinancial statements of our acquisitions may include earn-out provisionssubsidiaries and VIEs, of which we are the primary beneficiary. We evaluate all legal entities in which we hold an ownership or other forms of contingent consideration. As offinancial interest to determine if the acquisition date, we record contingent consideration, as applicable, at the estimated fair value of expected future payments associatedentity is a VIE. Variable interests can be contractual, ownership or other financial interests in an entity that change with the earn-out. Any changes to the recorded fair value of contingent consideration, subsequent to the measurement period, will be recognized as earnings in the period in which it occurs. Such contingent consideration liabilities are based on best estimates of future expected payment obligations, which are subject to change due to many factors outside of our control. Changes to the estimate of expected future contingent consideration payments may occur, from time to time, due to various reasons, including actual results differing from estimates and adjustments to the revenue or earnings assumptions used as the basis for the liability based on historical experience. While we believe that our current estimate of the fair value of our contingent consideration liability is reasonable, it is possible that the actual future settlement of our earn-out obligations could materially differ.
Deferred Turnaround Costs
Refinery turnaround costs, which are incurred in connection with planned major maintenance activities at our refineries, are capitalized when incurred and amortized on a straight-line basis over the period of time estimated until the next turnaround occurs (generally three to six years). While we believe that the estimates of time until the next turnaround are reasonable, it should be noted that factors such as competition, regulation or environmental matters could cause us to change our estimates thus impacting amortization expense in the future.
Derivative Instruments
We are exposed to market risk, primarily related to changes in commodity prices for the crude oil and feedstocks used in the refining process, as well as the prices of the refined products sold and the risk associated with the price of credits needed to comply with various governmental and regulatory environmental compliance programs. The accounting treatment for commodity and environmental compliance contracts depends on the intended use of the particular contract and on whether or not the contract meets the definition of a derivative. Non-derivative contracts are recorded at the time of delivery.
All derivative instruments that are not designated as normal purchases or sales are recorded in our Consolidated Balance Sheets as either assets or liabilities measured at their fair values. Changes in the fair value of derivative instruments that eitherthe VIE’s assets. If we are not designatedthe primary beneficiary, the general partner or do not qualifyanother limited partner may consolidate the VIE, and we record the investment as an equity method investment. Significant judgment is exercised in determining that a legal entity is a VIE and in evaluating whether we are the primary beneficiary in a VIE. Generally, the primary beneficiary is the party that has both the power to direct the activities that most significantly impact the VIE’s economic performance and the right to receive benefits or obligation to absorb losses that could be potentially significant to the VIE. We evaluate the entity’s need for hedge accounting treatment continuing financial support; the equity holder’s lack of a controlling financial interest; and/or normal purchaseif an equity holder’s voting interests are disproportionate to its obligation to absorb expected losses or normal sale accountingreceive residual returns. We evaluate our interests in a VIE to determine whether we are recognized in income. Contracts qualifying for the normal purchases and sales exemptionprimary beneficiary. We use a primarily qualitative analysis to determine if we are accounted for upon settlement. We elect fair value hedge accounting for certain derivatives associated with our inventory repurchase obligations.
Derivative accounting is complex and requires management judgmentdeemed to have a controlling financial interest in the following respects: identificationVIE, either on a standalone basis or as part of derivativesa related party group. We continually monitor our interests in legal entities for changes in the design or activities of an entity and embedded derivatives; determination ofchanges in our interests, including our status as the fair value of derivatives; identification of hedge relationships; assessment and measurement of hedge ineffectiveness; and election and designation ofprimary beneficiary to determine if the normal purchases and sales exception. All of these judgments, depending upon their timing and effect, can have a significant impact on earnings.changes require us to revise our previous conclusions.
Impairment of Long-Lived Assets
We evaluate long-lived assets for impairment on a continual basis and reassess the reasonableness of their related useful lives whenever events or changes in circumstances warrant assessment. Possible triggering events may include, among other things, significant adverse changes in the business climate, market conditions, environmental regulations or a determination that it is more likely than not that an asset or an asset group will be sold or retired before its estimated useful life. These possible triggering events of impairment may impact our assumptions related to future throughput levels, future operating revenues, expenses and gross margin, levels of anticipated capital expenditures and remaining useful life. Long-lived assets are tested for recoverability whenever events or changes in circumstances indicate that the carrying amount of the asset may not be recoverable. A long-lived asset is not recoverable if its carrying amount exceeds the sum of the undiscounted cash flows expected to result from its use and eventual disposition. Cash flows for long-lived assets/asset groups are determined at the lowest level for which identifiable cash flows exist. The cash flows from the refinery asset groups are evaluated individually regardless of product mix or fuel type produced. If a long-lived asset is not recoverable, an impairment loss is recognized for the amount by which the carrying amount of the long-lived asset exceeds its fair value, with fair value determined based on discounted estimated net cash flows or other appropriate methods. Our assumptions incorporate inherent uncertainties that are at times difficult to predict and could result in impairment charges or accelerated depreciation in future periods if actual results materially differ from the estimated assumptions used.
Income Taxes and Tax Receivable Agreement
As a result of PBF Energy’s acquisition of PBF LLC Series A Units or exchanges of PBF LLC Series A Units for PBF Energy Class A common stock, it expects to benefit from amortization and other tax deductions reflecting the step up in tax basis in the acquired assets. Those deductions will be allocated to PBF Energy and will be taken into account in reporting its taxable income. As a result of a federal income tax election made by PBF LLC, applicable to a portion of PBF Energy’s acquisition of PBF LLC Series A Units, the income tax basis of the assets of PBF LLC, underlying a portion of the units PBF Energy acquired, has been adjusted based upon the amount that PBF Energy paid for that portion of its PBF LLC Series A Units. PBF Energy entered into the Tax Receivable Agreement which provides for the payment by PBF Energy equal to 85% of the amount of the benefits, if any, that it is deemed to realize as a result of (i) increases in tax basis and (ii) certain other tax benefits related to entering into the Tax Receivable Agreement, including tax benefits attributable to payments under the Tax Receivable Agreement. As a result of these transactions, PBF Energy’s tax basis in its share of PBF LLC’s assets will be higher than the book basis of these same assets. This resulted in a deferred tax asset of $141.2$171.6 million as of December 31, 2021.2023.
Deferred taxes are calculated using a liability method, whereby deferred tax assets are recognized for deductible temporary differences and deferred tax liabilities are recognized for taxable temporary differences. Temporary differences represent the differences between reported amounts of assets and liabilities and their tax bases. Deferred tax assets are reduced by a valuation allowance when, in the opinion of management, it is more likely than not that some portion or all of the deferred tax assets will not be realized. Deferred tax assets and liabilities are adjusted for the effect of changes in tax laws and rates on the date of enactment. We recognize tax benefits for uncertain tax positions only if it is more likely than not that the position is sustainable based on its technical merits. Interest and penalties on uncertain tax positions are included as a component of the provision for income taxes on the Consolidated Statements of Operations. As a result of management’s assessment of the available positive and negative evidence to estimate whether sufficient future taxable income will be generated to permit use of the existing deferred tax assets as of December 31, 2021, a valuation allowance of $308.5 million was recorded to recognize only the portion of deferred tax assets that are more likely than not to be realized. The amount of the deferred tax assets considered realizable, however, could be adjusted if estimates of future taxable income are reduced or increased or if objective negative evidence in the form of cumulative losses is no longer present and additional weight is given to subjective evidence such as our projections for future taxable income. As a result of the valuation allowance, the liability associated with the Tax Receivable Agreement was $48.3 million as of December 31, 2021.
Pursuant to the Tax Receivable Agreement PBF Energy entered into at the time of its initial public offering, it is required to pay the current and former PBF LLC Series A unitholders, or their permitted assignees, who exchange their units for PBF Energy stock or whose units we purchase, approximately 85% of the cash savings in income taxes that PBF Energy is deemed to realize as a result of the increase in the tax basis of its interest in PBF LLC, including tax benefits attributable to payments made under the Tax Receivable Agreement. These payment obligations are of PBF Energy and not of PBF LLC or any of its subsidiaries. PBF Energy has recognized a liability for the Tax Receivable Agreement reflecting its estimate of the undiscounted amounts that it expects to pay under the agreement. PBF Energy’s estimate of the Tax Receivable Agreement liability is based, in part, on forecasts of future taxable income over the anticipated life of PBF Energy’s future business operations, assuming no material changes in the relevant tax law. The assumptions used in the forecasts are subject to substantial uncertainty about PBF Energy’s future business operations and the actual payments that it is required to make under the Tax Receivable Agreement could differ materially from its current estimates. PBF Energy must adjust the estimated Tax Receivable Agreement liability each time we purchase PBF LLC Series A Units or upon an exchange of PBF LLC Series A Units for PBF Energy Class A common stock. Such adjustments will be based on forecasts of future taxable income and PBF Energy’s future business operations at the time of such purchases or exchanges. Periodically, PBF Energy may adjust the liability based on an updated estimate of the amounts that it expects to pay, using assumptions consistent with those used in its concurrent estimate of the deferred tax asset valuation allowance. These periodic adjustments to the Tax Receivable Agreement liability, if any, are recorded in general and administrative expense and may result in adjustments to our income tax expense and deferred tax assets and liabilities.
Recent Accounting Pronouncements
Refer to “Note 2 - Summary of Significant Accounting Policies” of our Notes to Consolidated Financial Statements, for Recently Issued Accounting Pronouncements.
ITEM 7A. QUANTITATIVE AND QUALITATIVE DISCLOSURES ABOUT MARKET RISK
We are exposed to market risks, including changes in commodity prices and interest rates. Our primary commodity price risk is associated with the difference between the prices we sell our refined products and the prices we pay for crude oil and other feedstocks. We may use derivative instruments to manage the risks from changes in the prices of crude oil and refined products, natural gas, interest rates, or to capture market opportunities.
Commodity Price Risk
Our earnings, cash flow and liquidity are significantly affected by a variety of factors beyond our control, including the supply of, and demand for, crude oil, other feedstocks, refined products and natural gas. The supply of and demand for these commodities depend on, among other factors, changes in domestic and foreign economies, weather conditions, domestic and foreign political affairs, planned and unplanned downtime in refineries, pipelines and production facilities, production levels, the availability of imports, the marketing of competitive and alternative fuels, and the extent of government regulation. As a result, the prices of these commodities can be volatile. Our revenues fluctuate significantly with movements in industry refined product prices, our cost of sales fluctuates significantly with movements in crude oil and feedstock prices and our operating expenses fluctuate with movements in the price of natural gas. We manage our exposure to these commodity price risks through our supply and offtake agreements as well as through the use of various commodity derivative instruments.
We may use non-trading derivative instruments to manage exposure to commodity price risks associated with the purchase or sale of crude oil and feedstocks, finished products and natural gas outside of our supply and offtake agreements. The derivative instruments we use include physical commodity contracts and exchange-traded and over-the-counter financial instruments. We mark-to-market our commodity derivative instruments and recognize the changes in their fair value in our statements of operations.
The negative impact of the unprecedented global health and economic crisis sparked by the COVID-19 pandemic, combined with uncertainty around future output levels of the world’s largest oil producers increased unpredictability in oil supply and demand resulting in an economic challenge to our industry which has not occurred since our formation. This combination resulted in significant reduction in demand for our refined products and abnormal volatility in oil commodity prices. Demand for and market prices of most of our products started to recover following the lifting or easing of these restrictions by many governmental authorities and the distribution of the COVID-19 vaccines at the beginning of 2021.
At December 31, 20212023 and December 31, 2020,2022, we had gross open commodity derivative contracts representing 42.129.1 million barrels and 10.030.1 million barrels, respectively, with an unrealized net lossgain of $12.0$33.2 million and unrealized net loss of $3.0$13.9 million, respectively. The open commodity derivative contracts as of December 31, 20212023 expire at various times during 2022 and 2023.2024.
We carry inventories of crude oil, intermediates and refined products (“hydrocarbon inventories”) on our Consolidated Balance Sheets, the values of which are subject to fluctuations in market prices. Our hydrocarbon inventories totaled approximately 30.236.2 million barrels and 28.232.8 million barrels at December 31, 20212023 and December 31, 2020,2022, respectively. The average cost of our hydrocarbon inventories was approximately $78.29$83.64 and $78.64$80.04 per barrel on a LIFO basis at December 31, 20212023 and December 31, 2020,2022, respectively. TheAt December 31, 2020 results exclude the net impact of an LCM inventory adjustment of approximately $669.6 million, whereas at2023 and December 31, 2021,2022, the replacement value of inventory exceeded the LIFO carrying value. If market prices of our inventory decline to a level below our average cost, we may be required to write down the carrying value of our hydrocarbon inventories to market.
Our predominant variable operating cost is energy, which is comprised primarily of natural gas and electricity. We are therefore sensitive to movements in natural gas prices. Assuming normal operating conditions, we annually consume a total of betweenexpect our annual consumption to range from 75 million andto 95 million MMBTUs of natural gas amongst our six refineries as of December 31, 2021.refineries. Accordingly, a $1.00 per MMBTU change in natural gas prices would increase or decrease our natural gas costs by approximately $75.0 million to $95.0 million.
Compliance Program Price Risk
We are exposed to market risks related to our obligations to buy and the volatility in the price of credits needed to comply with various governmental and regulatory compliance programs, which includesinclude RINs, required to comply with the Renewable Fuel Standard.RFS. Our overall RINs obligation is based on a percentage of our domestic shipments of on-road fuels as established by EPA. To the degree we are unable to blend the required amount of biofuels to satisfy our RINs obligation, we must purchase RINs on the open market. To mitigate the impact of the market risk relating to our obligations on our results of operations and cash flows, we may elect to purchase RINs or other environmental credits as part of our liability management strategy. We also have the ability to purchase RINs directly from SBR.
In addition, we are exposed to risks associated with complying with federal and state legislative and regulatory measures to address greenhouse gasGHG and other emissions. Requirements to reduce emissions could result in increased costs to operate and maintain our facilities as well as implement and manage new emission controls and programs put in place. For example, in September 2016, the state of California enacted AB 32, which further reduces greenhouse gas emission targets to 40% below 1990 levels by 2030. Compliance with such emission standards may require the purchase of emission credits or similar instruments.
Certain of these compliance contracts or instruments qualify as derivative instruments. For certain of these contracts, we elect the normal purchase normal sale exception under ASC 815, Derivatives and Hedging for such instruments, and therefore do not record these contracts at their fair value.
Interest Rate Risk
The maximum commitment under our Revolving Credit Facility is $3.4$3.5 billion. Borrowings under the Revolving Credit Facility bear interest either at the Alternative Base Rate plus the Applicable Margin or at Adjusted LIBORthe Term SOFR plus the Applicable Margin, all as defined in the Revolving Credit Agreement. At December 31, 2021,2023, we had $900.0 millionno outstanding balance in variable interest debt. If this facility was fully drawn, a 1.0% change in the interest rate would increase or decrease our interest expense by approximately $23.6$23.7 million annually.
The PBFX Revolving Credit Facility, with a maximum commitment of $500.0 million, bears interest either at the Alternative Base Rate plus the Applicable Margin or at Adjusted LIBOR plus the Applicable Margin, all as defined in the PBFX Revolving Credit Agreement. At December 31, 2021, PBFX had $100.0 million outstanding in variable interest debt. If this facility was fully drawn, a 1.0% change in the interest rate would increase or decrease our interest expense by approximately $4.0 million annually.
We also have interest rate exposure in connection with our Third Inventory Intermediation Agreement under which we pay a time value of money charge based on LIBOR.
Credit Risk
We are subject to risk of losses resulting from nonpayment or nonperformance by our counterparties. We continue to closely monitor the creditworthiness of customers to whom we grant credit and establish credit limits in accordance with our credit policy.
Concentration Risk
For the years ended December 31, 20212023 and December 31, 2020,2022, only one customer, Shell, accounted for 10% or more of our revenues (approximately 15%14% and 13%14%, respectively). For the year ended December 31, 2019, no single customer accounted for 10% or more of our revenues.
As of December 31, 20212023 and December 31, 2020,2022, only one customer, Shell, accounted for 10% or more of our total trade accounts receivable (approximately 19% and 26% and 16%19%, respectively).
ITEM 8. FINANCIAL STATEMENTS AND SUPPLEMENTARY DATA
The information required by this item is set forth beginning on page F-1 of this Annual Report on Form 10-K.
ITEM 9. CHANGES IN AND DISAGREEMENTS WITH ACCOUNTANTS ON ACCOUNTING AND FINANCIAL DISCLOSURE
None.
ITEM 9A. CONTROLS AND PROCEDURES
Disclosure Controls and Procedures
PBF Energy and PBF LLCWe conducted separate evaluations, under the supervision and with the participation of each company’sour management, including the principal executive officer and principal financial officer, of the effectiveness of the disclosure controls and procedures (as defined in Rule 13a-15(e) under the Securities Exchange Act of 1934 as amended (the “Exchange Act”)) as of the end of the period covered by this report. Based upon these evaluations as required by Exchange Act Rule 13a-15(b), the principal executive officer and principal financial officer in each case, concluded that the disclosure controls and procedures are effective.
Management’s Report on Internal Control over Financial Reporting - PBF Energy
PBF Energy’sOur management is responsible for establishing and maintaining adequate internal control over financial reporting as defined in Rule 13a-15(f) of the Exchange Act. PBF Energy’sOur internal control system is designed to provide reasonable assurance regarding the reliability of financial reporting and the preparation of financial statements for external purposes in accordance with generally accepted accounting principles in the United States of America. Due to its inherent limitations, internal control over financial reporting may not prevent or detect misstatements. Therefore, even those systems determined to be effective can provide only reasonable assurance with respect to financial statement preparation and presentation.
Management assessed the effectiveness of PBF Energy’sour internal control over financial reporting as of December 31, 2021,2023, using the criteria set forth by the Committee of Sponsoring Organizations of the Treadway Commission in Internal Control — Integrated Framework (2013). Based on such assessment, management concluded that as of December 31, 2021, PBF Energy’s internal control over financial reporting is effective.
Management’s Report on Internal Control over Financial Reporting - PBF LLC
PBF LLC’s management is responsible for establishing and maintaining adequate internal control over financial reporting as defined in Rule 13a-15(f) of the Exchange Act. PBF LLC’s internal control system is designed to provide reasonable assurance regarding the reliability of financial reporting and the preparation of financial statements for external purposes in accordance with generally accepted accounting principles in the United States of America. Due to its inherent limitations, internal control over financial reporting may not prevent or detect misstatements. Therefore, even those systems determined to be effective can provide only reasonable assurance with respect to financial statement preparation and presentation.
Management assessed the effectiveness of PBF LLC’s internal control over financial reporting as of December 31, 2021, using the criteria set forth by the Committee of Sponsoring Organizations of the Treadway Commission in Internal Control — Integrated Framework (2013). Based on such assessment, management concluded that as of December 31, 2021, PBF LLC’s2023, our internal control over financial reporting is effective.
Auditor Attestation Report
Our independent registered public accounting firm has issued an attestation report on the effectiveness of PBF Energy’sour internal control over financial reporting, which is on page F-65 of this report. Changes in Internal Control Over Financial Reporting
There has been no change in our internal control over financial reporting during the quarter ended December 31, 20212023 that has materially affected, or is reasonably likely to materially affect PBF Energy’s or PBF LLC’sour internal control over financial reporting.
ITEM 9B. OTHER INFORMATION
None.Securities Trading Plans of Directors and Executive Officers
During the three months ended December 31, 2023, none of our directors or executive officers adopted or terminated any contract, instruction or written plan for the purchase or sale of PBF Energy securities that was intended to satisfy the affirmative defense conditions of Rule 10b5-1(c) or any “non-Rule 10b5-1 trading arrangement”.
ITEM 9C. DISCLOSURES REGARDING FOREIGN JURISDICTIONS THAT PREVENT INSPECTIONS
Not applicable.
PART III
ITEM 10. DIRECTORS, EXECUTIVE OFFICERS AND CORPORATE GOVERNANCE
The information required under this Item will be contained in our 20222024 Proxy Statement, incorporated herein by reference.reference, except as provided below.
We have adopted a Code of Business Conduct and Ethics that applies to our principal executive officer, principal financial officer and principal accounting officer. The Code of Business Conduct and Ethics is available on our website at www.pbfenergy.com under the heading “Investors”. Any amendments to the Code of Business Conduct and Ethics or any grant of a waiver from the provisions of the Code of Business Conduct and Ethics requiring disclosure under applicable Securities and Exchange Commission rules will be disclosed on the Company’s website.
See also Information About Our Executive Officers under “Item 1. Business” of this Annual Report on Form 10-K.
ITEM 11. EXECUTIVE COMPENSATION
The information required under this Item will be contained in our 20222024 Proxy Statement, incorporated herein by reference.
ITEM 12. SECURITY OWNERSHIP OF CERTAIN BENEFICIAL OWNERS AND MANAGEMENT AND RELATED STOCKHOLDER MATTERS
Information required by this Item, including Securities Authorized for Issuance Under Equity Compensation Plans, will be contained in our 20222024 Proxy Statement, incorporated herein by reference.
ITEM 13. CERTAIN RELATIONSHIPS AND RELATED TRANSACTIONS, AND DIRECTOR INDEPENDENCE
The information required under this Item will be contained in our 20222024 Proxy Statement, incorporated herein by reference.
ITEM 14. PRINCIPAL ACCOUNTING FEES AND SERVICES
Information about aggregate fees billed to us by our principal accountant, Deloitte & Touche LLP (PCAOB ID No. 34) will be contained in our 20222024 Proxy Statement, incorporated herein by reference.
PART IV
ITEM 15. EXHIBITS AND FINANCIAL STATEMENT SCHEDULES
(a) 1. Financial Statements. The consolidated financial statements of PBF Energy Inc., PBF Energy Company LLC and theirits subsidiaries, required by Part II, Item 8, are included in Part IV of this report. See Index to Consolidated Financial Statements beginning on page F-1.
2. Financial Statement Schedules and Other Financial Information. No financial statement schedules are submitted because either they are not applicable or because the required information is included in the consolidated financial statements or notes thereto.
3. Exhibits. Filed as part of this Annual Report on Form 10-K are the following exhibits:
| | | | | | | | | | |
| Number | | Description | | |
| | | | |
| | SaleAgreement and Purchase AgreementPlan of Merger, dated June 11, 2019July 27, 2022 by and betweenamong PBF HoldingEnergy Inc., PBF Energy Company LLC, PBFX Holdings Inc., Riverlands Merger Sub LLC, PBF Logistics LP and Equilon EnterprisesPBF Logistics GP LLC d/b/a Shell Oil Products US (incorporated by reference to Exhibit 2.1 filed with PBF Energy Inc.’s Current Report on Form 8-K dated June 11, 2019July 27, 2022 (File No. 001-35764)). | | |
| | | | |
| | Amendment No. 1 dated February 1, 2020 to Sale and PurchaseSubscription Agreement dated June 11, 2019 by and between PBF HoldingEnergy Company LLC and Equilon Enterprises LLC d/b/a Shell Oil Products USEni Sustainable Mobility S.p.A, dated as of February 16, 2023 (incorporated by reference to Exhibit 2.2 filed with2.1 of PBF Energy Inc.'s’s Current Report on Form 8-K dated February 6, 2020 (File No. 001-35764)) filed on February 23, 2023). | | |
| | | | |
| | Amended and Restated Certificate of Incorporation of PBF Energy Inc. (incorporated by reference to Exhibit 3.1 filed with PBF Energy Inc.’s Amendment No. 4 to Registration Statement on Form S-1 (Registration No. 333-177933)). | | |
| | | | |
| | Second Amended and Restated Bylaws of PBF Energy Inc. (incorporated by reference to Exhibit 3.1 filed with PBF Energy Inc.’s Current Report on Form 8-K dated February 15, 2017 (File No. 001-35764)). | | |
| | | | |
| | Indenture dated as of May 30, 2017, among PBF Holding Company LLC, PBF Finance Corporation, the Guarantors named on the signature pages thereto, Wilmington Trust, National Association, as Trustee and Deutsche Bank Trust Company Americas, as Paying Agent, Registrar, Transfer Agent and Authenticating Agent and form of 7.25% Senior Notes due 2025 (included as Exhibit A) (incorporated by reference to Exhibit 4.1 of PBF Energy Inc.’s Current Report on Form 8-K (File No. 001-35764) filed on May 30, 2017). | | |
| | | | |
| | Indenture dated as of January 24, 2020, among PBF Holding Company LLC, PBF Finance Corporation, the Guarantors named on the signature pages thereto, Wilmington Trust, National Association, as Trustee and Deutsche Bank Trust Company Americas, as Paying Agent, Registrar, Transfer Agent and Authenticating Agent and form of 6.00% Senior Notes due 2028 (included as Exhibit A) (incorporated by reference to Exhibit 4.1 filed with PBF Energy Inc.’s Current Report on Form 8-K dated January 24, 2020 (File No. 001-35764)). | | |
| | | | |
| | Indenture dated as of August 21, 2023, among PBF Holding Company LLC, PBF Finance Corporation, the Guarantors named on the signature pages thereto, Wilmington Trust, National Association, as Trustee, and Deutsche Bank Trust Company Americas, as Paying Agent, Registrar, Transfer Agent and Authenticating Agent and form of 7.875% Senior Note due 2030 (included as Exhibit A) (incorporated by reference to Exhibit 4.1 filed with PBF Energy Inc.’s Current Report on Form 8-K dated August 21, 2023 (File No. 001-35764)). | | |
| | | | |
| | First Supplemental Indenture dated February 3, 2020, among PBF Holding Company LLC, PBF Finance Corporation, Martinez Refining Company LLC, Martinez Terminal Company LLC, Wilmington Trust, National Association, as trustee, and Deutsche Bank Trust Company Americas, as paying agent, transfer agent, registrar and authenticating agent (6.00% Senior Notes due 2028) (incorporated by reference to Exhibit 4.3 filed with PBF Energy Inc.’s Quarterly Report on Form 10-Q dated May 15, 2020 (File No. 001-35764). | | |
| | | | |
| | First Supplemental Indenture dated February 3, 2020, among PBF Holding Company LLC, PBF Finance Corporation, Martinez Refining Company LLC, Martinez Terminal Company LLC, Wilmington Trust, National Association, as trustee, and Deutsche Bank Trust Company Americas, as paying agent, transfer agent, registrar and authenticating agent (7.25% Senior Notes due 2025) (incorporated by reference to Exhibit 4.4 filed with PBF Energy Inc.’s Quarterly Report on Form 10-Q dated May 15, 2020 (File No. 001-35764). | | |
| | | | |
| | | | | | | | | | |
| | Indenture dated May 12, 2015, among PBF Logistics LP, PBF Logistics Finance Corporation, the Guarantors named therein and Deutsche Bank Trust Company Americas, as trustee and form of 6.875% Senior Notes due 2023 (included as Exhibit A) (incorporated by reference herein to Exhibit 4.1 to the Current Report on Form 8-K (File No. 001-36446) filed on May 18, 2015). | | |
| | | | |
| | Supplemental Indenture dated June 19, 2015, among PBF Logistics LP, PBF Logistics Finance Corporation, the Guarantors named therein and Deutsche Bank Trust Company Americas, as trustee (incorporated by reference herein to Exhibit 4.1.1 to the Annual Report on Form 10-K (File No. 001-36446) filed on February 22, 2016). | | |
| | | | |
| | Second Supplemental Indenture dated as of June 28, 2016, among PBF Logistics Products Terminals LLC, PBF Logistics LP, PBF Logistics Finance Corporation, and Deutsche Bank Trust Company Americas, as trustee (incorporated by reference herein to Exhibit 4.2 to the Quarterly Report on form 10-Q for the quarter ended June 30, 2016 (File No. 001-36446) filed on August 4, 2016). | | |
| | | | |
| | Third Supplemental Indenture dated as of October 24, 2016, among Torrance Valley Pipeline Company LLC, PBFX Operating Company LLC, PBF Logistics LP, PBF Logistics Finance Corporation, and Deutsche Bank Trust Company Americas, as trustee (incorporated by reference herein to Exhibit 4.8 to the Annual Report on Form 10-K (File No. 001-36446) filed on February 24, 2017). | | |
| | | | |
| | Fourth Supplemental Indenture dated as of March 13, 2017, among Paulsboro Natural Gas Pipeline Company LLC, PBF Logistics LP, PBF Logistics Finance Corporation, and Deutsche Bank Trust Company Americas, as trustee (incorporated by reference herein to Exhibit 4.2 to the Quarterly Report on Form 10-Q for the quarter ended March 31, 2017 (File No. 001-36446) filed on May 4, 2017). | | |
| | | | |
| | Fifth Supplemental Indenture dated October 6, 2017, among PBF Logistics LP, PBF Logistics Finance Corporation, the Guarantors named therein and Deutsche Bank Trust Company Americas, as Trustee (incorporated by reference herein to Exhibit 4.1 to the Current Report on Form 8-K (File No. 001-36446) filed on October 6, 2017). | | |
| | | | |
| | Sixth Supplemental Indenture dated as of September 11, 2018, among DCR Storage and Loading LLC, Chalmette Logistics Company LLC, Toledo Rail Logistics Company LLC, Paulsboro Terminaling Company LLC, PBF Logistics LP, PBF Logistics Finance Corporation, and Deutsche Bank Trust Company Americas, as trustee (incorporated by reference herein to Exhibit 4.1 to the Quarterly Report on Form 10-Q for the quarter ended September 30, 2018 (File No. 001-36446) filed on October 31, 2018). | | |
| | | | |
| | Seventh Supplemental Indenture dated as of October 25, 2018, among CPI Operations LLC, PBF Logistics LP, PBF Logistics Finance Corporation, and Deutsche Bank Trust Company Americas, as trustee (incorporated by reference herein to Exhibit 4.1 to the Quarterly Report on Form 10-Q for the quarter ended March 31, 2019 (File No. 001-36446) filed on May 1, 2019). | | |
| | | | |
| | Eighth Supplemental Indenture dated March 4, 2020, among PBFX Ace Holdings LLC, PBF Logistics LP, PBF Logistics Finance Corporation, and Deutsche Bank Trust Company Americas, as trustee (incorporated by reference to Exhibit 4.1 filed with PBF Logistics LP’s Quarterly Report on Form 10-Q dated May 15, 2020 (File No. 001-36446)). | | |
| | | | |
| | Indenture dated as of May 13, 2020, among PBF Holding Company LLC, PBF Finance Corporation, the Guarantors named on the signature pages thereto, Wilmington Trust, National Association, as Trustee, Paying Agent, Registrar, Transfer Agent, Authenticating Agent and Notes Collateral Agent and form of 9.25% Senior Secured Notes due 2025 (included as exhibit A) (incorporated by reference to Exhibit 4.1 filed with PBF Energy Inc.’s Current Report on Form 8-K dated May 13, 2020 (File No. 001-35764)). | | |
| | | | |
| | Supplemental Indenture dated December 21, 2020, among PBF Holding Company LLC, PBF Finance Corporation, the Guarantors named on the signature pages thereto, Wilmington Trust, National Association, as Trustee, Paying Agent, Registrar, Transfer Agent, Authenticating Agent and Notes Collateral Agent (9.25% Senior Secured Notes due 2025) (incorporated by reference to Exhibit 4.3 filed with PBF Energy Inc.’s Current Report on Form 8-K dated December 22, 2020 (File No. 001-35764)). | | |
| | | | |
| | | | | | | | | | |
| | Amended and Restated Registration Rights Agreement of PBF Energy Inc. dated as of December 12, 2012 (incorporated by reference to Exhibit 4.1 filed with PBF Energy Inc.’s Current Report on Form 8-K dated December 18, 2012 (File No. 001-35764)). | | |
| | | | |
| | Description of Registrant’s Securities (incorporated by reference to Exhibit 4.18 of PBF Energy Inc’s Annual Report on Form 10-K (File No. 001-35764) filed on February 18, 2021). | | |
| | | | |
| | | | | | | | | | |
| | Form of 2023-2025 Performance Share Unit Agreement (incorporated by reference to Exhibit 10.1 filed with PBF Energy Inc.’s Current Report on Form 8-K dated April 12, 2022 (File No. 001-35764)). | | |
| | | | |
| | Form of 2023-2025 Performance Unit Agreement (incorporated by reference to Exhibit 10.2 filed with PBF Energy Inc.’s Current Report on Form 8-K dated April 12, 2022 (File No. 001-35764)). | | |
| | | | |
| | Form of PBF Energy Inc. Performance Share Unit Award Agreement (2022-2024 performance period) under the Amended and Restated PBF Energy Inc. 2017 Equity Incentive Plan (incorporated by reference to Exhibit 10.1 with PBF Energy Inc.’s Current Report on Form 8-K dated November 24, 2021 (File No. 001-35764)). | | |
| | | | |
| | Form of PBF Energy Inc. Performance Unit Award Agreement (2022-2024 performance period) under the Amended and Restated PBF Energy Inc. 2017 Equity Incentive Plan (incorporated by reference to Exhibit 10.2 with PBF Energy Inc.’s Current Report on Form 8-K dated November 24, 2021 (File No. 001-35764)). | | |
| | | | |
| | Form of PBF Energy Inc. Performance Share Unit Award Agreement (2024-2026 performance period) under the Amended and Restated PBF Energy Inc. 2017 Equity Incentive Plan (incorporated by reference to Exhibit 10.1 with PBF Energy Inc.’s Current Report on Form 8-K dated November 2, 2023 (File No. 001-35764)). | | |
| | | | |
| | Form of PBF Energy Inc. Performance Unit Award Agreement (2024-2026 performance period) under the Amended and Restated PBF Energy Inc. 2017 Equity Incentive Plan (incorporated by reference to Exhibit 10.2 with PBF Energy Inc.’s Current Report on Form 8-K dated November 2, 2023 (File No. 001-35764)). | | |
| | | | |
| | PBF Energy Inc. Amended and Restated 2012 Equity Incentive Plan (incorporated by reference to DEF 14A filed withAppendix A to PBF Energy Inc.’s Definitive Proxy Statement datedon Schedule 14A filed on March 22, 2016 (File No. 001-35764)). | | |
| | | | |
| | PBF Energy Inc. Amended and Restated 2017 Equity Incentive Plan (incorporated by reference to Appendix A to PBF Energy Inc.’s Definitive Proxy Statement on Schedule 14A filed on April 13, 2018 (File No. 001-35764)). | | |
| | | | |
| | Amendment No. 1 to PBF Energy Inc. Amended and Restated 2017 Equity Incentive Plan (incorporated by reference to Appendix A to PBF Energy Inc.’s Definitive Proxy Statement on Schedule 14A filed on April 13, 2022 (File No. 001-35764)). | | |
| | | | |
| | Form of PBF Energy Non-Qualified Stock Option Agreement (prior to 2020) under the Amended and Restated PBF Energy Inc. 2017 Equity Incentive Plan (incorporated by reference to Exhibit 10.1 filed with PBF Energy Inc.’s Current Report on Form 8-K dated November 2, 2018 (File No. 001-35764)). | | |
| | | | |
| | Form of PBF Energy Non-Qualified Stock Option Agreement (2020 and thereafter) under the Amended and Restated PBF Energy Inc. 2017 Equity Incentive Plan (incorporated by reference to Exhibit 10.1 filed with PBF Energy Inc.’s Current Report on Form 8-K dated November 13, 2020 (File No. 001-35764)). | | |
| | | | |
| | Form of PBF Energy Performance Share Unit Award Agreement (2021-2023) under the Amended and Restated PBF Energy Inc. 2017 Equity Incentive Plan (incorporated by reference to Exhibit 10.2 filed with PBF Energy Inc.’s Current Report on Form 8-K dated November 13, 2020 (File No. 001-35764)). | | |
| | | | |
| | Form of PBF Energy Performance Unit Award Agreement (2021-2023) under the Amended and Restated PBF Energy Inc. 2017 Equity Incentive Plan (incorporated by reference to Exhibit 10.3 filed with PBF Energy Inc.’s Current Report on Form 8-K dated November 13, 2020 (File No. 001-35764)). | | |
| | | | |
| | Form of Non-Qualified Stock Option Agreement under the PBF Energy Inc. 2012 Equity Incentive Plan (incorporated by reference to Exhibit 10.28 filed with PBF Energy Inc.’s Amendment No. 6 to Registration Statement on Form S-1 (Registration No. 333-177933)). | | |
| | | | |
| | Form of Amended and Restated Restricted Stock Agreement for non-employee Directors under the PBF Energy Inc. 2017 Equity Incentive Plan.Plan (incorporated by reference to Exhibit 10.3 of PBF Energy Inc.’s Annual Report on Form 10-K (File No. 001-35764) filed on February 23, 2018). | | |
| | | | |
| | Form of Amended and Restated Restricted Stock Agreement for Employees, under PBF Energy Inc. 2017 Equity Incentive Plan (incorporated by reference to Exhibit 10.7 of PBF Energy Inc.’s Annual Report on Form 10-K (File No. 001-35764) filed on February 23, 2018). | | |
| | | | |
| | Form of Amended and Restated Restricted Stock Agreement for Employees, under PBF Energy Inc. 2017 Equity Incentive Plan (incorporated by reference to Exhibit 10.2 of PBF Energy Inc.’s Current Report on Form 8-K dated February 15, 2023 (File No. 001-35764)). | | |
| | | | |
| | | | | | | | | | |
Transportation Services10.16 | | Form of PBF Energy Amended and Restated 2017 Equity Incentive Plan, as Amended Restricted Stock Agreement for Employee (incorporated by reference to Exhibit 10.2 filed with PBF Energy Inc.’s Current Report on Form 8-K dated asDecember 2, 2022 (File No. 001-35764)). | | |
| | | | |
| | Form of August 31, 2016 among PBF Holding Company LLCAmended and Torrance Valley Pipeline Company LLCRestated 2017 Equity Incentive Plan Performance Share Unit Award Agreement for the 2023-2025 Performance Cycle (incorporated by reference to Exhibit 10.3 filed with PBF Energy Inc.’s Current Report on Form 8-K dated September 7, 2016December 2, 2022 (File No. 001-35764)). | | |
| | | | |
| | | | | | | | | | |
| | Pipeline Service Order dated asForm of August 31, 2016, byAmended and between Torrance Valley Pipeline Company LLC, and PBF Holding Company LLCRestated 2017 Equity Incentive Plan Performance Unit Award Agreement for the 2023-2025 Performance Cycle (incorporated by reference to Exhibit 10.4 filed with PBF Energy Inc.’s Current Report on Form 8-K dated September 7, 2016December 2, 2022 (File No. 001-35764)). | | |
| | | | |
| | Pipeline Service OrderContribution Agreement by and among PBF Green Fuels LLC, PBF Energy Company LLC, Eni Sustainable Mobility US Inc., Eni Sustainable Mobility S.p.A., and St. Bernard Renewables LLC, dated as of August 31, 2016, by and between Torrance Valley Pipeline Company LLC, and PBF Holding Company LLC (incorporated by reference to Exhibit 10.5 filed with PBF Energy Inc.’s Current Report on Form 8-K dated September 7, 2016 (File No. 001-35764)). | | |
| | | | |
| | Dedicated Storage Service Order dated as of August 31, 2016, by and between Torrance Valley Pipeline Company LLC, and PBF Holding Company LLC (incorporated by reference to Exhibit 10.6 filed with PBF Energy Inc.’s Current Report on Form 8-K dated September 7, 2016 (File No. 001-35764)). | | |
| | | | |
| | Throughput Storage Service Order dated as of August 31, 2016, by and between Torrance Valley Pipeline Company LLC, and PBF Holding Company LLC (incorporated by reference to Exhibit 10.7 filed with PBF Energy Inc.’s Current Report on Form 8-K dated September 7, 2016 (File No. 001-35764)). | | |
| | | | |
| | Senior Secured Revolving Credit Agreement dated as of May 2, 2018June 27, 2023 (incorporated by reference to Exhibit 10.1 filed with PBF Energy Inc.’s Current Report on Form 8-K dated May 7, 2018June 28, 2023 (File No. 001-35764)). | | |
| | | | |
| | Amendment dated as of February 18, 2020 to Senior Secured Revolving Credit Agreement dated as of May 2, 2018 (incorporated by reference to Exhibit 10.3 filed with PBF Energy Inc.’s Quarterly Report on Form 10-Q dated May 15, 2020 (File No. 001-35764)). | | |
| | | | |
| | Second Amendment dated as of May 7, 2020 to Senior Secured Revolving Credit Agreement dated as of May 2, 2018, as amended (incorporated by reference to Exhibit 10.1 filed with PBF Energy Inc.’s Current Report on Form 8-K dated May 7, 2020 (File No. 001-35764)). | | |
| | | | |
| | Fifth Amended and Restated Omnibus Agreement dated as of July 31, 2018, among PBF Holding Company LLC, PBF Energy Company LLC, PBF Logistics GP LLC and PBF Logistics LP (incorporated by reference to Exhibit 10.2 filed with PBF Logistics LP’s Quarterly Report on Form 10-Q dated October 31, 2018 (File No. 001-36446)). | | |
| | | | |
| | Sixth Amended and Restated Operation and Management Services and Secondment Agreement dated as of July 31, 2018, among PBF Holding Company LLC, Delaware City Refining Company LLC, Toledo Refining Company LLC, Torrance Refining Company LLC, Torrance Logistics Company LLC, Chalmette Refining L.L.C., Paulsboro Refining Company LLC, PBF Logistics GP LLC, PBF Logistics LP, DCR Storage and Loading LLC, Delaware City Terminaling Company LLC, Toledo Terminaling Company LLC, Delaware Pipeline Company LLC, Delaware City Logistics Company LLC, Paulsboro Terminaling Company LLC, Paulsboro Natural Gas Pipeline Company LLC, Toledo Rail Logistics Company LLC, Chalmette Logistics Company LLC and PBFX Operating Company LLC (incorporated by reference to Exhibit 10.3 filed with PBF Logistics LP’s Quarterly Report on Form 10-Q dated October 31, 2018 (File No. 001-36446)). | | |
| | | | |
| | Delaware Pipeline Services Agreement dated as of May 15, 2015 among PBF Holding Company LLC and Delaware Pipeline Company LLC (incorporated by reference to Exhibit 10.3 filed with PBF Energy Inc.’s Current Report on Form 8-K dated May 12, 2015 (File No. 001-35764)). | | |
| | | | |
| | Delaware City Truck Loading Services Agreement dated as of May 15, 2015 among PBF Holding Company LLC and Delaware City Logistics Company LLC (incorporated by reference to Exhibit 10.4 filed with PBF Energy Inc.’s Current Report on Form 8-K dated May 12, 2015 (File No. 001-35764)). | | |
| | | | |
| | Third Amended and Restated Inventory Intermediation Agreement dated as of October 25, 2021, among J. Aron & Company LLC, PBF Holding Company LLC, Delaware City Refining Company LLC, Paulsboro Refining Company LLC, and Chalmette Refining, L.L.C. (incorporated by reference to Exhibit 10.1 filed with PBF Energy Inc.’s Current Report on Form 8-K dated October 28, 2021 (File No. 001-35764)). | | |
| | | | |
| | | | | | | | | | |
| | Amended and Restated Delaware City Rail Terminaling ServicesLimited Liability Agreement (incorporated by reference to Exhibit 10.1 filed withand among St. Bernard Renewables LLC, PBF Logistics LP’s Quarterly Report on Form 10-Q dated May 3, 2018 (File No. 001-36446)). | | |
| | | | |
| | Amendment to Amended and Restated Delaware City Rail Terminaling Service Agreement dated February 13, 2019 among PBF Holding Company LLC, Delaware City Terminaling CompanyGreen Fuels LLC and CPI Operations LLCEni Sustainable Mobility US, Inc., dated as of June 27, 2023. (incorporated by reference to Exhibit 10.2 filed with PBF Energy Inc.’s Current Report on Form 8-K dated February 14, 2019June 28, 2023 (File No. 001-35764)). | | |
| | | | |
| | Terminaling Service Agreement dated February 13, 2019 among PBF Holding Company LLC, Delaware City Terminaling Company LLC and CPI Operations LLC (incorporated by reference to Exhibit 10.3 filed with PBF Energy Inc.’s Current Report on Form 8-K dated February 14, 2019 (File No. 001-35764)). | | |
| | | | |
| | Amended and Restated Toledo Truck Unloading & Terminaling Agreement effective as of June 1, 2014 (incorporated by reference to Exhibit 10.10 filed with PBF Energy Inc.’s Quarterly Report on Form 10-Q dated August 7, 2014 (File No. 001-35764)). | | |
| | | | |
| | Assignment and Amendment of Amended and Restated Toledo Truck Unloading & Terminaling Agreement dated as of December 12, 2014 by and between PBF Holding Company LLC, PBF Logistics LP and Toledo Terminaling Company LLC (incorporated by reference to Exhibit 10.4 filed with PBF Logistics LP’s Current Report on Form 8-K dated December 16, 2014 (File No. 001-36446)). | | |
| | | | |
| | Lease Agreement dated as of February 15, 2017 by and between PBFX Operating Company LLC and Chalmette Refining, L.L.C. (incorporated by reference to Exhibit 10.3 of PBF Energy Inc.’s Current Report on Form 8-K (File No. 001-35764) filed on February 22, 2017). | | |
| | | | |
| | Storage Services Agreement dated as of February 15, 2017 by and between PBFX Operating Company LLC and PBF Holding Company LLC (incorporated by reference to Exhibit 10.1 of PBF Energy Inc.’s Current Report on Form 8-K (File No. 001-35764) filed on February 22, 2017). | | |
| | | | |
| | Amended and Restated Guaranty of Collection, dated as of October 6, 2017 (incorporated by reference to Exhibit 10.1 of PBF Energy Inc.’s Current Report on Form 8-K (File No. 001-35764) filed on October 6, 2017). | | |
| | | | |
| | Designation of Other Guaranteed Revolving Credit Obligations, dated as of December 12, 2014 with respect to the Amended and Restated Guaranty of Collection (incorporated by reference to Exhibit 10.8.2 filed with PBF Energy Inc.’s Quarterly Report on Form 10-Q dated August 6, 2015 (File No. 001-35764)). | | |
| | | | |
| | Amended and RestatedSenior Secured Revolving Credit Agreement, dated as of July 30, 2018, among PBF Logistics LP, the lender party hereto and Wells Fargo Bank, National Association as Administrative AgentAugust 23, 2023 (incorporated by reference to Exhibit 10.1 filed with PBF Energy Inc.’s Current Report on Form 8-K dated August 2, 201823, 2023 (File No. 001-35764)). | | |
| | | | |
| | Joinder Agreement dated as of September 7, 2018, among DCR Storage and Loading LLC, Chalmette Logistics Company LLC, Toledo Rail Logistics Company LLC, Paulsboro Terminaling Company LLC and Wells Fargo Bank, National Association, as Administrative Agent (incorporated by reference to Exhibit 10.4 filed with PBF Logistics LP’s Quarterly Report on Form 10-Q dated October 31, 2018 (File No. 001-36446)). | | |
| | | | |
| | Joinder Agreement dated May 26, 2016, among PBF Logistics Products Terminals LLC and Wells Fargo Bank, National Association, as Administrative Agent (incorporated by reference to Exhibit 4.1 filed with PBF Logistics LP’s Quarterly Report on Form 10-Q dated August 4, 2016 (File No. 001-36446)). | | |
| | | | |
| | Joinder Agreement to the ABL Security Agreement dated as of February 1, 2020, among Martinez Refining Company LLC, Martinez Terminal Company LLC and Bank of America, N.A., as Administrative Agent (incorporated by reference to Exhibit 10.1 filed with PBF Energy Inc.’s Quarterly Report on Form 10-Q dated May 15, 2020 (File No. 001-35764). | | |
| | | | |
| | | | | | | | | | |
| | Joinder Agreement to the Credit Agreement dated as of February 1, 2020, among PBF Holding Company LLC, the Guarantors named on the signature pages thereto including Martinez Refining Company LLC, Martinez Terminal Company LLC and Bank of America, N.A., as Administrative Agent to Senior Secured Revolving Credit Agreement dated as of May 2, 2018 (incorporated by reference to Exhibit 10.2 filed with PBF Energy Inc.’s Quarterly Report on Form 10-Q dated May 15, 2020 (File No. 001-35764). | | |
| | | | |
| | Second Amended and Restated Agreement of Limited Partnership of PBF Logistics LP dated as of September 15, 2014 (incorporated by reference to Exhibit 3.1 filed with PBF Logistics LP’s Current Report on Form 8-K dated September 19, 2014 (File No. 001-36446)). | | |
| | | | |
| | Amended and Restated Delaware City West Ladder Rack Terminaling Services Agreement (incorporated by reference to Exhibit 10.2 filed with PBF Logistics LP’s Quarterly Report on Form 10-Q dated May 3, 2018 (File No. 001-36446)). | | |
| | | | |
| | Storage and Terminaling Services Agreement dated as of December 12, 2014 among PBF Holding Company LLC and Toledo Terminaling Company LLC (incorporated by reference to Exhibit 10.3 to the Current Report on Form 8-K filed on December 16, 2014 (File No. 001-36446)). | | |
| | | | |
| | Amended and Restated Limited Liability Company Agreement of PBF Energy Company LLC (incorporated by reference to Exhibit 10.1 filed with PBF Energy Inc.’s Current Report on Form 8-K dated December 18, 2012 (File No. 001-35764)). | | |
| | | | |
| | Exchange Agreement, dated as of December 12, 2012 (incorporated by reference to Exhibit 10.3 filed with PBF Energy Inc.’s Current Report on Form 8-K dated December 18, 2012 (File No. 001-35764)). | | |
| | | | |
| | Tax Receivable Agreement, dated as of December 12, 2012 (incorporated by reference to Exhibit 10.2 filed with PBF Energy Inc.’s Current Report on Form 8-K dated December 18, 2012 (File No. 001-35764)). | | |
| | | | |
| | Restated Warrant and Purchase Agreement between PBF Energy Company LLC and the officers party thereto, as amended (incorporated by reference to Exhibit 10.17 filed with PBF Energy Inc.’s Amendment No. 4 to Registration Statement on Form S-1 (Registration No. 333-177933)). | | |
| | | | |
| | Form of Indemnification Agreement between PBF Energy Inc. and each of the executive officers and directors of PBF Energy Inc. (incorporated by reference to Exhibit 10.5 filed with PBF Energy Inc.’s Current Report on Form 8-K dated December 18, 2012 (File No. 001-35764)). | | |
| | | | |
| | PBF Logistics LP 2014 Long-Term Incentive Plan, adoptedEmployment Agreement dated as of May 14, 2014February 20, 2023 between PBF Investments LLC and Karen B. Davis (incorporated by reference to Exhibit 10.810.1 filed with PBF Logistics LP’sEnergy Inc.’s Current Report on Form 8-K dated May 14, 2014February 16, 2023 (File No. 001-36446)001-35764)). | | |
| | | | |
| | FormEmployment Agreement dated as of Phantom Unit Agreement for Employees, under theSeptember 29, 2015 between PBF Logistics LP 2014 Long-Term Incentive PlanInvestments LLC and Trecia M. Canty (incorporated by reference to Exhibit 10.810.36 filed with PBF Logistics LP’s Registration StatementEnergy Inc.’s Annual Report on Form S-1, as amended, originally filed on April 22, 201410-K dated February 16, 2023 (File No. 333-195024)001-35764)). | | |
| | | | |
| | Form of Phantom Unit Agreement for Non-Employee Directors, under the PBF Logistics LP 2014 Long-Term Incentive Plan (incorporated by reference to Exhibit 10.7 filed with PBF Logistics LP’s Registration Statement on Form S-1, as amended originally filed on April 22, 2014 (File No. 333-195024)). | | |
| | | | |
| | Form of Indemnification Agreement between PBF Logistics LP, PBF Logistics GP LLC and each of the executive officers and directors of PBF Logistics LP and PBF Logistics GP LLC (incorporated by reference to Exhibit 10.11 filed with PBF Logistics LP’s Registration Statement on Form S-1, as amended, originally filed on April 22, 2014 (File No. 333-195024)). | | |
| | | | |
| | | | | | | | | | |
| | Employment Agreement dated as of September 4, 2014 between PBF Investments LLC and Thomas O’Connor (incorporated by reference to Exhibit 10.9 filed with PBF Energy Inc.’s Annual Report on Form 10-K dated February 29, 2016 (File No. 001-35764)). | | |
| | | | |
| | Employment Agreement dated as of April 1, 2014 between PBF Investments LLC and Timothy Paul Davis (incorporated by reference to Exhibit 10.4 filed with PBF Energy Inc.’s Quarterly Report on Form 10-Q dated May 7, 2014 (File No. 001-35764)). | | |
| | | | |
| | | | | | | | | | |
| | Employment Agreement dated as of April 1, 2014 between PBF Investments LLC and Erik Young (incorporated by reference to Exhibit 10.2 filed with PBF Energy Inc.’s Quarterly Report on Form 10-Q dated May 7, 2014 (File No. 001-35764)). | | |
| | | | |
| | Second Amended and Restated Employment Agreement dated as of December 17, 2012,May 3, 2023 between PBF Investments LLC and Thomas J. Nimbley (incorporated by reference to Exhibit 10.810.1 filed with PBF Energy Inc.’s Current Report on Form 8-K dated December 18, 2012May 4, 2023 (File No. 001-35764)). | | |
| | | | |
| | SecondThird Amended and Restated Employment Agreement, dated as of December 17, 2012,May 3, 2023, between PBF Investments LLC and Matthew C. Lucey (incorporated by reference to Exhibit 10.910.2 filed with PBF Energy Inc.’s Current Report on Form 8-K dated December 18, 2012May 4, 2023 (File No. 001-35764)). | | |
| | | | |
| | Subsidiaries of PBF Energy and PBF Energy Company LLC. | | |
| | | | |
| | Consent of Deloitte & Touche LLP. | | |
| | | | |
| | Consent of Deloitte & Touche LLP. | | |
| | | | |
| | Power of Attorney (included on signature page). | | |
| | | | |
| | Certification by Chief Executive Officer of PBF Energy Inc. pursuant to Rule 13a-14(a)/15d-14(a), as adopted pursuant to Section 302 of the Sarbanes-Oxley Act of 2002. | | |
| | | | |
| | Certification by Chief Financial Officer of PBF Energy Inc. pursuant to Rule 13a-14(a)/15d-14(a), as adopted pursuant to Section 302 of the Sarbanes-Oxley Act of 2002. | | |
| | | | |
| | Certification by Chief Executive Officer of PBF Energy Company LLC pursuant to Rule 13a-14(a)/15d-14(a), as adopted pursuant to Section 302 of the Sarbanes-Oxley Act of 2002. | | |
| | | | |
| | Certification by Chief Financial Officer of PBF Energy Company LLC pursuant to Rule 13a-14(a)/15d-14(a), as adopted pursuant to Section 302 of the Sarbanes-Oxley Act of 2002. | | |
| | | | |
| | Certification by Chief Executive Officer of PBF Energy Inc. pursuant to 18 U.S.C. Section 1350, as adopted pursuant to Section 906 of the Sarbanes-Oxley Act of 2002. | | |
| | | | |
| | Certification by Chief Financial Officer of PBF Energy Inc. pursuant to 18 U.S.C. Section 1350, as adopted pursuant to Section 906 of the Sarbanes-Oxley Act of 2002. | | |
| | | | |
| | Certification by Chief Executive OfficerClawback Policy, effective as of PBF Energy Company LLC pursuant to 18 U.S.C. Section 1350, as adopted pursuant to Section 906 of the Sarbanes-Oxley Act of 2002.October 2, 2023 | | |
| | | | |
| | Certification by Chief Financial Officer of PBF Energy Company LLC pursuant to 18 U.S.C. Section 1350, as adopted pursuant to Section 906 of the Sarbanes-Oxley Act of 2002. | | |
| | | | |
| 101.INS | | Inline XBRL Instance Document. | | |
| | | | |
| 101.SCH | | Inline XBRL Taxonomy Extension Schema Document. | | |
| | | | |
| 101.CAL | | Inline XBRL Taxonomy Extension Calculation Linkbase Document. | | |
| | | | |
| 101.DEF | | Inline XBRL Taxonomy Extension Definition Linkbase Document. | | |
| | | | |
| 101.LAB | | Inline XBRL Taxonomy Extension Label Linkbase Document. | | |
| | | | |
| | | | | | | | | | |
| 101.PRE | | Inline XBRL Taxonomy Extension Presentation Linkbase Document. | | |
| | | | |
| 104 | | Cover Page Interactive Data File (formatted as Inline XBRL and contained in exhibit 101). | | |
——————————
| | | | | |
| * | Filed herewith. |
| |
| ** | Indicates management compensatory plan or arrangement. |
| |
| † | Portions of the exhibits have been omitted because (i) the registrant customarily and actually treats that information as private or confidential and (ii) the omitted information is not material. |
| |
| (1) | This exhibit should not be deemed to be “filed” for purposes of Section 18 of the Exchange Act. |
| |
| |
PBF ENERGY INC. AND PBF ENERGY COMPANY LLC
INDEX TO CONSOLIDATED FINANCIAL STATEMENTS
| | | | | | | | |
| | |
| | |
| PBF Energy Inc. | |
| |
| | |
| |
| | |
| |
| | |
| |
| | |
| |
| | |
| | |
| PBF Energy Company LLC | |
| | |
| | |
| | |
| | |
| | |
| | |
| | |
| | |
| | |
| | |
| | |
| | |
REPORT OF INDEPENDENT REGISTERED PUBLIC ACCOUNTING FIRM
To the Board of Directors and Stockholders of PBF Energy Inc. and subsidiaries
Opinion on the Financial Statements
We have audited the accompanying consolidated balance sheets of PBF Energy Inc. and subsidiaries (the "Company") as of December 31, 2021 and 2020, the related consolidated statements of operations, comprehensive income (loss), changes in equity, and cash flows, for each of the three years in the period ended December 31, 2021, and the related notes (collectively referred to as the "financial statements"). In our opinion, the financial statements present fairly, in all material respects, the financial position of the Company as of December 31, 2021 and 2020, and the results of its operations and its cash flows for each of the three years in the period ended December 31, 2021, in conformity with accounting principles generally accepted in the United States of America.
We have also audited, in accordance with the standards of the Public Company Accounting Oversight Board (United States) (PCAOB), the Company's internal control over financial reporting as of December 31, 2021, based on criteria established in Internal Control — Integrated Framework (2013) issued by the Committee of Sponsoring Organizations of the Treadway Commission and our report dated February 17, 2022, expressed an unqualified opinion on the Company's internal control over financial reporting.
Basis for Opinion
These financial statements are the responsibility of the Company's management. Our responsibility is to express an opinion on the Company's financial statements based on our audits. We are a public accounting firm registered with the PCAOB and are required to be independent with respect to the Company in accordance with the U.S. federal securities laws and the applicable rules and regulations of the Securities and Exchange Commission and the PCAOB.
We conducted our audits in accordance with the standards of the PCAOB. Those standards require that we plan and perform the audit to obtain reasonable assurance about whether the financial statements are free of material misstatement, whether due to error or fraud. Our audits included performing procedures to assess the risks of material misstatement of the financial statements, whether due to error or fraud, and performing procedures that respond to those risks. Such procedures included examining, on a test basis, evidence regarding the amounts and disclosures in the financial statements. Our audits also included evaluating the accounting principles used and significant estimates made by management, as well as evaluating the overall presentation of the financial statements. We believe that our audits provide a reasonable basis for our opinion.
Critical Audit Matter
The critical audit matter communicated below is a matter arising from the current-period audit of the financial statements that was communicated or required to be communicated to the audit committee and that (1) relates to accounts or disclosures that are material to the financial statements and (2) involved our especially challenging, subjective, or complex judgments. The communication of critical audit matters does not alter in any way our opinion on the financial statements, taken as a whole, and we are not, by communicating the critical audit matter below, providing a separate opinion on the critical audit matter or on the accounts or disclosures to which it relates.
Critical Accounting Policy and Estimate – Impairment Assessment of Long-Lived Assets and Definite-Lived Intangibles – refer to Note 2 to the Consolidated Financial Statements
Critical Audit Matter Description
The Company evaluates long-lived assets for impairment on a continual basis and reassesses the reasonableness of their related useful lives whenever events or changes in circumstances warrant assessment. Possible triggering events may include, among other things, significant adverse changes in the business climate, market conditions, environmental regulations or a determination that it is more likely than not that an asset or an asset
group will be sold or retired before its estimated useful life. During 2021, business conditions related to demand for the company’s products and reduced throughput levels as well as increasing environmental regulation were assessed as possible triggering events. These possible triggering events of impairment may impact the Company’s assumptions related to future throughput levels, future operating revenues, expenses and gross margin, levels of anticipated capital expenditures and remaining useful life. Long-lived assets are tested for recoverability whenever events or changes in circumstances indicate that the carrying amount exceeds the sum of the undiscounted cash flows expected to result from its use, early retirement or disposition. When events or changes in circumstances exist, the Company evaluates its long-lived assets for impairment by comparing the carrying value of the long-lived assets to the estimated undiscounted cash flows expected to result for the use of the assets over their remaining useful life. If the carrying amount of an asset exceeds the undiscounted cash flows, an analysis is performed to determine the fair value of the asset. The Company makes significant assumptions to evaluate long-lived assets for possible indications of impairment. Changes in these assumptions could have a significant impact on the long- lived assets. For the year ended December 31, 2021, no impairment loss related to long-lived assets has been recognized.
We identified the determination of possible triggering events for long-lived assets as a critical audit matter because of the significant assumptions management makes when determining whether events or changes in circumstances have occurred indicating that the carrying amounts of long-lived assets may not be recoverable. This required a high degree of auditor judgement.
How the Critical Audit Matter Was Addressed in the Audit
Our audit procedures related to impairment indicators for long-lived assets included the following, among others:
•We tested the effectiveness of controls over the identification of possible circumstances that may indicate that the carrying amounts of long-lived assets are no longer recoverable, including controls over management’s useful life, throughput levels, gross margin, operating expenses and future levels of capital expenditures assumptions
•We compared management’s evaluation of potential impairment indicators to our independent expectation by:
◦We performed searches for adverse general market and asset-specific environmental condition.
◦We inquired of Management about the impact of macro-economic impacts of the pandemic, the pace of decarbonization and the energy transition, and new environmental regulations on the Company’s forecasting of future cash flows, refining margins, future levels of capital expenditure and estimated useful lives.
◦We inspected minutes of the board of directors, the Company’s public statements, operating plans, and market reports to identify any evidence that may contradict management’s assumptions.
◦We read relevant rules and regulations issued by federal, state and local regulatory bodies, including staff reports, resolutions, other third-party filings, and other publicly available information to assess future levels of sustained capital expenditure and impact to future refinery throughput.
•With the assistance of Environmental Specialists, we performed a public domain search to assess the impact of environmental regulatory laws on the company’s operations.
/s/ Deloitte & Touche LLP
Parsippany, New Jersey
February 17, 2022
We have served as the Company's auditor since 2011.
REPORT OF INDEPENDENT REGISTERED PUBLIC ACCOUNTING FIRM
To PBF Energy Inc., the Managing Member of PBF Energy Company LLC
Opinion on the Financial Statements
We have audited the accompanying consolidated balance sheets of PBF Energy Company LLC and subsidiaries (the "Company") as of December 31, 2021 and 2020, the related consolidated statements of operations, comprehensive income (loss), changes in equity, and cash flows, for each of the three years in the period ended December 31, 2021, and the related notes (collectively referred to as the "financial statements"). In our opinion, the financial statements present fairly, in all material respects, the financial position of the Company as of December 31, 2021 and 2020, and the results of its operations and its cash flows for each of the three years in the period ended December 31, 2021, in conformity with accounting principles generally accepted in the United States of America.
Basis for Opinion
These financial statements are the responsibility of the Company's management. Our responsibility is to express an opinion on the Company's financial statements based on our audits. We are a public accounting firm registered with the Public Company Accounting Oversight Board (United States) (PCAOB) and are required to be independent with respect to the Company in accordance with the U.S. federal securities laws and the applicable rules and regulations of the Securities and Exchange Commission and the PCAOB.
We conducted our audits in accordance with the standards of the PCAOB. Those standards require that we plan and perform the audit to obtain reasonable assurance about whether the financial statements are free of material misstatement, whether due to error or fraud. The Company is not required to have, nor were we engaged to perform, an audit of its internal control over financial reporting. As part of our audits, we are required to obtain an understanding of internal control over financial reporting but not for the purpose of expressing an opinion on the effectiveness of the Company’s internal control over financial reporting. Accordingly, we express no such opinion.
Our audits included performing procedures to assess the risks of material misstatement of the financial statements, whether due to error or fraud, and performing procedures that respond to those risks. Such procedures included examining, on a test basis, evidence regarding the amounts and disclosures in the financial statements. Our audits also included evaluating the accounting principles used and significant estimates made by management, as well as evaluating the overall presentation of the financial statements. We believe that our audits provide a reasonable basis for our opinion.
Critical Audit Matter
The critical audit matter communicated below is a matter arising from the current-period audit of the financial statements that was communicated or required to be communicated to the audit committee and that (1) relates to accounts or disclosures that are material to the financial statements and (2) involved our especially challenging, subjective, or complex judgments. The communication of critical audit matters does not alter in any way our opinion on the financial statements, taken as a whole, and we are not, by communicating the critical audit matter below, providing a separate opinion on the critical audit matters or on the accounts or disclosures to which it relates.
Critical Accounting Policy and Estimate – Impairment Assessment of Long-Lived Assets and Definite-Lived Intangibles – refer to Note 2 to the Consolidated Financial Statements
Critical Audit Matter Description
The Company evaluates long-lived assets for impairment on a continual basis and reassesses the reasonableness of their related useful lives whenever events or changes in circumstances warrant assessment. Possible triggering events may include, among other things, significant adverse changes in the business climate, market
conditions, environmental regulations or a determination that it is more likely than not that an asset or an asset group will be sold or retired before its estimated useful life. During 2021, business conditions related to demand for the company’s products and reduced throughput levels as well as increasing environmental regulation were assessed as possible triggering events. These possible triggering events of impairment may impact the Company’s assumptions related to future throughput levels, future operating revenues, expenses and gross margin, levels of anticipated capital expenditures and remaining useful life. Long-lived assets are tested for recoverability whenever events or changes in circumstances indicate that the carrying amount exceeds the sum of the undiscounted cash flows expected to result from its use, early retirement or disposition. When events or changes in circumstances exist, the Company evaluates its long-lived assets for impairment by comparing the carrying value of the long-lived assets to the estimated undiscounted cash flows expected to result for the use of the assets over their remaining useful life.If the carrying amount of an asset exceeds the undiscounted cash flows, an analysis is performed to determine the fair value of the asset. The Company makes significant assumptions to evaluate long-lived assets for possible indications of impairment. Changes in these assumptions could have a significant impact on the long- lived assets. For the year ended December 31, 2021, no impairment loss related to long-lived assets has been recognized.
We identified the determination of possible triggering events for long-lived assets as a critical audit matter because of the significant assumptions management makes when determining whether events or changes in circumstances have occurred indicating that the carrying amounts of long-lived assets may not be recoverable. This required a high degree of auditor judgement.
How the Critical Audit Matter Was Addressed in the Audit
Our audit procedures related to impairment indicators for long-lived assets included the following, among others:
•We tested the effectiveness of controls over the identification of possible circumstances that may indicate that the carrying amounts of long-lived assets are no longer recoverable, including controls over management’s useful life, throughput levels, gross margin, operating expenses and future levels of capital expenditures assumptions.
•We compared management’s evaluation of potential impairment indicators to our independent expectation by:
◦We performed searches for adverse general market and asset-specific environmental conditions
◦We inquired of Management about the impact of macro-economic impacts of the pandemic, the pace of decarbonization and the energy transition, and new environmental regulations on the Company’s forecasting of future cash flows, refining margins, future levels of capital expenditure and estimated useful lives.
◦We inspected minutes of the board of directors, the Company’s public statements, operating plans, and market reports to identify any evidence that may contradict management’s assumptions
◦We read relevant rules and regulations issued by federal, state and local regulatory bodies, including staff reports, resolutions, other third-party filings, and other publicly available information to assess future levels of sustained capital expenditure and impact to future refinery throughput.
•With the assistance of Environmental Specialists, we performed a public domain search to assess the impact of environmental regulatory laws on the company’s operations.
/s/ Deloitte & Touche LLP
Parsippany, New Jersey
February 17, 2022
We have served as the Company's auditor since 2011.
REPORT OF INDEPENDENT REGISTERED PUBLIC ACCOUNTING FIRM
To the Board of Directors and Stockholders of PBF Energy Inc. and subsidiaries
Opinion on the Financial Statements
We have audited the accompanying consolidated balance sheets of PBF Energy Inc. and subsidiaries (the "Company") as of December 31, 2023 and 2022, the related consolidated statements of operations, comprehensive income, changes in equity, and cash flows, for each of the three years in the period ended December 31, 2023, and the related notes (collectively referred to as the "financial statements"). In our opinion, the financial statements present fairly, in all material respects, the financial position of the Company as of December 31, 2023 and 2022, and the results of its operations and its cash flows for each of the three years in the period ended December 31, 2023, in conformity with accounting principles generally accepted in the United States of America.
We have also audited, in accordance with the standards of the Public Company Accounting Oversight Board (United States) (PCAOB), the Company's internal control over financial reporting as of December 31, 2023, based on criteria established in Internal Control — Integrated Framework (2013) issued by the Committee of Sponsoring Organizations of the Treadway Commission and our report dated February 15, 2024, expressed an unqualified opinion on the Company's internal control over financial reporting.
Basis for Opinion
These financial statements are the responsibility of the Company's management. Our responsibility is to express an opinion on the Company's financial statements based on our audits. We are a public accounting firm registered with the PCAOB and are required to be independent with respect to the Company in accordance with the U.S. federal securities laws and the applicable rules and regulations of the Securities and Exchange Commission and the PCAOB.
We conducted our audits in accordance with the standards of the PCAOB. Those standards require that we plan and perform the audit to obtain reasonable assurance about whether the financial statements are free of material misstatement, whether due to error or fraud. Our audits included performing procedures to assess the risks of material misstatement of the financial statements, whether due to error or fraud, and performing procedures that respond to those risks. Such procedures included examining, on a test basis, evidence regarding the amounts and disclosures in the financial statements. Our audits also included evaluating the accounting principles used and significant estimates made by management, as well as evaluating the overall presentation of the financial statements. We believe that our audits provide a reasonable basis for our opinion.
Critical Audit Matters
The critical audit matters communicated below are matters arising from the current-period audit of the financial statements that were communicated or required to be communicated to the audit committee and that (1) relate to accounts or disclosures that are material to the financial statements and (2) involved our especially challenging, subjective, or complex judgments. The communication of critical audit matters does not alter in any way our opinion on the financial statements, taken as a whole, and we are not, by communicating the critical audit matters below, providing separate opinions on the critical audit matters or on the accounts or disclosures to which they relate.
Accounting for the Equity Investment in St. Bernard Renewables LLC – Refer to Notes 1, 2 and 6 to the Consolidated Financial Statements
Critical Audit Matter Description
On June 27, 2023, the Company and Eni Sustainable Mobility US Inc. (“Eni”) closed on the capitalization of St. Bernard Renewables LLC (“SBR”), a jointly held investee designed to own, develop, and operate a renewable diesel facility.
The Company determined that SBR is a variable interest entity (“VIE”) because the entity does not have sufficient equity at risk to fund its operations without additional financial support from its owners. The Company determined that it was not the primary beneficiary of the VIE because the Company does not have the ability to make the most relevant decisions that significantly affects SBR’s economic performance. The Company accounts for its 50% equity ownership of SBR as an equity method investment, as the Company has significant influence, but not control, over SBR.
We identified the Company’s accounting for the equity investment in SBR as a critical audit matter due to the judgment made by management in identifying the activities of the VIE that most significantly impact its economic performance and evaluating whether the Company has the ability to direct these activities. This required a high degree of auditor judgment and increased audit effort.
How the Critical Audit Matter was Addressed in the Audit
•Tested the effectiveness of controls over the Company’s evaluation of the variable interest consolidation model.
•Obtained and read management’s consideration of the applicability of variable interest guidance.
•Reviewed relevant contracts in our assessment of the contractual rights of the Company and Eni in assessing whether either partner is the primary beneficiary of SBR.
•Evaluated the conclusion that SBR is a VIE in accordance with the relevant accounting standards.
•Assessed the conclusion that the Company should deconsolidate SBR and subsequently account for SBR as an equity method investment in accordance with relevant accounting standards.
Deferred Refinery Turnaround Costs – Amortization Period – Refer to Notes 2 and 7 to the Consolidated Financial Statements
Critical Audit Matter Description
The Company routinely performs turnaround activities at each of its refineries. Refinery turnaround costs, which are incurred in connection with planned major maintenance activities, are deferred when incurred and amortized on a straight-line basis over the period estimated until the next planned turnaround occurs, which is based on an engineering assessment.
Given the amounts deferred that are subject to amortization and the judgment and technical knowledge required to estimate the amortization period of the turnarounds, performing audit procedures to evaluate the reasonableness of these estimates and assumptions required a high degree of auditor judgment and an increased extent of effort.
How the Critical Audit Matter was Addressed in the Audit
•Tested the effectiveness of controls over the Company’s approval of the amortization period and the recording of amortization.
•Inquired of refinery personnel regarding the in-service date, the amortization period assigned, and the scope and nature of turnaround projects.
•With the assistance of fair value specialists, we evaluated the reasonableness of the estimated amortization period by:
◦Testing the source information underlying the determination of the amortization period.
◦Developing a range of independent estimates and comparing those to the estimated amortization period selected by management.
•Performed a look-back analysis for turnarounds completed in the current year, to determine when a turnaround was last performed on the asset and if the amortization period assigned to it was appropriate.
/s/ Deloitte & Touche LLP
Morristown, New Jersey
February 15, 2024
We have served as the Company's auditor since 2011.
REPORT OF INDEPENDENT REGISTERED PUBLIC ACCOUNTING FIRM
To the Board of Directors and Stockholders of PBF Energy Inc. and subsidiaries
Opinion on Internal Control over Financial Reporting
We have audited the internal control over financial reporting of PBF Energy Inc. and subsidiaries (the “Company”) as of December 31, 2021,2023, based on criteria established in Internal Control — Integrated Framework (2013) issued by the Committee of Sponsoring Organizations of the Treadway Commission (COSO). In our opinion, the Company maintained, in all material respects, effective internal control over financial reporting as of December 31, 2021,2023, based on criteria established in Internal Control — Integrated Framework (2013) issued by COSO.
We have also audited, in accordance with the standards of the Public Company Accounting Oversight Board (United States) (PCAOB), the consolidated financial statements as of and for the year ended December 31, 2021,2023, of the Company and our report dated February 17, 2022,15, 2024, expressed an unqualified opinion on those financial statements.
Basis for Opinion
The Company’s management is responsible for maintaining effective internal control over financial reporting and for its assessment of the effectiveness of internal control over financial reporting, included in the accompanying Management’s Report on Internal Control over Financial Reporting. Our responsibility is to express an opinion on the Company’s internal control over financial reporting based on our audit. We are a public accounting firm registered with the PCAOB and are required to be independent with respect to the Company in accordance with the U.S. federal securities laws and the applicable rules and regulations of the Securities and Exchange Commission and the PCAOB.
We conducted our audit in accordance with the standards of the PCAOB. Those standards require that we plan and perform the audit to obtain reasonable assurance about whether effective internal control over financial reporting was maintained in all material respects. Our audit included obtaining an understanding of internal control over financial reporting, assessing the risk that a material weakness exists, testing and evaluating the design and operating effectiveness of internal control based on the assessed risk, and performing such other procedures as we considered necessary in the circumstances. We believe that our audit provides a reasonable basis for our opinion.
Definition and Limitations of Internal Control over Financial Reporting
A company’s internal control over financial reporting is a process designed to provide reasonable assurance regarding the reliability of financial reporting and the preparation of financial statements for external purposes in accordance with generally accepted accounting principles. A company’s internal control over financial reporting includes those policies and procedures that (1) pertain to the maintenance of records that, in reasonable detail, accurately and fairly reflect the transactions and dispositions of the assets of the company; (2) provide reasonable assurance that transactions are recorded as necessary to permit preparation of financial statements in accordance with generally accepted accounting principles, and that receipts and expenditures of the company are being made only in accordance with authorizations of management and directors of the company; and (3) provide reasonable assurance regarding prevention or timely detection of unauthorized acquisition, use, or disposition of the company’s assets that could have a material effect on the financial statements.
Because of its inherent limitations, internal control over financial reporting may not prevent or detect misstatements. Also, projections of any evaluation of effectiveness to future periods are subject to the risk that controls may become inadequate because of changes in conditions, or that the degree of compliance with the policies or procedures may deteriorate.
/s/ Deloitte & Touche LLP
Parsippany,Morristown, New Jersey
February 17, 202215, 2024
PBF ENERGY INC.
CONSOLIDATED BALANCE SHEETS
(in millions, except share and per share data)
| | December 31,
2021 | | December 31,
2020 |
| December 31,
2023 | | | December 31,
2023 | | December 31,
2022 |
| ASSETS | ASSETS | | | |
| Current assets: | Current assets: | |
| Cash and cash equivalents (PBFX $33.9 and $36.3, respectively) | $ | 1,341.5 | | | $ | 1,609.5 | |
| Current assets: | |
| Current assets: | |
| Cash and cash equivalents | |
| Cash and cash equivalents | |
| Cash and cash equivalents | |
| Accounts receivable | Accounts receivable | 1,277.6 | | | 512.9 | |
| Inventories | Inventories | 2,505.1 | | | 1,686.2 | |
| | Prepaid and other current assets | Prepaid and other current assets | 75.0 | | | 58.8 | |
| | Prepaid and other current assets | |
| | Prepaid and other current assets | |
| Total current assets | Total current assets | 5,199.2 | | | 3,867.4 | |
| Property, plant and equipment, net (PBFX: $787.3 and $820.2, respectively) | 4,902.2 | | | 4,843.3 | |
| Property, plant and equipment, net | |
| Equity method investment in SBR | |
| | Lease right of use assets | |
| Lease right of use assets | |
| Lease right of use assets | Lease right of use assets | 717.1 | | | 916.9 | |
| Deferred charges and other assets, net | Deferred charges and other assets, net | 822.9 | | | 872.2 | |
| Total assets | Total assets | $ | 11,641.4 | | | $ | 10,499.8 | |
| LIABILITIES AND EQUITY | LIABILITIES AND EQUITY | | | |
| Current liabilities: | Current liabilities: | |
| Current liabilities: | |
| Current liabilities: | |
| Accounts payable | |
| Accounts payable | |
| Accounts payable | Accounts payable | $ | 911.7 | | | $ | 407.0 | |
| Accrued expenses | Accrued expenses | 2,740.4 | | | 1,911.5 | |
| Payable pursuant to Tax Receivable Agreement | |
| | Deferred revenue | |
| Deferred revenue | |
| Deferred revenue | Deferred revenue | 42.7 | | | 47.2 | |
| Current operating lease liabilities | Current operating lease liabilities | 64.9 | | | 78.4 | |
| Current debt | Current debt | — | | | 7.4 | |
| Total current liabilities | Total current liabilities | 3,759.7 | | | 2,451.5 | |
| | Long-term debt (PBFX: $622.5 and $720.8, respectively) | 4,295.8 | | | 4,653.6 | |
| Payable to related parties pursuant to Tax Receivable Agreement | 48.3 | | | — | |
| Long-term debt | |
| Long-term debt | |
| Long-term debt | |
| Payable pursuant to Tax Receivable Agreement | |
| Deferred tax liabilities | Deferred tax liabilities | 111.4 | | | 99.6 | |
| Long-term operating lease liabilities | Long-term operating lease liabilities | 570.4 | | | 756.0 | |
| Long-term financing lease liabilities | Long-term financing lease liabilities | 70.6 | | | 68.3 | |
| Other long-term liabilities | Other long-term liabilities | 252.4 | | | 268.5 | |
| Total liabilities | Total liabilities | 9,108.6 | | | 8,297.5 | |
| Commitments and contingencies (Note 14) | 0 | | 0 |
| Commitments and contingencies (Note 11) | | Commitments and contingencies (Note 11) | | | |
| Equity: | Equity: | |
| PBF Energy Inc. equity | PBF Energy Inc. equity | |
| Class A common stock, $0.001 par value, 1,000,000,000 shares authorized, 120,319,577 shares outstanding at December 31, 2021, 120,101,641 shares outstanding at December 31, 2020 | 0.1 | | | 0.1 | |
| Class B common stock, $0.001 par value, 1,000,000 shares authorized, 15 shares outstanding at December 31, 2021, 16 shares outstanding at December 31, 2020 | — | | | — | |
| Preferred stock, $0.001 par value, 100,000,000 shares authorized, no shares outstanding at December 31, 2021 and December 31, 2020 | — | | | — | |
| Treasury stock, at cost, 6,676,809 shares outstanding at December 31, 2021 and 6,549,449 shares outstanding at December 31, 2020 | (169.1) | | | (167.3) | |
| PBF Energy Inc. equity | |
| PBF Energy Inc. equity | |
| Class A common stock, $0.001 par value, 1,000,000,000 shares authorized, 120,440,620 shares outstanding at December 31, 2023, 129,639,307 shares outstanding at December 31, 2022 | |
| Class A common stock, $0.001 par value, 1,000,000,000 shares authorized, 120,440,620 shares outstanding at December 31, 2023, 129,639,307 shares outstanding at December 31, 2022 | |
| Class A common stock, $0.001 par value, 1,000,000,000 shares authorized, 120,440,620 shares outstanding at December 31, 2023, 129,639,307 shares outstanding at December 31, 2022 | |
| Class B common stock, $0.001 par value, 1,000,000 shares authorized, 12 shares outstanding at December 31, 2023, 13 shares outstanding at December 31, 2022 | |
| Preferred stock, $0.001 par value, 100,000,000 shares authorized, no shares outstanding at December 31, 2023 and December 31, 2022 | |
| Treasury stock, at cost, 23,419,532 shares outstanding at December 31, 2023 and 10,937,916 shares outstanding at December 31, 2022 | |
| Additional paid in capital | Additional paid in capital | 2,874.0 | | | 2,846.2 | |
| Retained earnings (accumulated deficit) | (796.1) | | | (1,027.1) | |
| Retained earnings | |
| | Accumulated other comprehensive income (loss) | |
| Accumulated other comprehensive income (loss) | |
| Accumulated other comprehensive income (loss) | Accumulated other comprehensive income (loss) | 17.3 | | | (9.1) | |
| Total PBF Energy Inc. equity | Total PBF Energy Inc. equity | 1,926.2 | | | 1,642.8 | |
| Noncontrolling interest | Noncontrolling interest | 606.6 | | | 559.5 | |
| Total equity | Total equity | 2,532.8 | | | 2,202.3 | |
| Total liabilities and equity | Total liabilities and equity | $ | 11,641.4 | | | $ | 10,499.8 | |
See notes to consolidated financial statements.
F- 76
PBF ENERGY INC.
CONSOLIDATED STATEMENTS OF OPERATIONS
(in millions, except share and per share data)
| | Year Ended December 31, |
| 2021 | | 2020 | | 2019 |
| Year Ended December 31, | | | Year Ended December 31, |
| 2023 | | | 2023 | | 2022 | | 2021 |
| Revenues | Revenues | $ | 27,253.4 | | | $ | 15,115.9 | | | $ | 24,508.2 | |
| | Cost and expenses: | Cost and expenses: | |
| Cost of products and other | |
| Cost of products and other | |
| Cost of products and other | Cost of products and other | 23,826.8 | | | 14,275.6 | | | 21,387.5 | |
| Operating expenses (excluding depreciation and amortization expense as reflected below) | Operating expenses (excluding depreciation and amortization expense as reflected below) | 2,085.9 | | | 1,918.3 | | | 1,782.3 | |
| Depreciation and amortization expense | Depreciation and amortization expense | 453.5 | | | 551.7 | | | 425.3 | |
| Cost of sales | Cost of sales | 26,366.2 | | | 16,745.6 | | | 23,595.1 | |
| General and administrative expenses (excluding depreciation and amortization expense as reflected below) | General and administrative expenses (excluding depreciation and amortization expense as reflected below) | 247.3 | | | 248.5 | | | 284.0 | |
| Depreciation and amortization expense | Depreciation and amortization expense | 13.3 | | | 11.3 | | | 10.8 | |
| Change in fair value of contingent consideration | 32.4 | | | (93.7) | | | (0.8) | |
| Impairment expense | — | | | 98.8 | | | — | |
| Gain on sale of assets | (3.0) | | | (477.8) | | | (29.9) | |
| Change in fair value of contingent consideration, net | |
| Equity loss in investee | |
| Gain on formation of SBR equity method investment | |
| | (Gain) loss on sale of assets | |
| (Gain) loss on sale of assets | |
| (Gain) loss on sale of assets | |
| Total cost and expenses | Total cost and expenses | 26,656.2 | | | 16,532.7 | | | 23,859.2 | |
| | Income (loss) from operations | 597.2 | | | (1,416.8) | | | 649.0 | |
| | Income from operations | |
| Other income (expense): | Other income (expense): | |
| Interest expense, net | |
| Interest expense, net | |
| Interest expense, net | Interest expense, net | (317.5) | | | (258.2) | | | (159.6) | |
| Change in Tax Receivable Agreement liability | Change in Tax Receivable Agreement liability | (48.3) | | | 373.5 | | | — | |
| Change in fair value of catalyst obligations | Change in fair value of catalyst obligations | 8.5 | | | (11.8) | | | (9.7) | |
| Gain (loss) on extinguishment of debt | 79.9 | | | (22.2) | | | — | |
| (Loss) gain on extinguishment of debt | |
| Other non-service components of net periodic benefit cost | Other non-service components of net periodic benefit cost | 7.8 | | | 4.3 | | | (0.2) | |
| Income (loss) before income taxes | 327.6 | | | (1,331.2) | | | 479.5 | |
| Income before income taxes | |
| Income tax expense | Income tax expense | 12.1 | | | 2.1 | | | 104.3 | |
| Net income (loss) | 315.5 | | | (1,333.3) | | | 375.2 | |
| Net income | |
| Less: net income attributable to noncontrolling interests | Less: net income attributable to noncontrolling interests | 84.5 | | | 59.1 | | | 55.8 | |
| Net income (loss) attributable to PBF Energy Inc. stockholders | $ | 231.0 | | | $ | (1,392.4) | | | $ | 319.4 | |
| Net income attributable to PBF Energy Inc. stockholders | |
| | Weighted-average shares of Class A common stock outstanding | Weighted-average shares of Class A common stock outstanding | |
| Weighted-average shares of Class A common stock outstanding | |
| Weighted-average shares of Class A common stock outstanding | |
| Basic | |
| Basic | |
| Basic | Basic | 120,240,009 | | | 119,617,998 | | | 119,887,646 | |
| Diluted | Diluted | 122,638,154 | | | 120,660,665 | | | 121,853,299 | |
| Net income (loss) available to Class A common stock per share: | | | | | |
| Net income available to Class A common stock per share: | |
| Basic | |
| Basic | |
| Basic | Basic | $ | 1.92 | | | $ | (11.64) | | | $ | 2.66 | |
| Diluted | Diluted | $ | 1.90 | | | $ | (11.64) | | | $ | 2.64 | |
See notes to consolidated financial statements.
F- 87
PBF ENERGY INC.
CONSOLIDATED STATEMENTS OF COMPREHENSIVE INCOME (LOSS)
(in millions)
| | | | | | | | | | | | | | | | | |
| Year Ended December 31, |
| 2021 | | 2020 | | 2019 |
| Net income (loss) | $ | 315.5 | | | $ | (1,333.3) | | | $ | 375.2 | |
| Other comprehensive income (loss): | | | | | |
| Unrealized (loss) gain on available for sale securities | (0.7) | | | (0.1) | | | 0.4 | |
| Net gain (loss) on pension and other post-retirement benefits | 27.1 | | | (0.7) | | | 13.8 | |
| Total other comprehensive income (loss) | 26.4 | | | (0.8) | | | 14.2 | |
| Comprehensive income (loss) | 341.9 | | | (1,334.1) | | | 389.4 | |
| Less: comprehensive income attributable to noncontrolling interests | 84.5 | | | 59.1 | | | 55.9 | |
| Comprehensive income (loss) attributable to PBF Energy Inc. stockholders | $ | 257.4 | | | $ | (1,393.2) | | | $ | 333.5 | |
| | | | | | | | | | | | | | | | | |
| Year Ended December 31, |
| 2023 | | 2022 | | 2021 |
| Net income | $ | 2,162.0 | | | $ | 2,972.8 | | | $ | 315.5 | |
| Other comprehensive income (loss): | | | | | |
| Unrealized loss on available for sale securities | (0.4) | | | (2.5) | | | (0.7) | |
| Net (loss) gain on pension and other post-retirement benefits | (10.4) | | | (16.3) | | | 27.1 | |
| Total other comprehensive income (loss) | (10.8) | | | (18.8) | | | 26.4 | |
| Comprehensive income | 2,151.2 | | | 2,954.0 | | | 341.9 | |
| Less: comprehensive income attributable to noncontrolling interests | 21.5 | | | 96.0 | | | 84.5 | |
| Comprehensive income attributable to PBF Energy Inc. stockholders | $ | 2,129.7 | | | $ | 2,858.0 | | | $ | 257.4 | |
See notes to consolidated financial statements.
F- 98
PBF ENERGY INC.
CONSOLIDATED STATEMENTS OF CHANGES IN EQUITY
(in millions, except share and per share data)
| | | | Class A
Common Stock | Class B
Common Stock | Additional
Paid-in
Capital | Retained
Earnings | Accumulated
Other
Comprehensive Income (Loss) | Treasury Stock | Noncontrolling
Interest | Total
Equity | | Class A
Common Stock | Class B
Common Stock | Additional
Paid-in
Capital | Retained
Earnings (Accumulated Deficit) | Accumulated
Other
Comprehensive Income (Loss) | Treasury Stock | Noncontrolling
Interest | Total
Equity |
| | | Shares | Amount | Shares | Amount | Shares | Amount | | Shares | Amount | Shares | Amount | Shares | Amount |
| Balance, January 1, 2019 | 119,874,191 | | $ | 0.1 | | 20 | | $ | — | | $ | 2,633.8 | | $ | 225.8 | | $ | (22.4) | | 6,274,261 | | $ | (160.8) | | $ | 572.0 | | $ | 3,248.5 | |
| Balance, January 1, 2021 | |
| Comprehensive income | Comprehensive income | — | | — | | — | | — | | — | | 319.4 | | 14.1 | | — | | — | | 55.9 | | 389.4 | |
| Distributions to PBF Energy Company LLC members | — | | — | | — | | — | | — | | — | | — | | — | | — | | (3.2) | | (3.2) | |
| | Distributions to PBF Logistics LP public unitholders | |
| Distributions to PBF Logistics LP public unitholders | |
| Distributions to PBF Logistics LP public unitholders | Distributions to PBF Logistics LP public unitholders | — | | — | | — | | — | | — | | — | | — | | — | | — | | (64.1) | | (64.1) | |
| Stock-based compensation | Stock-based compensation | — | | — | | — | | — | | 27.2 | | — | | — | | — | | — | | 6.8 | | 34.0 | |
| Transactions in connection with stock-based compensation plans | Transactions in connection with stock-based compensation plans | 71,306 | | — | | — | | — | | (4.3) | | — | | — | | — | | — | | (0.2) | | (4.5) | |
| Dividends ($1.20 per common share) | — | | — | | — | | — | | — | | (143.8) | | — | | — | | — | | — | | (143.8) | |
| | Exchange of PBF Energy Company LLC Series A Units for PBF Energy Class A common stock | Exchange of PBF Energy Company LLC Series A Units for PBF Energy Class A common stock | 10,000 | | — | | — | | — | | — | | — | | — | | — | | — | | — | | — | |
| Issuance of additional PBFX common units | — | | — | | — | | — | | 152.0 | | — | | — | | — | | — | | (19.5) | | 132.5 | |
| Effects of changes in PBFX ownership interest on deferred tax assets and liabilities | — | | — | | — | | — | | (1.3) | | — | | — | | — | | — | | — | | (1.3) | |
| | Exchange of PBF Energy Company LLC Series A Units for PBF Energy Class A common stock | |
| | Exchange of PBF Energy Company LLC Series A Units for PBF Energy Class A common stock | |
| | Treasury stock purchases | |
| | Treasury stock purchases | |
| | Treasury stock purchases | Treasury stock purchases | (150,526) | | — | | — | | — | | 4.9 | | — | | — | | 150,526 | | (4.9) | | — | | — | |
| Other | Other | — | | — | | — | | — | | — | | (0.2) | | — | | — | | — | | (1.8) | | (2.0) | |
| | Balance, December 31, 2019 | 119,804,971 | | $ | 0.1 | | 20 | | $ | — | | $ | 2,812.3 | | $ | 401.2 | | $ | (8.3) | | 6,424,787 | | $ | (165.7) | | $ | 545.9 | | $ | 3,585.5 | |
| Balance, December 31, 2021 | |
| Balance, December 31, 2021 | |
| Balance, December 31, 2021 | |
| Comprehensive income (loss) | Comprehensive income (loss) | — | | — | | — | | — | | — | | (1,392.4) | | (0.8) | | — | | — | | 59.1 | | (1,334.1) | |
| Distributions to PBF Energy Company LLC members | Distributions to PBF Energy Company LLC members | — | | — | | — | | — | | — | | — | | — | | — | | — | | (0.4) | | (0.4) | |
| Distributions to PBF Logistics LP public unitholders | Distributions to PBF Logistics LP public unitholders | — | | — | | — | | — | | — | | — | | — | | — | | — | | (46.8) | | (46.8) | |
| Stock-based compensation | Stock-based compensation | — | | — | | — | | — | | 28.2 | | — | | — | | — | | — | | 4.9 | | 33.1 | |
| Transactions in connection with stock-based compensation plans | Transactions in connection with stock-based compensation plans | 166,685 | | — | | — | | — | | (1.0) | | — | | — | | — | | — | | (0.9) | | (1.9) | |
| Dividends ($0.30 per common share) | — | | — | | — | | — | | — | | (35.9) | | — | | — | | — | | — | | (35.9) | |
| Effect of change in deferred tax assets and liabilities and tax receivable agreement obligation | — | | — | | — | | — | | (2.1) | | — | | — | | — | | — | | — | | (2.1) | |
| Dividends ($0.20 per common share) | |
| | Effects of changes in PBF Logistics ownership interests on deferred tax assets and liabilities | |
| | Effects of changes in PBF Logistics ownership interests on deferred tax assets and liabilities | |
| | Effects of changes in PBF Logistics ownership interests on deferred tax assets and liabilities | |
| Exchange of PBF Energy Company LLC Series A Units for PBF Energy Class A common stock | Exchange of PBF Energy Company LLC Series A Units for PBF Energy Class A common stock | 254,647 | | — | | (4) | | — | | 2.3 | | — | | — | | — | | — | | (2.3) | | — | |
| PBFX Merger Transaction | |
| | Treasury stock purchases | Treasury stock purchases | (124,662) | | — | | — | | — | | 1.6 | | — | | — | | 124,662 | | (1.6) | | — | | — | |
| | Treasury stock purchases | |
| | Treasury stock purchases | |
| Other | Other | — | | — | | — | | — | | 4.9 | | — | | — | | — | | — | | — | | 4.9 | |
| Balance, December 31, 2020 | 120,101,641 | | $ | 0.1 | | 16 | | $ | — | | $ | 2,846.2 | | $ | (1,027.1) | | $ | (9.1) | | 6,549,449 | | $ | (167.3) | | $ | 559.5 | | $ | 2,202.3 | |
| Balance, December 31, 2022 | |
See notes to consolidated financial statements.
F- 109
PBF ENERGY INC.
CONSOLIDATED STATEMENTS OF CHANGES IN EQUITY (Continued)
(in millions, except share and per share data)
| | Class A
Common Stock | | | Class A
Common Stock | Class B
Common Stock | Additional
Paid-in
Capital | Retained
Earnings | Accumulated
Other
Comprehensive Income (Loss) | Treasury Stock | Noncontrolling
Interest | Total
Equity |
| Shares | | | Shares | Amount | Shares | Amount | Shares | Amount |
| Balance, December 31, 2022 | |
| Comprehensive income (loss) | |
| Distributions to PBF Energy Company LLC members | |
| | Class A
Common Stock | Class B
Common Stock | Additional
Paid-in
Capital | Retained
Earnings (Accumulated Deficit) | Accumulated
Other
Comprehensive Income (Loss) | Treasury Stock | Noncontrolling
Interest | Total
Equity |
| Shares | Amount | Shares | Amount | Shares | Amount |
| Balance, December 31, 2020 | 120,101,641 | | $ | 0.1 | | 16 | | $ | — | | $ | 2,846.2 | | $ | (1,027.1) | | $ | (9.1) | | 6,549,449 | | $ | (167.3) | | $ | 559.5 | | $ | 2,202.3 | |
| Comprehensive income | — | | — | | — | | — | | — | | 231.0 | | 26.4 | | — | | — | | 84.5 | | 341.9 | |
| | Distributions to PBF Logistics LP public unitholders | — | | — | | — | | — | | — | | — | | — | | — | | — | | (40.0) | | (40.0) | |
| Dividends ($0.85 per common share) | |
| Dividends ($0.85 per common share) | |
| Dividends ($0.85 per common share) | |
| Stock-based compensation | Stock-based compensation | — | | — | | — | | — | | 23.9 | | — | | — | | — | | — | | 5.3 | | 29.2 | |
| Transactions in connection with stock-based compensation plans | Transactions in connection with stock-based compensation plans | 234,739 | | — | | — | | — | | (1.1) | | — | | — | | — | | — | | (1.6) | | (2.7) | |
| | Effect of change in deferred tax assets and liabilities and tax receivable agreement obligation | |
| Effect of change in deferred tax assets and liabilities and tax receivable agreement obligation | |
| Effect of change in deferred tax assets and liabilities and tax receivable agreement obligation | |
| Exchange of PBF Energy Company LLC Series A Units for PBF Energy Class A common stock | Exchange of PBF Energy Company LLC Series A Units for PBF Energy Class A common stock | 110,557 | | — | | (1) | | — | | 0.4 | | — | | — | | — | | — | | (0.4) | | — | |
| | Treasury stock purchases | Treasury stock purchases | (127,360) | | — | | — | | — | | 1.8 | | — | | — | | 127,360 | | (1.8) | | — | | — | |
| Treasury stock purchases | |
| Treasury stock purchases | |
| Other | Other | — | | — | | — | | — | | 2.8 | | — | | — | | — | | — | | (0.7) | | 2.1 | |
| Balance, December 31, 2021 | 120,319,577 | | $ | 0.1 | | 15 | | $ | — | | $ | 2,874.0 | | $ | (796.1) | | $ | 17.3 | | 6,676,809 | | $ | (169.1) | | $ | 606.6 | | $ | 2,532.8 | |
| Balance, December 31, 2023 | |
See notes to consolidated financial statements.
F- 1110
PBF ENERGY INC.
CONSOLIDATED STATEMENTS OF CASH FLOWS
(in millions)
| | Year Ended December 31, | | | Year Ended December 31, |
| 2023 | | | 2023 | | 2022 | | 2021 |
| Cash flows from operating activities: | |
| Net income | |
| Net income | |
| Net income | |
| Adjustments to reconcile net income to net cash provided by operating activities: | |
| Depreciation and amortization | |
| Depreciation and amortization | |
| Depreciation and amortization | |
| | Year Ended December 31, |
| 2021 | | 2020 | | 2019 |
| Cash flows from operating activities: | | | | | |
| Net income (loss) | $ | 315.5 | | | $ | (1,333.3) | | | $ | 375.2 | |
| Adjustments to reconcile net income (loss) to net cash (used in) provided by operating activities: | |
| Depreciation and amortization | 483.8 | | | 581.1 | | | 447.5 | |
| Impairment expense | — | | | 98.8 | | | — | |
| Stock-based compensation | |
| Stock-based compensation | |
| Stock-based compensation | Stock-based compensation | 35.6 | | | 34.2 | | | 37.3 | |
| Change in fair value of catalyst obligations | Change in fair value of catalyst obligations | (8.5) | | | 11.8 | | | 9.7 | |
| Deferred income taxes | Deferred income taxes | 11.7 | | | 1.6 | | | 103.7 | |
| Change in Tax Receivable Agreement liability | Change in Tax Receivable Agreement liability | 48.3 | | | (373.5) | | | — | |
| Non-cash change in inventory repurchase obligations | Non-cash change in inventory repurchase obligations | (8.4) | | | (12.6) | | | 25.4 | |
| Non-cash lower of cost or market inventory adjustment | Non-cash lower of cost or market inventory adjustment | (669.6) | | | 268.0 | | | (250.2) | |
| Change in fair value of contingent consideration | 32.4 | | | (93.7) | | | (0.8) | |
| (Gain) loss on extinguishment of debt | (79.9) | | | 22.2 | | | — | |
| Change in fair value of contingent consideration, net | |
| Loss (gain) on extinguishment of debt | |
| Pension and other post-retirement benefit costs | Pension and other post-retirement benefit costs | 50.8 | | | 55.7 | | | 44.8 | |
| Gain on sale of assets | (3.0) | | | (477.8) | | | (29.9) | |
| Loss from equity method investment | |
| Gain on formation of SBR equity method investment | |
| (Gain) loss on sale of assets | |
| | Changes in operating assets and liabilities: | Changes in operating assets and liabilities: | |
| Changes in operating assets and liabilities: | |
| Changes in operating assets and liabilities: | |
| Accounts receivable | |
| Accounts receivable | |
| Accounts receivable | Accounts receivable | (764.7) | | | 322.1 | | | (116.1) | |
| Inventories | Inventories | (149.3) | | | 392.2 | | | (6.3) | |
| Prepaid and other current assets | Prepaid and other current assets | (16.2) | | | (1.8) | | | 2.7 | |
| Accounts payable | Accounts payable | 480.7 | | | (206.6) | | | 137.5 | |
| Accrued expenses | Accrued expenses | 797.9 | | | 116.0 | | | 208.1 | |
| Deferred revenue | Deferred revenue | (4.5) | | | 27.1 | | | 0.1 | |
| Other assets and liabilities | Other assets and liabilities | (75.3) | | | (63.1) | | | (55.2) | |
| Net cash provided by (used in) operating activities | $ | 477.3 | | | $ | (631.6) | | | $ | 933.5 | |
| Net cash provided by operating activities | |
| | Cash flows from investing activities: | Cash flows from investing activities: | |
| Cash flows from investing activities: | |
| Cash flows from investing activities: | |
| Expenditures for property, plant and equipment | |
| Expenditures for property, plant and equipment | |
| Expenditures for property, plant and equipment | Expenditures for property, plant and equipment | (249.1) | | | (196.2) | | | (404.9) | |
| Expenditures for deferred turnaround costs | Expenditures for deferred turnaround costs | (117.7) | | | (188.1) | | | (299.3) | |
| Expenditures for other assets | Expenditures for other assets | (28.9) | | | (9.1) | | | (44.7) | |
| Acquisition of Martinez refinery | — | | | (1,176.2) | | | — | |
| Equity method investment - contribution | |
| Equity method investment - return of capital | |
| | Proceeds from sale of assets | |
| | Proceeds from sale of assets | |
| | Proceeds from sale of assets | Proceeds from sale of assets | 7.2 | | | 543.1 | | | 36.3 | |
| | Net cash used in investing activities | Net cash used in investing activities | $ | (388.5) | | | $ | (1,026.5) | | | $ | (712.6) | |
| | Net cash used in investing activities | |
| | Net cash used in investing activities | |
See notes to consolidated financial statements.
F- 1211
PBF ENERGY INC.
CONSOLIDATED STATEMENTS OF CASH FLOWS (Continued)
(in millions)
| | Year Ended December 31, |
| Year Ended December 31, | | | Year Ended December 31, |
| Cash flows from financing activities: | Cash flows from financing activities: | 2021 | | 2020 | | 2019 | Cash flows from financing activities: | 2023 | | 2022 | | 2021 |
| | Net proceeds from issuance of PBFX common units | — | | | — | | | 132.5 | |
| PBFX Merger Transaction payment | |
| PBFX Merger Transaction payment | |
| PBFX Merger Transaction payment | |
| Dividend payments | Dividend payments | — | | | (35.9) | | | (143.5) | |
| Distributions to PBFX public unitholders | (39.0) | | | (45.9) | | | (62.5) | |
| Distributions to PBFX Public Unitholders | |
| Distributions to PBF Energy Company LLC members other than PBF Energy | Distributions to PBF Energy Company LLC members other than PBF Energy | — | | | (0.4) | | | (3.2) | |
| Distribution to T&M and Collins shareholders | Distribution to T&M and Collins shareholders | (0.7) | | | — | | | — | |
| Proceeds from 2025 9.25% Senior Secured Notes | — | | | 1,250.6 | | | — | |
| Proceeds from 2028 6.00% Senior Notes | — | | | 1,000.0 | | | — | |
| Proceeds from 2030 7.875% Senior Notes | |
| | Repurchase of 2028 6.00% Senior Notes | Repurchase of 2028 6.00% Senior Notes | (109.3) | | | — | | | — | |
| Repurchase of 2028 6.00% Senior Notes | |
| Repurchase of 2028 6.00% Senior Notes | |
| Redemption of 2025 7.25% Senior Notes | |
| Repurchase of 2025 7.25% Senior Notes | Repurchase of 2025 7.25% Senior Notes | (37.5) | | | — | | | — | |
| Redemption of 2023 7.00% Senior Notes | — | | | (517.5) | | | — | |
| | Redemption of 2025 9.25% Senior Secured Notes | |
| Redemption of 2025 9.25% Senior Secured Notes | |
| Redemption of 2025 9.25% Senior Secured Notes | |
| Proceeds from revolver borrowings | Proceeds from revolver borrowings | — | | | 1,450.0 | | | 1,350.0 | |
| Repayments of revolver borrowings | Repayments of revolver borrowings | — | | | (550.0) | | | (1,350.0) | |
| Repayments of PBFX revolver borrowings | |
| Redemption of PBFX 2023 Senior Notes | |
| Repayments of PBF Rail Term Loan | |
| Settlements of precious metal catalyst obligations | |
| | Payments on financing leases | |
| Payments on financing leases | |
| Payments on financing leases | |
| Proceeds from insurance premium financing | |
| Transactions in connection with stock-based compensation plans, net | |
| Payments of contingent consideration | |
| Share repurchases of PBF Energy’s Class A common stock | |
| Deferred financing costs and other | |
| Net cash used in financing activities | |
| | Proceeds from PBFX revolver borrowings | — | | | 100.0 | | | 228.0 | |
| Repayments of PBFX revolver borrowings | (100.0) | | | (183.0) | | | (101.0) | |
| Repayments of PBF Rail Term Loan | (7.4) | | | (7.2) | | | (7.0) | |
| | Deferred payment for the East Coast Storage Assets Acquisition | — | | | — | | | (32.0) | |
| Settlements of precious metal catalyst obligations | (31.7) | | | (8.8) | | | (6.5) | |
| Proceeds from catalyst financing arrangements | — | | | 51.9 | | | — | |
| Payments on financing leases | (17.8) | | | (12.4) | | | — | |
| | Taxes paid for net settlement of equity-based compensation | — | | | (2.1) | | | (4.8) | |
| Payments of contingent consideration | (12.2) | | | — | | | — | |
| | Purchases of treasury stock | — | | | (1.6) | | | (4.9) | |
| Deferred financing costs and other | (1.2) | | | (35.0) | | | 1.6 | |
| Net cash (used in) provided by financing activities | $ | (356.8) | | | $ | 2,452.7 | | | $ | (3.3) | |
| | Net change in cash and cash equivalents | |
| Net change in cash and cash equivalents | |
| Net change in cash and cash equivalents | Net change in cash and cash equivalents | (268.0) | | | 794.6 | | | 217.6 | |
| Cash and cash equivalents, beginning of period | Cash and cash equivalents, beginning of period | 1,609.5 | | | 814.9 | | | 597.3 | |
| Cash and cash equivalents, end of period | Cash and cash equivalents, end of period | $ | 1,341.5 | | | $ | 1,609.5 | | | $ | 814.9 | |
| | | | | | | | | | | | | | | | | |
| |
| | | | | |
| Supplemental cash flow disclosures | | | | | |
| Non-cash activities: | | | | | |
| Accrued and unpaid capital expenditures | $ | 104.0 | | | $ | 32.1 | | | $ | 37.2 | |
| Assets acquired or remeasured under operating and financing leases | (106.6) | | | 702.0 | | | 434.9 | |
| Fair value of the Martinez Contingent Consideration at acquisition | — | | | 77.3 | | | — | |
| | | | | |
| Cash paid during year for: | | | | | |
| Interest, net of capitalized interest of $9.1, $12.6 and $18.1 in 2021, 2020 and 2019, respectively | $ | 307.0 | | | $ | 206.9 | | | $ | 154.0 | |
| Income taxes | 5.7 | | | 2.1 | | | 2.7 | |
See notes to consolidated financial statements.
F- 13
PBF ENERGY COMPANY LLC AND SUBSIDIARIES
CONSOLIDATED BALANCE SHEETS
(in millions, except unit and per unit data)
| | | | | | | | | | | |
| December 31,
2021 | | December 31,
2020 |
| ASSETS | | | |
| Current assets: | | | |
| Cash and cash equivalents (PBFX: $33.9 and $36.3, respectively) | $ | 1,339.8 | | | $ | 1,607.3 | |
| Accounts receivable | 1,277.6 | | | 512.9 | |
| Inventories | 2,505.1 | | | 1,686.2 | |
| Prepaid and other current assets | 75.0 | | | 58.8 | |
| Total current assets | 5,197.5 | | | 3,865.2 | |
| | | |
| Property, plant and equipment, net (PBFX: $787.3 and $820.2, respectively) | 4,902.2 | | | 4,843.3 | |
| Lease right of use assets | 717.1 | | | 916.9 | |
| Deferred charges and other assets, net | 822.9 | | | 872.3 | |
| Total assets | $ | 11,639.7 | | | $ | 10,497.7 | |
| | | |
| LIABILITIES AND EQUITY | | | |
| Current liabilities: | | | |
| Accounts payable | $ | 911.7 | | | $ | 406.9 | |
| Accrued expenses | 2,792.6 | | | 1,951.2 | |
| Deferred revenue | 42.7 | | | 47.2 | |
| Current operating lease liabilities | 64.9 | | | 78.4 | |
| Current debt | — | | | 7.4 | |
| Total current liabilities | 3,811.9 | | | 2,491.1 | |
| | | |
| Long-term debt (PBFX: $622.5 and $720.8, respectively) | 4,295.8 | | | 4,653.6 | |
| Affiliate note payable | 375.2 | | | 376.3 | |
| Deferred tax liabilities | 24.2 | | | 38.7 | |
| Long-term operating lease liabilities | 570.4 | | | 756.0 | |
| Long-term financing lease liabilities | 70.6 | | | 68.3 | |
| Other long-term liabilities | 252.4 | | | 268.5 | |
| Total liabilities | 9,400.5 | | | 8,652.5 | |
| Commitments and contingencies (Note 14) | 0 | | 0 |
| | | |
| Series B Units, 1,000,000 issued and outstanding, no par or stated value | 5.1 | | | 5.1 | |
| PBF Energy Company LLC equity: | | | |
| Series A Units, 927,990 and 970,647 issued and outstanding at December 31, 2021 and 2020, no par or stated value | 17.6 | | | 17.6 | |
| Series C Units, 120,340,808 and 120,122,872 issued and outstanding at December 31, 2021 and 2020, no par or stated value | 2,245.0 | | | 2,220.3 | |
| Treasury stock, at cost | (169.1) | | | (167.3) | |
| Retained earnings (accumulated deficit) | (390.9) | | | (690.5) | |
| Accumulated other comprehensive income (loss) | 20.3 | | | (6.1) | |
| Total PBF Energy Company LLC equity | 1,722.9 | | | 1,374.0 | |
| Noncontrolling interest | 511.2 | | | 466.1 | |
| Total equity | 2,234.1 | | | 1,840.1 | |
| Total liabilities, Series B units and equity | $ | 11,639.7 | | | $ | 10,497.7 | |
See notes to consolidated financial statements.
F- 14
PBF ENERGY COMPANY LLC AND SUBSIDIARIES
CONSOLIDATED STATEMENTS OF OPERATIONS
(in millions)
| | | | | | | | | | | | | | | | | | | | | |
| | | Year Ended December 31, |
| | | | | 2021 | | 2020 | | 2019 |
| Revenues | | | | | $ | 27,253.4 | | | $ | 15,115.9 | | | $ | 24,508.2 | |
| | | | | | | | | |
| Cost and expenses: | | | | | | | | | |
| Cost of products and other | | | | | 23,826.8 | | | 14,275.6 | | | 21,387.5 | |
| Operating expenses (excluding depreciation and amortization expense as reflected below) | | | | | 2,085.9 | | | 1,918.3 | | | 1,782.3 | |
| Depreciation and amortization expense | | | | | 453.5 | | | 551.7 | | | 425.3 | |
| Cost of sales | | | | | 26,366.2 | | | 16,745.6 | | | 23,595.1 | |
| General and administrative expenses (excluding depreciation and amortization expense as reflected below) | | | | | 245.2 | | | 247.7 | | | 282.3 | |
| Depreciation and amortization expense | | | | | 13.3 | | | 11.3 | | | 10.8 | |
| Change in fair value of contingent consideration | | | | | 32.4 | | | (93.7) | | | (0.8) | |
| Impairment expense | | | | | — | | | 98.8 | | | — | |
| Gain on sale of assets | | | | | (3.0) | | | (477.8) | | | (29.9) | |
| Total cost and expenses | | | | | 26,654.1 | | | 16,531.9 | | | 23,857.5 | |
| | | | | | | | | |
| Income (loss) from operations | | | | | 599.3 | | | (1,416.0) | | | 650.7 | |
| | | | | | | | | |
| Other income (expense): | | | | | | | | | |
| Interest expense, net | | | | | (327.8) | | | (268.5) | | | (169.1) | |
| Change in fair value of catalyst obligations | | | | | 8.5 | | | (11.8) | | | (9.7) | |
| Gain (loss) on extinguishment of debt | | | | | 79.9 | | | (22.2) | | | — | |
| Other non-service components of net periodic benefit cost | | | | | 7.8 | | | 4.3 | | | (0.2) | |
| Income (loss) before income taxes | | | | | 367.7 | | | (1,714.2) | | | 471.7 | |
| Income tax (benefit) expense | | | | | (14.0) | | | 6.1 | | | (8.3) | |
| Net income (loss) | | | | | 381.7 | | | (1,720.3) | | | 480.0 | |
| Less: net income attributable to noncontrolling interests | | | | | 82.1 | | | 76.2 | | | 51.5 | |
| Net income (loss) attributable to PBF Energy Company LLC | | | | | $ | 299.6 | | | $ | (1,796.5) | | | $ | 428.5 | |
See notes to consolidated financial statements.
F- 15
PBF ENERGY COMPANY LLC AND SUBSIDIARIES
CONSOLIDATED STATEMENTS OF COMPREHENSIVE INCOME (LOSS)
(in millions)
| | | | | | | | | | | | | | | | | |
| Year Ended December 31, |
| 2021 | | 2020 | | 2019 |
| Net income (loss) | $ | 381.7 | | | $ | (1,720.3) | | | $ | 480.0 | |
| Other comprehensive income (loss): | | | | | |
| Unrealized (loss) gain on available for sale securities | (0.7) | | | (0.1) | | | 0.4 | |
| Net gain on pension and other post-retirement benefits | 27.1 | | | 3.7 | | | 13.8 | |
| Total other comprehensive income | 26.4 | | | 3.6 | | | 14.2 | |
| Comprehensive income (loss) | 408.1 | | | (1,716.7) | | | 494.2 | |
| Less: comprehensive income attributable to noncontrolling interests | 82.1 | | | 76.2 | | | 51.5 | |
| Comprehensive income (loss) attributable to PBF Energy Company LLC | $ | 326.0 | | | $ | (1,792.9) | | | $ | 442.7 | |
See notes to consolidated financial statements.
F- 16
PBF ENERGY COMPANY LLC AND SUBSIDIARIES
CONSOLIDATED STATEMENTS OF CHANGES IN EQUITY
(in millions, except unit data)
| | | | | | | | | | | | | | | | | | | | | | | | | | | | | |
| | Series A | Series C | Accumulated
Other
Comprehensive Income (Loss) | Retained
Earnings (Accumulated Deficit) | Noncontrolling
Interest | Treasury Stock | Total Member’s
Equity |
| | Units | Amount | Units | Amount |
| Balance, January 1, 2019 | 1,206,325 | | $ | 20.2 | | 119,895,422 | | $ | 2,009.8 | | $ | (23.9) | | $ | 914.3 | | $ | 459.8 | | $ | (160.8) | | $ | 3,219.4 | |
| Comprehensive income | — | | — | | — | | — | | 14.2 | | 428.5 | | 51.5 | | — | | 494.2 | |
| Exchange of Series A units for PBF Energy Class A common stock | (10,000) | | (0.1) | | 10,000 | | 0.1 | | — | | — | | — | | — | | — | |
| | | | | | | | | |
| Distribution to members | — | | — | | — | | — | | — | | (200.4) | | (64.1) | | — | | (264.5) | |
| Issuance of additional PBFX common units | — | | | — | | 152.0 | | — | | — | | (19.5) | | — | | 132.5 | |
| | | | | | | | | |
| Stock-based compensation | — | | — | | — | | 27.2 | | — | | — | | 6.8 | | — | | 34.0 | |
| | | | | | | | | |
| Transactions in connection with stock-based compensation plans | 18,992 | | (0.1) | | 71,306 | | (4.6) | | — | | — | | — | | — | | (4.7) | |
| Treasury stock purchases | — | | — | | (150,526) | | 4.9 | | — | | — | | — | | (4.9) | | — | |
| Other | — | | — | | — | | — | | — | | — | | (1.8) | | — | | (1.8) | |
| Balance, December 31, 2019 | 1,215,317 | | $ | 20.0 | | 119,826,202 | | $ | 2,189.4 | | $ | (9.7) | | $ | 1,142.4 | | $ | 432.7 | | $ | (165.7) | | $ | 3,609.1 | |
| Comprehensive income (loss) | — | | — | | — | | — | | 3.6 | | (1,796.5) | | 76.2 | | — | | (1,716.7) | |
| Exchange of Series A units for PBF Energy Class A common stock | (254,647) | | (2.3) | | 254,647 | | 2.3 | | — | | — | | — | | — | | — | |
| Distribution to members | — | | — | | — | | — | | — | | (36.3) | | (46.8) | | — | | (83.1) | |
| | | | | | | | | |
| Stock-based compensation | — | | — | | — | | 28.2 | | — | | — | | 4.9 | | — | | 33.1 | |
| Transactions in connection with stock-based compensation plans | 9,977 | | (0.1) | | 166,685 | | (1.2) | | — | | — | | — | | — | | (1.3) | |
| Treasury stock purchases | — | | — | | (124,662) | | 1.6 | | — | | — | | — | | (1.6) | | — | |
| Other | — | | — | | — | | — | | — | | (0.1) | | (0.9) | | — | | (1.0) | |
| Balance, December 31, 2020 | 970,647 | | $ | 17.6 | | 120,122,872 | | $ | 2,220.3 | | $ | (6.1) | | $ | (690.5) | | $ | 466.1 | | $ | (167.3) | | $ | 1,840.1 | |
| | | | | | | | | | | | | | | | | | | | | | | | | | | | | |
| | | | | | | |
| | | | |
| | | | | | | | | |
| Comprehensive income | — | | — | | — | | — | | 26.4 | | 299.6 | | 82.1 | | — | | 408.1 | |
| Exchange of Series A units for PBF Energy Class A common stock | (110,557) | | (0.4) | | 110,557 | | 0.4 | | — | | — | | — | | — | | — | |
| Distribution to members | — | | — | | — | | — | | — | | — | | (40.0) | | — | | (40.0) | |
| | | | | | | | | |
| | | | | | | | | |
| Stock-based compensation | — | | — | | — | | 23.9 | | — | | — | | 5.3 | | — | | 29.2 | |
| Transactions in connection with stock-based compensation plans | 67,900 | | 0.4 | | 234,739 | | (1.4) | | — | | — | | (1.6) | | — | | (2.6) | |
| Treasury stock purchases | — | | — | | (127,360) | | 1.8 | | — | | — | | — | | (1.8) | | — | |
| | | | | | | | | |
| Other | — | | — | | — | | — | | — | | — | | (0.7) | | — | | (0.7) | |
| Balance, December 31, 2021 | 927,990 | | $ | 17.6 | | 120,340,808 | | $ | 2,245.0 | | $ | 20.3 | | $ | (390.9) | | $ | 511.2 | | $ | (169.1) | | $ | 2,234.1 | |
See notes to consolidated financial statements.
F- 17
PBF ENERGY COMPANY LLC AND SUBSIDIARIES
CONSOLIDATED STATEMENTS OF CASH FLOWS
(in millions)
| | | | | | | | | | | | | | | | | |
| Year Ended December 31, |
| 2021 | | 2020 | | 2019 |
| Cash flows from operating activities: | | | | | |
| Net income (loss) | $ | 381.7 | | | $ | (1,720.3) | | | $ | 480.0 | |
| Adjustments to reconcile net income (loss) to net cash (used in) provided by operating activities: | | | | | |
| Depreciation and amortization | 483.8 | | | 581.1 | | | 447.5 | |
| Impairment expense | — | | | 98.8 | | | — | |
| Stock-based compensation | 35.6 | | | 34.2 | | | 37.3 | |
| Change in fair value of catalyst obligations | (8.5) | | | 11.8 | | | 9.7 | |
| Deferred income taxes | (14.5) | | | 7.3 | | | (8.8) | |
| Non-cash change in inventory repurchase obligations | (8.4) | | | (12.6) | | | 25.4 | |
| Non-cash lower of cost or market inventory adjustment | (669.6) | | | 268.0 | | | (250.2) | |
| Change in fair value of contingent consideration | 32.4 | | | (93.7) | | | (0.8) | |
| (Gain) loss on extinguishment of debt | (79.9) | | | 22.2 | | | — | |
| Pension and other post-retirement benefit costs | 50.8 | | | 55.7 | | | 44.8 | |
| Gain on sale of assets | (3.0) | | | (477.8) | | | (29.9) | |
| | | | | |
| Changes in operating assets and liabilities: | | | | | |
| Accounts receivable | (764.7) | | | 321.0 | | | (115.1) | |
| Inventories | (149.3) | | | 392.2 | | | (6.3) | |
| Prepaid and other current assets | (16.2) | | | (1.8) | | | 2.2 | |
| Accounts payable | 480.7 | | | (206.6) | | | 137.5 | |
| Accrued expenses | 810.6 | | | 124.9 | | | 219.5 | |
| Deferred revenue | (4.5) | | | 27.1 | | | 0.1 | |
| Other assets and liabilities | (75.3) | | | (63.7) | | | (56.0) | |
| Net cash provided by (used in) operating activities | $ | 481.7 | | | $ | (632.2) | | | $ | 936.9 | |
| | | | | |
| Cash flows from investing activities: | | | | | |
| Expenditures for property, plant and equipment | (249.1) | | | (196.2) | | | (404.9) | |
| Expenditures for deferred turnaround costs | (117.7) | | | (188.1) | | | (299.3) | |
| Expenditures for other assets | (28.9) | | | (9.1) | | | (44.7) | |
| Acquisition of Martinez refinery | — | | | (1,176.2) | | | — | |
| Proceeds from sale of assets | 7.2 | | | 543.1 | | | 36.3 | |
| | | | | |
| Net cash used in investing activities | $ | (388.5) | | | $ | (1,026.5) | | | $ | (712.6) | |
See notes to consolidated financial statements.
F- 18
PBF ENERGY COMPANY LLC AND SUBSIDIARIES
CONSOLIDATED STATEMENTS OF CASH FLOWS (Continued)
(in millions)
| | | | | | | | | | | | | | | | | |
| Year Ended December 31, |
| Cash flows from financing activities: | 2021 | | 2020 | | 2019 |
| Proceeds from issuance of PBF LLC Series C units | $ | — | | | $ | — | | | $ | — | |
| Net proceeds from issuance of PBFX common units | — | | | — | | | 132.5 | |
| Distributions to PBF Energy Company LLC members | — | | | (36.3) | | | (146.7) | |
| Distributions to PBFX public unitholders | (39.0) | | | (45.9) | | | (62.5) | |
| Distribution to T&M and Collins shareholders | (0.7) | | | — | | | — | |
| Proceeds from 2025 9.25% Senior Secured Notes | — | | | 1,250.6 | | | — | |
| Proceeds from 2028 6.00% Senior Notes | — | | | 1,000.0 | | | — | |
| Repurchase of 2028 6.00% Senior Notes | (109.3) | | | — | | | — | |
| Repurchase of 2025 7.25% Senior Notes | (37.5) | | | — | | | — | |
| Redemption of 2023 7.00% Senior Notes | — | | | (517.5) | | | — | |
| Proceeds from revolver borrowings | — | | | 1,450.0 | | | 1,350.0 | |
| Repayments of revolver borrowings | — | | | (550.0) | | | (1,350.0) | |
| | | | | |
| Repayments of PBF Rail Term Loan | (7.4) | | | (7.2) | | | (7.0) | |
| Proceeds from PBFX revolver borrowings | — | | | 100.0 | | | 228.0 | |
| Repayments of PBFX revolver borrowings | (100.0) | | | (183.0) | | | (101.0) | |
| | | | | |
| Affiliate note payable with PBF Energy Inc. | (1.1) | | | (0.1) | | | (3.1) | |
| | | | | |
| Deferred payment for the East Coast Storage Assets Acquisition | — | | | — | | | (32.0) | |
| Settlement of precious metal catalyst obligations | (31.7) | | | (8.8) | | | (6.5) | |
| Proceeds from catalyst financing arrangements | — | | | 51.9 | | | — | |
| Payments on financing leases | (17.8) | | | (12.4) | | | — | |
| Taxes paid for net settlement of equity-based compensation | — | | | (2.1) | | | (4.8) | |
| Payments of contingent consideration | (12.2) | | | — | | | — | |
| | | | | |
| Purchases of treasury stock | — | | | (1.6) | | | (4.9) | |
| Deferred financing costs and other | (4.0) | | | (35.3) | | | 1.4 | |
| Net cash (used in) provided by financing activities | $ | (360.7) | | | $ | 2,452.3 | | | $ | (6.6) | |
| | | | | |
| Net change in cash and cash equivalents | (267.5) | | | 793.6 | | | 217.7 | |
| Cash and cash equivalents, beginning of period | 1,607.3 | | | 813.7 | | | 596.0 | |
| Cash and cash equivalents, end of period | $ | 1,339.8 | | | $ | 1,607.3 | | | $ | 813.7 | |
| | | | | | | | | | | | | | | | | |
| |
| | | | | |
| Supplemental cash flow disclosures | | | | | |
| Non-cash activities: | | | | | |
| Accrued and unpaid capital expenditures | $ | 104.0 | | | $ | 32.1 | | | $ | 37.2 | |
| Assets acquired or remeasured under operating and financing leases | (106.6) | | | 702.0 | | | 434.9 | |
| Fair value of the Martinez Contingent Consideration at acquisition | — | | | 77.3 | | | — | |
| | | | | |
| | | | | |
| | | | | |
| Cash paid during year for: | | | | | |
| Interest, net of capitalized interest of $9.1, $12.6 and $18.1 in 2021, 2020 and 2019, respectively | $ | 307.0 | | | $ | 206.9 | | | $ | 154.0 | |
| Income taxes | 2.1 | | | 1.0 | | | 1.2 | |
| | | | | | | | | | | | | | | | | |
| |
| | | | | |
| Supplemental cash flow disclosures | | | | | |
| Non-cash activities: | | | | | |
| Accrued and unpaid capital expenditures | $ | 145.0 | | | $ | 166.1 | | | $ | 104.0 | |
| Assets acquired or remeasured under operating and financing leases | 271.6 | | | 54.7 | | | (106.6) | |
| | | | | |
| Contribution of assets to SBR equity method investment | (748.3) | | | — | | | — | |
| Settlement of affiliate note payable to fund investment in SBR working capital | (74.9) | | | — | | | — | |
| | | | | |
| | | | | |
| Cash paid during year for: | | | | | |
| Interest, net of capitalized interest of $38.2, $25.0 and $9.1 in 2023, 2022 and 2021, respectively | $ | 103.6 | | | $ | 249.7 | | | $ | 307.0 | |
| Income taxes | 299.0 | | | 148.9 | | | 5.7 | |
See notes to consolidated financial statements.
F- 1912
PBF ENERGY INC. AND PBF ENERGY COMPANY LLC
NOTES TO CONSOLIDATED FINANCIAL STATEMENTS
1. DESCRIPTION OF THE BUSINESS AND BASIS OF PRESENTATION
Description of the Business
PBF Energy Inc. (“PBF Energy”) is the sole managing member of PBF Energy Company LLC (“PBF LLC”), with a controlling interest in PBF LLC and its subsidiaries. PBF Energy consolidates the financial results of PBF LLC and its subsidiaries and records a noncontrolling interest in its Consolidated Financial Statements representing the economic interests of PBF LLC’s members other than PBF Energy (refer to “Note 1714 - Noncontrolling Interests”).
PBF Energy holds a 99.2%99.3% economic interest in PBF LLC as of December 31, 20212023 through its ownership of PBF LLC Series C Units, which are held solely by PBF Energy. Holders of PBF LLC Series A Units, which are held by parties other than PBF Energy (“the members of PBF LLC other than PBF Energy”), hold the remaining 0.8%0.7% economic interest in PBF LLC. In addition, the amended and restated limited liability company agreement of PBF LLC provides that any PBF LLC Series A Units acquired by PBF Energy will automatically be reclassified as PBF LLC Series C Units in connection with such acquisition. PBF LLC, together with its consolidated subsidiaries, owns and operates oil refineries and related facilities in North America.
As of December 31, 2021, PBF LLC, also held a 47.9% limited partnertogether with its subsidiaries, owns an interest in PBF Logistics LP (“PBFX”),an equity method investment that owns and operates a publicly-traded master limited partnership (“MLP”) (refer to “Note 3 - PBF Logistics LP”biorefinery co-located with the Chalmette refinery in Louisiana (the “Renewable Diesel Facility”). PBF Logistics GP LLC (“PBF GP”) owns the noneconomic general partner interest and serves as the general partner of PBFX and is wholly owned by PBF LLC. PBF Energy, through its ownership of PBF LLC, consolidates the financial results of PBFX and its subsidiaries and records a noncontrolling interest in its consolidated financial statements representing the economic interests of PBFX’s unitholders other than PBF LLC (refer to “Note 17 - Noncontrolling Interests”).
Collectively, PBF Energy and its consolidated subsidiaries, are referred to hereinafter as the “Company” unless the context otherwise requires. Discussions or areas of the Notes to Consolidated Financial Statements that either apply only to PBF Energy or PBF LLC are clearly noted.
Substantially all of the Company’s operations are in the United States. The Company operates in 2two reportable business segments: Refining and Logistics. The Company’s oil refineries are all engaged in the refining of crude oil and other feedstocks into petroleum products and are aggregated intorepresent the Refining segment. PBFXPBF Logistics LP (“PBFX”) operates logistics assets such as crude oil and refined products terminals, pipelines and storage facilities. The Logistics segment consists solely of PBFX’s operations.
COVID-19Investment in Equity Method Investee
On June 27, 2023, the Company contributed certain assets to St. Bernard Renewables LLC (“SBR”), a jointly held investment between the Company and Market DevelopmentsEni Sustainable Mobility US. Inc., a controlled subsidiary of Eni S.p.A. (collectively “Eni”). The Company accounts for its 50% equity ownership of SBR as an equity method investment, as the Company has significant influence, but not control, over SBR.
The impactPBFX Merger Transaction
On November 30, 2022, PBF Energy, PBF LLC, PBFX Holdings Inc., a Delaware corporation and wholly-owned subsidiary of PBF LLC, Riverlands Merger Sub LLC, a Delaware limited liability company and wholly owned subsidiary of PBF LLC, PBFX, and PBF Logistics GP LLC (“PBFX GP”) closed on a definitive agreement (the “Merger Agreement”) pursuant to which PBF Energy and PBF LLC acquired all of the unprecedented global health and economic crisis sparked by the coronavirus (“COVID-19”) pandemic, and variants thereof, and related adverse impact on economic and commercial activity resultedpublicly held common units in a significant reduction in demand for refined petroleum and petrochemical products startingPBFX representing limited partner interests in the first quartermaster limited partnership not already owned by certain wholly-owned subsidiaries of 2020. This significant demand reduction has had an adverse impactPBF Energy and its affiliates (the “Merger Transaction”). Subsequent to closing on the Company’s resultsMerger Transaction, PBFX became an indirect wholly-owned subsidiary of operationsPBF Energy and liquidity position. Demand for these products, however, started to recover throughout the year ended December 31, 2021 in connection with the lifting or easing of restrictions by many governmental authorities and the distribution of COVID-19 vaccines and other protective measures. The Company has adjusted throughput rates across its entire refining system to correlate with the gradual increases in demand, while still running below historic levels.
It is impossible to estimate the duration or significance of the financial impact that will result from the COVID-19 pandemic. However, the extent of the impact of the COVID-19 pandemic on the Company’s business, financial condition, results of operations and liquidity will depend largely on future developments, including the duration and severity of the pandemic and variants thereof, particularly within the geographic areas where the Company operates, the effectiveness of vaccine programs, and the related impact on overall economic activity, all of which cannot be predicted with certainty at this time.PBF LLC.
PBF ENERGY INC. AND PBF ENERGY COMPANY LLC
NOTES TO CONSOLIDATED FINANCIAL STATEMENTS
At the effective time of the closing of the Merger Transaction, pursuant to the terms of the Merger Agreement, each PBFX Public Common Unit was converted into the right to receive: (i) 0.27 of a share of Class A Common Stock, par value $0.001 per share, of PBF Energy, (ii) $9.25 in cash, without interest, and (iii) any cash in lieu of fractional shares of PBF Energy Common Stock to which the holder thereof became entitled upon surrender of such PBFX Public Common Units in accordance with the Merger Agreement. Such Merger Agreement consideration totaled $303.7 million in cash and resulted in the issuance of 8,864,684 shares of PBF Energy Class A common stock. The PBFX Common Units owned by PBF LLC and PBFX Holdings Inc. and the non-economic general partner interest remained outstanding and were unaffected by the Merger Transaction. There was no change in ownership of the non-economic general partner interest.
The Merger Transaction was accounted for in accordance with Financial Accounting Standards Board (“FASB”) Accounting Standards Codification (“ASC”) 810, Consolidation. Because the Company controlled PBFX both before and after the Merger Transaction, the changes in the Company’s ownership interest in PBFX resulting from the Merger Transaction was accounted for as an equity transaction, and no gain or loss was recognized in the Company’s Consolidated Statements of Operations. In addition, the tax effects of the Merger Transaction were recorded as adjustments to other assets, deferred income taxes and additional paid-in capital consistent with ASC 740, Income Taxes (“ASC 740”).
2. SUMMARY OF SIGNIFICANT ACCOUNTING POLICIES
Principles of Consolidation and Presentation
These Consolidated Financial Statements include the accounts of PBF Energy and subsidiaries in which PBF Energy has a controlling interest. All intercompany accounts and transactions have been eliminated in consolidation.
Cost Classifications
Cost of products and other consists of the cost of crude oil, other feedstocks, blendstocks and purchased refined products and the related in-bound freight and transportation costs.
Operating expenses (excluding depreciation and amortization) consists of direct costs of labor, maintenance and services, utilities, property taxes, environmental compliance costs and other direct operating costs incurred in connection with ourthe Company’s refining operations. Such expenses exclude depreciation related to refining and logistics assets that are integral to the refinery production process, which is presented separately as Depreciation and amortization expense as a component of Cost of sales on the Company’s Consolidated Statements of Operations.
Reclassification
As of December 31, 2021, Transactions in connection with stock-based compensation plans, previously disclosed as either Exercise of warrants and options or Taxes paid for net settlement of equity-based compensation, in the Consolidated Statements of Changes in Equity, are now disclosed together within one line item in the Consolidated Statements of Changes in Equity. Certain of these amounts previously reported in the Company's Consolidated Financial Statements and the respective notes for prior periods have been reclassified to conform to the 2021 presentation.
Use of Estimates
The preparation of the financial statements in conformity with accounting principles generally accepted in the United States (“GAAP”) requires management to make estimates and assumptions that affect the reported amounts of assets, liabilities, revenues and expenses and the related disclosures. Actual results could differ from those estimates.
PBF ENERGY INC.
NOTES TO CONSOLIDATED FINANCIAL STATEMENTS
Impairment Assessment of Long-Lived Assets and Definite-Lived Intangibles
The Company evaluates long-lived assets for impairment on a continual basis and reassesses the reasonableness of their related useful lives whenever events or changes in circumstances warrant assessment. Possible triggering events may include, among other things, significant adverse changes in the business climate, market conditions, environmental regulations or a determination that it is more likely than not that an asset or an asset group will be sold or retired before its estimated useful life. These possible triggering events of impairment may impact the Company’s assumptions related to future throughput levels, future operating revenues, expenses and gross margin, levels of anticipated capital expenditures and remaining useful life. Long-lived assets are tested for recoverability whenever events or changes in circumstances indicate that the carrying amount of the asset may not be recoverable. A long-lived asset is not recoverable if its carrying amount exceeds the sum of the undiscounted cash flows expected to result from its use, early retirement or disposition. Cash flows for long-lived assets/asset groups are determined at the lowest level for which identifiable cash flows exist. The cash flows from the refinery asset groups are evaluated individually regardless of product mix or fuel type produced. If a long-lived asset is not recoverable, an impairment loss is recognized for the amount by which the carrying amount of the long-lived asset exceeds its fair value, with fair value determined based on discounted estimated net cash flows or other appropriate methods. The Company’s assumptions incorporate inherent uncertainties that are at times difficult to predict and could result in impairment charges or accelerated depreciation in future periods if actual results materially differ from the estimated assumptions used.
Equity Method Investment
For equity investments that are not required to be consolidated under the variable or voting interest model, the Company evaluates the level of influence it is able to exercise over an entity’s operations to determine whether to use the equity method of accounting. The Company’s judgment regarding the level of influence over an equity method investment includes considering key factors such as its ownership interest, participation in policy-making and other significant decisions and material intercompany transactions. Equity investments for which the Company determines it has significant influence are accounted for as equity method investments. Amounts recognized for equity method investments are shown separately in the Company’s Consolidated Balance Sheets and adjusted for its share of the net earnings and losses of the investee and cash distributions, which is separately stated in its Consolidated Statements of Operations and its Consolidated Statements of Cash Flows.
Contributions made to equity method investees at times are in the form of loan agreements. Loans provided to equity method investees that are made based on the Company's proportionate ownership percentage are accounted for as “in-substance capital contributions” and are treated as an increase to the investment. In addition, the Company treats interest paid in kind on the loan agreements as an “in-substance return of capital” and reduces its investment accordingly, rather than recording interest income.
The Company evaluates its equity method investments presented for impairment whenever events or changes in circumstances indicate that the carrying amounts of such investments may be impaired. There were no impairment losses recorded on equity method investments for the year ended December 31, 2023. See “Note 6 - Equity Investment in SBR” for further information on the Company’s only current equity method investment.
Variable Interest Entities
The Company’s Consolidated Financial Statements include the financial statements of its subsidiaries and variable interest entities (“VIE”), of which the Company is the primary beneficiary. The Company evaluates all legal entities in which it holds an ownership or other financial interest to determine if the entity is a VIE. Variable interests can be contractual, ownership or other financial interests in an entity that change with changes in the fair value of the VIE’s assets. If the Company is not the primary beneficiary, the general partner or another limited partner may consolidate the VIE, and the Company records the investment as an equity method investment.
PBF ENERGY INC. AND PBF ENERGY COMPANY LLC
NOTES TO CONSOLIDATED FINANCIAL STATEMENTS
Business Combinations
We use the acquisition method of accounting for the recognition of assets acquired and liabilities assumed in business combinations at their estimated fair values as of the date of acquisition. Any excess consideration transferred over the estimated fair values of the identifiable net assets acquired is recorded as goodwill. Significant judgment is required in estimating the fair value of assets acquired. As a result, in the case of significant acquisitions, we obtain the assistance of third-party valuation specialists in estimating fair values of tangible and intangible assets based on available historical information and on expectations and assumptions about the future, considering the perspective of marketplace participants. While management believes those expectations and assumptions are reasonable, they are inherently uncertain. Unanticipated market or macroeconomic events and circumstances may occur, which could affect the accuracy or validity of the estimates and assumptions.
Certain of the Company’s acquisitions may include earn-out provisions or other forms of contingent consideration. As of the acquisition date, the Company records contingent consideration, as applicable, at the estimated fair value of expected future payments associated with the earn-out. Any changes to the recorded fair value of contingent consideration, subsequent to the measurement period, will be recognized as earnings in the period in which it occurs.
Cash and Cash Equivalents
The Company considers all highly liquid investments with original maturities of three months or less to be cash equivalents. The carrying amount of the cash equivalents approximates fair value due to the short-term maturity of those instruments.
Concentrations of Credit Risk
For the yearyears ended December 31, 20212023 and December 31, 2020,2022, only 1one customer, Shell plc (“Shell”), accounted for 10% or more of the Company’s revenues (approximately 15%14% and 13%14%, respectively). For the year ended December 31, 2019 no single customer amounted to greater than or equal to 10% of the Company’s revenues.
As of December 31, 20212023 and December 31, 2020,2022, only 1one customer, Shell, accounted for 10% or more of the Company’s total trade accounts receivable (approximately 26%19% and 16%19%, respectively).
Revenue Recognition
The Company sells various refined products primarily through its refinery subsidiaries and recognizes revenue related to the sale of products when control of the promised goods or services is transferred to the customers, in an amount that reflects the consideration the Company expects to be entitled to in exchange for those goods or services. Refer to “Note 2017 - Revenues” for further discussion of the Company’s revenue recognition policy.
Accounts Receivable
Accounts receivable are carried at invoiced amounts. An allowance for doubtful accounts is established, if required, to report such amounts at their estimated net realizable value. In estimating probable losses, management reviews accounts that are past due and determines if there are any known disputes.
Excise taxes on sales of refined products that are collected from customers and remitted to various governmental agencies are reported on a net basis.
PBF ENERGY INC. AND PBF ENERGY COMPANY LLC
NOTES TO CONSOLIDATED FINANCIAL STATEMENTS
Inventory
Inventories are carried at the lower of cost or market.market (“LCM”). The cost of crude oil, feedstocks, blendstocks and refined products are determined under the last-in first-out (“LIFO”) method using the dollar value LIFO method with increments valued based on average purchase prices during the year. The cost of supplies and other inventories is determined principally on the weighted average cost method.
RINs
The Company is subject to obligations to purchase Renewable Identification Numbers (“RINs”) required to comply with the the renewable fuel standard implemented by Environmental Protection Agency (“EPA”), which sets annual quotas for the quantity of renewable fuels (such as ethanol) that must be blended into motor fuels consumed in the United States (the “Renewable Fuel Standard”“RFS”). The Company’s overall RINs obligation is based on a percentage of domestic shipments of on-road fuels as established by EPA. To the degree the Company is unable to blend the required amount of biofuels to satisfy its RINs obligation, RINs must be purchased on the open market to avoid penalties and fines. The Company records its RINs obligation on a net basis in Accrued expenses when its RINs liability is greater than the amount of RINs earned and purchased in a given period and in Prepaid and other current assets when the amount of RINs earned and purchased is greater than the RINs liability.
PBF ENERGY INC.
NOTES TO CONSOLIDATED FINANCIAL STATEMENTS
Leases
The Company leases office space, office equipment, refinery facilities and equipment, railcars and other logistics assets primarily under non-cancelable operating leases, with terms typically ranging from one to twenty years, subject to certain renewal options as applicable. The Company considers those renewal or termination options that are reasonably certain to be exercised in the determination of the lease term and initial measurement of lease liabilities and right-of-use assets. Lease expense for operating lease payments is recognized on a straight-line basis over the lease term. Interest expense for finance leases is incurred based on the carrying value of the lease liability. Leases with an initial term of 12 months or less are not recorded on the Company’s Consolidated Balance Sheets.
The Company determines whether a contract is or contains a lease at inception of the contract and whether that lease meets the classification criteria of a finance or operating lease. When available, the Company uses the rate implicit in the lease to discount lease payments to present value; however, most of the Company’s leases do not provide a readily determinable implicit rate. Therefore, the Company must discount lease payments based on an estimate of its incremental borrowing rate.
For substantially all classes of underlying assets, the Company has elected the practical expedient not to separate lease and non-lease components, which allows for combining the components if certain criteria are met. For certain leases of refinery support facilities, the Company accounts for the non-lease service component separately.
Property, Plant and Equipment
Property, plant and equipment additions are recorded at cost. The Company capitalizes costs associated with the preliminary, pre-acquisition and development/construction stages of a major construction project. The Company capitalizes the interest cost associated with major construction projects based on the effective interest rate of total borrowings. The Company also capitalizes costs incurred in the acquisition and development of software for internal use, including the costs of software, materials, consultants and payroll-related costs for employees incurred in the application development stage.
PBF ENERGY INC. AND PBF ENERGY COMPANY LLC
NOTES TO CONSOLIDATED FINANCIAL STATEMENTS
Depreciation is computed using the straight-line method over the following estimated useful lives:
| | | | | |
| |
| Computers, furniture and fixtures | | | | | 3-7 years |
| Leasehold improvements | 20 years |
| Process units and equipment | 5-25 years |
| Pipeline and equipment | 5-25 years |
| Buildings | 25 years |
Computers, furniture and fixtures | 3-7 years |
Leasehold improvements | 20 years |
| Railcars | 50 years |
Maintenance and repairs are charged to operating expenses as they are incurred. Improvements and betterments, which extend the lives of the assets, are capitalized.
PBF ENERGY INC.
NOTES TO CONSOLIDATED FINANCIAL STATEMENTS
Deferred Charges and Other Assets, Net
Deferred charges and other assets include refinery turnaround costs, catalyst, precious metal catalysts, linefill, deferred financing costs and intangible assets. Refinery turnaround costs, which are incurred in connection with planned major maintenance activities, are capitalized when incurred and amortized on a straight-line basis over the period of time estimated to lapse until the next turnaround occurs.occurs, which is based on an engineering assessment. The amortization period generally ranges from 3 to 6 years; however, based uponon the specific facts and circumstances, different periods of deferral may occur.
Precious metal catalysts, linefill and certain other intangibles are considered indefinite-lived assets as they are not expected to deteriorate in their prescribed functions. Such assets are assessed for impairment in connection with the Company’s review of its long-lived assets.
Deferred financing costs are capitalized when incurred and amortized over the life of the loan (generally 1 to 8 years).loan.
Intangible assets with finite lives primarily consist of emission credits, permits and customer relationships and are amortized over their estimated useful lives (generally 1 to 10 years).
Asset Retirement Obligations
The Company records an asset retirement obligation at fair value for the estimated cost to retire a tangible long-lived asset at the time the Company incurs that liability, which is generally when the asset is purchased, constructed, or leased. The Company records the liability when it has a legal or contractual obligation to incur costs to retire the asset and when a reasonable estimate of the fair value of the liability can be made. If a reasonable estimate cannot be made at the time the liability is incurred, the Company will record the liability when sufficient information is available to estimate the liability’s fair value. Certain of the Company’s asset retirement obligations are based on its legal obligation to perform remedial activity at its refinery sites when it permanently ceases operations of the long-lived assets. The Company therefore considers the settlement date of these obligations to be indeterminable. Accordingly, the Company cannot calculate an associated asset retirement liability for these obligations at this time. The Company will measure and recognize the fair value of these asset retirement obligations when the settlement date is determinable.
PBF ENERGY INC. AND PBF ENERGY COMPANY LLC
NOTES TO CONSOLIDATED FINANCIAL STATEMENTS
Environmental Matters
Liabilities for future remediation costs are recorded when environmental assessments and/or remedial efforts are probable, and the costs can be reasonably estimated. Other than for assessments, the timing and magnitude of these accruals generally are based on the completion of investigations or other studies or a commitment to a formal plan of action. Environmental liabilities are based on best estimates of probable future costs using currently available technology and applying current regulations, as well as the Company’s own internal environmental policies. The measurement of environmental remediation liabilities may be discounted to reflect the time value of money if the aggregate amount and timing of cash payments of the liabilities are fixed or reliably determinable. The actual settlement of the Company’s liability for environmental matters could materially differ from its estimates due to a number of uncertainties such as the extent of contamination, changes in environmental laws and regulations, potential improvements in remediation technologies and the participation of other responsible parties.
PBF ENERGY INC.
NOTES TO CONSOLIDATED FINANCIAL STATEMENTS
Stock-Based Compensation
Stock-based compensation includes the accounting effect of options to purchase PBF Energy Class A common stock granted by the Company to certain employees, Series A warrants issued or granted by PBF LLC to employees in connection with their acquisition of PBF LLC Series A units, options to acquire Series A units of PBF LLC granted by PBF LLC to certain employees, Series B units of PBF LLC that were granted to certain members of management and restricted PBF LLC Series A Units and restricted PBF Energy Class A common stock granted to certain directors and officers. The estimated fair value of the options to purchase PBF Energy Class A common stock and the PBF LLC Series A warrants and options is based on the Black-Scholes option pricing model and the fair value of the PBF LLC Series B units is estimated based on a Monte Carlo simulation model. The estimated fair value is amortized as stock-based compensation expense on a straight-line method over the vesting period and included in General and administrative expense with forfeitures recognized in the period they occur.
Additionally, stock-based compensation includes unit-based compensation provided to certain officers, non-employee directors and seconded employees of PBFX’s general partner, PBF GP, or its affiliates, consisting of PBFX phantom units. The fair value of PBFX’s phantom units are measured based on the fair market value of the underlying common units on the date of grant based on the commonunit closing price on the grant date. The estimated fair value of PBFX’s phantom units is amortized over the vesting period using the straight-line method. Awards vest over a four year service period. The phantom unit awards may be settled in common units, cash or a combination of both. Expenses related to unit-based compensation are also included in General and administrative expenses with forfeitures recognized in the period they occur.
PBF EnergyCompany grants performance share unit awards and performance unit awards to certain key employees. Performance awards granted to employees prior to November 1, 2020 are based on a three-year performance cycle with 4four measurement periods and performance awards granted to employees after November 1, 2020 are based on a three-year performance cycle having a single measurement period. The payout for each, which ranges from 0%zero to 200%, is based on the relative ranking of the total shareholder return (“TSR”) of PBF Energy’s common stock as compared to the TSR of a selected group of industry peer companies over an average of four measurement periods. The performance share unit awards and performance unit awards are each measured at fair value based on Monte Carlo simulation models. The performance share unit awards will be settled in PBF Energy Class A common stock and are accounted for as equity awards and the performance unit awards will be settled in cash and are accounted for as liability awards.
PBF ENERGY INC. AND PBF ENERGY COMPANY LLC
NOTES TO CONSOLIDATED FINANCIAL STATEMENTS
Income Taxes
As a result of the PBF Energy’s acquisition of PBF LLC Series A Units or exchanges of PBF LLC Series A Units for PBF Energy Class A common stock, PBF Energy expects to benefit from amortization and other tax deductions reflecting the step up in tax basis in the acquired assets. Those deductions will be allocated to PBF Energy and will be taken into account in reporting PBF Energy’s taxable income. As a result of a federal income tax election made by PBF LLC, applicable to a portion of PBF Energy’s acquisition of PBF LLC Series A Units, the income tax basis of the assets of PBF LLC, underlying a portion of the units PBF Energy acquired, has been adjusted based upon the amount that PBF Energy paid for that portion of its PBF LLC Series A Units. PBF Energy entered into a tax receivable agreement with the PBF LLC Series A and PBF LLC Series B unitholders (the “Tax Receivable Agreement”), which provides for the payment by PBF Energy equal to 85% of the amount of the benefits, if any, that PBF Energy is deemed to realize as a result of (i) increases in tax basis and (ii) certain other tax benefits related to entering into the Tax Receivable Agreement, including tax benefits attributable to payments under the Tax Receivable Agreement. As a result of these transactions, PBF Energy’s tax basis in its share of PBF LLC’s assets will be higher than the book basis of these same assets. This resulted in a deferred tax asset of $141.2$171.6 million as of December 31, 2021.2023.
PBF ENERGY INC.
NOTES TO CONSOLIDATED FINANCIAL STATEMENTS
Deferred taxes are calculated using a liability method, whereby deferred tax assets are recognized for deductible temporary differences and deferred tax liabilities are recognized for taxable temporary differences. Temporary differences represent the differences between reported amounts of assets and liabilities and their tax bases. Deferred tax assets are reduced by a valuation allowance when, in the opinion of management, it is more likely than not that some portion or all of the deferred tax assets will not be realized. Deferred tax assets and liabilities are adjusted for the effect of changes in tax laws and rates on the date of enactment. PBF Energy recognizes tax benefits for uncertain tax positions only if it is more likely than not that the position is sustainable based on its technical merits. Interest and penalties on uncertain tax positions are included as a component of the provision for income taxes on the Consolidated Statements of Operations. As a result of management’s assessment ofThe Company assesses the available positive and negative evidence to estimate whether sufficient future taxable income will be generated to permit use of the existing deferred tax assets asassets. On the basis of December 31, 2021,this evaluation, a valuation allowance of $308.5 million wasis recorded to recognize only the portion of deferred tax assets that are more likely than not to be realized. The amount of the deferred tax assets considered realizable, however, could be adjusted if estimates of future taxable income during the carryforwardcarryover period are reduced or increased or if objective negative evidence in the form of cumulative losses is no longer present and additional weight is given to subjective evidence such as ourPBF Energy’s projections for future taxable income. As a result of the valuation allowance, the liability associated with the Tax Receivable Agreement was $48.3 million as of December 31, 2021.
The Federal tax returns for all years since 20182020 and state tax returns for all years since 20162019 (see “Note 2118 - Income Taxes”) are subject to examination by the respective tax authorities.
Net Income Per Share
Net income per share is calculated by dividing the net income available to PBF Energy Class A common stockholders by the weighted average number of shares of PBF Energy Class A common stock outstanding during the period. Diluted net income per share is calculated by dividing the net income available to PBF Energy Class A common stockholders, adjusted for the net income attributable to the noncontrolling interest and the assumed income tax expense thereon, by the weighted average number of PBF Energy Class A common shares outstanding during the period adjusted to include the assumed exchange of all PBF LLC Series A units outstanding for PBF Energy Class A common stock, if applicable under the if converted method, and the potentially dilutive effect of outstanding options to purchase shares of PBF Energy Class A common stock, performance share awards and options and warrants to purchase PBF LLC Series A Units, subject to forfeiture utilizing the treasury stock method.
PBF ENERGY INC. AND PBF ENERGY COMPANY LLC
NOTES TO CONSOLIDATED FINANCIAL STATEMENTS
Pension and Other Post-Retirement Benefits
The Company recognizes an asset for the overfunded status or a liability for the underfunded status of its pension and post-retirement benefit plans. The funded status is recorded within Other long-term liabilities or Other non-current assets. Changes in the plans’ funded status are recognized in other comprehensive income in the period the change occurs.
Fair Value Measurement
A fair value hierarchy (Level 1, Level 2, or Level 3) is used to categorize fair value amounts based on the quality of inputs used to measure fair value. Accordingly, fair values derived from Level 1 inputs utilize quoted prices in active markets for identical assets or liabilities. Fair values derived from Level 2 inputs are based on quoted prices for similar assets and liabilities in active markets, and inputs other than quoted prices that are either directly or indirectly observable for the asset or liability. Level 3 inputs are unobservable inputs for the asset or liability, and include situations where there is little, if any, market activity for the asset or liability.
The Company uses appropriate valuation techniques based on the available inputs to measure the fair values of its applicable assets and liabilities. When available, the Company measures fair value using Level 1 inputs because they generally provide the most reliable evidence of fair value. In some valuations, the inputs may fall into different levels in the hierarchy. In these cases, the asset or liability level within the fair value hierarchy is based on the lowest level of input that is significant to the fair value measurements.
PBF ENERGY INC.
NOTES TO CONSOLIDATED FINANCIAL STATEMENTS
Financial Instruments
The estimated fair value of financial instruments has been determined based on the Company’s assessment of available market information and appropriate valuation methodologies. The Company’s non-derivative financial instruments that are included in current assets and current liabilities are recorded at cost in the Consolidated Balance Sheets. The estimated fair value of these financial instruments approximates their carrying value due to their short-term nature. Derivative instruments are recorded at fair value in the Consolidated Balance Sheets.
The Company’s commodity contracts are measured and recorded at fair value using Level 1 inputs based on quoted prices in an active market, Level 2 inputs based on quoted market prices for similar instruments, or Level 3 inputs based on third-party sources and other available market based data. The Company’s catalyst obligations and derivatives related to the Company’s crude oil and feedstocks and refined product purchase obligations are measured and recorded at fair value using Level 2 inputs on a recurring basis, based on observable market prices for similar instruments.
Derivative Instruments
The Company is exposed to market risk, primarily related to changes in commodity prices for the crude oil and feedstocks used in the refining process as well as the prices of the refined products sold, and the risk associated with the price of credits needed to comply with various governmental and regulatory environmental compliance programs. The accounting treatment for commodity and environmental compliance contracts depends on the intended use of the particular contract and on whether or not the contract meets the definition of a derivative.
All derivative instruments, not designated as normal purchases or sales, are recorded in the Consolidated Balance Sheets as either assets or liabilities measured at their fair values. Changes in the fair value of derivative instruments that either are not designated or do not qualify for hedge accounting treatment or normal purchase or normal sale accounting are recognized currently in earnings. Contracts qualifying for the normal purchase and sales exemption are accounted for upon settlement. Cash flows related to derivative instruments that are not designated or do not qualify for hedge accounting treatment are included in operating activities.
PBF ENERGY INC. AND PBF ENERGY COMPANY LLC
NOTES TO CONSOLIDATED FINANCIAL STATEMENTS
The Company designates certain derivative instruments as fair value hedges of a particular risk associated with a recognized asset or liability. At the inception of the hedge designation, the Company documents the relationship between the hedging instrument and the hedged item, as well as its risk management objective and strategy for undertaking various hedge transactions. Derivative gains and losses related to these fair value hedges, including hedge ineffectiveness, are recorded in cost of sales along with the change in fair value of the hedged asset or liability attributable to the hedged risk. Cash flows related to derivative instruments that are designated as fair value hedges are included in operating activities.
Economic hedges are hedges not designated as fair value or cash flow hedges for accounting purposes that are used to (i) manage price volatility in certain refinery feedstock and refined product inventories, and (ii) manage price volatility in certain forecasted refinery feedstock purchases and refined product sales. These instruments are recorded at fair value and changes in the fair value of the derivative instruments are recognized currently in cost of sales.
Derivative accounting is complex and requires management judgment in the following respects: identification of derivatives and embedded derivatives, determination of the fair value of derivatives, documentation of hedge relationships, assessment and measurement of hedge ineffectiveness and election and designation of the normal purchases and sales exception.exemption. All of these judgments, depending upon their timing and effect, can have a significant impact on the Company’s earnings.
Recently Issued Accounting Pronouncements
In March 2020, the Financial Accounting Standards Board (“FASB”) issued Accounting Standard Update (“ASU”) 2020-04, “Reference Rate Reform (Topic 848): Facilitation of the effects of reference rate reform on financial reporting”. The amendments in this ASU provide optional guidance to alleviate the burden in accounting for reference rate reform, by allowing certain expedients and exceptions in applying GAAP to contracts, hedging relationship and other transactions affected by the expected market transition from London Interbank Offered Rate (“LIBOR”) and other interbank rates. The amendments in this ASU are effective for all entities at any time beginning on March 12, 2020 through December 31, 2022 and may be applied from the beginning of an interim period that includes the issuance date of the ASU. The Company does not expect that the adoption of this guidance will have a material impact on its Consolidated Financial Statements and related disclosures.
PBF ENERGY INC. AND PBF ENERGY COMPANY LLC
NOTES TO CONSOLIDATED FINANCIAL STATEMENTS
3. PBF LOGISTICS LP
PBFX is a fee-based, growth-oriented, publicly-traded MLP that owns and operates crude oil and refined products terminals, pipelines, storage facilities and similar logistics assets. PBFX engages in the processing of crude oil and the receiving, handling, storage and transferring of crude oil, refined products, natural gas and intermediates from sources located throughout the United States and Canada for PBF Energy in support of its refineries, as well as for third-party customers. As of December 31, 2021, a substantial majority of PBFX’s revenues are derived from long-term, fee-based commercial agreements with PBF Holding Company LLC (“PBF Holding”), a wholly owned subsidiary of PBF LLC, which include minimum volume commitments, for receiving, handling, storing and transferring crude oil, refined products and natural gas. PBF Energy also has agreements with PBFX that establish fees for certain general and administrative services and operational and maintenance services provided by PBF Holding to PBFX. These transactions, other than those with third parties, are eliminated by PBF Energy and PBF LLC in consolidation.
PBFX, a variable interest entity, is consolidated by PBF Energy through its ownership of PBF LLC. PBF LLC, through its ownership of PBF GP, has the sole ability to direct the activities of PBFX that most significantly impact its economic performance. PBF LLC is considered to be the primary beneficiary of PBFX for accounting purposes.
As of December 31, 2021, PBF LLC held a 47.9% limited partner interest in PBFX (consisting of 29,953,631 common units), with the remaining 52.1% limited partner interest held by the public unitholders.
PBF ENERGY INC. AND PBF ENERGY COMPANY LLC
NOTES TO CONSOLIDATED FINANCIAL STATEMENTS
4. ACQUISITIONS
Martinez Acquisition
On February 1, 2020, the Company acquired from Equilon Enterprises LLC d/b/a Shell Oil Products US (the "Seller"), the Martinez refinery and related logistics assets (collectively, the "Martinez Acquisition"), pursuant to a sale and purchase agreement dated June 11, 2019 (the “Sale and Purchase Agreement”). The Martinez refinery, located in Martinez, California, is a high-conversion, dual-coking facility that is strategically positioned in Northern California and provides for operating and commercial synergies with the Torrance refinery located in Southern California.
In addition to refining assets, the Martinez Acquisition includes a number of onsite logistics assets, including a deep-water marine facility, product distribution terminals and refinery crude and product storage facilities.
The aggregate purchase price for the Martinez Acquisition was $1,253.4 million, including final working capital of $216.1 million and the Martinez Contingent Consideration, as defined below. The transaction was financed through a combination of cash on hand, including proceeds from the $1.0 billion in aggregate principal amount of 6.0% senior unsecured notes due 2028 (the “2028 Senior Notes”), and borrowings under PBF Holding’s asset-based revolving credit facility (the “Revolving Credit Facility”).
The Company accounted for the Martinez Acquisition as a business combination under GAAP whereby it recognizes assets acquired and liabilities assumed in an acquisition at their estimated fair values as of the date of acquisition.
The total purchase consideration and the fair values of the assets and liabilities at the acquisition date were as follows:
| | | | | | |
(in millions) | Purchase Price | |
Gross purchase price | $ | 960.0 | | |
Working capital, including post close adjustments | 216.1 | | |
Contingent consideration (a) | 77.3 | | |
Total consideration | $ | 1,253.4 | | |
_________________________
(a) The Martinez Acquisition included an obligation for the Company to make post-closing earn-out payments to the Seller based on certain earnings thresholds of the Martinez refinery (as set forth in the Sale and Purchase Agreement), for a period of up to four years following the acquisition closing date (the “Martinez Contingent Consideration”). The Company recorded the Martinez Contingent Consideration based on its estimated fair value of $77.3 million at the acquisition date, which was recorded within “Other long-term liabilities” within the Consolidated Balance Sheets. Subsequent changes in the fair value of the Martinez Contingent Consideration are recorded in the Consolidated Statements of Operations.
PBF ENERGY INC. AND PBF ENERGY COMPANY LLC
NOTES TO CONSOLIDATED FINANCIAL STATEMENTS
Recently Issued Accounting Pronouncements
In November 2023, FASB issued Accounting Standard Update (“ASU”) 2023-07, “Segment Reporting (Topic 280) - Improvements to Reportable Segment Disclosures.” The following table summarizes the final amounts recognized for assets acquired and liabilities assumed as of the acquisition date:
| | | | | |
(in millions) | Fair Value Allocation |
Inventories | $ | 224.1 | |
Prepaid and other current assets | 5.4 | |
Property, plant and equipment | 987.9 | |
Operating lease right of use assets (a) | 7.8 | |
Financing lease right of use assets (a) | 63.5 | |
Deferred charges and other assets, net | 63.7 | |
Accrued expenses | (1.4) | |
Current operating lease liabilities | (1.9) | |
Current financing lease liabilities (b) | (6.0) | |
Long-term operating lease liabilities | (5.9) | |
Long-term financing lease liabilities | (57.5) | |
Other long-term liabilities - environmental obligation | (26.3) | |
Fair value of net assets acquired | $ | 1,253.4 | |
________________________
(a) Operating and Financing lease right of use assets are recordedamendments in Lease right of use assets within the Consolidated Balance Sheets.
(b) Current financing lease liabilities are recorded in Accrued expenses within the Consolidated Balance Sheets.
this ASU improve reportable segment disclosure requirements, primarily through enhanced disclosures about significant segment expenses. The Company’s adoption of this guidance will result in additional disclosure requirements but is not anticipated to have a significant impact on its Consolidated Financial Statements forStatements.
In December 2023, the year ended December 31, 2021 includeFASB issued ASU 2023-09, “Income Taxes (Topic 740) - Improvements to Income Tax Disclosures” which focuses on the results of operations of the Martinez refineryrate reconciliation and related logistics assets subsequentincome taxes paid. ASU No. 2023-09 requires a public business entity to disclose, on an annual basis, a tabular rate reconciliation using both percentages and currency amounts, broken out into specified categories with certain reconciling items further broken out by nature and jurisdiction to the Martinez Acquisition whereasextent those items exceed a specified threshold. In addition, all entities are required to disclose income taxes paid, net of refunds received disaggregated by federal, state/local, and foreign and by jurisdiction if the same periodamount is at least 5% of total income tax payments, net of refunds received. For public business entities, the new standard is effective for annual periods beginning after December 15, 2024, with early adoption permitted. An entity may apply the amendments in 2020 includes the resultsthis ASU prospectively or retrospectively. The Company’s adoption of operations of such assets from the date of the Martinez Acquisitionthis guidance will result in additional disclosure requirements but is not anticipated to have a significant impact on February 1, 2020 to December 31, 2020. On an unaudited pro-forma basis, the revenues and net income (loss) of the Company, assuming the acquisition had occurred on January 1, 2019, are shown below. The unaudited pro-forma information does not purport to present what the Company’s actual results would have been had the Martinez Acquisition occurred on January 1, 2019, nor is the financial information indicative of the results of future operations. The unaudited pro-forma financial information includes the depreciation and amortization expense related to the Martinez Acquisition and interest expense associated with the related financing.
| | | | | | | | | |
| | | December 31,
2020 |
(Unaudited, in millions) |
PBF Energy | | | |
Pro-forma revenues | | | $ | 15,479.7 | |
Pro-forma net loss attributable to PBF Energy Inc. stockholders | | | (1,423.4) | |
Pro forma net income (loss) available to PBF Energy Class A common stock per share: | | | |
Basic: | | | $ | (11.90) | |
Diluted: | | | $ | (11.90) | |
PBF LLC | | | |
Pro-forma revenues | | | $ | 15,479.7 | |
Pro-forma net loss attributable to PBF LLC | | | (1,827.8) | |
PBF ENERGY INC. AND PBF ENERGY COMPANY LLC
NOTES TO CONSOLIDATED FINANCIAL STATEMENTS
Acquisition Expenses
There were no acquisition costs for the year ended December 31, 2021. The Company incurred acquisition related costs consisting primarily of consulting and legal expenses related to completed, pending and non-consummated acquisitions of $12.5 million and $11.6 million in the years ended December 31, 2020 and 2019, respectively. These costs are included in theits Consolidated Statements of Operations in General and administrative expenses.Financial Statements.
5.3. CURRENT EXPECTED CREDIT LOSSES
Credit Losses
The Company has exposure to credit losses primarily through its sales of refined products. The Company evaluates creditworthiness on an individual customer basis. The Company utilizes a financial review model for purposes of evaluating creditworthiness which is based on information from financial statements and credit reports. The financial review model enables the Company to assess the customer’s risk profile and determine credit limits on the basis of their financial strength, including but not limited to, their liquidity, leverage, debt serviceability, longevity and how they pay their bills. The Company may require security in the form of letters of credit or cash payments in advance of product delivery for certain customers that are deemed higher risk.
The Company’s payment terms on its trade receivables are relatively short, generally 30 days or less for a substantial majority of its refined products. As a result, the Company’s collection risk is mitigated to a certain extent by the fact that sales are collected in a relatively short period of time, allowing for the ability to reduce exposure on defaults if collection issues are identified. Notwithstanding, the Company reviews each customer’s credit risk profile at least annually or more frequently if warranted. Following the widespread market disruption that has resulted from the COVID-19 pandemic, including resurgences and variants of the virus and related governmental responses, the Company has been performing ongoing credit reviews of its customers including monitoring for any negative credit events such as customer bankruptcy or insolvency events. As a result, the Company has adjusted payment terms or limited available trade credit for certain customers, as well as for customers within industries that are deemed to be at higher risk.
The Company performs a quarterly allowance for doubtful accounts analysis to assess whether an allowance needs to be recorded for any outstanding trade receivables. In estimating credit losses, management reviews accounts that are past due, have known disputes or have experienced any negative credit events that may result in future collectability issues. There was no allowance for doubtful accounts recorded as of December 31, 2021 and2023 or December 31, 2020, respectively.
PBF ENERGY INC. AND PBF ENERGY COMPANY LLC
NOTES TO CONSOLIDATED FINANCIAL STATEMENTS
6.4. INVENTORIES
Inventories consisted of the following:
| | | | | | | | | | | | | | | | | |
| December 31, 2021 |
| (in millions) | Titled Inventory | | Inventory Intermediation Agreement | | Total |
| Crude oil and feedstocks | $ | 953.5 | | | $ | 151.4 | | | $ | 1,104.9 | |
| Refined products and blendstocks | 964.6 | | | 293.8 | | | 1,258.4 | |
| Warehouse stock and other | 141.8 | | | — | | | 141.8 | |
| $ | 2,059.9 | | | $ | 445.2 | | | $ | 2,505.1 | |
| Lower of cost or market adjustment | — | | | — | | | — | |
| Total inventories | $ | 2,059.9 | | | $ | 445.2 | | | $ | 2,505.1 | |
| | | | | | | | | | | | | | | | | |
| December 31, 2023 |
| (in millions) | | | | | Total |
| Crude oil and feedstocks | | | | | $ | 1,495.4 | |
| Refined products and blendstocks | | | | | 1,536.5 | |
| Warehouse stock and other | | | | | 151.2 | |
| | | | | $ | 3,183.1 | |
| Lower of cost or market adjustment | | | | | — | |
| Total inventories | | | | | $ | 3,183.1 | |
| | | | | | | | | | | | | | | | | |
| December 31, 2022 |
| (in millions) | Titled Inventory | | Inventory Intermediation Agreement | | Total |
| Crude oil and feedstocks | $ | 1,195.2 | | | $ | 140.9 | | | $ | 1,336.1 | |
| Refined products and blendstocks | 1,244.7 | | | 40.9 | | | 1,285.6 | |
| Warehouse stock and other | 141.9 | | | — | | | 141.9 | |
| $ | 2,581.8 | | | $ | 181.8 | | | $ | 2,763.6 | |
| Lower of cost or market adjustment | — | | | — | | | — | |
| Total inventories | $ | 2,581.8 | | | $ | 181.8 | | | $ | 2,763.6 | |
| | | | | | | | | | | | | | | | | |
| December 31, 2020 |
| (in millions) | Titled Inventory | | Inventory Intermediation Agreements | | Total |
| Crude oil and feedstocks | $ | 1,018.9 | | | $ | — | | | $ | 1,018.9 | |
| Refined products and blendstocks | 933.7 | | | 266.5 | | | 1,200.2 | |
| Warehouse stock and other | 136.7 | | | — | | | 136.7 | |
| $ | 2,089.3 | | | $ | 266.5 | | | $ | 2,355.8 | |
| Lower of cost or market adjustment | (572.4) | | | (97.2) | | | (669.6) | |
| Total inventories | $ | 1,516.9 | | | $ | 169.3 | | | $ | 1,686.2 | |
On October 25, 2021, PBF Holding and its subsidiaries, Delaware City Refining Company LLC, Paulsboro Refining Company LLC and Chalmette Refining, L.L.C. (“Chalmette Refining”) (collectively, the “PBF Entities”), entered into a third amended and restated inventory intermediation agreement (the “Third Inventory Intermediation Agreement”) with J. Aron & Company, a subsidiaryAs of The Goldman Sachs Group, Inc. (“J. Aron”), pursuant to which the terms of the existing inventory intermediation agreements were amended and restated in their entirety, including, among other things, pricing and an extension of terms. The Third Inventory Intermediation Agreement extends the term to December 31, 2024, which term may be further extended by mutual consent of the parties to2023 and December 31, 2025.
Pursuant to the Third Inventory Intermediation Agreement, J. Aron will continue to purchase and hold title to certain2022, there was no LCM inventory including crude oil, intermediate and certain finished products (the “J. Aron Products”) purchased or produced by the Paulsboro and Delaware City refineries (and, at the election of the PBF Entities, the Chalmette refinery) (the "Refineries") and delivered into storage tanks at the Refineries (the "Storage Tanks"). The J. Aron Products are sold back to the Companyadjustment recorded as the J. Aron Products are discharged out of the Storage Tanks. These purchases and sales are settled monthly at the daily market prices related to those J. Aron Products. These transactions are considered to be made in contemplation of each other and, accordingly, do not result in the recognition of a sale when title passes from the Refineries to J. Aron. Additionally, J. Aron has the right to store the J. Aron Products purchased in Storage Tanks under the Third Inventory Intermediation Agreement and will retain these storage rights for the term of the agreement. PBF Holding continues to market and sell the J. Aron Products independently to third parties.
PBF ENERGY INC. AND PBF ENERGY COMPANY LLC
NOTES TO CONSOLIDATED FINANCIAL STATEMENTS
At December 31, 2021, the replacement value of inventories exceeded the LIFO carrying value. During the year ended December 31, 2021, the Company recorded an adjustment to value its inventories to the lower of cost or market which increased income from operations by $669.6 million, reflecting no lower of cost or market (“LCM”)LCM inventory reserve at December 31, 2021 in comparison with an LCM inventory reserve of $669.6 million at December 31, 2020. During the year ended December 31, 2020, the Company recorded an adjustment to value its inventories to the lower of cost or market which decreased income from operations by $268.0 million, reflecting the net change in the LCM inventory reserve from $401.6 million at December 31, 2019 to $669.6 million at December 31, 2020.2021.
An actual valuation of inventories valued under the LIFO method is made at the end of each year based on inventory levels and costs at that time. The CompanyThere were no significant decrements recorded a pre-tax charge related to a LIFO layer decrement of $83.0 million in the Refining segment during the yearyears ended December 31, 2020. There was no decrement recorded during the year ended2023, December 31, 2022, or December 31, 2021.
On July 31, 2023, the Company terminated the third amended and restated inventory intermediation agreement (the “Third Inventory Intermediation Agreement”) previously entered into by and among PBF Holding Company LLC (“PBF Holding”) and its subsidiaries, Delaware City Refining Company LLC, Paulsboro Refining Company LLC and Chalmette Refining, L.L.C. (“Chalmette Refining”) (collectively, the “PBF Entities”), and J. Aron & Company, a subsidiary of The majorityGoldman Sachs Group, Inc. (“J. Aron”). The Company made a payment of $268.0 million for the inventory previously held by J. Aron, inclusive of $13.5 million of related costs associated with exiting the agreement. Pursuant to the Third Inventory Intermediation Agreement, J. Aron had purchased and held title to certain inventory, including crude oil, intermediate and certain finished products (the “J. Aron Products”) purchased or produced by the Paulsboro and Delaware City refineries (and, at the election of the decrement recorded in 2020 related toPBF Entities, the Company’s East Coast LIFO inventory layerChalmette refinery) (the “Refineries”) and delivered into storage tanks at the reduction inRefineries (the “Storage Tanks”). Following the Company’s East Coast inventory experienced as partearly termination, the Company purchased, and now owns, all of the East Coast Refining Reconfiguration (as defined in “Note 7 - Property, Plant and Equipment, net”) and our decision to operate our two refineries on the east coast as one functional unit.inventory previously held by J. Aron.
PBF ENERGY INC. AND PBF ENERGY COMPANY LLC
NOTES TO CONSOLIDATED FINANCIAL STATEMENTS
7.5. PROPERTY, PLANT AND EQUIPMENT, NET
Property, plant and equipment, net consisted of the following:
| | | | | | | | | | | | | | |
| | | | |
| (in millions) | | December 31,
2021 | | December 31,
2020 |
| Land | | $ | 533.6 | | | $ | 534.7 | |
| Processing units, pipelines and equipment | | 5,166.1 | | | 5,026.2 | |
| Buildings and leasehold improvements | | 128.1 | | | 127.0 | |
| Computers, furniture and fixtures | | 176.8 | | | 164.3 | |
| Construction in progress | | 331.1 | | | 199.2 | |
| | 6,335.7 | | | 6,051.4 | |
| Less—Accumulated depreciation | | (1,433.5) | | | (1,208.1) | |
| Total property, plant and equipment, net | | $ | 4,902.2 | | | $ | 4,843.3 | |
| | | | | | | | | | | | | | |
| | | | |
| (in millions) | | December 31,
2023 | | December 31,
2022 |
| Processing units, pipelines and equipment | | $ | 5,463.5 | | | $ | 5,352.8 | |
| Land | | 530.9 | | | 533.6 | |
| Construction in progress | | 468.9 | | | 830.8 | |
| Computers, furniture and fixtures | | 221.5 | | | 184.4 | |
| Buildings and leasehold improvements | | 205.4 | | | 128.7 | |
| | 6,890.2 | | | 7,030.3 | |
| Less—Accumulated depreciation | | (1,912.1) | | | (1,669.3) | |
| Total property, plant and equipment, net | | $ | 4,978.1 | | | $ | 5,361.0 | |
Depreciation expense for the years ended December 31, 2023, 2022 and 2021 2020 and 2019 was $229.6$243.2 million, $223.0$236.5 million and $178.0$229.6 million, respectively. The Company capitalized $9.1$38.2 million and $12.6$25.0 million in interest during 20212023 and 2020,2022, respectively, in connection with construction in progress.
East Coast Refining Reconfiguration
6. EQUITY INVESTMENT IN SBR
On June 27, 2023, the Company and Eni consummated the closing of the equity method investment transaction and the capitalization of SBR, a jointly held investee designed to own, develop, and operate the Renewable Diesel Facility. The Company contributed the SBR business with an estimated fair value of approximately $1.69 billion, excluding working capital, in exchange for $431.0 million of cash contributed by Eni at close and its 50% interest in the entity, which includes rights to special distributions from SBR (with corresponding amounts funded by Eni) based on the achievement of certain project milestones and performance criteria. The Company received the first special distribution of $414.6 million subsequent to the commercial start up of the pre-treatment unit in July 2023. These special distributions are reflected as return of capital on the Company’s Consolidated Statement of Cash flows under investing activities. During the year ended December 31, 2020,2023, the Company reconfigured the Delaware and Paulsboro refineries (the “East Coast Refining Reconfiguration”) temporarily idling certain of its major processing units at the Paulsboro refinery, in order to operate the two refineries as one functional unit referred to as the East Coast Refining System. The reconfiguration process resulted in lower overall throughput and inventory levels in addition to decreases in capital and operating costs. The Company abandoned certain projects related to assets under construction related to these idled assets, resulting in an impairment charge of approximately $11.9 million and a corresponding decrease to its construction in progress account in the fourth quarter of 2020.
Capital Project Abandonments
In connection with the Company’s ongoing strategic response plan to deal with the COVID-19 pandemic and its East Coast Refining Reconfiguration, it assessed its refinery wide slate of capital projects that were either in process or not yet placed into service as of December 31, 2020. Based on this assessment and the Company’s strategic plan to reduce capital expenditures, it decided to abandon various capital projects across the refinery system, resulting in an impairment charge of approximately $79.9 million in the fourth quarter of 2020.
Sale of Hydrogen Plants
On April 17, 2020, the Company closed on the sale of 5 hydrogen plants to Air Products and Chemicals, Inc. (“Air Products”) in a sale-leaseback transaction for gross cash proceeds of $530.0 million and recognizedrecorded a gain of $471.1 million. In connection with$925.1 million resulting from the sale,difference between the fair value of the consideration received, including its 50% noncontrolling interest, and the carrying value of the related assets contributed.
The Company determined that SBR is a VIE because the entity does not have sufficient equity at risk to fund its operations without additional financial support from its owners. The Company is not the primary beneficiary of this VIE because it does not have the ability to make the most relevant decisions that significantly affect its economic performance.
The investment in SBR is accounted for under the equity method, and the Company has a maximum exposure to loss from it based on its recognized investment value.
The Company has entered into agreements with SBR and/or its subsidiary that allow the Company to purchase environmental credits and hydrocarbon products at its election. The Company does not have any obligation to buy a transition services agreement which was followed by the executionspecific amount of long-term supplyenvironmental credits under such agreements in August 2020.unless otherwise agreed. Refer to “Note 15 - Leases”10- Related Party Transactions” for further information.
Torrance Land Sales
On December 30, 2020 and August 1, 2019, the Company closed on third-party sales of parcels of real property acquired as part of the Torrance refinery, but not part of the refinery itself. The sales resulted in a gain of approximately $8.1 million and $33.1 million in the fourth quarter of 2020 and the third quarter of 2019, respectively, included within (Gain) loss on sale of assets in the Consolidated Statements of Operations.information regarding related party transactions with SBR.
PBF ENERGY INC. AND PBF ENERGY COMPANY LLC
NOTES TO CONSOLIDATED FINANCIAL STATEMENTS
8.7. DEFERRED CHARGES AND OTHER ASSETS, NET
Deferred charges and other assets, net consisted of the following:
| | | | | | | | | | | |
PBF Energy (in millions) | December 31,
2021 | | December 31,
2020 |
| Deferred turnaround costs, net | $ | 537.0 | | | $ | 598.2 | |
| Catalyst, net (a) | 166.8 | | | 155.2 | |
| Environmental credits | 41.3 | | | 39.6 | |
| Linefill | 27.4 | | | 27.4 | |
| Pension plan assets | 20.7 | | | 21.2 | |
| | | |
| Intangible assets, net | 9.6 | | | 10.1 | |
| | | |
| Other | 20.1 | | | 20.5 | |
| Total deferred charges and other assets, net | $ | 822.9 | | | $ | 872.2 | |
| | | | | | | | | | | |
PBF LLC (in millions) | December 31,
2021 | | December 31,
2020 |
| Deferred turnaround costs, net | $ | 537.0 | | | $ | 598.2 | |
| Catalyst, net (a) | 166.8 | | | 155.2 | |
| Environmental credits | 41.3 | | | 39.6 | |
| Linefill | 27.4 | | | 27.4 | |
| Pension plan assets | 20.7 | | | 21.2 | |
| | | |
| | | |
| Intangible assets, net | 9.6 | | | 10.1 | |
| Other | 20.1 | | | 20.6 | |
| Total deferred charges and other assets, net | $ | 822.9 | | | $ | 872.3 | |
| | | | | | | | | | | |
| (in millions) | December 31,
2023 | | December 31,
2022 |
| Deferred turnaround costs, net | $ | 860.8 | | | $ | 619.5 | |
| Catalyst, net (a) | 180.4 | | | 199.7 | |
| Environmental credits | 42.5 | | | 41.4 | |
| Linefill | 27.4 | | | 27.4 | |
| Pension plan assets | 18.8 | | | 18.6 | |
| | | |
| | | |
| | | |
| Other | 13.1 | | | 56.1 | |
| Total deferred charges and other assets, net | $ | 1,143.0 | | | $ | 962.7 | |
(a) Catalyst, net includes $113.0$114.2 million and $115.2$117.0 million of indefinite-lived precious metal catalysts (both owned or financed as part of existing catalyst financing arrangements) as of December 31, 20212023 and December 31, 2020,2022, respectively.
The Company recorded amortization expense related to deferred turnaround costs, catalyst and intangible assets of $221.1$314.4 million, $325.9$262.0 million and $258.1$221.1 million for the years ended December 31, 2023, 2022 and 2021, 2020 and 2019, respectively. Included in the year 2020 amortization expense is approximately $56.2 million of accelerated unamortized deferred turnaround costs associated with assets that were idled as part of the East Coast Refining Reconfiguration.
Intangible assets - net, included in “Other” above, primarily consists of customer relationships, permits and emission credits. Our net balance as of December 31, 20212023 and December 31, 20202022 is shown below:
| | | | | | | | | | | | | | |
| (in millions) | | December 31,
2021 | | December 31,
2020 |
| Intangible assets - gross | | $ | 25.5 | | | $ | 25.5 | |
| Accumulated amortization | | (15.9) | | | (15.4) | |
| Intangible assets - net | | $ | 9.6 | | | $ | 10.1 | |
| | | | | | | | | | | | | | |
| (in millions) | | December 31,
2023 | | December 31,
2022 |
| Intangible assets - gross | | $ | 25.5 | | | $ | 25.5 | |
| Accumulated amortization | | (16.9) | | | (16.4) | |
| Intangible assets - net | | $ | 8.6 | | | $ | 9.1 | |
PBF ENERGY INC. AND PBF ENERGY COMPANY LLC
NOTES TO CONSOLIDATED FINANCIAL STATEMENTS
9.8. ACCRUED EXPENSES
Accrued expenses consisted of the following:
| | | | | | | | | | | |
PBF Energy (in millions) | December 31,
2021 | | December 31,
2020 |
| Inventory-related accruals | $ | 959.9 | | | $ | 695.0 | |
| Renewable energy credit and emissions obligations (a) | 953.9 | | | 528.1 | |
| Inventory intermediation agreements (b) | 280.1 | | | 225.8 | |
| Excise and sales tax payable | 112.7 | | | 120.1 | |
| Accrued transportation costs | 91.0 | | | 72.1 | |
| Accrued utilities | 73.0 | | | 58.6 | |
| Accrued capital expenditures | 62.8 | | | 15.0 | |
| Accrued salaries and benefits | 59.5 | | | 42.2 | |
| Accrued refinery maintenance and support costs | 55.8 | | | 35.7 | |
| Accrued interest | 37.7 | | | 46.1 | |
| Environmental liabilities | 14.9 | | | 11.8 | |
| Current finance lease liabilities | 11.1 | | | 14.4 | |
| Customer deposits | 3.5 | | | 4.0 | |
| Contingent consideration | 2.9 | | | 12.1 | |
| Other | 21.6 | | | 30.5 | |
| Total accrued expenses | $ | 2,740.4 | | | $ | 1,911.5 | |
| | | | | | | | | | | |
PBF LLC (in millions) | December 31,
2021 | | December 31,
2020 |
| Inventory-related accruals | $ | 959.9 | | | $ | 695.0 | |
| Renewable energy credit and emissions obligations (a) | 953.9 | | | 528.1 | |
| Inventory intermediation agreements (b) | 280.1 | | | 225.8 | |
| Excise and sales tax payable | 112.7 | | | 120.1 | |
| Accrued transportation costs | 91.0 | | | 72.1 | |
| Accrued interest | 86.0 | | | 83.8 | |
| Accrued utilities | 73.0 | | | 58.6 | |
| Accrued capital expenditures | 62.8 | | | 15.0 | |
| Accrued salaries and benefits | 59.5 | | | 42.2 | |
| Accrued refinery maintenance and support costs | 55.8 | | | 35.7 | |
| Environmental liabilities | 14.9 | | | 11.8 | |
| Current finance lease liabilities | 11.1 | | | 14.4 | |
| Customer deposits | 3.5 | | | 4.0 | |
| Contingent consideration | 2.9 | | | 12.1 | |
| | | |
| Other | 25.5 | | | 32.5 | |
| Total accrued expenses | $ | 2,792.6 | | | $ | 1,951.2 | |
PBF ENERGY INC. AND PBF ENERGY COMPANY LLC
NOTES TO CONSOLIDATED FINANCIAL STATEMENTS
| | | | | | | | | | | |
| (in millions) | December 31,
2023 | | December 31,
2022 |
| Inventory-related accruals | $ | 1,716.2 | | | $ | 1,417.4 | |
| Renewable energy credit and emissions obligations (a) | 429.8 | | | 1,361.1 | |
| Accrued salaries and benefits | 187.3 | | | 173.1 | |
| Accrued transportation costs | 170.5 | | | 127.3 | |
| Excise and sales tax payable | 137.8 | | | 123.6 | |
| Accrued capital expenditures | 85.5 | | | 86.3 | |
| Accrued utilities | 71.0 | | | 105.4 | |
| Accrued refinery maintenance and support costs | 60.2 | | | 48.1 | |
| | | |
| Accrued interest | 32.4 | | | 24.9 | |
| Contingent consideration | 21.6 | | | 81.6 | |
| Environmental liabilities | 16.6 | | | 14.9 | |
| Current finance lease liabilities | 12.2 | | | 11.7 | |
| Inventory intermediation agreement (b) | — | | | 98.3 | |
| Accrued income tax payable | — | | | 16.5 | |
| | | |
| Other | 78.9 | | | 30.6 | |
| Total accrued expenses | $ | 3,020.0 | | | $ | 3,720.8 | |
(a) The Company is subject to obligations to purchase RINs required to comply with the Renewable Fuel Standard.RFS. The Company’s overall RINs obligation is based on a percentage of domestic shipments of on-road fuels as established by EPA. To the degree the Company is unable to blend the required amount of biofuels to satisfy its RINs obligation, RINs must be purchased on the open market to avoid penalties and fines. The Company records its RINs obligation on a net basis in Accrued expenses when its RINs liability is greater than the amount of RINs earned and purchased in a given period and in Prepaid and other current assets when the amount of RINs earned and purchased is greater than the RINs liability. In addition, the Company is subject to obligations to comply with federal and state legislative and regulatory measures, including regulations in the state of California pursuant to Assembly Bill 32 (“AB 32”), to address environmental compliance and greenhouse gas and other emissions. These requirements include incremental costs to operate and maintain our facilities as well as to implement and manage new emission controls and programs. Renewable energy credit and emissions obligations fluctuate with the volume of applicable product sales and timing of credit purchases. TheFrom time to time, the Company enters into forward purchase commitments in order to acquire its renewable energy and emissions credits at fixed prices. As of December 31, 2021,2023, the Company had entered into $520.0 million of such forward purchase commitments with respect to itsin excess of total accrued renewable energy and emissions obligations. Final settlement of theOur RIN obligations will be settled in accordance with established regulatory deadlines. The Company’s RINs obligation for annual compliance years 2020 through 2022 are subject to final rule making by EPA. Currently, the 2020 obligation is anticipated to require settlement in 2022 and the 2021 and 2022 obligations are anticipated to require settlement in 2023. The Company’scurrent AB 32 liability is part of aan ongoing triennial period program which will be settled throughin 2024.
(b) The Company hashad the obligation to repurchase the J. Aron Products that arewere held in its Storage Tanks in accordance with the inventory intermediation agreements with J. Aron.Third Inventory Intermediation Agreement. As of December 31, 2021 and December 31, 2020,2022, a liability iswas recognized forbased on the inventory intermediation agreements and is recorded at market pricerepurchase obligation under the Third Inventory Intermediation Agreement for the J. Aron owned inventory held in the Company’s Storage Tanks, with any change in the market price being recorded in Cost of products and other. As described in “Note 4 - Inventories”, the Company early terminated this agreement on July 31, 2023.
PBF ENERGY INC. AND PBF ENERGY COMPANY LLC
NOTES TO CONSOLIDATED FINANCIAL STATEMENTS
10.9. CREDIT FACILITIES AND DEBT
Long-term debtDebt outstanding consisted of the following:
| | (in millions) | (in millions) | | December 31,
2021 | | December 31,
2020 | (in millions) | | December 31,
2023 | | December 31,
2022 |
| 2025 Senior Secured Notes | | $ | 1,250.0 | | | $ | 1,250.0 | |
| | 2028 Senior Notes | 2028 Senior Notes | | 826.5 | | | 1,000.0 | |
| 2028 Senior Notes | |
| 2028 Senior Notes | |
| 2030 Senior Notes | |
| 2025 Senior Notes | 2025 Senior Notes | | 669.5 | | | 725.0 | |
| PBFX 2023 Senior Notes | PBFX 2023 Senior Notes | | 525.0 | | | 525.0 | |
| Revolving Credit Facility | Revolving Credit Facility | | 900.0 | | | 900.0 | |
| PBFX Revolving Credit Facility | PBFX Revolving Credit Facility | | 100.0 | | | 200.0 | |
| PBF Rail Term Loan | | — | | | 7.4 | |
| Catalyst financing arrangements | Catalyst financing arrangements | | 58.4 | | | 102.5 | |
| 4,329.4 | | | 4,709.9 | |
| | 1,301.6 | |
| Less—Current debt | Less—Current debt | | — | | | (7.4) | |
| Unamortized premium | | 1.4 | | | 2.2 | |
| Unamortized (discount) premium | |
| Unamortized deferred financing costs | Unamortized deferred financing costs | | (35.0) | | | (51.1) | |
| Long-term debt | Long-term debt | | $ | 4,295.8 | | | $ | 4,653.6 | |
20252028 Senior Secured Notes
On May 13,January 24, 2020, PBF Holding entered into an indenture among PBF Holding and PBF Holding’s wholly-owned subsidiary, PBF Finance Corporation (together with PBF Holding, the “Issuers”), the guarantors named therein (collectively the “Guarantors”), and Wilmington Trust, National Association, as Trustee, Paying Agent, Registrar, Transfer Agent, Authenticating Agent and Notes Collateral Agent, under which the Issuers issued $1.0 billion in aggregate principal amount of 9.25% senior secured notes due 2025 (the “initial 2025 Senior Secured Notes”). The Issuers received net proceeds of approximately $982.9 million from the offering after deducting the initial purchasers’ discount and offering expenses.
On December 21, 2020 PBF Holding issued an additional $250.0 million in aggregate principal amount of tack on 9.25% senior secured notes due 2025 (the “additional 2025 Senior Secured Notes”). The additional 2025 Senior Secured Notes were issued at an offering price of 100.25% plus accrued and unpaid interest from and including, November 15, 2020. The additional 2025 Senior Secured Notes were issued under the indenture governing the initial 2025 Senior Secured Notes and, together with the additional 2025 Senior Secured Notes, the (“2025 Senior Secured Notes”). The additional 2025 Senior Secured Notes are treated as a single series with the initial 2025 Senior Secured Notes and have the same terms except that a portion of the additional 2025 Senior Secured Notes were issued initially under a new temporary CUSIP number to be used during the 40-day distribution compliance period. The Issuers received net proceeds of approximately $245.7 million from the offering after deducting the initial purchasers’ discount and offering expenses.
The 2025 Senior Secured Notes are guaranteed on a senior secured basis by substantially all of PBF Holding’s subsidiaries. The 2025 Senior Secured Notes and guarantees are senior obligations and secured, subject to certain exceptions and permitted liens, on a first-priority basis, by substantially all of PBF Holding's and the guarantors’ present and future assets (other than assets securing the Revolving Credit Facility), which may also constitute collateral securing certain hedging obligations and any existing or future indebtedness that is permitted to be secured on a pari passu basis with the 2025 Senior Secured Notes. The 2025 Senior Secured Notes and guarantees are senior secured obligations and rank equal in right of payment with all of the Issuers’ and the Guarantors’ existing and future senior indebtedness, including the Revolving Credit Facility, the 2028 Senior Notes and the 7.25% senior unsecured notes due 2025 (the “2025 Senior Notes”). The 2025 Senior
PBF ENERGY INC. AND PBF ENERGY COMPANY LLC
NOTES TO CONSOLIDATED FINANCIAL STATEMENTS
Secured Notes and guarantees rank effectively senior to all of the Issuers’ and the Guarantors’ existing and future indebtedness that is not secured by the collateral (including the Revolving Credit Facility, the 2028 Senior Notes and the 2025 Senior Notes), subject to permitted liens on such collateral and certain other exceptions, and senior in right of payment to the Issuers’ and the Guarantors’ existing and future indebtedness that is expressly subordinated in right of payment thereto. The 2025 Senior Secured Notes and the guarantees are effectively subordinated to any of the Issuers’ and the Guarantors’ existing or future secured indebtedness that is secured by liens on assets owned by the Company that do not constitute part of the collateral securing the 2025 Senior Secured Notes and the guarantees (including the assets securing the Revolving Credit Facility) to the extent of the value of the collateral securing such indebtedness. The 2025 Senior Secured Notes and the guarantees are structurally subordinated to any existing or future indebtedness and other obligations of the Issuers’ non-guarantor subsidiaries. In addition, the 2025 Senior Secured Notes contain customary terms, events of default and covenants for an issuer of non-investment grade debt securities. These covenants include limitations on the incurrence of additional indebtedness, equity issuances, and payments. Many of these covenants will cease to apply or will be modified if the 2025 Senior Secured Notes are rated investment grade.
At any time prior to May 15, 2022, the Issuers may on any one or more occasions redeem up to 35% of the aggregate principal amount of the 2025 Senior Secured Notes in an amount not greater than the net cash proceeds of certain equity offerings at a redemption price equal to 109.250% of the principal amount of the 2025 Senior Secured Notes, plus any accrued and unpaid interest through the date of redemption. On or after May 15, 2022, the Issuers may redeem all or part of the 2025 Senior Secured Notes, in each case at the redemption prices described in the indenture, together with any accrued and unpaid interest through the date of redemption. In addition, prior to May 15, 2022, the Issuers may redeem all or part of the 2025 Senior Secured Notes at a “make-whole” redemption price described in the indenture, together with any accrued and unpaid interest to the date of redemption.
In addition, the Issuers may redeem in the aggregate up to 35% of the original aggregate principal amount of the 2025 Senior Secured Notes using net proceeds of any loan received pursuant to a Regulatory Debt Facility (as defined in the indenture) at a redemption price equal to 104.625% of the principal amount of the notes redeemed, plus accrued and unpaid interest to the redemption date as long as any such redemption occurs on or prior to 120 days after receipt of such net proceeds.
2028 Senior Notes
On January 24, 2020, PBF Holding entered into an indenture among the Issuers, the Guarantors, Wilmington Trust, National Association, as Trustee and Deutsche Bank Trust Company Americas, as Paying Agent, Registrar, Transfer Agent and Authenticating Agent, under which the Issuers issued $1.0 billion in aggregate principal amount of the 6.00% senior unsecured notes due 2028 (the “2028 Senior Notes.Notes”). The Issuers received net proceeds of approximately $987.0 million from the offering after deducting the initial purchasers’ discount and offering expenses. The Company primarily used the net proceeds to fully redeem the 7.00% senior notes due 2023 (the “2023 Senior Notes”), including accrued and unpaid interest, on February 14, 2020, and to fund a portion of the cash consideration for the acquisition of the Martinez Acquisition.refinery and related logistics assets. The difference between the carrying value of the 2023 Senior Notes on the date they were reacquired and the amount for which they were reacquired has been classified as loss on extinguishment of debt in the Consolidated Statements of Operations.
The 2028 Senior Notes included a registration rights arrangement whereby the Issuer and the Guarantors agreed to file with the U.S. Securities and Exchange Commission and use commercially reasonable efforts to consummate an offer to exchange the 2028 Senior Notes for an issue of registered notes with terms substantially identical to the notes not later than 365 days after the date of the original issuance of the notes. This registration statement was declared effective on October 14, 2020 and the exchange was consummated during the fourth quarter of 2020. As such, the Company did not have to transfer any consideration as a result of the registration rights agreement and thus no loss contingency was recorded.
PBF ENERGY INC. AND PBF ENERGY COMPANY LLC
NOTES TO CONSOLIDATED FINANCIAL STATEMENTS
The 2028 Senior Notes are guaranteed on a senior unsecured basis by substantially all of PBF Holding’s subsidiaries. The 2028 Senior Notes and guarantees are senior unsecured obligations and rank equal in right of payment with all of the Issuers’ and the Guarantors’ existing and future indebtedness, including the PBF Holding’s asset-based revolving credit facility (“Revolving Credit Facility, the 2025 Senior NotesFacility”) and the 20257.875% senior unsecured notes due 2030 (the “2030 Senior Secured Notes.Notes”). The 2028 Senior Notes and the guarantees rank senior in right of payment to the Issuers’ and the Guarantors’ existing and future indebtedness that is expressly subordinated in right of payment thereto. The 2028 Senior Notes and the guarantees are effectively subordinated to any of the Issuers’ and the Guarantors’ existing or future secured indebtedness (including the Revolving Credit Facility) to the extent of the value of the collateral securing such indebtedness. The 2028 Senior Notes and the guarantees are structurally subordinated to any existing or future indebtedness and other obligations of the Issuers’ non-guarantor subsidiaries. In addition, the 2028 Senior Notes contain customary terms, events of default and covenants for an issuer of non-investment grade debt securities. These covenants include limitations on the incurrence of additional indebtedness, equity issuances, and payments. Many of these covenants will cease to apply or will be modified if the 2028 Senior Notes are rated investment grade.
At any time priorSubsequent to February 15, 2023, the Issuers may on any one or more occasions redeem up to 35% of the aggregate principal amount of the 2028 Senior Notes in an amount not greater than the net cash proceeds of certain equity offerings at a redemption price equal to 106.000% of the principal amount of the 2028 Senior Notes, plus any accrued and unpaid interest through the date of redemption. On or after February 15, 2023, the Issuers may redeem all or part of the 2028 Senior Notes, in each case at the redemption prices described in the indenture, together with any accrued and unpaid interest through the date of redemption. In addition, prior to February 15, 2023, the Issuers may redeem all or part of the 2028 Senior Notes at a “make-whole” redemption price described in the indenture, together with any accrued and unpaid interest through the date of redemption.
During 2021, the Company made a number of open market repurchases of its 2028 Senior Notes that resulted in the extinguishment of $173.5 million in principal. Total cash consideration paid to repurchase the principal amount outstanding of the 2028 Senior Notes, excluding accrued interest, totaled $109.3 million and the Company recognized a $62.4 million gain on the extinguishment of debt during the year ended December 31, 2021.
During 2022, the Company made a number of open market repurchases of its 2028 Senior Notes that resulted in the extinguishment of $24.9 million in principal. Total cash consideration paid to repurchase the principal amount outstanding of the 2028 Senior Notes, excluding accrued interest, totaled $21.1 million and the Company recognized a $3.6 million gain on the extinguishment of debt during the year ended December 31, 2022.
2030 Senior Notes
On August 21, 2023, PBF Holding entered into an indenture among the Issuers, the Guarantors, Wilmington Trust, National Association, as Trustee and Deutsche Bank Trust Company Americas, as Paying Agent, Registrar, Transfer Agent and Authenticating Agent, under which the Issuers issued $500.0 million in aggregate principal amount of the 2030 Senior Notes, at an issue price of 99.324%. The Issuers received net proceeds of approximately $488.8 million from the offering after deducting the initial purchasers’ discount and offering expenses. The Company used the net proceeds, together with cash on hand, to fully redeem the outstanding 7.25% senior unsecured notes due 2025 (the “2025 Senior Notes”), including accrued and unpaid interest, on September 13, 2023.
The 2030 Senior Notes are guaranteed on a senior unsecured basis by substantially all of PBF Holding’s subsidiaries. The 2030 Senior Notes and guarantees are senior unsecured obligations and rank equal in right of payment with all of the Issuers’ and the Guarantors’ existing and future senior indebtedness, including the Revolving Credit Facility and the 2028 Senior Notes. The 2030 Senior Notes and the guarantees rank senior in right of payment to the Issuers’ and the Guarantors’ existing and future indebtedness that is expressly subordinated in right of payment thereto. The 2030 Senior Notes and the guarantees are effectively subordinated to any of the Issuers’ and the Guarantors’ existing or future secured indebtedness (including the Revolving Credit Facility) to the extent of the value of the collateral securing such indebtedness. The 2030 Senior Notes and the guarantees are structurally subordinated to any existing or future indebtedness and other obligations of the Issuers’ non-guarantor subsidiaries.
PBF ENERGY INC.
NOTES TO CONSOLIDATED FINANCIAL STATEMENTS
In addition, the 2030 Senior Notes contain customary terms, events of default and covenants for an issuer of non-investment grade debt securities. These covenants include limitations on the incurrence of additional indebtedness, equity issuances, and payments. Many of these covenants will cease to apply or will be modified if the 2030 Senior Notes are rated investment grade.
At any time prior to September 15, 2026, the Issuers may on any one or more occasions redeem up to 35% of the aggregate principal amount of the 2030 Senior Notes in an amount not greater than the net cash proceeds of certain equity offerings at a redemption price equal to 107.875% of the principal amount of the 2030 Senior Notes, plus any accrued and unpaid interest through the date of redemption; provided that at least 65% of the aggregate principal amount of the notes originally issued under the indenture governing the 2030 Senior Notes remains outstanding immediately after the occurrence of each such redemption. On or after September 15, 2026, the Issuers may redeem all or part of the 2030 Senior Notes, in each case at the redemption prices described in the indenture, together with any accrued and unpaid interest through the date of redemption. In addition, prior to September 15, 2026, the Issuers may redeem all or part of the 2030 Senior Notes at a “make-whole” redemption price described in the indenture, together with any accrued and unpaid interest through the date of redemption.
2025 Senior Notes
On May 30, 2017, PBF Holding entered into an indenture among the Issuers, the Guarantors, Wilmington Trust, National Association, as Trustee, and Deutsche Bank Trust Company Americas, as Paying Agent, Registrar, Transfer Agent and Authenticating Agent, under which the Issuers issued $725.0 million in aggregate principal amount of 7.25% 2025 Senior Notes. The Issuers received net proceeds of approximately $711.6 million from the offering after deducting the initial purchasers’ discount and offering expenses, all of which was used to fund the cash tender offer (the “Tender Offer”) for any and all of its outstanding 8.25% Senior Secured Notes due 2020 (the “2020 Senior Secured Notes”), to pay the related redemption price and accrued and unpaid interest for any 2020 Senior Secured Notes which remained outstanding after the completion of the Tender Offer, and for general corporate purposes.
The 2025 Senior Notes are guaranteed by substantially all of PBF Holding’s subsidiaries. The 2025 Senior Notes and guarantees are senior unsecured obligations which rank equal in right of payment with all of the Issuers’ and the Guarantors’ existing and future senior indebtedness, including the Revolving Credit Facility, the 2028 Senior Notes and the 2025 Senior Secured Notes. The 2025 Senior Notes and the guarantees rank senior in right of payment to the Issuers’ and the Guarantors’ existing and future indebtedness that is expressly subordinated in right of payment thereto. The 2025 Senior Notes and the guarantees are effectively subordinated to any of the Issuers’ and the Guarantors’ existing or future secured indebtedness (including the Revolving Credit Facility) to the extent of the value of the collateral securing such indebtedness. The 2025 Senior Notes and the guarantees are structurally subordinated to any existing or future indebtedness and other obligations of the Issuers’ non-guarantor subsidiaries.
PBF ENERGY INC. AND PBF ENERGY COMPANY LLC
NOTES TO CONSOLIDATED FINANCIAL STATEMENTS
PBF Holding has optional redemption rights to repurchase all or a portion of the 2025 Senior Notes at varying prices which are no less than 100% of the principal amount plus accrued and unpaid interest. The holders of the 2025 Senior Notes have repurchase options exercisable only upon a change in control, certain asset sale transactions, or in event of a default as defined in the indenture. In addition, the 2025 Senior Notes contain customary terms, events of default and covenants for an issuer of non-investment grade debt securities that limit certain types of additional debt, equity issuances, and payments. Many of these covenants will cease to apply or will be modified if the 2025 Senior Notes are rated investment grade.
During 2021, the Company made a number of open market repurchases of its 2025 Senior Notes that resulted in the extinguishment of $55.5 million in principal. Total cash consideration paid to repurchase the principal amount outstanding of the 2025 Senior Notes, excluding accrued interest, totaled $37.5 million and the Company recognized a $17.5 million gain on the extinguishment of debt during the year ended December 31, 2021.
During 2022, the Company made a number of open market repurchases of its 2025 Senior Notes that resulted in the extinguishment of $5.0 million in principal. Total cash consideration paid to repurchase the principal amount outstanding of the 2025 Senior Notes, excluding accrued interest, totaled $4.8 million and the Company recognized a $0.2 million gain on the extinguishment of debt during the year ended December 31, 2022.
During 2023, the Company exercised its rights under the indenture governing the 2025 Senior Notes to redeem all of the outstanding 2025 Senior Notes at a price of 100% of the aggregate principal amount thereof, plus accrued and unpaid interest. The aggregate redemption price for all 2025 Senior Notes approximated $664.5 million plus accrued and unpaid interest. The difference between the carrying value of the 2025 Senior Notes on the date they were redeemed and the amount for which they were redeemed was recorded as a loss on extinguishment of debt in the Consolidated Statements of Operations. The redemption was financed using proceeds from the 2030 Senior Notes and cash on hand.
PBF ENERGY INC.
NOTES TO CONSOLIDATED FINANCIAL STATEMENTS
2025 Senior Secured Notes
On May 13, 2020, PBF Holding entered into an indenture among the Issuers, the Guarantors, and Wilmington Trust, National Association, as Trustee, Paying Agent, Registrar, Transfer Agent, Authenticating Agent and Notes Collateral Agent, under which the Issuers issued $1.0 billion in aggregate principal amount of 9.25% senior secured notes due 2025 (the “initial 2025 Senior Secured Notes”). On December 21, 2020 PBF Holding issued an additional $250.0 million in aggregate principal amount of tack on 9.25% senior secured notes due 2025 (the “additional 2025 Senior Secured Notes”). The additional 2025 Senior Secured Notes were issued at an offering price of 100.25% plus accrued and unpaid interest from and including, November 15, 2020. The additional 2025 Senior Secured Notes were issued under the indenture governing the initial 2025 Senior Secured Notes and, together with the additional 2025 Senior Secured Notes, the (“2025 Senior Secured Notes”).
During 2022, the Company exercised its rights under the indenture governing the 2025 Senior Secured Notes to redeem all of the outstanding 2025 Senior Secured Notes at a price of 104.625% of the aggregate principal amount thereof plus accrued and unpaid interest. The aggregate redemption price for all 2025 Senior Secured Notes approximated $1.3 billion plus accrued and unpaid interest. The difference between the carrying value of the 2025 Senior Secured Notes on the date they were redeemed and the amount for which they were redeemed was $69.9 million and was recorded as a loss on extinguishment of debt in the Consolidated Statements of Operations. The redemption was funded using cash on hand.
PBFX 2023 Senior Notes
On May 12, 2015, PBFX entered into an indenture among PBFX and PBF Logistics Finance Corporation, a Delaware corporation and wholly-owned subsidiary of PBFX (together with PBFX, the “PBFX Issuers”), the Guarantors named therein and Deutsche Bank Trust Company Americas, as Trustee, under which the PBFX Issuers issued $350.0 million in aggregate principal amount of 6.875% Senior Notes due 2023.
On October 6, 2017, PBFX entered into a supplemental indenture for the purpose of issuing an additional $175.0 million in aggregate principal amount of 6.875% Senior Notes due 2023 (together with the initially issued notes, the “PBFX 2023 Senior Notes”). The additional amount of the PBFX 2023 Senior Notes were issued at 102% of face value, or an effective interest rate of 6.442%. The additional amount of the PBFX 2023 Senior Notes arewere treated as a single series with the initially issued PBFX 2023 Senior Notes and havehad the same general terms as those of the initially issued PBFX 2023 Senior Notes, except that (i) the additional amount of PBFX 2023 Senior Notes are subject to a separate registration rights agreement, and (ii) the additional amount of PBFX 2023 Senior Notes were issued initially under CUSIP numbers different from the initially issued PBFX 2023 Senior Notes.
PBF LLC agreed to a limited guarantee of collection of the principal amount of the PBFX 2023 Senior Notes, but is not otherwise subject to the covenants of the indenture. The PBFX 2023 Senior Notes are general senior unsecured obligations of the PBFX Issuers and are equal in right of payment with all of the PBFX Issuers’ existing and future senior indebtedness, including amounts outstanding under the PBFX Revolving Credit Facility (as defined below). The PBFX 2023 Senior Notes are effectively subordinated to all of the PBFX Issuers’ and the Guarantors’ existing and future secured debt, including the PBFX Revolving Credit Facility(as defined below), to the extent of the value of the assets securing that secured debt and will be structurally subordinated to all indebtedness of PBFX’s subsidiaries that do not guarantee the PBFX 2023 Senior Notes. The PBFX 2023 Senior Notes will be senior to any future subordinated indebtedness the PBFX Issuers may incur.
The PBFX indenture contains customary terms, events of default and covenants for transactions of this nature. These covenants include limitations on PBFX’s and its restricted subsidiaries’ ability to, among other things: (i) make investments; (ii) incur additional indebtedness or issue preferred units; (iii) pay dividends or make distributions on units or redeem or repurchase its subordinated debt; (iv) create liens; (v) incur dividend or other payment restrictions affecting subsidiaries; (vi) sell assets; (vii) merge or consolidate with other entities; and (viii) enter into transactions with affiliates. These covenants are subject to a number of important limitations and exceptions.
PBFX hashad optional redemption rights to repurchase all or a portion of the PBFX 2023 Senior Notes at varying prices which are no less than 100% of the principal amount, plus accrued and unpaid interest. The holders of the PBFX 2023 Senior Notes havehad repurchase options exercisable only upon a change in control, certain asset dispositions, or in event of default as defined in the indenture.
During 2023, the Company redeemed the $525.0 million in aggregate principal amount outstanding of its PBFX 2023 Senior Notes, inclusive of unamortized premium and deferred financing costs as of the redemption date. The PBFX 2023 Senior Notes were redeemed at a price of 100% of the aggregate principal amount thereof, plus accrued and unpaid interest through the date of redemption. The redemption was funded using cash on hand.
PBF ENERGY INC. AND PBF ENERGY COMPANY LLC
NOTES TO CONSOLIDATED FINANCIAL STATEMENTS
PBF Holding Revolving Credit Facility
On May 2, 2018,August 23, 2023, PBF Holding and certain of its wholly-owned subsidiaries, as borrowers or subsidiary guarantors, replaced the existingentered into an amended and restated asset-based revolving credit facilityagreement, among PBF Holding, Bank of America, National Association as administrative agent, and certain other lenders (the “Revolving Credit Agreement”). The Revolving Credit Agreement amended and restated the previously existing revolving credit agreement dated as of May 2, 2018 (as amended from time to time, the “Prior Credit Agreement”). Among other things, the Revolving Credit Agreement extended the Revolving Credit Facility through August 15, 20142028 and increased the maximum commitment amount under the facility to $3.5 billion from $2.85 billion. The commitment fees on the unused portion, the interest rate on advances and the fees for letters of credit are generally consistent with the new RevolvingPrior Credit Facility.Agreement. The Revolving Credit Facility has a maximum commitmentcontains representations, warranties and covenants by PBF Holding and the other borrowers, as well as customary events of $3.4 billion, a maturity date of May 2023default and redefines certain components ofindemnification obligations that are consistent with those in the Borrowing Base, asPrior Credit Agreement.
PBF Holding may from time to time by written notice to the Administrative Agent (as defined in the agreement governingRevolving Credit Agreement) elect to request after the commencement of the revolving availability period and prior to the revolving maturity date, increases to the existing revolving commitments by an amount not in excess of an aggregate amount equal to the sum of (1) $500.0 million, plus (2) an amount equal to all voluntary prepayments that have resulted in permanent reductions of the revolving commitments, plus (3) solely after the use of the amount set forth in clause (1), an amount equal to suppressed availability determined as of the date of such notice. Each such notice shall specify (i) the date on which PBF Holding proposes that the increased or new revolving commitments shall be effective, which shall be a date not less than 5 business days after the date on which such notice is delivered to the Administrative Agent and (ii) the identity of each Eligible Assignee (as defined in the Revolving Credit Facility (the “Revolving Credit Agreement”),Agreement) to make more funding available for working capital needswhom PBF Holding proposes any portion of such increased or new revolving commitments be allocated and other general corporate purposes. An accordion feature allows forthe amounts of such allocations; provided that any existing lender approached to provide all or a portion of the increased or new revolving commitments of upmay elect or decline, in its sole discretion, to $3.5 billion. provide such increased or new revolving commitment.
Borrowings under the Revolving Credit Facility bear interest at the Alternative Base Rate plus the Applicable Margin or at the Adjusted LIBORTerm SOFR Rate plus the Applicable Margin (all as defined in the Revolving Credit Agreement). The Applicable Margin ranges from 0.25% to 1.00% for Alternative Base Rate Loans and from 1.25% to 2.00% for Adjusted LIBORTerm SOFR Loans, in each case depending on the Company’s corporate credit rating. In addition, the LC Participation Fee ranges from 1.00%1.25% to 1.75%2.00% depending on the Company’s corporate credit rating and the Fronting Fee is capped at 0.25%.
The Revolving Credit Agreement contains customary covenants and restrictions on the activities of PBF Holding and its subsidiaries, including, but not limited to, limitations on incurring additional indebtedness, liens, negative pledges, guarantees, investments, loans, asset sales, mergers and acquisitions, prepayment of other debt, distributions, dividends and the repurchase of capital stock, transactions with affiliates and the ability of PBF Holding to change the nature of its business or its fiscal year; all as defined in the Revolving Credit Agreement.
In addition, the Revolving Credit Agreement has a financial covenant which requires that if at any time Excess Availability, as defined in the Revolving Credit Agreement, is less than the greater of (i) 10% of the lesser of the then existing Borrowing Base and the then aggregate Revolving Commitments of the Lenders (the “Financial Covenant Testing Amount”), and (ii) $100.0 million, and until such time as Excess Availability is greater than the Financial Covenant Testing Amount and $100.0 million for a period of 12 or more consecutive days, PBF Holding will not permit the Consolidated Fixed Charge Coverage Ratio, as defined in the Revolving Credit Agreement and determined as of the last day of the most recently completed quarter, to be less than 1 to 1.
PBF ENERGY INC.
NOTES TO CONSOLIDATED FINANCIAL STATEMENTS
PBF Holding’s obligations under the Revolving Credit Facility are (a) guaranteed by each of its domestic operating subsidiaries that are not Excluded Subsidiaries (as defined in the Revolving Credit Agreement) and (b) secured by a lien on (i) PBF LLC’s equity interest in PBF Holding and (ii) certain assets of PBF Holding and the subsidiary guarantors, including all deposit accounts (other than zero balance accounts, cash collateral accounts, trust accounts and/or payroll accounts, all of which are excluded from the definition of collateral), all accounts receivable, all hydrocarbon inventory (other than the J. Aron Productscertain inventory owned by J. Aron pursuant to the Third Inventory Intermediation Agreement)third parties under permittable inventory intermediation or similar agreements, as applicable) and to the extent evidencing, governing, securing or otherwise related to the foregoing, all general intangibles, chattel paper, instruments, documents, letter of credit rights and supporting obligations; and all products and proceeds of the foregoing.
On February 18, 2020, in connection with its entry into a $300.0 million uncommitted receivables purchase facility (the “Receivables Facility”), the Company amended theThe Revolving Credit Agreement and entered into a related intercreditor agreement to allow italso allows the Company to sell certain Eligible Receivables (as defined in the Revolving Credit Agreement) derived from the sale of refined product over truck racks. Under the Receivables Facility,its $300.0 million uncommitted receivables purchase facility (the “Receivables Facility”), the Company sells such receivables to a bank subject to bank approval and certain conditions. The sales of receivables under the Receivables Facility are absolute and irrevocable but subject to certain repurchase obligations under certain circumstances.
On May 7, 2020, the Company further amended the Revolving Credit Facility, to increase PBF Holding’s ability to incur certain secured debt from an amount equal to 10% of its total assets to 20% of its total assets.
PBF ENERGY INC. AND PBF ENERGY COMPANY LLC
NOTES TO CONSOLIDATED FINANCIAL STATEMENTS
OutstandingThere were no outstanding borrowings under the Revolving Credit Facility as of December 31, 20212023 and 2020 were $900.0 million.2022, respectively. Issued letters of credit were $380.1$55.0 million and $184.4$576.1 million as of December 31, 20212023 and 2020,2022, respectively.
PBFX Credit Facilities
On May 14, 2014, in connection with the PBFX initial public offering (the “PBFX Offering”),July 30, 2018, PBFX entered into a five-year, $275.0 million senior secured revolving credit facility (the “2014 PBFX Revolving Credit Facility”) with the administrative agent and a syndicate of lenders. On July 30, 2018, PBFX replaced the 2014 PBFX Revolving Credit Facility with the $500.0 million amended and restated revolving credit facility (the “PBFX Revolving Credit Facility”).
The PBFX Revolving Credit Facility iswas available to fund working capital, acquisitions, distributions, capital expenditures, and other general partnership purposes and iswas guaranteed by a guaranty of collection from PBF LLC. PBFX has the ability to increase the maximum amount of the PBFX Revolving Credit Facility by up to $250.0 million to a total facility size of $750.0 million, subject to receiving increased commitments from the lenders or other financial institutions and satisfaction of certain conditions. The PBFX Revolving Credit Facility includes a $75.0 million sublimit for standby letters of credit and a $25.0 million sublimit for swingline loans. Obligations under the PBFX Revolving Credit Facility arewere guaranteed by PBFX’s restricted subsidiaries, and arewere secured by a first priority lien on PBFX’s assets and those of PBFX’s restricted subsidiaries. The maturity date of the PBFX Revolving Credit Facility iswas July 30, 2023, but may be extended for one year on up to 2 occasions, subject to certain customary terms and conditions.2023. Borrowings under the PBFX Revolving Credit Facility bearbore interest at the Alternative Base Rate plus the Applicable Margin or the Adjusted LIBOR Rate plus an Applicable Margin, all as defined in the agreement governing the PBFX Revolving Credit Facility (the “PBFX Revolving Credit Agreement”). The Applicable Margin rangesranged from 0.75% to 1.75% for Alternative Base Rate Loans and from 1.75% to 2.75% for Adjusted LIBOR Rate Loans in each case depending on PBFX’s Consolidated Total Leverage Ratio, as defined in the PBFX Revolving Credit Agreement.
The PBFX Revolving Credit Agreement containscontained affirmative and negative covenants customary for revolving credit facilities of this nature which, among other things, limit or restrict PBFX’s ability and the ability of its restricted subsidiaries to incur or guarantee debt, incur liens, make investments, make restricted payments, amend material contracts, engage in certain business activities, engage in mergers, consolidations and other organizational changes, sell, transfer or otherwise dispose of assets, enter into burdensome agreements, or enter into transactions with affiliates on terms which are not at arm’s length.
Additionally, PBFX iswas required to maintain (a) Consolidated Interest Coverage Ratio of at least 2.50 to 1.00; (b) Consolidated Total Leverage Ratio of not greater than 4.50 to 1.00; and (c) Consolidated Senior Secured Leverage Ratio of not greater than 3.50 to 1.00 (all terms as defined in the PBFX Revolving Credit Agreement).certain financial covenant ratios.
PBF ENERGY INC.
NOTES TO CONSOLIDATED FINANCIAL STATEMENTS
The PBFX Revolving Credit Agreement containscontained events of default customary for transactions of their nature, including, but not limited to (and subject to any applicable grace periods when applicable), the failure to pay any principal, interest or fees when due, failure to perform or observe any covenant contained in the PBFX Revolving Credit Agreement or related documentation, any representation or warranty made in the agreements or related documentation being untrue in any material respect when made, default under certain material debt agreements, commencement of bankruptcy or other insolvency proceedings, certain changes in PBFX’s ownership or the ownership or board composition of PBFPBFX GP and material judgments or orders. Upon the occurrence and during the continuation of an event of default under the PBFX Revolving Credit Agreement, the lenders may,could, among other things, terminate their commitments, declare any outstanding loans to be immediately due and payable and/or exercise remedies against PBFX and the collateral as may be available to the lenders under the PBFX Revolving Credit Agreement and related documentation or applicable law.
During 2023, the Company terminated the PBFX made net repayments of $100.0 million duringRevolving Credit Facility. There were no outstanding borrowings under the year ended December 31, 2021.
PBF ENERGY INC. AND PBF ENERGY COMPANY LLC
NOTES TO CONSOLIDATED FINANCIAL STATEMENTS
The PBFX Revolving Credit Facility may be repaid, from time-to-time, without penalty. Asas of the date of termination. At December 31, 2021,2022, there were $100.0 millionno of borrowings and $3.5 million of letters of credit outstanding. At December 31, 2020, there were $200.0 million of borrowings and $4.9 million of letters of credit outstanding under the PBFX Revolving Credit Facility.
PBF Rail Term LoanPrecious Metals Financing Arrangements
On December 22, 2016, PBF Rail Logistics Company LLC (“PBF Rail”) entered into a $35.0 million term loan (the “PBF Rail Term Loan”). The PBF Rail Term Loan amortized monthly over its fiveDuring the year term and bore interest at a rate equal to one month LIBOR plus the margin as defined in the agreement governing the PBF Rail Term Loan (the “Rail Credit Agreement”). As security for the PBF Rail Term Loan, PBF Rail pledged, among other things: (i) certain Eligible Railcars; (ii) the Debt Service Reserve Account (as defined in the Rail Credit Agreement); and (iii) PBF Holding’s membership interest in PBF Rail. Additionally, the Rail Credit Agreement contained customary terms, events of default and covenants for transactions of this nature. PBF Rail may at any time repay the PBF Rail Term Loan without penalty in the event that railcars securing the loan are sold, scrapped or otherwise removed from the collateral pool.
The PBF Rail Term Loan was repaid in full as ofended December 31, 2021.
Precious Metal Catalyst Financing Arrangements
Certain2023, the Company settled its remaining outstanding precious metal financing arrangement, which represented a reduction of debt of approximately $3.1 million. During the year ended December 31, 2022, the Company settled certain of its precious metals financing arrangements, resulting in reductions of debt of approximately $56.2 million. Prior to the final settlement, certain subsidiaries of the Company have entered intohad agreements whereby such subsidiary sold a portion of its precious metal catalysts to a major commercial bank and subsequently refinanced the precious metal catalysts under contractual arrangements.arrangements to repurchase or otherwise settle the obligation at a future specified date. The volume of the precious metal catalysts and the interest rate arewere fixed over the term of each financing arrangement. At maturity, the Company mustwas required to repurchase the applicable precious metal catalysts, or otherwise settle itsthe obligation with the counterparty, at its then fair market value. The Company believes that there is a substantial market for precious metal catalysts and that it will be able to release such catalysts at maturity. The Company treated thesethose transactions as financing arrangements, and the related payments arewere recorded as interest expense over the agreements’ terms. The Company has elected the fair value option for accounting for itsthe catalyst repurchase obligations as the Company’s liability iswas directly impacted by the change in value of the underlying precious metal catalysts. The fair value of thesethe repurchase obligations aswas reflected in the fair value of long-term debt outstanding table below is measured using Level 2 inputs.
Details of the catalyst financing arrangements at each of the Company’s refineries as of December 31, 2021 are included in the following table:
| | | | | | | | | | | | | | | | | | | | |
Refinery | | Metal | | Annual interest rate | | Expiration date(1)
|
Paulsboro | | Platinum | | 1.47 | % | | December 2022 |
Delaware City | | Palladium | | 3.70 | % | | September 2022 |
Toledo | | Platinum | | 5.05 | % | | September 2022 |
Chalmette | | Platinum | | 5.10 | % | | November 2022 |
Chalmette | | Platinum | | 1.80 | % | | November 2022 |
Torrance | | Platinum | | 1.78 | % | | July 2022 |
Martinez | | Palladium | | 3.70 | % | | September 2022 |
__________________
(1) These catalyst financing arrangements are included in Long-term debt as of December 31, 2021 as the Company has the ability and intent to finance this debt through availability under other credit facilities if the catalyst financing arrangements are not renewed at maturity.
In total, aggregate annual catalyst financing fees were approximately $2.0 million and $2.7 million as of December 31, 2021 and 2020, respectively.
PBF ENERGY INC. AND PBF ENERGY COMPANY LLC
NOTES TO CONSOLIDATED FINANCIAL STATEMENTS
Debt Maturities
Debt maturing in the next five years and thereafter is as follows (in millions):
| | Year Ending December 31, | Year Ending December 31, | | Year Ending December 31, | |
| 2022 | $ | 58.4 | |
| 2023 | 1,525.0 | |
| 2024 | 2024 | — | |
| 2025 | 2025 | 1,919.5 | |
| 2026 | 2026 | — | |
| 2027 | |
| 2028 | |
| Thereafter | Thereafter | 826.5 | |
| Total debt outstanding | Total debt outstanding | $ | 4,329.4 | |
PBF ENERGY INC.
11. AFFILIATE NOTE PAYABLE - PBF LLCNOTES TO CONSOLIDATED FINANCIAL STATEMENTS
As of December 31, 2021 and December 31, 2020, PBF LLC had an outstanding note payable with PBF Energy for an aggregate principal amount of $375.2 million and $376.3 million, respectively. The note payable has a maturity date of April 2030, an annual interest rate of 2.5% and may be prepaid in whole or in part at any time, at the option of PBF LLC without penalty or premium.
12. OTHER LONG-TERM LIABILITIES
Other long-term liabilities consisted of the following:
| | | | | | | | | | | | | | |
| (in millions) | | December 31,
2021 | | December 31,
2020 |
| Environmental liabilities | | $ | 142.1 | | | $ | 141.9 | |
| Defined benefit pension plan liabilities | | 47.0 | | | 73.5 | |
| | | | |
| Contingent consideration | | 29.4 | | | — | |
| Post-retirement medical plan liabilities | | 18.2 | | | 22.0 | |
| Early railcar return liability | | 6.0 | | | 13.9 | |
| Other | | 9.7 | | | 17.2 | |
| Total other long-term liabilities | | $ | 252.4 | | | $ | 268.5 | |
13.10. RELATED PARTY TRANSACTIONS
Investments in PBF LLC
Pursuant to the amended and restated limited liability company agreement of PBF LLC, the holders of PBF LLC Series B Units are entitled to an interest in the amounts received by the investment funds associated with the initial investors in PBF LLC in excess of their original investment in the form of PBF LLC distributions and from the shares of PBF Energy Class A common stock issuable to such investment funds (for their own account and on behalf of the holders of PBF LLC Series B Units) upon an exchange, and the proceeds from the sale of such shares. Such proceeds received by the investment funds associated with the initial investors in PBF LLC are distributed to the holders of the PBF LLC Series B Units in accordance with the distribution percentages specified in the PBF LLC amended and restated limited liability company agreement. There were no distributions to PBF LLC Series B unitholders for the years ended December 31, 2021, 20202023, 2022 or 2021. Investment funds associated with the initial investors in PBF LLC may be entitled to future Tax Receivable Agreement payments in which the Series B Unitholders are entitled to a distribution payment pursuant to the PBF LLC amended and 2019.restated limited liability company agreement. In January 2024, the Company made payments under the Tax Receivable Agreement relating to the 2022 tax year of $43.0 million, inclusive of $4.2 million paid to Series B Unit holders. Refer to “Note 18 - Income Taxes” for a more detailed description of the Tax Receivable Agreement.
Transactions with SBR
The Company and its subsidiaries have entered into various agreements with SBR, in which it has a 50% equity investment, but does not control. In connection with the commencement of operations at SBR, the Company has provided limited financial performance guarantees to certain of SBR’s third-party suppliers for various commercial transactions, primarily for the purchase of feedstock inventory. Although the company does not currently expect to perform under such guarantees, it is entitled to certain indemnification protections from Eni in the event that it is required to perform.
Commercial and other transactions
PBF Holding has entered into commercial agreements with SBR for the purchase and sale of RINs and Low Carbon Fuel Standard (“LCFS”) credits.
The Agreement for the Sale and Purchase of Renewable Identification Numbers was initiated on June 1, 2023, and the LEAP Master Agreement for Purchasing and Selling of LCFS credits was initiated on August 1, 2023. Both agreements had initial terms of three months. Upon the expiration of the initial terms, both agreements have been, and will continue to be, automatically renewed for successive three-month periods, unless earlier terminated by the Company or SBR via written notice.
For the period beginning June 27, 2023 through December 31, 2023, the Company had total sales to SBR of $9.1 million, which are included in revenues, that consist primarily of refined product sales. The Company also had purchases from SBR of $244.4 million primarily related to the commercial agreements described above, included in cost of products and other, consisting of purchases of environmental credits and hydrocarbon products.
PBF ENERGY INC. AND PBF ENERGY COMPANY LLC
NOTES TO CONSOLIDATED FINANCIAL STATEMENTS
14.Operating Agreement
PBF Holding entered into an operation and management services and secondment agreement (the “Operating Agreement”) with SBR in June 2023, pursuant to which the Company provides SBR with the personnel necessary for SBR to operate so that it may perform its obligations under the commercial agreements. The Company charges SBR a fixed operating fee under the agreement and SBR reimburses the Company for the use of employees and the provision of certain infrastructure-related services to the extent applicable to its operations.
For the period beginning June 27, 2023 through December 31, 2023, the Company received total fees of $62.8 million under the Operating Agreement.
Additionally, the Consolidated Balance Sheet includes $22.1 million and $28.3 million of Accounts receivable and Accrued expenses, respectively, related to transactions with SBR as of December 31, 2023.
11. COMMITMENTS AND CONTINGENCIES
Other Commitments
In addition to commitments related to lease obligations accounted for in accordance with ASC 842, Leases and disclosed in “Note 1512 - Leases”, the Company is party to agreements which provide for the treatment of wastewater and the supply of hydrogen, nitrogen, oxygen, chemical and steam for certain of its refineries. The Company made purchases of $76.0$121.4 million, $69.0$112.2 million and $65.0$76.0 million under these supply agreements for the years ended December 31, 2023, 2022 and 2021, 2020 and 2019, respectively.
The fixed and determinable amounts related to obligations under these agreements are as follows (in millions):
| | | | | |
| Year Ending December 31, | |
| 2022 | $ | 54.4 | |
| 2023 | 36.1 | |
| 2024 | 24.8 | |
| 2025 | 21.4 | |
| 2026 | 21.4 | |
| Thereafter | 205.0 | |
| Total obligations | 363.1 |
| | | | | |
| Year Ending December 31, | |
| 2024 | $ | 51.8 | |
| 2025 | 26.0 | |
| 2026 | 21.7 | |
| 2027 | 21.7 | |
| 2028 | 21.7 | |
| Thereafter | 174.0 | |
| Total obligations | $ | 316.9 | |
Employment Agreements
The Company has entered into various employment agreements with members of executive management and certain other key personnel that include automatic annual renewals, unless canceled. Under some of the agreements, certain of the executives would receive a lump sum payment of between 1.50 to 2.99 times their base salary and continuation of certain employee benefits for the same period upon termination by the Company “Without Cause”, or by the employee “For Good Reason”, or upon a “Change in Control”, as defined in the agreements. Upon death or disability, certain of the Company’s executives, or their estates, would receive a lump sum payment of at least one half of their base salary.
PBF ENERGY INC.
NOTES TO CONSOLIDATED FINANCIAL STATEMENTS
Environmental Matters
The Company’s refineries, pipelines and related operations are subject to extensive and frequently changing federal, state and local laws and regulations, including, but not limited to, those relating to the discharge of materials into the environment or that otherwise relate to the protection of the environment (including in response to the potential impacts of climate change), waste management and the characteristics and the compositions of fuels. Compliance with existing and anticipated laws and regulations can increase the overall cost of operating the refineries, including remediation, operating costs and capital costs to construct, maintain and upgrade equipment and facilities.
These laws and permits raise potential exposure to future claims and lawsuits involving environmental and safety matters which could include soil and water contamination, air pollution, personal injury and property damage allegedly caused by substances which the Company manufactured, handled, used, released or disposed of, transported, or that relate to pre-existing conditions for which the Company has assumed responsibility. The Company believes that its current operations are in compliance with existing environmental and safety requirements. However, there have been and will continue to be ongoing discussions about environmental and safety matters between the Company and federal and state authorities, including notices of violations, citations and other enforcement actions, some of which have resulted or may result in changes to operating procedures and in capital expenditures. While it is often difficult to quantify future environmental or safety related expenditures, the Company anticipates that continuing capital investments and changes in operating procedures will be required for the foreseeable future to comply with existing and new requirements, as well as evolving interpretations and more strict enforcement of existing laws and regulations.
PBF ENERGY INC. AND PBF ENERGY COMPANY LLC
NOTES TO CONSOLIDATED FINANCIAL STATEMENTS
In connection with the acquisition of the Torrance refinery and related logistics assets, the Company assumed certain pre-existing environmental liabilities. The estimated costs related to these remediation obligations totaled $118.5$114.9 million as of December 31, 20212023 ($113.7117.0 million as of December 31, 2020)2022) and related primarily to remediation obligations to address existing soil and groundwater contamination and the related monitoring and clean-up activities. Costs related to these obligations are reassessed periodically or when changes to our remediation approach are identified. The current portion of the environmental liability is recorded in Accrued expenses and the non-current portion is recorded in Other long-term liabilities. The Company expects to make aggregate payments for this liability of approximately $49.2 million over the next five years.
The aggregate environmental liability reflected in the Company’s Consolidated Balance Sheets was $157.0$157.8 million and $153.7$157.7 million at December 31, 20212023 and December 31, 2020,2022, respectively, of which $142.1$141.2 million and $141.9$142.8 million, respectively, were classified as Other long-term liabilities. These liabilities include remediation and monitoring costs expected to be incurred over an extended period of time. Estimated liabilities could increase in the future when the results of ongoing investigations become known, are considered probable and can be reasonably estimated.
Applicable Federal and State Regulatory Requirements
The Company’s operations and many of the products it manufactures are subject to certain specific requirements of the Clean Air Act (the “CAA”) and related state and local regulations. The CAA contains provisions that require capital expenditures for the installation of certain air pollution control devices at the Company’s refineries. Subsequent rule making authorized by the CAA or similar laws or new agency interpretations of existing rules, may necessitate additional expenditures in future years.
PBF ENERGY INC.
NOTES TO CONSOLIDATED FINANCIAL STATEMENTS
The Company is required to comply with the Renewable Fuel Standard.RFS. Pursuant to the Energy Policy Act of 2005 and the Energy Independence and Security Act of 2007, EPA has issued the Renewable Fuel Standard,RFS, implementing mandates to blend renewable fuels into the petroleum fuels produced and sold in the United States. Under the Renewable Fuel Standard,RFS, the volume of renewable fuels that obligated refineries must blend into their finished petroleum fuels historically has increased on an annual basis. In addition, certain states have passed legislation that requires minimum biodiesel blending in finished distillates. On October 13, 2010, EPA raised the maximum amount of ethanol allowed under federal law from 10% to 15% for cars and light trucks manufactured since 2007. The maximum amount allowed under federal law currently remains at 10% ethanol for all other vehicles. Existing laws and regulations could change, and the minimum volumes of renewable fuels that must be blended with refined petroleum fuels may increase. Because we do not directly produce renewable fuels, increasing the volume of renewable fuels that must be blended into our products displacescould displace an increasing volume of our refinery’s product pool, potentially resulting in lower earnings and profitability. In addition, in order to meet certain of these and future EPA requirements, we may be required to purchase RINs, which may have fluctuating costs based on market conditions. Our RINs purchase obligation is dependent on our actual shipment of on-road transportation fuels domestically and the amount of blending achieved which can cause variability in our profitability. EPA’s proposedOn June 21, 2023, EPA finalized the volumes of renewable fuels that obligated refineries must blend into their final petroleum fuels are expectedfor years 2023, 2024, and 2025, and finalized volume requirements and percentage standards under the RFS program for 2023, 2024, and 2025, as well as making a series of important modifications to be finalized bystrengthen and expand the end of the first quarter of 2022.RFS program. As a result, wethe Company could also experience fluctuating compliance costs in the future if the volumes finalized by EPA differ from what has been proposed.
EPA published a Final Rule to the Clean Water Act Section 316(b) in August 2014 regarding cooling water intake structures, which includes requirements for petroleum refineries. The purpose of this rule is to prevent fish from being trapped against cooling water intake screens (impingement) and to prevent fish from being drawn through cooling water systems (entrainment). Facilities will be required to implement best technology available as soon as possible, but state agencies have the discretion to establish implementation time lines. The Company has evaluated, and continues to evaluate, the impact of this regulation, and at this time does not expect this regulation to materially impact the Company’s financial position, results of operations or cash flows.
PBF ENERGY INC. AND PBF ENERGY COMPANY LLC
NOTES TO CONSOLIDATED FINANCIAL STATEMENTS
The Company is subject to greenhouse gas emission control regulations in the state of California pursuant to AB 32. AB 32 imposes a statewide cap on greenhouse gas emissions, including emissions from transportation fuels, with the aim of returning the state to 1990 emission levels by 2020. AB 32 is implemented through two market mechanisms including the Low Carbon Fuel StandardLCFS and Cap and Trade. The Company is responsible for the AB 32 obligations related to the Torrance refinery beginning on July 1, 2016 and the Martinez refinery beginning on February 1, 2020 and must purchase emission credits to comply with these obligations. Additionally, in September 2016, the state of California enacted Senate Bill 32 (“SB32”SB 32”) which further reduces greenhouse gas emissions targets to 40 percent below 1990 levels by 2030. California Air Resources Board also amended the LCFS in 2018 to require a 20% reduction by 2030.
The Company recovers the majority of these costs from its customers, and does not expect these obligations to materially impact the Company’s financial position, results of operations, or cash flows. To the degree there are unfavorable changes to AB 32 or SB 32 regulations, or the Company is unable to recover such compliance costs from customers, these regulations could have a material adverse effect on our financial position, results of operations and cash flows.
The Company is subject to obligations to purchase RINs. On February 15, 2017, the Company received a notification that EPA records indicated that PBF Holding used potentially invalid RINs that were in fact verified under EPA’s RIN Quality Assurance Program (“QAP”) by an independent auditor as QAP A RINs. Under the regulations, use of potentially invalid QAP A RINs provided the user with an affirmative defense from civil penalties provided certain conditions are met. The Company has asserted the affirmative defense and if accepted by EPA will not be required to replace these RINs and will not be subject to civil penalties under the program. It is reasonably possible that EPA will not accept the Company’s defense and may assess penalties in these matters but any such amount is not expected to have a material impact on the Company’s financial position, results of operations or cash flows.
As of January 1, 2011, the Company is required to comply with EPA’s Control of Hazardous Air Pollutants From Mobile Sources, or MSAT2, regulations on gasoline that impose reductions in the benzene content of its produced gasoline. The Company purchases benzene credits to meet these requirements when necessary. The Company may implement capital projects to reduceIn addition, the amount of benzene credits that the Company needs to purchase. In additions, the Renewable Fuel Standard mandateRFS mandates the blending of prescribed percentages of renewable fuels (e.g., ethanol and biofuels) into the Company’s produced gasoline and diesel. These requirements, other requirements of the CAA and other presently existing or future environmental regulations may cause the Company to implement capital projects to reduce the amount of credits required to be purchased, make substantial capital expenditures as well as the purchase of credits at significant cost, to enable its refineries to produce products that meet applicable requirements.
PBF ENERGY INC.
NOTES TO CONSOLIDATED FINANCIAL STATEMENTS
The federal Comprehensive Environmental Response, Compensation and Liability Act of 1980 (“CERCLA”), also known as “Superfund,” imposes liability, without regard to fault or the legality of the original conduct, on certain classes of persons who are considered to be responsible for the release of a “hazardous substance” into the environment. These persons include the current or former owner or operator of the disposal site or sites where the release occurred and companies that disposed of or arranged for the disposal of the hazardous substances. Under CERCLA, such persons may be subject to joint and several liability for investigation and the costs of cleaning up the hazardous substances that have been released into the environment, for damages to natural resources and for the costs of certain health studies. As discussed more fully above, certain of the Company’s sites are subject to these laws and the Company may be held liable for investigation and remediation costs or claims for natural resource damages. It is not uncommon for neighboring landowners and other third parties to file claims for personal injury and property damage allegedly caused by hazardous substances or other pollutants released into the environment. Analogous state laws impose similar responsibilities and liabilities on responsible parties. In the Company’s current normal operations, it has generated waste, some of which falls within the statutory definition of a “hazardous substance” and some of which may have been disposed of at sites that may require cleanup under Superfund.
PBF ENERGY INC. AND PBF ENERGY COMPANY LLC
NOTES TO CONSOLIDATED FINANCIAL STATEMENTS
The Company is also currently subject to certain other existing environmental claims and proceedings. The Company believes that it is unlikely that future costs related to any of these other known contingent liability exposures would have a material impact on its financial position, results of operations or cash flows.
Contingent Consideration
In connection with the acquisition of the Martinez Acquisition,refinery and related logistics assets, the Salesale and Purchase Agreement includespurchase agreement dated June 11, 2019 included an earn-out provision based on certain earnings thresholds of the Martinez refinery. Pursuant to the agreement, the Company will make payments to the SellerEquilon Enterprises LLC d/b/a Shell Oil Products US, based on future earnings at the Martinez refinery in excess of certain thresholds, as defined in the agreement, for a period of up to four years following the acquisition closing date.date (the “Martinez Contingent Consideration”). The Company recorded the acquisition date fair value of the earn-out provision as contingent consideration of $77.3 million within “Other long-term liabilities” within the Company’s Consolidated Balance Sheets. Subsequent changes in the fair value of the Martinez Contingent Consideration are recorded in the Consolidated Statements of Operations. The value of the Martinez Contingent Consideration was estimated to be $29.4$21.6 million as of December 31, 20212023 and zero as of December 31, 2020.
In connection with the acquisition of CPI Operations LLC, the purchase and sale agreement between PBFX and Crown Point International LLC (“Crown Point”)is included an earn-out provision related to an existing commercial agreement with a third-party, basedwithin Accrued expenses on the future resultsCompany’s Consolidated Balance Sheets. This final earn-out payment is expected to be made in the second quarter of certain2024. The fair value of the acquired idled assets (the “PBFX Contingent Consideration”). PBFX and Crown Point will share equally in the future operating profits of the restarted assets, as defined in the purchase and sale agreement, over a contractual term of up to three years starting in 2019. The PBFXMartinez Contingent Consideration recorded was $2.9 million and $12.1estimated to be $147.3 million as of December 31, 20212022 (of which approximately $80.0 million was included within Accrued expenses and December 31, 2020, respectively, representing the present value of expected future payments. The short-term PBFX Contingent Consideration is includedpaid in “Accrued expenses” within the Company’s Consolidated Balance Sheets.
In the third quarter of 2020, the counterparty subject to the processing agreement with PBFX exercised its right to terminate the contract at the conclusion of the initial contract year, resulting in an adjustment in the fair value of the PBFX Contingent Consideration for the year ended December 31, 2020 of $16.4 million, reflecting the elimination of the estimated earn-out for years 2 and 3 of the performance period. There were no material changes in the fair value of the PBFX Contingent Consideration for the year ended December 31, 2021.April 2023).
Tax Receivable Agreement
PBF Energy entered into the Tax Receivable Agreement that provides for the payment by PBF Energy to such persons of an amount equal to 85% of the amount of the benefits, if any, that PBF Energy is deemed to realize as a result of (i) increases in tax basis, as described below, and (ii) certain other tax benefits related to entering into the Tax Receivable Agreement, including tax benefits attributable to payments under the Tax Receivable Agreement. For purposes of the Tax Receivable Agreement, the benefits deemed realized by PBF Energy will be computed by comparing the actual income tax liability of PBF Energy (calculated with certain assumptions) to the amount of such taxes that PBF Energy would have been required to pay had there been no increase to the tax basis of the assets of PBF LLC as a result of purchases or exchanges of PBF LLC Series A Units for shares of PBF Energy Class A common stock and had PBF Energy not entered into the Tax Receivable Agreement. The term of the Tax Receivable Agreement will continue until all such tax benefits have been utilized or expired unless: (i) PBF Energy exercises its right to terminate the Tax Receivable Agreement, (ii) PBF Energy breaches any of its material obligations under the Tax Receivable Agreement or (iii) certain changes of control occur, in which case all obligations under the Tax Receivable Agreement will generally be accelerated and due as calculated under certain assumptions.
PBF ENERGY INC. AND PBF ENERGY COMPANY LLC
NOTES TO CONSOLIDATED FINANCIAL STATEMENTS
The payment obligations under the Tax Receivable Agreement are obligations of PBF Energy and not of PBF LLC, PBF Holding or PBFX.any of its subsidiaries. In general, PBF Energy expects to obtain funding for these annual payments from PBF LLC, primarily through tax distributions, which PBF LLC makes on a pro-rata basis to its owners. Such owners include PBF Energy, which holds a 99.2%99.3% interest in PBF LLC as of December 31, 2021 (99.2%2023 (99.3% as of December 31, 2020)2022). PBF LLC generally obtains funding to pay its tax distributions by causing PBF Holding to distribute cash to PBF LLC and from distributions it receives from PBFX.
As of December 31, 2021,2023 and December 31, 2022, the Company recognized $48.3a liability of $336.6 million liability forand $338.6 million, respectively, related to the Tax Receivable Agreement obligation, reflecting the estimate of the undiscounted amounts that PBF Energy expects to pay under the agreement, net of the impact of aany deferred tax asset valuation allowance recognized in accordance with ASC 740, Income Taxes.740. As of December 31, 2023, $43.0 million of the Tax Receivable Agreement obligation was recorded as a Current liability and represents the amount paid in January 2024 related to the 2022 tax year. As future taxable income is recognized, increases in our Tax Receivable Agreement liability may be necessary in conjunction with the revaluation of deferred tax assets. There was no liability for the Tax Receivable Agreement recognized of as of December 31, 2020. Refer to “Note 2118 - Income Taxes” for more details.
PBF ENERGY INC.
15.NOTES TO CONSOLIDATED FINANCIAL STATEMENTS
12. LEASES
Lease Position as of December 31, 20212023 and December 31, 20202022
The table below presents the lease related assets and liabilities recorded on the Company’s Consolidated Balance Sheets as of December 31, 20212023 and December 31, 2020:2022:
| | | | | | | | | | | | | | | | | | | | |
| (in millions) | | Classification on the Balance Sheet | | December 31, 2021 | | December 31,
2020 |
| Assets | | | | | | |
| Operating lease assets | | Lease right of use assets | | $ | 636.0 | | | $ | 836.5 | |
| Finance lease assets | | Lease right of use assets | | 81.1 | | | 80.4 | |
| Total lease right of use assets | | | | $ | 717.1 | | | $ | 916.9 | |
| | | | | | |
| Liabilities | | | | | | |
| Current liabilities: | | | | | | |
| Operating lease liabilities | | Current operating lease liabilities | | $ | 64.9 | | | $ | 78.4 | |
| Finance lease liabilities | | Accrued expenses | | 11.1 | | | 14.4 | |
| Noncurrent liabilities: | | | | | | |
| Operating lease liabilities | | Long-term operating lease liabilities | | 570.4 | | | 756.0 | |
| Finance lease liabilities | | Long-term financing lease liabilities | | 70.6 | | | 68.3 | |
| Total lease liabilities | | | | $ | 717.0 | | | $ | 917.1 | |
| | | | | | | | | | | | | | | | | | | | |
| (in millions) | | Classification on the Balance Sheet | | December 31, 2023 | | December 31,
2022 |
| Assets | | | | | | |
| Operating lease assets | | Lease right of use assets | | $ | 732.8 | | | $ | 611.7 | |
| Finance lease assets | | Lease right of use assets | | 56.3 | | | 67.4 | |
| Total lease right of use assets | | | | $ | 789.1 | | | $ | 679.1 | |
| | | | | | |
| Liabilities | | | | | | |
| Current liabilities: | | | | | | |
| Operating lease liabilities | | Current operating lease liabilities | | $ | 131.2 | | | $ | 60.5 | |
| Finance lease liabilities | | Accrued expenses | | 12.2 | | | 11.7 | |
| Noncurrent liabilities: | | | | | | |
| Operating lease liabilities | | Long-term operating lease liabilities | | 608.8 | | | 552.7 | |
| Finance lease liabilities | | Long-term financing lease liabilities | | 46.1 | | | 57.9 | |
| Total lease liabilities | | | | $ | 798.3 | | | $ | 682.8 | |
Lease Costs
The table below presents certain information related to costs for the Company’s leases for the year ended December 31, 20212023 and December 31, 2020:2022:
| | | | | | | | | | | | | | | | | | |
Lease Costs (in millions) | | December 31, 2021 | | December 31,
2020 | | | | |
| Components of total lease costs: | | | | | | | | |
| Finance lease costs | | | | | | | | |
| Amortization of right of use assets | | $ | 16.1 | | | $ | 14.0 | | | | | |
| Interest on lease liabilities | | 4.6 | | | 4.3 | | | | | |
| Operating lease costs | | 170.2 | | | 162.3 | | | | | |
| Short-term lease costs | | 59.3 | | | 92.3 | | | | | |
| Variable lease costs | | 10.2 | | | 11.6 | | | | | |
| Total lease costs | | $ | 260.4 | | | $ | 284.5 | | | | | |
| | | | | | | | | | | | | | | | | | |
Lease Costs (in millions) | | December 31, 2023 | | December 31,
2022 | | | | |
| Components of total lease costs: | | | | | | | | |
| Finance lease costs | | | | | | | | |
| Amortization of right of use assets | | $ | 13.9 | | | $ | 12.6 | | | | | |
| Interest on lease liabilities | | 4.5 | | | 5.3 | | | | | |
| Operating lease costs | | 219.7 | | | 171.8 | | | | | |
| Short-term lease costs | | 137.7 | | | 88.0 | | | | | |
| Variable lease costs | | 13.4 | | | 8.1 | | | | | |
| Total lease costs | | $ | 389.2 | | | $ | 285.8 | | | | | |
PBF ENERGY INC.
Sale-leaseback TransactionsNOTES TO CONSOLIDATED FINANCIAL STATEMENTS
On April 17, 2020, the Company closed on the sale of 5 hydrogen plants to Air Products in a sale-leaseback transaction for gross cash proceeds of $530.0 million and recognized a gain of $471.1 million. In connection with the sale, the Company entered into a transition services agreement through which Air Products will exclusively supply hydrogen, steam, carbon dioxide and other products (the “Products”) to the Martinez, Torrance and Delaware City refineries for a specified period (not expected to exceed 18 months). The transition services agreement also requires certain maintenance and operating activities to be provided by PBF Holding, for which the Company will be reimbursed, during the term of the agreement. In August 2020, the parties executed long-term supply agreements through which Air Products will supply the Products for a term of fifteen years at these same refineries. As a result of these transactions, the Company recorded lease right of use assets and corresponding operating lease liabilities of approximately $504.0 million. There were no net gains or losses on any sale-leaseback transactions for the year ended December 31, 2021.
Other Information
The table below presents supplemental cash flow information related to leases for the year ended December 31, 20212023 and December 31, 20202022 (in millions):
| | | | | | | | | | | | | |
| Year Ended December 31, 2021 | | |
| 2021 | | 2020 | | |
| Cash paid for amounts included in the measurement of lease liabilities: | | | | | |
| Operating cash flows for operating leases | $ | 168.8 | | | $ | 163.1 | | | |
| Operating cash flows for finance leases | 4.6 | | | 4.3 | | | |
| Financing cash flows for finance leases | 17.8 | | | 12.4 | | | |
| Supplemental non-cash amounts of lease liabilities arising from obtaining or remeasuring right-of-use assets | (106.6) | | | 702.0 | | | |
| | | | | | | | | | | | | |
| Year Ended December 31, | | |
| 2023 | | 2022 | | |
| Cash paid for amounts included in the measurement of lease liabilities: | | | | | |
| Operating cash flows for operating leases | $ | 213.9 | | | $ | 169.6 | | | |
| Operating cash flows for finance leases | 4.5 | | | 5.3 | | | |
| Financing cash flows for finance leases | 14.1 | | | 11.3 | | | |
| Supplemental non-cash quantification of assets acquired or remeasured under operating and financing leases | 271.6 | | | 54.7 | | | |
Lease Term and Discount Rate
The table below presents certain information related to the weighted average remaining lease term and weighted average discount rate for the Company’s leases as of December 31, 2021:2023:
| | | | | | | | | | | |
| Weighted average remaining lease term - operating leases | 13.410.4 years | | | | | | |
| Weighted average remaining lease term - finance leases | 6.54.6 years | | | | | | |
| | | | | | | |
| Weighted average discount rate - operating leases | 15.514.5 | % | | | | | | |
| Weighted average discount rate - finance leases | 7.47.2 | % | | | | | | |
Undiscounted Cash Flows
The table below reconciles the fixed component of the undiscounted cash flows for each of the periods presented to the lease liabilities recorded on the Consolidated Balance Sheets as of December 31, 2021:2023:
| | | | | | | | | | | | | | |
Amounts due in the year ended December 31, (in millions) | | Finance Leases | | Operating Leases |
| 2022 | | $ | 16.5 | | | $ | 153.4 | |
| 2023 | | 16.4 | | | 125.2 | |
| 2024 | | 15.7 | | | 116.6 | |
| 2025 | | 14.2 | | | 103.0 | |
| 2026 | | 13.8 | | | 97.0 | |
| Thereafter | | 25.6 | | | 852.7 | |
| Total minimum lease payments | | 102.2 | | | 1,447.9 | |
| Less: effect of discounting | | 20.5 | | | 812.6 | |
| Present value of future minimum lease payments | | 81.7 | | | 635.3 | |
| Less: current obligations under leases | | 11.1 | | | 64.9 | |
| Long-term lease obligations | | $ | 70.6 | | | $ | 570.4 | |
| | | | | | | | | | | | | | |
Amounts due in the year ended December 31, (in millions) | | Finance Leases | | Operating Leases |
| 2024 | | $ | 15.8 | | | $ | 223.2 | |
| 2025 | | 13.9 | | | 168.7 | |
| 2026 | | 13.6 | | | 128.1 | |
| 2027 | | 13.6 | | | 98.7 | |
| 2028 | | 10.9 | | | 96.1 | |
| Thereafter | | 0.7 | | | 711.4 | |
| Total minimum lease payments | | 68.5 | | | 1,426.2 | |
| Less: effect of discounting | | 10.2 | | | 686.2 | |
| Present value of future minimum lease payments | | 58.3 | | | 740.0 | |
| Less: current obligations under leases | | 12.2 | | | 131.2 | |
| Long-term lease obligations | | $ | 46.1 | | | $ | 608.8 | |
As of December 31, 2021,2023, the Company has entered into certain leases that have not yet commenced. Such leases include a 15-year3-year lease for water treatment equipment,an oil tanker, with future lease payments estimated to total approximately $34.1$38.1 million. No other such pending leases, either individually or in the aggregate, are material. There are no material lease arrangements in which the Company is the lessor.
PBF ENERGY INC.
16.NOTES TO CONSOLIDATED FINANCIAL STATEMENTS
13. STOCKHOLDERS’ AND MEMBERS’ EQUITY STRUCTURE
PBF Energy Capital Structure
Class A Common Stock
Holders of Class A common stock are entitled to receive dividends when and if declared by the Board of Directors out of funds legally available therefore, subject to any statutory or contractual restrictions on the payment of dividends and to any restrictions on the payment of dividends imposed by the terms of any outstanding preferred stock. Upon the Company’s dissolution or liquidation or the sale of all or substantially all of the assets, after payment in full of all amounts required to be paid to creditors and to the holders of preferred stock having liquidation preferences, if any, the holders of shares of Class A common stock will be entitled to receive pro rata remaining assets available for distribution. Holders of shares of Class A common stock do not have preemptive, subscription, redemption or conversion rights.
Class B Common Stock
Holders of shares of Class B common stock are entitled, without regard to the number of shares of Class B common stock held by such holder, to 1one vote for each PBF LLC Series A Unit beneficially owned by such holder. Accordingly, the members of PBF LLC other than PBF Energy collectively have a number of votes in PBF Energy that is equal to the aggregate number of PBF LLC Series A Units that they hold.
Holders of shares of Class A common stock and Class B common stock vote together as a single class on all matters presented to stockholders for their vote or approval, except as otherwise required by applicable law.
Holders of Class B common stock do not have any right to receive dividends or to receive a distribution upon a liquidation or winding up of PBF Energy.
PBF ENERGY INC. AND PBF ENERGY COMPANY LLC
NOTES TO CONSOLIDATED FINANCIAL STATEMENTS
Preferred Stock
Authorized preferred stock may be issued in one or more series, with designations, powers and preferences as shall be designated by the Board of Directors.
PBF LLC Capital Structure
PBF LLC Series A Units
The allocation of profits and losses and distributions to PBF LLC Series A unitholders is governed by the limited liability company agreement of PBF LLC. These allocations are made on a pro rata basis with PBF LLC Series C Units. PBF LLC Series A unitholders do not have voting rights.
PBF LLC Series B Units
The PBF LLC Series B Units are intended to be “profit interests” within the meaning of Revenue Procedures 93-27 and 2001-43 of the Internal Revenue Service (“IRS”) and have a stated value of zero at issuance. The PBF LLC Series B Units are held by certain of the Company’s current and former officers, have no voting rights and are designed to increase in value only after the Company’s financial sponsors achieve certain levels of return on their investment in PBF LLC Series A Units. Accordingly, the amounts paid to the holders of PBF LLC Series B Units, if any, will reduce only the amounts otherwise payable to the PBF LLC Series A Units held by the Company’s financial sponsors, and will not reduce or otherwise impact any amounts payable to PBF Energy (the holder of PBF LLC Series C Units), the holders of the Company’s Class A common stock or any other holder of PBF LLC Series A Units. The maximum number of PBF LLC Series B Units authorized to be issued is 1,000,000.
PBF ENERGY INC.
NOTES TO CONSOLIDATED FINANCIAL STATEMENTS
PBF LLC Series C Units
The PBF LLC Series C Units rank on a parity with the PBF LLC Series A Units as to distribution rights, voting rights and rights upon liquidation, winding up or dissolution. PBF LLC Series C Units are held solely by PBF Energy.
Treasury Stock
On December 12, 2022, the Company’s Board of Directors authorized the repurchase of up to $500.0 million of PBF Energy's Class A common stock (as amended from time to time, the “Repurchase Program”). On May 3, 2023, the Company’s Board of Directors approved an increase in the repurchase authorization amount under the Repurchase Program from $500.0 million to $1.0 billion and extended the program expiration date to December 2025. During the year ended December 31, 2023, the Company purchased 12,367,073 shares of PBF Energy’s Class A common stock under the Repurchase Program for $532.5 million, inclusive of commissions paid, through open market transactions. During the year ended December 31, 2022, the Company purchased 4,192,555 shares of PBF Energy’s Class A common stock under the Repurchase Program for $156.4 million, inclusive of commissions paid, through open market transactions.
As disclosed in Note 23 - Subsequent Events, on February 13, 2024, the Company's Board of Directors approved an increase in the repurchase authorization amount under the Repurchase Program from $1.0 billion to $1.75 billion.
Treasury stock repurchases can be made from time to time through various methods, including open market transactions, block trades, accelerated share repurchases, privately negotiated transactions or otherwise, certain of which could be effected through Rule 10b5-1 plans. The timing and number of shares repurchased depends on a variety of factors, including price, capital availability, legal requirements and economic and market conditions. The Company is not obligated to purchase any shares under the Repurchase Program, and repurchases could be suspended or discontinued at any time without prior notice.
The Company records PBF Energy Class A common stock surrendered to cover income tax withholdings for certain directors and employees and others pursuant to the vesting of certain awards under the Company’s equity-based compensation plans as treasury shares.
17.14. NONCONTROLLING INTERESTS
Noncontrolling Interest in PBF LLC
PBF Energy is the sole managing member of, and has a controlling interest in, PBF LLC. As the sole managing member of PBF LLC, PBF Energy operates and controls all of the business and affairs of PBF LLC and its subsidiaries. PBF Energy’s equity interest in PBF LLC was approximately 99.2%99.3% as of both December 31, 20212023 and 2020, respectively.2022.
PBF Energy consolidates the financial results of PBF LLC and its subsidiaries, and records a noncontrolling interest for the economic interest in PBF Energy held by the members of PBF LLC other than PBF Energy. Noncontrolling interest on the Consolidated Statements of Operations includes the portion of net income or loss attributable to the economic interest in PBF Energy held by the members of PBF LLC other than PBF Energy. Noncontrolling interest on the Consolidated Balance Sheets reflects the portion of net assets of PBF Energy attributable to the members of PBF LLC other than PBF Energy.
PBF ENERGY INC. AND PBF ENERGY COMPANY LLC
NOTES TO CONSOLIDATED FINANCIAL STATEMENTS
The noncontrolling interest ownership percentages in PBF LLC as of the completion dates of each of the equity offerings and as of the years ended December 31, 2021, 20202023, 2022 and 20192021 are calculated as follows:
| | | | | | | | | | | | | | | | | |
| Holders of
PBF LLC Series
A Units | | Outstanding Shares
of PBF Energy
Class A
Common
Stock | | Total |
| December 31, 2019 | 1,215,317 | | 119,804,971 | | 121,020,288 |
| 1.0 | % | | 99.0 | % | | 100.0 | % |
| December 31, 2020 | 970,647 | | 120,101,641 | | 121,072,288 |
| 0.8 | % | | 99.2 | % | | 100.0 | % |
| December 31, 2021 | 927,990 | | 120,319,577 | | 121,247,567 |
| 0.8 | % | | 99.2 | % | | 100.0 | % |
| | | | | | | | | | | | | | | | | |
| Holders of
PBF LLC Series
A Units | | Outstanding Shares
of PBF Energy
Class A
Common
Stock | | Total |
| December 31, 2021 | 927,990 | | 120,319,577 | | 121,247,567 |
| 0.8 | % | | 99.2 | % | | 100.0 | % |
| December 31, 2022 | 910,457 | | 129,639,307 | | 130,549,764 |
| 0.7 | % | | 99.3 | % | | 100.0 | % |
| December 31, 2023 | 862,780 | | 120,440,620 | | 121,303,400 |
| 0.7 | % | | 99.3 | % | | 100.0 | % |
Noncontrolling Interest in PBFX
PBF LLC held a 47.9% limited partner interest in PBFX, with the remaining 52.1% limited partner interest owned by the public common unitholders as of December 31, 2021. PBF LLC is also the sole member of PBF GP, the general partner of PBFX.
PBF Energy, through its ownership of PBF LLC, consolidates the financial results of PBFX, and recordsPBFX. Prior to the Merger Transaction, the Company recorded a noncontrolling interest for the economic interest in PBFX held by the public common unitholders. NoncontrollingFollowing the Merger Transaction, noncontrolling interest on the Consolidated Statements of Operations includes the portion of net income or loss attributable to the economic interest in PBFX held by the public common unitholders of PBFX other than PBF Energy (through its ownership in PBF LLC). Noncontrolling as of November 30, 2022, and noncontrolling interest on the Consolidated Balance Sheets includes the portion of net assets of PBFX attributable to the public common unitholders of PBFX.was eliminated.
The noncontrolling interest ownership percentages in PBFX as of the 2019 Registered Direct OfferingNovember 30, 2022, November 29, 2022 and the years ended December 31, 2021 2020 and 2019 are calculated as follows:
| | | | | | | | | | | | | | | | | |
| Units of PBFX Held by the Public | | Units of PBFX Held by PBF LLC (Including Subordinated Units) | | Total |
| January 1, 2019 | 25,395,032 | | 19,953,631 | | 45,348,663 |
| 56.0 | % | | 44.0 | % | | 100.0 | % |
| April 29, 2019 - Registered Direct Offering | 32,047,718 | | 29,953,631 | | 62,001,349 |
| 51.7 | % | | 48.3 | % | | 100.0 | % |
| December 31, 2019 | 32,176,404 | | 29,953,631 | | 62,130,035 |
| 51.8 | % | | 48.2 | % | | 100.0 | % |
| December 31, 2020 | 32,411,207 | | 29,953,631 | | 62,364,838 |
| 52.0 | % | | 48.0 | % | | 100.0 | % |
| December 31, 2021 | 32,621,013 | | 29,953,631 | | 62,574,644 |
| 52.1 | % | | 47.9 | % | | 100.0 | % |
PBF ENERGY INC. AND PBF ENERGY COMPANY LLC
NOTES TO CONSOLIDATED FINANCIAL STATEMENTS
| | | | | | | | | | | | | | | | | |
| Units of PBFX Held by the Public | | Units of PBFX Held by PBF LLC (Including Subordinated Units) | | Total |
| | | | | |
| | | | | |
| December 31, 2021 | 32,621,013 | | 29,953,631 | | 62,574,644 |
| 52.1 | % | | 47.9 | % | | 100.0 | % |
| November 29, 2022 - Pre PBFX Merger Transaction | 32,832,175 | | | 29,953,631 | | | 62,785,806 | |
| 52.3 | % | | 47.7 | % | | 100.0 | % |
| November 30, 2022 - Post PBFX Merger Transaction | — | | 62,785,806 | | 62,785,806 |
| — | % | | 100.0 | % | | 100.0 | % |
Noncontrolling Interest in PBF Holding
In connection with the acquisition of the Chalmette refinery, PBF Holding records noncontrolling interest in two subsidiaries of Chalmette Refining. PBF Holding, through Chalmette Refining, owns an 80% ownership interest in both Collins Pipeline Company and T&M Terminal Company. For the year ended December 31, 20212023 the Company recorded a noncontrolling interest in the earnings of these subsidiaries of $2.3$0.9 million. For the year ended December 31, 20202022 the Company recorded a noncontrolling interest in the earningslosses of these subsidiaries of $0.3$1.4 million.
PBF ENERGY INC.
NOTES TO CONSOLIDATED FINANCIAL STATEMENTS
Changes in Equity and Noncontrolling Interests
The following tables summarize the changes in equity for the controlling and noncontrolling interests of PBF Energy for the years ended December 31, 2021, 20202023, 2022 and 2019:2021:
| PBF Energy (in millions) | PBF Energy
Inc. Equity | | Noncontrolling
Interest in PBF LLC | | Noncontrolling Interest in PBF Holding | | Noncontrolling
Interest in PBFX | | Total Equity |
| Balance at January 1, 2021 | $ | 1,642.8 | | | $ | 93.4 | | | $ | 10.6 | | | $ | 455.5 | | | $ | 2,202.3 | |
| (in millions) | |
| (in millions) | |
| (in millions) | | PBF Energy
Inc. Equity | | Noncontrolling
Interest in PBF LLC | | Noncontrolling Interest in PBF Holding | | | | Total Equity |
| Balance at January 1, 2023 | |
| Comprehensive income | Comprehensive income | 257.4 | | | 2.4 | | | 2.3 | | | 79.8 | | | 341.9 | |
| Dividends and distributions | Dividends and distributions | — | | | — | | | (0.7) | | | (40.0) | | | (40.7) | |
| | Effect of change in deferred tax assets and liabilities and tax receivable agreement obligation | |
| | Stock-based compensation | Stock-based compensation | 23.9 | | | — | | | — | | | 5.3 | | | 29.2 | |
| Stock-based compensation | |
| Stock-based compensation | |
| Transactions in connection with stock-based compensation plans | Transactions in connection with stock-based compensation plans | (1.1) | | | — | | | — | | | (1.6) | | | (2.7) | |
| Exchanges of PBF Energy Company LLC Series A Units for PBF Energy Class A common stock | 0.4 | | | (0.4) | | | — | | | — | | | — | |
| | Treasury stock purchases | |
| Treasury stock purchases | |
| Treasury stock purchases | |
| Other | Other | 2.8 | | | — | | | — | | | — | | | 2.8 | |
| Balance at December 31, 2021 | $ | 1,926.2 | | | $ | 95.4 | | | $ | 12.2 | | | $ | 499.0 | | | $ | 2,532.8 | |
| Balance at December 31, 2023 | |
| PBF Energy (in millions) | PBF Energy
Inc. Equity | | Noncontrolling
Interest in PBF LLC | | Noncontrolling Interest in PBF Holding | | Noncontrolling
Interest in PBFX | | Total Equity |
| Balance at January 1, 2020 | $ | 3,039.6 | | | $ | 113.2 | | | $ | 10.9 | | | $ | 421.8 | | | $ | 3,585.5 | |
| (in millions) | | (in millions) | PBF Energy
Inc. Equity | | Noncontrolling
Interest in PBF LLC | | Noncontrolling Interest in PBF Holding | | Noncontrolling
Interest in PBFX | | Total Equity |
| Balance at January 1, 2022 | |
| Comprehensive income (loss) | Comprehensive income (loss) | (1,393.2) | | | (17.1) | | | (0.3) | | | 76.5 | | | (1,334.1) | |
| Dividends and distributions | Dividends and distributions | (35.9) | | | (0.4) | | | — | | | (46.8) | | | (83.1) | |
| Effects of changes in PBFX ownership interest on deferred tax assets and liabilities | (2.1) | | | — | | | — | | | — | | | (2.1) | |
| | Effects of changes in PBF Logistics ownership interests on deferred tax assets and liabilities | |
| PBFX Merger Transaction | |
| Stock-based compensation | Stock-based compensation | 28.2 | | | — | | | — | | | 4.9 | | | 33.1 | |
| Transactions in connection with stock-based compensation plans | Transactions in connection with stock-based compensation plans | (1.0) | | | — | | | — | | | (0.9) | | | (1.9) | |
| Exchanges of PBF Energy Company LLC Series A Units for PBF Energy Class A common stock | Exchanges of PBF Energy Company LLC Series A Units for PBF Energy Class A common stock | 2.3 | | | (2.3) | | | — | | | — | | | — | |
| Treasury stock purchases | |
| Other | Other | 4.9 | | | — | | | — | | | — | | | 4.9 | |
| Balance at December 31, 2020 | $ | 1,642.8 | | | $ | 93.4 | | | $ | 10.6 | | | $ | 455.5 | | | $ | 2,202.3 | |
| Balance at December 31, 2022 | |
PBF ENERGY INC. AND PBF ENERGY COMPANY LLC
NOTES TO CONSOLIDATED FINANCIAL STATEMENTS
| | | | | | | | | | | | | | | | | | | | | | | | | | | | | |
PBF Energy (in millions) | PBF Energy
Inc. Equity | | Noncontrolling
Interest in PBF LLC | | Noncontrolling Interest in PBF Holding | | Noncontrolling
Interest in PBFX | | Total Equity |
| Balance at January 1, 2019 | $ | 2,676.5 | | | $ | 112.2 | | | $ | 10.9 | | | $ | 448.9 | | | $ | 3,248.5 | |
| Comprehensive income | 333.5 | | | 4.4 | | | — | | | 51.5 | | | 389.4 | |
| Dividends and distributions | (143.8) | | | (3.2) | | | — | | | (64.1) | | | (211.1) | |
| Effects of changes in PBFX ownership interest on deferred tax assets and liabilities | (1.3) | | | — | | | — | | | — | | | (1.3) | |
| Issuance of additional PBFX common units | 152.0 | | | — | | | — | | | (19.5) | | | 132.5 | |
| Stock-based compensation | 27.2 | | | — | | | — | | | 6.8 | | | 34.0 | |
| | | | | | | | | |
| | | | | | | | | |
| | | | | | | | | |
| | | | | | | | | |
| Transactions in connection with stock-based compensation plans | (4.3) | | | (0.2) | | | — | | | — | | | (4.5) | |
| Other | (0.2) | | | — | | | — | | | (1.8) | | | (2.0) | |
| Balance at December 31, 2019 | $ | 3,039.6 | | | $ | 113.2 | | | $ | 10.9 | | | $ | 421.8 | | | $ | 3,585.5 | |
The following tables summarize the changes in equity for the controlling and noncontrolling interests of PBF LLC for the years ended December 31, 2021, 2020, and 2019 respectively:
| | | | | | | | | | | | | | | | | | | | | | | |
PBF LLC (in millions) | PBF Energy Company LLC Equity | | Noncontrolling Interest in PBF Holding | | Noncontrolling
Interest in PBFX | | Total Equity |
| Balance at January 1, 2021 | $ | 1,374.0 | | | $ | 10.6 | | | $ | 455.5 | | | $ | 1,840.1 | |
| Comprehensive income | 326.0 | | | 2.3 | | | 79.8 | | | 408.1 | |
| Dividends and distributions | — | | | (0.7) | | | (40.0) | | | (40.7) | |
| | | | | | | |
| | | | | | | |
| Stock-based compensation | 23.9 | | | — | | | 5.3 | | | 29.2 | |
| Transactions in connection with stock-based compensation plans | (1.0) | | | — | | | (1.6) | | | (2.6) | |
| | | | | | | |
| | | | | | | |
| | | | | | | |
| Balance at December 31, 2021 | $ | 1,722.9 | | | $ | 12.2 | | | $ | 499.0 | | | $ | 2,234.1 | |
| | | | | | | | | | | | | | | | | | | | | | | |
PBF LLC (in millions) | PBF Energy Company LLC Equity | | Noncontrolling Interest in PBF Holding | | Noncontrolling
Interest in PBFX | | Total Equity |
| Balance at January 1, 2020 | $ | 3,176.4 | | | $ | 10.9 | | | $ | 421.8 | | | $ | 3,609.1 | |
| Comprehensive income (loss) | (1,792.9) | | | (0.3) | | | 76.5 | | | (1,716.7) | |
| Dividends and distributions | (36.3) | | | — | | | (46.8) | | | (83.1) | |
| | | | | | | |
| Stock-based compensation | 28.2 | | | — | | | 4.9 | | | 33.1 | |
| Transactions in connection with stock-based compensation plans | (1.3) | | | — | | | — | | | (1.3) | |
| | | | | | | |
| Other | (0.1) | | | — | | | (0.9) | | | (1.0) | |
| Balance at December 31, 2020 | $ | 1,374.0 | | | $ | 10.6 | | | $ | 455.5 | | | $ | 1,840.1 | |
PBF ENERGY INC. AND PBF ENERGY COMPANY LLC
NOTES TO CONSOLIDATED FINANCIAL STATEMENTS
| PBF LLC (in millions) | PBF Energy Company LLC Equity | | Noncontrolling Interest in PBF Holding | | Noncontrolling
Interest in PBFX | | Total Equity |
| Balance at January 1, 2019 | $ | 2,759.6 | | | $ | 10.9 | | | $ | 448.9 | | | $ | 3,219.4 | |
| (in millions) | | (in millions) | PBF Energy
Inc. Equity | | Noncontrolling
Interest in PBF LLC | | Noncontrolling Interest in PBF Holding | | Noncontrolling
Interest in PBFX | | Total Equity |
| Balance at January 1, 2021 | |
| Comprehensive income | Comprehensive income | 442.7 | | | — | | | 51.5 | | | 494.2 | |
| Dividends and distributions | Dividends and distributions | (200.4) | | | — | | | (64.1) | | | (264.5) | |
| Issuance of additional PBFX common units | 152.0 | | | — | | | (19.5) | | | 132.5 | |
| | | Stock-based compensation | Stock-based compensation | 27.2 | | | — | | | 6.8 | | | 34.0 | |
| | Stock-based compensation | |
| | Stock-based compensation | |
| | Transactions in connection with stock-based compensation plans | Transactions in connection with stock-based compensation plans | (4.7) | | | — | | | — | | | (4.7) | |
| | | Transactions in connection with stock-based compensation plans | |
| | Transactions in connection with stock-based compensation plans | |
| Exchanges of PBF Energy Company LLC Series A Units for PBF Energy Class A common stock | |
| Other | Other | — | | | — | | | (1.8) | | | (1.8) | |
| Balance at December 31, 2019 | $ | 3,176.4 | | | $ | 10.9 | | | $ | 421.8 | | | $ | 3,609.1 | |
| Balance at December 31, 2021 | |
Comprehensive Income (Loss)
Comprehensive income (loss) includes net income (loss) and other comprehensive income (loss) arising from activity related to the Company’s defined employee benefit plan and unrealized gain (loss) on available-for-sale securities. The following table summarizes the allocation of total comprehensive income of PBF Energy between the controlling and noncontrolling interests for the year ended December 31, 2021:2023:
| | | | | | | | | | | | | | | | | | | | |
PBF Energy (in millions) | | Attributable to
PBF Energy Inc. stockholders | | Noncontrolling
Interests | | Total |
| Net income | | $ | 231.0 | | | $ | 84.5 | | | $ | 315.5 | |
| Other comprehensive income (loss): | | | | | | |
| Unrealized loss on available for sale securities | | (0.7) | | | — | | | (0.7) | |
| Amortization of defined benefit plans unrecognized net gain | | 27.1 | | | — | | | 27.1 | |
| Total other comprehensive income | | 26.4 | | | — | | | 26.4 | |
| Total comprehensive income | | $ | 257.4 | | | $ | 84.5 | | | $ | 341.9 | |
| | | | | | | | | | | | | | | | | | | | |
| (in millions) | | Attributable to
PBF Energy Inc. stockholders | | Noncontrolling
Interests | | Total |
| Net income | | $ | 2,140.5 | | | $ | 21.5 | | | $ | 2,162.0 | |
| Other comprehensive income (loss): | | | | | | |
| Unrealized loss on available for sale securities | | (0.4) | | | — | | | (0.4) | |
| Amortization of defined benefit plans unrecognized net loss | | (10.4) | | | — | | | (10.4) | |
| Total other comprehensive income (loss) | | (10.8) | | | — | | | (10.8) | |
| Total comprehensive income | | $ | 2,129.7 | | | $ | 21.5 | | | $ | 2,151.2 | |
The following table summarizes the allocation of total comprehensive income (loss) of PBF Energy between the controlling and noncontrolling interests for the year ended December 31, 2020:2022:
| | | | | | | | | | | | | | | | | | | | |
PBF Energy (in millions) | | Attributable to
PBF Energy Inc. stockholders | | Noncontrolling
Interest | | Total |
| Net income (loss) | | $ | (1,392.4) | | | $ | 59.1 | | | $ | (1,333.3) | |
| Other comprehensive income (loss): | | | | | | |
| Unrealized loss on available for sale securities | | (0.1) | | | — | | | (0.1) | |
| Amortization of defined benefit plans unrecognized net loss | | (0.7) | | | — | | | (0.7) | |
| Total other comprehensive income (loss) | | (0.8) | | | — | | | (0.8) | |
| Total comprehensive income (loss) | | $ | (1,393.2) | | | $ | 59.1 | | | $ | (1,334.1) | |
| | | | | | | | | | | | | | | | | | | | |
| (in millions) | | Attributable to
PBF Energy Inc. stockholders | | Noncontrolling
Interest | | Total |
| Net income | | $ | 2,876.8 | | | $ | 96.0 | | | $ | 2,972.8 | |
| Other comprehensive income (loss): | | | | | | |
| Unrealized loss on available for sale securities | | (2.5) | | | — | | | (2.5) | |
| Amortization of defined benefit plans unrecognized net loss | | (16.3) | | | — | | | (16.3) | |
| Total other comprehensive income (loss) | | (18.8) | | | — | | | (18.8) | |
| Total comprehensive income | | $ | 2,858.0 | | | $ | 96.0 | | | $ | 2,954.0 | |
PBF ENERGY INC. AND PBF ENERGY COMPANY LLC
NOTES TO CONSOLIDATED FINANCIAL STATEMENTS
The following table summarizes the allocation of total comprehensive income of PBF Energy between the controlling and noncontrolling interests for the year ended December 31, 2019:
| | | | | | | | | | | | | | | | | | | | |
PBF Energy (in millions) | | Attributable to
PBF Energy Inc. stockholders | | Noncontrolling
Interest | | Total |
| Net income | | $ | 319.4 | | | $ | 55.8 | | | $ | 375.2 | |
| Other comprehensive income: | | | | | | |
| Unrealized gain on available for sale securities | | 0.4 | | | — | | | 0.4 | |
| Amortization of defined benefit plans unrecognized net gain | | 13.7 | | | 0.1 | | | 13.8 | |
| Total other comprehensive income | | 14.1 | | | 0.1 | | | 14.2 | |
| Total comprehensive income | | $ | 333.5 | | | $ | 55.9 | | | $ | 389.4 | |
The following table summarizes the allocation of total comprehensive income of PBF LLC between the controlling and noncontrolling interests for the year ended December 31, 2021:
| | | | | | | | | | | | | | | | | | | | |
PBF LLC (in millions) | | Attributable to
PBF LLC | | Noncontrolling
Interests | | Total |
| Net income | | $ | 299.6 | | | $ | 82.1 | | | $ | 381.7 | |
| Other comprehensive income (loss): | | | | | | |
| Unrealized loss on available for sale securities | | (0.7) | | | — | | | (0.7) | |
| Amortization of defined benefit plans unrecognized net gain | | 27.1 | | | — | | | 27.1 | |
| Total other comprehensive income | | 26.4 | | | — | | | 26.4 | |
| Total comprehensive income | | $ | 326.0 | | | $ | 82.1 | | | $ | 408.1 | |
The following table summarizes the allocation of total comprehensive income (loss) of PBF LLC between the controlling and noncontrolling interests for the year ended December 31, 2020:
| | | | | | | | | | | | | | | | | | | | |
PBF LLC (in millions) | | Attributable to
PBF LLC | | Noncontrolling
Interest | | Total |
| Net income (loss) | | $ | (1,796.5) | | | $ | 76.2 | | | $ | (1,720.3) | |
| Other comprehensive income (loss): | | | | | | |
| Unrealized loss on available for sale securities | | (0.1) | | | — | | | (0.1) | |
| Amortization of defined benefit plans unrecognized net gain | | 3.7 | | | — | | | 3.7 | |
| Total other comprehensive income | | 3.6 | | | — | | | 3.6 | |
| Total comprehensive income (loss) | | $ | (1,792.9) | | | $ | 76.2 | | | $ | (1,716.7) | |
PBF ENERGY INC. AND PBF ENERGY COMPANY LLC
NOTES TO CONSOLIDATED FINANCIAL STATEMENTS
The following table summarizes the allocation of total comprehensive income of PBF LLC between the controlling and noncontrolling interests for the year ended December 31, 2019:
| | | | | | | | | | | | | | | | | | | | |
PBF LLC (in millions) | | Attributable to
PBF LLC | | Noncontrolling
Interest | | Total |
| Net income | | $ | 428.5 | | | $ | 51.5 | | | $ | 480.0 | |
| Other comprehensive income: | | | | | | |
| Unrealized gain on available for sale securities | | 0.4 | | | — | | | 0.4 | |
| Amortization of defined benefit plans unrecognized net gain | | 13.8 | | | — | | | 13.8 | |
| Total other comprehensive income | | 14.2 | | | — | | | 14.2 | |
| Total comprehensive income | | $ | 442.7 | | | $ | 51.5 | | | $ | 494.2 | |
| | | | | | | | | | | | | | | | | | | | |
| (in millions) | | Attributable to
PBF Energy Inc. stockholders | | Noncontrolling
Interest | | Total |
| Net income | | $ | 231.0 | | | $ | 84.5 | | | $ | 315.5 | |
| Other comprehensive income (loss): | | | | | | |
| Unrealized loss on available for sale securities | | (0.7) | | | — | | | (0.7) | |
| Amortization of defined benefit plans unrecognized net gain | | 27.1 | | | — | | | 27.1 | |
| Total other comprehensive income | | 26.4 | | | — | | | 26.4 | |
| Total comprehensive income | | $ | 257.4 | | | $ | 84.5 | | | $ | 341.9 | |
18.15. STOCK-BASED COMPENSATION
The Company grants awards of PBF Energy Class A common stock and PBFX phantom units under its equity incentive plans which authorize the granting of various stock and stock-related awards to directors, employees, prospective employees and non-employees. Awards include non-qualified or incentive stock options, stock appreciation rights, stock awards (including restricted stock) and phantom unit awards, cash awards and performance awards that vest over a period determined by the plans.
Stock-based compensation expense included in general and administrative expenses consisted of the following:
| | | | | | | | | | | | | | | | | | | | |
| | | Years Ended December 31, |
| (in millions) | | 2021 | | 2020 | | 2019 |
| | | | | | |
| | | | | | |
| PBF Energy options | | $ | 17.3 | | | $ | 16.1 | | | $ | 15.8 | |
| PBF Energy restricted shares | | 2.8 | | | 5.3 | | | 6.5 | |
| PBF Energy performance awards | | 10.2 | | | 7.9 | | | 8.2 | |
| PBFX phantom units | | 5.3 | | | 4.9 | | | 6.8 | |
| | $ | 35.6 | | | $ | 34.2 | | | $ | 37.3 | |
PBF ENERGY INC. AND PBF ENERGY COMPANY LLC
NOTES TO CONSOLIDATED FINANCIAL STATEMENTS
| | | | | | | | | | | | | | | | | | | | |
| | | Years Ended December 31, |
| (in millions) | | 2023 | | 2022 | | 2021 |
| | | | | | |
| | | | | | |
| PBF Energy options | | $ | 11.9 | | | $ | 19.1 | | | $ | 17.3 | |
| PBF Energy restricted shares | | 17.9 | | | 11.6 | | | 2.8 | |
| PBF Energy performance awards | | 21.7 | | | 13.4 | | | 10.2 | |
| PBFX phantom units | | — | | | 10.2 | | | 5.3 | |
| | $ | 51.5 | | | $ | 54.3 | | | $ | 35.6 | |
PBF Energy options
PBF Energy grants stock options which represent the right to purchase share of the Company’s common stock at its fair market value, which is the closing price of PBF Energy’s common stock on the date of grant. Stock options have a maximum term of ten years from the date they are granted, and vest over a requisite service period of three years, or four years for grants prior to November 2020, subject to acceleration in certain circumstances. The Company did not grant stock options during the year ended December 31, 2023. The Company uses the Black-Scholes option-pricing model to estimate the fair value of stock options granted, which requires the input of subjective assumptions.
The Black-Scholes option-pricing model values used to value stock option awards granted were determined based on the following weighted average assumptions:
| | December 31, 2021 | | December 31, 2020 | | December 31, 2019 |
| | | | December 31, 2022 | |
| | | | December 31, 2022 | |
| | | | December 31, 2022 | | | December 31, 2021 |
| Expected life (in years) | Expected life (in years) | | 6.00 | | 6.08 | | 6.25 | Expected life (in years) | | | | 6.00 | | 6.00 |
| Expected volatility | Expected volatility | | 83.8 | % | | 69.1 | % | | 38.6 | % | Expected volatility | | | | 87.6 | % | | 83.8 | % |
| Dividend yield | Dividend yield | | 0.00 | % | | 1.41 | % | | 3.54 | % | Dividend yield | | | | 0.00 | % | | 0.00 | % |
| Risk-free rate of return | Risk-free rate of return | | 1.37 | % | | 0.81 | % | | 2.16 | % | Risk-free rate of return | | | | 3.24 | % | | 1.37 | % |
| Exercise price | Exercise price | | $ | 13.91 | | | $ | 13.58 | | | $ | 34.11 | |
| Weighted average fair value per option granted | Weighted average fair value per option granted | | $ | 9.84 | | | $ | 5.49 | | | $ | 9.43 | |
PBF ENERGY INC.
NOTES TO CONSOLIDATED FINANCIAL STATEMENTS
The following table summarizes activity for PBF Energy options for 2021:2023:
| | | | | | | | | | | | | | | | | | | | |
| | Number of
PBF Energy
Class A
Common
Stock Options | | Weighted
Average
Exercise Price | | Weighted
Average
Remaining
Contractual
Life
(in years) |
| Stock-based awards, outstanding at January 1, 2021 | | 13,790,777 | | | $ | 25.69 | | | 7.12 |
| Granted | | 1,700,621 | | | 13.91 | | | 10.00 |
| Exercised | | (52,400) | | | 6.72 | | | — | |
| Forfeited | | (389,239) | | | 23.70 | | | — | |
| Outstanding at December 31, 2021 | | 15,049,759 | | | $ | 24.48 | | | 6.51 |
| Exercisable and vested at December 31, 2021 | | 9,397,483 | | | $ | 27.72 | | | 5.26 |
| Expected to vest at December 31, 2021 | | 15,049,759 | | | $ | 24.48 | | | 6.51 |
| | | | | | | | | | | | | | | | | | | | |
| | Number of
PBF Energy
Class A
Common
Stock Options | | Weighted
Average
Exercise Price | | Weighted
Average
Remaining
Contractual
Life
(in years) |
| Stock-based awards, outstanding at January 1, 2023 | | 10,652,274 | | | $ | 24.50 | | | 5.96 |
| | | | | | |
| Exercised | | (2,901,250) | | | 24.65 | | | — | |
| Forfeited | | (297,570) | | | 36.18 | | | — | |
| Outstanding at December 31, 2023 | | 7,453,454 | | | $ | 23.98 | | | 5.26 |
| Exercisable and vested at December 31, 2023 | | 6,653,383 | | | $ | 24.61 | | | 5.02 |
| Total expected to vest as of December 31, 2023 | | 7,453,454 | | | $ | 23.98 | | | 5.26 |
At December 31, 2021,2023, the total intrinsic value of stock options outstanding and exercisable were $15.6$148.9 million and $5.0$128.8 million, respectively. The total intrinsic value of stock options exercised during the years ended December 31, 2023, 2022 and 2021 2020 and 2019 was $0.4$66.1 million, $0.0$63.1 million and $0.3$0.4 million, respectively.
Unrecognized compensation expense related to PBF Energy options at December 31, 20212023 was $36.7$5.1 million, which will be recognized from 20222024 through 2024.2025.
PBF ENERGY INC. AND PBF ENERGY COMPANY LLC
NOTES TO CONSOLIDATED FINANCIAL STATEMENTS
Restricted Stock Awards
The Company grants restricted stock to employees and non-employee directors. In general, restricted stock granted to our employees vest over a requisite services period of fourthree years, subject to acceleration in certain circumstances. Restricted stock recipients who received grants subsequent to May 2017 have voting rights; however, dividends are accrued and will be paid upon vesting. Restricted stock units granted to non-employee directors are considered to vest immediately at the time of the grant for accounting purposes, as they are non-forfeitable, but are issued in equal annual installments on each of the first three anniversaries of the grant date. The non-vested shares are not transferable and are held by our transfer agent. The fair values of restricted stock are equal to the market price of our common stock on the grant date.
The following table summarizes activity for PBF Energy restricted stock:
| | Number of
PBF Energy
Restricted Class A
Common Stock | | Weighted Average
Grant Date
Fair Value |
| Nonvested at January 1, 2021 | | 303,555 | | | $ | 22.32 | |
| | Number of
PBF Energy
Restricted Class A
Common Stock | | | | Number of
PBF Energy
Restricted Class A
Common Stock | | Weighted Average
Grant Date
Fair Value |
| Nonvested at January 1, 2023 | |
| Granted | Granted | | 81,840 | | | 16.13 | |
| Vested | Vested | | (229,462) | | | 24.34 | |
| Forfeited | Forfeited | | (246) | | | 24.18 | |
| Nonvested at December 31, 2021 | | 155,687 | | | $ | 16.09 | |
| Nonvested at December 31, 2023 | |
Unrecognized compensation expense related to PBF Energy Restricted Class A common stock at December 31, 20212023 was $0.1$22.8 million, which will be recognized from 20222024 through 2023.2026.
PBF ENERGY INC.
NOTES TO CONSOLIDATED FINANCIAL STATEMENTS
The following table reflects activity related to our restricted stock:
| | December 31, 2021 | | December 31, 2020 | | December 31, 2019 |
| | December 31, 2023 | | | | December 31, 2023 | | December 31, 2022 | | December 31, 2021 |
| Weighted-average grant-date fair value per share of restricted stock granted | Weighted-average grant-date fair value per share of restricted stock granted | | $ | 16.13 | | | $ | 9.82 | | | $ | 28.20 | |
| Fair value of restricted stock vested (in millions) | Fair value of restricted stock vested (in millions) | | $ | 3.1 | | | $ | 4.2 | | | $ | 11.6 | |
Performance Awards
The Company grants performance share awards, which are paid in stock, and performance share unit awards, which are paid in cash, (collectively, the “performance awards”) to certain key employees. Performance awards granted to employees prior to November 1, 2020 are based on a three-year performance cycle (the "performance cycle") with 4four measurement periods and performance awards granted to employees after November 1, 2020 are based on a three-year performance cycle having a single measurement period. The performance awards will vest on the last day of the performance cycle, subject to forfeiture or acceleration under certain circumstances set forth in the award agreement. The number of performance awards that will ultimately vest is based on the Company’s total shareholder return over the performance cycle. The number of shares ultimately issued, or cash paid under these awards can range from zero to 200% of target award amounts.
Performance Share Unit Awards
The performance share unit awards are accounted for as equity awards, for which the fair value was determined on the grant date by application of a Monte Carlo valuation model.
PBF ENERGY INC. AND PBF ENERGY COMPANY LLC
NOTES TO CONSOLIDATED FINANCIAL STATEMENTS
The grant date fair value was calculated using a Monte Carlo valuation model with the following assumptions:
| | December 31, 2021 | | December 31, 2020 | | December 31, 2019 |
| | December 31, 2023 | | | | December 31, 2023 | | December 31, 2022 | | December 31, 2021 |
| Expected life (in years) | Expected life (in years) | | 3.12 | | 2.89 - 3.14 | | 2.17 - 2.88 | Expected life (in years) | | 2.86 - 3.18 | | 3.08 | | 3.12 |
| Expected volatility | Expected volatility | | 83.78 | % | | 39.88% - 82.63% | | 37.19% - 41.70% | Expected volatility | | 56.68% - 59.98% | | 65.16% | | 83.78% |
| Dividend yield | Dividend yield | | 0.00 | % | | 0.00% - 4.28% | | 3.40% - 3.67% | Dividend yield | | 1.73% - 1.80% | | 2.18% | | 0.00% |
| Risk-free rate of return | Risk-free rate of return | | 0.87 | % | | 0.26% - 1.34% | | 1.66% - 2.51% | Risk-free rate of return | | 4.40% - 4.75% | | 3.90% | | 0.87% |
| Weighted average grant-date fair value per PSU | Weighted average grant-date fair value per PSU | | $ | 18.73 | | | $ | 10.77 | | | $ | 27.99 | |
The risk-free interest rate for the remaining performance period as of the grant date is based on a linear interpolation of published yields of traded U.S. Treasury Interest-Only STRIP Bonds. The dividend yield assumption is based on the annualized most recent quarterly dividend divided by the stock price on the grant date. The assumption for the expected volatility of the Company’s stock price reflects the average of PBF Energy’s common stock historical and implied volatility.
The following table summarizes activity for PBF Energy performance share awards:
| | Number of
PBF Energy
Performance Share Units (“PSU”) | | Weighted Average
Grant Date
Fair Value |
| Nonvested at January 1, 2021 | | 623,160 | | | $ | 15.62 | |
| | Number of
PBF Energy
Performance Share Units (“PSU”) | | | | Number of
PBF Energy
Performance Share Units (“PSU”) | | Weighted Average
Grant Date
Fair Value |
| Nonvested at January 1, 2023 | |
| Granted | Granted | | 301,965 | | | 18.73 | |
| Vested | Vested | | (179,600) | | | 27.85 | |
| | Nonvested at December 31, 2021 | | 745,525 | | | $ | 13.93 | |
| Forfeited | |
| Nonvested at December 31, 2023 | |
PBF ENERGY INC.
NOTES TO CONSOLIDATED FINANCIAL STATEMENTS
In 20212023, 2022 and 2020,2021, PSU’s with a fair value of $1.8$30.9 million, $2.0 million and $0.8$1.8 million, respectively, were vested.
As of December 31, 2021,2023, unrecognized compensation cost related to performance share unit awards was $8.2$17.4 million, which is expected to be recognized over a weighted average period of 2.632.48 years.
Performance Unit awards
The performance unit awards are dollar denominated with a target value of $1.00, with actual payout of up to $2.00 per unit (or 200 percent of target). The performance unit awards are settled in cash based on the payout amount determined at the end of the performance cycle. The Company accounts for the performance unit awards as liability awards which the Company recorded at fair market value on the date of grant. Subsequently, the performance unit awards will be marked-to-market at the end of each fiscal quarter by application of a Monte Carlo simulation model.
The following table summarizes activity for PBF Energy performance unit awards:
| | | | | | | | |
| | Number of
PBF Energy
Performance Units |
Nonvested at January 1, 20212023 | | 16,071,74531,454,950 | |
| Granted | | 11,782,92618,649,445 | |
| Vested | | (7,676,658)(6,036,460) | |
| Forfeited | | (510,774) | |
Nonvested at December 31, 20212023 | | 20,178,01343,557,161 | |
In 20212023, 2022 and 2020,2021, Performance Units with a fair value of $5.2$12.1 million, $1.5 million and $3.2$5.2 million, respectively, were vested.
PBF ENERGY INC. AND PBF ENERGY COMPANY LLC
NOTES TO CONSOLIDATED FINANCIAL STATEMENTS
As of December 31, 2021,2023, unrecognized compensation cost related to performance unit awards was $9.2$24.4 million, which is expected to be recognized over a weighted average period of 2.542.20 years.
PBFX Phantom Units
PBF GP’s Board of Directors adoptedIn the years ended December 31, 2022 and 2021, PBFX issued phantom unit awards under the PBF Logistics LP 2014 Long-Term Incentive Plan (the “PBFX LTIP”) in connection with the completion of the PBFX Offering. The PBFX LTIP is for the benefit of employees, consultants, service providers and non-employee directors of the general partner and its affiliates.
In the years ended December 31, 2021, 2020 and 2019, PBFX issued phantom unit awards under the PBFX LTIP to certain directors, officers and employees of our general partner or its affiliates as compensation. The fair value of each phantom unit on the grant date iswas equal to the market price of PBFX’s common unit on that date. The estimated fair value of PBFX’s phantom units iswas amortized using the straight-line method over the vesting period of four years, subject to acceleration if certain conditions arewere met. Total unrecognized compensation cost related to PBFX’s nonvested phantom units totaled $4.7 million as of December 31, 2021, which will be recognized from 2022 through 2025. The fair value of nonvested phantom units outstanding as of December 31, 2021 totaled $11.3 million.
A summary of PBFX’s unit award activity for the years ended December 31, 2021, 2020 and 2019 is set forth below:
| | | | | | | | | | | | | | |
| | Number of Phantom Units | | Weighted Average
Grant Date
Fair Value |
| | | | |
| | | | |
| | | | |
| | | | |
| | | | |
| | | | |
| | | | |
| | | | |
| Nonvested at January 1, 2021 | | 769,688 | | | $ | 15.29 | |
| Granted | | 344,546 | | | 14.50 | |
| Vested | | (308,427) | | | 17.07 | |
| Forfeited | | (15,125) | | | 12.81 | |
| Nonvested at December 31, 2021 | | 790,682 | | | $ | 14.30 | |
The following table reflects activity related to our phantom units:
| | | | | | | | | | | | | | | | | | | | |
| | December 31, 2021 | | December 31, 2020 | | December 31, 2019 |
| Weighted-average grant-date fair value per phantom unit granted | | $ | 14.50 | | | $ | 8.14 | | | $ | 21.39 | |
| Fair value of phantom unit vested (in millions) | | $ | 4.6 | | | $ | 3.2 | | | $ | 6.2 | |
The PBFX LTIP provides for the issuance of distribution equivalent rights (“DERs”) inIn connection with phantom unit awards. A DER entitles the participant, uponPBFX Merger Transaction, the Company accelerated the vesting of the related830,597 outstanding phantom units, towhich were settled by making a mandatorytotal cash payments equal topayment of $16.9 million, which was calculated using the productprior day’s PBFX closing price of $20.39. In addition, the number of vested phantom unit awards and the cash distribution per common unit paid by PBFX to its common unitholders. Cash payments made in connection with DERs are charged to partners’ equity, accrued and paid upon vesting.Company recognized all remaining compensation costs.
PBF ENERGY INC. AND PBF ENERGY COMPANY LLC
NOTES TO CONSOLIDATED FINANCIAL STATEMENTS
19.16. EMPLOYEE BENEFIT PLANS
Defined Contribution Plan
The Company’s defined contribution plan covers all employees. Employees are eligible to participate as of the first day of the month following 30 days of service. Participants can make basic contributions up to 50 percent of their annual salary subject to IRS limits. The Company matches participants’ contributions at the rate of 200 percent of the first 3 percent of each participant’s total basic contribution based on the participant’s total annual salary. The Company’s contribution to the qualified defined contribution plans was $27.8$37.5 million, $32.7$33.4 million and $27.5$27.8 million for the years ended December 31, 2021, 20202023, 2022 and 2019,2021, respectively.
Defined Benefit and Post-Retirement Medical Plans
The Company sponsors a noncontributory defined benefit pension plan (the “Qualified Plan”) with a policy to fund pension liabilities in accordance with the limits imposed by the Employee Retirement Income Security Act of 1974 and Federal income tax laws. In addition, the Company sponsors a supplemental pension plan covering certain employees, which provides incremental payments that would have been payable from the Company’s principal pension plan, were it not for limitations imposed by income tax regulations (the “Supplemental Plan”). The funded status is measured as the difference between plan assets at fair value and the projected benefit obligation which is to be recognized in the Consolidated Balance Sheets. The plan assets and benefit obligations are measured as of the Consolidated Balance Sheet date.
The non-union Delaware City employees and all Paulsboro, Toledo, Chalmette, Torrance and Martinez employees became eligible to participate in the Company’s defined benefit plans as of the respective acquisition dates. The union Delaware City employees became eligible to participate in the Company’s defined benefit plans upon commencement of normal operations. The Company did not assume any of the employees’ pension liability accrued prior to the respective acquisitions.
The Company formed the Post-Retirement Medical Plan on December 31, 2010 to provide health care coverage continuation from date of retirement to age 65 for qualifying employees associated with the Paulsboro acquisition. The Company credited the qualifying employees with their prior service under Valero Energy Corporation which resulted in the recognition of a liability for the projected benefit obligation. The Post-Retirement Medical Plan includes all corporate and refinery employees.
PBF ENERGY INC. AND PBF ENERGY COMPANY LLC
NOTES TO CONSOLIDATED FINANCIAL STATEMENTS
The changes in the benefit obligation, the changes in fair value of plan assets, and the funded status of the Company’s Pension and Post-Retirement Medical Plans as of and for the years ended December 31, 20212023 and 20202022 were as follows:
| | Pension Plans | | Post-Retirement
Medical Plan |
| | Pension Plans | | | | Pension Plans | | Post-Retirement
Medical Plan |
| (in millions) | (in millions) | | 2021 | | 2020 | | 2021 | | 2020 | (in millions) | | 2023 | | 2022 | | 2023 | | 2022 |
| Change in benefit obligation: | Change in benefit obligation: | | | | | | | | |
| Benefit obligation at beginning of year | |
| Benefit obligation at beginning of year | |
| Benefit obligation at beginning of year | Benefit obligation at beginning of year | | $ | 329.3 | | | $ | 271.2 | | | $ | 22.0 | | | $ | 17.5 | |
| Service cost | Service cost | | 57.5 | | | 59.0 | | | 1.1 | | | 1.0 | |
| Interest cost | Interest cost | | 5.3 | | | 6.9 | | | 0.3 | | | 0.4 | |
| Plan amendments | Plan amendments | | — | | | — | | | — | | | 1.8 | |
| | Benefit payments | Benefit payments | | (31.2) | | | (18.0) | | | (1.2) | | | (0.6) | |
| Actuarial (gain) loss | | (7.6) | | | 10.2 | | | (4.0) | | | 1.9 | |
| Benefit payments | |
| Benefit payments | |
| Actuarial loss (gain) | |
| Projected benefit obligation at end of year | Projected benefit obligation at end of year | | $ | 353.3 | | | $ | 329.3 | | | $ | 18.2 | | | $ | 22.0 | |
| Change in plan assets: | Change in plan assets: | | | | | | | | |
| Fair value of plan assets at beginning of year | |
| Fair value of plan assets at beginning of year | |
| Fair value of plan assets at beginning of year | Fair value of plan assets at beginning of year | | $ | 255.8 | | | $ | 197.4 | | | $ | — | | | $ | — | |
| Actual return on plan assets | Actual return on plan assets | | 27.7 | | | 28.6 | | | — | | | — | |
| Benefits paid | Benefits paid | | (31.2) | | | (18.0) | | | (1.2) | | | (0.6) | |
| | Employer contributions | Employer contributions | | 54.0 | | | 47.8 | | | 1.2 | | | 0.6 | |
| Employer contributions | |
| Employer contributions | |
| Fair value of plan assets at end of year | Fair value of plan assets at end of year | | $ | 306.3 | | | $ | 255.8 | | | $ | — | | | $ | — | |
| Reconciliation of funded status: | Reconciliation of funded status: | | | | | | | | |
| Fair value of plan assets at end of year | Fair value of plan assets at end of year | | $ | 306.3 | | | $ | 255.8 | | | $ | — | | | $ | — | |
| Fair value of plan assets at end of year | |
| Fair value of plan assets at end of year | |
| Less benefit obligations at end of year | Less benefit obligations at end of year | | 353.3 | | | 329.3 | | | 18.2 | | | 22.0 | |
| Funded status at end of year | Funded status at end of year | | $ | (47.0) | | | $ | (73.5) | | | $ | (18.2) | | | $ | (22.0) | |
The accumulated benefit obligation for the defined benefit plans approximated $298.9$391.1 million and $281.5$321.0 million at December 31, 20212023 and 2020,2022, respectively.
Benefit payments, which reflect expected future services that the Company expects to pay are as follows for the years ended December 31:
| | (in millions) | (in millions) | | Pension Benefits | | Post-Retirement
Medical Plan | (in millions) | | Pension Benefits | | Post-Retirement
Medical Plan |
| 2022 | | $ | 24.8 | | | $ | 1.8 | |
| 2023 | | 18.1 | | | 1.7 | |
| 2024 | 2024 | | 20.1 | | | 1.6 | |
| 2025 | 2025 | | 23.7 | | | 1.5 | |
| 2026 | 2026 | | 27.1 | | | 1.5 | |
| Years 2027-2031 | | 168.6 | | | 6.8 | |
| 2027 | |
| 2028 | |
| Years 2029-2033 | |
The Company’s funding policy for its defined benefit plans is to contribute amounts sufficient to meet legal funding requirements, plus any additional amounts that may be appropriate considering the funded status of the plans, tax consequences, the cash flow generated by the Company and other factors. The Company plans to contribute approximately $35.6$34.4 million to the Company’s Pension Plans during 2022.2024.
PBF ENERGY INC. AND PBF ENERGY COMPANY LLC
NOTES TO CONSOLIDATED FINANCIAL STATEMENTS
The components of net periodic benefit cost were as follows for the years ended December 31, 2021, 20202023, 2022 and 2019:2021:
| | Pension Benefits | | Post-Retirement
Medical Plan |
| | Pension Benefits | | | | Pension Benefits | | Post-Retirement
Medical Plan |
| (in millions) | (in millions) | | 2021 | | 2020 | | 2019 | | 2021 | | 2020 | | 2019 | (in millions) | | 2023 | | 2022 | | 2021 | | 2023 | | 2022 | | 2021 |
| Components of net periodic benefit cost: | Components of net periodic benefit cost: | | | | | | | | | | | | |
| Service cost | |
| Service cost | |
| Service cost | Service cost | | $ | 57.5 | | | $ | 59.0 | | | $ | 43.6 | | | $ | 1.1 | | | $ | 1.0 | | | $ | 1.0 | |
| Interest cost | Interest cost | | 5.3 | | | 6.9 | | | 8.3 | | | 0.3 | | | 0.4 | | | 0.7 | |
| Expected return on plan assets | Expected return on plan assets | | (14.2) | | | (12.5) | | | (9.6) | | | — | | | — | | | — | |
| | Amortization of prior service cost and actuarial loss | Amortization of prior service cost and actuarial loss | | 0.1 | | | 0.3 | | | 0.3 | | | 0.7 | | | 0.6 | | | 0.5 | |
| Amortization of prior service cost and actuarial loss | |
| Amortization of prior service cost and actuarial loss | |
| Net periodic benefit cost | Net periodic benefit cost | | $ | 48.7 | | | $ | 53.7 | | | $ | 42.6 | | | $ | 2.1 | | | $ | 2.0 | | | $ | 2.2 | |
Lump sum payments made by the Supplemental Plan to employees retiring in 2021, 20202023, 2022 and 20192021 did not exceed the Plan’s total service and interest costs expected for those years.
The pre-tax amounts recognized in other comprehensive (income) loss for the years ended December 31, 2021, 20202023, 2022 and 20192021 were as follows:
| | Pension Benefits | | Post-Retirement
Medical Plan |
| | Pension Benefits | | | | Pension Benefits | | Post-Retirement
Medical Plan |
| (in millions) | (in millions) | | 2021 | | 2020 | | 2019 | | 2021 | | 2020 | | 2019 | (in millions) | | 2023 | | 2022 | | 2021 | | 2023 | | 2022 | | 2021 |
| Prior service costs | Prior service costs | | $ | — | | | $ | — | | | $ | — | | | $ | — | | | $ | 1.8 | | | $ | — | |
| Net actuarial (gain) loss | | (21.1) | | | (5.9) | | | (10.7) | | | (4.0) | | | 1.9 | | | (2.3) | |
| Net actuarial loss (gain) | |
| Amortization of losses and prior service cost | Amortization of losses and prior service cost | | (0.1) | | | (0.3) | | | (0.3) | | | (0.7) | | | (0.6) | | | (0.5) | |
| Total changes in other comprehensive (income) loss | Total changes in other comprehensive (income) loss | | $ | (21.2) | | | $ | (6.2) | | | $ | (11.0) | | | $ | (4.7) | | | $ | 3.1 | | | $ | (2.8) | |
The pre-tax amounts in accumulated other comprehensive income (loss) as of December 31, 2021,2023 and 20202022 that have not yet been recognized as components of net periodic costs were as follows:
| | Pension Benefits | | Post-Retirement
Medical Plan |
| | Pension Benefits | | | | Pension Benefits | | Post-Retirement
Medical Plan |
| (in millions) | (in millions) | | 2021 | | 2020 | | 2021 | | 2020 | (in millions) | | 2023 | | 2022 | | 2023 | | 2022 |
| Prior service costs | Prior service costs | | $ | (0.5) | | | $ | (0.6) | | | $ | (4.3) | | | $ | (5.0) | |
| Net actuarial gain (loss) | | 12.7 | | | (8.4) | | | 7.8 | | | 3.9 | |
| Net actuarial (loss) gain | |
| Total | Total | | $ | 12.2 | | | $ | (9.0) | | | $ | 3.5 | | | $ | (1.1) | |
The weighted average assumptions used to determine the benefit obligations as of December 31, 2021,2023 and 20202022 were as follows:
| | | | | Qualified Plan | | Supplemental Plan | | Post-Retirement Medical Plan | | | Qualified Plan | | Supplemental Plan | | Post-Retirement Medical Plan |
| 2021 | | 2020 | | 2021 | | 2020 | | 2021 | | 2020 |
| | 2023 | | | | 2023 | | 2022 | | 2023 | | 2022 | | 2023 | | 2022 |
| Discount rate - benefit obligations | Discount rate - benefit obligations | | 2.78 | % | | 2.36 | % | | 2.73 | % | | 2.21 | % | | 2.46 | % | | 1.90 | % | Discount rate - benefit obligations | | 4.99 | % | | 5.22 | % | | 4.94 | % | | 5.24 | % | | 4.88 | % | | 5.15 | % |
| Rate of compensation increase | Rate of compensation increase | | 4.26 | % | | 4.28 | % | | 4.50 | % | | 4.50 | % | | — | | | — | |
PBF ENERGY INC. AND PBF ENERGY COMPANY LLC
NOTES TO CONSOLIDATED FINANCIAL STATEMENTS
The weighted average assumptions used to determine the net periodic benefit costs for the years ended December 31, 2021, 20202023, 2022 and 20192021 were as follows:
| | Qualified Plan | | Supplemental Plan | | Post-Retirement Medical Plan |
| 2021 | | 2020 | | 2019 | | 2021 | | 2020 | | 2019 | | 2021 | | 2020 | | 2019 |
| | Qualified Plan | | | | Qualified Plan | | Supplemental Plan | | Post-Retirement Medical Plan |
| | 2023 | | | | 2023 | | 2022 | | 2021 | | 2023 | | 2022 | | 2021 | | 2023 | | 2022 | | 2021 |
| Discount rates: | Discount rates: | | | | | | | | | | | | | | | | | | |
| Effective rate for service cost | |
| Effective rate for service cost | |
| Effective rate for service cost | Effective rate for service cost | | 2.40% | | 2.94% | | 4.24% | | 2.26% | | 2.79% | | 4.19% | | 2.35% | | 2.86% | | 4.21% | | 5.22% | | 2.80% | | 2.40% | | 5.24% | | 2.73% | | 2.26% | | 5.27% | | 2.80% | | 2.35% |
| Effective rate for interest cost | Effective rate for interest cost | | 1.74% | | 2.50% | | 3.92% | | 1.53% | | 2.33% | | 3.83% | | 1.28% | | 2.21% | | 3.69% | Effective rate for interest cost | | 5.14% | | 2.33% | | 1.74% | | 5.14% | | 2.24% | | 1.53% | | 5.05% | | 1.91% | | 1.28% |
| Effective rate for interest on service cost | Effective rate for interest on service cost | | 1.92% | | 2.59% | | 4.00% | | 1.75% | | 2.42% | | 3.90% | | 2.11% | | 2.68% | | 4.09% | Effective rate for interest on service cost | | 5.14% | | 2.45% | | 1.92% | | 5.12% | | 2.29% | | 1.75% | | 5.21% | | 2.65% | | 2.11% |
| Cash balance interest credit rate | Cash balance interest credit rate | | 1.57% | | 2.19% | | 3.34% | | 1.57% | | 2.19% | | 3.34% | | N/A | | N/A | | N/A | Cash balance interest credit rate | | 4.04% | | 2.06% | | 1.57% | | 4.04% | | 2.06% | | 1.57% | | N/A |
| Expected long-term rate of return on plan assets | Expected long-term rate of return on plan assets | | 5.25% | | 5.75% | | 6.00% | | N/A | | N/A | | N/A | | N/A | | N/A | | N/A | Expected long-term rate of return on plan assets | | 6.75% | | 5.50% | | 5.25% | | N/A |
| Rate of compensation increase | Rate of compensation increase | | 4.28% | | 4.28% | | 4.55% | | 4.50% | | 4.50% | | 5.00% | | N/A | | N/A | | N/A | Rate of compensation increase | | 4.27% | | 4.26% | | 4.28% | | 4.50% | | N/A |
The assumed health care cost trend rates as of December 31, 20212023 and 20202022 were as follows:
| | | | | | | | | | | | | | |
| | | Post-Retirement
Medical Plan |
| | 2023 | | 2022 |
| Health care cost trend rate assumed for next year | | 6.4 | % | | 6.4 | % |
| Rate to which the cost trend rate was assumed to decline (the ultimate trend rate) | | 4.0 | % | | 4.0 | % |
| Year that the rate reaches the ultimate trend rate | | 2046 | | 2046 |
| | | | | | | | | | | | | | |
| | | Post-Retirement
Medical Plan |
| | 2021 | | 2020 |
| Health care cost trend rate assumed for next year | | 5.2 | % | | 5.4 | % |
| Rate to which the cost trend rate was assumed to decline (the ultimate trend rate) | | 4.0 | % | | 4.5 | % |
| Year that the rate reaches the ultimate trend rate | | 2046 | | 2038 |
The table below presents the fair values of the assets of the Company’s Qualified Plan as of December 31, 20212023 and 20202022 by level of fair value hierarchy. Assets consist of collective trusts and are measured at fair value based on the closing net asset value (“NAV”) as determined by the fund manager and reported daily. As noted above, the Company’s post-retirement medical plan is funded on a pay-as-you-go basis and has no assets.
| | | | | | | | | | | | | | |
| | | Fair Value Measurements Using
NAV as Practical Expedient |
| | | December 31, |
| (in millions) | | 2021 | | 2020 |
| Equities: | | | | |
| Domestic equities | | $ | 73.9 | | | $ | 64.4 | |
| Developed international equities | | 37.7 | | | 38.2 | |
| Global low volatility equities | | 24.1 | | | 22.5 | |
| Emerging market equities | | 24.8 | | | 20.7 | |
| Fixed-income | | 121.6 | | | 95.7 | |
| | | | |
| | | | |
| Real Estate | | 23.2 | | | 13.3 | |
| Cash and cash equivalents | | 1.0 | | | 1.0 | |
| Total | | $ | 306.3 | | | $ | 255.8 | |
| | | | | | | | | | | | | | |
| | | Fair Value Measurements Using
NAV as Practical Expedient |
| | | December 31, |
| (in millions) | | 2023 | | 2022 |
| Equities: | | | | |
| Domestic equities | | $ | 75.0 | | | $ | 73.0 | |
| Developed international equities | | 46.9 | | | 34.9 | |
| Global low volatility equities | | 21.0 | | | 18.4 | |
| Emerging market equities | | 24.8 | | | 20.8 | |
| Fixed-income | | 159.9 | | | 106.2 | |
| | | | |
| | | | |
| Real Estate | | 19.7 | | | 18.9 | |
| Cash and cash equivalents | | 2.0 | | | 2.0 | |
| Total | | $ | 349.3 | | | $ | 274.2 | |
PBF ENERGY INC. AND PBF ENERGY COMPANY LLC
NOTES TO CONSOLIDATED FINANCIAL STATEMENTS
The Company’s investment strategy for its Qualified Plan is to achieve a reasonable return on assets that supports the plan’s interest credit rating, subject to a moderate level of portfolio risk that provides liquidity. Consistent with these financial objectives as of December 31, 2021,2023, the plan’s target allocations for plan assets are 54%48% invested in equity securities, 40%46% fixed income investments and 6% in real estate. Equity securities include international stocks and a blend of U.S. growth and value stocks of various sizes of capitalization. Fixed income securities include bonds and notes issued by the U.S. government and its agencies, corporate bonds, and mortgage-backed securities. The aggregate asset allocation is reviewed on an annual basis.
The overall expected long-term rate of return on plan assets for the Qualified Plan is based on the Company’s view of long-term expectations and asset mix.
PBF ENERGY INC. AND PBF ENERGY COMPANY LLC
NOTES TO CONSOLIDATED FINANCIAL STATEMENTS
20.17. REVENUES
Revenue Recognition
In accordance with FASB ASC Topic 606, Revenue from Contracts with CustomerCustomers (“ASC 606”), revenue is recognized when control of the promised goods or services is transferred to the Company’s customers, in an amount that reflects the consideration to which the Company expects to be entitled in exchange for those goods or services.
As described in “Note 2219 - Segment Information”, the Company’s business consists of the Refining Segment and LogisticsLogistic Segment. The following table provides information relating to the Company’s revenues for each product or group of similar products or services by segment for the periods presented.
| | | | | | | | | | | | | | | | | | | | |
| | Year Ended December 31, |
| (in millions) | | 2021 | | 2020 | | 2019 |
| Refining Segment: | | | | | | |
| Gasoline and distillates | | $ | 23,489.5 | | | $ | 12,799.4 | | | $ | 21,278.4 | |
| Feedstocks and other | | 1,310.1 | | | 935.5 | | | 806.9 | |
| Asphalt and blackoils | | 1,217.8 | | | 777.9 | | | 1,426.4 | |
| Chemicals | | 889.8 | | | 351.5 | | | 682.3 | |
| Lubricants | | 294.8 | | | 180.7 | | | 274.9 | |
| Total Revenues | | $ | 27,202.0 | | | $ | 15,045.0 | | | $ | 24,468.9 | |
| Logistics Segment: | | | | | | |
| Logistics | | 355.5 | | | 360.3 | | | 340.2 | |
| Total revenue prior to eliminations | | $ | 27,557.5 | | | $ | 15,405.3 | | | $ | 24,809.1 | |
| Elimination of intercompany revenue | | (304.1) | | | (289.4) | | | (300.9) | |
| Total Revenues | | $ | 27,253.4 | | | $ | 15,115.9 | | | $ | 24,508.2 | |
| | | | | | | | | | | | | | | | | | | | |
| | Year Ended December 31, |
| (in millions) | | 2023 | | 2022 | | 2021 |
| Refining Segment: | | | | | | |
| Gasoline and distillates | | $ | 34,002.5 | | | $ | 41,465.0 | | | $ | 23,489.5 | |
| Asphalt and blackoils | | 1,650.1 | | | 2,123.8 | | | 1,217.8 | |
| Feedstocks and other | | 1,640.6 | | | 1,863.0 | | | 1,310.1 | |
| Chemicals | | 650.6 | | | 903.8 | | | 889.8 | |
| Lubricants | | 344.7 | | | 425.0 | | | 294.8 | |
| Total Refining Revenue | | $ | 38,288.5 | | | $ | 46,780.6 | | | $ | 27,202.0 | |
| Logistics Segment: | | | | | | |
| Logistics Revenue | | 384.1 | | | 369.3 | | | 355.5 | |
| Total revenue prior to eliminations | | 38,672.6 | | | 47,149.9 | | | 27,557.5 | |
| Elimination of intercompany revenue | | (347.8) | | | (319.6) | | | (304.1) | |
| Total Revenues | | $ | 38,324.8 | | | $ | 46,830.3 | | | $ | 27,253.4 | |
The majority of the Company’s revenues are generated from the sale of refined products reported in the Refining segment.products. These revenues are largely based on the current spot (market) prices of the products sold, which represent consideration specifically allocable to the products being sold on a given day, and the Company recognizes those revenues upon delivery and transfer of title to the products to our customers. The time at which delivery and transfer of title occurs is the point when the Company’s control of the products is transferred to the Company’s customers and when its performance obligation to its customers is fulfilled. Delivery and transfer of title are specifically agreed to between the Company and customers within the contracts. The Refining segmentCompany also has contracts which contain fixed pricing, tiered pricing, minimum volume features with makeup periods, or other factors that have not materially been affected by ASC 606.
The Company’s Logistics segment revenues are generated by charging fees for crude oil and refined products terminaling, storage and pipeline services based on the greater of contractual minimum volume commitments, as applicable, or the delivery of actual volumes based on contractual rates applied to throughput or storage volumes. A majority of the Company’s logistics revenues are generated by intercompany transactions and are eliminated in consolidation.
PBF ENERGY INC. AND PBF ENERGY COMPANY LLC
NOTES TO CONSOLIDATED FINANCIAL STATEMENTS
Deferred Revenue
The Company records deferred revenue when cash payments are received or are due in advance of performance, including amounts which are refundable. Deferred revenue was $42.7$64.1 million and $47.2$40.6 million as of December 31, 20212023 and December 31, 2020,2022, respectively. Fluctuations in the deferred revenue balance are primarily driven by the timing and extent of cash payments received or due in advance of satisfying the Company’s performance obligations.
The Company’s payment terms vary by type and location of customers and the products offered. The period between invoicing and when payment is due is not significant (i.e. generally within two months). For certain products or services and customer types, the Company requires payment before the products or services are delivered to the customer.
Crude Oil and Refined Product Exchanges and Matching Buy/Sell Transactions
The Company enters into buy/sell arrangements and exchange contracts where it agrees to deliver a specified quantity and quality of crude oil or refined products at a specified location and date to a particular counterparty and to receive from the same counterparty the same commodity at a specified location on the same or another specified date. The exchange receipts and deliveries are non-monetary transactions, with the exception of specific grade or location differentials settled in cash. The matching buy/sell purchase and sale transactions are settled in cash. No revenues are recorded for exchange and matching buy/sell transactions as they are accounted for as exchanges of inventory. The net difference in buy/sell transactions are recorded in Cost of Goods Sold. The exchange transactions are recognized at the carrying amount of the inventory transferred.
Significant Judgment and Practical Expedients
For performance obligations related to sales of products, the Company has determined that customers are able to direct the use of, and obtain substantially all of the benefits from, the products at the point in time that the products are delivered. The Company has determined that the transfer of control upon delivery to the customer’s requested destination accurately depicts the transfer of goods. Upon the delivery of the products and transfer of control, the Company generally has the present right to payment and the customers bear the risks and rewards of ownership of the products. The Company has elected the practical expedient to not disclose the value of unsatisfied performance obligations for (i) contracts with an original expected length of one year or less and (ii) contracts for which the Company recognizes revenue at the amount to which it has the right to invoice for services performed.
PBF ENERGY INC. AND PBF ENERGY COMPANY LLC
NOTES TO CONSOLIDATED FINANCIAL STATEMENTS
21.18. INCOME TAXES
PBF Energy is required to file federal and applicable state corporate income tax returns and recognizes income taxes on its pre-tax income, (loss), which to-date has consisted primarily of its share of PBF LLC’s pre-tax income (see “Note 1613 - Stockholders’ and Members’ Equity Structure”). PBF LLC is organized as a limited liability company and PBFX is an MLP,a partnership, both of which are treated as “flow-through” entities for federal income tax purposes and therefore are not subject to income taxes apart from the income tax attributable to the 2two subsidiaries acquired in connection with the acquisition of Chalmette Refining and PBF Holding’s wholly-owned Canadian subsidiary, PBF Energy Limited, that are treated as C-Corporations for income tax purposes, with the tax provision calculated based on the effective tax rate for the periodperiods presented.
Valuation Allowance
ManagementThe Company assesses the available positive and negative evidence to estimate whether sufficient future taxable income will be generated to permit use of existing deferred tax assets. Negative evidence evaluated as part of this assessment includes PBF Energy’s cumulative losses incurred over a three-year period. Such objective evidence could limit PBF Energy’s ability to consider other subjective evidence, such as PBF Energy’s projections for future taxable income as market conditions, commodity prices and demand for refined products normalize.
On the basis of this evaluation, a valuation allowance wasis recorded to recognize only the portion of deferred tax assets that are more likely than not to be realized. The amount of the deferred tax assets considered realizable, however, could be adjusted if estimates of future taxable income during the carryover period are reduced or increased or if objective negative evidence in the form of cumulative losses is no longer present and additional weight is given to subjective evidence such as PBF Energy’s projections for future taxable income.
During the year ended December 31, 2022, the Company evaluated all available positive and negative evidence and determined that the $308.5 million valuation allowance, as of December 31, 2021, associated with deferred tax assets should be released because the Company believed that it had become more likely than not that the deferred tax assets would be realized. In the Company' s evaluation of the need for and amount of a valuation allowance on its deferred tax assets, the Company placed the most weight on objectively verifiable direct evidence, including its recent and historical operating results and the significant improvement in its operating profitability. The specific positive factors and evidence considered in the realizability of its deferred tax assets included the cumulative pre-tax income that the Company generated over the past three-year period. This resulted in the release of the full valuation allowance in the year ended December 31, 2022.
Inflation Reduction Act
On August 16, 2022, the Inflation Reduction Act (“IRA”) was enacted and signed into law in the United States. The IRA is a budget reconciliation package that includes significant law changes relating to tax, climate change, energy, and health care. The tax provisions include, among other items, a corporate alternative minimum tax of 15%, an excise tax of 1% on corporate stock buy-backs, energy-related tax credits and incentives, and additional IRS funding. Based on the Company’s results over the past three fiscal years, the corporate alternative minimum tax is currently not applicable. The Company does not expect the other tax provisions of the IRA to have a material impact on our Consolidated Financial Statements.
PBF ENERGY INC.
NOTES TO CONSOLIDATED FINANCIAL STATEMENTS
The income tax provision in the PBF Energy Consolidated Statements of Operations consists of the following:
| | | | | | | | | | | | | | | | | |
| (in millions) | Year Ended
December 31,
2021 | | Year Ended
December 31,
2020 | | Year Ended
December 31,
2019 |
| Current expense (benefit): | | | | | |
| Federal | $ | 0.3 | | | $ | (1.7) | | | $ | 0.2 | |
| Foreign | — | | | — | | | 0.1 | |
| State | 0.1 | | | 2.2 | | | 0.3 | |
| Total current | 0.4 | | | 0.5 | | | 0.6 | |
| | | | | |
| Deferred expense (benefit): | | | | | |
| Federal | 19.1 | | | (6.6) | | | 91.8 | |
| Foreign | (13.1) | | | 5.4 | | | (8.7) | |
| State | 5.7 | | | 2.8 | | | 20.6 | |
| Total deferred | 11.7 | | | 1.6 | | | 103.7 | |
| Total provision for income taxes | $ | 12.1 | | | $ | 2.1 | | | $ | 104.3 | |
PBF ENERGY INC. AND PBF ENERGY COMPANY LLC
NOTES TO CONSOLIDATED FINANCIAL STATEMENTS
| | | | | | | | | | | | | | | | | |
| (in millions) | Year Ended December 31, 2023 | | Year Ended
December 31,
2022 | | Year Ended
December 31,
2021 |
| Current expense (benefit): | | | | | |
| Federal | $ | 140.9 | | | $ | 75.8 | | | $ | 0.3 | |
| Foreign | (0.3) | | | 0.3 | | | — | |
| State | 46.2 | | | 88.5 | | | 0.1 | |
| Total current | 186.8 | | | 164.6 | | | 0.4 | |
| | | | | |
| Deferred expense (benefit): | | | | | |
| Federal | 387.7 | | | 379.9 | | | 19.1 | |
| Foreign | 3.1 | | | (0.9) | | | (13.1) | |
| State | 146.2 | | | 41.2 | | | 5.7 | |
| Total deferred | 537.0 | | | 420.2 | | | 11.7 | |
| Total provision for income taxes | $ | 723.8 | | | $ | 584.8 | | | $ | 12.1 | |
The difference between PBF Energy’s effective income tax rate and the United States statutory rate is reconciled below:
| | Year Ended
December 31,
2021 | | Year Ended
December 31,
2020 | | Year Ended
December 31,
2019 |
| Year Ended
December 31,
2023 | | | Year Ended
December 31,
2023 | | Year Ended
December 31,
2022 | | Year Ended
December 31,
2021 |
| | Provision at Federal statutory rate | Provision at Federal statutory rate | 21.0 | % | | 21.0 | % | | 21.0 | % |
| Provision at Federal statutory rate | |
| Provision at Federal statutory rate | | 21.0 | % | | 21.0 | % | | 21.0 | % |
| Increase (decrease) attributable to flow-through of certain tax adjustments: | Increase (decrease) attributable to flow-through of certain tax adjustments: | |
| State income taxes (net of federal income tax) | |
| State income taxes (net of federal income tax) | |
| State income taxes (net of federal income tax) | State income taxes (net of federal income tax) | 4.9 | % | | 5.6 | % | | 3.9 | % | 5.0 | % | | 4.9 | % | | 4.9 | % |
| Nondeductible/nontaxable items | Nondeductible/nontaxable items | 0.9 | % | | (0.1) | % | | 0.1 | % | Nondeductible/nontaxable items | (0.5) | % | | (0.4) | % | | 0.9 | % |
| | Rate differential from foreign jurisdictions | Rate differential from foreign jurisdictions | (0.4) | % | | — | % | | (0.2) | % |
| | Rate differential from foreign jurisdictions | |
| | Rate differential from foreign jurisdictions | | — | % | | — | % | | (0.4) | % |
| Provision to return adjustment | Provision to return adjustment | (0.1) | % | | (0.1) | % | | (0.1) | % | Provision to return adjustment | (0.1) | % | | — | % | | (0.1) | % |
| Adjustment to deferred tax assets and liabilities for change in tax rates | Adjustment to deferred tax assets and liabilities for change in tax rates | 2.2 | % | | 0.1 | % | | (0.5) | % | Adjustment to deferred tax assets and liabilities for change in tax rates | — | % | | (0.2) | % | | 2.2 | % |
| Stock-based compensation | — | % | | — | % | | 0.1 | % |
| | Deferred tax asset valuation allowance | |
| Deferred tax asset valuation allowance | |
| Deferred tax asset valuation allowance | Deferred tax asset valuation allowance | (23.2) | % | | (25.8) | % | | — | % | — | % | | (8.9) | % | | (23.2) | % |
| Other | Other | (0.3) | % | | (0.9) | % | | 0.3 | % | Other | (0.1) | % | | 0.5 | % | | (0.3) | % |
| Effective tax rate | Effective tax rate | 5.0 | % | | (0.2) | % | | 24.6 | % | Effective tax rate | 25.3 | % | | 16.9 | % | | 5.0 | % |
PBF Energy’s effective income tax rate for the years ended December 31, 2021, 20202023, 2022 and 2019,2021, including the impact of income attributable to noncontrolling interests of $84.5$21.5 million, $59.1$96.0 million and $55.8$84.5 million, respectively, was 3.7%25.1%, (0.2)%16.4% and 21.8%3.7%, respectively.
For the year ended December 31, 20212023, PBF Energy’s effective tax rate did not materially differ from the United States statutory rate, inclusive of state income taxes.
For the years ended December 31, 2022 and 20202021 the difference between the United States statutory rate and PBF Energy’s effective tax rate was primarily attributable to the changes in the deferred tax asset valuation allowance noted above. For the year ended December 31, 2019, PBF Energy’s effective tax rate was materially consistent with its statutory federal and state tax rates.allowance.
PBF ENERGY INC. AND PBF ENERGY COMPANY LLC
NOTES TO CONSOLIDATED FINANCIAL STATEMENTS
For financial reporting purposes, income (loss) before income taxes attributable to PBF Energy Inc. stockholders includes the following components:
| | (in millions) | (in millions) | Year Ended
December 31,
2021 | | Year Ended
December 31,
2020 | | Year Ended
December 31,
2019 | (in millions) | Year Ended
December 31,
2023 | | Year Ended
December 31,
2022 | | Year Ended
December 31,
2021 |
| | United States income (loss) | $ | 296.4 | | | $ | (1,413.0) | | | $ | 450.0 | |
| United States income | |
| United States income | |
| United States income | |
| Foreign income (loss) | Foreign income (loss) | (53.3) | | | 22.7 | | | (26.3) | |
| Total income (loss) before income taxes attributable to PBF Energy Inc. stockholders | $ | 243.1 | | | $ | (1,390.3) | | | $ | 423.7 | |
| Total income before income taxes attributable to PBF Energy Inc. stockholders | |
A summary of the components of PBF Energy’s deferred tax assets and deferred tax liabilities consists of the following:
| | | | | | | | | | | |
| (in millions) | December 31, 2021 | | December 31, 2020 |
| Deferred tax assets | | | |
| Purchase interest step-up | $ | 141.2 | | | $ | 155.2 | |
| Inventory | — | | | 146.5 | |
| | | |
| Pension, employee benefits and compensation | 63.7 | | | 48.5 | |
| Hedging | 4.9 | | | 4.3 | |
| Net operating loss carry forwards | 600.0 | | | 566.9 | |
| Environmental liabilities | 99.7 | | | 100.8 | |
| Lease liabilities | 308.7 | | | 223.4 | |
| Interest expense limitation carry forwards | 104.4 | | | 55.8 | |
| Other | 36.2 | | | 28.4 | |
| Total deferred tax assets | 1,358.8 | | | 1,329.8 | |
| Valuation allowance | (308.5) | | | (358.4) | |
| Total deferred tax assets, net | 1,050.3 | | | 971.4 | |
| | | |
| Deferred tax liabilities | | | |
| Property, plant and equipment | 825.0 | | | 845.1 | |
| Inventory | 23.1 | | | — | |
| Right of use assets | 308.7 | | | 223.4 | |
| Other | 4.9 | | | 2.5 | |
| Total deferred tax liabilities | 1,161.7 | | | 1,071.0 | |
| | | |
| Net deferred tax liabilities | $ | (111.4) | | | $ | (99.6) | |
| | | | | | | | | | | |
| (in millions) | December 31, 2023 | | December 31, 2022 |
| Deferred tax assets | | | |
| Purchase interest step-up | $ | 171.6 | | | $ | 191.4 | |
| | | |
| | | |
| Pension, employee benefits and compensation | 96.5 | | | 102.8 | |
| | | |
| Net operating loss carry forwards | 3.4 | | | 115.9 | |
| Environmental liabilities | 40.4 | | | 36.4 | |
| Lease liabilities | 305.9 | | | 284.1 | |
| | | |
| | | |
| Other | 27.0 | | | 54.7 | |
| Total deferred tax assets | 644.8 | | | 785.3 | |
| Valuation allowance | — | | | — | |
| Total deferred tax assets, net | 644.8 | | | 785.3 | |
| | | |
| Deferred tax liabilities | | | |
| Property, plant and equipment | 1,062.2 | | | 968.3 | |
| Inventory | 68.6 | | | 67.6 | |
| | | |
| Right of use assets | 303.5 | | | 283.2 | |
| Equity method investment in SBR | 278.8 | | | — | |
| Other | 5.0 | | | 1.6 | |
| Total deferred tax liabilities | 1,718.1 | | | 1,320.7 | |
| | | |
| Net deferred tax liability | $ | (1,073.3) | | | $ | (535.4) | |
As of December 31, 2021,2023, PBF Energy hashad zero federal and $3.2 million state income tax net operating loss carry forwards of $2,377.0 million and $127.0 million, respectively.forwards. The portion of the federal net operating loss carry forward that was generated in years prior to 2019 expireswas utilized in varying amounts through 2037. A federal net operating loss of $1.8 billion from 2018 and 2021 has an indefinite carry forward period and can be used to offset 80% of taxable income in future years.2022. The state net operating loss carry forwards expire at various dates from 20292025 through 2041 with certain jurisdictions having indefinite net operating loss carry forwardsforward periods. The Company has recorded valuation allowances against these assets, as it is deemed “more likely than not” that the deferred tax assets will not be realized.
PBF ENERGY INC. AND PBF ENERGY COMPANY LLC
NOTES TO CONSOLIDATED FINANCIAL STATEMENTS
The reported income tax (benefit) expense in the PBF LLC Consolidated Statements of Operations consists of the following:
| | | | | | | | | | | | | | | | | |
| (in millions) | Year Ended
December 31,
2021 | | Year Ended
December 31,
2020 | | Year Ended
December 31,
2019 |
| Current income tax expense (benefit) | $ | 0.5 | | | $ | (1.2) | | | $ | 0.5 | |
| Deferred income tax (benefit) expense | (14.5) | | | 7.3 | | | (8.8) | |
| Total income tax (benefit) expense | $ | (14.0) | | | $ | 6.1 | | | $ | (8.3) | |
Income tax years that remain subject to examination by material jurisdictions, where an examination has not already concluded are all years including and subsequent to:
| | | | | |
| United States | |
| Federal | 20182020 |
| New Jersey | 20162019 |
| Michigan | 20172019 |
| Delaware | 20182020 |
| Indiana | 20182020 |
| Pennsylvania | 20182020 |
| New York | 20182020 |
| Louisiana | 20182020 |
| California | 20172019 |
The Company does not have any unrecognized tax benefits.
PBF ENERGY INC. AND PBF ENERGY COMPANY LLC
NOTES TO CONSOLIDATED FINANCIAL STATEMENTS
22.19. SEGMENT INFORMATION
The Company’s operations are organized into 2two reportable segments, Refining and Logistics. Operations that are not included in the Refining or Logistics segments, including the Company’s share of SBR’s results, are included in Corporate. Intersegment transactions are eliminated in the Consolidated Financial Statements and are included in the Eliminations column below.
Refining
The Company’s Refining segment includes the operations of its 6six refineries, including certain related logistics assets that are not owned by PBFX. The Company’s refineries are located in Delaware City, Delaware, Paulsboro, New Jersey, Toledo, Ohio, Chalmette, Louisiana, Torrance, California and Martinez, California. The refineries produce unbranded transportation fuels, heating oil, petrochemical feedstocks, lubricants and other petroleum products in the United States. The Company purchases crude oil, other feedstocks and blending components from various third-party suppliers. The Company sells products throughout the Northeast, Midwest, Gulf Coast and West Coast of the United States, as well as in other regions of the United States, Canada and Mexico, and is able to ship products to other international destinations.
Logistics
The Company’s Logistics segment is comprised of PBFX, a publicly-traded MLP,partnership, formed to own or lease, operate, develop and acquire crude oil and refined products terminals, pipelines, storage facilities and similar logistics assets. PBFX’s assets primarily consist of rail and truck terminals and unloading racks, tank farms and pipelines that were acquired from or contributed by PBF LLC and are located at, or nearby, the Company’s refineries. PBFX provides various rail, truck and marine terminaling services, pipeline transportation services and storage services to PBF Holding and/or its subsidiaries and third-party customers through fee-based commercial agreements. PBFX currently does not generate significant third-party revenues and intersegment related-party revenues are eliminated in consolidation. From a PBF Energy and PBF LLC perspective, the Company’s chief operating decision maker evaluates the Logistics segment as a whole without regard to any of PBFX’s individual operating segments.
The Company evaluates the performance of its segments based primarily on income from operations. Income from operations includes those revenues and expenses that are directly attributable to management of the respective segment. The Logistics segment’s revenues include intersegment transactions with the Company’s Refining segment at prices the Company believes are substantially equivalent to the prices that could have been negotiated with unaffiliated parties with respect to similar services. Activities of the Company’s business that are not included in the 2two operating segments are included in Corporate. Such activities consist primarily of corporate staff operations and other items that are not specific to the normal operations of the 2two operating segments. The Company does not allocate non-operating income and expense items, including income taxes, to the individual segments. The Refining segment’s operating subsidiaries and PBFX are primarily pass-through entities with respect to income taxes.
Total assets of each segment consist of property, plant and equipment, inventories, cash and cash equivalents, accounts receivable and other assets directly associated with the segment’s operations. Corporate assets consist primarily of the Company’s equity method investment in SBR, non-operating property, plant and equipment and other assets not directly related to the Company’s refinery and logistics operations.
Disclosures regarding the Company’s reportable segments with reconciliations to consolidated totals for the years ended December 31, 2021, 20202023, 2022 and 20192021 are presented below. In connection with certain contributions by PBF LLC to PBFX, the accompanying segment information is retrospectively adjusted to include the historical results of those assets in the Logistics segment for all periods presented prior to such contributions, as applicable.
PBF ENERGY INC. AND PBF ENERGY COMPANY LLC
NOTES TO CONSOLIDATED FINANCIAL STATEMENTS
| | | | | | | | | | | | | | | | | | | | | | | | | | | | | |
| Year Ended December 31, 2021 |
PBF Energy (in millions) | Refining | | Logistics | | Corporate | | Eliminations | | Consolidated Total |
| Revenues | $ | 27,202.0 | | | $ | 355.5 | | | $ | — | | | $ | (304.1) | | | $ | 27,253.4 | |
| Depreciation and amortization expense | 415.7 | | | 37.8 | | | 13.3 | | | — | | | 466.8 | |
| Income (loss) from operations | 673.1 | | | 195.4 | | | (271.3) | | | — | | | 597.2 | |
| Interest expense, net | 8.8 | | | 42.1 | | | 266.6 | | | — | | | 317.5 | |
| Capital expenditures | 381.8 | | | 8.6 | | | 5.3 | | | — | | | 395.7 | |
| | | | | | | | | | | | | | | | | | | | | | | | | | | | | |
| Year Ended December 31, 2023 |
| (in millions) | Refining | | Logistics | | Corporate | | Eliminations | | Consolidated Total |
| Revenues | $ | 38,288.5 | | | $ | 384.1 | | | $ | — | | | $ | (347.8) | | | $ | 38,324.8 | |
| Depreciation and amortization expense | 523.9 | | | 36.1 | | | 11.5 | | | — | | | 571.5 | |
Income from operations (1) | 2,183.6 | | | 206.1 | | | 561.8 | | | — | | | 2,951.5 | |
| Interest (income) expense, net | (4.8) | | | 2.3 | | | 66.3 | | | — | | | 63.8 | |
Capital expenditures (2) | 1,152.9 | | | 11.9 | | | 8.8 | | | — | | | 1,173.6 | |
| | Year Ended December 31, 2020 |
| Refining | | Logistics | | Corporate | | Eliminations | | Consolidated Total |
| Year Ended December 31, 2022 | | | Year Ended December 31, 2022 |
| Refining | | | Refining | | Logistics | | Corporate | | Eliminations | | Consolidated Total |
| Revenues | Revenues | $ | 15,045.0 | | | $ | 360.3 | | | $ | — | | | $ | (289.4) | | | $ | 15,115.9 | |
| Depreciation and amortization expense | Depreciation and amortization expense | 498.0 | | | 53.7 | | | 11.3 | | | — | | | 563.0 | |
| Income (loss) from operations | Income (loss) from operations | (1,450.4) | | | 195.3 | | | (161.7) | | | — | | | (1,416.8) | |
| Interest expense, net | Interest expense, net | 1.7 | | | 47.9 | | | 208.6 | | | — | | | 258.2 | |
Capital expenditures (1) | 1,546.6 | | | 12.3 | | | 10.7 | | | — | | | 1,569.6 | |
Capital expenditures (2) | |
| | Year Ended December 31, 2019 |
| Refining | | Logistics | | Corporate | | Eliminations | | Consolidated Total |
| Year Ended December 31, 2021 | | | Year Ended December 31, 2021 |
| Refining | | | Refining | | Logistics | | Corporate | | Eliminations | | Consolidated Total |
| Revenues | Revenues | $ | 24,468.9 | | | $ | 340.2 | | | $ | — | | | $ | (300.9) | | | $ | 24,508.2 | |
| Depreciation and amortization expense | Depreciation and amortization expense | 386.7 | | | 38.6 | | | 10.8 | | | — | | | 436.1 | |
Income (loss) from operations (2) (3) | 767.9 | | | 159.3 | | | (270.3) | | | (7.9) | | | 649.0 | |
| Income (loss) from operations | |
| Interest expense, net | Interest expense, net | 1.3 | | | 51.1 | | | 107.2 | | | — | | | 159.6 | |
| Capital expenditures | Capital expenditures | 708.9 | | | 31.7 | | | 8.3 | | | — | | | 748.9 | |
| | | | | | | | | | | | | | | | | | | | | | | | | | | | | |
| Balance at December 31, 2021 |
| Refining | | Logistics | | Corporate | | Eliminations | | Consolidated Total |
| Total assets | $ | 10,753.3 | | | $ | 901.3 | | | $ | 48.5 | | | $ | (61.7) | | | $ | 11,641.4 | |
| | | | | | | | | | | | | | | | | | | | | | | | | | | | | |
| Balance at December 31, 2023 |
| Refining | | Logistics | | Corporate | | Eliminations | | Consolidated Total |
Total assets (3) | $ | 12,590.6 | | | $ | 816.8 | | | $ | 1,024.1 | | | $ | (43.7) | | | $ | 14,387.8 | |
| | | | | | | | | | | | | | | | | | | | | | | | | | | | | |
| Balance at December 31, 2020 |
| Refining | | Logistics | | Corporate | | Eliminations | | Consolidated Total |
| Total assets | $ | 9,565.0 | | | $ | 933.6 | | | $ | 54.4 | | | $ | (53.2) | | | $ | 10,499.8 | |
| | | | | | | | | | | | | | | | | | | | | | | | | | | | | |
| Year Ended December 31, 2021 |
PBF LLC (in millions) | Refining | | Logistics | | Corporate | | Eliminations | | Consolidated Total |
| Revenues | $ | 27,202.0 | | | $ | 355.5 | | | $ | — | | | $ | (304.1) | | | $ | 27,253.4 | |
| Depreciation and amortization expense | 415.7 | | | 37.8 | | | 13.3 | | | — | | | 466.8 | |
| Income (loss) from operations | 673.1 | | | 195.4 | | | (269.2) | | | — | | | 599.3 | |
| Interest expense, net | 8.8 | | | 42.1 | | | 276.9 | | | — | | | 327.8 | |
| Capital expenditures | 381.8 | | | 8.6 | | | 5.3 | | | — | | | 395.7 | |
| | | | | | | | | | | | | | | | | | | | | | | | | | | | | |
| Year Ended December 31, 2020 |
| Refining | | Logistics | | Corporate | | Eliminations | | Consolidated Total |
| Revenues | $ | 15,045.0 | | | $ | 360.3 | | | $ | — | | | $ | (289.4) | | | $ | 15,115.9 | |
| Depreciation and amortization expense | 498.0 | | | 53.7 | | | 11.3 | | | — | | | 563.0 | |
| Income (loss) from operations | (1,450.4) | | | 195.3 | | | (160.9) | | | — | | | (1,416.0) | |
| Interest expense, net | 1.7 | | | 47.9 | | | 218.9 | | | — | | | 268.5 | |
Capital expenditures (1) | 1,546.6 | | | 12.3 | | | 10.7 | | | — | | | 1,569.6 | |
PBF ENERGY INC. AND PBF ENERGY COMPANY LLC
NOTES TO CONSOLIDATED FINANCIAL STATEMENTS
| | | | | | | | | | | | | | | | | | | | | | | | | | | | | |
| Year Ended December 31, 2019 |
| Refining | | Logistics | | Corporate | | Eliminations | | Consolidated Total |
| Revenues | $ | 24,468.9 | | | $ | 340.2 | | | $ | — | | | $ | (300.9) | | | $ | 24,508.2 | |
| Depreciation and amortization expense | 386.7 | | | 38.6 | | | 10.8 | | | — | | | 436.1 | |
Income (loss) from operations (2) (3) | 767.9 | | | 159.3 | | | (268.6) | | | (7.9) | | | 650.7 | |
| Interest expense, net | 1.3 | | | 51.1 | | | 116.7 | | | — | | | 169.1 | |
| Capital expenditures | 708.9 | | | 31.7 | | | 8.3 | | | — | | | 748.9 | |
| | | | | | | | | | | | | | | | | | | | | | | | | | | | | |
| Balance at December 31, 2021 |
| Refining | | Logistics | | Corporate | | Eliminations | | Consolidated Total |
| Total assets | $ | 10,753.3 | | | $ | 901.3 | | | $ | 46.8 | | | $ | (61.7) | | | $ | 11,639.7 | |
| | | | | | | | | | | | | | | | | | | | | | | | | | | | | |
| Balance at December 31, 2020 |
| Refining | | Logistics | | Corporate | | Eliminations | | Consolidated Total |
| Total assets | $ | 9,565.0 | | | $ | 933.6 | | | $ | 52.3 | | | $ | (53.2) | | | $ | 10,497.7 | |
| | | | | | | | | | | | | | | | | | | | | | | | | | | | | |
| Balance at December 31, 2022 |
| Refining | | Logistics | | Corporate | | Eliminations | | Consolidated Total |
| Total assets | $ | 12,587.9 | | | $ | 863.1 | | | $ | 136.3 | | | $ | (38.2) | | | $ | 13,549.1 | |
(1) The Refining(2) For the years ended December 31, 2023 and December 31, 2022, the Company’s refining segment includes $312.7 million and $336.2 million, respectively, of capital expenditures of $1,176.2 million forrelated to the acquisitionconstruction of the Martinez refinery in the first quarter of 2020.Renewable Diesel Facility.
(2) On April 24, 2019, PBFX entered into a contribution agreement with PBF LLC (“the TVPC Contribution Agreement”), pursuant to which PBF LLC contributed to PBFX all of the issued and outstanding limited liability company interests of TVP Holding Company LLC (“TVP Holding”) for total consideration of $200.0 million (the “TVPC Acquisition”). Prior to the TVPC Acquisition, TVP Holding owned a 50% membership interest in Torrance Valley Pipeline Company LLC (“TVPC”). Subsequent to the closing of the TVPC Acquisition on May 31, 2019, PBFX owns 100% of the membership interests in TVPC.
(3) Prior to the TVPC Contribution Agreement, the Logistics segment included 100% of the income from operations of TVPC, as TVPC was consolidated by PBFX. PBFX recorded net income attributable to noncontrolling interest for the 50% equity interest in TVPC held by PBF Holding. PBF Holding (included in the Refining segment) recorded equity income in investee related to its 50% noncontrolling ownership interest in TVPC. For purposes of Corporate assets include the Company’s Consolidated Financial Statements, PBF Holding’s equity incomeEquity method investment in investee and PBFX’s net income attributable to noncontrolling interest eliminate in consolidation.
PBF ENERGY INC. AND PBF ENERGY COMPANY LLC
NOTES TO CONSOLIDATED FINANCIAL STATEMENTS
23.20. NET INCOME PER SHARE OF PBF ENERGY
The Company grants certain equity-based compensation awards to employees and non-employee directors that are considered to be participating securities. Due to the presence of participating securities, the Company has calculated net income per share of PBF Energy Class A common stock using the two-class method.
The following table sets forth the computation of basic and diluted net income per share of PBF Energy Class A common stock attributable to PBF Energy for the periods presented:
| | | | | | | | | | | | | | | | | |
| (in millions, except share and per share amounts) | Year Ended December 31, |
| Basic Earnings Per Share: | 2021 | | 2020 | | 2019 |
| Allocation of earnings: | | | | | |
| Net income (loss) attributable to PBF Energy Inc. stockholders | $ | 231.0 | | | $ | (1,392.4) | | | $ | 319.4 | |
| Less: Income allocated to participating securities | — | | | 0.1 | | | 0.5 | |
| Income (loss) available to PBF Energy Inc. stockholders - basic | $ | 231.0 | | | $ | (1,392.5) | | | $ | 318.9 | |
| Denominator for basic net income (loss) per PBF Energy Class A common share-weighted average shares | 120,240,009 | | | 119,617,998 | | | 119,887,646 | |
| Basic net income (loss) attributable to PBF Energy per Class A common share | $ | 1.92 | | | $ | (11.64) | | | $ | 2.66 | |
| | | | | |
| Diluted Earnings Per Share: | | | | | |
| Numerator: | | | | | |
| Income (loss) available to PBF Energy Inc. stockholders - basic | $ | 231.0 | | | $ | (1,392.5) | | | $ | 318.9 | |
Plus: Net income (loss) attributable to noncontrolling interest (1) | 2.4 | | | (17.1) | | | 4.3 | |
Less: Income tax (expense) benefit on net income (loss) attributable to noncontrolling interest (1) | (0.6) | | | 4.6 | | | (1.0) | |
Numerator for diluted net income (loss) per Class A common share - net income (loss) attributable to PBF Energy Inc. stockholders (1) | $ | 232.8 | | | $ | (1,405.0) | | | $ | 322.2 | |
| | | | | |
Denominator (1): | | | | | |
| Denominator for basic net income (loss) per PBF Energy Class A common share-weighted average shares | 120,240,009 | | | 119,617,998 | | | 119,887,646 | |
| Effect of dilutive securities: | | | | | |
| Conversion of PBF LLC Series A Units | 988,730 | | | 1,042,667 | | | 1,207,581 | |
Common stock equivalents (2) | 1,409,415 | | | — | | | 758,072 | |
| | | | | |
| Denominator for diluted net income (loss) per PBF Energy Class A common share-adjusted weighted average shares | 122,638,154 | | | 120,660,665 | | | 121,853,299 | |
| Diluted net income (loss) attributable to PBF Energy Inc. stockholders per Class A common share | $ | 1.90 | | | $ | (11.64) | | | $ | 2.64 | |
| | | | | | | | | | | | | | | | | |
| (in millions, except share and per share amounts) | Year Ended December 31, |
| Basic Earnings Per Share: | 2023 | | 2022 | | 2021 |
| Allocation of earnings: | | | | | |
| Net income attributable to PBF Energy Inc. stockholders | $ | 2,140.5 | | | $ | 2,876.8 | | | $ | 231.0 | |
| Less: Income allocated to participating securities | — | | | — | | | — | |
| Income available to PBF Energy Inc. stockholders - basic | $ | 2,140.5 | | | $ | 2,876.8 | | | $ | 231.0 | |
| Denominator for basic net income per PBF Energy Class A common share-weighted average shares | 124,953,858 | | | 122,598,076 | | | 120,240,009 | |
| Basic net income attributable to PBF Energy per Class A common share | $ | 17.13 | | | $ | 23.47 | | | $ | 1.92 | |
| | | | | |
| Diluted Earnings Per Share: | | | | | |
| Numerator: | | | | | |
| Income available to PBF Energy Inc. stockholders - basic | $ | 2,140.5 | | | $ | 2,876.8 | | | $ | 231.0 | |
Plus: Net income attributable to noncontrolling interest (1) | 20.5 | | | 27.9 | | | 2.4 | |
Less: Income tax expense on net income attributable to noncontrolling interest (1) | (5.3) | | | (7.2) | | | (0.6) | |
Numerator for diluted net income per Class A common share - net income attributable to PBF Energy Inc. stockholders (1) | $ | 2,155.7 | | | $ | 2,897.5 | | | $ | 232.8 | |
| | | | | |
Denominator (1): | | | | | |
| Denominator for basic net income per PBF Energy Class A common share-weighted average shares | 124,953,858 | | | 122,598,076 | | | 120,240,009 | |
| Effect of dilutive securities: | | | | | |
| Conversion of PBF LLC Series A Units | 899,519 | | | 917,991 | | | 988,730 | |
Common stock equivalents (2) | 4,656,071 | | | 3,344,039 | | | 1,409,415 | |
| | | | | |
| Denominator for diluted net income per PBF Energy Class A common share-adjusted weighted average shares | 130,509,448 | | | 126,860,106 | | | 122,638,154 | |
| Diluted net income attributable to PBF Energy Inc. stockholders per Class A common share | $ | 16.52 | | | $ | 22.84 | | | $ | 1.90 | |
PBF ENERGY INC. AND PBF ENERGY COMPANY LLC
NOTES TO CONSOLIDATED FINANCIAL STATEMENTS
——————————
(1) The diluted earnings per share calculation generally assumes the conversion of all outstanding PBF LLC Series A Units to PBF Energy Class A common stock. The net income (loss) attributable to PBF Energy used in the numerator of the diluted earnings per share calculation is adjusted to reflect the net income, (loss), as well as the corresponding income tax expense (benefit) (based on a 25.9%26.0%, 26.6%25.9% and 24.9%25.9% annualized statutory corporate tax rate for the years ended December 31, 2023, 2022 and 2021, 2020 and 2019)respectively) attributable to the converted units.
(2) Represents an adjustment to weighted-average diluted shares outstanding to assume the full exchange of common stock equivalents, including options and warrants for PBF LLC Series A Units and PSUs and options for shares of PBF Energy Class A common stock as calculated under the treasury stock method (to the extent the impact of such exchange would not be anti-dilutive). Common stock equivalents exclude the effects of performance share units and options and warrants to purchase 12,568,275, 14,446,89418,431, 3,877,035 and 6,765,52612,568,275 shares of PBF Energy Class A common stock and PBF LLC Series A units because they are anti-dilutive for the years ended December 31, 2021, 20202023, 2022 and 2019,2021, respectively. For periods showing a net loss, all common stock equivalents and unvested restricted stock are considered anti-dilutive.
PBF ENERGY INC. AND PBF ENERGY COMPANY LLC
NOTES TO CONSOLIDATED FINANCIAL STATEMENTS
24.21. FAIR VALUE MEASUREMENTS
The tables below present information about the Company’s financial assets and liabilities measured and recorded at fair value on a recurring basis and indicate the fair value hierarchy of the inputs utilized to determine the fair values as of December 31, 20212023 and 2020.2022.
The Company has elected to offset the fair value amounts recognized for multiple derivative contracts executed with the same counterparty; however, fair value amounts by hierarchy level are presented on a gross basis in the tables below. The Company hasmay be required to post margin collateral or reclaim cash collateral from derivative counterparties based on contractual terms. At December 31, 2023, the Company had the obligation to return cash collateral posted cash margin with various counterpartiesagainst its derivative obligations of $23.7 million. Cash collateral related to support hedging and trading activities. The cash margin postedderivative contracts is required by counterparties as collateral deposits and cannot be offset against the fair value of open contracts exceptrecorded net in the event of default.Consolidated Balance Sheets. The Company has no derivative contracts that are subject to master netting arrangements that are reflected gross on the Consolidated Balance Sheets.
| | As of December 31, 2021 |
| Fair Value Hierarchy | |
| As of December 31, 2023 | | | As of December 31, 2023 |
| Fair Value Hierarchy | |
| (in millions) | |
| (in millions) | |
| (in millions) | (in millions) | Level 1 | | Level 2 | | Level 3 | | Total Gross Fair Value | | Effect of Counter-party Netting | | Net Carrying Value on Balance Sheet | Level 1 | | Level 2 | | Level 3 | | Total Gross Fair Value | | Effect of Counter-party Netting | | Net Carrying Value on Balance Sheet |
| Assets: | Assets: | |
| Money market funds | |
| Money market funds | |
| Money market funds | Money market funds | $ | 270.1 | | | $ | — | | | $ | — | | | $ | 270.1 | | | N/A | | $ | 270.1 | |
| | Commodity contracts | Commodity contracts | 71.5 | | | — | | | — | | | 71.5 | | | (71.5) | | | — | |
| Derivatives included within inventory intermediation agreement obligations | — | | | 19.7 | | | — | | | 19.7 | | | — | | | 19.7 | |
| | Commodity contracts | |
| | Commodity contracts | |
| | Liabilities: | |
| | Liabilities: | |
| | Liabilities: | Liabilities: | |
| Commodity contracts | Commodity contracts | 79.7 | | | 3.8 | | | — | | | 83.5 | | | (71.5) | | | 12.0 | |
| Catalyst obligations | — | | | 58.4 | | | — | | | 58.4 | | | — | | | 58.4 | |
| Commodity contracts | |
| Commodity contracts | |
| | Renewable energy credit and emissions obligations | |
| Renewable energy credit and emissions obligations | |
| Renewable energy credit and emissions obligations | Renewable energy credit and emissions obligations | — | | | 953.9 | | | — | | | 953.9 | | | — | | | 953.9 | |
| Contingent consideration obligation | Contingent consideration obligation | — | | | — | | | 32.3 | | | 32.3 | | | — | | | 32.3 | |
|
| | As of December 31, 2020 |
| Fair Value Hierarchy | |
| As of December 31, 2022 | | | As of December 31, 2022 |
| Fair Value Hierarchy | |
| (in millions) | |
| (in millions) | |
| (in millions) | (in millions) | Level 1 | | Level 2 | | Level 3 | | Total Gross Fair Value | | Effect of Counter-party Netting | | Net Carrying Value on Balance Sheet | Level 1 | | Level 2 | | Level 3 | | Total Gross Fair Value | | Effect of Counter-party Netting | | Net Carrying Value on Balance Sheet |
| Assets: | Assets: | |
| Money market funds | Money market funds | $ | 411.6 | | | $ | — | | | $ | — | | | $ | 411.6 | | | N/A | | $ | 411.6 | |
| Money market funds | |
| Money market funds | |
| | | Commodity contracts | |
| | Commodity contracts | |
| | Commodity contracts | Commodity contracts | 2.5 | | | 3.5 | | | — | | | 6.0 | | | (6.0) | | | — | |
| Derivatives included within inventory intermediation agreement obligations | Derivatives included within inventory intermediation agreement obligations | — | | | 11.3 | | | — | | | 11.3 | | | — | | | 11.3 | |
| | Liabilities: | Liabilities: | |
| Liabilities: | |
| Liabilities: | |
| Commodity contracts | |
| Commodity contracts | |
| Commodity contracts | Commodity contracts | 2.3 | | | 6.7 | | | — | | | 9.0 | | | (6.0) | | | 3.0 | |
| Catalyst obligations | Catalyst obligations | — | | | 102.5 | | | — | | | 102.5 | | | — | | | 102.5 | |
| Renewable energy credit and emissions obligations | Renewable energy credit and emissions obligations | — | | | 528.1 | | | — | | | 528.1 | | | 0 | | 528.1 | |
| | Contingent consideration obligation | Contingent consideration obligation | — | | | — | | | 12.1 | | | 12.1 | | | — | | | 12.1 | |
| Contingent consideration obligation | |
| Contingent consideration obligation | |
PBF ENERGY INC. AND PBF ENERGY COMPANY LLC
NOTES TO CONSOLIDATED FINANCIAL STATEMENTS
The valuation methods used to measure financial instruments at fair value are as follows:
•Money market funds categorized in Level 1 of the fair value hierarchy are measured at fair value based on quoted market prices and included within Cash and cash equivalents.
•The commodity contracts categorized in Level 1 of the fair value hierarchy are measured at fair value based on quoted prices in an active market. The commodity contracts categorized in Level 2 of the fair value hierarchy are measured at fair value using a market approach based upon future commodity prices for similar instruments quoted in active markets.
•The derivatives included with inventory intermediation agreement obligations and the catalyst obligations are categorized in Level 2 of the fair value hierarchy and are measured at fair value using a market approach based upon commodity prices for similar instruments quoted in active markets.
•Renewable energy credit and emissions obligations primarily represent ourthe Company’s liability for the purchase of (i) biofuel credits (primarily RINs in the U.S.) needed to satisfy ourits obligation to blend biofuels into the products we producethe Company produces and (ii) emission credits under the AB 32 and similar programs (collectively, the cap-and-trade systems). To the degree we arethe Company is unable to blend biofuels (such as ethanol and biodiesel) at percentages required under the biofuel programs, weit must purchase biofuel credits to comply with these programs. Under the cap-and-trade systems, weit must purchase emission credits to comply with these systems. The liability for environmental credits is in part based on ourthe Company’s deficit for such credits as of the balance sheet date, if any, after considering any credits acquired, or under contract, and is equal to the product of the credits deficit and the market price of these credits as of the balance sheet date. To the extent that the Company has a better estimate of the cost at which it settles its obligation, such as agreements to purchase RINs at prices other than the current spot price, the Company considers those costs in valuing the remaining obligation. The environmental credit obligations are categorized in Level 2 of the fair value hierarchy and are measured at fair value using a market approach based on quoted prices from an independent pricing service.
•When applicable, commodity contracts categorized in Level 3 of the fair value hierarchy consist of commodity price swap contracts that relate to forecasted purchases of crude oil for which quoted forward market prices are not readily available due to market illiquidity. The forward prices used to value these swaps are derived using broker quotes, prices from other third-party sources and other available market based data.
•The contingent consideration obligationsobligation at December 31, 20212023 and 2022 is categorized in Level 3 of the fair value hierarchy and areis estimated using discounted cash flow models based on management’s estimate of the future cash flows related to the earn-out periods.
Non-qualified pension plan assets are measured at fair value using a market approach based on published net asset values of mutual funds as a practical expedient. As of December 31, 20212023 and 2020, $20.72022, $18.8 million and $21.2$18.6 million, respectively, were included within Deferred charges and other assets, net for these non-qualified pension plan assets.
PBF ENERGY INC.
NOTES TO CONSOLIDATED FINANCIAL STATEMENTS
The table below summarizes the changes in fair value measurements categorized in Level 3 of the fair value hierarchy, which primarily includes the change in estimated future earnings related to both the Martinez Contingent Consideration and the PBFX Contingent Consideration:
| | | | | | | | | | | | | | | | |
| | | | | | |
| Year Ended December 31, |
| (in millions) | 2021 | | 2020 | | | | | |
| Balance at beginning of period | $ | 12.1 | | | $ | 26.1 | | | | | | |
| Additions | — | | | 77.3 | | | | | | |
| Accretion on discounted liabilities | — | | | 3.8 | | | | | | |
| Settlements | (12.2) | | | (3.0) | | | | | | |
| Unrealized loss (gain) included in earnings | 32.4 | | | (92.1) | | | | | | |
| | | | | | | | |
| | | | | | | | |
| Balance at end of period | $ | 32.3 | | | $ | 12.1 | | | | | | |
PBF ENERGY INC. AND PBF ENERGY COMPANY LLC
NOTES TO CONSOLIDATED FINANCIAL STATEMENTS
| | | | | | | | | | | | | | | | |
| | | | | | |
| Year Ended December 31, |
| (in millions) | 2023 | | 2022 | | | | | |
| Balance at beginning of period | $ | 150.5 | | | $ | 32.3 | | | | | | |
| Additions | — | | | — | | | | | | |
| | | | | | | | |
| Settlements | (88.3) | | | (18.1) | | | | | | |
| Unrealized (gain) loss included in earnings | (40.6) | | | 136.3 | | | | | | |
| | | | | | | | |
| | | | | | | | |
| Balance at end of period | $ | 21.6 | | | $ | 150.5 | | | | | | |
There were no transfers between levels during the years ended December 31, 20212023 and 2020,2022, respectively.
Fair value of debt
The table below summarizes the faircarrying value and carryingfair value of debt as of December 31, 20212023 and 2020.2022.
| | December 31, 2023 | | | December 31, 2023 | | December 31, 2022 |
| (in millions) | | (in millions) | Carrying
value | | Fair
value | | Carrying
value | | Fair
value |
2028 Senior Notes (a) | |
2030 Senior Notes (a) | |
2025 Senior Notes (a) | |
PBFX 2023 Senior Notes (a) | |
| | | December 31, 2021 | | December 31, 2020 |
| (in millions) | Carrying
value | | Fair
value | | Carrying
value | | Fair
value |
2025 Senior Secured Notes (a) | $ | 1,250.0 | | | $ | 1,192.7 | | | $ | 1,250.0 | | | $ | 1,232.9 | |
2028 Senior Notes (a) | 826.5 | | | 520.9 | | | 1,000 | | | 562.5 | |
2025 Senior Notes (a) | 669.5 | | | 475.9 | | | 725.0 | | | 475.3 | |
PBFX 2023 Senior Notes (a) | 525.0 | | | 513.7 | | | 525.0 | | | 503.0 | |
Revolving Credit Facility (b) | 900.0 | | | 900.0 | | | 900.0 | | | 900.0 | |
PBFX Revolving Credit Facility (b) | 100.0 | | | 100.0 | | | 200.0 | | | 200.0 | |
PBF Rail Term Loan (b) | — | | | — | | | 7.4 | | | 7.4 | |
Catalyst financing arrangements (c) | 58.4 | | | 58.4 | | | 102.5 | | | 102.5 | |
Catalyst financing arrangements (b) | |
| | 4,329.4 | | | 3,761.6 | | | 4,709.9 | | | 3,983.6 | |
Catalyst financing arrangements (b) | |
| Catalyst financing arrangements (b) | |
| 1,301.6 | |
| Less - Current debt | Less - Current debt | — | | | — | | | (7.4) | | | (7.4) | |
| | Unamortized premium | 1.4 | | | n/a | | 2.2 | | | n/a |
| Unamortized (discount) premium | |
| Unamortized (discount) premium | |
| Unamortized (discount) premium | | (3.2) | | | n/a | | 0.2 | | | n/a |
| Less - Unamortized deferred financing costs | Less - Unamortized deferred financing costs | (35.0) | | | n/a | | (51.1) | | | n/a | Less - Unamortized deferred financing costs | (52.5) | | | n/a | | n/a | | (36.2) | | | n/a | | n/a |
| Long-term debt | Long-term debt | $ | 4,295.8 | | | $ | 3,761.6 | | | $ | 4,653.6 | | | $ | 3,976.2 | |
(a) The estimated fair value, categorized as a Level 2 measurement, was calculated based on the present value of future expected payments utilizing implied current market interest rates based on quoted prices of the outstanding senior notes.
(b) The estimated fair value approximates carrying value, categorized as a Level 2 measurement, as these borrowings bear interest based upon short-term floating market interest rates.
(c) Catalyst financing arrangements arewere valued using a market approach based upon commodity prices for similar instruments quoted in active markets and are categorized as a Level 2 measurement. The Company has elected the fair value option for accounting for its catalyst repurchase obligations as the Company’s liability iswas directly impacted by the change in fair value of the underlying catalyst.
Non-recurring fair value measurements and disclosures relate to the SBR equity method investment discussed in “Note 6 - Equity investment in SBR. The fair value of the SBR equity method investment was primarily based on the cash consideration received from Eni for their 50 percent ownership.
PBF ENERGY INC. AND PBF ENERGY COMPANY LLC
NOTES TO CONSOLIDATED FINANCIAL STATEMENTS
25.22. DERIVATIVES
The Company uses derivative instruments to mitigate certain exposures to commodity price risk. TheOn July 31, 2023, the Company entered intoterminated the Third Inventory Intermediation Agreement. Prior to its termination, the Third Inventory Intermediation Agreement that containcontained purchase obligations for certain volumes of crude oil, intermediates and refined products. The purchase obligations related to crude oil, intermediates and refined products under these agreements arethis agreement were derivative instruments that have been designated as fair value hedges in order to hedge the commodity price volatility of certain refinery inventory. The fair value of these purchase obligation derivatives iswas based on market prices of the underlying crude oil, intermediates and refined products. The level of activity for these derivatives iswas based on the level of operating inventories.
As of December 31, 2021,2023, there were 2,081,783no barrels of crude oil and feedstocks (noand no barrels at December 31, 2020)of intermediates and refined products outstanding under these derivative instruments designated as fair value hedges. As of December 31, 2021,2022, there were 2,070,5501,945,994 barrels of crude oil and feedstocks and 780,734 barrels of intermediates and refined products (2,604,736 barrels at December 31, 2020) outstanding under these derivative instruments designated as fair value hedges. These volumes represent the notional value of the contract.
The Company also enters into economic hedges primarily consisting of commodity derivative contracts that are not designated as hedges and are used to manage price volatility in certain crude oil and feedstock inventories as well as crude oil, feedstock, and refined product sales or purchases. The objective in entering into economic hedges is consistent with the objectives discussed above for fair value hedges. As of December 31, 2021,2023, there were 36,246,00023,774,000 barrels of crude oil and 5,819,0005,351,000 barrels of refined products (7,183,000(17,890,000 and 2,810,000,12,175,200, respectively, as of December 31, 2020)2022), outstanding under short and long term commodity derivative contracts not designated as hedges representing the notional value of the contracts.
The Company also uses derivative instruments to mitigate the risk associated with the price of credits needed to comply with various governmental and regulatory environmental compliance programs. For such contracts that represent derivatives the Company elects the normal purchase normal sale exception under ASC 815, Derivatives and Hedging, and therefore does not record them at fair value.
The following tables provide information regarding the fair values of derivative instruments as of December 31, 20212023 and December 31, 20202022 and the line items in the Consolidated Balance Sheets in which fair values are reflected.
| | | | | | | | |
| Description |
Balance Sheet Location | Fair Value
Asset/(Liability)Asset |
| | (in millions) |
| Derivatives designated as hedging instruments: | | |
December 31, 2021:2023: | | |
| | |
| Derivatives included within the inventory intermediation agreement obligations | Accrued expenses | $ | 19.7— | |
December 31, 2020:2022: | | |
| | |
| Derivatives included within the inventory intermediation agreement obligations | Accrued expenses | $ | 11.325.1 | |
| | |
| Derivatives not designated as hedging instruments: | | |
December 31, 2021:2023: | | |
| Commodity contracts | Accounts receivable | $ | (12.0)33.2 | |
December 31, 2020:2022: | | |
| Commodity contracts | Accounts receivable | $ | (3.0)13.9 | |
PBF ENERGY INC. AND PBF ENERGY COMPANY LLC
NOTES TO CONSOLIDATED FINANCIAL STATEMENTS
The following table provides information regarding gains or losses recognized in income on derivative instruments and the line items in the Consolidated Statements of Operations in which such gains and losses are reflected.
| | | | | | | | |
| Description | Location of Gain or (Loss) Recognized in
Income on Derivatives | Gain or (Loss)
Recognized in
Income on Derivatives |
| | (in millions) |
| Derivatives designated as hedging instruments: | | |
For the year ended December 31, 2021:2023: | | |
| | |
| Derivatives included within the inventory intermediation agreement obligations | Cost of products and other | $ | 8.421.0 | |
For the year ended December 31, 2020:2022: | | |
| | |
| Derivatives included within the inventory intermediation agreement obligations | Cost of products and other | $ | 12.65.4 | |
For the year ended December 31, 2019:2021: | | |
| | |
| Derivatives included within the inventory intermediation agreement obligations | Cost of products and other | $ | (25.4)8.4 | |
| | |
| Derivatives not designated as hedging instruments: | | |
| For the year ended December 31, 2023: | | |
| | |
| Commodity contracts | Cost of products and other | $ | 38.1 | |
| For the year ended December 31, 2022: | | |
| | |
| Commodity contracts | Cost of products and other | $ | (31.5) | |
| For the year ended December 31, 2021: | | |
| | |
| Commodity contracts | Cost of products and other | $ | (83.4) | |
| For the year ended December 31, 2020: | |
| | |
| Commodity contracts | Cost of products and other | $44.4 | |
| For the year ended December 31, 2019: | |
| | |
Commodity contracts | Cost of products and other | $ | 36.5 | |
| | |
| | |
| | |
| | |
| Hedged items designated in fair value hedges: | | |
For the year ended December 31, 2021:2023: | | |
| | |
| Crude oil, intermediate and refined product inventory | Cost of products and other | $ | (8.4)(21.0) | |
For the year ended December 31, 2020:2022: | | |
| | |
| Crude oil, intermediate and refined product inventory | Cost of products and other | $ | (12.6)(5.4) | |
For the year ended December 31, 2019:2021: | | |
| | |
| Crude oil, intermediate and refined product inventory | Cost of products and other | $ | 25.48.4 | |
| | |
| | |
| | |
The Company had no ineffectiveness related to the fair value hedges as of December 31, 2021, 20202023, 2022 and 2019.
PBF ENERGY INC. AND PBF ENERGY COMPANY LLC
NOTES TO CONSOLIDATED FINANCIAL STATEMENTS
26.23. SUBSEQUENT EVENTS
PBFX DistributionDividend Declared
On February 10, 2022, the Board of Directors of15, 2024, PBF GPEnergy announced a distributiondividend of $0.30$0.25 per unitshare on outstanding PBF Energy Class A common units of PBFX.stock. The distributiondividend is payable on March 10, 202214, 2024, to PBFX unitholdersPBF Energy Class A common stockholders of record as of February 24, 2022.29, 2024.
Share Repurchases
On February 13, 2024, the Company's Board of Directors approved an increase in the repurchase authorization amount under the Repurchase Program from $1.0 billion to $1.75 billion. These repurchases may be made from time to time through various methods, including open market transactions, block trades, accelerated share repurchases, privately negotiated transactions or otherwise, certain of which may be effected through Rule 10b5-1 and Rule 10b-18 plans. The timing and number of shares repurchased will depend on a variety of factors, including price, capital availability, legal requirements and economic and market conditions. The Company is not obligated to purchase any shares under the Repurchase Program, and repurchases may be suspended or discontinued at any time without prior notice.
From January 1, 2024 through February 14, 2024, the Company purchased an additional 1,047,358 shares of PBF Energy’s Class A common stock under the Repurchase Program for $47.9 million, inclusive of commissions paid.
Payments under the Tax Receivable Agreement
In January 2024, the Company made payments of $43.0 million, inclusive of $4.2 million paid to Series B Unit holders, under the Tax Receivable Agreement relating to the 2022 tax year.
ITEM 16. FORM 10-K SUMMARY
Not applicable.
SIGNATURES
Pursuant to the requirements of Section 13 or 15(d) of the Securities Exchange Act of 1934, eachthe registrant has duly caused this report to be signed on its behalf by the undersigned, thereunto duly authorized.
| | | | | | | | |
| | |
PBF ENERGY INC. (Registrant) |
| By: | | /s/ Thomas J. NimbleyMatthew C. Lucey |
| | (Thomas J. Nimbley)Matthew C. Lucey) |
| | President and Chief Executive Officer
(Principal Executive Officer) |
Date: February 17, 202215, 2024
| | | | | | | | |
| | |
PBF ENERGY COMPANY LLC
(Registrant)
|
By: | | /s/ Thomas J. Nimbley |
| | (Thomas J. Nimbley) |
| | Chief Executive Officer
(Principal Executive Officer) |
Date: February 17, 2022
POWER OF ATTORNEY
Each of the officers and directors of PBF Energy Inc., whose signature appears below, in so signing, also makes, constitutes and appoints each of Erik Young,Karen B. Davis, Matthew Lucey and Trecia Canty, and each of them, his true and lawful attorneys-in-fact, with full power and substitution, for him in any and all capacities, to execute and cause to be filed with the SEC any and all amendments to this Annual Report on Form 10-K, with exhibits thereto and other documents connected therewith and to perform any acts necessary to be done in order to file such documents, and hereby ratifies and confirms all that said attorneys-in-fact or their substitute or substitutes may do or cause to be done by virtue hereof.
Pursuant to the requirements of the Securities Exchange Act of 1934, this report has been signed below by the following persons on behalf of the registrant and in the capacities and on the dates indicated.
| | | | | | | | | | | | | | |
| Signature | | Title | | Date |
| | |
| /s/ Thomas J. Nimbley | | Chief Executive Officer andChairman, Chairman of the Board | | February 17, 202215, 2024 |
| (Thomas J. Nimbley) | | of Directors | | |
| | | | |
| /s/ Matthew C. Lucey | | President, Chief Executive Officer, | | February 15, 2024 |
| (Matthew C. Lucey) | | of DirectorsDirector (Principal Executive Officer) | | |
| | |
/s/ Erik YoungKaren B. Davis | | Senior Vice President, Chief Financial Officer | | February 17, 202215, 2024 |
(Erik Young)Karen B. Davis) | | (Principal Financial Officer) | | |
| | |
/s/ John Barone | | Chief Accounting Officer | | February 17, 2022 |
(John Barone) | | ( and Principal Accounting Officer) | | |
| | |
| /s/ Spencer Abraham | | Director | | February 17, 202215, 2024 |
| (Spencer Abraham) | | | | |
| | |
| /s/ Wayne A. Budd | | Director | | February 17, 202215, 2024 |
| (Wayne A. Budd) | | | | |
| | |
/s/ Karen B. Davis | | Director | | February 17, 2022 |
(Karen B. Davis) | | | | |
| | | | |
| /s/ Paul Donahue | | Director | | February 17, 202215, 2024 |
| (Paul Donahue) | | | | |
| | | | |
| /s/ Gene Edwards | | Director | | February 17, 202215, 2024 |
| (Gene Edwards) | | | | |
| | | | |
| | | | |
| | | | |
| | | |
/s/ Robert J. LaviniaGeorganne Hodges | | Director | | February 17, 202215, 2024 |
(Robert J. Lavinia)Georganne Hodges) | | | | |
| | | | |
| /s/ Kimberly S. Lubel | | Director | | February 17, 202215, 2024 |
| (Kimberly S. Lubel) | | | | |
| | | | |
| /s/ George E. Ogden | | Director | | February 17, 202215, 2024 |
| (George E. Ogden) | | | | |
| | | | |
| | Director | | | | |
POWER OF ATTORNEY
Each of the officers of PBF Energy Company LLC, whose signature appears below, in so signing, also makes, constitutes and appoints each of Erik Young, Matthew Lucey and Trecia Canty, and each of them, his true and lawful attorneys-in-fact, with full power and substitution, for him in any and all capacities, to execute and cause to be filed with the SEC any and all amendments to this Annual Report on Form 10-K, with exhibits thereto and other documents connected therewith and to perform any acts necessary to be done in order to file such documents, and hereby ratifies and confirms all that said attorneys-in-fact or their substitute or substitutes may do or cause to be done by virtue hereof.
Pursuant to the requirements of the Securities Exchange Act of 1934, this report has been signed below by the following persons on behalf of the registrant and in the capacities and on the dates indicated.
| | | | | | | | | | | | | | |
Signature(Damian W. Wilmot) | | | | |
| | | | |
| /s/ Lawrence Ziemba | | TitleDirector | | February 15, 2024 |
| (Lawrence Ziemba) | | | Date | |
| | |
| /s/ Thomas J. Nimbley | Chief Executive Officer | | February 17, 2022 |
(Thomas J. Nimbley) | | (Principal Executive Officer) | | |
| | |
/s/ Erik Young | | Senior Vice President, Chief Financial Officer | | February 17, 2022 |
(Erik Young) | | (Principal Financial Officer) | | |
| | |
/s/ John Barone | | Chief Accounting Officer | | February 17, 2022 |
(John Barone) | | (Principal Accounting Officer) | | |
| | |
Managing Member: | | | | |
PBF Energy Inc. | | | | |
/s/ Trecia Canty | | Senior Vice President, General Counsel & Corporate | | February 17, 2022 |
(Trecia Canty) | | Secretary | | |
| | |