| þ | |||||
| ANNUAL REPORT PURSUANT TO SECTION 13 OR 15(d) OF THE SECURITIES EXCHANGE ACT OF 1934 | |||||
| For the fiscal year ended December 31, | |||||
| OR | |||||
| TRANSITION REPORT PURSUANT TO SECTION 13 OR 15(d) OF THE SECURITIES EXCHANGE ACT OF 1934 | |||||
| For the transition period from to | |||||
Maryland | |||||
(State or of | 45-3999996 (I.R.S. Employer Identification No.) | ||||
1300 Post Oak Boulevard, Houston, | |||||
| TX (Address of | 77056 (Zip Code) | ||||
| Title of Each Class | Trading Symbol | Name of Each Exchange on Which Registered | ||||||||||||
| None | N/A | N/A | ||||||||||||
Large accelerated filer | o | Accelerated filer | o | Non-accelerated filer | þ | Smaller reporting company | o | ||||||||||||||||
| Emerging growth company | o | ||||||||||||||||||||||
| First Effective Closing Date | Per Share Public Offering Price | |||
| June 4, 2012 | $ | 10.00 | ||
| January 15, 2015 | $ | 9.75 | ||
| May 7, 2015 | $ | 9.90 | ||
| October 8, 2015 | $ | 9.70 | ||
| November 12, 2015 | $ | 9.55 | ||
| First Effective Closing Date | Per Share Public Offering Price | |||
| January 1, 2016 | $ | 9.00 | ||
| January 21, 2016 | $ | 8.80 | ||
| February 4, 2016 | $ | 8.60 | ||
| February 18, 2016 | $ | 8.50 | ||
| March 24, 2016 | $ | 8.60 | ||
| April 21, 2016 | $ | 8.70 | ||
| May 5, 2016 | $ | 8.80 | ||
| July 28, 2016 | $ | 8.90 | ||
| October 20, 2016 | $ | 9.00 | ||
| November 25, 2016 | $ | 9.05 | ||
| December 15, 2016 | $ | 9.10 | ||
| January 12, 2017 | $ | 9.15 | ||
| January 19, 2017 | $ | 9.30 | ||
| •no more than 25% of |
| Assumed Return on Our Portfolio (net of expenses) | (10)% | (5)% | 0% | 5% | 10% | |||||
| Corresponding return to stockholders | (19.43)% | (11.14)% | (2.85)% | 5.44% | 13.73% | |||||
Assumed Return on Our Portfolio(1) (net of expenses) | (10.0)% | (5.0)% | 0.0% | 5.0% | 10.0% | ||||||||||||||||||||||||
Corresponding Net Return to Common Stock Holder(2) | (23.8)% | (14.7)% | (5.5)% | 3.6% | 12.8% | ||||||||||||||||||||||||
| (1) | (2) | (3) | (4) | |||||||||||||||||||||||||||||||||||
| Title of Class | Amount Authorized | Amount Held by Us or for Our Account | Amount Outstanding Exclusive of Amount Under Column (3) | Title of Class | Amount Authorized | Amount Held by Us or for Our Account | Amount Outstanding Exclusive of Amount Under Column | |||||||||||||||||||||||||||||||
| Common Stock, par value $0.001 per share | 450,000,000 | — | 80,341,230 | |||||||||||||||||||||||||||||||||||
| Date of Transaction | Total number of shares sold | Sale price per share | Proceeds to the Company | ||||||||||||||
| May 1, 2023 | 255,754 | $ | 7.82 | $ | 2,000,000 | ||||||||||||
| August 1, 2023 | 348,542 | $ | 7.89 | $ | 2,750,000 | ||||||||||||
| November 1, 2023 | 475,888 | $ | 7.88 | $ | 3,750,000 | ||||||||||||
| Period | Total number of shares purchased | Average price paid per share | Total number of shares purchased as part of publicly announced plans or programs | Approximate dollar value of shares that may yet be purchased under the plans or programs | |||||||||||||||||||
| October 1 through October 31, 2023 | — | — | — | — | |||||||||||||||||||
| November 1 through November 30, 2023 | 531,085 | $ | 7.73 | 531,085 | N/A | ||||||||||||||||||
December 1 through December 31, 2023(1) | 427,843 | 6.50 | 427,843 | N/A | |||||||||||||||||||
Period (1) | Total Number of Shares Purchased | Average Price Paid per Share | Total Number of Shares Purchased as Part of Publicly Announced Plans or Programs | Maximum Number of Shares that May Yet be Purchased Under the Plans or Programs (2) | |||||
| October 1 through October 31, 2017 | — | — | — | — | |||||
| November 1 through November 30, 2017 | — | — | — | — | |||||
| December 1 through December 31, 2017 | 1,105,578 | $ | 8.10 | 1,105,578 | — | ||||
| Total | 1,105,578 | 1,105,578 | |||||||
| Year Ended December 31, | |||||||||||||||||||
| 2017 | 2016 | 2015 | 2014 | 2013 | |||||||||||||||
| (dollars in thousands) | |||||||||||||||||||
| Statement of operations data: | |||||||||||||||||||
| Investment income: | |||||||||||||||||||
| Non-Control/Non-Affiliate investments | $ | 94,963 | $ | 84,503 | $ | 63,253 | $ | 19,013 | $ | 2,758 | |||||||||
| Affiliate investments | 6,934 | 3,968 | 1,204 | 170 | — | ||||||||||||||
| Control investments | 1,763 | 928 | 932 | 30 | — | ||||||||||||||
| Total investment income | 103,660 | 89,399 | 65,389 | 19,213 | 2,758 | ||||||||||||||
| Expenses: | |||||||||||||||||||
| Interest expense | 18,317 | 15,055 | 11,159 | 3,325 | 419 | ||||||||||||||
| Base management and incentive fees | 24,814 | 20,840 | 18,142 | 6,029 | 784 | ||||||||||||||
| Internal administrative services expenses | 3,014 | 2,315 | 2,037 | 1,497 | 1,018 | ||||||||||||||
| Offering costs | 1,861 | 901 | — | — | — | ||||||||||||||
| Professional fees | 645 | 1,056 | 606 | 478 | 361 | ||||||||||||||
| Insurance | 191 | 191 | 192 | 191 | 186 | ||||||||||||||
| Other general and administrative | 1,518 | 1,440 | 1,280 | 598 | 235 | ||||||||||||||
| Expenses before fee and expense waivers | 50,360 | 41,798 | 33,416 | 12,118 | 3,003 | ||||||||||||||
| Waiver of management and incentive fees | (3,029 | ) | (1,689 | ) | (2,601 | ) | (2,274 | ) | (784 | ) | |||||||||
| Waiver of internal administrative services expenses | (3,014 | ) | (2,315 | ) | (2,037 | ) | (1,497 | ) | (1,018 | ) | |||||||||
| Expense support payment from Adviser | — | — | — | (328 | ) | (153 | ) | ||||||||||||
| Total expenses, net of fee and expense waivers | 44,317 | 37,794 | 28,778 | 8,019 | 1,048 | ||||||||||||||
| Net investment income before taxes | 59,343 | 51,605 | 36,611 | 11,194 | 1,710 | ||||||||||||||
| Income tax expense (benefit), including excise tax | 624 | 336 | 127 | (3 | ) | 5 | |||||||||||||
| Net investment income | 58,719 | 51,269 | 36,484 | 11,197 | 1,705 | ||||||||||||||
| Total realized gain (loss) on investments | (4,363 | ) | (22,891 | ) | (5,508 | ) | 20 | 27 | |||||||||||
| Net realized income | 54,356 | 28,378 | 30,976 | 11,217 | 1,732 | ||||||||||||||
| Total net change in unrealized appreciation (depreciation) on investments | (1,730 | ) | 38,206 | (37,956 | ) | (14,214 | ) | 421 | |||||||||||
| Net increase (decrease) in net assets resulting from operations | $ | 52,626 | $ | 66,584 | $ | (6,980 | ) | $ | (2,997 | ) | $ | 2,153 | |||||||
| Net investment income per share/unit – basic and diluted | $ | 0.76 | $ | 0.75 | $ | 0.75 | $ | 0.70 | $ | 0.64 | |||||||||
| Net realized income per share/unit – basic and diluted | $ | 0.70 | $ | 0.41 | $ | 0.63 | $ | 0.70 | $ | 0.65 | |||||||||
| Net increase (decrease) in net assets from operations per share/unit – basic and diluted | $ | 0.68 | $ | 0.97 | $ | (0.14 | ) | $ | (0.19 | ) | $ | 0.81 | |||||||
| Stockholder distributions declared per share/unit – basic and diluted | $ | 0.70 | $ | 0.70 | $ | 0.70 | $ | 0.70 | $ | 0.70 | |||||||||
| Weighted average shares/units outstanding – basic and diluted | 77,718,813 | 68,029,977 | 48,838,114 | 16,022,853 | 2,648,689 | ||||||||||||||
| As of December 31, | |||||||||||||||||||
| 2017 | 2016 | 2015 | 2014 | 2013 | |||||||||||||||
| (dollars in thousands) | |||||||||||||||||||
| Balance sheet data: | |||||||||||||||||||
| Assets: | |||||||||||||||||||
| Total portfolio investments at fair value | $ | 1,049,439 | $ | 989,247 | $ | 852,988 | $ | 473,862 | $ | 66,882 | |||||||||
| Cash and cash equivalents | 45,791 | 23,719 | 24,001 | 19,868 | 6,356 | ||||||||||||||
| Interest receivable | 8,638 | 7,204 | 7,927 | 4,328 | 399 | ||||||||||||||
| Receivable for securities sold | 4,959 | 7,610 | 1,995 | 3,014 | — | ||||||||||||||
| Prepaid and other assets | 4,072 | 1,268 | 511 | 338 | 109 | ||||||||||||||
| Due from Main Street | — | — | — | — | 19 | ||||||||||||||
| Deferred offering costs (net of accumulated amortization) | — | 680 | 1,107 | 2,388 | 3,688 | ||||||||||||||
| Deferred financing costs (net of accumulated amortization) | 6,163 | 3,840 | 4,883 | 2,426 | 168 | ||||||||||||||
| Total assets | $ | 1,119,062 | $ | 1,033,568 | $ | 893,412 | $ | 506,224 | $ | 77,621 | |||||||||
| Liabilities and net assets: | |||||||||||||||||||
| Accounts payable and other liabilities | $ | 1,459 | $ | 1,164 | $ | 610 | $ | 238 | $ | 66 | |||||||||
| Payable for unsettled trades | — | 932 | — | 6,249 | 2,608 | ||||||||||||||
| Stockholders distributions payable | 4,772 | 4,354 | 3,717 | 1,760 | 295 | ||||||||||||||
| Base management fees payable | 5,682 | 5,054 | 4,521 | 2,080 | — | ||||||||||||||
| Due to affiliates | 59 | 184 | 1,202 | 2,450 | 3,771 | ||||||||||||||
| Directors’ fees payable | 17 | 12 | 14 | 8 | 5 | ||||||||||||||
| Payable for securities purchased | 29,284 | 11,035 | 11,696 | 50,512 | 8,799 | ||||||||||||||
| Credit facilities payable | 430,000 | 413,000 | 380,000 | 182,864 | 14,000 | ||||||||||||||
| Total liabilities | 471,273 | 435,735 | 401,760 | 246,161 | 29,544 | ||||||||||||||
| Total net assets | 647,789 | 597,833 | 491,652 | 260,063 | 48,077 | ||||||||||||||
| Total liabilities and net assets | $ | 1,119,062 | $ | 1,033,568 | $ | 893,412 | $ | 506,224 | $ | 77,621 | |||||||||
| Other data: | |||||||||||||||||||
Weighted average effective yield on LMM debt (1) | 12.2 | % | 12.4 | % | 11.0 | % | 11.3 | % | 15.0 | % | |||||||||
| Number of LMM debt portfolio investments | 28 | 29 | 19 | 11 | 2 | ||||||||||||||
Weighted average effective yield on Middle Market debt (1) | 9.1 | % | 8.8 | % | 8.3 | % | 8.0 | % | 7.3 | % | |||||||||
| Number of Middle Market debt portfolio investments | 59 | 75 | 83 | 77 | 62 | ||||||||||||||
Weighted average effective yield on Private Loan debt (1) | 9.1 | % | 9.2 | % | 8.5 | % | 9.7 | % | 9.5 | % | |||||||||
| Number of Private Loan debt portfolio investments | 38 | 29 | 20 | 11 | 2 | ||||||||||||||
Weighted average effective yield on total portfolio (1) | 8.9 | % | 8.9 | % | 8.3 | % | 8.1 | % | 7.5 | % | |||||||||
| Number of LMM equity portfolio investments | 29 | 28 | 17 | 9 | — | ||||||||||||||
| Number of Middle Market equity portfolio investments | 4 | 5 | — | — | — | ||||||||||||||
Number of Private Loan equity portfolio investments (2) | 11 | 9 | 5 | — | — | ||||||||||||||
| Number of Other Portfolio investments | 7 | 3 | 3 | 1 | — | ||||||||||||||
| Expense ratios (as percentage of average net assets): | |||||||||||||||||||
| Total expenses | 7.14 | % | 7.12 | % | 7.23 | % | 5.62 | % | 4.24 | % | |||||||||
| Operating expenses excluding interest expense | 4.23 | % | 4.25 | % | 4.44 | % | 3.29 | % | 2.55 | % | |||||||||
| As of December 31, 2023 | |||||||||||||||||
| Private Loan | LMM (a) | Middle Market | |||||||||||||||
| (dollars in millions) | |||||||||||||||||
| Number of portfolio companies | 78 | 50 | 16 | ||||||||||||||
| Fair value | $ | 595.3 | $ | 387.0 | $ | 86.0 | |||||||||||
| Cost | $ | 586.4 | $ | 315.7 | $ | 114.7 | |||||||||||
| Debt investments as a % of portfolio (at cost) | 94.1 | % | 70.2 | % | 93.1 | % | |||||||||||
| Equity investments as a % of portfolio (at cost) | 5.9 | % | 29.8 | % | 6.9 | % | |||||||||||
| % of debt investments at cost secured by first priority lien | 100.0 | % | 99.9 | % | 100.0 | % | |||||||||||
| Weighted-average annual effective yield (b) | 13.1 | % | 13.0 | % | 13.0 | % | |||||||||||
| Average EBITDA (c) | $ | 30.5 | $ | 8.8 | $ | 74.2 | |||||||||||
| As of December 31, 2022 | |||||||||||||||||
| Private Loan | LMM (a) | Middle Market | |||||||||||||||
| (dollars in millions) | |||||||||||||||||
| Number of portfolio companies | 70 | 48 | 21 | ||||||||||||||
| Fair value | $ | 559.8 | $ | 352.7 | $ | 126.7 | |||||||||||
| Cost | $ | 563.0 | $ | 312.5 | $ | 159.7 | |||||||||||
| Debt investments as a % of portfolio (at cost) | 96.2 | % | 73.2 | % | 95.0 | % | |||||||||||
| Equity investments as a % of portfolio (at cost) | 3.8 | % | 26.8 | % | 5.0 | % | |||||||||||
| % of debt investments at cost secured by first priority lien | 99.4 | % | 99.9 | % | 98.5 | % | |||||||||||
| Weighted-average annual effective yield (b) | 11.8 | % | 12.1 | % | 11.3 | % | |||||||||||
| Average EBITDA (c) | $ | 36.8 | $ | 8.6 | $ | 79.2 | |||||||||||
| Cost: | December 31, 2023 | December 31, 2022 | ||||||||||||
| First lien debt | 86.5 | % | 88.5 | % | ||||||||||
| Equity | 13.3 | 10.8 | ||||||||||||
| Second lien debt | — | 0.3 | ||||||||||||
| Equity warrants | 0.2 | 0.2 | ||||||||||||
| Other | — | 0.2 | ||||||||||||
| 100.0 | % | 100.0 | % | |||||||||||
| Fair Value: | December 31, 2023 | December 31, 2022 | ||||||||||||
| First lien debt | 78.4 | % | 81.4 | % | ||||||||||
| Equity | 21.5 | 17.9 | ||||||||||||
| Second lien debt | — | 0.3 | ||||||||||||
| Equity warrants | 0.1 | 0.1 | ||||||||||||
| Other | — | 0.3 | ||||||||||||
| 100.0 | % | 100.0 | % | |||||||||||
| Year Ended December 31, | Net Change | ||||||||||||||||||||||
| 2023 | 2022 | Amount | % | ||||||||||||||||||||
| (dollars in thousands) | |||||||||||||||||||||||
| Total investment income | $ | 131,386 | $ | 103,765 | $ | 27,621 | 27 | % | |||||||||||||||
| Total expenses, net of expense waivers | (73,717) | (50,896) | (22,821) | 45 | % | ||||||||||||||||||
| Net investment income | 57,669 | 52,869 | 4,800 | 9 | % | ||||||||||||||||||
| Net realized loss from investments | (34,010) | (3,936) | (30,074) | NM | |||||||||||||||||||
| Net unrealized appreciation (depreciation) from investments | 46,319 | (1,702) | 48,021 | NM | |||||||||||||||||||
| Income tax provision | (3,769) | (1,643) | (2,126) | NM | |||||||||||||||||||
| Net increase in net assets resulting from operations | $ | 66,209 | $ | 45,588 | $ | 20,621 | 45 | % | |||||||||||||||
| Year Ended December 31, | |||||||||||
| 2017 | 2016 | 2015 | |||||||||
| Interest, Fee and Dividend Income: | |||||||||||
| Interest Income | $ | 97,672 | $ | 86,006 | $ | 63,864 | |||||
| Fee Income | 2,374 | 1,260 | 1,073 | ||||||||
| Dividend Income | 3,614 | 2,133 | 452 | ||||||||
| Total Interest, Fee and Dividend Income | $ | 103,660 | $ | 89,399 | $ | 65,389 | |||||
| December 31, 2017 | December 31, 2016 | ||||||||||||||||||||||
| Cost: | LMM | Private Loan | Middle Market | Total | LMM | Private Loan | Middle Market | Total | |||||||||||||||
| First Lien Secured Debt | 69.8 | % | 92.5 | % | 83.1 | % | 84.3 | % | 67.9 | % | 92.0 | % | 81.5 | % | 82.3 | % | |||||||
| Second Lien Secured Debt | — | 1.5 | 16.2 | 9.6 | 3.5 | 0.7 | 16.9 | 11.9 | |||||||||||||||
| Unsecured Debt | — | 3.3 | 0.1 | 1.1 | — | 4.9 | 0.9 | 1.6 | |||||||||||||||
Equity (1) | 29.2 | 2.5 | 0.6 | 4.8 | 26.9 | 2.0 | 0.7 | 3.9 | |||||||||||||||
| Equity Warrants | 1.0 | 0.2 | — | 0.2 | 1.7 | 0.4 | — | 0.3 | |||||||||||||||
| 100.0 | % | 100.0 | % | 100.0 | % | 100.0 | % | 100.0 | % | 100.0 | % | 100.0 | % | 100.0 | % | ||||||||
| December 31, 2017 | December 31, 2016 | ||||||||||||||||||||||
| Fair Value: | LMM | Private Loan | Middle Market | Total | LMM | Private Loan | Middle Market | Total | |||||||||||||||
| First Lien Secured Debt | 64.7 | % | 92.4 | % | 82.1 | % | 83.0 | % | 64.3 | % | 91.5 | % | 81.3 | % | 81.5 | % | |||||||
| Second Lien Secured Debt | — | 1.5 | 17.0 | 9.8 | 3.3 | 0.7 | 17.0 | 11.8 | |||||||||||||||
| Unsecured Debt | — | 3.4 | 0.1 | 1.1 | — | 4.9 | 0.9 | 1.7 | |||||||||||||||
Equity (1) | 34.3 | 2.5 | 0.8 | 5.9 | 30.7 | 2.1 | 0.8 | 4.6 | |||||||||||||||
| Equity Warrants | 1.0 | 0.2 | — | 0.2 | 1.7 | 0.8 | — | 0.4 | |||||||||||||||
| 100.0 | % | 100.0 | % | 100.0 | % | 100.0 | % | 100.0 | % | 100.0 | % | 100.0 | % | 100.0 | % | ||||||||
| Year Ended December 31, | Net Change | |||||||||||||||||||||||||
| 2023 | 2022 | Amount | % | |||||||||||||||||||||||
| (dollars in thousands) | ||||||||||||||||||||||||||
| Interest income | $ | 116,976 | $ | 90,811 | $ | 26,165 | 29 | % | (a) | |||||||||||||||||
| Dividend income | 11,255 | 9,442 | 1,813 | 19 | % | (b) | ||||||||||||||||||||
| Fee income | 3,155 | 3,512 | (357) | (10) | % | |||||||||||||||||||||
| Total investment income | $ | 131,386 | $ | 103,765 | $ | 27,621 | 27 | % | (c) | |||||||||||||||||
| As of December 31, 2017 | |||
Total debt investments (1) | $ | 138,908 | |
Weighted average effective yield on loans(2) | 4.95 | % | |
Largest loan to a single borrower(1) | $ | 3,496 | |
Total of 10 largest loans to borrowers(1) | $ | 30,790 | |
| HMS-ORIX | |||||||||||
| Loan Portfolio | |||||||||||
| As of December 31, 2017 | |||||||||||
| (dollars in thousands) | |||||||||||
| Portfolio Company | Industry | Type of Investment | Principal | Cost | Fair Value | ||||||
| Acosta, Inc. | Commercial Services and Supplies | LIBOR (1 month) + 3.25%, Current Coupon 4.82%, Secured Debt (Maturity - September 26, 2021) | $ | 2,000 | $ | 1,881 | $ | 1,766 | |||
| Acrisure, LLC | Insurance | LIBOR (2 months) + 4.25%, Current Coupon 5.65%, Secured Debt (Maturity - November 22, 2023) | 2,115 | 2,122 | 2,139 | ||||||
| Advantage Sales & Marketing Inc. | Commercial Services and Supplies | LIBOR (1 month) + 3.25%, Current Coupon 4.63%, Secured Debt (Maturity - July 23, 2021) | 1,990 | 1,938 | 1,945 | ||||||
| Air Medical Group Holdings Inc | Health Care Providers & Services | LIBOR (6 months) + 4.00%, Current Coupon 5.67%, Secured Debt (Maturity - April 28, 2022) | 1,990 | 1,981 | 1,993 | ||||||
| HMS-ORIX | |||||||||||
| Loan Portfolio | |||||||||||
| As of December 31, 2017 | |||||||||||
| (dollars in thousands) | |||||||||||
| Portfolio Company | Industry | Type of Investment | Principal | Cost | Fair Value | ||||||
| Albany Molecular Research, Inc. | Life Sciences Tools & Services | LIBOR (1 month) + 3.25%, Current Coupon 4.82%, Secured Debt (Maturity - August 28, 2024) | $ | 100 | $ | 100 | $ | 99 | |||
| Alphabet Holding Company, Inc. | Food Products | LIBOR (1 month) + 3.50%, Current Coupon 5.07%, Secured Debt (Maturity - September 26, 2024) | 1,995 | 1,985 | 1,935 | ||||||
| American Seafoods Group LLC | Food Products | Prime + 2.25%, Current Coupon 6.75%, Secured Debt (Maturity - August 21, 2023) | 1,500 | 1,493 | 1,513 | ||||||
| Ancestry.com Operations Inc. | Internet Software & Services | LIBOR (1 month) + 3.25%, Current Coupon 4.66%, Secured Debt (Maturity - October 19, 2023) | 1,995 | 2,013 | 2,007 | ||||||
| Arch Coal, Inc. | Metals & Mining | LIBOR (1 month) + 3.25%, Current Coupon 4.82%, Secured Debt (Maturity - March 7, 2024) | 1,985 | 1,992 | 2,004 | ||||||
| AshCo, Inc. | Specialty Retail | LIBOR (3 months) + 5.00%, Current Coupon 6.57%, Secured Debt (Maturity - September 25, 2024) | 1,995 | 1,951 | 1,993 | ||||||
| Asurion, LLC | Insurance | LIBOR (1 month) + 3.00%, Current Coupon 4.57%, Secured Debt (Maturity - November 3, 2023) | 1,312 | 1,312 | 1,320 | ||||||
| Atkore International, Inc. | Electric Equipment, Instruments & Components | LIBOR (3 months) + 3.00%, Current Coupon 4.70%, Secured Debt (Maturity - December 22, 2023) | 2,977 | 3,005 | 2,999 | ||||||
| BCP Renaissance Parent L.L.C. | Oil, Gas & Consumable Fuels | LIBOR (3 months) + 4.00%, Current Coupon 5.38%, Secured Debt (Maturity - October 31, 2024) | 600 | 602 | 608 | ||||||
| BMC Software Finance, Inc. | Software | LIBOR (1 month) + 3.25%, Current Coupon 4.82%, Secured Debt (Maturity - September 12, 2022) | 3,156 | 3,181 | 3,163 | ||||||
| Builders FirstSource, Inc. | Building Products | LIBOR (1 month) + 3.00%, Current Coupon 4.69%, Secured Debt (Maturity - February 29, 2024) | 2,977 | 2,974 | 2,993 | ||||||
| Calpine Corporation | Independent Power and Renewable Electricity Producers | LIBOR (3 months) + 2.50%, Current Coupon 4.20%, Secured Debt (Maturity - January 15, 2023) | 1,990 | 1,997 | 1,991 | ||||||
| CHS/Community Health Systems, Inc. | Health Care Providers & Services | LIBOR (3 months) + 3.00%, Current Coupon 4.48%, Secured Debt (Maturity - January 27, 2021) | 1,613 | 1,608 | 1,543 | ||||||
| ClubCorp Holdings, Inc. | Real Estate Management & Development | LIBOR (3 months) + 3.25%, Current Coupon 4.94%, Secured Debt (Maturity - September 18, 2024) | 1,959 | 1,949 | 1,969 | ||||||
| Colorado Buyer Inc | Technology Hardware, Storage & Peripherals | LIBOR (3 months) + 3.00%, Current Coupon 4.38%, Secured Debt (Maturity - May 1, 2024) | 2,985 | 2,995 | 3,008 | ||||||
| Confie Seguros Holding II Co. | Insurance | LIBOR (1 month) + 5.25%, Current Coupon 6.73%, Secured Debt (Maturity - April 19, 2022) | 1,985 | 1,992 | 1,987 | ||||||
| CPI International, Inc. | Aerospace & Defense | LIBOR (1 month) + 3.50%, Current Coupon 5.07%, Secured Debt (Maturity - July 26, 2024) | 1,995 | 1,995 | 2,011 | ||||||
| Diamond Resorts International, Inc. | Hotels, Restaurants & Leisure | LIBOR (1 month) + 4.50%, Current Coupon 6.07%, Secured Debt (Maturity - September 1, 2023) | 2,152 | 2,179 | 2,173 | ||||||
| HMS-ORIX | |||||||||||
| Loan Portfolio | |||||||||||
| As of December 31, 2017 | |||||||||||
| (dollars in thousands) | |||||||||||
| Portfolio Company | Industry | Type of Investment | Principal | Cost | Fair Value | ||||||
| Duff & Phelps Corporation | Diversified Financial Services | LIBOR (3 months) + 3.25%, Current Coupon 4.94%, Secured Debt (Maturity - October 15, 2024) | $ | 491 | $ | 494 | $ | 493 | |||
| LIBOR (3 months) + 3.25%, Current Coupon 4.63%, Secured Debt (Maturity - December 4, 2024) | 2,728 | 2,724 | 2,737 | ||||||||
| 3,219 | 3,218 | 3,230 | |||||||||
| EFS Cogen Holdings I LLC | Electric Utilities | LIBOR (3 months) + 3.25%, Current Coupon 4.95%, Secured Debt (Maturity - June 28, 2023) | 1,904 | 1,917 | 1,925 | ||||||
| Encapsys LLC | Chemicals | LIBOR (1 month) + 3.25%, Current Coupon 4.82%, Secured Debt (Maturity - November 7, 2024) | 1,000 | 1,001 | 1,006 | ||||||
| Endo Luxembourg Finance Company I S.a.r.l. | Pharmaceuticals | LIBOR (1 month) + 4.25%, Current Coupon 5.88%, Secured Debt (Maturity - April 29, 2024) | 1,990 | 2,009 | 2,005 | ||||||
| Envision Healthcare Corporation | Health Care Providers & Services | LIBOR (1 month) + 3.00%, Current Coupon 4.57%, Secured Debt (Maturity - December 1, 2023) | 2,481 | 2,481 | 2,491 | ||||||
| Everi Payments Inc. | Leisure Products | LIBOR (3 months) + 3.50%, Current Coupon 4.98%, Secured Debt (Maturity - May 9, 2024) | 1,990 | 1,983 | 2,013 | ||||||
| Exgen Renewables IV, LLC | Electrical Production | LIBOR (3 months) + 3.00%, Current Coupon 4.47%, Secured Debt (Maturity - November 29, 2024) | 300 | 299 | 304 | ||||||
| First American Payment Systems, L.P. | Diversified Financial Services | LIBOR (1 month) + 5.75%, Current Coupon 7.14%, Secured Debt (Maturity - January 5, 2024) | 952 | 963 | 958 | ||||||
| Fitness International, LLC | Hotels, Restaurants & Leisure | LIBOR (1 month) + 3.50%, Current Coupon 5.19%, Secured Debt (Maturity - July 1, 2020) | 1,735 | 1,757 | 1,760 | ||||||
| Flex Acquisition Company Inc | Containers & Packaging | LIBOR (3 months) + 3.00%, Current Coupon 4.34%, Secured Debt (Maturity - December 29, 2023) | 1,995 | 2,004 | 2,008 | ||||||
| Flexera Software LLC | Software | LIBOR (1 month) + 3.50%, Current Coupon 4.83%, Secured Debt (Maturity - April 2, 2020) | 1,995 | 2,013 | 2,008 | ||||||
| Gardner Denver, Inc. | Machinery | LIBOR (1 month) + 2.75%, Current Coupon 4.44%, Secured Debt (Maturity - July 30, 2024) | 1,995 | 2,005 | 2,004 | ||||||
| Golden Nugget, Inc. | Hotels, Restaurants & Leisure | LIBOR (1 month) + 3.25%, Current Coupon 4.66%, Secured Debt (Maturity - October 4, 2023) | 1,990 | 1,990 | 2,008 | ||||||
| Greatbatch Ltd. | Health Care Equipment & Supplies | LIBOR (1 month) + 3.25%, Current Coupon 4.66%, Secured Debt (Maturity - October 27, 2022) | 2,763 | 2,780 | 2,788 | ||||||
| GYP Holdings III Corp. | Trading Companies & Distributors | LIBOR (1 month) + 3.00%, Current Coupon 4.38%, Secured Debt (Maturity - March 31, 2023) | 3,483 | 3,506 | 3,502 | ||||||
| Harbor Freight Tools USA, Inc. | Specialty Retail | LIBOR (1 month) + 3.25%, Current Coupon 4.82%, Secured Debt (Maturity - August 18, 2023) | 1,980 | 1,987 | 1,996 | ||||||
| HD Supply Waterworks, Ltd. | Trading Companies & Distributors | LIBOR (6 months) + 3.00%, Current Coupon 4.46%, Secured Debt (Maturity - August 1, 2024) | 140 | 140 | 141 | ||||||
| Horizon Pharma, Inc. | Pharmaceuticals | LIBOR (1 month) + 3.25%, Current Coupon 4.75%, Secured Debt (Maturity - March 29, 2024) | 1,990 | 2,009 | 2,001 | ||||||
| HMS-ORIX | |||||||||||
| Loan Portfolio | |||||||||||
| As of December 31, 2017 | |||||||||||
| (dollars in thousands) | |||||||||||
| Portfolio Company | Industry | Type of Investment | Principal | Cost | Fair Value | ||||||
| IG Investments Holdings, LLC | Professional Services | LIBOR (1 month) + 3.50%, Current Coupon 5.19%, Secured Debt (Maturity - October 29, 2021) | $ | 1,990 | $ | 2,002 | $ | 1,992 | |||
| Jackson Hewitt Tax Service Inc. | Diversified Financial Services | LIBOR (1 month) + 7.00%, Current Coupon 8.38%, Secured Debt (Maturity - July 30, 2020) | 1,939 | 1,868 | 1,922 | ||||||
| KMG Chemicals, Inc. | Chemicals | LIBOR (1 month) + 2.75%, Current Coupon 4.32%, Secured Debt (Maturity - June 17, 2024) | 863 | 859 | 868 | ||||||
| KUEHG Corp. | Educational Services | LIBOR (1 month) + 3.75%, Current Coupon 5.44%, Secured Debt (Maturity - August 12, 2022) | 2,482 | 2,489 | 2,493 | ||||||
| LANDesk Group, Inc. | Software | LIBOR (1 month) + 4.25%, Current Coupon 5.82%, Secured Debt (Maturity - January 22, 2024) | 993 | 999 | 947 | ||||||
| Learfield Communications LLC | Media | LIBOR (1 month) + 3.25%, Current Coupon 4.82%, Secured Debt (Maturity - December 1, 2023) | 1,990 | 2,009 | 2,007 | ||||||
| MA FinanceCo., LLC | Electric Equipment, Instruments & Components | LIBOR (1 month) + 2.75%, Current Coupon 4.32%, Secured Debt (Maturity - June 21, 2024) | 387 | 387 | 388 | ||||||
| Mohegan Tribal Gaming Authority | Hotels, Restaurants & Leisure | LIBOR (1 month) + 4.00%, Current Coupon 5.57%, Secured Debt (Maturity - October 13, 2023) | 1,985 | 2,003 | 2,006 | ||||||
| MPH Acquisition Holdings LLC | Health Care Technology | LIBOR (3 months) + 3.00%, Current Coupon 4.69%, Secured Debt (Maturity - June 7, 2023) | 2,896 | 2,935 | 2,905 | ||||||
| NAB Holdings, LLC | IT Services | LIBOR (3 months) + 3.25%, Current Coupon 4.82%, Secured Debt (Maturity - July 1, 2024) | 1,990 | 1,981 | 2,000 | ||||||
| Ortho-Clinical Diagnostics, Inc | Life Sciences Tools & Services | LIBOR (1 month) + 3.75%, Current Coupon 5.44%, Secured Debt (Maturity - June 30, 2021) | 1,985 | 1,980 | 1,992 | ||||||
| PODS, LLC | Transportation & Logistics | LIBOR (1 month) + 3.00%, Current Coupon 4.40%, Secured Debt (Maturity - December 6, 2024) | 1,995 | 1,994 | 2,010 | ||||||
| Rackspace Hosting, Inc. | Electric Equipment, Instruments & Components | LIBOR (3 months) + 3.00%, Current Coupon 4.38%, Secured Debt (Maturity - November 3, 2023) | 3,284 | 3,309 | 3,286 | ||||||
| Radiate Holdco, LLC | Media | LIBOR (3 months) + 3.00%, Current Coupon 4.38%, Secured Debt (Maturity - February 1, 2024) | 2,570 | 2,544 | 2,547 | ||||||
| Red Ventures, LLC | Direct Marketing Services | LIBOR (1 month) + 4.00%, Current Coupon 5.57%, Secured Debt (Maturity - November 8, 2024) | 1,995 | 1,981 | 1,996 | ||||||
| Scientific Games International, Inc. | Leisure Products | LIBOR (1 month) + 3.25%, Current Coupon 4.67%, Secured Debt (Maturity - August 14, 2024) | 399 | 401 | 403 | ||||||
| Seattle Spin Co. | Electric Equipment, Instruments & Components | LIBOR (3 months) + 2.75%, Current Coupon 4.32%, Secured Debt (Maturity - June 21, 2024) | 2,613 | 2,616 | 2,618 | ||||||
| SeaWorld Parks & Entertainment, Inc. | Hotels, Restaurants & Leisure | LIBOR (3 months) + 3.00%, Current Coupon 4.69%, Secured Debt (Maturity - April 1, 2024) | 1,985 | 1,987 | 1,966 | ||||||
| Signode Industrial Group US Inc. | Machinery | LIBOR (1 month) + 2.75%, Current Coupon 4.32%, Secured Debt (Maturity - April 30, 2021) | 2,773 | 2,792 | 2,785 | ||||||
| HMS-ORIX | |||||||||||
| Loan Portfolio | |||||||||||
| As of December 31, 2017 | |||||||||||
| (dollars in thousands) | |||||||||||
| Portfolio Company | Industry | Type of Investment | Principal | Cost | Fair Value | ||||||
| Staples, Inc. | Distributors | LIBOR (3 months) + 4.00%, Current Coupon 5.49%, Secured Debt (Maturity - September 12, 2024) | $ | 2,000 | $ | 1,995 | $ | 1,965 | |||
| Telenet Financing USD LLC | Diversified Telecommunications Services | LIBOR (1 month) + 2.50%, Current Coupon 3.92%, Secured Debt (Maturity - March 2, 2026) | 1,655 | 1,655 | 1,663 | ||||||
| Transdigm, Inc. | Aerospace & Defense | LIBOR (1 month) + 2.75%, Current Coupon 4.32%, Secured Debt (Maturity - June 9, 2023) | 1,985 | 1,992 | 1,990 | ||||||
| LIBOR (1 month) + 3.00%, Current Coupon 4.57%, Secured Debt (Maturity - August 22, 2024) | 1,000 | 998 | 1,006 | ||||||||
| 2,985 | 2,990 | 2,996 | |||||||||
| Travelport Finance (Luxembourg) S.A.R.L. | Internet Software & Services | LIBOR (3 months) + 2.75%, Current Coupon 4.17%, Secured Debt (Maturity - September 2, 2021) | 1,901 | 1,901 | 1,903 | ||||||
| Traverse Midstream Partners LLC | Oil, Gas & Consumable Fuels | LIBOR (3 months) + 4.00%, Current Coupon 5.85%, Secured Debt (Maturity - September 27, 2024) | 781 | 784 | 793 | ||||||
| UFC Holdings, LLC | Media | LIBOR (3 months) + 3.25%, Current Coupon 4.81%, Secured Debt (Maturity - August 18, 2023) | 1,990 | 2,002 | 2,003 | ||||||
| Ultra Resources, Inc. | Oil, Gas & Consumable Fuels | LIBOR (1 month) + 3.00%, Current Coupon 4.41%, Secured Debt (Maturity - April 12, 2024) | 2,000 | 2,002 | 2,002 | ||||||
| Utz Quality Foods, LLC | Commercial Services and Supplies | LIBOR (1 month) + 3.50%, Current Coupon 5.01%, Secured Debt (Maturity - November 21, 2024) | 1,600 | 1,599 | 1,616 | ||||||
| Valeant Pharmaceuticals International, Inc. | Pharmaceuticals | LIBOR (1 month) + 3.50%, Current Coupon 4.94%, Secured Debt (Maturity - April 1, 2022) | 1,546 | 1,553 | 1,570 | ||||||
| Vertiv Group Corporation | Electrical Equipment | LIBOR (3 months) + 4.00%, Current Coupon 5.35%, Secured Debt (Maturity - November 30, 2023) | 1,555 | 1,569 | 1,556 | ||||||
| Vistra Operations Company LLC | Electric Utilities | LIBOR (2 months) + 2.75%, Current Coupon 4.08%, Secured Debt (Maturity - December 14, 2023) | 1,985 | 1,996 | 2,001 | ||||||
| West Corporation | Diversified Telecommunications Services | LIBOR (1 month) + 4.00%, Current Coupon 5.35%, Secured Debt (Maturity - October 10, 2024) | 1,032 | 1,022 | 1,036 | ||||||
| WideOpenWest Finance, LLC | Diversified Telecommunications Services | LIBOR (1 month) + 3.25%, Current Coupon 4.75%, Secured Debt (Maturity - August 18, 2023) | 3,496 | 3,506 | 3,470 | ||||||
| Total Loan Portfolio | $ | 139,017 | $ | 139,012 | |||||||
| HMS-ORIX SLF LLC | |||
| Balance Sheet (Unaudited) | |||
| (dollars in thousands) | |||
| As of December 31, 2017 | |||
| Assets | |||
| Portfolio investments at fair value (amortized cost: $139,017) | $ | 139,012 | |
| Cash and cash equivalents | 2,681 | ||
| Interest receivable | 306 | ||
| Deferred financing costs, net | 890 | ||
| Other assets | 15 | ||
| Total assets | $ | 142,904 | |
| Liabilities | |||
| Credit facilities payable | $ | 86,500 | |
| Payable for securities purchased | 5,268 | ||
| Accounts payable and accrued expenses | 64 | ||
| Total liabilities | 91,832 | ||
| Net assets | |||
| Members’ equity | 51,072 | ||
| Total net assets | 51,072 | ||
| Total liabilities and net assets | $ | 142,904 | |
| HMS-ORIX SLF LLC | |||
| Statement of Operations (Unaudited) | |||
| (dollars in thousands) | |||
| Period from inception (April 4, 2017) to December 31, 2017 | |||
| Investment income | |||
| Interest income | $ | 3,730 | |
| Dividend income | — | ||
| Fee income | — | ||
| Other income | — | ||
| Total investment income | 3,730 | ||
| Expenses | |||
| Interest expense | 1,720 | ||
| Other expenses | 34 | ||
| General and administrative expenses | 64 | ||
| Total expenses | 1,818 | ||
| Net investment income | 1,912 | ||
| Net realized (loss) from investments | (85 | ) | |
| Net realized income | 1,827 | ||
| Net change in unrealized (depreciation) on investments | (5 | ) | |
| Net increase in net assets resulting from operations | $ | 1,822 | |
| December 31, 2017 | December 31, 2016 | ||||||||||||
| Investment Rating | Investments at Fair Value | Percentage of Total Portfolio | Investments at Fair Value | Percentage of Total Portfolio | |||||||||
| 1 | $ | 2,940 | 2.2 | % | $ | 1,541 | 1.3 | % | |||||
| 2 | 47,155 | 34.8 | 56,244 | 48.5 | |||||||||
| 3 | 79,655 | 58.7 | 50,764 | 43.7 | |||||||||
| 4 | 5,439 | 4.0 | 7,511 | 6.5 | |||||||||
| 5 | 468 | 0.3 | — | — | |||||||||
| Totals | $ | 135,657 | 100.0 | % | $ | 116,060 | 100.0 | % | |||||
| Year Ended December 31, | Net Change | |||||||||||||||||||||||||
| 2023 | 2022 | Amount | % | |||||||||||||||||||||||
| (dollars in thousands) | ||||||||||||||||||||||||||
| Interest expense | $ | 36,458 | $ | 24,423 | $ | 12,035 | 49 | % | (a) | |||||||||||||||||
| Base management fees | 19,828 | 19,831 | (3) | — | % | |||||||||||||||||||||
| Incentive fees | 12,569 | 2,130 | 10,439 | 490% | (b) | |||||||||||||||||||||
| Internal administrative services fees | 8,916 | 5,147 | 3,769 | 73 | % | (c) | ||||||||||||||||||||
| General and administrative | 4,254 | 3,905 | 349 | 9 | % | |||||||||||||||||||||
| Total expenses before expense waivers | 82,025 | 55,436 | 26,589 | 48 | % | |||||||||||||||||||||
| Waiver of internal administrative services expenses | (8,308) | (4,540) | (3,768) | 83 | % | |||||||||||||||||||||
| Total expenses | $ | 73,717 | $ | 50,896 | $ | 22,821 | 45 | % | ||||||||||||||||||
| Year Ended December 31, 2023 | |||||||||||||||||||||||||||||||||||||||||||||||
| Full Exits | Partial Exits | Restructures | Other (a) | Total | |||||||||||||||||||||||||||||||||||||||||||
| Net Gain/(Loss) | # of Investments | Net Gain/(Loss) | # of Investments | Net Gain/(Loss) | # of Investments | Net Gain/(Loss) | Net Gain/(Loss) | ||||||||||||||||||||||||||||||||||||||||
| (dollars in thousands) | |||||||||||||||||||||||||||||||||||||||||||||||
| Private Loan portfolio | $ | 554 | 2 | $ | — | — | $ | (18,505) | 2 | $ | (90) | $ | (18,041) | ||||||||||||||||||||||||||||||||||
| LMM portfolio | (9,414) | 3 | — | — | (1,541) | 1 | — | (10,955) | |||||||||||||||||||||||||||||||||||||||
| Middle Market portfolio | 3,127 | 3 | — | — | (10,606) | 2 | 242 | (7,237) | |||||||||||||||||||||||||||||||||||||||
| Other Portfolio | — | — | 2,223 | 1 | — | — | — | 2,223 | |||||||||||||||||||||||||||||||||||||||
| Total net realized gain (loss) | $ | (5,733) | 8 | $ | 2,223 | 1 | $ | (30,652) | 5 | $ | 152 | $ | (34,010) | ||||||||||||||||||||||||||||||||||
| Year Ended December 31, 2022 | |||||||||||||||||||||||||||||||||||||||||||||||
| Full Exits | Partial Exits | Restructures | Other (a) | Total | |||||||||||||||||||||||||||||||||||||||||||
| Net Gain/(Loss) | # of Investments | Net Gain/(Loss) | # of Investments | Net Gain/(Loss) | # of Investments | Net Gain/(Loss) | Net Gain/(Loss) | ||||||||||||||||||||||||||||||||||||||||
| (dollars in thousands) | |||||||||||||||||||||||||||||||||||||||||||||||
| Private Loan portfolio | $ | 5,849 | 2 | $ | — | — | $ | (9,014) | 2 | $ | (27) | $ | (3,192) | ||||||||||||||||||||||||||||||||||
| LMM portfolio | — | — | — | — | (1,456) | 1 | 198 | (1,258) | |||||||||||||||||||||||||||||||||||||||
| Middle Market portfolio | (145) | 3 | — | — | — | — | (42) | (187) | |||||||||||||||||||||||||||||||||||||||
| Other Portfolio | — | — | 779 | 1 | — | — | (78) | 701 | |||||||||||||||||||||||||||||||||||||||
| Total net realized gain (loss) | $ | 5,704 | 5 | $ | 779 | 1 | $ | (10,470) | 3 | $ | 51 | $ | (3,936) | ||||||||||||||||||||||||||||||||||
| Year Ended December 31, 2023 | |||||||||||||||||||||||||||||
| Private Loan | LMM(a) | Middle Market | Other | Total | |||||||||||||||||||||||||
| (dollars in thousands) | |||||||||||||||||||||||||||||
| Accounting reversals of net unrealized (appreciation) depreciation recognized in prior periods due to net realized (gains / income) losses recognized during the current period | $ | 18,295 | $ | 10,428 | $ | 7,785 | $ | (2,225) | $ | 34,283 | |||||||||||||||||||
| Net unrealized appreciation (depreciation) relating to portfolio investments | (6,144) | 20,729 | (3,574) | 1,025 | 12,036 | ||||||||||||||||||||||||
| Total net unrealized appreciation (depreciation) relating to portfolio investments | $ | 12,151 | $ | 31,157 | $ | 4,211 | $ | (1,200) | $ | 46,319 | |||||||||||||||||||
| Year Ended December 31, 2022 | |||||||||||||||||||||||||||||
| Private Loan | LMM(a) | Middle Market | Other | Total | |||||||||||||||||||||||||
| (dollars in thousands) | |||||||||||||||||||||||||||||
| Accounting reversals of net unrealized (appreciation) depreciation recognized in prior periods due to net realized (gains / income) losses recognized during the current period | $ | 3,212 | $ | 1,462 | $ | (978) | $ | (392) | $ | 3,304 | |||||||||||||||||||
| Net unrealized appreciation (depreciation) relating to portfolio investments | (5,997) | 4,289 | (6,769) | 3,471 | (5,006) | ||||||||||||||||||||||||
| Total net unrealized appreciation (depreciation) relating to portfolio investments | $ | (2,785) | $ | 5,751 | $ | (7,747) | $ | 3,079 | $ | (1,702) | |||||||||||||||||||
| Distributions | |||||||
| For the Period Ended | Per Share | Amount | |||||
| 2017 | |||||||
| Three months ended December 31, 2017 | $ | 0.18 | $ | 14,144 | |||
| Three months ended September 30, 2017 | 0.17 | 13,910 | |||||
| Three months ended June 30, 2017 | 0.18 | 13,438 | |||||
| Three months ended March 31, 2017 | 0.17 | 12,922 | |||||
| 2016 | |||||||
| Three months ended December 31, 2016 | 0.18 | 12,767 | |||||
| Three months ended September 30, 2016 | 0.17 | 12,307 | |||||
| Three months ended June 30, 2016 | 0.18 | 11,650 | |||||
| Three months ended March 31, 2016 | 0.17 | 11,037 | |||||
| 2015 | |||||||
| Three months ended December 31, 2015 | 0.18 | 10,564 | |||||
| Three months ended September 30, 2015 | 0.17 | 9,373 | |||||
| Three months ended June 30, 2015 | 0.18 | 7,998 | |||||
| Three months ended March 31, 2015 | 0.17 | 6,260 | |||||
| Payments Due By Period (dollars in thousands) | |||||||||||||||||||
| Total | Less than 1 year | 1-3 years | 3-5 years | After 5 years | |||||||||||||||
EverBank Credit Facility (1) | $ | 82,000 | $ | — | $ | 82,000 | $ | — | $ | — | |||||||||
Deutsche Bank Credit Facility (2) | 348,000 | — | — | 348,000 | — | ||||||||||||||
| Total | $ | 430,000 | $ | — | $ | 82,000 | $ | 348,000 | $ | — | |||||||||
| 2024 | 2025 | 2026 | 2027 | 2028 | Thereafter | Total | |||||||||||||||||||||||||||||||||||
| (dollars in thousands) | |||||||||||||||||||||||||||||||||||||||||
SPV Facility(1) | $ | — | $ | — | $ | — | $ | — | $ | 203,688 | $ | — | $ | 203,688 | |||||||||||||||||||||||||||
| Series A Notes | — | — | 150,000 | — | — | — | 150,000 | ||||||||||||||||||||||||||||||||||
| Interest due on Series A Notes | 6,060 | 6,060 | 6,060 | — | — | — | 18,180 | ||||||||||||||||||||||||||||||||||
Corporate Facility(2) | — | — | 132,000 | — | — | — | 132,000 | ||||||||||||||||||||||||||||||||||
| Total | $ | 6,060 | $ | 6,060 | $ | 288,060 | $ | — | $ | 203,688 | $ | — | $ | 503,868 | |||||||||||||||||||||||||||
| Commitments and Contingencies | |||||||
| (dollars in thousands) | |||||||
| December 31, 2017 | December 31, 2016 | ||||||
| Unfunded Loan Commitments | |||||||
| Apex Linen Services, Inc. | $ | 403 | $ | 397 | |||
| Arcus Hunting, LLC | 976 | 2,136 | |||||
| BarFly Ventures, LLC | 613 | 881 | |||||
| BigName Holdings, LLC | 101 | — | |||||
| Boccella Precast Products, LLC | 500 | — | |||||
| Buca C, LLC | — | 1,548 | |||||
| CapFusion Holding, LLC | — | 394 | |||||
| CDHA Management, LLC | 2,343 | 3,259 | |||||
| Charps, LLC | 1,000 | — | |||||
| Clad-Rex Steel, LLC | 100 | — | |||||
| CTVSH, PLLC | 200 | — | |||||
| Datacom, LLC | 25 | 1,302 | |||||
| Felix Investments Holdings II LLC | 1,667 | — | |||||
| Gamber-Johnson Holdings, LLC | 300 | 300 | |||||
| GST Autoleather Inc. | 1,281 | — | |||||
| Guerdon Modular Holdings, Inc. | 400 | 400 | |||||
| Hawk Ridge Systems, LLC | 400 | 400 | |||||
| Hojeij Branded Foods, Inc. | 1,923 | 2,000 | |||||
| Hostway Corporation | 7 | — | |||||
| HW Temps LLC | 200 | 50 | |||||
| Jackmont Hospitality, Inc. | — | 1,200 | |||||
| LaMi Products, LLC | 294 | 1,729 | |||||
| Market Force Information, Inc. | 400 | — | |||||
| Meisler Operating, LLC | 400 | — | |||||
| Minute Key, Inc. | — | 197 | |||||
| Mystic Logistics, Inc. | 200 | 194 | |||||
| NNE Issuer, LLC | 5,542 | — | |||||
| NuStep, LLC | 300 | — | |||||
| Pardus Oil & Gas, LLC | — | 357 | |||||
| Permian Holdco 2, Inc. | 97 | 290 | |||||
| PPC/Shift, LLC | 500 | 500 | |||||
| Resolute Industrial LLC | 5,750 | — | |||||
| Strike, LLC | — | 2,475 | |||||
| Unirush, LLC | — | 980 | |||||
| Volusion, LLC | — | 2,955 | |||||
| Commitments and Contingencies | |||||||
| (dollars in thousands) | |||||||
| December 31, 2017 | December 31, 2016 | ||||||
| Wireless Vision Holdings, LLC | $ | 2,084 | $ | — | |||
| Unfunded Capital Commitments | |||||||
| Brightwood Capital Fund III, LP | 1,000 | 1,000 | |||||
| Brightwood Capital Fund IV, LP | 9,000 | 10,000 | |||||
| Copper Trail Energy Fund I LP | 2,500 | — | |||||
| Freeport First Lien Loan Fund III, LP | 4,941 | 7,737 | |||||
| Total | $ | 45,447 | $ | 42,681 | |||
| Basis Point Change | Increase (Decrease) in Interest Income | (Increase) Decrease in Interest Expense | Increase (Decrease) in Pre Incentive Fee Net Investment Income | (Increase) Decrease in Incentive Fee Expense | Increase (Decrease) in Net Investment Income | Increase (Decrease) in Net Investment Income per Share | ||||||||||||||||||||||||||||||||
| (dollars in thousands, except per share amounts) | ||||||||||||||||||||||||||||||||||||||
| (200) | $ | (13,142) | $ | 6,714 | $ | (6,428) | $ | 3,678 | $ | (2,750) | $ | (0.03) | ||||||||||||||||||||||||||
| (175) | (11,499) | 5,875 | (5,624) | 3,678 | (1,946) | (0.02) | ||||||||||||||||||||||||||||||||
| (150) | (9,857) | 5,035 | (4,822) | 3,678 | (1,144) | (0.01) | ||||||||||||||||||||||||||||||||
| (125) | (8,214) | 4,196 | (4,018) | 3,171 | (847) | (0.01) | ||||||||||||||||||||||||||||||||
| (100) | (6,571) | 3,357 | (3,214) | 2,367 | (847) | (0.01) | ||||||||||||||||||||||||||||||||
| (75) | (4,928) | 2,518 | (2,410) | 1,563 | (847) | (0.01) | ||||||||||||||||||||||||||||||||
| (50) | (3,286) | 1,678 | (1,608) | 761 | (847) | (0.01) | ||||||||||||||||||||||||||||||||
| (25) | (1,643) | 839 | (804) | 161 | (643) | (0.01) | ||||||||||||||||||||||||||||||||
| 25 | 1,643 | (839) | 804 | (161) | 643 | 0.01 | ||||||||||||||||||||||||||||||||
| 50 | 3,286 | (1,678) | 1,608 | (322) | 1,286 | 0.02 | ||||||||||||||||||||||||||||||||
| 75 | 4,928 | (2,518) | 2,410 | (482) | 1,928 | 0.02 | ||||||||||||||||||||||||||||||||
| 100 | 6,571 | (3,357) | 3,214 | (643) | 2,571 | 0.03 | ||||||||||||||||||||||||||||||||
| 125 | 8,214 | (4,196) | 4,018 | (804) | 3,214 | 0.04 | ||||||||||||||||||||||||||||||||
| 150 | 9,857 | (5,035) | 4,822 | (964) | 3,858 | 0.05 | ||||||||||||||||||||||||||||||||
| 175 | 11,499 | (5,875) | 5,624 | (1,125) | 4,499 | 0.06 | ||||||||||||||||||||||||||||||||
| 200 | 13,142 | (6,714) | 6,428 | (1,286) | 5,142 | 0.06 | ||||||||||||||||||||||||||||||||
| Change in interest rates | Increase (Decrease) in Interest Income | Increase (Decrease) in Interest Expense | Net Increase (Decrease) in Net Investment Income | |||||||||
| Down 100 basis points | $ | (5,713 | ) | $ | (4,300 | ) | $ | (1,413 | ) | |||
| Down 50 basis points | (4,239 | ) | (2,150 | ) | (2,089 | ) | ||||||
| Up 50 basis points | 4,277 | 2,150 | 2,127 | |||||||||
| Up 100 basis points | 8,568 | 4,300 | 4,268 | |||||||||
| Up 200 basis points | 17,152 | 8,600 | 8,552 | |||||||||
| Up 300 basis points | 25,736 | 12,900 | 12,836 | |||||||||
Report of Independent Registered Public Accounting Firm (PCAOB ID Number 248) | |||||
| December 31, 2017 | December 31, 2016 | ||||||
| ASSETS | |||||||
| Portfolio investments at fair value: | |||||||
| Non-Control/Non-Affiliate investments (amortized cost: $948,029 and $935,741 as of December 31, 2017 and December 31, 2016, respectively) | $ | 922,898 | $ | 916,393 | |||
| Affiliate investments (amortized cost: $71,708 and $53,771 as of December 31, 2017 and December 31, 2016, respectively) | 76,862 | 56,312 | |||||
| Control investments (amortized cost: $44,592 and $12,883 as of December 31, 2017 and December 31, 2016, respectively) | 49,679 | 16,542 | |||||
| Total portfolio investments | 1,049,439 | 989,247 | |||||
| Cash and cash equivalents | 45,791 | 23,719 | |||||
| Interest receivable | 8,638 | 7,204 | |||||
| Receivable for securities sold | 4,959 | 7,610 | |||||
| Prepaid and other assets | 4,072 | 1,268 | |||||
| Deferred offering costs (net of accumulated amortization of $0 and $9,919 as of December 31, 2017 and December 31, 2016, respectively) | — | 680 | |||||
| Deferred financing costs (net of accumulated amortization of $309 and $2,862 as of December 31, 2017 and December 31, 2016, respectively) | 6,163 | 3,840 | |||||
| Total assets | $ | 1,119,062 | $ | 1,033,568 | |||
| LIABILITIES | |||||||
| Accounts payable and other liabilities | $ | 1,459 | $ | 1,164 | |||
| Payable for unsettled trades | — | 932 | |||||
| Stockholder distributions payable | 4,772 | 4,354 | |||||
| Base management fees payable | 5,682 | 5,054 | |||||
| Due to affiliates | 59 | 184 | |||||
| Directors’ fees payable | 17 | 12 | |||||
| Payable for securities purchased | 29,284 | 11,035 | |||||
| Credit facilities payable | 430,000 | 413,000 | |||||
| Total liabilities | 471,273 | 435,735 | |||||
| Commitments and Contingencies (Note 13) | |||||||
| NET ASSETS | |||||||
| Common stock, $.001 par value; 150,000,000 shares authorized, 79,511,731 and 73,382,971 issued and outstanding as of December 31, 2017 and December 31, 2016, respectively | 80 | 73 | |||||
| Additional paid in capital | 685,593 | 633,855 | |||||
| Accumulated distributions in excess of net investment income | (22,660 | ) | (22,602 | ) | |||
| Net change in unrealized appreciation (depreciation) on investments | (15,224 | ) | (13,493 | ) | |||
| Total net assets | 647,789 | 597,833 | |||||
| Total liabilities and net assets | $ | 1,119,062 | $ | 1,033,568 | |||
| Net asset value per share | $ | 8.15 | $ | 8.15 | |||
| For The Year Ended December 31, | |||||||||||
| 2017 | 2016 | 2015 | |||||||||
| INVESTMENT INCOME: | |||||||||||
| From non-control/non-affiliate investments: | |||||||||||
| Interest income | $ | 92,159 | $ | 83,037 | $ | 61,956 | |||||
| Fee income | 2,121 | 903 | 944 | ||||||||
| Dividend income | 683 | 563 | 353 | ||||||||
| From affiliate investments: | |||||||||||
| Interest income | 4,850 | 2,229 | 1,060 | ||||||||
| Fee income | 180 | 276 | 45 | ||||||||
| Dividend income | 1,904 | 1,463 | 99 | ||||||||
| From control investments: | |||||||||||
| Interest income | 663 | 740 | 848 | ||||||||
| Fee income | 73 | 81 | 84 | ||||||||
| Dividend income | 1,027 | 107 | — | ||||||||
| Total interest, fee and dividend income | 103,660 | 89,399 | 65,389 | ||||||||
| EXPENSES: | |||||||||||
| Interest expense | 18,317 | 15,055 | 11,159 | ||||||||
| Base management and incentive fees | 24,814 | 20,840 | 18,142 | ||||||||
| Internal administrative services expenses | 3,014 | 2,315 | 2,037 | ||||||||
| Offering costs | 1,861 | 901 | — | ||||||||
| Professional fees | 645 | 1,056 | 606 | ||||||||
| Insurance | 191 | 191 | 192 | ||||||||
| Other general and administrative | 1,518 | 1,440 | 1,280 | ||||||||
| Expenses before fee and expense waivers | 50,360 | 41,798 | 33,416 | ||||||||
| Waiver of incentive fees | (3,029 | ) | (1,689 | ) | (2,601 | ) | |||||
| Waiver of internal administrative services expenses | (3,014 | ) | (2,315 | ) | (2,037 | ) | |||||
| Total expenses, net of fee and expense waivers | 44,317 | 37,794 | 28,778 | ||||||||
| Net investment income before taxes | 59,343 | 51,605 | 36,611 | ||||||||
| Income tax expense (benefit), including excise tax | 624 | 336 | 127 | ||||||||
| NET INVESTMENT INCOME | 58,719 | 51,269 | 36,484 | ||||||||
| NET REALIZED GAIN (LOSS) ON INVESTMENTS | |||||||||||
| Non-Control/Non-Affiliate investments | (5,314 | ) | (22,891 | ) | (5,508 | ) | |||||
| Affiliate investments | 951 | — | — | ||||||||
| Control investments | — | — | — | ||||||||
| Total realized gain (loss) on investments | (4,363 | ) | (22,891 | ) | (5,508 | ) | |||||
| NET REALIZED INCOME | 54,356 | 28,378 | 30,976 | ||||||||
| NET CHANGE IN UNREALIZED APPRECIATION (DEPRECIATION) ON INVESTMENTS | |||||||||||
| Non-Control/Non-Affiliate investments | (5,767 | ) | 34,185 | (40,543 | ) | ||||||
| Affiliate investments | 2,608 | 1,601 | 1,348 | ||||||||
| Control investments | 1,429 | 2,420 | 1,239 | ||||||||
| Total net change in unrealized appreciation (depreciation) on investments | (1,730 | ) | 38,206 | (37,956 | ) | ||||||
| NET INCREASE (DECREASE) IN NET ASSETS RESULTING FROM OPERATIONS | $ | 52,626 | $ | 66,584 | $ | (6,980 | ) | ||||
| PER SHARE INFORMATION – BASIC AND DILUTED | |||||||||||
| NET INVESTMENT INCOME PER SHARE | $ | 0.76 | $ | 0.75 | $ | 0.75 | |||||
| NET REALIZED INCOME PER SHARE | $ | 0.70 | $ | 0.41 | $ | 0.63 | |||||
| NET INCREASE (DECREASE) IN NET ASSETS RESULTING FROM OPERATIONS PER SHARE (EARNINGS PER SHARE) | $ | 0.68 | $ | 0.97 | $ | (0.14 | ) | ||||
| DISTRIBUTIONS DECLARED PER SHARE | $ | 0.70 | $ | 0.70 | $ | 0.70 | |||||
| WEIGHTED AVERAGE SHARES OUTSTANDING – BASIC AND DILUTED | 77,718,813 | 68,029,977 | 48,838,114 | ||||||||
| December 31, 2023 | December 31, 2022 | ||||||||||
| ASSETS | |||||||||||
| Investments at fair value: | |||||||||||
| Control investments (cost: $43,159 and $31,120 as of December 31, 2023 and December 31, 2022, respectively) | $ | 53,644 | $ | 50,303 | |||||||
| Affiliate investments (cost: $231,378 and $241,565 as of December 31, 2023 and December 31, 2022, respectively) | 291,279 | 277,000 | |||||||||
| Non‑Control/Non‑Affiliate investments (cost: $763,781 and $787,201 as of December 31, 2023 and December 31, 2022, respectively) | 747,972 | 740,840 | |||||||||
| Total investments (cost: $1,038,318 and $1,059,886 as of December 31, 2023 and December 31, 2022, respectively) | 1,092,895 | 1,068,143 | |||||||||
| Cash and cash equivalents | 30,786 | 21,312 | |||||||||
| Interest and dividend receivable | 10,541 | 11,917 | |||||||||
| Receivable for securities sold | 171 | 464 | |||||||||
| Deferred financing costs (net of accumulated amortization of $4,168 and $2,413 as of December 31, 2023 and December 31, 2022, respectively) | 3,416 | 2,908 | |||||||||
| Prepaids and other assets | 2,091 | 2,420 | |||||||||
| Total assets | $ | 1,139,900 | $ | 1,107,164 | |||||||
| LIABILITIES | |||||||||||
| Credit Facilities | $ | 335,688 | $ | 321,688 | |||||||
| Series A Notes due 2026 (par: $150,000 as of both December 31, 2023 and December 31, 2022) | 149,155 | 148,856 | |||||||||
| Accounts payable and other liabilities | 255 | 1,292 | |||||||||
| Payable for securities purchased | 206 | — | |||||||||
| Interest payable | 6,266 | 5,443 | |||||||||
| Dividend payable | 14,019 | 12,816 | |||||||||
| Management and incentive fees payable | 8,745 | 7,042 | |||||||||
| Deferred tax liability, net | 3,259 | 362 | |||||||||
| Total liabilities | 517,593 | 497,499 | |||||||||
| Commitments and contingencies (Note J) | |||||||||||
| NET ASSETS | |||||||||||
| Common stock, $0.001 par value per share (450,000,000 shares authorized; 80,108,865 and 80,105,999 shares issued and outstanding as of December 31, 2023 and December 31, 2022, respectively) | 80 | 80 | |||||||||
| Additional paid‑in capital | 686,136 | 684,165 | |||||||||
| Total overdistributed earnings | (63,909) | (74,580) | |||||||||
| Total net assets | 622,307 | 609,665 | |||||||||
| Total liabilities and net assets | $ | 1,139,900 | $ | 1,107,164 | |||||||
| NET ASSET VALUE PER SHARE | $ | 7.77 | $ | 7.61 | |||||||
| Year Ended December 31, | |||||||||||||||||
| 2023 | 2022 | 2021 | |||||||||||||||
| INVESTMENT INCOME: | |||||||||||||||||
| Interest, fee and dividend income: | |||||||||||||||||
| Control investments | $ | 3,101 | $ | 3,223 | $ | 2,810 | |||||||||||
| Affiliate investments | 29,805 | 24,057 | 18,244 | ||||||||||||||
| Non‑Control/Non‑Affiliate investments | 98,480 | 76,485 | 69,074 | ||||||||||||||
| Total investment income | 131,386 | 103,765 | 90,128 | ||||||||||||||
| EXPENSES: | |||||||||||||||||
| Interest | (36,458) | (24,423) | (14,469) | ||||||||||||||
| Base management fees | (19,828) | (19,831) | (17,316) | ||||||||||||||
| Incentive fees | (12,569) | (2,130) | (557) | ||||||||||||||
| Internal administrative services expenses | (8,916) | (5,147) | (4,317) | ||||||||||||||
| General and administrative | (4,254) | (3,905) | (4,427) | ||||||||||||||
| Total expenses before expense waivers | (82,025) | (55,436) | (41,086) | ||||||||||||||
| Waiver of internal administrative services expenses | 8,308 | 4,540 | 4,317 | ||||||||||||||
| Total expenses, net of expense waivers | (73,717) | (50,896) | (36,769) | ||||||||||||||
| NET INVESTMENT INCOME | 57,669 | 52,869 | 53,359 | ||||||||||||||
| NET REALIZED GAIN (LOSS): | |||||||||||||||||
| Control investments | 2,223 | — | — | ||||||||||||||
| Affiliate investments | (7,188) | (7,327) | (2,673) | ||||||||||||||
| Non‑Control/Non‑Affiliate investments | (29,045) | 3,391 | 2,175 | ||||||||||||||
| Realized loss on extinguishment of debt | — | — | (2,430) | ||||||||||||||
| Total net realized loss | (34,010) | (3,936) | (2,928) | ||||||||||||||
| NET UNREALIZED APPRECIATION (DEPRECIATION): | |||||||||||||||||
| Control investments | (1,289) | 1,503 | 2,001 | ||||||||||||||
| Affiliate investments | 25,116 | 15,689 | 10,237 | ||||||||||||||
| Non‑Control/Non‑Affiliate investments | 22,492 | (18,894) | 12,857 | ||||||||||||||
| Total net unrealized appreciation (depreciation) | 46,319 | (1,702) | 25,095 | ||||||||||||||
| INCOME TAXES: | |||||||||||||||||
| Federal and state income, excise and other taxes | (872) | (1,281) | (1,890) | ||||||||||||||
| Deferred taxes | (2,897) | (362) | — | ||||||||||||||
| Income tax provision | (3,769) | (1,643) | (1,890) | ||||||||||||||
| NET INCREASE IN NET ASSETS RESULTING FROM OPERATIONS | $ | 66,209 | $ | 45,588 | $ | 73,636 | |||||||||||
| NET INVESTMENT INCOME PER SHARE—BASIC AND DILUTED | $ | 0.72 | $ | 0.66 | $ | 0.67 | |||||||||||
| NET INCREASE IN NET ASSETS RESULTING FROM OPERATIONS PER SHARE—BASIC AND DILUTED | $ | 0.82 | $ | 0.57 | $ | 0.92 | |||||||||||
| WEIGHTED-AVERAGE SHARES OUTSTANDING—BASIC AND DILUTED | 80,269,002 | 79,993,040 | 79,873,537 | ||||||||||||||
| For The Year Ended December 31, | ||||||||||||
| 2017 | 2016 | 2015 | ||||||||||
| Change in Net Assets from Operations: | ||||||||||||
| Net investment income | $ | 58,719 | $ | 51,269 | $ | 36,484 | ||||||
| Net realized loss on investments | (4,363 | ) | (22,891 | ) | (5,508 | ) | ||||||
| Net change in unrealized appreciation (depreciation) on investments | (1,730 | ) | 38,206 | (37,956 | ) | |||||||
| Net increase (decrease) in net assets resulting from operations | 52,626 | 66,584 | (6,980 | ) | ||||||||
| Change in Net Assets from Stockholders’ Distributions: | ||||||||||||
| Distributions from net investment income | (54,414 | ) | (47,761 | ) | (34,195 | ) | ||||||
| Distributions from net realized gain on investments | — | — | — | |||||||||
| Net decrease in net assets resulting from stockholders’ distributions | (54,414 | ) | (47,761 | ) | (34,195 | ) | ||||||
| Change in Net Assets from Capital Share Transactions: | ||||||||||||
| Issuance of common stock, net of issuance costs | 47,077 | 73,491 | 263,372 | |||||||||
| Reinvestment of stockholder distributions | 27,641 | 24,766 | 16,937 | |||||||||
| Repurchase of common stock | (22,974 | ) | (10,899 | ) | (2,955 | ) | ||||||
| Offering costs | — | — | (4,590 | ) | ||||||||
| Net increase in net assets resulting from capital share transactions | 51,744 | 87,358 | 272,764 | |||||||||
| Total Increase in Net Assets | 49,956 | 106,181 | 231,589 | |||||||||
| Net Assets at beginning of period | 597,833 | 491,652 | 260,063 | |||||||||
| Net Assets at end of the period | $ | 647,789 | $ | 597,833 | $ | 491,652 | ||||||
| NAV per share at end of the period | $ | 8.15 | $ | 8.15 | $ | 7.88 | ||||||
| Common shares outstanding, beginning of period | 73,382,971 | 62,382,044 | 30,967,120 | |||||||||
| Issuance of common shares | 5,625,617 | 9,271,585 | 29,856,266 | |||||||||
| Issuance of common shares pursuant to distribution reinvestment plan | 3,316,991 | 3,115,762 | 1,918,998 | |||||||||
| Repurchase of common shares | (2,813,848 | ) | (1,386,420 | ) | (360,340 | ) | ||||||
| Common shares outstanding, end of period | 79,511,731 | 73,382,971 | 62,382,044 | |||||||||
| Common Stock | Additional Paid-In Capital | Total Overdistributed Earnings | Total Net Asset Value | ||||||||||||||||||||||||||
| Number of Shares | Par Value | ||||||||||||||||||||||||||||
| Balances at December 31, 2020 | 79,608,304 | $ | 80 | $ | 682,028 | $ | (102,484) | $ | 579,624 | ||||||||||||||||||||
| Issuance of common stock | 89,705 | — | 674 | — | 674 | ||||||||||||||||||||||||
| Dividend reinvestment | 1,461,714 | 1 | 11,159 | — | 11,160 | ||||||||||||||||||||||||
| Common stock repurchased | (1,333,118) | (1) | (10,064) | — | (10,065) | ||||||||||||||||||||||||
| Net increase resulting from operations | — | — | — | 73,636 | 73,636 | ||||||||||||||||||||||||
| Dividends to stockholders | — | — | — | (41,859) | (41,859) | ||||||||||||||||||||||||
| Reclassification for certain permanent book-to-tax differences | — | — | (1,371) | 1,371 | — | ||||||||||||||||||||||||
| Balances at December 31, 2021 | 79,826,605 | $ | 80 | $ | 682,426 | $ | (69,336) | $ | 613,170 | ||||||||||||||||||||
| Issuance of common stock | 94,697 | — | 750 | — | 750 | ||||||||||||||||||||||||
| Dividend reinvestment | 2,259,611 | 2 | 17,748 | — | 17,750 | ||||||||||||||||||||||||
| Common stock repurchased | (2,074,914) | (2) | (15,984) | — | (15,986) | ||||||||||||||||||||||||
| Net increase resulting from operations | — | — | — | 45,588 | 45,588 | ||||||||||||||||||||||||
| Dividends to stockholders | — | — | — | (51,607) | (51,607) | ||||||||||||||||||||||||
| Reclassification for certain permanent book-to-tax differences | — | — | (775) | 775 | — | ||||||||||||||||||||||||
| Balances at December 31, 2022 | 80,105,999 | $ | 80 | $ | 684,165 | $ | (74,580) | $ | 609,665 | ||||||||||||||||||||
| Issuance of common stock | 1,080,185 | 1 | 8,499 | — | 8,500 | ||||||||||||||||||||||||
| Dividend reinvestment | 2,345,246 | 2 | 18,415 | — | 18,417 | ||||||||||||||||||||||||
| Common stock repurchased | (3,422,565) | (3) | (24,424) | — | (24,427) | ||||||||||||||||||||||||
| Net increase resulting from operations | — | — | — | 66,209 | 66,209 | ||||||||||||||||||||||||
| Dividends to stockholders | — | — | — | (56,057) | (56,057) | ||||||||||||||||||||||||
| Reclassification for certain permanent book-to-tax differences | — | — | (519) | 519 | — | ||||||||||||||||||||||||
| Balances at December 31, 2023 | 80,108,865 | $ | 80 | $ | 686,136 | $ | (63,909) | $ | 622,307 | ||||||||||||||||||||
| For The Year Ended December 31, | |||||||||||
| 2017 | 2016 | 2015 | |||||||||
| CASH FLOWS FROM OPERATING ACTIVITIES | |||||||||||
| Net increase (decrease) in net assets resulting from operations | $ | 52,626 | $ | 66,584 | $ | (6,980 | ) | ||||
| Adjustments to reconcile net increase (decrease) in net assets resulting from operations to net cash generated from (used in) operating activities: | |||||||||||
| Principal repayments received, proceeds from sales of investments in portfolio companies | 525,018 | 349,564 | 176,066 | ||||||||
| Investments in portfolio companies | (551,797 | ) | (464,882 | ) | (631,126 | ) | |||||
| Net change in unrealized depreciation (appreciation) on investments | 1,730 | (38,206 | ) | 37,956 | |||||||
| Net realized loss on sale of portfolio investments | 4,363 | 22,891 | 5,508 | ||||||||
| Amortization of deferred financing costs | 1,327 | 1,492 | 1,161 | ||||||||
| Amortization of deferred offering costs | 1,861 | 901 | — | ||||||||
| Accretion of unearned income | (15,127 | ) | (11,946 | ) | (4,378 | ) | |||||
| Net payment-in-kind interest accrual | (1,255 | ) | (469 | ) | (1,223 | ) | |||||
| Changes in other assets and liabilities: | |||||||||||
| Interest receivable | (1,434 | ) | 723 | (3,599 | ) | ||||||
| Prepaid and other assets | (5,040 | ) | 103 | 101 | |||||||
| Due to affiliates | (60 | ) | 24 | 4,623 | |||||||
| Base management fees payable | 628 | 533 | 2,441 | ||||||||
| Accounts payable and other liabilities | 295 | 204 | 302 | ||||||||
| Directors’ fees payable | 5 | (2 | ) | 6 | |||||||
| Payable for unsettled trades | (932 | ) | 932 | (6,249 | ) | ||||||
| Net cash generated from (used in) operating activities | 12,208 | (71,554 | ) | (425,391 | ) | ||||||
| CASH FLOWS FROM FINANCING ACTIVITIES | |||||||||||
| Proceeds from issuance of common stock | 51,109 | 80,611 | 284,481 | ||||||||
| Redemption of common stock | (22,974 | ) | (10,899 | ) | (2,955 | ) | |||||
| Payment of selling commissions and dealer manager fees | (4,118 | ) | (7,033 | ) | (25,699 | ) | |||||
| Payment of offering costs | (1,160 | ) | (1,603 | ) | (4,590 | ) | |||||
| Payment of stockholder distributions | (26,356 | ) | (22,359 | ) | (15,301 | ) | |||||
| Repayments on credit facilities payable | (480,276 | ) | (388,000 | ) | (176,664 | ) | |||||
| Proceeds from credit facilities payable | 497,276 | 421,000 | 373,800 | ||||||||
| Payment of deferred financing costs | (3,637 | ) | (445 | ) | (3,548 | ) | |||||
| Net cash generated from financing activities | 9,864 | 71,272 | 429,524 | ||||||||
| Net increase (decrease) in cash and cash equivalents | 22,072 | (282 | ) | 4,133 | |||||||
| CASH AND CASH EQUIVALENTS AT THE BEGINNING OF THE PERIOD | 23,719 | 24,001 | 19,868 | ||||||||
| CASH AND CASH EQUIVALENTS AT THE END OF THE PERIOD | $ | 45,791 | $ | 23,719 | $ | 24,001 | |||||
| Year Ended December 31, | |||||||||||||||||
| 2023 | 2022 | 2021 | |||||||||||||||
| CASH FLOWS FROM OPERATING ACTIVITIES | |||||||||||||||||
| Net increase in net assets resulting from operations | $ | 66,209 | $ | 45,588 | $ | 73,636 | |||||||||||
| Adjustments to reconcile net increase in net assets resulting from operations to net cash provided by (used in) operating activities: | |||||||||||||||||
| Investments in portfolio companies | (236,404) | (217,226) | (546,882) | ||||||||||||||
| Proceeds from sales and repayments of debt investments in portfolio companies | 223,154 | 247,455 | 312,806 | ||||||||||||||
| Proceeds from sales and return of capital of equity investments in portfolio companies | 15,595 | — | — | ||||||||||||||
| Net unrealized (appreciation) depreciation | (46,319) | 1,702 | (25,095) | ||||||||||||||
| Net realized loss on portfolio investments | 34,010 | 3,936 | 498 | ||||||||||||||
| Realized loss on extinguishment of debt | — | — | 2,430 | ||||||||||||||
| Amortization of deferred financing costs | 2,053 | 1,463 | 1,277 | ||||||||||||||
| Amortization of deferred offering costs | 129 | 276 | 230 | ||||||||||||||
| Accretion of unearned income | (7,833) | (5,054) | (5,139) | ||||||||||||||
| Payment-in-kind interest | (5,023) | (4,057) | (5,361) | ||||||||||||||
| Cumulative dividends | (172) | (669) | — | ||||||||||||||
| Deferred tax provision | 2,897 | 362 | — | ||||||||||||||
| Changes in other assets and liabilities: | |||||||||||||||||
| Interest and dividend receivable | 116 | 1,074 | (4,688) | ||||||||||||||
| Prepaid and other assets | 329 | (361) | 380 | ||||||||||||||
| Management and incentive fees payable | 1,703 | 1,853 | 1,137 | ||||||||||||||
| Interest payable | 823 | 2,350 | 2,807 | ||||||||||||||
| Accounts payable and other liabilities | (1,037) | (2,016) | 816 | ||||||||||||||
| Net cash provided by (used in) operating activities | 50,230 | 76,676 | (191,148) | ||||||||||||||
| CASH FLOWS FROM FINANCING ACTIVITIES | |||||||||||||||||
| Issuance of common stock | 8,500 | 750 | 674 | ||||||||||||||
| Redemption of common stock | (24,427) | (15,984) | (10,065) | ||||||||||||||
| Payment of offering costs | (129) | (276) | (230) | ||||||||||||||
| Dividends paid | (36,438) | (33,018) | (18,725) | ||||||||||||||
| Proceeds from Credit Facilities | 150,000 | 115,000 | 489,688 | ||||||||||||||
| Repayments on Credit Facilities | (136,000) | (220,000) | (364,816) | ||||||||||||||
| Proceeds from Series A Notes due 2026 | — | 72,500 | 77,500 | ||||||||||||||
| Proceeds from Main Street Term Loan | — | — | 60,000 | ||||||||||||||
| Repayments of Main Street Term Loan | — | — | (60,000) | ||||||||||||||
| Payment of deferred financing costs | (2,262) | (149) | (6,131) | ||||||||||||||
| Net cash provided by (used in) financing activities | (40,756) | (81,177) | 167,895 | ||||||||||||||
| Net increase (decrease) in cash and cash equivalents | 9,474 | (4,501) | (23,253) | ||||||||||||||
| CASH AND CASH EQUIVALENTS AT BEGINNING OF PERIOD | 21,312 | 25,813 | 49,066 | ||||||||||||||
| CASH AND CASH EQUIVALENTS AT END OF PERIOD | $ | 30,786 | $ | 21,312 | $ | 25,813 | |||||||||||
| Supplemental cash flow disclosures: | |||||||||||||||||
| Interest paid | $ | 33,594 | $ | 20,610 | $ | 10,385 | |||||||||||
| Taxes paid | $ | 2,003 | $ | 2,469 | $ | 1,324 | |||||||||||
| Non-cash financing activities: | |||||||||||||||||
| Dividends declared and unpaid | $ | 14,019 | $ | 12,816 | $ | 11,974 | |||||||||||
| Value of shares issued pursuant to the DRIP | $ | 18,417 | $ | 17,750 | $ | 11,160 | |||||||||||
HMS Income Fund, Inc. Consolidated Schedule of Investments | ||||||||||||
| As of December 31, 2017 | ||||||||||||
| (dollars in thousands) | ||||||||||||
| Portfolio Company (1) (3) | Business Description | Type of Investment (2) (3) | Index Rate (22) | Principal (7) | Cost (7) | Fair Value (26) | ||||||
| Control Investments (6) | ||||||||||||
| Copper Trail Energy Fund I, LP (9)(15)(16) | Investment Partnership | LP Interests (Copper Trail Energy Fund I, LP) (Fully diluted 30.1%) | — | $ | — | $ | 2,500 | $ | 2,500 | |||
| GRT Rubber Technologies, LLC (8) (10) (13) | Engineered Rubber Product Manufacturer | LIBOR Plus 9.00% (Floor 1.00%), Current Coupon 10.36%, Secured Debt (Maturity - December 19, 2019) | 1 month LIBOR | 5,715 | 5,657 | 5,715 | ||||||
| Member Units (2,896 shares) (16) | — | — | 6,435 | 10,821 | ||||||||
| 12,092 | 16,536 | |||||||||||
| HMS-ORIX SLF LLC (9) (15) | Investment Partnership | Membership Interests (Fully diluted 60.00%) (16) | — | — | 30,000 | 30,643 | ||||||
| Subtotal Control Investments (6) (5% of total investments at fair value) | $ | 44,592 | $ | 49,679 | ||||||||
| Affiliate Investments (4) | ||||||||||||
| AFG Capital Group, LLC (10) (13) | Provider of Rent-to-Own Financing Solutions and Services | Member Units (46 shares) (16) | — | $ | — | $ | 300 | $ | 897 | |||
| Warrants (10 equivalent shares, Expiration - November 7, 2024) | — | — | 65 | 215 | ||||||||
| 365 | 1,112 | |||||||||||
| Charps, LLC (10) (13) | Pipeline Maintenance and Construction | 12.00% Secured Debt (Maturity - January 31, 2022) | None | 4,600 | 4,497 | 4,500 | ||||||
| Preferred Member Units (400 units) | — | — | 100 | 163 | ||||||||
| 4,597 | 4,663 | |||||||||||
| Clad-Rex Steel, LLC (10) (13) | Specialty Manufacturer of Vinyl-Clad Metal | LIBOR Plus 9.50% (Floor 1.00%), Current Coupon 10.86%, Secured Debt (Maturity - December 20, 2021) (8) | 1 month LIBOR | 3,320 | 3,264 | 3,320 | ||||||
| Member Units (179 units) (16) | — | — | 1,820 | 2,375 | ||||||||
| 10.00% Secured Debt (Clad-Rex Steel RE Investor, LLC) (Maturity - December 19, 2036) | None | 296 | 293 | 293 | ||||||||
| Member Units (Clad-Rex Steel RE Investor, LLC) (200 units) | — | — | 53 | 70 | ||||||||
| 5,430 | 6,058 | |||||||||||
| Freeport First Lien Loan Fund III, LP (9) (15) | Investment Partnership | LP Interests (Freeport First Lien Loan Fund III, LP) (Fully diluted 5.60%) (16) | — | — | 8,558 | 8,506 | ||||||
| Gamber-Johnson Holdings, LLC (8) (10) (13) | Manufacturer of Ruggedized Computer Mounting Systems | LIBOR Plus 11.00% (Floor 1.00%), Current Coupon 12.36%, Secured Debt (Maturity - June 24, 2021) | 1 month LIBOR | 5,850 | 5,750 | 5,850 | ||||||
| Member Units (2,155 units) (16) | — | — | 3,711 | 5,843 | ||||||||
| 9,461 | 11,693 | |||||||||||
| Guerdon Modular Holdings, Inc. (10) (13) | Multi-Family and Commercial Modular Construction Company | 13.00% Secured Debt (Maturity - August 13, 2019) | None | 2,677 | 2,644 | 2,660 | ||||||
| Common Stock (53,008 shares) | — | — | 746 | — | ||||||||
| Class B Preferred Stock (101,250 shares) | — | — | 285 | — | ||||||||
| 3,675 | 2,660 | |||||||||||
| Gulf Publishing Investor, LLC (10) (13) | Energy Focused Media and Publishing | 12.50% Secured Debt (Maturity - April 29, 2021) | None | 3,200 | 3,151 | 3,151 | ||||||
| LIBOR Plus 9.50% (Floor 1.00%), Current Coupon 10.86%, Secured Debt (Maturity - September 30, 2020) (8) | 1 month LIBOR | 20 | 20 | 20 | ||||||||
| Member Units (781 shares) | — | — | 920 | 1,210 | ||||||||
| 4,091 | 4,381 | |||||||||||
| Harris Preston Fund Investments (15) (16) | Investment Partnership | LP Interests (HPEP 3, LP) (Fully diluted 9.60%) (9) | — | — | 943 | 943 | ||||||
| LP Interests (2717 MH, LP) (Fully diluted 7.00%) | — | — | 536 | 536 | ||||||||
| 1,479 | 1,479 | |||||||||||
| Hawk Ridge Systems, LLC (9) (10) (13) | Value-Added Reseller of Engineering Design and Manufacturing Solutions | 11.00% Secured Debt (Maturity - December 2, 2021) | None | $ | 3,575 | $ | 3,513 | $ | 3,574 | |||
| Preferred Member Units (56 units) (16) | — | — | 713 | 950 | ||||||||
| Preferred Member Units (HRS Services, ULC) (56 units) (16) | — | — | 38 | 50 | ||||||||
| 4,264 | 4,574 | |||||||||||
| HW Temps LLC (8) (10) (13) | Temporary Staffing Solutions | LIBOR Plus 11.00% (Floor 1.00%), Current Coupon 12.36%, Secured Debt (Maturity - July 2, 2020) | 1 month LIBOR | 2,494 | 2,454 | 2,454 | ||||||
| Preferred Member Units (800 shares) (16) | — | — | 986 | 985 | ||||||||
| 3,440 | 3,439 | |||||||||||
| Market Force Information, Inc. (8)(10)(13) | Provider of Customer Experience Management Services | LIBOR Plus 11.00% (Floor 1.00%), Current Coupon 12.48%, Secured Debt (Maturity - July 28, 2022) | 3 month LIBOR | 5,840 | 5,732 | 5,732 | ||||||
| Member Units (170,000 units) | — | — | 3,675 | 3,675 | ||||||||
| 9,407 | 9,407 | |||||||||||
| M.H. Corbin, Inc. (10) (13) | Manufacturer and Distributor of Traffic Safety Products | 13.00% Secured Debt (Maturity - August 31, 2020) | None | 3,150 | 3,130 | 3,130 | ||||||
| Preferred Member Units (1,000 units) | — | — | 1,500 | 1,500 | ||||||||
| 4,630 | 4,630 | |||||||||||
| Mystic Logistics, Inc. (10) (13) | Logistics and Distribution Services Provider for Large Volume Mailers | 12.00% Secured Debt (Maturity - August 15, 2019) | None | 1,942 | 1,914 | 1,916 | ||||||
| Common Stock (1,468 shares) (16) | — | — | 680 | 1,705 | ||||||||
| 2,594 | 3,621 | |||||||||||
| NuStep, LLC (10) (13) | Designer, Manufacturer and Distributor of Fitness Equipment | 12.00% Secured Debt (Maturity - January 31, 2022) | None | 5,150 | 5,047 | 5,048 | ||||||
| Preferred Member Units (102 units) | — | — | 2,550 | 2,550 | ||||||||
| 7,597 | 7,598 | |||||||||||
| SoftTouch Medical Holdings LLC (8) (10) (13) | Home Provider of Pediatric Durable Medical Equipment | LIBOR Plus 9.00% (Floor 1.00%), Current Coupon 10.36%, Secured Debt (Maturity - October 31, 2019) | 1 month LIBOR | 1,260 | 1,250 | 1,260 | ||||||
| Member Units (785 units) (16) | — | — | 870 | 1,781 | ||||||||
| 2,120 | 3,041 | |||||||||||
| Subtotal Affiliate Investments (4) (7% of total investments at fair value) | $ | 71,708 | $ | 76,862 | ||||||||
| Non-Control/Non-Affiliate Investments (5) | ||||||||||||
| AAC Holding Corp. (8) | Substance Abuse Treatment Service Provider | LIBOR Plus 6.75% (Floor 1.00%), Current Coupon 8.13%, Secured Debt (Maturity - June 30, 2023) | 3 month LIBOR | $ | 11,751 | $ | 11,475 | $ | 11,810 | |||
| Adams Publishing Group, LLC (8) (11) | Local Newspaper Operator | LIBOR Plus 7.00% (Floor 1.00%), Current Coupon 8.69%, Secured Debt (Maturity - November 3, 2020) | 3 month LIBOR | 10,341 | 10,123 | 10,147 | ||||||
| ADS Tactical, Inc. (8) (11) | Value-Added Logistics and Supply Chain Solutions Provider | LIBOR Plus 7.50% (Floor 0.75%), Current Coupon 9.19%, Secured Debt (Maturity - December 31, 2022) | 3 month LIBOR | 12,981 | 12,671 | 12,801 | ||||||
| Aethon United BR, LP (8)(11) | Oil & Gas Exploration & Production | LIBOR Plus 6.75% (Floor 1.00%), Current Coupon 8.16%, Secured Debt (Maturity - September 8, 2023) (14) | 1 month LIBOR | 3,438 | 3,388 | 3,388 | ||||||
| Ahead, LLC (8) (11) | IT Infrastructure Value Added Reseller | LIBOR Plus 6.50%, Current Coupon 8.20%, Secured Debt (Maturity - November 2, 2020) | 3 month LIBOR | 7,374 | 7,233 | 7,420 | ||||||
| Allflex Holdings III Inc. (8) | Manufacturer of Livestock Identification Products | LIBOR Plus 7.00% (Floor 1.00%), Current Coupon 8.36%, Secured Debt (Maturity - July 19, 2021) (14) | 3 month LIBOR | 13,964 | 14,054 | 14,075 | ||||||
| American Scaffold Holdings, Inc. (8) (11) | Marine Scaffolding Service Provider | LIBOR Plus 6.50% (Floor 1.00%), Current Coupon 8.19%, Secured Debt (Maturity - March 31, 2022) | 3 month LIBOR | 7,031 | 6,948 | 6,996 | ||||||
| American Teleconferencing Services, Ltd. (8) | Provider of Audio Conferencing and Video Collaboration Solutions | LIBOR Plus 6.50% (Floor 1.00%), Current Coupon 7.90%, Secured Debt (Maturity - December 8, 2021) | 2 month LIBOR | $ | 9,532 | $ | 8,684 | $ | 9,407 | |||
| LIBOR Plus 9.50% (Floor 1.00%), Current Coupon 10.85%, Secured Debt (Maturity - June 6, 2022) (14) | 3 month LIBOR | 5,571 | 5,335 | 5,260 | ||||||||
| 14,019 | 14,667 | |||||||||||
| Apex Linen Service, Inc. (10) (13) | Industrial Launderers | 16.00% Secured Debt (Maturity - October 30, 2022) | None | 3,604 | 3,552 | 3,552 | ||||||
| LIBOR Plus 9.00% (Floor 1.00%), Current Coupon 10.36%, Secured Debt (Maturity - October 30, 2022) (8) | 1 month LIBOR | 600 | 600 | 600 | ||||||||
| 4,152 | 4,152 | |||||||||||
| Arcus Hunting, LLC (8) (11) | Manufacturer of Bowhunting and Archery Products and Accessories | LIBOR Plus 7.00% (Floor 1.00%), Current Coupon 8.34%, Secured Debt (Maturity - November 13, 2019) | 1 month LIBOR | 7,696 | 7,618 | 7,690 | ||||||
| ATI Investment Sub, Inc. (8) | Manufacturer of Solar Tracking Systems | LIBOR Plus 7.25% (Floor 1.00%), Current Coupon 8.82%, Secured Debt (Maturity - June 22, 2021) | 1 month LIBOR | 7,364 | 7,221 | 7,346 | ||||||
| ATX Networks Corp. (8) (9) | Provider of Radio Frequency Management Equipment | LIBOR Plus 6.00% (Floor 1.00%), Current Coupon 7.33%, Current Coupon plus PIK 8.33%, Secured Debt (Maturity - June 11, 2021) | 3 month LIBOR | 14,474 | 14,253 | 14,384 | ||||||
| BarFly Ventures, LLC (11) | Casual Restaurant Group | 12.00% Secured Debt (Maturity - August 31, 2020) | None | 2,905 | 2,863 | 2,905 | ||||||
| Warrants (.410 equivalent units, Expiration - August 31, 2025) | — | — | 158 | 175 | ||||||||
| Options (.731 equivalent units) | — | — | 133 | 309 | ||||||||
| 3,154 | 3,389 | |||||||||||
| BBB Tank Services, LLC (10) (13) | Maintenance, Repair and Construction Services to the Above-Ground Storage Tank Market | 15.00% Secured Debt (Maturity - April 8, 2021) | None | 1,000 | 987 | 969 | ||||||
| LIBOR Plus 9.50% (Floor 1.00%), Current Coupon 10.74%, Secured Debt (Maturity - April 9, 2018) (8) | 1 month LIBOR | 200 | 200 | 200 | ||||||||
| Member Units (200,000 units) | — | — | 200 | 125 | ||||||||
| 1,387 | 1,294 | |||||||||||
| Berry Aviation, Inc. (11) | Airline Charter Service Operator | Current Coupon 13.75%, Secured Debt (Maturity - January 30, 2020) (14) | None | 1,407 | 1,395 | 1,407 | ||||||
| Common Stock (138 shares) | — | — | 100 | 252 | ||||||||
| 1,495 | 1,659 | |||||||||||
| BigName Commerce, LLC (8) (11) | Provider of Envelopes and Complimentary Stationery Products | LIBOR Plus 7.25% (Floor 1.00%), Current Coupon 8.59%, Secured Debt (Maturity - May 11, 2022) | 1 month LIBOR | 2,488 | 2,460 | 2,460 | ||||||
| Binswanger Enterprises, LLC (8) (11) | Glass Repair and Installation Service Provider | LIBOR Plus 8.00% (Floor 1.00%), Current Coupon 9.49%, Secured Debt (Maturity - March 9, 2022) | 3 month LIBOR | 15,267 | 15,002 | 15,135 | ||||||
| Member Units (1,050,000 Class A units) | — | — | 1,050 | 1,000 | ||||||||
| 16,052 | 16,135 | |||||||||||
| Bluestem Brands, Inc. (8) | Multi-Channel Retailer of General Merchandise | LIBOR Plus 7.50% (Floor 1.00%), Current Coupon 9.07%, Secured Debt (Maturity - November 6, 2020) | 3 month LIBOR | 13,005 | 12,836 | 9,158 | ||||||
| Boccella Precast Products, LLC (8) (10) (13) | Manufacturer of Precast Hollow Core Concrete | LIBOR Plus 10.00% (Floor 1.00%), Current Coupon 11.34%, Secured Debt (Maturity - June 30, 2022) | 1 month LIBOR | 4,100 | 4,005 | 4,100 | ||||||
| Member Units (540,000 units) | — | — | 540 | 860 | ||||||||
| 4,545 | 4,960 | |||||||||||
| Brightwood Capital Fund Investments (9) (15) | Investment Partnership | LP Interests (Brightwood Capital Fund III, LP) (Fully diluted 0.52%) (16) | — | — | 4,075 | 3,443 | ||||||
| LP Interests (Brightwood Capital Fund IV, LP) (Fully diluted 1.58%) (16) | — | — | 2,037 | 2,037 | ||||||||
| 6,112 | 5,480 | |||||||||||
| Brundage-Bone Concrete Pumping, Inc. | Construction Services Provider | 10.38% Secured Debt (Maturity - September 1, 2023) (14) | None | 12,000 | 12,074 | 12,720 | ||||||
| Buca C, LLC (8) (10) (13) | Casual Restaurant Group | LIBOR Plus 7.25% (Floor 1.00%), Current Coupon 8.63%, Secured Debt (Maturity - June 30, 2020) | 1 month LIBOR | $ | 13,536 | $ | 13,386 | $ | 13,386 | |||
| Preferred Member Units (4 units, 6.00% cumulative) (16) | — | — | 2,702 | 2,781 | ||||||||
| 16,088 | 16,167 | |||||||||||
| Cadence Aerospace, LLC (8) (11) | Aerospace and Defense | LIBOR Plus 6.50% (Floor 1.00%), Current Coupon 7.91%, Secured Debt (Maturity - November 14, 2023) | 3 month LIBOR | 15,000 | 14,853 | 14,853 | ||||||
| CAI Software, LLC (10) (13) | Provider of Specialized Enterprise Resource Planning Software | 12.00% Secured Debt (Maturity - October 10, 2019) | None | 1,021 | 1,005 | 1,021 | ||||||
| Member Units (16,339 units) (16) | — | — | 163 | 807 | ||||||||
| 1,168 | 1,828 | |||||||||||
| CapFusion Holding, LLC (9) (10) (13) | Business Lender | 13.00% Secured Debt (Maturity - March 25, 2021) (18) | None | 1,669 | 1,394 | 468 | ||||||
| CDHA Management, LLC (8) (11) | Dental Services | LIBOR Plus 7.25% (Floor 1.00%), Current Coupon 8.78%, Secured Debt (Maturity - December 5, 2021) | 3 month LIBOR | 5,365 | 5,270 | 5,365 | ||||||
| Central Security Group, Inc. (8) | Security Alarm Monitoring Service Provider | LIBOR Plus 5.63% (Floor 1.00%), Current Coupon 7.19%, Secured Debt (Maturity - October 6, 2021) | 1 month LIBOR | 7,481 | 7,462 | 7,518 | ||||||
| Cenveo Corporation | Provider of Commercial Printing, Envelopes, Labels, Printed Office Products | 6.00% Secured Debt (Maturity - August 1, 2019) | None | 15,000 | 13,706 | 10,650 | ||||||
| Charlotte Russe, Inc. (8) | Fast-Fashion Retailer to Young Women | LIBOR Plus 5.50% (Floor 1.25%), Current Coupon 6.89%, Secured Debt (Maturity - May 22, 2019) | 3 month LIBOR | 14,972 | 14,863 | 6,045 | ||||||
| Clarius BIGS, LLC (11) (18) | Prints & Advertising Film Financing | 15.00% PIK Secured Debt (Maturity - January 5, 2015) (18) | None | 2,140 | 1,882 | 62 | ||||||
| 20.00% PIK Secured Debt (Maturity - January 5, 2015) (18) | None | 773 | 680 | 22 | ||||||||
| 2,562 | 84 | |||||||||||
| Clickbooth.com, LLC (8) (11) | Provider of Digital Advertising Performance Marketing Solutions | LIBOR Plus 8.50% (Floor 1.00%), Current Coupon 10.01%, Secured Debt (Maturity - December 5, 2022) | 1 month LIBOR | 3,000 | 2,941 | 2,941 | ||||||
| Construction Supply Investments, LLC (11) | Distribution Platform of Specialty Construction Materials to Professional Concrete and Masonry Contractors | LIBOR Plus 6.00% (Floor 1.00%), Current Coupon 7.57%, Secured Debt (Maturity - June 30, 2023) (8) | 1 month LIBOR | 7,125 | 7,090 | 7,090 | ||||||
| Member units (20,000 units) | — | — | 3,723 | 3,723 | ||||||||
| 10,813 | 10,813 | |||||||||||
| ContextMedia Health, LLC (8) | Provider of Healthcare Media Content | LIBOR Plus 6.50% (Floor 1.00%), Current Coupon 8.13%, Secured Debt (Maturity - December 23, 2021) | 1 month LIBOR | 9,500 | 8,685 | 6,413 | ||||||
| CTVSH, PLLC (8) (11) (13) | Emergency Care and Specialty Service Animal Hospital | LIBOR Plus 8.00% (Floor 1.00%), Current Coupon 9.48%, Secured Debt (Maturity - August 3, 2022) | 1 month LIBOR | 2,963 | 2,907 | 2,907 | ||||||
| Datacom, LLC (10) (13) | Technology and Telecommunications Provider | 5.25% Current / 5.25% PIK, Current Coupon 10.50% Secured Debt (Maturity - May 30, 2019) | None | 1,366 | 1,357 | 1,229 | ||||||
| 8.00% Secured Debt (Maturity - May 30, 2018) | None | 175 | 175 | 175 | ||||||||
| Class A Preferred Member Units (1,530 units, 15.00% cumulative) (16) | — | — | 131 | 81 | ||||||||
| Class B Preferred Member Units (717 units) | — | — | 670 | — | ||||||||
| 2,333 | 1,485 | |||||||||||
| Digital River, Inc. (8) | Provider of Outsourced e-Commerce Solutions and Services | LIBOR Plus 6.50% (Floor 1.00%), Current Coupon 8.08%, Secured Debt (Maturity - February 12, 2021) | 3 month LIBOR | 8,946 | 8,898 | 8,969 | ||||||
Evergreen Skills Lux S.á r.l. (d/b/a Skillsoft) (8) (9) | Technology-Based Performance Support Solutions | LIBOR Plus 8.25% (Floor 1.00%), Current Coupon 9.82%, Secured Debt (Maturity - April 28, 2022) (14) | 1 month LIBOR | 10,901 | 10,510 | 9,725 | ||||||
| Extreme Reach, Inc. (8) | Integrated TV and Video Advertising Platform | LIBOR Plus 6.25% (Floor 1.00%), Current Coupon 7.59%, Secured Debt (Maturity - February 7, 2020) | 3 month LIBOR | 10,411 | 10,397 | 10,398 | ||||||
| Felix Investments Holdings II, LLC (8) (11) | Oil and Gas Exploration and Production | LIBOR Plus 6.50% (Floor 1.00%), Current Coupon 7.90%, Secured Debt (Maturity - August 9, 2022) | 3 month LIBOR | $ | 3,333 | $ | 3,267 | $ | 3,267 | |||
| Flavors Holdings, Inc. (8) | Global Provider of Flavoring and Sweetening Products and Solutions | LIBOR Plus 5.75% (Floor 1.00%), Current Coupon 7.44%, Secured Debt (Maturity - April 3, 2020) | 3 month LIBOR | 12,407 | 11,853 | 11,507 | ||||||
| GoWireless Holdings, Inc. (8) (12) | Provider of Wireless Telecommunications Carrier Services | LIBOR Plus 6.50% (Floor 1.00%), Current Coupon 8.16%, Secured Debt (Maturity - December 22, 2024) | 3 month LIBOR | 15,000 | 14,850 | 14,888 | ||||||
| GST Autoleather, Inc. (8) | Automotive Leather Manufacturer | Prime Plus 6.50% (Floor 2.00%), Current Coupon 11.00%, Secured Debt (Maturity - July 10, 2020) | PRIME | 17,384 | 16,898 | 13,994 | ||||||
| Prime Plus 6.50% (Floor 2.25%), Current Coupon 11.00%, Secured Debt (Maturity - April 5, 2018) | PRIME | 3,377 | 3,299 | 3,326 | ||||||||
| 20,197 | 17,320 | |||||||||||
| Guitar Center, Inc. | Musical Instruments Retailer | 6.50% Secured Debt (Maturity - April 15, 2019) | None | 15,015 | 14,490 | 13,889 | ||||||
| Hojeij Branded Foods, LLC (8) (11) | Multi-Airport, Multi-Concept Restaurant Operator | LIBOR Plus 6.00% (Floor 1.00%), Current Coupon 7.57%, Secured Debt (Maturity - July 20, 2022) | 1 month LIBOR | 12,107 | 12,000 | 12,107 | ||||||
| Hoover Group, Inc. (8) (9) (11) | Provider of Storage Tanks and Related Products to the Energy and Petrochemical Markets | LIBOR Plus 7.25% (Floor 1.00%), Current Coupon 8.70%, Secured Debt (Maturity - January 28, 2021) | 3 month LIBOR | 14,848 | 14,030 | 13,656 | ||||||
| Hunter Defense Technologies, Inc. (8) | Provider of Military and Commercial Shelters and Systems | LIBOR Plus 6.00% (Floor 1.00%), Current Coupon 7.35%, Secured Debt (Maturity - August 5, 2019) | 3 month LIBOR | 14,552 | 14,161 | 14,389 | ||||||
| Hydrofarm Holdings, LLC (8) (11) | Wholesaler of Horticultural Products | LIBOR Plus 7.00%, Current Coupon 8.49%, Secured Debt (Maturity - May 12, 2022) | 1 month LIBOR | 6,666 | 6,546 | 6,657 | ||||||
| iEnergizer Limited (8) (9) | Provider of Business Outsourcing Solutions | LIBOR Plus 6.00% (Floor 1.25%), Current Coupon 7.57%, Secured Debt (Maturity - May 1, 2019) | 1 month LIBOR | 10,644 | 10,408 | 10,618 | ||||||
| Implus Footcare, LLC (8) (11) | Provider of Footwear and Other Accessories | LIBOR Plus 6.75% (Floor 1.00%), Current Coupon 8.44%, Secured Debt (Maturity - April 30, 2021) | 3 month LIBOR | 14,491 | 14,299 | 14,394 | ||||||
| Industrial Services Acquisitions, LLC (11) | Industrial Cleaning Services | 11.25% Current / 0.75% PIK, Current Coupon 12.00%, Unsecured Debt (Maturity - December 17, 2022) (17) | None | 10,603 | 10,429 | 10,603 | ||||||
| Member Units (Industrial Services Investments, LLC) (2,100,000 units) | — | — | 2,100 | 1,890 | ||||||||
| 12,529 | 12,493 | |||||||||||
| Inn of the Mountain Gods Resort and Casino | Hotel & Casino Owner & Operator | 9.25% Secured Debt (Maturity - November 30, 2020) | None | 10,749 | 10,620 | 9,782 | ||||||
| iPayment, Inc. (8) | Provider of Merchant Acquisition | LIBOR Plus 5.00% (Floor 1.00%), Current Coupon 6.62%, Secured Debt (Maturity - April 11, 2023) | 3 month LIBOR | 11,970 | 11,970 | 12,090 | ||||||
| iQor US Inc. (8) | Business Process Outsourcing Services Provider | LIBOR Plus 5.00% (Floor 1.00%), Current Coupon 6.34%, Secured Debt (Maturity - April 1, 2021) | 3 month LIBOR | 7,678 | 7,338 | 7,649 | ||||||
| IronGate Energy Services, LLC (18) | Oil and Gas Services | 11.00% Secured Debt (Maturity - July 1, 2018) (18) | None | 5,825 | 5,827 | 2,039 | ||||||
| Jackmont Hospitality, Inc. (8) (11) | Franchisee of Casual Dining Restaurants | LIBOR Plus 6.75% (Floor 1.00%), Current Coupon 8.32%, Secured Debt (Maturity - May 26, 2021) | 1 month LIBOR | 8,665 | 8,642 | 8,665 | ||||||
| Jacuzzi Brands Corp. (8) | Manufacturer of Bath and Spa Products | LIBOR Plus 7.00% (Floor 1.00%), Current Coupon 8.69%, Secured Debt (Maturity - June 28, 2023) | 3 month LIBOR | 5,925 | 5,812 | 5,969 | ||||||
| Joerns Healthcare, LLC (8) | Manufacturer and Distributor of Health Care Equipment & Supplies | LIBOR Plus 6.00% (Floor 1.00%), Current Coupon 7.48%, Secured Debt (Maturity - May 9, 2020) | 3 month LIBOR | 11,119 | 10,948 | 10,359 | ||||||
| Kellermeyer Bergensons Services, LLC (8) | Outsourced Janitorial Services to Retail/Grocery Customers | LIBOR Plus 8.50% (Floor 1.00%), Current Coupon 9.88%, Secured Debt (Maturity - April 29, 2022) (14) | 3 month LIBOR | 14,700 | 14,618 | 14,241 | ||||||
| Keypoint Government Solutions, Inc. (8) (11) | Provider of Pre-Employment Screening Services | LIBOR Plus 6.00% (Floor 1.00%), Current Coupon 7.35%, Secured Debt (Maturity - April 18, 2024) | 3 month LIBOR | 12,031 | 11,921 | 12,031 | ||||||
| LaMi Products, LLC (8) (11) | General Merchandise Distribution | LIBOR Plus 6.50% (Floor 1.00%), Current Coupon 8.05%, Secured Debt (Maturity -September 16, 2020) | 3 month LIBOR | 11,110 | 10,988 | 11,085 | ||||||
| Larchmont Resources, LLC (8) | Oil & Gas Exploration & Production | LIBOR Plus 9.00% (Floor 1.00%), Current Coupon 10.53%, Secured Debt (Maturity - August 7, 2020) | 3 month LIBOR | $ | 4,118 | $ | 4,118 | $ | 4,076 | |||
| Member units (Larchmont Intermediate Holdco, LLC) (4,806 units) | — | — | 601 | 1,658 | ||||||||
| 4,719 | 5,734 | |||||||||||
| LJ Host Merger Sub, Inc. (8) | Managed Services and Hosting Provider | LIBOR Plus 6.75% (Floor 1.25%), Current Coupon 8.44%, Secured Debt (Maturity - December 13, 2019) | 3 month LIBOR | 16,137 | 15,744 | 15,714 | ||||||
| LIBOR Plus 6.75% (Floor 1.25%), Current Coupon 8.44%, Secured Debt (Maturity - December 13, 2018) | 3 month LIBOR | 2,433 | 2,358 | 2,293 | ||||||||
| 18,102 | 18,007 | |||||||||||
| Logix Acquisition Company, LLC (8) (11) | Competitive Local Exchange Carrier | LIBOR Plus 5.75% (Floor 1.00%), Current Coupon 7.28%, Secured Debt (Maturity - August 9, 2024) (23) | 1 month LIBOR | 9,730 | 9,632 | 9,839 | ||||||
| LSF9 Atlantis Holdings, LLC (8) | Provider of Wireless Telecommunications Carrier Services | LIBOR Plus 6.00% (Floor 1.00%), Current Coupon 7.36%, Secured Debt (Maturity - May 1, 2023) | 1 month LIBOR | 13,825 | 13,722 | 13,897 | ||||||
| Lulu’s Fashion Lounge, LLC (8)(11) | Fast Fashion E-Commerce Retailer | LIBOR Plus 7.00% (Floor 1.00%), Current Coupon 8.57%, Secured Debt (Maturity - August 28, 2022) | 1 month LIBOR | 6,690 | 6,496 | 6,766 | ||||||
| Meisler Operating, LLC (10) (13) | Provider of Short Term Trailer and Container Rental | LIBOR Plus 8.50% (Floor 1.00%), Current Coupon 9.84%, Secured Debt (Maturity - June 7, 2022) (8) | 3 month LIBOR | 4,200 | 4,095 | 4,104 | ||||||
| Member Units (Milton Meisler Holdings, LLC) (8,000 units) | — | — | 800 | 848 | ||||||||
| 4,895 | 4,952 | |||||||||||
| MHVC Acquisition Corp. (8) | Provider of Differentiated Information Solutions, Systems Engineering and Analytics | LIBOR Plus 5.25% (Floor 1.00%), Current Coupon 6.95%, Secured Debt (Maturity - April 29, 2024) | 1 month LIBOR | 10,448 | 10,399 | 10,578 | ||||||
| Minute Key, Inc. (10) (13) | Operator of Automated Key Duplication Kiosk | Warrants (359,352 equivalent units, Expiration - May 20, 2025) | — | — | 70 | 293 | ||||||
| NBG Acquisition, Inc. (8) | Wholesaler of Home Decor Products | LIBOR Plus 5.50% (Floor 1.00%), Current Coupon 7.19%, Secured Debt (Maturity - April 26, 2024) | 1 month LIBOR | 4,402 | 4,336 | 4,452 | ||||||
| New Media Holdings II LLC (8) (9) | Local Newspaper Operator | LIBOR Plus 6.25% (Floor 1.00%), Current Coupon 7.82%, Secured Debt (Maturity - July 14, 2022) | 1 month LIBOR | 17,033 | 16,762 | 17,176 | ||||||
| NNE Issuer, LLC (8) (11) | Oil & Gas Exploration & Production | LIBOR Plus 8.00%, Current Coupon 9.49%, Secured Debt (Maturity - March 2, 2022) | 3 month LIBOR | 11,958 | 11,851 | 11,854 | ||||||
| North American Lifting Holdings, Inc. (8) | Crane Service Provider | LIBOR Plus 4.50% (Floor 1.00%), Current Coupon 6.19%, Secured Debt (Maturity - November 27, 2020) | 3 month LIBOR | 6,310 | 5,666 | 5,912 | ||||||
| Novetta Solutions, LLC (8) | Provider of Advanced Analytics Solutions for Defense Agencies | LIBOR Plus 5.00% (Floor 1.00%), Current Coupon 6.70%, Secured Debt (Maturity - October 17, 2022) | 3 month LIBOR | 9,625 | 9,382 | 9,364 | ||||||
| NTM Acquisition Corp. (8) | Provider of B2B Travel Information Content | LIBOR Plus 6.25% (Floor 1.00%), Current Coupon 7.94%, Secured Debt (Maturity - June 7, 2022) | 3 month LIBOR | 10,908 | 10,797 | 10,853 | ||||||
| Paris Presents, Inc. (8) | Branded Cosmetic and Bath Accessories | LIBOR Plus 8.75% (Floor 1.00%), Current Coupon 10.32%, Secured Debt (Maturity - December 31, 2021) (14) | 1 month LIBOR | 10,000 | 9,899 | 9,950 | ||||||
| Parq Holdings, LP (8) (9) | Hotel and Casino Operator | LIBOR Plus 7.50% (Floor 1.00%), Current Coupon 9.19%, Secured Debt (Maturity - December 17, 2020) | 3 month LIBOR | 12,469 | 12,317 | 12,547 | ||||||
| Permian Holdco 2, Inc. | Storage Tank Manufacturer | 14.00% PIK Unsecured Debt (Maturity - October 15, 2021) (17) | None | 765 | 765 | 765 | ||||||
| Series A Preferred Shares (Permian Holdco 1, Inc.) (386,255 units) (12.00% Cumulative) (16) | — | — | 1,997 | 2,449 | ||||||||
| Common Shares (Permian Holdco 1, Inc.) (386,255 units) | — | — | — | 350 | ||||||||
| 2,762 | 3,564 | |||||||||||
| Permian Holdings, Inc. | Storage Tank Manufacturer | 10.50% Secured Debt (Maturity - January 15, 2018) | None | 1,000 | 968 | 290 | ||||||
| Pernix Therapeutics Holdings, Inc. (11) | Pharmaceutical Royalty - Anti-Migraine | 12.00% Secured Debt (Maturity - August 1, 2020) | None | 2,737 | 2,717 | 1,725 | ||||||
| PPC/Shift, LLC (8) (11) | Provider of Digital Solutions to Automotive Industry | LIBOR Plus 6.00% (Floor 1.00%), Current Coupon 7.69%, Secured Debt (Maturity - December 22, 2021) | 3 month LIBOR | $ | 6,825 | $ | 6,704 | $ | 6,825 | |||
| Prowler Acquisition Corporation (8) | Specialty Distributor to the Energy Sector | LIBOR Plus 4.50% (Floor 1.00%), Current Coupon 6.34%, Secured Debt (Maturity - January 28, 2020) | 3 month LIBOR | 12,412 | 11,199 | 11,854 | ||||||
| Renaissance Learning, Inc. (8) | Technology-based K-12 Learning Solutions | LIBOR Plus 7.00% (Floor 1.00%), Current Coupon 8.69%, Secured Debt (Maturity - April 11, 2022) (14) | 3 month LIBOR | 12,695 | 12,359 | 12,767 | ||||||
| Resolute Industrial, LLC (8) (11) | HVAC Equipment Rental and Remanufacturing | LIBOR Plus 7.62% (Floor 1.00%), Current Coupon 8.95%, Secured Debt (Maturity - July 26, 2022) (24) | 3 month LIBOR | 17,086 | 16,679 | 16,774 | ||||||
| Common Stock (601 units) | — | — | 750 | 750 | ||||||||
| 17,429 | 17,524 | |||||||||||
| RGL Reservoir Operations, Inc. (9) (11) | Oil & Gas Equipment & Services | 1.00% Current / 9.00% PIK Secured Debt (Maturity - December 23, 2024) | None | 721 | 407 | 407 | ||||||
| RM Bidder, LLC (11) | Full-scale Film and Television Production and Distribution | Common Stock (1,854 units) | — | — | 31 | 13 | ||||||
| Series A Warrants (124,915 equivalent units, Expiration - October 20, 2025) | — | — | 284 | — | ||||||||
| Series B Warrants (93,686 equivalent units, Expiration - October 20, 2025) | — | — | — | — | ||||||||
| 315 | 13 | |||||||||||
| Salient Partners, LP (8) | Provider of Asset Management Services | LIBOR Plus 8.50% (Floor 1.00%), Current Coupon 9.85%, Secured Debt (Maturity - June 9, 2021) | 3 month LIBOR | 11,042 | 10,748 | 10,711 | ||||||
| Smart Modular Technologies, Inc. (8) (9) (11) | Provider of Specialty Memory Solutions | LIBOR Plus 6.25%, (Floor 1.00%), Current Coupon 7.66%, Secured Debt (Maturity - August 9, 2022) | 3 month LIBOR | 14,625 | 14,351 | 14,552 | ||||||
| Sorenson Communications, Inc. | Manufacturer of Communication Products for Hearing Impaired | 9.00% Secured Debt (Maturity - October 31, 2020) (14) | None | 6,616 | 6,457 | 6,599 | ||||||
| LIBOR Plus 5.75% (Floor 2.25%), Current Coupon 8.00%, Secured Debt (Maturity - April 30, 2020) (8) | 3 month LIBOR | 2,947 | 2,932 | 2,971 | ||||||||
| 9,389 | 9,570 | |||||||||||
| Strike, LLC (8) | Pipeline Construction and Maintenance Services | LIBOR Plus 8.00% (Floor 1.00%), Current Coupon 9.50%, Secured Debt (Maturity - November 30, 2022) | 3 month LIBOR | 9,500 | 9,251 | 9,643 | ||||||
| LIBOR Plus 8.00% (Floor 1.00%), Current Coupon 9.45%, Secured Debt (Maturity - May 30, 2019) | 3 month LIBOR | 2,500 | 2,480 | 2,513 | ||||||||
| 11,731 | 12,156 | |||||||||||
| Synagro Infrastructure Company, Inc. (8) | Waste Management Services | LIBOR Plus 5.50% (Floor 1.00%), Current Coupon 7.19%, Secured Debt (Maturity - August 22, 2020) | 3 month LIBOR | 6,411 | 6,235 | 6,023 | ||||||
| TE Holdings, LLC | Oil & Gas Exploration & Production | Common Units (72,785 units) | — | — | 728 | 118 | ||||||
| Teleguam Holdings, LLC (8) | Cable and Telecom Services Provider | LIBOR Plus 8.50% (Floor 1.00%), Current Coupon 10.07%, Secured Debt (Maturity - April 12, 2024) (14) | 1 month LIBOR | 7,750 | 7,602 | 7,808 | ||||||
| TMC Merger Sub Corp (8) | Refractory & Maintenance Services Provider | LIBOR Plus 6.25% (Floor 1.00%), Current Coupon 7.88%, Secured Debt (Maturity - October 31, 2022) (25) | 1 month LIBOR | 19,140 | 18,993 | 19,237 | ||||||
| TOMS Shoes, LLC (8) | Global Designer, Distributor, and Retailer of Casual Footwear | LIBOR Plus 5.50% (Floor 1.00%), Current Coupon 6.98%, Secured Debt (Maturity - October 30, 2020) | 3 month LIBOR | 4,863 | 4,604 | 2,893 | ||||||
| Turning Point Brands, Inc. (8) (9) (11) | Marketer/Distributor of Tobacco Products | LIBOR Plus 6.00% (Floor 1.00%), Current Coupon 7.61%, Secured Debt (Maturity - May 17, 2022) (24) | 3 month LIBOR | 8,436 | 8,364 | 8,605 | ||||||
| TVG-I-E CMN Acquisition, LLC (8) (11) | Organic Lead Generation for Online Postsecondary Schools | LIBOR Plus 6.00%, (Floor 1.00%), Current Coupon 7.56%, Secured Debt (Maturity - November 3, 2021) | 1 month LIBOR | 8,170 | 8,031 | 8,170 | ||||||
| U.S. Telepacific Corp. (8) | Provider of Communications and Managed Services | LIBOR Plus 5.00% (Floor 1.00%), Current Coupon 6.69%, Secured Debt (Maturity - May 2, 2023) | 3 month LIBOR | 16,421 | 16,027 | 15,754 | ||||||
| USJ-IMECO Holding Company, LLC (8) | Marine Interior Design and Installation | LIBOR Plus 6.00% (Floor 1.00%), Current Coupon 7.70%, Secured Debt (Maturity - April 16, 2020) | 3 month LIBOR | 8,243 | 8,224 | 8,202 | ||||||
| Valley Healthcare Group, LLC (8) (10) (13) | Provider of Durable Medical Equipment | LIBOR Plus 12.50% (Floor 0.50%), Current Coupon 13.86%, Secured Debt (Maturity - December 29, 2020) | 1 month LIBOR | $ | 2,942 | $ | 2,901 | $ | 2,901 | |||
| Preferred Member Units (Valley Healthcare Holding, LLC) (400 units) | — | — | 400 | 400 | ||||||||
| 3,301 | 3,301 | |||||||||||
| VIP Cinema Holdings, Inc. (8) | Supplier of Luxury Seating to the Cinema Industry | LIBOR Plus 6.00% (Floor 1.00%), Current Coupon 7.70%, Secured Debt (Maturity - March 1, 2023) | 3 month LIBOR | 9,625 | 9,582 | 9,721 | ||||||
| Vistar Media, Inc. (8) (11) | Operator of Digital Out-of-Home Advertising Platform | LIBOR Plus 10.00% (Floor 1.00%), Current Coupon 11.69%, Secured Debt (Maturity - February 16, 2022) | 3 month LIBOR | 3,319 | 3,046 | 3,102 | ||||||
| Warrants (70,207 equivalent units, Expiration - February 17, 2027) | — | — | 331 | 500 | ||||||||
| 3,377 | 3,602 | |||||||||||
| Volusion, LLC (10) (13) | Provider of Online Software-as-a-Service eCommerce Solutions | 11.50% Secured Debt (Maturity - January 24, 2020) | None | 7,172 | 6,453 | 6,453 | ||||||
| Preferred Member Units (2,090,001 units) | — | — | 6,000 | 6,000 | ||||||||
| Warrants (784,866.80 equivalent units, Expiration - January 26, 2025) | — | — | 1,104 | 891 | ||||||||
| 13,557 | 13,344 | |||||||||||
| Wellnext, LLC (8) (11) | Manufacturer of Supplements and Vitamins | LIBOR Plus 10.10% (Floor 1.00%), Current Coupon 11.67%, Secured Debt (Maturity - July 21, 2022) (23) | 1 month LIBOR | 9,930 | 9,856 | 9,930 | ||||||
| Wireless Vision Holdings, LLC (8) (11) | Provider of Wireless Telecommunications Carrier Services | LIBOR Plus 8.91% (Floor 1.00%), Current Coupon 10.27%, Secured Debt (Maturity - September 29, 2022) (23) | 1 month LIBOR | 12,899 | 12,574 | 12,574 | ||||||
| Wirepath, LLC (8) | E-Commerce Provider Into Connected Home Market | LIBOR Plus 5.25% (Floor 1.00%), Current Coupon 6.87%, Secured Debt (Maturity - August 5, 2024) | 2 month LIBOR | 11,471 | 11,416 | 11,629 | ||||||
| Subtotal Non-Control/Non-Affiliate Investments (5) (88% of total portfolio investments at fair value) | $ | 948,029 | $ | 922,898 | ||||||||
| Total Portfolio Investments | $ | 1,064,329 | $ | 1,049,439 | ||||||||
| Short Term Investments (20) | ||||||||||||
| Fidelity Institutional Money Market Funds (21) | — | Prime Money Market Portfolio, Class III Shares | — | — | $ | 11,335 | $ | 11,335 | ||||
| US Bank Money Market Account (21) | — | — | — | — | 18,613 | 18,613 | ||||||
| Total Short Term Investments | $ | 29,948 | $ | 29,948 | ||||||||
| Portfolio Company (1) (20) | Business Description | Type of Investment (2) (3) (15) | Investment Date (22) | Shares/Units | Total Rate | Reference Rate and Spread (25) | PIK Rate (19) | Maturity Date | Principal (4) | Cost (4) | Fair Value (18) | |||||||||||||||||||||||||||||||||
| Control Investments (5) | ||||||||||||||||||||||||||||||||||||||||||||
| Copper Trail Fund Investments | (12) (13) | Investment Partnership | ||||||||||||||||||||||||||||||||||||||||||
| LP Interests (CTMH, LP) | (8) (24) | 7/17/2017 | 38.8% | $ | 693 | $ | 568 | |||||||||||||||||||||||||||||||||||||
| GRT Rubber Technologies LLC | Manufacturer of Engineered Rubber Products | |||||||||||||||||||||||||||||||||||||||||||
| Secured Debt | 12/21/2018 | 11.48% | SF+ | 6.00% | 10/29/2026 | 1,182 | 1,173 | 1,182 | ||||||||||||||||||||||||||||||||||||
| Secured Debt | 12/19/2014 | 13.48% | SF+ | 8.00% | 10/29/2026 | 19,944 | 19,803 | 19,944 | ||||||||||||||||||||||||||||||||||||
| Member Units | 12/19/2014 | 2,896 | 6,435 | 21,890 | ||||||||||||||||||||||||||||||||||||||||
| 27,411 | 43,016 | |||||||||||||||||||||||||||||||||||||||||||
| Harris Preston Fund Investments | (12) (13) | Investment Partnership | ||||||||||||||||||||||||||||||||||||||||||
| LP Interests (2717 MH, L.P.) | (8) (24) | 10/1/2017 | 49.3% | 3,345 | 6,050 | |||||||||||||||||||||||||||||||||||||||
| Volusion, LLC | Provider of Online Software-as-a-Service eCommerce Solutions | |||||||||||||||||||||||||||||||||||||||||||
| Secured Debt | 3/31/2023 | 10.00% | 3/31/2025 | 900 | 900 | 900 | ||||||||||||||||||||||||||||||||||||||
| Preferred Member Units | 3/31/2023 | 2,184,683 | 3,706 | 3,110 | ||||||||||||||||||||||||||||||||||||||||
| Preferred Member Units | 3/31/2023 | 61,077 | — | — | ||||||||||||||||||||||||||||||||||||||||
| Preferred Member Units | 1/26/2015 | 2,090,001 | 6,000 | — | ||||||||||||||||||||||||||||||||||||||||
| Common Stock | 3/31/2023 | 772,620 | 1,104 | — | ||||||||||||||||||||||||||||||||||||||||
| 11,710 | 4,010 | |||||||||||||||||||||||||||||||||||||||||||
| Subtotal Control Investments (8.6% of net assets at fair value) | $ | 43,159 | $ | 53,644 | ||||||||||||||||||||||||||||||||||||||||
| Affiliate Investments (6) | ||||||||||||||||||||||||||||||||||||||||||||
| Analytical Systems Keco Holdings, LLC | Manufacturer of Liquid and Gas Analyzers | |||||||||||||||||||||||||||||||||||||||||||
| Secured Debt | (9) | 8/16/2019 | 15.38% | SF+ | 10.00% | 8/16/2024 | $ | 55 | $ | 54 | $ | 54 | ||||||||||||||||||||||||||||||||
| Secured Debt | (9) | 8/16/2019 | 15.38% | SF+ | 10.00% | 8/16/2024 | 1,031 | 1,020 | 1,020 | |||||||||||||||||||||||||||||||||||
| Preferred Member Units | 5/20/2021 | 607 | 607 | 1,210 | ||||||||||||||||||||||||||||||||||||||||
| Preferred Member Units | 8/16/2019 | 800 | 14.13% | 800 | — | |||||||||||||||||||||||||||||||||||||||
| Warrants | (27) | 8/16/2019 | 105 | 8/16/2029 | 79 | — | ||||||||||||||||||||||||||||||||||||||
| 2,560 | 2,284 | |||||||||||||||||||||||||||||||||||||||||||
| Barfly Ventures, LLC | (10) | Casual Restaurant Group | ||||||||||||||||||||||||||||||||||||||||||
| Member Units | 10/26/2020 | 12 | 528 | 1,380 | ||||||||||||||||||||||||||||||||||||||||
| Batjer TopCo, LLC | HVAC Mechanical Contractor | |||||||||||||||||||||||||||||||||||||||||||
| Secured Debt | (37) | 3/7/2022 | 3/7/2027 | — | (1) | — | ||||||||||||||||||||||||||||||||||||||
| Secured Debt | 3/7/2022 | 10.00% | 3/7/2027 | 30 | 30 | 30 | ||||||||||||||||||||||||||||||||||||||
| Secured Debt | 3/7/2022 | 10.00% | 3/7/2027 | 1,175 | 1,160 | 1,175 | ||||||||||||||||||||||||||||||||||||||
| Preferred Stock | (8) | 3/7/2022 | 453 | 455 | 680 | |||||||||||||||||||||||||||||||||||||||
| 1,644 | 1,885 | |||||||||||||||||||||||||||||||||||||||||||
| Brewer Crane Holdings, LLC | Provider of Crane Rental and Operating Services | |||||||||||||||||||||||||||||||||||||||||||
| Secured Debt | (9) | 1/9/2018 | 15.46% | L+ | 10.00% | 1/9/2025 | 1,375 | 1,375 | 1,374 | |||||||||||||||||||||||||||||||||||
| Preferred Member Units | (8) | 1/9/2018 | 737 | 1,070 | 1,400 | |||||||||||||||||||||||||||||||||||||||
| 2,445 | 2,774 | |||||||||||||||||||||||||||||||||||||||||||
| Portfolio Company (1) (20) | Business Description | Type of Investment (2) (3) (15) | Investment Date (22) | Shares/Units | Total Rate | Reference Rate and Spread (25) | PIK Rate (19) | Maturity Date | Principal (4) | Cost (4) | Fair Value (18) | |||||||||||||||||||||||||||||||||
| Centre Technologies Holdings, LLC | Provider of IT Hardware Services and Software Solutions | |||||||||||||||||||||||||||||||||||||||||||
| Secured Debt | (9) (37) | 1/4/2019 | SF+ | 9.00% | 1/4/2026 | — | — | — | ||||||||||||||||||||||||||||||||||||
| Secured Debt | (9) | 1/4/2019 | 14.48% | SF+ | 9.00% | 1/4/2026 | 4,394 | 4,364 | 4,394 | |||||||||||||||||||||||||||||||||||
| Preferred Member Units | 1/4/2019 | 3,327 | 1,531 | 2,760 | ||||||||||||||||||||||||||||||||||||||||
| 5,895 | 7,154 | |||||||||||||||||||||||||||||||||||||||||||
| Chamberlin Holding LLC | Roofing and Waterproofing Specialty Contractor | |||||||||||||||||||||||||||||||||||||||||||
| Secured Debt | (9) (37) | 2/26/2018 | SF+ | 6.00% | 2/26/2026 | — | (49) | — | ||||||||||||||||||||||||||||||||||||
| Secured Debt | (9) | 2/26/2018 | 13.49% | SF+ | 8.00% | 2/26/2026 | 3,905 | 3,903 | 3,905 | |||||||||||||||||||||||||||||||||||
| Member Units | (8) | 2/26/2018 | 1,087 | 2,860 | 7,330 | |||||||||||||||||||||||||||||||||||||||
| Member Units | (8) (23) | 11/2/2018 | 261,786 | 443 | 715 | |||||||||||||||||||||||||||||||||||||||
| 7,157 | 11,950 | |||||||||||||||||||||||||||||||||||||||||||
| Charps, LLC | Pipeline Maintenance and Construction | |||||||||||||||||||||||||||||||||||||||||||
| Preferred Member Units | (8) | 2/3/2017 | 457 | 491 | 3,920 | |||||||||||||||||||||||||||||||||||||||
| Clad-Rex Steel, LLC | Specialty Manufacturer of Vinyl-Clad Metal | |||||||||||||||||||||||||||||||||||||||||||
| Secured Debt | 12/20/2016 | 11.50% | 1/15/2024 | 2,140 | 2,140 | 2,103 | ||||||||||||||||||||||||||||||||||||||
| Secured Debt | 12/20/2016 | 10.00% | 12/20/2036 | 253 | 251 | 251 | ||||||||||||||||||||||||||||||||||||||
| Member Units | (8) | 12/20/2016 | 179 | 1,820 | 1,300 | |||||||||||||||||||||||||||||||||||||||
| Member Units | (23) | 12/20/2016 | 200 | 127 | 282 | |||||||||||||||||||||||||||||||||||||||
| 4,338 | 3,936 | |||||||||||||||||||||||||||||||||||||||||||
| Cody Pools, Inc. | Designer of Residential and Commercial Pools | |||||||||||||||||||||||||||||||||||||||||||
| Secured Debt | (37) | 3/6/2020 | 12/17/2026 | — | (2) | — | ||||||||||||||||||||||||||||||||||||||
| Secured Debt | 3/6/2020 | 12.50% | 12/17/2026 | 7,111 | 7,089 | 7,111 | ||||||||||||||||||||||||||||||||||||||
| Preferred Member Units | (8) (23) | 3/6/2020 | 147 | 2,079 | 18,120 | |||||||||||||||||||||||||||||||||||||||
| 9,166 | 25,231 | |||||||||||||||||||||||||||||||||||||||||||
| Colonial Electric Company LLC | Provider of Electrical Contracting Services | |||||||||||||||||||||||||||||||||||||||||||
| Secured Debt | (37) | 3/31/2021 | 3/31/2026 | — | — | — | ||||||||||||||||||||||||||||||||||||||
| Secured Debt | 3/31/2021 | 12.00% | 3/31/2026 | 5,513 | 5,448 | 5,407 | ||||||||||||||||||||||||||||||||||||||
| Preferred Member Units | 6/27/2023 | 240 | 240 | 600 | ||||||||||||||||||||||||||||||||||||||||
| Preferred Member Units | 3/31/2021 | 4,320 | 1,920 | 1,920 | ||||||||||||||||||||||||||||||||||||||||
| 7,608 | 7,927 | |||||||||||||||||||||||||||||||||||||||||||
| Compass Systems & Sales, LLC | Designer of End-to-End Material Handling Solutions | |||||||||||||||||||||||||||||||||||||||||||
| Secured Debt | (37) | 11/22/2023 | 11/22/2028 | — | — | — | ||||||||||||||||||||||||||||||||||||||
| Secured Debt | 11/22/2023 | 13.50% | 11/22/2028 | 4,300 | 4,175 | 4,175 | ||||||||||||||||||||||||||||||||||||||
| Preferred Equity | 11/22/2023 | 1,863 | 1,863 | 1,863 | ||||||||||||||||||||||||||||||||||||||||
| 6,038 | 6,038 | |||||||||||||||||||||||||||||||||||||||||||
| Datacom, LLC | Technology and Telecommunications Provider | |||||||||||||||||||||||||||||||||||||||||||
| Secured Debt | 3/1/2022 | 7.50% | 12/31/2025 | 50 | 49 | 49 | ||||||||||||||||||||||||||||||||||||||
| Secured Debt | 3/31/2021 | 10.00% | 12/31/2025 | 928 | 887 | 844 | ||||||||||||||||||||||||||||||||||||||
| Preferred Member Units | 3/31/2021 | 1,000 | 290 | 10 | ||||||||||||||||||||||||||||||||||||||||
| 1,226 | 903 | |||||||||||||||||||||||||||||||||||||||||||
| Portfolio Company (1) (20) | Business Description | Type of Investment (2) (3) (15) | Investment Date (22) | Shares/Units | Total Rate | Reference Rate and Spread (25) | PIK Rate (19) | Maturity Date | Principal (4) | Cost (4) | Fair Value (18) | |||||||||||||||||||||||||||||||||
| Digital Products Holdings LLC | Designer and Distributor of Consumer Electronics | |||||||||||||||||||||||||||||||||||||||||||
| Secured Debt | (9) | 4/1/2018 | 15.38% | SF+ | 10.00% | 4/27/2026 | 3,718 | 3,689 | 3,673 | |||||||||||||||||||||||||||||||||||
| Preferred Member Units | (8) | 4/1/2018 | 964 | 2,375 | 2,459 | |||||||||||||||||||||||||||||||||||||||
| 6,064 | 6,132 | |||||||||||||||||||||||||||||||||||||||||||
| Direct Marketing Solutions, Inc. | Provider of Omni-Channel Direct Marketing Services | |||||||||||||||||||||||||||||||||||||||||||
| Secured Debt | 2/13/2018 | 14.00% | 2/13/2026 | 217 | 213 | 217 | ||||||||||||||||||||||||||||||||||||||
| Secured Debt | 12/27/2022 | 14.00% | 2/13/2026 | 5,002 | 4,974 | 5,002 | ||||||||||||||||||||||||||||||||||||||
| Preferred Stock | (8) | 2/13/2018 | 2,100 | 2,100 | 5,180 | |||||||||||||||||||||||||||||||||||||||
| 7,287 | 10,399 | |||||||||||||||||||||||||||||||||||||||||||
| Flame King Holdings, LLC | Propane Tank and Accessories Distributor | |||||||||||||||||||||||||||||||||||||||||||
| Preferred Equity | (8) | 10/29/2021 | 2,340 | 2,600 | 6,970 | |||||||||||||||||||||||||||||||||||||||
| Freeport Financial Funds | (12) (13) | Investment Partnership | ||||||||||||||||||||||||||||||||||||||||||
| LP Interests (Freeport First Lien Loan Fund III LP) | (8) (24) | 7/31/2015 | 6.0% | 4,160 | 3,705 | |||||||||||||||||||||||||||||||||||||||
| Gamber-Johnson Holdings, LLC | Manufacturer of Ruggedized Computer Mounting Systems | |||||||||||||||||||||||||||||||||||||||||||
| Secured Debt | (9) (36) (37) | 6/24/2016 | SF+ | 7.50% | 1/1/2028 | — | — | — | ||||||||||||||||||||||||||||||||||||
| Secured Debt | (9) (36) | 12/15/2022 | 10.50% | SF+ | 7.50% | 1/1/2028 | 13,520 | 13,336 | 13,520 | |||||||||||||||||||||||||||||||||||
| Member Units | (8) | 6/24/2016 | 2,261 | 4,423 | 24,180 | |||||||||||||||||||||||||||||||||||||||
| 17,759 | 37,700 | |||||||||||||||||||||||||||||||||||||||||||
| GFG Group, LLC | Grower and Distributor of a Variety of Plants and Products to Other Wholesalers, Retailers and Garden Centers | |||||||||||||||||||||||||||||||||||||||||||
| Secured Debt | 3/31/2021 | 8.00% | 3/31/2026 | 2,336 | 2,304 | 2,336 | ||||||||||||||||||||||||||||||||||||||
| Preferred Member Units | (8) | 3/31/2021 | 56 | 1,225 | 2,870 | |||||||||||||||||||||||||||||||||||||||
| 3,529 | 5,206 | |||||||||||||||||||||||||||||||||||||||||||
| Gulf Publishing Holdings, LLC | Energy Industry Focused Media and Publishing | |||||||||||||||||||||||||||||||||||||||||||
| Secured Debt | (9) (37) | 9/29/2017 | SF+ | 9.50% | 7/1/2027 | — | — | — | ||||||||||||||||||||||||||||||||||||
| Secured Debt | 7/1/2022 | 12.50% | 7/1/2027 | 600 | 600 | 571 | ||||||||||||||||||||||||||||||||||||||
| Preferred Equity | 7/1/2022 | 15,930 | 1,400 | 620 | ||||||||||||||||||||||||||||||||||||||||
| Member Units | 4/29/2016 | 920 | 920 | — | ||||||||||||||||||||||||||||||||||||||||
| 2,920 | 1,191 | |||||||||||||||||||||||||||||||||||||||||||
| Harris Preston Fund Investments | (12) (13) | Investment Partnership | ||||||||||||||||||||||||||||||||||||||||||
| LP Interests (HPEP 3, L.P.) | (24) | 8/9/2017 | 8.2% | 2,296 | 4,225 | |||||||||||||||||||||||||||||||||||||||
| IG Investor, LLC | Military and Other Tactical Gear | |||||||||||||||||||||||||||||||||||||||||||
| Secured Debt | (37) | 6/21/2023 | 6/21/2028 | — | (27) | (27) | ||||||||||||||||||||||||||||||||||||||
| Secured Debt | 6/21/2023 | 13.00% | 6/21/2028 | 9,316 | 9,069 | 9,069 | ||||||||||||||||||||||||||||||||||||||
| Common Equity | 6/21/2023 | 3,600 | 3,600 | 3,600 | ||||||||||||||||||||||||||||||||||||||||
| 12,642 | 12,642 | |||||||||||||||||||||||||||||||||||||||||||
| Portfolio Company (1) (20) | Business Description | Type of Investment (2) (3) (15) | Investment Date (22) | Shares/Units | Total Rate | Reference Rate and Spread (25) | PIK Rate (19) | Maturity Date | Principal (4) | Cost (4) | Fair Value (18) | |||||||||||||||||||||||||||||||||
| Independent Pet Partners Intermediate Holdings, LLC | (10) | Omnichannel Retailer of Specialty Pet Products | ||||||||||||||||||||||||||||||||||||||||||
| Common Equity | 4/7/2023 | 6,436,566 | 6,540 | 6,320 | ||||||||||||||||||||||||||||||||||||||||
| Integral Energy Services | (10) | Nuclear Power Staffing Services | ||||||||||||||||||||||||||||||||||||||||||
| Secured Debt | (9) | 8/20/2021 | 13.16% | SF+ | 7.50% | 8/20/2026 | 16,925 | 16,737 | 16,232 | |||||||||||||||||||||||||||||||||||
| Preferred Equity | 12/7/2023 | 3,725 | 10.00% | 10.00% | 265 | 350 | ||||||||||||||||||||||||||||||||||||||
| Common Stock | 8/20/2021 | 11,647 | 1,584 | 190 | ||||||||||||||||||||||||||||||||||||||||
| 18,586 | 16,772 | |||||||||||||||||||||||||||||||||||||||||||
| Kickhaefer Manufacturing Company, LLC | Precision Metal Parts Manufacturing | |||||||||||||||||||||||||||||||||||||||||||
| Secured Debt | 10/31/2018 | 12.00% | 10/31/2026 | 4,950 | 4,933 | 4,933 | ||||||||||||||||||||||||||||||||||||||
| Secured Debt | 10/31/2018 | 9.00% | 10/31/2048 | 960 | 951 | 951 | ||||||||||||||||||||||||||||||||||||||
| Preferred Equity | 10/31/2018 | 145 | 3,060 | 2,420 | ||||||||||||||||||||||||||||||||||||||||
| Member Units | (23) | 10/31/2018 | 200 | 248 | 683 | |||||||||||||||||||||||||||||||||||||||
| 9,192 | 8,987 | |||||||||||||||||||||||||||||||||||||||||||
| MH Corbin Holding LLC | Manufacturer and Distributor of Traffic Safety Products | |||||||||||||||||||||||||||||||||||||||||||
| Secured Debt | (17) | 8/31/2015 | 13.00% | 12/31/2022 | 1,350 | 1,350 | 1,256 | |||||||||||||||||||||||||||||||||||||
| Preferred Member Units | 3/15/2019 | 16,500 | 1,100 | 80 | ||||||||||||||||||||||||||||||||||||||||
| Preferred Member Units | 9/1/2015 | 1,000 | 1,500 | — | ||||||||||||||||||||||||||||||||||||||||
| 3,950 | 1,336 | |||||||||||||||||||||||||||||||||||||||||||
| Mystic Logistics Holdings, LLC | Logistics and Distribution Services Provider for Large Volume Mailers | |||||||||||||||||||||||||||||||||||||||||||
| Secured Debt | (37) | 8/18/2014 | 1/31/2024 | — | — | — | ||||||||||||||||||||||||||||||||||||||
| Secured Debt | 8/18/2014 | 10.00% | 1/31/2024 | 1,436 | 1,436 | 1,436 | ||||||||||||||||||||||||||||||||||||||
| Common Stock | (8) | 8/18/2014 | 1,468 | 680 | 6,598 | |||||||||||||||||||||||||||||||||||||||
| 2,116 | 8,034 | |||||||||||||||||||||||||||||||||||||||||||
| NexRev LLC | Provider of Energy Efficiency Products & Services | |||||||||||||||||||||||||||||||||||||||||||
| Secured Debt | (37) | 2/28/2018 | 2/28/2025 | — | — | — | ||||||||||||||||||||||||||||||||||||||
| Secured Debt | 2/28/2018 | 10.00% | 2/28/2025 | 2,453 | 2,435 | 2,435 | ||||||||||||||||||||||||||||||||||||||
| Preferred Member Units | (8) | 2/28/2018 | 25,786,046 | 2,053 | 1,590 | |||||||||||||||||||||||||||||||||||||||
| 4,488 | 4,025 | |||||||||||||||||||||||||||||||||||||||||||
| NuStep, LLC | Designer, Manufacturer and Distributor of Fitness Equipment | |||||||||||||||||||||||||||||||||||||||||||
| Secured Debt | (9) | 1/31/2017 | 11.98% | SF+ | 6.50% | 1/31/2025 | 900 | 899 | 899 | |||||||||||||||||||||||||||||||||||
| Secured Debt | 1/31/2017 | 12.00% | 1/31/2025 | 4,610 | 4,606 | 4,606 | ||||||||||||||||||||||||||||||||||||||
| Preferred Member Units | 11/2/2022 | 515 | 515 | 1,290 | ||||||||||||||||||||||||||||||||||||||||
| Preferred Member Units | 1/31/2017 | 102 | 2,550 | 2,310 | ||||||||||||||||||||||||||||||||||||||||
| 8,570 | 9,105 | |||||||||||||||||||||||||||||||||||||||||||
| Oneliance, LLC | Construction Cleaning Company | |||||||||||||||||||||||||||||||||||||||||||
| Secured Debt | (9) | 8/6/2021 | 16.48% | SF+ | 11.00% | 8/6/2026 | 1,360 | 1,346 | 1,339 | |||||||||||||||||||||||||||||||||||
| Preferred Stock | 8/6/2021 | 282 | 282 | 282 | ||||||||||||||||||||||||||||||||||||||||
| 1,628 | 1,621 | |||||||||||||||||||||||||||||||||||||||||||
| Orttech Holdings, LLC | Distributor of Industrial Clutches, Brakes and Other Components | |||||||||||||||||||||||||||||||||||||||||||
| Secured Debt | (9) (37) | 7/30/2021 | SF+ | 11.00% | 7/31/2026 | — | (2) | — | ||||||||||||||||||||||||||||||||||||
| Portfolio Company (1) (20) | Business Description | Type of Investment (2) (3) (15) | Investment Date (22) | Shares/Units | Total Rate | Reference Rate and Spread (25) | PIK Rate (19) | Maturity Date | Principal (4) | Cost (4) | Fair Value (18) | |||||||||||||||||||||||||||||||||
| Secured Debt | (9) | 7/30/2021 | 16.48% | SF+ | 11.00% | 7/31/2026 | 5,510 | 5,452 | 5,510 | |||||||||||||||||||||||||||||||||||
| Preferred Stock | (8) (23) | 7/30/2021 | 2,500 | 2,500 | 4,260 | |||||||||||||||||||||||||||||||||||||||
| 7,950 | 9,770 | |||||||||||||||||||||||||||||||||||||||||||
| Pinnacle TopCo, LLC | Manufacturer and Distributor of Garbage Can Liners, Poly Bags, Produce Bags, and Other Similar Products | |||||||||||||||||||||||||||||||||||||||||||
| Secured Debt | 12/21/2023 | 8.00% | 12/31/2028 | 115 | 105 | 105 | ||||||||||||||||||||||||||||||||||||||
| Secured Debt | 12/21/2023 | 13.00% | 12/31/2028 | 7,660 | 7,472 | 7,472 | ||||||||||||||||||||||||||||||||||||||
| Preferred Equity | 12/21/2023 | 110 | 3,135 | 3,135 | ||||||||||||||||||||||||||||||||||||||||
| 10,712 | 10,712 | |||||||||||||||||||||||||||||||||||||||||||
| Robbins Bros. Jewelry, Inc. | Bridal Jewelry Retailer | |||||||||||||||||||||||||||||||||||||||||||
| Secured Debt | (37) | 12/15/2021 | 12/15/2026 | — | (6) | (6) | ||||||||||||||||||||||||||||||||||||||
| Secured Debt | 12/15/2021 | 12.50% | 12/15/2026 | 3,790 | 3,745 | 3,421 | ||||||||||||||||||||||||||||||||||||||
| Preferred Equity | 12/15/2021 | 1,230 | 1,230 | — | ||||||||||||||||||||||||||||||||||||||||
| 4,969 | 3,415 | |||||||||||||||||||||||||||||||||||||||||||
| SI East, LLC | Rigid Industrial Packaging Manufacturing | |||||||||||||||||||||||||||||||||||||||||||
| Secured Debt | 8/31/2018 | 11.25% | 6/16/2028 | 375 | 370 | 375 | ||||||||||||||||||||||||||||||||||||||
| Secured Debt | 6/16/2023 | 12.47% | 6/16/2028 | 18,179 | 18,019 | 18,179 | ||||||||||||||||||||||||||||||||||||||
| Preferred Member Units | (8) | 8/31/2018 | 55 | 508 | 6,390 | |||||||||||||||||||||||||||||||||||||||
| 18,897 | 24,944 | |||||||||||||||||||||||||||||||||||||||||||
| Student Resource Center, LLC | (10) | Higher Education Services | ||||||||||||||||||||||||||||||||||||||||||
| Secured Debt | (14) | 12/31/2022 | 8.50% | 8.50% | 12/31/2027 | 5,918 | 5,426 | 3,543 | ||||||||||||||||||||||||||||||||||||
| Preferred Equity | 12/31/2022 | 6,564,055 | — | — | ||||||||||||||||||||||||||||||||||||||||
| 5,426 | 3,543 | |||||||||||||||||||||||||||||||||||||||||||
| Tedder Industries, LLC | Manufacturer of Firearm Holsters and Accessories | |||||||||||||||||||||||||||||||||||||||||||
| Secured Debt | (17) | 8/31/2018 | 12.00% | 8/31/2023 | 460 | 460 | 432 | |||||||||||||||||||||||||||||||||||||
| Secured Debt | (17) | 8/31/2018 | 12.00% | 8/31/2023 | 3,800 | 3,800 | 3,565 | |||||||||||||||||||||||||||||||||||||
| Preferred Member Units | 8/28/2023 | 1,651 | 165 | — | ||||||||||||||||||||||||||||||||||||||||
| Preferred Member Units | 2/1/2023 | 1,411 | 141 | — | ||||||||||||||||||||||||||||||||||||||||
| Preferred Member Units | 8/31/2018 | 136 | 2,311 | — | ||||||||||||||||||||||||||||||||||||||||
| 6,877 | 3,997 | |||||||||||||||||||||||||||||||||||||||||||
| Trantech Radiator Topco, LLC | Transformer Cooling Products and Services | |||||||||||||||||||||||||||||||||||||||||||
| Secured Debt | (37) | 5/31/2019 | 5/31/2024 | — | (1) | — | ||||||||||||||||||||||||||||||||||||||
| Secured Debt | 5/31/2019 | 12.00% | 5/31/2024 | 1,980 | 1,975 | 1,980 | ||||||||||||||||||||||||||||||||||||||
| Common Stock | (8) | 5/31/2019 | 154 | 1,164 | 3,180 | |||||||||||||||||||||||||||||||||||||||
| 3,138 | 5,160 | |||||||||||||||||||||||||||||||||||||||||||
| VVS Holdco LLC | Omnichannel Retailer of Animal Health Products | |||||||||||||||||||||||||||||||||||||||||||
| Secured Debt | (9) (17) (37) | 12/1/2021 | SF+ | 6.00% | 12/1/2023 | — | — | — | ||||||||||||||||||||||||||||||||||||
| Secured Debt | 12/1/2021 | 11.50% | 12/1/2026 | 7,050 | 6,926 | 6,926 | ||||||||||||||||||||||||||||||||||||||
| Preferred Equity | (8) (23) | 12/1/2021 | 3,060 | 3,060 | 3,060 | |||||||||||||||||||||||||||||||||||||||
| 9,986 | 9,986 | |||||||||||||||||||||||||||||||||||||||||||
| Subtotal Affiliate Investments (46.8% of net assets at fair value) | $ | 231,378 | $ | 291,279 | ||||||||||||||||||||||||||||||||||||||||
| Non-Control Investments (7) | ||||||||||||||||||||||||||||||||||||||||||||
| AAC Holdings, Inc. | (11) | Substance Abuse Treatment Service Provider | ||||||||||||||||||||||||||||||||||||||||||
| Portfolio Company (1) (20) | Business Description | Type of Investment (2) (3) (15) | Investment Date (22) | Shares/Units | Total Rate | Reference Rate and Spread (25) | PIK Rate (19) | Maturity Date | Principal (4) | Cost (4) | Fair Value (18) | |||||||||||||||||||||||||||||||||
| Secured Debt | 1/31/2023 | 18.00% | 18.00% | 6/25/2025 | $ | 151 | $ | 149 | $ | 149 | ||||||||||||||||||||||||||||||||||
| Secured Debt | 12/11/2020 | 18.00% | 18.00% | 6/25/2025 | 5,014 | 4,888 | 4,958 | |||||||||||||||||||||||||||||||||||||
| Common Stock | 12/11/2020 | 593,927 | 3,148 | — | ||||||||||||||||||||||||||||||||||||||||
| Warrants | (27) | 12/11/2020 | 197,717 | 12/11/2025 | — | — | ||||||||||||||||||||||||||||||||||||||
| 8,185 | 5,107 | |||||||||||||||||||||||||||||||||||||||||||
| AB Centers Acquisition Corporation | (10) | Applied Behavior Analysis Therapy Provider | ||||||||||||||||||||||||||||||||||||||||||
| Secured Debt | (9) (37) | 9/6/2022 | P+ | 5.00% | 9/6/2028 | — | (20) | — | ||||||||||||||||||||||||||||||||||||
| Secured Debt | (9) | 9/6/2022 | 11.43% | SF+ | 6.00% | 9/6/2028 | 1,081 | 1,066 | 1,081 | |||||||||||||||||||||||||||||||||||
| Secured Debt | (9) | 9/6/2022 | 11.43% | SF+ | 6.00% | 9/6/2028 | 2,304 | 2,219 | 2,304 | |||||||||||||||||||||||||||||||||||
| Secured Debt | (9) | 6/21/2023 | 11.43% | SF+ | 6.00% | 9/6/2028 | 772 | 743 | 772 | |||||||||||||||||||||||||||||||||||
| 4,008 | 4,157 | |||||||||||||||||||||||||||||||||||||||||||
| Acumera, Inc. | (10) | Managed Security Service Provider | ||||||||||||||||||||||||||||||||||||||||||
| Secured Debt | (9) (37) | 6/7/2023 | SF+ | 7.50% | 6/7/2028 | — | (8) | (8) | ||||||||||||||||||||||||||||||||||||
| Secured Debt | (9) | 6/7/2023 | 12.98% | SF+ | 7.50% | 6/7/2028 | 11,922 | 11,825 | 11,922 | |||||||||||||||||||||||||||||||||||
| Warrants | (40) | 6/7/2023 | 14,953 | 5/19/2028 | — | 90 | ||||||||||||||||||||||||||||||||||||||
| 11,817 | 12,004 | |||||||||||||||||||||||||||||||||||||||||||
| Adams Publishing Group, LLC | (10) | Local Newspaper Operator | ||||||||||||||||||||||||||||||||||||||||||
| Secured Debt | (9) (36) | 3/11/2022 | 11.00% | SF+ | 7.00% | 1.00% | 3/11/2027 | 936 | 936 | 917 | ||||||||||||||||||||||||||||||||||
| Secured Debt | (9) (36) | 3/11/2022 | 11.00% | SF+ | 7.00% | 1.00% | 3/11/2027 | 2,531 | 2,527 | 2,481 | ||||||||||||||||||||||||||||||||||
| 3,463 | 3,398 | |||||||||||||||||||||||||||||||||||||||||||
| ADS Tactical, Inc. | (11) | Value-Added Logistics and Supply Chain Provider to the Defense Industry | ||||||||||||||||||||||||||||||||||||||||||
| Secured Debt | (9) | 3/29/2021 | 11.22% | SF+ | 5.75% | 3/19/2026 | 4,250 | 4,210 | 4,214 | |||||||||||||||||||||||||||||||||||
| AMEREQUIP LLC. | (10) | Full Services Provider Including Design, Engineering and Manufacturing of Commercial and Agricultural Equipment | ||||||||||||||||||||||||||||||||||||||||||
| Secured Debt | (9) (37) | 8/31/2022 | SF+ | 7.40% | 8/31/2027 | — | — | — | ||||||||||||||||||||||||||||||||||||
| Secured Debt | (9) | 8/31/2022 | 12.76% | SF+ | 7.40% | 8/31/2027 | 1,538 | 1,538 | 1,538 | |||||||||||||||||||||||||||||||||||
| Common Stock | (8) | 8/31/2022 | 11 | 83 | 100 | |||||||||||||||||||||||||||||||||||||||
| 1,621 | 1,638 | |||||||||||||||||||||||||||||||||||||||||||
| American Health Staffing Group, Inc. | (10) | Healthcare Temporary Staffing | ||||||||||||||||||||||||||||||||||||||||||
| Secured Debt | (9) (37) | 11/19/2021 | P+ | 5.00% | 11/19/2026 | — | (10) | (10) | ||||||||||||||||||||||||||||||||||||
| Secured Debt | (9) | 11/19/2021 | 13.50% | P+ | 5.00% | 11/19/2026 | 8,188 | 8,140 | 8,188 | |||||||||||||||||||||||||||||||||||
| 8,130 | 8,178 | |||||||||||||||||||||||||||||||||||||||||||
| American Nuts, LLC | (10) | Roaster, Mixer and Packager of Bulk Nuts and Seeds | ||||||||||||||||||||||||||||||||||||||||||
| Secured Debt | (9) | 3/11/2022 | 15.29% | SF+ | 9.75% | 15.29% | 4/10/2026 | 4,833 | 4,812 | 4,102 | ||||||||||||||||||||||||||||||||||
| Secured Debt | (9) | 3/11/2022 | 15.29% | SF+ | 9.75% | 15.29% | 4/10/2026 | — | — | — | ||||||||||||||||||||||||||||||||||
| Secured Debt | (9) (14) | 3/11/2022 | 17.29% | SF+ | 11.75% | 17.29% | 4/10/2026 | 4,270 | 4,244 | 2,522 | ||||||||||||||||||||||||||||||||||
| Secured Debt | (9) (14) | 3/11/2022 | 17.29% | SF+ | 11.75% | 17.29% | 4/10/2026 | — | — | — | ||||||||||||||||||||||||||||||||||
| 9,056 | 6,624 | |||||||||||||||||||||||||||||||||||||||||||
| American Teleconferencing Services, Ltd. | (11) | Provider of Audio Conferencing and Video Collaboration Solutions | ||||||||||||||||||||||||||||||||||||||||||
| Secured Debt | (14) (17) | 9/17/2021 | 4/7/2023 | 2,425 | 2,375 | 109 | ||||||||||||||||||||||||||||||||||||||
| Portfolio Company (1) (20) | Business Description | Type of Investment (2) (3) (15) | Investment Date (22) | Shares/Units | Total Rate | Reference Rate and Spread (25) | PIK Rate (19) | Maturity Date | Principal (4) | Cost (4) | Fair Value (18) | |||||||||||||||||||||||||||||||||
| Secured Debt | (14) (17) | 5/19/2016 | 6/8/2023 | 11,693 | 11,451 | 526 | ||||||||||||||||||||||||||||||||||||||
| 13,826 | 635 | |||||||||||||||||||||||||||||||||||||||||||
| ArborWorks, LLC | (10) | Vegetation Management Services | ||||||||||||||||||||||||||||||||||||||||||
| Secured Debt | 11/6/2023 | 15.00% | 15.00% | 11/6/2028 | 1,007 | 1,007 | 1,007 | |||||||||||||||||||||||||||||||||||||
| Secured Debt | (9) | 11/6/2023 | 12.04% | SF+ | 6.50% | 12.04% | 11/6/2028 | 3,765 | 3,765 | 3,765 | ||||||||||||||||||||||||||||||||||
| Preferred Equity | 11/6/2023 | 17,265 | 7,468 | 7,468 | ||||||||||||||||||||||||||||||||||||||||
| Preferred Equity | 11/6/2023 | 17,265 | — | — | ||||||||||||||||||||||||||||||||||||||||
| Common Equity | 11/9/2021 | 2,070 | 124 | — | ||||||||||||||||||||||||||||||||||||||||
| 12,364 | 12,240 | |||||||||||||||||||||||||||||||||||||||||||
| Archer Systems, LLC | (10) | Mass Tort Settlement Administration Solutions Provider | ||||||||||||||||||||||||||||||||||||||||||
| Common Stock | 8/11/2022 | 62,402 | 62 | 100 | ||||||||||||||||||||||||||||||||||||||||
| ATS Operating, LLC | (10) | For-Profit Thrift Retailer | ||||||||||||||||||||||||||||||||||||||||||
| Secured Debt | (9) | 1/18/2022 | 12.16% | SF+ | 6.50% | 1/18/2027 | 50 | 50 | 50 | |||||||||||||||||||||||||||||||||||
| Secured Debt | (9) | 1/18/2022 | 11.16% | SF+ | 5.50% | 1/18/2027 | 925 | 911 | 925 | |||||||||||||||||||||||||||||||||||
| Secured Debt | (9) | 1/18/2022 | 13.16% | SF+ | 7.50% | 1/18/2027 | 925 | 911 | 925 | |||||||||||||||||||||||||||||||||||
| Common Stock | 1/18/2022 | 100,000 | 100 | 90 | ||||||||||||||||||||||||||||||||||||||||
| 1,972 | 1,990 | |||||||||||||||||||||||||||||||||||||||||||
| AVEX Aviation Holdings, LLC | (10) | Specialty Aircraft Dealer & MRO Provider | ||||||||||||||||||||||||||||||||||||||||||
| Secured Debt | (9) (37) | 12/23/2022 | SF+ | 7.25% | 12/23/2027 | — | (17) | (5) | ||||||||||||||||||||||||||||||||||||
| Secured Debt | (9) | 12/23/2022 | 12.76% | SF+ | 7.25% | 12/23/2027 | 3,417 | 3,321 | 3,344 | |||||||||||||||||||||||||||||||||||
| Common Equity | (8) | 12/15/2021 | 137 | 134 | 124 | |||||||||||||||||||||||||||||||||||||||
| 3,438 | 3,463 | |||||||||||||||||||||||||||||||||||||||||||
| Berry Aviation, Inc. | (10) | Charter Airline Services | ||||||||||||||||||||||||||||||||||||||||||
| Preferred Member Units | (23) | 11/12/2019 | 122,416 | — | 200 | |||||||||||||||||||||||||||||||||||||||
| Preferred Member Units | (8) (23) | 7/6/2018 | 1,548,387 | — | 2,560 | |||||||||||||||||||||||||||||||||||||||
| — | 2,760 | |||||||||||||||||||||||||||||||||||||||||||
| Bettercloud, Inc. | (10) | SaaS Provider of Workflow Management and Business Application Solutions | ||||||||||||||||||||||||||||||||||||||||||
| Secured Debt | (9) (37) | 6/30/2022 | SF+ | 7.25% | 6/30/2028 | — | (18) | (18) | ||||||||||||||||||||||||||||||||||||
| Secured Debt | (9) | 6/30/2022 | 12.64% | SF+ | 7.25% | 6.25% | 6/30/2028 | 8,535 | 8,419 | 7,998 | ||||||||||||||||||||||||||||||||||
| 8,401 | 7,980 | |||||||||||||||||||||||||||||||||||||||||||
| Binswanger Enterprises, LLC | (10) | Glass Repair and Installation Service Provider | ||||||||||||||||||||||||||||||||||||||||||
| Member Units | 3/10/2017 | 1,050,000 | 1,050 | 120 | ||||||||||||||||||||||||||||||||||||||||
| Bluestem Brands, Inc. | (11) | Multi-Channel Retailer of General Merchandise | ||||||||||||||||||||||||||||||||||||||||||
| Secured Debt | (9) | 10/19/2022 | 16.00% | P+ | 7.50% | 15.00% | 8/28/2025 | 2,035 | 2,035 | 1,907 | ||||||||||||||||||||||||||||||||||
| Secured Debt | (9) | 8/28/2020 | 13.96% | SF+ | 8.50% | 12.96% | 8/28/2025 | 3,941 | 3,305 | 3,695 | ||||||||||||||||||||||||||||||||||
| Common Stock | 10/1/2020 | 700,446 | — | 533 | ||||||||||||||||||||||||||||||||||||||||
| Warrants | (27) | 10/19/2022 | 175,110 | 10/19/2032 | 1,111 | 129 | ||||||||||||||||||||||||||||||||||||||
| 6,451 | 6,264 | |||||||||||||||||||||||||||||||||||||||||||
| Boccella Precast Products LLC | Manufacturer of Precast Hollow Core Concrete | |||||||||||||||||||||||||||||||||||||||||||
| Secured Debt | 9/23/2021 | 10.00% | 2/28/2027 | 80 | 80 | 80 | ||||||||||||||||||||||||||||||||||||||
| Portfolio Company (1) (20) | Business Description | Type of Investment (2) (3) (15) | Investment Date (22) | Shares/Units | Total Rate | Reference Rate and Spread (25) | PIK Rate (19) | Maturity Date | Principal (4) | Cost (4) | Fair Value (18) | |||||||||||||||||||||||||||||||||
| Member Units | 6/30/2017 | 540,000 | 564 | 498 | ||||||||||||||||||||||||||||||||||||||||
| 644 | 578 | |||||||||||||||||||||||||||||||||||||||||||
| Bond Brand Loyalty ULC | (10) (13) (21) | Provider of Loyalty Marketing Services | ||||||||||||||||||||||||||||||||||||||||||
| Secured Debt | (9) (37) | 5/1/2023 | SF+ | 7.00% | 5/1/2028 | — | (16) | (16) | ||||||||||||||||||||||||||||||||||||
| Secured Debt | (9) | 5/1/2023 | 11.54% | SF+ | 6.00% | 5/1/2028 | 4,040 | 3,970 | 4,040 | |||||||||||||||||||||||||||||||||||
| Secured Debt | (9) | 5/1/2023 | 13.54% | SF+ | 8.00% | 5/1/2028 | 4,040 | 3,970 | 4,040 | |||||||||||||||||||||||||||||||||||
| Preferred Equity | 5/1/2023 | 360 | 360 | 310 | ||||||||||||||||||||||||||||||||||||||||
| Common Equity | 5/1/2023 | 360 | — | — | ||||||||||||||||||||||||||||||||||||||||
| 8,284 | 8,374 | |||||||||||||||||||||||||||||||||||||||||||
| Brightwood Capital Fund Investments | (12) (13) | Investment Partnership | ||||||||||||||||||||||||||||||||||||||||||
| LP Interests (Brightwood Capital Fund III, LP) | (24) | 7/21/2014 | 0.5% | 2,270 | 1,360 | |||||||||||||||||||||||||||||||||||||||
| LP Interests (Brightwood Capital Fund IV, LP) | (8) (24) | 10/26/2016 | 1.2% | 8,737 | 8,716 | |||||||||||||||||||||||||||||||||||||||
| 11,007 | 10,076 | |||||||||||||||||||||||||||||||||||||||||||
| Buca C, LLC | Casual Restaurant Group | |||||||||||||||||||||||||||||||||||||||||||
| Secured Debt | (17) | 6/30/2015 | 12.00% | 8/31/2023 | 11,490 | 11,490 | 8,218 | |||||||||||||||||||||||||||||||||||||
| Preferred Member Units | 6/30/2015 | 4 | 6.00% | 6.00% | 3,040 | — | ||||||||||||||||||||||||||||||||||||||
| 14,530 | 8,218 | |||||||||||||||||||||||||||||||||||||||||||
| Burning Glass Intermediate Holding Company, Inc. | (10) | Provider of Skills-Based Labor Market Analytics | ||||||||||||||||||||||||||||||||||||||||||
| Secured Debt | (9) | 6/14/2021 | 10.46% | SF+ | 5.00% | 6/10/2026 | 310 | 296 | 310 | |||||||||||||||||||||||||||||||||||
| Secured Debt | (9) | 6/14/2021 | 10.46% | SF+ | 5.00% | 6/10/2028 | 13,121 | 12,970 | 13,121 | |||||||||||||||||||||||||||||||||||
| 13,266 | 13,431 | |||||||||||||||||||||||||||||||||||||||||||
| CAI Software LLC | Provider of Specialized Enterprise Resource Planning Software | |||||||||||||||||||||||||||||||||||||||||||
| Preferred Equity | 12/13/2021 | 379,338 | 379 | 379 | ||||||||||||||||||||||||||||||||||||||||
| Preferred Equity | 12/13/2021 | 126,446 | — | — | ||||||||||||||||||||||||||||||||||||||||
| 379 | 379 | |||||||||||||||||||||||||||||||||||||||||||
| Career Team Holdings, LLC | Provider of Workforce Training and Career Development Services | |||||||||||||||||||||||||||||||||||||||||||
| Secured Debt | (9) | 12/17/2021 | 11.38% | SF+ | 6.00% | 12/17/2026 | 100 | 96 | 96 | |||||||||||||||||||||||||||||||||||
| Secured Debt | 12/17/2021 | 13.00% | 12/17/2026 | 2,225 | 2,185 | 2,185 | ||||||||||||||||||||||||||||||||||||||
| Common Stock | 12/17/2021 | 50,000 | 500 | 500 | ||||||||||||||||||||||||||||||||||||||||
| 2,781 | 2,781 | |||||||||||||||||||||||||||||||||||||||||||
| CaseWorthy, Inc. | (10) | SaaS Provider of Case Management Solutions | ||||||||||||||||||||||||||||||||||||||||||
| Secured Debt | (9) (37) | 5/18/2022 | SF+ | 6.00% | 5/18/2027 | — | (3) | (3) | ||||||||||||||||||||||||||||||||||||
| Secured Debt | (9) | 5/18/2022 | 11.61% | SF+ | 6.00% | 5/18/2027 | 2,581 | 2,561 | 2,581 | |||||||||||||||||||||||||||||||||||
| Secured Debt | (9) | 5/18/2022 | 11.61% | SF+ | 6.00% | 5/18/2027 | 1,985 | 1,971 | 1,985 | |||||||||||||||||||||||||||||||||||
| Common Equity | 12/30/2022 | 80,000 | 80 | 80 | ||||||||||||||||||||||||||||||||||||||||
| 4,609 | 4,643 | |||||||||||||||||||||||||||||||||||||||||||
| Channel Partners Intermediateco, LLC | (10) | Outsourced Consumer Services Provider | ||||||||||||||||||||||||||||||||||||||||||
| Secured Debt | (9) (44) | 2/7/2022 | 12.60% | SF+ | 7.00% | 2/7/2027 | 190 | 175 | 183 | |||||||||||||||||||||||||||||||||||
| Secured Debt | (9) | 2/7/2022 | 12.66% | SF+ | 7.00% | 2/7/2027 | 3,360 | 3,317 | 3,224 | |||||||||||||||||||||||||||||||||||
| Secured Debt | (9) | 6/24/2022 | 12.66% | SF+ | 7.00% | 2/7/2027 | 186 | 184 | 179 | |||||||||||||||||||||||||||||||||||
| Secured Debt | (9) | 3/27/2023 | 12.66% | SF+ | 7.00% | 2/7/2027 | 450 | 440 | 432 | |||||||||||||||||||||||||||||||||||
| Portfolio Company (1) (20) | Business Description | Type of Investment (2) (3) (15) | Investment Date (22) | Shares/Units | Total Rate | Reference Rate and Spread (25) | PIK Rate (19) | Maturity Date | Principal (4) | Cost (4) | Fair Value (18) | |||||||||||||||||||||||||||||||||
| 4,116 | 4,018 | |||||||||||||||||||||||||||||||||||||||||||
| Clarius BIGS, LLC | (10) | Prints & Advertising Film Financing | ||||||||||||||||||||||||||||||||||||||||||
| Secured Debt | (14) (17) | 9/23/2014 | 1/5/2015 | 2,694 | 2,350 | 16 | ||||||||||||||||||||||||||||||||||||||
| Classic H&G Holdings, LLC | Provider of Engineered Packaging Solutions | |||||||||||||||||||||||||||||||||||||||||||
| Secured Debt | (9) | 3/12/2020 | 11.69% | SF+ | 6.00% | 3/12/2025 | 1,140 | 1,133 | 1,140 | |||||||||||||||||||||||||||||||||||
| Secured Debt | 3/12/2020 | 8.00% | 3/12/2025 | 4,819 | 4,781 | 4,819 | ||||||||||||||||||||||||||||||||||||||
| Preferred Member Units | (8) | 3/12/2020 | 39 | 1,440 | 4,000 | |||||||||||||||||||||||||||||||||||||||
| 7,354 | 9,959 | |||||||||||||||||||||||||||||||||||||||||||
| Computer Data Source, LLC | (10) | Third Party Maintenance Provider to the Data Center Ecosystem | ||||||||||||||||||||||||||||||||||||||||||
| Secured Debt | (9) (30) | 8/6/2021 | 13.52% | SF+ | 8.00% | 8/6/2026 | 4,167 | 4,123 | 4,040 | |||||||||||||||||||||||||||||||||||
| Secured Debt | (9) | 8/6/2021 | 13.52% | SF+ | 8.00% | 8/6/2026 | 15,260 | 15,098 | 14,797 | |||||||||||||||||||||||||||||||||||
| 19,221 | 18,837 | |||||||||||||||||||||||||||||||||||||||||||
| Construction Supply Investments, LLC | (10) | Distribution Platform of Specialty Construction Materials to Professional Concrete and Masonry Contractors | ||||||||||||||||||||||||||||||||||||||||||
| Member Units | 12/29/2016 | 861,618 | 3,335 | 23,135 | ||||||||||||||||||||||||||||||||||||||||
| CQ Fluency, LLC | (10) | Global Language Services Provider | ||||||||||||||||||||||||||||||||||||||||||
| Secured Debt | (9) (37) | 12/27/2023 | SF+ | 7.00% | 6/27/2027 | — | (44) | (44) | ||||||||||||||||||||||||||||||||||||
| Secured Debt | (9) (37) | 12/27/2023 | SF+ | 7.00% | 6/27/2027 | — | (44) | (44) | ||||||||||||||||||||||||||||||||||||
| Secured Debt | (9) | 12/27/2023 | 12.45% | SF+ | 7.00% | 6/27/2027 | 7,500 | 7,280 | 7,280 | |||||||||||||||||||||||||||||||||||
| 7,192 | 7,192 | |||||||||||||||||||||||||||||||||||||||||||
| Dalton US Inc. | (10) | Provider of Supplemental Labor Services | ||||||||||||||||||||||||||||||||||||||||||
| Common Stock | 8/16/2022 | 52 | 60 | |||||||||||||||||||||||||||||||||||||||||
| DMA Industries, LLC | Distributor of aftermarket ride control products | |||||||||||||||||||||||||||||||||||||||||||
| Secured Debt | 11/19/2021 | 12.00% | 11/19/2026 | 4,700 | 4,642 | 4,700 | ||||||||||||||||||||||||||||||||||||||
| Preferred Equity | 11/19/2021 | 1,486 | 1,486 | 1,920 | ||||||||||||||||||||||||||||||||||||||||
| 6,128 | 6,620 | |||||||||||||||||||||||||||||||||||||||||||
| DTE Enterprises, LLC | (10) | Industrial Powertrain Repair and Services | ||||||||||||||||||||||||||||||||||||||||||
| Class AA Preferred Member Units (non-voting) | (8) | 4/13/2018 | 10.00% | 10.00% | 1,284 | 1,283 | ||||||||||||||||||||||||||||||||||||||
| Class A Preferred Member Units | 4/13/2018 | 776,316 | 8.00% | 8.00% | 776 | 260 | ||||||||||||||||||||||||||||||||||||||
| 2,060 | 1,543 | |||||||||||||||||||||||||||||||||||||||||||
| Dynamic Communities, LLC | (10) | Developer of Business Events and Online Community Groups | ||||||||||||||||||||||||||||||||||||||||||
| Secured Debt | (9) | 12/20/2022 | 10.45% | SF+ | 5.00% | 10.45% | 12/31/2026 | 2,070 | 1,912 | 1,912 | ||||||||||||||||||||||||||||||||||
| Secured Debt | (9) | 12/20/2022 | 12.45% | SF+ | 7.00% | 12.45% | 12/31/2026 | 2,113 | 1,879 | 1,859 | ||||||||||||||||||||||||||||||||||
| Preferred Equity | 12/20/2022 | 125,000 | 128 | 60 | ||||||||||||||||||||||||||||||||||||||||
| Preferred Equity | 12/20/2022 | 2,376,241 | — | — | ||||||||||||||||||||||||||||||||||||||||
| Common Equity | 12/20/2022 | 1,250,000 | — | — | ||||||||||||||||||||||||||||||||||||||||
| 3,919 | 3,831 | |||||||||||||||||||||||||||||||||||||||||||
| Portfolio Company (1) (20) | Business Description | Type of Investment (2) (3) (15) | Investment Date (22) | Shares/Units | Total Rate | Reference Rate and Spread (25) | PIK Rate (19) | Maturity Date | Principal (4) | Cost (4) | Fair Value (18) | |||||||||||||||||||||||||||||||||
| Elgin AcquireCo, LLC | Manufacturer and Distributor of Engine and Chassis Components | |||||||||||||||||||||||||||||||||||||||||||
| Secured Debt | (9) (37) | 10/3/2022 | SF+ | 6.00% | 10/3/2027 | — | — | — | ||||||||||||||||||||||||||||||||||||
| Secured Debt | 10/3/2022 | 12.00% | 10/3/2027 | 1,227 | 1,200 | 1,200 | ||||||||||||||||||||||||||||||||||||||
| Secured Debt | 10/3/2022 | 9.00% | 10/3/2052 | 412 | 409 | 409 | ||||||||||||||||||||||||||||||||||||||
| Common Stock | 10/3/2022 | 19 | 374 | 390 | ||||||||||||||||||||||||||||||||||||||||
| Common Stock | (23) | 10/3/2022 | 61 | 102 | 109 | |||||||||||||||||||||||||||||||||||||||
| 2,085 | 2,108 | |||||||||||||||||||||||||||||||||||||||||||
| Emerald Technologies Acquisition Co, Inc. | (11) | Design & Manufacturing | ||||||||||||||||||||||||||||||||||||||||||
| Secured Debt | (9) | 2/10/2022 | 11.79% | SF+ | 6.25% | 12/29/2027 | 2,391 | 2,357 | 2,175 | |||||||||||||||||||||||||||||||||||
| Engineering Research & Consulting, LLC | (10) | Provider of Engineering & Consulting Services to US Department of Defense | ||||||||||||||||||||||||||||||||||||||||||
| Secured Debt | (9) (37) | 5/23/2022 | P+ | 5.50% | 5/23/2027 | — | (11) | — | ||||||||||||||||||||||||||||||||||||
| Secured Debt | (9) | 5/23/2022 | 11.98% | SF+ | 6.50% | 5/23/2028 | 5,095 | 5,023 | 5,095 | |||||||||||||||||||||||||||||||||||
| 5,012 | 5,095 | |||||||||||||||||||||||||||||||||||||||||||
| Escalent, Inc. | (10) | Market Research and Consulting Firm | ||||||||||||||||||||||||||||||||||||||||||
| Secured Debt | (9) (37) | 4/7/2023 | SF+ | 8.00% | 4/7/2029 | — | (9) | (9) | ||||||||||||||||||||||||||||||||||||
| Secured Debt | (9) | 4/7/2023 | 13.45% | SF+ | 8.00% | 4/7/2029 | 6,924 | 6,742 | 6,924 | |||||||||||||||||||||||||||||||||||
| Common Equity | 4/7/2023 | 170,998 | 174 | 190 | ||||||||||||||||||||||||||||||||||||||||
| 6,907 | 7,105 | |||||||||||||||||||||||||||||||||||||||||||
| Event Holdco, LLC | (10) | Event and Learning Management Software for Healthcare Organizations and Systems | ||||||||||||||||||||||||||||||||||||||||||
| Secured Debt | (9) | 12/22/2021 | 12.61% | SF+ | 7.00% | 12/22/2026 | 308 | 306 | 302 | |||||||||||||||||||||||||||||||||||
| Secured Debt | (9) | 12/22/2021 | 12.61% | SF+ | 7.00% | 12/22/2026 | 3,681 | 3,659 | 3,614 | |||||||||||||||||||||||||||||||||||
| 3,965 | 3,916 | |||||||||||||||||||||||||||||||||||||||||||
| Garyline, LLC | (10) | Manufacturer of Consumer Plastic Products | ||||||||||||||||||||||||||||||||||||||||||
| Secured Debt | (9) (37) | 11/10/2023 | SF+ | 6.75% | 11/10/2028 | — | (76) | (76) | ||||||||||||||||||||||||||||||||||||
| Secured Debt | (9) | 11/10/2023 | 12.22% | SF+ | 6.75% | 11/10/2028 | 9,664 | 9,384 | 9,384 | |||||||||||||||||||||||||||||||||||
| Common Equity | 11/10/2023 | 210 | 210 | |||||||||||||||||||||||||||||||||||||||||
| 9,518 | 9,518 | |||||||||||||||||||||||||||||||||||||||||||
| Hawk Ridge Systems, LLC | Value-Added Reseller of Engineering Design and Manufacturing Solutions | |||||||||||||||||||||||||||||||||||||||||||
| Secured Debt | (9) | 12/2/2016 | 11.65% | SF+ | 6.00% | 1/15/2026 | 494 | 492 | 494 | |||||||||||||||||||||||||||||||||||
| Secured Debt | 12/2/2016 | 12.50% | 1/15/2026 | 9,744 | 9,697 | 9,744 | ||||||||||||||||||||||||||||||||||||||
| Preferred Member Units | 12/2/2016 | 56 | 713 | 4,370 | ||||||||||||||||||||||||||||||||||||||||
| Preferred Member Units | (23) | 12/2/2016 | 56 | 38 | 230 | |||||||||||||||||||||||||||||||||||||||
| 10,940 | 14,838 | |||||||||||||||||||||||||||||||||||||||||||
| HDC/HW Intermediate Holdings | (10) | Managed Services and Hosting Provider | ||||||||||||||||||||||||||||||||||||||||||
| Secured Debt | (9) (17) | 12/21/2018 | 14.34% | SF+ | 9.50% | 14.34% | 12/21/2023 | 205 | 205 | 186 | ||||||||||||||||||||||||||||||||||
| Secured Debt | (9) (17) | 12/21/2018 | 14.34% | SF+ | 9.50% | 14.34% | 12/21/2023 | 2,036 | 2,036 | 1,849 | ||||||||||||||||||||||||||||||||||
| 2,241 | 2,035 | |||||||||||||||||||||||||||||||||||||||||||
| HEADLANDS OP-CO LLC | (10) | Clinical Trial Sites Operator | ||||||||||||||||||||||||||||||||||||||||||
| Secured Debt | (9) (37) | 8/1/2022 | SF+ | 6.50% | 8/1/2027 | — | (14) | (14) | ||||||||||||||||||||||||||||||||||||
| Secured Debt | (9) | 8/1/2022 | 11.86% | SF+ | 6.50% | 8/1/2027 | 1,995 | 1,962 | 1,995 | |||||||||||||||||||||||||||||||||||
| Secured Debt | (9) | 8/1/2022 | 11.86% | SF+ | 6.50% | 8/1/2027 | 4,925 | 4,854 | 4,925 | |||||||||||||||||||||||||||||||||||
| Portfolio Company (1) (20) | Business Description | Type of Investment (2) (3) (15) | Investment Date (22) | Shares/Units | Total Rate | Reference Rate and Spread (25) | PIK Rate (19) | Maturity Date | Principal (4) | Cost (4) | Fair Value (18) | |||||||||||||||||||||||||||||||||
| 6,802 | 6,906 | |||||||||||||||||||||||||||||||||||||||||||
| Hybrid Promotions, LLC | (10) | Wholesaler of Licensed, Branded and Private Label Apparel | ||||||||||||||||||||||||||||||||||||||||||
| Secured Debt | (9) | 6/30/2021 | 15.91% | SF+ | 8.25% | 2.00% | 6/30/2026 | 7,964 | 7,813 | 7,313 | ||||||||||||||||||||||||||||||||||
| IG Parent Corporation | (11) | Software Engineering | ||||||||||||||||||||||||||||||||||||||||||
| Secured Debt | (9) (37) | 7/30/2021 | SF+ | 5.75% | 7/30/2026 | — | (13) | — | ||||||||||||||||||||||||||||||||||||
| Secured Debt | (9) | 7/30/2021 | 10.96% | SF+ | 5.50% | 7/30/2028 | 6,266 | 6,200 | 6,266 | |||||||||||||||||||||||||||||||||||
| Secured Debt | (9) | 7/30/2021 | 10.96% | SF+ | 5.50% | 7/30/2028 | 1,942 | 1,921 | 1,942 | |||||||||||||||||||||||||||||||||||
| 8,108 | 8,208 | |||||||||||||||||||||||||||||||||||||||||||
| Imaging Business Machines, L.L.C. | (10) | Technology Hardware & Equipment | ||||||||||||||||||||||||||||||||||||||||||
| Secured Debt | (9) (29) | 6/8/2023 | 12.41% | SF+ | 7.00% | 6/30/2028 | 791 | 791 | 786 | |||||||||||||||||||||||||||||||||||
| Secured Debt | (9) | 6/8/2023 | 12.45% | SF+ | 7.00% | 6/30/2028 | 10,384 | 10,068 | 10,318 | |||||||||||||||||||||||||||||||||||
| Common Equity | 6/8/2023 | 422 | 580 | 550 | ||||||||||||||||||||||||||||||||||||||||
| 11,439 | 11,654 | |||||||||||||||||||||||||||||||||||||||||||
| Implus Footcare, LLC | (10) | Provider of Footwear and Related Accessories | ||||||||||||||||||||||||||||||||||||||||||
| Secured Debt | (9) | 6/1/2017 | 14.25% | SF+ | 7.75% | 1.00% | 7/31/2024 | 17,012 | 17,010 | 15,816 | ||||||||||||||||||||||||||||||||||
| Industrial Services Acquisition, LLC | (10) | Industrial Cleaning Services | ||||||||||||||||||||||||||||||||||||||||||
| Secured Debt | (9) (32) | 8/13/2021 | 12.22% | SF+ | 6.75% | 8/13/2026 | 752 | 734 | 752 | |||||||||||||||||||||||||||||||||||
| Secured Debt | (9) | 8/13/2021 | 12.22% | SF+ | 6.75% | 8/13/2026 | 11,436 | 11,330 | 11,436 | |||||||||||||||||||||||||||||||||||
| Preferred Member Units | (8) (23) | 1/31/2018 | 336 | 10.00% | 10.00% | 321 | 415 | |||||||||||||||||||||||||||||||||||||
| Preferred Member Units | (8) (23) | 5/17/2019 | 187 | 20.00% | 20.00% | 240 | 279 | |||||||||||||||||||||||||||||||||||||
| Member Units | (23) | 6/17/2016 | 2,100 | 2,100 | 1,610 | |||||||||||||||||||||||||||||||||||||||
| 14,725 | 14,492 | |||||||||||||||||||||||||||||||||||||||||||
| Infinity X1 Holdings, LLC | Manufacturer and Supplier of Personal Lighting Products | |||||||||||||||||||||||||||||||||||||||||||
| Secured Debt | 3/31/2023 | 13.00% | 3/31/2028 | 4,388 | 4,314 | 4,314 | ||||||||||||||||||||||||||||||||||||||
| Preferred Equity | 3/31/2023 | 20,000 | 1,000 | 1,000 | ||||||||||||||||||||||||||||||||||||||||
| 5,314 | 5,314 | |||||||||||||||||||||||||||||||||||||||||||
| Infolinks Media Buyco, LLC | (10) | Exclusive Placement Provider to the Advertising Ecosystem | ||||||||||||||||||||||||||||||||||||||||||
| Secured Debt | (9) | 11/1/2021 | 11.21% | SF+ | 5.75% | 11/1/2026 | 1,881 | 1,829 | 1,881 | |||||||||||||||||||||||||||||||||||
| Secured Debt | (9) | 11/1/2021 | 11.21% | SF+ | 5.75% | 11/1/2026 | 9,690 | 9,579 | 9,690 | |||||||||||||||||||||||||||||||||||
| 11,408 | 11,571 | |||||||||||||||||||||||||||||||||||||||||||
| Insight Borrower Corporation | (10) | Test, Inspection, and Certification Instrument Provider | ||||||||||||||||||||||||||||||||||||||||||
| Secured Debt | (9) (37) | 7/19/2023 | SF+ | 6.25% | 7/19/2028 | — | (40) | (40) | ||||||||||||||||||||||||||||||||||||
| Secured Debt | (9) (37) | 7/19/2023 | SF+ | 6.25% | 7/19/2029 | — | (33) | (33) | ||||||||||||||||||||||||||||||||||||
| Secured Debt | (9) | 7/19/2023 | 11.65% | SF+ | 6.25% | 7/19/2029 | 8,373 | 8,143 | 8,287 | |||||||||||||||||||||||||||||||||||
| Common Equity | 7/19/2023 | 47,847 | 239 | 239 | ||||||||||||||||||||||||||||||||||||||||
| 8,309 | 8,453 | |||||||||||||||||||||||||||||||||||||||||||
| Inspire Aesthetics Management, LLC | (10) | Surgical and Non-Surgical Plastic Surgery and Aesthetics Provider | ||||||||||||||||||||||||||||||||||||||||||
| Secured Debt | (9) (31) | 4/3/2023 | 13.53% | SF+ | 8.00% | 4/3/2028 | 676 | 659 | 664 | |||||||||||||||||||||||||||||||||||
| Secured Debt | (9) | 4/3/2023 | 13.55% | SF+ | 8.00% | 4/3/2028 | 6,256 | 6,115 | 6,144 | |||||||||||||||||||||||||||||||||||
| Portfolio Company (1) (20) | Business Description | Type of Investment (2) (3) (15) | Investment Date (22) | Shares/Units | Total Rate | Reference Rate and Spread (25) | PIK Rate (19) | Maturity Date | Principal (4) | Cost (4) | Fair Value (18) | |||||||||||||||||||||||||||||||||
| Secured Debt | (9) | 6/14/2023 | 13.55% | SF+ | 8.00% | 4/3/2028 | 1,260 | 1,231 | 1,237 | |||||||||||||||||||||||||||||||||||
| Common Equity | 4/3/2023 | 101,719 | 322 | 190 | ||||||||||||||||||||||||||||||||||||||||
| 8,327 | 8,235 | |||||||||||||||||||||||||||||||||||||||||||
| Interface Security Systems, L.L.C | (10) | Commercial Security & Alarm Services | ||||||||||||||||||||||||||||||||||||||||||
| Secured Debt | (17) (28) | 12/9/2021 | 15.48% | SF+ | 10.00% | 8/7/2023 | 1,835 | 1,835 | 1,781 | |||||||||||||||||||||||||||||||||||
| Secured Debt | (9) (14) (17) | 8/7/2019 | 12.46% | SF+ | 7.00% | 12.46% | 8/7/2023 | 7,334 | 7,254 | 433 | ||||||||||||||||||||||||||||||||||
| Common Stock | 12/7/2021 | 2,143 | — | — | ||||||||||||||||||||||||||||||||||||||||
| 9,089 | 2,214 | |||||||||||||||||||||||||||||||||||||||||||
| Intermedia Holdings, Inc. | (11) | Unified Communications as a Service | ||||||||||||||||||||||||||||||||||||||||||
| Secured Debt | (9) | 8/3/2018 | 11.47% | SF+ | 6.00% | 7/19/2025 | 5,544 | 5,539 | 5,370 | |||||||||||||||||||||||||||||||||||
| Invincible Boat Company, LLC. | (10) | Manufacturer of Sport Fishing Boats | ||||||||||||||||||||||||||||||||||||||||||
| Secured Debt | (9) | 8/28/2019 | 12.00% | SF+ | 6.50% | 8/28/2025 | 519 | 516 | 509 | |||||||||||||||||||||||||||||||||||
| Secured Debt | (9) | 8/28/2019 | 12.00% | SF+ | 6.50% | 8/28/2025 | 16,812 | 16,751 | 16,515 | |||||||||||||||||||||||||||||||||||
| 17,267 | 17,024 | |||||||||||||||||||||||||||||||||||||||||||
| INW Manufacturing, LLC | (11) | Manufacturer of Nutrition and Wellness Products | ||||||||||||||||||||||||||||||||||||||||||
| Secured Debt | (9) | 5/19/2021 | 11.36% | SF+ | 5.75% | 3/25/2027 | 6,656 | 6,537 | 5,325 | |||||||||||||||||||||||||||||||||||
| Iron-Main Investments, LLC | Consumer Reporting Agency Providing Employment Background Checks and Drug Testing | |||||||||||||||||||||||||||||||||||||||||||
| Secured Debt | 8/2/2021 | 13.50% | 1/31/2028 | 1,128 | 1,108 | 1,108 | ||||||||||||||||||||||||||||||||||||||
| Secured Debt | 9/1/2021 | 13.50% | 1/31/2028 | 735 | 722 | 722 | ||||||||||||||||||||||||||||||||||||||
| Secured Debt | 11/15/2021 | 13.50% | 1/31/2028 | 2,236 | 2,236 | 2,236 | ||||||||||||||||||||||||||||||||||||||
| Secured Debt | 11/15/2021 | 13.50% | 1/31/2028 | 4,906 | 4,815 | 4,815 | ||||||||||||||||||||||||||||||||||||||
| Secured Debt | 1/31/2023 | 13.50% | 1/31/2028 | 2,641 | 2,525 | 2,525 | ||||||||||||||||||||||||||||||||||||||
| Common Stock | 8/3/2021 | 50,753 | 689 | 670 | ||||||||||||||||||||||||||||||||||||||||
| 12,095 | 12,076 | |||||||||||||||||||||||||||||||||||||||||||
| Isagenix International, LLC | (11) | Direct Marketer of Health & Wellness Products | ||||||||||||||||||||||||||||||||||||||||||
| Secured Debt | (9) | 4/13/2023 | 11.04% | SF+ | 5.50% | 8.54% | 4/14/2028 | 2,615 | 2,374 | 2,301 | ||||||||||||||||||||||||||||||||||
| Common Equity | 4/13/2023 | 186,322 | — | — | ||||||||||||||||||||||||||||||||||||||||
| 2,374 | 2,301 | |||||||||||||||||||||||||||||||||||||||||||
| ITA Holdings Group, LLC | Air Ambulance Services | |||||||||||||||||||||||||||||||||||||||||||
| Secured Debt | (9) | 6/21/2023 | 16.59% | SF+ | 9.00% | 2.00% | 6/21/2027 | 207 | 201 | 201 | ||||||||||||||||||||||||||||||||||
| Secured Debt | (9) | 6/21/2023 | 16.59% | SF+ | 9.00% | 2.00% | 6/21/2027 | 178 | 174 | 174 | ||||||||||||||||||||||||||||||||||
| Secured Debt | (9) | 6/21/2023 | 15.59% | SF+ | 8.00% | 2.00% | 6/21/2027 | 1,084 | 842 | 842 | ||||||||||||||||||||||||||||||||||
| Secured Debt | (9) | 6/21/2023 | 17.59% | SF+ | 10.00% | 2.00% | 6/21/2027 | 1,091 | 848 | 848 | ||||||||||||||||||||||||||||||||||
| Warrants | (27) | 6/21/2023 | 48,327 | 6/21/2033 | 523 | 523 | ||||||||||||||||||||||||||||||||||||||
| 2,588 | 2,588 | |||||||||||||||||||||||||||||||||||||||||||
| Jackmont Hospitality, Inc. | (10) | Franchisee of Casual Dining Restaurants | ||||||||||||||||||||||||||||||||||||||||||
| Secured Debt | (9) (26) | 10/26/2022 | 12.46% | SF+ | 7.00% | 11/4/2024 | 1,675 | 1,649 | 1,675 | |||||||||||||||||||||||||||||||||||
| Secured Debt | (9) | 11/8/2021 | 12.46% | SF+ | 7.00% | 11/4/2024 | 3,948 | 3,948 | 3,948 | |||||||||||||||||||||||||||||||||||
| Preferred Equity | 11/8/2021 | 5,653,333 | 216 | 2,190 | ||||||||||||||||||||||||||||||||||||||||
| Portfolio Company (1) (20) | Business Description | Type of Investment (2) (3) (15) | Investment Date (22) | Shares/Units | Total Rate | Reference Rate and Spread (25) | PIK Rate (19) | Maturity Date | Principal (4) | Cost (4) | Fair Value (18) | |||||||||||||||||||||||||||||||||
| 5,813 | 7,813 | |||||||||||||||||||||||||||||||||||||||||||
| Joerns Healthcare, LLC | (11) | Manufacturer and Distributor of Health Care Equipment & Supplies | ||||||||||||||||||||||||||||||||||||||||||
| Secured Debt | (9) (14) | 11/15/2021 | 23.63% | SF+ | 18.00% | 23.63% | 1/31/2024 | 2,048 | 2,048 | 1,747 | ||||||||||||||||||||||||||||||||||
| Secured Debt | (9) (14) | 8/21/2019 | 21.63% | SF+ | 16.00% | 21.63% | 8/21/2024 | 1,708 | 1,701 | 121 | ||||||||||||||||||||||||||||||||||
| Secured Debt | (9) (14) | 8/21/2019 | 21.63% | SF+ | 16.00% | 21.63% | 8/21/2024 | 1,643 | 1,635 | 117 | ||||||||||||||||||||||||||||||||||
| Common Stock | 8/21/2019 | 392,514 | 3,678 | — | ||||||||||||||||||||||||||||||||||||||||
| 9,062 | 1,985 | |||||||||||||||||||||||||||||||||||||||||||
| Johnson Downie Opco, LLC | Executive Search Services | |||||||||||||||||||||||||||||||||||||||||||
| Secured Debt | (37) | 12/10/2021 | 12/10/2026 | — | (4) | — | ||||||||||||||||||||||||||||||||||||||
| Secured Debt | 12/10/2021 | 15.00% | 12/10/2026 | 2,690 | 2,645 | 2,690 | ||||||||||||||||||||||||||||||||||||||
| Preferred Equity | 12/10/2021 | 368 | 404 | 1,070 | ||||||||||||||||||||||||||||||||||||||||
| 3,045 | 3,760 | |||||||||||||||||||||||||||||||||||||||||||
| JorVet Holdings, LLC | Supplier and Distributor of Veterinary Equipment and Supplies | |||||||||||||||||||||||||||||||||||||||||||
| Secured Debt | 3/28/2022 | 12.00% | 3/28/2027 | 2,850 | 2,814 | 2,814 | ||||||||||||||||||||||||||||||||||||||
| Preferred Equity | (8) | 3/28/2022 | 11,934 | 1,193 | 1,193 | |||||||||||||||||||||||||||||||||||||||
| 4,007 | 4,007 | |||||||||||||||||||||||||||||||||||||||||||
| JTI Electrical & Mechanical, LLC | (10) | Electrical, Mechanical and Automation Services | ||||||||||||||||||||||||||||||||||||||||||
| Secured Debt | (9) (41) | 12/22/2021 | 11.64% | SF+ | 6.00% | 12/22/2026 | 261 | 253 | 261 | |||||||||||||||||||||||||||||||||||
| Secured Debt | (9) | 12/22/2021 | 11.61% | SF+ | 6.00% | 12/22/2026 | 3,000 | 2,963 | 3,000 | |||||||||||||||||||||||||||||||||||
| Common Equity | 12/22/2021 | 140,351 | 140 | 140 | ||||||||||||||||||||||||||||||||||||||||
| 3,356 | 3,401 | |||||||||||||||||||||||||||||||||||||||||||
| KMS, LLC | (10) | Wholesaler of Closeout and Value-priced Products | ||||||||||||||||||||||||||||||||||||||||||
| Secured Debt | (9) | 10/4/2021 | 14.75% | SF+ | 9.25% | 10/4/2026 | 1,292 | 1,235 | 1,180 | |||||||||||||||||||||||||||||||||||
| Secured Debt | (9) | 10/4/2021 | 14.75% | SF+ | 9.25% | 10/4/2026 | 9,310 | 9,205 | 8,475 | |||||||||||||||||||||||||||||||||||
| 10,440 | 9,655 | |||||||||||||||||||||||||||||||||||||||||||
| Lightbox Holdings, L.P. | (11) | Provider of Commercial Real Estate Software | ||||||||||||||||||||||||||||||||||||||||||
| Secured Debt | 5/9/2019 | 10.62% | SF+ | 5.00% | 5/9/2026 | 5,765 | 5,736 | 5,592 | ||||||||||||||||||||||||||||||||||||
| LL Management, Inc. | (10) | Medical Transportation Service Provider | ||||||||||||||||||||||||||||||||||||||||||
| Secured Debt | (9) | 5/2/2019 | 12.71% | SF+ | 7.25% | 9/25/2024 | 7,960 | 7,933 | 7,960 | |||||||||||||||||||||||||||||||||||
| Secured Debt | (9) | 5/2/2019 | 12.71% | SF+ | 7.25% | 9/25/2024 | 5,246 | 5,228 | 5,246 | |||||||||||||||||||||||||||||||||||
| Secured Debt | (9) | 11/20/2020 | 12.71% | SF+ | 7.25% | 9/25/2024 | — | — | — | |||||||||||||||||||||||||||||||||||
| Secured Debt | (9) | 2/26/2021 | 12.71% | SF+ | 7.25% | 9/25/2024 | 871 | 868 | 871 | |||||||||||||||||||||||||||||||||||
| Secured Debt | (9) | 5/12/2022 | 12.71% | SF+ | 7.25% | 9/25/2024 | 8,822 | 8,781 | 8,822 | |||||||||||||||||||||||||||||||||||
| 22,810 | 22,899 | |||||||||||||||||||||||||||||||||||||||||||
| LLFlex, LLC | (10) | Provider of Metal-Based Laminates | ||||||||||||||||||||||||||||||||||||||||||
| Secured Debt | (9) | 8/16/2021 | 15.54% | SF+ | 9.00% | 1.00% | 8/16/2026 | 4,920 | 4,861 | 4,417 | ||||||||||||||||||||||||||||||||||
| Logix Acquisition Company, LLC | (10) | Competitive Local Exchange Carrier | ||||||||||||||||||||||||||||||||||||||||||
| Secured Debt | (9) | 1/8/2018 | 13.25% | P+ | 4.75% | 12/22/2024 | 11,552 | 11,285 | 9,069 | |||||||||||||||||||||||||||||||||||
| Portfolio Company (1) (20) | Business Description | Type of Investment (2) (3) (15) | Investment Date (22) | Shares/Units | Total Rate | Reference Rate and Spread (25) | PIK Rate (19) | Maturity Date | Principal (4) | Cost (4) | Fair Value (18) | |||||||||||||||||||||||||||||||||
| Mako Steel, LP | (10) | Self-Storage Design & Construction | ||||||||||||||||||||||||||||||||||||||||||
| Secured Debt | (9) (37) | 3/15/2021 | SF+ | 6.75% | 3/15/2026 | — | (36) | — | ||||||||||||||||||||||||||||||||||||
| Secured Debt | (9) | 3/15/2021 | 12.28% | SF+ | 6.75% | 3/15/2026 | 16,721 | 16,568 | 16,721 | |||||||||||||||||||||||||||||||||||
| 16,532 | 16,721 | |||||||||||||||||||||||||||||||||||||||||||
| MB2 Dental Solutions, LLC | (11) | Dental Partnership Organization | ||||||||||||||||||||||||||||||||||||||||||
| Secured Debt | (9) | 1/28/2021 | 11.46% | SF+ | 6.00% | 1/29/2027 | 2,803 | 2,771 | 2,803 | |||||||||||||||||||||||||||||||||||
| Secured Debt | (9) | 1/28/2021 | 11.46% | SF+ | 6.00% | 1/29/2027 | 3,925 | 3,880 | 3,925 | |||||||||||||||||||||||||||||||||||
| Secured Debt | (9) | 1/28/2021 | 11.46% | SF+ | 6.00% | 1/29/2027 | 3,464 | 3,424 | 3,464 | |||||||||||||||||||||||||||||||||||
| Secured Debt | (9) | 1/28/2021 | 11.46% | SF+ | 6.00% | 1/29/2027 | 7,796 | 7,725 | 7,796 | |||||||||||||||||||||||||||||||||||
| 17,800 | 17,988 | |||||||||||||||||||||||||||||||||||||||||||
| Metalforming Holdings, LLC | Distributor of Sheet Metal Folding and Metal Forming Equipment | |||||||||||||||||||||||||||||||||||||||||||
| Secured Debt | (37) | 10/19/2022 | 10/19/2024 | — | — | — | ||||||||||||||||||||||||||||||||||||||
| Secured Debt | 10/19/2022 | 12.75% | 10/19/2027 | 1,748 | 1,707 | 1,707 | ||||||||||||||||||||||||||||||||||||||
| Preferred Equity | (8) | 10/19/2022 | 434,331 | 8.00% | 8.00% | 443 | 443 | |||||||||||||||||||||||||||||||||||||
| Common Stock | 10/19/2022 | 112,865 | 113 | 110 | ||||||||||||||||||||||||||||||||||||||||
| 2,263 | 2,260 | |||||||||||||||||||||||||||||||||||||||||||
| Microbe Formulas, LLC | (10) | Nutritional Supplements Provider | ||||||||||||||||||||||||||||||||||||||||||
| Secured Debt | (9) (37) | 4/4/2022 | SF+ | 6.25% | 4/3/2028 | — | (6) | (6) | ||||||||||||||||||||||||||||||||||||
| Secured Debt | (9) | 4/4/2022 | 11.46% | SF+ | 6.00% | 4/3/2028 | 2,671 | 2,632 | 2,671 | |||||||||||||||||||||||||||||||||||
| 2,626 | 2,665 | |||||||||||||||||||||||||||||||||||||||||||
| Mills Fleet Farm Group, LLC | (10) | Omnichannel Retailer of Work, Farm and Lifestyle Merchandise | ||||||||||||||||||||||||||||||||||||||||||
| Secured Debt | (9) | 10/24/2018 | 12.52% | SF+ | 7.00% | 12/31/2026 | 18,152 | 17,863 | 17,524 | |||||||||||||||||||||||||||||||||||
| Mini Melts of America, LLC | (10) | Manufacturer and Distributor of Branded Premium Beaded Ice Cream | ||||||||||||||||||||||||||||||||||||||||||
| Secured Debt | (9) (37) | 11/30/2023 | SF+ | 6.25% | 11/30/2028 | — | (28) | (28) | ||||||||||||||||||||||||||||||||||||
| Secured Debt | (9) (37) | 11/30/2023 | SF+ | 6.25% | 11/30/2028 | — | (10) | (10) | ||||||||||||||||||||||||||||||||||||
| Secured Debt | (9) | 11/30/2023 | 10.64% | SF+ | 5.25% | 11/30/2028 | 3,225 | 3,149 | 3,149 | |||||||||||||||||||||||||||||||||||
| Secured Debt | (9) | 11/30/2023 | 12.64% | SF+ | 7.25% | 11/30/2028 | 3,225 | 3,146 | 3,146 | |||||||||||||||||||||||||||||||||||
| Common Equity | 11/30/2023 | 300,000 | 300 | 300 | ||||||||||||||||||||||||||||||||||||||||
| 6,557 | 6,557 | |||||||||||||||||||||||||||||||||||||||||||
| MonitorUS Holding, LLC | (10) (13) (21) | SaaS Provider of Media Intelligence Services | ||||||||||||||||||||||||||||||||||||||||||
| Secured Debt | 5/24/2022 | 14.00% | 4.00% | 5/24/2027 | 1,120 | 1,106 | 1,133 | |||||||||||||||||||||||||||||||||||||
| Secured Debt | 5/24/2022 | 14.00% | 4.00% | 5/24/2027 | 2,912 | 2,870 | 3,184 | |||||||||||||||||||||||||||||||||||||
| Secured Debt | 5/24/2022 | 14.00% | 4.00% | 5/24/2027 | 4,957 | 4,890 | 4,957 | |||||||||||||||||||||||||||||||||||||
| Common Stock | 8/30/2022 | 12,798,820 | 256 | 197 | ||||||||||||||||||||||||||||||||||||||||
| 9,122 | 9,471 | |||||||||||||||||||||||||||||||||||||||||||
| NinjaTrader, LLC | (10) | Operator of Futures Trading Platform | ||||||||||||||||||||||||||||||||||||||||||
| Secured Debt | (9) (37) | 12/18/2019 | SF+ | 7.00% | 12/18/2026 | — | (4) | (3) | ||||||||||||||||||||||||||||||||||||
| Secured Debt | (9) (37) | 12/18/2019 | SF+ | 7.00% | 12/18/2026 | — | (12) | (12) | ||||||||||||||||||||||||||||||||||||
| Secured Debt | (9) | 12/18/2019 | 12.54% | SF+ | 7.00% | 12/18/2026 | 10,991 | 10,888 | 10,991 | |||||||||||||||||||||||||||||||||||
| Secured Debt | (9) | 12/18/2023 | 12.52% | SF+ | 7.00% | 12/18/2026 | 3,878 | 3,807 | 3,878 | |||||||||||||||||||||||||||||||||||
| 14,679 | 14,854 | |||||||||||||||||||||||||||||||||||||||||||
| Portfolio Company (1) (20) | Business Description | Type of Investment (2) (3) (15) | Investment Date (22) | Shares/Units | Total Rate | Reference Rate and Spread (25) | PIK Rate (19) | Maturity Date | Principal (4) | Cost (4) | Fair Value (18) | |||||||||||||||||||||||||||||||||
| Obra Capital, Inc. (f/k/a Vida Capital, Inc.) | (11) | Alternative Asset Manager | ||||||||||||||||||||||||||||||||||||||||||
| Secured Debt | 10/10/2019 | 11.47% | SF+ | 6.00% | 10/1/2026 | 7,043 | 6,711 | 6,039 | ||||||||||||||||||||||||||||||||||||
| Paragon Healthcare, Inc. | (10) | Infusion Therapy Treatment Provider | ||||||||||||||||||||||||||||||||||||||||||
| Secured Debt | (9) (37) | 1/19/2022 | SF+ | 5.75% | 1/19/2027 | — | (11) | — | ||||||||||||||||||||||||||||||||||||
| Secured Debt | (9) (43) | 1/19/2022 | 11.24% | SF+ | 5.75% | 1/19/2027 | 423 | 414 | 421 | |||||||||||||||||||||||||||||||||||
| Secured Debt | (9) | 1/19/2022 | 11.25% | SF+ | 5.75% | 1/19/2027 | 2,456 | 2,412 | 2,442 | |||||||||||||||||||||||||||||||||||
| 2,815 | 2,863 | |||||||||||||||||||||||||||||||||||||||||||
| Power System Solutions | (10) | Backup Power Generation | ||||||||||||||||||||||||||||||||||||||||||
| Secured Debt | (9) (37) | 6/7/2023 | SF+ | 6.75% | 6/7/2028 | — | (35) | (35) | ||||||||||||||||||||||||||||||||||||
| Secured Debt | (9) (37) | 6/7/2023 | SF+ | 6.75% | 6/7/2028 | — | (35) | (35) | ||||||||||||||||||||||||||||||||||||
| Secured Debt | (9) | 6/7/2023 | 12.12% | SF+ | 6.75% | 6/7/2028 | 7,939 | 7,729 | 7,939 | |||||||||||||||||||||||||||||||||||
| Common Equity | 6/7/2023 | 532 | 532 | 500 | ||||||||||||||||||||||||||||||||||||||||
| 8,191 | 8,369 | |||||||||||||||||||||||||||||||||||||||||||
| PrimeFlight Aviation Services | (10) | Air Freight & Logistics | ||||||||||||||||||||||||||||||||||||||||||
| Secured Debt | (9) | 5/1/2023 | 12.28% | SF+ | 6.85% | 5/1/2029 | 5,970 | 5,813 | 5,970 | |||||||||||||||||||||||||||||||||||
| Secured Debt | (9) | 9/7/2023 | 12.20% | SF+ | 6.85% | 5/1/2029 | 570 | 553 | 570 | |||||||||||||||||||||||||||||||||||
| 6,366 | 6,540 | |||||||||||||||||||||||||||||||||||||||||||
| PTL US Bidco, Inc | (10) (13) (21) | Manufacturers of Equipment, Including Drilling Rigs and Equipment, and Providers of Supplies and Services to Companies Involved In the Drilling, Evaluation and Completion of Oil and Gas Wells | ||||||||||||||||||||||||||||||||||||||||||
| Secured Debt | (9) (45) | 8/19/2022 | 12.80% | SF+ | 7.25% | 8/19/2027 | 198 | 189 | 196 | |||||||||||||||||||||||||||||||||||
| Secured Debt | (9) | 8/19/2022 | 12.88% | SF+ | 7.25% | 8/19/2027 | 1,734 | 1,707 | 1,720 | |||||||||||||||||||||||||||||||||||
| 1,896 | 1,916 | |||||||||||||||||||||||||||||||||||||||||||
| Purge Rite, LLC | (10) | HVAC Flushing and Filtration Services | ||||||||||||||||||||||||||||||||||||||||||
| Secured Debt | (9) (37) | 10/2/2023 | SF+ | 8.00% | 10/2/2028 | — | (19) | (19) | ||||||||||||||||||||||||||||||||||||
| Secured Debt | (9) | 10/2/2023 | 13.70% | SF+ | 8.00% | 10/2/2028 | 3,906 | 3,813 | 3,813 | |||||||||||||||||||||||||||||||||||
| Preferred Equity | 10/2/2023 | 1,302,083 | 1,302 | 1,302 | ||||||||||||||||||||||||||||||||||||||||
| 5,096 | 5,096 | |||||||||||||||||||||||||||||||||||||||||||
| RA Outdoors LLC | (10) | Software Solutions Provider for Outdoor Activity Management | ||||||||||||||||||||||||||||||||||||||||||
| Secured Debt | (9) (32) | 4/8/2021 | 12.22% | SF+ | 6.75% | 4/8/2026 | 796 | 789 | 745 | |||||||||||||||||||||||||||||||||||
| Secured Debt | (9) | 4/8/2021 | 12.21% | SF+ | 6.75% | 4/8/2026 | 12,917 | 12,829 | 12,089 | |||||||||||||||||||||||||||||||||||
| 13,618 | 12,834 | |||||||||||||||||||||||||||||||||||||||||||
| Research Now Group, Inc. and Survey Sampling International, LLC | (11) | Provider of Outsourced Online Surveying | ||||||||||||||||||||||||||||||||||||||||||
| Secured Debt | (9) | 12/29/2017 | 11.14% | SF+ | 5.50% | 12/20/2024 | 9,691 | 9,691 | 7,237 | |||||||||||||||||||||||||||||||||||
| Richardson Sales Solutions | (10) | Business Services | ||||||||||||||||||||||||||||||||||||||||||
| Secured Debt | (9) (34) | 8/24/2023 | 18.47% | SF+ | 6.50% | 8/24/2028 | 833 | 781 | 818 | |||||||||||||||||||||||||||||||||||
| Secured Debt | (9) | 8/24/2023 | 11.88% | SF+ | 6.50% | 8/24/2028 | 10,553 | 10,261 | 10,362 | |||||||||||||||||||||||||||||||||||
| 11,042 | 11,180 | |||||||||||||||||||||||||||||||||||||||||||
| Roof Opco, LLC | (10) | Residential Re-Roofing/Repair | ||||||||||||||||||||||||||||||||||||||||||
| Secured Debt | (9) (37) | 8/27/2021 | SF+ | 6.50% | 8/27/2026 | — | (10) | — | ||||||||||||||||||||||||||||||||||||
| Secured Debt | (9) | 8/27/2021 | 12.16% | SF+ | 6.50% | 8/27/2026 | 4,219 | 4,150 | 4,142 | |||||||||||||||||||||||||||||||||||
| Portfolio Company (1) (20) | Business Description | Type of Investment (2) (3) (15) | Investment Date (22) | Shares/Units | Total Rate | Reference Rate and Spread (25) | PIK Rate (19) | Maturity Date | Principal (4) | Cost (4) | Fair Value (18) | |||||||||||||||||||||||||||||||||
| Secured Debt | (9) | 8/27/2021 | 14.16% | SF+ | 8.50% | 8/27/2026 | 4,219 | 4,150 | 4,082 | |||||||||||||||||||||||||||||||||||
| 8,290 | 8,224 | |||||||||||||||||||||||||||||||||||||||||||
| Rug Doctor, LLC. | (10) | Carpet Cleaning Products and Machinery | ||||||||||||||||||||||||||||||||||||||||||
| Secured Debt | (9) | 7/16/2021 | 13.54% | SF+ | 6.00% | 2.00% | 11/16/2025 | 6,410 | 6,389 | 6,383 | ||||||||||||||||||||||||||||||||||
| Secured Debt | (9) | 7/16/2021 | 13.54% | SF+ | 6.00% | 2.00% | 11/16/2025 | 9,022 | 8,991 | 8,984 | ||||||||||||||||||||||||||||||||||
| 15,380 | 15,367 | |||||||||||||||||||||||||||||||||||||||||||
| Slick Innovations, LLC | Text Message Marketing Platform | |||||||||||||||||||||||||||||||||||||||||||
| Secured Debt | 9/13/2018 | 14.00% | 12/22/2027 | 2,860 | 2,777 | 2,860 | ||||||||||||||||||||||||||||||||||||||
| Common Stock | 9/13/2018 | 17,500 | 114 | 600 | ||||||||||||||||||||||||||||||||||||||||
| 2,891 | 3,460 | |||||||||||||||||||||||||||||||||||||||||||
| South Coast Terminals Holdings, LLC | (10) | Specialty Toll Chemical Manufacturer | ||||||||||||||||||||||||||||||||||||||||||
| Secured Debt | (9) | 12/10/2021 | 11.46% | SF+ | 6.00% | 12/13/2026 | 38 | 34 | 34 | |||||||||||||||||||||||||||||||||||
| Secured Debt | (9) | 12/10/2021 | 11.70% | SF+ | 6.00% | 12/13/2026 | 2,979 | 2,943 | 2,979 | |||||||||||||||||||||||||||||||||||
| Common Equity | 12/10/2021 | 60,606 | 61 | 59 | ||||||||||||||||||||||||||||||||||||||||
| 3,038 | 3,072 | |||||||||||||||||||||||||||||||||||||||||||
| SPAU Holdings, LLC | (10) | Digital Photo Product Provider | ||||||||||||||||||||||||||||||||||||||||||
| Secured Debt | (9) (37) | 7/1/2022 | SF+ | 8.00% | 7/1/2027 | — | (14) | — | ||||||||||||||||||||||||||||||||||||
| Secured Debt | (9) | 7/1/2022 | 13.72% | SF+ | 8.00% | 7/1/2027 | 4,925 | 4,857 | 4,925 | |||||||||||||||||||||||||||||||||||
| Common Stock | 7/1/2022 | 200,000 | 200 | 160 | ||||||||||||||||||||||||||||||||||||||||
| 5,043 | 5,085 | |||||||||||||||||||||||||||||||||||||||||||
| Tex Tech Tennis, LLC | (10) | Sporting Goods & Textiles | ||||||||||||||||||||||||||||||||||||||||||
| Preferred Equity | (23) | 7/7/2021 | 1,000,000 | 1,000 | 2,840 | |||||||||||||||||||||||||||||||||||||||
| The Affiliati Network, LLC | Performance Marketing Solutions | |||||||||||||||||||||||||||||||||||||||||||
| Secured Debt | 8/9/2021 | 13.00% | 8/9/2026 | 40 | 37 | 37 | ||||||||||||||||||||||||||||||||||||||
| Secured Debt | 8/9/2021 | 13.00% | 8/9/2026 | 1,880 | 1,858 | 1,841 | ||||||||||||||||||||||||||||||||||||||
| Preferred Stock | 9/1/2023 | 43,027 | 43 | 43 | ||||||||||||||||||||||||||||||||||||||||
| Preferred Stock | (8) | 8/9/2021 | 320,000 | 1,600 | 1,600 | |||||||||||||||||||||||||||||||||||||||
| 3,538 | 3,521 | |||||||||||||||||||||||||||||||||||||||||||
| U.S. TelePacific Corp. | (11) | Provider of Communications and Managed Services | ||||||||||||||||||||||||||||||||||||||||||
| Secured Debt | (9) (14) | 6/1/2023 | 12.53% | SF+ | 7.15% | 6.00% | 5/2/2027 | 6,802 | 2,623 | 2,438 | ||||||||||||||||||||||||||||||||||
| Secured Debt | (14) | 6/1/2023 | 5/2/2027 | 692 | 15 | — | ||||||||||||||||||||||||||||||||||||||
| 2,638 | 2,438 | |||||||||||||||||||||||||||||||||||||||||||
| USA DeBusk LLC | (10) | Provider of Industrial Cleaning Services | ||||||||||||||||||||||||||||||||||||||||||
| Secured Debt | (9) | 10/22/2019 | 11.46% | SF+ | 6.00% | 9/8/2026 | 12,405 | 12,308 | 12,405 | |||||||||||||||||||||||||||||||||||
| Secured Debt | (9) | 7/19/2023 | 11.96% | SF+ | 6.50% | 9/8/2026 | 4,825 | 4,742 | 4,825 | |||||||||||||||||||||||||||||||||||
| Secured Debt | (9) | 11/21/2023 | 11.96% | SF+ | 6.50% | 9/8/2026 | 2,515 | 2,468 | 2,515 | |||||||||||||||||||||||||||||||||||
| 19,518 | 19,745 | |||||||||||||||||||||||||||||||||||||||||||
| UserZoom Technologies, Inc. | (10) | Provider of User Experience Research Automation Software | ||||||||||||||||||||||||||||||||||||||||||
| Secured Debt | (9) | 1/11/2023 | 12.99% | SF+ | 7.50% | 4/5/2029 | 3,000 | 2,923 | 3,000 | |||||||||||||||||||||||||||||||||||
| Vistar Media, Inc. | (10) | Operator of Digital Out-of-Home Advertising Platform | ||||||||||||||||||||||||||||||||||||||||||
| Preferred Stock | 4/3/2019 | 70,207 | 767 | 2,180 | ||||||||||||||||||||||||||||||||||||||||
| Portfolio Company (1) (20) | Business Description | Type of Investment (2) (3) (15) | Investment Date (22) | Shares/Units | Total Rate | Reference Rate and Spread (25) | PIK Rate (19) | Maturity Date | Principal (4) | Cost (4) | Fair Value (18) | |||||||||||||||||||||||||||||||||
| Vitesse Systems | (10) | Component Manufacturing and Machining Platform | ||||||||||||||||||||||||||||||||||||||||||
| Secured Debt | (9) | 12/22/2023 | 12.63% | SF+ | 7.00% | 12/22/2028 | 12,500 | 12,193 | 12,193 | |||||||||||||||||||||||||||||||||||
| VORTEQ Coil Finishers, LLC | (10) | Specialty Coating of Aluminum and Light-Gauge Steel | ||||||||||||||||||||||||||||||||||||||||||
| Common Equity | (8) | 11/30/2021 | 769,231 | 769 | 1,911 | |||||||||||||||||||||||||||||||||||||||
| Wall Street Prep, Inc. | (10) | Financial Training Services | ||||||||||||||||||||||||||||||||||||||||||
| Secured Debt | (9) (37) | 7/19/2021 | SF+ | 7.00% | 7/19/2026 | — | (5) | (5) | ||||||||||||||||||||||||||||||||||||
| Secured Debt | (9) | 7/19/2021 | 12.54% | SF+ | 7.00% | 7/19/2026 | 4,654 | 4,600 | 4,654 | |||||||||||||||||||||||||||||||||||
| Common Stock | 7/19/2021 | 500,000 | 500 | 910 | ||||||||||||||||||||||||||||||||||||||||
| 5,095 | 5,559 | |||||||||||||||||||||||||||||||||||||||||||
| Watterson Brands, LLC | (10) | Facility Management Services | ||||||||||||||||||||||||||||||||||||||||||
| Secured Debt | (9) (41) | 12/17/2021 | 11.50% | SF+ | 6.00% | 12/17/2026 | 253 | 249 | 253 | |||||||||||||||||||||||||||||||||||
| Secured Debt | (9) | 12/17/2021 | 11.50% | SF+ | 6.00% | 12/17/2026 | 53 | 47 | 53 | |||||||||||||||||||||||||||||||||||
| Secured Debt | (9) | 12/17/2021 | 11.50% | SF+ | 6.00% | 12/17/2026 | 2,166 | 2,146 | 2,166 | |||||||||||||||||||||||||||||||||||
| Secured Debt | (9) | 12/17/2021 | 11.50% | SF+ | 6.00% | 12/17/2026 | 1,955 | 1,936 | 1,955 | |||||||||||||||||||||||||||||||||||
| 4,378 | 4,427 | |||||||||||||||||||||||||||||||||||||||||||
| West Star Aviation Acquisition, LLC | (10) | Aircraft, Aircraft Engine and Engine Parts | ||||||||||||||||||||||||||||||||||||||||||
| Secured Debt | (9) (42) | 3/1/2022 | 11.34% | SF+ | 6.00% | 3/1/2028 | 665 | 654 | 665 | |||||||||||||||||||||||||||||||||||
| Secured Debt | (9) | 3/1/2022 | 11.35% | SF+ | 6.00% | 3/1/2028 | 2,948 | 2,907 | 2,947 | |||||||||||||||||||||||||||||||||||
| Secured Debt | (9) | 11/3/2023 | 11.35% | SF+ | 6.00% | 3/1/2028 | 1,467 | 1,438 | 1,467 | |||||||||||||||||||||||||||||||||||
| Common Stock | 3/1/2022 | 200,000 | 200 | 390 | ||||||||||||||||||||||||||||||||||||||||
| 5,199 | 5,469 | |||||||||||||||||||||||||||||||||||||||||||
| Winter Services LLC | (10) | Provider of Snow Removal and Ice Management Services | ||||||||||||||||||||||||||||||||||||||||||
| Secured Debt | (9) (35) | 11/19/2021 | 12.64% | SF+ | 7.00% | 11/19/2026 | 2,778 | 2,745 | 2,778 | |||||||||||||||||||||||||||||||||||
| Secured Debt | (9) | 11/19/2021 | 12.66% | SF+ | 7.00% | 11/19/2026 | 2,583 | 2,528 | 2,583 | |||||||||||||||||||||||||||||||||||
| Secured Debt | (9) | 11/19/2021 | 12.66% | SF+ | 7.00% | 11/19/2026 | 11,625 | 11,479 | 11,625 | |||||||||||||||||||||||||||||||||||
| 16,752 | 16,986 | |||||||||||||||||||||||||||||||||||||||||||
| World Micro Holdings, LLC | Supply Chain Management | |||||||||||||||||||||||||||||||||||||||||||
| Secured Debt | 12/12/2022 | 13.00% | 12/12/2027 | 1,627 | 1,601 | 1,601 | ||||||||||||||||||||||||||||||||||||||
| Preferred Equity | (8) | 12/12/2022 | 530 | 530 | 530 | |||||||||||||||||||||||||||||||||||||||
| 2,131 | 2,131 | |||||||||||||||||||||||||||||||||||||||||||
| Xenon Arc, Inc. | (10) | Tech-enabled Distribution Services to Chemicals and Food Ingredients Primary Producers | ||||||||||||||||||||||||||||||||||||||||||
| Secured Debt | (9) (37) | 12/17/2021 | SF+ | 5.25% | 12/17/2026 | — | (5) | — | ||||||||||||||||||||||||||||||||||||
| Secured Debt | (9) | 12/17/2021 | 11.22% | SF+ | 5.75% | 12/17/2027 | 1,188 | 1,163 | 1,188 | |||||||||||||||||||||||||||||||||||
| Secured Debt | (9) | 12/17/2021 | 11.25% | SF+ | 5.75% | 12/17/2027 | 2,352 | 2,321 | 2,352 | |||||||||||||||||||||||||||||||||||
| 3,479 | 3,540 | |||||||||||||||||||||||||||||||||||||||||||
| YS Garments, LLC | (11) | Designer and Provider of Branded Activewear | ||||||||||||||||||||||||||||||||||||||||||
| Secured Debt | (9) | 8/22/2018 | 13.00% | SF+ | 7.50% | 8/9/2026 | 5,584 | 5,485 | 5,110 | |||||||||||||||||||||||||||||||||||
| Portfolio Company (1) (20) | Business Description | Type of Investment (2) (3) (15) | Investment Date (22) | Shares/Units | Total Rate | Reference Rate and Spread (25) | PIK Rate (19) | Maturity Date | Principal (4) | Cost (4) | Fair Value (18) | |||||||||||||||||||||||||||||||||
| Zips Car Wash, LLC | (10) | Express Car Wash Operator | ||||||||||||||||||||||||||||||||||||||||||
| Secured Debt | (9) (33) | 2/11/2022 | 12.71% | SF+ | 7.25% | 3/1/2024 | 2,356 | 2,352 | 2,234 | |||||||||||||||||||||||||||||||||||
| Secured Debt | (9) (33) | 2/11/2022 | 12.71% | SF+ | 7.25% | 3/1/2024 | 591 | 589 | 555 | |||||||||||||||||||||||||||||||||||
| 2,941 | 2,789 | |||||||||||||||||||||||||||||||||||||||||||
| Subtotal Non-Control/Non-Affiliate Investments (120.2% of net assets at fair value) | $ | 763,781 | $ | 747,972 | ||||||||||||||||||||||||||||||||||||||||
| Total Portfolio Investments, December 31, 2023 (175.6% of net assets at fair value) | $ | 1,038,318 | $ | 1,092,895 | ||||||||||||||||||||||||||||||||||||||||
| Money market funds (included in cash and cash equivalents) (16) | ||||||||||||||||||||||||||||||||||||||||||||
| Fidelity Government Portfolio Class III Fund (38) | $ | 3,188 | $ | 3,188 | ||||||||||||||||||||||||||||||||||||||||
| First American Treasury Obligations Fund Class Z (39) | 17,656 | 17,656 | ||||||||||||||||||||||||||||||||||||||||||
| Total money market funds | $ | 20,844 | $ | 20,844 | ||||||||||||||||||||||||||||||||||||||||
| Twelve Months Ended December 31, 2017 | Twelve Months Ended December 31, 2017 | ||||||||||||||||||||||||||||||||
| Affiliate Investments | Fair Value at December 31, 2016 | Gross Additions (Cost)* | Gross Reductions (Cost)** | Net Unrealized Gain (Loss) | Fair Value at December 31, 2017 | Net Realized Gain (Loss) | Interest Income | Fee Income | Dividend Income | ||||||||||||||||||||||||
| AFG Capital Group, LLC | |||||||||||||||||||||||||||||||||
| Member units | $ | 687 | $ | — | $ | — | $ | 210 | $ | 897 | $ | — | $ | — | $ | — | $ | 18 | |||||||||||||||
| Warrants | 167 | — | — | 48 | 215 | — | — | — | — | ||||||||||||||||||||||||
| Charps, LLC | |||||||||||||||||||||||||||||||||
| Term loan | — | 4,817 | (320 | ) | 3 | 4,500 | — | 533 | 1 | — | |||||||||||||||||||||||
| Preferred member units | — | 101 | — | 62 | 163 | — | — | — | — | ||||||||||||||||||||||||
| Clad-Rex Steel, LLC | |||||||||||||||||||||||||||||||||
| Term loan | $ | 3,449 | $ | 16 | $ | (201 | ) | $ | 56 | $ | 3,320 | $ | — | $ | 392 | $ | — | $ | — | ||||||||||||||
| Term loan | 99 | — | (99 | ) | — | — | — | — | — | — | |||||||||||||||||||||||
| Member units | 1,820 | — | — | 555 | 2,375 | — | — | — | 103 | ||||||||||||||||||||||||
| Term loan (Clad-Rex Steel RE Investor, LLC) | 298 | — | (5 | ) | — | 293 | — | 30 | — | — | |||||||||||||||||||||||
| Member units (Clad-Rex Steel RE Investor, LLC) | 53 | — | — | 17 | 70 | — | — | — | — | ||||||||||||||||||||||||
| EIG Traverse Co-Investment, LP | |||||||||||||||||||||||||||||||||
| LP interests | 9,905 | 951 | (10,756 | ) | (100 | ) | — | 951 | — | — | 871 | ||||||||||||||||||||||
| Freeport First Lien Loan Fund III, LP | |||||||||||||||||||||||||||||||||
| LP interests | 4,763 | 3,795 | — | (52 | ) | 8,506 | — | — | — | 617 | |||||||||||||||||||||||
| Gamber-Johnson Holdings, LLC | |||||||||||||||||||||||||||||||||
| Term loan | 5,964 | 19 | (170 | ) | 37 | 5,850 | — | 755 | — | — | |||||||||||||||||||||||
| Common stock | 4,730 | — | — | 1,113 | 5,843 | — | — | 54 | 105 | ||||||||||||||||||||||||
| Guerdon Modular Holdings, Inc. | |||||||||||||||||||||||||||||||||
| Term loan | 2,642 | 22 | (1 | ) | (3 | ) | 2,660 | — | 366 | — | — | ||||||||||||||||||||||
| Common stock | 20 | — | — | (20 | ) | — | — | — | — | — | |||||||||||||||||||||||
| Class B preferred units | 285 | — | — | (285 | ) | — | — | — | — | — | |||||||||||||||||||||||
| Gulf Publishing Holdings, LLC | |||||||||||||||||||||||||||||||||
| Term loan | 2,455 | 710 | (14 | ) | — | 3,151 | — | 387 | 1 | — | |||||||||||||||||||||||
| Term loan | — | 20 | — | — | 20 | — | — | — | — | ||||||||||||||||||||||||
| Member units | 781 | 142 | — | 287 | 1,210 | — | — | 10 | — | ||||||||||||||||||||||||
| Harris Preston Fund Investments | |||||||||||||||||||||||||||||||||
| LP interests (HPEP 3, LP) | — | 943 | — | — | 943 | — | — | — | — | ||||||||||||||||||||||||
| LP interests (2717 HM, LP) | — | 536 | — | — | 536 | — | — | — | — | ||||||||||||||||||||||||
| Hawk Ridge Systems, LLC | |||||||||||||||||||||||||||||||||
| Term loan | 2,451 | 1,212 | (149 | ) | 60 | 3,574 | — | 301 | — | — | |||||||||||||||||||||||
| Preferred member units | 713 | — | — | 237 | 950 | — | — | — | 65 | ||||||||||||||||||||||||
| Preferred member units (HRS Services, ULC) | 38 | — | — | 12 | 50 | — | — | — | 1 | ||||||||||||||||||||||||
| HWT, LLC | |||||||||||||||||||||||||||||||||
| Term loan | 2,591 | 13 | (150 | ) | — | 2,454 | — | 370 | — | — | |||||||||||||||||||||||
| Member units | 985 | — | — | — | 985 | — | — | 35 | — | ||||||||||||||||||||||||
| Market Force Information, Inc. | |||||||||||||||||||||||||||||||||
| Term loan | — | 6,018 | (286 | ) | — | 5,732 | — | 324 | — | — | |||||||||||||||||||||||
| Member units | — | 3,675 | — | — | 3,675 | — | — | — | — | ||||||||||||||||||||||||
| M.H. Corbin, LLC | |||||||||||||||||||||||||||||||||
| Term loan | 3,299 | 8 | (177 | ) | — | 3,130 | — | 382 | — | — | |||||||||||||||||||||||
| Member units | 1,500 | — | — | — | 1,500 | — | — | 35 | — | ||||||||||||||||||||||||
| Mystic Logistics, Inc. | |||||||||||||||||||||||||||||||||
| Term loan | 2,294 | 21 | (352 | ) | (47 | ) | 1,916 | — | 272 | 2 | — | ||||||||||||||||||||||
| Common stock | 1,445 | — | — | 260 | 1,705 | — | — | — | — | ||||||||||||||||||||||||
| NuStep, LLC | |||||||||||||||||||||||||||||||||
| Term loan | — | 5,179 | (131 | ) | — | 5,048 | — | 603 | — | — | |||||||||||||||||||||||
| Preferred member units | — | 2,550 | — | — | 2,550 | — | — | — | — | ||||||||||||||||||||||||
| SoftTouch Medical Holdings, LLC | |||||||||||||||||||||||||||||||||
| Term loan | 1,260 | 5 | — | (5 | ) | 1,260 | — | 135 | — | 124 | |||||||||||||||||||||||
| Member units | 1,618 | — | — | 163 | 1,781 | — | — | 42 | — | ||||||||||||||||||||||||
| $ | 56,312 | $ | 30,753 | $ | (12,811 | ) | $ | 2,608 | $ | 76,862 | $ | 951 | $ | 4,850 | $ | 180 | $ | 1,904 | |||||||||||||||
| Twelve Months Ended December 31, 2017 | Twelve Months Ended December 31, 2017 | ||||||||||||||||||||||||||||||||
| Controlled Investments | Fair Value at December 31, 2016 | Gross Additions (Cost)** | Gross Reductions (Cost)*** | Net Unrealized Gain (Loss) | Fair Value at December 31, 2017 | Net Realized Gain (Loss) | Interest Income | Fee Income | Dividend Income | ||||||||||||||||||||||||
| Copper Trail Energy Fund I, LP | |||||||||||||||||||||||||||||||||
| LP interests | $ | — | $ | 2,500 | $ | — | $ | — | $ | 2,500 | $ | — | $ | — | $ | — | $ | — | |||||||||||||||
| GRT Rubber Technologies, LLC | |||||||||||||||||||||||||||||||||
| Term loan | 6,538 | 32 | (824 | ) | (31 | ) | 5,715 | — | 663 | — | — | ||||||||||||||||||||||
| Member units | 10,004 | — | — | 817 | 10,821 | — | — | 73 | 577 | ||||||||||||||||||||||||
HMS-ORIX SLF LLC* | |||||||||||||||||||||||||||||||||
| Membership interests | — | 30,000 | — | 643 | 30,643 | — | — | — | 450 | ||||||||||||||||||||||||
| $ | 16,542 | $ | 32,532 | $ | (824 | ) | $ | 1,429 | $ | 49,679 | $ | — | $ | 663 | $ | 73 | $ | 1,027 | |||||||||||||||
HMS Income Fund, Inc. Consolidated Schedule of Investments | ||||||||||||
| As of December 31, 2016 | ||||||||||||
| (dollars in thousands) | ||||||||||||
| Portfolio Company (1) (3) | Business Description | Type of Investment (2) (3) | Index Rate (22) | Principal (7) | Cost (7) | Fair Value | ||||||
| Control Investments (6) | ||||||||||||
| GRT Rubber Technologies, LLC (8) (10) (13) | Engineered Rubber Product Manufacturer | LIBOR Plus 9.00% (Floor 1.00%), Current Coupon 10.00%, Secured Debt (Maturity - December 19, 2019) | 1 month LIBOR | $ | 6,538 | $ | 6,448 | $ | 6,538 | |||
| Member Units (2,896 shares) | — | — | 6,435 | 10,004 | ||||||||
| 12,883 | 16,542 | |||||||||||
| Subtotal Control Investments (6) (2% of total investments at fair value) | $ | 12,883 | $ | 16,542 | ||||||||
| Affiliate Investments (4) | ||||||||||||
| AFG Capital Group, LLC (10) (13) | Provider of Rent-to-Own Financing Solutions and Services | Member Units (46 shares) | — | — | $ | 300 | $ | 687 | ||||
| Warrants (10 equivalent shares, Expiration - November 7, 2024) | — | — | 65 | 167 | ||||||||
| 365 | 854 | |||||||||||
| Clad-Rex Steel, LLC (10) (13) | Specialty Manufacturer of Vinyl-Clad Metal | LIBOR Plus 9.50% (Floor 1.00%), Current Coupon 10.50%, Secured Debt (Maturity - December 20, 2021) (8) | 1 month LIBOR | 3,520 | 3,449 | 3,449 | ||||||
| LIBOR Plus 9.50% (Floor 1.00%), Current Coupon 10.50%, Secured Debt (Maturity - December 20, 2018) (8) | 1 month LIBOR | 100 | 99 | 99 | ||||||||
| Member Units (179 units) | — | — | 1,820 | 1,820 | ||||||||
| 10.00% Secured Debt (Clad-Rex Steel RE Investor, LLC) (Maturity - December 20, 2036) | None | 301 | 298 | 298 | ||||||||
| Member Units (Clad-Rex Steel RE Investor, LLC) (200 units) | — | — | 53 | 53 | ||||||||
| 5,719 | 5,719 | |||||||||||
| EIG Traverse Co-Investment, LP (9) (15) | Investment Partnership | LP Interests (EIG Traverse Co-Investment, LP) (Fully diluted 22.20%) (16) | — | — | 9,805 | 9,905 | ||||||
| Freeport First Lien Loan Fund III, LP (9) (15) | Investment Partnership | LP Interests (Freeport First Lien Loan Fund III, LP) (Fully diluted 5.60%) (16) | — | — | 4,763 | 4,763 | ||||||
| Gamber-Johnson Holdings, LLC (8) (10) (13) | Manufacturer of Ruggedized Computer Mounting Systems | LIBOR Plus 11.00% (Floor 1.00%), Current Coupon 12.00%, Secured Debt (Maturity - June 24, 2021) | 1 month LIBOR | 6,020 | 5,902 | 5,964 | ||||||
| Member Units (2,155 units) | — | 3,711 | 4,730 | |||||||||
| 9,613 | 10,694 | |||||||||||
| Guerdon Modular Holdings, Inc. (10) (13) | Multi-Family and Commercial Modular Construction Company | 9.00% Current / 4.00% PIK Secured Debt (Maturity - August 13, 2019) | None | 2,668 | 2,621 | 2,642 | ||||||
| Common Stock (53,008 shares) | — | — | 746 | 20 | ||||||||
| Class B Preferred Stock (101,250 shares) | — | — | 285 | 285 | ||||||||
| 3,652 | 2,947 | |||||||||||
| Gulf Publishing Holdings, LLC (10) (13) | Energy Focused Media and Publishing | 12.50% Secured Debt (Maturity - April 29, 2021) | None | 2,500 | 2,455 | 2,455 | ||||||
| Member Units (781 shares) | — | 781 | 781 | |||||||||
| 3,236 | 3,236 | |||||||||||
| Hawk Ridge Systems, LLC (9) (10) (13) | Value-Added Reseller of Engineering Design and Manufacturing Solutions | 10.00% Secured Debt (Maturity - December 2, 2021) | None | 2,500 | 2,451 | 2,451 | ||||||
| Preferred Member Units (56 units) | — | — | 713 | 713 | ||||||||
| Preferred Member Units (HRS Services, ULC) (56 units) | — | — | 38 | 38 | ||||||||
| 3,202 | 3,202 | |||||||||||
| HW Temps LLC (8) (10) (13) | Temporary Staffing Solutions | LIBOR Plus 13.00% (Floor 1.00%), Current Coupon 14.00%, Secured Debt (Maturity - July 2, 2020) | 1 month LIBOR | 2,644 | 2,591 | 2,591 | ||||||
| Preferred Member Units (800 shares) (16) | — | — | 986 | 985 | ||||||||
| 3,577 | 3,576 | |||||||||||
| M.H. Corbin Holding, LLC (10) (13) | Manufacturer and Distributor of Traffic Safety Products | 10.00% Secured Debt (Maturity - August 31, 2021) | None | 3,325 | 3,299 | 3,299 | ||||||
| Preferred Member Units (1,000 shares) | — | 1,500 | 1,500 | |||||||||
| 4,799 | 4,799 | |||||||||||
| Mystic Logistics, Inc. (10) (13) | Logistics and Distribution Services Provider for Large Volume Mailers | 12.00% Secured Debt (Maturity - August 15, 2019) | None | $ | 2,294 | $ | 2,246 | $ | 2,294 | |||
| Common Stock (1,468 shares) (16) | — | — | 680 | 1,445 | ||||||||
| 2,926 | 3,739 | |||||||||||
| SoftTouch Medical Holdings LLC (8) (10) (13) | Home Provider of Pediatric Durable Medical Equipment | LIBOR Plus 9.00% (Floor 1.00%), Current Coupon 10.00%, Secured Debt (Maturity - October 31, 2019) | 1 month LIBOR | 1,260 | 1,244 | 1,260 | ||||||
| Member Units (785 units) (16) | — | — | 870 | 1,618 | ||||||||
| 2,114 | 2,878 | |||||||||||
| Subtotal Affiliate Investments (4) (6% of total investments at fair value) | $ | 53,771 | $ | 56,312 | ||||||||
| Non-Control/Non-Affiliate Investments (5) | ||||||||||||
| Adams Publishing Group, LLC (8) (11) | Local Newspaper Operator | LIBOR Plus 7.00% (Floor 1.00%), Current Coupon 8.00%, Secured Debt (Maturity - November 3, 2020) | 3 month LIBOR | $ | 7,589 | $ | 7,459 | $ | 7,589 | |||
| ADS Tactical, Inc. (8) (11) | Value-Added Logistics and Supply Chain Solutions Provider | LIBOR Plus 7.50% (Floor 1.00%), Current Coupon 8.50%, Secured Debt (Maturity - December 31, 2022) | 3 month LIBOR | 10,000 | 9,750 | 9,750 | ||||||
| Ahead, LLC (8) (11) | IT Infrastructure Value Added Reseller | LIBOR Plus 6.50%, Current Coupon 7.50%, Secured Debt (Maturity - November 2, 2020) | 3 month LIBOR | 9,500 | 9,267 | 9,536 | ||||||
| Allflex Holdings III Inc. (8) | Manufacturer of Livestock Identification Products | LIBOR Plus 7.00% (Floor 1.00%), Current Coupon 8.00%, Secured Debt (Maturity - July 19, 2021) (14) | 6 month LIBOR | 14,922 | 15,012 | 14,936 | ||||||
| American Scaffold Holdings, Inc. (8) (11) | Marine Scaffolding Service Provider | LIBOR Plus 6.50% (Floor 1.00%), Current Coupon 7.50%, Secured Debt (Maturity - March 31, 2022) | 1 month LIBOR | 7,359 | 7,257 | 7,323 | ||||||
| American Teleconferencing Services, Ltd. (8) | Provider of Audio Conferencing and Video Collaboration Solutions | LIBOR Plus 6.50% (Floor 1.00%), Current Coupon 7.50%, Secured Debt (Maturity - December 8, 2021) | 3 month LIBOR | 10,056 | 9,122 | 9,848 | ||||||
| LIBOR Plus 9.50% (Floor 1.00%), Current Coupon 10.50%, Secured Debt (Maturity - June 6, 2022) (14) | 3 month LIBOR | 5,571 | 5,353 | 5,353 | ||||||||
| 14,475 | 15,201 | |||||||||||
| AmeriTech College Operations, LLC (10) (13) | For-Profit Nursing and Healthcare College | 13.00% Secured Debt (Maturity - January 31, 2020) | None | 375 | 375 | 375 | ||||||
| 10.00% Secured Debt (Maturity - November 30, 2019) | None | 61 | 61 | 61 | ||||||||
| 13.00% Secured Debt (Maturity - November 30, 2019) | None | 64 | 64 | 64 | ||||||||
| Preferred Member Units (364 units, 5.00% cumulative) (16) | — | — | 284 | 284 | ||||||||
| 784 | 784 | |||||||||||
| AP Gaming I, LLC (8) (11) | Developer, Manufacturer and Operator of Gaming Machines | LIBOR Plus 8.25% (Floor 1.00%), Current Coupon 9.25%, Secured Debt (Maturity - December 21, 2020) | 3 month LIBOR | 11,291 | 11,194 | 11,267 | ||||||
| Apex Linen Service, Inc. (10) (13) | Industrial Launderers | 13.00% Secured Debt (Maturity - October 30, 2022) | None | 3,604 | 3,545 | 3,545 | ||||||
| LIBOR Plus 6.00% (Floor 1.00%), Current Coupon 7.00%, Secured Debt (Maturity - October 30, 2022) | 1 month LIBOR | 600 | 600 | 600 | ||||||||
| 4,145 | 4,145 | |||||||||||
| Arcus Hunting, LLC (8) (11) | Manufacturer of Bowhunting and Archery Products and Accessories | LIBOR Plus 7.00% (Floor 1.00%), Current Coupon 8.00%, Secured Debt (Maturity - November 13, 2019) | 1 month LIBOR | 6,973 | 6,850 | 6,973 | ||||||
| Artel, LLC (8) (12) | Provider of Secure Satellite Network and IT Solutions | LIBOR Plus 7.00% (Floor 1.25%), 7.25% Current/1.00% PIK, Current Coupon 8.25%, Secured Debt (Maturity - November 27, 2017) | 3 month LIBOR | 5,173 | 5,000 | 4,837 | ||||||
| ATI Investment Sub, Inc. (8) | Manufacturer of Solar Tracking Systems | LIBOR Plus 7.25% (Floor 1.00%), Current Coupon 8.25%, Secured Debt (Maturity - June 22, 2021) | 1 month LIBOR | 9,500 | 9,322 | 9,476 | ||||||
| ATX Networks Corp. (8) (9) | Provider of Radio Frequency Management Equipment | LIBOR Plus 6.00% (Floor 1.00%), Current Coupon 7.00%, Secured Debt (Maturity - June 11, 2021) | 3 month LIBOR | 14,775 | 14,541 | 14,516 | ||||||
| BarFly Ventures, LLC (11) | Casual Restaurant Group | 12.00% Secured Debt (Maturity - August 30, 2020) | None | $ | 1,986 | $ | 1,953 | $ | 1,942 | |||
| Warrants (.410 equivalent units, Expiration - August 31, 2025) | — | — | 158 | 94 | ||||||||
| Options (.731 equivalent units) | — | — | 133 | 164 | ||||||||
| 2,244 | 2,200 | |||||||||||
| BBB Tank Services, LLC (10) (13) | Maintenance, Repair and Construction Services to the Above-Ground Storage Tank Market | 15% Current Secured Debt (Maturity - April 8, 2021) | None | 1,007 | 989 | 989 | ||||||
| LIBOR Plus 9.50% (Floor 1.00%), Current Coupon 10.50%, Secured Debt (Maturity - April 8, 2021) | 1 month LIBOR | 200 | 200 | 200 | ||||||||
| Member Units (200,000 units) | — | — | 200 | 200 | ||||||||
| 1,389 | 1,389 | |||||||||||
| Berry Aviation, Inc. (11) | Airline Charter Service Operator | 12.00% Current / 1.75% PIK, Current Coupon 13.75%, Secured Debt (Maturity - January 30, 2020) (14) | None | 1,407 | 1,390 | 1,407 | ||||||
| Common Stock (138 shares) | — | — | 100 | 205 | ||||||||
| 1,490 | 1,612 | |||||||||||
| Bluestem Brands, Inc. (8) | Multi-Channel Retailer of General Merchandise | LIBOR Plus 7.50% (Floor 1.00%), Current Coupon 8.50%, Secured Debt (Maturity - November 6, 2020) | 3 month LIBOR | 13,812 | 13,582 | 12,039 | ||||||
| Brightwood Capital Fund III, LP (9) (15) | Investment Partnership | LP Interests (Brightwood Capital Fund III, LP) (Fully diluted .52%) (16) | — | — | 4,075 | 3,698 | ||||||
| Brundage-Bone Concrete Pumping, Inc. | Construction Services Provider | 10.38% Secured Debt (Maturity - September 1, 2021) (14) | None | 12,000 | 12,088 | 12,960 | ||||||
| Buca C, LLC (8) (10) (13) | Casual Restaurant Group | LIBOR Plus 7.25% (Floor 1.00%), Current Coupon 8.25%, Secured Debt (Maturity - June 30, 2020) | 1 month LIBOR | 15,114 | 14,889 | 15,114 | ||||||
| Preferred Member Units (4 units, 6.00% cumulative) (16) | — | — | 2,547 | 3,110 | ||||||||
| 17,436 | 18,224 | |||||||||||
| CAI Software, LLC (10) (13) | Provider of Specialized Enterprise Resource Planning Software | 12.00% Secured Debt (Maturity - October 10, 2019) | None | 921 | 904 | 921 | ||||||
| Member Units (16,339 units) | — | — | 163 | 620 | ||||||||
| 1,067 | 1,541 | |||||||||||
| CapFusion Holding, LLC (9) (10) (13) | Business Lender | 13.00% Secured Debt (Maturity - March 25, 2021) | None | 3,600 | 3,289 | 3,289 | ||||||
| Warrants (400 equivalent units, Expiration - March 24, 2026) | — | — | 300 | 300 | ||||||||
| 3,589 | 3,589 | |||||||||||
| CDHA Management, LLC (8) (11) | Dental Services | Prime Plus 6.25% (Floor 3.75%), Current Coupon 10.00%, Secured Debt (Maturity - December 5, 2021) | PRIME | 4,491 | 4,376 | 4,376 | ||||||
| Prime Plus 6.25% (Floor 3.75%), Current Coupon 10.00%, Secured Debt (Maturity - December 5, 2021) | PRIME | — | — | — | ||||||||
| 4,376 | 4,376 | |||||||||||
| Cenveo Corporation | Provider of Commercial Printing, Envelopes, Labels, Printed Office Products | 6.00% Secured Debt (Maturity - August 1, 2019) | None | 15,000 | 13,013 | 13,388 | ||||||
| Charlotte Russe, Inc. (8) | Fast-Fashion Retailer to Young Women | LIBOR Plus 5.50% (Floor 1.25%), Current Coupon 6.75%, Secured Debt (Maturity - May 22, 2019) | 3 month LIBOR | 15,101 | 14,918 | 9,184 | ||||||
| CJ Holding Company (8) | Oil and Gas Equipment and Services | LIBOR Plus 9.00% (Floor 1.00%), Current Coupon 10.00%, Secured Debt (Maturity - March 31, 2017) | 3 month LIBOR | 83 | 85 | 83 | ||||||
| Clarius BIGS, LLC (11) (18) | Prints & Advertising Film Financing | 15.00% PIK Secured Debt (Maturity - January 5, 2015) (18) | None | 2,144 | 1,886 | 64 | ||||||
| 20.00% PIK Secured Debt (Maturity - January 5, 2015) (18) | None | 774 | 681 | 23 | ||||||||
| 2,567 | 87 | |||||||||||
| Compuware Corporation (8) | Provider of Software and Supporting Services | LIBOR Plus 5.25% (Floor 1.00%), Current Coupon 6.25%, Secured Debt (Maturity - December 15, 2019) | 3 month LIBOR | $ | 12,265 | $ | 12,004 | $ | 12,341 | |||
| Construction Supply Investments, LLC (8) (11) | Distribution Platform of Specialty Construction Materials to Professional Concrete and Masonry Contractors | LIBOR Plus 9.50% (Floor 1.00%), Current Coupon 10.50%, Secured Debt (Maturity - June 30, 2023) | 3 month LIBOR | 8,500 | 8,305 | 8,330 | ||||||
| Member units (20,000 units) | — | — | 2,000 | 2,000 | ||||||||
| 10,305 | 10,330 | |||||||||||
| ContextMedia Health, LLC (8) (12) | Provider of Healthcare Media Content | LIBOR Plus 6.50% (Floor 1.00%), Current Coupon 7.50%, Secured Debt (Maturity - December 21, 2021) | 1 month LIBOR | 10,000 | 9,000 | 9,150 | ||||||
| Covenant Surgical Partners, Inc. | Ambulatory Surgical Centers | 8.75% Secured Debt (Maturity - August 1, 2019) | None | 9,500 | 9,500 | 9,168 | ||||||
| CRGT, Inc. (8) | Provider of Custom Software Development | LIBOR Plus 6.50% (Floor 1.00%), Current Coupon 7.50%, Secured Debt (Maturity - December 18, 2020) | 1 month LIBOR | 9,642 | 9,492 | 9,666 | ||||||
| CST Industries, Inc. (8) | Storage Tank Manufacturer | LIBOR Plus 6.25% (Floor 1.50%), Current Coupon 7.75%, Secured Debt (Maturity - May 22, 2017) | 3 month LIBOR | 2,759 | 2,766 | 2,759 | ||||||
| Datacom, LLC (10) (13) | Technology and Telecommunications Provider | 5.25% Current / 5.25% PIK, Current Coupon 10.50% Secured Debt (Maturity - May 30, 2019) | None | 1,296 | 1,282 | 1,222 | ||||||
| 8.00% Secured Debt (Maturity - May 30, 2017) | — | 100 | 100 | 100 | ||||||||
| Class A Preferred Member Units (1,530 units, 15.00% cumulative) (16) | — | — | 131 | 152 | ||||||||
| Class B Preferred Member Units (717 units) | — | — | 670 | 170 | ||||||||
| 2,183 | 1,644 | |||||||||||
| Digital River, Inc. (8) | Provider of Outsourced e-Commerce Solutions and Services | LIBOR Plus 6.50% (Floor 1.00%), Current Coupon 7.50%, Secured Debt (Maturity - February 12, 2021) | 3 month LIBOR | 14,586 | 14,477 | 14,713 | ||||||
| Digital Room, LLC (8) | Organic Lead Generation for Online Postsecondary Schools | LIBOR Plus 6.00% (Floor 1.00%), Current Coupon 7.00%, Secured Debt (Maturity - November 21, 2022) | 3 month LIBOR | 7,625 | 7,475 | 7,549 | ||||||
| East West Copolymer & Rubber, LLC (10) (13) | Manufacturer of Synthetic Rubbers | 12.00% Current / 2.00% PIK, Current Coupon 14.00%, Secured Debt (Maturity - October 17, 2019) | None | 2,400 | 2,351 | 2,136 | ||||||
| Warrants (627,697 equivalent shares, Expiration - October 15, 2024) | — | — | 13 | — | ||||||||
| 2,364 | 2,136 | |||||||||||
| ECP-PF Holdings Groups, Inc. (11) | Fitness Club Operator | LIBOR Plus 9.00% (Floor 1.00%), Current Coupon 10.00%, Secured Debt (Maturity - November 26, 2019) | 3 month LIBOR | 1,875 | 1,863 | 1,875 | ||||||
| Evergreen Skills Lux S.á r.l. (d/b/a Skillsoft) (8) (9) | Technology-Based Performance Support Solutions | LIBOR Plus 8.25% (Floor 1.00%), Current Coupon 9.34%, Secured Debt (Maturity - April 28, 2022) (14) | 6 month LIBOR | 10,902 | 10,443 | 8,214 | ||||||
| Flavors Holdings, Inc. (8) | Global Provider of Flavoring and Sweetening Products and Solutions | LIBOR Plus 5.75% (Floor 1.00%), Current Coupon 6.75%, Secured Debt (Maturity - April 3, 2020) | 3 month LIBOR | 11,774 | 11,236 | 9,596 | ||||||
| GST Autoleather, Inc. (8) | Automotive Leather Manufacturer | LIBOR Plus 5.50% (Floor 1.00%), Current Coupon 6.50%, Secured Debt (Maturity - July 10, 2020) | 3 month LIBOR | 12,204 | 12,073 | 11,929 | ||||||
| Guitar Center, Inc. | Musical Instruments Retailer | 6.50% Secured Debt (Maturity - April 15, 2019) | None | 15,015 | 14,128 | 13,626 | ||||||
| Hojeij Branded Foods, LLC (8) (11) | Multi-Airport, Multi-Concept Restaurant Operator | LIBOR Plus 6.50% (Floor 1.00%), Current Coupon 7.50%, Secured Debt (Maturity - July 28, 2021) | 3 month LIBOR | 5,419 | 5,376 | 5,419 | ||||||
| Hoover Group, Inc. (8) (9) (11) | Provider of Storage Tanks and Related Products to the Energy and Petrochemical Markets | LIBOR Plus 7.25% (Floor 1.00%), Current Coupon 8.25%, Secured Debt (Maturity - January 28, 2021) | 3 month LIBOR | 15,000 | 13,961 | 13,961 | ||||||
| Horizon Global Corporation (8) (9) | Auto Parts Manufacturer | LIBOR Plus 6.00% (Floor 1.00%), Current Coupon 7.00%, Secured Debt (Maturity - June 30, 2021) | 1 month LIBOR | 12,098 | 11,893 | 12,325 | ||||||
| Hunter Defense Technologies, Inc. (8) | Provider of Military and Commercial Shelters and Systems | LIBOR Plus 6.00% (Floor 1.00%), Current Coupon 7.00%, Secured Debt (Maturity - August 5, 2019) | 3 Month LIBOR | 13,847 | 13,255 | 12,878 | ||||||
| Hygea Holdings Corp. (8) (11) | Provider of Physician Services | LIBOR Plus 9.25%, Current Coupon 10.17%, Secured Debt (Maturity - February 24, 2019) | 3 Month LIBOR | 7,875 | 7,378 | 7,615 | ||||||
| Warrants (5,910,453 equivalent shares, Expiration - February 24, 2023) | — | — | 369 | 1,531 | ||||||||
| 7,747 | 9,146 | |||||||||||
| iEnergizer Limited (8) (9) | Provider of Business Outsourcing Solutions | LIBOR 6.00% (Floor 1.25%), Current Coupon 7.25%, Secured Debt (Maturity - May 1, 2019) | 1 month LIBOR | $ | 8,569 | $ | 8,110 | $ | 8,312 | |||
| Indivior Finance, LLC (8) (9) | Specialty Pharmaceutical Company Treating Opioid Dependence | LIBOR Plus 6.00% (Floor 1.00%), Current Coupon 7.00%, Secured Debt (Maturity - December 19, 2019) | 3 month LIBOR | 9,000 | 8,644 | 9,079 | ||||||
| Industrial Container Services, LLC (8) (11) | Steel Drum Reconditioner | LIBOR Plus 5.75% (Floor 1.00%), Current Coupon 6.75%, Secured Debt (Maturity - December 31, 2018) | 3 month LIBOR | 8,927 | 8,871 | 8,927 | ||||||
| Industrial Services Acquisitions, LLC (11) | Industrial Cleaning Services | 11.25% Current / 0.75% PIK, Current Coupon 12.00%, Unsecured Debt (Maturity - December 17, 2022) (17) | None | 10,523 | 10,325 | 10,325 | ||||||
| Member units (Industrial Services Investments, LLC) (2,100,000 units) | — | — | 2,100 | 2,100 | ||||||||
| 12,425 | 12,425 | |||||||||||
| Inn of the Mountain Gods Resort and Casino | Hotel & Casino Owner & Operator | 9.25% Secured Debt (Maturity - November 30, 2020) | None | 10,749 | 10,583 | 9,782 | ||||||
| Intertain Group Limited (8) (9) | Business-to-Consumer Online Gaming Operator | LIBOR Plus 6.50% (Floor 1.00%), Current Coupon 7.50%, Secured Debt (Maturity - April 8, 2022) | 3 month LIBOR | 8,799 | 8,633 | 8,876 | ||||||
| iPayment, Inc. (8) | Provider of Merchant Acquisition | LIBOR Plus 5.25% (Floor 1.50%), Current Coupon 6.75%, Secured Debt (Maturity - May 8, 2017) | 3 month LIBOR | 15,007 | 14,986 | 14,481 | ||||||
| Ipreo Holdings, LLC | Application Software for Capital Markets | 7.25% Unsecured Debt (Maturity - August 1, 2022) (17) | None | 6,250 | 5,318 | 5,266 | ||||||
| iQor US Inc. (8) | Business Process Outsourcing Services Provider | LIBOR Plus 5.00% (Floor 1.00%), Current Coupon 6.00%, Secured Debt (Maturity - April 1, 2021) | 1 month LIBOR | 7,757 | 7,331 | 7,442 | ||||||
| IronGate Energy Services, LLC (18) | Oil and Gas Services | 11.00% Secured Debt (Maturity - July 1, 2018) (18) | None | 5,825 | 5,827 | 1,631 | ||||||
| Jackmont Hospitality, Inc. (8) (11) | Franchisee of Casual Dining Restaurants | LIBOR Plus 4.25% (Floor 1.00%)/ 2.50% PIK , Current Coupon 7.75%, Secured Debt (Maturity - May 26, 2021) | 1 month LIBOR | 8,891 | 8,861 | 8,891 | ||||||
| Joerns Healthcare, LLC (8) | Manufacturer and Distributor of Health Care Equipment & Supplies | LIBOR Plus 5.00% (Floor 1.00%), Current Coupon 6.00%, Secured Debt (Maturity - May 9, 2020) | 3 month LIBOR | 12,172 | 11,947 | 11,442 | ||||||
| JSS Holdings, Inc. (8) | Aircraft Maintenance Program Provider | LIBOR Plus 6.50% (Floor 1.00%), Current Coupon 7.50%, Secured Debt (Maturity - August 31, 2021) | 3 month LIBOR | 13,828 | 13,550 | 13,759 | ||||||
| Kellermeyer Bergensons Services, LLC (8) | Outsourced Janitorial Services to Retail/Grocery Customers | LIBOR Plus 8.50% (Floor 1.00%), Current Coupon 9.50%, Secured Debt (Maturity - April 29, 2022) (14) | 3 month LIBOR | 14,700 | 14,603 | 13,964 | ||||||
| Kendra Scott, LLC (8) | Jewelry Retail Stores | LIBOR Plus 6.00% (Floor 1.00%), Current Coupon 7.00%, Secured Debt (Maturity - July 17, 2020) | 3 month LIBOR | 9,375 | 9,305 | 9,328 | ||||||
| Keypoint Government Solutions, Inc. (8) | Provider of Pre-Employment Screening Services | LIBOR Plus 6.50% (Floor 1.25%), Current Coupon 7.75%, Secured Debt (Maturity - November 13, 2017) | 3 month LIBOR | 1,761 | 1,757 | 1,752 | ||||||
| LaMi Products, LLC (8) (11) | General Merchandise Distribution | LIBOR Plus 6.50% (Floor 1.00%), Current Coupon 7.50%, Secured Debt (Maturity - September 16, 2020) | 3 month LIBOR | 10,735 | 10,564 | 10,730 | ||||||
| LIBOR Plus 6.50% (Floor 1.00%), Current Coupon 7.50%, Secured Debt (Maturity - September 16, 2020) | 3 month LIBOR | |||||||||||
| 10,564 | 10,730 | |||||||||||
| Larchmont Resources, LLC (8) | Oil & Gas Exploration & Production | LIBOR Plus 9.00% (Floor 1.00%), Current Coupon 10.00% PIK, Secured Debt (Maturity - August 7, 2020) | 3 month LIBOR | 3,816 | 3,816 | 3,731 | ||||||
| Member units (Larchmont Intermediate Holdo, LLC) (4,806 units) | — | — | 601 | 2,027 | ||||||||
| 4,417 | 5,758 | |||||||||||
| Legendary Pictures Funding, LLC (8) (11) | Producer of TV, Film, and Comic Content | LIBOR Plus 6.00% (Floor 1.00%), Current Coupon 7.00%, Secured Debt (Maturity - April 22, 2020) | 3 month LIBOR | 8,020 | 7,905 | 8,030 | ||||||
| LJ Host Merger Sub, Inc. (8) | Managed Services and Hosting Provider | LIBOR Plus 4.75% (Floor 1.25%), Current Coupon 6.00%, Secured Debt (Maturity - December 13, 2019) | 3 month LIBOR | 4,846 | 4,837 | 4,595 | ||||||
| Logix Acquisition Company, LLC (8) (11) | Competitive Local Exchange Carrier | LIBOR Plus 8.28% (Floor 1.00%), Current Coupon 9.28%, Secured Debt (Maturity - June 24, 2021) | 3 month LIBOR | 8,593 | 8,455 | 8,593 | ||||||
| Minute Key, Inc. (10) (13) | Operator of Automated Key Duplication Kiosk | 10.00% Current / 2.00% PIK Secured Debt (Maturity - September 19, 2019) (14) | None | $ | 3,905 | $ | 3,821 | $ | 3,821 | |||
| Warrants (359,352 equivalent units, Expiration - May 20, 2025) | — | — | 70 | 117 | ||||||||
| 3,891 | 3,938 | |||||||||||
| Mood Media Corporation (8) (9) | Provider of Electronic Equipment | LIBOR Plus 6.00% (Floor 1.00%), Current Coupon 7.00%, Secured Debt (Maturity - May 1, 2019) | 3 month LIBOR | 14,822 | 14,741 | 14,328 | ||||||
| New Media Holdings II LLC (8) (9) | Local Newspaper Operator | LIBOR Plus 6.25% (Floor 1.00%), Current Coupon 7.25%, Secured Debt (Maturity - June 4, 2020) | 3 month LIBOR | 14,706 | 14,578 | 14,633 | ||||||
| North American Lifting Holdings, Inc. (8) | Crane Service Provider | LIBOR Plus 4.50% (Floor 1.00%), Current Coupon 5.50%, Secured Debt (Maturity - November 27, 2020) | 3 month LIBOR | 2,405 | 2,016 | 2,101 | ||||||
| North Atlantic Trading Company, Inc. (8) | Marketer/Distributor of Tobacco | Prime Plus 5.50% (Floor 3.75%), Current Coupon 9.25%, Secured Debt (Maturity - January 13, 2020) | PRIME | 10,897 | 10,913 | 10,829 | ||||||
| Novitex Acquisition, LLC (8) | Provider of Document Management Services | LIBOR Plus 6.75% (Floor 1.25%), Current Coupon 8.00%, Secured Debt (Maturity - July 7, 2020) | 3 month LIBOR | 13,322 | 13,004 | 12,823 | ||||||
| NTM Acquisition Corp. (8) | Provider of B2B Travel Information Content | LIBOR Plus 6.25% (Floor 1.00%), Current Coupon 7.25%, Secured Debt (Maturity - June 7, 2022) | 3 month LIBOR | 4,144 | 4,085 | 4,128 | ||||||
| Pardus Oil & Gas, LLC | Oil & Gas Exploration and Production | 13.00% PIK, Secured Debt (Maturity - November 12, 2021) | None | 989 | 989 | 989 | ||||||
| 5.00% PIK, Secured Debt (Maturity - May 13, 2022) (14) | None | 517 | 517 | 293 | ||||||||
| Class A units (1,331 units) | — | — | 1,331 | 523 | ||||||||
| 2,837 | 1,805 | |||||||||||
| Paris Presents, Inc. (8) | Branded Cosmetic and Bath Accessories | LIBOR Plus 8.75% (Floor 1.00%), Current Coupon 9.75%, Secured Debt (Maturity - December 31, 2021) (14) | 1 month LIBOR | 7,500 | 7,382 | 7,350 | ||||||
| Parq Holdings, LP (8) (9) | Hotel and Casino Operator | LIBOR Plus 7.50% (Floor 1.00%), Current Coupon 8.50%, Secured Debt (Maturity - December 17, 2020) | 1 month LIBOR | 12,500 | 12,378 | 12,313 | ||||||
| Permian Holdco 2, Inc. | Storage Tank Manufacturer | 14.00% PIK Unsecured Debt (Maturity - October 15, 2021) | None | 483 | 483 | 483 | ||||||
| Series A Preferred Shares (Permian Holdco 1, Inc.) (386,255 units) (12.00% Cumulative) (16) | — | — | 997 | 997 | ||||||||
| Common Shares (Permian Holdco 1, Inc.) (386,255 units) | — | — | 997 | 997 | ||||||||
| 2,477 | 2,477 | |||||||||||
| Permian Holdings, Inc. | Storage Tank Manufacturer | 10.50% Secured Debt (Maturity - January 15, 2018) | None | 1,000 | 338 | 338 | ||||||
| Pernix Therapeutics Holdings, Inc. (11) | Pharmaceutical Royalty - Anti-Migraine | 12.00% Secured Debt (Maturity - August 1, 2020) | None | 3,016 | 2,990 | 2,910 | ||||||
| Pike Corporation (8) | Construction and Maintenance Services for Electric Transmission and Distribution Infrastructure | LIBOR Plus 8.50% (Floor 1.00%), Current Coupon 9.50%, Secured Debt (Maturity - June 22, 2022) (14) | 1 month LIBOR | 13,334 | 13,070 | 13,411 | ||||||
| Polycom, Inc. (8) | Provider of Audio and Video Communication Solutions | LIBOR Plus 6.50% (Floor 1.00%), Current Coupon 7.50%, Secured Debt (Maturity - September 27, 2023) | 3 month LIBOR | 12,089 | 11,617 | 12,194 | ||||||
| PPC/Shift, LLC (8) (11) | Provider of Digital Solutions to Automotive Industry | LIBOR Plus 6.00% (Floor 1.00%), Current Coupon 7.00%, Secured Debt (Maturity - December 22, 2021) | 3 month LIBOR | 7,000 | 6,851 | 6,851 | ||||||
| Premier Dental Services, Inc. (8) | Dental Care Services | LIBOR Plus 6.50% (Floor 1.00%), Current Coupon 7.50%, Secured Debt (Maturity - November 1, 2018) | 3 month LIBOR | 4,511 | 4,497 | 4,494 | ||||||
| Prowler Acquisition Corporation (8) | Specialty Distributor to the Energy Sector | LIBOR Plus 4.50% (Floor 1.00%), Current Coupon 5.50%, Secured Debt (Maturity - January 28, 2020) | 3 month LIBOR | 11,329 | 9,896 | 8,383 | ||||||
| Raley’s, Inc. (8) | Family-Owned Supermarket Chain in California | LIBOR Plus 6.25% (Floor 1.00%), Current Coupon 7.25%, Secured Debt (Maturity - May 18, 2022) | 3 month LIBOR | 4,195 | 4,125 | 4,242 | ||||||
| Redbox Automated Retail, LLC (8) | Operator of Home Media Entertainment Kiosks | LIBOR Plus 7.50% (Floor 1.00%), Current Coupon 8.50%, Secured Debt (Maturity - September 27, 2021) | 3 month LIBOR | 14,344 | 13,925 | 13,989 | ||||||
| Renaissance Learning, Inc. (8) | Technology-based K-12 Learning Solutions | LIBOR Plus 7.00% (Floor 1.00%), Current Coupon 8.00%, Secured Debt (Maturity - April 11, 2022) (14) | 3 month LIBOR | $ | 12,950 | $ | 12,548 | $ | 12,896 | |||
| RGL Reservoir Operations, Inc. (8) (9) | Oil & Gas Equipment & Services | LIBOR Plus 5.00% (Floor 1.00%), Current Coupon 6.00%, Secured Debt (Maturity - August 13, 2021) | 3 month LIBOR | 3,910 | 3,826 | 880 | ||||||
| RM Bidder, LLC (11) | Full-scale Film and Television Production and Distribution | Common Stock (1,854 units) | — | — | 31 | 29 | ||||||
| Series A Warrants (124,915 equivalent units, Expiration - October 20, 2025) | — | — | 284 | 200 | ||||||||
| Series B Warrants (93,686 equivalent units, Expiration - October 20, 2025) | — | — | — | — | ||||||||
| 315 | 229 | |||||||||||
| Salient Partners, LP (8) | Provider of Asset Management Services | LIBOR Plus 8.50% (Floor 1.00%), Current Coupon 9.50%, Secured Debt (Maturity - June 9, 2021) | 3 month LIBOR | 11,842 | 11,527 | 11,338 | ||||||
| School Specialty, Inc. (8) | Distributor of Education Supplies and Furniture | LIBOR Plus 8.50% (Floor 1.00%), Current Coupon 9.50%, Secured Debt (Maturity - June 11, 2019) | 1 month LIBOR | 5,467 | 5,396 | 5,536 | ||||||
| Sigma Electric Manufacturing Corp. (8) (11) | Manufacturer and Distributor of Electrical Fittings and Parts | LIBOR Plus 7.25% (Floor 1.00%), Current Coupon 8.25%, Secured Debt (Maturity - May 13, 2019) | 3 Month LIBOR | 12,500 | 12,199 | 12,199 | ||||||
| Sorenson Communications, Inc. | Manufacturer of Communication Products for Hearing Impaired | 9.00% Secured Debt (Maturity - October 31, 2020) (14) | None | 11,710 | 11,308 | 10,305 | ||||||
| LIBOR Plus 5.75% (Floor 2.25%), Current Coupon 8.00%, Secured Debt (Maturity - April 30, 2020) | 3 month LIBOR | 2,977 | 2,957 | 2,955 | ||||||||
| 14,265 | 13,260 | |||||||||||
| Strike, LLC (8) | Pipeline Construction and Maintenance Services | LIBOR Plus 8.00% (Floor 1.00%), Current Coupon 9.29%, Secured Debt (Maturity - November 30, 2022) | 6 month LIBOR | 10,000 | 9,667 | 9,900 | ||||||
| Synagro Infrastructure Company, Inc. (8) | Waste Management Services | LIBOR Plus 5.25% (Floor 1.00%), Current Coupon 6.25%, Secured Debt (Maturity - August 22, 2020) | 3 month LIBOR | 2,704 | 2,687 | 2,372 | ||||||
| TaxAct, Inc. (8) | Provider of Tax Preparation Solutions | LIBOR Plus 6.00% (Floor 1.00%), Current Coupon 7.00%, Secured Debt (Maturity - January 3, 2023) | 1 month LIBOR | 6,500 | 6,369 | 6,549 | ||||||
| TE Holdings, LLC | Oil & Gas Exploration & Production | Common Units (72,785 units) | — | — | 728 | 546 | ||||||
| Teleguam Holdings, LLC (8) | Cable and Telecom Services Provider | LIBOR Plus 7.50% (Floor 1.25%), Current Coupon 8.75%, Secured Debt (Maturity - June 10, 2019) (14) | 1 month LIBOR | 6,397 | 6,387 | 6,268 | ||||||
| LIBOR Plus 4.00% (Floor 1.25%), Current Coupon 5.25%, Secured Debt (Maturity - December 10, 2018) | 1 month LIBOR | 7,481 | 7,335 | 7,406 | ||||||||
| 13,722 | 13,674 | |||||||||||
| TMC Merger Sub Corp (8) | Refractory & Maintenance Services Provider | LIBOR Plus 6.25% (Floor 1.00%), Current Coupon 7.25%, Secured Debt (Maturity - October 31, 2022) | 1 week LIBOR | 12,500 | 12,376 | 12,438 | ||||||
| The Topps Company, Inc. (8) | Trading Cards & Confectionary | LIBOR Plus 6.00% (Floor 1.25%), Current Coupon 7.25%, Secured Debt (Maturity - October 2, 2018) | 3 month LIBOR | 1,109 | 1,104 | 1,113 | ||||||
| TOMS Shoes, LLC (8) | Global Designer, Distributor, and Retailer of Casual Footwear | LIBOR Plus 5.50% (Floor 1.00%), Current Coupon 6.50%, Secured Debt (Maturity - October 30, 2020) | 3 month LIBOR | 4,913 | 4,573 | 3,635 | ||||||
| Travel Leaders Group, LLC (8) | Travel Agency Network Provider | LIBOR Plus 6.00% (Floor 1.00%), Current Coupon 7.00%, Secured Debt (Maturity - December 7, 2020) | 1 month LIBOR | 15,988 | 15,900 | 15,960 | ||||||
| TVG-I-E CMN Acquisition, LLC (8) (11) | Organic Lead Generation for Online Postsecondary Schools | LIBOR Plus 6.00%, Current Coupon 7.00%, Secured Debt (Maturity - November 3, 2021) | 1 month LIBOR | 6,459 | 6,333 | 6,333 | ||||||
| Unirush LLC (10) (13) | Provider of Prepaid Debit Card Solutions | 12.00% Secured Debt (Maturity Date - February 1, 2019) | None | 3,000 | 2,745 | 3,000 | ||||||
| Warrants (111,181 equivalent units, Expiration - February 2, 2026) | — | — | 313 | 313 | ||||||||
| 3,058 | 3,313 | |||||||||||
| U.S. Telepacific Corp. (8) (11) | Provider of Communications and Managed Services | LIBOR Plus 8.50% (Floor 1.00%), Current Coupon 9.50%, Secured Debt (Maturity - February 24, 2021) | 3 month LIBOR | 7,500 | 7,367 | 7,367 | ||||||
| USJ-IMECO Holding Company, LLC (8) | Marine Interior Design and Installation | LIBOR Plus 6.00% (Floor 1.00%), Current Coupon 7.00%, Secured Debt (Maturity - April 16, 2020) | 3 month LIBOR | $ | 8,857 | $ | 8,829 | $ | 8,813 | |||
| Valley Healthcare Group, LLC (8) (10) (13) | Provider of Durable Medical Equipment | LIBOR Plus 12.50% (Floor 0.50%), Current Coupon 13.12%, Secured Debt (Maturity - December 29, 2020) | 1 month LIBOR | 3,239 | 3,183 | 3,183 | ||||||
| Preferred Member Units (Valley Healthcare Holding, LLC) (400 units) | — | — | 400 | 400 | ||||||||
| 3,583 | 3,583 | |||||||||||
| VCVH Holding Corp. (8) | Healthcare Technology Services Focused on Revenue Maximization | LIBOR Plus 9.25% (Floor 1.00%), Current Coupon 10.25%, Secured Debt (Maturity - June 1, 2024) (14) | 3 month LIBOR | 3,500 | 3,417 | 3,474 | ||||||
| Volusion, LLC (10) (13) | Provider of Online Software-as-a-Service eCommerce Solutions | 11.50% Secured Debt (Maturity - January 24, 2020) | None | 7,500 | 6,484 | 6,484 | ||||||
| Preferred Member Units (2,090,001 units) | — | — | 6,000 | 6,000 | ||||||||
| Warrants (784,866.80 equivalent units, Expiration - January 26, 2025) | — | — | 1,104 | 1,104 | ||||||||
| 13,588 | 13,588 | |||||||||||
| Wellnext, LLC (8) (11) | Manufacturer of Supplements and Vitamins | LIBOR Plus 9.00% (Floor 0.50%), Current Coupon 9.85%, Secured Debt (Maturity - May 23, 2021) | 3 month LIBOR | 10,058 | 9,966 | 10,058 | ||||||
| Worley Claims Services, LLC (8) (11) | Insurance Adjustment Management and Services Provider | LIBOR Plus 8.00% (Floor 1.00%), Current Coupon 9.00%, Secured Debt (Maturity - October 31, 2020) | 1 month LIBOR | 6,370 | 6,326 | 6,370 | ||||||
| YP Holdings LLC (8) | Online and Offline Advertising Operator | LIBOR Plus 11.00% (Floor 1.25%), Current Coupon 12.25%, Secured Debt (Maturity - June 4, 2018) | 1 month LIBOR | 15,280 | 15,016 | 15,241 | ||||||
| Subtotal Non-Control/Non-Affiliate Investments (5) (91% of total portfolio investments at fair value) | $ | 935,741 | $ | 916,393 | ||||||||
| Total Portfolio Investments | $ | 1,002,395 | $ | 989,247 | ||||||||
| Short Term Investments (20) | ||||||||||||
| Fidelity Institutional Money Market Funds | — | Prime Money Market Portfolio, Class III Shares (21) | — | — | $ | 9,775 | $ | 9,775 | ||||
| UMB Bank Money Market Account (21) | — | — | 642 | 642 | ||||||||
| US Bank Money Market Account (21) | — | — | — | — | 10,672 | 10,672 | ||||||
| Total Short Term Investments | $ | 21,089 | $ | 21,089 | ||||||||
| Twelve Months Ended December 31, 2016 | Twelve Months Ended December 31, 2016 | ||||||||||||||||||||||||||||||||
| Affiliate Investments | Fair Value at December 31, 2015 | Gross Additions (Cost)* | Gross Reductions (Cost)** | Net Unrealized Gain (Loss) | Fair Value at December 31, 2016 | Net Realized Gain (Loss) | Interest Income | Fee Income | Dividend Income | ||||||||||||||||||||||||
| AFG Capital Group, LLC | |||||||||||||||||||||||||||||||||
| Term loan | $ | 3,197 | $ | 120 | $ | (3,238 | ) | $ | (79 | ) | $ | — | $ | — | $ | 256 | $ | — | $ | — | |||||||||||||
| Member units | 505 | 1 | (1 | ) | 182 | 687 | — | — | — | — | |||||||||||||||||||||||
| Warrants | 123 | — | — | 44 | 167 | — | — | — | — | ||||||||||||||||||||||||
| Clad-Rex Steel, LLC | |||||||||||||||||||||||||||||||||
| Term loan | — | 3,449 | — | — | 3,449 | — | 14 | — | — | ||||||||||||||||||||||||
| Term loan | — | 99 | — | — | 99 | — | — | 1 | — | ||||||||||||||||||||||||
| Member units | — | 1,820 | — | — | 1,820 | — | — | — | — | ||||||||||||||||||||||||
| Term loan (Clad-Rex Steel RE Investor, LLC) | — | 298 | — | — | 298 | — | — | — | — | ||||||||||||||||||||||||
| Member units (Clad-Rex Steel RE Investor, LLC) | — | 53 | — | — | 53 | — | — | — | — | ||||||||||||||||||||||||
| EIG Traverse Co-Investment, LP | |||||||||||||||||||||||||||||||||
| LP interests | $ | 4,755 | $ | 5,051 | $ | (1 | ) | $ | 100 | $ | 9,905 | $ | — | $ | — | $ | 56 | $ | 888 | ||||||||||||||
| Freeport First Lien Loan Fund III, LP | |||||||||||||||||||||||||||||||||
| LP interests | 2,077 | 2,686 | — | — | 4,763 | — | — | — | 402 | ||||||||||||||||||||||||
| Gamber-Johnson Holdings, LLC | |||||||||||||||||||||||||||||||||
| Term loan | — | 5,902 | — | 62 | 5,964 | — | 328 | — | — | ||||||||||||||||||||||||
| Common stock | — | 3,711 | — | 1,019 | 4,730 | — | — | 101 | — | ||||||||||||||||||||||||
| Guerdon Modular Holdings, Inc. | |||||||||||||||||||||||||||||||||
| Term loan | — | 2,651 | (4 | ) | (5 | ) | 2,642 | — | 311 | — | — | ||||||||||||||||||||||
| Common stock | — | 303 | — | (283 | ) | 20 | — | — | 13 | — | |||||||||||||||||||||||
| Class B preferred units | — | 285 | — | — | 285 | — | — | — | — | ||||||||||||||||||||||||
| Gulf Publishing Holdings, LLC | |||||||||||||||||||||||||||||||||
| Term loan | — | 2,455 | — | — | 2,455 | — | 219 | — | — | ||||||||||||||||||||||||
| Member units | — | 781 | — | — | 781 | — | — | — | — | ||||||||||||||||||||||||
| Hawk Ridge Systems, LLC | |||||||||||||||||||||||||||||||||
| Term loan | — | 2,451 | — | — | 2,451 | — | 22 | — | — | ||||||||||||||||||||||||
| Preferred member units | — | 713 | — | — | 713 | — | — | — | — | ||||||||||||||||||||||||
| Preferred member units (HRS Services, ULC) | — | 38 | — | — | 38 | — | — | — | — | ||||||||||||||||||||||||
| HWT, LLC | |||||||||||||||||||||||||||||||||
| Term loan | 2,430 | 211 | (50 | ) | — | 2,591 | — | 283 | — | — | |||||||||||||||||||||||
| Member units | 986 | 1 | (1 | ) | (1 | ) | 985 | — | — | 32 | 108 | ||||||||||||||||||||||
| M.H. Corbin, LLC | |||||||||||||||||||||||||||||||||
| Term loan | 3,467 | 4 | (172 | ) | — | 3,299 | — | 351 | — | — | |||||||||||||||||||||||
| Member units | 1,500 | — | — | — | 1,500 | — | — | 46 | — | ||||||||||||||||||||||||
| Mystic Logistics, Inc. | |||||||||||||||||||||||||||||||||
| Term loan | 2,361 | 8 | (59 | ) | (16 | ) | 2,294 | — | 301 | — | — | ||||||||||||||||||||||
| Common stock | 1,492 | 1 | — | (48 | ) | 1,445 | — | — | — | — | |||||||||||||||||||||||
| Soft Touch Medical Holdings, LLC | |||||||||||||||||||||||||||||||||
| Term loan | 1,402 | 3 | (161 | ) | 16 | 1,260 | — | 144 | — | — | |||||||||||||||||||||||
| Member units | 1,008 | 1 | (1 | ) | 610 | 1,618 | — | — | 27 | 65 | |||||||||||||||||||||||
| $ | 25,303 | $ | 33,096 | $ | (3,688 | ) | $ | 1,601 | $ | 56,312 | $ | — | $ | 2,229 | $ | 276 | $ | 1,463 | |||||||||||||||
| Portfolio Company (1) (20) | Business Description | Type of Investment (2) (3) (15) | Investment Date (22) | Shares/Units | Total Rate | Reference Rate and Spread (25) | PIK Rate (19) | Maturity Date | Principal (4) | Cost (4) | Fair Value (18) | |||||||||||||||||||||||||||||||||
| Control Investments (5) | ||||||||||||||||||||||||||||||||||||||||||||
| Copper Trail Fund Investments | (12) (13) | Investment Partnership | ||||||||||||||||||||||||||||||||||||||||||
| LP Interests (CTMH, LP) | (24) | 07/17/2017 | 39.0% | $ | 713 | $ | 588 | |||||||||||||||||||||||||||||||||||||
| GRT Rubber Technologies LLC | Manufacturer of Engineered Rubber Products | |||||||||||||||||||||||||||||||||||||||||||
| Secured Debt | 12/21/2018 | 10.12% | L+ | 6.00% | 12/21/2023 | 330 | 324 | 330 | ||||||||||||||||||||||||||||||||||||
| Secured Debt | 12/19/2014 | 12.12% | L+ | 8.00% | 10/29/2026 | 19,944 | 19,753 | 19,943 | ||||||||||||||||||||||||||||||||||||
| Member Units | (8) | 12/19/2014 | 2,896 | 6,435 | 21,890 | |||||||||||||||||||||||||||||||||||||||
| 26,512 | 42,163 | |||||||||||||||||||||||||||||||||||||||||||
| Harris Preston Fund Investments | (12) (13) | Investment Partnership | ||||||||||||||||||||||||||||||||||||||||||
| LP Interests (2717 MH, L.P.) | (24) | 10/01/2017 | 49.3% | 3,895 | 7,552 | |||||||||||||||||||||||||||||||||||||||
| Subtotal Control Investments (8.3% of net assets at fair value) | $ | 31,120 | $ | 50,303 | ||||||||||||||||||||||||||||||||||||||||
| Affiliate Investments (6) | ||||||||||||||||||||||||||||||||||||||||||||
| AFG Capital Group, LLC | Provider of Rent-to-Own Financing Solutions and Services | |||||||||||||||||||||||||||||||||||||||||||
| Preferred Member Units | (8) | 11/07/2014 | 46 | $ | 300 | $ | 2,350 | |||||||||||||||||||||||||||||||||||||
| Analytical Systems Keco Holdings, LLC | Manufacturer of Liquid and Gas Analyzers | |||||||||||||||||||||||||||||||||||||||||||
| Secured Debt | (9) | 08/16/2019 | L+ | 10.00% | 8/16/2024 | — | (2) | (2) | ||||||||||||||||||||||||||||||||||||
| Secured Debt | (9) | 08/16/2019 | 14.13% | L+ | 10.00% | 8/16/2024 | 1,166 | 1,135 | 1,135 | |||||||||||||||||||||||||||||||||||
| Preferred Member Units | 05/20/2021 | 607 | 607 | 880 | ||||||||||||||||||||||||||||||||||||||||
| Preferred Member Units | 08/16/2019 | 800 | 14.13% | 800 | — | |||||||||||||||||||||||||||||||||||||||
| Warrants | (27) | 08/16/2019 | 105 | 8/16/2029 | 79 | — | ||||||||||||||||||||||||||||||||||||||
| 2,619 | 2,013 | |||||||||||||||||||||||||||||||||||||||||||
| ATX Networks Corp. | (11) | Provider of Radio Frequency Management Equipment | ||||||||||||||||||||||||||||||||||||||||||
| Secured Debt | (9) | 09/01/2021 | 12.23% | L+ | 7.50% | 9/1/2026 | 6,811 | 6,266 | 6,368 | |||||||||||||||||||||||||||||||||||
| Unsecured Debt | 09/01/2021 | 10.00% | 10.00% | 9/1/2028 | 3,417 | 2,337 | 2,614 | |||||||||||||||||||||||||||||||||||||
| Common Stock | 09/01/2021 | 585 | — | 3,290 | ||||||||||||||||||||||||||||||||||||||||
| 8,603 | 12,272 | |||||||||||||||||||||||||||||||||||||||||||
| Barfly Ventures, LLC | (10) | Casual Restaurant Group | ||||||||||||||||||||||||||||||||||||||||||
| Member Units | 10/26/2020 | 12 | 528 | 1,107 | ||||||||||||||||||||||||||||||||||||||||
| Batjer TopCo, LLC | HVAC Mechanical Contractor | |||||||||||||||||||||||||||||||||||||||||||
| Secured Debt | 03/07/2022 | 3/31/2027 | — | (1) | (1) | |||||||||||||||||||||||||||||||||||||||
| Secured Debt | 03/07/2022 | 11.00% | 3/31/2027 | 1,225 | 1,205 | 1,205 | ||||||||||||||||||||||||||||||||||||||
| Preferred Stock | (8) | 03/07/2022 | 453 | 455 | 455 | |||||||||||||||||||||||||||||||||||||||
| 1,659 | 1,659 | |||||||||||||||||||||||||||||||||||||||||||
| Brewer Crane Holdings, LLC | Provider of Crane Rental and Operating Services | |||||||||||||||||||||||||||||||||||||||||||
| Secured Debt | (9) | 01/09/2018 | 14.12% | L+ | 10.00% | 1/9/2023 | 1,491 | 1,491 | 1,491 | |||||||||||||||||||||||||||||||||||
| Preferred Member Units | (8) | 01/09/2018 | 737 | 1,070 | 1,770 | |||||||||||||||||||||||||||||||||||||||
| 2,561 | 3,261 | |||||||||||||||||||||||||||||||||||||||||||
| Portfolio Company (1) (20) | Business Description | Type of Investment (2) (3) (15) | Investment Date (22) | Shares/Units | Total Rate | Reference Rate and Spread (25) | PIK Rate (19) | Maturity Date | Principal (4) | Cost (4) | Fair Value (18) | |||||||||||||||||||||||||||||||||
| Centre Technologies Holdings, LLC | Provider of IT Hardware Services and Software Solutions | |||||||||||||||||||||||||||||||||||||||||||
| Secured Debt | (9) | 01/04/2019 | L+ | 9.00% | 1/4/2026 | — | — | — | ||||||||||||||||||||||||||||||||||||
| Secured Debt | (9) | 01/04/2019 | 13.13% | L+ | 9.00% | 1/4/2026 | 3,758 | 3,731 | 3,731 | |||||||||||||||||||||||||||||||||||
| Preferred Member Units | 01/04/2019 | 3,327 | 1,531 | 2,170 | ||||||||||||||||||||||||||||||||||||||||
| 5,262 | 5,901 | |||||||||||||||||||||||||||||||||||||||||||
| Chamberlin Holding LLC | Roofing and Waterproofing Specialty Contractor | |||||||||||||||||||||||||||||||||||||||||||
| Secured Debt | (9) | 02/26/2018 | L+ | 6.00% | 2/26/2023 | — | — | — | ||||||||||||||||||||||||||||||||||||
| Secured Debt | (9) | 02/26/2018 | 12.13% | L+ | 8.00% | 2/26/2023 | 4,236 | 4,228 | 4,236 | |||||||||||||||||||||||||||||||||||
| Member Units | (8) | 02/26/2018 | 1,087 | 2,860 | 5,728 | |||||||||||||||||||||||||||||||||||||||
| Member Units | (8) (23) | 11/02/2018 | 261,786 | 443 | 678 | |||||||||||||||||||||||||||||||||||||||
| 7,531 | 10,642 | |||||||||||||||||||||||||||||||||||||||||||
| Charps, LLC | Pipeline Maintenance and Construction | |||||||||||||||||||||||||||||||||||||||||||
| Preferred Member Units | (8) | 02/03/2017 | 457 | 491 | 3,330 | |||||||||||||||||||||||||||||||||||||||
| Clad-Rex Steel, LLC | Specialty Manufacturer of Vinyl-Clad Metal | |||||||||||||||||||||||||||||||||||||||||||
| Secured Debt | (9) | 12/20/2016 | 13.23% | SF+ | 9.00% | 1/15/2024 | 2,620 | 2,620 | 2,620 | |||||||||||||||||||||||||||||||||||
| Secured Debt | 12/20/2016 | 10.00% | 12/20/2036 | 262 | 260 | 260 | ||||||||||||||||||||||||||||||||||||||
| Member Units | (8) | 12/20/2016 | 179 | 1,820 | 2,060 | |||||||||||||||||||||||||||||||||||||||
| Member Units | (23) | 12/20/2016 | 200 | 53 | 152 | |||||||||||||||||||||||||||||||||||||||
| 4,753 | 5,092 | |||||||||||||||||||||||||||||||||||||||||||
| Cody Pools, Inc. | Designer of Residential and Commercial Pools | |||||||||||||||||||||||||||||||||||||||||||
| Secured Debt | (9) | 03/06/2020 | 15.38% | L+ | 10.50% | 12/17/2026 | 273 | 261 | 273 | |||||||||||||||||||||||||||||||||||
| Secured Debt | (9) | 03/06/2020 | 15.38% | L+ | 10.50% | 12/17/2026 | 6,882 | 6,786 | 6,882 | |||||||||||||||||||||||||||||||||||
| Preferred Member Units | (8) (23) | 03/06/2020 | 147 | 2,079 | 14,550 | |||||||||||||||||||||||||||||||||||||||
| 9,126 | 21,705 | |||||||||||||||||||||||||||||||||||||||||||
| Colonial Electric Company LLC | Provider of Electrical Contracting Services | |||||||||||||||||||||||||||||||||||||||||||
| Secured Debt | 03/31/2021 | 3/31/2026 | — | — | — | |||||||||||||||||||||||||||||||||||||||
| Secured Debt | 03/31/2021 | 12.00% | 3/31/2026 | 5,828 | 5,729 | 5,729 | ||||||||||||||||||||||||||||||||||||||
| Preferred Member Units | (8) | 03/31/2021 | 4,320 | 1,920 | 2,290 | |||||||||||||||||||||||||||||||||||||||
| 7,649 | 8,019 | |||||||||||||||||||||||||||||||||||||||||||
| Datacom, LLC | Technology and Telecommunications Provider | |||||||||||||||||||||||||||||||||||||||||||
| Secured Debt | 03/01/2022 | 7.50% | 12/31/2025 | 25 | 25 | 25 | ||||||||||||||||||||||||||||||||||||||
| Secured Debt | 03/31/2021 | 7.50% | 12/31/2025 | 958 | 895 | 865 | ||||||||||||||||||||||||||||||||||||||
| Preferred Member Units | (8) | 03/31/2021 | 1,000 | 290 | 300 | |||||||||||||||||||||||||||||||||||||||
| 1,210 | 1,190 | |||||||||||||||||||||||||||||||||||||||||||
| Digital Products Holdings LLC | Designer and Distributor of Consumer Electronics | |||||||||||||||||||||||||||||||||||||||||||
| Secured Debt | (9) | 04/01/2018 | 14.13% | L+ | 10.00% | 4/1/2023 | 3,883 | 3,878 | 3,878 | |||||||||||||||||||||||||||||||||||
| Preferred Member Units | (8) | 04/01/2018 | 964 | 2,375 | 2,459 | |||||||||||||||||||||||||||||||||||||||
| 6,253 | 6,337 | |||||||||||||||||||||||||||||||||||||||||||
| Direct Marketing Solutions, Inc. | Provider of Omni-Channel Direct Marketing Services | |||||||||||||||||||||||||||||||||||||||||||
| Secured Debt | (9) | 02/13/2018 | L+ | 11.00% | 2/13/2026 | — | (5) | — | ||||||||||||||||||||||||||||||||||||
| Secured Debt | (9) | 12/27/2022 | 15.13% | L+ | 11.00% | 2/13/2026 | 5,352 | 5,306 | 5,352 | |||||||||||||||||||||||||||||||||||
| Portfolio Company (1) (20) | Business Description | Type of Investment (2) (3) (15) | Investment Date (22) | Shares/Units | Total Rate | Reference Rate and Spread (25) | PIK Rate (19) | Maturity Date | Principal (4) | Cost (4) | Fair Value (18) | |||||||||||||||||||||||||||||||||
| Preferred Stock | (8) | 02/13/2018 | 2,100 | 2,100 | 5,558 | |||||||||||||||||||||||||||||||||||||||
| 7,401 | 10,910 | |||||||||||||||||||||||||||||||||||||||||||
| Flame King Holdings, LLC | Propane Tank and Accessories Distributor | |||||||||||||||||||||||||||||||||||||||||||
| Secured Debt | (9) | 10/29/2021 | 10.75% | L+ | 6.50% | 10/31/2026 | 1,900 | 1,885 | 1,900 | |||||||||||||||||||||||||||||||||||
| Secured Debt | (9) | 10/29/2021 | 13.25% | L+ | 9.00% | 10/31/2026 | 5,300 | 5,175 | 5,300 | |||||||||||||||||||||||||||||||||||
| Preferred Equity | (8) | 10/29/2021 | 2,340 | 2,600 | 4,400 | |||||||||||||||||||||||||||||||||||||||
| 9,660 | 11,600 | |||||||||||||||||||||||||||||||||||||||||||
| Freeport Financial Funds | (12) (13) | Investment Partnership | ||||||||||||||||||||||||||||||||||||||||||
| LP Interests (Freeport First Lien Loan Fund III LP) | (8) (24) | 07/31/2015 | 6.0% | 6,303 | 5,848 | |||||||||||||||||||||||||||||||||||||||
| Gamber-Johnson Holdings, LLC | Manufacturer of Ruggedized Computer Mounting Systems | |||||||||||||||||||||||||||||||||||||||||||
| Secured Debt | (9) | 06/24/2016 | SF+ | 8.50% | 1/1/2028 | — | — | — | ||||||||||||||||||||||||||||||||||||
| Secured Debt | (9) | 12/15/2022 | 11.50% | SF+ | 8.50% | 1/1/2028 | 16,020 | 15,747 | 16,020 | |||||||||||||||||||||||||||||||||||
| Member Units | (8) | 06/24/2016 | 2,261 | 4,423 | 12,720 | |||||||||||||||||||||||||||||||||||||||
| 20,170 | 28,740 | |||||||||||||||||||||||||||||||||||||||||||
| GFG Group, LLC | Grower and Distributor of a Variety of Plants and Products to Other Wholesalers, Retailers and Garden Centers | |||||||||||||||||||||||||||||||||||||||||||
| Secured Debt | 03/31/2021 | 9.00% | 3/31/2026 | 2,836 | 2,779 | 2,836 | ||||||||||||||||||||||||||||||||||||||
| Preferred Member Units | (8) | 03/31/2021 | 56 | 1,225 | 1,790 | |||||||||||||||||||||||||||||||||||||||
| 4,004 | 4,626 | |||||||||||||||||||||||||||||||||||||||||||
| Gulf Publishing Holdings, LLC | Energy Industry Focused Media and Publishing | |||||||||||||||||||||||||||||||||||||||||||
| Secured Debt | (9) | 09/29/2017 | L+ | 9.50% | 7/1/2027 | — | — | — | ||||||||||||||||||||||||||||||||||||
| Secured Debt | 07/01/2022 | 12.50% | 7/1/2027 | 600 | 600 | 571 | ||||||||||||||||||||||||||||||||||||||
| Preferred Equity | 07/01/2022 | 15,930 | 1,400 | 950 | ||||||||||||||||||||||||||||||||||||||||
| Member Units | 04/29/2016 | 920 | 920 | — | ||||||||||||||||||||||||||||||||||||||||
| 2,920 | 1,521 | |||||||||||||||||||||||||||||||||||||||||||
| Harris Preston Fund Investments | (12) (13) | Investment Partnership | ||||||||||||||||||||||||||||||||||||||||||
| LP Interests (HPEP 3, L.P.) | (24) | 08/09/2017 | 8.2% | 2,558 | 4,331 | |||||||||||||||||||||||||||||||||||||||
| Kickhaefer Manufacturing Company, LLC | Precision Metal Parts Manufacturing | |||||||||||||||||||||||||||||||||||||||||||
| Secured Debt | 10/31/2018 | 11.50% | 10/31/2023 | 5,104 | 5,075 | 5,093 | ||||||||||||||||||||||||||||||||||||||
| Secured Debt | 10/31/2018 | 9.00% | 10/31/2048 | 970 | 961 | 961 | ||||||||||||||||||||||||||||||||||||||
| Preferred Equity | 10/31/2018 | 145 | 3,060 | 1,800 | ||||||||||||||||||||||||||||||||||||||||
| Member Units | (8) (23) | 10/31/2018 | 200 | 248 | 713 | |||||||||||||||||||||||||||||||||||||||
| 9,344 | 8,567 | |||||||||||||||||||||||||||||||||||||||||||
| Market Force Information, LLC | Provider of Customer Experience Management Services | |||||||||||||||||||||||||||||||||||||||||||
| Secured Debt | (14) | 07/28/2017 | 12.00% | 12.00% | 7/28/2023 | 6,520 | 6,463 | 403 | ||||||||||||||||||||||||||||||||||||
| Member Units | 07/28/2017 | 185,980 | 4,160 | — | ||||||||||||||||||||||||||||||||||||||||
| 10,623 | 403 | |||||||||||||||||||||||||||||||||||||||||||
| MH Corbin Holding LLC | Manufacturer and Distributor of Traffic Safety Products | |||||||||||||||||||||||||||||||||||||||||||
| Portfolio Company (1) (20) | Business Description | Type of Investment (2) (3) (15) | Investment Date (22) | Shares/Units | Total Rate | Reference Rate and Spread (25) | PIK Rate (19) | Maturity Date | Principal (4) | Cost (4) | Fair Value (18) | |||||||||||||||||||||||||||||||||
| Secured Debt | 08/31/2015 | 13.00% | 12/31/2022 | 1,539 | 1,539 | 1,137 | ||||||||||||||||||||||||||||||||||||||
| Preferred Member Units | 03/15/2019 | 16,500 | 1,100 | — | ||||||||||||||||||||||||||||||||||||||||
| Preferred Member Units | 09/01/2015 | 1,000 | 1,500 | — | ||||||||||||||||||||||||||||||||||||||||
| 4,139 | 1,137 | |||||||||||||||||||||||||||||||||||||||||||
| Mystic Logistics Holdings, LLC | Logistics and Distribution Services Provider for Large Volume Mailers | |||||||||||||||||||||||||||||||||||||||||||
| Secured Debt | 08/18/2014 | 1/31/2024 | — | — | — | |||||||||||||||||||||||||||||||||||||||
| Secured Debt | 08/18/2014 | 10.00% | 1/31/2024 | 1,436 | 1,436 | 1,436 | ||||||||||||||||||||||||||||||||||||||
| Common Stock | (8) | 08/18/2014 | 1,468 | 680 | 5,708 | |||||||||||||||||||||||||||||||||||||||
| 2,116 | 7,144 | |||||||||||||||||||||||||||||||||||||||||||
| NexRev LLC | Provider of Energy Efficiency Products & Services | |||||||||||||||||||||||||||||||||||||||||||
| Secured Debt | 02/28/2018 | 2/28/2025 | — | — | — | |||||||||||||||||||||||||||||||||||||||
| Secured Debt | 02/28/2018 | 11.00% | 2/28/2025 | 2,866 | 2,828 | 2,119 | ||||||||||||||||||||||||||||||||||||||
| Preferred Member Units | (8) | 02/28/2018 | 25,786,046 | 2,053 | 280 | |||||||||||||||||||||||||||||||||||||||
| 4,881 | 2,399 | |||||||||||||||||||||||||||||||||||||||||||
| NuStep, LLC | Designer, Manufacturer and Distributor of Fitness Equipment | |||||||||||||||||||||||||||||||||||||||||||
| Secured Debt | (9) | 01/31/2017 | 10.63% | L+ | 6.50% | 1/31/2025 | 1,100 | 1,097 | 1,100 | |||||||||||||||||||||||||||||||||||
| Secured Debt | 01/31/2017 | 12.00% | 1/31/2025 | 4,610 | 4,603 | 4,603 | ||||||||||||||||||||||||||||||||||||||
| Preferred Member Units | 11/02/2022 | 515 | 515 | 1,290 | ||||||||||||||||||||||||||||||||||||||||
| Preferred Member Units | 01/31/2017 | 102 | 2,550 | 2,010 | ||||||||||||||||||||||||||||||||||||||||
| 8,765 | 9,003 | |||||||||||||||||||||||||||||||||||||||||||
| Oneliance, LLC | Construction Cleaning Company | |||||||||||||||||||||||||||||||||||||||||||
| Secured Debt | (9) | 08/06/2021 | 15.13% | L+ | 11.00% | 8/6/2026 | 1,400 | 1,380 | 1,380 | |||||||||||||||||||||||||||||||||||
| Preferred Stock | 08/06/2021 | 264 | 264 | 264 | ||||||||||||||||||||||||||||||||||||||||
| 1,644 | 1,644 | |||||||||||||||||||||||||||||||||||||||||||
| Orttech Holdings, LLC | Distributor of Industrial Clutches, Brakes and Other Components | |||||||||||||||||||||||||||||||||||||||||||
| Secured Debt | (9) | 07/30/2021 | L+ | 11.00% | 7/31/2026 | — | (2) | (2) | ||||||||||||||||||||||||||||||||||||
| Secured Debt | (9) | 07/30/2021 | 15.13% | L+ | 11.00% | 7/31/2026 | 5,900 | 5,814 | 5,814 | |||||||||||||||||||||||||||||||||||
| Preferred Stock | (8) (23) | 07/30/2021 | 2,500 | 2,500 | 2,940 | |||||||||||||||||||||||||||||||||||||||
| 8,312 | 8,752 | |||||||||||||||||||||||||||||||||||||||||||
| Robbins Bros. Jewelry, Inc. | Bridal Jewelry Retailer | |||||||||||||||||||||||||||||||||||||||||||
| Secured Debt | (9) | 12/15/2021 | 12/15/2026 | — | (8) | (8) | ||||||||||||||||||||||||||||||||||||||
| Secured Debt | (9) | 12/15/2021 | 12.50% | 12/15/2026 | 3,965 | 3,902 | 3,902 | |||||||||||||||||||||||||||||||||||||
| Preferred Equity | 12/15/2021 | 1,230 | 1,230 | 1,650 | ||||||||||||||||||||||||||||||||||||||||
| 5,124 | 5,544 | |||||||||||||||||||||||||||||||||||||||||||
| SI East, LLC | Rigid Industrial Packaging Manufacturing | |||||||||||||||||||||||||||||||||||||||||||
| Secured Debt | 08/31/2018 | 8/31/2023 | — | — | — | |||||||||||||||||||||||||||||||||||||||
| Secured Debt | 08/31/2018 | 9.50% | 8/31/2023 | 29,929 | 29,795 | 29,929 | ||||||||||||||||||||||||||||||||||||||
| Preferred Member Units | (8) | 08/31/2018 | 52 | 406 | 4,550 | |||||||||||||||||||||||||||||||||||||||
| 30,201 | 34,479 | |||||||||||||||||||||||||||||||||||||||||||
| Sonic Systems International, LLC | (10) | Nuclear Power Staffing Services | ||||||||||||||||||||||||||||||||||||||||||
| Secured Debt | (9) | 08/20/2021 | 11.24% | L+ | 7.50% | 8/20/2026 | 18,425 | 18,143 | 18,425 | |||||||||||||||||||||||||||||||||||
| Common Stock | 08/20/2021 | 11,647 | 1,584 | 1,490 | ||||||||||||||||||||||||||||||||||||||||
| 19,727 | 19,915 | |||||||||||||||||||||||||||||||||||||||||||
| Student Resource Center, LLC | (10) | Higher Education Services | ||||||||||||||||||||||||||||||||||||||||||
| Portfolio Company (1) (20) | Business Description | Type of Investment (2) (3) (15) | Investment Date (22) | Shares/Units | Total Rate | Reference Rate and Spread (25) | PIK Rate (19) | Maturity Date | Principal (4) | Cost (4) | Fair Value (18) | |||||||||||||||||||||||||||||||||
| Secured Debt | 12/31/2022 | 13.27% | L+ | 8.50% | 12/31/2027 | 5,556 | 5,063 | 5,063 | ||||||||||||||||||||||||||||||||||||
| Preferred Equity | 12/31/2022 | 6,564,055 | — | — | ||||||||||||||||||||||||||||||||||||||||
| 5,063 | 5,063 | |||||||||||||||||||||||||||||||||||||||||||
| Tedder Industries, LLC | Manufacturer of Firearm Holsters and Accessories | |||||||||||||||||||||||||||||||||||||||||||
| Secured Debt | 08/31/2018 | 12.00% | 8/31/2023 | 460 | 460 | 460 | ||||||||||||||||||||||||||||||||||||||
| Secured Debt | 08/31/2018 | 12.00% | 8/31/2023 | 3,800 | 3,797 | 3,780 | ||||||||||||||||||||||||||||||||||||||
| Preferred Member Units | 08/31/2018 | 136 | 2,311 | 1,920 | ||||||||||||||||||||||||||||||||||||||||
| 6,568 | 6,160 | |||||||||||||||||||||||||||||||||||||||||||
| Trantech Radiator Topco, LLC | Transformer Cooling Products and Services | |||||||||||||||||||||||||||||||||||||||||||
| Secured Debt | 05/31/2019 | 5/31/2024 | — | (3) | — | |||||||||||||||||||||||||||||||||||||||
| Secured Debt | 05/31/2019 | 12.00% | 5/31/2024 | 1,980 | 1,960 | 1,980 | ||||||||||||||||||||||||||||||||||||||
| Common Stock | (8) | 05/31/2019 | 154 | 1,164 | 1,950 | |||||||||||||||||||||||||||||||||||||||
| 3,121 | 3,930 | |||||||||||||||||||||||||||||||||||||||||||
| VVS Holdco LLC | Omnichannel Retailer of Animal Health Products | |||||||||||||||||||||||||||||||||||||||||||
| Secured Debt | (9) (23) | 12/01/2021 | L+ | 6.00% | 12/1/2023 | — | (5) | (5) | ||||||||||||||||||||||||||||||||||||
| Secured Debt | (23) | 12/01/2021 | 11.50% | 12/1/2026 | 7,600 | 7,421 | 7,421 | |||||||||||||||||||||||||||||||||||||
| Preferred Equity | (8) (23) | 12/01/2021 | 2,960 | 2,960 | 2,990 | |||||||||||||||||||||||||||||||||||||||
| 10,376 | 10,406 | |||||||||||||||||||||||||||||||||||||||||||
| Subtotal Affiliate Investments (45.4% of net assets at fair value) | $ | 241,565 | $ | 277,000 | ||||||||||||||||||||||||||||||||||||||||
| Non-Control Investments (7) | ||||||||||||||||||||||||||||||||||||||||||||
| AAC Holdings, Inc. | (11) | Substance Abuse Treatment Service Provider | ||||||||||||||||||||||||||||||||||||||||||
| Secured Debt | 12/11/2020 | 18.00% | 18.00% | 6/25/2025 | $ | 4,173 | $ | 3,963 | $ | 4,110 | ||||||||||||||||||||||||||||||||||
| Common Stock | 12/11/2020 | 593,927 | 3,148 | — | ||||||||||||||||||||||||||||||||||||||||
| Warrants | (27) | 12/11/2020 | 197,717 | 12/11/2025 | — | — | ||||||||||||||||||||||||||||||||||||||
| 7,111 | 4,110 | |||||||||||||||||||||||||||||||||||||||||||
| AB Centers Acquisition Corporation | (10) | Applied Behavior Analysis Therapy Provider | ||||||||||||||||||||||||||||||||||||||||||
| Secured Debt | (9) | 09/06/2022 | SF+ | 6.00% | 9/6/2028 | — | (5) | (5) | ||||||||||||||||||||||||||||||||||||
| Secured Debt | (9) | 09/06/2022 | 10.20% | SF+ | 6.00% | 9/6/2028 | 86 | 77 | 86 | |||||||||||||||||||||||||||||||||||
| Secured Debt | (9) | 09/06/2022 | 10.58% | SF+ | 6.00% | 9/6/2028 | 1,983 | 1,930 | 1,983 | |||||||||||||||||||||||||||||||||||
| 2,002 | 2,064 | |||||||||||||||||||||||||||||||||||||||||||
| Acumera, Inc. | (10) | Managed Security Service Provider | ||||||||||||||||||||||||||||||||||||||||||
| Secured Debt | (9) | 06/28/2022 | 13.88% | L+ | 9.50% | 10/26/2027 | 4,616 | 4,511 | 4,616 | |||||||||||||||||||||||||||||||||||
| Secured Debt | (9) | 06/28/2022 | 13.57% | L+ | 9.00% | 10/26/2027 | 1,379 | 1,348 | 1,379 | |||||||||||||||||||||||||||||||||||
| 5,859 | 5,995 | |||||||||||||||||||||||||||||||||||||||||||
| Adams Publishing Group, LLC | (10) | Local Newspaper Operator | ||||||||||||||||||||||||||||||||||||||||||
| Secured Debt | (9) (28) | 03/11/2022 | 10.00% | L+ | 6.00% | 3/11/2027 | 565 | 565 | 565 | |||||||||||||||||||||||||||||||||||
| Secured Debt | (9) (28) | 03/11/2022 | 10.00% | L+ | 7.50% | 3/11/2027 | 2,826 | 2,819 | 2,826 | |||||||||||||||||||||||||||||||||||
| 3,384 | 3,391 | |||||||||||||||||||||||||||||||||||||||||||
| ADS Tactical, Inc. | (11) | Value-Added Logistics and Supply Chain Provider to the Defense Industry | ||||||||||||||||||||||||||||||||||||||||||
| Secured Debt | (9) | 03/29/2021 | 10.14% | L+ | 5.75% | 3/19/2026 | 9,125 | 8,996 | 8,213 | |||||||||||||||||||||||||||||||||||
| AMEREQUIP LLC. | (10) | Full Service Provider of Comprehensive Commercial Production Services, Including the Design, Engineering, and Manufacturing of Products It | ||||||||||||||||||||||||||||||||||||||||||
| Portfolio Company (1) (20) | Business Description | Type of Investment (2) (3) (15) | Investment Date (22) | Shares/Units | Total Rate | Reference Rate and Spread (25) | PIK Rate (19) | Maturity Date | Principal (4) | Cost (4) | Fair Value (18) | |||||||||||||||||||||||||||||||||
| Secured Debt | (9) | 08/31/2022 | SF+ | 7.40% | 8/31/2027 | — | — | — | ||||||||||||||||||||||||||||||||||||
| Secured Debt | (9) | 08/31/2022 | 11.72% | SF+ | 7.40% | 8/31/2027 | 2,026 | 2,026 | 2,025 | |||||||||||||||||||||||||||||||||||
| Common Stock | 08/31/2022 | 11 | 80 | 80 | ||||||||||||||||||||||||||||||||||||||||
| 2,106 | 2,105 | |||||||||||||||||||||||||||||||||||||||||||
| American Health Staffing Group, Inc. | (10) | Healthcare Temporary Staffing | ||||||||||||||||||||||||||||||||||||||||||
| Secured Debt | (9) | 11/19/2021 | L+ | 6.00% | 11/19/2026 | — | (13) | (13) | ||||||||||||||||||||||||||||||||||||
| Secured Debt | (9) | 11/19/2021 | 11.12% | L+ | 6.00% | 11/19/2026 | 8,271 | 8,206 | 8,271 | |||||||||||||||||||||||||||||||||||
| 8,193 | 8,258 | |||||||||||||||||||||||||||||||||||||||||||
| American Nuts, LLC | (10) | Roaster, Mixer and Packager of Bulk Nuts and Seeds | ||||||||||||||||||||||||||||||||||||||||||
| Secured Debt | (9) | 03/11/2022 | 10.46% | SF+ | 6.75% | 4/10/2026 | 4,438 | 4,416 | 4,148 | |||||||||||||||||||||||||||||||||||
| Secured Debt | (9) | 03/11/2022 | 12.46% | SF+ | 8.75% | 4/10/2026 | 4,438 | 4,417 | 4,161 | |||||||||||||||||||||||||||||||||||
| 8,833 | 8,309 | |||||||||||||||||||||||||||||||||||||||||||
| American Teleconferencing Services, Ltd. | (11) | Provider of Audio Conferencing and Video Collaboration Solutions | ||||||||||||||||||||||||||||||||||||||||||
| Secured Debt | (14) | 09/17/2021 | 7.50% | L+ | 6.50% | 1/31/2023 | 2,425 | 2,375 | 136 | |||||||||||||||||||||||||||||||||||
| Secured Debt | (9) (14) | 05/19/2016 | 7.50% | L+ | 6.50% | 6/8/2023 | 11,693 | 11,451 | 658 | |||||||||||||||||||||||||||||||||||
| 13,826 | 794 | |||||||||||||||||||||||||||||||||||||||||||
| ArborWorks, LLC | (10) | Vegetation Management Services | ||||||||||||||||||||||||||||||||||||||||||
| Secured Debt | (9) | 11/09/2021 | 13.41% | L+ | 9.00% | 11/9/2026 | 2,484 | 2,427 | 2,095 | |||||||||||||||||||||||||||||||||||
| Secured Debt | (9) | 11/09/2021 | 13.56% | L+ | 9.00% | 11/9/2026 | 15,786 | 15,540 | 13,313 | |||||||||||||||||||||||||||||||||||
| Common Equity | 11/09/2021 | 124 | 124 | — | ||||||||||||||||||||||||||||||||||||||||
| 18,091 | 15,408 | |||||||||||||||||||||||||||||||||||||||||||
| Archer Systems, LLC | (10) | Mass Tort Settlement Administration Solutions Provider | ||||||||||||||||||||||||||||||||||||||||||
| Secured Debt | (9) | 08/11/2022 | SF+ | 6.50% | 8/11/2027 | — | (4) | (4) | ||||||||||||||||||||||||||||||||||||
| Secured Debt | (9) | 08/11/2022 | 10.92% | SF+ | 6.50% | 8/11/2027 | 2,205 | 2,165 | 2,170 | |||||||||||||||||||||||||||||||||||
| Common Stock | 08/11/2022 | 62,402 | 62 | 62 | ||||||||||||||||||||||||||||||||||||||||
| 2,223 | 2,228 | |||||||||||||||||||||||||||||||||||||||||||
| ATS Operating, LLC | (10) | For-Profit Thrift Retailer | ||||||||||||||||||||||||||||||||||||||||||
| Secured Debt | (9) | 01/18/2022 | SF+ | 5.50% | 1/18/2027 | — | — | — | ||||||||||||||||||||||||||||||||||||
| Secured Debt | (9) | 01/18/2022 | 9.32% | SF+ | 5.50% | 1/18/2027 | 925 | 907 | 914 | |||||||||||||||||||||||||||||||||||
| Secured Debt | (9) | 01/18/2022 | 11.32% | SF+ | 7.50% | 1/18/2027 | 925 | 907 | 916 | |||||||||||||||||||||||||||||||||||
| Common Stock | 01/18/2022 | 100,000 | 100 | 90 | ||||||||||||||||||||||||||||||||||||||||
| 1,914 | 1,920 | |||||||||||||||||||||||||||||||||||||||||||
| AVEX Aviation Holdings, LLC | (10) | Specialty Aircraft Dealer | ||||||||||||||||||||||||||||||||||||||||||
| Secured Debt | (9) | 12/23/2022 | SF+ | 7.25% | 12/23/2027 | — | (8) | (8) | ||||||||||||||||||||||||||||||||||||
| Secured Debt | (9) | 12/23/2022 | 12.17% | SF+ | 7.25% | 12/23/2027 | 4,038 | 3,876 | 3,876 | |||||||||||||||||||||||||||||||||||
| Common Equity | 12/15/2021 | 50 | 50 | 56 | ||||||||||||||||||||||||||||||||||||||||
| 3,918 | 3,924 | |||||||||||||||||||||||||||||||||||||||||||
| BBB Tank Services, LLC | Maintenance, Repair and Construction Services to the Above-Ground Storage Tank Market | |||||||||||||||||||||||||||||||||||||||||||
| Unsecured Debt | (9) (17) | 04/08/2016 | 15.12% | L+ | 11.00% | 4/8/2021 | 200 | 200 | 200 | |||||||||||||||||||||||||||||||||||
| Unsecured Debt | (9) (17) | 04/08/2016 | 15.12% | L+ | 11.00% | 4/8/2021 | 1,000 | 1,000 | 522 | |||||||||||||||||||||||||||||||||||
| Preferred Stock (non-voting) | 12/17/2018 | 15.00% | 41 | — | ||||||||||||||||||||||||||||||||||||||||
| Member Units | 04/08/2016 | 200,000 | 200 | — | ||||||||||||||||||||||||||||||||||||||||
| 1,441 | 722 | |||||||||||||||||||||||||||||||||||||||||||
| Berry Aviation, Inc. | (10) | Charter Airline Services | ||||||||||||||||||||||||||||||||||||||||||
| Portfolio Company (1) (20) | Business Description | Type of Investment (2) (3) (15) | Investment Date (22) | Shares/Units | Total Rate | Reference Rate and Spread (25) | PIK Rate (19) | Maturity Date | Principal (4) | Cost (4) | Fair Value (18) | |||||||||||||||||||||||||||||||||
| Secured Debt | 07/06/2018 | 12.00% | 1.50% | 1/6/2024 | 190 | 189 | 190 | |||||||||||||||||||||||||||||||||||||
| Preferred Member Units | (8) (23) | 11/12/2019 | 122,416 | 16.00% | — | 270 | ||||||||||||||||||||||||||||||||||||||
| Preferred Member Units | (8) (23) | 07/06/2018 | 1,548,387 | 8.00% | 8.00% | 1,161 | 4,561 | |||||||||||||||||||||||||||||||||||||
| 1,350 | 5,021 | |||||||||||||||||||||||||||||||||||||||||||
| Bettercloud, Inc. | (10) | SaaS Provider of Workflow Management and Business Application Solutions | ||||||||||||||||||||||||||||||||||||||||||
| Secured Debt | (9) | 06/30/2022 | SF+ | 1.00% | 6.00% | 6/30/2028 | — | (22) | (22) | |||||||||||||||||||||||||||||||||||
| Secured Debt | (9) | 06/30/2022 | 11.40% | SF+ | 1.00% | 6.00% | 6/30/2028 | 7,991 | 7,848 | 7,991 | ||||||||||||||||||||||||||||||||||
| 7,826 | 7,969 | |||||||||||||||||||||||||||||||||||||||||||
| Binswanger Enterprises, LLC | (10) | Glass Repair and Installation Service Provider | ||||||||||||||||||||||||||||||||||||||||||
| Member Units | 03/10/2017 | 1,050,000 | 1,050 | 420 | ||||||||||||||||||||||||||||||||||||||||
| Bluestem Brands, Inc. | (11) | Multi-Channel Retailer of General Merchandise | ||||||||||||||||||||||||||||||||||||||||||
| Secured Debt | (9) | 10/19/2022 | L+ | 8.50% | 8/28/2025 | — | — | — | ||||||||||||||||||||||||||||||||||||
| Secured Debt | (9) | 08/28/2020 | 12.94% | L+ | 8.50% | 8/28/2025 | 3,473 | 2,455 | 3,366 | |||||||||||||||||||||||||||||||||||
| Common Stock | (8) | 10/01/2020 | 700,446 | — | 4,708 | |||||||||||||||||||||||||||||||||||||||
| Warrants | (27) | 10/19/2022 | 175,110 | 10/19/2032 | 1,111 | 1,173 | ||||||||||||||||||||||||||||||||||||||
| 3,566 | 9,247 | |||||||||||||||||||||||||||||||||||||||||||
| Boccella Precast Products LLC | Manufacturer of Precast Hollow Core Concrete | |||||||||||||||||||||||||||||||||||||||||||
| Secured Debt | 09/23/2021 | 10.00% | 2/28/2027 | 80 | 80 | 80 | ||||||||||||||||||||||||||||||||||||||
| Member Units | (8) | 06/30/2017 | 540,000 | 564 | 741 | |||||||||||||||||||||||||||||||||||||||
| 644 | 821 | |||||||||||||||||||||||||||||||||||||||||||
| Brightwood Capital Fund Investments | (12) (13) | Investment Partnership | ||||||||||||||||||||||||||||||||||||||||||
| LP Interests (Brightwood Capital Fund III, LP) | (8) (24) | 07/21/2014 | 0.5% | 2,449 | 1,576 | |||||||||||||||||||||||||||||||||||||||
| LP Interests (Brightwood Capital Fund IV, LP) | (8) (24) | 10/26/2016 | 1.2% | 8,737 | 9,082 | |||||||||||||||||||||||||||||||||||||||
| 11,186 | 10,658 | |||||||||||||||||||||||||||||||||||||||||||
| Buca C, LLC | Casual Restaurant Group | |||||||||||||||||||||||||||||||||||||||||||
| Secured Debt | 06/30/2015 | 9.00% | 6/30/2023 | 11,740 | 11,740 | 8,345 | ||||||||||||||||||||||||||||||||||||||
| Preferred Member Units | 06/30/2015 | 4 | 6.00% | 6.00% | 3,040 | — | ||||||||||||||||||||||||||||||||||||||
| 14,780 | 8,345 | |||||||||||||||||||||||||||||||||||||||||||
| Burning Glass Intermediate Holding Company, Inc. | (10) | Provider of Skills-Based Labor Market Analytics | ||||||||||||||||||||||||||||||||||||||||||
| Secured Debt | (9) | 06/14/2021 | L+ | 5.00% | 6/10/2026 | — | (19) | — | ||||||||||||||||||||||||||||||||||||
| Secured Debt | (9) | 06/14/2021 | 8.91% | L+ | 5.00% | 6/10/2028 | 13,255 | 13,070 | 13,255 | |||||||||||||||||||||||||||||||||||
| 13,051 | 13,255 | |||||||||||||||||||||||||||||||||||||||||||
| Cadence Aerospace LLC | (10) | Aerostructure Manufacturing | ||||||||||||||||||||||||||||||||||||||||||
| Secured Debt | (9) (30) | 11/14/2017 | 11.99% | L+ | 8.50% | 0.01% | 11/14/2023 | 20,112 | 20,066 | 20,112 | ||||||||||||||||||||||||||||||||||
| CAI Software LLC | Provider of Specialized Enterprise Resource Planning Software | |||||||||||||||||||||||||||||||||||||||||||
| Preferred Equity | (8) | 12/13/2021 | 379,338 | 379 | 379 | |||||||||||||||||||||||||||||||||||||||
| Preferred Equity | 12/13/2021 | 126,446 | — | — | ||||||||||||||||||||||||||||||||||||||||
| Portfolio Company (1) (20) | Business Description | Type of Investment (2) (3) (15) | Investment Date (22) | Shares/Units | Total Rate | Reference Rate and Spread (25) | PIK Rate (19) | Maturity Date | Principal (4) | Cost (4) | Fair Value (18) | |||||||||||||||||||||||||||||||||
| 379 | 379 | |||||||||||||||||||||||||||||||||||||||||||
| Camin Cargo Control, Inc. | (11) | Provider of Mission Critical Inspection, Testing and Fuel Treatment Services | ||||||||||||||||||||||||||||||||||||||||||
| Secured Debt | (9) | 06/14/2021 | 10.88% | L+ | 6.50% | 6/4/2026 | 7,609 | 7,553 | 7,342 | |||||||||||||||||||||||||||||||||||
| Career Team Holdings, LLC | Provider of Workforce Training and Career Development Services | |||||||||||||||||||||||||||||||||||||||||||
| Secured Debt | (9) | 12/17/2021 | L+ | 6.00% | 12/17/2026 | — | (3) | (3) | ||||||||||||||||||||||||||||||||||||
| Secured Debt | 12/17/2021 | 12.50% | 12/17/2026 | 2,250 | 2,196 | 2,196 | ||||||||||||||||||||||||||||||||||||||
| Common Stock | 12/17/2021 | 50,000 | 500 | 500 | ||||||||||||||||||||||||||||||||||||||||
| 2,693 | 2,693 | |||||||||||||||||||||||||||||||||||||||||||
| CaseWorthy, Inc. | (10) | SaaS Provider of Case Management Solutions | ||||||||||||||||||||||||||||||||||||||||||
| Secured Debt | (9) | 05/18/2022 | L+ | 6.00% | 5/18/2027 | — | (4) | (4) | ||||||||||||||||||||||||||||||||||||
| Secured Debt | (9) | 05/18/2022 | 10.73% | L+ | 6.00% | 5/18/2027 | 2,600 | 2,574 | 2,574 | |||||||||||||||||||||||||||||||||||
| Secured Debt | (9) | 05/18/2022 | 10.48% | L+ | 5.75% | 5/18/2027 | 1,995 | 1,977 | 1,995 | |||||||||||||||||||||||||||||||||||
| Common Equity | 12/30/2022 | 80,000 | 80 | 80 | ||||||||||||||||||||||||||||||||||||||||
| 4,627 | 4,645 | |||||||||||||||||||||||||||||||||||||||||||
| Channel Partners Intermediateco, LLC | (10) | Outsourced Consumer Services Provider | ||||||||||||||||||||||||||||||||||||||||||
| Secured Debt | (9) (34) | 02/07/2022 | 10.72% | SF+ | 6.25% | 2/7/2027 | 172 | 162 | 169 | |||||||||||||||||||||||||||||||||||
| Secured Debt | (9) (35) | 02/07/2022 | 10.71% | SF+ | 6.25% | 2/7/2027 | 3,591 | 3,530 | 3,539 | |||||||||||||||||||||||||||||||||||
| 3,692 | 3,708 | |||||||||||||||||||||||||||||||||||||||||||
| Clarius BIGS, LLC | (10) | Prints & Advertising Film Financing | ||||||||||||||||||||||||||||||||||||||||||
| Secured Debt | (14) (17) | 09/23/2014 | 15.00% | 15.00% | 1/5/2015 | 2,747 | 2,403 | 19 | ||||||||||||||||||||||||||||||||||||
| Classic H&G Holdings, LLC | Provider of Engineered Packaging Solutions | |||||||||||||||||||||||||||||||||||||||||||
| Secured Debt | (9) | 03/12/2020 | 9.75% | L+ | 6.00% | 3/12/2025 | 1,140 | 1,127 | 1,140 | |||||||||||||||||||||||||||||||||||
| Secured Debt | 03/12/2020 | 8.00% | 3/12/2025 | 4,819 | 4,754 | 4,819 | ||||||||||||||||||||||||||||||||||||||
| Preferred Member Units | (8) | 03/12/2020 | 39 | 1,440 | 6,160 | |||||||||||||||||||||||||||||||||||||||
| 7,321 | 12,119 | |||||||||||||||||||||||||||||||||||||||||||
| Computer Data Source, LLC | (10) | Third Party Maintenance Provider to the Data Center Ecosystem | ||||||||||||||||||||||||||||||||||||||||||
| Secured Debt | (9) (36) | 08/06/2021 | 12.56% | L+ | 8.00% | 8/6/2026 | 4,167 | 4,106 | 3,851 | |||||||||||||||||||||||||||||||||||
| Secured Debt | (9) | 08/06/2021 | 12.56% | L+ | 8.00% | 8/6/2026 | 15,604 | 15,374 | 14,421 | |||||||||||||||||||||||||||||||||||
| 19,480 | 18,272 | |||||||||||||||||||||||||||||||||||||||||||
| Construction Supply Investments, LLC | (10) | Distribution Platform of Specialty Construction Materials to Professional Concrete and Masonry Contractors | ||||||||||||||||||||||||||||||||||||||||||
| Member Units | (8) | 12/29/2016 | 861,618 | 3,335 | 21,165 | |||||||||||||||||||||||||||||||||||||||
| Dalton US Inc. | (10) | Provider of Supplemental Labor Services | ||||||||||||||||||||||||||||||||||||||||||
| Secured Debt | (9) | 08/16/2022 | 11.90% | SF+ | 8.00% | 8/16/2027 | 79 | 63 | 78 | |||||||||||||||||||||||||||||||||||
| Secured Debt | (9) | 08/16/2022 | SF+ | 8.00% | 8/16/2027 | — | (5) | (5) | ||||||||||||||||||||||||||||||||||||
| Secured Debt | (9) | 08/16/2022 | 12.56% | SF+ | 8.00% | 8/16/2027 | 1,035 | 1,016 | 1,020 | |||||||||||||||||||||||||||||||||||
| Common Stock | 08/16/2022 | 14 | 14 | 14 | ||||||||||||||||||||||||||||||||||||||||
| 1,088 | 1,107 | |||||||||||||||||||||||||||||||||||||||||||
| DMA Industries, LLC | Distributor of aftermarket ride control products | |||||||||||||||||||||||||||||||||||||||||||
| Portfolio Company (1) (20) | Business Description | Type of Investment (2) (3) (15) | Investment Date (22) | Shares/Units | Total Rate | Reference Rate and Spread (25) | PIK Rate (19) | Maturity Date | Principal (4) | Cost (4) | Fair Value (18) | |||||||||||||||||||||||||||||||||
| Secured Debt | 11/19/2021 | 12.00% | 11/19/2026 | 5,300 | 5,217 | 5,300 | ||||||||||||||||||||||||||||||||||||||
| Preferred Equity | 11/19/2021 | 1,486 | 1,486 | 1,820 | ||||||||||||||||||||||||||||||||||||||||
| 6,703 | 7,120 | |||||||||||||||||||||||||||||||||||||||||||
| DTE Enterprises, LLC | (10) | Industrial Powertrain Repair and Services | ||||||||||||||||||||||||||||||||||||||||||
| Secured Debt | (9) | 04/13/2018 | L+ | 7.50% | 4/13/2023 | — | (1) | (1) | ||||||||||||||||||||||||||||||||||||
| Secured Debt | (9) | 04/13/2018 | 12.24% | L+ | 7.50% | 4/13/2023 | 6,119 | 6,110 | 5,978 | |||||||||||||||||||||||||||||||||||
| Class AA Preferred Member Units (non-voting) | (8) | 04/13/2018 | 10.00% | 10.00% | 1,161 | 1,161 | ||||||||||||||||||||||||||||||||||||||
| Class A Preferred Member Units | 04/13/2018 | 776,316 | 8.00% | 8.00% | 776 | 380 | ||||||||||||||||||||||||||||||||||||||
| 8,046 | 7,518 | |||||||||||||||||||||||||||||||||||||||||||
| Dynamic Communities, LLC | (10) | Developer of Business Events and Online Community Groups | ||||||||||||||||||||||||||||||||||||||||||
| Secured Debt | (9) | 12/20/2022 | 9.18% | SF+ | 4.50% | 9.18% | 12/31/2026 | 1,875 | 1,717 | 1,717 | ||||||||||||||||||||||||||||||||||
| Secured Debt | (9) | 12/20/2022 | 11.18% | SF+ | 6.50% | 11.18% | 12/31/2026 | 1,875 | 1,642 | 1,642 | ||||||||||||||||||||||||||||||||||
| Preferred Equity | 12/20/2022 | 125,000 | 128 | 128 | ||||||||||||||||||||||||||||||||||||||||
| Preferred Equity | 12/20/2022 | 2,376,241 | — | — | ||||||||||||||||||||||||||||||||||||||||
| Common Equity | 12/20/2022 | 1,250,000 | — | — | ||||||||||||||||||||||||||||||||||||||||
| 3,487 | 3,487 | |||||||||||||||||||||||||||||||||||||||||||
| Elgin AcquireCo, LLC | Manufacturer and Distributor of Engine and Chassis Components | |||||||||||||||||||||||||||||||||||||||||||
| Secured Debt | (9) | 10/03/2022 | SF+ | 6.00% | 10/3/2027 | — | (1) | (1) | ||||||||||||||||||||||||||||||||||||
| Secured Debt | 10/03/2022 | 12.00% | 10/3/2027 | 1,227 | 1,192 | 1,192 | ||||||||||||||||||||||||||||||||||||||
| Secured Debt | 10/03/2022 | 9.00% | 10/3/2052 | 415 | 411 | 411 | ||||||||||||||||||||||||||||||||||||||
| Common Stock | 10/03/2022 | 25 | 497 | 497 | ||||||||||||||||||||||||||||||||||||||||
| Common Stock | (23) | 10/03/2022 | 61 | 102 | 102 | |||||||||||||||||||||||||||||||||||||||
| 2,201 | 2,201 | |||||||||||||||||||||||||||||||||||||||||||
| Emerald Technologies Acquisition Co, Inc. | (11) | Design & Manufacturing | ||||||||||||||||||||||||||||||||||||||||||
| Secured Debt | (9) | 02/10/2022 | 10.67% | SF+ | 6.25% | 2/10/2028 | 2,453 | 2,411 | 2,328 | |||||||||||||||||||||||||||||||||||
| Engineering Research & Consulting, LLC | (10) | Provider of Engineering & Consulting Services to US Department of Defense | ||||||||||||||||||||||||||||||||||||||||||
| Secured Debt | (9) | 05/23/2022 | 11.68% | SF+ | 6.50% | 5/23/2027 | 41 | 27 | 41 | |||||||||||||||||||||||||||||||||||
| Secured Debt | (9) | 05/23/2022 | 10.92% | SF+ | 6.50% | 5/23/2028 | 5,159 | 5,070 | 5,159 | |||||||||||||||||||||||||||||||||||
| 5,097 | 5,200 | |||||||||||||||||||||||||||||||||||||||||||
| EPIC Y-Grade Services, LP | (11) | NGL Transportation & Storage | ||||||||||||||||||||||||||||||||||||||||||
| Secured Debt | (9) | 06/22/2018 | 10.70% | L+ | 6.00% | 6/30/2027 | 6,840 | 6,777 | 6,156 | |||||||||||||||||||||||||||||||||||
| Event Holdco, LLC | (10) | Event and Learning Management Software for Healthcare Organizations and Systems | ||||||||||||||||||||||||||||||||||||||||||
| Secured Debt | (9) (23) | 12/22/2021 | 10.67% | L+ | 7.00% | 12/22/2026 | 308 | 305 | 292 | |||||||||||||||||||||||||||||||||||
| Secured Debt | (9) (23) | 12/22/2021 | 10.67% | L+ | 7.00% | 12/22/2026 | 3,692 | 3,663 | 3,507 | |||||||||||||||||||||||||||||||||||
| 3,968 | 3,799 | |||||||||||||||||||||||||||||||||||||||||||
| Flip Electronics LLC | (10) | Distributor of Hard-to-Find and Obsolete Electronic Components | ||||||||||||||||||||||||||||||||||||||||||
| Secured Debt | (9) | 03/24/2022 | 11.21% | SF+ | 7.50% | 1/2/2026 | 818 | 818 | 818 | |||||||||||||||||||||||||||||||||||
| Secured Debt | (9) | 01/04/2021 | 12.19% | SF+ | 7.50% | 1/2/2026 | 12,327 | 12,055 | 12,327 | |||||||||||||||||||||||||||||||||||
| 12,873 | 13,145 | |||||||||||||||||||||||||||||||||||||||||||
| Portfolio Company (1) (20) | Business Description | Type of Investment (2) (3) (15) | Investment Date (22) | Shares/Units | Total Rate | Reference Rate and Spread (25) | PIK Rate (19) | Maturity Date | Principal (4) | Cost (4) | Fair Value (18) | |||||||||||||||||||||||||||||||||
| Hawk Ridge Systems, LLC | Value-Added Reseller of Engineering Design and Manufacturing Solutions | |||||||||||||||||||||||||||||||||||||||||||
| Secured Debt | (9) | 12/02/2016 | 10.13% | L+ | 6.00% | 1/15/2026 | 796 | 796 | 796 | |||||||||||||||||||||||||||||||||||
| Secured Debt | 12/02/2016 | 9.00% | 1/15/2026 | 8,200 | 8,147 | 8,200 | ||||||||||||||||||||||||||||||||||||||
| Preferred Member Units | (8) | 12/02/2016 | 56 | 713 | 4,370 | |||||||||||||||||||||||||||||||||||||||
| Preferred Member Units | (23) | 12/02/2016 | 56 | 38 | 230 | |||||||||||||||||||||||||||||||||||||||
| 9,694 | 13,596 | |||||||||||||||||||||||||||||||||||||||||||
| HDC/HW Intermediate Holdings | (10) | Managed Services and Hosting Provider | ||||||||||||||||||||||||||||||||||||||||||
| Secured Debt | (9) | 12/21/2018 | 14.34% | SF+ | 9.50% | 2.00% | 12/21/2023 | 180 | 179 | 175 | ||||||||||||||||||||||||||||||||||
| Secured Debt | (9) | 12/21/2018 | 14.34% | SF+ | 9.50% | 2.00% | 12/21/2023 | 1,780 | 1,772 | 1,731 | ||||||||||||||||||||||||||||||||||
| 1,951 | 1,906 | |||||||||||||||||||||||||||||||||||||||||||
| HEADLANDS OP-CO LLC | (10) | Clinical Trial Sites Operator | ||||||||||||||||||||||||||||||||||||||||||
| Secured Debt | (9) | 08/01/2022 | SF+ | 6.50% | 8/1/2027 | — | (18) | (18) | ||||||||||||||||||||||||||||||||||||
| Secured Debt | (9) | 08/01/2022 | SF+ | 6.50% | 8/1/2027 | — | (18) | (18) | ||||||||||||||||||||||||||||||||||||
| Secured Debt | (9) | 08/01/2022 | 10.62% | SF+ | 6.50% | 8/1/2027 | 4,975 | 4,884 | 4,975 | |||||||||||||||||||||||||||||||||||
| 4,848 | 4,939 | |||||||||||||||||||||||||||||||||||||||||||
| Hybrid Promotions, LLC | (10) | Wholesaler of Licensed, Branded and Private Label Apparel | ||||||||||||||||||||||||||||||||||||||||||
| Secured Debt | 06/30/2021 | 12.07% | SF+ | 8.25% | 6/30/2026 | 7,875 | 7,762 | 6,826 | ||||||||||||||||||||||||||||||||||||
| IG Parent Corporation | (11) | Software Engineering | ||||||||||||||||||||||||||||||||||||||||||
| Secured Debt | (9) (37) | 07/30/2021 | 10.17% | SF+ | 5.75% | 7/30/2026 | 465 | 447 | 465 | |||||||||||||||||||||||||||||||||||
| Secured Debt | (9) | 07/30/2021 | 10.17% | SF+ | 5.75% | 7/30/2028 | 8,291 | 8,186 | 8,291 | |||||||||||||||||||||||||||||||||||
| 8,633 | 8,756 | |||||||||||||||||||||||||||||||||||||||||||
| Implus Footcare, LLC | (10) | Provider of Footwear and Related Accessories | ||||||||||||||||||||||||||||||||||||||||||
| Secured Debt | (9) | 06/01/2017 | 13.98% | L+ | 7.75% | 1.50% | 4/30/2024 | 16,921 | 16,914 | 15,961 | ||||||||||||||||||||||||||||||||||
| Independent Pet Partners Intermediate Holdings, LLC | (10) | Omnichannel Retailer of Specialty Pet Products | ||||||||||||||||||||||||||||||||||||||||||
| Secured Debt | 11/28/2022 | 14.42% | SF+ | 10.00% | 14.42% | 2/27/2023 | 481 | 459 | 459 | |||||||||||||||||||||||||||||||||||
| Secured Debt | (14) | 12/10/2020 | 6.00% | 6.00% | 11/20/2023 | 10,902 | 10,443 | 4,515 | ||||||||||||||||||||||||||||||||||||
| Preferred Stock (non-voting) | 12/10/2020 | 6.00% | 6.00% | 2,470 | — | |||||||||||||||||||||||||||||||||||||||
| Preferred Stock (non-voting) | 12/10/2020 | — | — | |||||||||||||||||||||||||||||||||||||||||
| Member Units | 11/20/2018 | 1,191,667 | 1,192 | — | ||||||||||||||||||||||||||||||||||||||||
| Warrants | 11/20/2018 | 185,757 | 11/19/2028 | — | — | |||||||||||||||||||||||||||||||||||||||
| 14,564 | 4,974 | |||||||||||||||||||||||||||||||||||||||||||
| Industrial Services Acquisition, LLC | (10) | Industrial Cleaning Services | ||||||||||||||||||||||||||||||||||||||||||
| Secured Debt | (9) | 08/13/2021 | 11.50% | L+ | 6.75% | 8/13/2026 | 387 | 359 | 387 | |||||||||||||||||||||||||||||||||||
| Secured Debt | (9) | 08/13/2021 | 11.50% | L+ | 6.75% | 8/13/2026 | 10,871 | 10,738 | 10,871 | |||||||||||||||||||||||||||||||||||
| Preferred Member Units | (8) (23) | 01/31/2018 | 336 | 10.00% | 10.00% | 301 | 338 | |||||||||||||||||||||||||||||||||||||
| Preferred Member Units | (8) (23) | 05/17/2019 | 187 | 20.00% | 20.00% | 215 | 217 | |||||||||||||||||||||||||||||||||||||
| Member Units | (23) | 06/17/2016 | 2,100 | 2,100 | 1,400 | |||||||||||||||||||||||||||||||||||||||
| 13,713 | 13,213 | |||||||||||||||||||||||||||||||||||||||||||
| Infolinks Media Buyco, LLC | (10) | Exclusive Placement Provider to the Advertising Ecosystem | ||||||||||||||||||||||||||||||||||||||||||
| Secured Debt | (9) | 11/01/2021 | L+ | 5.50% | 11/1/2026 | — | (48) | (48) | ||||||||||||||||||||||||||||||||||||
| Portfolio Company (1) (20) | Business Description | Type of Investment (2) (3) (15) | Investment Date (22) | Shares/Units | Total Rate | Reference Rate and Spread (25) | PIK Rate (19) | Maturity Date | Principal (4) | Cost (4) | Fair Value (18) | |||||||||||||||||||||||||||||||||
| Secured Debt | (9) | 11/01/2021 | 10.23% | L+ | 5.50% | 11/1/2026 | 10,742 | 10,576 | 10,742 | |||||||||||||||||||||||||||||||||||
| 10,528 | 10,694 | |||||||||||||||||||||||||||||||||||||||||||
| Interface Security Systems, L.L.C | (10) | Commercial Security & Alarm Services | ||||||||||||||||||||||||||||||||||||||||||
| Secured Debt | (38) | 12/09/2021 | 14.22% | L+ | 10.00% | 8/7/2023 | 1,682 | 1,682 | 1,682 | |||||||||||||||||||||||||||||||||||
| Secured Debt | (9) (14) | 08/07/2019 | 12.07% | L+ | 7.00% | 1.00% | 8/7/2023 | 7,334 | 7,254 | 1,085 | ||||||||||||||||||||||||||||||||||
| Common Stock | 12/07/2021 | 2,143 | — | — | ||||||||||||||||||||||||||||||||||||||||
| 8,936 | 2,767 | |||||||||||||||||||||||||||||||||||||||||||
| Intermedia Holdings, Inc. | (11) | Unified Communications as a Service | ||||||||||||||||||||||||||||||||||||||||||
| Secured Debt | (9) | 08/03/2018 | 10.38% | L+ | 6.00% | 7/19/2025 | 5,621 | 5,613 | 4,342 | |||||||||||||||||||||||||||||||||||
| Invincible Boat Company, LLC. | (10) | Manufacturer of Sport Fishing Boats | ||||||||||||||||||||||||||||||||||||||||||
| Secured Debt | (9) | 08/28/2019 | 10.14% | L+ | 6.50% | 8/28/2025 | 622 | 618 | 622 | |||||||||||||||||||||||||||||||||||
| Secured Debt | (9) | 08/28/2019 | 10.17% | L+ | 6.50% | 8/28/2025 | 17,148 | 17,050 | 17,148 | |||||||||||||||||||||||||||||||||||
| 17,668 | 17,770 | |||||||||||||||||||||||||||||||||||||||||||
| INW Manufacturing, LLC | (11) | Manufacturer of Nutrition and Wellness Products | ||||||||||||||||||||||||||||||||||||||||||
| Secured Debt | (9) | 05/19/2021 | 10.48% | L+ | 5.75% | 3/25/2027 | 6,984 | 6,825 | 5,972 | |||||||||||||||||||||||||||||||||||
| Iron-Main Investments, LLC | Consumer Reporting Agency Providing Employment Background Checks and Drug Testing | |||||||||||||||||||||||||||||||||||||||||||
| Secured Debt | 08/02/2021 | 12.50% | 11/15/2026 | 1,133 | 1,108 | 1,108 | ||||||||||||||||||||||||||||||||||||||
| Secured Debt | 09/01/2021 | 12.50% | 11/15/2026 | 788 | 771 | 771 | ||||||||||||||||||||||||||||||||||||||
| Secured Debt | 11/15/2021 | 12.50% | 11/15/2026 | 2,236 | 2,236 | 2,236 | ||||||||||||||||||||||||||||||||||||||
| Secured Debt | 11/15/2021 | 12.50% | 11/15/2026 | 4,928 | 4,813 | 4,813 | ||||||||||||||||||||||||||||||||||||||
| Common Stock | 08/03/2021 | 44,944 | 449 | 449 | ||||||||||||||||||||||||||||||||||||||||
| 9,377 | 9,377 | |||||||||||||||||||||||||||||||||||||||||||
| Isagenix International, LLC | (11) | Direct Marketer of Health & Wellness Products | ||||||||||||||||||||||||||||||||||||||||||
| Secured Debt | (9) (14) | 06/21/2018 | 9.93% | L+ | 7.75% | 6/14/2025 | 5,053 | 5,034 | 1,537 | |||||||||||||||||||||||||||||||||||
| Jackmont Hospitality, Inc. | (10) | Franchisee of Casual Dining Restaurants | ||||||||||||||||||||||||||||||||||||||||||
| Secured Debt | (9) | 10/26/2022 | 12.23% | L+ | 7.50% | 11/4/2024 | 1,000 | 965 | 1,000 | |||||||||||||||||||||||||||||||||||
| Secured Debt | (9) | 11/08/2021 | 12.23% | L+ | 7.50% | 11/4/2024 | 4,126 | 4,126 | 4,126 | |||||||||||||||||||||||||||||||||||
| Preferred Equity | (8) | 11/08/2021 | 5,653,333 | 12.00% | 12.00% | 242 | 1,247 | |||||||||||||||||||||||||||||||||||||
| 5,333 | 6,373 | |||||||||||||||||||||||||||||||||||||||||||
| Joerns Healthcare, LLC | (11) | Manufacturer and Distributor of Health Care Equipment & Supplies | ||||||||||||||||||||||||||||||||||||||||||
| Secured Debt | 11/15/2021 | 18.00% | 1/31/2024 | 1,935 | 1,935 | 1,935 | ||||||||||||||||||||||||||||||||||||||
| Secured Debt | (14) | 08/21/2019 | 19.75% | 19.75% | 8/21/2024 | 3,351 | 3,325 | 418 | ||||||||||||||||||||||||||||||||||||
| Common Stock | 08/21/2019 | 392,514 | 3,678 | — | ||||||||||||||||||||||||||||||||||||||||
| 8,938 | 2,353 | |||||||||||||||||||||||||||||||||||||||||||
| Johnson Downie Opco, LLC | Executive Search Services | |||||||||||||||||||||||||||||||||||||||||||
| Secured Debt | (9) | 12/10/2021 | L+ | 11.50% | 12/10/2026 | — | (3) | — | ||||||||||||||||||||||||||||||||||||
| Secured Debt | (9) | 12/10/2021 | 15.63% | L+ | 11.50% | 12/10/2026 | 1,111 | 1,093 | 1,111 | |||||||||||||||||||||||||||||||||||
| Preferred Equity | (8) | 12/10/2021 | 350 | 350 | 620 | |||||||||||||||||||||||||||||||||||||||
| 1,440 | 1,731 | |||||||||||||||||||||||||||||||||||||||||||
| Portfolio Company (1) (20) | Business Description | Type of Investment (2) (3) (15) | Investment Date (22) | Shares/Units | Total Rate | Reference Rate and Spread (25) | PIK Rate (19) | Maturity Date | Principal (4) | Cost (4) | Fair Value (18) | |||||||||||||||||||||||||||||||||
| JorVet Holdings, LLC | Supplier and Distributor of Veterinary Equipment and Supplies | |||||||||||||||||||||||||||||||||||||||||||
| Secured Debt | 03/28/2022 | 12.00% | 3/28/2027 | 2,850 | 2,802 | 2,802 | ||||||||||||||||||||||||||||||||||||||
| Preferred Equity | (8) | 03/28/2022 | 11,934 | 1,193 | 1,193 | |||||||||||||||||||||||||||||||||||||||
| 3,995 | 3,995 | |||||||||||||||||||||||||||||||||||||||||||
| JTI Electrical & Mechanical, LLC | (10) | Electrical, Mechanical and Automation Services | ||||||||||||||||||||||||||||||||||||||||||
| Secured Debt | (9) | 12/22/2021 | L+ | 6.00% | 12/22/2026 | — | (11) | (11) | ||||||||||||||||||||||||||||||||||||
| Secured Debt | (9) | 12/22/2021 | 10.73% | L+ | 6.00% | 12/22/2026 | 3,059 | 3,010 | 3,059 | |||||||||||||||||||||||||||||||||||
| Common Equity | 12/22/2021 | 140,351 | 140 | 240 | ||||||||||||||||||||||||||||||||||||||||
| 3,139 | 3,288 | |||||||||||||||||||||||||||||||||||||||||||
| KMS, LLC | (10) | Wholesaler of Closeout and Value-priced Products | ||||||||||||||||||||||||||||||||||||||||||
| Secured Debt | (9) | 10/04/2021 | 12.00% | L+ | 7.25% | 10/4/2026 | 1,330 | 1,250 | 1,244 | |||||||||||||||||||||||||||||||||||
| Secured Debt | (9) | 10/04/2021 | 12.00% | L+ | 7.25% | 10/4/2026 | 9,381 | 9,238 | 8,778 | |||||||||||||||||||||||||||||||||||
| 10,488 | 10,022 | |||||||||||||||||||||||||||||||||||||||||||
| Lightbox Holdings, L.P. | (11) | Provider of Commercial Real Estate Software | ||||||||||||||||||||||||||||||||||||||||||
| Secured Debt | 05/09/2019 | 9.73% | L+ | 5.00% | 5/9/2026 | 5,826 | 5,783 | 5,622 | ||||||||||||||||||||||||||||||||||||
| LL Management, Inc. | (10) | Medical Transportation Service Provider | ||||||||||||||||||||||||||||||||||||||||||
| Secured Debt | (9) | 05/02/2019 | 11.21% | SF+ | 7.25% | 9/25/2023 | 8,003 | 7,987 | 7,945 | |||||||||||||||||||||||||||||||||||
| Secured Debt | (9) | 05/02/2019 | 11.67% | SF+ | 7.25% | 9/25/2023 | 6,164 | 6,148 | 6,119 | |||||||||||||||||||||||||||||||||||
| Secured Debt | (9) | 05/12/2022 | 11.67% | SF+ | 7.25% | 9/25/2023 | 8,884 | 8,809 | 8,820 | |||||||||||||||||||||||||||||||||||
| 22,944 | 22,884 | |||||||||||||||||||||||||||||||||||||||||||
| LLFlex, LLC | (10) | Provider of Metal-Based Laminates | ||||||||||||||||||||||||||||||||||||||||||
| Secured Debt | (9) | 08/16/2021 | 12.74% | L+ | 9.00% | 8/16/2026 | 4,938 | 4,856 | 4,833 | |||||||||||||||||||||||||||||||||||
| Logix Acquisition Company, LLC | (10) | Competitive Local Exchange Carrier | ||||||||||||||||||||||||||||||||||||||||||
| Secured Debt | (9) | 01/08/2018 | 10.13% | L+ | 5.75% | 12/22/2024 | 9,506 | 9,476 | 7,843 | |||||||||||||||||||||||||||||||||||
| Mako Steel, LP | (10) | Self-Storage Design & Construction | ||||||||||||||||||||||||||||||||||||||||||
| Secured Debt | (9) (31) | 03/15/2021 | 11.79% | L+ | 7.25% | 3/15/2026 | 3,448 | 3,395 | 3,426 | |||||||||||||||||||||||||||||||||||
| Secured Debt | (9) | 03/15/2021 | 11.09% | L+ | 7.25% | 3/15/2026 | 17,070 | 16,845 | 16,959 | |||||||||||||||||||||||||||||||||||
| 20,240 | 20,385 | |||||||||||||||||||||||||||||||||||||||||||
| MB2 Dental Solutions, LLC | (11) | Dental Partnership Organization | ||||||||||||||||||||||||||||||||||||||||||
| Secured Debt | (9) | 01/28/2021 | 10.42% | SF+ | 6.00% | 1/29/2027 | 8,359 | 8,223 | 8,359 | |||||||||||||||||||||||||||||||||||
| Secured Debt | (9) | 01/28/2021 | 10.42% | SF+ | 6.00% | 1/29/2027 | 7,876 | 7,783 | 7,876 | |||||||||||||||||||||||||||||||||||
| 16,006 | 16,235 | |||||||||||||||||||||||||||||||||||||||||||
| MetalForming AcquireCo, LLC | Distributor of Sheet Metal Folding and Metal Forming Equipment | |||||||||||||||||||||||||||||||||||||||||||
| Secured Debt | 10/19/2022 | 10/19/2024 | — | (1) | (1) | |||||||||||||||||||||||||||||||||||||||
| Secured Debt | 10/19/2022 | 12.75% | 10/19/2027 | 1,748 | 1,697 | 1,697 | ||||||||||||||||||||||||||||||||||||||
| Preferred Equity | (8) | 10/19/2022 | 434,331 | 8.00% | 8.00% | 441 | 441 | |||||||||||||||||||||||||||||||||||||
| Common Stock | 10/19/2022 | 112,865 | 113 | 113 | ||||||||||||||||||||||||||||||||||||||||
| 2,250 | 2,250 | |||||||||||||||||||||||||||||||||||||||||||
| Microbe Formulas, LLC | (10) | Nutritional Supplements Provider | ||||||||||||||||||||||||||||||||||||||||||
| Portfolio Company (1) (20) | Business Description | Type of Investment (2) (3) (15) | Investment Date (22) | Shares/Units | Total Rate | Reference Rate and Spread (25) | PIK Rate (19) | Maturity Date | Principal (4) | Cost (4) | Fair Value (18) | |||||||||||||||||||||||||||||||||
| Secured Debt | (9) | 04/04/2022 | SF+ | 6.25% | 4/3/2028 | — | (7) | (7) | ||||||||||||||||||||||||||||||||||||
| Secured Debt | (9) | 04/04/2022 | 9.86% | SF+ | 6.25% | 4/3/2028 | 3,142 | 3,085 | 3,034 | |||||||||||||||||||||||||||||||||||
| 3,078 | 3,027 | |||||||||||||||||||||||||||||||||||||||||||
| Mills Fleet Farm Group, LLC | (10) | Omnichannel Retailer of Work, Farm and Lifestyle Merchandise | ||||||||||||||||||||||||||||||||||||||||||
| Secured Debt | (9) | 10/24/2018 | 10.66% | L+ | 6.25% | 10/24/2024 | 18,769 | 18,559 | 18,338 | |||||||||||||||||||||||||||||||||||
| MonitorUS Holding, LLC | (10) (13) (21) | SaaS Provider of Media Intelligence Services | ||||||||||||||||||||||||||||||||||||||||||
| Secured Debt | (9) | 05/24/2022 | L+ | 7.00% | 5/24/2027 | — | (19) | (19) | ||||||||||||||||||||||||||||||||||||
| Secured Debt | (9) | 05/24/2022 | 11.73% | L+ | 7.00% | 5/24/2027 | 2,882 | 2,828 | 3,139 | |||||||||||||||||||||||||||||||||||
| Secured Debt | (9) | 05/24/2022 | 11.73% | L+ | 7.00% | 5/24/2027 | 4,906 | 4,820 | 4,906 | |||||||||||||||||||||||||||||||||||
| Common Stock | 08/30/2022 | 12,798,820 | 256 | 256 | ||||||||||||||||||||||||||||||||||||||||
| 7,885 | 8,282 | |||||||||||||||||||||||||||||||||||||||||||
| NinjaTrader, LLC | (10) | Operator of Futures Trading Platform | ||||||||||||||||||||||||||||||||||||||||||
| Secured Debt | (9) | 12/18/2019 | L+ | 6.25% | 12/18/2024 | — | (1) | — | ||||||||||||||||||||||||||||||||||||
| Secured Debt | (9) | 12/18/2019 | L+ | 6.25% | 12/18/2024 | — | (23) | (23) | ||||||||||||||||||||||||||||||||||||
| Secured Debt | (9) | 12/18/2019 | 9.99% | L+ | 6.25% | 12/18/2024 | 11,634 | 11,524 | 11,634 | |||||||||||||||||||||||||||||||||||
| 11,500 | 11,611 | |||||||||||||||||||||||||||||||||||||||||||
| NTM Acquisition Corp. | (11) | Provider of B2B Travel Information Content | ||||||||||||||||||||||||||||||||||||||||||
| Secured Debt | (9) | 07/12/2016 | 9.50% | L+ | 6.25% | 1.00% | 6/7/2024 | 4,036 | 4,034 | 3,915 | ||||||||||||||||||||||||||||||||||
| NWN Corporation | (10) | Value Added Reseller and Provider of Managed Services to a Diverse Set of Industries | ||||||||||||||||||||||||||||||||||||||||||
| Secured Debt | (9) (39) | 05/07/2021 | 10.85% | SF+ | 8.00% | 5/7/2026 | 1,570 | 1,519 | 1,482 | |||||||||||||||||||||||||||||||||||
| Secured Debt | (9) | 05/07/2021 | 12.56% | SF+ | 8.00% | 5/7/2026 | 20,786 | 20,476 | 19,620 | |||||||||||||||||||||||||||||||||||
| Secured Debt | 12/16/2022 | 20.00% | 20.00% | 8/6/2026 | 3,226 | 3,065 | 3,065 | |||||||||||||||||||||||||||||||||||||
| 25,060 | 24,167 | |||||||||||||||||||||||||||||||||||||||||||
| OVG Business Services, LLC | (10) | Venue Management Services | ||||||||||||||||||||||||||||||||||||||||||
| Secured Debt | (9) | 11/29/2021 | 10.64% | L+ | 6.25% | 11/19/2028 | 17,413 | 17,265 | 16,368 | |||||||||||||||||||||||||||||||||||
| Paragon Healthcare, Inc. | (10) | Infusion Therapy Treatment Provider | ||||||||||||||||||||||||||||||||||||||||||
| Secured Debt | (9) | 01/19/2022 | 10.26% | SF+ | 5.75% | 1/19/2027 | 71 | 57 | 70 | |||||||||||||||||||||||||||||||||||
| Secured Debt | (9) (29) | 01/19/2022 | 9.96% | SF+ | 5.75% | 1/19/2027 | 356 | 343 | 349 | |||||||||||||||||||||||||||||||||||
| Secured Debt | (9) | 01/19/2022 | 9.81% | SF+ | 5.75% | 1/19/2027 | 2,363 | 2,304 | 2,317 | |||||||||||||||||||||||||||||||||||
| 2,704 | 2,736 | |||||||||||||||||||||||||||||||||||||||||||
| PTL US Bidco, Inc | (13) (40) | Manufacturers of Equipment, Including Drilling Rigs and Equipment, and Providers of Supplies and Services to Companies Involved In the Drilling, Evaluation and Completion of Oil and Gas Wells. | ||||||||||||||||||||||||||||||||||||||||||
| Secured Debt | (9) | 08/19/2022 | SF+ | 7.25% | 8/19/2027 | — | (12) | (12) | ||||||||||||||||||||||||||||||||||||
| Secured Debt | (9) | 08/19/2022 | 11.80% | SF+ | 7.25% | 8/19/2027 | 1,852 | 1,817 | 1,828 | |||||||||||||||||||||||||||||||||||
| 1,805 | 1,816 | |||||||||||||||||||||||||||||||||||||||||||
| RA Outdoors LLC | (10) | Software Solutions Provider for Outdoor Activity Management | ||||||||||||||||||||||||||||||||||||||||||
| Secured Debt | (9) | 04/08/2021 | SF+ | 6.75% | 4/8/2026 | — | (11) | (11) | ||||||||||||||||||||||||||||||||||||
| Portfolio Company (1) (20) | Business Description | Type of Investment (2) (3) (15) | Investment Date (22) | Shares/Units | Total Rate | Reference Rate and Spread (25) | PIK Rate (19) | Maturity Date | Principal (4) | Cost (4) | Fair Value (18) | |||||||||||||||||||||||||||||||||
| Secured Debt | (9) | 04/08/2021 | 10.56% | SF+ | 6.75% | 4/8/2026 | 12,917 | 12,789 | 11,685 | |||||||||||||||||||||||||||||||||||
| 12,778 | 11,674 | |||||||||||||||||||||||||||||||||||||||||||
| Research Now Group, Inc. and Survey Sampling International, LLC | (11) | Provider of Outsourced Online Surveying | ||||||||||||||||||||||||||||||||||||||||||
| Secured Debt | (9) | 12/29/2017 | 8.84% | L+ | 5.50% | 12/20/2024 | 9,820 | 9,820 | 7,434 | |||||||||||||||||||||||||||||||||||
| RM Bidder, LLC | (10) | Scripted and Unscripted TV and Digital Programming Provider | ||||||||||||||||||||||||||||||||||||||||||
| Member Units | 11/12/2015 | 1,854 | 31 | 13 | ||||||||||||||||||||||||||||||||||||||||
| Warrants | (26) | 11/12/2015 | 218,601 | 10/20/2025 | 284 | — | ||||||||||||||||||||||||||||||||||||||
| 315 | 13 | |||||||||||||||||||||||||||||||||||||||||||
| Roof Opco, LLC | (10) | Residential Re-Roofing/Repair | ||||||||||||||||||||||||||||||||||||||||||
| Secured Debt | (9) | 08/27/2021 | 10.97% | SF+ | 6.50% | 8/27/2026 | 389 | 375 | 389 | |||||||||||||||||||||||||||||||||||
| Secured Debt | (9) | 08/27/2021 | 10.32% | SF+ | 6.50% | 8/27/2026 | 2,917 | 2,835 | 2,917 | |||||||||||||||||||||||||||||||||||
| Secured Debt | (9) | 08/27/2021 | 10.32% | SF+ | 6.50% | 8/27/2026 | 3,967 | 3,906 | 3,967 | |||||||||||||||||||||||||||||||||||
| 7,116 | 7,273 | |||||||||||||||||||||||||||||||||||||||||||
| Rug Doctor, LLC. | (10) | Carpet Cleaning Products and Machinery | ||||||||||||||||||||||||||||||||||||||||||
| Secured Debt | (9) | 07/16/2021 | 13.02% | SF+ | 6.25% | 2.00% | 11/16/2024 | 6,250 | 6,212 | 5,597 | ||||||||||||||||||||||||||||||||||
| Secured Debt | (9) | 07/16/2021 | 13.02% | SF+ | 6.25% | 2.00% | 11/16/2024 | 9,250 | 9,190 | 8,293 | ||||||||||||||||||||||||||||||||||
| 15,402 | 13,890 | |||||||||||||||||||||||||||||||||||||||||||
| Savers, Inc. | (11) | For-Profit Thrift Retailer | ||||||||||||||||||||||||||||||||||||||||||
| Secured Debt | (9) | 05/14/2021 | 10.34% | SF+ | 5.50% | 4/26/2028 | 4,281 | 4,270 | 4,149 | |||||||||||||||||||||||||||||||||||
| SIB Holdings, LLC | (10) | Provider of Cost Reduction Services | ||||||||||||||||||||||||||||||||||||||||||
| Secured Debt | (9) | 10/29/2021 | 11.01% | L+ | 6.25% | 10/29/2026 | 522 | 511 | 491 | |||||||||||||||||||||||||||||||||||
| Secured Debt | (9) | 10/29/2021 | 11.01% | L+ | 6.25% | 10/29/2026 | 1,954 | 1,908 | 1,803 | |||||||||||||||||||||||||||||||||||
| Secured Debt | (9) | 10/29/2021 | 11.01% | L+ | 6.25% | 10/29/2026 | 9,726 | 9,576 | 8,974 | |||||||||||||||||||||||||||||||||||
| Common Equity | 10/29/2021 | 119,048 | 250 | 183 | ||||||||||||||||||||||||||||||||||||||||
| 12,245 | 11,451 | |||||||||||||||||||||||||||||||||||||||||||
| Slick Innovations, LLC | Text Message Marketing Platform | |||||||||||||||||||||||||||||||||||||||||||
| Secured Debt | 09/13/2018 | 14.00% | 12/22/2027 | 3,460 | 3,334 | 3,460 | ||||||||||||||||||||||||||||||||||||||
| Common Stock | (8) | 09/13/2018 | 17,500 | 114 | 400 | |||||||||||||||||||||||||||||||||||||||
| 3,448 | 3,860 | |||||||||||||||||||||||||||||||||||||||||||
| South Coast Terminals Holdings, LLC | (10) | Specialty Toll Chemical Manufacturer | ||||||||||||||||||||||||||||||||||||||||||
| Secured Debt | (9) | 12/10/2021 | L+ | 5.75% | 12/13/2026 | — | (6) | (6) | ||||||||||||||||||||||||||||||||||||
| Secured Debt | (9) | 12/10/2021 | 9.69% | L+ | 5.75% | 12/13/2026 | 3,523 | 3,467 | 3,523 | |||||||||||||||||||||||||||||||||||
| Common Equity | 12/10/2021 | 60,606 | 61 | 92 | ||||||||||||||||||||||||||||||||||||||||
| 3,522 | 3,609 | |||||||||||||||||||||||||||||||||||||||||||
| SPAU Holdings, LLC | (10) | Digital Photo Product Provider | ||||||||||||||||||||||||||||||||||||||||||
| Secured Debt | (9) | 07/01/2022 | SF+ | 7.50% | 7/1/2027 | — | (18) | (18) | ||||||||||||||||||||||||||||||||||||
| Secured Debt | (9) | 07/01/2022 | 11.06% | SF+ | 7.50% | 7/1/2027 | 4,975 | 4,887 | 4,975 | |||||||||||||||||||||||||||||||||||
| Common Stock | 07/01/2022 | 200,000 | 200 | 200 | ||||||||||||||||||||||||||||||||||||||||
| 5,069 | 5,157 | |||||||||||||||||||||||||||||||||||||||||||
| Tex Tech Tennis, LLC | (10) | Sporting Goods & Textiles | ||||||||||||||||||||||||||||||||||||||||||
| Preferred Equity | (23) | 07/07/2021 | 1,000,000 | 1,000 | 1,830 | |||||||||||||||||||||||||||||||||||||||
| Portfolio Company (1) (20) | Business Description | Type of Investment (2) (3) (15) | Investment Date (22) | Shares/Units | Total Rate | Reference Rate and Spread (25) | PIK Rate (19) | Maturity Date | Principal (4) | Cost (4) | Fair Value (18) | |||||||||||||||||||||||||||||||||
| The Affiliati Network, LLC | Performance Marketing Solutions | |||||||||||||||||||||||||||||||||||||||||||
| Secured Debt | 08/09/2021 | 13.00% | 8/9/2026 | 30 | 26 | 26 | ||||||||||||||||||||||||||||||||||||||
| Secured Debt | 08/09/2021 | 13.00% | 8/9/2026 | 2,380 | 2,341 | 2,341 | ||||||||||||||||||||||||||||||||||||||
| Preferred Stock | (8) | 08/09/2021 | 320,000 | 1,600 | 1,600 | |||||||||||||||||||||||||||||||||||||||
| 3,967 | 3,967 | |||||||||||||||||||||||||||||||||||||||||||
| U.S. TelePacific Corp. | (11) | Provider of Communications and Managed Services | ||||||||||||||||||||||||||||||||||||||||||
| Secured Debt | (9) | 05/17/2017 | 11.57% | SF+ | 1.25% | 7.25% | 5/2/2026 | 13,425 | 13,358 | 5,018 | ||||||||||||||||||||||||||||||||||
| USA DeBusk LLC | (10) | Provider of Industrial Cleaning Services | ||||||||||||||||||||||||||||||||||||||||||
| Secured Debt | (9) | 10/22/2019 | 9.82% | L+ | 5.75% | 9/8/2026 | 18,013 | 17,828 | 18,013 | |||||||||||||||||||||||||||||||||||
| Vida Capital, Inc | (11) | Alternative Asset Manager | ||||||||||||||||||||||||||||||||||||||||||
| Secured Debt | 10/10/2019 | 10.38% | L+ | 6.00% | 10/1/2026 | 6,263 | 6,208 | 4,885 | ||||||||||||||||||||||||||||||||||||
| Vistar Media, Inc. | (10) | Operator of Digital Out-of-Home Advertising Platform | ||||||||||||||||||||||||||||||||||||||||||
| Preferred Stock | 04/03/2019 | 70,207 | 767 | 2,250 | ||||||||||||||||||||||||||||||||||||||||
| Volusion, LLC | Provider of Online Software-as-a-Service eCommerce Solutions | |||||||||||||||||||||||||||||||||||||||||||
| Secured Debt | (17) | 01/26/2015 | 11.50% | 1/26/2020 | 7,172 | 7,172 | 6,392 | |||||||||||||||||||||||||||||||||||||
| Unsecured Convertible Debt | 05/16/2018 | 8.00% | 11/16/2023 | 175 | 175 | — | ||||||||||||||||||||||||||||||||||||||
| Preferred Member Units | 01/26/2015 | 2,090,001 | 6,000 | — | ||||||||||||||||||||||||||||||||||||||||
| Warrants | (27) | 01/26/2015 | 784,867 | 1/26/2025 | 1,104 | — | ||||||||||||||||||||||||||||||||||||||
| 14,451 | 6,392 | |||||||||||||||||||||||||||||||||||||||||||
| VORTEQ Coil Finishers, LLC | (10) | Specialty Coating of Aluminum and Light-Gauge Steel | ||||||||||||||||||||||||||||||||||||||||||
| Common Equity | (8) | 11/30/2021 | 769,231 | 769 | 2,910 | |||||||||||||||||||||||||||||||||||||||
| Wall Street Prep, Inc. | (10) | Financial Training Services | ||||||||||||||||||||||||||||||||||||||||||
| Secured Debt | (9) | 07/19/2021 | L+ | 7.00% | 7/19/2026 | — | (7) | (7) | ||||||||||||||||||||||||||||||||||||
| Secured Debt | (9) | 07/19/2021 | 10.74% | L+ | 7.00% | 7/19/2026 | 5,328 | 5,252 | 5,216 | |||||||||||||||||||||||||||||||||||
| Common Stock | 07/19/2021 | 500,000 | 500 | 530 | ||||||||||||||||||||||||||||||||||||||||
| 5,745 | 5,739 | |||||||||||||||||||||||||||||||||||||||||||
| Watterson Brands, LLC | (10) | Facility Management Services | ||||||||||||||||||||||||||||||||||||||||||
| Secured Debt | (9) | 12/17/2021 | 10.73% | L+ | 6.00% | 12/17/2026 | 51 | 46 | 51 | |||||||||||||||||||||||||||||||||||
| Secured Debt | (9) | 12/17/2021 | 10.73% | L+ | 6.00% | 12/17/2026 | 53 | 45 | 53 | |||||||||||||||||||||||||||||||||||
| Secured Debt | (9) | 12/17/2021 | 10.73% | L+ | 6.00% | 12/17/2026 | 4,142 | 4,089 | 4,141 | |||||||||||||||||||||||||||||||||||
| 4,180 | 4,245 | |||||||||||||||||||||||||||||||||||||||||||
| West Star Aviation Acquisition, LLC | (10) | Aircraft, Aircraft Engine and Engine Parts | ||||||||||||||||||||||||||||||||||||||||||
| Secured Debt | (9) | 03/01/2022 | SF+ | 6.00% | 3/1/2028 | — | (6) | (6) | ||||||||||||||||||||||||||||||||||||
| Secured Debt | (9) | 03/01/2022 | 8.59% | SF+ | 6.00% | 3/1/2028 | 2,978 | 2,926 | 2,948 | |||||||||||||||||||||||||||||||||||
| Common Stock | 03/01/2022 | 200,000 | 200 | 250 | ||||||||||||||||||||||||||||||||||||||||
| 3,120 | 3,192 | |||||||||||||||||||||||||||||||||||||||||||
| Portfolio Company (1) (20) | Business Description | Type of Investment (2) (3) (15) | Investment Date (22) | Shares/Units | Total Rate | Reference Rate and Spread (25) | PIK Rate (19) | Maturity Date | Principal (4) | Cost (4) | Fair Value (18) | |||||||||||||||||||||||||||||||||
| Winter Services LLC | (10) | Provider of Snow Removal and Ice Management Services | ||||||||||||||||||||||||||||||||||||||||||
| Secured Debt | (9) | 11/19/2021 | L+ | 7.00% | 11/19/2026 | — | (43) | — | ||||||||||||||||||||||||||||||||||||
| Secured Debt | (9) | 11/19/2021 | L+ | 7.00% | 11/19/2026 | — | (43) | (43) | ||||||||||||||||||||||||||||||||||||
| Secured Debt | (9) | 11/19/2021 | 10.74% | L+ | 7.00% | 11/19/2026 | 12,500 | 12,305 | 12,487 | |||||||||||||||||||||||||||||||||||
| 12,219 | 12,444 | |||||||||||||||||||||||||||||||||||||||||||
| World Micro Holdings, LLC | Supply Chain Management | |||||||||||||||||||||||||||||||||||||||||||
| Secured Debt | 12/12/2022 | 13.00% | 12/12/2027 | 1,970 | 1,930 | 1,930 | ||||||||||||||||||||||||||||||||||||||
| Preferred Equity | 12/12/2022 | 530 | 530 | 530 | ||||||||||||||||||||||||||||||||||||||||
| 2,460 | 2,460 | |||||||||||||||||||||||||||||||||||||||||||
| Xenon Arc, Inc. | (10) | Tech-enabled Distribution Services to Chemicals and Food Ingredients Primary Producers | ||||||||||||||||||||||||||||||||||||||||||
| Secured Debt | 12/17/2021 | L+ | 5.25% | 12/17/2026 | — | (6) | (6) | |||||||||||||||||||||||||||||||||||||
| Secured Debt | 12/17/2021 | 10.84% | L+ | 5.25% | 12/17/2027 | 1,200 | 1,169 | 1,192 | ||||||||||||||||||||||||||||||||||||
| Secured Debt | 12/17/2021 | 8.63% | L+ | 5.25% | 12/17/2027 | 2,370 | 2,332 | 2,354 | ||||||||||||||||||||||||||||||||||||
| 3,495 | 3,540 | |||||||||||||||||||||||||||||||||||||||||||
| YS Garments, LLC | (11) | Designer and Provider of Branded Activewear | ||||||||||||||||||||||||||||||||||||||||||
| Secured Debt | (9) | 08/22/2018 | 9.51% | L+ | 5.50% | 8/9/2024 | 6,329 | 6,310 | 6,064 | |||||||||||||||||||||||||||||||||||
| Zips Car Wash, LLC | (10) | Express Car Wash Operator | ||||||||||||||||||||||||||||||||||||||||||
| Secured Debt | (9) | 02/11/2022 | 11.67% | SF+ | 7.25% | 3/1/2024 | 2,388 | 2,357 | 2,388 | |||||||||||||||||||||||||||||||||||
| Secured Debt | (9) (32) | 02/11/2022 | 11.67% | SF+ | 7.25% | 3/1/2024 | 599 | 594 | 597 | |||||||||||||||||||||||||||||||||||
| 2,951 | 2,985 | |||||||||||||||||||||||||||||||||||||||||||
| Subtotal Non-Control/Non-Affiliate Investments (121.5% of net assets at fair value) | $ | 787,201 | $ | 740,840 | ||||||||||||||||||||||||||||||||||||||||
| Total Portfolio Investments, December 31, 2022 (175.2% of net assets at fair value) | $ | 1,059,886 | $ | 1,068,143 | ||||||||||||||||||||||||||||||||||||||||
| Short-Term Investments (16) | ||||||||||||||||||||||||||||||||||||||||||||
| US Bank Money Market Account (21) | $ | 8,347 | $ | 8,347 | ||||||||||||||||||||||||||||||||||||||||
| Total Short-Term Investments | $ | 8,347 | $ | 8,347 | ||||||||||||||||||||||||||||||||||||||||
| Twelve Months Ended December 31, 2016 | Twelve Months Ended December 31, 2016 | ||||||||||||||||||||||||||||||||
| Controlled Investments | Fair Value at December 31, 2015 | Gross Additions (Cost)* | Gross Reductions (Cost)** | Net Unrealized Gain (Loss) | Fair Value at December 31, 2016 | Net Realized Gain (Loss) | Interest Income | Fee Income | Dividend Income | ||||||||||||||||||||||||
| GRT Rubber Technologies, LLC | |||||||||||||||||||||||||||||||||
| Term loan | $ | 7,806 | $ | 37 | $ | (1,395 | ) | $ | 90 | $ | 6,538 | $ | — | $ | 740 | $ | — | $ | — | ||||||||||||||
| Member units | 7,674 | — | — | 2,330 | 10,004 | — | — | 81 | 107 | ||||||||||||||||||||||||
| $ | 15,480 | $ | 37 | $ | (1,395 | ) | $ | 2,420 | $ | 16,542 | $ | — | $ | 740 | $ | 81 | $ | 107 | |||||||||||||||
| Year Ended December 31, | |||||||||||||||||||||||||||||
| 2023 | 2022 | 2021 | |||||||||||||||||||||||||||
| (dollars in thousands) | |||||||||||||||||||||||||||||
| Interest, fee and dividend income: | |||||||||||||||||||||||||||||
| Interest income | $ | 116,976 | $ | 90,811 | $ | 72,536 | |||||||||||||||||||||||
| Dividend income | 11,255 | 9,442 | 15,880 | ||||||||||||||||||||||||||
| Fee income | 3,155 | 3,512 | 1,712 | ||||||||||||||||||||||||||
| Total interest, fee and dividend income | $ | 131,386 | $ | 103,765 | $ | 90,128 | |||||||||||||||||||||||
| Fair Value Measurements | |||||||||||||||
| Level 1 | Level 2 | Level 3 | Total | ||||||||||||
| First lien secured debt investments | $ | — | $ | — | $ | 830,460 | $ | 830,460 | |||||||
| Second lien secured debt investments | — | — | 97,940 | 97,940 | |||||||||||
| Unsecured debt investments | — | — | 11,368 | 11,368 | |||||||||||
Equity investments (1) | — | — | 109,671 | 109,671 | |||||||||||
| Total | $ | — | $ | — | $ | 1,049,439 | $ | 1,049,439 | |||||||
| Fair Value Measurements | |||||||||||||||
| Level 1 | Level 2 | Level 3 | Total | ||||||||||||
| First lien secured debt investments | $ | — | $ | — | $ | 791,126 | $ | 791,126 | |||||||
| Second lien secured debt investments | — | — | 114,652 | 114,652 | |||||||||||
| Unsecured debt investments | — | — | 16,074 | 16,074 | |||||||||||
| Equity investments | — | — | 67,395 | 67,395 | |||||||||||
| Total | $ | — | $ | — | $ | 989,247 | $ | 989,247 | |||||||
| Fair Value Measurements | |||||||||||||||
| Level 1 | Level 2 | Level 3 | Total | ||||||||||||
| LMM portfolio investments | $ | — | $ | — | $ | 135,657 | $ | 135,657 | |||||||
| Private Loan investments | — | — | 315,382 | 315,382 | |||||||||||
| Middle Market investments | — | — | 549,792 | 549,792 | |||||||||||
Other Portfolio investments (1) | — | — | 48,608 | 48,608 | |||||||||||
| Total | $ | — | $ | — | $ | 1,049,439 | $ | 1,049,439 | |||||||
| Fair Value Measurements | |||||||||||||||
| Level 1 | Level 2 | Level 3 | Total | ||||||||||||
| LMM portfolio investments | $ | — | $ | — | $ | 116,060 | $ | 116,060 | |||||||
| Private Loan investments | — | — | 211,357 | 211,357 | |||||||||||
| Middle Market investments | — | — | 643,464 | 643,464 | |||||||||||
| Other Portfolio investments | — | — | 18,366 | 18,366 | |||||||||||
| Total | $ | — | $ | — | $ | 989,247 | $ | 989,247 | |||||||
| Type of Investment | Fair Value as of December 31, 2023 (in thousands) | Valuation Technique | Significant Unobservable Inputs | Range(3) | Weighted Average(3) | Median(3) | ||||||||||||||||||||||||||||||||
| Equity investments | $ | 254,770 | Discounted cash flow | WACC | 10.9% - 22.5% | 14.4 | % | 15.5 | % | |||||||||||||||||||||||||||||
| Market comparable / Enterprise value | EBITDA multiple (1) | 4.9x - 9.2x (2) | 7.3x | 6.5x | ||||||||||||||||||||||||||||||||||
| Debt investments | $ | 777,003 | Discounted cash flow | Risk adjusted discount factor (4) | 9.8% - 16.8% (2) | 13.1 | % | 12.8 | % | |||||||||||||||||||||||||||||
| Expected principal recovery percentage | 0.6% - 100.0% | 99.6 | % | 100.0 | % | |||||||||||||||||||||||||||||||||
| Debt investments | $ | 61,122 | Market approach | Third-party quote | 4.5 - 99.2 | 85.0 | 89.5 | |||||||||||||||||||||||||||||||
| Total Level 3 investments | $ | 1,092,895 | ||||||||||||||||||||||||||||||||||||
| Fair Value | Valuation Technique | Significant Unobservable Inputs | Range | Weighted Average (2) | ||||
| LMM equity investments | $ | 47,876 | Discounted Cash Flows | WACC | 12.6% - 17.4% | 13.9% | ||
| Market Approach/Enterprise Value | EBITDA Multiples (1) | 4.0x - 10.0x | 7.1x | |||||
| LMM debt portfolio investments | 87,781 | Discounted Cash Flows | Expected Principal Recovery | 28.0% - 100.0% | 98.9% | |||
| Risk Adjusted Discount Factor | 10.6% - 20.5% | 12.3% | ||||||
| Private Loan debt investments | 228,789 | Discounted Cash Flows | Expected Principal Recovery | 2.9% - 100.0% | 99.7% | |||
| Risk Adjusted Discount Factor | 4.5% - 28.3% | 7.9% | ||||||
| 77,981 | Market Approach | Third Party Quotes | 92.0% - 102.0% | 98.8% | ||||
| Private Loan equity investments | 8,612 | Market Approach/Enterprise Value | EBITDA Multiples (1) | 5.0x - 9.5x | 8.0x | |||
| Discounted Cash Flows | WACC | 9.9% - 14.0% | 11.8% | |||||
| Middle Market debt investments | 545,217 | Market Approach | Third Party Quotes | 29.0% - 106.0% | 96.1% | |||
| Middle Market equity investments | 4,575 | Market Approach | Third Party Quotes | $1.6 - $345.0 | $322.2 | |||
| Discounted Cash Flow | WACC | 15.3% - 15.3% | 15.3% | |||||
Market Approach/ Enterprise Value | EBITDA Multiples (1) | 5.5x - 5.5x | 5.5x | |||||
Other Portfolio investments (3) | 48,608 | Market Approach | NAV (1) | 86.1% - 102.1% | 100.3% | |||
| $ | 1,049,439 | |||||||
| Type of Investment | Fair Value as of December 31, 2022 (in thousands) | Valuation Technique | Significant Unobservable Inputs | Range(3) | Weighted Average(3) | Median(3) | ||||||||||||||||||||||||||||||||
| Equity investments | $ | 215,861 | Discounted cash flow | WACC | 10.4% - 22.5% | 14.3 | % | 15.7 | % | |||||||||||||||||||||||||||||
| Market comparable / Enterprise value | EBITDA multiple (1) | 4.3x - 8.5x (2) | 7.2x | 6.4x | ||||||||||||||||||||||||||||||||||
| Debt investments | $ | 743,887 | Discounted cash flow | Risk adjusted discount factor (4) | 8.5% - 18.2% (2) | 13.0 | % | 12.4 | % | |||||||||||||||||||||||||||||
| Expected principal recovery percentage | 0.7% - 100.0% | 99.1 | % | 100.0 | % | |||||||||||||||||||||||||||||||||
| Debt investments | $ | 108,395 | Market approach | Third-party quote | 5.6 - 98.5 | 85.7 | 90.0 | |||||||||||||||||||||||||||||||
| Total Level 3 investments | $ | 1,068,143 | ||||||||||||||||||||||||||||||||||||
| Fair Value | Valuation Technique | Significant Unobservable Inputs | Range | Weighted Average (2) | ||||
| LMM equity investments | $ | 37,616 | Discounted Cash Flows | WACC | 10.7% - 16.6% | 12.7% | ||
| Market Approach/Enterprise Value | EBITDA Multiples (1) | 3.3x - 11.5x | 6.9x | |||||
| LMM debt portfolio investments | 78,444 | Discounted Cash Flows | Expected Principal Recovery | 100.0% - 100.0% | 100.0% | |||
| Risk Adjusted Discount Factor | 8.5% - 21.0% | 11.3% | ||||||
| Private Loan debt investments | 165,968 | Discounted Cash Flows | Expected Principal Recovery | 3.0% - 100.0% | 99.9% | |||
| Risk Adjusted Discount Factor | 4.8% - 14.2% | 8.3% | ||||||
| 39,066 | Market Approach | Third Party Quotes | 96.5% - 100.4% | 99.7% | ||||
| Private Loan equity investments | 6,323 | Market Approach/Enterprise Value | EBITDA Multiples (1) | 5.0x - 9.5x | 8.3x | |||
| Discounted Cash Flows | WACC | 10.6% - 13.2% | 11.8% | |||||
| Middle Market debt investments | 638,374 | Market Approach | Third Party Quotes | 22.5% - 108.0% | 95.7% | |||
| Middle Market equity investments | 5,090 | Market Approach | Third Party Quotes | 75.0% - 337.5% | 281.8% | |||
| Other Portfolio investments | 18,366 | Market Approach | NAV (1) | 92.5% - 101.0% | 99.0% | |||
| $ | 989,247 | |||||||
| Type of Investment | Fair Value as of December 31, 2022 | Transfers Into Level 3 Hierarchy | Redemptions/ Repayments | New Investments | Net Changes from Unrealized to Realized | Net Unrealized Appreciation (Depreciation) | Other(1) | Fair Value as of December 31, 2023 | ||||||||||||||||||||||||||||||||||||||||||
| Debt | $ | 852,282 | $ | — | $ | (253,517) | $ | 230,663 | $ | 33,078 | $ | (5,467) | $ | (18,914) | $ | 838,125 | ||||||||||||||||||||||||||||||||||
| Equity | 214,687 | — | (15,329) | 16,377 | 923 | 17,352 | 20,019 | 254,029 | ||||||||||||||||||||||||||||||||||||||||||
| Equity Warrant | 1,174 | — | (284) | 523 | 284 | 149 | (1,105) | 741 | ||||||||||||||||||||||||||||||||||||||||||
| $ | 1,068,143 | $ | — | $ | (269,130) | $ | 247,563 | $ | 34,285 | $ | 12,034 | $ | — | $ | 1,092,895 | |||||||||||||||||||||||||||||||||||
| Type of Investment | Fair Value as of December 31, 2021 | Transfers Into Level 3 Hierarchy | Redemptions/ Repayments | New Investments | Net Changes from Unrealized to Realized | Net Unrealized Appreciation (Depreciation) | Other(1) | Fair Value as of December 31, 2022 | ||||||||||||||||||||||||||||||||||||||||||
| Debt | $ | 879,970 | $ | — | $ | (205,481) | $ | 211,631 | $ | 10,645 | $ | (42,747) | $ | (1,736) | $ | 852,282 | ||||||||||||||||||||||||||||||||||
| Equity | 196,374 | — | (22,234) | 7,728 | (7,037) | 38,120 | 1,736 | 214,687 | ||||||||||||||||||||||||||||||||||||||||||
| Equity Warrant | 792 | — | (45) | 1,111 | (305) | (379) | — | 1,174 | ||||||||||||||||||||||||||||||||||||||||||
| $ | 1,077,136 | $ | — | $ | (227,760) | $ | 220,470 | $ | 3,303 | $ | (5,006) | $ | — | $ | 1,068,143 | |||||||||||||||||||||||||||||||||||
| Fair Value Measurements | ||||||||||||||||||||||||||
| (in thousands) | ||||||||||||||||||||||||||
| At December 31, 2023 | Fair Value | Quoted Prices in Active Markets for Identical Assets (Level 1) | Significant Other Observable Inputs (Level 2) | Significant Unobservable Inputs (Level 3) | ||||||||||||||||||||||
| Private Loan portfolio investments | $ | 595,326 | $ | — | $ | — | $ | 595,326 | ||||||||||||||||||
| LMM portfolio investments | 386,956 | — | — | 386,956 | ||||||||||||||||||||||
| Middle Market portfolio investments | 85,990 | — | — | 85,990 | ||||||||||||||||||||||
| Other Portfolio investments | 24,623 | — | — | 24,623 | ||||||||||||||||||||||
| Total investments | $ | 1,092,895 | $ | — | $ | — | $ | 1,092,895 | ||||||||||||||||||
| Type of Investment | January 1, 2017 Fair Value | PIK Interest Accrual | New Investments (1) | Sales/ Repayments | Net Change in Unrealized Appreciation (Depreciation) (2) | Net Realized Gain (Loss) | December 31, 2017 Fair Value | ||||||||||||||
| LMM Equity | $ | 37,616 | $ | 154 | $ | 8,276 | $ | (622 | ) | $ | 3,210 | $ | (758 | ) | $ | 47,876 | |||||
| LMM Debt | 78,444 | 120 | 26,985 | (15,854 | ) | (1,104 | ) | (810 | ) | 87,781 | |||||||||||
| Private Loan Equity | 6,323 | — | 3,855 | (2,917 | ) | (1,197 | ) | 2,548 | 8,612 | ||||||||||||
| Private Loan Debt | 205,034 | 201 | 210,474 | (108,750 | ) | (143 | ) | (46 | ) | 306,770 | |||||||||||
| Middle Market Debt | 638,374 | 697 | 294,857 | (380,250 | ) | (3,536 | ) | (4,925 | ) | 545,217 | |||||||||||
| Middle Market Equity | 5,090 | 83 | 914 | (1,004 | ) | 813 | (1,321 | ) | 4,575 | ||||||||||||
Other Portfolio (3) | 18,366 | — | 39,812 | (10,756 | ) | 237 | 949 | 48,608 | |||||||||||||
| Total | $ | 989,247 | $ | 1,255 | $ | 585,173 | $ | (520,153 | ) | $ | (1,720 | ) | $ | (4,363 | ) | $ | 1,049,439 | ||||
| Fair Value Measurements | ||||||||||||||||||||||||||
| (in thousands) | ||||||||||||||||||||||||||
| At December 31, 2022 | Fair Value | Quoted Prices in Active Markets for Identical Assets (Level 1) | Significant Other Observable Inputs (Level 2) | Significant Unobservable Inputs (Level 3) | ||||||||||||||||||||||
| Private Loan portfolio investments | $ | 559,763 | $ | — | $ | — | $ | 559,763 | ||||||||||||||||||
| LMM portfolio investments | 352,661 | — | — | 352,661 | ||||||||||||||||||||||
| Middle Market portfolio investments | 126,744 | — | — | 126,744 | ||||||||||||||||||||||
| Other Portfolio investments | 28,975 | — | — | 28,975 | ||||||||||||||||||||||
| Total investments | $ | 1,068,143 | $ | — | $ | — | $ | 1,068,143 | ||||||||||||||||||
| As of December 31, 2023 | |||||||||||||||||
| Private Loan | LMM (a) | Middle Market | |||||||||||||||
| (dollars in millions) | |||||||||||||||||
| Number of portfolio companies | 78 | 50 | 16 | ||||||||||||||
| Fair value | $ | 595.3 | $ | 387.0 | $ | 86.0 | |||||||||||
| Cost | $ | 586.4 | $ | 315.7 | $ | 114.7 | |||||||||||
| Debt investments as a % of portfolio (at cost) | 94.1 | % | 70.2 | % | 93.1 | % | |||||||||||
| Equity investments as a % of portfolio (at cost) | 5.9 | % | 29.8 | % | 6.9 | % | |||||||||||
| % of debt investments at cost secured by first priority lien | 100.0 | % | 99.9 | % | 100.0 | % | |||||||||||
| Weighted-average annual effective yield (b) | 13.1 | % | 13.0 | % | 13.0 | % | |||||||||||
| Average EBITDA (c) | $ | 30.5 | $ | 8.8 | $ | 74.2 | |||||||||||
| As of December 31, 2022 | |||||||||||||||||
| Private Loan | LMM (a) | Middle Market | |||||||||||||||
| (dollars in millions) | |||||||||||||||||
| Number of portfolio companies | 70 | 48 | 21 | ||||||||||||||
| Fair value | $ | 559.8 | $ | 352.7 | $ | 126.7 | |||||||||||
| Cost | $ | 563.0 | $ | 312.5 | $ | 159.7 | |||||||||||
| Debt investments as a % of portfolio (at cost) | 96.2 | % | 73.2 | % | 95.0 | % | |||||||||||
| Equity investments as a % of portfolio (at cost) | 3.8 | % | 26.8 | % | 5.0 | % | |||||||||||
| % of debt investments at cost secured by first priority lien | 99.4 | % | 99.9 | % | 98.5 | % | |||||||||||
| Weighted-average annual effective yield (b) | 11.8 | % | 12.1 | % | 11.3 | % | |||||||||||
| Average EBITDA (c) | $ | 36.8 | $ | 8.6 | $ | 79.2 | |||||||||||
| Type of Investment | January 1, 2016 Fair Value | PIK Interest Accrual | New Investments (1) | Sales/ Repayments | Net Change in Unrealized Appreciation (Depreciation)(2) | Net Realized Gain (Loss) | December 31, 2016 Fair Value | ||||||||||||||
| LMM Equity | $ | 24,165 | $ | (72 | ) | $ | 9,264 | $ | — | $ | 4,259 | $ | — | $ | 37,616 | ||||||
| LMM Debt | 61,295 | 200 | 24,343 | (7,715 | ) | 321 | — | 78,444 | |||||||||||||
| Private Loan Equity | 530 | — | 4,602 | — | 1,191 | — | 6,323 | ||||||||||||||
| Private Loan Debt | 110,558 | 248 | 164,902 | (72,533 | ) | 2,156 | (297 | ) | 205,034 | ||||||||||||
| Middle Market Debt | 645,913 | 93 | 260,416 | (275,787 | ) | 30,333 | (22,594 | ) | 638,374 | ||||||||||||
| Middle Market Equity | — | — | 4,653 | — | 437 | — | 5,090 | ||||||||||||||
| Other Portfolio | 10,527 | — | 7,985 | — | (146 | ) | — | 18,366 | |||||||||||||
| Total | $ | 852,988 | $ | 469 | $ | 476,165 | $ | (356,035 | ) | $ | 38,551 | $ | (22,891 | ) | $ | 989,247 | |||||
| Cost: | December 31, 2023 | December 31, 2022 | ||||||||||||
| First lien debt | 86.5 | % | 88.5 | % | ||||||||||
| Equity | 13.3 | 10.8 | ||||||||||||
| Second lien debt | — | 0.3 | ||||||||||||
| Equity warrants | 0.2 | 0.2 | ||||||||||||
| Other | — | 0.2 | ||||||||||||
| 100.0 | % | 100.0 | % | |||||||||||
| Fair Value: | December 31, 2023 | December 31, 2022 | ||||||||||||
| First lien debt | 78.4 | % | 81.4 | % | ||||||||||
| Equity | 21.5 | 17.9 | ||||||||||||
| Second lien debt | — | 0.3 | ||||||||||||
| Equity warrants | 0.1 | 0.1 | ||||||||||||
| Other | — | 0.3 | ||||||||||||
| 100.0 | % | 100.0 | % | |||||||||||
Investments at Cost | Cost Percentage of Total Portfolio | Investments at Fair Value | Fair Value Percentage of Total Portfolio | ||||||||||
| First lien secured debt investments | $ | 856,582 | 80.5 | % | $ | 830,460 | 79.1 | % | |||||
| Second lien secured debt investments | 97,691 | 9.2 | 97,940 | 9.3 | |||||||||
| Unsecured debt investments | 11,194 | 1.0 | 11,368 | 1.1 | |||||||||
Equity investments (1) | 96,850 | 9.1 | 107,597 | 10.3 | |||||||||
| Equity warrants | 2,012 | 0.2 | 2,074 | 0.2 | |||||||||
| Total | $ | 1,064,329 | 100.0 | % | $ | 1,049,439 | 100.0 | % | |||||
| Cost: | December 31, 2023 | December 31, 2022 | ||||||||||||
| Southwest | 23.8 | % | 22.2 | % | ||||||||||
| Northeast | 21.9 | 20.3 | ||||||||||||
| Southeast | 17.8 | 17.8 | ||||||||||||
| Midwest | 17.6 | 15.1 | ||||||||||||
| West | 17.0 | 22.9 | ||||||||||||
| Canada | 0.8 | 0.8 | ||||||||||||
| Other Non-United States | 1.1 | 0.9 | ||||||||||||
| 100.0 | % | 100.0 | % | |||||||||||
| Fair Value: | December 31, 2023 | December 31, 2022 | ||||||||||||
| Southwest | 26.8 | % | 25.3 | % | ||||||||||
| Northeast | 21.6 | 20.3 | ||||||||||||
| Midwest | 18.3 | 15.9 | ||||||||||||
| West | 16.4 | 21.1 | ||||||||||||
| Southeast | 15.0 | 15.2 | ||||||||||||
| Canada | 0.8 | 1.2 | ||||||||||||
| Other Non-United States | 1.1 | 1.0 | ||||||||||||
| 100.0 | % | 100.0 | % | |||||||||||
Investments at Cost | Cost Percentage of Total Portfolio | Investments at Fair Value | Fair Value Percentage of Total Portfolio | ||||||||||
| First lien secured debt investments | $ | 809,280 | 80.7 | % | $ | 791,126 | 80.0 | % | |||||
| Second lien secured debt investments | 117,339 | 11.7 | 114,652 | 11.6 | |||||||||
| Unsecured debt investments | 16,126 | 1.6 | 16,074 | 1.6 | |||||||||
| Equity investments | 56,974 | 5.7 | 63,569 | 6.4 | |||||||||
| Equity warrants | 2,676 | 0.3 | 3,826 | 0.4 | |||||||||
| Total | $ | 1,002,395 | 100.0 | % | $ | 989,247 | 100.0 | % | |||||
| Cost: | December 31, 2023 | December 31, 2022 | ||||||||||||
| Internet Software & Services | 8.8 | % | 7.8 | % | ||||||||||
| Commercial Services & Supplies | 8.5 | 11.3 | ||||||||||||
| Health Care Providers & Services | 6.5 | 4.9 | ||||||||||||
| Machinery | 6.0 | 5.9 | ||||||||||||
| Professional Services | 5.7 | 3.7 | ||||||||||||
| Diversified Consumer Services | 5.4 | 4.7 | ||||||||||||
| IT Services | 5.2 | 4.9 | ||||||||||||
| Distributors | 4.4 | 5.0 | ||||||||||||
| Containers & Packaging | 4.3 | 3.4 | ||||||||||||
| Leisure Equipment & Products | 3.7 | 3.7 | ||||||||||||
| Textiles, Apparel & Luxury Goods | 3.1 | 2.0 | ||||||||||||
| Computers & Peripherals | 2.9 | 1.9 | ||||||||||||
| Specialty Retail | 2.7 | 4.0 | ||||||||||||
| Communications Equipment | 2.7 | 3.5 | ||||||||||||
| Aerospace & Defense | 2.6 | 3.6 | ||||||||||||
| Media | 2.5 | 2.4 | ||||||||||||
| Construction & Engineering | 2.5 | 2.5 | ||||||||||||
| Electrical Equipment | 2.2 | 1.8 | ||||||||||||
| Building Products | 2.1 | 2.4 | ||||||||||||
| Hotels, Restaurants & Leisure | 2.1 | 2.0 | ||||||||||||
| Diversified Financial Services | 2.1 | 1.7 | ||||||||||||
| Household Products | 2.0 | 1.5 | ||||||||||||
| Internet & Catalog Retail | 1.6 | 1.3 | ||||||||||||
| Food & Staples Retailing | 1.5 | 0.9 | ||||||||||||
| Software | 1.4 | 1.3 | ||||||||||||
| Health Care Equipment & Supplies | 1.3 | 1.2 | ||||||||||||
| Food Products | 0.9 | 1.1 | ||||||||||||
| Energy Equipment & Services | 0.5 | 1.2 | ||||||||||||
| Diversified Telecommunication Services | 0.1 | 3.4 | ||||||||||||
| Other (1) | 4.7 | 5.0 | ||||||||||||
| 100.0 | % | 100.0 | % | |||||||||||
| Investments at Cost | Cost Percentage of Total Portfolio | Investments at Fair Value | Fair Value Percentage of Total Portfolio | ||||||||||
| Northeast | $ | 155,908 | 15.4 | % | $ | 154,098 | 15.4 | % | |||||
| Southeast | 180,946 | 17.8 | 188,290 | 18.8 | |||||||||
| West | 190,615 | 18.8 | 177,422 | 17.7 | |||||||||
| Southwest | 193,219 | 19.0 | 190,926 | 19.1 | |||||||||
| Midwest | 250,005 | 24.6 | 244,331 | 24.4 | |||||||||
| Non-United States | 44,987 | 4.4 | 45,764 | 4.6 | |||||||||
| Total | $ | 1,015,680 | 100.0 | % | $ | 1,000,831 | 100.0 | % | |||||
| Fair Value: | December 31, 2023 | December 31, 2022 | ||||||||||||
| Machinery | 7.4 | % | 7.5 | % | ||||||||||
| Commercial Services & Supplies | 7.3 | 10.3 | ||||||||||||
| Internet Software & Services | 7.3 | 6.7 | ||||||||||||
| Diversified Consumer Services | 6.5 | 5.9 | ||||||||||||
| Health Care Providers & Services | 6.0 | 4.6 | ||||||||||||
| Professional Services | 5.5 | 2.8 | ||||||||||||
| IT Services | 5.0 | 4.7 | ||||||||||||
| Distributors | 4.6 | 5.5 | ||||||||||||
| Computers & Peripherals | 4.6 | 2.8 | ||||||||||||
| Containers & Packaging | 4.6 | 3.8 | ||||||||||||
| Leisure Equipment & Products | 3.3 | 3.7 | ||||||||||||
| Construction & Engineering | 3.1 | 2.9 | ||||||||||||
| Textiles, Apparel & Luxury Goods | 2.9 | 2.0 | ||||||||||||
| Specialty Retail | 2.7 | 3.1 | ||||||||||||
| Media | 2.6 | 2.6 | ||||||||||||
| Aerospace & Defense | 2.5 | 3.5 | ||||||||||||
| Electrical Equipment | 2.3 | 1.9 | ||||||||||||
| Construction Materials | 2.2 | 2.1 | ||||||||||||
| Diversified Financial Services | 2.0 | 1.8 | ||||||||||||
| Building Products | 1.9 | 2.5 | ||||||||||||
| Household Products | 1.9 | 1.3 | ||||||||||||
| Software | 1.7 | 1.7 | ||||||||||||
| Air Freight & Logistics | 1.6 | 1.2 | ||||||||||||
| Hotels, Restaurants & Leisure | 1.6 | 1.5 | ||||||||||||
| Internet & Catalog Retail | 1.5 | 1.9 | ||||||||||||
| Food & Staples Retailing | 1.2 | 0.8 | ||||||||||||
| Communications Equipment | 1.1 | 1.3 | ||||||||||||
| Energy Equipment & Services | 0.3 | 1.0 | ||||||||||||
| Diversified Telecommunication Services | 0.1 | 3.6 | ||||||||||||
| Other (1) | 4.7 | 5.0 | ||||||||||||
| 100.0 | % | 100.0 | % | |||||||||||
| Investments at Cost | Cost Percentage of Total Portfolio | Investments at Fair Value | Fair Value Percentage of Total Portfolio | ||||||||||
| Northeast | $ | 144,465 | 14.6 | % | $ | 141,637 | 14.6 | % | |||||
| Southeast | 185,803 | 18.9 | 193,616 | 19.9 | |||||||||
| West | 177,572 | 18.1 | 167,544 | 17.3 | |||||||||
| Southwest | 188,455 | 19.2 | 181,894 | 18.7 | |||||||||
| Midwest | 217,603 | 22.1 | 218,540 | 22.5 | |||||||||
| Non-United States | 69,854 | 7.1 | 67,650 | 7.0 | |||||||||
| Total | $ | 983,752 | 100.0 | % | $ | 970,881 | 100.0 | % | |||||
| Cost | Fair Value | ||||||||||
| December 31, 2017 | December 31, 2016 | December 31, 2017 | December 31, 2016 | ||||||||
| Commercial Services and Supplies | 7.9 | % | 9.1 | % | 7.7 | % | 9.2 | % | |||
| Hotels, Restaurants, and Leisure | 6.2 | 8.0 | 6.3 | 8.1 | |||||||
| Construction and Engineering | 5.4 | 4.6 | 5.5 | 4.8 | |||||||
| Diversified Telecommunication Services | 5.3 | 3.1 | 5.3 | 3.0 | |||||||
| Aerospace and Defense | 4.8 | 1.9 | 4.9 | 1.8 | |||||||
| IT Services | 4.6 | 4.6 | 4.6 | 4.7 | |||||||
| Communications Equipment | 4.3 | 4.7 | 4.5 | 4.9 | |||||||
| Media | 4.0 | 7.7 | 3.9 | 7.6 | |||||||
| Diversified Consumer Services | 3.6 | 2.8 | 3.7 | 2.7 | |||||||
| Energy Equipment and Services | 3.5 | 3.7 | 3.2 | 2.8 | |||||||
| Professional Services | 3.5 | 1.0 | 3.6 | 1.0 | |||||||
| Machinery | 3.5 | 1.5 | 4.0 | 1.9 | |||||||
| Internet Software and Services | 3.3 | 5.1 | 3.3 | 5.2 | |||||||
| Distributors | 3.1 | 1.6 | 3.2 | 1.7 | |||||||
| Leisure Equipment and Products | 3.0 | 0.8 | 3.1 | 0.8 | |||||||
| Specialty Retail | 2.9 | 3.9 | 2.0 | 3.3 | |||||||
| Auto Components | 2.7 | 3.1 | 2.4 | 3.2 | |||||||
| Food Products | 2.6 | 2.7 | 2.6 | 2.5 | |||||||
| Oil, Gas, and Consumable Fuels | 2.4 | 0.9 | 2.5 | 0.9 | |||||||
| Computers and Peripherals | 2.3 | 1.0 | 2.6 | 1.1 | |||||||
| Health Care Equipment and Supplies | 2.0 | 2.2 | 2.1 | 2.3 | |||||||
| Internet and Catalog Retail | 1.9 | 1.4 | 1.6 | 1.2 | |||||||
| Household Durables | 1.6 | — | 1.6 | — | |||||||
| Health Care Providers and Services | 1.5 | 2.2 | 1.6 | 2.4 | |||||||
| Construction Materials | 1.5 | 1.0 | 1.6 | 1.1 | |||||||
| Diversified Financial Services | 1.3 | 1.9 | 1.2 | 1.9 | |||||||
| Trading Companies and Distributors | 1.2 | 1.0 | 1.3 | 1.0 | |||||||
| Capital Markets | 1.1 | 1.2 | 1.1 | 1.2 | |||||||
| Food & Staples Retailing | 1.0 | 1.4 | 1.0 | 1.5 | |||||||
| Personal Products | 1.0 | 0.8 | 1.0 | 0.8 | |||||||
| Healthcare Technology | 0.9 | 1.3 | 0.6 | 1.3 | |||||||
| Marine | 0.8 | 0.9 | 0.8 | 0.9 | |||||||
| Tobacco | 0.8 | 1.1 | 0.9 | 1.1 | |||||||
| Electronic Equipment, Instruments & Components | 0.7 | 3.7 | 0.7 | 3.7 | |||||||
| Electrical Equipment | 0.7 | 0.9 | 0.7 | 1.0 | |||||||
| Building Products | 0.5 | 0.6 | 0.6 | 0.6 | |||||||
| Road & Rail | 0.5 | — | 0.5 | — | |||||||
| Software | 0.5 | 2.6 | 0.6 | 2.7 | |||||||
| Textiles, Apparel & Luxury Goods | 0.4 | 0.5 | 0.3 | 0.4 | |||||||
| Publishing | 0.4 | 0.3 | 0.4 | 0.3 | |||||||
| Pharmaceuticals | 0.3 | 1.2 | 0.2 | 1.2 | |||||||
| Air Freight & Logistics | 0.3 | 0.3 | 0.4 | 0.4 | |||||||
| Airlines | 0.2 | 0.2 | 0.2 | 0.2 | |||||||
| Consumer Finance | — | 0.3 | 0.1 | 0.4 | |||||||
| Containers and Packaging | — | 0.3 | — | 0.3 | |||||||
| Chemicals | — | 0.2 | — | 0.2 | |||||||
| Oil and Gas Exploration and Production | — | 0.1 | — | 0.1 | |||||||
| Insurance | — | 0.6 | — | 0.6 | |||||||
| Total | 100.0 | % | 100.0 | % | 100.0 | % | 100.0 | % | |||
| As of December 31, 2017 | |||
Total debt investments (1) | $ | 138,908 | |
Weighted average effective yield on loans(2) | 4.95 | % | |
Largest loan to a single borrower(1) | $ | 3,496 | |
Total of 10 largest loans to borrowers(1) | $ | 30,790 | |
| HMS-ORIX | |||||||||||
| Loan Portfolio | |||||||||||
| As of December 31, 2017 | |||||||||||
| (dollars in thousands) | |||||||||||
| Portfolio Company | Industry | Type of Investment | Principal | Cost | Fair Value | ||||||
| Acosta, Inc. | Commercial Services and Supplies | LIBOR (1 month) + 3.25%, Current Coupon 4.82%, Secured Debt (Maturity - September 26, 2021) | $ | 2,000 | $ | 1,881 | $ | 1,766 | |||
| Acrisure, LLC | Insurance | LIBOR (2 months) + 4.25%, Current Coupon 5.65%, Secured Debt (Maturity - November 22, 2023) | 2,115 | 2,122 | 2,139 | ||||||
| Advantage Sales & Marketing Inc. | Commercial Services and Supplies | LIBOR (1 month) + 3.25%, Current Coupon 4.63%, Secured Debt (Maturity - July 23, 2021) | 1,990 | 1,938 | 1,945 | ||||||
| Air Medical Group Holdings Inc | Health Care Providers & Services | LIBOR (6 months) + 4.00%, Current Coupon 5.67%, Secured Debt (Maturity - April 28, 2022) | 1,990 | 1,981 | 1,993 | ||||||
| Albany Molecular Research, Inc. | Life Sciences Tools & Services | LIBOR (1 month) + 3.25%, Current Coupon 4.82%, Secured Debt (Maturity - August 28, 2024) | 100 | 100 | 99 | ||||||
| Alphabet Holding Company, Inc. | Food Products | LIBOR (1 month) + 3.50%, Current Coupon 5.07%, Secured Debt (Maturity - September 26, 2024) | 1,995 | 1,985 | 1,935 | ||||||
| HMS-ORIX | |||||||||||
| Loan Portfolio | |||||||||||
| As of December 31, 2017 | |||||||||||
| (dollars in thousands) | |||||||||||
| Portfolio Company | Industry | Type of Investment | Principal | Cost | Fair Value | ||||||
| American Seafoods Group LLC | Food Products | Prime + 2.25%, Current Coupon 6.75%, Secured Debt (Maturity - August 21, 2023) | $ | 1,500 | $ | 1,493 | $ | 1,513 | |||
| Ancestry.com Operations Inc. | Internet Software & Services | LIBOR (1 month) + 3.25%, Current Coupon 4.66%, Secured Debt (Maturity - October 19, 2023) | 1,995 | 2,013 | 2,007 | ||||||
| Arch Coal, Inc. | Metals & Mining | LIBOR (1 month) + 3.25%, Current Coupon 4.82%, Secured Debt (Maturity - March 7, 2024) | 1,985 | 1,992 | 2,004 | ||||||
| AshCo, Inc. | Specialty Retail | LIBOR (3 months) + 5.00%, Current Coupon 6.57%, Secured Debt (Maturity - September 25, 2024) | 1,995 | 1,951 | 1,993 | ||||||
| Asurion, LLC | Insurance | LIBOR (1 month) + 3.00%, Current Coupon 4.57%, Secured Debt (Maturity - November 3, 2023) | 1,312 | 1,312 | 1,320 | ||||||
| Atkore International, Inc. | Electric Equipment, Instruments & Components | LIBOR (3 months) + 3.00%, Current Coupon 4.70%, Secured Debt (Maturity - December 22, 2023) | 2,977 | 3,005 | 2,999 | ||||||
| BCP Renaissance Parent L.L.C. | Oil, Gas & Consumable Fuels | LIBOR (3 months) + 4.00%, Current Coupon 5.38%, Secured Debt (Maturity - October 31, 2024) | 600 | 602 | 608 | ||||||
| BMC Software Finance, Inc. | Software | LIBOR (1 month) + 3.25%, Current Coupon 4.82%, Secured Debt (Maturity - September 12, 2022) | 3,156 | 3,181 | 3,163 | ||||||
| Builders FirstSource, Inc. | Building Products | LIBOR (1 month) + 3.00%, Current Coupon 4.69%, Secured Debt (Maturity - February 29, 2024) | 2,977 | 2,974 | 2,993 | ||||||
| Calpine Corporation | Independent Power and Renewable Electricity Producers | LIBOR (3 months) + 2.50%, Current Coupon 4.20%, Secured Debt (Maturity - January 15, 2023) | 1,990 | 1,997 | 1,991 | ||||||
| CHS/Community Health Systems, Inc. | Health Care Providers & Services | LIBOR (3 months) + 3.00%, Current Coupon 4.48%, Secured Debt (Maturity - January 27, 2021) | 1,613 | 1,608 | 1,543 | ||||||
| ClubCorp Holdings, Inc. | Real Estate Management & Development | LIBOR (3 months) + 3.25%, Current Coupon 4.94%, Secured Debt (Maturity - September 18, 2024) | 1,959 | 1,949 | 1,969 | ||||||
| Colorado Buyer Inc | Technology Hardware, Storage & Peripherals | LIBOR (3 months) + 3.00%, Current Coupon 4.38%, Secured Debt (Maturity - May 1, 2024) | 2,985 | 2,995 | 3,008 | ||||||
| Confie Seguros Holding II Co. | Insurance | LIBOR (1 month) + 5.25%, Current Coupon 6.73%, Secured Debt (Maturity - April 19, 2022) | 1,985 | 1,992 | 1,987 | ||||||
| CPI International, Inc. | Aerospace & Defense | LIBOR (1 month) + 3.50%, Current Coupon 5.07%, Secured Debt (Maturity - July 26, 2024) | 1,995 | 1,995 | 2,011 | ||||||
| Diamond Resorts International, Inc. | Hotels, Restaurants & Leisure | LIBOR (1 month) + 4.50%, Current Coupon 6.07%, Secured Debt (Maturity - September 1, 2023) | 2,152 | 2,179 | 2,173 | ||||||
| Duff & Phelps Corporation | Diversified Financial Services | LIBOR (3 months) + 3.25%, Current Coupon 4.94%, Secured Debt (Maturity - October 15, 2024) | 491 | 494 | 493 | ||||||
| LIBOR (3 months) + 3.25%, Current Coupon 4.63%, Secured Debt (Maturity - December 4, 2024) | 2,728 | 2,724 | 2,737 | ||||||||
| 3,219 | 3,218 | 3,230 | |||||||||
| EFS Cogen Holdings I LLC | Electric Utilities | LIBOR (3 months) + 3.25%, Current Coupon 4.95%, Secured Debt (Maturity - June 28, 2023) | 1,904 | 1,917 | 1,925 | ||||||
| Encapsys LLC | Chemicals | LIBOR (1 month) + 3.25%, Current Coupon 4.82%, Secured Debt (Maturity - November 7, 2024) | 1,000 | 1,001 | 1,006 | ||||||
| HMS-ORIX | |||||||||||
| Loan Portfolio | |||||||||||
| As of December 31, 2017 | |||||||||||
| (dollars in thousands) | |||||||||||
| Portfolio Company | Industry | Type of Investment | Principal | Cost | Fair Value | ||||||
| Endo Luxembourg Finance Company I S.a.r.l. | Pharmaceuticals | LIBOR (1 month) + 4.25%, Current Coupon 5.88%, Secured Debt (Maturity - April 29, 2024) | $ | 1,990 | $ | 2,009 | $ | 2,005 | |||
| Envision Healthcare Corporation | Health Care Providers & Services | LIBOR (1 month) + 3.00%, Current Coupon 4.57%, Secured Debt (Maturity - December 1, 2023) | 2,481 | 2,481 | 2,491 | ||||||
| Everi Payments Inc. | Leisure Products | LIBOR (3 months) + 3.50%, Current Coupon 4.98%, Secured Debt (Maturity - May 9, 2024) | 1,990 | 1,983 | 2,013 | ||||||
| Exgen Renewables IV, LLC | Electrical Production | LIBOR (3 months) + 3.00%, Current Coupon 4.47%, Secured Debt (Maturity - November 29, 2024) | 300 | 299 | 304 | ||||||
| First American Payment Systems, L.P. | Diversified Financial Services | LIBOR (1 month) + 5.75%, Current Coupon 7.14%, Secured Debt (Maturity - January 5, 2024) | 952 | 963 | 958 | ||||||
| Fitness International, LLC | Hotels, Restaurants & Leisure | LIBOR (1 month) + 3.50%, Current Coupon 5.19%, Secured Debt (Maturity - July 1, 2020) | 1,735 | 1,757 | 1,760 | ||||||
| Flex Acquisition Company Inc | Containers & Packaging | LIBOR (3 months) + 3.00%, Current Coupon 4.34%, Secured Debt (Maturity - December 29, 2023) | 1,995 | 2,004 | 2,008 | ||||||
| Flexera Software LLC | Software | LIBOR (1 month) + 3.50%, Current Coupon 4.83%, Secured Debt (Maturity - April 2, 2020) | 1,995 | 2,013 | 2,008 | ||||||
| Gardner Denver, Inc. | Machinery | LIBOR (1 month) + 2.75%, Current Coupon 4.44%, Secured Debt (Maturity - July 30, 2024) | 1,995 | 2,005 | 2,004 | ||||||
| Golden Nugget, Inc. | Hotels, Restaurants & Leisure | LIBOR (1 month) + 3.25%, Current Coupon 4.66%, Secured Debt (Maturity - October 4, 2023) | 1,990 | 1,990 | 2,008 | ||||||
| Greatbatch Ltd. | Health Care Equipment & Supplies | LIBOR (1 month) + 3.25%, Current Coupon 4.66%, Secured Debt (Maturity - October 27, 2022) | 2,763 | 2,780 | 2,788 | ||||||
| GYP Holdings III Corp. | Trading Companies & Distributors | LIBOR (1 month) + 3.00%, Current Coupon 4.38%, Secured Debt (Maturity - March 31, 2023) | 3,483 | 3,506 | 3,502 | ||||||
| Harbor Freight Tools USA, Inc. | Specialty Retail | LIBOR (1 month) + 3.25%, Current Coupon 4.82%, Secured Debt (Maturity - August 18, 2023) | 1,980 | 1,987 | 1,996 | ||||||
| HD Supply Waterworks, Ltd. | Trading Companies & Distributors | LIBOR (6 months) + 3.00%, Current Coupon 4.46%, Secured Debt (Maturity - August 1, 2024) | 140 | 140 | 141 | ||||||
| Horizon Pharma, Inc. | Pharmaceuticals | LIBOR (1 month) + 3.25%, Current Coupon 4.75%, Secured Debt (Maturity - March 29, 2024) | 1,990 | 2,009 | 2,001 | ||||||
| IG Investments Holdings, LLC | Professional Services | LIBOR (1 month) + 3.50%, Current Coupon 5.19%, Secured Debt (Maturity - October 29, 2021) | 1,990 | 2,002 | 1,992 | ||||||
| Jackson Hewitt Tax Service Inc. | Diversified Financial Services | LIBOR (1 month) + 7.00%, Current Coupon 8.38%, Secured Debt (Maturity - July 30, 2020) | 1,939 | 1,868 | 1,922 | ||||||
| KMG Chemicals, Inc. | Chemicals | LIBOR (1 month) + 2.75%, Current Coupon 4.32%, Secured Debt (Maturity - June 17, 2024) | 863 | 859 | 868 | ||||||
| KUEHG Corp. | Educational Services | LIBOR (1 month) + 3.75%, Current Coupon 5.44%, Secured Debt (Maturity - August 12, 2022) | 2,482 | 2,489 | 2,493 | ||||||
| LANDesk Group, Inc. | Software | LIBOR (1 month) + 4.25%, Current Coupon 5.82%, Secured Debt (Maturity - January 22, 2024) | 993 | 999 | 947 | ||||||
| Learfield Communications LLC | Media | LIBOR (1 month) + 3.25%, Current Coupon 4.82%, Secured Debt (Maturity - December 1, 2023) | 1,990 | 2,009 | 2,007 | ||||||
| HMS-ORIX | |||||||||||
| Loan Portfolio | |||||||||||
| As of December 31, 2017 | |||||||||||
| (dollars in thousands) | |||||||||||
| Portfolio Company | Industry | Type of Investment | Principal | Cost | Fair Value | ||||||
| MA FinanceCo., LLC | Electric Equipment, Instruments & Components | LIBOR (1 month) + 2.75%, Current Coupon 4.32%, Secured Debt (Maturity - June 21, 2024) | $ | 387 | $ | 387 | $ | 388 | |||
| Mohegan Tribal Gaming Authority | Hotels, Restaurants & Leisure | LIBOR (1 month) + 4.00%, Current Coupon 5.57%, Secured Debt (Maturity - October 13, 2023) | 1,985 | 2,003 | 2,006 | ||||||
| MPH Acquisition Holdings LLC | Health Care Technology | LIBOR (3 months) + 3.00%, Current Coupon 4.69%, Secured Debt (Maturity - June 7, 2023) | 2,896 | 2,935 | 2,905 | ||||||
| NAB Holdings, LLC | IT Services | LIBOR (3 months) + 3.25%, Current Coupon 4.82%, Secured Debt (Maturity - July 1, 2024) | 1,990 | 1,981 | 2,000 | ||||||
| Ortho-Clinical Diagnostics, Inc | Life Sciences Tools & Services | LIBOR (1 month) + 3.75%, Current Coupon 5.44%, Secured Debt (Maturity - June 30, 2021) | 1,985 | 1,980 | 1,992 | ||||||
| PODS, LLC | Transportation & Logistics | LIBOR (1 month) + 3.00%, Current Coupon 4.40%, Secured Debt (Maturity - December 6, 2024) | 1,995 | 1,994 | 2,010 | ||||||
| Rackspace Hosting, Inc. | Electric Equipment, Instruments & Components | LIBOR (3 months) + 3.00%, Current Coupon 4.38%, Secured Debt (Maturity - November 3, 2023) | 3,284 | 3,309 | 3,286 | ||||||
| Radiate Holdco, LLC | Media | LIBOR (3 months) + 3.00%, Current Coupon 4.38%, Secured Debt (Maturity - February 1, 2024) | 2,570 | 2,544 | 2,547 | ||||||
| Red Ventures, LLC | Direct Marketing Services | LIBOR (1 month) + 4.00%, Current Coupon 5.57%, Secured Debt (Maturity - November 8, 2024) | 1,995 | 1,981 | 1,996 | ||||||
| Scientific Games International, Inc. | Leisure Products | LIBOR (1 month) + 3.25%, Current Coupon 4.67%, Secured Debt (Maturity - August 14, 2024) | 399 | 401 | 403 | ||||||
| Seattle Spin Co. | Electric Equipment, Instruments & Components | LIBOR (3 months) + 2.75%, Current Coupon 4.32%, Secured Debt (Maturity - June 21, 2024) | 2,613 | 2,616 | 2,618 | ||||||
| SeaWorld Parks & Entertainment, Inc. | Hotels, Restaurants & Leisure | LIBOR (3 months) + 3.00%, Current Coupon 4.69%, Secured Debt (Maturity - April 1, 2024) | 1,985 | 1,987 | 1,966 | ||||||
| Signode Industrial Group US Inc. | Machinery | LIBOR (1 month) + 2.75%, Current Coupon 4.32%, Secured Debt (Maturity - April 30, 2021) | 2,773 | 2,792 | 2,785 | ||||||
| Staples, Inc. | Distributors | LIBOR (3 months) + 4.00%, Current Coupon 5.49%, Secured Debt (Maturity - September 12, 2024) | 2,000 | 1,995 | 1,965 | ||||||
| Telenet Financing USD LLC | Diversified Telecommunications Services | LIBOR (1 month) + 2.50%, Current Coupon 3.92%, Secured Debt (Maturity - March 2, 2026) | 1,655 | 1,655 | 1,663 | ||||||
| Transdigm, Inc. | Aerospace & Defense | LIBOR (1 month) + 2.75%, Current Coupon 4.32%, Secured Debt (Maturity - June 9, 2023) | 1,985 | 1,992 | 1,990 | ||||||
| LIBOR (1 month) + 3.00%, Current Coupon 4.57%, Secured Debt (Maturity - August 22, 2024) | 1,000 | 998 | 1,006 | ||||||||
| 2,985 | 2,990 | 2,996 | |||||||||
| Travelport Finance (Luxembourg) S.A.R.L. | Internet Software & Services | LIBOR (3 months) + 2.75%, Current Coupon 4.17%, Secured Debt (Maturity - September 2, 2021) | 1,901 | 1,901 | 1,903 | ||||||
| Traverse Midstream Partners LLC | Oil, Gas & Consumable Fuels | LIBOR (3 months) + 4.00%, Current Coupon 5.85%, Secured Debt (Maturity - September 27, 2024) | 781 | 784 | 793 | ||||||
| UFC Holdings, LLC | Media | LIBOR (3 months) + 3.25%, Current Coupon 4.81%, Secured Debt (Maturity - August 18, 2023) | 1,990 | 2,002 | 2,003 | ||||||
| HMS-ORIX | |||||||||||
| Loan Portfolio | |||||||||||
| As of December 31, 2017 | |||||||||||
| (dollars in thousands) | |||||||||||
| Portfolio Company | Industry | Type of Investment | Principal | Cost | Fair Value | ||||||
| Ultra Resources, Inc. | Oil, Gas & Consumable Fuels | LIBOR (1 month) + 3.00%, Current Coupon 4.41%, Secured Debt (Maturity - April 12, 2024) | $ | 2,000 | $ | 2,002 | $ | 2,002 | |||
| Utz Quality Foods, LLC | Commercial Services and Supplies | LIBOR (1 month) + 3.50%, Current Coupon 5.01%, Secured Debt (Maturity - November 21, 2024) | 1,600 | 1,599 | 1,616 | ||||||
| Valeant Pharmaceuticals International, Inc. | Pharmaceuticals | LIBOR (1 month) + 3.50%, Current Coupon 4.94%, Secured Debt (Maturity - April 1, 2022) | 1,546 | 1,553 | 1,570 | ||||||
| Vertiv Group Corporation | Electrical Equipment | LIBOR (3 months) + 4.00%, Current Coupon 5.35%, Secured Debt (Maturity - November 30, 2023) | 1,555 | 1,569 | 1,556 | ||||||
| Vistra Operations Company LLC | Electric Utilities | LIBOR (2 months) + 2.75%, Current Coupon 4.08%, Secured Debt (Maturity - December 14, 2023) | 1,985 | 1,996 | 2,001 | ||||||
| West Corporation | Diversified Telecommunications Services | LIBOR (1 month) + 4.00%, Current Coupon 5.35%, Secured Debt (Maturity - October 10, 2024) | 1,032 | 1,022 | 1,036 | ||||||
| WideOpenWest Finance, LLC | Diversified Telecommunications Services | LIBOR (1 month) + 3.25%, Current Coupon 4.75%, Secured Debt (Maturity - August 18, 2023) | 3,496 | 3,506 | 3,470 | ||||||
| Total Loan Portfolio | $ | 139,017 | $ | 139,012 | |||||||
| HMS-ORIX SLF LLC | |||
| Balance Sheet (Unaudited) | |||
| (dollars in thousands) | |||
| As of December 31, 2017 | |||
| Assets | |||
| Portfolio investments at fair value (amortized cost: $139,017) | $ | 139,012 | |
| Cash and cash equivalents | 2,681 | ||
| Interest receivable | 306 | ||
| Deferred financing costs, net | 890 | ||
| Other assets | 15 | ||
| Total assets | $ | 142,904 | |
| Liabilities | |||
| Credit facilities payable | $ | 86,500 | |
| Payable for securities purchased | 5,268 | ||
| Accounts payable and accrued expenses | 64 | ||
| Total liabilities | 91,832 | ||
| Net assets | |||
| Members’ equity | 51,072 | ||
| Total net assets | 51,072 | ||
| Total liabilities and net assets | $ | 142,904 | |
| HMS-ORIX SLF LLC | |||
| Statement of Operations (Unaudited) | |||
| (dollars in thousands) | |||
| Period from inception (April 4, 2017) to December 31, 2017 | |||
| Investment income | |||
| Interest income | $ | 3,730 | |
| Dividend income | — | ||
| Fee income | — | ||
| Other income | — | ||
| Total investment income | 3,730 | ||
| Expenses | |||
| Interest expense | 1,720 | ||
| Other expenses | 34 | ||
| General and administrative expenses | 64 | ||
| Total expenses | 1,818 | ||
| Net investment income | 1,912 | ||
| Net realized (loss) from investments | (85 | ) | |
| Net realized income | 1,827 | ||
| Net change in unrealized (depreciation) on investments | (5 | ) | |
| Net increase in net assets resulting from operations | $ | 1,822 | |
| Outstanding Balance | Unamortized Debt Issuance Costs (1) | Recorded Value | Estimated Fair Value (2) | ||||||||||||||||||||
| (dollars in thousands) | |||||||||||||||||||||||
| SPV Facility | $ | 203,688 | $ | — | $ | 203,688 | $ | 203,688 | |||||||||||||||
| Series A Notes | 150,000 | (845) | 149,155 | 141,531 | |||||||||||||||||||
| Corporate Facility | 132,000 | — | 132,000 | 132,000 | |||||||||||||||||||
| Total Debt | $ | 485,688 | $ | (845) | $ | 484,843 | $ | 477,219 | |||||||||||||||
| Outstanding Balance | Unamortized Debt Issuance Costs (1) | Recorded Value | Estimated Fair Value (2) | ||||||||||||||||||||
| (dollars in thousands) | |||||||||||||||||||||||
| SPV Facility | $ | 223,688 | $ | — | $ | 223,688 | $ | 223,688 | |||||||||||||||
| Series A Notes | 150,000 | (1,144) | 148,856 | 132,955 | |||||||||||||||||||
| Corporate Facility | 98,000 | — | 98,000 | 98,000 | |||||||||||||||||||
| Total Debt | $ | 471,688 | $ | (1,144) | $ | 470,544 | $ | 454,643 | |||||||||||||||
| Year Ended December 31, | |||||||||||||||||||||||||||||
| 2023 | 2022 | 2021 | |||||||||||||||||||||||||||
| (dollars in thousands) | |||||||||||||||||||||||||||||
| SPV Facility | $ | 22,184 | $ | 13,856 | $ | 8,255 | |||||||||||||||||||||||
| Series A Notes | 6,358 | 6,167 | 653 | ||||||||||||||||||||||||||
| Corporate Facility | 7,916 | 4,400 | 2,681 | ||||||||||||||||||||||||||
Deutsche Bank Credit Facility(1) | — | — | 1,045 | ||||||||||||||||||||||||||
Main Street Term Loan(2) | — | — | 1,835 | ||||||||||||||||||||||||||
| Total Interest Expense | $ | 36,458 | $ | 24,423 | $ | 14,469 | |||||||||||||||||||||||
| As of December 31, | |||||||
| 2017 | 2016 | ||||||
| Balance Sheet Data | |||||||
| Current assets | $ | 8,375 | $ | 8,326 | |||
| Noncurrent assets | 28,312 | 32,107 | |||||
| Current liabilities | 3,577 | 2,941 | |||||
| Non Current liabilities | 16,067 | 18,563 | |||||
| For the Twelve Months Ended December 31, | |||||||||||
| 2017 | 2016 | 2015 | |||||||||
| Summary of Operations | |||||||||||
| Total revenue | $ | 31,165 | $ | 26,140 | $ | 29,838 | |||||
| Gross profit | 6,737 | 6,330 | 6,943 | ||||||||
| Income from operations | 2,329 | 2,154 | 2,900 | ||||||||
| Net income (loss) | (103 | ) | (270 | ) | 86 | ||||||
| 2024 | 2025 | 2026 | 2027 | 2028 | Thereafter | Total | |||||||||||||||||||||||||||||||||||
| (dollars in thousands) | |||||||||||||||||||||||||||||||||||||||||
SPV Facility(1) | $ | — | $ | — | $ | — | $ | — | $ | 203,688 | $ | — | $ | 203,688 | |||||||||||||||||||||||||||
Series A Notes(2) | — | — | 150,000 | — | — | — | 150,000 | ||||||||||||||||||||||||||||||||||
Corporate Facility(3) | — | — | 132,000 | — | — | — | 132,000 | ||||||||||||||||||||||||||||||||||
| Total | $ | — | $ | — | $ | 282,000 | $ | — | $ | 203,688 | $ | — | $ | 485,688 | |||||||||||||||||||||||||||
| Payments Due By Period (dollars in thousands) | |||||||||||||||||||
| Total | Less than 1 year | 1-3 years | 3-5 years | After 5 years | |||||||||||||||
EverBank Credit Facility (1) | $ | 82,000 | $ | — | $ | 82,000 | $ | — | $ | — | |||||||||
Deutsche Bank Credit Facility (2) | 348,000 | — | — | 348,000 | — | ||||||||||||||
| Total | $ | 430,000 | $ | — | $ | 82,000 | $ | 348,000 | $ | — | |||||||||
| Year Ended December 31, | |||||||||||||||||||||||||||||
| Per Share Data: | 2023 | 2022 | 2021 | 2020 | 2019 | ||||||||||||||||||||||||
| NAV at the beginning of the period | $ | 7.61 | $ | 7.68 | $ | 7.28 | $ | 7.77 | $ | 7.96 | |||||||||||||||||||
| Net investment income (1)(6) | 0.72 | 0.66 | 0.67 | 0.59 | 0.71 | ||||||||||||||||||||||||
| Net realized loss (1)(2) | (0.42) | (0.05) | (0.04) | (0.66) | (0.23) | ||||||||||||||||||||||||
| Net unrealized appreciation (depreciation) (1)(2) | 0.58 | (0.02) | 0.31 | (0.03) | 0.04 | ||||||||||||||||||||||||
| Income tax provision (1)(2) | (0.05) | (0.02) | (0.02) | (0.02) | (0.01) | ||||||||||||||||||||||||
| Net increase (decrease) in net assets resulting from operations (1) | 0.83 | 0.57 | 0.92 | (0.12) | 0.51 | ||||||||||||||||||||||||
| Dividends paid from net investment income | (0.70) | (0.65) | (0.53) | (0.35) | (0.68) | ||||||||||||||||||||||||
| Dividends paid from capital gains | — | — | — | — | (0.02) | ||||||||||||||||||||||||
| Dividends paid or accrued (3) | (0.70) | (0.65) | (0.53) | (0.35) | (0.70) | ||||||||||||||||||||||||
| Accretive effect of stock repurchases (repurchasing shares below NAV) (4) | 0.03 | — | — | — | — | ||||||||||||||||||||||||
| Other (5)(6) | — | 0.01 | 0.01 | (0.02) | — | ||||||||||||||||||||||||
| NAV at the end of the period | $ | 7.77 | $ | 7.61 | $ | 7.68 | $ | 7.28 | $ | 7.77 | |||||||||||||||||||
| Shares outstanding at the end of the period | 80,108,865 | 80,105,999 | 79,826,605 | 79,608,304 | 78,463,377 | ||||||||||||||||||||||||
| Year Ended December 31, | |||||||||||||||||||
| Per Share/Unit Data: | 2017 | 2016 | 2015 | 2014 | 2013 | ||||||||||||||
| NAV at beginning of period | $ | 8.15 | $ | 7.88 | $ | 8.40 | $ | 8.91 | $ | 8.86 | |||||||||
| Results from Operations | |||||||||||||||||||
Net investment income (1) (2) | 0.76 | 0.75 | 0.75 | 0.70 | 0.64 | ||||||||||||||
Net realized appreciation (depreciation) (1) (2) | (0.06 | ) | (0.34 | ) | (0.11 | ) | — | 0.01 | |||||||||||
Net change in unrealized appreciation (depreciation) on investments(1) (2) | (0.02 | ) | 0.56 | (0.78 | ) | (0.89 | ) | 0.16 | |||||||||||
| Net increase (decrease) in net assets resulting from operations | 0.68 | 0.97 | (0.14 | ) | (0.19 | ) | 0.81 | ||||||||||||
Stockholder distributions (1) (3) | |||||||||||||||||||
Distributions from net investment income (1) (2) | (0.70 | ) | (0.70 | ) | (0.70 | ) | (0.70 | ) | (0.69 | ) | |||||||||
Distributions from realized appreciation (1) (2) | — | — | — | — | (0.01 | ) | |||||||||||||
| Net decrease in net assets resulting from stockholder distributions | (0.70 | ) | (0.70 | ) | (0.70 | ) | (0.70 | ) | (0.70 | ) | |||||||||
| Capital share transactions | |||||||||||||||||||
Issuance of common stock above (below) NAV, net of offering costs (1) (4) | 0.02 | — | 0.21 | 0.09 | (0.06 | ) | |||||||||||||
| Net increase (decrease) in net assets resulting from capital share transactions | 0.02 | — | 0.21 | 0.09 | (0.06 | ) | |||||||||||||
Other (5) | — | — | 0.11 | 0.29 | — | ||||||||||||||
| NAV at end of the period | $ | 8.15 | $ | 8.15 | $ | 7.88 | $ | 8.40 | $ | 8.91 | |||||||||
| Shares/units outstanding at end of period | 79,511,731 | 73,382,971 | 62,382,044 | 30,967,120 | 5,396,967 | ||||||||||||||
| Weighted average shares/units outstanding | 77,718,813 | 68,029,977 | 48,838,114 | 16,022,853 | 2,648,689 | ||||||||||||||
| Year Ended December 31, | |||||||||||||||||||||||||||||
| 2023 | 2022 | 2021 | 2020 | 2019 | |||||||||||||||||||||||||
| (dollars in thousands) | |||||||||||||||||||||||||||||
| NAV at end of period | $ | 622,307 | $ | 609,665 | $ | 613,170 | $ | 579,624 | $ | 609,305 | |||||||||||||||||||
| Average NAV | $ | 613,525 | $ | 611,214 | $ | 593,440 | $ | 557,382 | $ | 622,708 | |||||||||||||||||||
| Average outstanding debt | $ | 487,271 | $ | 494,957 | $ | 321,973 | $ | 386,084 | $ | 474,000 | |||||||||||||||||||
| Ratio of total expenses, including income tax expense, to average NAV(1)(2)(4) | 12.63 | % | 8.60 | % | 6.51 | % | 7.38 | % | 9.11 | % | |||||||||||||||||||
| Ratio of operating expenses to average NAV(2)(4) | 12.02 | % | 8.33 | % | 6.20 | % | 7.16 | % | 9.11 | % | |||||||||||||||||||
| Ratio of operating expenses, excluding interest expense, to average NAV(2)(4) | 6.07 | % | 4.33 | % | 3.76 | % | 4.07 | % | 4.86 | % | |||||||||||||||||||
| Ratio of operating expenses, excluding interest expense and incentive fees, to average NAV(2)(4) | 4.02 | % | 3.98 | % | 3.66 | % | 4.07 | % | 4.22 | % | |||||||||||||||||||
| Ratio of net investment income to average NAV(4) | 9.40 | % | 8.65 | % | 8.99 | % | 8.40 | % | 8.84 | % | |||||||||||||||||||
| Portfolio turnover ratio | 21.82 | % | 18.92 | % | 35.39 | % | 8.93 | % | 33.30 | % | |||||||||||||||||||
| Total return based on change in NAV(3)(4) | 10.86 | % | 7.43 | % | 12.71 | % | (1.80) | % | 6.41 | % | |||||||||||||||||||
(2)Unless otherwise noted, operating expenses include interest, management fees, incentive fees and general and administrative expenses. (3)Total return is calculated based on the change in NAV per share and stockholder distributions declared per share during the reporting period, divided by the NAV per share at the beginning of the |
| Year Ended December 31, | |||||||||||||||||||
| 2017 | 2016 | 2015 | 2014 | 2013 | |||||||||||||||
| (dollars in thousands) | |||||||||||||||||||
| NAV at end of period | $ | 647,789 | $ | 597,833 | $ | 491,652 | $ | 260,063 | $ | 48,077 | |||||||||
| Average net assets | $ | 629,775 | $ | 535,175 | $ | 400,045 | $ | 142,603 | $ | 24,864 | |||||||||
| Average Credit Facilities borrowings | $ | 427,200 | $ | 396,000 | $ | 304,973 | $ | 89,846 | $ | 9,660 | |||||||||
| Ratios to average net assets: | |||||||||||||||||||
Ratio of total expenses to average net assets (1) | 7.14 | % | 7.12 | % | 7.23 | % | 5.62 | % | 4.24 | % | |||||||||
| Ratio of net investment income to average net assets | 9.32 | % | 9.81 | % | 9.12 | % | 7.85 | % | 6.86 | % | |||||||||
| Portfolio turnover ratio | 50.66 | % | 39.01 | % | 24.23 | % | 38.39 | % | 49.37 | % | |||||||||
Total return (2) | 8.59 | % | 12.31 | % | 2.14 | % | 2.13 | % | 8.47 | % | |||||||||
| Distributions | |||||||
| For the Period Ended | Per Share | Amount | |||||
| 2017 | |||||||
| Three months ended December 31, 2017 | $ | 0.18 | $ | 14,144 | |||
| Three months ended September 30, 2017 | 0.17 | 13,910 | |||||
| Three months ended June 30, 2017 | 0.18 | 13,438 | |||||
| Three months ended March 31, 2017 | 0.17 | 12,922 | |||||
| 2016 | |||||||
| Three months ended December 31, 2016 | 0.18 | 12,767 | |||||
| Three months ended September 30, 2016 | 0.17 | 12,307 | |||||
| Three months ended June 30, 2016 | 0.18 | 11,650 | |||||
| Three months ended March 31, 2016 | 0.17 | 11,037 | |||||
| 2015 | |||||||
| Three months ended December 31, 2015 | 0.18 | 10,564 | |||||
| Three months ended September 30, 2015 | 0.17 | 9,373 | |||||
| Three months ended June 30, 2015 | 0.18 | 7,998 | |||||
| Three months ended March 31, 2015 | 0.17 | 6,260 | |||||
| Year Ended December 31, | ||||||||||||||||||||
| 2017 | 2016 | 2015 | ||||||||||||||||||
| Source of Distribution | Distribution Amount | Percentage | Distribution Amount | Percentage | Distribution Amount | Percentage | ||||||||||||||
| Net realized income from operations (before waiver of incentive fees) | $ | 51,327 | 94.3 | % | $ | 26,689 | 55.9 | % | $ | 28,375 | 83.0 | % | ||||||||
| Waiver of incentive fees | 3,029 | 5.6 | 1,689 | 3.5 | 2,601 | 7.6 | ||||||||||||||
Distributions in excess of net realized income from operations (1) | 58 | 0.1 | 19,383 | 40.6 | 3,219 | 9.4 | ||||||||||||||
| Total | $ | 54,414 | 100.0 | % | $ | 47,761 | 100.0 | % | $ | 34,195 | 100.0 | % | ||||||||
| Year Ended December 31, | |||||||||||||||||||||||||||||
| 2023 | 2022 | 2021 | 2020 | 2019 | |||||||||||||||||||||||||
| Ratio of total expenses, including income tax expense, to average NAV(1)(2) | 13.98 | % | 9.33 | % | 7.24 | % | 8.11 | % | 9.84 | % | |||||||||||||||||||
| Ratio of operating expenses to average NAV(2) | 13.37 | % | 9.06 | % | 6.92 | % | 7.89 | % | 9.84 | % | |||||||||||||||||||
| Ratio of operating expenses, excluding interest expense, to average NAV(2) | 7.43 | % | 5.07 | % | 4.49 | % | 4.80 | % | 5.58 | % | |||||||||||||||||||
| Ratio of operating expenses, excluding interest expense and incentive fees, to average NAV(2) | 5.38 | % | 4.72 | % | 4.39 | % | 4.80 | % | 4.95 | % | |||||||||||||||||||
| Ratio of net investment income to average NAV | 8.05 | % | 7.90 | % | 8.26 | % | 7.67 | % | 8.11 | % | |||||||||||||||||||
| Total return based on change in NAV(3) | 9.50 | % | 6.69 | % | 11.98 | % | (2.20) | % | 5.85 | % | |||||||||||||||||||
| Year Ended December 31, | |||||||||||
| 2017 | 2016 | 2015 | |||||||||
| Net increase (decrease) in net assets resulting from operations | $ | 52,626 | $ | 66,584 | $ | (6,980 | ) | ||||
| Net change in unrealized (appreciation) depreciation | 1,730 | (38,206 | ) | 37,956 | |||||||
| Income tax (benefit) provision | 624 | 336 | 127 | ||||||||
| Pre-tax book (income) loss not consolidated for tax purposes | 3,532 | 21,353 | 5,862 | ||||||||
| Book income and tax income differences, including debt origination, structuring fees, dividends, realized gains and changes in estimates | 3,669 | 1,093 | 1,024 | ||||||||
Estimated taxable income (1) | 62,181 | 51,160 | 37,989 | ||||||||
| Taxable income earned in prior year and carried forward for distribution in current year | 7,238 | 3,839 | 45 | ||||||||
| Taxable income earned prior to period end and carried forward for distribution next period | (19,777 | ) | (11,592 | ) | (7,556 | ) | |||||
| Dividend accrued as of period end and paid-in the following period | 4,772 | 4,354 | 3,717 | ||||||||
| Taxable income earned to be carried forward | (15,005 | ) | (7,238 | ) | (3,839 | ) | |||||
| Total distributions accrued or paid to common stockholders | $ | 54,414 | $ | 47,761 | $ | 34,195 | |||||
| Year Ended December 31, | ||||||||||||
| 2017 | 2016 | 2015 | ||||||||||
| Deferred tax assets: | ||||||||||||
| Net operating loss carryforwards | $ | 1,901 | $ | 2,258 | $ | 2,869 | ||||||
| Foreign tax credit carryforwards | 10 | — | — | |||||||||
| Capital loss carryforwards | 5,390 | 8,366 | — | |||||||||
| Net unrealized depreciation of portfolio investments | — | 20 | 2,143 | |||||||||
| Total deferred tax assets | 7,301 | 10,644 | 5,012 | |||||||||
| Deferred tax liabilities: | ||||||||||||
| Net basis differences in portfolio investments | (703 | ) | (1,119 | ) | (599 | ) | ||||||
| Net unrealized appreciation of portfolio investments | (426 | ) | — | — | ||||||||
| Other | — | — | — | |||||||||
| Total deferred tax liabilities | (1,129 | ) | (1,119 | ) | (599 | ) | ||||||
| Valuation allowance | (6,172 | ) | (9,525 | ) | (4,413 | ) | ||||||
| Total net deferred tax assets (liabilities) | $ | — | $ | — | $ | — | ||||||
| Year Ended December 31, | |||||||||||||||||
| 2017 | 2016 | 2015 | |||||||||||||||
| Income tax expense (benefit) at the statutory rate | $ | 18,638 | 35.00 | % | $ | 23,421 | 35.00 | % | $ | (2,399 | ) | 35.00 | % | ||||
| Non-taxable RIC income | (19,065 | ) | (35.80 | ) | (28,410 | ) | (42.45 | ) | (1,811 | ) | 26.42 | ||||||
| State and local taxes | 202 | 0.38 | (44 | ) | (0.07 | ) | (184 | ) | 2.68 | ||||||||
| Change in federal tax rate for tax reform | 3,823 | 7.18 | — | — | — | — | |||||||||||
| Change in valuation allowance for tax reform | (3,823 | ) | (7.18 | ) | — | — | — | — | |||||||||
| Change in valuation allowance from operations | 470 | 0.88 | 5,113 | 7.64 | 4,413 | (64.40 | ) | ||||||||||
Other 1 | 379 | 0.71 | 256 | 0.38 | $ | 108 | (1.58 | ) | |||||||||
| Effective tax rate | $ | 624 | 1.17 | % | $ | 336 | 0.50 | % | $ | 127 | (1.88 | )% | |||||
| Year Ended December 31, | ||||||||||||||||||
| Tax Characteristics of Distributions | 2017 | 2016 | 2015 | |||||||||||||||
| Ordinary Income | $ | 52,473 | 96.43 | % | $ | 44,848 | 93.90 | % | $ | 34,085 | 99.68 | % | ||||||
| Capital Gain Distributions | 1,941 | 3.57 | 2,913 | 6.10 | 110 | 0.32 | ||||||||||||
| Total Distributions | $ | 54,414 | 100.00 | % | $ | 47,761 | 100.00 | % | $ | 34,195 | 100.00 | % | ||||||
| Year Ended December 31, | |||||||||||||||||
| 2023 | 2022 | 2021 | |||||||||||||||
| (dollars in thousands) | |||||||||||||||||
| Ordinary income (1) | $ | 47,756 | $ | 61,854 | $ | 29,797 | |||||||||||
| Qualified dividends | 8,301 | 1,727 | 92 | ||||||||||||||
| Distributions on tax basis | $ | 56,057 | $ | 63,581 | $ | 29,889 | |||||||||||
| Year Ended December 31, | |||||||||||||||||
| 2023 | 2022 | 2021 | |||||||||||||||
| (estimated, dollars in thousands) | |||||||||||||||||
| Net increase in net assets resulting from operations | $ | 66,209 | $ | 45,588 | $ | 73,636 | |||||||||||
| Net unrealized (appreciation) depreciation | (46,319) | 1,702 | (25,095) | ||||||||||||||
| Income tax provision | 3,769 | 1,643 | 1,890 | ||||||||||||||
| Pre-tax book (income) loss not consolidated for tax purposes | 4,241 | (9,748) | (17,640) | ||||||||||||||
| Book income and tax income differences, including debt origination, structuring fees, dividends, realized gains and changes in estimates | 22,228 | 9,820 | 3,171 | ||||||||||||||
| Estimated taxable income (1) | 50,128 | 49,005 | 35,962 | ||||||||||||||
| Taxable income earned in prior year and carried forward for distribution in current year | 20,674 | 23,276 | 29,173 | ||||||||||||||
| Taxable income earned prior to period end and carried forward for distribution next period | (28,764) | (33,491) | (35,250) | ||||||||||||||
| Dividend accrued as of period end and paid in the following period | 14,019 | 12,817 | 11,974 | ||||||||||||||
| Taxable income earned to be carried forward | (14,745) | (20,674) | (23,276) | ||||||||||||||
| Total distributions accrued or paid to common stockholders | $ | 56,057 | $ | 51,607 | $ | 41,859 | |||||||||||
| Year Ended December 31, | |||||||||||||||||||||||||||||
| 2023 | 2022 | 2021 | |||||||||||||||||||||||||||
| (dollars in thousands) | |||||||||||||||||||||||||||||
| Current tax expense: | |||||||||||||||||||||||||||||
| Federal | $ | 13 | $ | 33 | $ | — | |||||||||||||||||||||||
| State | 340 | 495 | 495 | ||||||||||||||||||||||||||
| Excise | 519 | 753 | 1,395 | ||||||||||||||||||||||||||
| Total current tax expense | 872 | 1,281 | 1,890 | ||||||||||||||||||||||||||
| Deferred tax expense (benefit): | |||||||||||||||||||||||||||||
| Federal | 3,450 | 351 | — | ||||||||||||||||||||||||||
| State | (553) | 11 | — | ||||||||||||||||||||||||||
| Total deferred tax expense | 2,897 | 362 | — | ||||||||||||||||||||||||||
| Total income tax provision | $ | 3,769 | $ | 1,643 | $ | 1,890 | |||||||||||||||||||||||
| Year Ended December 31, | |||||||||||
| 2023 | 2022 | ||||||||||
| (dollars in thousands) | |||||||||||
| Deferred tax assets: | |||||||||||
| Net operating loss carryforwards | $ | 671 | $ | 398 | |||||||
| Interest expense carryforwards | 3,258 | 1,426 | |||||||||
| General business and foreign tax credit carryforwards | 329 | 156 | |||||||||
| Capital loss carryforwards | 6,041 | 10,013 | |||||||||
| Total deferred tax assets | 10,299 | 11,993 | |||||||||
| Deferred tax liabilities: | |||||||||||
| Net basis differences in portfolio investments | (1,484) | (3,777) | |||||||||
| Net unrealized appreciation of portfolio investments | (12,074) | (8,578) | |||||||||
| Total deferred tax liabilities | (13,558) | (12,355) | |||||||||
| Total deferred tax liabilities, net | $ | (3,259) | $ | (362) | |||||||
| Period | Total number of shares purchased | Average price paid per share | Total number of shares purchased as part of publicly announced plans or programs | Approximate dollar value of shares that may yet be purchased under the plans or programs | |||||||||||||||||||
| April 1 through June 30, 2021 | 383,513 | $ | 7.46 | 383,513 | N/A | ||||||||||||||||||
| July 1 through September 30, 2021 | 438,292 | 7.57 | 438,292 | N/A | |||||||||||||||||||
| October 1 through December 31, 2021 | 511,314 | 7.60 | 511,314 | N/A | |||||||||||||||||||
| January 1 through March 31, 2022 | 489,031 | 7.75 | 489,031 | N/A | |||||||||||||||||||
| April 1 through June 30, 2022 | 536,065 | 7.77 | 536,065 | N/A | |||||||||||||||||||
| July 1 through September 30, 2022 | 527,508 | 7.64 | 527,508 | N/A | |||||||||||||||||||
| October 1 through December 31, 2022 | 522,310 | 7.66 | 522,310 | N/A | |||||||||||||||||||
| January 1 through March 31, 2023 | 519,489 | 7.67 | 519,489 | N/A | |||||||||||||||||||
| April 1 through June 30, 2023 (1) | 965,568 | 6.59 | 965,568 | N/A | |||||||||||||||||||
| July 1 through September 30, 2023 (2) | 978,579 | 7.12 | 978,579 | N/A | |||||||||||||||||||
| October 1 through December 31, 2023 (3) | 958,928 | 7.12 | 958,928 | N/A | |||||||||||||||||||
| Total | 6,830,597 | 6,830,597 | |||||||||||||||||||||
| Year Ended December 31, | |||||||||||||||||
| 2023 | 2022 | 2021 | |||||||||||||||
| (dollars in thousands) | |||||||||||||||||
| DRIP participation | $ | 18,417 | $ | 17,750 | $ | 11,160 | |||||||||||
| Shares issued for DRIP | 2,345,246 | 2,259,611 | 1,461,776 | ||||||||||||||
| Investments with equity capital commitments that have not yet funded: | Amount | |||||||
| Brightwood Capital Fund III, LP | $ | 216 | ||||||
| Freeport First Lien Loan Fund III LP | 8,340 | |||||||
| HPEP 3, L.P. | 1,308 | |||||||
| Total Equity Commitments | $ | 9,864 | ||||||
| Investments with commitments to fund revolving loans that have not been fully drawn or term loans with additional commitments not yet funded: | ||||||||
| CQ fluency, LLC | $ | 4,500 | ||||||
| Mako Steel, LP | 4,057 | |||||||
| Power System Solutions | 3,989 | |||||||
| Insight Borrower Corporation | 3,888 | |||||||
| AB Centers Acquisition Corporation | 2,810 | |||||||
| Garyline, LLC | 2,626 | |||||||
| SI East, LLC | 2,125 | |||||||
| Mini Melts of America, LLC | 1,988 | |||||||
| Bluestem Brands, Inc. | 1,840 | |||||||
| American Health Staffing Group, Inc. | 1,667 | |||||||
| IG Parent Corporation | 1,667 | |||||||
| ArborWorks, LLC | 1,481 | |||||||
| Infolinks Media Buyco, LLC | 1,260 | |||||||
| Burning Glass Intermediate Holding Company, Inc. | 1,239 | |||||||
| Bettercloud, Inc. | 1,216 | |||||||
| Richardson Sales Solutions | 1,061 | |||||||
| HEADLANDS OP-CO LLC | 1,000 | |||||||
| IG Investor, LLC | 1,000 | |||||||
| NexRev LLC | 1,000 | |||||||
| SPAU Holdings, LLC | 1,000 | |||||||
| Roof Opco, LLC | 972 | |||||||
| Bond Brand Loyalty ULC | 900 | |||||||
| Classic H&G Holdco, LLC | 860 | |||||||
| Engineering Research & Consulting, LLC | 828 | |||||||
| Year Ended December 31, | ||||||||||||
| Supplemental Disclosure of Cash Flow Information | 2017 | 2016 | 2015 | |||||||||
| Interest Paid | $ | 16,966 | $ | 13,560 | $ | 9,877 | ||||||
| Taxes Paid | 426 | 287 | 81 | |||||||||
| Supplemental Disclosure of Non-Cash Flow Information | ||||||||||||
| Stockholder distributions declared and unpaid | 4,772 | 4,354 | 3,717 | |||||||||
| Stockholder distributions reinvested | 27,641 | 24,769 | 16,939 | |||||||||
| Change in unpaid deferred offering costs | (21 | ) | 1,129 | 1,281 | ||||||||
| Unpaid deferred financing costs | 13 | 4 | 70 | |||||||||
| Unpaid sales commissions and dealer manager fees | — | 86 | — | |||||||||
| VVS Holdco, LLC | 800 | |||||||
| Cody Pools, Inc. | 786 | |||||||
| Purge Rite, LLC | 781 | |||||||
| Acumera, Inc. | 768 | |||||||
| NinjaTrader, LLC | 750 | |||||||
| Imaging Business Machines, L.L.C. | 692 | |||||||
| Centre Technologies Holdings, LLC | 600 | |||||||
| Paragon Healthcare, Inc. | 571 | |||||||
| Invincible Boat Company, LLC. | 561 | |||||||
| AVEX Aviation Holdings, LLC | 512 | |||||||
| Evergreen North America Acquisitions, LLC | 501 | |||||||
| Wall Street Prep, Inc. | 500 | |||||||
| Watterson Brands, LLC | 484 | |||||||
| GRT Rubber Technologies LLC | 468 | |||||||
| JTI Electrical & Mechanical, LLC | 440 | |||||||
| RA Outdoors LLC | 438 | |||||||
| Microbe Formulas, LLC | 434 | |||||||
| PTL US Bidco, Inc | 427 | |||||||
| CaseWorthy, Inc. | 400 | |||||||
| Trantech Radiator Topco, LLC | 400 | |||||||
| Chamberlin Holding LLC | 400 | |||||||
| Johnson Downie Opco, LLC | 400 | |||||||
| Channel Partners Intermediateco, LLC | 381 | |||||||
| ITA Holdings Group, LLC | 366 | |||||||
| Escalent, Inc. | 349 | |||||||
| South Coast Terminals Holdings, LLC | 343 | |||||||
| Gamber-Johnson Holdings, LLC | 300 | |||||||
| Pinnacle TopCo, LLC | 285 | |||||||
| Batjer TopCo, LLC | 230 | |||||||
| Metalforming Holdings, LLC | 205 | |||||||
| Career Team Holdings, LLC | 200 | |||||||
| ATS Operating, LLC | 200 | |||||||
| Mystic Logistics Holdings, LLC | 200 | |||||||
| Orttech Holdings, LLC | 200 | |||||||
| Analytical Systems Keco Holdings, LLC | 145 | |||||||
| Elgin AcquireCo, LLC | 123 | |||||||
| Clad-Rex Steel, LLC | 100 | |||||||
| Gulf Publishing Holdings, LLC | 100 | |||||||
| AAC Holdings, Inc. | 71 | |||||||
| Inspire Aesthetics Management, LLC | 43 | |||||||
| Adams Publishing Group, LLC | 5 | |||||||
| Interface Security Systems, L.L.C | 1 | |||||||
| Total Loan Commitments | $ | 60,934 | ||||||
| Total Commitments | $ | 70,798 | ||||||
Management Fee (1) | Subordinated Incentive Fee (1) | Capital Gain Incentive Fee (1) | Expense Support (1) | ||||||||||||||||||||||||||||||
| Quarter Ended | Waivers | Repaid to Adviser (2) | Waivers | Repaid to Adviser (2) | Waivers | Repaid to Adviser (2) | Payments | Repaid to Adviser (2) | Operating Expense Ratio (3) | Annualized Distribution Rate (4) | Eligible to be Repaid Through | ||||||||||||||||||||||
| 6/30/2012 | $ | 31 | $ | — | $ | 18 | $ | — | $ | — | $ | — | $ | — | $ | — | 1.35% | $ | 0.70 | Expired | |||||||||||||
| 9/30/2012 | $ | 97 | $ | — | $ | 52 | $ | — | $ | 3 | $ | — | $ | — | $ | — | 1.97% | $ | 0.70 | Expired | |||||||||||||
| 12/31/2012 | $ | 104 | $ | — | $ | 53 | $ | — | $ | — | $ | — | $ | — | $ | — | 2.96% | $ | 0.70 | Expired | |||||||||||||
| 3/31/2013 | $ | 84 | $ | — | $ | — | $ | — | $ | — | $ | — | $ | — | $ | — | 1.86% | $ | 0.70 | Expired | |||||||||||||
| 6/30/2013 | $ | 118 | $ | — | $ | — | $ | — | $ | — | $ | — | $ | — | $ | — | 1.36% | $ | 0.70 | Expired | |||||||||||||
| 9/30/2013 | $ | 268 | $ | — | $ | — | $ | — | $ | — | $ | — | $ | — | $ | — | 1.22% | $ | 0.70 | Expired | |||||||||||||
| 12/31/2013 | $ | 309 | $ | — | $ | — | $ | — | $ | 5 | $ | — | $ | 153 | $ | — | 0.49% | $ | 0.70 | Expired | |||||||||||||
| 3/31/2014 | $ | 306 | $ | — | $ | — | $ | — | $ | — | $ | — | $ | — | $ | — | 1.28% | $ | 0.70 | Expired | |||||||||||||
| 6/30/2014 | $ | 548 | $ | — | $ | — | $ | — | $ | — | $ | — | $ | — | $ | — | 1.28% | $ | 0.70 | Expired | |||||||||||||
| 9/30/2014 | $ | 821 | $ | — | $ | — | $ | — | $ | — | $ | — | $ | 328 | $ | — | 1.23% | $ | 0.70 | Expired | |||||||||||||
| 12/31/2014 | $ | 148 | $ | — | $ | 451 | $ | — | $ | — | $ | — | $ | — | $ | — | 1.70% | $ | 0.70 | Expired | |||||||||||||
| 3/31/2015 | $ | — | $ | — | $ | 358 | $ | — | $ | — | $ | — | $ | — | $ | — | 1.78% | $ | 0.70 | 3/31/2018 | |||||||||||||
| 6/30/2015 | $ | — | $ | — | $ | 930 | $ | — | $ | — | $ | — | $ | — | $ | — | 1.69% | $ | 0.70 | 6/30/2018 | |||||||||||||
| 9/30/2015 | $ | — | $ | — | $ | 155 | $ | — | $ | — | $ | — | $ | — | $ | — | 2.11% | $ | 0.70 | 9/30/2018 | |||||||||||||
| 12/31/2015 | $ | — | $ | — | $ | 1,159 | $ | — | $ | — | $ | — | $ | — | $ | — | 2.27% | $ | 0.70 | 12/31/2018 | |||||||||||||
| 3/31/2016 | $ | — | $ | — | $ | 493 | $ | — | $ | — | $ | — | $ | — | $ | — | 1.83% | $ | 0.70 | 3/31/2019 | |||||||||||||
| 6/30/2016 | $ | — | $ | — | $ | — | $ | — | $ | — | $ | — | $ | — | $ | — | 1.77% | $ | 0.70 | 6/30/2019 | |||||||||||||
| 9/30/2016 | $ | — | $ | — | $ | — | $ | — | $ | — | $ | — | $ | — | $ | — | 1.73% | $ | 0.70 | 9/30/2019 | |||||||||||||
| 12/31/2016 | $ | — | $ | — | $ | 1,196 | $ | — | $ | — | $ | — | $ | — | $ | — | 1.67% | $ | 0.70 | 12/31/2019 | |||||||||||||
| 3/31/2017 | $ | — | $ | — | $ | 1,495 | $ | — | $ | — | $ | — | $ | — | $ | — | 1.62% | $ | 0.70 | 3/31/2020 | |||||||||||||
| 6/30/2017 | $ | — | $ | — | $ | 823 | $ | — | $ | — | $ | — | $ | — | $ | — | 1.60% | $ | 0.70 | 6/30/2020 | |||||||||||||
| 9/30/2017 | $ | — | $ | — | $ | — | $ | — | $ | — | $ | — | $ | — | $ | — | 1.77% | $ | 0.70 | 9/30/2020 | |||||||||||||
| 12/31/2017 | $ | — | $ | — | $ | 711 | $ | — | $ | — | $ | — | $ | — | $ | — | 1.82% | $ | 0.70 | 12/31/2020 | |||||||||||||
| Internal Administrative Services | |||||||||||||||
| Quarter Ended | Waivers | Repaid to Adviser | Operating Expense Ratio (1) | Annualized Distribution Rate (2) | Eligible to be Repaid Through (3) | ||||||||||
| 6/30/2012 | $ | 25 | $ | — | 1.35% | $ | 0.70 | Not Eligible to be Repaid | |||||||
| 9/30/2012 | $ | 129 | $ | ��� | 1.97% | $ | 0.70 | Not Eligible to be Repaid | |||||||
| 12/31/2012 | $ | 284 | $ | — | 2.96% | $ | 0.70 | Not Eligible to be Repaid | |||||||
| 3/31/2013 | $ | 233 | $ | — | 1.86% | $ | 0.70 | Not Eligible to be Repaid | |||||||
| 6/30/2013 | $ | 222 | $ | — | 1.36% | $ | 0.70 | Not Eligible to be Repaid | |||||||
| 9/30/2013 | $ | 234 | $ | — | 1.22% | $ | 0.70 | Not Eligible to be Repaid | |||||||
| 12/31/2013 | $ | 329 | $ | — | 0.49% | $ | 0.70 | Not Eligible to be Repaid | |||||||
| 3/31/2014 | $ | 329 | $ | — | 1.28% | $ | 0.70 | Not Eligible to be Repaid | |||||||
| 6/30/2014 | $ | 385 | $ | — | 1.28% | $ | 0.70 | Not Eligible to be Repaid | |||||||
| 9/30/2014 | $ | 371 | $ | — | 1.23% | $ | 0.70 | Not Eligible to be Repaid | |||||||
| 12/31/2014 | $ | 412 | $ | — | 1.70% | $ | 0.70 | Not Eligible to be Repaid | |||||||
| 3/31/2015 | $ | 437 | $ | — | 1.78% | $ | 0.70 | Not Eligible to be Repaid | |||||||
| 6/30/2015 | $ | 480 | $ | — | 1.69% | $ | 0.70 | Not Eligible to be Repaid | |||||||
| 9/30/2015 | $ | 517 | $ | — | 2.11% | $ | 0.70 | Not Eligible to be Repaid | |||||||
| 12/31/2015 | $ | 603 | $ | — | 2.27% | $ | 0.70 | Not Eligible to be Repaid | |||||||
| 3/31/2016 | $ | 533 | $ | — | 1.83% | $ | 0.70 | Not Eligible to be Repaid | |||||||
| 6/30/2016 | $ | 574 | $ | — | 1.77% | $ | 0.70 | Not Eligible to be Repaid | |||||||
| 9/30/2016 | $ | 529 | $ | — | 1.73% | $ | 0.70 | Not Eligible to be Repaid | |||||||
| 12/31/2016 | $ | 679 | $ | — | 1.67% | $ | 0.70 | Not Eligible to be Repaid | |||||||
| 3/31/2017 | $ | 661 | $ | — | 1.62% | $ | 0.70 | Not Eligible to be Repaid | |||||||
| 6/30/2017 | $ | 873 | $ | — | 1.60% | $ | 0.70 | Not Eligible to be Repaid | |||||||
| 9/30/2017 | $ | 694 | $ | — | 1.77% | $ | 0.70 | Not Eligible to be Repaid | |||||||
| 12/31/2017 | $ | 786 | $ | — | 1.82% | $ | 0.70 | Not Eligible to be Repaid | |||||||
| Incurred | Unpaid as of | ||||||||||||||||||
| Year Ended December 31, | December 31, | ||||||||||||||||||
| Type and Recipient | 2017 | 2016 | 2015 | 2017 | 2016 | ||||||||||||||
Incentive Fees on Income (1) - the Adviser, Sub-Adviser | $ | — | $ | — | $ | — | $ | — | $ | — | |||||||||
Capital Gains Incentive Fee (1) - the Adviser, Sub-Adviser | — | — | — | — | — | ||||||||||||||
| Offering Costs - the Adviser, Sub-Adviser | 1,181 | 1,581 | 3,309 | — | (23 | ) | |||||||||||||
| Expense Support from Adviser | — | — | — | — | — | ||||||||||||||
Other (2) - the Adviser | 693 | 458 | 463 | 59 | 121 | ||||||||||||||
| Selling Commissions - Dealer Manager | 2,577 | 4,772 | 17,489 | — | 92 | ||||||||||||||
| Dealer Manager Fee - Dealer Manager | 1,453 | 2,348 | 8,210 | — | (6 | ) | |||||||||||||
| Due to Affiliates | $ | 59 | $ | 184 | |||||||||||||||
Base Management Fees (1) - the Adviser, Sub-Adviser | $ | 21,785 | $ | 19,151 | $ | 15,541 | $ | 5,682 | $ | 5,054 | |||||||||
| For the Three Months Ended | Repurchase Date | Shares Repurchased | Percentage of Shares Tendered that were Repurchased | Repurchase Price per Share | Aggregate Consideration for Repurchased Shares | ||||||||||||
| September 30, 2013 | — | — | 100 | % | $ | — | $ | — | |||||||||
| December 31, 2013 | 12/31/2013 | 395 | 100 | % | 8.89 | 3,512 | |||||||||||
| March 31, 2014 | 3/31/2014 | 1,667 | 100 | % | 8.85 | 14,753 | |||||||||||
| June 30, 2014 | 6/30/2014 | 9,763 | 100 | % | 8.87 | 86,598 | |||||||||||
| September 30, 2014 | 9/30/2014 | 6,093 | 100 | % | 8.82 | 53,740 | |||||||||||
| December 31, 2014 | 12/17/2014 | 340 | 100 | % | 8.51 | 2,893 | |||||||||||
| March 31, 2015 | 3/25/2015 | 33,842 | 100 | % | 8.54 | 289,011 | |||||||||||
| June 30, 2015 | 6/24/2015 | 52,799 | 100 | % | 8.71 | 459,879 | |||||||||||
| September 30, 2015 | 9/23/2015 | 82,165 | 100 | % | 8.48 | 696,759 | |||||||||||
| December 31, 2015 | 12/23/2015 | 191,534 | 100 | % | 7.88 | 1,509,288 | |||||||||||
| March 31, 2016 | 3/30/2016 and 3/31/2016 | 200,508 | 100 | % | 7.62 | 1,527,873 | |||||||||||
| June 30, 2016 | 6/23/2016 | 639,880 | 100 | % | 7.81 | 4,997,465 | |||||||||||
| September 30, 2016 | 9/22/2016 | 239,605 | 100 | % | 7.92 | 1,897,674 | |||||||||||
| December 31, 2016 | 12/22/2016 | 306,426 | 100 | % | 8.08 | 2,475,925 | |||||||||||
| March 31, 2017 | 3/23/2017 | 614,180 | 100 | % | 8.23 | 5,054,698 | |||||||||||
| June 30, 2017 | 6/16/2017 | 346,307 | 100 | % | 8.20 | 2,839,713 | |||||||||||
| September 30, 2017 | 9/21/2017 | 747,785 | 100 | % | 8.19 | 6,124,356 | |||||||||||
| December 31, 2017 | 12/21/2017 | 1,105,578 | 100 | % | 8.10 | 8,955,178 | |||||||||||
| 4,578,867 | $ | 36,989,315 | |||||||||||||||
| Commitments and Contingencies | |||||||
| (dollars in thousands) | |||||||
| December 31, 2017 | December 31, 2016 | ||||||
| Unfunded Loan Commitments | |||||||
| Apex Linen Services, Inc. | $ | 403 | $ | 397 | |||
| Arcus Hunting, LLC | 976 | 2,136 | |||||
| BarFly Ventures, LLC | 613 | 881 | |||||
| BigName Holdings, LLC | 101 | — | |||||
| Boccella Precast Products, LLC | 500 | — | |||||
| Buca C, LLC | — | 1,548 | |||||
| CapFusion Holding, LLC | — | 394 | |||||
| CDHA Management, LLC | 2,343 | 3,259 | |||||
| Charps, LLC | 1,000 | — | |||||
| Clad-Rex Steel, LLC | 100 | — | |||||
| CTVSH, PLLC | 200 | — | |||||
| Datacom, LLC | 25 | 1,302 | |||||
| Felix Investments Holdings II LLC | 1,667 | — | |||||
| Gamber-Johnson Holdings, LLC | 300 | 300 | |||||
| GST Autoleather Inc. | 1,281 | — | |||||
| Guerdon Modular Holdings, Inc. | 400 | 400 | |||||
| Hawk Ridge Systems, LLC | 400 | 400 | |||||
| Hojeij Branded Foods, Inc. | 1,923 | 2,000 | |||||
| Hostway corporation | 7 | — | |||||
| HW Temps LLC | 200 | 50 | |||||
| Jackmont Hospitality, Inc. | — | 1,200 | |||||
| LaMi Products, LLC | 294 | 1,729 | |||||
| Market Force Information, Inc. | 400 | — | |||||
| Meisler Operating, LLC | 400 | — | |||||
| Minute Key, Inc. | — | 197 | |||||
| Mystic Logistics, Inc. | 200 | 194 | |||||
| NNE Issuer, LLC | 5,542 | — | |||||
| NuStep, LLC | 300 | — | |||||
| Pardus Oil & Gas, LLC | — | 357 | |||||
| Permian Holdco 2, Inc. | 97 | 290 | |||||
| PPC/Shift, LLC | 500 | 500 | |||||
| Resolute Industrial LLC | 5,750 | — | |||||
| Strike, LLC | — | 2,475 | |||||
| Unirush, LLC | — | 980 | |||||
| Volusion, LLC | — | 2,955 | |||||
| Wireless Vision Holdings, LLC | 2,084 | — | |||||
| Unfunded Capital Commitments | |||||||
| Brightwood Capital Fund III, LP | 1,000 | 1,000 | |||||
| Brightwood Capital Fund IV, LP | 9,000 | 10,000 | |||||
| Copper Trail Energy Fund I LP | 2,500 | — | |||||
| Freeport First Lien Loan Fund III, LP | 4,941 | 7,737 | |||||
| Total | $ | 45,447 | $ | 42,681 | |||
| Company | Total Rate | Base Rate | Spread | PIK Rate | Type of Investment(1)(10)(11) | Geography | Amount of Realized Gain/(Loss) | Amount of Unrealized Gain/(Loss) | Amount of Interest, Fees or Dividends Credited to Income(2) | December 31, 2022 Fair Value (13) | Gross Additions(3) | Gross Reductions(4) | December 31, 2023 Fair Value (13) | ||||||||||||||||||||||||||||||||||||||||||||||||||||
| Control Investments | |||||||||||||||||||||||||||||||||||||||||||||||||||||||||||||||||
| Copper Trail Fund Investments | LP Interests (CTMH, LP) | (9) | $ | — | $ | — | $ | 38 | $ | 588 | $ | — | $ | 20 | $ | 568 | |||||||||||||||||||||||||||||||||||||||||||||||||
| GRT Rubber Technologies LLC | 11.48% | SF+ | 6.00% | Secured Debt (12) | (8) | — | 3 | 88 | 330 | 852 | — | 1,182 | |||||||||||||||||||||||||||||||||||||||||||||||||||||
| 13.48% | SF+ | 8.00% | Secured Debt | (8) | — | (50) | 2,696 | 19,943 | 51 | 50 | 19,944 | ||||||||||||||||||||||||||||||||||||||||||||||||||||||
| Member Units | (8) | — | — | 90 | 21,890 | — | — | 21,890 | |||||||||||||||||||||||||||||||||||||||||||||||||||||||||
| Harris Preston Fund Investments | LP Interests (2717 MH, L.P.) | (8) | 2,223 | (952) | 142 | 7,552 | 2,796 | 4,298 | 6,050 | ||||||||||||||||||||||||||||||||||||||||||||||||||||||||
| Volusion, LLC | 10.00% | Secured Debt | (8) | — | — | 69 | — | 900 | — | 900 | |||||||||||||||||||||||||||||||||||||||||||||||||||||||
| 11.50% | Secured Debt | (8) | (1,366) | 780 | 71 | 6,392 | — | 6,392 | — | ||||||||||||||||||||||||||||||||||||||||||||||||||||||||
| 8.00% | Unsecured Convertible Debt | (8) | (175) | 175 | — | — | 175 | 175 | — | ||||||||||||||||||||||||||||||||||||||||||||||||||||||||
| Preferred Member Units | (8) | — | — | 1 | — | — | — | — | |||||||||||||||||||||||||||||||||||||||||||||||||||||||||
| Preferred Member Units | (8) | — | (596) | — | — | 4,906 | 1,796 | 3,110 | |||||||||||||||||||||||||||||||||||||||||||||||||||||||||
| Preferred Member Units | (8) | — | — | — | — | — | — | — | |||||||||||||||||||||||||||||||||||||||||||||||||||||||||
| Common Stock | (8) | — | (1,104) | — | — | 1,104 | 1,104 | — | |||||||||||||||||||||||||||||||||||||||||||||||||||||||||
| Warrants | (8) | — | 1,104 | — | — | — | — | — | |||||||||||||||||||||||||||||||||||||||||||||||||||||||||
| Other Amounts related to investments transferred to or from other 1940 Act classification during the period | 1,541 | (649) | (94) | (6,392) | 6,392 | — | — | ||||||||||||||||||||||||||||||||||||||||||||||||||||||||||
| Total Control Investments | $ | 2,223 | $ | (1,289) | $ | 3,101 | $ | 50,303 | $ | 17,176 | $ | 13,835 | $ | 53,644 | |||||||||||||||||||||||||||||||||||||||||||||||||||
| Affiliate Investments | |||||||||||||||||||||||||||||||||||||||||||||||||||||||||||||||||
| AFG Capital Group, LLC | Preferred Member Units | (8) | $ | 1,800 | $ | (2,050) | $ | — | $ | 2,350 | $ | 1,800 | $ | 4,150 | $ | — | |||||||||||||||||||||||||||||||||||||||||||||||||
| Analytical Systems Keco Holdings, LLC | 15.38% | SF+ | 10.00% | Secured Debt (12) | (8) | — | — | 4 | (2) | 56 | — | 54 | |||||||||||||||||||||||||||||||||||||||||||||||||||||
| 15.38% | SF+ | 10.00% | Secured Debt | (8) | — | — | 188 | 1,135 | 21 | 136 | 1,020 | ||||||||||||||||||||||||||||||||||||||||||||||||||||||
| 14.13% | Preferred Member Units | (8) | — | — | — | — | — | — | — | ||||||||||||||||||||||||||||||||||||||||||||||||||||||||
| Preferred Member Units | (8) | — | 330 | — | 880 | 330 | — | 1,210 | |||||||||||||||||||||||||||||||||||||||||||||||||||||||||
| Warrants | (8) | — | — | — | — | — | — | — | |||||||||||||||||||||||||||||||||||||||||||||||||||||||||
| ATX Networks Corp. | L+ | 7.50% | Secured Debt | (6) | — | (102) | 856 | 6,368 | 545 | 6,913 | — | ||||||||||||||||||||||||||||||||||||||||||||||||||||||
| 10.00% | Unsecured Debt | (6) | — | (276) | 1,135 | 2,614 | 1,135 | 3,749 | — | ||||||||||||||||||||||||||||||||||||||||||||||||||||||||
| Common Stock | (6) | 3,178 | (3,290) | — | 3,290 | 3,178 | 6,468 | — | |||||||||||||||||||||||||||||||||||||||||||||||||||||||||
| Barfly Ventures, LLC | Member Units | (5) | — | 273 | — | 1,107 | 273 | — | 1,380 | ||||||||||||||||||||||||||||||||||||||||||||||||||||||||
| Batjer TopCo, LLC | 10.00% | Secured Debt (12) | (8) | — | 1 | — | (1) | 1 | — | — | |||||||||||||||||||||||||||||||||||||||||||||||||||||||
| 10.00% | Secured Debt (12) | (8) | — | — | 2 | — | 70 | 40 | 30 | ||||||||||||||||||||||||||||||||||||||||||||||||||||||||
| 10.00% | Secured Debt | (8) | — | 15 | 129 | 1,205 | 21 | 51 | 1,175 | ||||||||||||||||||||||||||||||||||||||||||||||||||||||||
| Preferred Stock | (8) | — | 225 | 76 | 455 | 225 | — | 680 | |||||||||||||||||||||||||||||||||||||||||||||||||||||||||
| Brewer Crane Holdings, LLC | 15.46% | L+ | 10.00% | Secured Debt | (9) | — | — | 224 | 1,491 | 8 | 125 | 1,374 | |||||||||||||||||||||||||||||||||||||||||||||||||||||
| Preferred Member Units | (9) | — | (370) | 30 | 1,770 | — | 370 | 1,400 | |||||||||||||||||||||||||||||||||||||||||||||||||||||||||
| Centre Technologies Holdings, LLC | SF+ | 9.00% | Secured Debt (12) | (8) | — | — | 3 | — | — | — | — | ||||||||||||||||||||||||||||||||||||||||||||||||||||||
| 14.48% | SF+ | 9.00% | Secured Debt | (8) | — | 29 | 572 | 3,731 | 663 | — | 4,394 | ||||||||||||||||||||||||||||||||||||||||||||||||||||||
| Preferred Member Units | (8) | — | 590 | 30 | 2,170 | 590 | — | 2,760 | |||||||||||||||||||||||||||||||||||||||||||||||||||||||||
| Chamberlin Holding LLC | SF+ | 6.00% | Secured Debt (12) | (8) | — | 49 | 11 | — | — | — | — | ||||||||||||||||||||||||||||||||||||||||||||||||||||||
| Company | Total Rate | Base Rate | Spread | PIK Rate | Type of Investment(1)(10)(11) | Geography | Amount of Realized Gain/(Loss) | Amount of Unrealized Gain/(Loss) | Amount of Interest, Fees or Dividends Credited to Income(2) | December 31, 2022 Fair Value (13) | Gross Additions(3) | Gross Reductions(4) | December 31, 2023 Fair Value (13) | ||||||||||||||||||||||||||||||||||||||||||||||||||||
| 13.49% | SF+ | 8.00% | Secured Debt | (8) | — | (4) | 553 | 4,236 | 4 | 335 | 3,905 | ||||||||||||||||||||||||||||||||||||||||||||||||||||||
| Member Units | (8) | — | 1,599 | 1,045 | 5,728 | 1,602 | — | 7,330 | |||||||||||||||||||||||||||||||||||||||||||||||||||||||||
| Member Units | (8) | — | 37 | 23 | 678 | 38 | 1 | 715 | |||||||||||||||||||||||||||||||||||||||||||||||||||||||||
| Charps, LLC | Preferred Member Units | (5) | — | 590 | 366 | 3,330 | 590 | — | 3,920 | ||||||||||||||||||||||||||||||||||||||||||||||||||||||||
| Clad-Rex Steel, LLC | 11.50% | Secured Debt (12) | (5) | — | — | — | — | — | — | — | |||||||||||||||||||||||||||||||||||||||||||||||||||||||
| 11.50% | Secured Debt | (5) | — | (37) | 284 | 2,620 | — | 517 | 2,103 | ||||||||||||||||||||||||||||||||||||||||||||||||||||||||
| 10.00% | Secured Debt | (5) | — | — | 26 | 260 | — | 9 | 251 | ||||||||||||||||||||||||||||||||||||||||||||||||||||||||
| Member Units | (5) | — | (760) | 69 | 2,060 | — | 760 | 1,300 | |||||||||||||||||||||||||||||||||||||||||||||||||||||||||
| Member Units | (5) | — | 55 | — | 152 | 130 | — | 282 | |||||||||||||||||||||||||||||||||||||||||||||||||||||||||
| Cody Pools, Inc. | 12.50% | Secured Debt (12) | (8) | — | 2 | 1 | — | — | — | — | |||||||||||||||||||||||||||||||||||||||||||||||||||||||
| 12.50% | Secured Debt | (8) | — | 22 | 562 | — | 7,872 | 761 | 7,111 | ||||||||||||||||||||||||||||||||||||||||||||||||||||||||
| L+ | 10.50% | Secured Debt | (8) | — | (11) | 26 | 273 | 14 | 287 | — | |||||||||||||||||||||||||||||||||||||||||||||||||||||||
| L+ | 10.50% | Secured Debt | (8) | — | (96) | 500 | 6,882 | — | 6,882 | — | |||||||||||||||||||||||||||||||||||||||||||||||||||||||
| Preferred Member Units | (8) | — | 3,570 | 1,219 | 14,550 | 3,570 | — | 18,120 | |||||||||||||||||||||||||||||||||||||||||||||||||||||||||
| Colonial Electric Company LLC | Secured Debt | (6) | — | — | 12 | — | 400 | 400 | — | ||||||||||||||||||||||||||||||||||||||||||||||||||||||||
| 12.00% | Secured Debt | (6) | — | (41) | 471 | 5,729 | 34 | 356 | 5,407 | ||||||||||||||||||||||||||||||||||||||||||||||||||||||||
| Preferred Member Units | (6) | — | 360 | — | — | 600 | — | 600 | |||||||||||||||||||||||||||||||||||||||||||||||||||||||||
| Preferred Member Units | (6) | — | (370) | — | 2,290 | — | 370 | 1,920 | |||||||||||||||||||||||||||||||||||||||||||||||||||||||||
| Compass Systems & Sales, LLC | 13.50% | Secured Debt | (5) | — | — | — | — | — | — | — | |||||||||||||||||||||||||||||||||||||||||||||||||||||||
| 13.50% | Secured Debt | (5) | — | — | 69 | — | 4,175 | — | 4,175 | ||||||||||||||||||||||||||||||||||||||||||||||||||||||||
| Preferred Equity | (5) | — | — | — | — | 1,863 | — | 1,863 | |||||||||||||||||||||||||||||||||||||||||||||||||||||||||
| Datacom, LLC | 7.50% | Secured Debt | (8) | — | — | 4 | 25 | 89 | 65 | 49 | |||||||||||||||||||||||||||||||||||||||||||||||||||||||
| 10.00% | Secured Debt | (8) | — | (14) | 107 | 865 | 22 | 43 | 844 | ||||||||||||||||||||||||||||||||||||||||||||||||||||||||
| Preferred Member Units | (8) | — | (290) | — | 300 | — | 290 | 10 | |||||||||||||||||||||||||||||||||||||||||||||||||||||||||
| Digital Products Holdings LLC | 15.38% | SF+ | 10.00% | Secured Debt | (5) | — | (17) | 586 | 3,878 | — | 205 | 3,673 | |||||||||||||||||||||||||||||||||||||||||||||||||||||
| Preferred Member Units | (5) | — | — | 50 | 2,459 | — | — | 2,459 | |||||||||||||||||||||||||||||||||||||||||||||||||||||||||
| Direct Marketing Solutions, Inc. | 14.00% | Secured Debt | (9) | — | (2) | 13 | — | 227 | 10 | 217 | |||||||||||||||||||||||||||||||||||||||||||||||||||||||
| 14.00% | Secured Debt | (9) | — | (19) | 730 | 5,352 | 19 | 369 | 5,002 | ||||||||||||||||||||||||||||||||||||||||||||||||||||||||
| Preferred Stock | (9) | — | (380) | 43 | 5,558 | — | 378 | 5,180 | |||||||||||||||||||||||||||||||||||||||||||||||||||||||||
| Flame King Holdings, LLC | L+ | 6.50% | Secured Debt | (9) | — | (15) | 121 | 1,900 | 15 | 1,915 | — | ||||||||||||||||||||||||||||||||||||||||||||||||||||||
| L+ | 9.00% | Secured Debt | (9) | — | (123) | 478 | 5,300 | 123 | 5,423 | — | |||||||||||||||||||||||||||||||||||||||||||||||||||||||
| Preferred Equity | (9) | — | 2,570 | 814 | 4,400 | 2,570 | — | 6,970 | |||||||||||||||||||||||||||||||||||||||||||||||||||||||||
| Freeport Financial Funds | LP Interests (Freeport First Lien Loan Fund III LP) (12) | (5) | — | — | 598 | 5,848 | — | 2,143 | 3,705 | ||||||||||||||||||||||||||||||||||||||||||||||||||||||||
| Gamber-Johnson Holdings, LLC | SF+ | 7.50% | Secured Debt (12) | (5) | — | — | 2 | — | — | — | — | ||||||||||||||||||||||||||||||||||||||||||||||||||||||
| 10.50% | SF+ | 7.50% | Secured Debt | (5) | — | (88) | 1,727 | 16,020 | 88 | 2,588 | 13,520 | ||||||||||||||||||||||||||||||||||||||||||||||||||||||
| Member Units | (5) | — | 11,460 | 1,491 | 12,720 | 11,460 | — | 24,180 | |||||||||||||||||||||||||||||||||||||||||||||||||||||||||
| GFG Group, LLC | 8.00% | Secured Debt | (5) | — | (25) | 263 | 2,836 | 25 | 525 | 2,336 | |||||||||||||||||||||||||||||||||||||||||||||||||||||||
| Preferred Member Units | (5) | — | 1,080 | 200 | 1,790 | 1,080 | — | 2,870 | |||||||||||||||||||||||||||||||||||||||||||||||||||||||||
| Gulf Publishing Holdings, LLC | SF+ | 9.50% | Secured Debt (12) | (8) | — | — | — | — | — | — | — | ||||||||||||||||||||||||||||||||||||||||||||||||||||||
| 12.50% | Secured Debt | (8) | — | — | 73 | 571 | — | — | 571 | ||||||||||||||||||||||||||||||||||||||||||||||||||||||||
| Preferred Equity | (8) | — | (330) | — | 950 | — | 330 | 620 | |||||||||||||||||||||||||||||||||||||||||||||||||||||||||
| Member Units | (8) | — | — | — | — | — | — | — | |||||||||||||||||||||||||||||||||||||||||||||||||||||||||
| Company | Total Rate | Base Rate | Spread | PIK Rate | Type of Investment(1)(10)(11) | Geography | Amount of Realized Gain/(Loss) | Amount of Unrealized Gain/(Loss) | Amount of Interest, Fees or Dividends Credited to Income(2) | December 31, 2022 Fair Value (13) | Gross Additions(3) | Gross Reductions(4) | December 31, 2023 Fair Value (13) | ||||||||||||||||||||||||||||||||||||||||||||||||||||
| HPEP 3, L.P. | LP Interests (HPEP 3, L.P.) (12) | (8) | — | 156 | 4 | 4,331 | 403 | 509 | 4,225 | ||||||||||||||||||||||||||||||||||||||||||||||||||||||||
| IG Investor, LLC | Secured Debt (12) | (6) | — | — | 5 | — | 173 | 200 | (27) | ||||||||||||||||||||||||||||||||||||||||||||||||||||||||
| 13.00% | Secured Debt | (6) | — | — | 692 | — | 9,179 | 110 | 9,069 | ||||||||||||||||||||||||||||||||||||||||||||||||||||||||
| Common Equity | (6) | — | — | — | — | 3,774 | 174 | 3,600 | |||||||||||||||||||||||||||||||||||||||||||||||||||||||||
| Independent Pet Partners Intermediate Holdings, LLC | Common Equity | (6) | — | (220) | — | — | 6,540 | 220 | 6,320 | ||||||||||||||||||||||||||||||||||||||||||||||||||||||||
| Integral Energy Services | 13.16% | SF+ | 7.50% | Secured Debt | (8) | — | (787) | 2,773 | 18,425 | 94 | 2,287 | 16,232 | |||||||||||||||||||||||||||||||||||||||||||||||||||||
| 10.00% | 10.00% | Preferred Equity | (8) | — | 85 | — | — | 350 | — | 350 | |||||||||||||||||||||||||||||||||||||||||||||||||||||||
| Common Stock | (8) | — | (1,300) | 50 | 1,490 | — | 1,300 | 190 | |||||||||||||||||||||||||||||||||||||||||||||||||||||||||
| Kickhaefer Manufacturing Company, LLC | 12.00% | Secured Debt | (5) | — | (18) | 668 | 5,093 | 58 | 218 | 4,933 | |||||||||||||||||||||||||||||||||||||||||||||||||||||||
| 9.00% | Secured Debt | (5) | — | — | 86 | 961 | — | 10 | 951 | ||||||||||||||||||||||||||||||||||||||||||||||||||||||||
| Preferred Equity | (5) | — | 620 | — | 1,800 | 620 | — | 2,420 | |||||||||||||||||||||||||||||||||||||||||||||||||||||||||
| Member Units | (5) | — | (30) | 29 | 713 | — | 30 | 683 | |||||||||||||||||||||||||||||||||||||||||||||||||||||||||
| Market Force Information, LLC | L+ | 11.00% | Secured Debt | (9) | (6,465) | 6,060 | — | 403 | 6,060 | 6,463 | — | ||||||||||||||||||||||||||||||||||||||||||||||||||||||
| Member Units | (9) | (4,160) | 4,160 | — | — | 4,160 | 4,160 | — | |||||||||||||||||||||||||||||||||||||||||||||||||||||||||
| MH Corbin Holding LLC | 13.00% | Secured Debt | (5) | — | 307 | 190 | 1,137 | 308 | 189 | 1,256 | |||||||||||||||||||||||||||||||||||||||||||||||||||||||
| Preferred Member Units | (5) | — | 80 | — | — | 80 | — | 80 | |||||||||||||||||||||||||||||||||||||||||||||||||||||||||
| Preferred Member Units | (5) | — | — | — | — | — | — | — | |||||||||||||||||||||||||||||||||||||||||||||||||||||||||
| Mystic Logistics Holdings, LLC | Secured Debt (12) | (6) | — | — | 1 | — | — | — | — | ||||||||||||||||||||||||||||||||||||||||||||||||||||||||
| 10.00% | Secured Debt | (6) | — | — | 146 | 1,436 | — | — | 1,436 | ||||||||||||||||||||||||||||||||||||||||||||||||||||||||
| Common Stock | (6) | — | 890 | 1,131 | 5,708 | 890 | — | 6,598 | |||||||||||||||||||||||||||||||||||||||||||||||||||||||||
| NexRev LLC | 10.00% | Secured Debt (12) | (8) | — | — | — | — | — | — | — | |||||||||||||||||||||||||||||||||||||||||||||||||||||||
| 10.00% | Secured Debt | (8) | — | 708 | 289 | 2,119 | 729 | 413 | 2,435 | ||||||||||||||||||||||||||||||||||||||||||||||||||||||||
| Preferred Member Units | (8) | — | 1,310 | 166 | 280 | 1,310 | — | 1,590 | |||||||||||||||||||||||||||||||||||||||||||||||||||||||||
| NuStep, LLC | 11.98% | SF+ | 6.50% | Secured Debt | (5) | — | (2) | 120 | 1,100 | 1 | 202 | 899 | |||||||||||||||||||||||||||||||||||||||||||||||||||||
| 12.00% | Secured Debt | (5) | — | — | 564 | 4,603 | 3 | — | 4,606 | ||||||||||||||||||||||||||||||||||||||||||||||||||||||||
| Preferred Member Units | (5) | — | 300 | — | 2,010 | 300 | — | 2,310 | |||||||||||||||||||||||||||||||||||||||||||||||||||||||||
| Preferred Member Units | (5) | — | — | — | 1,290 | — | — | 1,290 | |||||||||||||||||||||||||||||||||||||||||||||||||||||||||
| Oneliance, LLC | 16.48% | SF+ | 11.00% | Secured Debt | (7) | — | (7) | 231 | 1,380 | 6 | 47 | 1,339 | |||||||||||||||||||||||||||||||||||||||||||||||||||||
| Preferred Stock | (7) | — | — | — | 264 | 18 | — | 282 | |||||||||||||||||||||||||||||||||||||||||||||||||||||||||
| Orttech Holdings, LLC | SF+ | 11.00% | Secured Debt (12) | (5) | — | 2 | 1 | (2) | 2 | — | — | ||||||||||||||||||||||||||||||||||||||||||||||||||||||
| 16.48% | SF+ | 11.00% | Secured Debt | (5) | — | 58 | 955 | 5,814 | 86 | 390 | 5,510 | ||||||||||||||||||||||||||||||||||||||||||||||||||||||
| Preferred Stock | (5) | — | 1,320 | 274 | 2,940 | 1,320 | — | 4,260 | |||||||||||||||||||||||||||||||||||||||||||||||||||||||||
| Pinnacle TopCo, LLC | 8.00% | Secured Debt (12) | (8) | — | — | 1 | — | 105 | — | 105 | |||||||||||||||||||||||||||||||||||||||||||||||||||||||
| 13.00% | Secured Debt | (8) | — | — | 34 | — | 7,472 | — | 7,472 | ||||||||||||||||||||||||||||||||||||||||||||||||||||||||
| Preferred Equity | (8) | — | — | — | — | 3,135 | — | 3,135 | |||||||||||||||||||||||||||||||||||||||||||||||||||||||||
| Robbins Bros. Jewelry, Inc. | 12.50% | Secured Debt | (9) | — | — | 4 | (8) | 2 | — | (6) | |||||||||||||||||||||||||||||||||||||||||||||||||||||||
| 12.50% | Secured Debt | (9) | — | (323) | 507 | 3,902 | 18 | 499 | 3,421 | ||||||||||||||||||||||||||||||||||||||||||||||||||||||||
| Preferred Equity | (9) | — | (1,650) | — | 1,650 | — | 1,650 | — | |||||||||||||||||||||||||||||||||||||||||||||||||||||||||
| SI East, LLC | 11.25% | Secured Debt (12) | (7) | — | 6 | 28 | — | 625 | 250 | 375 | |||||||||||||||||||||||||||||||||||||||||||||||||||||||
| 12.47% | Secured Debt | (7) | — | 161 | 1,278 | — | 18,179 | — | 18,179 | ||||||||||||||||||||||||||||||||||||||||||||||||||||||||
| 9.50% | Secured Debt | (7) | — | (134) | 1,403 | 29,929 | — | 29,929 | — | ||||||||||||||||||||||||||||||||||||||||||||||||||||||||
| Preferred Member Units | (7) | — | 1,737 | 399 | 4,550 | 1,840 | — | 6,390 | |||||||||||||||||||||||||||||||||||||||||||||||||||||||||
| Student Resource Center, LLC | 8.50% | 8.50% | Secured Debt | (6) | — | (1,881) | 364 | 5,063 | 244 | 1,764 | 3,543 | ||||||||||||||||||||||||||||||||||||||||||||||||||||||
| Company | Total Rate | Base Rate | Spread | PIK Rate | Type of Investment(1)(10)(11) | Geography | Amount of Realized Gain/(Loss) | Amount of Unrealized Gain/(Loss) | Amount of Interest, Fees or Dividends Credited to Income(2) | December 31, 2022 Fair Value (13) | Gross Additions(3) | Gross Reductions(4) | December 31, 2023 Fair Value (13) | ||||||||||||||||||||||||||||||||||||||||||||||||||||
| Preferred Equity | (6) | — | — | — | — | — | — | — | |||||||||||||||||||||||||||||||||||||||||||||||||||||||||
| Tedder Industries, LLC | 12.00% | Secured Debt | (9) | — | (28) | 56 | 460 | — | 28 | 432 | |||||||||||||||||||||||||||||||||||||||||||||||||||||||
| 12.00% | Secured Debt | (9) | — | (218) | 466 | 3,780 | 3 | 218 | 3,565 | ||||||||||||||||||||||||||||||||||||||||||||||||||||||||
| Preferred Member Units | (9) | — | (1,920) | — | 1,920 | — | 1,920 | — | |||||||||||||||||||||||||||||||||||||||||||||||||||||||||
| Preferred Member Units | (9) | — | (141) | — | — | 124 | 124 | — | |||||||||||||||||||||||||||||||||||||||||||||||||||||||||
| Preferred Member Units | (9) | — | (165) | — | — | 165 | 165 | — | |||||||||||||||||||||||||||||||||||||||||||||||||||||||||
| Trantech Radiator Topco, LLC | 8.00% | Secured Debt (12) | (7) | — | (2) | 3 | — | 2 | 2 | — | |||||||||||||||||||||||||||||||||||||||||||||||||||||||
| 12.00% | Secured Debt | (7) | — | (14) | 255 | 1,980 | 14 | 14 | 1,980 | ||||||||||||||||||||||||||||||||||||||||||||||||||||||||
| Common Stock | (7) | — | 1,230 | 29 | 1,950 | 1,230 | — | 3,180 | |||||||||||||||||||||||||||||||||||||||||||||||||||||||||
| VVS Holdco LLC | SF+ | 6.00% | Secured Debt (12) | (5) | — | — | 10 | (5) | 5 | — | — | ||||||||||||||||||||||||||||||||||||||||||||||||||||||
| 11.50% | Secured Debt | (5) | — | — | 904 | 7,421 | 55 | 550 | 6,926 | ||||||||||||||||||||||||||||||||||||||||||||||||||||||||
| Preferred Equity | (5) | — | (30) | 54 | 2,990 | 100 | 30 | 3,060 | |||||||||||||||||||||||||||||||||||||||||||||||||||||||||
| Other Amounts related to investments transferred to or from other 1940 Act classification during the period | (1,541) | 649 | (151) | — | — | — | — | ||||||||||||||||||||||||||||||||||||||||||||||||||||||||||
| Total Affiliate investments | $ | (7,188) | $ | 25,116 | $ | 29,805 | $ | 277,000 | $ | 115,308 | $ | 101,029 | $ | 291,279 | |||||||||||||||||||||||||||||||||||||||||||||||||||
| Company | Total Rate | Base Rate | Spread | PIK Rate | Type of Investment(1)(10)(11) | Geography | Amount of Realized Gain/(Loss) | Amount of Unrealized Gain/(Loss) | Amount of Interest, Fees or Dividends Credited to Income(2) | December 31, 2021 Fair Value | Gross Additions(3) | Gross Reductions(4) | December 31, 2022 Fair Value (13) | ||||||||||||||||||||||||||||||||||||||||||||||||||||
| Control Investments | |||||||||||||||||||||||||||||||||||||||||||||||||||||||||||||||||
| GRT Rubber Technologies LLC | 10.12% | L+ | 6.00% | Secured Debt | (8) | $ | — | $ | 6 | $ | 7 | $ | — | $ | 330 | $ | — | $ | 330 | ||||||||||||||||||||||||||||||||||||||||||||||
| 12.12% | L+ | 8.00% | Secured Debt | (8) | — | (32) | 1,972 | 19,152 | 824 | 33 | 19,943 | ||||||||||||||||||||||||||||||||||||||||||||||||||||||
| Member Units | (8) | — | (860) | 1,244 | 22,750 | — | 860 | 21,890 | |||||||||||||||||||||||||||||||||||||||||||||||||||||||||
| Harris Preston Fund Investments | LP Interests (2717 MH, L.P.) | (8) | — | 2,389 | — | 3,971 | 3,581 | — | 7,552 | ||||||||||||||||||||||||||||||||||||||||||||||||||||||||
| Copper Trail Fund Investments | LP Interests (CTMH, LP) | (9) | — | — | — | 710 | — | 122 | 588 | ||||||||||||||||||||||||||||||||||||||||||||||||||||||||
| Other Amounts related to investments transferred to or from other 1940 Act classification during the period | — | — | — | — | — | — | — | ||||||||||||||||||||||||||||||||||||||||||||||||||||||||||
| Total Control Investments | $ | — | $ | 1,503 | $ | 3,223 | $ | 46,583 | $ | 4,735 | $ | 1,015 | $ | 50,303 | |||||||||||||||||||||||||||||||||||||||||||||||||||
| Affiliate Investments | |||||||||||||||||||||||||||||||||||||||||||||||||||||||||||||||||
| AFG Capital Group, LLC | 10.00% | Secured Debt | (8) | $ | — | $ | — | $ | 1 | $ | 36 | $ | — | $ | 36 | $ | — | ||||||||||||||||||||||||||||||||||||||||||||||||
| Preferred Member Units | (8) | — | 420 | 50 | 1,930 | 420 | — | 2,350 | |||||||||||||||||||||||||||||||||||||||||||||||||||||||||
| Analytical Systems Keco Holdings, LLC | L+ | 10.00% | Secured Debt | (8) | — | — | 2 | (4) | 2 | — | (2) | ||||||||||||||||||||||||||||||||||||||||||||||||||||||
| 14.13% | L+ | 10.00% | Secured Debt | (8) | — | — | 174 | 1,182 | 23 | 70 | 1,135 | ||||||||||||||||||||||||||||||||||||||||||||||||||||||
| 14.13% | Preferred Member Units | (8) | — | — | — | — | — | — | — | ||||||||||||||||||||||||||||||||||||||||||||||||||||||||
| Preferred Member Units | (8) | — | (340) | — | 1,220 | — | 340 | 880 | |||||||||||||||||||||||||||||||||||||||||||||||||||||||||
| Warrants | (8) | — | — | — | — | — | — | — | |||||||||||||||||||||||||||||||||||||||||||||||||||||||||
| ATX Networks Corp. | 12.23% | L+ | 7.50% | Secured Debt | (6) | — | 135 | 756 | 7,121 | 364 | 1,117 | 6,368 | |||||||||||||||||||||||||||||||||||||||||||||||||||||
| 10.00% | 10.00% | Unsecured Debt | (6) | — | 309 | 327 | 1,977 | 637 | — | 2,614 | |||||||||||||||||||||||||||||||||||||||||||||||||||||||
| Common Stock | (6) | — | 3,290 | — | — | 3,290 | — | 3,290 | |||||||||||||||||||||||||||||||||||||||||||||||||||||||||
| Barfly Ventures, LLC | Member Units | (5) | — | 463 | — | 643 | 464 | — | 1,107 | ||||||||||||||||||||||||||||||||||||||||||||||||||||||||
| Batjer TopCo, LLC | Secured Debt | (8) | — | — | — | — | 50 | 51 | (1) | ||||||||||||||||||||||||||||||||||||||||||||||||||||||||
| 11.00% | Secured Debt | (8) | — | — | 116 | — | 1,205 | — | 1,205 | ||||||||||||||||||||||||||||||||||||||||||||||||||||||||
| Preferred Stock | (8) | — | — | 70 | — | 455 | — | 455 | |||||||||||||||||||||||||||||||||||||||||||||||||||||||||
| Brewer Crane Holdings, LLC | 14.12% | L+ | 10.00% | Secured Debt | (9) | — | — | 220 | 2,005 | 10 | 524 | 1,491 | |||||||||||||||||||||||||||||||||||||||||||||||||||||
| Preferred Member Units | (9) | — | (160) | 207 | 1,930 | — | 160 | 1,770 | |||||||||||||||||||||||||||||||||||||||||||||||||||||||||
| Centre Technologies Holdings, LLC | L+ | 9.00% | Secured Debt | (8) | — | — | 7 | — | 360 | 360 | — | ||||||||||||||||||||||||||||||||||||||||||||||||||||||
| 13.13% | L+ | 9.00% | Secured Debt | (8) | — | 115 | 445 | 2,216 | 1,612 | 97 | 3,731 | ||||||||||||||||||||||||||||||||||||||||||||||||||||||
| Preferred Member Units | (8) | — | 639 | 30 | 1,460 | 710 | — | 2,170 | |||||||||||||||||||||||||||||||||||||||||||||||||||||||||
| Chamberlin Holding LLC | L+ | 6.00% | Secured Debt | (8) | — | — | 2 | — | — | — | — | ||||||||||||||||||||||||||||||||||||||||||||||||||||||
| 12.13% | L+ | 8.00% | Secured Debt | (8) | — | (42) | 486 | 4,454 | 42 | 260 | 4,236 | ||||||||||||||||||||||||||||||||||||||||||||||||||||||
| Member Units | (8) | — | (300) | 463 | 6,030 | — | 302 | 5,728 | |||||||||||||||||||||||||||||||||||||||||||||||||||||||||
| Member Units | (8) | — | 180 | 19 | 385 | 293 | — | 678 | |||||||||||||||||||||||||||||||||||||||||||||||||||||||||
| Charps, LLC | Preferred Member Units | (5) | — | (170) | 190 | 3,500 | — | 170 | 3,330 | ||||||||||||||||||||||||||||||||||||||||||||||||||||||||
| Clad-Rex Steel, LLC | SF+ | 9.00% | Secured Debt | (5) | — | — | 1 | — | — | — | — | ||||||||||||||||||||||||||||||||||||||||||||||||||||||
| 13.23% | SF+ | 9.00% | Secured Debt | (5) | — | — | 304 | 2,620 | — | — | 2,620 | ||||||||||||||||||||||||||||||||||||||||||||||||||||||
| 10.00% | Secured Debt | (5) | — | — | 27 | 268 | — | 8 | 260 | ||||||||||||||||||||||||||||||||||||||||||||||||||||||||
| Member Units | (5) | — | (500) | 190 | 2,560 | — | 500 | 2,060 | |||||||||||||||||||||||||||||||||||||||||||||||||||||||||
| Member Units | (5) | — | 20 | — | 133 | 19 | — | 152 | |||||||||||||||||||||||||||||||||||||||||||||||||||||||||
| Cody Pools, Inc. | 15.38% | L+ | 10.50% | Secured Debt | (8) | — | 11 | 20 | (6) | 1,033 | 754 | 273 | |||||||||||||||||||||||||||||||||||||||||||||||||||||
| 15.38% | L+ | 10.50% | Secured Debt | (8) | — | (30) | 963 | 7,187 | 30 | 335 | 6,882 | ||||||||||||||||||||||||||||||||||||||||||||||||||||||
| Company | Total Rate | Base Rate | Spread | PIK Rate | Type of Investment(1)(10)(11) | Geography | Amount of Realized Gain/(Loss) | Amount of Unrealized Gain/(Loss) | Amount of Interest, Fees or Dividends Credited to Income(2) | December 31, 2021 Fair Value | Gross Additions(3) | Gross Reductions(4) | December 31, 2022 Fair Value (13) | ||||||||||||||||||||||||||||||||||||||||||||||||||||
| Preferred Member Units | (8) | — | 2,640 | 1,004 | 11,910 | 2,640 | — | 14,550 | |||||||||||||||||||||||||||||||||||||||||||||||||||||||||
| Colonial Electric Company LLC | Secured Debt | (6) | — | — | 12 | — | 400 | 400 | — | ||||||||||||||||||||||||||||||||||||||||||||||||||||||||
| 12.00% | Secured Debt | (6) | — | — | 761 | 6,007 | 37 | 315 | 5,729 | ||||||||||||||||||||||||||||||||||||||||||||||||||||||||
| Preferred Member Units | (6) | — | 10 | 349 | 2,280 | 10 | — | 2,290 | |||||||||||||||||||||||||||||||||||||||||||||||||||||||||
| Datacom, LLC | 7.50% | Secured Debt | (8) | — | — | — | — | 25 | — | 25 | |||||||||||||||||||||||||||||||||||||||||||||||||||||||
| 7.50% | Secured Debt | (8) | — | 20 | 98 | 852 | 43 | 30 | 865 | ||||||||||||||||||||||||||||||||||||||||||||||||||||||||
| Preferred Member Units | (8) | — | 10 | 11 | 290 | 10 | — | 300 | |||||||||||||||||||||||||||||||||||||||||||||||||||||||||
| Digital Products Holdings LLC | 14.13% | L+ | 10.00% | Secured Debt | (5) | — | — | 510 | 4,186 | 22 | 330 | 3,878 | |||||||||||||||||||||||||||||||||||||||||||||||||||||
| Preferred Member Units | (5) | — | — | 50 | 2,459 | — | — | 2,459 | |||||||||||||||||||||||||||||||||||||||||||||||||||||||||
| Direct Marketing Solutions, Inc. | L+ | 11.00% | Secured Debt | (9) | — | 5 | 42 | (7) | 757 | 750 | — | ||||||||||||||||||||||||||||||||||||||||||||||||||||||
| 15.13% | L+ | 11.00% | Secured Debt | (9) | — | 46 | — | — | 5,352 | — | 5,352 | ||||||||||||||||||||||||||||||||||||||||||||||||||||||
| L+ | 11.00% | Secured Debt | (9) | — | (54) | 661 | 4,705 | — | 4,705 | — | |||||||||||||||||||||||||||||||||||||||||||||||||||||||
| Preferred Stock | (9) | — | 970 | 343 | 4,590 | 968 | — | 5,558 | |||||||||||||||||||||||||||||||||||||||||||||||||||||||||
| Flame King Holdings, LLC | 10.75% | L+ | 6.50% | Secured Debt | (9) | — | 15 | 167 | 1,581 | 319 | — | 1,900 | |||||||||||||||||||||||||||||||||||||||||||||||||||||
| 13.25% | L+ | 9.00% | Secured Debt | (9) | — | 123 | 706 | 5,145 | 155 | — | 5,300 | ||||||||||||||||||||||||||||||||||||||||||||||||||||||
| Preferred Equity | (9) | — | 1,800 | 538 | 2,600 | 1,800 | — | 4,400 | |||||||||||||||||||||||||||||||||||||||||||||||||||||||||
| Freeport Financial Funds | LP Interests (Freeport First Lien Loan Fund III LP) | (5) | — | (57) | 421 | 7,231 | — | 1,383 | 5,848 | ||||||||||||||||||||||||||||||||||||||||||||||||||||||||
| Gamber-Johnson Holdings, LLC | SF+ | 8.50% | Secured Debt | (5) | — | — | 2 | — | — | — | — | ||||||||||||||||||||||||||||||||||||||||||||||||||||||
| 11.50% | SF+ | 8.50% | Secured Debt | (5) | — | 272 | 113 | — | 16,020 | — | 16,020 | ||||||||||||||||||||||||||||||||||||||||||||||||||||||
| L+ | 7.50% | Secured Debt | (5) | — | (17) | 559 | 5,400 | — | 5,400 | — | |||||||||||||||||||||||||||||||||||||||||||||||||||||||
| Member Units | (5) | — | 290 | 224 | 12,430 | 290 | — | 12,720 | |||||||||||||||||||||||||||||||||||||||||||||||||||||||||
| GFG Group, LLC | 9.00% | Secured Debt | (5) | — | (26) | 329 | 3,136 | 26 | 326 | 2,836 | |||||||||||||||||||||||||||||||||||||||||||||||||||||||
| Preferred Member Units | (5) | — | 40 | 144 | 1,750 | 40 | — | 1,790 | |||||||||||||||||||||||||||||||||||||||||||||||||||||||||
| Gulf Publishing Holdings, LLC | L+ | 9.50% | Secured Debt | (8) | — | — | 2 | 64 | — | 64 | — | ||||||||||||||||||||||||||||||||||||||||||||||||||||||
| 6.25% | Secured Debt | (8) | (1,455) | 962 | 126 | 2,429 | — | 2,429 | — | ||||||||||||||||||||||||||||||||||||||||||||||||||||||||
| 12.50% | Secured Debt | (8) | — | (29) | 19 | — | 600 | 29 | 571 | ||||||||||||||||||||||||||||||||||||||||||||||||||||||||
| Member Units | (8) | — | — | — | — | — | — | — | |||||||||||||||||||||||||||||||||||||||||||||||||||||||||
| Preferred Equity | (8) | — | (450) | — | — | 1,400 | 450 | 950 | |||||||||||||||||||||||||||||||||||||||||||||||||||||||||
| HPEP 3, L.P. | LP Interests (HPEP 3, L.P.) | (8) | 779 | 254 | (50) | 4,712 | 587 | 968 | 4,331 | ||||||||||||||||||||||||||||||||||||||||||||||||||||||||
| Kickhaefer Manufacturing Company, LLC | 11.50% | Secured Debt | (5) | — | 18 | 630 | 5,040 | 53 | — | 5,093 | |||||||||||||||||||||||||||||||||||||||||||||||||||||||
| 9.00% | Secured Debt | (5) | — | — | 88 | 970 | — | 9 | 961 | ||||||||||||||||||||||||||||||||||||||||||||||||||||||||
| Preferred Equity | (5) | — | (1,280) | — | 3,080 | — | 1,280 | 1,800 | |||||||||||||||||||||||||||||||||||||||||||||||||||||||||
| Member Units | (5) | — | 98 | 28 | 615 | 99 | 1 | 713 | |||||||||||||||||||||||||||||||||||||||||||||||||||||||||
| Market Force Information, LLC | 12.00% | 12.00% | Secured Debt | (9) | — | (1,831) | — | 2,234 | — | 1,831 | 403 | ||||||||||||||||||||||||||||||||||||||||||||||||||||||
| Member Units | (9) | — | — | — | — | — | — | — | |||||||||||||||||||||||||||||||||||||||||||||||||||||||||
| MH Corbin Holding LLC | 13.00% | Secured Debt | (5) | — | 175 | 250 | 1,484 | 177 | 524 | 1,137 | |||||||||||||||||||||||||||||||||||||||||||||||||||||||
| Preferred Member Units | (5) | — | — | — | — | — | — | — | |||||||||||||||||||||||||||||||||||||||||||||||||||||||||
| Preferred Member Units | (5) | — | — | — | — | — | — | — | |||||||||||||||||||||||||||||||||||||||||||||||||||||||||
| Mystic Logistics Holdings, LLC | Secured Debt | (6) | — | — | 1 | — | — | — | — | ||||||||||||||||||||||||||||||||||||||||||||||||||||||||
| 10.00% | Secured Debt | (6) | — | — | 152 | 1,595 | — | 159 | 1,436 | ||||||||||||||||||||||||||||||||||||||||||||||||||||||||
| Common Stock | (6) | — | 3,500 | 1,050 | 2,210 | 3,498 | — | 5,708 | |||||||||||||||||||||||||||||||||||||||||||||||||||||||||
| NexRev LLC | Secured Debt | (8) | — | — | 7 | 199 | — | 199 | — | ||||||||||||||||||||||||||||||||||||||||||||||||||||||||
| 11.00% | Secured Debt | (8) | — | (188) | 486 | 3,311 | — | 1,192 | 2,119 | ||||||||||||||||||||||||||||||||||||||||||||||||||||||||
| Company | Total Rate | Base Rate | Spread | PIK Rate | Type of Investment(1)(10)(11) | Geography | Amount of Realized Gain/(Loss) | Amount of Unrealized Gain/(Loss) | Amount of Interest, Fees or Dividends Credited to Income(2) | December 31, 2021 Fair Value | Gross Additions(3) | Gross Reductions(4) | December 31, 2022 Fair Value (13) | ||||||||||||||||||||||||||||||||||||||||||||||||||||
| Preferred Member Units | (8) | — | (723) | 20 | 670 | 333 | 723 | 280 | |||||||||||||||||||||||||||||||||||||||||||||||||||||||||
| NuStep, LLC | 10.63% | L+ | 6.50% | Secured Debt | (5) | — | 2 | 78 | 430 | 670 | — | 1,100 | |||||||||||||||||||||||||||||||||||||||||||||||||||||
| 12.00% | Secured Debt | (5) | — | (1) | 545 | 4,310 | 294 | 1 | 4,603 | ||||||||||||||||||||||||||||||||||||||||||||||||||||||||
| Preferred Member Units | (5) | — | (1,370) | — | 3,380 | — | 1,370 | 2,010 | |||||||||||||||||||||||||||||||||||||||||||||||||||||||||
| Preferred Member Units | (5) | — | 775 | — | — | 1,290 | — | 1,290 | |||||||||||||||||||||||||||||||||||||||||||||||||||||||||
| Oneliance, LLC | 15.13% | L+ | 11.00% | Secured Debt | (7) | — | — | 190 | 1,374 | 6 | — | 1,380 | |||||||||||||||||||||||||||||||||||||||||||||||||||||
| Preferred Stock | (7) | — | — | 1 | 264 | — | — | 264 | |||||||||||||||||||||||||||||||||||||||||||||||||||||||||
| Orttech Holdings, LLC | L+ | 11.00% | Secured Debt | (5) | — | — | 5 | 41 | 1 | 44 | (2) | ||||||||||||||||||||||||||||||||||||||||||||||||||||||
| 15.13% | L+ | 11.00% | Secured Debt | (5) | — | — | 815 | 5,937 | 27 | 150 | 5,814 | ||||||||||||||||||||||||||||||||||||||||||||||||||||||
| Preferred Stock | (5) | — | 440 | 225 | 2,500 | 440 | — | 2,940 | |||||||||||||||||||||||||||||||||||||||||||||||||||||||||
| Robbins Bros. Jewelry, Inc. | Secured Debt | (9) | — | — | 5 | — | 2 | 10 | (8) | ||||||||||||||||||||||||||||||||||||||||||||||||||||||||
| 12.50% | Secured Debt | (9) | — | — | 529 | — | 3,977 | 75 | 3,902 | ||||||||||||||||||||||||||||||||||||||||||||||||||||||||
| Preferred Equity | (9) | — | 420 | 62 | — | 1,650 | — | 1,650 | |||||||||||||||||||||||||||||||||||||||||||||||||||||||||
| SI East, LLC | Secured Debt | (7) | — | — | 78 | 750 | 1,250 | 2,000 | — | ||||||||||||||||||||||||||||||||||||||||||||||||||||||||
| 9.50% | Secured Debt | (7) | — | 76 | 2,708 | 21,200 | 10,375 | 1,646 | 29,929 | ||||||||||||||||||||||||||||||||||||||||||||||||||||||||
| Preferred Member Units | (7) | — | 690 | 216 | 3,860 | 690 | — | 4,550 | |||||||||||||||||||||||||||||||||||||||||||||||||||||||||
| Sonic Systems International, LLC | 11.24% | L+ | 7.50% | Secured Debt | (8) | — | 282 | 1,676 | 13,738 | 4,687 | — | 18,425 | |||||||||||||||||||||||||||||||||||||||||||||||||||||
| Common Stock | (8) | — | (94) | 50 | 1,250 | 334 | 94 | 1,490 | |||||||||||||||||||||||||||||||||||||||||||||||||||||||||
| Student Resource Center, LLC | 13.27% | L+ | 8.50% | Secured Debt | (6) | — | — | — | — | 5,063 | — | 5,063 | |||||||||||||||||||||||||||||||||||||||||||||||||||||
| Secured Debt | (6) | (6,651) | 4,438 | 12 | — | 6,524 | 6,524 | — | |||||||||||||||||||||||||||||||||||||||||||||||||||||||||
| Preferred Equity | (6) | — | — | — | — | — | — | — | |||||||||||||||||||||||||||||||||||||||||||||||||||||||||
| Tedder Industries, LLC | 12.00% | Secured Debt | (9) | — | — | 55 | 259 | 201 | — | 460 | |||||||||||||||||||||||||||||||||||||||||||||||||||||||
| 12.00% | Secured Debt | (9) | — | (17) | 505 | 3,754 | 43 | 17 | 3,780 | ||||||||||||||||||||||||||||||||||||||||||||||||||||||||
| Preferred Member Units | (9) | — | (391) | — | 2,145 | 166 | 391 | 1,920 | |||||||||||||||||||||||||||||||||||||||||||||||||||||||||
| Trantech Radiator Topco, LLC | Secured Debt | (7) | — | 3 | 3 | (6) | 6 | — | — | ||||||||||||||||||||||||||||||||||||||||||||||||||||||||
| 12.00% | Secured Debt | (7) | — | (17) | 273 | 2,180 | 17 | 217 | 1,980 | ||||||||||||||||||||||||||||||||||||||||||||||||||||||||
| Common Stock | (7) | — | (210) | 29 | 2,160 | — | 210 | 1,950 | |||||||||||||||||||||||||||||||||||||||||||||||||||||||||
| VVS Holdco LLC | L+ | 6.00% | Secured Debt | (5) | — | — | 13 | 292 | 203 | 500 | (5) | ||||||||||||||||||||||||||||||||||||||||||||||||||||||
| 11.50% | Secured Debt | (5) | — | — | 932 | 7,375 | 46 | — | 7,421 | ||||||||||||||||||||||||||||||||||||||||||||||||||||||||
| Preferred Equity | (5) | — | 30 | 129 | 2,960 | 30 | — | 2,990 | |||||||||||||||||||||||||||||||||||||||||||||||||||||||||
| Other Amounts related to investments transferred to or from other 1940 Act classification during the period | — | — | — | — | — | — | — | ||||||||||||||||||||||||||||||||||||||||||||||||||||||||||
| Total Affiliate investments | $ | (7,327) | $ | 15,689 | $ | 24,057 | $ | 234,158 | $ | 84,672 | $ | 41,830 | $ | 277,000 | |||||||||||||||||||||||||||||||||||||||||||||||||||
| Quarter Ended | |||||||||||||||
| March 31, 2017 | June 30, 2017 | September 30, 2017 | December 31, 2017 | ||||||||||||
| Total interest, fee and dividend income | $ | 25,364 | $ | 25,548 | $ | 25,331 | $ | 27,417 | |||||||
| Net investment income | $ | 15,142 | $ | 15,064 | $ | 13,040 | $ | 15,473 | |||||||
| Net realized gain (loss) from investments | $ | 2,640 | $ | (5 | ) | $ | 724 | $ | (7,722 | ) | |||||
| Net change in unrealized appreciation (depreciation) on investments | $ | (4,516 | ) | $ | 2,401 | $ | (5,050 | ) | $ | 5,435 | |||||
| Net increase in net assets resulting from operations | $ | 13,266 | $ | 17,460 | $ | 8,714 | $ | 13,186 | |||||||
| Net investment income per share – basic and diluted | $ | 0.20 | $ | 0.20 | $ | 0.16 | $ | 0.20 | |||||||
| Net increase in net assets resulting from operations per share – basic and diluted | $ | 0.18 | $ | 0.22 | $ | 0.11 | $ | 0.17 | |||||||
| Quarter Ended | |||||||||||||||
| March 31, 2016 | June 30, 2016 | September 30, 2016 | December 31, 2016 | ||||||||||||
| Total interest, fee and dividend income | $ | 21,259 | $ | 21,201 | $ | 22,234 | $ | 24,705 | |||||||
| Net investment income | $ | 12,240 | $ | 12,048 | $ | 12,518 | $ | 14,463 | |||||||
| Net realized loss from investments | $ | (646 | ) | $ | (9,369 | ) | $ | (1,949 | ) | $ | (10,927 | ) | |||
| Net change in unrealized appreciation (depreciation) on investments | $ | (14,263 | ) | $ | 15,416 | $ | 11,776 | $ | 25,277 | ||||||
| Net increase (decrease) in net assets resulting from operations | $ | (2,669 | ) | $ | 18,095 | $ | 22,345 | $ | 28,813 | ||||||
| Net investment income per share – basic and diluted | $ | 0.19 | $ | 0.18 | $ | 0.18 | $ | 0.20 | |||||||
| Net increase (decrease) in net assets resulting from operations per share – basic and diluted | $ | (0.04 | ) | $ | 0.27 | $ | 0.32 | $ | 0.42 | ||||||
| Quarter Ended | |||||||||||||||
| March 31, 2015 | June 30, 2015 | September 30, 2015 | December 31, 2015 | ||||||||||||
| Total interest, fee and dividend income | $ | 11,793 | $ | 15,381 | $ | 17,325 | $ | 20,890 | |||||||
| Net investment income | $ | 6,327 | $ | 8,791 | $ | 9,543 | $ | 11,823 | |||||||
| Net realized gain (loss) from investments | $ | 20 | $ | 127 | $ | (17 | ) | $ | (5,638 | ) | |||||
| Net change in unrealized appreciation (depreciation) on investments | $ | 3,840 | $ | 3,967 | $ | (19,324 | ) | $ | (26,439 | ) | |||||
| Net increase (decrease) in net assets resulting from operations | $ | 10,187 | $ | 12,885 | $ | (9,798 | ) | $ | (20,254 | ) | |||||
| Net investment income per share – basic and diluted | $ | 0.17 | $ | 0.19 | $ | 0.18 | $ | 0.20 | |||||||
| Net increase (decrease) in net assets resulting from operations per share – basic and diluted | $ | 0.28 | $ | 0.28 | $ | (0.18 | ) | $ | (0.34 | ) | |||||
| Name and Principal Occupation(1) | Age | Director Since(2) | ||||||||||||
| Independent Directors | ||||||||||||||
| Robert L. Kay | 71 | 2020 | ||||||||||||
| Mr. Kay has been an independent director since October 2020. Mr. Kay has more than 40 years of broad based banking, investments, private equity intermediary and private business management experience, including commercial loan and venture capital investment portfolio oversight. After spending the first 10 years of his career as a corporate lender with a major Texas bank holding company in Dallas, he returned to his hometown in Austin where he spent the next eight years in the venture investing arena. Beginning in 1990, Mr. Kay served as Chief Executive Officer and/or Chief Operating Officer of multiple start up, growth phase and turnaround operating company situations, including serving as Chief Operating Officer and Chief Financial Officer of DrillingInfo from 2006 until its sale in 2012. Mr. Kay has served as the managing member and chief executive officer of Excelleration Partners, an early stage investment firm since 2012. Mr. Kay currently serves as Chief Executive Officer of Halfile Systems Corporation, a software and data subscription business located in Kyle, Texas, as a Director of Myocardial Solutions, Inc., a healthcare technology company located in Raleigh, North Carolina, and as a Director of The Muny Conservancy, a non-profit organization located in Austin, Texas. Mr. Kay earned a B.B.A. in general business (accounting concentration) from the University of Texas. | ||||||||||||||
| John O. Niemann, Jr. | 67 | 2012 | ||||||||||||
| Mr. Niemann has been an independent director since 2012 and Chairman of the Nominating and Corporate Governance Committee since October 2020. He is the President and Chief Operating Officer of Arthur Andersen LLP and has been since 2003. He previously served as a Managing Director of Andersen Tax LLC from June 2013 until his retirement from this position in March 2023. He previously served on the administrative board of Arthur Andersen LLP and on the board of partners of Andersen Worldwide. He began his career at Arthur Andersen LLP in 1978 and has served in increasing responsibilities in senior management positions, since 1992. Mr. Niemann has served as a director and Chairman of the Audit Committee of Hines Global Income Trust since July 2014 and as the lead independent director since May 2019 and as a director and Chairman of the Audit Committee of Adams Resources & Energy, Inc. since May 2019. He joined Professional Asset Indemnity Limited as a Director in October 2021, which is a non-public Bermuda captive insurance company. Mr. Niemann has served on the board of directors of many Houston area non-profit organizations, including Strake Jesuit College Preparatory School (past chair of the board), The Regis School of the Sacred Heart (past chair of the board), The Houston Symphony, The University of St. Thomas, The Alley Theatre and Taping for the Blind, Inc. He graduated with a B.A. in Managerial Studies (magna cum laude) and a master’s degree in accounting from Rice University, received a J.D. (summa cum laude) from the South Texas College of Law and an LL.M. in taxation (summa cum laude) from the University of San Francisco School of Law. | ||||||||||||||
| Name and Principal Occupation(1) | Age | Director Since(2) | ||||||||||||
| Jeffrey B. Walker | 63 | 2020 | ||||||||||||
| Mr. Walker has been an independent director and Chairman of the Audit Committee since October 2020. Mr. Walker retired in May 2020 after a successful 38 year career in public accounting with Arthur Andersen and, more recently, Deloitte Tax, LLP where he held several leadership roles including, most recently, Vice Chairman from 2014 until May 2020. Mr. Walker served as a member of Deloitte LLP’s board from 2011 until 2015 and also served as the Chief Development Officer of Deloitte Tax from 2013 until 2015. Mr. Walker is a certified public accountant and a member of the AICPA and Texas State Board of CPAs and earned a B.B.A. in Accounting and Economics from the University of Mississippi. | ||||||||||||||
| Interested Directors | ||||||||||||||
| Mr. Hyzak is an interested person, as defined in the 1940 Act, due to his positions at MSC Income Fund. | ||||||||||||||
| Dwayne L. Hyzak | 51 | 2018 | ||||||||||||
| Mr. Hyzak has been a member of our board of directors since June 2020 and has served as our Chief Executive Officer and Chairman since October 2020. Since 2018, Mr. Hyzak has also served as Main Street’s Chief Executive Officer and as a member of Main Street’s board of directors. Mr. Hyzak also serves as a member of Main Street’s management team’s executive and investment committees. Previously, he served as Main Street’s President (2015 until November 2018), Chief Operating Officer (2014 until November 2018), Chief Financial Officer (2011 until 2014) and Senior Managing Director since 2011 and also served in other senior executive positions at Main Street prior to 2011. Prior to its IPO in 2007, Mr. Hyzak served as a Senior Managing Director and other executive positions of several Main Street predecessor funds and entities, which are now subsidiaries of Main Street. Mr. Hyzak joined Main Street in 2002, becoming one of the founding members of the firm. Prior to joining Main Street, Mr. Hyzak was a Director of Integration with Quanta Services, Inc. (NYSE: PWR), which provides specialty contracting services to the power, natural gas and telecommunications industries, where he was principally focused on the company’s mergers and acquisitions and corporate finance activities. Previously, Mr. Hyzak was a Manager with Arthur Andersen in its Transaction Advisory Services group. Mr. Hyzak currently serves on the board of directors of Child Advocates, a non-profit organization that trains and supports advocates to serve the interests of abused or neglected children in the greater Houston area. | ||||||||||||||
| Name | Age | Position(s) Held | Officer Since | ||||||||
Dwayne L. Hyzak(1)(2) | 51 | Chairman of the Board and Chief Executive Officer | 2020 | ||||||||
David L. Magdol(1)(2) | 53 | President and Chief Investment Officer | 2020 | ||||||||
Jesse E. Morris(2) | 56 | Executive Vice President, Chief Financial Officer, Chief Operating Officer and Treasurer | 2020 | ||||||||
Jason B. Beauvais(2) | 48 | Executive Vice President, General Counsel and Secretary | 2020 | ||||||||
| Nicholas T. Meserve | 44 | Managing Director | 2020 | ||||||||
| Cory E. Gilbert | 51 | Vice President, Chief Accounting Officer and Assistant Treasurer | 2020 | ||||||||
| Adam W. Park | 37 | Chief Compliance Officer, Assistant General Counsel and Assistant Secretary | 2020 | ||||||||
| Board Committees | ||||||||||||||
| Director | Audit | Nominating and Corporate Governance | ||||||||||||
| Robert L. Kay | x | x | ||||||||||||
| John O. Niemann, Jr. | x | Chair | ||||||||||||
| Jeffrey B. Walker | Chair | x | ||||||||||||
| Name of Director | Fees Earned or Paid in Cash | All Other Compensation(1) | Total Compensation(2) | |||||||||||||||||
| Interested Directors: | ||||||||||||||||||||
| Dwayne L. Hyzak | $ | — | $ | — | $ | — | ||||||||||||||
| Independent Directors: | ||||||||||||||||||||
| Robert L. Kay | 126,500 | — | 126,500 | |||||||||||||||||
| John O. Niemann, Jr. | 126,500 | — | 126,500 | |||||||||||||||||
| Jeffrey B. Walker | 131,500 | — | 131,500 | |||||||||||||||||
Shares beneficially owned as of March 1, 2024 | ||||||||||||||
| Name and Address | Number | Percentage of Current Ownership | ||||||||||||
| Interested Directors: | ||||||||||||||
| Dwayne L. Hyzak | 20,979 | * | ||||||||||||
| Independent Directors: | ||||||||||||||
| Robert L. Kay | 20,000 | * | ||||||||||||
| John O. Niemann, Jr. | 46,429 | * | ||||||||||||
| Jeffrey B. Walker | 30,129 | * | ||||||||||||
| Executive Officers (that are not directors): | ||||||||||||||
| David L. Magdol | 16,783 | * | ||||||||||||
| Jesse E. Morris | — | — | ||||||||||||
| Jason B. Beauvais | 8,392 | * | ||||||||||||
| All executive officers and directors as a group (7 persons) | 142,712 | * | ||||||||||||
| Name and Address(1) | Dollar Range of Equity Securities Beneficially Owned(2)(3)(4) | |||||||
| Interested Directors: | ||||||||
| Dwayne L. Hyzak | Over $100,000 | |||||||
| Independent Directors: | ||||||||
| Robert L. Kay | Over $100,000 | |||||||
| John O. Niemann, Jr. | Over $100,000 | |||||||
| Jeffrey B. Walker | Over $100,000 | |||||||
| Fiscal Year Ended December 31, 2023 | Fiscal Year Ended December 31, 2022 | ||||||||||
| Audit Fees | $ | 482,300 | $ | 476,940 | |||||||
| Audit Related Fees | — | — | |||||||||
| Tax Fees | — | — | |||||||||
| All Other Fees | — | — | |||||||||
| Total Fees | $ | 482,300 | $ | 476,940 | |||||||
Report of Independent Registered Public Accounting Firm (PCAOB ID Number 248) | |||||
| Audited Financial Statements | |||||
| 3.1 | ||||||||
| Articles of Amendment and Restatement of the Registrant (filed as Exhibit 3.1 to the Registrant’s current report on Form 8-K, filed on December 21, 2016 (File No. 814-00939) and incorporated herein by reference). | ||||||||
| 3.2 | ||||||||
| 3.3 | ||||||||
| 4.1 | ||||||||
| Amended and Restated Distribution Reinvestment Plan, effective as of November 1, 2017 (filed as Exhibit 4.1 to the Registrant’s current report on Form 8-K, filed on October 19, 2017 (File No. 814-00939) and incorporated herein by reference). | ||||||||
| 4.2 | ||||||||
| 10.1 | ||||||||
| 10.2 | ||||||||
| 10.3 | ||||||||
| 10.4 | ||||||||
| 10.5 | ||||||||
| Amended and Restated Senior Secured Revolving Credit Agreement, dated as of March 6, 2017, by and among the Registrant, HMS Equity Holding, LLC, HMS Equity Holding II, Inc., the financial institutions party thereto and EverBank Commercial Finance, Inc. (filed as Exhibit 10.40 to the Registrant’s annual report on Form 10-K, filed on March 7, 2017 (File No. 814-00939) and incorporated herein by reference). | ||||||||
| 10.6 | ||||||||
| First Amendment to the Amended and Restated Senior Secured Revolving Credit Agreement, dated as of October 19, 2017, by and among the Registrant, HMS Equity Holding, LLC, HMS Equity Holding II, Inc., the financial institutions party thereto and EverBank Commercial Finance, Inc. (filed as Exhibit 10.1 to the Registrant’s current report on Form 8-K, filed on October 19, 2017 (File No. 814-00939) and incorporated herein by reference). | ||||||||
| 10.7 | ||||||||
| 10.8 | ||||||||
| Fourth Amendment to Amended and Restated | ||||||||
| 10.9 | ||||||||
| 10.10 | ||||||||
| 10.11 | Seventh Amendment to Amended and Restated Senior Secured Revolving Credit Agreement, dated as of April 27, 2023, by and among the Registrant, the Guarantors party thereto, the lenders party thereto and TIAA, FSB (filed as Exhibit 10.1 to the Registrant’s quarterly report on Form 10-Q, filed on May 12, 2023 (File No. 814-00939) and incorporated herein by reference). | |||||||
| 10.12 | ||||||||
| 10.13 | First Amendment to Loan and Security Agreement, dated June 2, 2023, by and among MSIF Funding, LLC, as borrower; MSC Income Fund, Inc., as portfolio manager; U.S. Bank Trust Company, National Association, as collateral agent and collateral administrator; U.S. Bank National Association, as securities intermediary; and JPMorgan Chase Bank, National Association, as administrative agent and lender (filed as Exhibit 10.1 to the Registrant’s current report on Form 8-K, filed on June 6, 2023 (File No. 814-00939) and incorporated herein by reference). | |||||||
| 10.14 | Second Amendment to Loan and Security Agreement, dated August 31, 2023, by and among MSIF Funding, LLC, as borrower; MSC Income Fund, Inc., as portfolio manager; U.S. Bank Trust Company, National Association, as collateral agent and collateral administrator; U.S. Bank National Association, as securities intermediary; and JPMorgan Chase Bank, National Association, as administrative agent and lender (filed as Exhibit 10.1 to the Registrant’s current report on Form 8-K (File No. 814-00939) and incorporated herein by reference). | |||||||
| Second Amendment to Loan and Security Agreement, dated August 31, 2023, by and among MSIF Funding, LLC, as borrower; MSC Income Fund, Inc., as portfolio manager; U.S. Bank Trust Company, National Association, as collateral agent and collateral administrator; U.S. Bank National Association, as securities intermediary; and JPMorgan Chase Bank, National Association, as administrative agent and lender. | ||||||||
| 10.15 | ||||||||
| 21.1 | ||||||||
| 31.1 | ||||||||
| 31.2 | ||||||||
| 32.2 | ||||||||
| 101 | The following financial information from our Annual Report on Form 10-K for the fourth quarter of fiscal year 2023, filed with the SEC on March 8, 2024, formatted in Inline Extensible Business Reporting Language (iXBRL): (i) the Consolidated Balance Sheets at December 31, 2023 and December 31, 2022, (ii) the Consolidated Statements of Operations for the years ended December 31, 2023, 2022 and 2021, (iii) the Consolidated Statements of Changes in Net Assets for the periods ended December 31, 2023, 2022 and 2021, (iv) the Consolidated Statements of Cash Flows for the years ended December 31, 2023, 2022 and 2021, (v) the Consolidated Schedule of Investments for the periods ended December 31, 2023 and December 31, 2022, (vi) the Notes to Consolidated Financial Statements and (vii) the Consolidated Schedule 12-14 for the years ended December 31, 2023 and 2022 (filed herewith). | |||||||
| 104 | Cover Page Interactive Data File (embedded within the Inline XBRL document) (filed herewith) |
| Date: March 8, 2024 | By: | /s/ DWAYNE L. HYZAK | ||||||||
| Chairman and Chief Executive Officer | ||||||||||
| Signature | Title | Date | ||||||||||||
| /s/ | Chairman of the Board and Chief Executive Officer | |||||||||||||
(Principal Executive Officer) | March 8, 2024 | |||||||||||||
| Dwayne L. Hyzak | ||||||||||||||
| /s/ | Executive Vice President, Chief Financial Officer, Chief Operating Officer and | |||||||||||||
| Treasurer (Principal Financial Officer) | March 8, 2024 | |||||||||||||
| Jesse E. Morris | ||||||||||||||
| /s/ | Vice President, Chief Accounting Officer and Assistant Treasurer | |||||||||||||
(Principal Accounting Officer) | March 8, 2024 | |||||||||||||
| Cory E. Gilbert | ||||||||||||||
| /s/ ROBERT L. KAY | Director | March 8, 2024 | ||||||||||||
| Robert L. Kay | ||||||||||||||
| /s/ | Director | March | ||||||||||||
| John O. Niemann, Jr. | ||||||||||||||
| /s/ JEFFREY B. WALKER | Director | March 8, 2024 | ||||||||||||
| Jeffrey B. Walker | ||||||||||||||
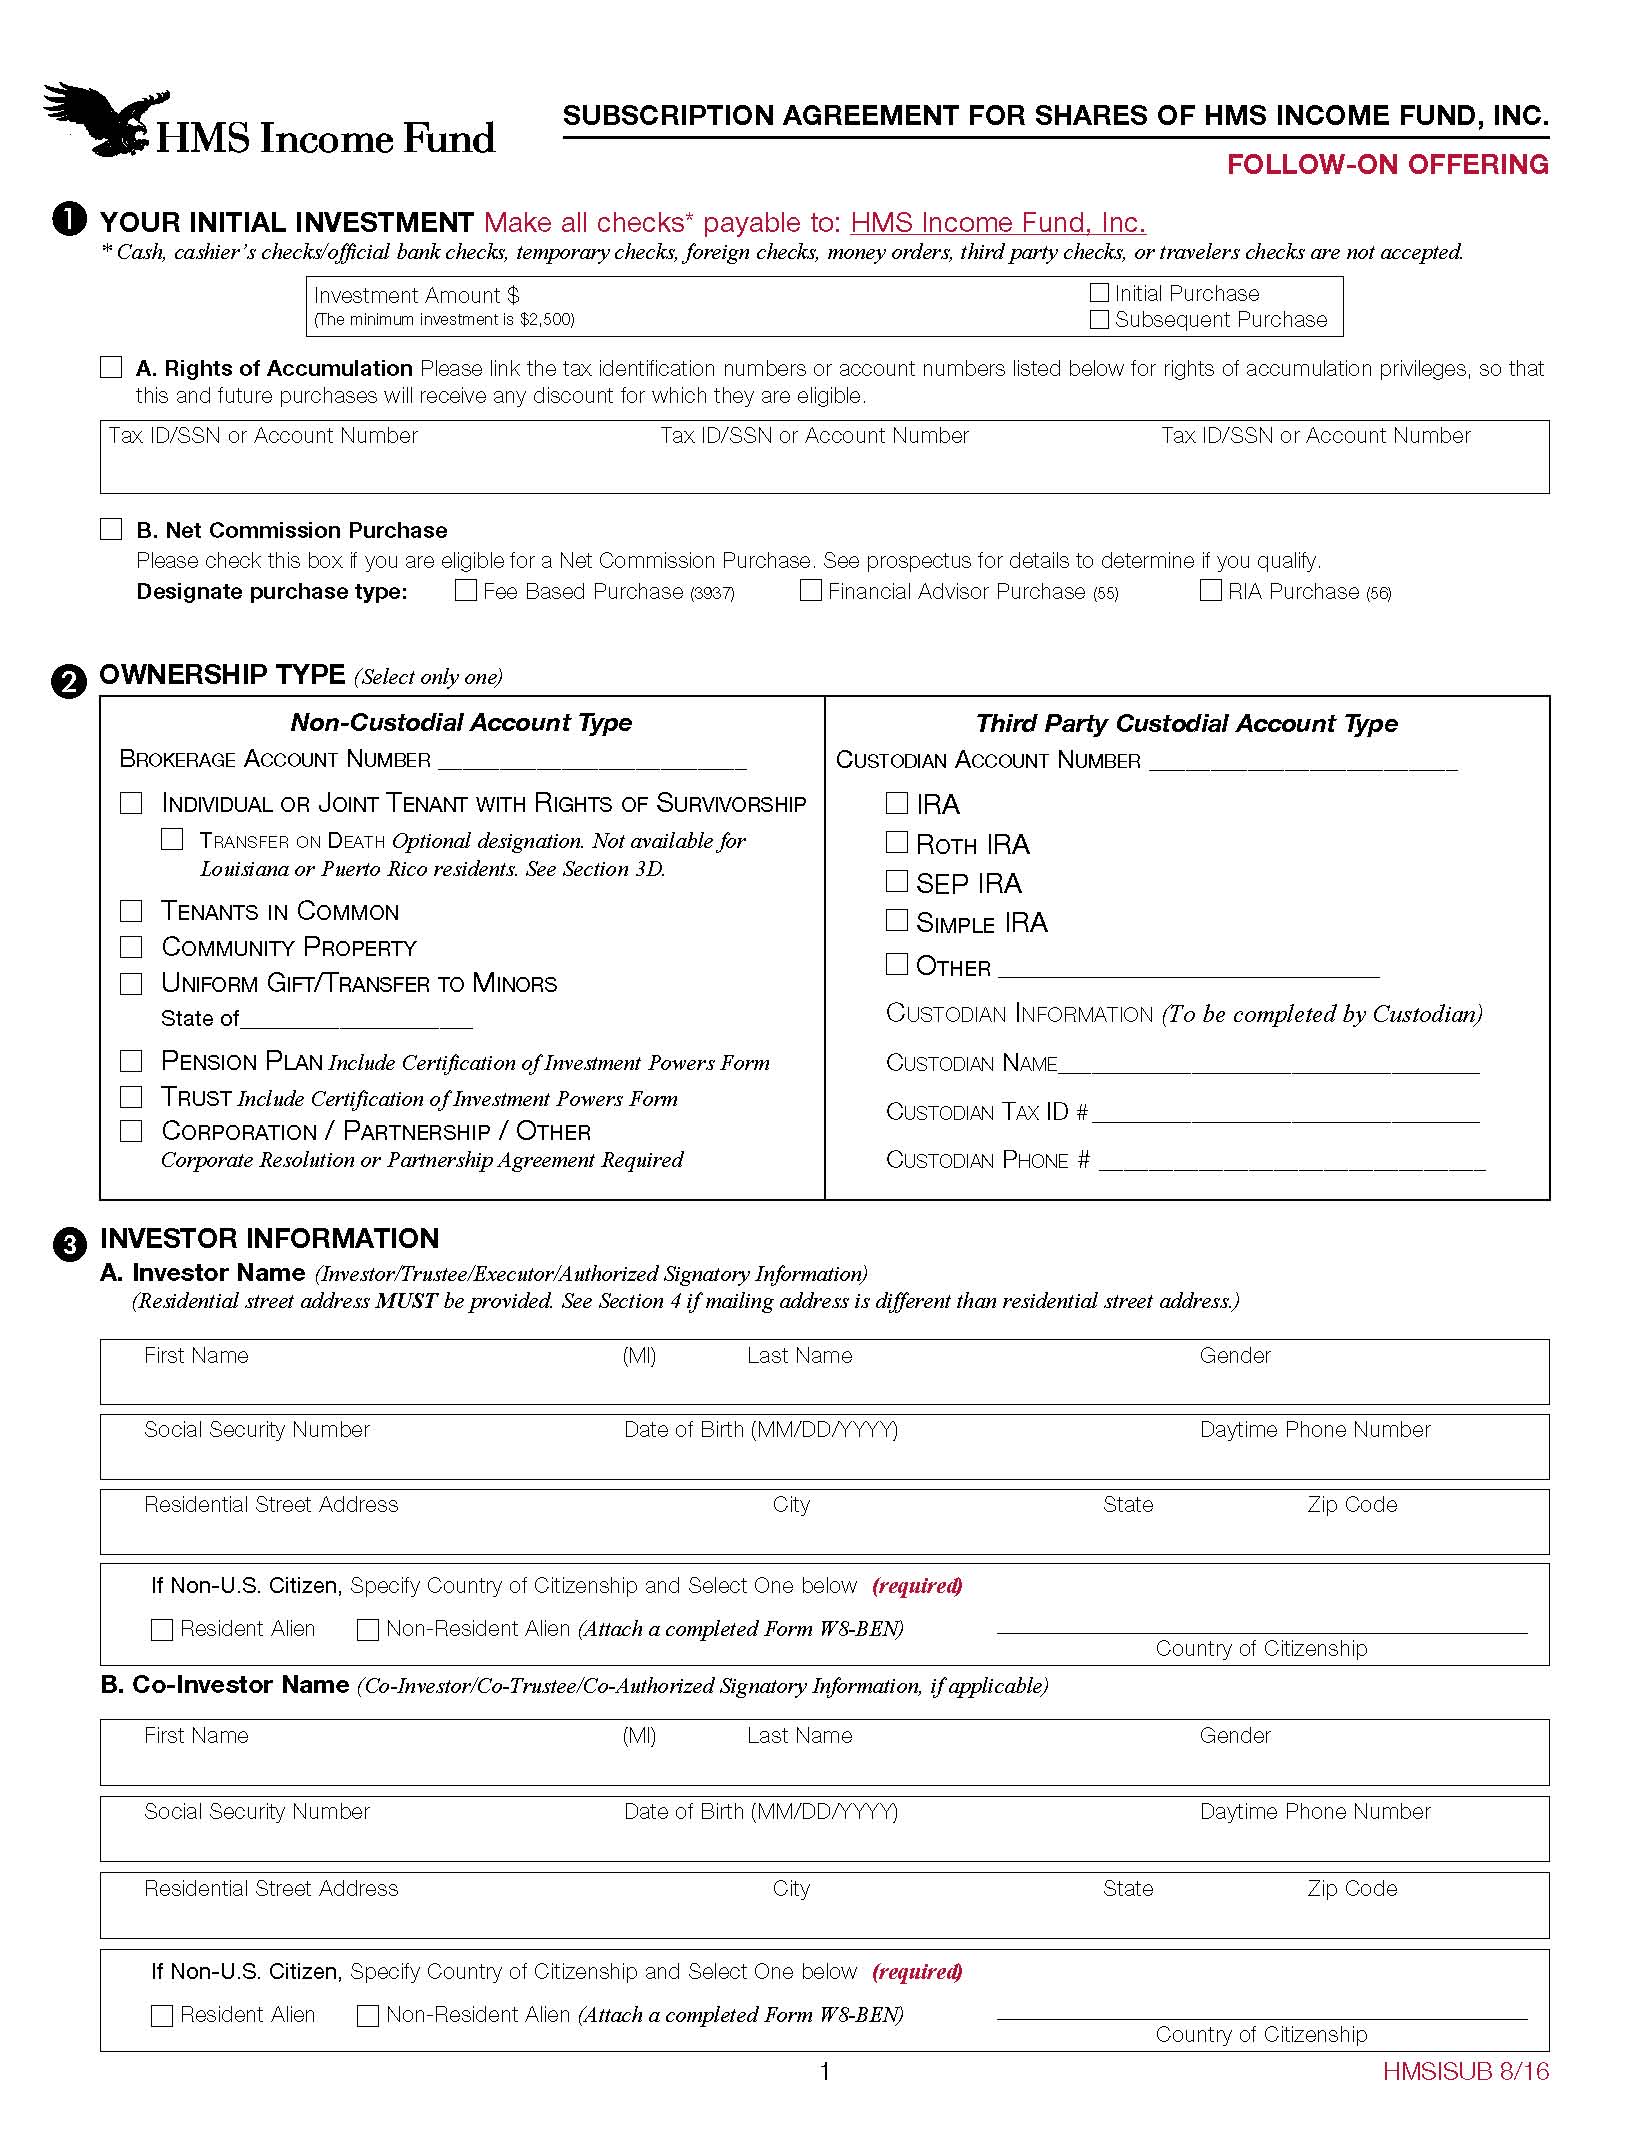