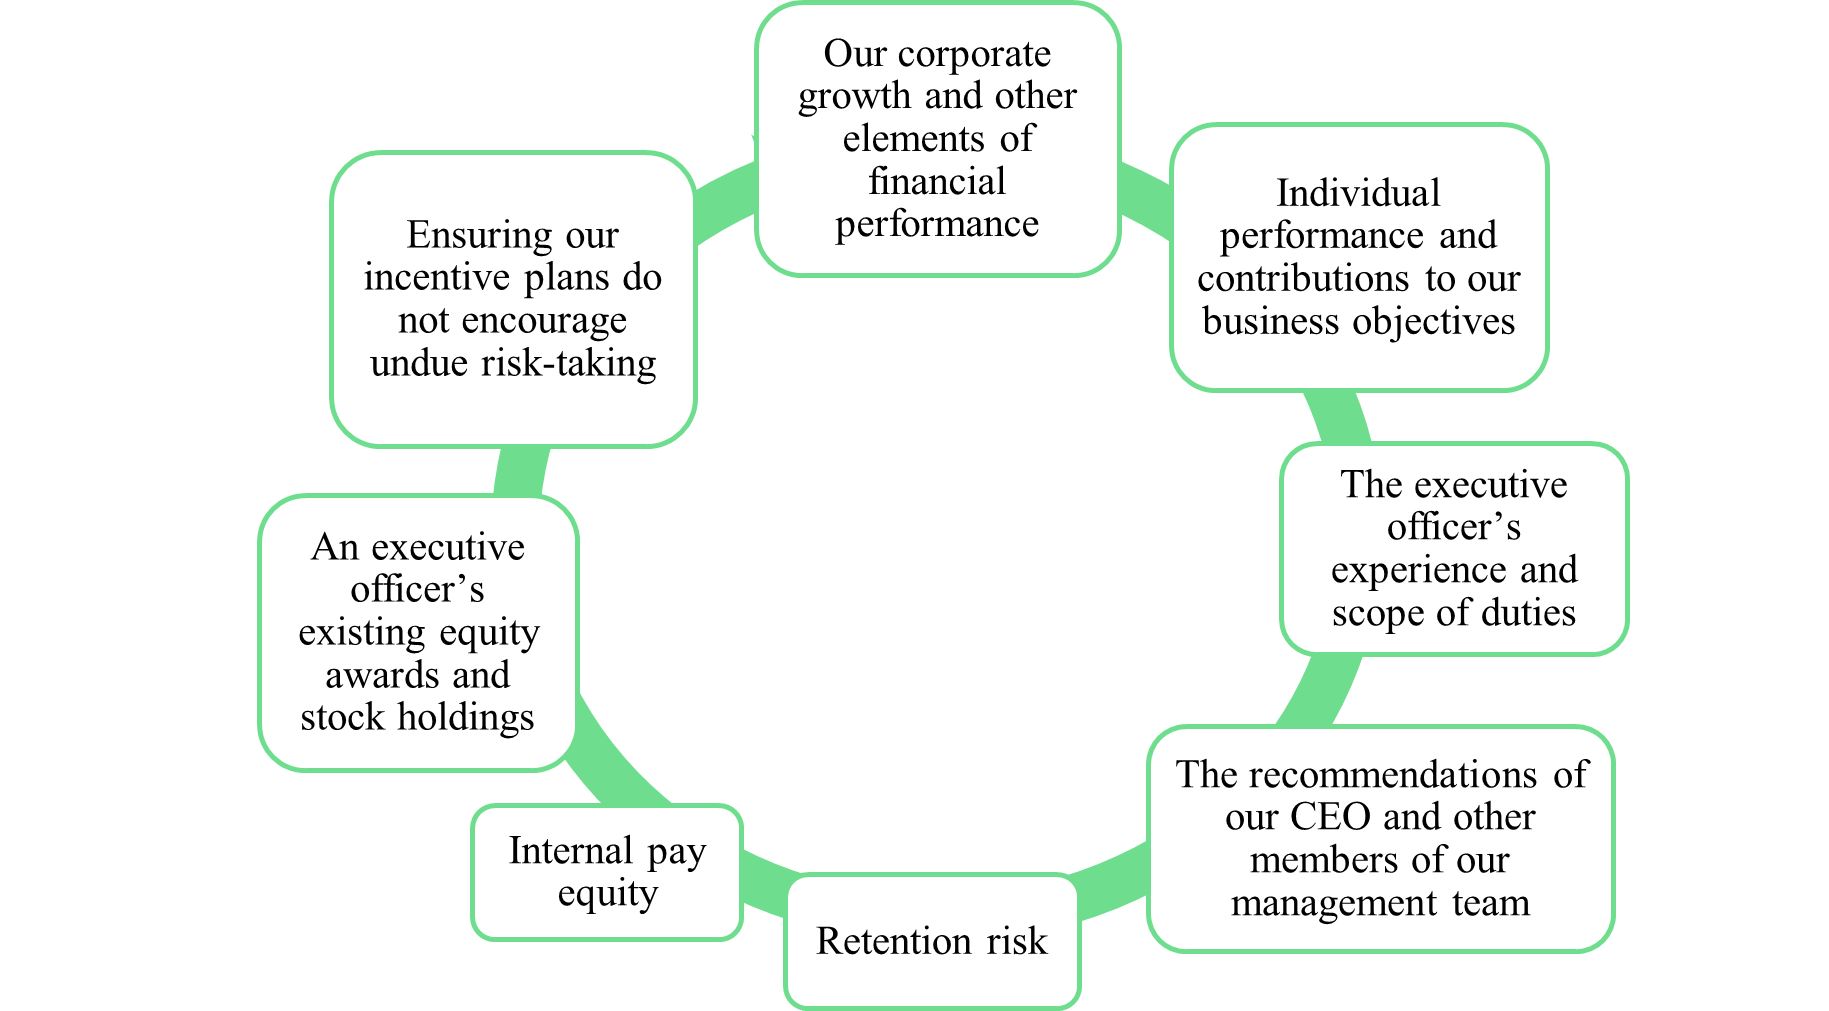
Our unique approach addresses the challenges presented by the financing alternatives available to our customers head on and delivers a superior value proposition for our customers by:| Role of Management | | Our CEO works closely with the compensation and leadership committee in determining the compensation of our NEOs (other than his own) and other executive officers. Each year, our CEO reviews the annual performance of our NEOs and other executive officers and makes recommendations to the compensation and leadership committee (except as it relates to his own performance and compensation) regarding individual compensation adjustments, promotions, bonus pool funding, level of achievement of corporate goals and annual incentive plan payouts. Our CEO also identifies and recommends corporate and individual performance objectives for our annual incentive plan for approval by the compensation and leadership committee based on our business plan and strategic objectives for the relevant fiscal year, and makes recommendations on the size, frequency and terms of equity incentive awards and new hire compensation packages. These recommendations from our CEO are often developed in consultation with members of his senior management team, including our CFO and Chief People Officer. In certain situations, our compensation and leadership committee may elect to delegate a portion of its authority to our CEO or a subcommittee, other than any authority relating to our executive officers. Our compensation and leadership committee has delegated to our CEO the authority to make employment offers to candidates at and below the senior vice president level without seeking the approval of the compensation and leadership committee, subject to certain parameters. In addition, our compensation and leadership committee has delegated to a subcommittee, currently made up of our CEO and CFO, the authority to approve certain equity grants to employees at and below the senior vice president level, subject to certain parameters approved by the compensation and leadership committee. At the request of the compensation and leadership committee, our CEO typically attends a portion of each compensation and leadership committee meeting, including meetings at which the compensation and leadership committee’s compensation consultant is present. From time to time, various members of management and other employees, as well as outside legal counsel and consultants retained by management, attend compensation and leadership committee meetings to make presentations and provide financial and other background information and advice relevant to compensation and leadership committee deliberations. Our CEO and other NEOs do not typically participate in, or are present during, any deliberations or determinations of our compensation and leadership committee regarding their compensation or individual performance objectives. |
| Role of Compensation Consultants | |
• | Providing accessThe compensation and leadership committee has the authority under its charter to capital for credit invisibleretain the services of one or more external advisors, including compensation consultants, legal counsel, accounting, and mis-scored consumers—We take a holistic approachother advisors, to solvingassist it in performance of its duties and responsibilities. The compensation and leadership committee makes all determinations regarding the financial needsengagement, fees, and services of our customers by combining our deep, data-driven understanding of our customers with our advanced proprietary technology. This helps usthese external advisors, and any such external advisor reports directly to score 100% of the applicants who comecompensation and leadership committee.
During 2023, the compensation and leadership committee retained Willis Towers Watson as its independent compensation consultant to us, enabling us to serve credit invisiblesprovide support and mis-scored consumers that others cannot. In comparison, other lenders, relying on traditional credit bureau-based and in some cases qualitative underwriting and/or legacy systems and processes either decline or inaccurately underwrite loans due to their inability to credit score our customers accurately. |
| |
• | Offering a simple application process with timely funding—Our innovative, alternative data-based credit models power our ability to successfully preapprove borrowers in seconds after they complete an application process that typically takesadvisory services as little as 8-10 minutes. Customers who are approved can receive their loan proceeds the same day.
|
| |
• | Designing responsibly structured products to ensure customer success—To provide manageable payments for our customers, our loan size and length of loan term are generally correlated. Our core offering is a simple-to-understand, personal unsecured installment loan ranging in size from $300 to $10,000, which is fully amortizing with fixed payments that are sized to match each customer’s cash flow. Our loans do not have prepayment penalties or balloon payments. As part of our responsible lending philosophy, we verify income for 100% of our personal loan customers, and we only make loans that our ability-to-pay model indicates customers should be able to afford after meeting their other debts and regular living expenses. We determine the loan size and term based on our assessment of a customer’s ability to pay the loan in full and on schedule by the stated maturity, leading to better outcomes compared to alternative credit products availableit relates to our customers. To make sure a customer is comfortablecompensation program. Willis Towers Watson performs no other services for us other than its work for the compensation and leadership committee. Willis Towers Watson complied with his or her repayment terms, the customer hasdefinition of independence under the option to choose a lower loan amount or alternative repayment terms prior to the execution of the loan documents.
|
| |
• | Delivering significant savings compared to alternatives—According to a study commissioned by usDodd-Frank Act and conducted by the Financial Health Network, we save our customers an estimated average of approximately $1,000 on their first loan with us compared to typically available alternative credit products, which are on average more than four times the cost of our loans,other applicable SEC and some options range up to more than seven times the cost of our loans. For a typical new customer of ours, this equates to approximately one-third of their monthly net take-home pay. These savings create substantial benefits for our customers, allowing them access to liquidity during times of need, such as to help cover unexpected medical bills, repair their car that they rely upon to drive to work or to help pay off more expensive debt.stock exchange regulations.
|
| |
• | Servicing our customers how, where and when they want to be served—We operate over 335 retail locations that our customers can visit in person seven days a week, have contact centers that our customers can call between 7 a.m. and 11 p.m. CST on weekdays and between 9 a.m. and 10 p.m. CST on weekends, and have a fully digital origination platform that our customers can access 24/7 through their mobile phones. In addition, our customers can make their loan payments via ACH or in cash at our retail locations and at more than 56,000 third-party payment sites across the nation. Our employees embody our mission-driven approach, can speak to our customers in English or Spanish, and are fully attuned to their problems. We believe our ability to offer such an omni-channel customer experience is a significant differentiator in the market and leads to a high customer retention rate for their future borrowing needs.
|
| |
• | Rewarding customers when they demonstrate successful repayment behavior:
|
| |
• | Larger, lower cost loans for returning customers—We generally are able to offer customers who repay their loan and return to us for a subsequent loan with a loan that is on average approximately $1,300 larger than their prior loan with us. After a full re-underwriting, we typically also offer returning customers a lower rate, with an average rate reduction between a customer’s first and second loan of approximately six percentage points.
|
| |
• | Development of credit history—We report payment history on every loan we make to nationwide credit bureaus, helping our customers develop a credit history. Since inception, we have helped over 830,000 customers who came to us without a FICO® score begin establishing a credit history.
|
| |
• | Enhancing customer experience through value-add services—We include credit education at the time of loan disbursement to ensure customers, many of whom are new to credit, understand the terms and payment obligations of their loans and how timely and complete payment will help them build positive credit. We also offer customers access to free financial coaching by phone with a nonprofit partner and referrals to a variety of financial health resources.
|
Our service and superior customer value proposition have led to exceptional customer satisfaction and loyalty, as evidenced by our strong Net Promoter Score®, or NPS, averaging over 80 since 2016. This NPS places us among the top consumer companies and is exceptional compared to other financial services companies.
Our applicationUse of advanced data analytics has enabled us to successfully underwrite loans to credit invisible and mis-scored consumers, while growing rapidly and maintaining consistent credit quality since 2009. Our proprietary, centralized credit scoring model and continually evolving data analytics have enabled us to maintain strong absolute and relative performance through varying stages of an economic cycle with net lifetime loan loss rates ranging between 5.5% and 8.1% since 2009. More importantly, since inception we have been able to originate more than 3.7 million loans to empower over 1.7 million customers, saving them an estimated $1.7 billion in aggregate interest and fees compared to typically available alternatives (according to a study commissioned by us and conducted by the Financial Health Network), and helped establish credit for over 830,000 customers who came to us without a FICO® score. Our service to the community has been recognized by the U.S. Department of the Treasury, which has certified us as a Community Development Financial Institution, or CDFI, since 2009. CDFIs are certified by the U.S. Department of the Treasury’s Community Development Financial Institutions Fund, known as the CDFI Fund. CDFIs must have a primary mission of promoting community development, providing financial products and services, serving one or more defined low-income target markets, and maintaining accountability to the communities they serve.
Our Lending Platform
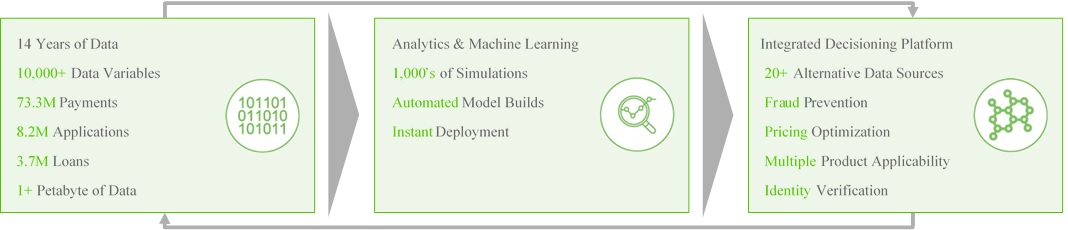
Over the last 14 years of lending, we have developed a deep data-driven understanding of our customers’ needs through a combination of continuous customer engagement and the rigorous application of data science, allowing us to continuously refine and tailor our platform and product set to our customers. We pioneered the research and use of alternative data sources and application of innovative advanced data analytics and next-generation technology in the lending space to develop our proprietary, centralized platform. Our technology and data analytics are crucial to our approach and are a key driver in providing us competitive advantage, unique credit performance, and a lower cost option to millions of consumers.Competitive Market Data
We have built a proprietary lending platform with over 1,000 end nodes that processes large amounts of alternative data along with traditional credit bureau data and leverages machine learning to assess creditworthiness. The speed at which we can incorporate new data sources, test, learn and implement changes into our scoring and decisioning platform allows for highly managed risk outcomes and timely adjustments to changes in consumer behavior or economic conditions. The performance of our 2009 and 2010 loan vintages is a testament to the adaptability and nimbleness of our scoring and decisioning platform. After a spike in losses in our 2008 vintage, we proactively adjusted various inputs to our risk model to fine tune our loan offerings. As a result, our net lifetime loan losses in the 2009 and 2010 vintages came down to 5.5% and 6.4%, respectively from 8.9% in 2008.
Our lending platform has the following key attributes:
| |
• | Unique, large and growing data set—We leverage over one petabyte of data derived from our research and development of alternative data sources and our proprietary data accumulated from more than 8.2 million customer applications, 3.7 million loans and 73.3 million customer payments.
|
| |
• | Serves customers that others cannot—Our use of alternative data allows us to score 100% of the applicants who come to us, enabling us to serve credit invisibles and mis-scored consumers that others cannot.
|
| |
• | Virtuous cycle of risk model improvement—As our data set has grown for over a decade, we have created a virtuous cycle of consistent enhancements to our proprietary risk models that has allowed us to increase both the number of customers for whom we can approve loans and the amount of credit we can responsibly lend as our risk models derive new insights from our growing customer base.
|
| |
• | Scalable and rapidly evolving—Powered by machine learning, our automated model development workflows enable us to evaluate over 10,000 data variables and develop and deploy a new credit risk model in as little as 25 days. We believe this is a process that can typically take 6-12 months for traditional lenders with legacy technology platforms. This quick turnaround time for a new scoring model allows us to quickly incorporate new data sources into our models or to react to changes in consumer behavior or the macroeconomic environment. Our flexible decisioning platform allows our centralized risk team to adjust score cutoffs and assigned loan amounts in a matter of minutes. We use this platform to rapidly build and test strategies across the customer lifecycle, including through direct mail and digital marketing targeting, underwriting, pricing, fraud and customer servicing.
|
| |
• | 100% centralized and automated decision making—Fully automated and centralized decision making that does not allow any manual intervention enables us to achieve highly predictable credit performance and rapid, efficient scaling of our business.
|
| |
• | Supports omni-channel network—Our digital loan application allows our customers to transact with us seamlessly through their preferred method: in person at one of over 335 retail locations, over the phone through contact centers, or via mobile or online through our responsive web-based origination solution.
|
Our Products
Our core product is a simple-to-understand, affordable, unsecured, fully amortizing personal installment loan with fixed payments and fixed interest rates throughout the life of the loan. Our loans do not have prepayment penalties or balloon payments, and range in size from $300 to $10,000 with terms of six to 48 months. Generally, loan payments are structured on a bi-weekly or semi-monthly basis to coincide with our customers' receipt of their wages. As part of our underwriting process, we verify income for all applicants and only approve loans that meet our ability-to-pay criteria.
We charge fixed interest rates on our loans, which vary based on the amount disbursed and applicable state law. For all active loans in our portfolio as of December 31, 2019, at time of disbursement, the simple average original principal balance and weighted average term and annual percentage rate, or APR, at origination was $3,885, 32 months, and 33.8%, respectively.
We fully re-underwrite all loans to returning customers and require all customers to have successfully repaid their previous loan before disbursing their new loan, with the exception of our “Good Customer Program.” Under our Good Customer Program, for certain of our best performing, low-risk customers, we will extend a new loan prior to receiving full repayment of their existing loan. In accordance with our policy to allow a customer to have only one personal loan outstanding, the new loan proceeds are used to pay off the prior loan and the excess amount is disbursed to the customer. Customers qualify for the Good Customer Program if they have made substantial progress in repaying their current loan, meaning they have repaid at least 40% of the original principal balance of the loan, are current on their loan and have made timely payments throughout the term of the loan. In recognition of good payment behavior, we typically grant returning customers, whether under the Good Customer Program or not, a lower rate on subsequent loans. These subsequent loans are on average approximately $1,300 larger than the customer’s prior loan, and have a lower rate, with an average rate reduction of approximately six percentage points between their first and second loan. As of December 31, 2019, returning customers comprised 80% of our owned principal balance outstanding at the end of the period.
As part of our strategy, we are expanding beyond our core offering of unsecured personal installment loans into other financial services that a significant portion of our customers already use and have asked us to provide, such as auto loans and credit cards. In April 2019, we began offering direct auto loans online on a limited basis to customers in California. We provide customers with the ability to determine if they are pre-qualified without impacting their FICO® score and enable them to purchase a vehicle from a dealership or private party. In November 2019, we began offering an auto refinance product enabling customers to refinance an existing secured auto loan, or to consolidate an existing secured auto loan with an unsecured Oportun loan. Currently, our auto loans range from $5,000 to $35,000 with terms from 24 to 72 months. In December 2019, we launched the Oportun® Visa® Credit Card, issued by WebBank, as a pilot to a limited number of potential customers. As the introduction of these new products are still in test mode, we expect the percentage of our principal balance attributable to these products to be minimal compared to our core product.
Our Business Model
In pursuit of our mission, we have developed a high-growth business that is uniquely suited to meet the needs of our target customers. Our business model leverages data-driven customer insight to generate a low cost of acquisition and high customer growth rate. Driven by our proprietary lending platform, our product offering is able to generate high risk-adjusted yields with consistently low levels of credit losses. As a result, we are able to access capital at attractive costs. Our technology-driven approach drives our Operating Efficiency. Components of the business model include:
Efficient customer acquisition—Our superior customer value proposition, which enhances the effectiveness of our marketing, combined with our centralized and automated lending platform, allows us to acquire customers at an efficient cost. We have automated the approval, loan size and pricing decisions, and no employee has discretion over individual underwriting decisions or loan terms. The automation and centralization also enable us to provide consistent service, apply best practices across geographies and channels and, importantly, achieve a lower Customer Acquisition Cost to drive attractive unit economics. We believe our Customer Acquisition Cost of $134 in 2019 compares favorably to other lenders. In addition, for customers acquired during 2018, the average payback period, which refers to the number of months it takes for our Net Revenue to exceed our Customer Acquisition Cost, was less than four months.
Attractive recurring revenue streams—The careful evolution and rapid deployment of our credit models creates a virtuous cycle that increases our customer base and our alternative data set, improving our underwriting tools and ability to grow profitably. This enables us to increase the average loan amount we can responsibly offer our customers. In addition to returning customers, who generally qualify for larger loans and also experience a lower default rate, we believe we can identify customers who we can approve for larger loans without increasing defaults because we apply our credit algorithms to our large and expanding data set.
Low-cost term funding—Our consistent and strong credit performance has enabled us to build a large, scalable and low-cost debt funding program to support the growth of our loan originations. To fund our growth at a low and efficient Cost of Debt, we have built a diversified and well-established capital markets funding program which allows us to partially hedge our exposure to rising interest rates by locking in our interest expense for up to three years. Over the past six years, we have executed 14 bond offerings in the asset-backed securities market, the last 11 of which include tranches that have been rated investment grade. We also have a committed three-year, $400 million secured line of credit, which funds our loan portfolio growth. Additionally, we sell up to 15% of our core personal loan originations and all loans originated under our Access Loan Program, to institutional investors under a forward commitment at a fixed price to demonstrate the value of our loans, increase our liquidity and further diversify our sources of funding. For the year ended December 31, 2019, our Cost of Debt was 4.4%. As of December 31, 2019, over 80% of our debt was at a fixed cost.
Improving Operating Efficiency—To build our business, we have made, and will continue to make, significant investments in data science, our proprietary platform, technology infrastructure, compliance and controls. We believe those investments will continue to enhance our Operating Efficiency and will improve our profit margins as we grow. We had Operating Efficiency of 60.4% and 57.7% for the years ended December 31, 2019 and 2018, respectively. We had Adjusted Operating Efficiency of 57.2% and 57.8% for the years ended December 31, 2019 and 2018, respectively. For more information about the non-GAAP financial measures discussed above, and for a reconciliation of these non-GAAP financial measures to their corresponding GAAP financial measures, see "Non-GAAP Financial Measures."
Our Strategy for Growth
We believe our opportunity for future growth is substantial as we estimate our share of the total market in 2019 was less than one percent based on our total revenue of $600.1 million for 2019 compared to an estimated $196 billion market for consumers underserved by mainstream financial services. To date, we have served only 1.7 million of the estimated 100 million credit invisible and mis-scored consumers in the United States.
Expand nationwide
We intend to expand our geographic presence in existing states and enter new states. Entering new markets is now a scalable and repeatable business process for us. We currently offer our personal loan product in 12 states: California, Texas, Illinois, Utah, Nevada, Arizona, Missouri, New Mexico, Florida, Wisconsin, Idaho and New Jersey. In December 2019, we launched the Oportun® Visa® Credit Card pilot in several new states outside of our current personal loan footprint. In addition, we are considering ways to enter new geographic markets with our personal loan product either via state licensing, a bank sponsorship program or by obtaining a bank charter.
Increase brand awareness and expand our marketing channels
We believe we can drive additional customer growth through effective brand building campaigns and direct marketing. Our exceptional NPS and success with customer referrals, which have been responsible for nearly one-third of loan application volume from new customers in the twelve months ended December 31, 2019, should help accelerate our brand recognition. Through the application of our data science capabilities and advanced analytics, we aim to increase our brand awareness, penetrate a greater percentage of our serviceable market and acquire customers at a low cost.
Continue to evolve our credit underwriting models
We expect to continue to invest significantly in our credit data and analytics capabilities. The evolution of our proprietary risk model will enable us to underwrite more customers and make more credit available to new and returning customers, while maintaining consistent credit quality.
Improvements in our credit models enabled us to increase our average original principal balance by 18% from $3,292 as of December 31, 2017 to $3,885 as of December 31, 2019 without a material change in loss rates. The continuous evolution and rapid deployment of our credit models using machine learning creates a virtuous cycle that increases our customer base and our alternative data set, improving our underwriting tools and ability to grow profitably.
Further improve strong customer loyalty
We seek to increase the percentage of returning customers as loans to these customers have attractive economics for us. Our strategy is to reward our returning customers by giving them a larger loan with a lower rate and longer term, since returning customers experience a lower default rate, are less expensive to service and have lower acquisition costs. We plan to invest in technology and mobile-first experiences to further simplify the loan
process for returning customers. We also expect that adding new products and services, such as auto loans and credit cards, will further improve customer loyalty and extend customer lifetime.
Expand product and service offerings to meet our customers’ needs
In line with our mission, we are constantly evaluating the needs of our customers. Our data indicates that approximately 50% of our customers who come to us initially without a credit score eventually take out a revolving credit card and approximately 30% take out an auto loan. To meet this demand, we are leveraging our unique business model, including our technology and risk models, to develop additional consumer financial services and products, including auto loans and credit cards. In April 2019, we began offering direct auto loans online on a limited test basis to customers in California. We provide customers with the ability to determine if they are pre-qualified without impacting their FICO® score and enable them to purchase a vehicle from a dealership or private party. In November 2019, we began offering an auto refinance product enabling customers to refinance an existing auto loan as well as consolidate an existing secured auto loan with an unsecured Oportun loan. Currently, our auto loans range from $5,000 to $35,000 with terms from 24 to 72 months. In December 2019, we launched the Oportun® Visa® Credit Card, issued by WebBank, Member FDIC, to a limited number of potential customers. Over time, we expect to continue to evaluate opportunities both organically and through acquisition to provide a broader suite of products and services that address our customers’ financial needs in a cost effective and transparent manner, leveraging the efficiency of our existing business model.
Giving at Oportun
We understand that our long-term success is linked to the success of our customers and the communities we serve. That is why we annually dedicate one percent of our net profits to support charitable programs and nonprofit partnerships that help strengthen the communities in which we operate, and in which our employees live and work. Our employee volunteer program enables global team members to donate their time to support charitable organizations. In addition, beginning in 2019, we introduced a program to match employee contributions to eligible non-profit organizations.
Our Competition
We primarily compete with other consumer finance companies, credit card issuers, financial technology companies and financial institutions, as well as other nonbank lenders serving credit-challenged consumers, including online marketplace lenders, lenders that distribute loans through third-party retail locations such as check cashing and money transmitter stores, point-of-sale lending, payday lenders, and auto title lenders and pawn shops focused on low-to-moderate income customers. While the consumer lending market is competitive, we believe that we can serve our target market with products that lead to better outcomes for consumers because they help establish credit and accelerate their entrance into the mainstream financial system. On the contrary, the offerings of payday, auto title and pawn lenders, for example, are provided at rates that are too expensive relative to the borrowers’ ability to pay, are often structured in a way that forces borrowers to become overextended, and typically lack the personalized touch that is essential to cultivating the trust of our target customer base. Few, if any, banks or traditional financial institutions lend to individuals who do not have a credit score. Those individuals that do have a credit score, but have a relatively limited credit history, also typically face constrained access and low approval rates for credit products.
The principal competitive factors in our sector include price, flexibility of loan terms offered, customer convenience and customer satisfaction. We believe our purpose-built technology, responsible construction of our products, omni-channel network and superior customer value proposition allow us to compete favorably on each of these factors. Going forward, however, our competition could include large traditional financial institutions that have more substantial financial resources than we do, and which can leverage established distribution and infrastructure channels. Additionally, new companies are continuing to enter the financial technology space and could deploy innovative solutions that compete for our customers. See “Risk Factors - If we do not compete effectively in our target markets, our results of operations could be harmed” and “Risk Factors - Competition for our highly skilled employees is intense, and we may not be ablestrive to attract and retain the employees we need to support the growth ofmost highly qualified executive officers in an extremely competitive market. Accordingly, our business.”
Regulationscompensation and Compliance
The U.S. consumer lending industryleadership committee believes that it is highly regulated under state and federal law. We are subject to examination, supervision and regulation by each state in which we are licensed. We are also currently, and expect in the future,important when making its compensation decisions to be regulated by the Consumer Financial Protection Bureau, or CFPB. In additioninformed as to the CFPB, other state and federal agencies have the ability to regulate aspects of our business. For example, the Dodd-Frank Wall Street Reform and Consumer Protection Act, or the Dodd-Frank Act, as well as many state statutes provide a mechanismcompetitive market for state attorneys general to investigate us. In addition, the Federal Trade Commission has jurisdiction to investigate aspects of our business. Federal consumer protection laws that these regulators may enforce include laws related to the use of credit reports and credit reporting accuracy, data privacy and security, disclosure of applicable loan terms, anti-discrimination laws, laws protecting members of the military, laws governing payments, including recurring ACH payments and laws regarding electronic signatures and disclosures.
We are also subject to inspections, examinations, supervision and regulation by applicable agencies in each state in which we do business. Many states have laws and regulations that are similar to the federal consumer protection laws referred to above, but the degree and nature of such laws and regulations vary from state to state. State laws also further dictate what state licenses we need to conduct business, as well other aspects of our loansexecutive talent, including the ratescurrent practices of comparable public companies. Consequently, our compensation and fees, the loan terms and sizes, underwriting requirements and collections and servicing practices.
We are registered with Financial Crimes Enforcement Network, or FinCEN,leadership committee annually reviews market data for each executive officer’s position, as a Money Services Business, or MSB, in relation to the reloadable prepaid debit card issued by Metabank, for which we act as program manager. We are required to be compliant with the USA PATRIOT Act, Office of Foreign Assets Control, Bank Secrecy Act, Anti-Money Laundering laws, and Know-Your-Customer requirements and certain state money transmitter laws.
We review our consumer contracts, policies and procedures and processes to ensure compliance with applicable laws and regulations. We have built our systems and processes with controls in place in order to ensure compliance with these laws on a consistent basis. In addition to ensure proper controls are in place, we have a compliance management system that leverages the four key control components of governance, compliance program risk assessments, customer complaint monitoring and internal compliance audits.
Information Technology, Infrastructure and Security
Our applications, including our proprietary workflow management system that handles loan application, document verification, loan disbursement and loan servicing, are architected to be highly available, resilient, scalable and secure. Supporting systems are deployed in a hybrid cloud environment hosted in industry-leading data center and cloud service providers that are N+1 compliant.
We deploy our information technology services and applications across multiple data centers using best of breed network, telephony, server, storage, database and end user services, hardware and operating systems. We design our infrastructure to be load balanced across multiple sites and automatically scale up and down to meet peaks in demand and maintain good application performance.
We have fully redundant data centers in place. Disaster recovery and business continuity plans and tests have been completed, which help to ensure our ability to recover in the event of a disaster or other unforeseen event. We back up our mission critical applications and production databases daily and retain them in compliance with our policies. In the event of a catastrophic disaster affecting one of our hosting facilities, we can restore production databases from a backup to minimize disruption of service. Furthermore, additional measures for operational recovery include real-time replication of production databases for quick failover. In the event of database restores, we perform data consistency checks to validate the integrity of the data recovery process.
We conduct enterprise growth planning analyses to ensure that our technology solutions are aligned with the needs of our business. We believe that we have enough physical capacity to support our operations for the foreseeable future.
We believe that operating a secure business must span people, process, and technology. We build security awareness into our corporate communications and training efforts, and we routinely hold security roundtables with our department leads.
We have deep experience with deploying secure environments and have partnered with industry-leading cloud service providers to host, manage and monitor our mission-critical systems. If required, sensitive data at rest is encrypted with industry standard advanced encryption standards, or AES, using keys that we manage. We ensure our network security with redundant multi-protocol label switching, or MPLS, circuits and site-to-site virtual private networks, or VPNs, that provide a secure, private cloud network and allow us to monitor our sites behind our secure firewalls. Because we collect and store large amounts of customer personally identifiable information, we have invested in industry-proven methods of information security and we take our obligations to protect that information and avoid data breaches very seriously. These activities are supplemented with real-time monitoring and alerting for potential intrusions.
For more information with respect to the regulatory framework affecting our business, see "Risk Factors – Risks Related to our Industry and Regulation."
Seasonality
Our quarterly results of operations may not necessarily be indicative of the results for the full year or the results for any future periods. Our business is highly seasonal, and the fourth quarter is typically our strongest quarter in terms of loan originations. We have historically experienced a seasonal decline in credit performance in the fourth quarter primarily attributable to competing demand of our customers' available cash flow around the holidays. General increases in our customers’ available cash flow in the first quarter, including from cash received from tax refunds, temporarily reduces our customers’ borrowing needs. We experienced this seasonal trend in 2019, consistent with prior years.
Our Intellectual Property
We protect our intellectual property through a combination of trademarks, trade dress, domain names, copyrights and trade secrets, as well as contractual provisions, confidentiality procedures, non-disclosure agreements with third parties, employee disclosure and invention assignment agreements and other contractual rights. We currently have no patent applications on our proprietary risk model, underwriting process or loan approval decision making process because applying for a patent would require us to publicly disclose such information, which we regard as trade secrets. We may pursue such protection in the future to the extent we believe it will be beneficial.
We have trademark rights in our name, our logo, and other brand indicia, and have trademark registrations for select marks in the United States and many other jurisdictions around the world. We will pursue additional trademark registrations to the extent we believe it will be beneficial. We also have registered domain names for websites that we use in our business. We may be subject to third party claims from time to time with respect to our intellectual property. See "—Legal Proceedings"described below.
In addition to using survey data for similar sized companies, the protection provided by our intellectual property rights, we enter into confidentialitycompensation and intellectual property rights agreements with our employees, consultants, contractors and business partners. Under such agreements, our employees, consultants and contractors are subject to invention assignment provisions designed to protect our proprietary information and ensure our ownership in intellectual propertyleadership committee approved a peer group of comparable publicly-traded companies, developed pursuant to such agreements.
Employees
We had 2,663 full-time and 616 part-time employees worldwide as of December 31, 2019. This includes 583 corporate employees in the United States, of which 272 employees are dedicated to technology, risk, analytics and data science.
Available Information
Our website address is www.oportun.com. Our Annual Report on Form 10-K, Quarterly Reports on Form 10-Q, Current Reports on Form 8-K, and amendments to reports filed pursuant to Section 13(a) and 15(d) of the Exchange Act, are filed with the SEC. The SEC’s website, www.sec.gov, contains these reports and other information that registrants (including OPRT) file electronically withassistance of Willis Towers Watson, to aid it in assessing the SEC.
These reports are also available free of charge through our website, www.investor.oportun.com, as soon as reasonably practicable after we file them with, or furnish them to, the SEC.
We announce material information to the public through a variety of means, including filings with the SEC, press releases, public conference calls, our website (www.oportun.com), the investor relations sectionoverall competitiveness of our website (investor.oportun.com), as well as social media, including our LinkedIn page (https://www.linkedin.com/company/oportun/) and Twitter account (@Oportun) . The information on our website is not incorporated by reference into this report. The website addresses listed above are provided for the information of the reader and are not intended to be active links.
Item 1A. Risk Factors
Investing in our common stock involves a high degree of risk. Any of the following risks could have an adverse effect on our business, results of operations and financial condition. The following risks could cause the trading price of our common stock to decline, which would cause you to lose all or part of your investment. You should carefully consider these risks, all of the other information in this report and general economic and business risks before making a decision to invest in our common stock. While we believe the risks described below include all material risks currently known by us, it is possible that these may not be the only ones we face. Additional risks and uncertainties not presently known to us or that we currently deem immaterial may also impair our business operations.
Risks Relating to Our Business
We have experienced rapid growth that may not be indicative of our future growth and, if we continue to grow rapidly, we may not be able to manage our growth effectively.
We have experienced rapid growth and have a limited operating history at our current scale. Assessing our business and future prospects may be difficult because of the risks and difficulties we face. These risks and difficulties include our ability to:
increase the volume of loans originated through our various origination channels, including retail locations, direct mail marketing, contact centers and online, which includes our mobile origination solution;
increase the effectiveness of our direct mail marketing, radio advertising, digital advertising, and other marketing strategies;
efficiently manage and expand our presence and activities in states in which we operate, as well as expand into new states;
successfully build our brand and protect our reputation from negative publicity;
manage our Annualized Net Charge-Off Rate;
maintain the terms on which we lend to our customers;
protect against increasingly sophisticated fraudulent borrowing and online theft;
enter into new markets and introduce new products and services;
continue to expand our customer demographic focus from our original customer base of Spanish-speaking customers;
successfully maintain our diversified funding strategy, including loan warehouse facilities, whole loan sales and securitization transactions;
successfully manage our interest rate spread against our cost of capital;
successfully adjust our proprietary credit risk models, products and services in response to changing macroeconomic conditions and fluctuations in the credit market;
effectively manage and expand the capabilities of our contact centers, outsourcing relationships and other business operations abroad;
effectively secure and maintain the confidentiality of the information provided and utilized across our systems;
successfully compete with companies that are currently in, or may in the future enter, the business of providing consumer financial services to low-to-moderate income customers underserved by traditional, mainstream financial institutions;
attract, integrate and retain qualified employees; and
successfully adapt to complex and evolving regulatory environments.
We expect that, in the future, even if our revenue continues to increase, our revenue or aggregate origination growth rates may decline. In addition, our historical rapid growth has placed, and may continue to place, significant demands on our management and our operational and financial resources. We will need to improve our operational, financial and management controls and our reporting systems and procedures as we continue to grow our business and add more personnel. If we cannot manage our growth effectively, our results of operations will suffer.
We have incurred net losses in the past and may incur net losses in the future.
For the year ended December 31, 2019, we generated net income of $62.5 million. However, for the year ended December 31, 2017, we experienced a net loss of $10.2 million, and we have experienced a net loss in years prior to 2017. As of December 31, 2019, our retained earnings were $77.6 million. We will need to generate and sustain increased revenue and net income levels in future periods in order to increase profitability, and, even if we do, we may not be able to maintain or increase our level of profitability over the long term. We intend to continue to expend significant funds to grow our business, and we may not be able to increase our revenue enough to offset our higher operating expenses. We may incur significant losses in the future for a number of reasons, including the other risks described in this report, and unforeseen expenses, difficulties, complications and delays, and other unknown events. If we are unable to achieve or sustain profitability, our business would suffer,executive compensation program and the market pricekey components of our common stock may decrease.
compensation under the program. The peer group was selected from publicly-traded companies with (i) similar industry focus (i.e., consumer finance, software and services) (ii) comparable company scope and size, or (iii) that have similar product offerings. Our quarterly results are likely to fluctuate significantlycompensation and may not fully reflectleadership committee considered compensation data from the underlying performance of our business.
Our quarterly results of operations are likely to vary significantly in the future and period-to-period comparisons of our results of operations may not be meaningful, especially as a result of our election of the fair value option as of January 1, 2018. Accordingly, the results for any one quarter are not necessarily an indication of future performance. Our quarterly financial results may fluctuate due to a variety of factors, some of which are outside of our control and, as a result, may not fully reflect the underlying performance of our business. Factors that may cause fluctuations in our quarterly financial results include:below-listed companies.
| Atlanticus | Green Dot | MoneyLion | Regional Management | World Acceptance |
•CURO Group | loan volumes, loan mix and the channels through which our loans are originated;
LendingClub | OppFi | SoFi Technologies | |
| Enova International | LendingTree | PROG Holdings | Upstart Holdings | |
the effectiveness
Elements of our direct marketingExecutive Compensation and other marketing channels;
the timing and success of new products and origination channels;
the amount and timing of operating expenses related to acquiring customers and the maintenance and expansion of our business, operations and infrastructure;
net charge-off rates;
adjustments to the fair value of our Fair Value Loans and Fair Value Notes;
our cost of borrowing money and access to the capital markets; and
general economic, industry and market conditions.
In addition, we experience significant seasonality in demand for our loans, which is generally lower in the first quarter. The seasonal slowdown is primarily attributable to high loan demand around the holidays in the fourth quarter and the general increase in our customers’ available cash flows in the first quarter, including cash received from tax refunds, which temporarily reduces their borrowing needs. While our growth has obscured this seasonality from our overall financial results, we expect our results of operations to continue to be affected by such seasonality in the future.
Our risk management efforts may not be effective, which may expose us to market risks that harm our results of operations.
We could incur substantial losses and our business operations could be disrupted if we are unable to effectively identify, monitor and mitigate financial risks, such as credit risk, interest rate risk, prepayment risk and liquidity risk, as well as operational risks. Our risk management policies, procedures and models, may not be sufficient to identify all of the risks we are exposed to, mitigate the risks we have identified or identify additional risks that arise in the future.
As our loan mix changes and as our product offerings evolve, our risk management strategies may not always adapt to such changes. Some of our methods of managing risk are based upon our use of observed historical market behavior and management’s judgment. Other of our methods for managing risk depend on the evaluation of information regarding markets, customers or other matters that are publicly available or otherwise accessible to us. While we employ a broad and diversified set of risk monitoring and risk mitigation techniques, those techniques and the judgments that accompany their application cannot anticipate every economic and financial outcome or the timing of such outcomes. If our risk management efforts are ineffective, we could suffer losses that could harm our business, financial condition or results of operations.
We rely extensively on models in managing many aspects of our business. If our models contain errors or are otherwise ineffective, our business could be adversely affected.
Our ability to attract customers and to build trust in our loan products is significantly dependent on our ability to effectively evaluate a customer’s creditworthiness and likelihood of default. In deciding whether to extend credit to prospective customers, we rely heavily on our proprietary credit risk models, which are statistical models built using third-party alternative data, credit bureau data, customer application data and our credit experience gained through monitoring the performance of our customers over time. Some of these models are built using forms of artificial intelligence, or AI, such as machine learning. If our credit risk models fail to adequately predict the creditworthiness of our customers or their ability to repay their loans due to programming or other errors, or if any portion of the information pertaining to the prospective customer is incorrect, incomplete or becomes stale (whether by fraud, negligence or otherwise), and our systems do not detect such errors, inaccuracies or incompleteness, or any of the other components of our credit decision process described herein fails, we may experience higher than forecasted loan losses. Also, if we are unable to access certain third-party data used in our credit risk models, or access to such data is limited, our ability to accurately evaluate potential customers may be compromised. Credit and other information that we receive from third parties about a customer may also be inaccurate or may not accurately reflect the customer’s creditworthiness, which may adversely affect our loan pricing and approval process, resulting in mispriced loans, incorrect approvals or denials of loans. In addition, this information may not always be complete, up-to-date or properly evaluated. As a result, these methods may not predict future risk exposures, which could be significantly greater than the historical measures or available information indicate.
Our reliance on our credit risk models and other models to manage many aspects of our business, including valuation, pricing, collections management, marketing targeting models, fraud prevention, liquidity and capital planning, direct mail and telesales, may prove in practice to be less predictive than we expect for a variety of reasons, including as a result of errors in constructing, interpreting or using the models or the use of inaccurate assumptions (including failures to update assumptions appropriately in a timely manner, or the use of AI). We rely on our credit risk models and other models to develop and manage new products and services with which we have limited development or operating experience as well as new geographies where we have not historically operated. Our assumptions may be inaccurate, and our models may not be as predictive as expected for many reasons, in particular because they often involve matters that are inherently difficult to predict and beyond our control, such as macroeconomic conditions, credit market volatility and interest rate environment, and they often involve complex interactions between a number of dependent and independent variables
and factors. In particular, even if the general accuracy of our valuation models is validated, valuations are highly dependent upon the reasonableness of our assumptions and the predictability of the relationships that drive the results of the models. The errors or inaccuracies in our models may be material and could lead us to make wrong or sub-optimal decisions in managing our business, and this could harm our business, results of operations and financial condition.
Additionally, if we make errors in the development, validation or implementation of any of the models or tools we use to underwrite the loans that we then securitize or sell to investors, those investors may experience higher delinquencies and losses. We may also be subject to liability to those investors if we misrepresented the characteristics of the loans sold because of those errors. Moreover, future performance of our customers’ loans could differ from past experience because of macroeconomic factors, policy actions by regulators, lending by other institutions or reliability of data used in the underwriting process. To the extent that past experience has influenced the development of our underwriting procedures and proves to be inconsistent with future events, delinquency rates and losses on loans could increase. Errors in our models or tools and an inability to effectively forecast loss rates could also inhibit our ability to sell loans to investors or draw down on borrowings under our warehouse and other debt facilities, which could limit originations of new loans and could hinder our growth and harm our financial performance. Additionally, the use of AI in credit models is relatively new and its impact from a regulatory standpoint is unproven, and any negative regulatory action based upon this could have an adverse impact on our financial performance.
Our business may be adversely affected by disruptions in the credit markets, including reduction in our ability to finance our business.
We depend on securitization transactions, loan warehouse facilities and other forms of debt financing, as well as whole loan sales, in order to finance the principal amount of most of the loans we make to our customers. See more information about our outstanding debt in Note 8 to the Notes to the Consolidated Financial Statements. However, there is no assurance that these sources of capital will continue to be available in the future on terms favorable to us or at all. The availability of debt financing and other sources of capital depends on many factors, some of which are outside of our control. The risk of volatility surrounding the global economic system and uncertainty surrounding the future of regulatory reforms such as the Dodd-Frank Wall Street Reform and Consumer Protection Act, or the Dodd-Frank Act, continue to create uncertainty around access to the capital markets. Events of default or breaches of financial, performance or other covenants, as a result of the underperformance of certain pools of loans underpinning our securitizations or other debt facilities, could reduce or terminate our access to funding from institutional investors, including investment banks, traditional and alternative asset managers and other entities. Such events could also result in default rates at a higher interest rate and therefore increase our cost of capital. In addition, our ability to access future capital may be impaired because our interests in our financed pools of loans are “first loss” interests and so these interests will only be realized to the extent all amounts owed to investors or lenders and service providers under our securitizations and debt facilities are paid in full. In the event of a sudden or unexpected shortage or restriction on the availability of funds, we cannot be sure that we will be able to maintain the necessary levels of funding to retain current levels of originations without incurring higher funding costs, a reduction in the term of funding instruments or increasing the rate of whole loan sales or be able to access funding at all. If we are unable to arrange financing on favorable terms, we may not be able to grow our business as planned and we may have to curtail our origination of loans. In addition, in July 2017 the head of the United Kingdom Financial Conduct Authority announced the desire to phase out the use of LIBOR by the end of 2021. It is not possible to predict whether LIBOR will cease to exist after calendar year 2021, whether additional reforms to LIBOR may be enacted, or whether alternative reference rates will gain market acceptance, and any of these outcomes could increase our interest rate risk related to our Secured Financing which is currently tied to LIBOR. Changes in interest rates or foreign currency exchange rates could affect our interest expense, which could result in volatility in our results of operations, financial condition and cash flows.
We have elected the fair value option effective as of January 1, 2018, and we use estimates in determining the fair value of our loans and our asset-backed notes. If our estimates prove incorrect, we may be required to write down the value of these assets or write up the value of these liabilities, which could adversely affect our results of operations. Further, our election of the fair value option as of January 1, 2018 resulted in a significant one-time impact to our Net Revenue for the year ended December 31, 2018.
Our ability to measure and report our financial position and results of operations is influenced by the need to estimate the impact or outcome of future events on the basis of information available at the time of the issuance of the financial statements. If actual results differ from our judgments and assumptions, then it may have an adverse impact on the results of operations and cash flows. Management has processes in place to monitor these judgments and assumptions, including review by our internal valuation and loan loss allowance committee, but these processes may not ensure that our judgments and assumptions are correct.
We have elected the fair value option to account for our Fair Value Loans and Fair Value Notes as of January 1, 2018, and we use estimates and assumptions in determining the fair value. Our Fair Value Loans represented 85% of our total assets and Fair Value Notes represented 66% of our total liabilities as of December 31, 2019. Our Fair Value Loans are determined using Level 3 inputs and Fair Value Notes are determined using Level 2 inputs. Changes to these inputs could significantly impact our fair value measurements. Valuations are highly dependent upon the reasonableness of our assumptions and the predictability of the relationships that drive the results of our valuation methodologies. In addition, a variety of factors such as changes in the interest rate environment and the credit markets, changes in average life, higher than anticipated delinquency and default levels or financial market illiquidity, may ultimately affect the fair values of our loans receivable and asset-backed notes. Material differences in these ultimate values from those determined based on management’s estimates and assumptions may require us to adjust the value of certain assets and liabilities, including in a manner that is not comparable to others in our industry, which could adversely affect our results of operations.
As a result of the election of the fair value option, our operating results for the year ended December 31, 2018 reflect the fair value of the Fair Value Loans, but such fair value was not offset by declines in fair value for loans made in prior periods resulting from credit losses and other factors, as would have occurred if we had elected the fair value option at inception. Over time, as the Fair Value Loans age and a higher percentage of our loan portfolio become Fair Value Loans, we expect the impact of credit losses reflected in the fair value of our Fair Value Loans to exceed changes in fair value that may occur due to interest rate changes or other market conditions, which will reduce our Net Revenue.
If net charge-off rates are in excess of expected loss rates, our business and results of operations may be harmed.
Our personal loans are not secured by any collateral, not guaranteed or insured by any third party and not backed by any governmental authority in any way. We are therefore limited in our ability to collect on these loans if a customer is unwilling or unable to repay them. A customer’s ability to repay us can be negatively impacted by increases in his or her payment obligations to other lenders under mortgage, credit card and other loans. These changes can result from increases in base lending rates or structured increases in payment obligations and could reduce the ability of our customers to meet their payment obligations to other lenders and to us. If a customer defaults on a loan, we may be unsuccessful in our efforts to collect the amount of the loan. Because our net charge-off rate depends on the collectability of the loans, if we experience an unexpected significant increase in the number of customers who fail to repay their loans or an increase in the principal amount of the loans that are not repaid, our revenue and results of operations could be adversely affected. Furthermore, because our personal loans are unsecured loans, they are dischargeable in bankruptcy. If we experience an unexpected, significant increase in the number of customers who successfully discharge their loans in a bankruptcy action, our revenue and results of operations could be adversely affected.
We incorporate our estimate of lifetime loan losses in our measurement of fair value for our Fair Value Loans. To estimate the appropriate level of allowance for loan losses, we consider known and relevant internal and external factors that affect loan receivable collectability, including the total amount of loans receivable outstanding, historical loan losses, our current collection patterns and economic trends. While this evaluation process uses historical and other objective information, the classification of loans and the forecasts and establishment of loan losses and fair value are also dependent on our subjective assessment based upon our experience and judgment. Our methodology for establishing our fair value is based on the guidance in Accounting Standards Codification, 820 and 825, and, in part, on our historic loss experience. If customer behavior changes as a result of economic conditions and if we are unable to predict how the unemployment rate and general economic uncertainty may affect our estimate of lifetime loan losses, the fair value may be reduced for our Fair Value Loans, which will decrease Net Revenue. Our calculations of fair value are estimates, and if these estimates are inaccurate, our results of operations could be adversely affected. Neither state regulators nor federal regulators regulate our calculations of fair value, and unlike traditional banks, we are not subject to periodic review by bank regulatory agencies of our loss estimates or our calculations of fair value. In addition, because our debt financings include delinquency triggers as predictors of losses, increased delinquencies or losses may reduce or terminate the availability of debt financings to us.
Our results of operations and financial condition and our customers’ willingness to borrow money from us and ability to make payments on their loans have been, and may in the future be, adversely affected by economic conditions and other factors that we cannot control.
Uncertainty and negative trends in general economic conditions in the United States and abroad, historically have created a difficult operating environment for our business and other companies in our industry. Many factors, including factors that are beyond our control, may impact our results of operations or financial condition, our customers’ willingness to incur loan obligations and/ or affect our customers’ willingness or capacity to make payments on their loans. These factors include: unemployment levels, housing markets, immigration policies, gas prices, energy costs, government shutdowns, delays in tax refunds, significant tightening of credit markets and interest rates, as well as events such as natural disasters, acts of war, terrorism, catastrophes and pandemics. In addition, major medical expenses, divorce, death or other issues that affect our customers could affect our customers’ willingness or ability to make payments on their loans. Further, our business currently is heavily concentrated on consumer lending and, as a result, we are more susceptible to fluctuations and risks particular to U.S. consumer credit than a company with a more diversified lending portfolio. We are also more susceptible to the risks of increased regulations and legal and other regulatory actions that are targeted towards consumer credit. If the United States experiences an economic downturn, or if we become affected by other events beyond our control, we may experience a significant reduction in revenue, earnings and cash flows. If our customers default under a loan receivable held directly by us, we will experience loss of principal and anticipated interest payments, which could adversely affect our cash flow from operations. The cost to service our loans may also increase without a corresponding increase in our interest on loans. We may also become exposed to increased credit risk from our customers and third parties who have obligations to us.
If aspects of our business, including the quality of our loan portfolio or our customers’ ability to pay, are significantly affected by economic changes or any other conditions in the future, we cannot be certain that we will adequately adapt our business to such changes, so our business would be adversely affected.
Negative publicity or public perception of our industry or our company could adversely affect our reputation, business and results of operations.
Negative publicity about our industry or our company in the media or on social media platforms, even if inaccurate, could adversely affect our reputation and the confidence in our brand and business model. Our reputation is very important to attracting new customers and retaining existing customers. While we believe that we have a good reputation and that we provide customers with a superior experience, there can be no assurance that we will continue to maintain a good relationship with customers.
Consumer advocacy groups, politicians and certain government and media reports have, in the past, advocated governmental action to prohibit or severely restrict the dollar amount, interest rate, or other terms of consumer loans, particularly “small dollar” loans and those with short terms. The consumer groups and media reports typically focus on the cost to a consumer for this type of loan, which may be higher than the interest typically charged by issuers to consumers with more historical creditworthiness; for example, some groups are critical of loans with APRs greater than 36%. The consumer groups, politicians and government and media reports frequently characterize these short-term consumer loans as predatory or abusive toward consumers. If the negative characterization of short-term consumer loans becomes associated with our business model and loan terms, even if inaccurate, demand for our consumer loans could significantly decrease, and it could be less likely that investors purchase our loans or our asset-backed securities, or our lenders extend or renew lines of credit to us, which could adversely affect our results of operations and financial condition.
Negative perception of our consumer loans or other activities may also result in us being subject to more restrictive laws and regulations and potential investigations, enforcement actions and lawsuits. If there are changes in the laws affecting any of our consumer loans, or our marketing and
servicing of such loans, or if we become subject to such investigations, enforcement actions and lawsuits, our financial condition and results of operations would be adversely affected.
Harm to our reputation can also arise from many other sources, including employee or former employee misconduct, misconduct by outsourced service providers or other counterparties, failure by us or our partners to meet minimum standards of service and quality, and inadequate protection of customer information and compliance failures and claims. Our reputation may also be harmed if we fail to maintain our certification as a Community Development Financial Institution, or CDFI.
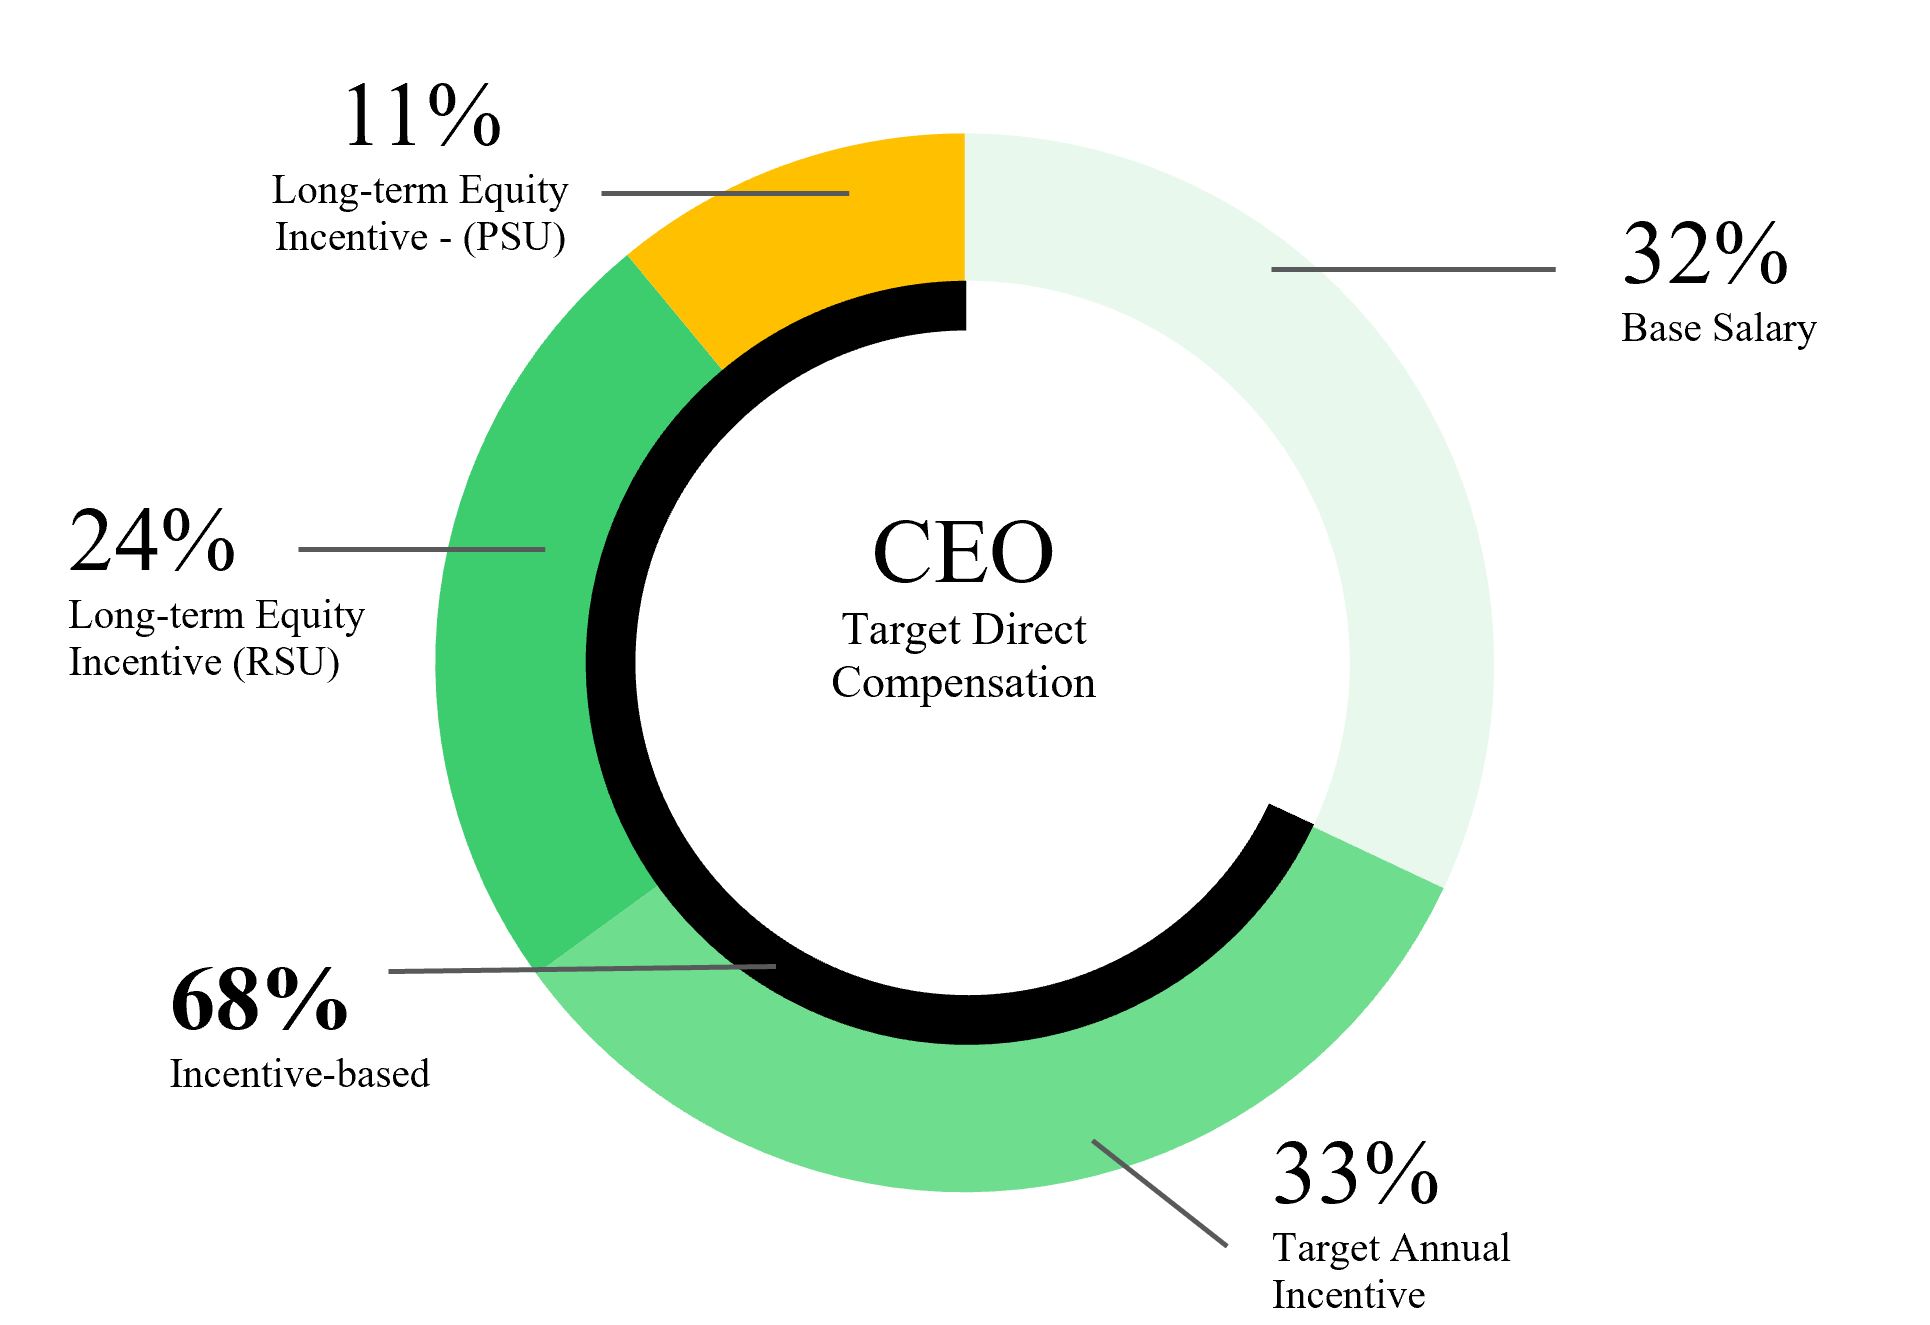
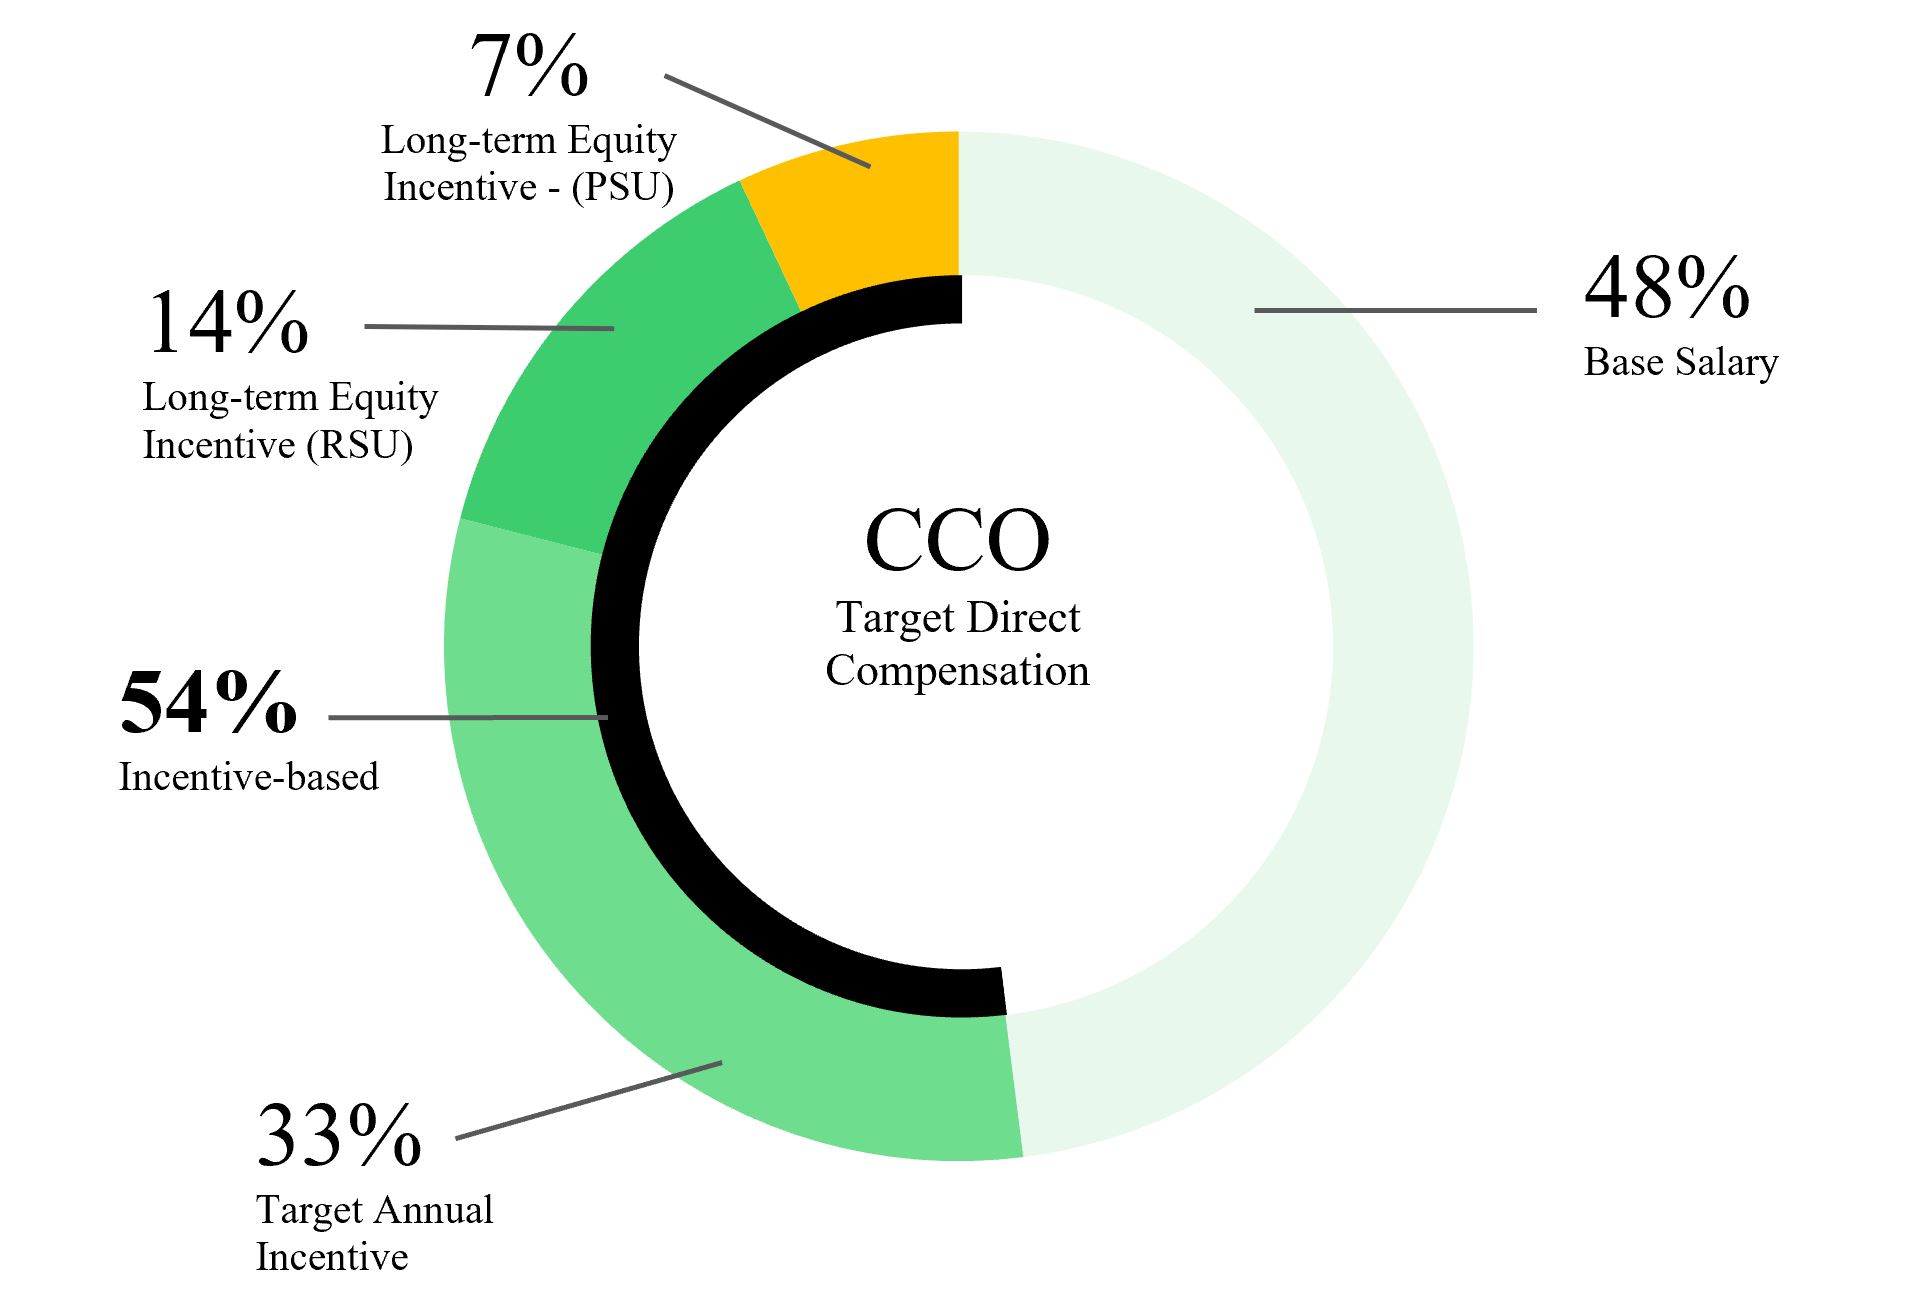
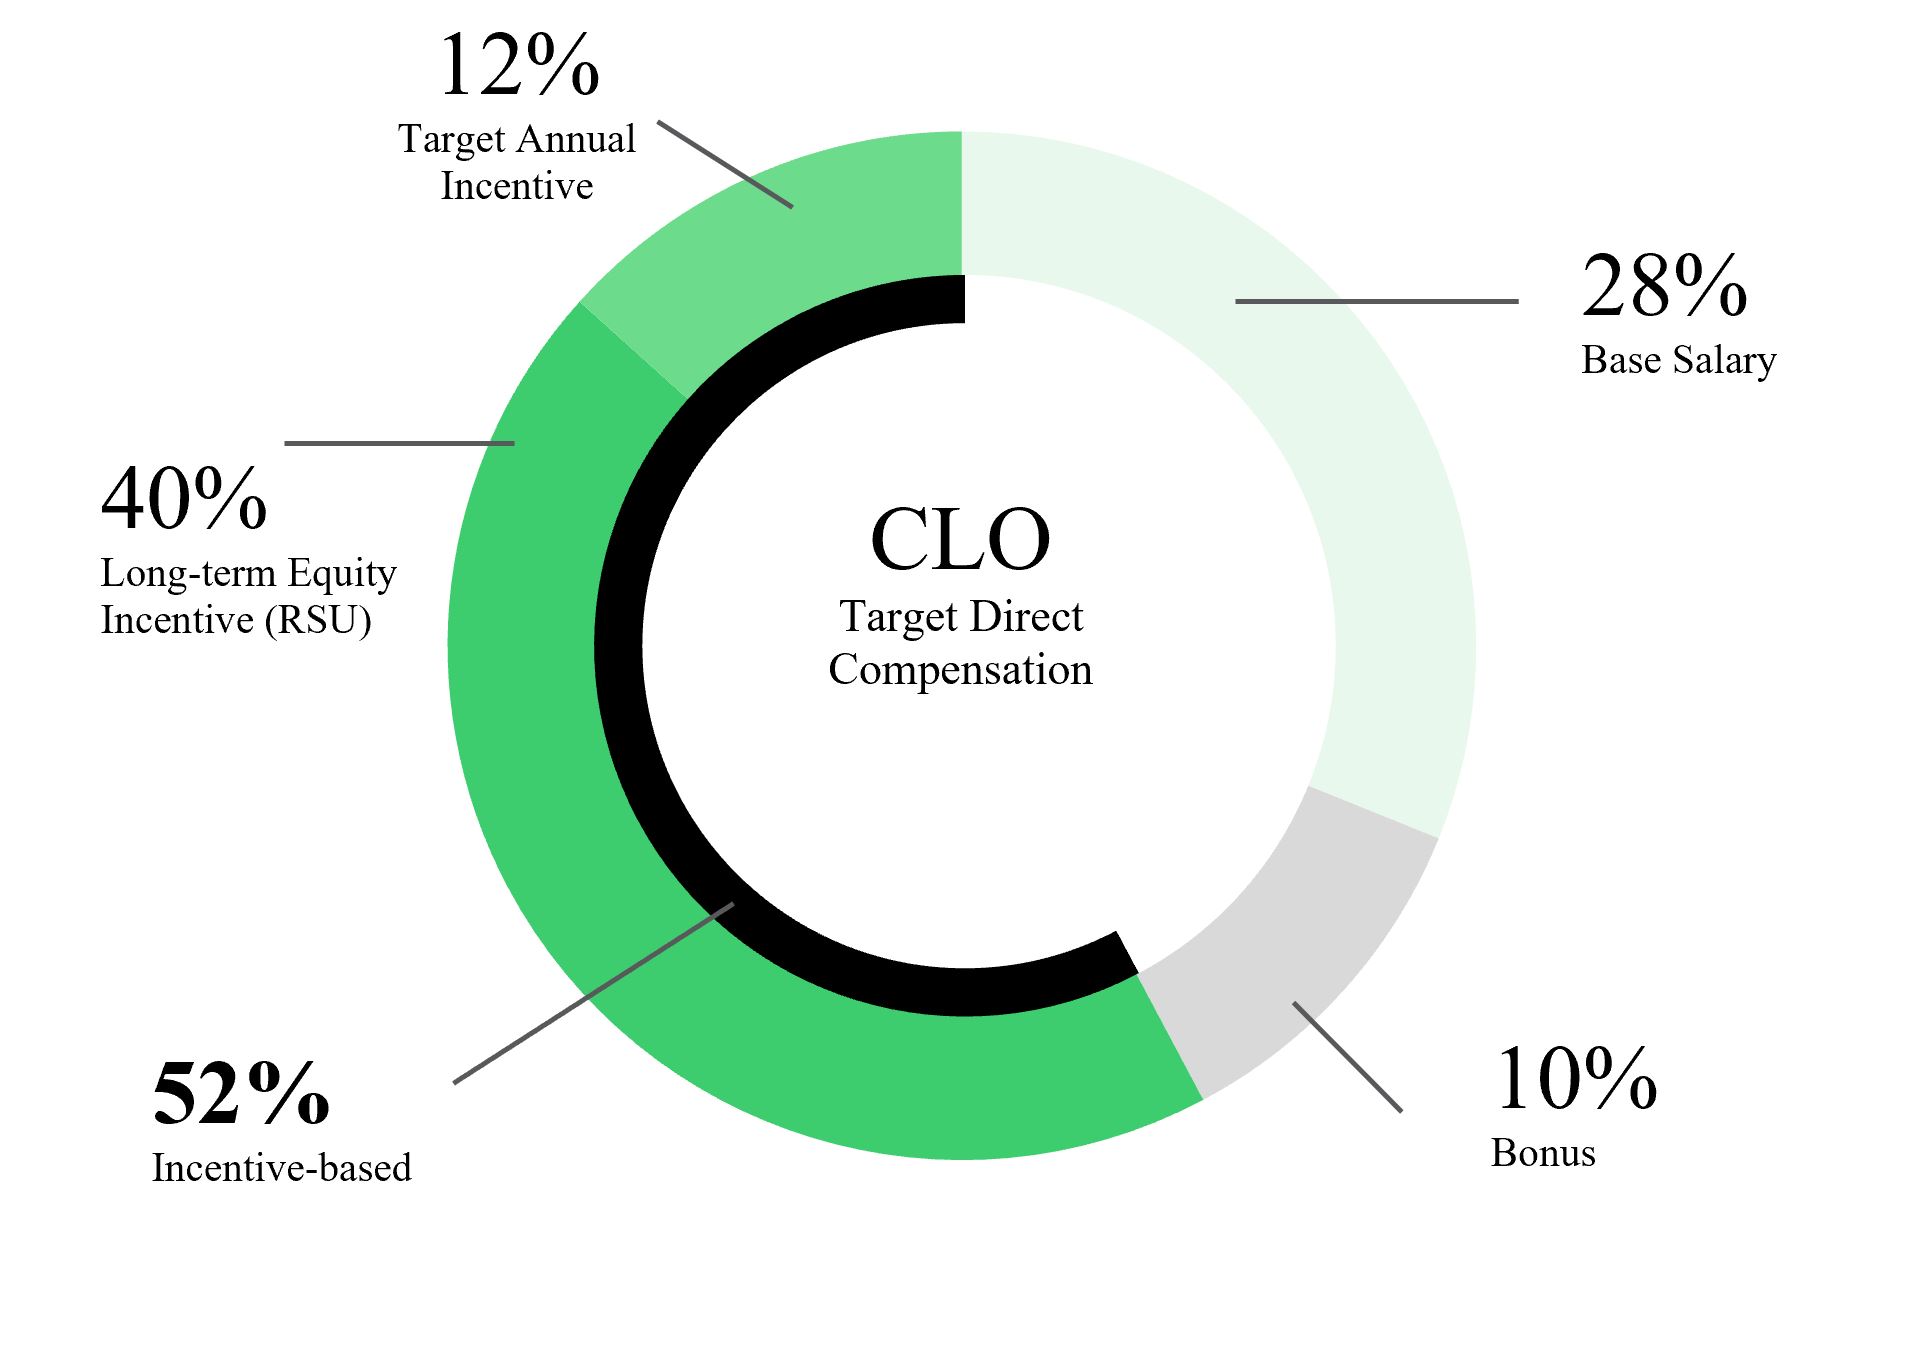
If we do not compete effectively in our target markets, our results of operations could be harmed.2023 Compensation Decisions
The consumer lending market is highly competitive and increasingly dynamic as emerging technologies continue to enter into the marketplace. Technological advances and heightened e-commerce activities have increased consumers’ accessibility to products and services, which has intensified the desirability of offering loans to consumers through digital-based solutions. We primarily compete with other consumer finance companies, credit card issuers, financial technology companies and financial institutions, as well as payday lenders and pawn shops focused on low-to-moderate income customers. Many of our competitors operate with different business models, such as lending as a service, lending through partners or point-of-sale lending, have different cost structures or participate selectively in different market segments. We may also face competition from companies that have not previously competed in the consumer lending market for customers with little or no credit history. Many of our current or potential competitors have significantly more financial, technical, marketing and other resources than we do and may be able to devote greater resources to the development, promotion, sale and support of their platforms and distribution channels. We face competition in areas such as compliance capabilities, financing terms, promotional offerings, fees, approval rates, speed and simplicity of loan origination, ease-of-use, marketing expertise, service levels, products and services, technological capabilities and integration, customer service, strategic partnerships, brand and reputation. Our competitors may also have longer operating histories, lower financing costs or costs of capital, more extensive customer bases, more diversified products and customer bases, operational efficiencies, more versatile technology platforms, greater brand recognition and brand loyalty and broader customer and partner relationships than we have. Our competitors may be better at developing new products, responding more quickly to new technologies and undertaking more extensive marketing campaigns. Furthermore, our existing and potential competitors may decide to modify their pricing and business models to compete more directly with our model. If we are unable to compete with such companies or fail to meet the need for innovation in our industry, the demand for our products could stagnate or substantially decline, or our products could fail to maintain or achieve more widespread market acceptance.
Our success and future growth depend on our Oportun brand and our successful marketing efforts across channels, and if we are unable to attract or retain customers, our business and financial results may be harmed.
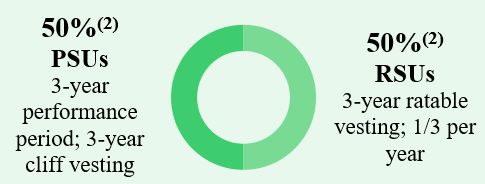
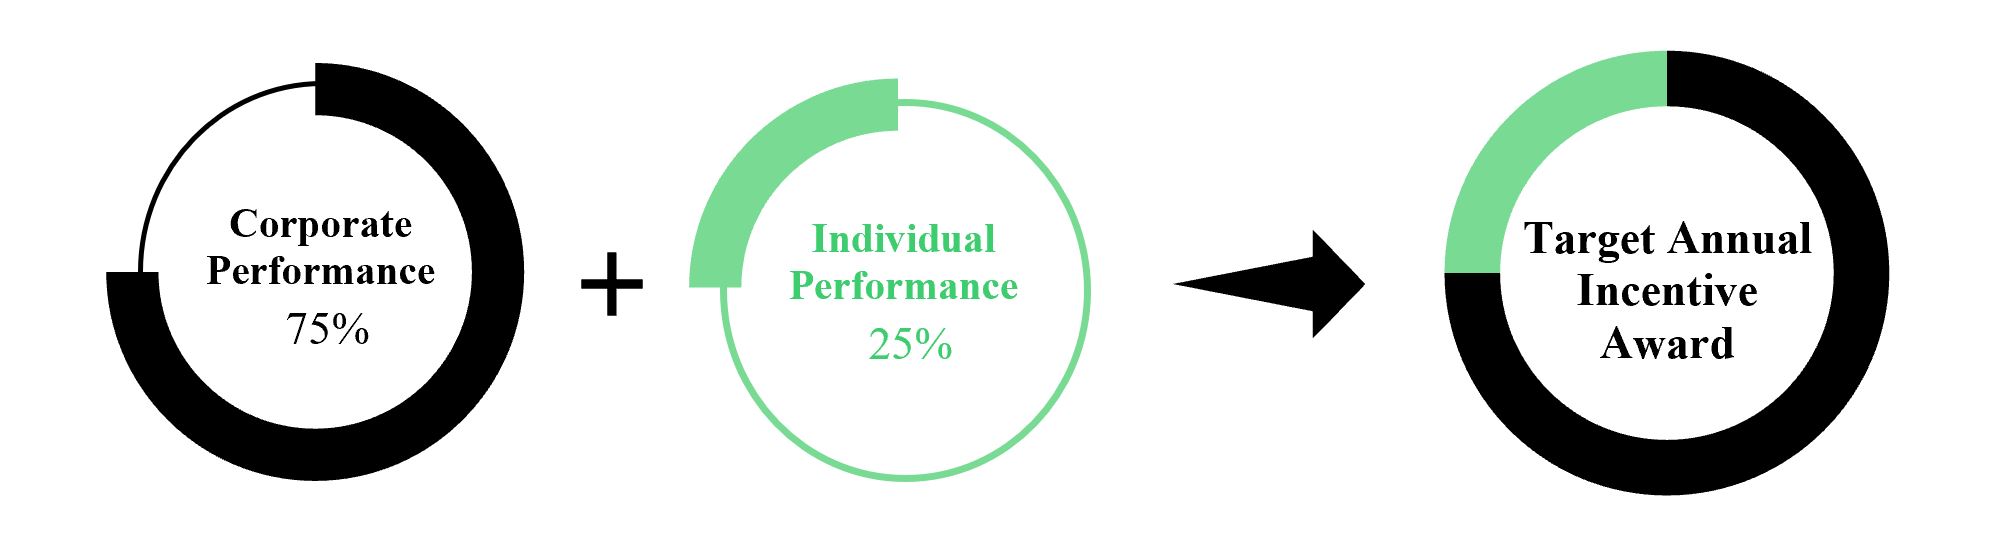
We intend to continue to dedicate significant resources to our marketing efforts, particularly as we develop our brand. Our ability to attract qualified customers depends in large part on the success of these marketing efforts and the successkey components of the marketing channels we use to promote our products. Intarget total direct compensation for each executive officer set by the past, we marketed primarily through word of mouth at our retail locationscompensation and direct mail,leadership committee annually are annual base salary, short-term cash incentive compensation and more recently, through radiolong-term equity incentive compensation (PSUs and digital advertising, such as paidRSUs). The compensation and unpaid search, e-mail marketingleadership committee generally positions total cash compensation and paid display advertisements. We expect our future marketing programs to include direct mail, radio, television, print, online display, video, digital advertising, search engine optimization, search engine marketing, social media, events and other grassroots activities, as well as retail and digital sources of leads, such as lead aggregators and retail referral partners. The marketing channels that we employ may become more crowded and saturated by other lenders or the methodologies, policies and regulations applicable to marketing channels may change, which may decrease the effectiveness of our marketing campaigns and increase our customer acquisition costs, which may in turn adversely affect our results of operations.
Our business model relies on our ability to scale rapidly, and if our marketing efforts are not successful or if we are unsuccessful in developing our brand marketing campaigns, it could have an adverse effect on our ability to attract customers. If we fail to successfully promote and maintain our brand or if we incur substantial expenses in an unsuccessful attempt to promote and maintain our brand, we may lose existing customers to our competitors or be unable to attract new customers, which in turn would harm our business, results of operations and financial condition. Even if our marketing efforts result in increased revenue, we may be unable to recover our marketing costs through increases in loan volume. Any incremental increases in customer acquisition cost could have an adverse effect on our business, results of operations and financial condition. Furthermore, increases in marketing and other customer acquisition costs may not result in increased loan originations at the levels we anticipate or at all, which could resultequity compensation in a higher customer acquisition cost per account.
As we continue to expand our loan origination and acquisition channels, introduce new products and services and enter into new states, we also face the risks that our mobile and other channels could be unprofitable, increase costs, decrease operating margins or take longer than anticipated to achieve our target margins due to: difficulties with user interface or disappointment with the user experience; defects, errors or failures in our mobile service; negative publicity about our financial products and services or our mobile service’s performance or effectiveness; delays in releasing to the market new mobile service enhancements; uncertainty in applicable consumer protection laws and regulations to the mobile loan environment; and increased risks of fraudulent activity associated with our mobile channel.
Our current and future business growth strategy involves expanding into new markets with new retail location openings, and we may not integrate or manage new retail locations we open or acquire.
Opening new retail locations and increasing originations at existing retail locations are important elements of our growth strategy. We opened 34, 50 and 42 new retail locations in 2019, 2018 and 2017, respectively. New retail location openings may impose significant costs on us and subject us to numerous risks, including:
identification of new locations and negotiation of acceptable lease terms; and
incurrence of additional indebtedness (if necessary to finance new retail locations).
Our continued growth is dependent upon a number of factors, including the availability of suitable retail locations, the ability to obtain any required government permits and licenses, zoning and occupancy requirements, hiring qualified management and customer service personnel, and other factors, some of which are beyond our control. If we fail to anticipate customers’ needs or market dynamics related to the region or neighborhood of a new retail location, such retail location may not deliver the expected financial results. A recent trend among some municipalities has been to enact zoning restrictions in certain markets. These zoning restrictions may limit the number of non-bank lenders that can operate in an area or require certain distance requirements between competitors, residential areas or highways. Depending on the way a zoning restriction may be drafted, such restriction may restrict our ability to operate within those zoned areas. We may not be able to continue to expand our business successfully through new retail location openings in the future.
We could experience a decline in repeat customers.
As of December 31, 2019, December 31, 2018 and December 31, 2017, returning customers comprised 80%, 80% and 78%, respectively, of our Owned Principal Balance at End of Period. In order for us to maintain or improve our operating results, it is important that we continue to extend loans to returning customers who have successfully repaid their previous loans. Our repeat loan rates may decline or fluctuate as a result of our expansion into new products and markets or because our customers are able to obtain alternative sources of funding based on their credit history with us, and new customers we acquire in the future may not be as loyal as our current customer base. If our repeat loan rates decline, we may not realize consistent or improved operating results from our existing customer base.
We are, and intend in the future to continue, developing new financial products and services, and our failure to accurately predict their demand or growth could have an adverse effect on our business.
We are, and intend in the future to continue, developing new financial products and services, such as credit cards and auto loans. We intend to continue investing significant resources in developing new tools, features, services, products and other offerings. New initiatives are inherently risky, as each involves unproven business strategies and new financial products and services with which we have limited or no prior development or operating experience.
We can provide no assurance that we will be able to develop, commercially market and achieve acceptance of our new products and services. In addition, our investment of resources to develop new products and services may either be insufficient or result in expenses that are excessive in light of revenue actually originated from these new products and services. Product or service introductions may not always be successful. For example, we invested resources in development, marketing, and support for the pilot launch of OportunPath to a limited number of customers but decided in the fourth quarter of 2019 to discontinue the service in order to strategically realign our resources to focus on other products. In addition, the borrower profile of customers using our new products and services may not be as attractive as the customers that we currently serve, which may lead to higher levels of delinquencies or defaults than we have historically experienced. Failure to accurately predict demand or growth with respect to our new products and services could adversely impact our business, and there is always risk that these new products and services will be unprofitable, will increase our costs or will decrease operating margins or take longer than anticipated to achieve target margins. Further, our development efforts with respect to these initiatives could distract management from current operations and will divert capital and other resources from our existing business.
We are, and intend in the future to continue, expanding into new geographic regions, and our failure to comply with applicable laws or regulations, or accurately predict demand or growth, related to these geographic regions could have an adverse effect on our business.
We intend to continue expanding into new geographic regions. We can provide no assurance that we will achieve similar levels of success, if any, in the new geographic regions where we do not currently operate. In addition, each of the new states where we do not currently operate may have different laws and regulations that apply to our products and services. As such, we expect to be subject to significant additional legal and regulatory requirements, including various federal and state consumer lending laws. We have limited experience in managing risks and the compliance requirements attendant to these additional legal and regulatory requirements in new geographies. The costs of compliance and any failure by us to comply with such regulatory requirements in new geographies could harm our business.
Our proprietary credit risk models rely in part on the use of third-party data to assess and predict the creditworthiness of our customers, and if we lose the ability to license or use such third-party data, or if such third-party data contain inaccuracies, it may harm our results of operations.
We rely on our proprietary credit risk models, which are statistical models built using third-party alternative data, credit bureau data, customer application data and our credit experience gained through monitoring the payment performance of our customers over time. If we are unable to access certain third-party data used in our credit risk models, or our access to such data is limited, our ability to accurately evaluate potential customers will be compromised, and we may be unable to effectively predict probable credit losses inherent in our loan portfolio, which would negatively impact our results of operations. Third-party data sources include credit bureau data and other alternative data sources. Such data is electronically obtained from third parties and is aggregated by our risk engine to be used in our credit risk models to score applicants and make credit decisions and in our verification processes to confirm customer reported information. Data from consumer reporting agencies and other information that we receive from third parties about a customer may be inaccurate or may not accurately reflect the customer’s creditworthiness, which may cause us to provide loans to higher risk customers than we intend through our underwriting process and/or inaccurately price the loans we make. We use numerous third-party data sources and multiple credit factors within our proprietary credit risk models, which helps mitigate, but does not eliminate, the risk of an inaccurate individual report. In addition, there are risks that the costs ofcommittee believes substantially links executive compensation to corporate performance and strikes a balance between our access to third-party data may increase or our terms with such third-party data providers could worsen.
We follow procedures to verify each customer’s identity, income,short-term and address, which are designed to minimize fraud. These procedures may include visual inspection of customer identification documents to ensure authenticity, review of paystubs or bank statements for proof of income and employment, and review of analysis of information from credit bureaus, fraud detection databases and other alternative data sources for verification of employment,
income and other debt obligations. If any of the information that is considered in the loan review process is inaccurate, whether intentional or not, and such inaccuracy is not detected prior to loan funding, the loan may have a greater risk of default than expected. If any of our procedures are not followed, or if these procedures fail, fraud may occur. Additionally, there is a risk that following the date of the loan application, a customer may have defaulted on, or become delinquent in the payment of, a pre-existing debt obligation, taken on additional debt, lost his or her job or other sources of income or experienced other adverse financial events. Fraudulent activity or significant increases in fraudulent activity could also lead to regulatory intervention, negatively impact our results of operations, brand and reputation and require us to take additional steps to reduce fraud risk, which could increase our costs.
If we are unable to collect payment on and service the loans we make to our customers, our business would be harmed.
Our ability to adequately service our loans is dependent upon our ability to grow and appropriately train our customer service and collections staff, our ability to expand existing and open new contact centers as our loans increase, and our ability to reach our customers via phone, text, or email when they default. Additionally, our customer service and collections staff are dependent upon our maintaining adequate information technology, telephony and internet connectivity such that they can perform their job functions. If we fail to adequately leverage these technologies to service and collect amounts owed in respect of our loans, or if consumers opt to block us from calling, texting, emailing or otherwise contacting them when they are in default, then payments to us may be delayed or reduced, which would increase our delinquency rate and loan losses.
Because we receive a significant amount of cash in our retail locations through customer loan repayments, we may be subject to theft and cash shortages due to employee errors.
Since our business requires us to receive a significant amount of cash in each of our retail locations, we are subject to the risk of theft (including by or facilitated by employees) and cash shortages due to employee errors. Although we have implemented various procedures and programs to reduce these risks, maintain insurance coverage for theft and provide security measures for our facilities, we cannot make assurances that theft and employee error will not occur. We have experienced theft and attempted theft in the past.
We are exposed to geographic concentration risk.
The geographic concentration of our loan originations may expose us to an increased risk of loss due to risks associated with certain regions. Certain regions of the United States from time to time will experience weaker economic conditions and higher unemployment and, consequently, will experience higher rates of delinquency and loss than on similar loans nationally. In addition, natural or man-made disasters in specific geographic regions may result in higher rates of delinquency and loss in those areas.long-term strategic goals. A significant portion of our outstanding receivablesNEOs’ target total direct compensation opportunity is originated in certain states, and within the states where we operate, originations are generally more concentrated in and around metropolitan areas and other population centers. Therefore, economic conditions, natural or man-made disasters or other factors affecting these states or areas in particular could adversely impact the delinquency and default experiencecomprised of the receivables and could adversely affect our business. Further, the concentration of our outstanding receivables in one or more states would have a disproportionate effect on us if governmental authorities in any of those states take action against us or take action affecting how we conduct our business.
As of December 31, 2019, 59%, 25%, 5% and 5% of our Owned Principal Balance at End of Period related to customers from California, Texas, Illinois and Florida, respectively. If any of the events noted in these risk factors were to occur in or have a disproportionate impact in regions where we operate or plan to commence operations, it may negatively affect our business in many ways, including increased delinquencies and loan losses or a decrease in future originations.
Changes in immigration patterns, policy or enforcement could affect some of our customers, including those who may be undocumented immigrants, and consequently impact the performance of our loans, our business and results of operations.
Some of our customers are immigrants and some may not be U.S. citizens or permanent resident aliens. We follow appropriate customer identification procedures as mandated by law, including accepting government issued picture identification that may be issued by non-U.S. governments, as permitted by the USA PATRIOT Act, but we do not verify the immigration status of our customers, which we believe is consistent with industry best practices and is not required by law. While our credit models look to approve customers who have stability of residency and employment, it is possible that a significant change in immigration patterns, policy or enforcement could cause some customers to emigrate from the United States, either voluntarily or involuntarily, or slow the flow of new immigrants to the United States. Immigration reform is a priority of the current administration, which could lead to changes in laws that make it more difficult or less desirable for immigrants to work“at-risk” compensation in the United States, resultingform of performance-based annual incentive opportunities and equity awards in increased delinquencies and losses on our loans or a decrease in future originations dueorder to more difficulty for potential customers to earn income. In addition, if we or our competitors receive negative publicity around making loans to undocumented immigrants, it may draw additional attention from regulatory bodies or consumer advocacy groups, all of which may harm our brand and business. We cannot predictalign the likelihood, nature or extent of government regulation that may arise from future legislation or administrative action.
Our current level of interest rate spread may decline in the future. Any material reduction in our interest rate spread could adversely affect our results of operations.
We earn over 90% of our revenue from interest payments on the loans we make to our customers. Financial institutions and other funding sources provide usNEOs’ incentives with the capital to fund a substantial portion of the principal amount of our loans to customers and charge us interest on funds that we borrow. In the event that the spread between the interest rate at which we lend to our customers and the rate at which we borrow from our lenders decreases, our Net Revenue will decrease. The interest rates we charge to our customers and pay to our lenders could each be affected by a variety of factors, including our ability to access capital markets , the volume of loans we make to our customers, loan mix, competition and regulatory limitations. See “Part II, Item 7A Quantitative and Qualitative Disclosures about Market Risk.”
Market interest rate changes may adversely affect our business forecasts and expectations and are highly sensitive to many macroeconomic factors beyond our control, such as inflation, recession, the state of the credit markets, global economic disruptions, unemployment and the fiscal and monetary policies of the federal government and its agencies. Interest rate changes may require us to make adjustments to the fair value of our Fair Value Loans or Fair Value Notes, which may in turn adversely affect our results of operations. For instance, interest rates recently declined significantly. When interest rates fall, the fair value of our Fair Value Loans increases, which increases Net Revenue. In addition, decreasing interest rates also increase the fair value of our Fair Value Notes, which reduces Net Revenue. Because the duration and fair value of our loans and asset- backed notes are different, the respective changes in fair value did not fully offset each other resulting in a negative impact on Net Revenue. We do not currently hedge our interest rate exposure associated with our debt financing. Any reduction in our interest rate spread could have an adverse effect on our business, results of operations and financial condition. We do not currently hedge our interest rate exposure associated with our debt financing or fair market valuation of our loans.
In connection with our securitizations, secured financing facility, and whole loan sales, we make representations and warranties concerning these loans. If those representations and warranties are not correct, we could be required to repurchase the loans. Any significant required repurchases could have an adverse effect on our ability to operate and fund our business.
In our asset-backed securitizations, our secured financing facility and our whole loan sales, we make numerous representations and warranties concerning the characteristics of the loans we transfer and sell, including representations and warranties that the loans meet the eligibility requirements of those facilities and investors. If those representations and warranties are incorrect, we may be required to repurchase the loans. Failure to repurchase so-called ineligible loans when required would constitute an event of default under our securitizations, our secured financing facility and our whole loan sales and a termination event under the applicable agreement. We can provide no assurance, however, that we would have adequate cash or other qualifying assets available to make such repurchases.
Fraudulent activity could negatively impact our business, operating results, brand and reputation and require us to take steps to reduce fraud risk.
Fraud is prevalent in the financial services industry and is likely to increase as perpetrators become more sophisticated. We are subject to the risk of fraudulent activity associated with customers and third parties handling customer information. Also, we continue to develop and expand our mobile origination channel, which involves the use of internet and telecommunications technologies (including mobile devices) to offer our products and services. These new mobile technologies may be more susceptible to the fraudulent activities of organized criminals, perpetrators of fraud, hackers, terrorists and others. Our resources, technologies and fraud prevention tools may be insufficient to accurately detect and prevent fraud. If the level of our fraud losses increases, our results of operations could be harmed, our brand and reputation may be negatively impacted, we may be subjected to higher regulatory scrutiny and our costs may increase as we attempt to reduce such fraud.
Security breaches of customers’ confidential information that we store may harm our reputation, adversely affect our results of operations, and expose us to liability.
We are increasingly dependent on information technology systems and infrastructure, including mobile technologies, to operate our business. In the ordinary course of our business, we collect, process, transmit and store large amounts of sensitive information, including the personal information, credit information and other sensitive data of our customers and potential customers. It is critical that we do so in a secure manner to maintain the confidentiality, integrity and availability of such sensitive information. We also have arrangements in place with certain of our third-party vendors that require us to share consumer information. We have also outsourced elements of our operations (including elements of our information technology infrastructure) to third parties, and as a result, we manage a number of third-party vendors who may have access to our computer networks or our confidential information. In addition, many of those third parties may in turn subcontract or outsource some of their responsibilities to third parties. As a result, our information technology systems, including the functions of third parties that are involved or have access to those systems, is very large and complex. While all information technology operations are inherently vulnerable to inadvertent or intentional security breaches, incidents, attacks and exposures, the size, complexity, accessibility and distributed nature of our information technology systems, and the large amounts of sensitive information stored on those systems, make such systems potentially vulnerable to unintentional or malicious, internal and external attacks on our technology environment. Potential vulnerabilities can be exploited from inadvertent or intentional actions of our employees, third-party vendors, business partners, or by malicious third parties. Attacks of this nature are increasing in their frequency, levels of persistence, sophistication and intensity, and are being conducted by sophisticated and organized groups and individuals with a wide range of motives (including, but not limited to, industrial espionage) and expertise, including organized criminal groups, “hacktivists,” nation states and others. In addition to the extraction of sensitive information, such attacks could include the deployment of harmful malware, ransomware, denial-of-service attacks, social engineering and other means to affect service reliability and threaten the confidentiality, integrity and availability of information and systems. In addition, the prevalent use of mobile devices increases the risk of data security incidents. Significant disruptions of our, our third-party vendors’ and/ or business partners’ information technology systems or other similar data security incidents could adversely affect our business operations and result in the loss, misappropriation, or unauthorized access, use or disclosure of, or the prevention of access to, sensitive information, which could result in financial, legal, regulatory, business and reputational harm to us.
Because techniques used to obtain unauthorized access or to sabotage systems change frequently and generally are not recognized until they are launched against a target, we and our third-party hosting facilities may be unable to anticipate these techniques or to implement adequate preventative measures. In addition, many governments have enacted laws requiring companies to notify individuals of data security breaches involving their personal data. These mandatory disclosures regarding a security breach are costly to implement and often lead to widespread negative publicity, which may cause our customers to lose confidence in the effectiveness of our data security measures. Any security breach, whether actual or perceived, would harm our reputation and we could lose customers.
We also face indirect technology, cybersecurity and operational risks relating to the customers, clients and other third parties with whom we do business or upon whom we rely to facilitate or enable our business activities, including vendors, payment processors, and other parties who have access
to confidential information due to our agreements with them. In addition, any security compromise in our industry, whether actual or perceived, or information technology system disruptions, natural disasters, terrorism, war and telecommunication and electrical failures, could interrupt our business or operations, harm our reputation, erode customer confidence, negatively affect our ability to attract new customers, or subject us to third-party lawsuits, regulatory fines or other action or liability.
Like other financial services firms, we have been and continue to be the subject of actual or attempted unauthorized access, mishandling or misuse of information, computer viruses or malware, and cyber-attacks that could obtain confidential information, destroy data, disrupt or degrade service, sabotage systems or cause other damage, distributed denial of service attacks, data breaches and other infiltration, exfiltration or other similar events. On August 24, 2019, we identified an incident involving unauthorized access to a small number of company email accounts. Forensic investigation indicated that a small amount of consumer and employee sensitive information was contained in these email accounts, which has currently resulted in breach notices sent and credit monitoring provided to approximately 700 consumers.
Our retail locations also process physical customer loan documentation that contain confidential information about our customers, including financial and personally identifiable information. We retain physical records in various storage locations outside of our retail locations. The loss or theft of customer information and data from our retail locations or other storage locations could subject us to additional regulatory scrutiny, possible civil litigation and possible financial liability and losses.
While we regularly monitor data flow inside and outside the company, attackers have become very sophisticated in the way they conceal access to systems, and many companies that have been attacked are not aware that they have been attacked. Any event that leads to unauthorized access, use or disclosure of personal information, including but not limited to personal information regarding our customers, loan applicants or employees, could disrupt our business, harm our reputation, compel us to comply with applicable federal and/or state breach notification laws and foreign law equivalents, subject us to litigation, regulatory investigation and oversight, mandatory corrective action, require us to verify the correctness of database contents, or otherwise subject us to liability under laws, regulations and contractual obligations, including those that protect the privacy and security of personal information. This could result in increased costs to us, and result in significant legal and financial exposure and/or reputational harm. In addition, any failure or perceived failure by us or our vendors to comply with our privacy, confidentiality or data security-related legal or other obligations to third parties, or any security incidents or other inappropriate access events that result in the unauthorized access, release or transfer of sensitive information, which could include personally identifiable information, may result in governmental investigations, enforcement actions, regulatory fines, litigation, or public statements against us by advocacy groups or others, and could cause third parties, to lose trust in us or we could be subject to claims by third parties that we have breached our privacy- or confidentiality- related obligations, which could harm our business and prospects. Moreover, data security incidents and other inappropriate access can be difficult to detect, and any delay in identifying them may lead to increased harm of the type described above. There can be no assurance that our security measures intended to protect our information technology systems and infrastructure will successfully prevent service interruptions or security incidents.
We maintain errors, omissions, and cyber liability insurance policies covering certain security and privacy damages. However, we cannot be certain that our coverage will continue to be available on economically reasonable terms or will be available in sufficient amounts to cover one or more large claims, or that the insurer will not deny coverage as to any future claim. The successful assertion of one or more large claims against us that exceed available insurance coverage, or the occurrence of changes in our insurance policies, including premium increases or the imposition of large deductible or co-insurance requirements, could have an adverse effect on our business, financial condition and results of operations.
Our ability to collect payment on loans and maintain accurate accounts may be adversely affected by computer viruses, physical or electronic break-ins, technical errors and similar disruptions.
The automated nature of our business may make us attractive targets for hacking and potentially vulnerable to computer malware, physical or electronic break-ins and similar disruptions. Despite efforts to ensure the integrity of our systems, it is possible that we may not be able to anticipate or to implement effective preventive measures against all security breaches of these types, in which case there would be an increased risk of fraud or identity theft, and we may experience losses on, or delays in the collection of amounts owed on, a fraudulently induced loan.
In addition, the software that we have developed to use in our daily operations is highly complex and may contain undetected technical errors that could cause our computer systems to fail. Because each loan that we make involves our proprietary automated underwriting process and depends on the efficient and uninterrupted operation of our computer systems, and all of our loans are underwritten using an automated underwriting process that does not require manual review, any failure of our computer systems involving our automated underwriting process and any technical or other errors contained in the software pertaining to our automated underwriting process could compromise our ability to accurately evaluate potential customers, which would negatively impact our results of operations. Our computer systems may encounter service interruptions at any time due to system or software failure, natural disasters, severe weather conditions, health pandemics, terrorist attacks, cyber-attacks, power outages or other events, and any failure of our computer systems could cause an interruption in operations and result in disruptions in, or reductions in the amount of, collections from the loans we make to our customers. While we have taken steps to prevent such activity from affecting our systems, if we are unable to prevent such activity, we may be subject to significant liability, negative publicity and a loss of customers, all of which may negatively affect our business.
Any significant disruption in our computer systems could prevent us from processing or posting payments on loans, reduce the effectiveness of our credit risk models and result in a loss of customers.
In the event of a system outage and physical data loss, our ability to service our loans, process applications or make loans available would be adversely affected. We also rely on facilities, components, and services supplied by third parties, including data center facilities and cloud storage services. Any interference or disruption of our technology and underlying infrastructure or our use of our third-party providers’ services could materially and adversely affect our business, relationships with our customers and our reputation. Also, as our business grows, we may be required to expand and improve the capacity, capability and reliability of our infrastructure. If we are not able to effectively address capacity constraints, upgrade our systems as needed and continually develop our technology and infrastructure to reliably support our business, our results of operations may be harmed.
Additionally, in the event of damage or interruption, our insurance policies may not adequately compensate us for any losses that we may incur. Our disaster recovery plan has not been tested under actual disaster conditions, and we may not have sufficient capacity to recover all data and services in the event of an outage. These factors could prevent us from processing or posting payments on the loans, damage our brand and reputation, divert our employees’ attention, subject us to liability and cause customers to abandon our business, any of which could adversely affect our business, results of operations and financial condition.
It may be difficult and costly to protect our intellectual property rights, and we may not be able to ensure their protection.
Our ability to lend to our customers depends, in part, upon our proprietary technology. We may be unable to protect our proprietary technology effectively which would allow competitors to duplicate our products and adversely affect our ability to compete with them. We rely on a combination of copyright, trade secret, trademark laws and other rights, as well as confidentiality procedures and contractual provisions to protect our proprietary technology, processes and other intellectual property and do not have patent protection. However, the steps we take to protect our intellectual property rights may be inadequate. For example, a third party may attempt to reverse engineer or otherwise obtain and use our proprietary technology without our consent. The pursuit of a claim against a third party for infringement of our intellectual property could be costly, and there can be no guarantee that any such efforts would be successful. Our failure to secure, protect and enforce our intellectual property rights could adversely affect our brand and adversely impact our business.
We have been, and may in the future be, sued by third parties for alleged infringement of their proprietary rights.
Our proprietary technology, including our credit risk models, may infringe upon claims of third-party intellectual property, and we may face intellectual property challenges from such other parties. We may not be successful in defending against any such challenges or in obtaining licenses to avoid or resolve any intellectual property disputes. If we are unsuccessful, such claim or litigation could result in a requirement that we pay significant damages or licensing fees, which would negatively impact our financial performance. We may also be obligated to indemnify parties or pay substantial legal settlement costs, including royalty payments, and to modify applications or refund fees. Even if we were to prevail in such a dispute, any litigation regarding our intellectual property could be costly and time consuming and divert the attention of our management and key personnel from our business operations.
For example, in January 2018, we received a complaint by a third party alleging various claims for trademark infringement, unfair competition, trademark dilution and misappropriation against us. The complaint calls for monetary damages and injunctive relief requiring us to cease using our trademarks. We believe this claim is without merit and intend to vigorously defend this matter. The final outcome with respect to the claims in the lawsuits, including our liability, if any, is uncertain. Furthermore, we cannot be certain that any of these claims would be resolved in our favor. For example, an adverse litigation ruling against us could result in a significant damages award against us, could result in injunctive relief, could result in a requirement that we make substantial royalty payments, and could result in the cancellation of certain Oportun trademarks which would require that we rebrand. Moreover, an adverse finding could cause us to incur substantial expense, could be a distraction to management, and any rebranding as a result may not be well received in the market. To the extent that we reach a negotiated settlement, the settlement could require that we pay substantial compensation and could require that we make modifications to our name, branding, marketing materials and advertising that may not be well received in the market. See “Legal Proceedings” for more information regarding these proceedings.
Moreover, it has become common in recent years for individuals and groups to purchase intellectual property assets for the sole purpose of making claims of infringement and attempting to extract settlements from companies such as ours. Even in instances where we believe that claims and allegations of intellectual property infringement against us are without merit, defending against such claims is time consuming and expensive and could result in the diversion of time and attention of our management and employees. In addition, although in some cases a third party may have agreed to indemnify us for such costs, such indemnifying party may refuse or be unable to uphold its contractual obligations. In other cases, our insurance may not cover potential claims of this type adequately or at all, and we may be required to pay monetary damages, which may be significant.
Our credit risk models and internal systems rely on software that is highly technical, and if it contains undetected errors, our business could be adversely affected.
Our credit risk models and internal systems rely on internally developed software that is highly technical and complex. In addition, our models and internal systems depend on the ability of such software to store, retrieve, process and manage immense amounts of data. The software on which we rely has contained, and may now or in the future contain, undetected errors, bugs or other defects. Some errors may only be discovered after the code has been released for external or internal use. Errors, bugs or other defects within the software on which we rely may result in a negative experience for our customers, result in errors or compromise our ability to protect customer data or our intellectual property. Specifically, any defect in our credit risk models could result in the approval of unacceptably risky loans. Such defects could also result in harm to our reputation, loss of customers, loss of revenue, adjustments to the fair value of our Fair Value Loans or Fair Value Notes, challenges in raising debt or equity, or liability for damages, any of which could adversely affect our business and results of operations.
Some aspects of our business processes include open source software, and any failure to comply with the terms of one or more of these open source licenses could negatively affect our business.
We incorporate open source software into processes supporting our business. Such open source software may include software covered by licenses like the GNU General Public License and the Apache License. The terms of various open source licenses have not been interpreted by U.S. courts, and there is a risk that such licenses could be construed in a manner that limits our use of the software, inhibits certain aspects of our systems and negatively affects our business operations.
Some open source licenses contain requirements that we make source code available at no cost for modifications or derivative works we create based upon the type of open source software we use. We may face claims from third parties claiming ownership of, or demanding the release or license of, such modifications or derivative works (which could include our proprietary source code or credit risk models) or otherwise seeking to enforce the terms of the applicable open source license. If portions of our proprietary credit risk models are determined to be subject to an open source license, or if the license terms for the open source software that we incorporate change, we could be required to publicly release the affected portions of our source code, re-engineer all or a portion of our model or change our business activities, any of which could negatively affect our business operations and our intellectual property rights.
In addition to risks related to license requirements, the use of open source software can lead to greater risks than the use of third-party commercial software, as open source licensors generally do not provide warranties or controls on the origin of the software. Use of open source software may also present additional security risks because the public availability of such software may make it easier for hackers and other third parties to determine how to breach our website and systems that rely on open source software.
We may not be able to make technological improvements as quickly as demanded by our customers, which could harm our ability to attract customers and adversely affect our results of operations, financial condition and liquidity.
The financial services industry is undergoing rapid technological changes, with frequent introductions of new technology-driven products and services. The effective use of technology increases efficiency and enables financial and lending institutions to better serve customers and reduce costs. Our future success will depend, in part, upon our ability to address the needs of our customers by using technology, such as mobile and online services, to provide products and services that will satisfy customer demands for convenience, as well as to create additional efficiencies in our operations. We may not be able to effectively implement new technology-driven products and services as quickly as competitors or be successful in marketing these products and services to our customers. Furthermore, our technology may become obsolete or uncompetitive, and there is no guarantee that we will be able to successfully develop, obtain or use new technologies to adapt our models and systems. Failure to successfully keep pace with technological change affecting the financial services industry could harm our ability to attract customers and adversely affect our results of operations, financial condition and liquidity.
A deterioration in the financial condition of counterparties, including financial institutions, could expose us to credit losses, limit access to liquidity or disrupt our business operations.
We have entered into, and may in the future enter into, financing and derivative transactions with counterparties in the financial services industry, including brokers and dealers, commercial banks, investment banks, hedge funds, and other financial institutions. Furthermore, the operations of U.S. and global financial services institutions are interconnected, and a decline in the financial condition of one or more financial services institutions, or the perceived lack of creditworthiness of such financial institutions, may expose us to credit losses or defaults, limit access to liquidity or otherwise disrupt the operations of our business. As such, our financing and derivative transactions expose us to credit risk in the event of a default by the counterparty, which can be exacerbated during periods of market illiquidity.
Our vendor relationships subject us to a variety of risks, and the failure of third parties to comply with legal or regulatory requirements or to provide various services that are important to our operations could have an adverse effect on our business.
We have vendors that, among other things, provide us with key services, including financial, technology and other services to support our loan servicing and other activities. The CFPB issued guidance stating that institutions under its supervision may be held responsible for the actions of the companies with which they contract. Accordingly, we could be adversely impacted to the extent our vendors fail to comply with the legal requirements applicable to the particular products or services being offered. Our use of third-party vendors is subject to increasing regulatory attention.
The CFPB and other regulators have issued regulatory guidance that has focused on the need for financial institutions to perform increased due diligence and ongoing monitoring of third-party vendor relationships, thus increasing the scope of management involvement and decreasing the benefit that we receive from using third-party vendors. Moreover, if our regulators conclude that we have not met the heightened standards for oversight of our third-party vendors, we could be subject to enforcement actions, civil monetary penalties, supervisory orders to cease and desist or other remedial actions.
In some cases, third-party vendors are the sole source, or one of a limited number of sources, of the services they provide to us. Most of our vendor agreements are terminable on little or no notice, and if our current vendors were to stop or were unable to continue providing services to us on acceptable terms, we may be unable to procure alternatives from other vendors in a timely and efficient manner on acceptable terms or at all. If any third-party vendor fails to provide the services we require, due to factors outside our control, we could be subject to regulatory enforcement actions, suffer economic and reputational harm and incur significant costs to resolve any such disruptions in service.
If we lose the services of any of our key management personnel, our business could suffer.
Our future success significantly depends on the continued service and performance of our key management personnel. Competition for these employees is intense and we may not be able to replace, attract and retain key personnel. We do not maintain key-man insurance for every member of our senior management team. The loss of the service of our senior management team or key team members, and the process to replace any of them, or the inability to attract additional qualified personnel as needed, all of which would involve significant time and expense, could harm our business.
Competition for our highly skilled employees is intense, and we may not be able to attract and retain the employees we need to support the growth of our business.
Competition for highly skilled personnel, including engineering and data analytics personnel, is extremely intense, particularly in the San Francisco Bay Area where our headquarters is located. We have experienced and expect to continue to face difficulty identifying and hiring qualified personnel in many areas, especially as we pursue our growth strategy. We may not be able to hire or retain such personnel at compensation levels consistent with our existing compensation and salary structure. Many of the companies with which we compete for experienced employees have greater resources than we have and may be able to offer more attractive terms of employment. In particular, employee candidates, specifically in high-technology industries, often consider the value of any equity they may receive in connection with their employment so significant volatility or a decline in the price of our stock may adversely affect our recruitment strategies.
In addition, we invest significant time and expense in training our employees, which increases their value to competitors who may seek to recruit them. If we fail to retain our employees, we could incur significant expenses in hiring and training their replacements and the quality of our services and our ability to serve our customers could be adversely affected.
We are dependent on hiring an adequate number of hourly bilingual employees to run our business and are subject to government regulations concerning these and our other employees, including minimum wage laws.
Our workforce is comprised primarily of bilingual employees who work on an hourly basis. In certain areas where we operate, there is significant competition for hourly bilingual employees and the lack of availability of an adequate number of hourly bilingual employees could adversely affect our operations. In addition, we are subject to applicable rules and regulations relating to our relationship with our employees, including minimum wage and break requirements, health benefits, unemployment and sales taxes, overtime and working conditions and immigration status. We are from time to time subject to employment-related claims, including wage and hour claims. Further, legislated increases in minimum wage, as well as increases in additional labor cost components, such as employee benefit costs, workers’ compensation insurance rates, compliance costs and fines would increase our labor costs, which could have an adverse effect on our business.
Our mission to provide inclusive, affordable financial services that empower our customers to build a better future may conflict with the short-term interests of our stockholders.
Our mission is to provide inclusive, affordable financial services that empower our customers to build a better future. Therefore, we have made in the past,stockholders and may make in the future, decisions that we believe will benefit our customers and therefore provide long-term benefits for our business, even if our decision negatively impacts our short-term results of operations. For example, we constrain the maximum interest rates we charge in order to further our goal of making our loans affordable for our target customers. Our decisions may negatively impact our short-term financial results or not provide the long-term benefits that we expect and may decrease the spread between the interest rate at which we lend to our customers and the rate at which we borrow from our lenders.
If we cannot maintain our corporate culture as we grow, we could lose the innovation, collaboration and focus on the mission that contribute to our business.
We believe that a critical component of our success is our corporate culture and our deep commitment to our mission. We believe this mission-based culture fosters innovation, encourages teamwork and cultivates creativity. Our mission defines our business philosophy as well as the emphasis that we place on our customers, our people and our culture and is consistently reinforced to and by our employees. As we develop the infrastructure of a public company and continue to grow, we may find it difficult to maintain these valuable aspects of our corporate culture and our long-term mission. Any failure to preserve our culture, including a failure due to the growth from becoming a public company, could negatively impact our future success, including our ability to attract and retain employees, encourage innovation and teamwork, and effectively focus on and pursue our mission and corporate objectives.
Misconduct by our employees could harm us by subjecting us to monetary loss, significant legal liability, regulatory scrutiny and reputational harm.
Our reputation is critical to maintaining and developing relationships with our existing and potential customers and third parties with whom we do business. There is a risk that our employees could be accused of or engage in misconduct that adversely affects our business, including fraud, theft, the redirection, misappropriation or otherwise improper execution of loan transactions, disclosure of personal and business information and the failure to follow protocol when interacting with customers that could lead us to suffer direct losses from the activity as well as serious reputational harm. Employee misconduct could also lead to regulatory sanctions and prompt regulators to allege or to determine based upon such misconduct that we have not established adequate supervisory systems and procedures to inform employees of applicable rules or to detect and deter violations of such rules. Misconduct by our employees, or even unsubstantiated allegations of misconduct, could harm our reputation and our business.
Our international operations and offshore service providers involve inherent risks which could result in harm to our business.
As of December 31, 2019, we had 1,519 employees in three contact centers in Mexico. These employees provide certain English/Spanish bilingual support related to customer-facing contact center activities, administrative and technology support of the contact centers and back-office support services. We have also engaged outsourcing partners in the United States that provide offshore customer-facing contact center activities in Colombia, Jamaica and may, in the future, include additional locations in other countries. In addition, we have engaged vendors that utilize employees or contractors based outside of the United States. As of December 31, 2019, our business process outsourcing partners have provided us, on an exclusive basis, the equivalent of 630 full-time equivalents in Colombia and Jamaica. Additionally, in 2019, we began utilizing outsourcing partners in the United States to provide offshore technology delivery services in India. These activities in Colombia, Jamaica, India and other future locations are subject to inherent risks that are beyond our control, including:
risks related to government regulation or required compliance with local laws;
local licensing and reporting obligations;
difficulties in developing, staffing and simultaneously managing a number of varying foreign operations as a result of distance, language and cultural differences;
different, uncertain, overlapping or more stringent local laws and regulations;
political and economic instability, tensions, security risks and changes in international diplomatic and trade relations;
state or federal regulations that restrict offshoring of business operational functions or require offshore partners to obtain additional licenses, registrations or permits to perform services on our behalf;
geopolitical events, including natural disasters, public health issues, pandemics, acts of war and terrorism;
compliance with applicable U.S. laws and foreign laws related to consumer protection, intellectual property, privacy, data security, corruption, money laundering and export/trade control;
misconduct by our outsourcing partners and their employees or even unsubstantiated allegations of misconduct;
risks due to lack of direct involvement in hiring and retaining personnel; and
potentially adverse tax developments and consequences.
Violations of the complex foreign and U.S. laws, rules and regulations that apply to our international operations and offshore activities of our service providers may result in heightened regulatory scrutiny, fines, criminal actions or sanctions against us, our directors our officers or our employees, as well as restrictions on the conduct of our business and reputational damage.
If we discover a material weakness in our internal control over financial reporting that we are unable to remedy or otherwise fail to maintain effective internal control over financial reporting or disclosure controls and procedures, our ability to report our financial results on a timely and accurate basis and the market price of our common stock may be adversely affected.
goals. The Sarbanes-Oxley Act requires, among other things, that, as a public company, we maintain effective internal control over financial reporting and disclosure controls and procedures including implementation of financial systems and tools. In 2017, we implemented a company-wide integrated financial reporting and human capital management system, which resulted in identification of significant deficiencies and delays in closing the accounting records for 2017 and the first quarter of 2018 and required significant remediation efforts in 2017 and 2018. If our remediation measures in 2017 and 2018 or future remediation measures are not fully successful, we may identify errors related to prior periods that could require a restatement of our financial statements and which may result in delays in filing our periodic reports. Any failure to maintain effective disclosure controls and procedures or internal control over financial reporting could have an adverse effect on our ability to accurately report our financial information on a timely basis and result in material misstatements in our consolidated financial statements.
To comply with Section 404A of the Sarbanes-Oxley Act, we may incur substantial cost, expend significant management time on compliance-related issues and hire additional accounting, financial and internal audit staff with appropriate public company experience and technical accounting knowledge. Moreover, if we are not able to comply with the requirements of Section 404A in a timely manner or if we or our independent registered public accounting firm identify deficiencies in our internal control over financial reporting that are deemed to be material weaknesses, we could be subject to sanctions or investigations by the Securities and Exchange Commission, or the SEC, or other regulatory authorities, adversely affect our ability to access the credit markets and sell additional equity and commit additional financial and management resources to remediate deficiencies.
Our business is subject to the risks of natural disasters and other catastrophic events, and to interruption by man-made problems.
A significant natural disaster, such as an earthquake, fire, hurricanes, flood or other catastrophic event (many of which are becoming more acute and frequent as a result of climate change), or interruptions by strikes, crime, terrorism, cyber-attacks, pandemics or other public health crises, power outages or other man-made problems, could have an adverse effect on our business, results of operations and financial condition. Our headquarters is located in the San Francisco Bay Area, and our systems are hosted in multiple data centers across Northern California, a region known for seismic activity and wildfires and related power outages. Additionally, certain of our contact centers and retail locations are located in areas prone to natural disasters, including earthquakes, tornadoes and hurricanes, and certain of our retail locations and our contact centers may be located in areas with high levels of criminal activities.
Our IT systems are backed up regularly to highly available, alternate data centers in a different region, and we have conducted disaster recovery testing of our mission critical systems. Despite any precautions we may take, however, the occurrence of a natural disaster or other unanticipated problems at our data centers could result in lengthy interruptions in our services. In addition, acts of war, terrorism and other geo-political unrest could cause disruptions in our business and lead to interruptions, delays or loss of critical data.
In addition, a large number of customers make payments and apply for loans at our retail locations. If one or more of our retail locations becomes unavailable for any reason, including as a result of localized weather events or natural or man-made disasters, our ability to conduct business and collect payments from customers on a timely basis may be adversely affected, which could result in lower loan originations, higher delinquencies and increased losses.
All of the aforementioned risks may be further increased if our business continuity plans prove to be inadequate and there can be no assurance that both personnel and non-mission critical applications can be fully operational after a declared disaster within a defined recovery time. If our personnel, systems or primary data center facilities are impacted, we may suffer interruptions and delays in our business operations. In addition, to the extent these events impact our customers or their ability to timely repay their loans, our business could be negatively affected.
We may not maintain sufficient business interruption or property insurance to compensate us for potentially significant losses, including potential harm to our business that may result from interruptions in our ability to provide our financial products and services.
Unfavorable outcomes in legal proceedings may harm our business and results of operations.
We are, and may in the future become, subject to litigation, claims, investigations, legal and administrative cases and proceedings, whether civil or criminal, or lawsuits by governmental agencies or private parties, which may affect our results of operations. In 2018, we settled a class action with common stockholders alleging that certain of our directors, officers, former directors and officers, and certain of our convertible preferred stockholders breached their fiduciary duties to our common stockholders in their capacities as officers, directors and/or controlling stockholders by approving certain of our convertible preferred stock financing rounds that diluted the ownership of our common stockholders and that certain defendants allegedly aided and abetted such breaches. In June 2017, certain plaintiffs that were previously part of the class action in the lawsuit described above, filed suit alleging the same claims, but covering a more limited series of financings. See “Legal Proceedings” for more information regarding this and other proceedings.
If the results of any pending or future legal proceedings are unfavorable to us or if we are unable to successfully defend against third-party lawsuits, we may be required to pay monetary damages or fulfill our indemnification obligations or we may be subject to fines, penalties, injunctions or other censure. Even if we adequately address the issues raised by an investigation or proceeding or successfully defend a third-party lawsuit or counterclaim, we may have to devote significant financial and management resources to address these issues.
Risks Related to our Industry and Regulation
The lending industry is highly regulated. Changes in regulations or in the way regulations are applied to our business could adversely affect our business.
Our business is subject to numerous federal, state and local laws and regulations. Following the financial crisis that began in 2008, supervisory efforts to enact and apply relevant laws, regulations and policies have become more intense. Statutes, regulations and policies affecting lending institutions are continually under review by Congress, state legislatures and federal and state regulatory agencies. Further changes in laws or regulations, or the regulatory application or interpretation of the laws and regulations applicable to us, could adversely affect our ability to operate in the manner in which we currently conduct business. Such changes in, and in the interpretation and enforcement of, laws and regulations may also make it more difficult or costly for us to originate additional loans, or for us to collect payments on our loans to customers or otherwise operate our business by subjecting us to additional licensing, registration and other regulatory requirements in the future. For instance, in 2019, competing bills were introduced in the Senate, one bill which would create a national usury cap of 36% APR, the other which would create a national cap of the lesser of 15% APR or the maximum rate permitted by the state in which the consumer resides. Although there is no evidence that such bills would ever be enacted into law, if such a bill were to be enacted, it would greatly restrict profitability for us.
Furthermore, judges or regulatory agencies could interpret current rules or laws differently than the way we do, leading to such adverse consequences as described above. A failure to comply with any applicable laws or regulations could result in regulatory actions, loss of licenses, lawsuits and damage to our reputation, any of which could have an adverse effect on our business and financial condition and our ability to originate and service loans and perform our obligations to investors and other constituents. It could also result in a default or early amortization event under our debt facilities and reduce or terminate availability of debt financing to us to fund originations.
Our failure to comply with the regulations in the jurisdictions in which we conduct our business could harm our results of operations.
Federal and state agencies have broad enforcement powers over us, including powers to periodically examine and continuously monitor our operations and to investigate our business practices and broad discretion to deem particular practices unfair, deceptive, abusive or otherwise not in accordance with the law. All of our operations are subject to regular examination by state regulators and, in the future, may be subject to regular examination by federal regulators. These examinations may result in requirements to change our policies or practices, and in some cases, we may be required to pay monetary fines or make reimbursements to customers.
State attorneys general have stated their intention to fill any void left by diminished CFPB enforcement and have a variety of tools at their disposal to enforce state and federal consumer financial laws. First, Section 1042 of the Dodd-Frank Act grants state attorneys general the ability to enforce the Dodd-Frank Act and regulations promulgated under the Dodd-Frank Act’s authority and to secure remedies provided in the Dodd-Frank Act against
entities within their jurisdiction. State attorneys general also have enforcement authority under state law with respect to unfair or deceptive practices. Generally, under these statutes, state attorneys general may conduct investigations, bring actions, and recover civil penalties or obtain injunctive relief against entities engaging in unfair, deceptive, or fraudulent acts. Attorneys general may also coordinate among themselves to enter into multi-state actions or settlements. Finally, several consumer financial laws like the Truth in Lending Act and Fair Credit Reporting Act grant enforcement or litigation authority to state attorneys general. Should the CFPB decrease its enforcement activity under the Trump administration, we expect to see an increase in actions brought by state attorneys general.
We believe that we maintain all material licenses and permits required for our current operations and are in substantial compliance with all applicable federal, state and local regulations, but we may not be able to maintain all requisite licenses and permits, and the failure to satisfy those and other regulatory requirements could have an adverse effect on our operations. There is also a chance that a regulator will believe that we or our service providers should obtain additional licenses above and beyond those currently held by us or our service providers, if any. Changes in laws or regulations applicable to us could subject us or our service providers to additional licensing, registration and other regulatory requirements in the future or could adversely affect our ability to operate or the manner in which we conduct business, including restrictions on our ability to open retail locations in certain counties, municipalities or other geographic locations.
A failure to comply with applicable laws and regulations could result in additional compliance requirements, limitations on our ability to collect all or part of the principal of or interest on loans, fines, an inability to continue operations, regulatory actions, loss of our license to transact business in a particular location or state, lawsuits, potential impairment, voiding, or voidability of loans, rescission of contracts, civil and criminal liability and damage to our reputation.
A proceeding relating to one or more allegations or findings of our violation of law could also result in modifications in our methods of doing business, including our servicing and collections procedures. It could result in the requirement that we pay damages and/or cancel the balance or other amounts owing under loans associated with such violation. It could also result in a default or early amortization event under certain of our debt facilities and reduce or terminate availability of debt financing to us to fund originations. To the extent it is determined that the loans we make to our customers were not originated in accordance with all applicable laws as we are required to represent under our securitization and other debt facilities and in loan sales to investors, we could be obligated to repurchase for cash, or swap for qualifying assets, any such loan determined not to have been originated in compliance with legal requirements. We may not have adequate liquidity and resources to make such cash repurchases or swap for qualifying assets.
For more information with respect to the regulatory framework affecting our businesses, see “Business - Regulations and Compliance.”
Financial regulatory reform relating to asset-backed securities has not been fully implemented and could have a significant impact on our ability to access the asset-backed securities market.
We rely upon asset-backed financing for a significant portion of our funds with which to carry on our business. Asset-backed securities and the securitization markets were heavily affected by the Dodd-Frank Act and have also been a focus of increased regulation by the SEC. For example, the Dodd-Frank Act mandates the implementation of rules requiring securitizers or originators to retain an economic interest in a portion of the credit risk for any asset that they securitize or originate. Furthermore, sponsors are prohibited from diluting the required risk retention by dividing the economic interest among multiple parties or hedging or transferring the credit risk the sponsor is required to maintain. Rules relating to securitizations rated by nationally-recognized statistical rating agencies require that the findings of any third-party due diligence service providers be made publicly available at least five business days prior to the first sale of securities, which has led and will continue to lead us to incur additional costs in connection with each securitization.
However, some of the regulations to be implemented under the Dodd-Frank Act relating to securitization have not yet been finalized. Additionally, there is general uncertainty regarding what changes, if any, may be implemented with regard to the Dodd-Frank Act. Any new rules or changes to the Dodd-Frank Act (or the current rules thereunder) could adversely affect our ability and our cost to access the asset-backed securities market.
Litigation, regulatory actions and compliance issues could subject us to significant fines, penalties, judgments, remediation costs and/or requirements resulting in increased expenses.
In the ordinary course of business, we have been named as a defendant in various legal actions, including class actions and other litigation. Generally, this litigation arises from the dissatisfaction of a consumer with our products or services; some of this litigation, however, has arisen from other matters, including claims of violation of do-not-call, credit reporting and collection laws, bankruptcy and practices. All such legal actions are inherently unpredictable and, regardless of the merits of the claims, litigation is often expensive, time- consuming, disruptive to our operations and resources, and distracting to management. In addition, certain of those actions include claims for indeterminate amounts of damages. Our involvement in any such matter also could cause significant harm to our reputation and divert management attention from the operation of our business, even if the matters are ultimately determined in our favor. If resolved against us, legal actions could result in excessive verdicts and judgments, injunctive relief, equitable relief, and other adverse consequences that may affect our financial condition and how we operate our business. We have in the past chosen to settle (and may in the future choose to settle) certain matters in order to avoid the time and expense of litigating them. Although none of the settlements has been material to our business, there is no assurance that, in the future, such settlements will not have a material adverse effect on our business.
In addition, a number of participants in the consumer financial services industry have been the subject of putative class action lawsuits, state attorney general actions and other state regulatory actions, federal regulatory enforcement actions, including actions relating to alleged unfair, deceptive or abusive acts or practices, violations of state licensing and lending laws, including state usury laws, actions alleging discrimination on the basis of race, ethnicity, gender or other prohibited bases, and allegations of noncompliance with various state and federal laws and regulations relating to originating and servicing consumer finance loans and other consumer financial services and products. The current regulatory environment, increased regulatory compliance efforts, and enhanced regulatory enforcement have resulted in significant operational and compliance costs and may prevent us from providing certain products
and services. There is no assurance that these regulatory matters or other factors will not, in the future, affect how we conduct our business or adversely affect our business. In particular, legal proceedings brought under state consumer protection statutes or under several of the various federal consumer financial services statutes subject to the jurisdiction of the CFPB may result in a separate fine for each violation of the statute, which, particularly in the case of class action lawsuits, could result in damages substantially in excess of the amounts we earned from the underlying activities.
Some of our consumer financing agreements include arbitration clauses. If our arbitration agreements were to become unenforceable for any reason, we could experience an increase to our consumer litigation costs and exposure to potentially damaging class action lawsuits.
In addition, from time to time, through our operational and compliance controls, we identify compliance issues that require us to make operational changes and, depending on the nature of the issue, result in financial remediation to impacted customers. These self-identified issues and voluntary remediation payments could be significant, depending on the issue and the number of customers impacted, and could generate litigation or regulatory investigations that subject us to additional risk.
Internet-based and electronic signature-based loan origination processes may give rise to greater risks than paper-based processes.
We use the internet and internet-enabled mobile phones to obtain application information, distribute certain legally required notices to applicants for, and borrowers of, the loans, and to obtain electronically signed loan documents in lieu of paper documents with tangible borrower signatures. In addition, we have introduced the use of electronic signature-based loan origination processes with a tablet in our retail locations. These processes may entail greater risks than would paper-based loan origination processes, including risks regarding the sufficiency of notice for compliance with consumer protection laws, risks that borrowers may challenge the authenticity of their signature or of the loan documents, risks that a court of law may not enforce electronically signed loan documents and risks that, despite controls, unauthorized changes are made to the electronic loan documents. If any of those factors were to cause any loans, or any of the terms of the loans, to be unenforceable against the borrowers, our ability to service these loans could be adversely affected.
The CFPB is a relatively new agency which has sometimes taken expansive views of its authority to regulate consumer financial services, creating uncertainty as to how the agency’s actions or the actions of any other new agency could impact our business.
The CFPB, which commenced operations in July 2011, has broad authority to create and modify regulations under federal consumer financial protection laws and regulations, such as the Truth in Lending Act and Regulation Z, the Equal Credit Opportunity Act and Regulation B, the Fair Credit Reporting Act, the Electronic Funds Transfer Act and Regulation E, and to enforce compliance with those laws. The CFPB is charged with the examination and supervision of certain participants in the consumer financial services market, including short-term, small dollar lenders, and larger participants in other areas of financial services. The CFPB is also authorized to prevent “unfair, deceptive or abusive acts or practices” through its regulatory, supervisory and enforcement authority. To assist in its enforcement, the CFPB maintains an online complaint system that allows consumers to log complaints with respect to various consumer finance products, including our loan products and our prepaid debit card program. This system could inform future CFPB decisions with respect to its regulatory, enforcement or examination focus. The CFPB may also request reports concerning our organization, business conduct, markets and activities and conduct on-site examinations of our business on a periodic basis if the CFPB were to determine, through its complaint system, that we were engaging in activities that pose risks to consumers.
There continues to be uncertainty about the future of the CFPB and as to how its strategies and priorities, including in both its examination and enforcement processes, will impact our business and our results of operations going forward. Actions by the CFPB could result in requirements to alter or cease offering affected financial products and services, making them less attractive and restricting our ability to offer them. The CFPB could also implement rules that restrict our effectiveness in servicing our financial products and services.
Future actions by the CFPB (or other regulators) against us or our competitors that discourage the use of our or their services or restrict our business activities could result in reputational harm and adversely affect our business. If the CFPB changes regulations that were adopted in the past by other regulators and transferred to the CFPB by the Dodd-Frank Act, or modifies through supervision or enforcement past regulatory guidance or interprets existing regulations in a different or stricter manner than they have been interpreted in the past by us, the industry or other regulators, our compliance costs and litigation exposure could increase materially. If future regulatory or legislative restrictions or prohibitions are imposed that affect our ability to offer certain of our products or that require us to make significant changes to our business practices, and if we are unable to develop compliant alternatives with acceptable returns, our business could be adversely affected.
As a prepaid debit card provider, we are subject to extensive and complex federal and state regulations, and new regulations, as well as changes to or inadvertent noncompliance with existing regulations, that could adversely affect our business.
We offer our customers a reloadable debit card marketed under the trade name “Ventiva” in six states in which we operate. Since March 2012, we are registered with the Financial Crimes Enforcement Network as a Money Services Business in relation to our reloadable debit card. Although we do not currently allow the Ventiva card to be reloaded with cash at our retail locations, in connection with our role as program manager for the issuer of our reloadable debit cards, we are required to be compliant with a variety of federal and state statutes and regulations which impact the manner in which we conduct our reloadable debit card business. These include, but are not limited to state money transmitter laws, the USA PATRIOT Act, the Office of Foreign Asset Control, the Bank Secrecy Act, Anti-Money Laundering laws, and Know-Your-Customer requirements, collectively referred to as AML Laws, indirect regulation and direct audit and examination by the Office of the Comptroller of the Currency, the Board of Governors of the Federal Reserve System, and the Federal Deposit Insurance Corporation. Although we have committed resources to our AML Laws compliance program to ensure compliance with these various requirements, there could be heightened liability for us, our officers and our Board members if a regulatory agency were to deem our compliance program to be deficient or there were to be a break-down in compliance controls related to these regulations or heightened enforcement in this area.
Additionally, each state in which we offer a prepaid debit card has regulations governing money transmitters which could apply to the Ventiva card activities we conduct, or previously conducted, in that particular state. These regulations could require us to obtain a money transmitter license in a particular state. Although we believe that our activities in our states of operation do not require such licensing, the laws applicable to our debit card business or the interpretation thereof change frequently, are often unclear and may differ or conflict between jurisdictions. As a result, ensuring compliance has become more difficult and costly. Any failure, or perceived failure, by us to comply with all applicable statutes and regulations could result in fines, penalties, regulatory enforcement actions, civil liability, criminal liability, and/or limitations on our ability to operate our business.
The collection, processing, storage, use and disclosure of personal data could give rise to liabilities as a result of existing or new governmental regulation, conflicting legal requirements or differing views of personal privacy rights.
We receive, transmit and store a large volume of personally identifiable information and other sensitive data from customers and potential customers. There are federal, state and foreign laws regarding privacy and the storing, sharing, use, disclosure and protection of personally identifiable information and sensitive data. Specifically, cybersecurity and data privacy issues, particularly with respect to personally identifiable information are increasingly subject to legislation and regulations to protect the privacy and security of personal information that is collected, processed and transmitted. For example, in June 2018, California enacted the California Consumer Privacy Act, or the CCPA, which broadly defines personal information and took effect on January 1, 2020. The CCPA gives California residents expanded privacy rights and protections and provides for civil penalties for CCPA violations, in addition to providing for a private right of action for data breaches. Whereas we have implemented the CCPA, compliance with other current and future customer privacy data protection and information security laws and regulations could result in higher compliance, technical or operating costs. Further, any violations of these laws and regulations may require us to change our business practices or operational structure, address legal claims and sustain monetary penalties and/or other harms to our business. We could also be adversely affected if new legislation or regulations are adopted or if existing legislation or regulations are modified such that we are required to alter our systems or require changes to our business practices or privacy policies.
We may have to constrain our business activities to avoid being deemed an investment company under the Investment Company Act.
The Investment Company Act of 1940, as amended, or the Investment Company Act, contains substantive legal requirements that regulate the manner in which “investment companies” are permitted to conduct their business activities. We believe we have conducted, and we intend to continue to conduct, our business in a manner that does not result in our company being characterized as an investment company, including by relying on certain exemptions from registration as an investment company. We rely on guidance published by the SEC staff or on our analyses of such guidance to determine our qualification under these and other exemptions. To the extent that the SEC staff publishes new or different guidance with respect to these matters, we may be required to adjust our business operations accordingly. Any additional guidance from the SEC staff could provide additional flexibility to us, or it could inhibit our ability to conduct our business operations. There can be no assurance that the laws and regulations governing our Investment Company Act status or SEC guidance regarding the Investment Company Act will not change in a manner that adversely affects our operations. If we are deemed to be an investment company, we may attempt to seek exemptive relief from the SEC, which could impose significant costs and delays on our business. We may not receive such relief on a timely basis, if at all, and such relief may require us to modify or curtail our operations. If we are deemed to be an investment company, we may also be required to institute burdensome compliance requirements and our activities may be restricted.
Our bank sponsorship products may lead to regulatory risk and may increase our regulatory burden.
We are currently in two bank sponsorship programs, one with MetaBank for our prepaid debit card and one with WebBank for our credit card product. In addition, we are undertaking an effort to evaluate different options, including a bank sponsorship program, to offer standard, uniform installment loan products on a nationwide basis. State and federal agencies have broad discretion in their interpretation of laws and their interpretation of requirements related to such programs and may elect to alter standards or the interpretation of the standards applicable to these programs. Therefore, our efforts to enter into a bank sponsorship related to our installment loan product may not ultimately be successful. Furthermore, federal regulation of the banking industry, along with tax and accounting laws, regulations, rules and standards may limit the business activity of banks and affiliates under these structures and control the method by which we can conduct business. Regulation by a federal banking regulator may also subject us to increased compliance, legal and operational costs, and could subject our business model to scrutiny or limit our ability to expand the scope of our activities in a manner that could have a material adverse effect on us.
Anti-money laundering, anti-terrorism financing and economic sanctions laws could have adverse consequences for us.
We maintain a compliance program designed to enable us to comply with all applicable anti-money laundering and anti-terrorism financing laws and regulations, including the Bank Secrecy Act and the USA PATRIOT Act and U.S. economic sanctions laws administered by the Office of Foreign Assets Control. This program includes policies, procedures, processes and other internal controls designed to identify, monitor, manage and mitigate the risk of money laundering and terrorist financing and engaging in transactions involving sanctioned countries persons and entities. These controls include procedures and processes to detect and report suspicious transactions, perform customer due diligence, respond to requests from law enforcement, and meet all recordkeeping and reporting requirements related to particular transactions involving currency or monetary instruments. No assurance is given that our programs and controls will be effective to ensure compliance with all applicable anti-money laundering and anti-terrorism financing laws and regulations, and our failure to comply with these laws and regulations could subject us to significant sanctions, fines, penalties and reputational harm.
We are subject to governmental export and import controls that could subject us to liability, impair our ability to compete in international markets and adversely affect our business.
Although our business does not involve the commercial sale or distribution of hardware, software or technology, in the normal course of our business activities we may from time to time ship general commercial equipment outside the United States to our subsidiaries or affiliates for their internal use. In addition, we may export, transfer or provide access to software and technology to non-U.S. persons such as employees and contractors, as well as
third-party vendors and consultants engaged to support our business activities. In all cases, the sharing of software and/or technology is solely for the internal use of the company or for the use by business partners to provide services to us, including software development. However, such shipments and transfers may be subject to U.S. and foreign regulations governing the export and import of goods, software and technology. If we fail to comply with these laws and regulations, we and certain of our employees could be subject to significant sanctions, fines, penalties and reputational harm. Further, any change in applicable export, import or economic sanctions regulations or related legislation, shift in approach to the enforcement or scope of existing regulations or change in the countries, persons or technologies targeted by these regulations could adversely affect our business.
Risks Related to our Indebtedness
We have incurred substantial debt and may issue debt securities or otherwise incur substantial debt in the future, which may adversely affect our financial condition and negatively impact our operations.
We have in the past incurred, and expect to continue to incur, substantial debt to fund our loan activities. We depend on securitization transactions, warehouse facilities, whole loan sales and other forms of debt financing in order to finance the growth of our business and the origination of most of the loans we make to our customers. The incurrence of debt could have a variety of negative effects, including:
default and foreclosure on our and our subsidiaries’ assets if asset performance and our operating revenue are insufficient to repay debt obligations;
mandatory repurchase obligations for any loans conveyed or sold into a debt financing or under a whole loan purchase facility if the representations and warranties we made with respect to those loans were not correct when made;
acceleration of obligations to repay the indebtedness (or other outstanding indebtedness to the extent of cross default triggers), even if we make all principal and interest payments when due, if we breach any covenants that require the maintenance of certain financial ratios with respect to us or the loan portfolio securing our indebtedness or the maintenance of certain reserves or tangible net worth and do not obtain a waiver for such breach or renegotiate our covenant;
our inability to obtain necessary additional financing if the debt security contains covenants restricting our ability to obtain such financing while the debt security is outstanding;
our inability to obtain necessary additional financing if changes in the characteristics of our loans or our collection and other loan servicing activities change and cease to meet conditions precedent for continued or additional availability under our debt financings;
diverting a substantial portion of cash flow to pay principal and interest on such debt, which would reduce the funds available for expenses, capital expenditures, acquisitions and other general corporate purposes;
creating limitations on our flexibility in planning for and reacting to changes in our business and in the industry in which we operate;
defaults based on loan portfolio performance or default in our collection and loan servicing obligations could result in our being replaced by a third-party or back-up servicer and notification to our customers to redirect payments;
downgrades or revisions of agency ratings for our debt financing; and
monitoring, administration and reporting costs and expenses, including legal, accounting and other monitoring reporting costs and expenses, required under our debt financings.
In addition, our Secured Financing carries a floating rate of interest linked to LIBOR. In July 2017, the U.K. announced the discontinuation of LIBOR which could result in interest rate increases on our Secured Financing which could adversely affect our results of operations.
A breach of early payment triggers or covenants or other terms of our agreements with lenders could result in an early amortization, default, and/or acceleration of the related funding facilities.
The primary funding sources available to support the maintenance and growth of our business include, among others, asset-backed securitization, revolving debt facilities (including the secured financing facility) and whole loan sale facilities. Our liquidity would be adversely affected by our inability to comply with various conditions precedent to availability under these facilities (including the eligibility of our loans), covenants and other specified requirements set forth in our agreements with our lenders which could result in the early amortization, default and/or acceleration of our existing facilities. Such covenants and requirements include financial covenants, portfolio performance covenants and other events. Moreover, we currently act as servicer with respect to the unsecured consumer loans held by our subsidiaries. If we default in our servicing obligations or fail to meet certain financial covenants, an early amortization event or event of default could occur, and/or we could be replaced by our backup servicer or another replacement servicer. If we are replaced as servicer to these loans, there is no guarantee that the backup services will be adequate. Any disruptions in services may cause the inability to collect and process repayments. For more information on covenants, requirements and events, see Note 8 of the Notes to the Consolidated Financial Statements included elsewhere in this report.
During an early amortization period or if an event of default exists, principal and interest collections from the loans in our asset-backed facilities would be applied to repay principal under such facilities and principal collections would no longer be available on a revolving basis to fund purchases of newly originated loans. If an event of default exists under our revolving debt or loan sale facilities, the applicable lenders’ or purchasers’ commitments to extend further credit or purchase additional loans under the related facility would terminate. If loan collections were insufficient to repay the amounts due under our securitizations and our revolving debt facility, the applicable lenders, trustees and noteholders could seek remedies, including against the collateral pledged under such facilities.
An early amortization event or event of default would negatively impact our liquidity, including our ability to originate new loans, and require us to rely on alternative funding sources. This may increase our funding costs or alternative funding sources might not be available when needed. If we were unable to arrange new or alternative methods of financing on favorable terms, we might have to curtail the origination of loans, and we may be replaced by our backup servicer or another replacement servicer.
Our securitizations and whole loan sales may expose us to certain risks, and we can provide no assurance that we will be able to access the securitization or whole loan sales market in the future, which may require us to seek more costly financing.
We have securitized, and may in the future securitize, certain of our loans to generate cash to originate new loans or pay our outstanding indebtedness. In each such transaction and in connection with our warehouse facilities, we sell and convey a pool of loans to a special purpose entity, or SPE. Concurrently, each SPE issues notes or certificates pursuant to the terms of an indenture. The securities issued by the SPE are secured by the pool of loans owned by the SPE. In exchange for the sale of a portion of the pool of loans to the SPE, we receive cash, which are the proceeds from the sale of the securities. We also contribute a portion of the pool of loans in consideration for the equity interests in the SPE. Subject to certain conditions in the indenture governing the notes issued by the SPE (or the agreement governing the SPE’s revolving loan), the SPE is permitted to purchase additional loans from us or distribute to us residual amounts received by it from the loan pool, which residual amounts are the cash amounts remaining after all amounts payable to service providers and the noteholders have been satisfied. We also have the ability to swap pools of loans with the SPE. Our equity interest in the SPE is a residual interest in that it entitles us as the equity owner of the SPE to residual cash flows, if any, from the loans and to any assets remaining in the SPE once the notes are satisfied and paid in full (or in the case of a revolving loan, paid in full and all commitments terminated). As a result of challenging credit and liquidity conditions, the value of the subordinated securities we retain in our securitizations might be reduced or, in some cases, eliminated.
During the financial crisis that began in 2008, the securitization market was constrained, and we can give no assurances that we will be able to complete additional securitizations in the future. Further, other matters, such as (i) accounting standards applicable to securitization transactions and (ii) capital and leverage requirements applicable to banks and other regulated financial institutions holding asset-backed securities, could result in decreased investor demand for securities issued through our securitization transactions, or increased competition from other institutions that undertake securitization transactions. In addition, compliance with certain regulatory requirements may affect the type of securitizations that we are able to complete.
If it is not possible or economical for us to securitize our loans in the future, we would need to seek alternative financing to support our operations and to meet our existing debt obligations, which may not be available on commercially reasonable terms, or at all. If the cost of such alternative financing were to be higher than our securitizations, we would likely reduce the fair value of our Fair Value Loans, which would negatively impact our results of operations.
The gain on sale generated by our whole loan sales and servicing fees earned on sold loans also represents a significant source of our earnings. Demand for our loans at the current premiums may be impacted by factors outside our control, including availability of loan pools, demand by investors for whole loan assets and attractiveness of returns offered by competing investment alternatives offered by other loan originators with more attractive characteristics than our loan pools and loan purchaser interest.
Our results of operations are affected by our ability to sell our loans for a premium over their net book value. Potential loan purchasers might reduce the premiums they are willing to pay for the loans that they purchase during periods of economic slowdown or recession to compensate for any increased risks. A reduction in the sale price of the loans we sell under our whole loan sale program would likely result in a reduction in the fair value of our Fair Value Loans, which would negatively impact our results of operations. Any sustained decline in demand for our loans or increase in delinquencies, defaults or foreclosures may reduce the price we receive on future loan sales below our loan origination cost.
Risks Related to Ownership of Our Common Stock
You may be diluted by the future issuance of additional common stock in connection with our equity incentive plans, acquisitions or otherwise.
Our amended and restated certificate of incorporation authorizes us to issue shares of common stock authorized but unissued and rights relating to common stock for the consideration and on the terms and conditions established by our Board in its sole discretion, whether in connection with acquisitions or otherwise. We have reserved 7,469,664 shares for issuance under our 2019 Equity Incentive Plan and 726,186 shares for issuance under our 2019 Employee Stock Purchase Plan, subject to adjustment in certain events. Any common stock that we issue, including under our 2019 Equity Incentive Plan, our 2019 Employee Stock Purchase Plan or other equity incentive plans that we may adopt in the future, could dilute your percentage ownership.
The price of our common stock may be volatile, and you could lose all or part of your investment.
The trading price of our common stock has been and may continue to be volatile and will depend on a number of factors, including those described in this “Risk Factors” section, many of which are beyond our control and may not be related to our operating performance. These fluctuations could cause you to lose all or part of your investment in our common stock, because you might be unable to sell your shares at or above the price you paid. Factors that could cause fluctuations in the trading price of our common stock include the following:
failure to meet quarterly or annual guidance with regard to revenue, margins, earnings or other key financial or operational metrics;
fluctuations in the trading volume of our share or the size of our public float;
price and volume fluctuations in the overall stock market from time to time;
changes in operating performance and stock market valuations of similar companies;
failure of financial analysts to maintain coverage of us, changes in financial estimates by any analysts who follow our company, or our failure to meet these estimates or the expectations of investors;
public reaction to our press releases, other public announcements and filings with the SEC;
any major change in our management;
sales of shares of our common stock by us or our stockholders;
rumors and market speculation involving us or other companies in our industry;
actual or anticipated changes in our results of operations or fluctuations in our results of operations;
changes in prevailing interest rates;
quarterly fluctuations in demand for our loans;
actual or anticipated developments in our business or our competitors’ businesses or the competitive landscape generally;
litigation, government investigations and regulatory actions;
developments or disputes concerning our intellectual property or other proprietary rights;
new laws or regulations or new interpretations of existing laws or regulations applicable to our business;
changes in accounting standards, policies, guidelines, interpretations or principles;
other general market, political and economic conditions, including any such conditions and local conditions in the markets in which our customers, employees, and contractors are located.
If financial or industry analysts do not publish research or reports about our business, or if they issue an adverse or misleading opinion regarding our stock, our stock price and trading volume could decline.
The trading market for our common stock is influenced by the research and reports that industry or financial analysts publish about us or our business. We do not control these analysts or the content and opinions included in their reports. Because we are a new public company, the analysts who publish information about our common stock have had relatively little experience with our company, which could affect their ability to accurately forecast our results and make it more likely that we fail to meet their estimates. If any of the analysts who cover us issue an adverse or misleading opinion regarding our stock price, our stock price would likely decline. If one or more of these analysts cease coverage of our company or fail to publish reports on us regularly, we could lose visibility in the financial markets, which in turn could cause our stock price or trading volume to decline.
Our directors, officers and principal stockholders have substantial control over our company, which could limit your ability to influence the outcome of key transactions, including a change of control.
Our directors, executive officers and each of our 5% stockholders and their affiliates, in the aggregate, beneficially own a significant number of the outstanding shares of our common stock. As a result, these stockholders, if acting together, will be able to influence or control matters requiring approval by our stockholders, including the election of directors and the approval of mergers, acquisitions or other extraordinary transactions. They may also have interests that differ from yours, and they may vote in a way with which you disagree or which may be adverse to your interests. This concentration of ownership may have the effect of delaying, preventing or deterring a change of control of our company, could deprive our stockholders of an opportunity to receive a premium for their common stock as part of a sale of our company and might ultimately affect the market price of our common stock.
We may need to raise additional funds in the future, including through equity, debt or convertible debt financings, to support business growth and those funds may not be available on acceptable terms, or at all.
We intend to continue to make investments to support our business growth and may require additional funds to respond to business challenges, including the need to develop new loan products, enhance our risk management model, improve our operating infrastructure, expand to new retail locations or acquire complementary businesses and technologies. Accordingly, we may need to engage in equity, debt or convertible debt financings to secure additional funds. If we raise additional funds by issuing equity securities or securities convertible into equity securities, our stockholders may experience dilution. Debt financing, if available, may involve covenants restricting our operations or our ability to incur additional debt. Any debt or additional equity financing that we raise may contain terms that are not favorable to us or our stockholders.
If we are unable to obtain adequate financing or on terms satisfactory to us when we require it, we may be unable to pursue certain opportunities and our ability to continue to support our growth and to respond to challenges could be impaired
The requirements of being a public company may strain our resources, divert management’s attention and affect our ability to attract and retain qualified board members.
As a public company, we are subject to the reporting requirements of the Securities Exchange Act of 1934, as amended, or the Exchange Act, the Sarbanes-Oxley Act, the Dodd-Frank Act, the listing standards of the Nasdaq Stock Market and other applicable securities rules and regulations, including changes in corporate governance practices and the establishment and maintenance of effective disclosure and financial controls. Compliance with these rules and regulations increases our legal and financial compliance costs, makes some activities more difficult, time-consuming or costly and increases demand on our systems and resources. We cannot predict or estimate the amount of additional costs we may incur as a result of being a public company or the timing of such costs.
Being a public company also makes it more expensive for us to obtain director and officer liability insurance, and we may be required to accept reduced coverage, incur substantially higher costs to obtain coverage or only obtain coverage with a significant deductible. These factors could also make it more difficult for us to attract and retain qualified executive officers and qualified members of our Board, particularly to serve on our audit and risk committee and compensation and leadership committee.
In addition, changing laws, regulations and standards or interpretations thereof relating to corporate governance and public disclosure are creating uncertainty for public companies, increasing legal and financial compliance costs and making some activities more time-consuming. We intend to invest resources to comply with evolving laws, regulations and standards, and this investment may result in increased general and administrative expenses and a diversion of management’s time and attention. If our efforts to comply with new laws, regulations and standards differ fromcommittee believes that the activities intended by regulatory or governing bodies due to ambiguities related to their application and practice, regulatory authorities may initiate legal proceedings against us.
Certaintarget total direct compensation of our market opportunity estimates, growth forecasts, and key metrics could prove toNEOs should be inaccurate, and any real or perceived inaccuracies may harm our reputation and negatively affect our business.
Market opportunity estimates and growth forecasts, including those we have generated ourselves, are subject to significant uncertainty and are based on assumptions and estimates that may not prove to be accurate. The estimates and forecasts relating to the size and expected growth of our target market may prove to be inaccurate. It is impossible to offer every loan product, term or feature that every customer wants, and our competitors may develop and offer loan products, terms or features that we do not offer. The variables that go into the calculation of our market opportunity are subject to change over time, and there is no guarantee that any particular number or percentage of the individuals covered by our market opportunity estimates will generate any particular level of revenues for us. Even ifcompetitive within the markets in which we compete, meet our size estimateswhile considering factors such as individual performance, company performance and growth forecasts,any unique circumstances of the NEO’s position based on that individual’s responsibilities and market factors. We believe that this target will enable us to attract, motivate and retain the executive talent necessary to develop and execute our business could fail to grow at similar rates, if at all, for a variety of reasons outsidestrategy. The compensation and leadership committee reviews the compensation of our NEOs against our peer group, survey data sources, and other companies which we compete with for talent to provide a general assessment of the overall competitiveness of our executive compensation program. We also provide our NEOs with certain severance and change in control benefits, as well as other benefits generally available to all our employees, including competitionretirement benefits under our 401(k) plan and participation in our industry. Furthermore, in order for usemployee benefit plans.
Base Salaries
Base salary is a fixed component of pay intended to successfully address this broader market opportunity, we will need to successfully expand into new geographic regions where we do not currently operate. Our key metrics may differ from estimates published by third parties or from similarly titled metricsrecognize and reward the day-to-day contributions of our competitors due to differences in methodology. If investors or analysts do not perceive our metrics to be accurate representationsexecutive officers. Base salaries are initially set at the time of our business, or if we discover material inaccuracies in our metrics, our reputation, business, resultshiring, taking into account level of operations,responsibility, qualifications, experience, salary expectations and financial condition would be adversely affected.
Certain provisions in our charter documentsmarket data. Base salaries are then reviewed on an annual basis by the compensation and under Delaware law could limit attempts by our stockholders to replace or remove our Board, delay or prevent an acquisition of our company, and limit the market price of our common stock.
Provisions in our amended and restated certificate of incorporation and amended and restated bylaws may have the effect of delaying or preventing a change of control orleadership committee. The table below reflects changes in our Board. These provisions includeNEOs’ salaries from the following:prior year.
a classified Board with three-year staggered terms, which may delay the ability of stockholders to change the membership of a majority| Executives | | 2022 Annual Base Salary ($) | | | 2023 Annual Base Salary ($)(1) | | | Change (%) | |
| Raul Vazquez | | | 700,000 | | | | 595,000 | (2) | | | (15.00 | ) |
| Kathleen Layton | | | 341,318 | | | | 375,000 | (3) | | | 9.87 | |
| Patrick Kirscht | | | 473,509 | | | | 473,509 | | | | — | |
| (1) | The base salary amount for each of our NEOs is approved by the compensation and leadership committee. |
| (2) | In connection with certain operating expense reduction efforts by the Company, Mr. Vazquez voluntarily requested a reduction of his annual base salary of 15%, effective November 11, 2023, which was reduced from $700,000 to $595,000 on an annualized basis. |
| (3) | Ms. Layton’s salary was increased on July 15, 2023 in connection with her promotion to Chief Legal Officer. |
Annual Incentive Plan
Each of our Board;
our Board has the rightNEOs was eligible to elect directors to fill a vacancy created by the expansion of the Board or the resignation, death or removal of a director, which prevents stockholders from being able to fill board vacancies;
our stockholders may not act by written consent or call special stockholders’ meetings;
our amended and restated certificate of incorporation prohibits cumulative voting in the election of directors, which limits the ability of minority stockholders to elect director candidates;
stockholders must provide advance notice and additional disclosures in order to nominate individuals for election to the Board or to propose matters that can be acted upon at a stockholders’ meeting, which may discourage or deter a potential acquiror from conducting a solicitation of proxies to elect the acquiror’s own slate of directors or otherwise attempting to obtain control of our company; and
our Board may issue, without stockholder approval, shares of undesignated preferred stock, which may make it possible for our Board to issue preferred stock with voting or other rights or preferences that could impede the success of any attempt to acquire us.
As a Delaware corporation, we are also subject to certain Delaware anti-takeover provisions. Under Delaware law, a corporation may not engage in a business combination with any holder of 15% or more of its capital stock unless the holder has held the stock for three years or, among other things, the Board has approved the transaction. Such provisions could allow our Board to prevent or delay an acquisition of our company.
Certain of our executive officers may be entitled, pursuant to the terms of their employment arrangements, to accelerated vesting of their stock options following a change of control of our company under certain conditions. In addition to the arrangements currently in place with some of our executive officers, we may enter into similar arrangements in the future with other officers. Such arrangements could delay or discourage a potential acquisition.
Any provision of our amended and restated certificate of incorporation or amended and restated bylaws or Delaware law that has the effect of delaying or deterring a potential acquisition could limit the opportunity for our stockholders to receive a premium for their shares of our common stock in connection with such acquisition, and could also affect the price that some investors are willing to pay for our common stock.
Our amended and restated certificate of incorporation provides that the Court of Chancery of the State of Delaware or the U.S. federal district courts will be the exclusive forums for substantially all disputes between us and our stockholders, which could limit our stockholders’ ability to obtain a favorable judicial forum for disputes with us or our directors, officers or other employees.
Our amended and restated certificate of incorporation provides that the Court of Chancery of the State of Delaware is the sole and exclusive forum for: (1) any derivative action or proceeding brought on our behalf, (2) any action asserting a claim of breach of a fiduciary duty owed by any of our directors, officers or other employees to us or our stockholders, (3) any action asserting a claim against us or any of our directors, officers or other employees arising pursuant to any provisions of the Delaware General Corporation Law, our amended and restated certificate of incorporation or our amended and restated bylaws, (4) any action to interpret, apply, enforce or determine the validity of our amended and restated certificate of incorporation or our amended and restated bylaws, or (5) any action asserting a claim against us or any of our directors, officers or other employees that is governed by the internal affairs doctrine. This provision would not apply to suits brought to enforce a duty or liability created by the Exchange Act or the rules and regulations thereunder. However, this provision applies to Securities Act claims and Section 22 of the Securities Act creates concurrent jurisdiction for federal and state courts over all suits brought to enforce a duty or liability created by the Securities Act or the rules and regulations thereunder. Accordingly, there is uncertainty as to whether a court would enforce such a provision, and our stockholders will not be deemed to have waived our compliance with the federal securities laws and the rules and regulations thereunder.
Our amended and restated certificate of incorporation further provides that the U.S. federal district courts will be the exclusive forum for resolving any complaint asserting a cause of action arising under the Securities Act, subject to and contingent upon a final adjudication in the State of Delaware of the enforceability of such exclusive forum provision. If a court were to find either exclusive forum provisionparticipate in our amended and restated certificateannual incentive plan for 2023. This performance-based cash compensation was designed to reward the achievement of incorporationannual corporate performance relative to be inapplicable or unenforceable in an action, we may incur additional costs associated with resolving such action in other jurisdictions, which could adversely affect our business and financial condition. For example, the Court of Chancery of the State of Delaware recently determined that the exclusive forum of provision of federal district courts of the United States of America for resolving any complaint asserting a cause of action arising under the Securities Act is not enforceable. However, this decision may be reviewed and ultimately overturned by the Delaware Supreme Court. If the Court of Chancery’s decision were to be overturned, we would enforce the federal district court exclusive forum provision in our amended and restated certificate of incorporation.
Item 1B. Unresolved Staff Comments
None.
Item 2. Properties
Our corporate headquarters is located in San Carlos, California, where we lease approximately 100,000 square feet of office space pursuant to a lease expiring in February 2026. We lease additional offices in Frisco, Texas; Irvine, California; Los Angeles, California; and Modesto, California and also lease three contact center locations in Mexico. We operate over 335 retail locations and co-locations across California, Illinois, Texas, Utah, Nevada, Arizona, New Mexico, New Jersey and Florida. Our retail locations are co-located within other retail locations, such as grocery stores, or are standalone locations. We lease our locations pursuant to multiple lease agreements, including under month-to-month terms. In addition, we are currently subleasing a portion of our headquarters space to third parties. We plan to open additional retail locations each year as we continue to grow our business.
Item 3. Legal Proceedings
On June 13, 2017, a complaint, captioned Atinar Capital II, LLC and James Gutierrez v. David Strohm, et. al., CGC 17-559515, or the Atinar Lawsuit, was filed by plaintiffs James Gutierrez and Atinar Capital II, LLC (an LLC controlled by Gutierrez), or the Gutierrez Plaintiffs, in the Superior Court of the State of California, County of San Francisco, against certain of our current and former directors and officers, and certain of our stockholders alleging that the defendants breached their fiduciary duties to our common stockholders in their capacities as officers, directors and/or controlling stockholders by approving certain of our convertible preferred stock financing rounds that diluted the ownership of our common stockholders, and that certain defendants allegedly aided and abetted such breaches. On October 17, 2019, after being given leave by the court to amend its complaint, the plaintiffs filed a second amended complaint that added Gutierrez Family Holdings, LLC (another entity controlled by Gutierrez) as an additional plaintiff, and pleading the case in the alternative as a derivative shareholder suit. As part of the derivative shareholder suit, Oportun Financial Corporation was added as a nominal defendant only. The second amended complaint seeks unspecified monetary damages and other relief. On November 18, 2019, we filed a demurrer of the second amended complaint, which is scheduled to be heard by the court on March 3, 2020. We are indemnifying the current and former directors and officers to whom we have indemnification obligations for fees incurred in defending this matter, and if such directors and officers incur any losses in connection with this matter, we may be required to indemnify them for such losses.
We believe that the Atinar Lawsuit is without merit and we intend to vigorously defend the actions. However, the final outcome with respect to the claims in the lawsuit, including our liability, if any, is uncertain. Furthermore, we cannot be certain that any claims in the Atinar Lawsuit would be resolved in our favor. An adverse finding could cause us to incur substantial expense, could be a distraction to management and could result in reputational harm.
On January 2, 2018, a complaint, captioned Opportune LLP v. Oportun, Inc. and Oportun, LLC, Civil Action No. 4:18-cv-00007, or the Opportune Lawsuit, was filed by plaintiff Opportune LLP in the United States District Court for the Southern District of Texas, against us and our wholly-owned subsidiary, Oportun, LLC. The complaint alleged various claims for trademark infringement, unfair competition, trademark dilution and misappropriation against us and Oportun, LLC and called for injunctive relief requiring us and Oportun, LLC to cease using its marks,pre-established goals, as well as monetary damages related to the claims. In addition, on January 2, 2018, the plaintiff initiated a cancellation proceeding, Proceeding No. 92067634, before the Trademark Trialindividual performance, contributions and Appeal Board seeking to cancel certain of our trademarks, or the Cancellation Proceeding and, together with the
Opportune Lawsuit, the Opportune Matter. On March 5, 2018, the Trademark Trial and Appeal Board granted our motion to suspend the Cancellation Proceeding pending final disposition of the Opportune Lawsuit. On April 24, 2018, the District Court granted our motion to partially dismiss the complaint, dismissing Plaintiff's misappropriation claim. On February 22, 2019, Plaintiff filed an amended complaint adding an additional claim under the Anti-Cybersquatting Protection Act to the remaining claims in the original complaint. On August 30, 2019, we filed a motion for summary judgment on all of Plaintiff's claims. On January 22, 2020, the District Court issued its decision denying our motion for summary judgment. No trial date has been set.
We believe that the Opportune Matter is without merit. We intend to vigorously defend the Opportune Matter. The final outcome with respect to the claims in the lawsuits, including our liability, if any, is uncertain. Furthermore, we cannot be certain that any claims by the plaintiff would be resolved in our favor. For example, an adverse litigation ruling against us could result in a significant damages award against us, could result in injunctive relief, could result in a requirement that we make substantial royalty payments, and could result in the cancellation of certain Oportun trademarks which would require that we rebrand. Moreover, an adverse finding could cause us to incur substantial expense, could be a distraction to management, and any rebranding as a result may not be well received in the market.
At this stage in these litigation matters, any possible monetary loss or range of monetary loss cannot be estimated. The outcome of litigation is inherently uncertain. If one or more of these legal matters were resolved against us in a reporting period, or settled on unfavorable terms, our consolidated financial statements for that reporting period could be materially adversely affected.
From time to time, we may bring or be subject to other legal proceedings and claims in the ordinary course of business, including legal proceedings with third parties asserting infringement of their intellectual property rights and shareholder claims. Other than as described above, we are not presently a party to any legal proceedings that, if determined adversely to us, we believe would individually or taken together have a material adverse effect on our business, financial condition, cash flows or results of operations.
See Note 15, Leases, Commitments and Contingencies, in the accompanying Notes to the Consolidated Financial Statements for additional information regarding litigation reserves, if any, for legal proceedings in which the Company is involved.
Item 4. Mine Safety Disclosures
None.
PART II
Item 5. Market for Registrant's Common Equity, Related Stockholder Matters and Issuer Purchases of Equity Securities
Market Information and Stockholders
Oportun's common stock has been listed for trading on the Nasdaq Global Select Market since September 26, 2019 under the symbol "OPRT". As of February 21, 2020, we had 291 record holders of our common stock. This figure does not reflect the beneficial ownership of shares held in nominee name or held in trust by other entities. Therefore, the actual number of stockholders is greater than this number of registered stockholders of record.
Dividend Policy
We have never declared or paid any cash dividends on our capital stock, and we do not currently intend to pay any cash dividends on our capital stock in the foreseeable future. We currently intend to retain all available funds and any future earnings to support operations and to finance the growth and development of our business. Any future determination to pay dividends will be made at the discretion of our Board subject to applicable laws, and will depend upon, among other factors, our results of operations, financial condition, contractual restrictions and capital requirements. Our future ability to pay cash dividends on our capital stock may also be limited by the terms of any future debt or preferred securities or future credit facility.
Stock Performancestrategic impact.
The informationcompensation and leadership committee established target annual incentive awards for each executive officer, denominated as a percentage of base salary, which were set at the same percentages of base salary for 2023 as in 2022.
| | | 2023 Target Annual Incentive Award Opportunity | |
| | | | | | Percentage of Base Salary (%) | |
| Raul Vazquez | | | 700,000 | (1) | | | 100 | |
| Kathleen Layton | | | 113,625 | (2) | | | 65 | (3) |
| Patrick Kirscht | | | 307,780 | | | | 65 | |
| (1) | In connection with Mr. Vazquez’ voluntary reduction in salary, the compensation and leadership committee agreed that with respect to the annual bonus calculation for 2023, Mr. Vazquez’ target award would be determined using the annual base salary in effect immediately before the reduction. |
| (2) | Ms. Layton was only eligible for this bonus opportunity for approximately five months of the year, which is the prorated portion of time in which she served in an executive capacity. This Target Award represents the time in which Ms. Layton served as Chief Legal Officer. |
| (3) | Ms. Layton was only eligible for this bonus opportunity for approximately five months of the year, which is the prorated portion of time in which she served in an executive capacity. This represents the bonus opportunity for Ms. Layton assuming no proration. |
For 2023, the compensation and leadership committee approved the corporate performance goals and their respective weightings set forth below. Our compensation and leadership committee believes these are the appropriate drivers for our business as they provide a balance between growth and strengthening our financial position while operating in a challenging environment. Periodically throughout the year, the compensation and leadership committee may revise corporate performance goals and weightings for annual incentive awards based on our business priorities and annual operating plan. Our Adjusted EBITDA and total revenue performance metrics allow the compensation and leadership committee to accurately assess the Company’s productivity and efficiency, while evaluating comparative results period-over-period. Please refer to the Reconciliation on Non-GAAP Financial Measures section of this “Stock Performance” section shall not be deemed to be “soliciting material” or to be “filed” withamendment for the SECCompany’s definition of Adjusted EBITDA.
In 2023, the annual incentive awards were weighted 75% on corporate performance and 25% on attainment of individual goals for purposes of Section 18 of the Exchange Act, or otherwise subject to liabilities under that Section, and shall not be deemed to be incorporated by reference into anyall of our filingsNEOs, except for our CEO. The annual incentive award for the CEO was weighted 80% on corporate performance and 20% on attainment of individual goals. Individual goal achievement for each NEO’s performance was determined by the compensation and leadership committee.
| (1) | For the CEO, the weightings were 80% on corporate performance and 20% on attainment of individual goals. |
Our 2023 performance included several achievements but ultimately fell short of our expectations. The following provides additional information regarding the corporate goals under the Securities Act of 1933, as amended.our Annual Incentive Plan.
The following data and graph show a comparison of the cumulative total shareholder return for our common stock, KBW NASDAQ Financial Technology Index, and the NASDAQ Global Select Market Composite Index from September 26, 2019 through December 31, 2019. This data assumes simultaneous investments of $100 on September 26, 2019 and reinvestment of any dividends. The stockholder return shown in the graph below is not necessarily indicative of future performance, and we do not make or endorse any predictions as to future stockholder returns.
|
| | | | | | | | | | | | | | | |
| Company Index | 9/26/2019 | 9/30/2019 | 10/31/2019 | 11/30/2019 | 12/31/2019 |
| Oportun Financial Corporation | $ | 100.00 |
| $ | 100.31 |
| $ | 99.69 |
| $ | 131.05 |
| $ | 147.19 |
|
| NASDAQ Composite Index | $ | 100.00 |
| $ | 99.61 |
| $ | 98.48 |
| $ | 107.90 |
| $ | 111.73 |
|
| KBW Nasdaq Financial Technology Index | $ | 100.00 |
| $ | 98.83 |
| $ | 100.81 |
| $ | 106.10 |
| $ | 106.23 |
|
Issuer Purchases of Equity Securities
None.
Unregistered Sales of Equity Securities
We had no unregistered sales of our securities in the reporting period not previously reported.
Use of Proceeds
On September 30, 2019, we completed our initial public offering, or the IPO, in which we sold 4,873,356 shares of common stock at a price to the public of $15.00 per share for an aggregate offering price of approximately $73.1 million, including shares sold in connection with the full exercise of the underwriters’ option to purchase additional shares. In addition, the selling stockholders sold 2,314,144, shares of our common stock at a price to the public of $15.00 per share for an aggregate offering price of approximately $34.7 million, including shares sold in connection with the full exercise of the underwriters’ option to purchase additional shares. We did not receive any proceeds from the sale of shares by the selling stockholders in the IPO. The shares of our common stock sold by us and by the selling stockholders on September 30, 2019, represented all securities registered in the registration statement.
The offer and sale of all of the shares in the IPO were registered under the Securities Act pursuant to a registration statement on Form S-1 (File No. 333-232685), which was declared effective by the SEC on September 25, 2019. We received aggregate net proceeds of $60.5 million, after deducting underwriting discounts and commissions of $5.1 million and offering expenses paid by us of approximately $7.5 million subject to certain cost reimbursements. There has been no material change in the planned use of proceeds from our IPO as described in the final prospectus for our IPO, dated September 25, 2019 and filed with the SEC pursuant to Rule 424(b)(4) under the Securities Act of 1933, as amended, on September 27, 2019, or our Prospectus. The representatives of the underwriters of our IPO were Barclays Capital Inc., J.P. Morgan Securities LLC and Jefferies LLC. No payments were made by us to directors, officers or persons owning ten percent or more of our common stock or to their associates, or to our affiliates, other than payments in the ordinary course of business to officers for salaries and to non-employee directors pursuant to our director compensation policy.
Item 6. Selected Financial Data
As a “Smaller Reporting Company” as defined by Item 10 of Regulation S-K, the Company is not required to provide this information
Item 7. Management's Discussion and Analysis of Financial Condition and Results of Operations
An index to our management's discussion and analysis follows:
|
| | |
TopicMetric (Weighting) | | | Target
($) | Actual
($) | Percent attainment
(%) |
Total Revenue and Adjusted EBITDA
| | Total Revenue (consolidated) (25%) | 1,109M | 1,057M | 91.2% |
|
| Adjusted EBITDA (75%) | 77.9M | 1.7M | 0.0% |
|
| Total Corporate Attainment | | |
| | |
| | |
| | |
| | |
| | |
| | |
| | |
| | 23% |
You should readFor a reconciliation of non-GAAP Adjusted EBITDA to GAAP EBITDA, refer to the following discussionReconciliation on Non-GAAP Financial Measures section of this amendment. For more information about our business, please see “Business” and analysis of our financial condition and results of operations together with our consolidated financial statements and the related notes and other financial information included elsewhere in this reportand the audited consolidated financial statements and the related notes and the discussion under the heading “Management’s Discussion and Analysis of Financial Condition and Results of Operations” in our Original Form 10-K.
Individual annual incentive award goals and achievement for our NEOs vary depending on our strategic corporate initiatives and each executive officer’s responsibilities. While not exhaustive, below are certain key factors that the compensation and leadership committee, in consultation with our CEO, considered when determining the individual component of each 2023 annual incentive award. While the compensation and leadership committee recognized that the challenging macroeconomic environment resulting from inflationary pressures and higher interest rates negatively impacted the business and stock performance, it determined that in 2023 our NEOs were able to continue to shift priorities to focus on tightening our underwriting, reducing expenses, optimizing operational efficiency and guiding Oportun on a trajectory for sustainable, profitable growth and long-term value creation for stockholders. The compensation and leadership committee recognized the individual accomplishments of the NEOs, including:
Regularly enhancing our underwriting models and servicing efforts to continue to improve credit outcomes amidst an uncertain and dynamic macroeconomic environment;
Adaptability and responsiveness of the legal and compliance organization amidst a complex regulatory landscape;
Providing strategic guidance that contributed to the achievement of key business initiatives;
| • | Increasing operating efficiency due to several cost structure optimization initiatives; and |
Executing and delivering a number of funding arrangements in a challenging capital markets environment.
As a result of the compensation and leadership committee’s performance review, including the decline in our Net Income and Total Stockholder Return, the following annual incentive awards were paid to each of our NEOs for 2023, representing a decrease in the incentive award paid in comparison to 2022:
| | | Target Bonus ($) | | Bonus Payout (% of Target) | | Bonus Amount ($) | | YoY Change (%) |
| Raul Vazquez | | | 700,000 | (1)
| | | 32.2 | | | | 225,680 | | | | (43.0 | )
|
| Kathleen Layton | | | 113,625 | (2)
| | | 42.1 | | | | 47,795 | | | | N/A | |
| Patrick Kirscht | | | 307,780 | | | | 39.6 | | | | 121,881 | | | | (51.9 | ) |
| (1) | In connection with Mr. Vazquez’ voluntary reduction in salary, the compensation and leadership committee agreed that with respect to annual bonus calculation for 2023, Mr. Vazquez’ target award would be determined using the annual base salary in effect immediately before the reduction. |
| (2) | Ms. Layton’s target annual incentive award was prorated for the portion of time in which she served in an executive capacity. Assuming no proration, the Target Bonus for Ms. Layton would have been $243,750 and the Bonus Amount would have been $102,619. Prior to her promotion to Chief Legal Officer, Ms. Layton received $95,175 in bonus payments for 2023. |
| (3) | Ms. Layton was not serving in an executive capacity in 2022 and did not receive an annual incentive award. |
Long-Term Incentive Compensation
Our compensation and leadership committee believes long-term incentive compensation is an effective means for focusing our NEOs on driving increased stockholder value over a multi-year period and motivating them to remain employed with us. In 2023, our compensation and leadership committee, in consultation with Willis Towers Watson, conducted a review of the design of our long-term incentive program. Based on this review, the compensation and leadership committee determined to adopt a new, enhanced long-term incentive program for our executive officers. The design of the 2023 program is intended to directly align the interests of our executive officers with those of our stockholders, to give our executive officers a strong incentive to maximize stockholder returns on a long-term basis, and to aid in our recruitment and retention of key executive talent necessary to ensure our continued success.
In 2023, our long-term incentive program provided for the delivery of long-term incentive awards through a combination of the following two award vehicles:
| LTI Vehicle | Performance Period | Weighting |
Performance-based
Restricted Stock Units (PSUs) | A three-year performance period covering calendar years 2023 through 2025; three-year cliff vesting | Approximately 50% of total target award |
| Restricted Stock Units (RSUs) | N/A – Shares vest in three equal annual installments from the vesting commencement date of March 10, 2023, subject to continued employment | Approximately 50% of total target award |
The PSU award is the new element of our long-term incentive program, and it is the performance-contingent award which replaces the stock options in our prior long-term incentive program. The PSU award rewards executives for absolute total shareholder return as measured by the Company’s stock price appreciation and any declared dividends. We use absolute total shareholder return as the sole performance metric for the award because the compensation and leadership committee believes it is the ultimate measure of the Company’s achievement for its stockholders over the long term. The PSUs have both upside potential and downside risk based on positive or negative absolute total shareholder return performance. Vesting of the 2023-2025 PSU award cycle occurs at the end of the three-year performance period, which is December 31, 2025, and vested PSUs are subject to the continued employment of each executive through March 10, 2026. Vesting is dependent upon meeting a three-year threshold level of absolute total shareholder return, and participants are eligible to earn up to 125% of their target award. Any PSUs that vest in excess of the 100% target number of units (the “Upside Units”), may be paid out via a cash payment with respect to some or all of the Upside Units, in an amount equal to the fair market value of the underlying shares as of the vesting date.
The following table reflects potential performance and payout percentages. Performance between these points will be linearly interpolated.
| TSR Global | Percent That Become Eligible Units | Corresponding Average Closing Stock Prices |
If Company TSR is achieved at . . . | . . . Then the percentage of the Target Number of Performance-Based Restricted Stock Units that become Eligible Units is: | The applicable average closing prices of our common stock for each of the twenty (20) trailing consecutive trading days ending with, and inclusive of, the measurement date would need to reach: |
| 125% or greater | 125% | $13.61 |
| 100% | 100% | $12.10 |
| 75% | 75% | $10.59 |
| 50% | 50% | $9.08 |
| 25% | 25% | $7.56 |
| Less than 25% | 0% | < $7.56 |
Stock-based compensation cost for the PSUs is measured based on the estimated fair value of the PSUs granted using a Monte Carlo simulation. The fair value is then amortized ratably over the requisite service period of the awards. The fair value for PSUs achieved over 100% of target are recognized as a liability and will be revalued as needed throughout the service period.
A summary of our PSU activity under the 2019 Plan for the year ended December 31, 2023 is as follows:
| | PSU Outstanding | Weighted Average Grant- Date Fair Value ($) |
Balance – January 1, 2023 | — | — |
| Granted | 327,668 | 1.33 |
| Vested | — | — |
| Forfeited | — | — |
| Balance – December 31, 2023 | 327,668 | 1.33 |
For fiscal year 2023, we recognized approximately $13.2 thousand in compensation cost related to nonvested PSU awards granted to employees in our condensed consolidated statements of operations. As of December 31, 2023, we had approximately $422.6 thousand in unrecognized compensation cost related to nonvested PSU awards granted to employees, which will be recognized over a weighted average vesting period of approximately 2.19 years.
Employment and Change in Control Arrangements
We have entered into at-will employment offer letters with each of our NEOs that were approved by the compensation and leadership committee and our Board. In addition, we provide each NEO with the opportunity to receive certain severance payments and benefits in the event of a termination of employment under certain circumstances, including in connection with a change of control. The compensation and leadership committee generally believes that the severance protection payments and benefits we offer are necessary to provide stability among our executive officers, serve to focus our executive officers on our business operations, and avoid distractions in connection with a potential change in control transaction or period of uncertainty.
For additional information on the employment arrangements and potential post-employment payments to our NEOs, see “Employment, Severance, and Change in Control Agreements” and “Potential Payments and Benefits Upon Termination or Change in Control” below.
401(k) Plan and Employee Benefits
During 2023, all full-time employees in the United States employed by Oportun, including the NEOs, were eligible to participate in the Company’s 401(k) plan, a tax qualified retirement plan (with an employer match up to 4% of eligible contributions). Other than the 401(k) plan, we do not provide defined benefit pension plans or defined contribution retirement plans to the NEOs or other employees.
We also offer a number of benefit programs to our full-time employees, including our NEOs, in the United States. These benefits include medical, vision and dental insurance, health and dependent care flexible spending accounts, wellness programs, charitable donation matching, short-term and long-term disability insurance, accidental death and dismemberment insurance, basic life insurance coverage, and business travel insurance. Full-time and part-time employees in the United States are eligible to receive paid parental leave.
Stock Ownership Guidelines
In April 2022, the compensation and leadership committee adopted stock ownership guidelines for our executive officers and non-employee directors to further align their interests with our stockholders. Under these guidelines, each participant is required to own shares of our common stock with value of at least the following:
| Position | Ownership Requirement |
| CEO | 6x annual base salary |
| Other Section 16 officers | 3x annual base salary |
| Non-employee directors | 5x annual cash retainer |
Covered executives are expected to meet the required ownership level within five years of the later of the initial adoption of the policy or hire or promotion into a covered executive role. Non-employee directors are expected to meet the required ownership level within five years of the appointment date. Further, executives and non-employee directors must hold at least 50% of any net after-tax shares realized from equity award vesting or exercise until the guideline has been met. Shares held outright and unvested RSUs that are subject to only a time-vesting condition count towards the ownership threshold but shares underlying options and unearned performance-vesting shares do not.
Compensation Clawback
In April 2022, the compensation and leadership committee approved a discretionary executive clawback policy which applies to our Section 16 officers. Our discretionary clawback policy provides that if (i) the Company is required to restate its financial statements filed pursuant to the Exchange Act as a result of a material error in the financial statement, (ii) such restatement is due to the gross negligence or intentional misconduct of a clawback officer (as determined by the compensation and leadership committee), (iii) the amount of any cash-based incentive paid to or payable to such clawback officer that was determined based on the achievement of financial or operating results would have been less if such financial statements had been correct at the time of determination, and (iv) no more than three years have elapsed from the filing date of such financial statements upon which such incentive compensation was determined, then the Company shall recoup from such clawback officer an amount equal to such excess cash incentive compensation through such means as the compensation and leadership committee determines in accordance with the policy.
In addition to the above-described discretionary clawback policy, in November 2023, the compensation and leadership committee adopted a separate mandatory incentive-based executive clawback policy which applies to our current and former executive officers, on or after October 2, 2023. Our mandatory clawback policy provides for the recoupment of certain executive compensation, including but not limited to short- and long-term incentive-based compensation, in the event of an accounting restatement resulting from material noncompliance with financial reporting requirements under U.S. federal securities laws, consistent with SEC regulations effective in 2023.
Hedging and Pledging Policies
We have established an insider trading policy, which, among other things, prohibits all employees and non-employee directors from engaging in short sales or transactions in publicly-traded options (such as puts and calls) and other derivative securities relating to our common stock, hedging or similar transaction designed to decrease the risks associated with holding our securities, pledging any of our securities as collateral for a loan, and holding any of our securities in a margin account.
Compensation Risk Assessment
The compensation and leadership committee has reviewed our compensation programs to assess whether they encourage our employees to take excessive or inappropriate risks. After reviewing and assessing our compensation philosophy, policies and practices, including the mix of fixed and variable, short-term and long-term incentives and overall pay, incentive plan structures, and the checks and balances built into, and oversight of, each plan and practice, the compensation and leadership committee has determined that any risks arising from our compensation programs are not reasonably likely to have a material adverse effect on the Company.
Deductibility of Executive Compensation
Section 162(m) of the Internal Revenue Code generally places a $1 million limit on the amount of compensation a publicly-held company can deduct for U.S. federal tax purposes in any tax year on compensation paid to “covered employees.” The compensation and leadership committee retains discretion to award compensation amounts which are not tax-deductible if it determines that such compensation is consistent with our business needs.
Taxation of Parachute Payments and Deferred Compensation
We do not provide, and have no obligation to provide, any executive officer, including any NEO, with a “gross-up” or other reimbursement payment for any tax liability that he or she might owe as a result of the application of Section 280G, 4999, or 409A of the Code. Sections 280G and 4999 of the Code provide that executive officers and directors who hold significant equity interests and certain other service providers may be subject to an excise tax if they receive payments or benefits in connection with a change of control that exceed certain limits prescribed by the Code, and that the employer may be unable to take a deduction on the amounts subject to this additional tax.
Summary Compensation Table
The following table provides information regarding the compensation awarded to, earned by or paid to our NEOs for the years ended December 31, 2023, 2022, and 2021:
| Year | | Salary(1) ($) | | | Bonus ($) | | | Stock Awards(3) ($) | | | Option Awards(3) ($) | | | Non-Equity Incentive Plan Compensation (4) ($) | | | All Other Compensation (5) ($) | | | Total ($) | |
Raul Vazquez(6)(7) | 2023 | | | 687,885 | | | | — | | | | 746,007 | | | | — | | | | 225,680 | | | | 34,963 | | | | 1,694,535 | |
| Chief Executive Officer | 2022 | | | 683,836 | | | | — | | | | 2,650,738 | | | | 875,005 | | | | 525,000 | | | | 31,345 | | | | 4,765,924 | |
| 2021 | | | 591,917 | | | | — | | | | 875,019 | | | | 875,010 | | | | 745,440 | | | | 31,999 | | | | 3,119,385 | |
| | | | | | | | | | | | | | | | | | | | | | | | | | | | | | |
Kathleen Layton(8) | 2023 | | | 356,216 | | | | 95,175 | (2) | | | 371,545 | | | | — | | | | 47,795 | | | | 15,362 | | | | 886,093 | |
| Chief Legal Officer and Corporate Secretary | | | | | | | | | | | | | | | | | | | | | | | | | | | | | |
| | | | | | | | | | | | | | | | | | | | | | | | | | | | | |
| | | | | | | | | | | | | | | | | | | | | | | | | | | | | | |
| Patrick Kirscht | 2023 | | | 473,509 | | | | — | | | | 208,704 | | | | — | | | | 121,881 | | | | 39,819 | | | | 843,913 | |
| Chief Credit Officer | 2022 | | | 469,176 | | | | — | | | | 1,136,034 | | | | 375,008 | | | | 234,682 | | | | 38,949 | | | | 2,253,849 | |
| 2021 | | | 433,816 | | | | — | | | | 375,005 | | | | 375,011 | | | | 358,158 | | | | 36,150 | | | | 1,578,140 | |
| | | | | | | | | | | | | | | | | | | | | | | | | | | | | | |
| (1) | The salary amounts in this column reflect the blended salary paid, which takes into account any salary increases or decreases effective during the year, if any. These amounts have been adjusted to reflect the blended salary paid and may deviate an immaterial amount from the previously reported salaries. |
| (2) | The amount reported represents an annual bonus paid to Ms. Layton during the course of 2023, prior to her promotion to Chief Legal Officer. The bonus for non-executive employees is not based on pre-established performance criteria and therefore is not included in Non-Equity Incentive Plan Compensation. |
| (3) | These columns reflect the aggregate grant date fair value of stock options, RSUs, and PSUs measured pursuant to FASB ASC 718 without regard to forfeitures and assuming the probable level of achievement for all PSUs. We value time-based RSUs based on the closing market price of our common stock reported on Nasdaq on the grant dates. We value PSUs using the Monte Carlo simulation pricing model. In 2023, Messrs. Vazquez and Kirscht were granted PSUs having the following grant date fair values: $234,560 for Mr. Vazquez and $65,621 for Mr. Kirscht. The value of the PSUs at the grant date assuming that the highest level of performance conditions will be achieved is $293,200 for Mr. Vazquez and $82,026 for Mr. Kirscht. The actual number of PSUs, if any, that may be earned range from 0% to 125% of the target number of units. Any PSUs that vest in excess of the 100% target number of units (the “Upside Units”), may be paid out via a cash payment with respect to some or all of the Upside Units, in an amount equal to the fair market value of the underlying shares as of the vesting date, subject to the terms of the 2019 Equity Incentive Plan and the PSU Award Agreement. For additional information on the assumptions used in calculating the grant date fair value of these awards see Note 2 and Note 11 to our Notes to the Consolidated Financial Statements included in our Original Form 10-K, as well as “Elements of Executive Compensation and 2023 Compensation Decisions—Long-Term Incentive Compensation” above. These amounts in this column may not reflect the actual economic value that may be realized by the NEO. For additional information regarding our long-term incentive program, see “Elements of Executive Compensation and 2023 Compensation Decisions—Long-Term Incentive Compensation” above. |
| (4) | The amounts represent the bonuses paid under our annual incentive plan. |
| (5) | The amounts reported include the cash value of Oportun’s match of our NEO’s contributions to the 401(k) plan, matching charitable contributions made by Oportun in 2021 and 2022 pursuant to the Company’s charitable match program, certain life insurance premium payments, and certain medical insurance and disability insurance payments. For 2023, “All Other Compensation” includes certain medical insurance and disability insurance payments, as well as (i) $13,200 for 401(k) employer match and $318 for life insurance premium for Mr. Vazquez; (ii) $13,200 for 401(k) employer match for Ms. Layton and (iii) $13,200 for 401(k) employer match and $318 for life insurance premium for Mr. Kirscht. |
| (6) | Mr. Vazquez serves on our Board but is not paid additional compensation for such service. |
| (7) | Mr. Vazquez’ base salary was voluntarily decreased from $700,000 to $595,000, effective November 11, 2023. |
| (8) | Ms. Layton’s base salary was increased from $341,318 to $375,000, effective July 15, 2023. |
Grants of Plan-Based Awards in Fiscal Year 2023
The following table provides information regarding each grant of a plan-based award made to an NEO under any plan in the year ended December 31, 2023:
| | | | | | | | Estimated Future Payouts Under Equity Incentive Plan Awards | | | | | | | |
| Type of Award | Grant Date | | Estimated Future Payouts Under Non- Equity Incentive Plan Awards: (1) Target ($) | | | Threshold (#) | | | Target (#) | | | Maximum (#) | | | All Other Stock Awards: Number of Shares or Units (#) | | | Grant Date Fair Value of Stock Awards (2) ($) | |
| Raul Vazquez | Annual incentive award | 2/12/2024 | | | 700,000 | | | | — | | | | — | | | | — | | | | — | | | | — | |
| PSU | 12/6/2023 | | | — | | | | 44,090 | | | | 176,361 | | | | 220,451 | | | | — | | | | 234,560 | |
| RSU | 12/6/2023 | | | — | | | | — | | | | — | | | | — | | | | 176,361 | | | | 511,447 | |
| | | | | | | | | | | | | | | | | | | | | | | | | | | |
Kathleen Layton | Annual incentive award | 2/12/2024 | | | 113,625 | | | | — | | | | — | | | | — | | | | — | | | | — | |
| | RSU | 10/25/2023 | | | — | | | | — | | | | — | | | | — | | | | 18,700 | | | | 100,419 | |
| RSU | 9/10/2023 | | | — | | | | — | | | | — | | | | — | | | | 36,102 | | | | 271,126 | |
| | | | | | | | | |
|
|
|
|
|
|
|
|
|
|
|
|
|
|
|
|
| |
| Patrick Kirscht | Annual incentive award | 2/12/2024 | | | 307,780 | | | | — | | | | — | | | | — | | | | — | | | | — | |
| PSU | 12/6/2023 | | | — | | | | 12,334 | | | | 49,339 | | | | 61,673 | | | | — | | | | 65,621 | |
| | RSU | 12/6/2023 | | | — | | | | — | | | | — | | | | — | | | | 49,339 | | | | 143,083 | |
| | | | | | | | | | | | | | | | | | | | | | | | | | | |
| (1) | Represents the target amount of annual cash incentive compensation for which the executive was eligible to receive under our annual incentive plan. There are no minimum thresholds or maximums. |
(2) | This column reflects the aggregate grant date fair value of the RSU awards and PSU awards, assuming the probable level of achievement, measured pursuant to FASB ASC 718, without regard to forfeitures. The assumptions used in calculating the grant date fair value of these awards are set forth in Note 2 and Note 11 to our Notes to the Consolidated Financial Statements included in our Original Form 10-K. These amounts do not reflect the actual economic value that may be realized by the NEO. |
Annual Incentive Plan
Each of our NEOs was eligible to participate in our annual incentive plan for 2023. For additional discussion regarding the criteria applied in determining the amounts payable under the Annual Incentive Plan, please see “Executive Compensation—Annual Incentive Plan.”
Outstanding Equity Awards at 2023 Fiscal Year End
The following table provides information with respect to all outstanding stock options and RSUs held by our NEOs as of December 31, 2023. See “Employment, Severance, and Change in Control Agreements” and “Potential Payments and Benefits Upon Termination or Change in Control” below for information regarding the impact of certain employment termination scenarios on outstanding equity awards.
| | | Option Awards | | | Stock Awards | |
| Name | Award Grant Date (1) | | Number of Securities Underlying Unexercised Options - Unexercisable (2) (#) | | | Number of Securities Underlying Unexercised Options - Exercisable (3) (#) | | | Option Exercise Price ($/sh) | | | Option Expiration Date | | | Number of Shares or Units That Have Not Vested (#) | | | Market Value of
Shares or Units That Have Not Vested (5) ($) | | | Equity Incentive Plan Awards: Number of Unearned Shares, Units or Other Rights That Have Not Vested (#) | | | Equity Incentive Plan Awards: Market or Payout Value of Unearned Shares, Units or Other Rights That Have Not Vested (5) ($) | |
Raul Vazquez | 9/10/2014 | | | — | | | | 136,363 | | | | 10.23 | | | 9/9/2024 | | | | — | | | | — | | | | — | | | | — | |
| 9/29/2015 | | | — | | | | 3,741 | | | | 26.73 | | | 9/28/2025 | | | | — | | | | — | | | | — | | | | — | |
| 11/30/2016 | | | — | | | | 145,453 | | | | 19.69 | | | 11/29/2026 | | | | — | | | | — | | | | — | | | | — | |
| 6/28/2019 | | | — | | | | 140,551 | | | | 18.04 | | | 6/27/2029 | | | | — | | | | — | | | | — | | | | — | |
| 3/10/2020(6) |
| | 12,088 | | | | 181,276 | | | | 19.00 | | | 3/9/2030 | | | | — | | | | — | | | | — | | | | — | |
| 3/10/2020 | | | — | | | | — | | | | | | | | — | | | | 23,027 | (4) | | | 90,036 | | | | — | | | | — | |
| 9/10/2020(7) |
| | — | | | | — | | | | — | | | | — | | | | 31,475 | (4) | | | 123,067 | | | | — | | | | — | |
| 3/10/2021(6) |
| | 22,544 | | | | 49,592 | | | | 21.26 | | | 3/9/2031 | | | | — | | | | — | | | | — | | | | — | |
| 3/10/2021 | | | — | | | | — | | | | — | | | | — | | | | 20,579 | (4) | | | 80,464 | | | | — | | | | — | |
| 3/25/2022 | | | 62,747 | | | | 48,801 | | | | 13.39 | | | 3/24/2032 | | | | | | | | | | | | — | | | | — | |
| 3/25/2022 | | | — | | | | — | | | | — | | | | — | | | | 148,473 | (4) | | | 580,529 | | | | — | | | | — | |
| 12/6/2023 | | | — | | | | — | | | | — | | | | — | | | | 176,361 | (8) | | | 689,572 | | | | — | | | | — | |
| 12/6/2023 | | | — | | | | — | | | | — | | | | — | | | | — | | | | — | | | | 44,090 | (9) | | | 172,392 | |
| | | | | | | | | | | | | | | | | | | | | | | | | | | | | | | | | | |
| Kathleen Layton | 12/21/2016 | | | — | | | | 8,522 | | | | 19.69 | | | 12/20/2026 | | | | — | | | | — | | | | — | | | | — | |
| 11/29/2017 | | | — | | | | 4,022 | | | | 24.86 | | | 11/28/2027 | | | | — | | | | — | | | | — | | | | — | |
| 3/29/2018 | | | — | | | | 3,935 | | | | 25.41 | | | 3/28/2028 | | | | — | | | | — | | | | — | | | | — | |
| 3/10/2020(6) |
| | 573 | | | | 8,591 | | | | 19.00 | | | 3/9/2030 | | | | — | | | | — | | | | — | | | | — | |
| 3/10/2020 | | | — | | | | — | | | | — | | | | — | | | | 1,092 | (4) | | | 4,270 | | | | — | | | | — | |
| 9/10/2020 | | | — | | | | — | | | | — | | | | — | | | | 1,492 | (4) | | | 5,834 | | | | — | | | | — | |
| 3/10/2021 | | | — | | | | — | | | | — | | | | — | | | | 1,671 | (4) | | | 6,534 | | | | — | | | | — | |
| 3/10/2021(6) |
| | 1,831 | | | | 4,026 | | | | 21.26 | | | 3/9/2031 | | | | — | | | | — | | | | — | | | | — | |
| 3/10/2022 | | | — | | | | — | | | | — | | | | — | | | | 7,669 | (4) | | | 29,986 | | | | — | | | | — | |
| 3/10/2022(6) |
| | 9,722 | | | | 7,561 | | | | 13.26 | | | 3/9/2032 | | | | — | | | | — | | | | — | | | | — | |
| 9/10/2023 | | | — | | | | — | | | | — | | | | — | | | | 3,6102 | (4) | | | 141,159 | | | | — | | | | — | |
| 10/25/2023 | | | — | | | | — | | | | — | | | | — | | | | 18,700 | (4) | | | 73,117 | | | | — | | | | — | |
| | | | | | | | | | | | | | | | | | | | | | | | | | | | | | | | | |
| Patrick Kirscht | 9/29/2014 | | | — | | | | 36,363 | | | | 10.23 | | | 9/28/2024 | | | | — | | | | — | | | | — | | | | — | |
| 9/29/2015 | | | — | | | | 54,545 | | | | 26.73 | | | 9/28/2025 | | | | — | | | | — | | | | — | | | | — | |
| 11/30/2016 | | | — | | | | 45,453 | | | | 19.69 | | | 11/29/2026 | | | | — | | | | — | | | | — | | | | — | |
| 6/28/2019 | | | — | | | | 70,275 | | | | 18.04 | | | 6/27/2029 | | | | — | | | | — | | | | — | | | | — | |
| 3/10/2020(6) |
| | 5,181 | | | | 77,690 | | | | 19.00 | | | 3/9/2030 | | | | — | | | | — | | | | — | | | | — | |
| 3/10/2020 | | | — | | | | — | | | | — | | | | — | | | | 9,869 | (4) | | | 38,588 | | | | — | | | | — | |
| 9/10/2020(7) |
| | — | | | | — | | | | — | | | | — | | | | 13,490 | (4) | | | 52,746 | | | | — | | | | — | |
| 3/10/2021(6) |
| | 9,662 | | | | 21,254 | | | | 21.26 | | | 3/9/2031 | | | | — | | | | — | | | | — | | | | — | |
| 3/10/2021 | | | — | | | | — | | | | — | | | | — | | | | 8,820 | (4) | | | 34,486 | | | | — | | | | — | |
| 3/25/2022 | | | 26,892 | | | | 20,915 | | | | 13.39 | | | 3/24/2032 | | | | — | | | | — | | | | — | | | | — | |
| 3/25/2022 | | | — | | | | — | | | | — | | | | — | | | | 63,632 | (4) | | | 248,801 | | | | — | | | | — | |
| 12/6/2023 | | | — | | | | — | | | | — | | | | — | | | | 49,339 | (8) | | | 192,915 | | | | — | | | | — | |
| 12/6/2023 | | | — | | | | — | | | | — | | | | — | | | | — | | | | — | | | | 12,334 | (9) | | | 48,226 | |
| | | | | | | | | | | | | | | | | | | | | | | | | | | | | | | | | | |
| (1) | Awards with a grant date on or prior to July 31, 2015 were granted under our 2005 Plan, awards with a grant date after July 31, 2015, but on or prior to September 26, 2019, were granted under our 2015 Stock Option/Stock Issuance Plan. Awards with a grant date after September 26, 2019 were granted under our 2019 Equity Incentive Plan. |
| (2) | Each option grant provides for a four-year vesting schedule, with one-fourth of the underlying shares vesting on the one-year anniversary of the vesting commencement date, and the balance vesting in equal monthly installments over the remaining 36 months, in each case subject to the executive’s continued service through the applicable vesting date. Except with respect to stock options granted under our 2019 Equity Incentive Plan, options are exercisable immediately following grant, also known as “early exercisable,” and unvested shares purchased on an early exercise are subject to a repurchase right in our favor on termination of employment that lapses along the same vesting schedule as contained in the option grant. This column reflects the number of unexercised options that were unvested as of December 31, 2023. |
| (3) | This column reflects the number of shares subject to unexercised options that were vested as of December 31, 2023. |
| (4) | The RSUs will vest over a four-year period with one-fourth of the RSUs vesting on each one year anniversary of the vesting commencement date, subject to the executive’s continued service on each such vesting date. There is no performance-based vesting condition associated with such RSUs. |
| (5) | Represents the number of unvested shares underlying RSUs multiplied by the per share fair market value of our common stock as of December 31, 2023, based on the closing price of our common stock of $3.91 per share. |
| (6) | Stock options granted under our 2019 Equity Incentive Plan are not early exercisable. |
| (7) | Includes “pull-forward” grants awarded in September 2020 where the grant pulled forward 50% of the annual grant value that otherwise would have been awarded as part of the annual review process in March 2021, with the remainder issued as awards of stock options and RSUs in March 2021. |
| (8) | The RSUs will vest in 3 equal annual installments from the vesting commencement date of March 10, 2023, subject to the executive’s continued service on each vesting date. There is no performance-based vesting condition associated with such RSUs. |
| (9) | These amounts represent PSU grants, assuming an achievement level at threshold. The actual number of PSUs, if any, that may be earned range from 0% to 125% of the target number of units. Any PSUs that vest in excess of the Upside Units, may be paid out in cash. Vesting is also contingent upon the continued employment of the executive through March 10, 2026, or as otherwise provided in the applicable award agreement. For additional information, see “Elements of Executive Compensation and 2023 Compensation Decisions—Long-Term Incentive Compensation” above. |
Option Exercises and Stock Vested in Fiscal Year 2023
The following table presents information concerning the aggregate value and number of shares of our common stock for which options were exercised or RSUs vested during 2023 for each of the NEOs:
| | | Option Awards | | | Stock Awards | |
| Name | | Number of Shares Acquired on Exercise (#) | | | Value Realized on Exercise ($)(1) | | | Number of Shares Acquired on Vesting (#) | | | Value Realized on Vesting ($)(4) | |
| Raul Vazquez | | | 101,675 | (2) | | | 148,445 | | | | 132,131 | | | | 701,197 | |
| Kathleen Layton | | | — | | | | — | | | | 7,859 | | | | 41,843 | |
| Patrick Kirscht | | | 68,181 | (3) | | | 99,544 | | | | 57,902 | | | | 308,161 | |
(1) | The value realized on exercise was determined based on a fair market value of the Company stock on the date of the exercise. |
(2) | Reflects two option exercises made on June 14, 2023, each with a per share exercise price of $5.86. For the first option exercise, Mr. Vazquez exercised the option as to 90,909 vested shares and chose to pay the exercise price and amounts required to satisfy tax withholding obligations through net share withholding, with the Company retaining 79,230 otherwise deliverable shares. For the second option exercise, Mr. Vazquez chose to exchange 8,084 previously owned shares, which had been held for at least 6 months, to cover the exercise price for the 10,766 vested options. Such exchange resulted in no applicable tax withholding. |
(3) | Reflects two option exercises made on June 14, 2023, each with a per share exercise price of $5.86. For the first option exercise, Mr. Kirscht exercised the option as to 45,454 vested shares and chose to pay the exercise price and amounts required to satisfy tax withholding obligations through net share withholding, with the Company retaining 40,521 otherwise deliverable shares. For the second option exercise, Mr. Kirscht chose to exchange 17,065 previously owned shares, which had been held for at least 6 months, to cover the exercise price for the 22,727 vested options. Such exchange resulted in no applicable tax withholding. |
(4) | The number of shares and value realized on vesting include shares that were withheld or sold at the time of vesting to satisfy tax withholding requirements. |
Employment, Severance and Change in Control Agreements
We previously entered into offer letters with each of our NEOs that generally provide for at-will employment and set forth the executive’s base salary, eligibility for an annual incentive award opportunity and employee benefits, and coverage under our executive severance policy. Each of our NEOs has also executed our standard form of proprietary information and invention assignment agreement. Each NEO must abide by any applicable compensation recovery policy, stock ownership guidelines, or other similar policies that we maintain. Further, the award agreements governing the PSU awards granted to Messrs. Vazquez and Kirscht in2023provide for certain benefits upon a change in control or in the event of an involuntary termination of the applicable NEO in connection with a change in control of Oportun. General provisions of the executive severance and change in control policy is discussed below, and any potential payments and benefits due upon a termination of employment or a change in control are further quantified below in “Potential Payments and Benefits Upon Termination or Change in Control.”
Executive Severance and Change in Control Policy
We maintain an executive severance and change in control policy, which covers each of our NEOs.
Upon a termination of employment by us without cause or by the executive for good reason (an “involuntary termination”), our NEOs other than our CEO will receive 12 months of salary continuation and continuation of health plan benefits at no cost under the Consolidated Omnibus Budget Reconciliation Act of 1985, as amended (“COBRA”) if they have been employed with us for at least five years (or nine months of such benefits if they have been employed for less than five years). If the termination occurs during the period beginning 90 days before, through 12 months after, our change in control (the “change in control period”), they will receive the higher level of salary continuation and health insurance benefits regardless of their tenure with us, their full target bonus, and full vesting of their unvested equity awards other than performance-vested awards. For performance-vested awards (other than the PSU awards described in the following section), any acceleration of vesting, exercisability or lapse of restrictions is based on actual performance through the date of such change in control. As of December 31, 2023, the last day of the most recently completed fiscal year, each of Ms. Layton and Mr. Kirscht had completed at least five years of employment with us.
On an involuntary termination, our CEO will receive 18 months of salary continuation and continuation of health plan benefits at no cost under COBRA if he has been employed with us for at least five years (or 12 months of such benefits if he has been employed for less than five years), and 12 months’ worth of accelerated vesting of equity awards other than performance-vested awards. If the involuntary termination occurs within the change in control period, he will receive the higher level of salary continuation and health insurance benefits regardless of his tenure with us, 150% of his target bonus, and full vesting of his unvested equity awards other than performance-vested awards. For performance-vested awards (other than the PSU awards described in the following section), any acceleration of vesting, exercisability or lapse of restrictions is based on actual performance through the date of such change in control. As of December 31, 2023, the last day of the most recently completed fiscal year, our CEO had completed at least five years of employment with us.
Severance benefits are subject to the execution of a release of claims by the executive, resignation from all officer and director positions, and continued compliance with the executive’s obligations under any confidentiality, intellectual property assignment, non-solicitation and restrictive covenant agreement with us. The terms “cause,” “good reason” and “change in control” can be found in the executive severance and change in control policy. If the payments and benefits under our executive severance and change in control policy would constitute “parachute payments” within the meaning of Section 280G of the Internal Revenue Code and would be subject to the related excise tax, such payments either will be paid in full or as to such lesser amount that would result in no portion of the payments and benefits being subject to such excise tax, whichever results in the greater amount of after-tax benefits to the NEO after taking into account any applicable excise tax. Our executive severance and change in control policy does not provide for any Internal Revenue Code Section 280G-related tax gross-up payments from the Company.
PSU Award Agreement
Under each of the award agreements governing the PSU awards granted to Messrs. Vazquez and Kirscht in 2023, if a “change in control” (as defined in the PSU award agreement) occurs during the three-year performance period covering calendar years 2023 through 2025, the performance period will be shortened to conclude as of a date, determined by the compensation and leadership committee, that is within the 10-day period ending with the estimated date of the change in control, and the compensation and leadership committee will certify our TSR performance during the abbreviated performance period by comparing the beginning average closing price to the consideration payable in the change in control (instead of the average closing price for the last 20 trailing consecutive trading days).
If the applicable NEO continues to provide service to us through the date of the change in control, then as of immediately before the change in control, a number of PSUs will become eligible PSUs equal to the greater of (x) the number of PSUs, if any, that the compensation and leadership committee determined may become eligible PSUs according to the certification described above, or (y) 100% of the target number of PSUs.
If the change in control occurs while the NEO continues to provide service to us and the PSU award is not assumed, continued, or substituted by a similar award, 100% of the NEO’s eligible PSUs (as determined according to the certification described above) will vest as of immediately before the change in control.
In addition, if, during the period beginning 90 days before a change in control and ending 12 months after that change in control, the NEO’s employment with us is terminated either (a) by us without “cause” and other than due to their death or “disability,” or (b) by the NEO for “good reason” (as such terms are defined in the PSU agreement), 100% of the NEO’s eligible PSUs will vest, subject to the NEO’s execution of a release of claims by the executive, resignation from all officer and director positions, and continued compliance with the executive’s obligations under any confidentiality, intellectual property assignment, non-solicitation and restrictive covenant agreement with us. The vesting acceleration benefits under our executive severance and change in control policy will not apply to these PSU awards.
Potential Payments and Benefits Upon Termination or Change in Control
The following table sets forth the estimated payments and benefits that would be received by each of the NEOs upon a change in control of Oportun, upon a termination of employment without cause or following a resignation for good reason (which we refer to below as an involuntary termination) unrelated to a change in control, or upon an involuntary termination in connection with a change in control of Oportun. This table reflects amounts payable to each NEO assuming his or her employment was terminated on December 31, 2023, and/or the change in control also occurred on that date. For additional discussion of the potential benefits and payments due in connection with a termination of employment or a change in control, please see “Employment, Severance, and Change in Control Agreements—Executive Severance and Change in Control Policy” above.
| Name | | Change in Control (1)(2) ($) | | | Involuntary Termination Other than During Change in Control Period (2)(3) ($) | | | Involuntary Termination During Change in Control Period (2)(3) ($) | |
| Raul Vazquez | | | | | | | | | |
Salary Severance(4) | | | | | | 1,050,000 | | | | 1,050,000 | |
Bonus Severance(4) | | | | | | — | | | | 1,050,000 | |
| Continuation of Health Insurance Benefits | | | | | | 27,081 | | | | 27,081 | |
| Accelerated Vesting of Equity Awards | | | 689,572 | | | | 676,696 | | | | 2,253,239 | |
| Total | | | 689,572 | | | | 1,753,777 | | | | 4,380,320 | |
Kathleen Layton | | | | | | | | | | | | |
| Salary Severance | | | — | | | | 375,000 | | | | 375,000 | |
| Bonus Severance | | | — | | | | — | | | | 113,625 | |
| Continuation of Health Insurance Benefits | | | — | | | | — | | | | — | |
| Accelerated Vesting of Equity Awards | | | — | | | | — | | | | 260,899 | |
| Total | | | — | | | | 375,000 | | | | 749,524 | |
| Patrick Kirscht | | | | | | | | | | | | |
| Salary Severance | | | — | | | | 473,508 | | | | 473,508 | |
| Bonus Severance | | | — | | | | — | | | | 307,780 | |
| Continuation of Health Insurance Benefits | | | — | | | | 23,248 | | | | 23,248 | |
| Accelerated Vesting of Equity Awards | | | 192,215 | | | | — | | | | 760,452 | |
| Total | | | 192,215 | | | | 496,756 | | | | 1,564,988 | |
| (1) | The values listed in this column for “Equity Awards” reflect the estimated value of the PSUs granted to the applicable NEO that would become eligible PSUs (that is, eligible to vest on March 10, 2026, subject to the NEO continuing to provide service following the change in control through that date) if a change in control occurred on December 29, 2023 (which was during the PSU award’s three-year performance period covering calendar years 2023 through 2025). This estimated value was calculated by multiplying the number of eligible PSUs by the closing price for a share of our common stock on December 29, 2023 (the last business day of our 2023 fiscal year), which was $3.91. The number of eligible PSUs is assumed to be the target number of PSUs since the number of PSUs that would become eligible PSUs based on our TSR performance during the abbreviated performance period was less than the target number of PSUs. |
| (2) | Based on salary and target bonus amounts as of December 29, 2023. |
| (3) | The values listed in this column for “Equity Awards” reflect the estimated value of accelerated vesting of the applicable NEO’s equity awards, which was calculated by multiplying the number of shares underlying the NEO’s unvested option, RSU awards or PSU awards that would be accelerated by the closing price for a share of our common stock on December 29, 2023 (the last business day of our 2023 fiscal year), which was $3.91, minus the aggregate exercise price attributable to the accelerated shares in the case of a stock option. No value has been included for stock options that have a per share exercise price at or above $3.91. For the PSU awards granted to Messrs. Vazquez and Kirscht in 2023, the number of PSUs accelerated is assumed to be the target number of PSUs since the number of PSUs that would become eligible PSUs based on our TSR performance during the abbreviated performance period was less than the target number of PSUs. |
| (4) | In connection with Mr. Vazquez’ voluntary reduction in salary, the compensation and leadership committee agreed that with respect to the executive severance and change in control policy, any severance benefits received will be determined using the annual base salary in effect immediately before the reduction. |
Report of the Compensation and Leadership Committee
The compensation and leadership committee has reviewed and discussed the “Executive Compensation” section with management. Based on this review and discussion, the compensation and leadership committee has recommended to the Board that the “Executive Compensation” section be included in our Annual Report on Form 10-K/A for the fiscal year ended December 31, 2018 included in the final prospectus2023 and our proxy statement for our initial public offering, dated September 25, 2019 and filed with2024 annual meeting of stockholders.
Respectfully submitted by the Securities and Exchange Commission pursuant to Rule 424(b)(4) under the Securities Act of 1933, as amended, or the Securities Act, on September 27, 2019, or our Prospectus. Somemembers of the information contained in this discussioncompensation and analysis, including information with respect to our plans and strategy for our business, includes forward-looking statements that involve risks and uncertainties. You should reviewleadership committee of the “Risk Factors” section of this report for a discussion of important factors that could cause actual results to differ materially from the results described in or implied by the forward-looking statements contained in the following discussion and analysis.Board:
OverviewMohit Daswani
Ginny Lee
Louis P. Miramontes
Scott Parker
We are a high-growth, mission-driven provider of inclusive, affordable financial services powered by a deep, data-driven understanding of our customers and advanced proprietary technology. Our proprietary lending platform and application of machine learning to our unique alternative data set enable us to provide loans at a fraction of the price of other providers to customers who either do not have a credit history or credit score, known as credit invisibles, or who may have a limited credit history and are “mis-scored,” meaning that traditional credit scores do not properly reflect their credit worthiness. In our 14-year history, we have originated more than 3.7 million loans, representing over $8.4 billion of credit extended, to more than 1.7 million customers. A study commissioned by us and conducted by the Financial Health Network (formerly known as the Center for Financial Services Innovation) estimated that, as of December 31, 2019, our customers have saved more than $1.7 billion in aggregate interest and fees compared to alternative products available to them.
Our core offering is a simple-to-understand, affordable, unsecured, fully amortizing personal installment loan with fixed payments and fixed interest rates throughout the life of the loan. Our personal loans do not have prepayment penalties or balloon payments and range in size from $300 to $10,000 with terms ranging from six to 48 months. As part of our commitment to be a responsible lender, we verify income for 100% of our personal loan customers and only make loans to customers that our ability-to-pay model indicates should be able to afford a loan after meeting their other debts and regular living expenses. We execute our sales and marketing strategy through a variety of acquisition channels including our retail locations, direct mail, broadcast and digital marketing, as well as other channels. We also benefit significantly from word-of-mouth referrals, nearly one-third of new customers in the last 12 months tell us they heard about Oportun from a friend or family member. Our omni-channel network provides our customers with flexibility to apply for a loan at one of over 335 retail locations, over the phone, or via mobile or online through our responsive web-designed origination solution.
As part of our strategy, we have begun to expand beyond our core offering of unsecured installment loans into other financial services that a significant portion of our customers already use and have asked us to provide, such as auto loans and credit cards. In April 2019, we began offering direct auto loans onlineReconciliation on a limited basis to customers in California. In November 2019, we began offering an auto refinance product enabling customers to refinance an existing secured auto loan or to consolidate an existing secured auto loan with an unsecured Oportun loan. Currently, our auto loans range from $5,000 to $35,000 with terms from 24 to 72 months. In December 2019, we launched the Oportun® Visa® Credit Card, issued by WebBank, Member FDIC as a pilot to a limited number of potential customers.
To fund our growth at a low and efficient cost, we have built a diversified and well-established capital markets funding program, which allows us to partially hedge our exposure to rising interest rates by locking in our interest expense for up to three years. Over the past six years, we have executed 14 bond offerings in the asset-backed securities market, the last 11 of which include tranches that have been rated investment grade. We issued two- and three-year fixed rate bonds which have provided us committed capital to fund future loan originations at a fixed Cost of Debt. In addition to our whole loan sale program, we also have a committed three-year, $400.0 million secured line of credit, which also helps to fund our loan portfolio growth.
In order to achieve our profit goals, we closely manage our operating expenses, which consist of technology and facilities, sales and marketing, personnel, outsourcing and professional fees and general, administrative and other expenses, with the goal of increasing our investment in our technology platform and development of new capabilities.
We have elected the fair value option to account for all loans receivable held for investment that were originated on or after January 1, 2018, or the Fair Value Loans, and for all asset-backed notes issued on or after January 1, 2018, or the Fair Value Notes, as compared to the loans held for investment that were originated prior to January 1, 2018, or the Loans Receivable at Amortized Cost. We believe the fair value option enables us to report GAAP net income that more closely approximates our net cash flow generation and provides increased transparency into our profitability and asset quality. Loans Receivable at Amortized Cost and asset-backed notes issued prior to January 1, 2018 are accounted for in our 2018 and subsequent financial statements at amortized cost, net of reserves. Loans that we designate for sale are accounted for as held for sale and recorded at the lower of cost or fair value until the loans receivable are sold. We estimate the fair value of the Fair Value Loans using a discounted cash flow model, which considers various factors such as the price that we could sell our loans to a third party in a non-public market, credit risk, net charge-offs, customer payment rates and market conditions such as interest rates. We estimate the fair value of our Fair Value Notes based upon the prices at which our or similar asset-backed notes trade. We reevaluate the fair value of our Fair Value Loans and our Fair Value Notes at the close of each measurement period.
Key Financial and Operating Metrics
We monitor and evaluate the following key metrics in order to measure our current performance, develop and refine our growth strategies, and make strategic decisions.
For a presentation of the actual impact of the election of the fair value option for the periods presented in the financial statements included elsewhere in this report, please see the next section, "Non-GAAP Financial Measures". The Fair Value Pro Forma information is presented in that section because it is non-GAAP presentation.
The following table and related discussion set forth key financial and operating metrics for the Company's operations as of and for the years ended December 31, 2019 and 2018. For similar financial and operating metrics and discussion of the Company’s 2018 results compared to its 2017 results, refer to Item 7, “Management’s Discussion and Analysis of Financial Condition and Results of Operations” under Part I of the Company’s registration statement on Form S-1 (File No. 333-232685), which was declared effective by the SEC on September 25, 2019.
|
| | | | | | | | |
| | | As of or for the Year Ended December 31, |
| (in thousands of dollars, except CAC) | | 2019 | | 2018 |
Aggregate Originations (1) | | $ | 2,051,836 |
| | $ | 1,759,908 |
|
Number of Loans Originated (1) | | 726,964 |
| | 644,551 |
|
Active Customers (1) | | 793,254 |
| | 695,697 |
|
Customer Acquisition Cost (1) | | $ | 134 |
| | $ | 120 |
|
Owned Principal Balance at End of Period (1) | | $ | 1,842,928 |
| | $ | 1,501,284 |
|
Managed Principal Balance at End of Period (1) | | $ | 2,198,950 |
| | $ | 1,785,143 |
|
Average Daily Principal Balance (1) | | $ | 1,624,347 |
| | $ | 1,282,333 |
|
Charge-offs, Net of Recoveries (1) | | $ | 134,804 |
| | $ | 94,384 |
|
30+ Day Delinquent Principal Balance at End of Period (1) | | $ | 73,882 |
| | $ | 59,467 |
|
30+ Day Delinquency Rate (1) | | 4.0 | % | | 4.0 | % |
Annualized Net Charge-Off Rate (1) | | 8.3 | % | | 7.4 | % |
| Operating Efficiency | | 60.4 | % | | 57.7 | % |
| Adjusted Operating Efficiency | | 57.2 | % | | 57.8 | % |
| Return on Equity | | 14.7 | % | | 43.8 | % |
| Adjusted Return on Equity | | 14.9 | % | | 13.2 | % |
(1) Credit card amounts have been excluded from these metrics for the year ended December 31, 2019 because they are de minimis.
See “Glossary” at the beginning of this report for formulas and definitions of our key performance metrics.
Aggregate Originations
Aggregate Originations increased to $2.1 billion for the year ended December 31, 2019 from $1.8 billion for the year ended December 31, 2018, representing a 16.6% increase. The increase is primarily driven by the continued investment in marketing, increase in the average loan size, strategic growth in new retail locations, the increase in originations through our mobile platform, and a continued high percentage of returning customers who generally qualify for larger loan amounts. We originated 726,964 and 644,551 loans for the year ended December 31, 2019 and 2018, respectively, representing a 12.8% increase.
Active Customers
As of December 31, 2019, Active Customers increased by 14.0% from December 31, 2018 due to our strategic marketing initiatives, which continue to attract new customers and retain existing customers, the expansion of our retail footprint and the enhancement of our mobile capabilities.
Customer Acquisition Cost
For the year ended December 31, 2019 and 2018, our Customer Acquisition Cost was $134 and $120 respectively, an increase of 11.7%. The increase is primarily due to an increase in our retail and telesales staff and investment in testing new marketing channels like digital advertising and lead aggregators, as well as the expansion of our direct mail program. As we continue to optimize customer lifetime value, we project that our Customer Acquisition Cost may continue to increase.
Managed Principal Balance at End of Period
Managed Principal Balance at End of Period as of December 31, 2019 increased by 23.2% from December 31, 2018 driven by the increase in Aggregate Originations.
Average Daily Principal Balance
Average Daily Principal Balance increased by 26.7% from $1.3 billion for the year ended December 31, 2018 to $1.6 billion for the year ended December 31, 2019. This increase reflects an increase in the number of loans originated, which has grown 12.8% from the year ended December 31, 2018 to the same period in 2019, as well as an increase in average loan size.
30+ Day Delinquency Rate
Our 30+ Day Delinquency Rate was 4.0% as of December 31, 2019 and 2018, respectively due to our ability to successfully manage credit performance. Delinquency rates converged to the prior year level as credit performance strengthened.
Annualized Net Charge-Off Rate
Annualized Net Charge-Off Rate for the years ended December 31, 2019 and 2018 was 8.3% and 7.4%, respectively. Net charge-offs for the year increased due to relative receivables growth and delays in the receipt of tax refunds due to the government shutdown earlier in 2019.
Operating Efficiency and Adjusted Operating Efficiency
For the year ended December 31, 2019 and 2018, Operating Efficiency was 60.4%, and 57.7%, respectively and Adjusted Operating Efficiency was 57.2% and 57.8%, respectively. The increase in Operating Efficiency is a result of operating expenses growing slightly faster than total revenue. The increase in operating expenses is driven by $14.3 million in investments in new products, as well as additional investments in technology, engineering, data science and public company readiness. Adjusted Operating Efficiency improved due to strong expense discipline compared to revenue and prudent capital allocation in order to permit the investments previously described. For a reconciliation of Operating Efficiency to Adjusted Operating Efficiency, see “Non-GAAP Financial Measures—Fair Value Pro Forma.”
Return on Equity and Adjusted Return on Equity
For the year ended December 31, 2019 and 2018, Return on Equity was 14.7% and 43.8%, respectively, and Adjusted Return on Equity was 14.9% and 13.2%, respectively. The decrease in Return on Equity is primarily due to the one-time impact related to the adoption of fair value accounting in 2018. The increase in Adjusted Return on Equity is due to improved Operating Efficiency and increased Net Revenue on a Fair Value Pro Forma basis, year over year. For a reconciliation of Return on Equity to Adjusted Return on Equity, see “Non–GAAP Financial Measures—Fair Value Pro Forma.”
Historical Credit Performance
In addition to monitoring our loss and delinquency performance on an owned portfolio basis, we also monitor the performance of our loans by the period in which the loan was disbursed, generally years or quarters, which we refer to as a vintage. We calculate net lifetime loan loss rate by vintage as a percentage of original principal balance. Net lifetime loan loss rates equal the net lifetime loan losses for a given year through December 31, 2019 divided by the total origination loan volume for that year. Loans are charged off no later than after becoming 120 days contractually delinquent.
The below table shows our net lifetime loan loss rate for each annual vintage since we began lending in 2006. We have managed to stabilize cumulative net lifetime loan losses since the financial crisis that started in 2008. Our proprietary, centralized credit scoring model and continually evolving data analytics have enabled us to maintain consistent net lifetime loan loss rates ranging between 5.5% and 8.1% since 2009. We even achieved a net lifetime loan loss rate of 5.5% during the peak of the recession in 2009. The evolution of our credit models has allowed us to increase our average loan size and commensurately extend our average loan terms. Cumulative net lifetime loan losses for the 2015, 2016, 2017, and 2018 vintages increased partially due to the delay in tax refunds in 2017 and 2019, the impact of natural disasters such as Hurricane Harvey, and the longer duration of the loans. The chart below includes all personal loan originations by vintage, excluding loans originated under the Access Loan Program.
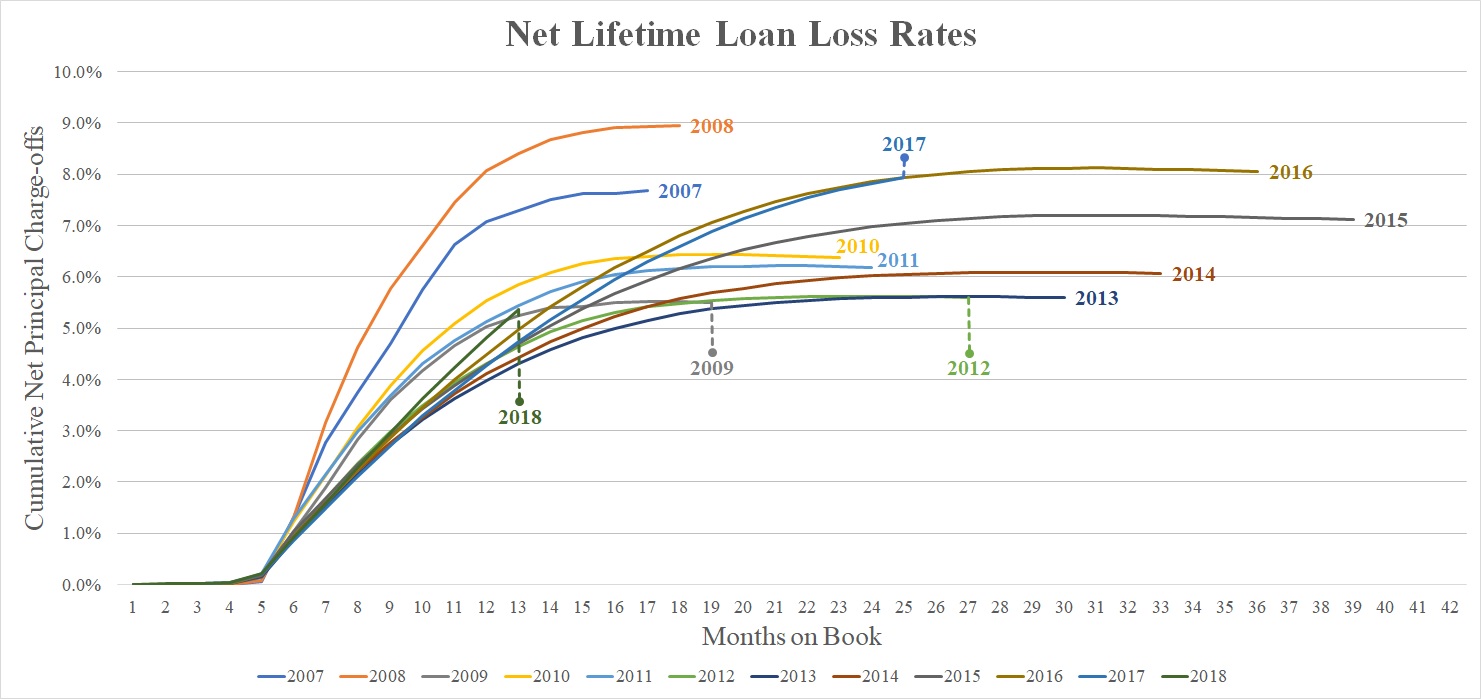
|
| | | | | | | | | | | | | | | | | | | | | | | | | | | | | | | | | | | | |
| | | Year of Origination |
| | | 2007 | | 2008 | | 2009 | | 2010 | | 2011 | | 2012 | | 2013 | | 2014 | | 2015 | | 2016 | | 2017 | | 2018 |
| Net lifetime loan losses as of December 31, 2019 as a percentage of original principal balance | | 7.7 | % | | 8.9 | % | | 5.5 | % | | 6.4 | % | | 6.2 | % | | 5.6 | % | | 5.6 | % | | 6.1 | % | | 7.1 | % | | 8.1 | %* | | 7.9 | %* | | 5.4 | %* |
| Outstanding principal balance as of December 31, 2019 as a percentage of original amount disbursed | | — | % | | — | % | | — | % | | — | % | | — | % | | — | % | | — | % | | — | % | | — | % | | 0.3 | % | | 6.7 | % | | 47.4 | % |
| Dollar weighted average original term for vintage in months | | 9.3 |
| | 9.9 |
| | 10.2 |
| | 11.7 |
| | 12.3 |
| | 14.5 |
| | 16.4 |
| | 19.1 |
| | 22.3 |
| | 24.2 |
| | 26.3 |
| | 29.0 |
|
* Vintage is not yet fully mature from a loss perspective.
Results of Operations
The following tables and related discussion set forth our Consolidated Statements of Operations for the years ended December 31, 2019 and 2018. For similar operating and financial data and discussion of the Company’s 2018 results compared to its 2017 results, refer to Item 7, “Management's Discussion and Analysis of Financial Condition and Results of Operations” under Part I of the Company’s registration statement on Form S-1 (File No. 333-232685), which was declared effective by the SEC on September 25, 2019.
|
| | | | | | | | |
| | | Years Ended December 31, |
| (in thousands of dollars) | | 2019 | | 2018 |
| Revenue | | | | |
| Interest income | | $ | 544,126 |
| | $ | 448,777 |
|
| Non-interest income | | 56,022 |
| | 48,802 |
|
| Total revenue | | 600,148 |
|
| 497,579 |
|
| Less: | | | | |
| Interest expense | | 60,546 |
| | 46,919 |
|
| Provision (release) for loan losses | | (4,483 | ) | | 16,147 |
|
| Total net increase (decrease) in fair value | | (97,237 | ) | | 22,899 |
|
| Net revenue | | 446,848 |
|
| 457,412 |
|
| Operating expenses: | | | | |
| Technology and facilities | | 101,981 |
| | 82,848 |
|
| Sales and marketing | | 97,153 |
| | 77,617 |
|
| Personnel | | 90,647 |
| | 63,291 |
|
| Outsourcing and professional fees | | 57,243 |
| | 52,733 |
|
| General, administrative and other | | 15,392 |
| | 10,828 |
|
| Total operating expenses | | 362,416 |
| | 287,317 |
|
| Income before taxes | | 84,432 |
| | 170,095 |
|
| Income tax expense | | 22,834 |
| | 46,701 |
|
| Net income | | $ | 61,598 |
|
| $ | 123,394 |
|
Total revenue
|
| | | | | | | | | | | | | | | |
| | | Year Ended December 31, | | 2019 vs. 2018 Change |
| (in thousands of dollars) | | 2019 | | 2018 | | $ | | % |
| Revenue | | | | | | | | |
| Interest income | | $ | 544,126 |
| | $ | 448,777 |
| | $ | 95,349 |
| | 21.2 | % |
| Non-interest income | | 56,022 |
| | 48,802 |
| | 7,220 |
| | 14.8 | % |
| Total revenue | | $ | 600,148 |
|
| $ | 497,579 |
| | $ | 102,569 |
| | 20.6 | % |
| Percentage of total revenue: | | | | | | | | |
| Interest income | | 90.7 | % | | 90.2 | % | | | | |
| Non-interest income | | 9.3 | % | | 9.8 | % | | | | |
| Total revenue | | 100.0 | % |
| 100.0 | % | | | | |
Total Revenue. Total revenue increased by $102.6 million, or 20.6%, from $497.6 million for 2018 to $600.1 million for 2019.
Interest income. Total interest income increased by $95.3 million, or 21.2%, from $448.8 million for 2018 to $544.1 million for 2019. The increase is primarily attributable to growth in our Average Daily Principal Balance, which grew from $1.3 billion for 2018 to $1.6 billion for 2019, an increase of 26.7%. This is partially offset by $8.5 million accretion of deferred origination fees related to the election of fair value accounting in 2018 and a decline in portfolio yield.
Non-interest income. Total non-interest income increased by $7.2 million, or 14.8%, from $48.8 million for 2018 to $56.0 million for 2019. The increase is primarily due to a $3.6 million increase in servicing revenue from loans sold to Ellington and a $3.1 million increase in gain on sale of loans.
See Note 2, Summary of Significant Accounting Policies, and Note 12, Revenue, of the Notes to the Consolidated Financial Statements included elsewhere in this report for further discussion on the Company's interest income, non-interest income and revenue.
Interest expense
|
| | | | | | | | | | | | | | | |
| | | Year Ended December 31, | | 2019 vs. 2018 Change |
| (in thousands of dollars) | | 2019 | | 2018 | | $ | | % |
| Interest expense | | $ | 60,546 |
| | $ | 46,919 |
| | $ | 13,627 |
| | 29.0 | % |
| Percentage of total revenue | | 10.1 | % | | 9.4 | % | | | | |
| Cost of Debt | | 4.4 | % | | 4.4 | % | | | | |
| Leverage as a percentage of Average Daily Principal Balance | | 85.5 | % | | 83.5 | % | | | | |
Interest expense. Interest expense increased by $13.6 million, or 29.0%, from $46.9 million for 2018 to $60.5 million for 2019. We financed approximately 85.5% of our loans receivable through debt for 2019 as compared to 83.5% for 2018, and our Average Daily Debt Balance increased from $1.1 billion to $1.4 billion for 2019, an increase of 30.3%. While interest expense has increased in aggregate as we have grown our loans receivable, we have maintained a stable Cost of Debt as we have become a more established issuer and have been able to refinance and increase the size of our securitizations.
See Note 2, Summary of Significant Accounting Policies, and Note 8, Borrowings, in the Notes to the Consolidated Financial Statements included in this report for further information on the Company's Interest expense and the Company's secured financing facility and asset-backed notes.
Provision (release) for loan losses
Provision (release) for loan losses represents a provision to maintain an allowance for loan losses adequate to provide for losses over the next 12 months for our Loans Receivable at Amortized Cost. Our allowance for loan losses represents our estimate of the credit losses inherent in our loans and is based on a variety of factors, including current economic conditions, our historical loan loss experience, recent trends in delinquencies and loan seasoning. There is no provision for loan losses for the Fair Value Loans because lifetime loan losses are incorporated in the measurement of fair value for loans receivable. We expect the provision for loan losses for Loans Receivable at Amortized Cost will decrease as these loans run off, assuming losses remain constant.
|
| | | | | | | | | | | | | | | |
| | | Year Ended December 31, | | 2019 vs. 2018 Change |
| (in thousands of dollars) | | 2019 | | 2018 | | $ | | % |
| Charge-offs, net of recoveries on loans receivable at amortized cost | | $ | 17,871 |
| | $ | 71,398 |
| | $ | (53,527 | ) | | (75.0 | )% |
| Excess provision on loans receivable at amortized cost | | (22,354 | ) | | (55,251 | ) | | 32,897 |
| | (59.5 | )% |
| Provision (release) for loan losses | | $ | (4,483 | ) | | $ | 16,147 |
| | $ | (20,630 | ) | | (127.8 | )% |
| Allowance for loan losses rate on amortized cost portfolio | | 9.45 | % | | 8.13 | % | | | | |
| Percentage of total revenue: | | (0.7 | )% | | 3.2 | % | | | | |
Provision (release) for loan losses. Provision (release) for loan losses decreased by $20.6 million, or 127.8%, from $16.1 million for 2018 to $(4.5) million for 2019, mainly due to the partial liquidation of the amortized cost portfolio. The amortized cost portfolio balance at the end of 2019 is $42.5 million compared to $323.8 million at the end of 2018.
Total net increase (decrease) in fair value
Net increase (decrease) in fair value reflects changes in fair value of Fair Value Loans and Fair Value Notes on an aggregate basis and is based on a number of factors, including benchmark interest rates, credit spreads, remaining cumulative charge-offs and customer payment rates. Increases in the fair value of loans increase Net Revenue. Conversely, decreases in the fair value of loans decrease Net Revenue. Increases in the fair value of asset-backed notes result in a decrease of Net Revenue. Decreases in the fair value of asset-backed notes increase Net Revenue.
|
| | | | | | | | | | | | | | | |
| | | Year Ended December 31, | | 2019 vs. 2018 Change |
| (in thousands of dollars) | | 2019 | | 2018 | | $ | | % |
| Fair value mark-to-market adjustment: | | | | | | | | |
| Fair value mark-to-market adjustment on fair value loans | | $ | 31,670 |
| | $ | 49,998 |
| | $ | (18,328 | ) | | (36.7 | )% |
| Fair value mark-to-market adjustment on asset-backed notes | | (11,974 | ) | | (4,113 | ) | | (7,861 | ) | | * |
|
| Total fair value mark-to-market adjustment | | 19,696 |
| | 45,885 |
| | (26,189 | ) | | * |
|
| Charge-offs, net of recoveries on loans receivable at fair value | | (116,933 | ) | | (22,986 | ) | | (93,947 | ) | | * |
|
| Total net increase (decrease) in fair value | | $ | (97,237 | ) | | $ | 22,899 |
| | $ | (120,136 | ) | | * |
|
| Percentage of total revenue: | | | | | | | | |
| Fair value mark-to-market adjustment | | 3.3 | % | | 9.2 | % | | | | |
| Charge-offs, net of recoveries on loans receivable at fair value | | (19.5 | )% | | (4.6 | ) | | | | |
| Total net increase (decrease) in fair value | | (16.2 | )% | | 4.6 | % | | | | |
| Discount rate | | 7.77 | % | | 9.20 | % | | | | |
| Remaining cumulative charge-offs | | 9.61 | % | | 10.52 | % | | | | |
| Average life in years | | 0.81 |
| | 0.85 |
| | | | |
* Not meaningful.
Net increase (decrease) in fair value.Net decrease in fair value for 2019 was $97.2 million. This amount represents a total fair value mark-to-market increase of $19.7 million offset by $116.9 million of charge-offs, net of recoveries on Fair Value Loans. The total fair value mark-to-market adjustment consists of a $31.7 million mark-to-market adjustment on Fair Value Loans due to (a) a decrease in the discount rate from 9.20% as of December 31, 2018 to 7.77% as of December 31, 2019 caused by declining interest rates and credit spreads, (b) a decrease in remaining cumulative charge-offs from 10.52% as of December 31, 2018 to 9.61% as of December 31, 2019, and offset by (c) a decline in average life from 0.85 years as of December 31, 2018 to 0.81 years as of December 31, 2019 due to further seasoning of the Fair Value Loan portfolio. The $(12.0) million mark-to-market adjustment on Fair Value Notes is due to a decrease in interest rates.
Charge-offs, net of recoveries
|
| | | | | | | | | | | | | | | |
| | | Year Ended December 31, | | 2019 vs. 2018 Change |
| (in thousands of dollars) | | 2019 | | 2018 | | $ | | % |
| Charge-offs, net of recoveries on loans receivable at amortized cost | | $ | 17,871 |
| | $ | 71,398 |
| | $ | (53,527 | ) | | (75.0 | )% |
| Charge-offs, net of recoveries on loans receivable at fair value | | 116,933 |
| | 22,986 |
| | 93,947 |
| | * |
|
| Total charge-offs, net of recoveries | | $ | 134,804 |
| | $ | 94,384 |
| | $ | 40,420 |
| | 42.8 | % |
| Average Daily Principal Balance | | 1,624,347 |
| | 1,282,333 |
| | 342,014 |
|
| 26.7 | % |
| Annualized Net Charge-Off Rate | | 8.3 | % | | 7.4 | % | | | | |
* Not meaningful
Charge-offs, net of recoveries. We optimized growth while maintaining an annualized net charge-off rate of 8.3% for the year ended December 31, 2019. We believe this experience indicates the strength of our proprietary credit scoring technology as well as the efficacy and scalability of our business model.
Operating expenses
Operating expenses consist of technology and facilities, sales and marketing, personnel, outsourcing and professional fees and general, administrative and other expenses. For Fair Value Loans, we no longer capitalize direct loan origination expenses, instead expensing them in operating expenses as incurred. For Fair Value Notes, we no longer capitalize financing expenses, instead including them within operating expenses as incurred.
Technology and facilities
Technology and facilities expenses are the largest component of our operating expenses, representing the costs required to build our omni-channel network, and consist of three components. The first component is comprised of costs associated with our technology, engineering, information security, cybersecurity, platform development, maintenance, and end user services, including fees for software licenses, consulting, legal and other services as a result of our efforts to grow our business, as well as personnel expenses. The second includes rent for retail and corporate locations, utilities, insurance,
telephony costs, property taxes, equipment rental expenses, licenses and fees and depreciation and amortization. Lastly, this category also includes all software licenses, subscriptions, and technology service costs to support our corporate operations, excluding sales and marketing.
|
| | | | | | | | | | | | | | | |
| | | Year Ended December 31, | | 2019 vs. 2018 Change |
| (in thousands of dollars) | | 2019 | | 2018 | | $ | | % |
| Technology and facilities | | $ | 101,981 |
| | $ | 82,848 |
| | $ | 19,133 |
| | 23.1 | % |
| Percentage of total revenue | | 17.0 | % | | 16.7 | % | | | | |
Technology and facilities. Technology and facilities expense increased by $19.1 million, or 23.1%, from $82.8 million for 2018 to $102.0 million for 2019. As we have continued to build our omni-channel network, we have increased the number of retail locations from 312 at December 31, 2018 to 337 at December 31, 2019, an increase of 8.0%, and our headcount has grown 7.6% during the same period. We also had a $4.7 million increase in service costs related to higher usage of software and cloud services, $3.0 million increase in professional services and other related costs due to growth in staffing at our India technology service center and $2.4 million increase related to new products and services.
Sales and marketing
Sales and marketing expenses consist of two components and represents the costs to acquire our customers. The first component is comprised of the expense to acquire a customer through various paid marketing channels including direct mail, radio, television, digital marketing and brand marketing. The second component is the costs associated with our telesales, lead generation and retail operations, including personnel expenses, but excluding costs associated with retail locations. For Fair Value Loans, sales and marketing-related direct origination expenses are expensed when incurred.
|
| | | | | | | | | | | | | | | |
| | | Year Ended December 31, | | 2019 vs. 2018 Change |
| (in thousands of dollars, except CAC) | | 2019 | | 2018 | | $ | | % |
| Sales and marketing | | $ | 97,153 |
| | $ | 77,617 |
| | $ | 19,536 |
| | 25.2 | % |
| Percentage of total revenue | | 16.2 | % | | 15.6 | % | | | | |
| Customer Acquisition Cost (CAC) | | $ | 134 |
| | $ | 120 |
| | $ | 14 |
| | 11.7 | % |
Sales and marketing. Sales and marketing expenses to acquire our customers increased by $19.5 million, or 25.2%, from $77.6 million for 2018 to $97.2 million for 2019. As we expanded our omni-channel network, we added headcount to our retail locations and telesales, leading to increased personnel-related and outsourced service costs of $10.0 million. To grow our loan originations, we increased our investment in marketing initiatives by $11.0 million across various marketing channels, including direct mail, digital advertising channels, lead aggregators, brand marketing and $1.8 million investment in new products and services. This was partially offset by a decline in dues and subscription expenses of $1.9 million. As a result of our increased marketing investment, our CAC has increased by 11.7% from 2018 to 2019.
Personnel
Personnel expenses represent compensation and benefits that we provide to our employees, and include salaries, wages, bonuses, commissions, related employer taxes, medical and other benefits provided and stock-based compensation expense for all of our staff with the exception of our telesales, lead generation, retail operations and technology which are included in sales and marketing expenses and technology and facilities, respectively.
|
| | | | | | | | | | | | | | | |
| | | Year Ended December 31, | | 2019 vs. 2018 Change |
| (in thousands of dollars) | | 2019 | | 2018 | | $ | | % |
| Personnel | | $ | 90,647 |
| | $ | 63,291 |
| | $ | 27,356 |
| | 43.2 | % |
| Percentage of total revenue | | 15.1 | % | | 12.7 | % | | | | |
Personnel. Personnel expense increased by $27.4 million, or 43.2%, from $63.3 million for 2018 to $90.6 million for 2019, primarily driven by a 13.7% increase in corporate employee headcount associated with preparing to become a public company, $7.2 million due to increased stock compensation triggered by the successful completion of the IPO and $5.1 million increased investment related to new products and services.
Outsourcing and professional fees
Outsourcing and professional fees consist of costs for various third-party service providers and contact center operations, primarily for the sales, customer service, collections and store operation functions. Our contact centers located in Mexico and our third-party contact centers located in Colombia and Jamaica provide support for the business including application processing, verification, customer service and collections. We utilize third parties to operate the contact centers in Colombia and Jamaica and include the costs in outsourcing and other professional fees. Professional fees also include the cost of legal and audit services, credit reports, recruiting, cash transportation, collection services and fees and consultant expenses. For Fair Value Loans, direct loan origination expenses related to application processing are expensed when incurred. In addition, outsourcing and professional fees include any financing expenses, including legal and underwriting fees, related to our Fair Value Notes.
|
| | | | | | | | | | | | | | | |
| | | Year Ended December 31, | | 2019 vs. 2018 Change |
| (in thousands of dollars) | | 2019 | | 2018 | | $ | | % |
| Outsourcing and professional fees | | $ | 57,243 |
| | $ | 52,733 |
| | $ | 4,510 |
| | 8.6 | % |
| Percentage of total revenue | | 9.5 | % | | 10.6 | % | | | | |
Outsourcing and professional fees. Outsourcing and professional fees increased by $4.5 million, or 8.6%, from $52.7 million for 2018 to $57.2 million for 2019. The increase resulted primarily from an increased use of professional services of $4.5 million to support public company readiness, a $2.9 million increase in spending on risk analytics, outsourcing costs of $2.5 million in part to increase our usage of offshore service centers, an increase in legal costs of $2.0 million and $1.4 million of expenses related to new products and services. These increases were partially offset by a $6.1 million decrease in debt financing fees as we executed four offerings of asset-backed notes in 2018 compared to one offering of asset-backed notes in 2019.
General, administrative and other
General, administrative and other expenses include non-compensation expenses for employees, who are not a part of the technology and sales and marketing organization, which include travel, lodging, meal expenses, office supplies, printing and shipping. Also included are franchise taxes, bank fees, foreign currency gains and losses, transaction gains and losses, debit card expenses and litigation reserve.
|
| | | | | | | | | | | | | | | |
| | | Year Ended December 31, | | 2019 vs. 2018 Change |
| (in thousands of dollars) | | 2019 | | 2018 | | $ | | % |
| General, administrative and other | | $ | 15,392 |
| | $ | 10,828 |
| | $ | 4,564 |
| | 42.1 | % |
| Percentage of total revenue | | 2.6 | % | | 2.2 | % | | | | |
General, administrative and other. General, administrative and other expense increased by $4.6 million, or 42.1%, from $10.8 million for 2018 to $15.4 million for 2019, primarily due to increases in travel expenses, postage and shipping expenses, and other general and administrative expenses due to new products and services and continuing growth of the business.
Income taxes
Income taxes consist of U.S. federal, state and foreign income taxes, if any. For the years ended December 31, 2019 and 2018 we recognized tax expense attributable to U.S. federal, state and Mexico income taxes.
|
| | | | | | | | | | | | | | | |
| | | Year Ended December 31, | | 2019 vs. 2018 Change |
| (in thousands of dollars) | | 2019 | | 2018 | | $ | | % |
| Income tax expense | | $ | 22,834 |
| | $ | 46,701 |
| | $ | (23,867 | ) | | (51.1 | )% |
| Percentage of total revenue | | 3.8 | % | | 9.4 | % | | | | |
| Effective tax rate | | 27.0 | % | | 27.5 | % | | | | |
Income tax expense. Income tax expense decreased by $23.9 million or 51.1%, from $46.7 million for 2018 to $22.8 million for 2019, primarily as a result of higher pretax income for 2018 due to the one-time impact of our election of the fair value option for Fair Value Loans and Fair Value Notes.
See Note 2, Summary of Significant Accounting Policies, and Note 13, Income Taxes, of the Notes to the Consolidated Financial Statements included elsewhere in this report for further discussion on the Company's income taxes.
Fair Value Estimate Methodology for Loans Receivable at Fair Value
Election of Fair Value Option
We have elected the fair value option to account for loans held for investment and asset-backed notes effective as of January 1, 2018. We believe the fair value option for loans held for investment and asset-backed notes is a better fit for us given our high growth, short duration, high quality assets and funding structure. As compared to the loans held for investment that were originated prior to January 1, 2018, or Loans Receivable at Amortized Cost, we believe the fair value option enables us to report GAAP net income that more closely approximates our net cash flow generation and provides increased transparency into our profitability and asset quality. Loans Receivable at Amortized Cost and asset-backed notes issued prior to January 1, 2018 are accounted for in our 2018 and 2019 financial statements at amortized cost, net. Upon adoption of ASU 2019-05, effective January 1, 2020, the Company will elect the fair value option on all remaining loans receivable currently recorded at amortized cost. Upon adoption of ASU 2019-05, the Company will (i) release the remaining allowance for loan losses on Loan Receivables at Amortized Cost; (ii) recognize the unamortized net originations fee income; and (iii) measure the remaining loans originated prior to January 1, 2018 at fair value. Loans that we designate for sale will continue to be accounted for as held for sale and recorded at the lower of cost or fair value until the loans are sold.
Summary
Fair value is an electable option under GAAP to account for any financial instruments, including loans receivable and debt. It differs from amortized cost accounting in that loans receivable and debt are recorded on the balance sheet at fair value rather than on a cost basis. Under the fair value option credit losses are recognized through income as they are incurred rather than through the establishment of an allowance and provision for losses. The fair value of instruments under this election is updated at the end of each reporting period, with changes since the prior reporting period reflected in the Consolidated Statements of Operations and Comprehensive Income as net increase (decrease) in fair value which impacts Net Revenue. Changes in interest rates, credit spreads, realized and projected credit losses and cash flow timing will lead to changes in fair value and therefore impact earnings. These changes in the fair value of the Fair Value Loans may be partially offset by changes in the fair value of the Fair Value Notes, depending upon the relative duration of the instruments.
Comparison of Fair Value and Amortized Cost Accounting
The primary differences between fair value and amortized cost accounting are:
Loans and notes are recorded at their fair value, not their principal balance or cost basis;
The fair value of the loans takes into consideration net charge-offs for the remaining life of the loans, thus no separate allowance for loan loss is required;
Upfront fees and expenses of loans and notes are no longer deferred but recognized at origination in income or expense, respectively;
Changes in the fair value of loans and notes impact Net Revenue; and
Net charge-offs are recognized as they occur as part of the change in fair value for loans.
Fair Value Estimate Methodology for Loans Receivable at Fair Value
We calculate the fair value of Fair Value Loans using a model that projects and discounts expected cash flows. The fair value is a function of:
Portfolio yield;
Average life;
Prepayments;
Remaining cumulative charge-offs; and
Discount rate.
Portfolio yield is the expected interest and fees collected from the loans as an annualized percentage of outstanding principal balance. Portfolio yield is based upon (a) the contractual interest rate, reduced by expected delinquencies and interest charge-offs and (b) late fees, net of late fee charge-offs based upon expected delinquencies. Origination fees are not included in portfolio yield since they are generally capitalized as part of the loan’s principal balance at origination.
Average life is the time-weighted average of expected principal payments divided by outstanding principal balance. The timing of principal payments is based upon the contractual amortization of loans, adjusted for the impact of prepayments, Good Customer Program refinances, and charge-offs.
Prepayments are the expected remaining cumulative principal payments that will be repaid earlier than contractually required over the life of the loan, divided by the outstanding principal balance.
Remaining cumulative charge-offs is the expected net principal charge-offs over the remaining life of the loans, divided by the outstanding principal balance.
Discount rate is the sum of the interest rate and the credit spread. The interest rate is based upon the interpolated LIBOR/swap curve rate that corresponds to the average life. The credit spread is based upon the credit spread implied by the whole loan purchase price at the time the flow sale agreement was entered into, updated for changes in credit spreads on our Fair Value Notes, which serve as a proxy for how a whole loan buyer would adjust their yield requirements relative to the originally agreed price.
It is also possible to estimate the fair value of our loans using a simplified calculation. The table below illustrates a simplified calculation to aid investors in understanding how fair value may be estimated using the last eight quarters:
Subtracting the servicing fee from the weighted average portfolio yield over the remaining life of the loans to calculate net portfolio yield;
Multiplying the net portfolio yield by the weighted average life in years of the loans receivable, which is based upon the contractual amortization of the loans and expected remaining prepayments and charge-offs to calculate net cash flow;
Subtracting the remaining cumulative charge-offs from the net portfolio yield to calculate the net cash flow;
Subtracting the product of the discount rate and the average life from the net cash flow to calculate the gross fair value premium as a percentage of loan principal balance; and
Subtracting the accrued interest and fees as a percentage of loan principal balance from the gross fair value premium as a percentage of loan principal balance to calculate the fair value premium as a percentage of loan principal balance.
The table below reflects the application of this methodology for the eight quarters since the election of the fair value option on January 1, 2018:
|
| | | | | | | | | | | | | | | | | | | | | | | | |
| | | Three Months Ended |
| | | Dec 31, 2019 | | Sep 30, 2019 | | Jun 30, 2019 | | Mar 31, 2019 | | Dec 31, 2018 | | Sep 30, 2018 | | Jun 30, 2018 | | Mar 31, 2018 |
| Weighted average portfolio yield over the remaining life of the loans | | 31.45 | % | | 32.08 | % | | 32.43 | % | | 32.59 | % | | 32.76 | % | | 32.84 | % | | 32.80 | % | | 32.55 | % |
| Less: Servicing fee | | (5.00 | )% | | (5.00 | )% | | (5.00 | )% | | (5.00 | )% | | (5.00 | )% | | (5.00 | )% | | (5.00 | )% | | (5.00 | )% |
| Net portfolio yield | | 26.45 | % | | 27.08 | % | | 27.43 | % | | 27.59 | % | | 27.76 | % | | 27.84 | % | | 27.80 | % | | 27.55 | % |
| Multiplied by: Weighted average life in years | | 0.814 |
| | 0.781 |
| | 0.792 |
| | 0.804 |
| | 0.850 |
| | 0.875 |
| | 0.924 |
| | 0.970 |
|
| Pre-loss cash flow | | 21.53 | % | | 21.13 | % | | 21.67 | % | | 22.07 | % | | 23.60 | % | | 24.50 | % | | 25.58 | % | | 26.72 | % |
| Less: Remaining cumulative charge-offs | | (9.61 | )% | | (9.87 | )% | | (10.05 | )% | | (10.00 | )% | | (10.52 | )% | | (11.23 | )% | | (9.48 | )% | | (8.77 | )% |
| Net cash flow | | 11.92 | % | | 11.26 | % | | 11.62 | % | | 12.07 | % | | 13.08 | % | | 13.27 | % | | 16.10 | % | | 17.95 | % |
| Less: Discount rate multiplied by average life | | (6.33 | )% | | (6.19 | )% | | (6.62 | )% | | (7.09 | )% | | (7.82 | )% | | (7.87 | )% | | (8.13 | )% | | (8.45 | )% |
| Gross fair value premium as a percentage of loan principal balance | | 5.59 | % | | 5.07 | % | | 5.00 | % | | 4.98 | % | | 5.26 | % | | 5.40 | % | | 7.97 | % | | 9.50 | % |
| Less: Accrued interest and fees as a percentage of loan principal balance | | (1.05 | )% | | (0.97 | )% | | (0.93 | )% | | (0.97 | )% | | (1.01 | )% | | (0.82 | )% | | (0.90 | )% | | (0.84 | )% |
| Fair value premium as a percentage of loan principal balance | | 4.54 | % | | 4.10 | % | | 4.07 | % | | 4.01 | % | | 4.25 | % | | 4.58 | % | | 7.07 | % | | 8.66 | % |
| Discount Rate | | 7.77 | % | | 7.93 | % | | 8.38 | % | | 8.86 | % | | 9.20 | % | | 8.94 | % | | 8.84 | % | | 8.71 | % |
The table below reflects the application of this methodology for eight quarters under Fair Value Pro Forma as if we had elected the fair value option since inception:
|
| | | | | | | | | | | | | | | | | | | | | | | | |
| | | Three Months Ended |
| | | Dec 31, 2019 | | Sep 30, 2019 | | Jun 30, 2019 | | Mar 31, 2019 | | Dec 31, 2018 | | Sep 30, 2018 | | Jun 30, 2018 | | Mar 31, 2018 |
| Weighted average portfolio yield over the remaining life of the loans | | 31.47 | % | | 31.89 | % | | 32.37 | % | | 32.45 | % | | 32.68 | % | | 32.74 | % | | 31.96 | % | | 30.78 | % |
| Less: Servicing fee | | (5.00 | )% | | (5.00 | )% | | (5.00 | )% | | (5.00 | )% | | (5.00 | )% | | (5.00 | )% | | (5.00 | )% | | (5.00 | )% |
| Net portfolio yield | | 26.47 | % | | 26.89 | % | | 27.37 | % | | 27.45 | % | | 27.68 | % | | 27.74 | % | | 26.96 | % | | 25.78 | % |
| Multiplied by: Weighted average life in years | | 0.804 |
| | 0.765 |
| | 0.764 |
| | 0.754 |
| | 0.762 |
| | 0.750 |
| | 0.785 |
| | 0.785 |
|
| Pre-loss cash flow | | 21.28 | % | | 20.71 | % | | 20.80 | % | | 20.59 | % | | 21.03 | % | | 20.81 | % | | 21.30 | % | | 20.11 | % |
| Less: Remaining cumulative charge-offs | | (9.51 | )% | | (9.83 | )% | | (9.94 | )% | | (9.83 | )% | | (10.18 | )% | | (11.00 | )% | | (9.47 | )% | | (8.95 | )% |
| Net cash flow | | 11.77 | % | | 10.88 | % | | 10.86 | % | | 10.76 | % | | 10.85 | % | | 9.81 | % | | 11.83 | % | | 11.16 | % |
| Less: Discount rate multiplied by average life | | (6.25 | )% | | (6.11 | )% | | (6.37 | )% | | (6.65 | )% | | (6.98 | )% | | (6.64 | )% | | (6.92 | )% | | (6.72 | )% |
| Gross fair value premium as a percentage of loan principal balance | | 5.52 | % | | 4.77 | % | | 4.49 | % | | 4.11 | % | | 3.87 | % | | 3.17 | % | | 4.91 | % | | 4.44 | % |
| Less: Accrued interest and fees as a percentage of loan principal balance | | (1.04 | )% | | (0.96 | )% | | (0.92 | )% | | (0.96 | )% | | (1.00 | )% | | (0.94 | )% | | (0.92 | )% | | (0.94 | )% |
| Fair value premium as a percentage of loan principal balance | | 4.48 | % | | 3.81 | % | | 3.57 | % | | 3.15 | % | | 2.87 | % | | 2.23 | % | | 3.99 | % | | 3.50 | % |
| Discount Rate | | 7.77 | % | | 7.93 | % | | 8.38 | % | | 8.86 | % | | 9.19 | % | | 8.85 | % | | 8.76 | % | | 8.61 | % |
The illustrative tables included above are designed to assist investors in understanding the impact of our election of the fair value option. For a presentation of the actual impact of the election of the fair value option for the periods presented in the financial statements included elsewhere in this report, please see the next section, “Non-GAAP Financial Measures.” The Fair Value Pro Forma information is presented in that section because they are non-GAAP presentations, as they show the impact of Fair Value Pro Forma adjustment for periods that before January 1, 2018.
Sensitivity to Key Drivers
Credit Performance Sensitivity
Increases in expected future charge-offs will decrease expected cash flow and decrease fair value of the loans. Conversely, decreases in expected future charge-offs will increase expected cash flow and increase fair value of the loans.
The following table presents estimates at December 31, 2019 under Fair Value Pro Forma as if we had elected the fair value option since inception:
|
| | | | | | | |
| Remaining Cumulative Charge-offs | | Projected percentage change in the fair value of our Fair Value Loans | | Projected change in net fair value recorded in earnings ($ in thousands) |
| 120% of expected | | (1.6 | )% | | $ | (29,838 | ) |
| 110% of expected | | (0.8 | )% | | (15,099 | ) |
| 100% of expected | | — | % | | — |
|
| 90% of expected | | 0.8 | % | | 15,288 |
|
| 80% of expected | | 1.6 | % | | 30,971 |
|
The following table presents estimates at December 31, 2018 under Fair Value Pro Forma as if we had elected the fair value option since inception:
|
| | | | | | | |
| Remaining Cumulative Charge-offs | | Projected percentage change in the fair value of our Fair Value Loans | | Projected change in net fair value recorded in earnings ($ in thousands) |
| 120% of expected | | (1.5 | )% | | $ | (22,163 | ) |
| 110% of expected | | (0.7 | )% | | (11,168 | ) |
| 100% of expected | | — | % | | — |
|
| 90% of expected | | 0.8 | % | | 11,345 |
|
| 80% of expected | | 1.5 | % | | 22,871 |
|
Interest Rate Sensitivity
Changes in benchmark interest rates are likely to impact the discount rate the market uses to value our loans and notes. Decreases in discount rate increase the fair value of the loans and notes and increases in the discount rate decrease the fair value of the loans and notes. The amount of change for the notes is greater because they have a longer average life (1.3 years on average) than the loans (0.80 years). Because an increase in the fair value of a liability is a net decrease in fair value, if the discount rate decreases for both the loans and notes then Net Revenue will be reduced; and if the discount rate increases for both, then Net Revenue will be increased.
Given the differences in average life between the loans and the debt, if the yield or spread curves experience a change in slope rather than vertical shift, then the fair value of the loans and notes will change independently. This occurred in, for example, the year ended December 31, 2018 when the yield curve inverted, and the discount rate increased for the Fair Value Loans and decreased for the Fair Value Notes. In the year ended December 31, 2019, the discount rate of the Fair Value Loans fell more than the discount rate for the Fair Value Notes. While the interest rate curve may twist, we believe credit spreads are more likely to shift vertically, albeit the magnitude of the shift for loans may be greater than debt since the debt cash flows are the senior portion of the loan cash flows.
The following table presents estimates at December 31, 2019 under Fair Value Pro Forma as if we had elected the fair value option since inception:
|
| | | | | | | | | | |
| Change in Interest Rates | | Projected percentage change in the fair value of our Fair Value Loans | | Projected percentage change in the fair value of our Fair Value Notes | | Projected change in net fair value recorded in earnings ($ in thousands) |
| -100 Basis Points | | 0.7 | % | | 1.5 | % | | $ | (8,661 | ) |
| -50 Basis Points | | 0.4 | % | | 0.8 | % | | (4,465 | ) |
| -25 Basis Points | | 0.2 | % | | 0.4 | % | | (2,390 | ) |
| Basis Interest Rate | | — | % | | — | % | | — |
|
| +25 Basis Points | | (0.2 | )% | | (0.3 | )% | | 1,719 |
|
| +50 Basis Points | | (0.4 | )% | | (0.7 | )% | | 3,752 |
|
| +100 Basis Points | | (0.7 | )% | | (1.4 | )% | | 7,776 |
|
The following table presents estimates at December 31, 2018 under Fair Value Pro Forma as if we had elected the fair value option since inception:
|
| | | | | | | | | | |
| Change in Interest Rates | | Projected percentage change in the fair value of our Fair Value Loans | | Projected percentage change in the fair value of our Fair Value Notes | | Projected change in net fair value recorded in earnings ($ in thousands) |
| -100 Basis Points | | 0.7 | % | | 2.2 | % | | $ | (16,540 | ) |
| -50 Basis Points | | 0.3 | % | | 1.1 | % | | (8,205 | ) |
| -25 Basis Points | | 0.2 | % | | 0.5 | % | | (4,091 | ) |
| Basis Interest Rate | | — | % | | — | % | | — |
|
| +25 Basis Points | | (0.2 | )% | | (0.5 | )% | | 4,030 |
|
| +50 Basis Points | | (0.3 | )% | | (1.1 | )% | | 8,038 |
|
| +100 Basis Points | | (0.7 | )% | | (2.1 | )% | | 15,952 |
|
Prepayment Sensitivity
Increases in prepayments will decrease the average life and thus decrease the fair value of the loans. Conversely, decreases in prepayments will increase the average life of the loans and thus increase the fair value of the loans.
The following table presents estimates at December 31, 2019 under Fair Value Pro Forma as if we had elected the fair value option since inception:
|
| | | | | | | |
| Remaining Cumulative Prepayments | | Projected percentage change in the fair value of our Fair Value Loans | | Projected change in net fair value recorded in earnings ($ in thousands) |
| 120% of expected | | (0.2 | )% | | $ | (3,268 | ) |
| 110% of expected | | (0.1 | )% | | (1,709 | ) |
| 100% of expected | | — | % | | — |
|
| 90% of expected | | 0.1 | % | | 1,679 |
|
| 80% of expected | | 0.2 | % | | 3,523 |
|
The following table presents estimates at December 31, 2018 under Fair Value Pro Forma as if we had elected the fair value option since inception:
|
| | | | | | | |
| Remaining Cumulative Prepayments | | Projected percentage change in the fair value of our Fair Value Loans | | Projected change in net fair value recorded in earnings ($ in thousands) |
| 120% of expected | | (0.1 | )% | | $ | (1,244 | ) |
| 110% of expected | | — | % | | (648 | ) |
| 100% of expected | | — | % | | — |
|
| 90% of expected | | 0.1 | % | | 703 |
|
| 80% of expected | | 0.1 | % | | 1,461 |
|
Drivers of Fair Value for Fair Value Notes
The fair value of Fair Value Notes is set based upon marks provided by a third-party marking service, which either uses prices at which our Fair Value Notes or similar securities traded. Debt investors trade a bond based upon the interpolated swap curve rate that corresponds to the bond’s average life plus a credit spread (the bond yield or discount rate).
For an analysis of the effects of changes in Interest Rates, Remaining Cumulative Charge-offs, and Remaining Cumulative Prepayments on GAAP financial information, see Item 7A.Quantitative and Qualitative Disclosures About Market Risk.
Non-GAAP Financial Measures
We believe that the provision of non-GAAPThe amendment contains financial measures in this report, including Adjusted EBITDA, Adjusted Net Income, Adjusted Operating Efficiency and Adjusted Return on Equity, can provide useful measures for period-to-period comparisons of our core business and useful information to investors and others in understanding and evaluating our operating results. However, non-GAAP financial measuresthat are not calculated in accordance with United StatesU.S. generally accepted accounting principles or GAAP, and should not be considered as an alternative to any measures of financial performance calculated and presented in accordance with GAAP. There are limitations related to the use of these non-GAAP financial measures versus their most directly comparable GAAP measures, which include the following:(“GAAP”).
Other companies, including companies in our industry, may calculate these measures differently, which may reduce their usefulness as a comparative measure.
These measures do not consider the potentially dilutive impact of stock-based compensation.
Although depreciation and amortization are non-cash charges, the assets being depreciated and amortized may have to be replaced in the future and Adjusted EBITDA does not reflect cash capital expenditure requirements for such replacements or for new capital expenditure requirements.
Although excess provision represents the portion of provision for loan losses not attributable to net principal charge-offs occurring in the current period, it is expected that net principal charge-offs in the amount of the excess provision will occur in future periods.
Although the fair value mark-to-market adjustment is a non-cash adjustment, it does reflect our estimate of the price a third party would pay for our Fair Value Loans or our Fair Value Notes.
Adjusted EBITDA does not reflect tax payments that may represent a reduction in cash available to us.
Fair Value Pro Forma
We have elected the fair value option to account for all Fair Value Loans held for investment and all Fair Value Notes issued on or after January 1, 2018. In order to facilitate comparisons to prior periods, we have provided below unaudited financial information for the years ended December 31, 2019 and 2018 on a pro forma basis, or the Fair Value Pro Forma, as if we had elected the fair value option since our inception for all loans originated and held for investment and all asset-backed notes issued.
Fair Value Pro Forma Consolidated Statements of Operations Data:
|
| | | | | | | | | | | | | | | | | | | | | | | | | | | | | | |
| | | Year Ended December 31, 2019 | | Year Ended December 31, 2018 | | Period-to-period Change in FVPF |
| (in thousands) | | As Reported | | FV Adjustments | | FV Pro Forma | | As Reported | | FV Adjustments | | FV Pro Forma | | $ | % |
| Revenue: | | | | | | | | | | | | | | | |
| Interest income | | $ | 544,126 |
| | $ | (1,755 | ) | | $ | 542,371 |
| | $ | 448,777 |
| | $ | (12,619 | ) | | $ | 436,158 |
| | $ | 106,213 |
| 24 | % |
| Non-interest income | | 56,022 |
| | — |
| | 56,022 |
| | 48,802 |
| | — |
| | 48,802 |
| | 7,220 |
| 15 | % |
| Total revenue | | 600,148 |
| | (1,755 | ) | | 598,393 |
| | 497,579 |
| | (12,619 | ) | | 484,960 |
| | 113,433 |
| 23 | % |
| Less: | | | | | | | | | | | | | | | |
| Interest expense | | 60,546 |
| | (1,412 | ) | | 59,134 |
| | 46,919 |
| | (2,900 | ) | | 44,019 |
| | 15,115 |
| 34 | % |
| Provision (release) for loan losses | | (4,483 | ) | | 4,483 |
| | — |
| | 16,147 |
| | (16,147 | ) | | — |
| | — |
| — | % |
| Net increase (decrease) in fair value | | (97,237 | ) | | (13,361 | ) | | (110,598 | ) | | 22,899 |
| | (122,196 | ) | | (99,297 | ) | | (11,301 | ) | 11 | % |
| Net revenue | | 446,848 |
| | (18,187 | ) | | 428,661 |
| | 457,412 |
| | (115,768 | ) | | 341,644 |
| | 87,017 |
| 25 | % |
| Operating expenses: | | | | | | | | | | | | | | | |
| Technology and facilities | | 101,981 |
| | — |
| | 101,981 |
| | 82,848 |
| | — |
| | 82,848 |
| | 19,133 |
| 23 | % |
| Sales and marketing | | 97,153 |
| | — |
| | 97,153 |
| | 77,617 |
| | — |
| | 77,617 |
| | 19,536 |
| 25 | % |
| Personnel | | 90,647 |
| | — |
| | 90,647 |
| | 63,291 |
| | — |
| | 63,291 |
| | 27,356 |
| 43 | % |
| Outsourcing and professional fees | | 57,243 |
| | — |
| | 57,243 |
| | 52,733 |
| | — |
| | 52,733 |
| | 4,510 |
| 9 | % |
| General, administrative and other | | 15,392 |
| | — |
| | 15,392 |
| | 10,828 |
| | — |
| | 10,828 |
| | 4,564 |
| 42 | % |
| Total operating expenses | | 362,416 |
| | — |
| | 362,416 |
| | 287,317 |
| | — |
| | 287,317 |
| | 75,099 |
| 26 | % |
| Income before taxes | | 84,432 |
| | (18,187 | ) | | 66,245 |
| | 170,095 |
| | (115,768 | ) | | 54,327 |
| | 11,918 |
| 22 | % |
| Income tax expense | | 22,834 |
| | (5,018 | ) | | 17,816 |
| | 46,701 |
| | (31,808 | ) | | 14,893 |
| | 2,923 |
| 20 | % |
| Net income (loss) | | $ | 61,598 |
| | $ | (13,169 | ) | | $ | 48,429 |
| | $ | 123,394 |
| | $ | (83,960 | ) | | $ | 39,434 |
| | $ | 8,995 |
| 23 | % |
Fair Value Pro Forma Consolidated Balance Sheet Data:
|
| | | | | | | | | | | | | | | | | | | | | | | | | | | | | | |
| | | December 31, 2019 | | December 31, 2018 | | Period-to-period Change in FVPF |
| (in thousands) | | As Reported | | FV Adjustments | | FV Pro Forma | | As Reported | | FV Adjustments | | FV Pro Forma | | $ | % |
| Cash and cash equivalents | | $ | 72,179 |
| | $ | — |
| | $ | 72,179 |
| | $ | 70,475 |
| | $ | — |
| | $ | 70,475 |
| | $ | 1,704 |
| 2 | % |
| Restricted cash | | 63,962 |
| | — |
| | 63,962 |
| | 58,700 |
| | — |
| | 58,700 |
| | 5,262 |
| 9 | % |
Loans receivable (1) | | 1,920,559 |
| | 5,011 |
| | 1,925,570 |
| | 1,523,250 |
| | 21,182 |
| | 1,544,432 |
| | 381,138 |
| 25 | % |
| Other assets | | 145,174 |
| | (6,579 | ) | | 138,595 |
| | 87,514 |
| | (2,510 | ) | | 85,004 |
| | 53,591 |
| 63 | % |
| Total assets | | 2,201,874 |
| | (1,568 | ) | | 2,200,306 |
| | 1,739,939 |
| | 18,672 |
| | 1,758,611 |
| | 441,695 |
| 25 | % |
Total debt (2) | | 1,549,223 |
| | 1,557 |
| | 1,550,780 |
| | 1,310,266 |
| | (311 | ) | | 1,309,955 |
| | 240,825 |
| 18 | % |
| Other liabilities | | 163,885 |
| | (1,621 | ) | | 162,264 |
| | 83,124 |
| | 7,318 |
| | 90,442 |
| | 71,822 |
| 79 | % |
| Total liabilities | | 1,713,108 |
| | (64 | ) | | 1,713,044 |
| | 1,393,390 |
| | 7,007 |
| | 1,400,397 |
| | 312,647 |
| 22 | % |
| Total stockholder's equity | | 488,766 |
| | (1,504 | ) | | 487,262 |
| | 346,549 |
| | 11,665 |
| | 358,214 |
| | 129,048 |
| 36 | % |
| Total liabilities and stockholders' equity | | $ | 2,201,874 |
| | $ | (1,568 | ) | | $ | 2,200,306 |
| | $ | 1,739,939 |
| | $ | 18,672 |
| | $ | 1,758,611 |
| | $ | 441,695 |
| 25 | % |
(1) The information included in the As Reported figure includes loans receivable at fair value and loans receivable at amortized cost, net of unamortized deferred origination costs and fees and allowance for loan losses.
(2) The information included in the As Reported figure includes asset-backed notes at fair value and asset-backed notes at amortized cost, net of deferred financing costs. As Reported and FV Pro Forma figures include our secured financing facility measured under amortized cost accounting.
Adjusted EBITDA
Adjusted EBITDA is a non-GAAP financial measure defined as our net income, (loss), adjusted for the impact of our election of the fair value option and further adjusted to eliminate the effect of certain items as described below. We believe that Adjusted EBITDA is an important measure because it allows management, investors and our Board to evaluate and compare our operating results, including our return on capital and operating efficiencies, from period-to-period by making the adjustments described below. In addition, it provides a useful measure for period-to-period comparisons of our business, as it removes the effect of taxes, certain non-cash items, variable charges and timing differences.
We believe it is useful to exclude the impact of income tax expense (benefit), as reported, because historically it has included irregular income tax items that do not reflect ongoing business operations.
We believe it is useful to exclude the impact of interest expense associated with the Company’s Corporate Financing, as we view this expense as related to our capital structure rather than our funding.
We believe it is useful to exclude the impact of depreciation and amortization and stock-based compensation expense because they are non-cash charges.
We believe it is useful to exclude the impact of the litigation reservecertain non-recurring charges, such as expenses associated with our workforce optimization, acquisition and integration related expenses, and other non-recurring charges because this item doesthese items do not reflect ongoing business operations. Other non-recurring charges include litigation reserve, impairment charges, debt amendment and warrant amortization costs related to our Corporate Financing.
We also reverse origination fees for Loans Receivable at Fair Value, Loans, net. As a result of our election of the fair value option for our Fair Value Loans, weWe recognize the full amount of any origination fees as revenue at the time of loan disbursement in advance of our collection of origination fees through principal payments. As a result, we believe it is beneficial to exclude the uncollected portion of such origination fees, because such amounts do not represent cash that we received.
We also reverse the fair value mark-to-market adjustment because it is a non-cash adjustment as shown in the table below.adjustment.
|
| | | | | | | | |
Components of Fair Value Mark-to-Market Adjustment - Fair Value Pro Forma (in thousands) | | Year Ended December 31, |
| | 2019 | | 2018 |
| Fair value mark-to-market adjustment on Fair Value Loans | | $ | 39,460 |
| | $ | (5,926 | ) |
| Fair value mark-to-market adjustment on asset-backed notes | | (15,253 | ) | | 1,013 |
|
| Total fair value mark-to-market adjustment - Fair Value Pro Forma | | $ | 24,207 |
| | $ | (4,913 | ) |
The following table presents a reconciliation of net income (loss) to Adjusted EBITDA for the years ended December 31, 2019 and 2018 as if the fair value option had been in place since inception for all loans held for investment and all asset-backed notes:
|
| | | | | | | | |
| | | Year Ended December 31, |
| Adjusted EBITDA (in thousands) | | 2019 | | 2018 |
Net income (1) | | $ | 61,598 |
| | $ | 123,394 |
|
| Adjustments: | | | | |
| Fair Value Pro Forma net income adjustment | | (13,169 | ) | | (83,960 | ) |
| Income tax expense | | 17,816 |
| | 14,893 |
|
| Depreciation and amortization | | 14,101 |
| | 11,823 |
|
Stock-based compensation expense (2) | | 19,183 |
| | 6,772 |
|
| Litigation reserve | | 905 |
| | — |
|
| Origination fees for Fair Value Loans, net | | (1,908 | ) | | (3,576 | ) |
| Fair value mark-to-market adjustment | | (24,207 | ) | | 4,913 |
|
| Adjusted EBITDA | | $ | 74,319 |
| | $ | 74,259 |
|
(1) The year ended December 31, 2019 Net income figure includes operating expenses of $14.3 million ($10.4 million net of tax) associated with the launch of new products and services (auto, credit card, and OportunPath).
(2) The increase in stock-based compensation expense for the year ended December 31, 2019 compared to 2018 was primarily due to the recognition of compensation cost in connection with the performance-based condition relating to certain awards being considered probable on the effective date of the IPO.
Adjusted Net Income
We define Adjusted Net Income as our net income (loss), adjusted for the impact of our election of the fair value option, and further adjusted to exclude income tax expense (benefit) and stock-based compensation expenses. We believe that Adjusted Net Income is an important measure of operating performance because it allows management, investors, and our Board to evaluate and compare our operating results, including our return on capital and operating efficiencies, from period to period.
We believe it is useful to exclude the impact of income tax expense (benefit), as reported, because historically it has included irregular tax items that do not reflect our ongoing business operations.
We believe it is useful to exclude stock-based compensation expense, net of tax, because it is a non-cash charge.
We believe it is useful to exclude the impact of the litigation reserve, net of tax, because this item does not reflect ongoing business operations.
We include the impact of normalized income tax expense by applying the income tax rate noted in the table.
The following table presents a reconciliation of net income (loss) to Adjusted Net Income for the years ended December 31, 20192023 and 2018 on 2022as if the fair value option had been in place since inception for all loans held for investment and all asset-backed notes:
|
| | | | | | | | |
| | | Year Ended December 31, |
Adjusted Net Income (in thousands) | | 2019 | | 2018 |
Net income (1) | | $ | 61,598 |
| | $ | 123,394 |
|
| Adjustments: | | | | |
| Fair Value Pro Forma net income adjustment | | (13,169 | ) | | (83,960 | ) |
| Income tax expense | | 17,816 |
| | 14,893 |
|
Stock-based compensation expense (2) | | 19,183 |
| | 6,772 |
|
| Litigation reserve | | 905 |
| | — |
|
| Adjusted income before taxes | | 86,333 |
| | 61,099 |
|
| Normalized income tax expense | | 23,548 |
| | 16,750 |
|
| Adjusted Net Income | | $ | 62,785 |
| | $ | 44,349 |
|
Income tax rate (3) | | 27.0 | % | | 27.5 | % |
(1) The year ended December 31, 2019 Net income figure includes operating expenses of $14.3 million ($10.4 million net of tax) associated with the launch of new products and services (auto, credit card and OportunPath).
(2) The increase in stock-based compensation expense for the year ended December 31, 2019 compared to 2018 was primarily due to the recognition of compensation cost in connection with the performance-based condition relating to certain awards being considered probable on the effective date of the IPO.
(3) Income tax rate is based on the effective tax rate.:
Adjusted Earnings Per Share (“Adjusted EPS”)| | | Year Ended December 31, | |
Adjusted EBITDA (in thousands) | | 2023 | | | 2022 | |
| Net income (loss) | | $ | (179,951 | ) | | $ | (77,744 | ) |
| Adjustments: | | | | | | | | |
| Income tax expense (benefit) | | | (73,702 | ) | | | 2,458 | |
| Interest on corporate financing | | | 37,684 | | | | 5,987 | |
| Depreciation and amortization | | | 42,978 | | | | 35,182 | |
| Stock-based compensation expense | | | 17,997 | | | | 27,620 | |
| Workforce optimization expenses | | | 22,485 | | | | 1,882 | |
| Acquisition and integration related expenses | | | 27,640 | | | | 29,682 | |
| Origination fees for loans receivable at fair value, net | | | (18,536 | ) | | | (26,845 | ) |
Other non-recurring charges (1) | | | 15,524 | | | | 111,222 | |
| Fair value mark-to-market adjustment | | | 109,548 | | | | (119,711 | ) |
| Adjusted EBITDA | | $ | 1,667 | | | $ | (10,267 | ) |
| (1) | Certain prior-period financial information has been reclassified to conform to current period presentation. |
Adjusted Earnings Per Share is a non-GAAP financial measure that allows management, investors and our Board to evaluate the operating results, operating trends and profitability of the business in relation to diluted adjusted weighted-average shares outstanding post initial public offering. In addition, it provides a useful measure for period-to-period comparisons of our business, as it considers the effect of conversion of all convertible preferred shares as of the beginning of each annual period.
The following table presents a reconciliation of diluted EPS to Adjusted EPS for the years ended December 31, 2019 and 2018. For the reconciliation of net income (loss) to Adjusted Net Income, see the immediately preceding table “Adjusted Net Income.”
|
| | | | | | | | |
| | | Year Ended December 31, |
| (in thousands, except share and per share data) | | 2019 | | 2018 |
| Diluted earnings per share | | $ | 0.40 |
| | $ | 4.47 |
|
| Adjusted EPS | | | | |
| Adjusted Net Income | | $ | 62,785 |
| | $ | 44,349 |
|
| | | | | |
| Basic weighted-average common shares outstanding | | 9,347,103 |
| | 2,585,405 |
|
| Weighted-average common shares outstanding based on assumed convertible preferred conversion | | 14,005,753 |
| | 19,370,949 |
|
| Weighted average effect of dilutive securities: | | | | |
| Stock options | | 1,300,758 |
| | 1,114,816 |
|
Restricted stock units (1) | | 101,671 |
| | — |
|
| Warrants | | 12,320 |
| | 14,882 |
|
| Diluted adjusted weighted-average common shares outstanding | | 24,767,605 |
| | 23,086,052 |
|
| Adjusted Earnings Per Share | | $ | 2.53 |
| | $ | 1.92 |
|
(1) The increase in restricted stock units included in the diluted adjusted weighted-average common shares outstanding for the year ended December 31, 2019 compared to 2018 was primarily due to the performance-based condition relating to certain awards being considered probable on the effective date of the IPO, the voluntary stock option exchange offer and the issuance of restricted stock units for annual awards.
Adjusted Return on Equity
We define Adjusted Return on Equity as annualized Adjusted Net Income divided by average Fair Value Pro Forma total stockholders’ equity. Average Fair Value Pro Forma stockholders’ equity is an average of the beginning and ending Fair Value Pro Forma stockholders’ equity balance for each period. We believe Adjusted Return on Equity is an important measure because it allows management, investors and our Board to evaluate the profitability of the business in relation to equity and how well we generate income from the equity available.
The following table presents a reconciliation of Return on Equity to Adjusted Return on Equity for the years ended December 31, 2019 and 2018. For the reconciliation of net income (loss) to Adjusted Net Income, see the immediately preceding table “Adjusted Net Income.”
|
| | | | | | | | |
| | | As of or for the Year Ended December 31, |
| (in thousands) | | 2019 | | 2018 |
| Return on Equity | | 14.7 | % | | 43.8 | % |
| Adjusted Return on Equity | | | | |
| Adjusted Net Income | | $ | 62,785 |
| | $ | 44,349 |
|
| Fair Value Pro Forma average stockholders' equity | | $ | 422,738 |
| | $ | 335,275 |
|
| Adjusted Return on Equity | | 14.9 | % | | 13.2 | % |
Adjusted Operating Efficiency
We define Adjusted Operating Efficiency is a non-GAAP financial measure defined as Fair Value Pro Forma total operating expenses (excludingadjusted to exclude stock-based compensation expense and certain non-recurring charges such as expenses associated with a litigation reserve)reserve, our retail network optimization plan, impairment charges and acquisition and integration related expenses divided by Fair Value Pro Forma Total Revenue.total revenue. We believe Adjusted Operating Efficiency is an important measure because it allows management, investors and our Board to evaluate how efficientefficiently we are at managingmanage costs relative to revenue.
The following table presents a reconciliation of Operating Efficiency to Adjusted Operating Efficiency for the years ended December 31, 20192023 and 2022:
| | | As of or for the Year Ended December 31, | |
| (in thousands) | | 2023 | | | 2022 | |
| Operating Efficiency | | | 50.6 | % | | | 75.2 | % |
| Adjusted Operating Efficiency | | | | | | | | |
| Total revenue | | $ | 1,056,919 | | | $ | 952,545 | |
| Total operating expense | | | 534,319 | | | | 715,943 | |
| Stock-based compensation expense | | | (17,997 | ) | | | (27,620 | ) |
| Workforce optimization expenses | | | (22,485 | ) | | | (1,882 | ) |
| Acquisition and integration related expenses | | | (27,640 | ) | | | (29,682 | ) |
Other non-recurring charges (1) | | | (14,409 | ) | | | (111,222 | ) |
| Total adjusted operating expenses | | $ | 451,788 | | | $ | 545,537 | |
| Adjusted Operating Efficiency | | | 42.7 | % | | | 57.3 | % |
| (1) | Certain prior-period financial information has been reclassified to conform to current period presentation. |
Non-Employee Director Compensation
We compensate non-employee directors for their service on our Board with a combination of cash and equity awards, the amounts of which are commensurate with their role and involvement and taking into consideration a competitive market analysis performed by Willis Towers Watson. Directors may be reimbursed for travel, food, lodging and other expenses directly related to their activities as directors. Directors are also entitled to the protection provided by their indemnification agreements and the indemnification provisions as described in our amended and restated certificate of incorporation and amended and restated bylaws.
The compensation and leadership committee, which is comprised solely of independent directors, has the primary responsibility for reviewing and recommending to the Board the type and amount of compensation as well as changes to the compensation to be paid or awarded to non-employee directors, including any consulting, retainer, Board meeting, committee and committee chair fees and equity awards.
Cash Compensation
Each non-employee director receives an annual cash retainer for his or her service on the Board, as well as additional cash retainers if he or she serves as the Lead Independent Director, on a committee or as the chair of a committee. For new directors, these amounts are prorated for partial-year service based on the date of election to the Board. All cash payments to non-employee directors who served in the relevant capacity at any point during the immediately preceding prior fiscal quarter will be paid quarterly in arrears on a prorated basis. A non-employee director who served in the relevant capacity during only a portion of the prior fiscal quarter will receive a prorated payment of the quarterly payment of the applicable cash retainer. The following table lists the cash retainer amounts in effect during fiscal year 2023.
| Position | | Annual Cash Retainer ($) | |
| Board member | | | 40,000 | |
| Lead Independent Director | | | 25,000 | |
| Audit and risk committee chair | | | 20,000 | |
| Audit and risk committee member | | | 10,000 | |
| Other committee chair | | | 15,000 | |
| Other committee member | | | 7,500 | |
Non-employee directors were able to elect to receive a fixed percent up to 100% of their cash compensation earned for Board or committee service in the form of fully vested restricted stock units (“RSUs”) or cash. In 2023, for those directors who made an election to receive their compensation in the form of RSUs, the number of shares underlying such RSUs was calculated by dividing the amount of cash compensation earned by the non-employee director by the closing stock price on each grant date and rounded up to the nearest full share.
Equity Compensation
Each then-serving non-employee director received an annual award of RSUs with a value of $125,000 and the then-serving Lead Independent Director received an additional equity award of RSUs with a value of $31,250 immediately after the 2023 annual meeting. The number of shares subject to the RSUs was determined based on the annual equity award value divided by the nine-month trailing average of the closing price of the Company’s stock on March 10, 2023 and 2018:rounded up to the nearest full share, resulting in an award of RSUs covering 19,441 shares of our common stock for each non-employee director, with the then-serving Lead Independent Director receiving an additional award of RSUs covering 4,860 shares of our common stock. The RSU awards vest upon the satisfaction of a one-year service-based vesting schedule, commencing June 2023, subject to the non-employee director continuing to provide services to us through the applicable vesting date. A non-employee director who is newly appointed to the Board other than in connection with an annual meeting of stockholders will receive a grant of RSUs upon appointment (an “Initial Director Award”). The number of shares subject to each Initial Director Award is determined based on the annual equity award value divided by the nine-month trailing average of the closing price of the Company’s stock on the grant date and rounded up to the nearest full share, but the Initial Director Award is prorated based on the portion of the time period remaining in the one-year period since the last annual meeting.
|
| | | | | | | | |
| | | As of or for the Year Ended December 30, |
| (in thousands) | | 2019 | | 2018 |
| Operating Efficiency | | 60.4 | % | | 57.7 | % |
| Adjusted Operating Efficiency | |
| | |
| Total revenue | | $ | 600,148 |
| | $ | 497,579 |
|
| Fair Value Pro Forma total revenue adjustments | | (1,755 | ) | | (12,619 | ) |
| Fair Value Pro Forma Total Revenue | | 598,393 |
| | 484,960 |
|
| Total operating expense | | 362,416 |
| | 287,317 |
|
Stock-based compensation expense (1) | | (19,183 | ) | | (6,772 | ) |
| Litigation Reserve | | (905 | ) | | — |
|
| Total Fair Value Pro Forma adjusted operating expenses | | $ | 342,328 |
| | $ | 280,545 |
|
| Adjusted Operating Efficiency | | 57.2 | % | | 57.8 | % |
(1)
The increase in stock-basedfollowing table provides information regarding all compensation expenseawarded to, earned by or paid to our non-employee directors for the year ended December 31, 2019 compared to 2018 was primarily due to the recognition of compensation cost in connection with the performance-based condition relating to certain awards being considered probable on the effective date of the IPO.2023:
Liquidity and Capital Resources| Director | | Fees Earned or Paid in Cash ($) | | | Stock Awards(1) ($) | | | Total ($) | |
Carl Pascarella(2) | | | 70,712 | (3) | | | 144,591 | | | | 215,303 | |
| Roy Banks | | | 57,744 | | | | 115,674 | | | | 173,418 | |
| Jo Ann Barefoot | | | 57,500 | | | | 115,674 | | | | 173,174 | |
Mohit Daswani(4) | | | — | | | | — | | | | — | |
| Ginny Lee | | | 62,500 | (5) | | | 115,674 | | | | 178,174 | |
| Louis P. Miramontes | | | 57,500 | | | | 115,674 | | | | 173,174 | |
Carlos Minetti(4) | | | — | | | | — | | | | — | |
Scott Parker(6) | | | — | | | | — | | | | — | |
| Sandra A. Smith | | | 65,387 | | | | 115,674 | | | | 181,061 | |
David Strohm(7) | | | 21,972 | (8) | | | — | | | | 21,972 | |
Frederic Welts(7) | | | 27,129 | (9) | | | — | | | | 27,129 | |
| R. Neil Williams | | | 70,985 | (10) | | | 115,674 | | | | 186,659 | |
Sources of liquidity(1) | This column reflects the aggregate grant date fair value of the RSUs granted as annual equity awards for Board service as described above (or in the case of Mr. Pascarella, such annual equity award plus an additional annual equity award for his service as then-serving Lead Independent Director) measured pursuant to FASB ASC 718, without regard to forfeitures. The assumptions used in calculating the grant date fair value of these awards are set forth in Note 2 and Note 11 to our Notes to the Consolidated Financial Statements included in our Original Form 10-K. These amounts do not reflect the actual economic value that may be realized by the non-employee director. |
(2) | Mr. Pascarella resigned on November 4, 2023. |
(3) | Mr. Pascarella received 12,647 RSUs pursuant to an election to receive his retainer compensation for 2023 in the form of RSUs. |
(4) | Mr. Daswani and Mr. Minetti were both appointed to the Board on February 7, 2024 and therefore did not receive compensation for 2023. |
(5) | Ms. Lee received 11,288 RSUs pursuant to an election to receive her retainer compensation for 2023 in the form of RSUs. |
(6) | Mr. Parker was appointed to the Board on April 19, 2024 and therefore did not receive compensation for 2023. |
(7) | Mr. Strohm and Mr. Welts did not stand for re-election at the 2023 annual meeting of stockholders. |
(8) | Mr. Strohm received 3,857 RSUs pursuant to an election to receive his retainer compensation for 2023 in the form of RSUs. |
(9) | Mr. Welts received 4,779 RSUs pursuant to an election to receive his retainer compensation for 2023 in the form of RSUs. |
(10) | Mr. Williams received 12,856 RSUs pursuant to an election to receive his retainer compensation for 2023 in the form of RSUs. |
To date, we have funded our lending activities and operations primarily through private issuances of debt, placements of convertible preferred stock, cash from operating activities, and the sale of loans to a third-party financial institution. We anticipate issuing additional securitizations, entering into additional secured financings and continuing whole loan sales.
Current debt facilities
The following table summarizeslists all outstanding equity awards held by our current debt facilities available for funding our lending activities and our operating expendituresnon-employee directors as of December 31, 2019:2023:
|
| | | | | | | | |
| Debt Facility | | Scheduled Amortization Period Commencement Date | | Interest Rate | | Principal (in thousands) |
| Secured Financing | | 10/1/2021 | | LIBOR (minimum of 0.00%) + 2.45% | | $ | 62,000 |
|
| Asset-Backed Securitization-Series 2019-A Notes | | 8/1/2022 | | 3.22% | | 250,000 |
|
| Asset-Backed Securitization-Series 2018-D Notes | | 12/1/2021 | | 4.50% | | 175,002 |
|
| Asset-Backed Securitization-Series 2018-C Notes | | 10/1/2021 | | 4.39% | | 275,000 |
|
| Asset-Backed Securitization-Series 2018-B Notes | | 7/1/2021 | | 4.09% | | 213,159 |
|
| Asset-Backed Securitization-Series 2018-A Notes | | 3/1/2021 | | 3.83% | | 200,004 |
|
| Asset-Backed Securitization-Series 2017-B Notes | | 10/1/2020 | | 3.51% | | 200,000 |
|
| Asset-Backed Securitization-Series 2017-A Notes | | 6/1/2020 | | 3.36% | | 160,001 |
|
| | | | | | | $ | 1,535,166 |
|
The outstanding amounts set forth in the table above are consolidated on our balance sheet whereas loans sold to a third-party financial institution are not on our balance sheet once sold. We currently act as servicer in exchange for a servicing fee with respect to the loans purchased by the third-party financial institution.
Lenders do not have direct recourse to Oportun Financial Corporation or Oportun, Inc.
Debt
Our ability to utilize our secured financing facility as described herein is subject to compliance with various requirements, including:
| |
• | Eligibility Criteria. In order for our loans to be eligible for purchase by Oportun Funding V, they must meet all applicable eligibility criteria;
|
| |
• | Concentration Limits. The collateral pool is subject to certain concentration limits that, if exceeded, would reduce our borrowing base availability by the amount of such excess; and
|
| |
• | Covenants and Other Requirements. The secured financing facility contains several financial covenants, portfolio performance covenants and other covenants or requirements that, if not complied with, may result in an event of default and/or an early amortization event causing the accelerated repayment of amounts owed.
|
As of December 31, 2019, we were in compliance with all financial covenants required per the debt facility.
For more information regarding our current asset-backed secured financing facility, see Notes 4 and 8 of the Notes to the Consolidated Financial Statements included elsewhere in this report.
Our ability to utilize our asset-backed securitization facilities as described herein is subject to compliance with various requirements including:
| |
• | Eligibility Criteria. In order for our loans to be eligible for purchase by our wholly owned special purpose subsidiaries they must meet all applicable eligibility criteria; and
|
| |
• | Covenants and Other Requirements. Our securitization facilities contain pool concentration limits, pool performance covenants and other covenants or requirements that, if not complied with, may result in an event of default, and/or an early amortization event causing the accelerated repayment of amounts owed.
|
As of December 31, 2019, we were in compliance with all covenants and requirements of all our asset-backed notes.
For more information regarding our asset-backed securitization facilities, see Note 4 and 8 of the Notes to the Consolidated Financial Statements included elsewhere in this report.
Whole loan sales
In November 2014, we initially entered into a whole loan sale agreement with an institutional investor that was amended most recently for a one-year term on September 12, 2019, providing, among other things, to extend the term through November 10, 2020. Pursuant to this agreement, we have committed to sell at least 10% of our loan originations, subject to certain eligibility criteria, with an option to sell an additional 5%. We currently sell 15% of our loan originations to the institutional investor. We retain all rights and obligations involving the servicing of the loans and earn servicing revenue of 5% of the daily average principal balance of loans sold each month.
In addition, under a pilot program, we entered into a separate whole loan sale arrangement with an institutional investor with a commitment to sell 100% of our loans originated under our Access Loan Program. We recognize servicing revenue of 5% of the daily average principal balance of sold loans for the month.
We will continue to evaluate additional loan sale opportunities in the future and have not made any determinations regarding the percentage of loans we may sell.
The loans are randomly selected and sold at a pre-determined purchase price above par and we recognize a gain on the loans. We sell loans twice per week. We have not repurchased any of the loans sold related to this agreement and do not anticipate repurchasing loans sold in the future. We therefore do not record a reserve related to our repurchase obligations from the whole loan sale agreement.
Cash, cash equivalents, restricted cash and cash flows
The following table summarizes our cash and cash equivalents, restricted cash and cash flows for the periods indicated:
|
| | | | | | | | |
| | | Year Ended December 31, |
| (in thousands of dollars) | | 2019 | | 2018 |
| Cash, cash equivalents and restricted cash | | $ | 136,141 |
| | $ | 129,175 |
|
| Cash provided by (used in) | | | | |
| Operating activities | | 218,374 |
| | 138,374 |
|
| Investing activities | | (497,680 | ) | | (471,427 | ) |
| Financing activities | | $ | 286,272 |
| | $ | 368,073 |
|
Our cash is held for working capital purposes and originating loans. Our restricted cash represents collections held in our securitizations and is applied currently after month-end to pay interest expense and satisfy any amount due to whole loan buyer with any excess amounts returned to us.
Cash flows
Operating Activities
Our net cash provided by operating activities was $218.4 million and $138.4 million for the years ended December 31, 2019 and 2018, respectively. Cash flows from operating activities primarily include net income or losses adjusted for (i) non-cash items included in net income or loss, including depreciation and amortization expense, amortization of deferred financing and loan costs, amortization of debt discount, fair value adjustments, net, origination fees for loans at fair value, net, gain on loan sales, stock-based compensation expense, provision for loan losses and deferred tax assets, (ii) originations of loans sold and held for sale, and proceeds from sale of loans and (iii) changes in the balances of operating assets and liabilities, which can vary significantly in the normal course of business due to the amount and timing of various payments.
Investing Activities
Our net cash used in investing activities was $497.7 million and $471.4 million for the years ended December 31, 2019 and 2018, respectively. Our investing activities consist primarily of loan originations and loan repayments. We currently do not own any real estate. We invest in purchases of property and equipment and incur system development costs. Purchases of property and equipment, and capitalization of system development costs may vary from period to period due to the timing of the expansion of our operations, the addition of employee headcount and the development cycles of our system development.
Financing Activities
Our net cash provided by financing activities was $286.3 million and $368.1 million for the years ended December 31, 2019 and 2018, respectively. During those time periods, net cash provided by financing activities was primarily driven by borrowings on our secured financing facility and asset-backed notes, partially offset by repayments on those borrowings, and net proceeds from our initial public offering.
Operating and capital expenditure requirements
We believe that our existing cash balance, anticipated positive cash flows from operations and available borrowing capacity under our credit facilities will be sufficient to meet our anticipated cash operating expense and capital expenditure requirements through at least the next 12 months. If our available cash balances are insufficient to satisfy our liquidity requirements, we will seek additional equity or debt financing. The sale of equity may result in dilution to our stockholders and those securities may have rights senior to those of our common shares. If we raise additional funds through the issuance of additional debt, the agreements governing such debt could contain covenants that would restrict our operations and such debt would rank senior to shares of our common stock. We may require additional capital beyond our currently anticipated amounts and additional capital may not be available on reasonable terms, or at all.
Contractual Obligations
As a “Smaller Reporting Company” as defined by Item 10 of Regulation S-K, the Company is not required to provide this information.
Off-Balance Sheet Arrangements
We do not engage in off-balance sheet financing arrangements that have, or are reasonably likely to have, a current or future effect on our financial condition, changes in financial condition, total revenue or expenses, results of operations, liquidity, capital expenditures or capital resources.
Critical Accounting Policies and Significant Judgments and Estimates
Our Management's Discussion and Analysis of Financial Condition and Results of Operations is based on our consolidated financial statements, which have been prepared in accordance with GAAP. The preparation of these consolidated financial statements requires us to make estimates and assumptions that affect the reported amounts of assets, liabilities, revenue, expenses and the related disclosures. In accordance with GAAP, we base our estimates on historical experience and on various other assumptions that we believe are reasonable under the circumstances. Actual results may differ from these estimates under different assumptions or conditions.
While our significant accounting policies are more fully described in Note 2, Summary of Significant Accounting Policies, in our Notes to the Consolidated Financial Statements included elsewhere in this report, we believe fair value of loans held for investment as critical to the process of making significant judgments and estimates in the preparation of our consolidated financial statements.
Fair Value of Loans Held for Investment
We have elected the fair value option for our Fair Value Loans. We primarily use a discounted cash flow model to estimate fair value based on the present value of estimated future cash flows. This model uses inputs that are not observable but reflect our best estimates of the assumptions a market participant would use to calculate fair value. The following describes the primary inputs that require significant judgment:
| |
• | Remaining Cumulative Charge-offs - Remaining cumulative charge-offs are estimates of the principal payments that will not be repaid over the life of a loan held for investment. Remaining cumulative loss expectations are adjusted to reflect the expected principal recoveries on charged-off loans. Remaining cumulative loss expectations are primarily based on the historical performance of our loans but also incorporate adjustments based on our expectations of future credit performance and are quantified by the remaining cumulative charge-off rate.
|
| |
• | Remaining Cumulative Prepayments - Remaining cumulative prepayments are estimates of the principal payments that will be repaid earlier than contractually required over the life of a loan held for investment. Remaining cumulative prepayment rates are primarily based on the historical performance of our loans but also incorporate adjustments based on our expectations of future customer behavior and refinancings through our Good Customer Program.
|
| |
• | Average Life - Average life is the time weighted average of the estimated principal payments divided by the principal balance at the measurement date. The timing of estimated principal payments is impacted by scheduled amortization of loans, charge-offs, and prepayments.
|
| |
• | Discount Rates - The discount rates applied to the expected cash flows of loans held for investment reflect our estimates of the rates of return that investors would require when investing in financial instruments with similar risk and return characteristics. Discount rates are based on our estimate of the rate of return likely to be received on new loans. Discount rates for aged loans are adjusted to reflect the market relationship between interest rates and remaining time to maturity.
|
The Company developed an internal model to estimate the Fair Value Loans. To generate future expected cash flows, the model combines receivable characteristics with assumptions about borrower behavior based on the Company’s historical loan performance. These cash flows are then discounted using a required rate of return that management estimates would be used by a market participant.
The Company tested the fair value model by comparing modeled cash flows to historical loan performance to ensure that the model was complete, accurate and reasonable for the Company’s use. The Company also engaged a third party to create an independent fair value estimate for the Fair Value Loans, which provides a set of fair value marks using the Company’s historical loan performance data and whole loan sale prices to develop independent forecasts of borrower behavior. Their model used these assumptions to generate loan level cash flows which were then aggregated and compared to the Company’s within an acceptable range.
The Company's internal valuation and loan loss allowance committee provides governance and oversight over the fair value pricing and loan loss allowance calculations and related financial statement disclosures. Additionally, this committee provides a challenge of the assumptions used and outputs of the model, including the appropriateness of such measures and periodically reviews the methodology and process to determine the fair value pricing and loan loss allowance. Any significant changes to the process must be approved by the committee.
Recently Issued Accounting Pronouncements
See Note 2, Summary of Significant Accounting Policies, of the Notes to the Consolidated Financial Statements included elsewhere in this report for a discussion of recent accounting pronouncements and future application of accounting standards.
Item 7A. Quantitative and Qualitative Disclosures About Market Risk
Market risk represents the risk of loss that may impact our financial position due to adverse changes in financial market prices, credit performance of loans and interest rates. We do not use derivative financial instruments for speculative, hedging or trading purposes, although in the future we may enter into interest rate or exchange rate hedging arrangements to manage the risks described below. Certain unobservable inputs may (in isolation) have either a directionally consistent or opposite impact on the fair value of the financial instrument for a given change in that input. When multiple inputs are used within the valuation techniques for loans, a change in one input in a certain direction may be offset by an opposite change from another input.
Credit Performance Sensitivity
In a strong economic climate, credit losses may decrease due to low unemployment and rising wages, which will increase the fair value of our Fair Value Loans, which increases Net Revenue. In a weak economic climate, credit losses may increase due to high unemployment and falling wages, which will decrease the fair value of our Fair Value Loans, which decreases Net Revenue. Changes in credit losses will also impact our Loans Receivable at Amortized Cost but given that these loans represent only 2% of our loans receivable as of December 31, 2019, are now significantly seasoned and are amortizing, the impact of changes to charge-offs on our Loans Receivable at Amortized Cost are not expected to be material.
The following table presents estimates at December 31, 2019. Actual results could differ materially from these estimates:
|
| | | | | | | |
| Remaining Cumulative Charge-Offs | | Projected percentage change in the fair value of our Fair Value Loans | | Projected change in net fair value recorded in earnings ($ in thousands) |
| 120% of expected | | (1.6 | )% | | $ | (29,324 | ) |
| 110% of expected | | (0.8 | )% | | $ | (14,899 | ) |
| 100% of expected | | — | % | | $ | — |
|
| 90% of expected | | 0.8 | % | | $ | 14,815 |
|
| 80% of expected | | 1.6 | % | | $ | 30,138 |
|
The following table presents estimates at December 31, 2018. Actual results could differ materially from these estimates:
|
| | | | | | | |
| Remaining Cumulative Charge-Offs | | Projected percentage change in the fair value of our Fair Value Loans | | Projected change in net fair value recorded in earnings ($ in thousands) |
| 120% of expected | | (1.5 | )% | | $ | (18,050 | ) |
| 110% of expected | | (0.8 | )% | | $ | (9,095 | ) |
| 100% of expected | | — | % | | $ | — |
|
| 90% of expected | | 0.8 | % | | $ | 9,237 |
|
| 80% of expected | | 1.6 | % | | $ | 18,620 |
|
Market Rate Sensitivity
The fair values of our Fair Value Loans are estimated using a discounted cash flow methodology, where the discount rate considers various inputs such as the price that we can sell loans to a third party in a non-public market, market conditions such as interest rates, and credit spreads. The discount rates may change due to expected loan performance. We recorded a fair value mark-to-market adjustment related to our Fair Value Loans and Fair Value Notes of $19.7 million for the year ended December 31, 2019, a decrease of approximately $26.2 million compared to the prior year.
Interest Rate Sensitivity
We charge fixed rates on our loans and the average life of our loan portfolio is approximately 0.8 years. The fair value of fixed rate loans will generally change when interest rates change, because interest rates will impact the discount rate the market uses to value our loans. As of December 31, 2019, we had $1.5 billion of fixed-rate asset-backed notes outstanding with an average life of 1.3 years. Our borrowing cost does not vary with interest rates for our asset-backed notes, but the fair value will generally change when interest rates change, because interest rates will impact the discount rate the market uses to value our notes. As of December 31, 2019, we had $62.0 million of outstanding borrowings under our secured financing. The interest rate of the secured financing is 1-month LIBOR plus a spread of 2.45% with a LIBOR floor of 0.00% and the maximum borrowing amount is $400.0 million. Changes in interest rates in the future will likely affect our borrowing costs of our secured financing.
In a strong economic climate, interest rates may rise, which will decrease the fair value of our Fair Value Loans, which reduces Net Revenue. Rising interest rates will also decrease the fair value of our Fair Value Notes, which increases Net Revenue. Conversely, in a weak economic climate, interest rates may fall, which will increase the fair value of our Fair Value Loans, which increases Net Revenue. Decreasing interest rates will also increase the fair value of our Fair Value Notes, which reduces Net Revenue. Because the duration and fair value of our loans and asset-backed notes are different, the respective changes in fair value will not fully offset each other. Changes in interest rates will not impact the carrying value of our loans held for investment and originated prior to January 1, 2018, or the Loans Receivable at Amortized Cost, as these loans are reported at their amortized cost, which is the outstanding principal balance, net of unamortized deferred origination fees and costs and the allowance for loan losses, so there will be no impact to Net Revenue related to these loans.
The following table presents estimates at December 31, 2019. Actual results could differ materially from these estimates:
|
| | | | | | | | | | |
| Change in Interest Rates | | Projected percentage change in the fair value of our Fair Value Loans | | Projected percentage change in the fair value of our Fair Value Notes | | Projected change in net fair value recorded in earnings
($ in thousands) |
| -100 Basis Points | | 0.7 | % | | 1.8 | % | | $ | (6,257 | ) |
| -50 Basis Points | | 0.4 | % | | 0.9 | % | | $ | (3,103 | ) |
| -25 Basis Points | | 0.2 | % | | 0.4 | % | | $ | (1,545 | ) |
| Basis Interest Rate | | — | % | | — | % | | $ | — |
|
| +25 Basis Points | | (0.2 | )% | | (0.4 | )% | | $ | 1,532 |
|
| +50 Basis Points | | (0.4 | )% | | (0.9 | )% | | $ | 3,052 |
|
| +100 Basis Points | | (0.7 | )% | | (1.7 | )% | | $ | 6,053 |
|
The following table presents estimates at December 31, 2018. Actual results could differ materially from these estimates:
|
| | | | | | | | | | |
| Change in Interest Rates | | Projected percentage change in the fair value of our Fair Value Loans | | Projected percentage change in the fair value of our Fair Value Notes | | Projected change in net fair value recorded in earnings ($ in thousands) |
| -100 Basis Points | | 0.7 | % | | 2.5 | % | | $ | (12,272 | ) |
| -50 Basis Points | | 0.4 | % | | 1.2 | % | | $ | (6,086 | ) |
| -25 Basis Points | | 0.2 | % | | 0.6 | % | | $ | (3,038 | ) |
| Basis Interest Rate | | — | % | | — | % | | $ | — |
|
| +25 Basis Points | | (0.2 | )% | | (0.6 | )% | | $ | 2,970 |
|
| +50 Basis Points | | (0.4 | )% | | (1.2 | )% | | $ | 5,931 |
|
| +100 Basis Points | | (0.7 | )% | | (2.4 | )% | | $ | 11,768 |
|
Prepayment Sensitivity
In a strong economic climate, customers’ incomes may increase which may lead them to prepay their loans more quickly. In a weak economic climate, customers incomes may decrease which may lead them to prepay their loans more slowly. Additionally, changes in the eligibility requirements for our Good Customer Program, which allows customers with existing loans to take out a new loan and use a portion of the proceeds to pay-off their existing loan, could impact prepayment rates. In the future, we may implement programs or products that may include a consolidation feature that would enable the customer to use the proceeds from one loan to pay off their personal loan, which could cause prepayment rates on personal loans to increase. Increased competition may also lead to increased prepayment, if our customers take out a loan from another lender to refinance our loan.
The following table presents estimates at December 31, 2019. Actual results could differ materially from these estimates:
|
| | | | | | | |
| Remaining Cumulative Prepayments | | Projected percentage change in the fair value of our Fair Value Loans | | Projected change in net fair value recorded in earnings
($ in thousands) |
| 120% of expected | | (0.2 | )% | | $ | (3,340 | ) |
| 110% of expected | | (0.1 | )% | | $ | (1,809 | ) |
| 100% of expected | | — | % | | $ | — |
|
| 90% of expected | | 0.1 | % | | $ | 1,520 |
|
| 80% of expected | | 0.2 | % | | $ | 3,331 |
|
The following table presents estimates at December 31, 2018. Actual results could differ materially from these estimates:
|
| | | | | | | |
| Remaining Cumulative Prepayments | | Projected percentage change in the fair value of our Fair Value Loans | | Projected change in net fair value recorded in earnings ($ in thousands) |
| 120% of expected | | (0.1 | )% | | $ | (1,239 | ) |
| 110% of expected | | (0.1 | )% | | $ | (646 | ) |
| 100% of expected | | — | % | | $ | — |
|
| 90% of expected | | 0.1 | % | | $ | 700 |
|
| 80% of expected | | 0.1 | % | | $ | 1,456 |
|
Foreign Currency Exchange Risk
All of our revenue and substantially all of our operating expenses are denominated in U.S. dollars. Our non-U.S. dollar operating expenses in Mexico made up 6.3% of total operating expenses in 2019. All of our interest income is denominated in U.S. dollars and is therefore not subject to foreign currency exchange risk.
Item 8. Financial Statements and Supplementary Data
Report of Independent Registered Public Accounting Firm
To the stockholders and the Board of Directors of Oportun Financial Corporation
Opinion on the Financial Statements
We have audited the accompanying consolidated balance sheets of Oportun Financial Corporation and subsidiaries (the "Company") as of December 31, 2019 and 2018, the related consolidated statements of operations and comprehensive income, changes in stockholders’ equity, and cash flows, for each of the three years in the period ended December 31, 2019, and the related notes (collectively referred to as the "financial statements"). In our opinion, the financial statements present fairly, in all material respects, the financial position of the Company as of December 31, 2019 and 2018, and the results of its operations and its cash flows for each of the three years in the period ended December 31, 2019, in conformity with accounting principles generally accepted in the United States of America.
Basis for Opinion
These financial statements are the responsibility of the Company's management. Our responsibility is to express an opinion on the Company's financial statements based on our audits. We are a public accounting firm registered with the Public Company Accounting Oversight Board (United States) (PCAOB) and are required to be independent with respect to the Company in accordance with the U.S. federal securities laws and the applicable rules and regulations of the Securities and Exchange Commission and the PCAOB.
We conducted our audits in accordance with the standards of the PCAOB. Those standards require that we plan and perform the audit to obtain reasonable assurance about whether the financial statements are free of material misstatement, whether due to error or fraud. The Company is not required to have, nor were we engaged to perform, an audit of its internal control over financial reporting. As part of our audits, we are required to obtain an understanding of internal control over financial reporting but not for the purpose of expressing an opinion on the effectiveness of the Company’s internal control over financial reporting. Accordingly, we express no such opinion.
Our audits included performing procedures to assess the risks of material misstatement of the financial statements, whether due to error or fraud, and performing procedures that respond to those risks. Such procedures included examining, on a test basis, evidence regarding the amounts and disclosures in the financial statements. Our audits also included evaluating the accounting principles used and significant estimates made by management, as well as evaluating the overall presentation of the financial statements. We believe that our audits provide a reasonable basis for our opinion.
/s/ Deloitte & Touche LLP
San Francisco, CA
February 28, 2020
We have served as the Company's auditor since 2010.
OPORTUN FINANCIAL CORPORATION
Consolidated Balance Sheets
(in thousands, except share and per share data)
|
| | | | | | | | |
| | | December 31, |
| | | 2019 | | 2018 |
| Assets | | | | |
| Cash and cash equivalents | | $ | 72,179 |
| | $ | 70,475 |
|
| Restricted cash | | 63,962 |
| | 58,700 |
|
| Loans receivable at fair value | | 1,882,088 |
| | 1,227,469 |
|
| Loans receivable at amortized cost | | 42,546 |
| | 323,814 |
|
| Less: | | | | |
| Unamortized deferred origination costs and fees, net | | (103 | ) | | (1,707 | ) |
| Allowance for loan losses | | (3,972 | ) | | (26,326 | ) |
| Loans receivable at amortized cost, net | | 38,471 |
| | 295,781 |
|
| Loans held for sale | | 715 |
| | — |
|
| Interest and fees receivable, net | | 17,185 |
| | 13,177 |
|
| Right of use assets - operating | | 50,503 |
| | — |
|
| Deferred tax assets | | 1,563 |
| | 1,039 |
|
| Other assets | | 75,208 |
| | 73,298 |
|
| Total assets | | $ | 2,201,874 |
| | $ | 1,739,939 |
|
| | | | | |
| Liabilities and stockholders' equity | | | | |
| Liabilities | | | | |
| Secured financing | | $ | 60,910 |
| | $ | 85,289 |
|
| Asset-backed notes at fair value | | 1,129,202 |
| | 867,278 |
|
| Asset-backed notes at amortized cost | | 359,111 |
| | 357,699 |
|
| Amount due to whole loan buyer | | 33,354 |
| | 27,941 |
|
| Lease liabilities | | 53,357 |
| | — |
|
| Deferred tax liabilities | | 24,868 |
| | 13,925 |
|
| Other liabilities | | 52,306 |
| | 41,258 |
|
| Total liabilities | | 1,713,108 |
| | 1,393,390 |
|
| Stockholders' equity | | | | |
| Convertible preferred stock, $0.0001 par value - 0 and 16,550,904 shares authorized at December 31, 2019 and December 31, 2018; 0 and 14,043,977 shares issued and outstanding (liquidation preference of $0 and $261,343) at December 31, 2019 and December 31, 2018, respectively | | — |
| | 16 |
|
| Convertible preferred stock, additional paid-in capital | | — |
| | 257,887 |
|
| Preferred stock, $0.0001 par value - 100,000,000 and 0 shares authorized at December 31, 2019 and December 31, 2018; 0 shares issued and outstanding at December 31, 2019 and December 31, 2018, respectively | | — |
| | — |
|
| Preferred stock, additional paid-in capital | | — |
| | — |
|
| Common stock, $0.0001 par value - 1,000,000,000 and 28,181,818 shares authorized at December 31, 2019 and December 31, 2018; 27,262,639 shares issued and 27,003,157 shares outstanding at December 31, 2019; 3,194,731 shares issued and 2,935,249 shares outstanding at December 31, 2018 | | 6 |
| | 3 |
|
| Common stock, additional paid-in capital | | 418,299 |
| | 44,411 |
|
| Convertible preferred and common stock warrants | | 63 |
| | 130 |
|
| Accumulated other comprehensive loss | | (162 | ) | | (132 | ) |
| Retained earnings | | 76,679 |
| | 52,662 |
|
| Treasury stock at cost, 259,482 shares at December 31, 2019 and December 31, 2018, respectively | | (6,119 | ) | | (8,428 | ) |
| Total stockholders’ equity | | 488,766 |
| | 346,549 |
|
| Total liabilities and stockholders' equity | | $ | 2,201,874 |
| | $ | 1,739,939 |
|
See Notes to the Consolidated Financial Statements.
OPORTUN FINANCIAL CORPORATION
Consolidated Statements of Operations and Comprehensive Income
(in thousands, except share and per share data)
|
| | | | | | | | | | | | |
| | | Year Ended December 31, |
| | | 2019 | | 2018 | | 2017 |
| Revenue | | | | | | |
| Interest income | | $ | 544,126 |
| | $ | 448,777 |
| | $ | 327,935 |
|
| Non-interest income | | 56,022 |
| | 48,802 |
| | 33,019 |
|
| Total revenue | | 600,148 |
| | 497,579 |
| | 360,954 |
|
| Less: | | | | | | |
| Interest expense | | 60,546 |
| | 46,919 |
| | 36,399 |
|
| Provision (release) for loan losses | | (4,483 | ) | | 16,147 |
| | 98,315 |
|
| Net increase (decrease) in fair value | | (97,237 | ) | | 22,899 |
| | — |
|
| Net revenue | | 446,848 |
| | 457,412 |
| | 226,240 |
|
| | | | | | | |
| Operating expenses: | | | | | | |
| Technology and facilities | | 101,981 |
| | 82,848 |
| | 70,896 |
|
| Sales and marketing | | 97,153 |
| | 77,617 |
| | 58,060 |
|
| Personnel | | 90,647 |
| | 63,291 |
| | 47,186 |
|
| Outsourcing and professional fees | | 57,243 |
| | 52,733 |
| | 31,171 |
|
| General, administrative and other | | 15,392 |
| | 10,828 |
| | 16,858 |
|
| Total operating expenses | | 362,416 |
| | 287,317 |
| | 224,171 |
|
| | | | | | | |
| Income before taxes | | 84,432 |
| | 170,095 |
| | 2,069 |
|
| Income tax expense | | 22,834 |
| | 46,701 |
| | 12,275 |
|
| Net income (loss) | | $ | 61,598 |
| | $ | 123,394 |
| | $ | (10,206 | ) |
| Change in post-termination benefit obligation | | (30 | ) | | 10 |
| | (119 | ) |
| Total comprehensive income (loss) | | $ | 61,568 |
| | $ | 123,404 |
| | $ | (10,325 | ) |
| | | | | | | |
| Net income (loss) attributable to common stockholders | | $ | 4,262 |
| | $ | 16,597 |
| | $ | (10,206 | ) |
| | | | | | | |
| Share data: | | | | | | |
| Earnings (loss) per share: | | | | | | |
| Basic | | $ | 0.46 |
| | $ | 6.42 |
| | $ | (4.22 | ) |
| Diluted | | $ | 0.40 |
| | $ | 4.47 |
| | $ | (4.22 | ) |
| Weighted average common shares outstanding: | | | | | | |
| Basic | | 9,347,103 |
| | 2,585,405 |
| | 2,419,810 |
|
| Diluted | | 10,761,852 |
| | 3,715,103 |
| | 2,419,810 |
|
See Notes to the Consolidated Financial Statements.
OPORTUN FINANCIAL CORPORATION
Consolidated Statements of Changes in Stockholders' Equity
(in thousands, except share data) |
| | | | | | | | | | | | | | | | | | | | | | | | | | | | | | | | | | | | | | | | | | | | | |
| For the Years Ended December 31, 2019, 2018 and 2017 |
| | | Convertible Preferred Stock | | Convertible Preferred and Common Stock Warrants | | Common Stock | | | | | | | | |
| | | Shares | | Par Value | | Additional Paid-in Capital | | Shares | | Par Value | | Shares | | Par Value | | Additional Paid-in Capital | | Accumulated Other Comprehensive Income (Loss) | | Retained Earnings (Deficit) | | Treasury Stock | | Total Stockholders' Equity |
| Balance – January 1, 2019 | | 14,043,977 |
| | $ | 16 |
| | $ | 257,887 |
| | 24,959 |
| | $ | 130 |
| | 2,935,249 |
| | $ | 3 |
| | $ | 44,411 |
| | $ | (132 | ) | | $ | 52,662 |
| | $ | (8,428 | ) | | $ | 346,549 |
|
| Issuance of common stock upon exercise of stock options | | — |
| | — |
| | — |
| | — |
| | — |
| | 105,909 |
| | — |
| | 791 |
| | — |
| | — |
| | — |
| | 791 |
|
| Repurchase of stock options | | — |
| | — |
| | — |
| | — |
| | — |
| | — |
| | — |
| | (86 | ) | | — |
| | — |
| | — |
| | (86 | ) |
| Issuance of common stock upon initial public offering, net of offering costs | | — |
| | — |
| | — |
| | — |
| | — |
| | 4,873,356 |
| | — |
| | 60,479 |
| | — |
| | — |
| | — |
| | 60,479 |
|
| Stock-based compensation expense | | — |
| | — |
| | — |
| | — |
| | — |
| | — |
| | — |
| | 19,183 |
| | — |
| | — |
| | — |
| | 19,183 |
|
| Conversion of convertible preferred stock to common stock in connection with initial public offering | | (14,043,977 | ) | | (16 | ) | | (257,887 | ) | | 7,643 |
| | — |
| | 19,075,167 |
| | 3 |
| | 295,356 |
| | — |
| | (37,456 | ) | | — |
| | — |
|
| Issuance of convertible preferred stock and conversion to common stock upon exercise of warrants, net | | — |
| | — |
| | — |
| | (9,090 | ) | | (67 | ) | | 3,969 |
| | — |
| | 67 |
| | — |
| | — |
| | — |
| | — |
|
| Vesting of restricted stock units, net | | — |
| | — |
| | — |
| | — |
| | — |
| | 9,507 |
| | — |
| | (92 | ) | | — |
| | — |
| | — |
| | (92 | ) |
| Cumulative effect of adoption of ASC 842 | | — |
| | — |
| | — |
| | — |
| | — |
| | — |
| | — |
| | — |
| | — |
| | (125 | ) | | — |
| | (125 | ) |
| Change in post-termination benefit obligation | | — |
| | — |
| | — |
| | — |
| | — |
| | — |
| | — |
| | — |
| | (30 | ) | | — |
| | — |
| | (30 | ) |
| Secured non-recourse affiliate note | | — |
| | — |
| | — |
| | — |
| | — |
| | — |
| | — |
| | (1,810 | ) | | — |
| | — |
| | 2,309 |
| | 499 |
|
| Net income | | — |
| | — |
| | — |
| | — |
| | — |
| | — |
| | — |
| | — |
| | — |
| | 61,598 |
| | — |
| | 61,598 |
|
| Balance – December 31, 2019 | | — |
| | $ | — |
| | $ | — |
| | 23,512 |
| | $ | 63 |
| | 27,003,157 |
| | $ | 6 |
| | $ | 418,299 |
| | $ | (162 | ) | | $ | 76,679 |
| | $ | (6,119 | ) | | $ | 488,766 |
|
| | | | | | | | | | | | | | | | | | | | | | | | | |
| Balance – January 1, 2018 | | 14,460,517 |
| | $ | 16 |
| | $ | 267,974 |
| | 24,959 |
| | $ | 130 |
| | 2,328,278 |
| | $ | 3 |
| | $ | 24,700 |
| | $ | (142 | ) | | $ | (70,732 | ) | | $ | (5,222 | ) | | $ | 216,727 |
|
| Issuance of common stock upon exercise of stock options | | — |
| | — |
| | — |
| | — |
| | — |
| | 192,979 |
| | — |
| | 1,030 |
| | — |
| | — |
| | — |
| | 1,030 |
|
| Repurchase of common stock | | — |
| | — |
| | — |
| | — |
| | — |
| | (30,287 | ) | | — |
| | — |
| | — |
| | — |
| | (896 | ) | | (896 | ) |
| Secured non-recourse affiliate note | | — |
| | — |
| | — |
| | — |
| | — |
| | — |
| | — |
| | 1,822 |
| | — |
| | — |
| | (2,310 | ) | | (488 | ) |
| Stock-based compensation expense | | — |
| | — |
| | — |
| | — |
| | — |
| | — |
| | — |
| | 6,772 |
| | — |
| | — |
| | — |
| | 6,772 |
|
| Issuance of common stock upon conversion of convertible preferred stock | | (416,540 | ) | | — |
| | (10,087 | ) | | — |
| | — |
| | 444,279 |
| | — |
| | 10,087 |
| | — |
| | — |
| | — |
| | — |
|
| Change in post-termination benefit obligation | | — |
| | — |
| | — |
| | — |
| | — |
| | — |
| | — |
| | — |
| | 10 |
| | — |
| | — |
| | 10 |
|
| Net income | | — |
| | — |
| | — |
| | — |
| | — |
| | — |
| | — |
| | — |
| | — |
| | 123,394 |
| | — |
| | 123,394 |
|
| Balance – December 31, 2018 | | 14,043,977 |
| | $ | 16 |
| | $ | 257,887 |
| | 24,959 |
| | $ | 130 |
| | 2,935,249 |
| | $ | 3 |
| | $ | 44,411 |
| | $ | (132 | ) | | $ | 52,662 |
| | $ | (8,428 | ) | | $ | 346,549 |
|
| | | | | | | | | | | | | | | | | | | | | | | | | |
| Balance – January 1, 2017 | | 14,373,976 |
| | $ | 16 |
| | $ | 265,073 |
| | 111,500 |
| | $ | 1,031 |
| | 2,420,094 |
| | $ | 3 |
| | $ | 19,299 |
| | $ | (23 | ) | | $ | (61,587 | ) | | $ | (248 | ) | | $ | 223,564 |
|
| Issuance of common stock upon exercise of stock options | | — |
| | — |
| | — |
| | — |
| | — |
| | 162,837 |
| | — |
| | 705 |
| | — |
| | — |
| | — |
| | 705 |
|
| Repurchase of common stock | | — |
| | — |
| | — |
| | — |
| | — |
| | (164,850 | ) | | — |
| | — |
| | — |
| | — |
| | (3,898 | ) | | (3,898 | ) |
| Payment of employee tax obligation paid with equivalent shares | | — |
| | — |
| | — |
| | — |
| | — |
| | (37,795 | ) | | — |
| | (769 | ) | | — |
| | — |
| | — |
| | (769 | ) |
| Stock-based compensation expense | | — |
| | — |
| | — |
| | — |
| | — |
| | — |
| | — |
| | 5,705 |
| | — |
| | — |
| | — |
| | 5,705 |
|
| Repurchase of stock options | | — |
| | — |
| | — |
| | — |
| | — |
| | — |
| | — |
| | (1,447 | ) | | — |
| | — |
| | — |
| | (1,447 | ) |
| Issuance of convertible preferred and common stock on exercise of warrants | | 86,541 |
| | — |
| | 2,901 |
| | (86,541 | ) | | (901 | ) | | — |
| | — |
| | — |
| | — |
| | — |
| | — |
| | 2,000 |
|
| Cumulative adjustment due to new accounting standards update (ASU 2016-09) | | — |
| | — |
| | — |
| | — |
| | — |
| | — |
| | — |
| | — |
| | — |
| | 1,061 |
| | — |
| | 1,061 |
|
| Change in post-termination benefit obligation | | — |
| | — |
| | — |
| | — |
| | — |
| | — |
| | — |
| | — |
| | (119 | ) | | — |
| | — |
| | (119 | ) |
| Settlement of secured non-recourse affiliate note | | — |
| | — |
| | — |
| | — |
| | — |
| | (52,008 | ) | | — |
| | 1,207 |
| | — |
| | — |
| | (1,076 | ) | | 131 |
|
| Net loss | | — |
| | — |
| | — |
| | — |
| | — |
| | — |
| | — |
| | — |
| | — |
| | (10,206 | ) | | — |
| | (10,206 | ) |
| Balance – December 31, 2017 | | 14,460,517 |
| | $ | 16 |
| | $ | 267,974 |
| | 24,959 |
| | $ | 130 |
| | 2,328,278 |
| | $ | 3 |
| | $ | 24,700 |
| | $ | (142 | ) | | $ | (70,732 | ) | | $ | (5,222 | ) | | $ | 216,727 |
|
See Notes to the Consolidated Financial Statements.
OPORTUN FINANCIAL CORPORATION
Consolidated Statements of Cash Flow
(in thousands)
|
| | | | | | | | | | | | |
| | | Year Ended December 31, |
| | | 2019 | | 2018 | | 2017 |
| Cash flows from operating activities | | | | | | |
| Net income (loss) | | $ | 61,598 |
| | $ | 123,394 |
| | $ | (10,206 | ) |
| Adjustments to reconcile net income (loss) to net cash provided by operating activities: | | | | | | |
| Depreciation and amortization | | 14,101 |
| | 11,823 |
| | 10,589 |
|
| Net decrease (increase) in fair value | | 97,237 |
| | (22,899 | ) | | — |
|
| Origination fees for loans receivable at fair value, net | | (3,777 | ) | | (17,506 | ) | | — |
|
| Gain on loan sales | | (36,537 | ) | | (33,468 | ) | | (22,254 | ) |
| Stock-based compensation expense | | 19,183 |
| | 6,772 |
| | 5,705 |
|
| Provision (release) for loan losses | | (4,483 | ) | | 16,147 |
| | 98,315 |
|
| Deferred tax provision | | 10,419 |
| | 42,023 |
| | 8,291 |
|
| Other, net | | 9,728 |
| | 6,101 |
| | 9,559 |
|
| Originations of loans sold and held for sale | | (355,617 | ) | | (292,386 | ) | | (220,529 | ) |
| Proceeds from sale of loans | | 391,438 |
| | 328,253 |
| | 241,277 |
|
| Changes in operating assets and liabilities: | | | | | | |
| Interest and fee receivable, net | | (7,128 | ) | | (6,889 | ) | | (3,453 | ) |
| Other assets | | (47,628 | ) | | (28,205 | ) | | (6,036 | ) |
| Amount due to whole loan buyer | | 5,413 |
| | 5,898 |
| | 8,560 |
|
| Other liabilities | | 64,427 |
| | (684 | ) | | 19,300 |
|
| Net cash provided by operating activities | | 218,374 |
| | 138,374 |
| | 139,118 |
|
| Cash flows from investing activities | | | | | | |
| Originations of loans | | (1,487,103 | ) | | (1,322,102 | ) | | (1,062,692 | ) |
| Repayments of loan principal | | 1,015,646 |
| | 868,619 |
| | 731,325 |
|
| Purchase of fixed assets | | (8,875 | ) | | (14,559 | ) | | (8,548 | ) |
| Capitalization of system development costs | | (17,348 | ) | | (3,385 | ) | | (3,473 | ) |
| Net cash used in investing activities | | (497,680 | ) | | (471,427 | ) | | (343,388 | ) |
| Cash flows from financing activities | | | | | | |
| Borrowings under secured financing | | 144,000 |
| | 481,000 |
| | 441,240 |
|
| Proceeds from initial public offering, net of offering costs | | 60,479 |
| | — |
| | — |
|
| Borrowings under asset-backed notes | | 249,951 |
| | 863,165 |
| | 360,001 |
|
| Payments of secured financing | | (169,000 | ) | | (549,780 | ) | | (323,460 | ) |
| Repayment of asset-backed notes | | — |
| | (424,837 | ) | | (237,544 | ) |
| Repayments of capital lease obligations | | (270 | ) | | (259 | ) | | (397 | ) |
| Payments of deferred financing costs | | — |
| | (862 | ) | | (5,874 | ) |
| Net payments related to stock-based activities | | 1,112 |
| | (354 | ) | | (3,278 | ) |
| Net cash provided by financing activities | | 286,272 |
| | 368,073 |
| | 230,688 |
|
| Net increase in cash and cash equivalents and restricted cash | | 6,966 |
| | 35,020 |
| | 26,418 |
|
| Cash and cash equivalents and restricted cash, beginning of period | | 129,175 |
| | 94,155 |
| | 67,737 |
|
| Cash and cash equivalents and restricted cash, end of period | | $ | 136,141 |
| | $ | 129,175 |
| | $ | 94,155 |
|
| | | | | | | |
| Supplemental disclosure of cash flow information | | | | | | |
| Cash and cash equivalents | | $ | 72,179 |
| | $ | 70,475 |
| | $ | 48,349 |
|
| Restricted cash | | 63,962 |
| | 58,700 |
| | 45,806 |
|
| Total cash and cash equivalents and restricted cash | | $ | 136,141 |
| | $ | 129,175 |
| | $ | 94,155 |
|
| | | | | | | |
| Cash paid for income taxes, net of refunds | | $ | 2,933 |
| | $ | 20,440 |
| | $ | 4,402 |
|
| Cash paid for interest | | $ | 58,038 |
| | $ | 42,428 |
| | $ | 31,064 |
|
| Cash paid for amounts included in the measurement of operating lease liabilities | | $ | 12,759 |
| | $ | — |
| | $ | — |
|
| Supplemental disclosures of non-cash investing and financing activities | | | | | | |
| Right of use assets obtained in exchange for operating lease obligations | | $ | 59,564 |
| | $ | — |
| | $ | — |
|
| Additional common stock issued to Series G shareholders upon initial public offering | | $ | 37,456 |
| | $ | — |
| | $ | — |
|
| Secured non-recourse affiliate note settled with common stock | | $ | — |
| | $ | — |
| | $ | 1,076 |
|
| Non-cash investment in capitalized assets | | $ | 687 |
| | $ | 544 |
| | $ | 543 |
|
See Notes to the Consolidated Financial Statements.
OPORTUN FINANCIAL CORPORATION
Notes to the Consolidated Financial Statements
December 31, 2019
|
| |
1. | Organization and Description of Business |
Oportun Financial Corporation (together with its subsidiaries, "Oportun" or the " Company") is a technology-powered and mission-driven provider of inclusive, affordable financial services to customers who do not have a credit score, known as credit invisibles, or who may have a limited credit history and are "mis-scored," meaning that the Company believes that traditional credit scores do not properly reflect such customers’ credit worthiness. The Company's primary product offerings are small dollar, unsecured installment loans and other products and services that are affordably priced and that help customers establish a credit history. The Company has developed a proprietary lending platform that enables the Company to underwrite the risk of low-to-moderate income customers that are credit invisible or mis-scored, leveraging data collected through the application process and data obtained from third-party data providers, and a technology platform for application processing, loan accounting and servicing. The Company is headquartered in San Carlos, California. The Company has been certified by the United States Department of the Treasury as a Community Development Financial Institution ("CDFI") since 2009.
The Company uses securitization transactions, warehouse facilities and other forms of debt financing, as well as whole loan sales, to finance the principal amount of most of the loans it makes to its customers.
Segments
Segments are defined as components of an enterprise for which discrete financial information is available and evaluated regularly by the chief operating decision maker ("CODM") in deciding how to allocate resources and in assessing performance. The Company’s Chief Executive Officer and the Company's Chief Financial Officer are collectively considered to be the CODM. The CODM reviews financial information presented on a consolidated basis for purposes of allocating resources and evaluating financial performance. As such, the Company’s operations constitute a single reportable segment.
Initial Public Offering
On September 30, 2019, the Company completed its initial public offering (“IPO”), in which it issued and sold 4,873,356 shares of common stock and selling stockholders sold 2,314,144 shares of common stock, including the underwriters' over-allotment, at a price of $15.00 per share with net proceeds of approximately $60.5 million, after deducting underwriting discounts and commissions of $5.1 million and offering expenses paid by us of approximately $7.5 million. In connection with the IPO, all 14,043,977 shares of the Company’s outstanding redeemable convertible preferred stock automatically converted into 19,075,167 shares of common stock. Additionally, on September 26, 2019, 3,969 shares of common stock were issued in connection with the cashless exercise of 9,090 Series F-1 convertible preferred stock warrants.
On September 9, 2019, the Company effected a one-for-eleven reverse stock split of its issued and outstanding shares of common stock and convertible preferred stock. The par value of the common and convertible preferred stock was not adjusted as a result of the reverse stock split. Accordingly, all share and per share amounts for all periods presented in the accompanying consolidated financial statements and notes thereto have been adjusted retroactively, where applicable, to reflect this reverse stock split.
|
| |
2. | Summary of Significant Accounting Policies |
Basis of Presentation ‑ The accompanying consolidated financial statements have been prepared in accordance with accounting principles generally accepted in the United States of America ("GAAP"). The consolidated financial statements include the accounts of the Company and its wholly owned subsidiaries. All intercompany accounts and transactions have been eliminated in consolidation. All share and per share amounts for all periods presented in the accompanying consolidated financial statements and notes thereto have been adjusted retroactively, where applicable, to reflect the Company's one-for-eleven reverse stock split. See "Initial Public Offering" above for additional information.
Use of Estimates ‑ The preparation of the consolidated financial statements in conformity with GAAP requires management to make estimates and assumptions that affect the reported amounts of assets and liabilities and disclosure of contingent assets and liabilities at the date of the consolidated financial statements, and the reported amounts of income and expenses during the reporting period. These estimates are based on information available as of the date of the consolidated financial statements; therefore, actual results could differ from those estimates and assumptions.
Consolidation and Variable Interest Entities ‑ The consolidated financial statements include the accounts of the Company and its wholly owned subsidiaries. The Company’s policy is to consolidate the financial statements of entities in which it has a controlling financial interest. The Company determines whether it has a controlling financial interest in an entity by evaluating whether the entity is a voting interest entity or variable interest entity ("VIE") and if the accounting guidance requires consolidation.
VIEs are entities that, by design, either (i) lack sufficient equity to permit the entity to finance its activities without additional subordinated financial support from other parties, or (ii) have equity investors that do not have the ability to make significant decisions relating to the entity’s operations through voting rights, or do not have the obligation to absorb the expected losses, or do not have the right to receive the residual returns of the entity. The Company determines whether it has a controlling financial interest in a VIE by considering whether its involvement with the VIE is significant and whether it is the primary beneficiary of the VIE based on the following:
The Company has the power to direct the activities of the VIE that most significantly impact the entity’s economic performance;
The aggregate indirect and direct variable interests held by us have the obligation to absorb losses or the right to receive benefits from the entity that could be significant to the VIE; an
Qualitative and quantitative factors regarding the nature, size, and form of the Company’s involvement with the VIE.
Foreign Currency Re-measurement ‑ The functional currency of the Company’s foreign subsidiaries is the U.S. dollar. Monetary assets and liabilities of these subsidiaries are re-measured into U.S. dollars from the local currency at rates in effect at period-end and nonmonetary assets and liabilities are re-measured at historical rates. Revenue and expenses are re-measured at average exchange rates in effect during each period. Foreign currency gains and losses from re-measurement and transaction gains and losses are recorded as other expense in the Consolidated Statements of Operations and Comprehensive Income.
Concentration of Credit Risk ‑ Financial instruments that potentially subject the Company to concentrations of credit risk consist principally of cash and cash equivalents, restricted cash and loans receivable.
As of December 31, 2019, 59%, 25%, 5%, and 5% of the owned principal balance related to customers from California, Texas, Illinois and Florida, respectively. Owned principal balance related to customers from each of the remaining states of operation continues to be at or below 2%. As of December 31, 2018, 65%, 24%, 5%, 2%, 2%, 2% of the owned principal balance related to customers from California, Texas, Illinois, Nevada, Arizona and Florida, respectively, and the owned principal balance related to customers from Idaho, Missouri, New Jersey, New Mexico, Utah and Wisconsin were not material.
Cash and Cash Equivalents ‑ Cash and cash equivalents consist of unrestricted cash balances and short-term, liquid investments with an original maturity date of three months or less at the time of purchase.
Restricted Cash ‑ Restricted cash represents cash held at a financial institution as part of the collateral for the Company’s secured financing, asset-backed notes and loans designated for sale.
Loans Receivable at Fair Value ‑ The Company elected the fair value option to account for new loan originations held for investment on or after January 1, 2018. Under the fair value option, direct loan origination fees are taken into income immediately and direct loan origination costs are expensed in the period the loan originates. Loans are charged off at the earlier of when loans are determined to be uncollectible or when loans are 120 days contractually past due and recoveries are recorded when cash is received. The Company estimates the fair value of the loans using a discounted cash flow model, which considers various unobservable inputs such as remaining cumulative charge-offs, remaining cumulative prepayments, average life and discount rate. The Company re-evaluates the fair value of loans receivable at the close of each measurement period. Changes in fair value are recorded in "Net increase (decrease) in fair value" in the Consolidated Statements of Operations and Comprehensive Income in the period of the fair value changes.
Loans Receivable at Amortized Cost ‑ Loans originated prior to January 1, 2018 are carried at amortized cost, which is the outstanding unpaid principal balance, net of deferred loan origination fees and costs and the allowance for loan losses.
The Company estimates direct loan origination costs associated with completed and successfully originated loans. The direct loan origination costs include employee compensation and independent third-party costs incurred to originate loans. Direct loan origination costs are offset against any loan origination fees and deferred and amortized over the life of the loan using effective interest rate method for loans originated before January 1, 2018.
Fair Value Measurements ‑ The Company follows applicable guidance that establishes a fair value measurement framework, provides a single definition of fair value and requires expanded disclosure summarizing fair value measurements. Such guidance emphasizes that fair value is a market-based measurement, not an entity-specific measurement. Therefore, a fair value measurement should be determined based on the assumptions that market participants would use in pricing an asset or liability.
Fair value guidance establishes a three-level hierarchy for inputs used in measuring the fair value of a financial asset or financial liability.
Level 1 financial instruments are valued based on unadjusted quoted prices in active markets for identical assets or liabilities, accessible by the Company at the measurement date.
Level 2 financial instruments are valued using quoted prices for similar assets or liabilities, quoted prices in markets that are not active, or models using inputs that are observable or can be corroborated by observable market data of substantially the full term of the assets or liabilities.
Level 3 financial instruments are valued using pricing inputs that are unobservable and reflect the Company’s own assumptions that market participants would use in pricing the asset or liability.
Loans Held for Sale ‑ Loans held for sale are recorded at the lower of cost or fair value until the loans are sold. Loans held for sale are sold within four days of origination. Cost of loans held for sale is inclusive of unpaid principal plus net deferred origination costs.
Troubled Debt Restructuring ("TDR") ‑ In certain limited circumstances, the Company grants concessions to customers for economic or legal reasons related to a customer’s financial difficulties that would otherwise not have been considered. Financial difficulty is typically evidenced by a customer’s delinquency status and not having access to funds to pay the debt, participation in a credit counseling arrangement or bankruptcy proceedings,
among others. The Company restructures a loan as a TDR only if the customer can demonstrate willingness to pay under the terms of a TDR for the foreseeable future. When a loan is restructured as a TDR, the Company may grant one or a combination of the following concessions:
Reduction of interest rate;
Extension of term, typically longer than the remaining term of the original loan; or
Forgiveness of a portion or all of the unpaid interest and late fees.
When a loan is restructured as a TDR, the customer signs a new loan document; however, the restructured loan is considered part of the Company’s ongoing effort to recover its investment in the original loan.
A loan that has been classified as a TDR remains so until the loan is paid off or charged off.
For loans recorded at amortized cost, when a loan is restructured as a TDR, the unamortized portion of deferred origination fees, net of origination costs, is amortized based on the term of the TDR, which is typically longer than the remaining term of the un-restructured loan. When a TDR is charged off, the unamortized portion of deferred origination fees, net of origination costs, is also written off.
For loans recorded at fair value, when a loan is restructured as a TDR, any new loan origination fees and costs, if any, are recognized in "Interest income" and "Operating expenses", respectively, in the Consolidated Statements of Operations and Comprehensive Income, when the TDR documents are signed, and any changes in fair value of the original loan are recorded in "Net increase (decrease) in fair value" in the Consolidated Statements of Operations and Comprehensive Income in the period of the fair value changes.
Allowance for Loan Losses ‑ The Company’s allowance for loan losses is an estimate of losses inherent in the Loans Receivable at Amortized Cost at the balance sheet date. Loans are charged off against the allowance at the earlier of when loans are determined to be uncollectible or when loans are 120 days contractually past due. Loan recoveries are recorded when cash is received.
The Company sets the allowance for loan losses on a total portfolio basis by analyzing historical charge-off rates for the loan portfolio, and certain credit quality indicators. The evaluation of the allowance for loan losses is inherently subjective, requiring significant management judgment about future events. In evaluating the sufficiency of the allowance for loan losses, management considers factors that affect loan loss experience, including current economic conditions, recent trends in delinquencies and loan seasoning, and the probability of recession forecasts that correlate to the improvement or deterioration of loan performance. Accordingly, the Company’s actual net charge-offs could differ materially from the Company’s estimate. The provision for loan loss reflects the activity for the applicable period and provides an allowance at a level that management believes is adequate to cover probable losses in the loan portfolio as of December 31, 2019 and 2018.
For Loans Receivable at Amortized Cost, TDRs are evaluated for loan losses separately during the period prior to the first two payments having been made. Afterwards, TDRs are evaluated for loan losses collectively with the total loan portfolio based on delinquency status.
Fixed Assets ‑ Fixed assets are stated at cost, less accumulated depreciation. Depreciation is calculated using the straight-line method over the estimated useful lives of the respective assets, which is generally three years for computer and office equipment and furniture and fixtures, and three to five years for purchased software, vehicles and leasehold improvements. When assets are sold or retired, the cost and related accumulated depreciation are removed from the accounts and any resulting gain or loss, if any, is included in the Consolidated Statements of Operations and Comprehensive Income. Maintenance and repairs are charged to the Consolidated Statements of Operations and Comprehensive Income as incurred.
The Company does not own any buildings or real estate. The Company enters into term leases for its headquarters, call center and store locations. Leasehold improvements are capitalized and depreciated over the lesser of their physical life or lease term of the building.
Systems Development Costs ‑ The Company capitalizes software developed or acquired for internal use in accordance with Financial Accounting Standards Board ("FASB") Accounting Standards Codification ("ASC") ASC No. 350-40, Internal-Use Software. The Company has internally developed its proprietary Web-based technology platform, which consists of application processing, credit scoring, loan accounting, servicing and collections, debit card processing, and data and analytics.
The Company capitalizes its costs to develop software when preliminary development efforts are successfully completed; management has authorized and committed project funding; and it is probable the project will be completed and the software will be used as intended. Costs incurred prior to meeting these criteria, together with costs incurred for training and maintenance, are expensed as incurred. When the software developed for internal use has reached its technological feasibility, such costs are amortized on a straight-line basis over the estimated useful life of the assets, which is generally three years. Costs incurred for upgrades and enhancements that are expected to result in additional functionality are capitalized and amortized over the estimated useful life of the upgrades.
Impairment ‑We review long-lived assets, including fixed assets, right of use assets and system development costs, for impairment whenever events or changes in circumstances indicate that the carrying amount of the assets may not be fully recoverable. An impairment loss is recognized when estimated undiscounted future cash flows expected to result from the use of the asset and its eventual disposition are less than its carrying amount. We determined that there were no events or changes in circumstances that indicated our long-lived assets were impaired for the years ended December 31, 2019, 2018 and 2017.
Revenue Recognition ‑ The Company’s primary sources of revenue consist of interest and non-interest income.
Interest Income
Interest income includes interest on loans and fees on loans. Generally, the Company’s loans require semi- monthly or biweekly customer payments of interest and principal. Fees on loans include billed late fees offset by charged-off fees and provision for uncollectible fees. The Company charges customers a late fee if a scheduled installment payment becomes delinquent. Depending on the loan, late fees are assessed when the loan is eight to 16 days delinquent. Late fees are recognized when they are billed. When a loan is charged off, uncollected late fees are also written off. For Loans Receivable at Fair Value, interest income includes (i) billed interest and late fees, plus (ii) origination fees recognized at loan disbursement, less (iii) charged-off interest and late fees, less (iv) provision for uncollectable interest and late fees. Additionally, direct loan origination expenses are recognized in operating expenses as incurred. In comparison, for Loans Receivable at Amortized Cost, interest income includes: (a) billed interest and late fees, less (b) charged-off interest and late fees, less (c) provision for uncollectable interest and late fees, plus (d) amortized origination fees recognized over the life of the loan, less (e) amortized cost of direct loan origination expenses recognized over the life of the loan.
Interest income is recognized based upon the amount the Company expects to collect from its customers. When a loan becomes delinquent for a period of 90 days or more, interest income continues to be recorded until the loan is charged off. Delinquent loans are charged off at month-end during the month it becomes 120 days’ delinquent. For both loans receivable at amortized cost and loans receivable at fair value, the Company mitigates the risk of income recorded for loans that are delinquent for 90 days or more by establishing a 100% provision and the provision for uncollectable interest and late fees is offset against interest income. Previously accrued and unpaid interest is also charged off in the month the Company receives a notification of bankruptcy, a judgment or mediated agreement by the court, or loss of life, unless there is evidence that the principal and interest are collectible.
For Loans Receivable at Fair Value, loan origination fees and costs are recognized when incurred.
Non-Interest Income
Non-interest income includes gain on loan sales, servicing fees, debit card income, sublease income and other income.
Gain on Loan Sales‑ The Company recognizes a gain on sale from the difference between the proceeds received from the purchaser and the carrying value of the loans on the Company’s books. Loans are sold within four days of origination; therefore, the Company does not record any provision for loan losses on loans designated for sale. The Company sells a certain percentage of new loans twice weekly.
The Company accounts for loan sales in accordance with ASC No. 860, Transfers and Servicing. In accordance with this guidance, a transfer of a financial asset, a group of financial assets, or a participating interest in a financial asset is accounted for as a sale if all of the following conditions are met:
The financial assets are isolated from the transferor and its consolidated affiliates as well as its creditors.
The transferee or beneficial interest holders have the right to pledge or exchange the transferred financial assets.
The transferor does not maintain effective control of the transferred assets.
For the years ended December 31, 2019, 2018 and 2017 all sales met the requirements for sale treatment. The Company records the gain on the sale of a loan at the sale date in an amount equal to the proceeds received less outstanding principal, accrued interest, late fees and net deferred origination costs.
Servicing Fees ‑ The Company retains servicing rights on sold loans. Servicing fees comprise the 5.0% per annum servicing fee based upon the average daily principal balance of loans sold that the Company earns for servicing loans sold to a third-party financial institution. The servicing fee compensates the Company for the costs incurred in servicing the loans, including providing customer services, receiving customer payments and performing appropriate collection activities. Management believes the fee approximates a market rate and accordingly has not recognized a servicing asset or liability.
Debit card income is the revenue from interchange fees when customers use our reloadable debit card for purchases as well as the associated card user fees. Sublease income is the rental income from subleasing a portion of our headquarters. Other income includes marketing incentives paid directly to us by the merchant clearing company based on transaction volumes, interest earned on cash and cash equivalents and restricted cash, and gain (loss) on asset sales.
Interest expense ‑ Interest expense consists of interest expense associated with the Company’s asset-backed notes and secured financing, and it includes origination costs as well as fees for the unused portion of the secured financing facility. Asset-backed notes at amortized cost are borrowings that originated prior to January 1, 2018, and origination costs are amortized over the life of the borrowing using the effective interest rate method. As of January 1, 2018, the Company elected the fair value option for all new borrowings under asset-backed notes issued on or after that date. Accordingly, all origination costs for such asset-backed notes at fair value are expensed as incurred.
Income Taxes ‑ The Company accounts for income taxes under the asset and liability method. Under this method, deferred tax assets and liabilities are determined based on the difference between the consolidated financial statement and tax basis of assets and liabilities using enacted tax rates in effect for the year in which the differences are expected to reverse. Valuation allowances are established when necessary to reduce deferred tax assets to an amount that is more likely than not to be realized.
Under the provisions of ASC No. 740-10, Income Taxes, the Company evaluates uncertain tax positions by reviewing against applicable tax law all positions taken by the Company with respect to tax years for which the statute of limitations is still open. ASC No. 740-10 provides that a tax benefit from an uncertain tax position may be recognized when it is more likely than not that the position will be sustained upon examination, including resolutions of any related appeals or litigation processes, based on the technical merits. The Company recognizes interest and penalties related to the liability for unrecognized tax benefits, if any, as a component of the income tax expense line in the accompanying Consolidated Statements of Operations and Comprehensive Income.
The Tax Cuts and Jobs Act was enacted December 22, 2017 and provides for a modified territorial tax system; beginning in 2018, GILTI provisions will be applied providing an incremental tax on low taxed foreign income. The GILTI provisions require the Company to include in the U.S. income tax return foreign subsidiary earnings in excess of an allowable return on the foreign subsidiary’s tangible assets. During 2018, the Company made an accounting policy election to treat taxes related to GILTI as a current period expense.
Stock-Based Compensation ‑ The Company applies the provisions of ASC No. 718-10, Stock Compensation. ASC 718-10 establishes accounting for stock-based employee awards based on the fair value of the award which is measured at grant date. Accordingly, stock-based compensation cost is recognized in operating expenses in the Consolidated Statements of Operations and Comprehensive Income over the requisite service period. The fair value of stock options granted or modified is estimated using the Black-Scholes option pricing model.
The Company granted restricted stock units ("RSUs") to employees that vest upon the satisfaction of time- based criterion of up to four years and some include a performance criterion, a liquidity event in connection with an initial public offering or a change in control. These RSUs are not considered vested until both criteria have been met, if applicable, and provided that the participant is in continuous service on the vesting date. Compensation cost for awards with performance criteria, measured on the grant date, will be recognized when both the service and performance conditions are probable of being achieved. For grants and awards with just a service condition, the Company recognizes stock-based compensation expenses using the straight-line basis over the requisite service period net of forfeitures. For grants and awards with both service and performance conditions, the Company recognizes expenses using the accelerated attribution method.
Treasury Stock ‑ From time to time, the Company repurchases shares of its common stock in a tender offer. Treasury stock is reported at cost, and no gain or loss is recorded on stock repurchase transactions. Repurchased shares are held as treasury stock until they are retired or re-issued. The Company did not retire or re-issue any treasury stock for the years ended December 31, 2019 and 2018.
Basic and Diluted Earnings per Share ‑ Basic earnings per share is computed by dividing net income per share available to common stockholders by the weighted average number of common shares outstanding for the period and excludes the effects of any potentially dilutive securities. The Company computes earnings per share using the two-class method required for participating securities. The Company considers all series of convertible preferred stock to be participating securities due to their noncumulative dividend rights. As such, net income allocated to these participating securities which includes participation rights in undistributed earnings, are subtracted from net income to determine total undistributed net income to be allocated to common stockholders. All participating securities are excluded from basic weighted-average common shares outstanding.
Diluted earnings per share reflects the potential dilution that could occur if securities or other contracts to issue common stock were exercised. It is computed by dividing net income attributable to common stockholders by the weighted-average common shares plus the effect of dilutive potential common shares outstanding during the period using the treasury stock method or the two-class method, whichever is more dilutive.
Recently Adopted Accounting Standards
Leases ‑ In February 2016, the FASB issued Accounting Standards Update ("ASU") 2016-02, Leases, which requires lessees to recognize a right-of-use asset and a liability for the obligation to make payments on leases with terms greater than 12 months and to disclose information related to the amount, timing and uncertainty of cash flows arising from leases, including various qualitative and quantitative requirements. Management has reviewed this update and other ASUs that were subsequently issued to further clarify the implementation guidance outlined in ASU 2016-02. The Company has elected the package of practical expedients, which allows the Company not to reassess (1) whether any expired or existing contracts as of the adoption date are or contain a lease, (2) lease classification for any expired or existing leases as of the adoption date and (3) initial direct costs for any existing leases as of the adoption date. The Company did not elect to apply the hindsight practical expedient when determining lease term and assessing impairment of right-of-use assets. The Company adopted the amendments of these ASUs as of January 1, 2019. See Note 15,Leases, Commitments and Contingencies for additional information on the adoption of ASU 2016-02.
Accounting Standards to be Adopted
Allowance for Loan Losses and Fair Value Option ‑ In June 2016, the FASB issued ASU 2016-13, Financial Instruments-Credit Losses: Measurement of Credit Losses on Financial Instruments. This guidance significantly changes the way entities will be required to measure credit losses. Under the new standard, estimated credit loss will be based upon an expected credit loss approach rather than an incurred loss approach that is currently required. In May 2019, the FASB issued ASU 2019-05, Financial Instruments-Credit Losses (Topic 326): Targeted Transition. This ASU provides an option to irrevocably elect the fair value option applied on an instrument-by-instrument basis for certain financial assets upon the adoption of Topic 326. In November 2019, the FASB issued ASU 2019-10, Financial Instruments - Credit Loss (Topic 326), Derivatives and Hedging (Topic 815), and Leases (Topic 842), which defers the effective date for public filers that are considered small reporting companies as defined by the Securities and Exchange Commission to fiscal years beginning after December 15, 2022, including interim periods within those fiscal years. Early adoption is permitted in fiscal years beginning after 15 December 2018, including interim periods in those fiscal years. The Company will early adopt ASU 2016-13 and ASU 2019-05 effective January 1, 2020.
The Company has previously elected fair value option for all loans originated after January 1, 2018. In addition, upon adoption of ASU 2019-05 effective January 1, 2020, the Company will elect fair value option on all remaining loans receivable currently at amortized cost. As a result, the adoption of ASU 2016-13 is not expected to have a material impact on the Company’s consolidated financial statements and disclosures. Upon the adoption of ASU 2019-05, the Company will (i) release the remaining allowance for loan losses on Loan Receivables at Amortized Cost; (ii) recognize the unamortized net originations fee income and (iii) measure the remaining loans originated prior to January 1, 2018 at fair value. These adjustments will result in an increase to opening retained earnings as of January 1, 2020 of approximately $4.8 million.
Fair Value Disclosures ‑ In August 2018, the FASB issued ASU No. 2018-13, Disclosure Framework-Changes to the Disclosure Requirements for Fair Value Measurement, which amends ASC 820, Fair Value Measurement. This ASU modifies the disclosure requirements for fair value measurements by removing, modifying, or adding certain disclosures. The ASU is effective for all entities for fiscal years beginning after December 15, 2019. The amendments on changes in unrealized gains and losses, the range and weighted average of significant unobservable inputs used to develop Level 3 fair value measurements, and the narrative description of measurement uncertainty should be applied prospectively for only the most recent interim or annual period presented in the initial fiscal year of adoption. All other amendments should be applied retrospectively to all periods presented upon their effective date. Early adoption is permitted upon issuance of this ASU. An entity is permitted to early adopt any removed or modified disclosures upon issuance of this Update and delay adoption of the additional disclosures until their effective date. The adoption of this ASU is not expected to have a material effect on the Company’s consolidated financial statements.
Cloud Computing Arrangements- In August 2018, the FASB issued ASU 2018-15, Intangibles-Goodwill and Other-Internal-Use-Software (Subtopic 350-40): Customer’s Accounting for Implementation Costs Incurred in a Cloud Computing Arrangement That Is a Service Contract. This ASU aligns the requirements for capitalizing implementation costs incurred in a hosting arrangement that is a service contract with the requirements for capitalizing implementation costs incurred to develop or obtain internal-use software (and hosting arrangements that include an internal-use software license). This ASU is effective for fiscal years, and interim periods, beginning after December 15, 2019. Early adoption is permitted. The Company will prospectively capitalize all eligible implementation costs related to cloud computing arrangements starting January 1, 2020.
Income Taxes- In December 2019, the FASB issued ASU 2019-12, Income Taxes (Topic 740): Simplifying the Accounting for Income Taxes. This ASU is intended to simplify the accounting for income taxes by removing certain exceptions to the general principles of accounting for income taxes and to improve the consistent application of GAAP for other areas of accounting for income taxes by clarifying and amending existing guidance. The ASU is effective for fiscal years beginning after December 15, 2020. Early adoption is permitted. The Company is currently evaluating the effect that the new guidance will have on its consolidated financial statements and disclosures.
|
| |
3. | Earnings (Loss) per Share |
Basic and diluted (loss) earnings per share are calculated as follows:
|
| | | | | | | | | | | | |
| | | Year Ended December 31, |
| (in thousands, except share and per share data) | | 2019 | | 2018 | | 2017 |
| Net income (loss) | | $ | 61,598 |
| | $ | 123,394 |
| | $ | (10,206 | ) |
| Less: Additional common stock issued to Series G shareholders | | (37,456 | ) | | — |
| | — |
|
Less: Net income allocated to participating securities (1) | | (19,880 | ) | | (106,797 | ) | | — |
|
| Net income (loss) attributable to common stockholders | | $ | 4,262 |
| | $ | 16,597 |
| | $ | (10,206 | ) |
| | | | | | | |
| Basic weighted-average common shares outstanding | | 9,347,103 |
| | 2,585,405 |
| | 2,419,810 |
|
| Weighted average effect of dilutive securities: | | | | | | |
| Stock options | | 1,300,758 |
| | 1,114,816 |
| | — |
|
Restricted stock units (2) | | 101,671 |
| | — |
| | — |
|
| Warrants | | 12,320 |
| | 14,882 |
| | — |
|
| Diluted weighted-average common shares outstanding | | 10,761,852 |
| | 3,715,103 |
| | 2,419,810 |
|
| | | | | | | |
| Earnings (loss) per share: | | | | | | |
| Basic | | $ | 0.46 |
| | $ | 6.42 |
| | $ | (4.22 | ) |
| Diluted | | $ | 0.40 |
| | $ | 4.47 |
| | $ | (4.22 | ) |
(1) In a period of net income, both earnings and dividends (if any) are allocated to participating securities. In a period of net loss, only dividends (if any) are allocated to participating securities.
(2) The increase in restricted stock units included in the diluted weighted-average common shares outstanding for the year ended December 31, 2019 compared to 2018 was primarily due to the performance-based condition relating to certain awards being considered probable on the effective date of the IPO, the voluntary stock option exchange offer and the issuance of restricted stock units for annual awards.
The following common share equivalent securities have been excluded from the calculation of diluted weighted-average common shares outstanding because the effect is anti-dilutive for the periods presented:
|
| | | | | | | | | |
| | | Year Ended December 31, |
| (in thousands, except share and per share data) | | 2019 | | 2018 | | 2017 |
| Stock options | | 2,231,060 |
| | — |
| | 1,138,870 |
|
| Warrants | | — |
| | — |
| | 16,920 |
|
| Convertible preferred stock | | 12,630,249 |
| | 17,497,594 |
| | 17,569,360 |
|
| Total anti-dilutive common share equivalents | | 14,861,309 |
| | 17,497,594 |
| | 18,725,150 |
|
Restricted stock units granted with performance criterion were not reflected in the computation of diluted earnings (loss) per share for the years ended December 31, 2018 and 2017 as the performance condition was not considered probable. Per the provisions of ASC Topic 260, Earnings per Share, diluted earnings (loss) per share only reflects those shares that would be issued if the reporting period were the end of the contingency period. Accordingly, total outstanding restricted stock units of 0; 503,515; and 162,236 were not reflected in the denominator in the computation of diluted earnings (loss) per share for the years ended December 31, 2019, 2018 and 2017.
The income available to common stockholders, which is the numerator in calculating diluted earnings (loss) per share, does not include any compensation cost related to these restricted stock unit awards for the years ended December 31, 2018 and 2017. For the year ended December 31, 2019, the income available to common stockholders includes $7.9 million catch-up relating to these restricted stock units because of the performance criteria being considered probable on the effective date of the IPO.
|
| |
4. | Variable Interest Entities |
As part of the Company’s overall funding strategy, the Company transfers a pool of designated loans receivable to wholly owned special-purpose subsidiaries, or VIEs, to collateralize certain asset-backed financing transactions. The Company has determined that it is the primary beneficiary of these VIEs because it has the power to direct the activities that most significantly impact the VIEs’ economic performance and the obligation to absorb the losses or the right to receive benefits from the VIEs that could potentially be significant to the VIEs. Such power arises from the Company’s contractual right to service the loans receivable securing the VIEs’ asset-backed debt obligations. The Company has an obligation to absorb losses or the right to receive benefits that are potentially significant to the VIEs because it retains the residual interest of each asset-backed financing transaction either in the form of an asset-backed certificate or as an uncertificated residual interest. Accordingly, the Company includes the VIEs’ assets, including the assets securing the financing transactions, and related liabilities in its consolidated financial statements.
Each VIE issues a series of asset-backed securities that are supported by the cash flows arising from the loans receivable securing such debt. Cash inflows arising from such loans receivable are distributed monthly to the transaction’s noteholders and related service providers in accordance with the transaction’s contractual priority of payments. The creditors of the VIEs above have no recourse to the general credit of the Company as the primary beneficiary of the VIEs and the liabilities of the VIEs can only be settled by the respective VIE’s assets. The Company retains the most subordinated economic interest in each financing transaction through its ownership of the respective residual interest in each VIE. The Company has no obligation to repurchase loans receivable that initially satisfied the financing transaction’s eligibility criteria but subsequently became delinquent or defaulted loans receivable.
The following table represents the assets and liabilities of consolidated VIEs recorded on the Company’s consolidated balance sheets:
|
| | | | | | | | |
| | | December 31, |
| (in thousands) | | 2019 | | 2018 |
| Consolidated VIE assets | | | | |
| Restricted cash | | $ | 28,821 |
| | $ | 29,184 |
|
| Loans receivable at fair value | | 1,745,465 |
| | 1,174,684 |
|
| Loans receivable at amortized cost | | 41,747 |
| | 319,129 |
|
| Interest and fee receivable | | 15,874 |
| | 13,036 |
|
| Total VIE assets | | 1,831,907 |
| | 1,536,033 |
|
| Consolidated VIE liabilities | | | | |
Secured financing (1) | | 62,000 |
| | 87,000 |
|
| Asset-backed notes at fair value | | 1,129,202 |
| | 867,278 |
|
Asset-backed notes at amortized cost (1) | | 360,001 |
| | 360,001 |
|
| Total VIE liabilities | | $ | 1,551,203 |
| | $ | 1,314,279 |
|
(1) Amounts exclude deferred financing costs. See Note 8, Borrowings for additional information.
|
| |
5. | Loans Receivable at Amortized Cost, Net |
Loans receivable at amortized cost, net, consisted of the following:
|
| | | | | | | | |
| | | December 31, |
| (in thousands) | | 2019 | | 2018 |
| Loans receivable at amortized cost | | $ | 42,546 |
| | $ | 323,814 |
|
| Deferred origination costs and fees, net | | (103 | ) | | (1,707 | ) |
| Allowance for loan losses | | (3,972 | ) | | (26,326 | ) |
| Loans receivable at amortized cost, net | | $ | 38,471 |
| | $ | 295,781 |
|
Loans receivable at amortized cost are the unpaid principal balances of the loans. Accrued and unpaid interest and late fees on the loans estimated to be collected from customers are included in interest and fees receivable in the consolidated balance sheets. At December 31, 2019 and 2018, accrued and unpaid interest on loans were $0.3 million and $2.3 million, respectively. Accrued and unpaid late fees were immaterial at December 31, 2019 and 2018.
Credit Quality Information - The Company uses a proprietary credit scoring algorithm to assess the creditworthiness of individuals who have limited or no credit profile. Data used in the algorithm is obtained from customers, alternative credit reporting agencies, as well as information from traditional credit bureaus.
The Company’s proprietary credit scoring platform determines the amount and duration of the loan. The amount of the loan is determined based on the credit risk and cash flow of the individual. Lower risk individuals with higher cash flows are eligible for larger loans with longer duration. Higher risk individuals with lower cash flows are eligible for smaller loans with shorter duration. Larger loans typically have lower interest rates than smaller loans.
After the loan is disbursed, the Company monitors the credit quality of its loans receivable on an ongoing and a total portfolio basis. The following are credit quality indicators that the Company uses to monitor its exposure to credit risk, to evaluate allowance for loan losses and help set the Company’s strategy in granting future loans:
| |
• | Delinquency Status ‑ The delinquency status of the Company’s loan receivables reflects, among other factors, changes in the mix of loans in the portfolio, the quality of receivables, the success of collection efforts and general economic conditions.
|
| |
• | Geographic Region - In July 2018, the Company stopped calculating estimated loss rates on a geographic region basis and began using the discounted cash flow model to project net charge-offs for the next 12 months for all vintages to calculate the estimated loss rate on a total portfolio basis. Until June 30, 2018, the Company calculated estimated loss rates for two geographic regions. Northern and Central California were considered as one region. Southern California, Texas and all other states, collectively, were considered as another region, and have higher estimated loss rates compared to the Northern and Central California region. The estimated loss rate for the geographic region covering Southern California, Texas and all other states for loans originated prior to January 1, 2018 and outstanding as of June 30, 2018 was approximately 105 basis points higher than the geographic region covering Northern and Central California. See Note 2, Summary of Significant Accounting Policies, for a discussion of concentrations of credit risk related to geographic regions.
|
The recorded investment in loans receivable at amortized cost based on credit quality indicators were as follows:
|
| | | | | | | | |
| | | December 31, |
Credit Quality Indicator (in thousands) | | 2019 | | 2018 |
| Geographic Region | | | | |
| Northern and Central California | | $ | 12,167 |
| | $ | 91,307 |
|
| Southern California, Texas and all other states | | 30,379 |
| | 232,507 |
|
| | | $ | 42,546 |
| | $ | 323,814 |
|
| Delinquency Status | | | | |
| 30-59 days past due | | $ | 2,304 |
| | $ | 10,891 |
|
| 60-89 days past due | | 1,615 |
| | 7,089 |
|
| 90-119 days past due | | 1,459 |
| | 5,872 |
|
| | | $ | 5,378 |
| | $ | 23,852 |
|
Past Due Loans Receivable - In accordance with the Company’s policy, for loans recorded at amortized cost, income from interest and fees continues to be recorded for loans that are delinquent 90 days or more. The Company addresses the valuation risk on loans recorded at amortized cost that are delinquent 90 days or more by reserving them at 100%.
The recorded investment in loans receivable at amortized cost that are 90 or more days’ delinquent and still accruing income from interest and fees were as follows:
|
| | | | | | | | |
| | | December 31, |
| (in thousands) | | 2019 | | 2018 |
| Non-TDRs | | $ | 720 |
| | $ | 4,440 |
|
| TDRs | | 739 |
| | 1,432 |
|
| Total | | $ | 1,459 |
| | $ | 5,872 |
|
Troubled Debt Restructurings ("TDR") - For the years ended December 31, 2019 and 2018, TDRs were primarily related to concessions involving interest rate reduction and extension of term.
As of December 31, 2019 and 2018, TDRs comprised 21% and 6% respectively, of the Company’s total owned loan portfolio at amortized cost. The increase in the percentage is reflective of the lower balance of the loan portfolio at amortized cost from 2018 to 2019.
The amount of unamortized origination fees, net of origination costs, that were written off as a result of TDR restructurings of loans recorded at amortized cost during the years ended December 31, 2019, 2018 and 2017 was not material.
The Company’s TDR loans receivable at amortized cost based on delinquency status were as follows:
|
| | | | | | | | |
| | | December 31, |
| (in thousands) | | 2019 | | 2018 |
| TDRs current to 29 days delinquent | | $ | 6,367 |
| | $ | 14,035 |
|
| TDRs 30 or more days delinquent | | 2,462 |
| | 5,246 |
|
| Total | | $ | 8,829 |
| | $ | 19,281 |
|
A loan that has been classified as a TDR remains so until the loan is paid off or charged off. A TDR loan that misses its first two scheduled payments is charged off at the end of the month upon reaching 30 days’ delinquency. A TDR loan that makes the first two scheduled payments is charged off according to the Company’s normal charge-off policy at 120 days’ delinquency.
For loans recorded at amortized cost, previously accrued but unpaid interest and fees are also written off when the loan is charged off upon reaching 120 days’ delinquency or when collection is not deemed probable.
Information on TDRs that defaulted and were charged off during the periods indicated were as follows:
|
| | | | | | | | | | | | |
| | | Year Ended December 31, |
| (in thousands) | | 2019 | | 2018 | | 2017 |
| Recorded investment in TDRs that subsequently defaulted and were charged off | | $ | 10,225 |
| | $ | 15,649 |
| | $ | 13,768 |
|
| Unpaid interest and fees charged off | | 1,286 |
| | 1,983 |
| | 1,684 |
|
When a loan recorded at amortized cost is restructured as a TDR, a portion of all of the accrued but unpaid interest and late fees may be forgiven. The following table shows the financial effects of TDRs that occurred during the periods indicated:
|
| | | | | | | | | | | | |
| | | Year Ended December 31, |
| (in thousands) | | 2019 | | 2018 | | 2017 |
| Contractual interest and fees forgiven | | $ | — |
| | $ | 157 |
| | $ | 255 |
|
Allowance for Loan Losses - For loans receivable at amortized cost, the Company sets the allowance for loan losses on a total portfolio by analyzing historical charge-off rates for the loan portfolio and the credit quality indicators discussed earlier.
The Provision (release) for loan losses reflects the activity for the applicable period and provides an allowance at a level that management believes is adequate to cover probable loan losses at the balance sheet date. The Company estimates an allowance for loan losses only for loans receivable at amortized cost.
Activity in the allowance for loan losses was as follows:
|
| | | | | | | | | | | | |
| | | Year Ended December 31, |
| (in thousands) | | 2019 | | 2018 | | 2017 |
| Balance - beginning of period | | $ | 26,326 |
| | $ | 81,577 |
| | $ | 59,943 |
|
| Provision (release) for loan losses | | (4,483 | ) | | 16,147 |
| | 98,315 |
|
| Loans charged off | | (30,702 | ) | | (82,605 | ) | | (83,940 | ) |
| Recoveries | | 12,831 |
| | 11,207 |
| | 7,259 |
|
| Balance - end of period | | $ | 3,972 |
| | $ | 26,326 |
| | $ | 81,577 |
|
The originations of loans sold and held for sale during the year ended December 31, 2019 was $355.6 million and the Company recorded a gain on sale of $36.5 million and servicing revenue of $15.4 million. The originations of loans sold and held for sale during the year ended December 31, 2018 was $292.4 million and the Company recorded a gain on sale of $33.5 million and servicing revenue of $11.8 million. The originations of loans sold and held for sale during the year ended December 31, 2017 was $220.5 million and the Company recorded a gain on sale of $22.3 million and servicing revenue of $8.3 million.
Whole Loan Sale Program ‑ In November 2014, the Company entered into a whole loan sale agreement with an institutional investor, as amended from time to time. The term of the current agreement expires on November 10, 2020. Pursuant to this agreement, the Company has committed to sell at least 10% of its unsecured loan originations, with an option to sell an additional 5%, subject to certain eligibility criteria and minimum and maximum volumes. The Company is currently selling 15% of its unsecured loan originations to the institutional investor.
In addition, in July 2017, the Company entered into a separate whole loan sale arrangement with an institutional investor as amended from time to time, providing for a commitment to sell 100% of the Company’s loans originated under its Access Loan Program.
Other assets consist of the following:
|
| | | | | | | | |
| | | December 31, |
| (in thousands) | | 2019 | | 2018 |
| Fixed assets | | | | |
| Computer and office equipment | | $ | 10,432 |
| | $ | 8,459 |
|
| Furniture and fixtures | | 10,768 |
| | 9,542 |
|
| Purchased software | | 4,527 |
| | 3,955 |
|
| Vehicles | | 171 |
| | 842 |
|
| Leasehold improvements | | 27,701 |
| | 23,006 |
|
| Total cost | | 53,599 |
| | 45,804 |
|
| Less: Accumulated depreciation | | (30,765 | ) | | (22,609 | ) |
| Total fixed assets, net | | $ | 22,834 |
| | $ | 23,195 |
|
| | | | | |
| System development costs: | | | | |
| System development costs | | $ | 36,795 |
| | $ | 19,022 |
|
| Less: Accumulated amortization | | (18,456 | ) | | (13,530 | ) |
| Total system development costs, net | | $ | 18,339 |
| | $ | 5,492 |
|
| | | | | |
| Tax receivable | | $ | 13,107 |
| | $ | 24,597 |
|
| Servicer fee and whole loan receivables | | 6,621 |
| | 5,769 |
|
| Prepaid expenses | | 12,217 |
| | 9,237 |
|
| Deferred IPO costs | | — |
| | 3,211 |
|
| Other | | 2,090 |
| | 1,797 |
|
| Total other assets | | $ | 75,208 |
| | $ | 73,298 |
|
Fixed Assets
Depreciation and amortization expense for the years ended December 31, 2019, 2018 and 2017 were $8.8 million, $8.3 million, and $7.5 million, respectively.
System Development Costs
Amortization of system development costs for years ended December 31, 2019, 2018 and 2017 was $4.9 million, $3.5 million, and $3.1 million, respectively. System development costs capitalized in the years ended December 31, 2019, 2018 and 2017, were $17.9 million, $3.3 million, and $3.5 million, respectively.
The following table presents information regarding the Company's secured financing facility:
|
| | | | | | | | | | | | |
| | | December 31, 2019 |
| Variable Interest Entity | | Current Balance | | Commitment Amount | | Maturity Date | | Interest Rate |
| (in thousands) | | | | | | | | |
| Oportun Funding V, LLC | | $ | 60,910 |
| | $ | 400,000 |
| | 10/1/2021 | | LIBOR (minimum of 0.00%) + 2.45% |
|
| | | | | | | | | | | | |
| | | December 31, 2018 |
| Variable Interest Entity | | Current Balance | | Commitment Amount | | Maturity Date | | Interest Rate |
| (in thousands) | | | | | | | | |
| Oportun Funding V, LLC | | $ | 85,289 |
| | $ | 400,000 |
| | 10/1/2021 | | LIBOR (minimum of 0.00%) + 2.45% |
The Company elected the fair value option for all asset-backed notes issued on or after January 1, 2018. The following table presents information regarding asset-backed notes:
|
| | | | | | | | | | | | | | | | | | | | | |
| | | December 31, 2019 |
| Variable Interest Entity | | Initial note amount issued (a) | | Initial collateral balance (b) | | Current balance (a) | | Current collateral balance (b) | | Weighted average interest rate(c) | | Original revolving period |
| (in thousands) | | | | | | | | | | | | |
| Asset-backed notes recorded at fair value: | | | | | | | | | | | | |
| Oportun Funding XIII, LLC (Series 2019-A) | | $ | 279,412 |
| | $ | 294,118 |
| | $ | 251,090 |
| | $ | 299,813 |
| | 3.22 | % | | 3 years |
| Oportun Funding XII, LLC (Series 2018-D) | | 175,002 |
| | 184,213 |
| | 178,980 |
| | 187,447 |
| | 4.50 | % | | 3 years |
| Oportun Funding X, LLC (Series 2018-C) | | 275,000 |
| | 289,474 |
| | 280,852 |
| | 294,380 |
| | 4.39 | % | | 3 years |
| Oportun Funding IX, LLC (Series 2018-B) | | 225,001 |
| | 236,854 |
| | 216,306 |
| | 241,000 |
| | 4.09 | % | | 3 years |
| Oportun Funding VIII, LLC (Series 2018-A) | | 200,004 |
| | 222,229 |
| | 201,974 |
| | 225,945 |
| | 3.83 | % | | 3 years |
| Total asset-backed notes recorded at fair value | | $ | 1,154,419 |
| | $ | 1,226,888 |
| | $ | 1,129,202 |
| | $ | 1,248,585 |
| | | | |
| Asset-backed notes recorded at amortized cost: | | | | | | | | | | | | |
| Oportun Funding VII, LLC (Series 2017-B) | | $ | 200,000 |
| | $ | 222,231 |
| | $ | 199,413 |
| | $ | 225,925 |
| | 3.51 | % | | 3 years |
| Oportun Funding VI, LLC (Series 2017-A) | | 160,001 |
| | 188,241 |
| | 159,698 |
| | 191,223 |
| | 3.36 | % | | 3 years |
| Total asset-backed notes recorded at amortized cost | | $ | 360,001 |
| | $ | 410,472 |
| | $ | 359,111 |
| | $ | 417,148 |
| |
| | |
|
| | | | | | | | | | | | | | | | | | | | | |
| | | December 31, 2018 |
| Variable Interest Entity | | Initial note amount issued (a) | | Initial collateral balance (b) | | Current balance (a) | | Current collateral balance (b) | | Weighted average interest rate(c) | | Original revolving period |
| (in thousands) | | | | | | | | | | | | |
| Asset-backed notes recorded at fair value: | | | | | | | | | | | | |
| Oportun Funding XII, LLC (Series 2018-D) | | $ | 175,002 |
| | $ | 184,213 |
| | $ | 177,086 |
| | $ | 188,710 |
| | 4.50 | % | | 3 years |
| Oportun Funding X, LLC (Series 2018-C) | | 275,000 |
| | 289,474 |
| | 277,662 |
| | 297,443 |
| | 4.39 | % | | 3 years |
| Oportun Funding IX, LLC (Series 2018-B) | | 225,001 |
| | 236,854 |
| | 213,751 |
| | 241,353 |
| | 4.09 | % | | 3 years |
| Oportun Funding VIII, LLC (Series 2018-A) | | 200,004 |
| | 222,229 |
| | 198,779 |
| | 226,465 |
| | 3.83 | % | | 3 years |
| Total asset-backed notes recorded at fair value: | | $ | 875,007 |
| | $ | 932,770 |
| | $ | 867,278 |
| | $ | 953,971 |
| | | | |
| Asset-backed notes recorded at amortized cost: | | | | | | | | | | | | |
| Oportun Funding VII, LLC (Series 2017-B) | | $ | 200,000 |
| | $ | 222,231 |
| | $ | 198,677 |
| | $ | 226,465 |
| | 3.51 | % | | 3 years |
| Oportun Funding VI, LLC (Series 2017-A) | | 160,001 |
| | 188,241 |
| | 159,022 |
| | 191,447 |
| | 3.36 | % | | 3 years |
| Total asset-backed notes recorded at amortized cost | | $ | 360,001 |
| | $ | 410,472 |
| | $ | 357,699 |
| | $ | 417,912 |
| | | | |
(a) Initial note amount issued includes notes retained by the Company as applicable and the current balances are measured at fair value for asset-backed notes recorded at fair value and reflects pay-downs subsequent to note issuance and exclude notes retained by the Company.
(b) Includes the unpaid principal balance of loans receivables, cash, cash equivalents and restricted cash pledged by the Company.
(c) Weighted average interest rate excludes notes retained by the Company.
As of December 31, 2019 and 2018, the Company was in compliance with all covenants and requirements of the secured financing facility and asset-backed notes.
Other liabilities consist of the following:
|
| | | | | | | | |
| | | December 31, |
| (in thousands) | | 2019 | | 2018 |
| Accounts payable | | $ | 5,919 |
| | $ | 7,277 |
|
| Accrued compensation | | 22,226 |
| | 15,303 |
|
| Accrued expenses | | 15,110 |
| | 10,335 |
|
| Deferred rent | | — |
| | 2,208 |
|
| Taxes payable | | 4,233 |
| | 1,610 |
|
| Accrued interest | | 3,842 |
| | 3,368 |
|
| Other | | 976 |
| | 1,157 |
|
| Total other liabilities | | $ | 52,306 |
| | $ | 41,258 |
|
Convertible Preferred Stock - Immediately prior to the completion of the IPO, all 14,043,977 shares of convertible preferred stock were converted into 19,075,167 shares of the Company's common stock. The conversion of all of the Company's convertible preferred stock included an additional 1,873,355 shares of common stock issued for the conversion of the Series G convertible preferred stock to reflect the conversion rate of the Series G convertible preferred stock. The additional 1,873,355 shares issued to Series G convertible preferred stockholders resulted in a $37.5 million reduction to retained earnings and a corresponding increase to additional paid-in capital.
The Company's Board of Directors will have the authority, without further action by the Company's stockholders, to issue up to 100,000,000 shares of undesignated preferred stock with rights and preferences, including voting rights, designated from time to time by the Board of Directors. There were no shares of convertible preferred stock issued or outstanding as of December 31, 2019. A summary of the Company's convertible preferred stock as of December 31, 2018 is as follows:
|
| | | | | | | | | | | | | | |
| | | December 31, 2018 |
Series (in thousands, except share data) | | Shares Authorized | | Shares Issued and Outstanding | | Liquidation Amount | | Proceeds - Net of Issuance Costs |
| A‐1 | | 23,636 |
| | 22,945 |
| | $ | 57 |
| | $ | 45 |
|
| B‐1 | | 418,181 |
| | 397,197 |
| | 2,760 |
| | 3,878 |
|
| C‐1 | | 609,090 |
| | 577,315 |
| | 13,505 |
| | 19,184 |
|
| D‐1 | | 863,636 |
| | 837,399 |
| | 19,588 |
| | 27,950 |
|
| E‐1 | | 454,545 |
| | 435,374 |
| | 14,090 |
| | 20,037 |
|
| F | | 1,000,000 |
| | 939,500 |
| | 43,425 |
| | 22,794 |
|
| F‐1 | | 4,545,454 |
| | 4,310,729 |
| | 36,426 |
| | 36,756 |
|
| G | | 5,727,272 |
| | 3,889,093 |
| | 48,981 |
| | 48,785 |
|
| H | | 2,909,090 |
| | 2,634,425 |
| | 82,511 |
| | 78,474 |
|
| | | 16,550,904 |
| | 14,043,977 |
| | $ | 261,343 |
| | $ | 257,903 |
|
Common Stock - As of December 31, 2019 and 2018, the Company was authorized to issue 1,000,000,000 and 28,181,818 shares of common stock with a par value of $0.0001 per share, respectively. As of December 31, 2019, 27,262,639 and 27,003,157 shares were issued and outstanding, respectively, and 259,482 shares were held in treasury stock. As of December 31, 2018, 3,194,731 and 2,935,249 shares were issued and outstanding, respectively, and 259,482 shares were held in treasury stock.
An aggregate of 30,287 shares of Company common stock were tendered pursuant to a tender offer conducted by the Company for a total purchase price of $0.9 million on October 3, 2018. Shares repurchased are reflected in the treasury stock components of stockholders' equity.
Warrants - On September 26, 2019, 3,969 shares of convertible preferred stock were issued in connection with the cashless exercise of 9,090 Series F-1 convertible preferred stock warrants. All 3,969 shares were converted to common stock in connection with the IPO. Additionally, at the closing of the IPO, the outstanding 15,869 Series G convertible preferred stock warrants automatically converted into warrants exercisable for 23,512 shares of common stock.
|
| |
11. | Equity Compensation and Other Benefits |
2019 Equity Incentive Plan
We currently have one stockholder-approved plan from which we can issue stock-based awards, which was approved by our stockholders in fiscal year 2019 (the "2019 Plan"). The 2019 Plan became effective on September 25, 2019 and replaced the Amended and Restated 2005 Stock Option / Stock Issuance Plan and the 2015 Stock Option/Stock Issuance Plan (collectively, the “Previous Plans”). The Previous Plans solely exist to satisfy outstanding options previously granted under those plans. The 2019 Plan provides for the grant of incentive stock options, or ISOs, nonstatutory stock options, or NSOs, stock appreciation rights, restricted stock awards, restricted stock unit awards, performance-based awards, and other awards, or collectively, awards. ISOs may be granted only to the Company's employees, including officers, and the employees of its affiliates. All other awards may be granted to the employees, including officers, non-employee directors and consultants and the employees and consultants of the Company's affiliates. The maximum number of shares of our common stock that may be issued under the 2019 Plan will not exceed 7,469,664 shares, of which, 1,870,745 were available for future awards as of December 31, 2019.
2019 Employee Stock Purchase Plan
In September 2019, the Board adopted, and stockholders approved, the Company's 2019 Employee Stock Purchase Plan (the "ESPP"). The ESPP became effective on September 25, 2019. The purpose of the ESPP is to secure the services of new employees, to retain the services of existing employees and to provide incentives for such individuals to exert maximum efforts toward the Company's success and that of its affiliates. The ESPP includes two components. One component is designed to allow eligible U.S. employees to purchase common stock in a manner that may qualify for favorable tax treatment under Section 423 of the Code. In addition, purchase rights may be granted under a component that does not qualify for such favorable tax treatment when necessary or appropriate to permit participation by eligible employees who are foreign nationals or employed outside of the United States while complying with applicable foreign laws. The maximum aggregate number of shares of common stock that may be issued under the ESPP is 726,186 shares and as of December 31, 2019, no shares have been issued under the ESPP.
Generally, all regular employees, including executive officers, employed by the Company or by any of its designated affiliates, will be eligible to participate in the ESPP and may contribute, normally through payroll deductions, up to 15% of their earnings (as defined in the ESPP) for the purchase of common stock under the ESPP. Unless otherwise determined by the Board, common stock will be purchased for the accounts of employees participating in the ESPP at a price per share equal to the lower of (a) 85% of the fair market value of a share of the Company's common stock on the first date of an offering or (b) 85% of the fair market value of a share of the common stock on the date of purchase.
| Director | | Stock Awards (#) | | | Stock Options
The term of an option may not exceed 10 years as determined by the Board, and each option generally vests over a four-year period with 25% vesting on the first anniversary date of the grant and 1/36th of the remaining amount vesting at monthly intervals thereafter. Option holders are allowed to exercise unvested options to acquire restricted shares. Upon termination of employment, option holders have a period of up to three months in which to exercise any remaining vested options. The Company has the right to repurchase at the original purchase price any unvested but issued common shares upon termination of service. Unexercised options granted to participants who separate from the Company are forfeited and returned to the pool of stock options available for grant.
The Company estimates the fair value of stock options granted using the Black-Scholes option-pricing model. The fair value is then amortized ratably over the requisite service periods of the awards, which is generally the vesting period.
The fair value of stock option grants was estimated with the following assumptions:
| | | | | | | | | | | Year Ended December 31, | | | | 2019 | | 2018 | | 2017 | | Expected volatility (employee) | | 50.8 % - 51.2 % | | 42.6 % - 43.2 % | | 43.1 % - 44.2 % | | Risk-free interest rate (employee) | | 1.8 - 2.6 | | 2.6 - 2.9 | | 1.9 - 2.3 | | Expected term (employee, in years) | | 5.9 - 6.1 | | 5.7 - 6.1 | | 5.7 - 6.1 | | Expected dividend | | —% | | —% | | —% |
These assumptions are defined as follows:
| | • | Expected Volatility ‑ Since the Company does not have enough trading history to use the volatility of its own common stock, the option’s expected volatility is estimated based on historical volatility of a peer group’s common stock.
| |
| | • | Risk-Free Interest Rate‑ The risk-free interest rate is based on the U.S. Treasury zero-coupon issues in effect at the time of grant for periods corresponding with the expected term of the option.Carl Pascarella(1) | | | 34,908 | (2) | | | — | | |
| | • | Expected Term ‑ The option’s expected term represents the period that the Company’s stock-based awards are expected to be outstanding.
| | Roy Banks | | | 9,721 | | | | — | |
| | • | Expected Dividend - The Company has no plans to pay dividends.| Jo Ann Barefoot | | | 9,721 | | | | 18,181 | | Mohit Daswani(3) | | | — | | | | — | | | Ginny Lee | | | 29,499 | (4) | | | — | | | Louis P. Miramontes | | | 9,721 | | | | 18,181 | | Carlos Minetti(3) | | | — | | | | — | | Scott Parker(5) | | | — | | | | — | | | Sandra A. Smith | | | 9,721 | | | | — | | David Strohm(6) | | | 19,917 | (7) | | | — | | Frederic Welts(6) | | | 14,079 | (8) | | | — | | | R. Neil Williams | | | 40,834 | (9) | | | 18,181 | | |
| (1) | Mr. Pascarella resigned on November 4, 2023. |
| (2) | As there was no public marketComprises 34,908 fully vested shares subject to future release, earned pursuant to an election to receive his annual retainer compensation in the form of RSUs for the Company’syears of 2020, 2021, 2022 and 2023.
|
| (3) | Mr. Daswani and Mr. Minetti were both appointed to the Board on February 7, 2024 and therefore did not receive compensation for 2023. |
| (4) | Includes 19,778 fully vested shares subject to future release, earned pursuant to an election to receive her annual retainer compensation in the form of RSUs for the years of 2022 and 2023. |
| (5) | Mr. Parker was appointed to the Board on April 19, 2024 and therefore did not receive compensation for 2023. |
| (6) | Mr. Strohm and Mr. Welts did not stand for re-election at the 2023 annual meeting of stockholders. |
| (7) | Comprises 19,917 fully vested shares subject to future release, earned pursuant to an election to receive his annual retainer compensation in the form of RSUs for the years of 2020, 2021, 2022 and 2023. |
| (8) | Comprises 14,079 fully vested shares subject to future release, earned pursuant to an election to receive his annual retainer compensation in the form of RSUs for the years of 2022 and 2023. |
| (9) | Includes 31,113 fully vested shares subject to future release, earned pursuant to an election to receive his annual retainer compensation in the form of RSUs for the years of 2020, 2021, 2022 and 2023. |
Item 12. Security Ownership of Certain Beneficial Owners and Management and Related Stockholder Matters
Equity Compensation Plan Information The following table provides information as of December 31, 2023 with respect to shares of our common stock that may be issued under our existing equity compensation plans:
| Plan Category | | Number of Securities to be Issued Upon Exercise of Outstanding Options, Restricted Stock Units and Rights (#) | | | Weighted Average Exercise Price of Outstanding Options(1) ($) | | | Number of Securities Remaining Available for Future Issuance Under Equity Compensation Plans (Excluding Securities Reflected in the First Column) (#) | | | Equity compensation plans approved by security holders | | | | | | | | | | 2019 Equity Incentive Plan(2) | | | 5,007,959 | | | | 17.08 | | | | 3,192,145 | | | 2015 Stock Option / Stock Issuance Plan | | | 1,174,403 | | | | 20.41 | | | | — | | | 2005 Stock Option / Stock Issuance Plan | | | 324,379 | | | | 14.82 | | | | — | | 2019 Employee Stock Purchase Plan(3) | | | — | | | | — | | | | 1,926,598 | | | Equity compensation plans not approved by security holders | | | | | | | | | | | | | | 2021 Inducement Equity Incentive Plan | | | 421,954 | | | | | | | | 518,558 | | | Total | | | 6,928,695 | | | | | | | | 5,637,301 | |
| (1) | PSUs and RSUs, which do not have an exercise price, are excluded in the calculation of weighted-average exercise price. |
| (2) | Our 2019 Equity Incentive Plan (“2019 Plan”) provides that the number of shares of common stock available for issuance under the 2019 Plan automatically increases on the first day of each fiscal year beginning with the 2020 fiscal year, in an amount equal to 5% of the outstanding shares of our common stock on the last day of the immediately preceding fiscal year. The Board may act prior to the IPO,first day of any fiscal year to provide that the fair value underlyingincrease in the Company’sshare reserve for such fiscal year will be a lesser number of shares. |
| (3) | Our 2019 Employee Stock Purchase Plan (“ESPP”) provides that the number of shares of common stock was determined byavailable for issuance under the Company’s Board. The valuationsESPP automatically increases on the first day of each fiscal year beginning with the 2020 fiscal year, in an amount equal to the lesser of (i) 1% of the Company’soutstanding shares of our common stock were determinedon the last day of the immediately preceding fiscal year or (ii) 726,186 shares. The Board may act prior to the first day of any fiscal year to provide that there will be no increase in the share reserve for such fiscal year or that the increase in the share reserve for such fiscal year will be a lesser number of shares. |
Stock Ownership Table
The following table sets forth certain information with respect to the beneficial ownership of our common stock as of April 24, 2024 for:
each person, or group of affiliated persons, who beneficially owned more than 5% of our common stock; each of our named executive officers; each of our directors and nominees for director; and all of our current executive officers and directors as a group.
We have determined beneficial ownership in accordance with the rules of the SEC and the information is not necessarily indicative of beneficial ownership for any other purpose. Unless otherwise indicated below, to our knowledge, the persons and entities named in the table have sole voting and sole investment power with respect to all shares that they beneficially owned, subject to community property laws where applicable.
We have based our calculation of the percentage of beneficial ownership on35,586,052 shares of our common stock outstanding as of April 24, 2024. We have deemed shares of our common stock subject to stock options that are currently exercisable or exercisable and RSUs that will vest within 60 days after April 24, 2024, to be outstanding and to be beneficially owned by the person holding the stock option for the purpose of computing the percentage ownership of that person. We did not deem these shares outstanding, however, for the purpose of computing the percentage ownership of any other person.
Unless otherwise indicated, the address of each beneficial owner listed in the table below is c/o Oportun Financial Corporation, 2 Circle Star Way, San Carlos, CA 94070.
| Name of Beneficial Owner | | Number of Shares Beneficially Owned (1) | | | Percentage of Shares Beneficially Owned | | | 5% Stockholders: | | | | | | | Entities affiliated with Neuberger Berman (2) | | | 4,193,453 | | | | 10.5 | % | Entities affiliated with Findell Capital Management LLC (3) | | | 2,944,600 | | | | 8.3 | % | Institutional Venture Partners XIV, L.P. (4) | | | 2,921,267 | | | | 8.2 | % | Entities affiliated with Ellington (5) | | | 2,484,149 | | | | 7.0 | % | | Directors and Named Executive Officers: | | | | | | | | | Raul Vazquez (6) | | | 1,823,250 | | | | 5.0 | % | Kathleen Layton (7) | | | 64,487 | | | | * | | Patrick Kirscht (8) | | | 522,926 | | | | 1.5 | % | Roy Banks (9) | | | 35,962 | | | | * | | Jo Ann Barefoot (10) | | | 69,046 | | | | * | | Mohit Daswani (11) | | | 7,818 | | | | * | | Ginny Lee (12) | | | 55,740 | | | | * | | Carlos Minetti (13) | | | 7,818 | | | | * | | Lou Miramontes (14) | | | 63,689 | | | | * | | Scott Parker (15) | | | 20,000 | | | | * | | Sandra A. Smith (16) | | | 50,865 | | | | * | | Neil Williams (17) | | | 95,299 | | | | * | | All executive officers and directors as a group (13 persons) (18) | | | 3,456,010 | | | | 9.3 | % |
| * | Represents beneficial ownership of less than one percent of the outstanding common stock. |
(1) | Represents shares of common stock beneficially owned by such individual or entity, and includes shares held in the beneficial owner’s name or jointly with others, or in the name of a bank, nominee or trustee for the beneficial owner’s account. |
(2) | Consists of 2,904,355 shares of common stock issuable upon exercise of warrants issued or issuable to NB Specialty Finance Fund II, 1,056,129 shares of common stock issuable upon exercise of warrants issued or issuable to NBSF Canada 2021 Trust, and 232,969 shares of common stock issuable upon exercise of warrants issued or issuable to NB Direct Access Fund LP. Ultimate voting and dispositive power with respect to the shares of common stock issuable is exercised by NB Alternatives Advisers LLC. We have based percentage ownership assuming full exercise of the warrants. Pursuant to a beneficial ownership limitation included in the warrants, the entities affiliated with Neuberger Berman are prohibited from exercising the warrants to the extent that such exercise would result in having beneficial ownership in excess of 9.9% of the outstanding shares of our common stock. The address for NB Alternatives Advisers LLC is 325 N. Saint Paul Street, Suite 4900, Dallas, TX 75201. |
(3) | Based on a Schedule 13D/A filed with the guidelines outlinedSEC on April 23, 2024, by Findell Capital Partners, LP (“FCP”), Finn Management GP LLC (“FMGP”), Findell Capital Management LLC (“FCM”) and Brian A. Finn (collectively, “Findell”). According to the Schedule 13D/A, as of April 23, 2024, Findell beneficially owned 2,944,600 shares in the American Instituteaggregate, including (i) 2,021,000 shares held directly by FCP and (ii) 923,600 shares held in certain separately managed accounts. Each of Certified Public Accountants, ValuationFCP, FCM, FMGP and Mr. Finn has shared voting power and shared investment power with respect to the shares beneficially owned by them. The address for each of Privately-Held-Company Equity Securities IssuedFCP, FMGP, FCM and Mr. Finn is 88 Pine Street, Suite 2240, New York, New York 10005. |
(4) | Based on a Schedule 13G filed with the SEC on February 13, 2024, by Institutional Venture Partners XIV, L.P. (“IVP XIV”), Institutional Venture Management XIV, LLC (“IVM XIV”), Todd C. Chaffee (“Chaffee”), Norman A. Fogelsong (“Fogelsong”), Stephen J. Harrick (“Harrick”), J. Sanford Miller (“Miller”), Dennis B. Phelps (“Phelps”), Jules A. Maltz (“Maltz”) (Chaffee, Fogelsong, Harrick, Miller, Phelps and Maltz, collectively, the “Managing Partners”) (IVP XIV, IVM XIV and the Managing Directors, collectively, “IVP”). According to the Schedule 13G, IVM XIV serves as Compensation. In the absencesole general partner of a public market,IVP XIV and has sole voting and investment control over the shares owned by IVP XIV and may be deemed to own beneficially the shares held by IVP XIV. IVM XIV owns no securities of the Company relied upon contemporaneous valuations performeddirectly. Chaffee, Fogelsong, Harrick, Miller, Maltz and Phelps are Managing Directors of IVM XIV and share voting and dispositive power over the shares held by an independent third-party valuation firm,IVP XIV and may be deemed to own beneficially the Company’s actual operating and financial performance, forecasts, including the current statusshares held by IVP XIV. The Managing Directors own no securities of the technicalIssuer directly. According to the Schedule 13G, as of February 13, 2024, IVP has shared voting and commercial successdispositive power with respect to 2,921,267 shares. The address for IVP is c/o Institutional Venture Partners, 3000 Sand Hill Road, Building 2, Suite 250, Menlo Park, California 94025. |
(5) | Based on a Schedule 13G/A filed with the SEC on January 17, 2024, by Ellington Management Group, LLC, EMG Holdings, L.P., VC Investments LLC and Michael W. Vranos (collectively, “Ellington”). According to the Schedule 13G/A, as of January 17, 2024, Ellington has shared voting and dispositive power with respect to 2,484,149 shares. The address for Ellington is 53 Forest Avenue, Old Greenwich, Connecticut 06870. |
(6) | Consists of (a) 848,715 shares held by Mr. Vazquez directly, (b) 233,709 shares held in a trust for which Mr. Vazquez is trustee, and (c) 803,156 stock options stock options that are vested and exercisable within 60 days from April 24, 2024. |
(7) | Consists of (a) 24,365 shares and (b) 40,122 stock options that are vested and exercisable within 60 days from April 24, 2024. |
(8) | Consists of (a) 175,610 shares held by Mr. Kirscht directly, (b) 5,800 shares held in two accounts by Mr. Kirscht’s daughters containing 2,900 shares each, and (c) 341,516 stock options that are vested and exercisable within 60 days from April 24, 2024. |
(9) | Consists of (a) 31,102 shares and (b) 4,860 RSUs that are scheduled to vest within 60 days from April 24, 2024. |
(10) | Consists of (a) 46,005 shares, (b) 4,860 RSUs that are scheduled to vest within 60 days from April 24, 2024, and (c) 18,181 stock options that are vested and exercisable within 60 days from April 24, 2024. |
(11) | Consists of (a) 3,909 shares and (b) 3,909 RSUs that are scheduled to vest within 60 days from April 24, 2024. |
(12) | Consists of (a) 31,102 shares, (b) 19,778 fully vested deferred RSUs, and (c) 4,860 RSUs that are scheduled to vest within 60 days from April 24, 2024. |
(13) | Consists of (a) 3,909 shares and (b) 3,909 RSUs that are scheduled to vest within 60 days from April 24, 2024. |
(14) | Consists of (a) 40,648 shares and (b) 4,860 RSUs that are scheduled to vest within 60 days from April 24, 2024, and (c) 18,181 stock options that are vested and exercisable within 60 days from April 24, 2024. |
(15) | Consists of 20,000 shares. |
(16) | Consists of (a) 46,005 shares and (b) 4,860 RSUs that are scheduled to vest within 60 days from April 24, 2024. |
(17) | Consists of (a) 41,145 shares, (b) 31,113 fully vested deferred RSUs, (c) 4,860 RSUs that are scheduled to vest within 60 days from April 24, 2024, and (d) 18,181 stock options that are vested and exercisable within 60 days from April 24, 2024. |
(18) | Includes shares beneficially owned by all current executive officers and directors of the Company’s operations, the potential for an initial public offering, the macroeconomic environment, interest rates, market outlook,company. Consists of (a) 1,977,495 shares, (b) 50,891 fully vested deferred RSUs, (c) 36,978 RSUs that are scheduled to vest within 60 days from April 24, 2024, and competitive environment, among other factors.
Stock Option Activity - A summary of the Company's stock option activity under the 2005 Plan, the 2015 Plan, and the 2019 Plan at December 31, 2019 is as follows:
| | | | | | | | | | | | | | | (in thousands, except share and per share data) | | Options Outstanding | | Options Weighted-Average Exercise Price | | Weighted Average Remaining Life (in years) | | Aggregate Intrinsic Value | | Balance – January 1, 2019 | | 4,593,202 |
| | 16.31 |
| | 6.67 | | $ | 38,723 |
| | Options granted | | 682,679 |
| | 19.08 |
| | | | |
| | Options exercised | | (105,909 | ) | | 7.44 |
| | | | |
| | Options canceled | | (1,219,282 | ) | | 26.04 |
| | | | |
| | Balance – December 31, 2019 | | 3,950,690 |
| | 14.03 |
| | 5.87 | | $ | 40,264 |
| | | | | | | | | | | | Options vested and expected to vest - December 31, 2019 | | 3,950,690 |
| | 14.03 |
| | 5.87 | | $ | 40,264 |
| | Options vested and exercisable - December 31, 2019 | | 2,795,568 |
| | 11.20 |
| | 4.68 | | $ | 36,298 |
|
Information on(d) 1,390,646 stock options granted, exercised and vested is as follows:exercisable within 60 days from April 24, 2024.
|
Item 13. Certain Relationships and Related Transactions, and Director Independence
Certain Relationships and Related Transactions
The following is a summary of transactions and arrangements, since the beginning of our last two fiscal years, to which we have been a participant, in which the amount involved exceeded or will exceed the lesser of $120,000 or one percent of the average Company’s total assets at year-end for the last two completed fiscal years in which we were or are to be a participant and in which a related person had or will have a direct or indirect material interest. A related person is: (i) an executive officer, director or director nominee, (ii) a beneficial owner of more than 5% of our common stock, (iii) an immediate family member of an executive officer, director or director nominee or beneficial owner of more than 5% of our common stock, or (iv) any entity that is owned or controlled by any of the foregoing persons has a substantial ownership interest or control.
Indemnification Agreements
Our amended and restated certificate of incorporation contains provisions limiting the liability of our directors, and our amended and restated bylaws provide that we indemnify each of our directors to the fullest extent permitted under Delaware law. Our amended and restated certificate of incorporation and amended and restated bylaws also provide our Board with discretion to indemnify our officers and employees when determined appropriate by our Board. In addition, we have entered and expect to continue to enter into agreements to indemnify our directors and executive officers.
Investors’ Rights Agreements and Registration Rights Agreements
We are party to an amended and restated investors’ rights agreement (the “IRA”) with certain purchasers of the Company’s preferred stock (which converted to common stock in our IPO), which provides, among other things, that certain holders of our capital stock, have the right to demand that we file a registration statement or request that their shares of our capital stock be included on a registration statement that we are otherwise filing. As of September 30, 2023 the obligations under the IRA were terminated.
In connection with the acquisition of Hello Digit, Inc. (“Digit”) we entered into a registration rights agreement with the holders of Digit stock, pursuant to which the holders have certain “piggyback” registration rights with respect to registrations of equity securities initiated by the Company.
Transactions with Credit Karma and Hummingbird
Raul Vazquez is currently a member of the board of directors of Intuit Inc. (“Intuit”). On December 3, 2020, Intuit acquired Credit Karma. We have conducted business with Credit Karma for lead generation services since November 2019 and made payments to Credit Karma of approximately $8.9 million for services provided in 2022 and payments of approximately $1.6 million for services provided in 2023. Mr. Vazquez is not involved in directly managing Credit Karma and these transactions with Credit Karma were entered into in the ordinary course of business. This transaction was approved in accordance with Oportun’s Related Person Transactions Policy.
We entered into an agreement with Hummingbird RegTech, Inc. (“Hummingbird”), a provider of compliance software, in 2022, and made payments to them of approximately $178,000 in 2022 and payments of approximately $245,000 in 2023. A member of our Board of Directors, Jo Ann Barefoot, is a co-founder and shareholder of Hummingbird. Ms. Barefoot is not involved in directly managing Hummingbird and these transactions were entered into in the ordinary course of business. This transaction was approved in accordance with Oportun’s Related Person Transactions Policy.
Transactions with Affiliates of Ellington Financial
In November 2014 we entered into an agreement with ECL Funding, LLC, an entity affiliated with Ellington Financial, to sell at least 10% of our unsecured loan originations, with an option to sell an additional 5%, subject to certain eligibility criteria and minimum and maximum volumes. We also entered into a Servicing Agreement pursuant to which we agreed to service the portfolio owned by Ellington Financial and in return earn a servicing fee of 5%. We chose not to renew the arrangement and allowed the agreement to expire on its terms on March 4, 2022. The originations of loans sold and held for sale during the year ended December 31, 2022, was $52.7 million. Our servicing fee revenue during 2022 was $17.4 million.
In addition, in March 2022, we participated in a co-sponsored securitization transaction with certain other entities affiliated with Ellington Financial and sold loans through the issuance of amortizing asset-backed notes secured by a pool of our unsecured and secured personal installment loans. We also sold our share of the residual interest in the pool. The sold loans had an aggregate unpaid principal balance of approximately $227.6 million.
In November 2023, we entered into an agreement with an affiliated trust of Ellington Financial, to sell certain of our unsecured loan originations, subject to certain eligibility criteria. We also entered into a Servicing Agreement pursuant to which we agreed to service the portfolio purchased by the affiliated trust of Ellington Financial and in return earn a servicing fee of 5%.
The originations of loans sold and held for sale under our agreements with affiliates of Ellington Financial during the year ended December 31, 2023 was $3.4 million and our servicing fee revenue was $7.9 million.
Transactions with Neuberger Berman
On September 14, 2022, we entered into an agreement to borrow $150.0 million of senior secured term loans from certain funds affiliated with Neuberger Berman Specialty Finance, beneficial owner of greater than five percent of our outstanding common stock (the “Corporate Facility”). On March 10, 2023, we upsized and amended the Corporate Facility (the “Amended Credit Agreement”) to be able to borrow up to an additional $75.0 million. We borrowed $20.8 million of term loans under the Amended Corporate Facility on March 10, 2023 (the “Incremental Tranche A-1 Loans”) and borrowed an additional $4.2 million of term loans under the Amended Corporate Facility on March 27, 2023 (the “Incremental Tranche A-2 Loans”). The term loans bear interest at an amount equal to (a) 1-month term SOFR plus 9.00%, payable in cash, plus (b) 3.00%, payable in cash or in kind at our option. The term loans are scheduled to mature on September 14, 2026, and are not subject to amortization. Certain prepayments of the term loans are subject to a prepayment premium. The obligations under the Amended Corporate Facility are secured by our assets and assets of certain of our subsidiaries guaranteeing the Amended Corporate Facility, including pledges of the equity interests of certain subsidiaries that are directly or indirectly owned by us, subject to customary exceptions.
We borrowed an aggregate additional amount of $50.0 million of term loans under the Amended Corporate Facility in two additional $25.0 million tranches on May 5, 2023 and June 30, 2023 (the “Incremental Tranche B Loans” and “Incremental Tranche C Loans,”), respectively.
In connection with the Amended Corporate Facility, we issued warrants to the lenders providing the Incremental Tranche A-1 Loans to purchase 1,980,242 shares of our common stock at an exercise price of $0.01 per share. In addition, (a) on March 27, 2023, in connection with the funding of the Incremental Tranche A-2 Loans, we issued warrants to the lenders providing the Incremental Tranche A-2 Loans to purchase 116,485 shares of our common stock, (b) on May 5, 2023, in connection with the funding of the Incremental Tranche B Loans, we issued warrants to the lenders providing the Incremental Tranche B Loans to purchase 1,048,363 shares of our common stock, and (c) on June 30, 2023, in connection with the funding of the Incremental Tranche C Loans, we issued warrants to the lenders providing the Incremental Tranche C Loans to purchase 1,048,363 shares of our common stock, in each case, at an exercise price of $0.01 per share. We also entered into a registration rights agreement with the applicable lenders, which stipulates that we file a registration statement with respect to the shares underlying the warrants.
On June 16, 2023, we entered into a forward flow whole loan sale agreement with certain funds affiliated with Neuberger Berman. Pursuant to this agreement, we have a commitment to sell up to $300.0 million of our personal loan originations over twelve months. We will continue to service these loans upon transfer of the receivables. As part of this agreement, during the twelve months ended December 31, 2023, we transferred loans receivable totaling $220.5 million.
On March 12, 2024, the Company entered into an additional amendment to the Amended Corporate Facility, which among other modifications, required certain principal payments in amounts equal to $5.7 million per month to be made by the Company on the last business day of each of March, April and May 2024.
Policies and Procedures for Related Party Transactions
We have adopted a policy that all transactions, arrangements, or relationships in which the amounts exceed $120,000 or one percent of the average Company’s total assets at year-end for the last two completed fiscal years between us and our directors, executive officers, holders of more than 5% of our capital stock, any member of the immediate family of the foregoing persons, or their affiliates are approved by the audit and risk committee, or a similar committee consisting of entirely independent directors, according to the terms of our Code of Business Conduct. In approving or rejecting any such related party proposal, the audit and risk committee will consider the relevant facts and circumstances available and deemed to be relevant to the matter, including, but not limited to, risks, costs, impact on independence, availability of alternatives, and transaction terms that could have been obtained from unaffiliated third parties.
We believe that we have executed all the transactions described above on terms no less favorable to us than we could have obtained from unaffiliated third parties. It is our intent to ensure that all future transactions between us and related parties are also approved by the audit and risk committee, or a similar committee consisting of entirely independent directors, according to the terms of our Code of Business Conduct, and are on terms no less favorable to us than those that we could obtain from unaffiliated third parties.
Director Independence
The listing rules of Nasdaq generally require that a majority of the members of a listed company’s board of directors be independent. In addition, the listing rules generally require that, subject to specified exceptions, each member of a listed company’s audit, compensation, and nominating and governance committees be independent.
In addition, audit committee members must also satisfy the independence criteria set forth in Rule 10A-3 under the Exchange Act. In order to be considered independent for purposes of Rule 10A-3, a member of an audit committee of a listed company may not, other than in his or her capacity as a member of the audit committee, the board of directors, or any other board committee: accept, directly or indirectly, any consulting, advisory, or other compensatory fee from the listed company or any of its subsidiaries; or be an affiliated person of the listed company or any of its subsidiaries. Additionally, compensation committee members must satisfy the independence criteria set forth in Rule 10C-1 under the Exchange Act. In order to be considered independent for purposes of Rule 10C-1, a member of the compensation committee of a listed company may not, other than in his or her capacity as a member of the compensation committee, the board of directors, or any other board committee: accept, directly or indirectly, any consulting, advisory, or other compensatory fee from the listed company or any of its subsidiaries; or be an affiliated person of the listed company or any of its subsidiaries.
Our Board conducts an annual review of the independence of our directors. In its most recent review, our Board determined that Mr. Banks, Ms. Barefoot, Mr. Daswani, Ms. Lee, Mr. Minetti, Mr. Miramontes, Mr. Parker, Ms. Smith, and Mr. Williams, representing eight of our nine directors, are “independent directors” as defined under the applicable listing standards of Nasdaq and the applicable rules and regulations promulgated by the SEC. Our Board has also determined that all members of our audit and risk committee, compensation and leadership committee, and nominating, governance and social responsibility committee are independent and satisfy the relevant SEC and Nasdaq independence requirements for such committees.
Item 14. Principal Accountant Fees and Services
Principal Accountant Fees and Services
The following table reflects the aggregate fees for audit and other services provided by Deloitte & Touche LLP (San Francisco, CA, PCAOB ID 34) for the years ended December 31, 2023 and 2022:
| | | Year Ended December 31, |
| | | | 2023 | | | 2022 |
| Audit Fees (1) | | $ | 2,361,346 | | | $ | 2,492,625 |
| Audit-Related Fees (2) | | | 441,260 | | | | 810,500 |
| Tax Fees (3) | | | 387,972 | | | | 748,751 |
| | Total Fees | | $ | 3,190,578 | | | $ | 4,051,876 |
|
| (1) | | | | | | | | | | | | | | | | | | Year Ended December 31, | | (in thousands, except per share data) | | 2019 | | 2018 | | 2017 | | Weighted average fair value per share of options granted | | $ | 9.54 |
| | $ | 11.92 |
| | $ | 10.08 |
| | Cash received from options exercised, net | | 791 |
| | 1,030 |
| | 705 |
| | Aggregate intrinsic value of options exercised | | 1,028 |
| | 4,114 |
| | 3,061 |
| | Fair value of shares vested | | 6,735 |
| | 6,063 |
| | 5,350 |
|
The following table summarizes the outstanding and vested stock options:
| | | | | | | | | | | | | | | | | As of December 31, 2019 | | | | Options Outstanding | | Options Vested and Exercisable | | Range of Weighted-Average Exercise Prices | | Number Outstanding | | Weighted Average Remaining Contractual Life
(in years) | | Weighted Average Exercise Price | | Number Exercisable | | Weighted Average Exercise Price | | 0.01 - 5.00 | | 1,295,156 |
| | 2.78 | | 1.92 | | 1,295,156 |
| | 1.92 | | 5.01 - 10.00 | | 75,011 |
| | 4.38 | | 8.21 | | 75,011 |
| | 8.21 | | 10.01 - 15.00 | | 305,266 |
| | 4.73 | | 10.38 | | 305,266 |
| | 10.38 | | 15.01 - 20.00 | | 1,164,459 |
| | 7.91 | | 19.00 | | 548,712 |
| | 19.64 | | 20.01 - 25.00 | | 632,767 |
| | 8.23 | | 22.30 | | 248,896 |
| | 22.43 | | 25.01 - 30.00 | | 468,445 |
| | 7.14 | | 26.88 | | 312,941 |
| | 26.71 | | 30.01 - 35.00 | | 9,586 |
| | 5.47 | | 32.64 | | 9,586 |
| | 32.64 | | | | 3,950,690 |
| | | | | | 2,795,568 |
| | |
AsAudit Fees consist of December 31, 2019 and 2018, the Company’s total unrecognized compensation cost related to nonvested stock-based option awards granted to employees was, $10.1 million and $16.0 million, respectively, which will be recognized over a weighted-average vesting period of approximately 2.4 years and 2.8 years, respectively.
Stock Option Exchange Offer
On August 22, 2019, the Company completed a one-time voluntary stock option exchange offer that allowed eligible participants the opportunity to exchange certain stock optionsfees for RSUs, subject to a new vesting schedule (the "RSU Exchange Offer"), or for a cash payment (the "Cash Exchange Offer,") together with the RSU Exchange Offer, (the "Exchange Offers").
As a result of the Exchange Offers, options to purchase 1,040,154 shares of the Company’s common stock were accepted for exchange and 455,218 replacement RSUs were issued. The replacement RSUs have a vesting commencement date of August 1, 2019 and vesting schedule of two to four years. The RSUs will first vest on August 1, 2020, with the remainder vesting on a quarterly basis thereafter. The RSUs were granted under, and subject to, the terms and conditions of the Company's 2015 Stock Option/Stock Issuance Plan (the "2015 Plan"). The incremental compensation cost from the exchange is $3.2 million, recognized over the vesting period of the replacement award. The amount of cash payments provided in the Cash Exchange Offer was insignificant.
Restricted Stock Units
The Company’s restricted stock units ("RSUs") vest upon the satisfaction of time-based criterion of up to four years. The service-based requirement will be satisfied in installments as follows: 25% of the total number of RSUs awarded will have the service-based requirement satisfied during the month in which the 12-month anniversary of the vesting commencement date occurs, and thereafter 1/16th of the total award in a series of 12 successive equal quarterly installments or 1/4th of the total award in a series of three successive equal annual installments following the first anniversary of the initial service vest date. Some awards also include a performance criterion, a liquidity eventprofessional services rendered in connection with the Company's initial public offering or a change in control. The liquidity event requirement will be satisfied as to any then-outstanding RSUs on the first to occuraudit of the following events prior to the expiration date: (1) the closing of a change in control; or (2) the first trading day following the expiration of the lock-up period. These RSUs are not considered vested until both criteria have been met, if applicable, and provided that participant is providing continuous service on the vesting date. The performance-based condition of such RSUs was considered probable on the effective date of the IPO completed in September 2019. As a result, $7.9 million of compensation expense was recognized in connection with these performance-based awards upon completion of the IPO.
Stock-based compensation cost for RSUs is measured based on the fair market value of the Company’s common stock on the date of grant. For RSUs granted before the IPO there was no public market for the Company’s common stock. The Company retained an independent third-party valuation firm to determine the fair value of its common stock before the IPO. The Company’s Board reviewed and approved the valuations.
A summary of the Company’s RSU activity under the 2015 Plan and the 2019 Plan for the year ended December 31, 2019 is as follows:
| | | | | | | | | | | RSU Outstanding | | Weighted Average Grant-Date Fair Value | | Balance – January 1, 2019 | | 503,491 |
| | 26.24 |
| Granted (1) | | 1,198,179 |
| | 17.50 |
| | Vested | | 14,534 |
| | 23.65 |
| Forfeited (1) | | 40,813 |
| | 17.47 |
| Balance – December 31, 2019 (1) | | 1,646,323 |
| | 20.12 |
| Expected to vest after December 31, 2019 (1) | | 1,646,323 |
| | 20.12 |
|
(1) Replacement RSUs are fair valued using the grant date fair market value on the date of exchange (August 22, 2019).
As of December 31, 2019 and 2018, the Company's total unrecognized compensation cost related to nonvested restricted stock unit awards granted to employees was, $21.2 million and $8.9 million, respectively, which will be recognized over a weighted average vesting period of approximately 3.0 years and 3.6 years, respectively.
Stock-based Compensation - Total stock-based compensation expense included in the Consolidated Statements of Operations and Comprehensive Income is as follows:
| | | | | | | | | | | | | | | | | Year Ended December 31, | | (in thousands of dollars) | | 2019 | | 2018 | | 2017 | | Technology and facilities | | $ | 2,699 |
| | $ | 1,262 |
| | $ | 1,088 |
| | Sales and marketing | | 123 |
| | 113 |
| | 116 |
| | Personnel | | 16,361 |
| | 5,397 |
| | 4,501 |
| | Total stock-based compensation | | $ | 19,183 |
| | $ | 6,772 |
| | $ | 5,705 |
|
The Company accounts for forfeitures as they occur and does not estimate forfeitures as of the award grant date. The Company capitalized compensation expense related to stock-based compensation the years ended December 31, 2019, 2018, and 2017 of $0.9 million, $0.1 million and $0.1 million, respectively.
Cash flows from the tax benefits for tax deductions resulting from the exercise of stock options in excess of the compensation expense recorded for those options (excess tax benefits) are required to be classified as cash from financing activities. The total income tax benefit recognized in the income statement for share-based compensation arrangements was $1.1 million and $0.7 million for the years ended December 31, 2017 and 2018, respectively. The Company had no realized excess tax benefits from stock options for the year ended December 31, 2019.
Retirement Plan
The Company maintains a 401(k) Plan, which enables employees to make pre-tax or post-tax deferral contributions to the participating employees account. Employees may contribute a portion of their pay up to theour annual amount as set periodically by the Internal Revenue Service. The Company provides for an employer 401(k) contribution match of up to 4% of an employee’s eligible compensation. The total amount contributed by the Company for the years ended December 31, 2019, 2018 and 2017, was $2.4 million, $1.7 million, and $1.3 million, respectively. All employee and employer contributions will be invested according to participants’ individual elections. The Company remits employee contributions to plan with each bi-weekly payroll.
Interest Income - Total interest income included in the Consolidated Statements of Operations and Comprehensive Income is as follows:
| | | | | | | | | | | | | | | | | Year Ended December 31, | | (in thousands) | | 2019 | | 2018 | | 2017 | | Interest income | | | | | | | | Interest on loans | | $ | 535,325 |
| | $ | 439,939 |
| | $ | 320,516 |
| | Fees on loans | | 8,801 |
| | 8,838 |
| | 7,419 |
| | Total interest income | | $ | 544,126 |
| | $ | 448,777 |
| | $ | 327,935 |
|
Non-interest Income - Total non-interest income included in the Consolidated Statements of Operations and Comprehensive Income is as follows:
| | | | | | | | | | | | | | | | | Year Ended December 31, | | (in thousands) | | 2019 | | 2018 | | 2017 | | Non-interest income | | | | | | | | Gain on loan sales | | $ | 36,537 |
| | $ | 33,466 |
| | $ | 22,254 |
| | Servicing fees | | 15,429 |
| | 11,813 |
| | 8,260 |
| | Debit card income | | 1,151 |
| | 1,950 |
| | 2,505 |
| | Sublease income | | 1,622 |
| | 1,573 |
| | — |
| | Other income | | 1,283 |
| | — |
| | — |
| | Total non-interest income | | $ | 56,022 |
| | $ | 48,802 |
| | $ | 33,019 |
|
The following are the domestic and foreign components of the Company’s income before taxes:
| | | | | | | | | | | | | | | | | Year Ended December 31, | | (in thousands) | | 2019 | | 2018 | | 2017 | | Domestic | | $ | 82,612 |
| | $ | 168,907 |
| | $ | 2,162 |
| | Foreign | | 1,820 |
| | 1,188 |
| | (93 | ) | | Income before taxes | | $ | 84,432 |
| | $ | 170,095 |
| | $ | 2,069 |
|
The “Tax Cuts and Jobs Act” (the “Act”) was enacted December 22, 2017. The law includes significant changes to the U.S. corporate tax system, including a Federal corporate rate change reduction from 35% to 21%. Additionally, as a result of the Act, the Company is required to pay U.S. income taxes on accumulated foreign subsidiary earnings not previously subject to U.S. income tax. The Company recorded a provisional deduction to its deferred tax assets for the impact of the U.S. Tax Act of approximately $11.2 million. This amount was primarily comprised of the re-measurement of federal net deferred tax liabilities resulting from a permanent reduction in the U.S. statutory corporate tax rate to 21% from 35%, after taking into account the mandatory one-time tax on the accumulated earnings of the Company's foreign subsidiaries. In 2018, the Company completed its determination of the accounting implications of the U.S. Tax Act.
The provision for income taxes consisted of the following:
| | | | | | | | | | | | | | | | | | | (in thousands) | | Federal | | State | | Foreign | | Total | | December 31, 2019 | | | | | | | | | | Current | | $ | 7,946 |
| | $ | 2,835 |
| | $ | 1,308 |
| | $ | 12,089 |
| | Deferred | | 7,830 |
| | 3,439 |
| | (524 | ) | | 10,745 |
| | Total provision for income taxes | | $ | 15,776 |
| | $ | 6,274 |
| | $ | 784 |
| | $ | 22,834 |
| | | | | | | | | | | | December 31, 2018 | | | | | | | | | | Current | | $ | 3,548 |
| | $ | 420 |
| | $ | 709 |
| | $ | 4,677 |
| | Deferred | | 28,403 |
| | 13,934 |
| | (313 | ) | | 42,024 |
| | Total provision for income taxes | | $ | 31,951 |
| | $ | 14,354 |
| | $ | 396 |
| | $ | 46,701 |
| | | | | | | | | | | | December 31, 2017 | | | | | | | | | | Current | | $ | 3,127 |
| | $ | 724 |
| | $ | 1,195 |
| | $ | 5,046 |
| | Deferred | | 8,270 |
| | (874 | ) | | (167 | ) | | 7,229 |
| | Total provision (benefit) for income taxes | | $ | 11,397 |
| | $ | (150 | ) | | $ | 1,028 |
| | $ | 12,275 |
|
Deferred income taxes reflect the net tax effects of temporary differences between the carrying amounts of assets and liabilities for financial reporting purposes and the amounts used for income tax purposes, and operating losses and tax credit carryforwards.
The primary components of the Company’s net deferred tax assets and liabilities are composed of the following:
| | | | | | | | | | | | | December 31, | | (in thousands) | | 2019 | | 2018 | | Deferred tax assets: | | | | | | Accrued expenses and reserves | | $ | 2,281 |
| | $ | 1,891 |
| | Allowance for loan losses | | 1,110 |
| | 7,297 |
| | Leases | | 14,449 |
| | — |
| | Share-based compensation | | 7,057 |
| | 3,034 |
| | Mexico fixed assets | | 937 |
| | 738 |
| | Depreciation and amortization | | 480 |
| | — |
| | Other | | 672 |
| | 417 |
| | Total deferred tax assets | | $ | 26,986 |
| | $ | 13,377 |
| | Valuation allowance | | $ | — |
| | $ | — |
| | Deferred tax liabilities: | | | | | | System development costs | | $ | (4,966 | ) | | $ | (1,515 | ) | | Right of use assets | | (13,676 | ) | | — |
| | Depreciation and amortization | | — |
| | (227 | ) | | Prepaid expenses | | (912 | ) | | (174 | ) | | Fair value adjustment | | (30,737 | ) | | (24,347 | ) | | Total deferred tax liabilities | | (50,291 | ) | | (26,263 | ) | | Net deferred taxes | | $ | (23,305 | ) | | $ | (12,886 | ) |
Income tax expense was $22.8 million, $46.7 million, and $12.3 million for the year ended December 31, 2019, 2018, and 2017 which represents an effective tax rate of 27.0%, 27.5%, and 593.3%, respectively.
The Company adopted ASU No. 2016-09, Compensation - Stock Compensation (Topic 718): Improvements to Employee Share-Based Payment Accounting effective January 1, 2017, which requires the Company to record excess tax benefits resulting from the exercise of non-qualified stock options, the disqualifying disposition of incentive stock options and vesting of restricted stock awards as income tax benefits in the Consolidated Statements of Operations and Comprehensive Income with a corresponding decrease to current taxes payable. As a result of the adoption of ASU No. 2016-09, the Company recorded an adjustment to 2017 opening retained earnings in the amount of $1.1 million, representing net operating losses previously tracked off-balance sheet resulting from excess tax benefits that are included in the deferred tax asset under the new standard.
The following table summarizes the activity related to the unrecognized tax benefits:
| | | | | | | | | | | | | | | | | Year Ended December 31, | | (in thousands) | | 2019 | | 2018 | | 2017 | | Balance as of January 1, | | $ | 1,431 |
| | $ | 1,067 |
| | $ | 664 |
| | Increases related to current year tax positions | | 535 |
| | 357 |
| | 330 |
| | Decreases related to current year tax positions | | — |
| | — |
| | — |
| | Increases related to prior year tax positions | | 19 |
| | 7 |
| | 73 |
| | Decreases related to prior year tax positions | | (52 | ) | | — |
| | — |
| | Balance as of December 31, | | $ | 1,933 |
| | $ | 1,431 |
| | $ | 1,067 |
|
Interest and penalties related to the Company’s unrecognized tax benefits accrued at December 31, 2019 were not material. The Company’s policy is to recognize interest and penalties associated with income taxes in income tax expense. The Company does not expect its uncertain tax positions to have a material impact on its consolidated financial statements, within the next twelve months. The total amountreview of unrecognized tax benefits, net of associated deferred tax benefit,our quarterly condensed consolidated financial statements, statutory audit fees, and audit services that would impact the effective tax rate, if recognized, is $1.9 million.
Due to the net operating loss carryforwards, the Company’s United States federal and significant state returns are open to examinationnormally provided by the Internal Revenue Service and state jurisdictions for years ended December 31, 2010 and 2007, respectively, and forward. For Mexico, all tax years remain open for examination by the Mexico taxing authorities.
A reconciliation of income tax expense with the amount computed by applying the statutory U.S. federal income tax rates to income before provision for income taxes is as follows:
| | | | | | | | | | | | | | | | | Year Ended December 31, | | (in thousands) | | 2019 | | 2018 | | 2017 | | Income tax expense computed at U.S. federal statutory rate | | $ | 17,731 |
| | $ | 35,720 |
| | $ | 724 |
| | State Tax | | 4,788 |
| | 11,229 |
| | (34 | ) | | Foreign Rate differential | | 164 |
| | 106 |
| | 279 |
| | Foreign taxes amended filings | | — |
| | — |
| | 782 |
| | Federal tax credits | | (2,042 | ) | | (595 | ) | | (875 | ) | | Share based compensation expense | | 752 |
| | 148 |
| | (263 | ) | | Uncertain tax positions | | 611 |
| | — |
| | — |
| | Other | | 830 |
| | 93 |
| | 298 |
| | Tax reform impact | | — |
| | — |
| | 11,364 |
| | Change in valuation allowance | | — |
| | — |
| | — |
| | Income tax expense | | $ | 22,834 |
| | $ | 46,701 |
| | $ | 12,275 |
| | Effective tax rate | | 27.0 | % | | 27.5 | % | | 593.3 | % |
| | | 14. | Fair Value of Financial Instruments |
Financial Instruments at Fair Value
The Company has elected the fair value option to account for all loans receivable held for investment that were originated on or after January 1, 2018 (the "Fair Value Loans"), and for all asset-backed notes issued on or after January 1, 2018 (the "Fair Value Notes"). Loans Receivable at Amortized Cost and asset-backed notes issued prior to January 1, 2018 are accounted for at amortized cost, net. Loans that the Company designates for sale will continue to be accounted for as held for sale and recorded at the lower of cost or fair value until the loans receivable are sold.
The table below compares the fair value of loans receivable and asset-backed notes to their contractual balances for the periods shown:
| | | | | | | | | | | | | | | | | | | | | December 31, 2019 | | December 31, 2018 | | (in thousands) | | Unpaid Principal Balance | | Fair Value | | Unpaid Principal Balance | | Fair Value | | Assets | | | | | | | | | | Loans receivable | | $ | 1,800,418 |
| | $ | 1,882,088 |
| | $ | 1,177,471 |
| | $ | 1,227,469 |
| | Liabilities | | | | | | | | | | Asset-backed notes | | $ | 1,113,165 |
| | $ | 1,129,202 |
| | $ | 863,165 |
| | $ | 867,278 |
|
The Company calculates the fair value of the Fair Value Notes using independent pricing services and broker price indications, which are based on quoted prices for identical or similar notes, which are Level 2 input measures.
The Company primarily uses a model to estimate the fair value of Level 3 instruments based on the present value of estimated future cash flows. This model uses inputs that are inherently judgmental and reflect management’s best estimates of the assumptions a market participant would use to calculate fair value. The following tables present quantitative information about the significant unobservable inputs used for the Company’s Level 3 fair value measurements:
| | | | | | | | | | | | | | | December 31, 2019 | | (in thousands) | | Fair Value Level 3 | | Valuation Technique | | Significant Unobservable Input | | Weighted Average Inputs | | Loans receivable at fair value | | $ | 1,882,088 |
| | Discounted Cash Flows | | Remaining cumulative charge-offs (1) | | 9.61% | | | Remaining cumulative prepayments (1) | | 34.95% | | | Average life (years) | | 0.81 | | | Discount rate | | 7.77% | | | | | | | | | | | | | | December 31, 2018 | | | | Fair Value
Level 3 | | Valuation Technique | | Significant Unobservable Input | | Weighted Average Inputs | | Loans receivable at fair value | | $ | 1,227,469 |
| | Discounted Cash Flows | | Remaining cumulative charge-offs (1) | | 10.52% | | | Remaining cumulative prepayments (1) | | 33.78% | | | Average life (years) | | 0.85 | | | Discount rate | | 9.20% |
(1) Figure disclosed as a percentage of outstanding principal balance.
Fair value adjustments related to financial instruments where the fair value option has been elected are recorded through earnings for the years ended December 31, 2019 and 2018. Certain unobservable inputs may (in isolation) have either a directionally consistent or opposite impact on the fair value of the financial instrument for a given change in that input. When multiple inputs are used within the valuation techniques for loans, a change in one input in a certain direction may be offset by an opposite change from another input.
The Company developed an internal model to estimate the Fair Value Loans. To generate future expected cash flows, the model combines receivable characteristics with assumptions about borrower behavior based on the Company’s historical loan performance. These cash flows are then discounted using a required rate of return that management estimates would be used by a market participant.
The Company tested the fair value model by comparing modeled cash flows to historical loan performance to ensure that the model was complete, accurate and reasonable for the Company’s use. The Company also engaged a third party to create an independent fair value estimate for the Fair Value Loans, which provides a set of fair value marks using the Company’s historical loan performance data and whole loan sale prices to develop independent forecasts of borrower behavior. Their model used these assumptions to generate loan level cash flows which were then aggregated and compared to the Company’s within an acceptable range.
The Company's internal valuation and loan loss allowance committee provides governance and oversight over the fair value pricing and loan loss allowance calculations and related financial statement disclosures. Additionally, this committee provides a challenge of the assumptions used and outputs of the model, including the appropriateness of such measures and periodically reviews the methodology and process to determine the fair value pricing and loan loss allowance. Any significant changes to the process must be approved by the committee.
The table below presents a reconciliation of loans receivable at fair value on a recurring basis using significant unobservable inputs:
| | | | | | | | | | | | | | | | | December 31, | | (in thousands) | | 2019 | | 2018 | | 2017 | | Balance – beginning of period | | $ | 1,227,469 |
| | $ | — |
| | $ | — |
| | Principal disbursements | | 1,741,899 |
| | 1,509,379 |
| | — |
| | Principal payments from customers | | (996,945 | ) | | (308,683 | ) | | — |
| | Gross charge-offs | | (122,005 | ) | | (23,225 | ) | | — |
| | Net increase in fair value | | 31,670 |
| | 49,998 |
| | — |
| | Balance ‑ end of period | | $ | 1,882,088 |
| | $ | 1,227,469 |
| | $ | — |
|
As of December 31, 2019, the aggregate fair value of loans that are 90 days or more past and in non-accrual status is $3.6 million, and the aggregate unpaid principal balance for loans that are 90 days or more past due is $15.8 million. As of December 31, 2018, the aggregate fair value of loans that are 90 days or more past due and in non-accrual status is $1.1 million, and the aggregate unpaid principal balance for loans that are 90 days or more past due is $7.6 million.
Financial Instruments Disclosed but Not Carried at Fair Value
The following table presents the carrying value and estimated fair values of financial assets and liabilities disclosed but not carried at fair value and the level within the fair value hierarchy:
| | | | | | | | | | | | | | | | | | | | | | | | | December 31, 2019 | | | | Carrying value | | Estimated fair value | | Estimated fair value | | (in thousands of dollars) | Level 1 | | Level 2 | | Level 3 | | Assets | | | | | | | | | | | | Cash and cash equivalents | | $ | 72,179 |
| | $ | 72,179 |
| | $ | 72,179 |
| | $ | — |
| | $ | — |
| | Restricted cash | | 63,962 |
| | 63,962 |
| | 63,962 |
| | — |
| | — |
| | Loans receivable at amortized cost, net (Note 5) | | 38,471 |
| | 43,482 |
| | — |
| | — |
| | 43,482 |
| | Loans held for sale (Note 6) | | 715 |
| | 772 |
| | — |
| | — |
| | 772 |
| | Liabilities | | | | | | | | | | | | Accounts payable | | 5,919 |
| | 5,919 |
| | 5,919 |
| | — |
| | — |
| | Secured financing (Note 8) | | 62,000 |
| | 62,000 |
| | — |
| | 62,000 |
| | — |
| | Asset-backed notes at amortized cost (Note 8) | | $ | 359,111 |
| | $ | 360,668 |
| | $ | — |
| | $ | 360,668 |
| | $ | — |
|
| | | | | | | | | | | | | | | | | | | | | | | | | December 31, 2018 | | | | Carrying value | | Estimated fair value | | Estimated fair value | | (in thousands of dollars) | Level 1 | | Level 2 | | Level 3 | | Assets | | | | | | | | | | | | Cash and cash equivalents | | $ | 70,475 |
| | $ | 70,475 |
| | $ | 70,475 |
| | $ | — |
| | $ | — |
| | Restricted cash | | 58,700 |
| | 58,700 |
| | 58,700 |
| | — |
| | — |
| | Loans receivable at amortized cost, net (Note 5) | | 295,781 |
| | 316,962 |
| | — |
| | — |
| | 316,962 |
| | Liabilities | | | | | |
|
| |
|
| |
|
| | Accounts payable | | 7,277 |
| | 7,277 |
| | 7,277 |
| | — |
| | — |
| | Secured financing (Note 8) | | 87,000 |
| | 87,000 |
| | — |
| | 87,000 |
| | — |
| | Asset-backed notes at amortized cost (Note 8) | | $ | 357,699 |
| | $ | 357,388 |
| | $ | — |
| | $ | 357,388 |
| | $ | — |
|
We use the following methods and assumptions to estimate fair value:
| | • | Cash, cash equivalents, restricted cash and accounts payable ‑ The carrying values of certain of the Company’s financial instruments, including cash and cash equivalents, restricted cash and accounts payable, approximate Level 1 fair values of these financial instruments due to their short-term nature.
|
| | • | Loans receivable ‑ The fair value of loans receivable recorded at amortized cost were estimated by discounting the future expected cash flows using a required rate of return that management estimates would be used by a market participant.
|
| | • | Loans held for sale ‑ The fair values of loans held for sale are based on a negotiated agreement with the purchaser.
|
| | • | Secured financing and asset-backed notes ‑ The fair values of secured financing and asset-backed notes recorded at carrying value have been calculated using discount rates equivalent to the weighted-average market yield of comparable debt securities. The Company's asset-backed notes are valued by independent pricing services and brokers using quoted prices for identical or similar notes, which are Level 2 input measures.
|
There were no transfers in or out of Level 1, Level 2 or Level 3 assets and liabilities for the years ended December 31, 2019, 2018 and 2017.
| | | 15. | Leases, Commitments and Contingencies |
Leases - The Company’s leases are primarily of real property consisting of retail locations and office space and have remaining lease terms of 10 years or less.
As described in Note 2, the Company adopted ASU 2016-02, Leases, as of January 1, 2019, using the modified retrospective transition approach. The Company has elected the practical expedient to keep leases with terms of 12 months or less off the balance sheet as no recognition of a lease liability and a right-of-use asset is required. Operating lease expense is recognized on a straight-line basis over the lease term in "Technology and facilities" in the Consolidated Statements of Operations and Comprehensive Income.
Most of the Company’s existing lease arrangements are classified as operating leases under the new standard. At the inception of a contract, the Company determines if the contract is or contains a lease. At the commencement date of a lease, the Company recognizes a lease liability equal to the
present value of the lease payments and a right-of-use asset representing the Company's right to use the underlying asset for the duration of the lease term. The Company’s leases include options to extend or terminate the arrangement at the end of the original lease term. The Company generally does not include renewal or termination options in its assessment of the leases unless extension or termination for certain assets is deemed to be reasonably certain. Variable lease payments and short-term lease costs were deemed immaterial. The Company’s leases do not provide an explicit rate. The Company uses its contractual borrowing rate to determine lease discount rates.
As of December 31, 2019, maturities of lease liabilities, excluding short-term leases and leases on a month-to-month basis, were as follows:
| | | | | | | (in thousands) | | Operating Leases | | Lease Expense | | | | 2020 | | $ | 15,227 |
| | 2021 | | 12,439 |
| | 2022 | | 9,663 |
| | 2023 | | 8,340 |
| | 2024 | | 7,488 |
| | Thereafter | | 7,293 |
| | Total lease payments | | 60,450 |
| | Imputed interest | | (6,240 | ) | | Total leases | | $ | 54,210 |
| | | | | | Sublease income | | | | 2020 | | $ | (861 | ) | | 2021 and Thereafter | | — |
| | Total lease payments | | (861 | ) | | Imputed interest | | 8 |
| | Total sublease income | | $ | (853 | ) | | | | | | Net lease liabilities | | $ | 53,357 |
| | Weighted average remaining lease term | | 5.0 years |
| | Weighted average discount rate | | 4.49 | % |
Future minimum lease payments under these non-cancelable leases having initial terms in excess of one year at December 31, 2018, under ASC 840, Leases, were as follows (in thousands):
| | | | | | | (in thousands) | | Operating Leases | | Lease Expense | | | | 2019 | | $ | 12,994 |
| | 2020 | | 12,558 |
| | 2021 | | 10,035 |
| | 2022 | | 7,640 |
| | 2023 | | 6,500 |
| | Thereafter | | 12,767 |
| | Total lease payments | | $ | 62,494 |
|
Rental expenses under operating leases for the years ended December 31, 2019, 2018 and 2017 were $18.2 million, $16.0 million and $11.4 million, respectively.
Purchase Commitment ‑ The Company has commitments to purchase information technology and communication services in the ordinary course of business, with various terms through 2023. These amounts are not reflective of the Company’s entire anticipated purchases under the related agreements; rather, they are determined based on the non-cancelable amounts to which the Company is contractually obligated. The Company’s purchase obligations are $7.3 million in 2020, $6.6 million in 2021, $2.7 million in 2022, $0.2 million in 2023, and $0.0 million in 2024 and thereafter.
Whole Loan Sale Program ‑The Company has a commitment to sell to a third-party financial institution 10% of its unsecured loan originations that satisfy certain eligibility criteria, and an additional 5% at the Company’s sole option. For details regarding the whole loan sale program, refer to Note 6, Loans Held for Sale.
Access Loan Whole Loan Sale Program ‑ In July 2017, the Company entered into a whole loan sale transaction with a financial institution with a commitment to sell 100% of the originations pursuant to the Company’s Access Loan Program and service the sold loans. For details regarding the Access Loan Whole Loan Sale Program, refer to Note 6, Loans Held for Sale.
Unfunded Loan and Credit Card Commitments - Unfunded loan and credit card commitments at December 31, 2019 and 2018 were $2.3 million and $0.7 million, respectively.
Litigation - On January 2, 2018, a complaint, captioned Opportune LLP v. Oportun, Inc. and Oportun, LLC, Civil Action No. 4:18-cv-00007, or the Opportune Lawsuit, was filed by plaintiff Opportune LLP in the United States District Court for the Southern District of Texas, against us and our wholly-owned subsidiary, Oportun, LLC. The complaint alleged various claims for trademark infringement, unfair competition, trademark dilution and misappropriation against us and Oportun, LLC and called for injunctive relief requiring us and Oportun, LLC to cease using its marks, as well as monetary damages related to the claims. In addition, on January 2, 2018, the plaintiff initiated a cancellation proceeding, Proceeding No. 92067634, before the Trademark Trial and Appeal Board seeking to cancel certain of our trademarks, or the Cancellation Proceeding and, together with the Opportune Lawsuit, the Opportune Matter. On March 5, 2018, the Trademark Trial and Appeal Board granted our motion to suspend the Cancellation Proceeding pending final disposition of the Opportune Lawsuit. On April 24, 2018, the District Court granted our motion to partially dismiss the complaint, dismissing Plaintiff's misappropriation claim. On February 22, 2019, Plaintiff filed an amended complaint adding an additional claim under the Anti-Cybersquatting Protection Act to the remaining claims in the original complaint. On August 30, 2019, we filed a motion for summary judgment on all of Plaintiff's claims. On January 22, 2020, the District Court issued its decision denying our motion for summary judgment. No trial date has been set. In connection with discussions regarding settlement of the Opportune Matter, the Company has recorded a liability of $1.9 million within Other liabilities and a corresponding insurance recovery receivable of $1.0 million within Other assets on the Consolidated Balance Sheets as of December 31, 2019. The income statement impact of $0.9 million was recorded through General, administrative and other on the Consolidated Statements of Operations and Comprehensive Income for the year ended December 31, 2019. Actual results could differ from these estimates.
See Item 3. Legal Proceedings for additional information regarding legal proceedings in which the Company is involved.
Subsequent to the balance sheet date of December 31, 2019, the Company’s wholly-owned subsidiary, Oportun Funding VI, LLC, the issuer under the 2017-A asset backed securitization transaction, provided notice on February 21, 2020 to the trustee that they had elected to redeem all $160.0 million of outstanding 2017-A Notes on March 9, 2020 and satisfy and discharge Oportun Funding VI, LLC’s obligations under the 2017-A Notes and the indenture. See “Management's Discussion and Analysis of Financial Condition and Results of Operations-Liquidity and Capital Resources-Current debt facilities” and Note 8, Borrowings.
| | | 17. | Selected Quarterly Financial Data (Unaudited) |
As a “Smaller Reporting Company” as defined by Item 10 of Regulation S-K, the Company is not required to provide this information.
Item 9. Changes in and Disagreements with Accountants on Accounting and Financial Disclosure
None.
Item 9A. Controls and Procedures
Evaluation of Disclosure Controls and Procedures
We maintain disclosure controls and procedures designed to provide reasonable assurance that information we are required to disclose in reports that we file or submit under the Exchange Act is accumulated and communicated to our management, including our Chief Executive Officer and Chief Financial Officer, as appropriate, to allow timely decisions regarding required disclosure and that such information is recorded, processed, summarized and reported within the time periods specified in the SEC’s rules and forms.
As of December 31, 2019, we carried out an evaluation of the effectiveness of our disclosure controls and procedures, as such term is defined in Rules 13a-15(e) and 15d-15(e) under the Exchange Act. This evaluation was conducted under the supervision of, and with the participation of our management, including our Chief Executive Officer and our Chief Financial Officer. Management recognizes that any controls and procedures, no matter how well designed and operated, can provide only reasonable assurance of achieving their objectives and management necessarily applies its judgment in evaluating the cost-benefit relationship of possible controls and procedures. Based on our evaluation, our Chief Executive Officer and our Chief Financial Officer concluded that, as of December 31, 2019 our disclosure controls and procedures were effective to provide the reasonable assurance described above.
Exemption from Management's Report on Internal Control Over Financial Reporting
This Annual Report on Form 10-K does not include a report of management's assessment regarding internal control over financial reporting or an attestation report of our independent registered public accounting firm due to a transition period established by the rules of the SEC for newly public companies.
Changes in Internal Control over Financial Reporting
There were no changes in our internal control over financial reporting identified in connection with the evaluation required by Rule 13a-15(d)regulatory filings.
|
| (2) | Audit-Related Fees consist of fees for assurance and 15d-15(d)related services, including issuance of Exchange Act that occurred during the during the quarter ended December 31, 2019 that have materially affected, or are reasonably likelyagreed upon reports, fees related to materially affect, our internal control over financialdue diligence procedures, and fees related to service organization controls reporting. |
| (3) | Tax Fees consist of fees for U.S. and international corporate tax compliance and consulting services. |
Audit and Risk Committee Oversight of Independence and Pre-Approval Policy
At least annually, consistent with the applicable SEC and Public Company Accounting Oversight Board (“PCAOB”) rules, the audit and risk committee receives and reviews written disclosures from our independent registered public accounting firm, Deloitte & Touche LLP, delineating all relationships between them, or their affiliates, and the Company, or persons in financial oversight roles at the Company, that may reasonably be thought to bear on independence. The audit and risk committee considers and discusses with Deloitte & Touche LLP any potential effects of any such relationships on their independence as well as any compensation or services that could affect their objectivity and independence.
As part of the audit and risk committee’s oversight of independence, the committee determines and approves engagements of Deloitte & Touche LLP to perform any proposed permissible non-audit services, including the scope of the service and the compensation to be paid, prior to the commencement of such engagements. All of the services provided by Deloitte & Touche LLP for the years ended December 31, 2023 and 2022 described above were pre-approved by the audit and risk committee. Our audit and risk committee has determined that the rendering of services other than audit services by Deloitte & Touche LLP is compatible with maintaining the principal accountant’s independence.
PART IV
Item 15. Exhibit and Financial Statement Schedules
Inherent Limitations on Effectiveness of Controls | (1) | Financial Statement Schedules: |
No financial statement or supplemental data are filed with this report on Form 10-K/A. See Index to Financial Statements and Supplemental Data of the Original Form 10-K.
Our management, including our
Exhibits are listed in the Exhibit Index below.
| Exhibit | Description | | Form | File No. | Exhibit | Filing Date | | Filed Herewith | | Rule 13a-14(a)/15d-14(a) Certifications of the Chief Executive Officer and Director of Oportun Financial Corporation | | | | | | | x | | Rule 13a-14(a)/15d-14(a) Certifications of the Chief Financial Officer does not expect that our disclosure controls and procedures or our internal controls over financial reporting will prevent all errors and all fraud. A control system, no matter how well conceived and operated, can provide only reasonable, not absolute, assurance that the objectives of the control system are met. Further, the design of a control system must reflect the fact that there are resource constraints, and the benefits of controls must be considered relative to their costs. Our disclosure controls and procedures and our internal controls over financial reporting have been designed to provide reasonable assurance of achieving their objectives. Because of the inherent limitations in all control systems, no evaluation of controls can provide absolute assurance that all control issues and instances of fraud, if any, have been detected. These inherent limitations include the realities that judgments in decision making can be faulty, and that breakdowns can occur because of a simple error or mistake. Additionally, controls can be circumvented by the individual acts of some persons, by collusion of two or more people or by management override of the controls. The design of any system of controls also is based in part upon certain assumptions about the likelihood of future events, and there can be no assurance that any design will succeed in achieving its stated goals under all potential future conditions; over time, controls may become inadequate because of changes in conditions, or the degree of compliance with policies or procedures may deteriorate. Because of the inherent limitations in a cost-effective control system, misstatements due to error or fraud may occur and not be detected.
Item 9B. Other Information
None.
PART III
Item 10.Directors, Executive Officers and Corporate Governance
The information required by Item 10 with respect to executive officers is incorporated by reference to our Company’s definitive proxy statement for the 2020 Annual Meeting of Shareholders, which will be filed with the SEC pursuant to Regulation 14A within 120 days of the Company’s fiscal year-ended December 31, 2019 (the "Proxy Statement").
Information required by Item 10 for matters other than executive officers is incorporated by reference to the Proxy Statement.
Item 11. Executive Compensation
The information required by Item 11 is incorporated by reference to the information presented in the Proxy Statement.
Item 12. Security Ownership of Certain Beneficial Owners and Management and Related Stockholders Matters
The information required by Item 12 is incorporated by reference to the information presented in the Proxy Statement.
Item 13. Certain Relationships and Related Transactions, and Director Independence
The information required by Item 13 is incorporated by reference to the information presented in the Proxy Statement.
Item 14. Principal Accounting Fees and Services
The information required by Item 14 is incorporated by reference to the information presented in the Proxy Statement.
PART IV
Item 15.Exhibits and Financial Statement Schedules
(a) (1) The following consolidated financial statementsChief Administrative Officer of Oportun Inc. and its subsidiaries are includedFinancial Corporation
| | | | | | | x | | 104 | Cover Page Interactive Data File in PART II - Item 8:
Consolidated Balance Sheets, December 31, 2019 and 2018
Consolidated Statements of Operations and Comprehensive Income, years ended December 31, 2019, 2018, and 2017
Consolidated Statements of ChangesInline XBRL format (included in Stockholders' Equity, years ended December 31, 2019, 2018, and 2017
Consolidated Statements of Cash Flow, years ended December 31, 2019, 2018, and 2017
Notes to the Consolidated Financial Statements
(2) Financial Statement Schedules:
All other schedules have been omitted because they are either not required or inapplicable.
(3) Exhibits:
Exhibits are listed in the Exhibit Index below.
Item 16.Form 10-K Summary
None.
Exhibit Index
| | | | | | | | | | | | | Incorporated by Reference | | | Exhibit | Description | | Form | File No. | Exhibit | Filing Date | | Filed Herewith | 4.3 | 101). | | | | | | | x | 10.1 | | | | | | | | x | 10.2 ¥ | | | | | | | | x | 21.1 | | | | | | | | x | 24.1 | | | | | | | | x | 31.1 | | | | | | | | x | 31.2 | | | | | | | | x | 32.1 | | | | | | | | x | 101 | Interactive data files pursuant to Rule 405 of Regulation S-T: | | | | | | | | | (i) Consolidated Balance Sheets, | | | | | | | | | (ii) Consolidated Statements of Operations and Comprehensive Income, | | | | | | | | | (iii) Consolidated Statements of Changes in Stockholders' Equity, | | | | | | | | | (iv) Consolidated Statements of Cash Flows, and | | | | | | | | | (v) Notes to the Consolidated Financial Statements | | | | | | | | 104 | Cover Page Interactive Data File in Inline XBRL format (included in Exhibit 101). | | | | | | | |
¥ Portions of this exhibit have been omitted from the exhibit because they are both not material and would be competitively harmful if publicly disclosed.
* The certifications attached as Exhibit 32.1 that accompany this Annual Report on Form 10-K are not deemed filed with the Securities and Exchange Commission and are not to be incorporated by reference into any filing of the Registrant under the Securities Act of 1933, as amended, or the Securities Exchange Act of 1934, as amended, whether made before or after the date of this Annual Report on Form 10-K, irrespective of any general incorporation language contained in such filing.
The instance document does not appear in the interactive data file because its XBRL tags are embedded within the Inline XBRL document.
Signatures
OPORTUN FINANCIAL CORPORATION (Registrant)
Pursuant to the requirements of Section 13 or 15(d) of the Securities Exchange Act of 1934, the registrant has duly caused this report to be signed on its behalf by the undersigned, thereunto duly authorized, on February 28, 2020.April 29, 2024.
| Date:
| | | | | | | | Date: | February 28, 2020 | By:
| /s/ Jonathan Coblentz | | | | | Jonathan Coblentz | | | | | Chief Financial Officer and Chief Administrative Officer | | | | | (Principal Financial and Accounting Officer) |
POWER OF ATTORNEY
KNOW ALL PERSONS BY THESE PRESENTS, that each person whose signature appears below constitutes and appoints Raul Vazquez and Jonathan Coblentz, jointly and severally, his or her attorneys-in-fact, each with the power of substitution, for him or her in any and all capacities, to sign any amendments to this Annual Report on Form 10-K, and to file the same, with exhibits thereto and other documents in connection therewith with the Securities and Exchange Commission, hereby ratifying and confirming all that each of said attorneys-in-fact, or his substitute or substitutes, may do or cause to be done by virtue hereof.
Pursuant to the requirements of the Securities Exchange Act of 1934, this report has been signed below by the following persons on behalf of the registrant and in the capacities and on the dates indicated.
| | | | | | /s/ Raul Vazquez | | /s/ Jonathan Coblentz | | Raul Vazquez | | Jonathan Coblentz | | (President, Chief Executive Officer, and Director) | | (Chief Financial Officer and Chief Administrative Officer) | | (Principal Executive Officer) | | (Principal Financial and Accounting Officer) | | | | | | /s/ Aida M. Alvarez | | /s/ Jo Ann Barefoot | | Aida M. Alvarez | | Jo Ann Barefoot | | (Director) | | (Director) | | | | | | /s/ Louis P. Miramontes | | /s/ Carl Pascarella | | Louis P. Miramontes | | Carl Pascarella | | (Director) | | (Director) | | | | | | /s/ David Strohm | | /s/ R. Neil Williams | | David Strohm | | R. Neil Williams | | (Director) | | (Director) |
35 96
|
|