UNITED STATES
SECURITIES AND EXCHANGE COMMISSION
WASHINGTON, D.C. 20549
FORM 10-K
ANNUAL REPORT PURSUANT TO SECTION 13 OR 15(d) OF THE SECURITIES EXCHANGE ACT OF 1934
|
| | |
| For the fiscal year ended: | | COMMISSION FILE NUMBER: |
December 31, 20162017 | | 000-54627 |
ATLAS FINANCIAL HOLDINGS, INC.
(EXACT NAME OF REGISTRANT AS SPECIFIED IN ITS CHARTER)
|
| | |
| | | |
| CAYMAN ISLANDS | | 27-5466079 |
| (State or other jurisdiction of | | (I.R.S. Employer |
| incorporation or organization) | | Identification No.) |
| | |
150 NW POINT BOULEVARD953 AMERICAN LANE, 3RD FLOOR | | 6000760173 |
Elk Grove Village,Schaumburg, IL | | (Zip Code) |
| (Address of principal executive offices) | | |
Registrant’s telephone number, including area code: (847) 472-6700
Securities registered pursuant to Section 12(b) of the Act:
|
| | | | |
| TITLE OF EACH CLASS: | | | | NAME OF EACH EXCHANGE ON WHICH REGISTERED: |
| Common, $0.003 par value per share | | | | Nasdaq Stock Market |
| 6.625% Senior Unsecured Notes due 2022 | | | | Nasdaq Stock Market |
Securities registered pursuant to Section 12(g) of the Act: None
Indicate by check mark if the registrant is a well-known seasoned issuer, as defined in Rule 405 of the Securities Act. Yes ¨ No þ
Indicate by check mark if the registrant is not required to file reports pursuant to Section 13 or Section 15(d) of the Act. Yes ¨ No þ
Indicate by check mark whether the Registrant (1) has filed all reports required to be filed by Section 13 or 15(d) of the Securities Exchange Act of 1934 during the preceding 12 months (or for such shorter period that the Registrant was required to file such reports), and (2) has been subject to such filing requirements for the past 90 days. Yes þ No ¨
Indicate by check mark whether the registrant has submitted electronically and posted on its corporate Web site, if any, every Interactive Data File required to be submitted and posted pursuant to Rule 405 of Regulation S-T (§ 232.405 of this chapter) during the preceding 12 months (or for such shorter period that the registrant was required to submit and post such files). Yes þ No ¨
Indicate by check mark if disclosure of delinquent filers pursuant to Item 405 of Regulation S-K (§ 229.405 of this chapter) is not contained herein, and will not be contained, to the best of Registrant’s knowledge, in definitive proxy or information statements incorporated by reference in Part III of this Form 10-K or any amendment to this Form 10-K. þ
Indicate by check mark whether the registrant is a large accelerated filer, an accelerated filer, a non-accelerated filer, or a smaller reporting company, or emerging growth company. See the definitions of “large accelerated filer,” “accelerated filer”filer,” “smaller reporting company,” and “smaller reporting“emerging growth company” in Rule 12b-2 of the Exchange Act. (Check one):
Large Accelerated Filer ¨ Accelerated Filer þ
Non-Accelerated Filer ¨ Smaller Reporting Company ¨
(doDo not check if a smaller reporting company) Emerging Growth Company þ
If an emerging growth company, indicate by check mark if the registrant has elected not to use the extended transition period for complying with any new or revised financial accounting standards provided pursuant to Section 13(a) of the Exchange Act. þ
Indicate by check mark whether the registrant is a shell company (as defined in Rule 12b-2 of the Act). Yes ¨ No þ
There were 12,030,70311,936,970 shares of the Registrant'sRegistrant’s common stock outstanding as of March 10, 2017,29, 2018, all of which 11,902,512 are ordinary voting common shares and 128,191shares. There are no outstanding restricted voting common shares. As of the last business day of the Registrant’s most recently completed second fiscal quarter, the aggregate market value of the Registrant'sRegistrant’s common equity held by non-affiliates of the Registrant was approximately $184.0$153.0 million (based upon the closing sale price of the Registrant’s common shares on June 30, 2016)2017).
For purposes of the foregoing calculation only, which is required by Form 10-K, the Registrant has included in the shares owned by affiliates those shares owned by directors and officers of the Registrant, and such inclusion shall not be construed as an admission that any such person is an affiliate for any purpose.
* * *
DOCUMENTS INCORPORATED BY REFERENCE
Portions of the Registrant’s Definitive Proxy Statement for its 20172018 Annual Meeting of Stockholders are incorporated by reference into Part III of this report.
ATLAS FINANCIAL HOLDINGS, INC.
INDEX TO ANNUAL REPORT ON FORM 10-K
December 31, 20162017
Part I.
Item 1. Business
Overview
Atlas Financial Holdings, Inc. ("Atlas"(“Atlas” or "We"“We” or "the Company"“the Company”) is a financial services holding company whose subsidiaries specialize in the underwriting of commercial automobile insurance policies, focusing on the “light” commercial automobile sector. This sector includes taxi cabs, non-emergency para-transit, limousine, livery and business auto. With roots dating back to 1925 selling insurance for taxi cabs, we are one of the oldest insurers of taxi and livery businesses in the United States. This experience serves as the foundation of our hyper-focused specialty insurance business that embraces continuous improvement, analytics and technology. The expanding segment of commercially licensed drivers operating through transportation network companies (“TNC”) are included in the livery product. Our goal is to be the preferred specialty commercial transportation insurerinsurance business in any geographic area where our value proposition delivers benefit to all stakeholders.
We were originally formed as JJR VI, a Canadian capital pool company, on December 21, 2009 under the laws of Ontario, Canada. On December 31, 2010, we completed a reverse merger wherein American Service Insurance Company, Inc. ("(“American Service"Service”) and American Country Insurance Company ("(“American Country"Country”), in exchange for the consideration set out below, were transferred to us by Kingsway America Inc. ("KAI"(“KAI”), a wholly owned subsidiary of Kingsway Financial Services Inc. ("KFSI"(“KFSI”), a Canadian public company whose shares are traded on the Toronto and New York Stock Exchanges. Prior to the transaction, American Service and American Country were wholly owned subsidiaries of KAI. American Country commenced operations in 1979. In 1983, American Service began as a non-standard personal and commercial auto insurer writing business in the Chicago, Illinois area.
On December 31, 2010, following the reverse merger transaction described immediately hereafter, we filed a Certificate of Registration by Way of Continuation in the Cayman Islands to re-domesticate as a Cayman Islands company. In addition, on December 30, 2010 we filed a Certificate of Incorporation on Change of Name to change our name to Atlas Financial Holdings, Inc. Our current organization is a result of a reverse merger transaction involving the following companies:
| |
| (a) | JJR VI, sponsored by JJR Capital, a Toronto based merchant bank; |
| |
| (b) | American Insurance Acquisition Inc., (" (“American Acquisition"Acquisition”), a corporation formed under the laws of Delaware as a wholly owned subsidiary of KAI; and |
| |
| (c) | Atlas Acquisition Corp., a Delaware corporation wholly-owned by JJR VI and formed for the purpose of merging with and into American Acquisition. |
In connection with the reverse merger transaction, KAI transferred 100% of the capital stock of each of American Service and American Country to American Acquisition (another wholly owned subsidiary of KAI) in exchange for C$35.1 million of common shares and $18.0 million of preferred shares of American Acquisition and promissory notes worth C$7.7 million, aggregating C$60.8 million. In addition, American Acquisition raised C$8.0 million through a private placement offering of subscription receipts to qualified investors in both the United States and Canada at a price of C$6.00 per subscription receipt.
KAI received 4,601,621 restricted voting common shares of our company, then valued at $27.8 million, along with 18,000,000 non-voting preferred shares of our company, then valued at $18.0 million, and C$8.0 million cash for total consideration of C$60.8 million in exchange for 100% of the outstanding shares of American Acquisition and full payment of certain promissory notes. Investors in the American Acquisition private placement offering of subscription receipts received 1,327,834 of our ordinary voting common shares, plus warrants to purchase one ordinary voting common share of our company for each subscription receipt at C$6.00 at any time until December 31, 2013. Every 10 common shares of JJR VI held by the shareholders of JJR VI immediately prior to the reverse merger were, upon consummation of the merger, consolidated into one ordinary voting common share of JJR VI. Upon re-domestication in the Cayman Islands, these consolidated shares were then exchanged on a one-for-one basis for our ordinary voting common shares.
In connection with the acquisition of American Service and American Country, we streamlined the operations of the insurance subsidiaries to focus on the “light” commercial automobile lines of business we believe will produce favorable underwriting results. During 2011 and 2012, we disposed of non-core assets and placed into run-off certain non-core lines of business previously written by the insurance subsidiaries. Since disposing of these non-core assets and lines of business, our sole focus has been the underwriting of specialty commercial insurance for users of "light"“light” vehicles in the United States.
On December 7, 2012, a shareholder meeting was held where a one-for-three reverse stock split was unanimously approved. When the reverse stock split took effect on January 29, 2013, it decreased the authorized and outstanding ordinary voting common shares and restricted voting common shares at a ratio of one-for-three. The primary objective of the reverse stock split was to increase the per share price of Atlas'Atlas’ ordinary voting common shares to meet certain listing requirements of the NASDAQ Capital Market. Unless otherwise noted, all historical share and per share values in this Annual Report on Form 10-K reflect the one-for-three reverse stock split.
On January 2, 2013 we acquired Camelot Services, Inc. ("(“Camelot Services"Services”), a privately owned insurance holding company, and its sole subsidiary, Gateway Insurance Company ("Gateway"(“Gateway”), from an unaffiliated third party. This transaction was contractually deemed effective as of January 1, 2013. Gateway provides specialized commercial insurance products, including commercial automobile insurance to niche markets such as taxi, black car and sedan service owners and operators. Gateway also wrote contractor'scontractor’s workers’ compensation insurance, which we ceased writing as part of the transaction. An indemnity reinsurance agreement was entered into pursuant to which 100% of Gateway’s workers’ compensation business was ceded to a third party captive reinsurer funded by the seller as part of the transaction.
Under the terms of the stock purchase agreement, the purchase price equaled the adjusted book value of Camelot Services as of December 31, 2012, subject to certain pre and post-closing adjustments, including, among others, the future development of Gateway’s actual claims reserves for certain lines of business and the utilization of certain deferred tax assets over time. The total purchase price for all of Camelot Services’ outstanding shares was $14.3 million, consisting of a combination of cash and Atlas preferred shares. Consideration consisted of a $6.0 million dividend paid by Gateway immediately prior to the closing, $2.0 million of Atlas preferred shares (consisting of a total of 2,000,000 preferred shares) and $6.3 million in cash. Pursuant to the terms of the stock purchase agreement, the Company issued an additional 940,500 preferred shares due to the favorable development of Gateway’s actual claims reserves for certain lines of business during the first quarter of 2015. During the first quarter of 2016, the Company canceled 401,940 preferred shares pursuant to the Gateway stock purchase agreement due to the unfavorable development of Gateway’s actual claims reserves for certain lines of business. During the third quarter of 2016, the Company and the former owner of Camelot Services agreed to settle the additional consideration related to future claims development and utilization of certain tax assets. Atlas redeemed all 2,538,560 of the remaining preferred shares issued to the former owner of Gateway.
On February 11, 2013, an aggregate of 4,125,000 Atlas ordinary voting common shares were offered in Atlas'Atlas’ initial public offering in the United States. 1,500,000 ordinary voting common shares were offered by Atlas and 2,625,000 ordinary voting common shares were sold by KAI at a price of $5.85 per share. Atlas also granted the underwriters an option to purchase up to an aggregate of 618,750 additional shares at the public offering price of $5.85 per share to cover over-allotments, if any. On March 11, 2013, the underwriters exercised this option and purchased an additional 451,500 shares. After underwriting and other expenses, total proceeds of $9.8 million were realized on the issuance of the shares. Since that time, Atlas'Atlas’ shares have traded on the NASDAQ under the symbol "AFH."“AFH.” The principal purposes of the initial offering in the United States were to create a public market in the United States for Atlas'Atlas’ ordinary voting common shares and thereby enable future access to the public equity markets in the United States by Atlas and its shareholders, and to obtain additional capital.
On June 5, 2013, Atlas delisted from the Toronto Stock Exchange.
On August 1, 2013, Atlas used the net proceeds from the U.S. initial public offering to partially fund the repurchase of 18,000,000 of its outstanding preferred shares owned by KAI for $16.2 million. These preferred shares had accrued dividends on a cumulative basis at a rate of $0.045 per share per year (4.5%) and were convertible into 2,286,000 common shares at the option of the holder after December 31, 2015. These shares were redeemed in their entirety for $0.90 for every dollar of outstanding face value plus accrued interest.
On May 13, 2014, an aggregate of 2,000,000 Atlas ordinary voting common shares were offered in a subsequent public offering in the United States at a price of $12.50 per share. Atlas also granted the underwriters an option to purchase up to an aggregate of 300,000 additional shares at the public offering price of $12.50 per share to cover over-allotments, if any. On May 27, 2014, the underwriters exercised this option and purchased an additional 161,000 shares. After underwriting and other expenses, total proceeds of $25.0 million were realized on the issuance of the shares. A portion of the net proceeds from the offering was used to support the acquisition of Anchor Holdings Group, Inc. and its affiliated entities as described further below.
During the fourth quarter of 2014, Camelot Services was merged into American Acquisition.
On March 11, 2015, we acquired Anchor Holdings Group, Inc. ("(“Anchor Holdings"Holdings”), a privately owned insurance holding company, and its wholly owned subsidiary, Global Liberty Insurance Company of New York ("(“Global Liberty"Liberty”), along with its affiliated entities, Anchor Group Management ("Inc. (“Anchor Management"Management”), Plainview Premium Finance Company, Inc. ("(“Plainview Delaware"Delaware”) and Plainview Delaware'sDelaware’s wholly owned subsidiary, Plainview Premium Finance Company of California, Inc. ("(“Plainview California"California”), and together with Anchor Holdings, Global Liberty, Anchor Management, and Plainview Delaware, "Anchor,"“Anchor,” from an unaffiliated third party for a total purchase price of $23.2 million, consisting of a combination of cash and Atlas preferred shares and is estimated atthat was approximately 1.3 times combined U.S. GAAP book value. Consideration consisted of approximately $19.2 million in cash and $4.0 million of Atlas preferred shares (consisting of a total of 4,000,000 preferred shares at $1.00 per preferred share). Anchor provides specialized commercial insurance products, including commercial automobile insurance to niche markets such as taxi, black car and sedan service owners and operators primarily in the New York market. During the fourth quarter of 2016, the company canceled 4,000,000 preferred shares pursuant to the Anchor stock purchase agreement due to unfavorable development of Global Liberty'sLiberty’s pre-acquisition claims reserves. Although the re-issuance of preferred shares to the former owner of Anchor may be highly unlikely, the contingent consideration terms of the Anchor stock purchase agreement will remain in effect for a period of five years from the date of acquisition.
Our core business is the underwriting of commercial automobile insurance policies, focusing on the "light"“light” commercial automobile sector, which is carried out through American Country, American Service, Gateway and Global Liberty (collectively, our "Insurance“Insurance Subsidiaries."”)
Competitive Strengths
Our value proposition is driven by our competitive strengths, which include the following:
Focus on niche commercial insurance business. We target niche markets that support adequate pricing. We believe that we are able to adapt to changing market needs well in advance of our competitors through our strategic commitment and operating scale. We develop and deliver superior specialty commercial automobile insurance products pricedand services to meet our customers’customers' needs with a focus on innovation and strivethe effective use of technology and analytics to generatedeliver consistent underwritingoperating profit for our Insurance Subsidiaries. Although reserves were strengthened in connection with certain specific business segments primarily for older accident years, in more recent yearsthe insurance businesses we have experienced a favorable trend in loss ratios attributable to the increased composition of commercial automobile written premium as a percentage of our Insurance Subsidiaries' total written premium coupled with our ability to increase pricing and manage claims effectively.own.
There are a limited number of competitors specializing in these lines of business. Management believes a strong value proposition is very important to attract new business and can result in desirable retention levels as policies renew on an annual basis.
Strong market presence with recognized brands and long-standing distribution relationships. Our Insurance Subsidiaries have a long heritage as insurers of taxi, livery and para-transit businesses. All of our Insurance Subsidiaries have strong brand recognition and long-standing distribution relationships in target markets. ThroughOur understanding of the markets we serve remains current through regular interaction with our independent retail agents, we strive to thoroughly understand each of the markets we serve in order to deliver strategically priced products to attractive market share at the right time.agents. Our Insurance Subsidiaries are currently licensed in more states than those in which we have currently elected to do business, and we routinely re-evaluate all markets to assess future potential opportunities and risks. There are also a relatively limited number of agents who specialize in these lines of business. As a result, strategic relationships with independent retail agents are important to ensure efficient distribution.
Sophisticated underwriting and claims handling expertise.experience. Atlas has extensive experience and expertise with respect to underwriting and claims management in our specialty area of insurance. Our well-developed underwriting and claims infrastructure includes an extensive data repository, proprietary technologies, deep market knowledge and established market relationships. Analysis of the substantial data available through our operating companies drives our product and pricing decisions. We believe our underwriting and claims handling expertiseexperience provides enhanced risk selection, high quality service to our customers and greater control over claims costs. We are committed to maintaining this underwriting and claims handling expertiseexperience as a core competency as our volume of business increases. In recent years, we invested significantly in the use of machine learning based predictive analytics in both our underwriting and claims areas to further leverage this heritage.
Scalable operations positioned for growth. Significant progress has been made in aligning our organization'sorganization’s infrastructure cost base to our expected revenue going forward. The core functions of our Insurance Subsidiaries were integrated into a common operating platform. We believe that our Insurance Subsidiaries are well-positioned to continue approaching proportionate market share of approximately 20% in all of the markets in which we operate with better than industry level profitability from the efficient operating infrastructure established subsequent to Atlas'Atlas’ acquisition of the companies. We are committed to evaluating, and where beneficial, deploy, new technologies and analytics to maximize efficiency and scalability.
Experienced management team. We have a talented and experienced management team who have decades of experience in the property and casualty insurance industry. Our senior management team has worked in the property and casualty industry for an average of more than 25 years and with the Insurance Subsidiaries, directly or indirectly, for an average of 15 years.
Strategic Focus
Vision
Our goal is toTo always be the preferred specialty commercial transportation insurerinsurance business in any geographic areaareas where our value proposition delivers benefit to all stakeholders.
Mission
WeTo develop and deliver superior specialty insurance products pricedand services to meet our customers’ needs with a focus on innovation and generatethe effective use of technology and analytics to deliver consistent underwritingoperating profit for our Insurance Subsidiaries. These products are distributed to the insured through independent retail agents utilizing our company’s operating platform.
insurance businesses we own.
We seek to achieve our vision and mission through the design, sophisticated pricing and efficient delivery of specialty transportation insurance products and risk management products. Through constant interaction with our retail producers, we strive to thoroughly understand eachservices. Our understanding of the markets we serve in order to deliver strategically priced products to attractive markets at the right time.will remain current through interaction with our retail producers. Analysis of the substantial data available through our operating companies drives ourwill drive product and pricing decisions. We will focus on our key strengths and seek to expand our geographic footprint, products and productsservices only to the extent that these activities support our visionVision and mission.Mission. We will target niche markets that support adequate pricing and believe we arewill be best able to adapt to changing market needs ahead of our competitors throughdue to our scale and strategic commitment and increasing scale.commitment.
Outlook
Over the past six years, throughThrough infrastructure re-organization, dispositions and by placing certain lines of business into run-off, our Insurance Subsidiaries have streamlined operations to focus on the lines of business we believe will leverage our core competencies and produce favorable underwriting results. Significant progress has been made in aligningWe have aligned the organization'sorganization’s infrastructure cost base to our expected revenue stream going forward. TheWe integrated the core functions of the Insurance Subsidiaries were integratedour insurance businesses into a common, best practice based, operating platform. Management believes that our Insurance Subsidiariesinsurance businesses are well-positioned to return to the volume of premium they wrote in the recent past and continue to grow to proportionate market share of approximately 20% in all of the markets in which we operate with better than industry level profitability. Our Insurance Subsidiariesinsurance businesses have a long heritage with respect to their continuingour core lines of business and will benefit from the efficient operating infrastructure currently in place. Through its Insurance Subsidiaries, Atlas actively wrote business in 42 states and the District of Columbia during 20162017 utilizing our well-developed underwriting and claims methodology.
We believe that the most significant opportunities going forward are: (i) continually managing our independent retail agency and customer relationships, (ii) building business in previously untapped geographic markets to the extent that they meet our specific criteria where our Insurance Subsidiariesinsurance businesses are licensed, but not active prior to Atlas'Atlas’ acquisition of these subsidiaries,businesses, and (iii) opportunistically acquiring books of business or similar insurance companies, provided market conditions support this activity. Primary potential risks related to these activities include: (i) insurance market conditions becoming or remaining “soft” for a sustained period of time, (ii) not being able to achieve the expected support from distribution partners, and (iii) the Insurance Subsidiaries not successfully maintaining appropriate ratings from A.M. Best.
We seek to deploy our capital to maximize the return for our shareholders, either by investing in growing our operations or by pursuing other capital initiatives, depending upon insurance and capital market conditions. We willintend to identify and prioritize market expansion opportunities based on the comparative strength of our value proposition relative to competitors, the market opportunity and the legal and regulatory environment.
We intend to continue to grow profitably by undertaking the following:
Re-establishMaintain legacy distribution relationships. We continue to build upon relationships with independent retail agents that have been our Insurance Subsidiaries’ distribution partners in the past.for several years. We seek to develop and maintain strategic distribution relationships with a relatively small number of independent retail agents with substantial market presence in each state in which we currently operate. We expect to continue to increase the distribution of our core products in the states where we are actively writing insurance and re-capture insurance premium historically written by the Insurance Subsidiaries.insurance.
Expand our market presence. We are committed to continuing to diversifydiversification by leveraging our experience, historical data and market research to expand our business ininto previously untapped markets to the extent incremental markets meet our criteria. Utilizing our established brands and market relationships, we have made significant inroadsgrown in new states where we had no active business in recent years. We will continue to expand into additional states or product lines where we are licensed, but not currently active, to the extent that our market expansion criteria is met in a given state. In the alternative, we will endeavor to quickly adjust our pricing and underwriting or reduce our exposure to potentially underperforming products.
Acquire complementary books of business and insurance companies. We plan to opportunistically pursue acquisitions of complementary books of business and insurance companies provided market conditions support this activity. We will evaluate each acquisition opportunity based on its expected economic contribution to our results and support of our market expansion initiatives. Our acquisitions of Gateway and Anchor are consistent with this aspect of our strategy.
Market
Our primary target market is made up of small to mid-size taxi, limousine, other livery (including TNC drivers/operators) and non-emergency para-transit operators. The “light” commercial automobile policies we underwrite provide coverage for light weightlightweight commercial vehicles typically with the minimum limits prescribed by statute, municipal or other regulatory requirements. The majority of our policyholders are individual owners or small fleet operators.
In certain jurisdictions like Illinois, Louisiana, Nevada and New York, we have also been successful working with larger operators who retain a meaningful amount of their own risk of loss through higher retentions, self-insurance or self-funded captive insurance entity arrangements. In these cases, we provide support in the areas of day-to-day policy administration and claims handling consistent with the value proposition we offer to all of our insureds, generally on a fee for service basis. We may also provide excess coverage above the levels of risk retained by the insureds where a better than average loss ratio is expected. Through these arrangements, we are able to effectively utilize the significant specialized operating infrastructure we maintain to generate revenue from business segments that may otherwise be more price sensitive in the current market environment.
Gross premiumpremiums written from commercial automobile was $274.7 million, $223.8 million, $207.8 million, and $119.5$207.8 million for the years ended December 31, 2017, 2016, 2015, and 2014,2015, respectively. As a percentage of the Insurance Subsidiaries’ overall book of business, commercial auto gross premiumpremiums written represented 99.4%99.5%, 99.3%99.4%, and 97.6%99.3% of gross premiumpremiums written for the years ended December 31, 2017, 2016, and 2015, and 2014, respectively.
The “light” commercial automobile sector is a subset of the historically profitablebroader commercial automobile insurance industry segment.segment, which over the long term has been historically profitable. In more recent years the commercial automobile insurance industry has seen profitability pressure within certain segments, underperforming the broader property & casualty ("P&C") industry. Over the longer-term however, commercial autoit has outperformed the overall P&C industry generally over the past fifteen years based on data compiled by A.M. Best Aggregates & Averages. Data compiled by SNL Financial also indicates that for 20152016 the total market for commercial automobile liability insurance was approximately $31.3$33.1 billion. The size of the commercial automobile insurance market can be affected significantly by many factors, such as the total number of vehicles insured, the underwriting capacity and underwriting criteria of automobile insurance carriers and general economic conditions. Historically, the commercial automobile insurance market has been characterized by periods of excess underwriting capacity and increased price competition followed by periods of reduced underwriting capacity and higher premium rates.
We believe that there is a positive correlation between the economy and commercial automobile insurance in general. However, operatorsOperators of “light” commercial automobiles may be less likely than other business segments within the commercial automobile insurance market to take vehicles out of service, as their businesses and business reputations rely heavily on availability. With respect to certain business lines such as the taxi line, there are also other factors such as the cost and limited supply of medallions, which may discourage a policyholder from taking vehicles out of service in the face of reduced demand for the use of the vehicle. The significant expansion of transportation network companies ("TNC")TNC has resulted in a reduction in taxi vehicles available to insure; however, we believe that the aforementioned factor relating to medallion values has mitigated the overall decline. Market research also suggests that the combined addressable markets between traditional taxi, livery and TNC companies expanded during this period.
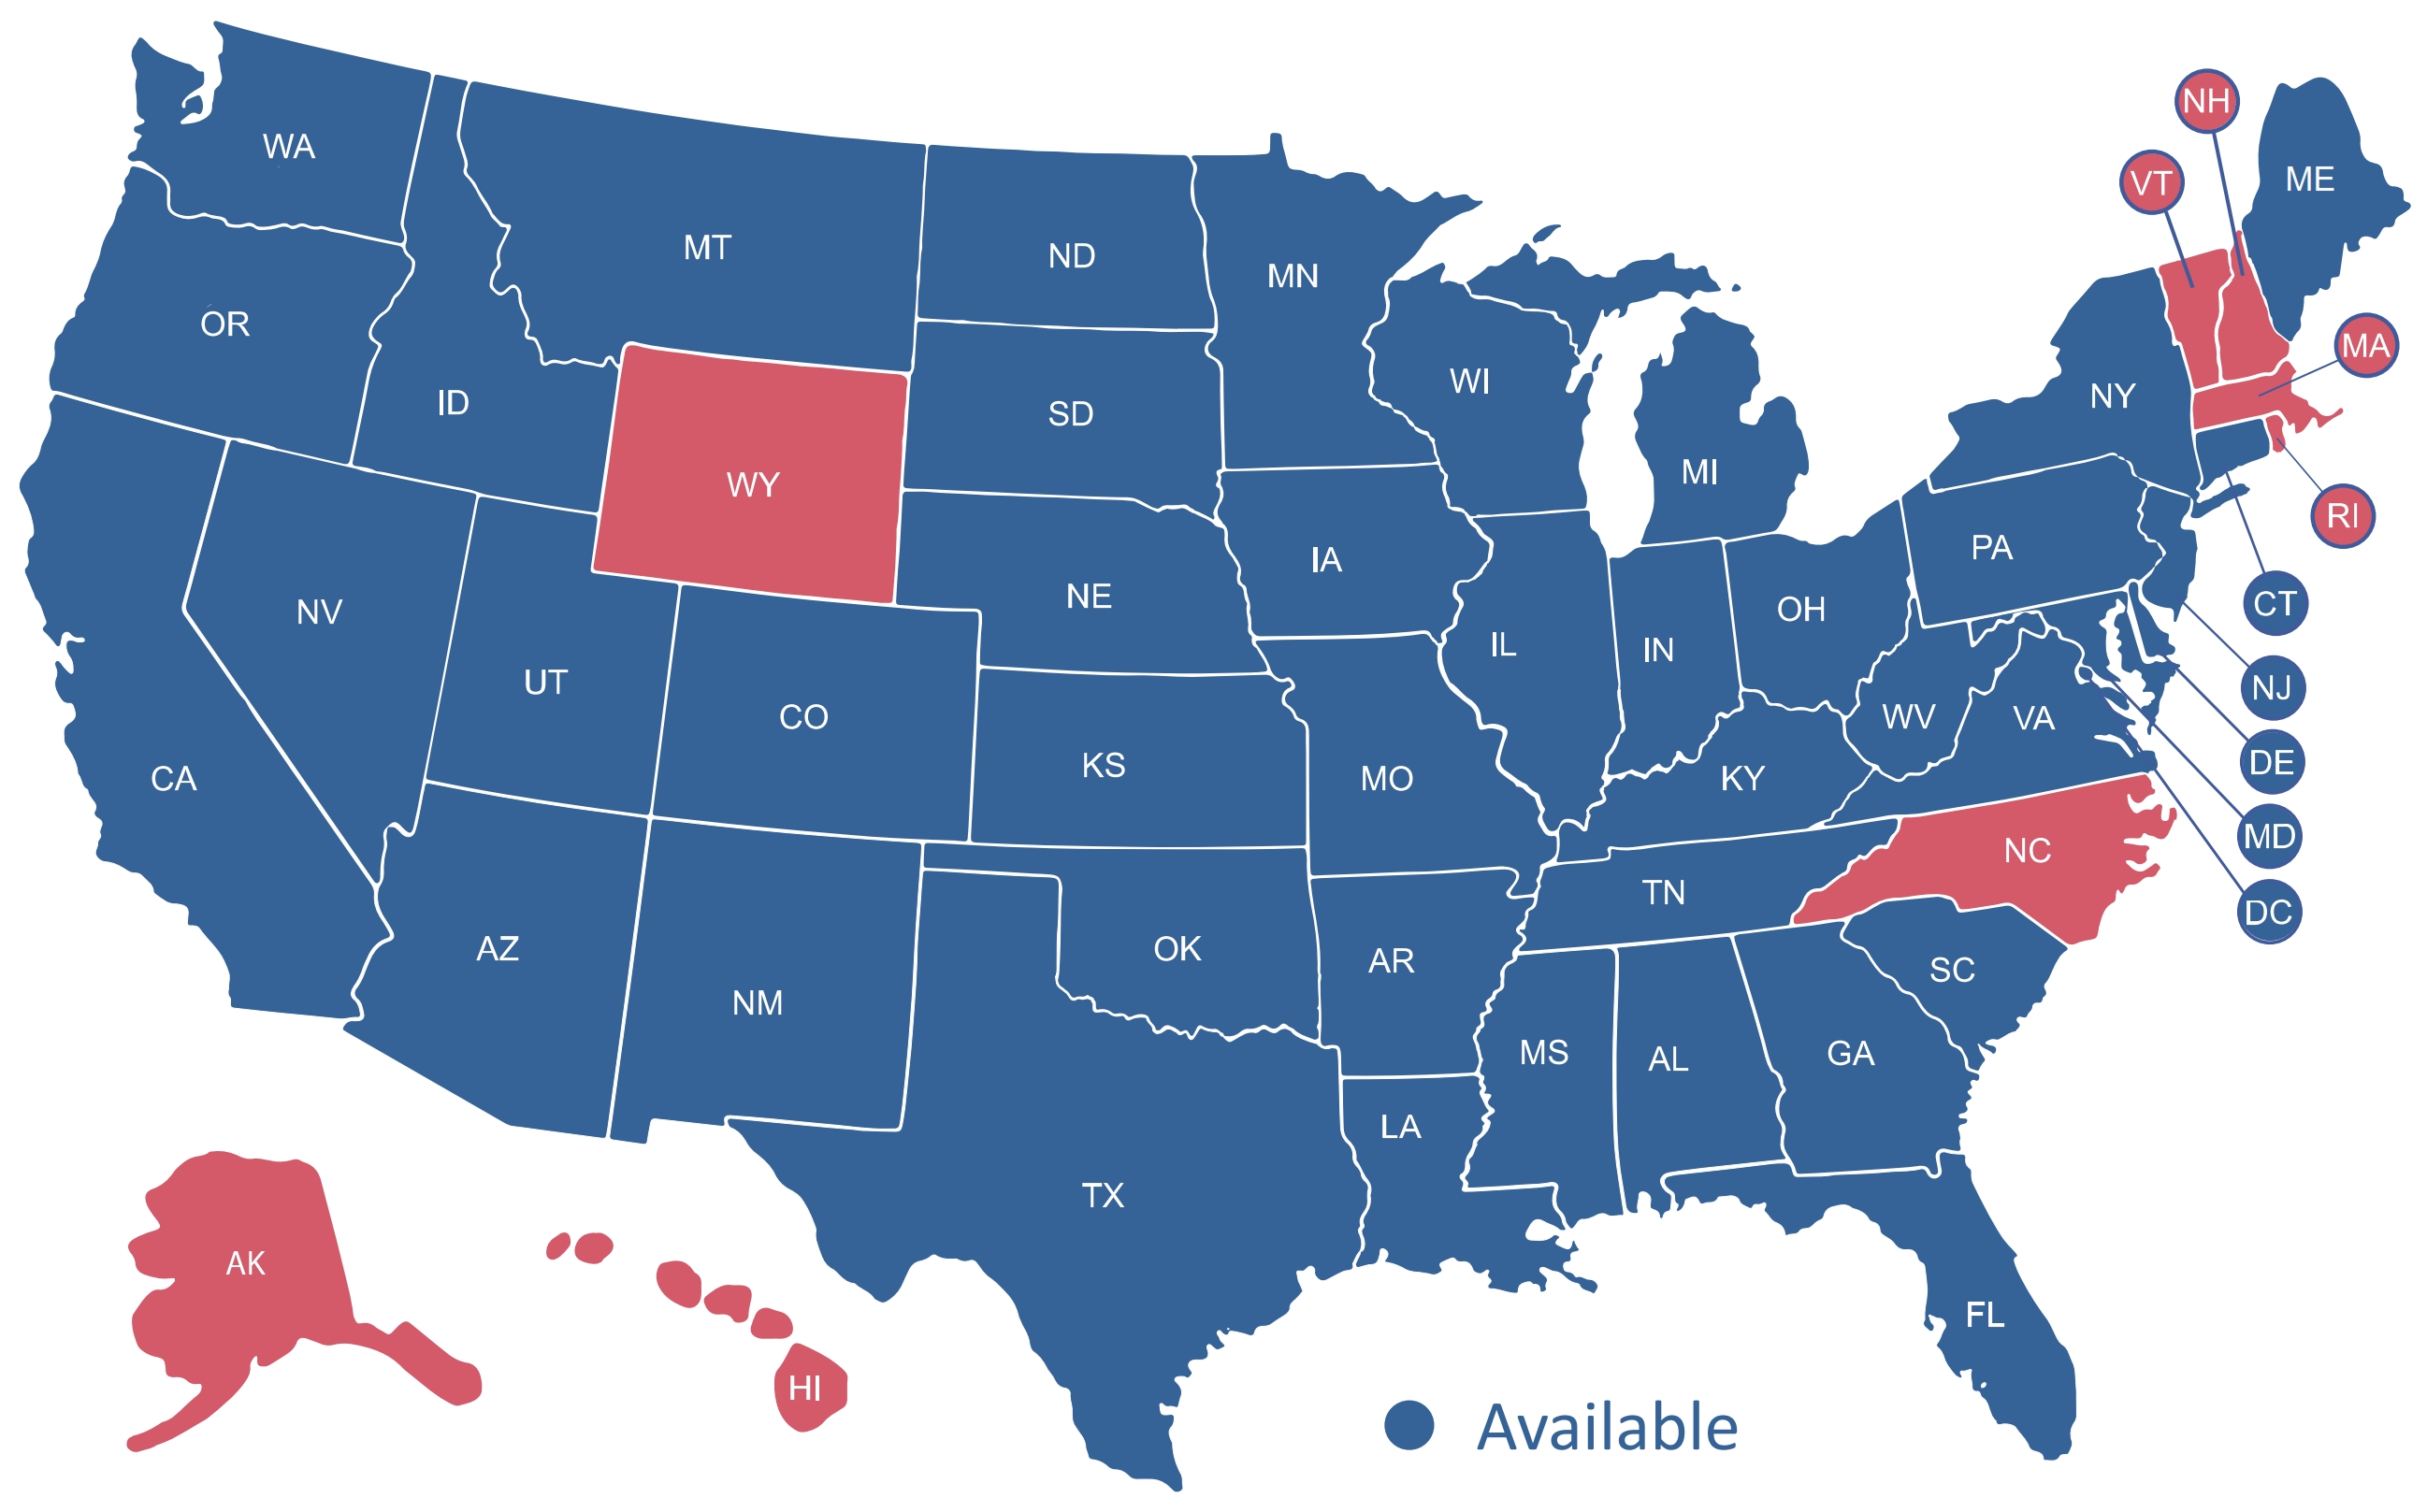
Currently, we distribute our products only in the United States. Through our Insurance Subsidiaries, we are licensed to write P&C insurance in 49 states plus the District of Columbia in the United States. The following table reflects, in percentages, the principal geographic distribution of gross premiums written for the year ended December 31, 2016.2017. No other jurisdiction accounted for more than 5%.
|
| |
Distribution of Gross PremiumPremiums Written by Jurisdiction |
| New York | 31.0%36.0% |
| California | 13.2%15.3% |
| Illinois | 5.5%5.7% |
The diagram below outlines the states where we are focused on actively writing new insurance policies and where we believe the comparative strength of our value proposition, the market opportunity, and the legal and regulatory environment are favorable (the blue states in the below diagram).
Agency Relationships
Independent retail agents are recruited by us directly utilizing marketing efforts targeting the specialty niche upon which we focus. Interested agents are evaluated based on their experience, expertise and ethical dealing. Typically, our Company enters into distribution relationships with approximately one out of every ten agents seeking an agency contract. We do not provide exclusive territories to our independent retail agents, nor do we expect to be their only insurance market. We are generally interested in acting as one of a relatively small number of insurance partners with whom our independent retail agents place business and are also careful not to oversaturate the distribution channel in any given geographic market. This helps to ensure that we are able to receive the maximum number of submissions for underwriting evaluation without unnecessary downstream pressure from agents to write business that does not fit our underwriting model.
Agents receive commission as a percentage of premiums (generally 10%) as their primary compensation from us. Larger agents may also be eligible for profit sharing based on the growth and underwriting profitability related to their book of business with us. The quality of business presented and written by each independent retail agent is evaluated regularly by our underwriters and is also reviewed quarterly by senior management. Key metrics for evaluation include overall accuracy and adequacy of underwriting information, performance relative to agreed commitments, support with respect to claims presented by their customers (as applicable) and overall underwriting profitability of the agent’s book of business. While we rely on our independent retail agents for distribution and customer support, underwriting and claims handling responsibilities are retained by us. Many of our agents have had direct relationships with our Insurance Subsidiaries for a number of years.
Seasonality
Our P&C insurance business is seasonal in nature. Our ability to generate written premium is also impacted by the timing of policy effective periods in the states in which we operate while our net premiums earned generally follow a relatively smooth trend from quarter to quarter. Also, our gross premiums written are impacted by certain common renewal dates in larger metropolitan markets for the light commercial risks that represent our core lines of business. For example, January 1st and March 1st are common taxi cab renewal dates in Illinois and New York, respectively. Additionally, we implemented our New York “excess taxi program” in the third quarter of 2012, which has an annual renewal date in the third quarter. Net underwriting income is driven mainly by the timing and nature of claims, which can vary widely.
Competition
The insurance industry is price competitive in all markets in which the Insurance Subsidiaries operate. Our Company strives to employ disciplined underwriting practices with the objective of rejecting underpriced risks.
Our Company competes on a number of factors such as brand and distribution strength, pricing, agency relationships, policy support, claims service, and market reputation. In our core commercial automobile lines, the primary offerings are policies at the minimum prescribed limits in each state, as established by statutory, municipal and other regulations. We believe our Company differentiates itself from many larger companies competing for this specialty business by exclusively focusing on these lines of insurance. We believe our exclusive focus results in the deployment of underwriting and claims professionals who are more familiar with issues common in specialty commercial automobile lines,insurance businesses, and provides our customers with better service. In more recent years, we have also been leveragingWe leverage machine learning based predictive analytics and other technologies, such as telematics, to further differentiate ourselves from our competitors.
Our competitors generally fall into two categories. The first is made up of large generalist insurers who often sell their products to our niche through intermediaries such as managing general agents or wholesalers. The second consists primarily of smaller local insurance companies. These smaller companies may focus primarily on one or more of our niche markets. Or, as is typical in the majority of geographic areas where we compete, they have a broader focus, often writing a significant amount of non-standard lines of business.
To compete successfully in the specialty commercial insurance industry, we rely on our ability to: identify markets that are most likely to produce an underwriting profit; operate with a disciplined underwriting approach; offer diversified products and geographic platforms; practice effective claims management; reserve appropriately for unpaid claims and claims adjustment expenses; strivestrives for cost containment through economies of scale where deemed appropriate; and, provide services and competitive commissions to our independent agents.
Regulation
We are subject to extensive regulation, particularly at the state level. The method, extent and substance of such regulation varies by state, but generally has its source in statutes and regulations whichthat establish standards and requirements for conducting the business of insurance and that delegate regulatory authority to state insurance regulatory agencies. Insurance companies can also be subject to so-called “desk drawer rules” of state insurance regulators, which are regulatory rules or best practices that have not been codified or formally adopted through regulatory proceedings. In general, such regulation is intended for the protection of those who purchase or use insurance products issued by our Insurance Subsidiaries, not the holders of securities issued by us. These laws and regulations have a significant impact on our business and relate to a wide variety of matters including accounting methods, agent and company licensure, claims procedures, corporate governance, examinations, investing practices, policy forms, pricing, trade practices, reserve adequacy and underwriting standards.
In recent years, the state insurance regulatory framework has come under increased federal scrutiny. Most recently, pursuant to the Dodd-Frank Regulatory Reform Act of 2010, the Federal Insurance Office was formed for the purpose of, among other things, examining and evaluating the effectiveness of the current insurance and reinsurance regulatory framework. In addition, state legislators and insurance regulators continue to examine the appropriate nature and scope of state insurance regulation.
Many state laws require insurers to file insurance policy forms and/or insurance premium rates and underwriting rules with state insurance regulators. In some states, such rates, forms and/or rules must be approved prior to use. While these requirements vary from state to state, generally speaking, regulators review premium rates to ensure they are not excessive, inadequate or unfairly discriminatory.
As a result, the speed with which an insurer can change prices in response to competition or increased costs depends, in part, on whether the premium rate laws and regulations (i) require prior approval of the premium rates to be charged, (ii) permit the insurer to file and use the forms, rates and rules immediately, subject to further review, or (iii) permit the insurer to immediately use the forms, rates and/or rules and to subsequently file them with the regulator. When state laws and regulations significantly restrict both underwriting and pricing, it can become more difficult for an insurer to make adjustments quickly in response to changes, which could affect profitability. Historical results and actuarial work related thereto are often required to support rate changes and may limit the magnitude of such changes in a given period.
Insurance companies are required to report their financial condition and results of operations in accordance with statutory accounting principles prescribed or permitted by state insurance laws and regulations and the National Association of Insurance Commissioners (the “NAIC”). As a result, industry data is available that enables comparisons between insurance companies, including competitors who are not subject to the requirement to prepare financial statements in conformity with accounting principles generally accepted in the United States of America ("(“U.S. GAAP"GAAP”). We frequently use industry publications containing statutory financial information to assess our competitive position. State insurance laws and regulations also prescribe the form and content of statutory financial statements, require the performance of periodic financial examinations of insurers, establish standards for the types and amounts of investments insurers may hold and require minimum capital and surplus levels. Additional requirements include risk-based capital (“RBC”) rules, thresholds intended to enable state insurance regulators to assess the level of risk inherent in an insurance company’s business and consider items such as asset risk, credit risk, underwriting risk and other business risks relevant to its operations. In accordance with RBC formulas, a company’s RBC requirements are calculated and compared to its total adjusted capital to determine whether regulatory intervention is warranted. As of December 31, 2016,2017, the total adjusted capital of each of our Insurance Subsidiaries exceeded the minimum levels required under RBC requirements.
It is difficult to predict what specific measures at the state or federal level will be adopted or what effect any such measures would have on us or our Insurance Subsidiaries.
Employees
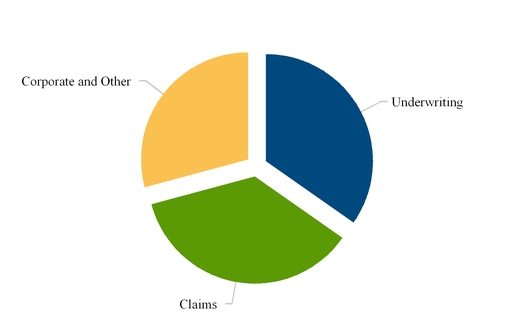
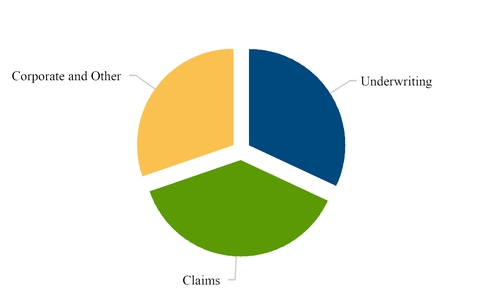
As of December 31, 2016,2017, we had 230264 full-time employees, 153173 of whom work at the corporate headquarters in Elk Grove Village,Schaumburg, Illinois, 108 of whom work in St. Louis, 6270 of whom work in New York, 6 of whom work in Arizona and 57 of whom work remotely. The Corporate and Other category includes executive, information technology, data integrity,business analytics and actuarial, finance and human resources. The Claims category includes in-house legal.
Available Information about Atlas
The address of our registered office is Cricket Square, Hutchins Drive, PO Box 2681, Grand Cayman, KY1-1111, Cayman Islands. Our operating headquarters are located at 150 Northwest Point Boulevard, Elk Grove Village,953 American Lane, 3rd Floor, Schaumburg, Illinois 60007,60173, USA. We maintain a website at http://www.atlas-fin.com. Information on our website or any other website does not constitute a part of this Annual Report on Form 10-K. Atlas files with the Securities and Exchange Commission (the "SEC"“SEC”) and makes available free of charge on its website the Annual Report on Form 10-K, Quarterly Reports on Form10-Q, Current Reports on Form 8-K and amendments to those reports filed or furnished pursuant to Section 13(a) or 15(d) of the Exchange Act (15 U.S.C. 78m(a) or 78o(d)) as soon as reasonably practicable after those reports are electronically filed with, or furnished to, the SEC. To access these filings, go to the company website, using the "Investor Relations"“Investor Relations” heading. These reports are also available on the SEC'sSEC’s website at http://www.sec.gov.
Item 1A. Risk Factors
You should read the following risk factors carefully in connection with evaluating our business and the forward-looking information contained in this Annual Report on Form 10-K. Any of the following risks could materially and adversely affect our business, operating results, financial condition and the actual outcome of matters as to which forward-looking statements are made in this Annual Report on Form 10-K. While we believe we have identified and discussed below the key risk factors affecting our business, there may be additional risks and uncertainties that are not presently known or that are not currently believed to be significant that may adversely affect our business, operating results or financial condition in the future.
Reserve and Exposure Risks
The Insurance Subsidiaries’ provisions for unpaid claims and claims adjustment expenses may be inadequate, which would result in a reduction in our net income and might adversely affect our financial condition.
Our success depends upon our ability to accurately assess and price the risks covered by the insurance policies that we write. We establish reserves to cover our estimated liability for the payment of claims and expenses related to the administration of claims incurred on the insurance policies we write. Establishing an appropriate level of reserves is an inherently uncertain process. Our provisions for unpaid claims and claims adjustment expenses do not represent an exact calculation of actual liability, but are estimates involving actuarial and statistical projections at a given point in time of what we expect to be the cost of the ultimate settlement and administration of known and unknown claims. The process for establishing the provision for unpaid claims and claims adjustment expenses reflects the uncertainties and significant judgmental factors inherent in estimating future results of both known and unknown claims, and as such, the process is inherently complex and imprecise. We utilize a third party actuarial firmfirms to assist us in estimating the provision for unpaid claims and claims adjustment expenses. These estimates are based upon various factors, including:
actuarial and statistical projections of the cost of settlement and administration of claims reflecting facts and circumstances then known;
historical claims information;
assessments of currently available data;
estimates of future trends in claims severity and frequency;
judicial theories of liability;
economic factors such as inflation;
estimates and assumptions regarding judicial and legislative trends, and actions such as class action lawsuits and judicial interpretation of coverages or policy exclusions; and
the level of insurance fraud.
Most or all of these factors are not directly quantifiable, particularly on a prospective basis, and the effects of these and unforeseen factors could negatively impact our ability to accurately assess the risks of the policies that we write. In addition, there may be significant reporting lags between the occurrence of the insured event and the time it is actually reported to the insurer and additional lags between the time of reporting and final settlement of claims. Unfavorable development in any of these factors could cause the level of reserves to be inadequate. The following factors may have a substantial impact on future claims incurred:
the amounts of claims payments;
the expenses that the Insurance Subsidiaries incur in resolving claims;
legislative and judicial developments; and
changes in economic conditions, including inflation.
As time passes and more information about the claims becomes known, the estimates are adjusted upward or downward to reflect this additional information. Because of the elements of uncertainty encompassed in this estimation process, and the extended time it can take to settle many of the more substantial claims, several years of experience may be required before a meaningful comparison can be made between actual claim costs and the original provision for unpaid claims and claims adjustment expenses. The development of the provision for unpaid claims and claims adjustment expenses is shown by the difference between estimates of claims liabilities as of the initial year end and the re-estimated liability at each subsequent year end. Favorable development (reserve redundancy) means that the original claims estimates were higher than subsequently determined or re-estimated. Unfavorable development (reserve deficiency) means that the original claims estimates were lower than subsequently determined or re-estimated.
Government regulators could require that we increase reserves if they determine that provisions for unpaid claims are understated. Increases to the provision for unpaid claims and claims adjustment expenses cause a reduction in our Insurance Subsidiaries’ surplus which could cause a downgrading of our Insurance Subsidiaries’ ratings. Any such downgrade could, in turn, adversely affect their ability to sell insurance policies.
For the companies that we acquired or will acquire, the provisions for unpaid claims and claims adjustment expenses may be inadequate at the time of purchase, which would result in a reduction in our net income and might adversely affect our financial condition.
We cannot guarantee that the provisions for unpaid claims and claims adjustment expenses of the companies that we acquired are or will be adequate. We became or will become responsible for the historical claims reserves established by the acquired company'scompany’s management upon completion of acquisitions. While the stock purchase agreement provides for certain protections in this regard, there can be no assurances they will be sufficient to offset any adverse development to the acquired company'scompany’s historical claims reserves. Any unfavorable development in an acquired company'scompany’s claims reserves would reduce our net income and have an adverse effect on our financial position to the extent it exceeds the protections provided for in the stock purchase agreement related to each acquisition.
Our success depends on our ability to accurately price the risks we underwrite.
Our results of operations and financial condition depend on our ability to underwrite and set premium rates accurately for a wide variety of risks. Adequate rates are necessary to generate premiums sufficient to pay claims, claims adjustment expenses and underwriting expenses and to earn a profit. To price our products accurately, we must collect and properly analyze a substantial amount of data; develop, test and apply appropriate pricing techniques; closely monitor and timely recognize changes in trends; and project both severity and frequency of claims with reasonable accuracy. Our ability to undertake these efforts successfully, and as a result price our products accurately, is subject to a number of risks and uncertainties, some of which are outside our control, including:
the availability of sufficient reliable data and our ability to properly analyze available data;
the uncertainties that inherently characterize estimates and assumptions;
underlying trends or changes affecting risk and loss costs;
our selection and application of appropriate pricing techniques; and
changes in applicable legal liability standards and in the civil litigation system generally.
Consequently, we could underprice risks, which would adversely affect our profit margins, or we could overprice risks, which could reduce our sales volume and competitiveness. In either case, our profitability could be materially and adversely affected.
Our Insurance Subsidiaries rely on independent agents and other producers to bind insurance policies on and to collect premiums from our policyholders, which exposes us to risks that our producers fail to meet their obligations to us.
Our Insurance Subsidiaries market and distribute automobile insurance products through a network of independent agents and other producers in the United States. We rely, and will continue to rely, heavily on these producers to attract new business. Independent producers generally have the ability to bind insurance policies and collect premiums on our behalf, actions over which we have a limited ability to exercise preventative control. In the event that an independent agent exceeds their authority by binding us on a risk that does not comply with our underwriting guidelines, we may be at risk for that policy until we effect a cancellation. Any improper use of such authority may result in claims that could have a material adverse effect on our business, results of operations and financial condition. In addition, in accordance with industry practice, policyholders often pay the premiums for their policies to producers for payment to us. These premiums may be considered paid when received by the producer, and thereafter, the customer is no longer liable to us for those amounts, whether or not we have actually received these premium payments from the producer. Consequently, we assume a degree of risk associated with our reliance on independent agents in connection with the settlement of insurance premium balances.
Our Insurance Subsidiaries may be unable to mitigate their risk or increase their underwriting capacity through reinsurance arrangements, which could adversely affect our business, financial condition and results of operations. If reinsurance rates rise significantly or reinsurance becomes unavailable or reinsurers are unable to pay our claims, we may be adversely affected.
In order to reduce underwriting risk and increase underwriting capacity, our Insurance Subsidiaries transfer portions of our insurance risk to other insurers through reinsurance contracts. We generally purchase reinsurance from third parties in order to reduce our liability on individual risks. Reinsurance does not relieve us of our primary liability to our Insurance Subsidiaries’ insureds. During the year ended December 31, 2016,2017, we had ceded premiumpremiums written of $45.0$44.8 million to our reinsurers. The availability, cost and structure of reinsurance protection are subject to prevailing market conditions that are outside of our control and which may affect our level of business and profitability. Our ability to provide insurance at competitive premium rates and coverage limits on a continuing basis depends in part upon the extent to which we can obtain adequate reinsurance in amounts and at rates that will not adversely affect our competitive position. There are no assurances that we will be able to maintain our current reinsurance facilities, which generally are subject to annual renewal. If we are unable to renew any of these facilities upon their expiration or to obtain other reinsurance facilities in adequate amounts and at favorable rates, we may need to modify our underwriting practices or reduce our underwriting commitments, which could adversely affect our results of operations.
Our Insurance Subsidiaries are subject to credit risk with respect to the obligations of reinsurers and certain of our insureds. The inability of our risk sharing partners to meet their obligations could adversely affect our profitability.
Although the reinsurers are liable to us to the extent of risk ceded to them, we remain ultimately liable to policyholders on all risks, even those reinsured. As a result, ceded reinsurance arrangements do not limit our ultimate obligations to policyholders to pay claims. We are subject to credit risks with respect to the financial strength of our reinsurers. We are also subject to the risk that their reinsurers may dispute their obligations to pay our claims. As a result, we may not recover sufficient amounts for claims that we submit to reinsurers, if at all. As of December 31, 2016,2017, we had an aggregate of $43.2$61.4 million of reinsurance recoverables, of which $36.3$60.9 million were unsecured. In addition, our reinsurance agreements are subject to specified limits, and we would not have reinsurance coverage to the extent that those limits are exceeded.
Effective immediately after the close of the Gateway transaction, we entered into a reinsurance agreement with a third party reinsurer, that covers all in-force premium and claims reserves for Gateway’s workers’ compensation program. Along with the reserves, any go-forward premium written for the workers’ compensation program will be ceded in its entirety to this third party reinsurer under the terms of this reinsurance agreement. While Gateway will remain liable to its insureds, we expect to have no net exposure to any claims related to this workers’ compensation business subsequent to the effective date of the acquisition, provided the reinsurer continues to make payments to us and otherwise complies with the terms of this reinsurance agreement, although no assurances thereof can be given.
With respect to insurance programs, the Insurance Subsidiaries are subject to credit risk with respect to the payment of claims and on the portion of risk exposure either ceded to captives established by their clients or deductibles retained by their clients. No assurance can be given regarding the future ability of these entities to meet their obligations. The inability of our risk sharing partners to meet their obligations could adversely affect our profitability.
The exclusions and limitations in our policies may not be enforceable.
Many of the policies we issue include exclusions or other conditions that define and limit coverage, which exclusions and conditions are designed to manage our exposure to certain types of risks and expanding theories of legal liability. In addition, many of our policies limit the period during which a policyholder may bring a claim under the policy, which period in many cases is shorter than the statutory period under which these claims can be brought by our policyholders. While these exclusions and limitations help us assess and control our claims exposure, it is possible that a court or regulatory authority could nullify or void an exclusion or limitation, or legislation could be enacted modifying or barring the use of these exclusions and limitations. This could result in higher than anticipated claims and claims adjustment expenses by extending coverage beyond our underwriting intent or increasing the number or size of claims, which could have a material adverse effect on our operating results. In some instances, these changes may not become apparent until some time after we have issued the insurance policies that are affected by the changes. As a result, the full extent of liability under our insurance contracts may not be known for many years after a policy is issued.
The occurrence of severe catastrophic events may have a material adverse effect on our financial results and financial condition.
Although our business strategy generally precludes us from writing significant amounts of catastrophe exposed business, most property and casualty insurance contains some exposure to catastrophic claims. We have only limited exposure to natural and man-made disasters, such as hurricane, typhoon, windstorm, flood, earthquake, acts of war, acts of terrorism and political instability. While we carefully manage our aggregate exposure to catastrophes, modeling errors and the incidence and severity of catastrophes, such as hurricanes, windstorms and large-scale terrorist attacks are inherently unpredictable, and our claims from catastrophes could be substantial. In addition, it is possible that we may experience an unusual frequency of smaller claims in a particular period. In either case, the consequences could be substantial volatility in our financial condition or results of operations for any fiscal quarter or year, which could have a material adverse effect on our ability to write new business. These claims could deplete our shareholders’ equity. Increases in the values and geographic concentrations of insured property and the effects of inflation have resulted in increased severity of industry claims from catastrophic events in recent years, and we expect that those factors will increase the severity of catastrophe claims in the future. It is also possible that catastrophic claims could have an impact on our investment portfolio.
The risk models we use to quantify catastrophe exposures and risk accumulations may prove inadequate in predicting all outcomes from potential catastrophe events.
We rely on widely accepted and industry-recognized catastrophe risk modeling, primarily in conjunction with our reinsurance partners, to help us quantify our aggregate exposure to any one event. As with any model of physical systems, particularly those with low frequencies of occurrence and potentially high severity of outcomes, the accuracy of the model’s predictions is largely dependent on the accuracy and quality of the data provided in the underwriting process and the judgments of our employees and other industry professionals. These models do not anticipate all potential perils or events that could result in a catastrophic loss to us. Furthermore, it is often difficult for models to anticipate and incorporate events that have not been experienced during or as a result of prior catastrophes. Accordingly, it is possible for us to be subject to events or contingencies that have not been anticipated by our catastrophe risk models and which could have a material adverse effect on our reserves and results of operations.
Financial Risks
We are a holding company dependent on the results of operations of our subsidiaries and their ability to pay dividends and other distributions to us.
Atlas is a holding company with no significant operations of its own and a legal entity separate and distinct from our Insurance Subsidiaries. As a result, our only sources of income are dividends and other distributions from our Insurance Subsidiaries. We will be limited by the earnings of those subsidiaries, and the distribution or other payment of such earnings to them in the form of dividends, loans, advances or the reimbursement of expenses. The payment of dividends, the making of loans and advances or the reimbursement of expenses by our Insurance Subsidiaries is contingent upon the earnings of those subsidiaries and is subject to various business considerations and various statutory and regulatory restrictions imposed by the insurance laws of the domiciliary jurisdiction of such subsidiaries. In the states of domicile of our Insurance Subsidiaries, dividends may only be paid out of earned surplus and cannot be paid when the surplus of the company fails to meet minimum requirements or when payment of the dividend or distribution would reduce its surplus to less than the minimum amount. The state insurance regulator must be notified in advance of the payment of an extraordinary dividend and be given the opportunity to disapprove any such dividend. Prior to entering into any loan or certain other agreements between one or more of our Insurance Subsidiaries and Atlas or our other affiliates, advance notice must be provided to the state insurance regulator, and the insurance regulator has the opportunity to disapprove such loan or agreement. Additionally, insurance regulators have broad powers to prevent reduction of statutory capital and surplus to inadequate levels and could refuse to permit the payment of dividends calculated under any applicable formula. As a result, we may not be able to receive dividends or other distributions from our Insurance Subsidiaries at times and in amounts necessary to meet our operating needs, to pay dividends to shareholders or to pay corporate expenses. The inability of our Insurance Subsidiaries to pay dividends or make other distributions could have a material adverse effect on our business and financial condition.
Our Insurance Subsidiaries are subject to minimum capital and surplus requirements. Failure to meet these requirements may subject us to regulatory action.
Atlas'Atlas’ Insurance Subsidiaries are subject to minimum capital and surplus requirements imposed under laws of the states in which the companies are domiciled as well as in the states where we conduct business. Any failure by one of our Insurance Subsidiaries to meet minimum capital and surplus requirements imposed by applicable state law may subject it to corrective action, which may include requiring adoption of a comprehensive financial plan, revocation of its license to sell insurance products or placing the subsidiary under state regulatory control. Any new minimum capital and surplus requirements adopted in the future may require us to increase the capital and surplus of our Insurance Subsidiaries, which we may not be able to do.
We are subject to assessments and other surcharges from state guaranty funds and mandatory state insurance facilities, which may reduce our profitability.
Virtually all states require insurers licensed to do business therein to bear a portion of contingent and incurred claims handling expenses and the unfunded amount of “covered” claims and unearned premium obligations of impaired or insolvent insurance companies, either up to the policy'spolicy’s limit, the applicable guaranty fund covered claims obligation cap, or 100% of statutorily defined workers'workers’ compensation benefits, subject to applicable deductibles. These obligations are funded by assessments, made on a retrospective, prospective or pre-funded basis, which are levied by guaranty associations within the state, up to prescribed limits (typically 2% of “net direct written premium”), on all member insurers in the state on the basis of the proportionate share of the premiums written by member insurers in certain covered lines of business in which the impaired, insolvent or failed insurer was engaged. Accordingly, the total amount of assessments levied on us by the states in which we are licensed to write insurance may increase as we increase our premiums written. In addition, as a condition to the ability to conduct business in certain states (and within the jurisdiction of some local governments), insurance companies are subject to or required to participate in various premium or claims based insurance-related assessments, including mandatory (a/k/a “involuntary”) insurance pools, underwriting associations, workers'workers’ compensation second-injury funds, reinsurance funds, and other state insurance facilities. Although we may be entitled to take premium tax credit (or offsets), recover policy surcharges or include assessments in future premium rate structures for payments we make under these facilities, the effect of these assessments and insurance-related arrangements, or changes in them, could reduce our profitability in any given period or limit our ability to grow our business.
Market fluctuations, changes in interest rates or a need to generate liquidity could have significant and negative effects on our investment portfolio. We may not be able to realize our investment objectives, which could significantly reduce our net income.
We depend on income from our securities portfolio for a substantial portion of our earnings. Investment returns are an important part of our overall profitability. A significant decline in investment yields in the securities portfolio or an impairment of securities owned could have a material adverse effect on our business, results of operations and financial condition. We currently maintain and intend to continue to maintain a securities portfolio comprised primarily of investment grade fixed income securities. Despite the Company’s best efforts, we cannot predict which industry sectors or specific investments in which we maintain investments may suffer losses as a result of potential declines in commercial and economic activity. Accordingly, adverse fluctuations in the fixed income or equity markets could adversely impact profitability, financial condition or cash flows. If we are forced to sell portfolio securities that have unrealized losses for liquidity purposes rather than holding them to maturity or recovery, we would realize investment losses on those securities when that determination was made. We could also experience a loss of principal in fixed and non-fixed income investments. In addition, certain of our investments, including our investments in limited partnerships owning income producing properties, are illiquid and difficult to value.
Our ability to achieve our investment objectives is affected by general economic conditions that are beyond our control. General economic conditions can adversely affect the markets for interest rate sensitive securities, including liquidity in such markets, the level and volatility of interest rates and, consequently, the value of fixed maturity securities. U.S. and global markets have experienced periods of volatility since mid-2007. Initiatives taken by the U.S. and foreign governments have helped to stabilize the financial markets and restore liquidity to the banking system and credit markets. In addition, markets in the United States and around the world experienced volatility in 2011 due, in part, to sovereign debt downgrades. If market conditions were to deteriorate, our investment portfolio could be adversely affected.
Difficult conditions in the economy generally may materially and adversely affect our business, results of operations and statement of financial position, and these conditions may not improve in the near future.
Current market conditions and the potential for instability in the global financial markets present additional risks and uncertainties for our business. In particular, deterioration in the public debt markets could lead to additional investment losses and an erosion of capital as a result of a reduction in the fair value of investment securities.
Since 2007, the market has experienced the severe downturn associated with mortgage backed securities, and the follow-on impact to the broader financial sector. This environment created significant unrealized losses in our securities portfolio at certain stages in 2009. Since then, there have been periods of uncertainty for many reasons, including concerns about the credit-worthiness of countries within the European Union, uncertainty about the strength of the Chinese economy, the United Kingdom European Union membership referendum (the "Brexit vote"“Brexit vote”) and the recent rapid rise in U.S. Treasury yields.
Risks from these events, or other currently unknown events could lead to worsening economic conditions, widening of credit spreads or bankruptcies which could negatively impact the financial position of the company.
Atlas’ portfolio is managed by an SEC registered investment advisor specializing in the management of insurance company portfolios. We and our investment manager consider these issues in connection with current asset allocation decisions with the object of avoiding them going forward. However, depending on market conditions going forward, we could again incur substantial realized and additional unrealized losses in future periods, which could have an adverse impact on the results of operations and financial condition. There can be no assurance that the current market conditions will improve in the near future. We could also experience a reduction in capital in the Insurance Subsidiaries below levels required by the regulators in the jurisdictions in which we operate. Certain trust accounts for the benefit of unaffiliated third parties have been established with collateral on deposit under the terms and conditions of the relevant trust agreements. The value of collateral could fall below the levels required under these agreements, putting the subsidiary or subsidiaries in breach of the agreement.
We may not have access to capital in the future.
We may need new or additional financing in the future to conduct our operations or expand our business. However, we may be unable to raise capital on favorable terms, or at all, including as a result of disruptions, uncertainty and volatility in the global credit markets, or due to any sustained weakness in the general economic conditions and/or financial markets in the United States or globally. From time to time, we may rely on access to financial markets as a source of liquidity for operations, acquisitions and general corporate purposes.
The limited public float and trading volume for our shares may have an adverse impact on the share price or make it difficult to liquidate.
Our securities are held by a relatively small number of shareholders. Future sales of substantial amounts of our shares in the public market, or the perception that these sales could occur, may adversely impact the market price of our shares, and our shares could be difficult to liquidate.
We do not anticipate paying any cash dividends on our common stock for the foreseeable future.
We currently intend to retain our future earnings, if any, for the foreseeable future, for working capital and other general corporate purposes. We do not intend to pay any dividends to holders of our ordinary voting common shares. As a result, capital appreciation in the price of our ordinary voting common shares, if any, will be the only source of gain on an investment in our ordinary voting common shares. We have never declared or paid cash dividends on our common stock since Atlas'Atlas’ inception in 2010. Any future determination to pay dividends on our common stock will be at the discretion of our board of directors, subject to applicable laws, and will depend on our financial condition, results of operations, capital requirements, general business conditions, and other factors that our board of directors considers relevant. In addition, the insurance laws and regulations governing our Insurance Subsidiaries contain restrictions on the ability to pay dividends, or to make other distributions to Atlas, which may limit Atlas'Atlas’ ability to pay dividends to its common shareholders.
Unlike the holders of our ordinary voting common shares, holders of our preferred shares are entitled to dividends on a cumulative basis whether or not declared by our board of directors, at a rate of $0.045 per preferred share per year, which must be paid or declared and set apart before any dividend may be paid on our ordinary voting common shares. We paid $409,000 of preferred dividends during 2016 on the preferred shares held by the former owner of Gateway. All of the preferred shares held by the former owner of Gateway were repurchased on September 30, 2016, and therefore, no additional dividends have accrued or will accrue on those preferred shares. During the fourth quarter of 2016, Atlas canceled the 4,000,000 preferred shares held by the former owner of Anchor. The cumulative amount of accrued and unpaid dividends to the former owner of Anchor was $333,000 as of December 31, 2016.2017. As of December 31, 2016, the paid claims development on Global Liberty'sLiberty’s pre-acquisition claims reserves was in excess of $4,000,000, and as a result, pursuant to the terms of the Anchor stock purchase agreement, dividends will no longer accrue to the former owner of Anchor. As of December 31, 2016, there were no preferred shares outstanding. Although the re-issuance of preferred shares to the former owner of Anchor may be highly unlikely, the contingent consideration terms of the Anchor stock purchase agreement will remain in effect for a period of five years from the date of acquisition.
Risks Related to the Company’s Senior Unsecured Notes
If Atlas incurs additional debt or liabilities, or if we are unable to maintain a level of cash flows from operating activities, Atlas’ ability to pay its obligations on its senior unsecured notes (the “Senior Unsecured Notes”) could be adversely affected. Although the Senior Unsecured Notes are “senior notes,” they would be subordinate to any senior secured indebtedness the Company may incur and structurally subordinate to all liabilities of Atlas’ subsidiaries, which increases the risk that Atlas will be unable to meet its obligations on the Senior Unsecured Notes when they mature. Atlas’ ability to pay interest on the Senior Unsecured Notes as it comes due and the principal of the Senior Unsecured Notes at their maturity may be limited by regulatory constraints, including, without limitation, state insurance laws that limit the ability of Atlas’ insurance company subsidiaries to pay dividends. Although the Senior Unsecured Notes are listed on the Nasdaq Global Market, there can be no assurance that an active trading market for the Senior Unsecured Notes will develop, or if one does develop, that it will be maintained. The price at which holders will be able to sell their Senior Unsecured Notes prior to maturity will depend on a number of factors and may be substantially less than the amount originally invested. Holders of the Senior Unsecured Notes will have limited rights if there is an event of default. Atlas may redeem the Senior Unsecured Notes before maturity, and holders of the redeemed Senior Unsecured Notes may be unable to reinvest the proceeds at the same or a higher rate of return.
Compliance Risks
We are subject to comprehensive regulation, and our results may be unfavorably impacted by these regulations.
As a holding company that owns insurance companies domiciled in the United States, we and our Insurance Subsidiaries are subject to comprehensive laws, regulations and rules. These laws, regulations and rules generally delegate regulatory, supervisory and administrative powers to state insurance regulators. Insurance regulations are generally designed to protect policyholders rather than shareholders, and are related to matters, including, but not limited to:
rate setting;
RBC ratio and solvency requirements;
restrictions on the amount, type, nature, quality and quantity of securities and other investments in which insurers may invest;
the maintenance of adequate reserves for unearned premiums and unpaid, and incurred but not reported, claims;
restrictions on the types of terms that can be included in insurance policies;
standards for accounting;
marketing practices;
claims settlement practices;
the examination of insurance companies by regulatory authorities, including periodic financial and market conduct examinations;
requirements to comply with medical privacy laws as a result of our administration of Gateway'sGateway’s run-off and American Country'sCountry’s transportation workers'workers’ compensation business;
underwriting requirements related to Global Liberty'sLiberty’s run-off property insurance program;
the licensing of insurers and their agents;
limitations on dividends and transactions with affiliates;
approval of certain reinsurance transactions;
insolvency proceedings;
ability to enter and exit certain insurance markets, cancel policies or non-renew policies; and
data privacy.
Such laws, regulations and rules increase our legal and financial compliance costs and make some activities more time-consuming and costly. Any failure to monitor and address any internal control issues could adversely impact operating results. In addition, the Sarbanes-Oxley Act requires, among other things, that we maintain effective disclosure controls and procedures and internal control over financial reporting. A deficiency in internal control exists when the design or operation of a control does not allow management or employees, in the normal course of performing their assigned functions, to prevent or detect and correct misstatements on a timely basis. A significant deficiency is a deficiency, or combination of deficiencies, in internal control that is less severe than a material weakness, yet important enough to merit attention by those charged with governance. A material weakness is a deficiency, or combination of deficiencies, in internal control, such that there is a reasonable possibility that a material misstatement of the entity'sentity’s financial statements will not be prevented, or detected and corrected on a timely basis.
State insurance departments conduct periodic examinations of the affairs of insurance companies and require filing of annual and other reports relating to the financial condition of insurance companies, holding company issues and other matters. Our business depends on compliance with applicable laws, regulations and rules and our ability to maintain valid licenses and approvals for our operations. Regulatory authorities may deny or revoke licenses for various reasons, including violations of laws, regulations and rules. Changes in the level of regulation of the insurance industry or changes in laws, regulations and rules themselves or interpretations thereof by regulatory authorities could have a material adverse effect on our operations. Because we are subject to insurance laws, regulations and rules of many jurisdictions that are administered by different regulatory and governmental authorities, there is also a risk that one authority'sauthority’s interpretation of a legal or regulatory issue may conflict with another authority'sauthority’s interpretation of the same issue. Insurance companies are also subject to “desk drawer rules” of state insurance regulators, which are regulatory rules that have not been codified or formally adopted through regulatory proceedings. In addition, we could face individual, group and class-action lawsuits by our policyholders and others for alleged violations of certain state laws, regulations and rules. Each of these regulatory risks could have an adverse effect on our profitability.
As a result of our administration of Gateway'sGateway’s run-off and American Country'sCountry’s transportation workers'workers’ compensation business, we are required to comply with state and federal laws governing the collection, transmission, security and privacy of health information that result in significant compliance costs, and any failure to comply with these laws could result in material criminal and civil penalties. These laws and rules are subject to administrative interpretation and many are derived from the privacy provisions in the Federal Gramm-Leach-Bliley Act of 2002. The Gramm-Leach-Bliley Act, which, among other things, protects consumers from the unauthorized dissemination of certain personal information, and various state laws and regulations addressing privacy issues, require us to maintain appropriate procedures for managing and protecting certain personal information of our customers and to fully disclose our privacy practices to our customers. Given the complexity of these privacy regulations, the possibility that the regulations may change, and the fact that the regulations are subject to changing and potentially conflicting interpretation, our ability to maintain compliance with the privacy requirements of state and federal law is uncertain and the costs of compliance are significant.
Most states have adopted either statutes or regulations or have issued bulletins or informal rules that regulate the anticipated withdrawal of a product, line or sub-line of insurance business from the insurance marketplace in their state. While what constitutes a “withdrawal” or its equivalent under each state'sstate’s statutory or regulatory scheme varies, our Insurance Subsidiaries can be subjected to regulatory requirements in connection with any withdrawal, including, but not limited to, making notice and/or plan filings with the applicable insurance regulator in certain states and possibly requiring the prior approval of the applicable state regulator. A failure by our Insurance Subsidiaries to comply with and satisfy these regulatory requirements in connection with any withdrawals could lead to regulatory fines, cause a distraction for management requiring us to continue to administer withdrawn business for longer than anticipated and could result in our Insurance Subsidiaries continuing to write undesirable business, which could have an adverse impact on our reserves, results of operations and financial condition.
It is not possible to predict the future impact of changing federal and state regulation on our operations, and there can be no assurance that laws enacted in the future will not be more restrictive than existing laws, regulations and rules. New or more restrictive laws, regulations and rules, including changes in current tax or other regulatory interpretations could make it more expensive for us to conduct our businesses, restrict or reduce the premiums our Insurance Subsidiaries are able to charge or otherwise change the way we do business. In addition, economic and financial market turmoil or other conditions, circumstances or events may result in U.S. federal oversight of the insurance industry in general.
Our business is subject to risks related to litigation and regulatory actions.
We may, from time to time, be subject to a variety of legal and regulatory actions relating to our current and past business operations, including, but not limited to:
disputes over coverage or claims adjudication, including claims alleging that we or our Insurance Subsidiaries have acted in bad faith in the administration of claims by our policyholders;
disputes regarding sales practices, disclosure, policy issuance and cancellation, premium refunds, licensing, regulatory compliance, setting of appropriate reserves and compensation arrangements;
limitations on the conduct of our business;
disputes with our agents, producers or network providers over compensation or the termination of our contracts with such agents, producers or network providers, including any alleged claim that they may make against us in connection with a dispute whether in the scope of their agreements or otherwise;
disputes with taxing authorities regarding tax liabilities; and
disputes relating to certain businesses acquired or disposed of by us.
As insurance industry practices and regulatory, judicial and industry conditions change, unexpected and unintended issues related to pricing, claims, coverage and business practices may emerge. Plaintiffs often target P&C insurers in purported class action litigation relating to claims handling and insurance sales practices. The resolution and implications of new underwriting, claims and coverage issues could have a negative effect on our business by extending coverage beyond our underwriting intent, increasing the size of claims or otherwise requiring us to change our practices. The effects of unforeseen emerging claims and coverage issues could negatively impact revenues, results of operations and reputation. Current and future court decisions and legislative activity may increase our exposure to these or other types of claims. Multi-party or class action claims may present additional exposure to substantial economic, non-economic or punitive damage awards. An unfavorable result with respect to even one of these claims, if it resulted in a significant damage award or a judicial ruling that was otherwise detrimental, could create a precedent that could have a material adverse effect on our results of operations and financial condition. This risk of potential liability may make reasonable settlements of claims more difficult to obtain. We cannot determine with any certainty what new theories of recovery may evolve or what their impact may be on our business.
We have been and may be subject to governmental or administrative investigations and proceedings. Our Insurance Subsidiaries have been subject to numerous inquiries related to the substantial ownership interest in us held by KAI in the past. As of this document’s filing date, KAI’s ownershipKAI is below 10%, and they are no longer considered an ultimate controlling party from a statutory perspective. We remaincan be subject to regulatory action, restrictions or heightened compliance or reporting requirements in certain states, including Connecticut and Texas. Texas accounted for 3.9%, 5.0% and 6.0% of our net premiums earned for the years ended December 31, 2016, 2015, and 2014, respectively. Prior to Atlas' acquisition of American Country, the Connecticut insurance commissioner issued an order prohibiting American Country from writing new policies, limiting it to only renewing existing policies in that state. Currently, Global Liberty is our only insurance subsidiary that can write any business in Connecticut, but we may seek approval for our other Insurance Subsidiaries to write business in this state at some point in the future. In 2009, the Texas Department of Insurance indicated to American Country and American Service that it was considering revoking their certificates of authority to write insurance business in Texas. Following discussions with management of the subsidiaries’ former owner, KFSI, these Insurance Subsidiaries were allowed to retain their licenses, in part, in anticipation of a planned spin-off of the Insurance Subsidiaries outside of KFSI and subject to their maintenance of a statutory deposit in Texas.states. If we are not able to successfully comply with or lift the heightened compliance or disclosure requirements applicable in one or more of these states or any new requirements that a state may impose in the future, we may not be able to expand our operations in such state in accordance with our growth strategy or we could be subject to additional regulatory requirements that could impose a material burden on our expansion strategy or limit or prohibit our ability to write new and renewal insurance policies in such state. Any such limitation or prohibition could have a material adverse effect on our results of operations and financial conditions and on our ability to execute our strategy in the future. The result of these inquiries could lead to additional requirements, restrictions or limitations being placed on us or our Insurance Subsidiaries, any of which could increase our costs of regulatory compliance and could have an adverse effect on our ability to operate our business. As a general matter, we cannot predict the outcome of regulatory investigations, proceedings and reviews and cannot guarantee that such investigations, proceedings or reviews or related litigation or changes in operating policies and practices would not materially and adversely affect our results of operations and financial condition. In addition, we have experienced difficulties with our relationships with regulatory bodies in various jurisdictions, and if such difficulties arise in the future, they could have a material adverse effect on our ability to do business in that jurisdiction.
Our business could be adversely affected as a result of changing political, regulatory, economic or other influences.
The insurance industry is subject to changing political, economic and regulatory influences. These influences affect the practices and operation of insurance and reinsurance organizations. Legislatures in the United States and other jurisdictions have periodically considered programs to reform or amend their respective insurance and reinsurance regulatory systems. Recently, the insurance and reinsurance regulatory framework has been subject to increased scrutiny in many jurisdictions. Changes in current insurance laws, regulations and rules may result in increased governmental involvement in or supervision of the insurance industry or may otherwise change the business and economic environment in which insurance industry participants operate. Historically, the automobile insurance industry has been under pressure from time to time from regulators, legislators or special interest groups to reduce, freeze or set rates at levels that are not necessarily related to underlying costs or risks, including initiatives to reduce automobile and other commercial line insurance rates. These changes may limit the ability of our Insurance Subsidiaries to price automobile insurance adequately and could require us to discontinue unprofitable product lines, make unplanned modifications of our products and services, or result in delays or cancellations of sales of our products and services.
Failure to maintain the security of personal data and the availability of critical systems may result in lost business, reputational damage, legal costs and regulatory fines.
Our Insurance Subsidiaries obtain and store vast amounts of personal data that can present significant risks to the Company and its customers and employees. Various laws and regulations govern the use and storage of such data, including, but not limited to, social security numbers, credit card and banking data. The Company'sCompany’s data systems are vulnerable to security breaches due to the sophistication of cyber-attacks, viruses, malware, hackers and other external hazards, as well as inadvertent errors, equipment and system failures, and employee misconduct. The Company also relies on the ability of its business partners to maintain secure systems and processes that comply with legal requirements and protect personal data. These risks and regulatory requirements related to personal data security expose the Company to potential data loss, damage to our reputation, and cause us to incur compliance and litigation, regulatory investigation and remediation costs. In the event of non-compliance with the Payment Card Industry Data Security Standard, an information security standard for organizations that handle cardholder information for the major debit, credit, prepaid, e-purse, ATM and point-of-sale cards, such organizations could prevent our subsidiaries from collecting premium payments from customers by way of such cards and impose significant fines on our subsidiaries. There can be no assurances that our preventative actions will be sufficient to prevent or mitigate the risk of cyber-attacks.
The Company'sCompany’s business operations rely on the continuous availability of its computer systems. In addition to disruptions caused by cyber-attacks or other data breaches, such systems may be adversely affected by natural and man-made catastrophes. The Company'sCompany’s failure to maintain business continuity in the wake of such events may prevent the timely completion of critical processes across its operations, including, but not limited to, insurance policy administration, claims processing, billing and payroll. These failures could result in significant loss of business, fines and litigation.litigation, and there can be no assurances that our cyber risk insurance coverage will be sufficient in the event of a cyber incident.
The requirements of being a United States public company may strain our resources and divert management’s attention.
As a United States public company, we are subject to the reporting requirements of the Securities Exchange Act of 1934, as amended (which we refer to herein as the Exchange Act), the Sarbanes-Oxley Act, the Dodd-Frank Act, the listing requirements of the NASDAQ Stock Market and other applicable securities rules and regulations. Compliance with these rules and regulations increases our legal and financial compliance costs, makes some activities more difficult, time-consuming or costly and increases demand on our systems and resources, which may increase after we are no longer an “emerging growth company.” The Exchange Act requires, among other things, that we file annual, quarterly and current reports with respect to our business and operating results. The Sarbanes-Oxley Act requires, among other things, that we maintain effective disclosure controls and procedures and internal control over financial reporting. In order to maintain and, if required, improve our disclosure controls and procedures and internal control over financial reporting to meet this standard, significant resources and management oversight may be required. As a result, management’s attention may be diverted from other business concerns, which could adversely affect our business and operating results. We may need to hire more employees in the future or engage outside consultants to comply with these requirements, which will increase our costs and expenses.
In addition, changing laws, regulations and standards in the United States relating to corporate governance and public disclosure are creating uncertainty for public companies, increasing legal and financial compliance costs and making some activities more time consuming. These laws, regulations and standards are subject to varying interpretations, in many cases due to their lack of specificity, and, as a result, their application in practice may evolve over time as new guidance is provided by regulatory and governing bodies. This could result in continuing uncertainty regarding compliance matters and higher costs necessitated by ongoing revisions to disclosure and governance practices. We intend to invest resources to comply with evolving laws, regulations and standards, and this investment may result in increased general and administrative expenses and a diversion of management’s time and attention from revenue-generating activities to compliance activities. If our efforts to comply with new laws, regulations and standards differ from the activities intended by regulatory or governing bodies due to ambiguities related to their application and practice, regulatory authorities may initiate legal proceedings against us and our business and operating results may be adversely affected.
For as long as we remain an “emerging growth company” as defined in the Jumpstart Our Business Startups Act of 2012 (which we refer to herein as the JOBS Act), we may take advantage of certain exemptions from various reporting requirements that are applicable to other public companies that are not “emerging growth companies.” We will remain an “emerging growth company” for up to five years from our U.S. initial public offering, although we will cease to be an “emerging growth company” before that time if we meet certain criteria.
Section 107 of the JOBS Act provides that an “emerging growth company” can take advantage of an extended transaction period for complying with new or revised accounting standards. However, we are choosing to “opt out” of such extended transition period, and as a result, we will comply with new or revised accounting standards on the relevant dates on which adoption of such standards is required for non-emerging growth companies. Our decision to opt out of the extended transition period for complying with new or revised accounting standards is irrevocable.
As a result of disclosure of information in this Annual Report on Form 10-K and in filings required of a public company in the United States, our business, results of operations, cash flows and financial condition will become more visible, which may result in threatened or actual litigation, including by competitors and other third parties. If such claims are successful, our business and operating results could be adversely affected, and even if the claims do not result in litigation or are resolved in our favor, these claims, and the time and resources necessary to resolve them, could divert the resources of our management and adversely affect our business and operating results.
Strategic and Operational Risks
Our geographic concentration ties our performance to the business, economic, regulatory and other conditions of certain states.
Some jurisdictions generate a more significant percentage of our total premiums than others. Our revenues and profitability are subject to the prevailing regulatory, legal, economic, political, demographic, competitive, weather and other conditions in the principal states in which we do business. Changes in any of these conditions could make it less attractive for us to do business in such states and would have a more pronounced effect on us compared to companies that are more geographically diversified. In addition, our exposure to severe losses from localized perils, such as earthquakes, hurricanes, tropical storms, tornadoes, wind, ice storms, hail, fires, terrorism, riots and explosions, is increased in those areas where we have written significant numbers of P&C insurance policies. Given our geographic concentration, negative publicity regarding our products and services could have a material adverse effect on our business and operations, as could other regional factors impacting the local economies in that market.
In order to operate in a profitable manner, we need to maintain or increase our current level of earned premiums. We may experience difficulty in managing historic and future growth, which could adversely affect our results of operations and financial condition.
We believe that, givenIn order to maintain and/or increase our fixed costs associated with underwriting and administering our insurance operations, our Insurance Subsidiaries must generate annual netcurrent level of earned premiums in excess of approximately $150 million in orderneeded to achieve our targeted levels of profitability. In order to maintain and increase this level of earned premiums,profitability, we intend to leverage geographic expansion and increase our market share via our expanded distribution network. Continued growth could impose significant demands on management, including the need to identify, recruit, maintain and integrate additional employees. Growth may also place a strain on management systems and operational and financial resources, and such systems, procedures and internal controls may not be adequate to support operations as they expand. Incremental merger and acquisition activities could affect our minimum efficient scale.
The integration and management of acquired books of business, acquired businesses and other growth initiatives involve numerous risks that could adversely affect our profitability, and are contingent on many factors, including:
expanding our financial, operational and management information systems;
managing our relationships with independent agents, brokers, and legacy program managers, including maintaining adequate controls;
expanding our executive management and the infrastructure required to effectively control our growth;
maintaining ratings of our Insurance Subsidiaries;
increasing the statutory capital of our Insurance Subsidiaries to support growth in written premiums;
accurately setting claims provisions for new business where historical underwriting experience may not be available;
obtaining regulatory approval for appropriate premium rates where applicable; and
obtaining the required regulatory approvals to offer additional insurance products or to expand into additional states or other jurisdictions.
Our failure to grow our earned premiums or to manage our growth effectively could have a material adverse effect on our business, financial condition or results of operations.
Engaging in acquisitions involves risks, and if we are unable to effectively manage these risks, our business may be materially harmed.
Acquisitions of similar insurance providers, such as Gateway and Global Liberty, are expected to be a material component of our growth strategy, subject to availability of suitable opportunities and market conditions. From time to time, we may engage in discussions concerning acquisition opportunities and, as a result of such discussions, may enter into acquisition transactions. Upon the announcement of an acquisition, our share price may fall depending on numerous factors, including, but not limited to, the intended target, the size of the acquisition, the purchase price and the potential dilution to existing shareholders. It is also possible that an acquisition could dilute earnings per common share. Acquisitions entail numerous risks, including the following:
difficulties in the integration of the acquired business;
assumption of unknown material liabilities, including deficient provisions for unpaid claims and claims adjustment expenses;
diversion of management’s attention from other business concerns;
failure to achieve financial or operating objectives; and
potential loss of policyholders or key employees of acquired companies.
We may be unable to integrate or profitably operate any business, operations, personnel, services or products we may acquire in the future, which may result in our inability to realize expected revenue increases, cost savings, increases in geographic or product presence, and other projected benefits from the acquisition. Integration may result in the loss of key employees, disruption to our existing businesses or the business of the acquired company, or otherwise harm our ability to retain customers and employees or achieve the anticipated benefits of the acquisition. Time and resources spent on integration may also impair our ability to grow our existing businesses. Also, the negative effect of any financial commitments required by regulatory authorities or rating agencies in acquisitions or business combinations may be greater than expected.
Provisions in our organizational documents, corporate laws and the insurance laws of Illinois, Missouri, New York and other states could impede an attempt to replace or remove management or directors or prevent or delay a merger or sale, which could diminish the value of our shares.
Our Memorandum of Association, Articles of Association and Code of Regulations and the corporate laws and the insurance laws of various states contain provisions that could impede an attempt to replace or remove management or directors or prevent the sale of the Insurance Subsidiaries that shareholders might consider to be in their best interests. These provisions include, among others:
requiring a vote of holders of 5% of the ordinary voting common shares to call a special meeting of shareholders;
requiring a two-thirds vote to amend the Articles of Association;
requiring the affirmative vote of a majority of the voting power of shares represented at a special meeting of shareholders; and
statutory requirements prohibiting a merger, consolidation, combination or majority share acquisition between Insurance Subsidiaries and an interested shareholder or an affiliate of an interested shareholder without regulatory approval.
These provisions may prevent shareholders from receiving the benefit of any premium over the market price of our shares offered by a bidder in a potential takeover and may adversely affect the prevailing market price of our shares if they are viewed as discouraging takeover attempts.
In addition, insurance regulatory provisions may delay, defer or prevent a takeover attempt that shareholders may consider in their best interest. For example, under applicable state statutes, subject to limited exceptions, no person or entity may, directly or indirectly, acquire control of a domestic insurer without the prior approval of the state insurance regulator. Under the insurance laws, “control” (including the terms “controlling,” “controlled by” and “under common control with”) is generally defined to include acquisition of a certain percentage or more of an insurer’s voting securities (such as 10% or more under Illinois, Missouri and MissouriNew York law). These requirements would require a potential bidder to obtain prior approval from the insurance departments of the states in which the Insurance Subsidiaries are domiciled and commercially domiciled and may require pre-acquisition notification in other states. Obtaining these approvals could result in material delays or deter any such transaction. Regulatory requirements could make a potential acquisition of our company more difficult and may prevent shareholders from receiving the benefit from any premium over the market price of our shares offered by a bidder in a takeover context. Even in the absence of a takeover attempt, the existence of these provisions may adversely affect the prevailing market price of our shares if they are viewed as discouraging takeover attempts in the future.
Our business depends upon key employees, and if we are unable to retain the services of these key employees or to attract and retain additional qualified personnel, our business may suffer.
Our operations depend, to a great extent, upon the ability of executive management and other key employees to implement our business strategy and our ability to attract and retain additional qualified personnel in the future. The loss of the services of any of our key employees, or the inability to identify, hire and retain other highly qualified personnel in the future could adversely affect the quality and profitability of our business operations. In addition, we must forecast volume and other factors in changing business environments with reasonable accuracy and adjust our hiring and employment levels accordingly. Our failure to recognize the need for such adjustments, or our failure or inability to react appropriately on a timely basis, could lead to over-staffing (which could adversely affect our cost structure) or under-staffing (which could impair our ability to service current product lines and new lines of business). In either event, our financial results and customer relationships could be adversely affected.
Market and Competition Risks
Because the Insurance Subsidiaries are commercial automobile insurers, conditions in that industry could adversely affect their business.
The majority of the gross premiums written by our Insurance Subsidiaries are generated from commercial automobile insurance policies. Adverse developments in the market for commercial automobile insurance, including those which could result from potential declines in commercial and economic activity, could cause our results of operations to suffer. The commercial automobile insurance industry is cyclical. Historically, the industry has been characterized by periods of price competition and excess capacity followed by periods of higher premium rates and shortages of underwriting capacity. These fluctuations in the business cycle have negatively impacted and could continue to negatively impact the revenues of our company. The results of the Insurance Subsidiaries, and in turn, us, may also be affected by risks, to the extent they are covered by the insurance policies we issue, that impact the commercial automobile industry related to severe weather conditions, floods, hurricanes, tornadoes, earthquakes and tsunamis, as well as explosions, terrorist attacks and riots. The Insurance Subsidiaries’ commercial automobile insurance business may also be affected by cost trends that negatively impact profitability, such as a continuing economic downturn, inflation in vehicle repair costs, vehicle replacement parts costs, used vehicle prices, fuel costs and medical care costs. Increased costs related to the handling and litigation of claims may also negatively impact profitability. Legacy business previously written by us also includes private passenger auto, surety and other P&C insurance business. Adverse developments relative to previously written or current business could have a negative impact on our results.
The insurance and related businesses in which we operate may be subject to periodic negative publicity, which may negatively impact our financial results.
The products and services of the Insurance Subsidiaries are ultimately distributed to individual and business customers. From time to time, consumer advocacy groups or the media may focus attention on insurance products and services, thereby subjecting the industry to periodic negative publicity. We also may be negatively impacted if participants in one or more of our markets engage in practices resulting in increased public attention to our business. Negative publicity may also result in increased regulation and legislative scrutiny of practices in the P&C insurance industry as well as increased litigation. These factors may further increase our costs of doing business and adversely affect our profitability by impeding our ability to market our products and services, requiring us to change our products or services or by increasing the regulatory burdens under which we operate.
The highly competitive environment in which we operate could have an adverse effect on our business, results of operations and financial condition.
The commercial automobile insurance business is highly competitive, and, except for regulatory considerations, there are relatively few barriers to entry. Many of our competitors are substantially larger and may enjoy better name recognition, substantially greater financial resources, higher ratings by rating agencies, broader and more diversified product lines and more widespread agency relationships than we have. Our underwriting profits could be adversely impacted if new entrants or existing competitors try to compete with our products, services and programs or offer similar or better products at or below our prices. Insurers in our markets generally compete on the basis of price, consumer recognition, coverages offered, claims handling, financial stability, customer service and geographic coverage. Although pricing is influenced to some degree by that of our competitors, it is not in our best interest to compete solely on price, and we may from time to time experience a loss of market share during periods of intense price competition. Our business could be adversely impacted by the loss of business to competitors offering competitive insurance products at lower prices. This competition could affect our ability to attract and retain profitable business. Pricing sophistication and related underwriting and marketing programs use a number of risk evaluation factors. For auto insurance, these factors can include, but are not limited to, vehicle make, model and year; driver age; territory; years licensed; claims history; years insured with prior carrier; prior liability limits; prior lapse in coverage; and insurance scoring based on credit report information. We believe our pricing model will generate future underwriting profits, however past performance is not a perfect indicator of future driver performance.
Changes in the nature of the markets we serve could impact the size of our market and/or the market share available to us.
The industry we serve is being impacted by the introduction of mobile applications (including but not limited to Transportation Network Companies, or "TNCs")TNCs), on-line dispatch and tracking, in-vehicle technologies and other technology-related changes. These technologies could change the size of the overall addressable market we serve and may also impact the nature of the risks we insure.
If we are not able to attract and retain independent agents and brokers, our revenues could be negatively affected.
We market and distribute our insurance programs exclusively through independent insurance agents and specialty insurance brokers. As a result, our business depends in large part on the marketing efforts of these agents and brokers and on our ability to offer insurance products and services that meet the requirements of the agents, the brokers and their customers. However, these agents and brokers are not obligated to sell or promote our products and many sell or promote competitors’ insurance products in addition to our products. Some of our competitors have higher financial strength ratings, offer a larger variety of products, set lower prices for insurance coverage and/or offer higher commissions than we do. Therefore, we may not be able to continue to attract and retain independent agents and brokers to sell our insurance products. The failure or inability of independent agents and brokers to market our insurance products successfully could have a material adverse impact on our business, financial condition and results of operations.
If we are unable to maintain our claims-paying ratings, our ability to write insurance and to compete with other insurance companies may be adversely impacted. A decline in rating could adversely affect our position in the insurance market, make it more difficult to market our insurance products and cause our premiums and earnings to decrease.
Financial ratings are an important factor influencing the competitive position of insurance companies. Third party rating agencies assess and rate the claims-paying ability of insurers and reinsurers based upon criteria that they have established. Periodically these rating agencies evaluate the business to confirm that it continues to meet the criteria of the ratings previously assigned. Financial strength ratings are an important factor in establishing the competitive position of insurance companies and may be expected to have an effect on an insurance company’s premiums. The Insurance Subsidiaries are rated by A.M. Best, which issues independent opinions of an insurer’s financial strength and its ability to meet policyholder obligations. A.M. Best ratings range from “A++” (Superior) to “F” (In Liquidation), with a total of 16 separate rating categories. The objective of A.M. Best’s rating system is to provide potential policyholders and other interested parties an opinion of an insurer’s financial strength and ability to meet ongoing obligations, including paying claims.
On September 22, 2016,19, 2017, A.M. Best affirmed the current financial strength ratings of "B" "Stable"“B” “Fair” for American Country, American Service and Gateway and "B+" "Negative"“B+” “Good” for Global Liberty. There is a risk that A.M. Best will not maintain these ratings in the future. If the Insurance Subsidiaries’ ratings are reduced by A.M. Best, their competitive position in the insurance industry could suffer, and it could be more difficult to market their insurance products. A downgrade could result in a significant reduction in the number of insurance contracts written by the subsidiaries and in a substantial loss of business to other competitors with higher ratings, causing premiums and earnings to decrease. Rating agencies evaluate insurance companies based on financial strength and the ability to pay claims, factors that may be more relevant to policyholders than to investors. Financial strength ratings by rating agencies are not ratings of securities or recommendations to buy, hold or sell any security and should not be relied upon as such.
Our ability to generate written premiums is impacted by seasonality, which may cause fluctuations in our operating results and to our stock price.
The P&C insurance business is seasonal in nature. Our ability to generate written premium is also impacted by the timing of policy effective periods in the states in which we operate, while our net premiums earned generally follow a relatively smooth trend from quarter to quarter. Also, our gross premiums written are impacted by certain common renewal dates in larger metropolitan markets for the light commercial risks that represent our core lines of business. For example, January 1st and March 1st are common taxi cab renewal dates in Illinois and New York, respectively. Additionally, we implemented our New York “excess taxi program” in the third quarter of 2012, which has an annual renewal date in the third quarter. Net underwriting income is driven mainly by the timing and nature of claims, which can vary widely. As a result of this seasonality, investors may not be able to predict our annual operating results based on a quarter-to-quarter comparison of our operating results. Additionally, this seasonality may cause fluctuations in our stock price. We believe seasonality will have an ongoing impact on our business.
U.S. Tax Risks
If our company were not to be treated as a U.S. corporation for U.S. federal income tax purposes, certain tax inefficiencies would result and certain adverse tax rules would apply.
Pursuant to certain “expatriation” provisions of the U.S. Internal Revenue Code of 1986, as amended ("IRC"(“IRC”), the reverse merger agreement relating to the reverse merger transaction described below provides that the parties intend to treat our company as a U.S. corporation for U.S. federal income tax purposes. The expatriation provisions are complex, are largely unsettled and subject to differing interpretations, and are subject to change, perhaps retroactively. If our company was not to be treated as a U.S. corporation for U.S. federal income tax purposes, certain tax inefficiencies and adverse tax consequences and reporting requirements would result for both our company and the recipients and holders of stock in our company, including that dividend distributions from our Insurance Subsidiaries to us would be subject to 30% U.S. withholding tax, with no available reduction and that members of the consolidated group may not be permitted to file a consolidated U.S. tax return resulting in the acceleration of cash tax outflow and potential permanent loss of tax benefits associated with net operating loss carryforwards ("NOLs"(“NOLs”) that could have otherwise been utilized.
Our use of losses may be subject to limitations, and the tax liability of our company may be increased.
Our ability to utilize the NOLs is subject to the rules of Section 382 of the IRC. Section 382 generally restricts the use of NOLs after an “ownership change.” An ownership change occurs if, among other things, the stockholders (or specified groups of stockholders) who own or have owned, directly or indirectly, five percent (5%) or more of our common stock or are otherwise treated as five percent (5%) stockholders under Section 382 and the regulations promulgated thereunder increase their aggregate percentage ownership of our stock by more than 50 percentage points over the lowest percentage of the stock owned by these stockholders over a three-year rolling period. In the event of an ownership change, Section 382 imposes an annual limitation on the amount of taxable income a corporation may offset with NOLs. This annual limitation is generally equal to the product of the value of our stock on the date of the ownership change, multiplied by the long-term tax-exempt rate published monthly by the Internal Revenue Service. Any unused annual limitation may be carried over to later years until the applicable expiration date for the respective NOL carryforwards.
The rules of Section 382 are complex and subject to varying interpretations. Because of our numerous equity issuances, which have included the issuance of various classes of convertible securities and warrants, uncertainty existed as to whether we may have undergone an ownership change in the past or will undergo one as a result of our 2013 U.S. public offering. Based upon management'smanagement’s assessment, it was determined that at the date of the U.S. public offering there was not an "ownership change"“ownership change” as defined by Section 382. However, on July 22, 2013, as a result of shareholder activity, a "triggering event"“triggering event” as determined under IRC Section 382 was reached. As a result, under IRC Section 382, the use of the Company'sCompany’s NOLs and other carryforwards generated prior to the “triggering event” will be limited as a result of this "ownership“ownership change” for tax purposes, which is defined as a cumulative change of more than 50% during any three-year period by shareholders of the Company'sCompany’s shares.
Following this triggering event, the Company estimates that it will retain total tax effected federal NOLs of approximately $14.5$13.3 million as of December 31, 2016.2017. Book value per common share was unaffected by this event, as the amount of lost net deferred tax assets were offset by a corresponding decrease in the valuation allowance that was already held against the majority of these assets.
Atlas has the following total NOLs as of December 31, 2016:2017:
| Net Operating Loss Carryforward by Expiry ($ in ‘000s) | | | Year of Occurrence | Year of Expiration | Amount | Year of Expiration | Amount |
| 2001 | 2021 | $ | 5,007 |
| 2021 | $ | 5,007 |
|
| 2002 | 2022 | 4,317 |
| 2022 | 4,317 |
|
| 2006 | 2026 | 7,825 |
| 2026 | 7,825 |
|
| 2007 | 2027 | 5,131 |
| 2027 | 5,131 |
|
| 2008 | 2028 | 1,949 |
| 2028 | 1,949 |
|
| 2009 | 2029 | 1,949 |
| 2029 | 1,949 |
|
| 2010 | 2030 | 1,949 |
| 2030 | 1,949 |
|
| 2011 | 2031 | 4,166 |
| 2031 | 4,166 |
|
| 2012 | 2032 | 9,235 |
| 2032 | 9,236 |
|
| 2015 | 2035 | 1 |
| 2035 | 1 |
|
| 2017 | | 2037 | 21,864 |
|
| Total | | $ | 41,529 |
| | $ | 63,394 |
|
NOLs and other carryforwards generated in 2015 and 2017 are not limited by IRC Section 382.
Further limitations on the utilization of losses may apply because of the “dual consolidated loss” rules, which will also require our company to recapture into income the amount of any such utilized losses in certain circumstances. As a result of the application of these rules, the future tax liability of our company and our Insurance Subsidiaries could be significantly increased. In addition, taxable income may also be recognized by our company or our Insurance Subsidiaries in connection with the 2010 reverse merger transaction.
Risks Related to Our 2013 Initial Public Offering in the United States
The requirements of being a United States public company may strain our resources and divert management’s attention.
As a United States public company, we are subject to the reporting requirements of the Securities Exchange Act of 1934, as amended (which we refer to herein as the Exchange Act), the Sarbanes-Oxley Act, the Dodd-Frank Act, the listing requirements of the NASDAQ Stock Market and other applicable securities rules and regulations. Compliance with these rules and regulations increases our legal and financial compliance costs, makes some activities more difficult, time-consuming or costly and increases demand on our systems and resources, which may increase after we are no longer an “emerging growth company.” The Exchange Act requires, among other things, that we file annual, quarterly and current reports with respect to our business and operating results. The Sarbanes-Oxley Act requires, among other things, that we maintain effective disclosure controls and procedures and internal control over financial reporting. In order to maintain and, if required, improve our disclosure controls and procedures and internal control over financial reporting to meet this standard, significant resources and management oversight may be required. As a result, management’s attention may be diverted from other business concerns, which could adversely affect our business and operating results. We may need to hire more employees in the future or engage outside consultants to comply with these requirements, which will increase our costs and expenses.
In addition, changing laws, regulations and standards in the United States relating to corporate governance and public disclosure are creating uncertainty for public companies, increasing legal and financial compliance costs and making some activities more time consuming. These laws, regulations and standards are subject to varying interpretations, in many cases due to their lack of specificity, and, as a result, their application in practice may evolve over time as new guidance is provided by regulatory and governing bodies. This could result in continuing uncertainty regarding compliance matters and higher costs necessitated by ongoing revisions to disclosure and governance practices. We intend to invest resources to comply with evolving laws, regulations and standards, and this investment may result in increased general and administrative expenses and a diversion of management’s time and attention from revenue-generating activities to compliance activities. If our efforts to comply with new laws, regulations and standards differ from the activities intended by regulatory or governing bodies due to ambiguities related to their application and practice, regulatory authorities may initiate legal proceedings against us and our business and operating results may be adversely affected.
For as long as we remain an “emerging growth company” as defined in the Jumpstart Our Business Startups Act of 2012 (which we refer to herein as the JOBS Act), we may take advantage of certain exemptions from various reporting requirements that are applicable to other public companies that are not “emerging growth companies.” We will remain an “emerging growth company” for up to five years from our U.S. initial public offering, although we will cease to be an “emerging growth company” before that time if we meet certain criteria.
Section 107 of the JOBS Act provides that an “emerging growth company” can take advantage of an extended transaction period for complying with new or revised accounting standards. However, we are choosing to “opt out” of such extended transition period, and as a result, we will comply with new or revised accounting standards on the relevant dates on which adoption of such standards is required for non-emerging growth companies. Our decision to opt out of the extended transition period for complying with new or revised accounting standards is irrevocable.
As a result of disclosure of information in this Annual Report on Form 10-K and in filings required of a public company in the United States, our business, results of operations, cash flows and financial condition will become more visible, which may result in threatened or actual litigation, including by competitors and other third parties. If such claims are successful, our business and operating results could be adversely affected, and even if the claims do not result in litigation or are resolved in our favor, these claims, and the time and resources necessary to resolve them, could divert the resources of our management and adversely affect our business and operating results.
Item 1B. Unresolved Staff Comments
None.
Item 2. Properties
Our corporate headquarters is located at 150 Northwest Point Boulevard, Elk Grove Village, Illinois 60007, USA. The facility consists of one office building totaling 176,844 net rentable square feet of office space on 7.2 acres. We are leasing approximately 30,600 square feet through November 2017 at $66,000 per month and an additional 2,500 square feet through May 2017 at $4,000 per month with a month to month extension option. Atlas purchased a building in the fourth quarter of 2016 to serve as the new corporate headquarters. This building is located at 953 American Lane, Schaumburg, Illinois 60173, USA and is three storiesUSA. The Company-owned facility consists of one three-story office building with approximately 110,000 square feet. An unaffiliated tenant currently leases one floor of the building. Atlas plans to move to the new location once the necessary renovations are completed in the late second or early third quarter of 2017. We believe that the new facility will be sufficient space to support the growth and expansion of our business.
We are leasing threealso lease four additional office spaces. The St. Louis, Missouri lease is 4,375 square feet of office space and effective through June 2021. We currently pay a monthly rent equal to approximately $10,000.This office is mainly used for certain underwriting operations for Gateway. The Manhattan, New York lease is 1,796 square feet of office space andspace. The Manhattan lease was effective through February 2018. We currently pay a monthly rent equal to approximately $6,000.2018 but was renewed upon expiration for an additional two years after year end. This office is mainly used for certain claims operations. Upon completion of the Anchor acquisition, we assumed a lease for 25,396 square feet of office space in Melville, New York, which is effective through February 2022. We currently pay a monthly rent equal to approximately $60,000.This office operates as the Global Liberty headquarters with underwriting, claims, and corporate and other operations. The Scottsdale, Arizona lease is 2,107 square feet of office space and effective through November 2020. This office is mainly used for certain underwriting operations.
We own one property in Alabama, which comprises approximately 13.6 acres of land and is currently held for sale.
Item 3. Legal Proceedings
In connection with our operations, we are, from time to time, named as defendants in actions for damages and costs allegedly sustained by the plaintiffs. While it is not possible to estimate the outcome of the various proceedings at this time, such actions have generally been resolved with minimal damages or expense in excess of amounts provided, and our company does not believe that it will incur any significant additional loss or expense in connection with such actions.
On March 5, 2018, a complaint was filed in the U.S. District Court for the Northern District of Illinois asserting claims under the federal securities laws against the Company and two of its executive officers on behalf of a putative class of purchasers of the Company’s securities, styled Fryman v. Atlas Financial Holdings, Inc., et al., No. 1:18-cv-01640 (N.D. Ill.). In the complaint, the plaintiff asserts claims on behalf of a putative class consisting of purchasers of the Company’s securities between March 13, 2017 and March 2, 2018. The complaint alleges that the defendants violated Sections 10(b) and 20(a) of the Securities Exchange Act of 1934 and Rule 10b-5 promulgated thereunder by making allegedly false and misleading statements or failing to disclose certain information regarding the adequacy of the Company’s reserves. The complaint seeks, among other remedies, unspecified damages, attorneys’ fees and other costs, equitable and/or injunctive relief, and such other relief as the court may find just and proper. Under applicable provisions of the federal securities laws, motions for appointment as lead plaintiffs must be filed within sixty days after a notice announcing the filing of the Fryman complaint. The Company does not believe there isand the other defendants anticipate that they will file a motion to dismiss the complaint for failure to state a claim upon which relief can be granted. Under the federal securities laws, discovery and other proceedings automatically will be stayed during the pendency of any litigation pending or threatened against it that, individually or in aggregate, may reasonably be expectedsuch motion to have a material adverse effect on the Company.dismiss.
Item 4. Mine Safety Disclosures
Not applicable.
Part II.
Item 5. Market for Registrant'sRegistrant’s Common Equity, Related Stockholder Matters and Issuer Purchases of Equity Securities
As of February 1, 2017,15, 2018, there were approximately 1,7901,679 shareholders of record of our ordinary voting common shares and one shareholder of record of our restricted voting common shares (all of which convert to ordinary voting common shares upon the sale of such shares by the sole shareholder, KAI, or its subsidiaries).shares. Our ordinary voting common shares have been listed on the NASDAQ under the symbol “AFH” since February 12, 2013 and were previously listed on the Toronto Stock Exchange - Venture ("TSXV"(“TSXV”) under the same symbol beginning January 6, 2011. On June 5, 2013, the Company delisted from the TSXV. As of March 10, 2017,29, 2018, there were 11,902,51211,936,970 ordinary voting common shares and 128,191no restricted voting common shares outstanding.
Set forth below are the high and low closing prices of the ordinary voting common shares during 20162017 and 2015:2016:
| | Summary of Share Prices | | | High | Low | High | Low |
| 2017 | | |
| Fourth Quarter | | $20.60 | $18.20 |
| Third Quarter | | $19.00 | $13.95 |
| Second Quarter | | $15.65 | $12.50 |
| First Quarter | | $17.80 | $12.75 |
| 2016 | | |
| Fourth Quarter | $18.05 | $15.30 | $18.05 | $15.30 |
| Third Quarter | $17.69 | $15.54 | $17.69 | $15.54 |
| Second Quarter | $18.39 | $16.67 | $18.39 | $16.67 |
| First Quarter | $19.21 | $16.70 | $19.21 | $16.70 |
| 2015 | | |
| Fourth Quarter | $20.97 | $18.22 | |
| Third Quarter | $19.83 | $16.00 | |
| Second Quarter | $20.31 | $17.79 | |
| First Quarter | $18.10 | $15.87 | |
During 2016, we repurchased 2,538,5602017, the 128,191 restricted voting common shares that were beneficially owned or controlled by KFSI (including its subsidiaries and affiliated companies, “Kingsway”) were sold to non-affiliates of preferredKingsway. The Kingsway-owned restricted voting common shares from the former ownerautomatically converted to ordinary voting common shares upon their sale to non-affiliates of Gateway and paid all accrued dividends on these shares prior to the repurchase date. On December 31, 2016, we canceled 4,000,000 of preferred shares from the former owner of Anchor pursuant to the terms of the Anchor stock purchase agreement as described in Note 3, 'Acquisitions,' to the Consolidated Financial Statements. The cumulative amount of accrued and unpaid dividends as of December 31, 2016 was $333,000. As of December 31, 2016, the paid claims development on Global Liberty's pre-acquisition reserves was in excess of $4,000,000, and as a result, dividends will no longer accrue to the former owner of Anchor. As of December 31, 2016, there were no preferred shares outstanding. Although the re-issuance of preferred shares to the former owner of Anchor may be highly unlikely, the contingent consideration terms of the Anchor stock purchase agreement will remain in effect for period of five years from the date of acquisition.Kingsway.
Due to insurance regulations there are restrictions on our Insurance Subsidiaries that currently materially limit the Company'sCompany’s ability to pay dividends. We did not pay any dividends to our common shareholders during 2015, 2016, 2017 or to date in 2017,2018, and we have no current plans to pay dividends to our common shareholders. See ‘Item 7, Management’s Discussion and Analysis, Liquidity and Capital Resources’ for further discussion of regulatory dividend restrictions.
During 2016, KAIKingsway sold 4,672 restricted voting common shares that converted to ordinary voting common shares.
On May 13, 2014, an aggregate of 2,000,000 Atlas ordinary voting common shares were offered in a subsequent public offering in the United States at a price of $12.50 per share. Atlas also granted the underwriters an option to purchase up to an aggregate of 300,000 additional shares at the public offering price of $12.50 per share to cover over-allotments, if any. On May 27, 2014, the underwriters exercised this option and purchased an additional 161,000 shares. After underwriting and other expenses, total proceeds of $25.0 million were realized on the issuance of the shares. A portion of the net proceeds from the offering was used to support the acquisition of Anchor.
Performance Graph
The following stock performance graph shows a comparison of cumulative total shareholder return of Atlas'Atlas’ ordinary voting common shares for the period beginning with the first day Atlas traded on the NASDAQ exchange, with the cumulative total return of the Russell 2000 Index and the SNL U.S. Insurance P&C Index. The graph assumes a $100 investment on February 12, 2013, the first day Atlas traded on the NASDAQ exchange, in Atlas common stock and for each index listed, and all dividends are assumed to be reinvested.
| | | Company/Index | 2/12/13 | 6/30/13 | 12/31/13 | 6/30/14 | 12/31/14 | 6/30/15 | 12/31/15 | 6/30/16 | 12/31/16 | 2/12/13 | 12/31/13 | 12/31/14 | 12/31/15 | 12/31/16 | 12/31/17 |
| Atlas Financial Holdings | 100.00 |
| 150.42 |
| 247.39 |
| 254.79 |
| 274.29 |
| 333.28 |
| 334.45 |
| 289.41 |
| 303.36 |
| 100.00 |
| 247.39 |
| 274.29 |
| 334.45 |
| 303.36 |
| 345.38 |
|
| Russel 2000 Index | 100.00 |
| 107.17 |
| 128.42 |
| 132.51 |
| 134.70 |
| 141.11 |
| 128.76 |
| 131.61 |
| 156.19 |
| 100.00 |
| 128.42 |
| 134.70 |
| 128.76 |
| 156.19 |
| 179.07 |
|
| SNL U.S. Insurance P&C Index | 100.00 |
| 108.38 |
| 120.14 |
| 124.16 |
| 137.98 |
| 136.58 |
| 142.74 |
| 149.81 |
| 168.46 |
| 100.00 |
| 120.14 |
| 137.98 |
| 142.74 |
| 168.46 |
| 192.59 |
|
Equity Compensation Plan Information
The following table provides information regarding the number of shares of ordinary voting common shares to be issued upon exercise of outstanding options, warrants and rights under the Company'sCompany’s equity compensation plans and the weighted average exercise price and number of shares of common stock remaining available for issuance under those plans as of December 31, 2016.2017.
|
| | | |
| | Number of securities to be issued upon exercise of outstanding options, warrants & rights (a) 2 | Weighted average exercise price of outstanding options, warrants and rights (b) 3 | Number of securities remaining available for future issuance under equity compensation plans (excluding securities reflected in column (a)) 4 |
Equity compensation plans approved by security holders 1 | 562,728 | * | 626,782 |
|
| | | |
| | Number of securities to be issued upon exercise of outstanding options, warrants and rights (a) 2 | Weighted average exercise price of outstanding options, warrants and rights (b) 3 | Number of securities remaining available for future issuance under equity compensation plans (excluding securities reflected in column (a)) 4 |
Equity compensation plans approved by security holders 1 | 429,390 | * | 787,014 |
1 The Company has no equity compensation plans that were not approved by its security holders.
2 Summation of 562,728429,390 shares outstanding under the January 18, 2011, January 11, 2013, March 6, 2014 and the March 12, 2015 equity compensation plansplans.
3 Average price not computed due to currency differencesdifferences.
4 Equal to the remainder allowable according to the 2013 Equity Incentive Plan (10% of issued and outstanding ordinary voting common shares).
Purchases of Equity Securities
No unregistered securities were sold during the three month periodfiscal year ended December 31, 2016.2017. No repurchases of equity securities were made during the three month period ended December 31, 2016.2017.
Item 6. Selected Financial Data
The following table has selected financial information for the periods ended and as of the dates indicated. These historical results are not necessarily indicative of the results to be expected from any future period and should be read in conjunction with our consolidated financial statements and the related notes and the section of this Annual Report on Form 10-K entitled “Management’s Discussion and Analysis of Financial Condition and Results of Operations.”
| | | | 2016 | 2015 | 2014 | 2013 | 2012 | 2017 | 2016 | 2015 | 2014 | 2013 |
| | ($ in '000s, except for share and per share data) | ($ in ‘000s, except for share and per share data) |
| | | |
| Net premiums earned | $ | 171,058 |
| $ | 152,064 |
| $ | 98,124 |
| $ | 71,344 |
| $ | 38,709 |
| $ | 215,771 |
| $ | 171,058 |
| $ | 152,064 |
| $ | 98,124 |
| $ | 71,344 |
|
| Total revenue | 177,579 |
| 156,851 |
| 101,618 |
| 74,027 |
| 42,791 |
| 221,975 |
| 177,579 |
| 156,851 |
| 101,618 |
| 74,027 |
|
| Net income attributable to common shareholders | 2,365 |
| 14,154 |
| 17,608 |
| 7,361 |
| 2,356 |
| |
| Earnings per common share basic | $ | 0.20 |
| $ | 1.18 |
| $ | 1.61 |
| $ | 0.92 |
| $ | 0.38 |
| |
| Earnings per common share diluted | $ | 0.19 |
| $ | 1.13 |
| $ | 1.56 |
| $ | 0.74 |
| $ | 0.38 |
| |
| Net (loss) income attributable to common shareholders | | (38,810 | ) | 2,365 |
| 14,154 |
| 17,608 |
| 7,361 |
|
| (Loss) earnings per common share basic | | $ | (3.22 | ) | $ | 0.20 |
| $ | 1.18 |
| $ | 1.61 |
| $ | 0.92 |
|
| (Loss) earnings per common share diluted | | $ | (3.22 | ) | $ | 0.19 |
| $ | 1.13 |
| $ | 1.56 |
| $ | 0.74 |
|
| Combined ratio | 102.9 | % | 88.2 | % | 91.4 | % | 94.2 | % | 102.4 | % | 122.5 | % | 102.9 | % | 88.2 | % | 91.4 | % | 94.2 | % |
| | | |
| Cash and invested assets | $ | 224,779 |
| $ | 233,304 |
| $ | 179,994 |
| $ | 139,888 |
| $ | 120,824 |
| $ | 243,483 |
| $ | 224,779 |
| $ | 233,304 |
| $ | 179,994 |
| $ | 139,888 |
|
| Total assets | 423,577 |
| 411,292 |
| 283,911 |
| 219,278 |
| 163,067 |
| 482,503 |
| 423,577 |
| 411,292 |
| 283,911 |
| 219,278 |
|
| Notes payable | 19,187 |
| 17,219 |
| — |
| — |
| — |
| 24,031 |
| 19,187 |
| 17,219 |
| — |
| — |
|
| Total liabilities | 296,235 |
| 281,670 |
| 174,512 |
| 155,580 |
| 103,203 |
| 391,858 |
| 296,235 |
| 281,670 |
| 174,512 |
| 155,580 |
|
| Total shareholders' equity | 127,342 |
| 129,622 |
| 109,399 |
| 63,698 |
| 59,864 |
| |
Mezzanine equity r | | — |
| — |
| 6,941 |
| 2,000 |
| 2,000 |
|
Total shareholders’ equity r | | 90,645 |
| 127,342 |
| 122,681 |
| 107,399 |
| 61,698 |
|
| Common shares | 12,023,295 |
| 12,015,888 |
| 11,771,586 |
| 9,424,734 |
| 6,144,392 |
| 12,164,041 |
| 12,023,295 |
| 12,015,888 |
| 11,771,586 |
| 9,424,734 |
|
| Book value per participative share outstanding | $ | 10.54 |
| $ | 10.15 |
| $ | 9.08 |
| $ | 6.54 |
| $ | 6.55 |
| |
| Book value per common share outstanding | | $ | 7.42 |
| $ | 10.54 |
| $ | 10.15 |
| $ | 9.08 |
| $ | 6.54 |
|
| | | |
r - amounts reclassified for preferred shares | | — |
| — |
| 6,941 |
| 2,000 |
| 2,000 |
|
r - Prior to the year ended December 31, 2017, the Company presented preferred shares issued as contingent consideration within the permanent equity section of the Consolidated Statements of Financial Position. In accordance with Financial Accounting Standards Board ASC Topic 480 - Distinguishing Liabilities from Equity, contingent consideration issued as preferred shares wherein the number of shares to be issued is variable should be classified outside of permanent equity and reflected as mezzanine equity on the Consolidated Statements of Financial Position. This table has been restated to include the contingent consideration as a separate line called ‘Mezzanine equity’ and removed from ‘Total shareholders’ equity.’
For 2015 and 2014, we reclassified our presentation for costs related to acquisition and stock purchase agreements from non-operating expenses to other underwriting expenses.expenses, because these costs were incurred as a result of acquiring new businesses. The reclassification increased the combined ratio by 1.2% and 0.7% for the years ended December 31, 2015 and 2014, respectively.
For 2015, total assets, notes payable and total liabilities were restated according to the adoption of Accounting Standards Update 2015-03. See Note 20, 'Change in Accounting Principle,' to the Consolidated Financial Statements for further discussion of the impact.
For 2013, we reclassified our presentation for interest expense from other underwriting expenses to non-operating expenses. The reclassification reduced the combined ratio by 0.2% for the year ended December 31, 2013.
These results include the acquisitions of Gateway on January 2, 2013 and Anchor on March 11, 2015, which will affect the comparability of the data. See Note 3, 'Acquisitions,'‘Acquisitions,’ to the Consolidated Financial Statements for further discussion of the impact of these acquisitions.
Common shares for 2012 have been restated for the one-for-three stock split on January 29, 2013, and per share data has been restated to reflect the common share restatement.
Item 7. Management’s Discussion and Analysis (MD&A) of Financial Condition and Results of Operations
|
| | |
| Section | Description | Page |
| I. | Overview | |
| II. | Application of Critical Accounting Estimates | |
| III. | Operating Results | |
| IV. | Financial Condition | |
MANAGEMENT'SMANAGEMENT’S DISCUSSION AND ANALYSIS OF FINANCIAL CONDITION AND RESULTS OF OPERATIONS
(All amounts in US dollars, except for amounts preceded by “C” as Canadian dollars, share and per share amounts)
The following discussion and analysis of our financial condition and results of operations should be read in conjunction with our consolidated financial statements and related notes that appear elsewhere in this document. In this discussion and analysis, the term “common share” refers to the summation of restricted voting common shares, and ordinary voting common shares and participative restricted stock units when used to describe earnings (loss) or book value per common share.
Forward-looking statements
In addition to the historical consolidated financial information, this report contains “forward-looking statements,” within the meaning of the Private Securities Litigation Reform Act of 1995, which may include, but are not limited to, statements with respect to estimates of future expenses, revenue and profitability; trends affecting financial condition, cash flows and results of operations; the availability and terms of additional capital; dependence on key suppliers and other strategic partners; industry trends; the competitive and regulatory environment; the successful integration of acquisitions; the impact of losing one or more senior executives or failing to attract additional key personnel; and other factors referenced in this report. Factors that could cause or contribute to these differences include those discussed below and elsewhere, particularly in “Risk Factors.”
Often, but not always, forward-looking statements can be identified by the use of words such as “plans”, “expects”, “is expected”, “budget”, “scheduled”, “estimates”, “forecasts”, “intends”, “anticipates”, or “believes” or variations (including negative variations) of such words and phrases, or state that certain actions, events or results “may”, “could”, “would”, “might” or “will” be taken, occur or be achieved. Forward-looking statements involve known and unknown risks, uncertainties and other factors which may cause the actual results, performance or achievements of Atlas to be materially different from any future results, performance or achievements expressed or implied by the forward-looking statements. Such factors include, among others, general business, economic, competitive, political, regulatory and social uncertainties.
Although Atlas has attempted to identify important factors that could cause actual actions, events or results to differ materially from those described in forward-looking statements, there may be other factors that cause actions, events or results to differ from those anticipated, estimated or intended. Forward-looking statements contained herein are made as of the date of this report and Atlas disclaims any obligation to update any forward-looking statements, whether as a result of new information, future events or results, or otherwise. There can be no assurance that forward-looking statements will prove to be accurate, as actual results and future events could differ materially from those anticipated in such statements. Accordingly, readers should not place undue reliance on forward-looking statements due to the inherent uncertainty in them.
I. OVERVIEW
We are a financial services holding company incorporated under the laws of the Cayman Islands. Our core business is the underwriting of commercial automobile insurance policies, focusing on the “light” commercial automobile sector, which is carried out through our Insurance Subsidiaries. This sector includes taxi cabs, non-emergency para-transit, limousine, livery (including certain transportation network companies (“TNC”) drivers/operators) and business auto. Our goal is to always be the preferred specialty commercial transportation insurerinsurance business in any geographic areas where our value proposition delivers benefit to all stakeholders. We are licensed to write property and casualty ("(“P&C"&C”) insurance in 49 states and the District of Columbia in the United States. The Insurance Subsidiaries distribute their products through a network of independent retail agents, and actively wrote insurance in 42 states and the District of Columbia during 2016.2017. We embrace continuous improvement, analytics and technology as a means of building on the strong heritage our subsidiary companies cultivated in the niche markets we serve.
Over the past six years,Since Atlas’ formation in 2010, we have disposed of non-core assets, consolidated infrastructure and placed into run-off certain non-core lines of business previously written by the Insurance Subsidiaries. Our focus going forward is the underwriting of commercial automobile insurance in the U.S. Substantially all of our new premiums written are in “light” commercial automobile lines of business.
Commercial Automobile
Our primary target market is made up of small to mid-size taxi, limousine, other livery (including certain "TNC"TNC drivers/operators) and non-emergency para-transit operators. The “light” commercial automobile policies we underwrite provide coverage for lightweight commercial vehicles typically with the minimum limits prescribed by statute, municipal or other regulatory requirements. The majority of our policyholders are individual owners or small fleet operators. In certain jurisdictions like Illinois, Louisiana, Nevada and New York, we have also been successful working with larger operators who retain a meaningful amount of their own risk of loss through higher retentions, self-insurance or self-funded captive insurance entity arrangements. In these cases, we provide support in the areas of day to dayday-to-day policy administration and claims handling consistent with the value proposition we offer to all of our insureds, generally on a fee for service basis. We may also provide excess coverage above the levels of risk retained by the insureds where a better than average loss ratio is expected. Through these arrangements, we are able to effectively utilize the significant specialized operating infrastructure we maintain to generate revenue from business segments that may otherwise be more price sensitive in the current market environment.
The “light” commercial automobile sector is a subset of the broader commercial automobile insurance industry segment, which over the long term has been historically profitable. In more recent years the commercial automobile insurance industry has seen profitability pressure within certain segments, however, it has outperformed the overall P&C industry generally over the past fifteen years based on data compiled by A.M. Best Aggregates & Averages. Data compiled by SNL Financial also indicates that for 20152016 the total market for commercial automobile liability insurance was approximately $31.3$33.1 billion. The size of the commercial automobile insurance market can be affected significantly by many factors, such as the underwriting capacity and underwriting criteria of automobile insurance carriers and general economic conditions. Historically, the commercial automobile insurance market has been characterized by periods of excess underwriting capacity and increased price competition followed by periods of reduced capacity and higher premium rates.
We believe that there is a positive correlation between the economy and commercial automobile insurance in general. Operators of “light” commercial automobiles may be less likely than other business segments within the commercial automobile insurance market to take vehicles out of service, as their businesses and business reputations rely heavily on availability. With respect to certain business lines such as the taxi line, there are also other factors such as the cost and limited supply of medallions, which may discourage a policyholder from taking vehicles out of service in the face of reduced demand for the use of the vehicle. The significant expansion of transportation network companies ("TNC")TNC has resulted in a reduction in taxi vehicles available to insure; however, we believe that the aforementioned factor relating to medallion values has mitigated the overall decline. Market research also suggests that the combined addressable markets between traditional
Other lines of business
The other line of business is comprised of our surety program (currently in run off), Gateway’s truck and workers’ compensation programs (currently in run off), American Services’ non-standard personal lines business (currently in run off), Atlas’ workers’ compensation related to taxi, liveryother liability, Global Liberty’s homeowners program (currently in run off) and TNC companies expanded during this period.
Suretyassigned risk pool business.
Our surety program primarily consistsconsisted of U.S. Customs bonds (currently in run off).bonds. We engage a former affiliate, Avalon Risk Management, to help coordinate customer service and claims handling for the surety bonds written.written as this program runs off. This non-core program is 100% reinsured to an unrelated third party. For 2016, all policies were not renewed.
Other
The other line of business is comprised of Gateway's truckparty and workers' compensation programs (currently in run off), American Services' non-standard personal lines business (currently in run off), Atlas' workers' compensation relatedhas been transitioned to taxi, other liability, Global Liberty's homeowners program (currently in run off) and assigned risk pool business.another carrier.
The Gateway truck and workers'workers’ compensation programs were put into run-off during 2012. The truck program had little earned premium during 2012, and the workers'workers’ compensation program iswas 100% reinsured retrospectively and prospectively to an unrelated third party. The workers’ compensation reinsurance agreement was terminated during 2017.
Non-standard automobile insurance is principally provided to individuals who do not qualify for standard automobile insurance coverage because of their payment history, driving record, place of residence, age, vehicle type or other factors. Such drivers typically represent higher than normal risks and pay higher insurance rates for comparable coverage. Consistent with Atlas’ focus on commercial automobile insurance, Atlas has transitioned away from the non-standard auto line. Our Insurance Subsidiaries ceased writing new and renewal policies of this type in 2011, and earned premium discontinued in 2012, allowing surplus and resources to be devoted to the expected growth of the commercial automobile business.
The non-renewal process for Global Liberty'sLiberty’s homeowners program began prior to Atlas'Atlas’ acquisition and remains underway. This is a relatively small book of business, which is relatively small and substantially reinsured.
Atlas' workers'Atlas’ workers’ compensation related to taxi and other liability are ancillary products that are offered only to insureds who purchase our commercial automobile insurance products. The workers’ compensation program will be non-renewed in 2018 due to limited demand.
Assigned risk pools are established by state governments to cover high-risk insureds who cannot purchase insurance through conventional means.
II. APPLICATION OF CRITICAL ACCOUNTING ESTIMATES
The preparation of financial statements in conformity with U.S. GAAP requires management to adopt accounting policies and make estimates and assumptions that affect amounts reported in the consolidated financial statements. The most critical estimates include those used in determining:
| |
| ◦ | Fair value of financial assets; |
| |
| ◦ | Impairment of financial assets; |
| |
| ◦ | Deferred policy acquisition costs; |
| |
| ◦ | Valuation of deferred tax assets; |
| |
| ◦ | Business combination; and |
In making these determinations, management makes subjective and complex judgments that frequently require estimates about matters that are inherently uncertain. Many of these policies, estimates and related judgments are common in the insurance and financial services industries; others are specific to our businesses and operations. It is reasonably likely that changes in these items could occur from period to period and result in a material impact on our consolidated financial statements.
A brief summary of each of these critical accounting estimates follows. For a more detailed discussion of the effect of these estimates on our consolidated financial statements, and the judgments and assumptions related to these estimates, see the referenced sections of this document. For a complete summary of our significant accounting policies, see Note 1, 'Nature‘Nature of Operations' and Basis of Presentation,’ to the Consolidated Financial Statements.
Fair values of financial instruments - Atlas has used the following methods and assumptions in estimating fair value:
Fair values for bonds and equity securities are based on quoted market prices, when available. If quoted market prices are not available, fair values are based on quoted market prices of comparable instruments or values obtained from independent pricing services. Atlas employs a fair value hierarchy to categorize the inputs it uses in valuation techniques to measure the fair value. The hierarchy is comprised of quoted prices in active markets (Level 1), third party pricing models using available trade, bid and market information (Level 2) and internal models without observable market information (Level 3). The Company recognizes transfers between levels of the fair value hierarchy at the end of the period in which events occur impacting the availability of inputs to the fair value methodology. Typically, transfers from Level 2 to Level 3 occur due to collateral performance.
Atlas'Atlas’ fixed income portfolio is managed by a SEC registered investment advisor specializing in the management of insurance company portfolios. Management works directly with them to ensure that Atlas benefits from their expertise and also evaluates investments as well as specific positions independently using internal resources. Atlas'Atlas’ investment advisor has a team of credit analysts for all investment grade fixed income sectors. The investment process begins with an independent analyst review of each security'ssecurity’s credit worthiness using both quantitative tools and qualitative review. At the issuer level, this includes reviews of past financial data, trends in financial stability, projections for the future, reliability of the management team in place, market data (credit spread, equity prices, trends in this data for the issuer and the issuer'sissuer’s industry). Reviews also consider industry trends and the macro-economic environment. This analysis is continuous, integrating new information as it becomes available. As of December 31, 2016,2017, this process did not generate any significant difference in the rating assessment between Atlas'Atlas’ review and the rating agencies.
Atlas employs specific control processes to determine the reasonableness of the fair value of its financial assets. These processes are designed to supplement those performed by our external portfolio manager to ensure that the values received from them are accurately recorded and that the data inputs and the valuation techniques utilized are appropriate, consistently applied, and that the assumptions are reasonable and consistent with the objective of determining fair value. For example, on a continuing basis, Atlas assesses the reasonableness of individual security values which have stale prices or whose changes exceed certain thresholds as compared to previous values received from our external portfolio manager or to expected prices. The portfolio is reviewed routinely for transaction volumes, new issuances, any changes in spreads, as well as the overall movement of interest rates along the yield curve to determine if sufficient activity and liquidity exists to provide a credible source for market valuations. When fair value determinations are expected to be more variable, they are validated through reviews by members of management or the Board of Directors who have relevant expertise and who are independent of those charged with executing investment transactions.
Changes in inflation can influence the interest rates which can impact the fair value of our available-for-sale fixed income portfolio and yields on new investments. The Investment Committee of the Board of Directors considers inflation when providing guidance and analyzing the investment portfolio to provide a stable source of income to supplement underwriting income.
Impairment of financial assets - Atlas assesses, on a quarterly basis, whether there is objective evidence that a financial asset or group of financial assets is impaired. An investment is considered impaired when the fair value of the investment is less than its cost or amortized cost. When an investment is impaired, the Company must make a determination as to whether the impairment is other-than-temporary.
The analysis includes some or all of the following procedures as deemed appropriate by management:
| |
| ◦ | identifying all security holdings in unrealized loss positions that have existed for at least six months or other circumstances that management believes may impact the recoverability of the security; |
| |
| ◦ | obtaining a valuation analysis from third party investment managers regarding these holdings based on their knowledge, experience and other market based valuation techniques; |
| |
| ◦ | reviewing the trading range of certain securities over the preceding calendar period; |
| |
| ◦ | assessing whether declines in market value are other than temporary for debt security holdings based on credit ratings from third party security rating agencies; and |
| |
| ◦ | determining the necessary provision for declines in market value that are considered other than temporary based on the analyses performed. |
The risks and uncertainties inherent in the assessment methodology utilized to determine declines in market value that are other than temporary include, but may not be limited to, the following:
| |
| ◦ | the opinion of professional investment managers could prove to be incorrect; |
| |
| ◦ | the past trading patterns of individual securities may not reflect future valuation trends; |
| |
| ◦ | the credit ratings assigned by independent credit rating agencies may prove to be incorrect due to unforeseen or unknown facts related to a company’s financial situation; and |
| |
| ◦ | the debt service pattern of non-investment grade securities may not reflect future debt service capabilities and may not reflect a company’s unknown underlying financial problems. |
Under U.S. GAAP, with respect to an investment in an impaired debt security, other-than-temporary impairment ("OTTI"(“OTTI”) occurs if (a) there is intent to sell the debt security, (b) it is more likely than not it will be required to sell the debt security before its anticipated recovery, or (c) it is probable that all amounts due will be unable to be collected such that the entire cost basis of the security will not be recovered. If Atlas intends to sell the debt security, or will more likely than not be required to sell the debt security before the anticipated recovery, a loss in the entire amount of the impairment is reflected in net realized gains (losses) on investments in the consolidated statements of income (loss) and comprehensive income.income (loss). If Atlas determines that it is probable it will be unable to collect all amounts and Atlas has no intent to sell the debt security, a credit loss is recognized in net realized gains (losses) on investments in the consolidated statements of income (loss) and comprehensive income (loss) to the extent that the fair value is less than the amortized cost basis; any difference between fair value and the new amortized cost basis (net of the credit loss) is reflected in accumulated other comprehensive income (losses), net of applicable income taxes.
For equity securities, the Company evaluates its ability to retain its investment in the issuer for a period of time sufficient to allow for any anticipated recovery in fair value. Evidence considered to determine anticipated recovery are analysts'analysts’ reports on the near-term prospects of the issuer and the financial condition of the issuer or the industry, in addition to the length and extent of the market value decline. If an OTTI is identified, the equity security is adjusted to fair value through a charge to earnings. Refer to Note 5, 'Investments'‘Investments’ to the Consolidated Financial Statements for further discussion of the other-than-temporary impairment on equity securities.
Deferred policy acquisition costs ("DPAC"(“DPAC”) - Atlas defers brokers’ commissions, premium taxes and other underwriting and marketing costs directly relating to the successful acquisition of premiums written to the extent they are considered recoverable. The other underwriting and marketing costs include a percentage of salary and related expense, payroll taxes and travel of our marketing and underwriting employees. The percentage is derived from an annual persistency rate study using policy and vehicle counts to compute a hit ratio. The deferred costs are then expensed as the related premiums are earned. The method followed in determining the deferred policy acquisition costs limits the deferral to its realizable value by giving consideration to estimated future claims and expenses to be incurred as premiums are earned. Changes in estimates, if any, are recorded in the accounting period in which they are determined. Anticipated investment income is included in determining the realizable value of the deferred policy acquisition costs. Atlas’ deferred policy acquisition costs are reported net of deferred ceding commissions.
Claims liabilities - The provision for unpaid claims and claims adjustment expenses represent the estimated liabilities for reported claims, plus those incurred but not yet reported and the related estimated claims adjustment expenses. Unpaid claims expenses are determined using case-basis evaluations and statistical analyses, including insurance industry claims data, and represent estimates of the ultimate cost of all claims incurred. Although considerable variability is inherent in such estimates, management believes that the liability for unpaid claims and claims adjustment expenses is adequate. The estimates are continually reviewed and adjusted as necessary; such adjustments are included in current operations and are accounted for as changes in estimates.
Atlas considers the impact of inflation when establishing adequate rates and estimating the provision for unpaid claims and claims adjustment expenses. We establish reserves to cover our estimated liability for the payment of claims and expenses related to the administration of claims incurred on the insurance policies we write. Inflation has a larger impact the longer the time between the issuance of the policy and the final settlement of claims. Greater than expected claims costs above the established reserves will require an increase in claims reserves and reduce the earnings in the period the deficiency was established. We consider the impact of inflation on these reserves to establishwhen establishing policy rates that maintain adequate underwriting income.rates.
Valuation of deferred tax assets - Deferred taxes are recognized using the asset and liability method of accounting. Under this method the future tax consequences attributable to temporary differences in the tax basis of assets, liabilities and items recognized directly in equity and the financial reporting basis of such items are recognized in the financial statements by recording deferred tax assets ("DTAs"(“DTAs”) or deferred tax liabilities ("DTLs"(“DTLs”).
Deferred tax assets related to the carry-forward of unused tax losses and credits and those arising from temporary differences are recognized only to the extent that it is probable that future taxable income will be available against which they can be utilized. Deferred tax assets and liabilities are measured using enacted tax rates expected to apply to taxable income in the years in which those temporary differences are expected to be recovered or settled. The effect on future tax assets and liabilities of a change in tax rates is recognized in income in the period that includes the date of enactment or substantive enactment.
In assessing the need for a valuation allowance, Atlas considers both positive and negative evidence related to the likelihood of realization of the deferred tax assets. Atlas performs an assessment of recoverability of its deferred tax assets on a quarterly basis. If, based on the weight of available evidence, it is more likely than not the deferred tax assets will not be realized, a valuation allowance is recorded.recognized in income in the period that such determination is made.
As of December 31, 2016,2017, there was no valuation allowance recorded against the Company's DTA.Company’s DTA, however there is no guarantee that a valuation allowance will not be required in the future.
Business combinations - The value of certain assets and liabilities acquired are subject to adjustment from the initial purchase price allocation as additional information is obtained, including, but not limited to, valuation of separately identifiable intangibles, the preferred stock issued to the seller, and deferred taxes.
The valuations are finalized within twelve months of the close of the acquisition. The changes upon finalization to the initial purchase price allocation and valuation of assets and liabilities may result in an adjustment to identifiable intangible assets and goodwill. Adjustments to the provisional amounts identified during the measurement period are recognized in the reporting period in which the adjustment amounts are determined. The effect of changes in depreciation, amortization, or other income effects, if any, as a result of the change to the provisional amounts, calculated as if the accounting had been completed at the acquisition date, are recorded in the financial statements and presented separately on the statements of income statementand comprehensive income in the reporting period in which the adjustment amounts are determined.
Reinsurance - As part of Atlas'Atlas’ insurance risk management policies, portions of its insurance risk is ceded to reinsurers. Reinsurance premiums and claims adjustment expenses are accounted for on a basis consistent with those used in accounting for the original policies issued and the terms of the reinsurance contracts. Premiums and claims and claims adjustment expenses ceded to other companies have been reported as a reduction of premium revenue and incurred claims. Commissions paid to Atlas by reinsurers on business ceded have been accounted for as a reduction of the related policy acquisition costs. Reinsurance recoverables are recorded for that portion of paid and unpaid claims and claims adjustment expenses that are ceded to other companies. Prepaid reinsurance premiums are recorded for unearned premiums that have been ceded to other companies.
III. OPERATING RESULTS
CONSOLIDATED PERFORMANCE
20162017 Full Year Financial Performance Summary (comparisons to 20152016 unless otherwise noted):
Gross premiumpremiums written increased by 7.6%22.6% to $225.1$276.0 million which included an increase of 7.7% in our core commercial auto business
In-force premium as of December 31, 20162017 increased $43.9 million to $268.5 million
Total revenue for the year ended December 31, 2017 increased by 25.0% to $222.0 million
Underwriting loss for the year ended December 31, 2017 was $224.6$48.5 million, compared to $210.6an underwriting loss of $5.0 million, as of December 31, 2015
The combined ratio increased by 14.7 percentage pointsprimarily due to 102.9%, primarily as a result of a 19.1% impact from previously announcedthe claims reserve strengthening related to prior accident years
There was an underwriting lossThe combined ratio increased by 19.6% to 122.5%, primarily as a result of $5.0 million, compared to underwriting income of $18.0 million, primarily due to $32.6 million ofa 34.9% impact from claims reserve strengthening related to prior accident years
Net incomeloss was $2.6$38.8 million, or $0.19$3.22 loss per common share diluted, compared to $14.4net income of $2.6 million, or $1.13$0.19 earnings per common share diluted, representing a decrease in earnings per common share of 83.2% or $0.94.$3.41
Book value per common share as of December 31, 2016 was $10.54, compared2017 decreased $3.12 to $10.15 as of December 31, 2015$7.42
Return on equity was 2.1%a negative 35.6% as compared to 12.1%a positive 2.1%
The following financial data is derived from Atlas’ consolidated financial statements for the years ended December 31, 2016,2017, December 31, 2015,2016, and December 31, 2014.2015. Ratios are calculated as a percentage of net premiumpremiums earned.
| Selected Financial Information ($ in '000s, except for per share data) | |
| Selected Financial Information ($ in ‘000s, except for per share data) | | Selected Financial Information ($ in ‘000s, except for per share data) |
| | | Year Ended | Year Ended |
| | December 31, 2016 | | December 31, 2015 | | December 31, 2014 | December 31, 2017 | December 31, 2016 | December 31, 2015 |
| Gross premium written | $ | 225,095 |
| | $ | 209,286 |
| | $ | 122,432 |
| |
| Net premium earned | 171,058 |
| | 152,064 |
| | 98,124 |
| |
| Gross premiums written | | $ | 275,961 |
| $ | 225,095 |
| $ | 209,286 |
|
| Net premiums earned | | 215,771 |
| 171,058 |
| 152,064 |
|
| Net claims incurred | 134,746 |
| | 89,994 |
| | 61,078 |
| 203,873 |
| 134,746 |
| 89,994 |
|
| Underwriting expense: | | | | | | |
| Acquisition costs | 18,803 |
| | 18,592 |
| | 14,048 |
| 27,885 |
| 18,803 |
| 18,592 |
|
| Share-based compensation | 1,552 |
| | 1,613 |
| | 1,470 |
| 1,176 |
| 1,552 |
| 1,613 |
|
Expenses (recovered) incurred related to acquisitions and stock purchase agreements1 | (6,297 | ) | | 1,941 |
| | 694 |
| — |
| (6,297 | ) | 1,941 |
|
| DPAC amortization | | 806 |
| (746 | ) | (385 | ) |
Other underwriting expenses2 | 27,237 |
| | 21,971 |
| | 12,393 |
| 30,548 |
| 27,983 |
| 22,356 |
|
| Total underwriting expenses | 41,295 |
| | 44,117 |
| | 28,605 |
| 60,415 |
| 41,295 |
| 44,117 |
|
| Underwriting (loss) income | (4,983 | ) | | 17,953 |
| | 8,441 |
| (48,517 | ) | (4,983 | ) | 17,953 |
|
| Net investment income | 4,824 |
| | 3,976 |
| | 3,110 |
| 4,897 |
| 4,824 |
| 3,976 |
|
| (Loss) income from operating activities, before tax | (159 | ) | | 21,929 |
| | 11,551 |
| |
| (Loss) income from operating activities, before income taxes | | (43,620 | ) | (159 | ) | 21,929 |
|
Interest expense2 | (1,026 | ) | | (694 | ) | | — |
| (1,840 | ) | (1,026 | ) | (694 | ) |
| Realized gains and other income | 1,697 |
| | 811 |
| | 384 |
| 1,307 |
| 1,697 |
| 811 |
|
| Net income before tax | 512 |
| | 22,046 |
| | 11,935 |
| |
| Tax benefit from release of valuation allowance | — |
| | — |
| | (9,446 | ) | |
| Net (loss) income before income taxes | | (44,153 | ) | 512 |
| 22,046 |
|
| Income tax (benefit) expense | (2,134 | ) | | 7,616 |
| | 3,679 |
| (5,343 | ) | (2,134 | ) | 7,616 |
|
| Net income | $ | 2,646 |
| | $ | 14,430 |
| | $ | 17,702 |
| |
| Net (loss) income | | $ | (38,810 | ) | $ | 2,646 |
| $ | 14,430 |
|
| | | | | | | |
| Key Financial Ratios: | | | | | | |
| Loss ratio | 78.8 | % | | 59.2 | % | | 62.3 | % | 94.5 | % | 78.8 | % | 59.2 | % |
| Underwriting expense ratio: | | | | | | |
| Acquisition cost ratio | 11.0 | % | | 12.2 | % | | 14.3 | % | 12.9 | % | 11.0 | % | 12.2 | % |
| Share-based compensation ratio | 0.9 | % | | 1.1 | % | | 1.5 | % | 0.5 | % | 0.9 | % | 1.1 | % |
Expenses (recovered) incurred related to acquisitions and stock purchase agreements ratio1 | (3.7 | )% | | 1.3 | % | | 0.7 | % | — | % | (3.7) | % | 1.3 | % |
| DPAC amortization ratio | | 0.4 | % | (0.4) | % | (0.3) | % |
| Other underwriting expense ratio | 15.9 | % | | 14.4 | % | | 12.6 | % | 14.2 | % | 16.3 | % | 14.7 | % |
Total underwriting expense ratio1 | 24.1 | % | | 29.0 | % | | 29.1 | % | 28.0 | % | 24.1 | % | 29.0 | % |
Combined ratio1 | 102.9 | % | | 88.2 | % | | 91.4 | % | 122.5 | % | 102.9 | % | 88.2 | % |
| Earnings per common share diluted | $ | 0.19 |
| | $ | 1.13 |
| | $ | 1.56 |
| |
| (Loss) earnings per common share diluted | | $ | (3.22 | ) | $ | 0.19 |
| $ | 1.13 |
|
| Book value per common share | $ | 10.54 |
| | $ | 10.15 |
| | $ | 9.08 |
| $ | 7.42 |
| $ | 10.54 |
| $ | 10.15 |
|
| Return on equity | 2.1 | % | | 12.1 | % | | 20.5 | % | |
Return on equity3 | | (35.6) | % | 2.1 | % | 12.5 | % |
1 - For 2015, and 2014, we reclassified our presentation for costs related to acquisition and stock purchase agreements from non-operating expenses to other underwriting expenses.expenses, because these costs were incurred as a result of acquiring new businesses. The reclassification increased the total underwriting expense ratio and the combined ratio by 1.3% and 0.7% for the yearsyear ended December 31, 2015 and 2014, respectively.2015. The reclassification increased total underwriting expenses and decreased underwriting income and income from operating activities, before taxincome taxes by $1.9 million and $694,000 for the yearsyear ended December 31, 2015 and 2014, respectively.2015.
2 - For 2015, we restated our presentation for amortization of loan costs from other underwriting expense to interest expense in accordance with the Company'sCompany’s adoption of Accounting Standards Update 2015-03. As a result, other underwriting expense and total underwriting expense decreased and income from operating activities, before taxincome taxes and interest expense increased by $56,000. This restatement had a negligible impact on the other underwriting expense ratio, the total underwriting expense ratio and the combined ratio for the year ended December 31, 2015.
3 - For 2015, we restated our presentation for preferred shares from within the permanent equity section to be included within the mezzanine equity section in accordance with Financial Accounting Standards Board (“FASB”) ASC Topic 480 - Distinguishing Liabilities from Equity. As a result, return on equity increased 0.4% as a result of this decrease in shareholders’ equity from the reclassification of preferred shares.
Revenues
We derive our revenues primarily from premiums from our insurance policies and income from our investment portfolio. Our underwriting approach is to price our products to generate consistent underwriting profit for the insurance companies we own. As with all P&C insurance companies, the impact of price changes is reflected in our financial results over time. Price changes on our in-force policies occur as they are renewed. This cycle generally takes twelve months for our entire book of business and up to an additional twelve months to earn a full year of premium at the renewal rate.
We approach investment and capital management with the intention of supporting insurance operations by providing a stable source of income to supplement underwriting income. The goals of our investment policy are to protect capital while optimizing investment income and capital appreciation and maintaining appropriate liquidity. We follow a formal investment policy, and the Board of Directors reviews the portfolio performance at least quarterly for compliance with the established guidelines. The Investment Committee of the Board of Directors provides interim guidance and analysis with respect to asset allocation, as deemed appropriate.
Expenses
Net claims incurred expenses are a function of the amount and type of insurance contracts we write and of the claims experience of the underlying risks. We record net claims incurred based on an actuarial analysis of the estimated claims we expect to be reported on contracts written. We seek to establish case reserves at the maximum probable exposure based on our historical claims experience. Our ability to estimate net claims incurred accurately at the time of pricing our contracts is a critical factor in determining our profitability. The amount reported under net claims incurred in any period includes payments in the period net of the change in the value of the reserves for net claims incurred between the beginning and the end of the period.
Acquisition costs consist principally of brokerage and agent commissions and, to a lesser extent, premium taxes. The brokerage and agent commissions are reduced by ceding commissions received from assuming reinsurers that represent a percentage of the premiums on insurance policies and reinsurance contracts written and vary depending upon the amount and types of contracts written.
Other underwriting expenses consist primarily of personnel related expenses (including salaries, benefits and certain costs associated with awards under our equity compensation plans, such as share-based compensation expense) and other general operating expenses. We believe that because a portion of our personnel expenses are relatively fixed in nature, increased writings may improve our operating scale and may lead to reduced operating expense ratios.
Year ended December 31, 2017 compared to year endedDecember 31, 2016:
Gross Premiums Written
The following table summarizes gross premiums written by line of business.
| Gross Premiums Written by Line of Business ($ in ‘000s) |
| | | | | | | | |
| Year Ended December 31, | 2017 | 2016 | % Change |
| Commercial automobile | $ | 274,705 |
| $ | 223,801 |
| 22.7 | % |
| Other | 1,256 |
| 1,294 |
| (3.0 | )% |
| Total | $ | 275,961 |
| $ | 225,095 |
| 22.6 | % |
For the year ended December 31, 2017, gross premiums written was $276.0 million compared to $225.1 million for the year ended December 31, 2016, representing a 22.6% increase. This increase primarily resulted from growth in livery/limousine and para-transit gross premiums written primarily in New York, California, and New Jersey offset by a decrease in taxi gross premiums written in Louisiana and Nevada and in all lines in Minnesota and Michigan. New premium business represented approximately 40.7% of the total gross premiums written on our core lines for the year ended December 31, 2017, as compared to 33.9% for the year ended December 31, 2016.
In-force premium was $268.5 million and $224.6 million as of December 31, 2017 and December 31, 2016, respectively. The Company’s gross unearned premium reserves were $128.0 million and $113.2 million as of December 31, 2017 and December 31, 2016, respectively. The increase in gross unearned premium reserves and in-force premium since December 31, 2016 primarily resulted from growth in the states of California, New Jersey, and New York offset by a reduction in business in the states of Louisiana, Michigan and Minnesota.
We continued our disciplined underwriting practices in the state of Michigan. We have raised prices incrementally, subject to regulatory rules, based on the challenging results seen in that state. As a result, we have seen fewer renewals of our Michigan business. Michigan insured vehicles represented approximately 1.4% and 3.9% of total insured vehicles in force as of December 31, 2017 and December 31, 2016, respectively.
Geographic Concentration
| Gross Premiums Written by State ($ in ‘000s) |
| | | | | | | | | | | |
| Year Ended December 31, | 2017 | | 2016 |
| New York | $ | 99,374 |
| 36.0 | % | | $ | 69,737 |
| 31.0 | % |
| California | 42,165 |
| 15.3 | % | | 29,784 |
| 13.2 | % |
| Illinois | 15,664 |
| 5.7 | % | | 12,398 |
| 5.5 | % |
| New Jersey | 11,090 |
| 4.0 | % | | 4,881 |
| 2.2 | % |
| Virginia | 8,704 |
| 3.2 | % | | 7,940 |
| 3.5 | % |
| Texas | 8,511 |
| 3.1 | % | | 7,881 |
| 3.5 | % |
| Ohio | 7,204 |
| 2.6 | % | | 5,942 |
| 2.6 | % |
| Washington | 7,186 |
| 2.6 | % | | 4,975 |
| 2.2 | % |
| Minnesota | 6,453 |
| 2.3 | % | | 9,542 |
| 4.3 | % |
| Nevada | 6,449 |
| 2.3 | % | | 7,966 |
| 3.5 | % |
| Other | 63,161 |
| 22.9 | % | | 64,049 |
| 28.5 | % |
| Total | $ | 275,961 |
| 100.0 | % | | $ | 225,095 |
| 100.0 | % |
As illustrated by the table above, 36.0% of Atlas’ gross premiums written for the year ended December 31, 2017 came from New York and 64.2% came from the five states currently producing the most premium volume, as compared to 58.6% for the year ended December 31, 2016. Approximately 62.5% of the increase in New York gross premiums written for the year ended December 31, 2017 came from one new large limousine fleet account.
Ceded Premiums Written
Ceded premiums written is equal to premium ceded under the terms of Atlas’ in force reinsurance treaties. Atlas generally purchases reinsurance in an effort to limit net exposure on any one claim to a maximum amount of $500,000 with respect to commercial automobile liability claims. Atlas also purchases reinsurance in an effort to protect against awards in excess of its policy limits. Effective July 1, 2014, Atlas implemented a quota share reinsurance agreement with Swiss Reinsurance America Corporation (“Swiss Re”) for its commercial auto and general liability lines of business (“Quota Share”) written by American Country, American Service and Gateway, or collectively “ASI Pool Subsidiaries.” This reinsurance agreement had an initial cession rate of 5%, which was increased to 15% effective April 1, 2015, and then was decreased to 5% effective July 1, 2016. The Quota Share provides the Company with financial flexibility to manage expected growth and the timing of potential future capital raising activities. For 2015, Global Liberty had a 20% quota share reinsurance agreement with SCOR Reinsurance Company (“SCOR Re”). In 2016, this contract was replaced by a 25% quota share reinsurance agreement with Swiss Re for its commercial auto and general liability lines of business (“Global Quota Share”). The cession rate of the Quota Share and Global Quota Share remained the same for 2017.
Ceded premiums written decreased 0.5% to $44.8 million for the year ended December 31, 2017, compared with $45.0 million for the year ended December 31, 2016, primarily due to reductions in the cession rates of the Quota Share agreement and Global Liberty’s commercial automobile excess of loss reinsurance contracts offset by premium growth as compared to the prior year period. As our limousine and para-transit business grows, we expect ceded premiums written to increase, because, under the current market conditions, the reinsurance costs are more expensive for these products.
Net Premiums Written
Net premiums written is equal to gross premiums written less the ceded premiums written under the terms of Atlas’ in-force reinsurance treaties. Net premiums written increased 28.4% to $231.1 million for the year ended December 31, 2017 compared with $180.1 million for the year ended December 31, 2016. These changes are attributed to the combined effects of the reasons cited in the ‘Gross Premiums Written’ and ‘Ceded Premiums Written’ sections above.
Net Premiums Earned
Premiums are earned ratably over the term of the underlying policy. Net premiums earned increased by $44.7 million to $215.8 million for the year ended December 31, 2017, a 26.1% increase compared with $171.1 million for the year ended December 31, 2016. The increase in net premiums earned is attributable to the combined effects of the reasons cited in the ‘Gross Premiums Written’ and ‘Ceded Premiums Written’ sections above.
Based on a ongoing analysis of the niche markets on which we focus, we believe that the total number of rides, and accordingly vehicle count, in these niche markets continues to grow. In 2016, we saw a decline in our taxi business as some passengers and drivers migrated to a TNC market. However, this was generally offset by corresponding growth in our limousine and livery business. Growth in vehicle count in our limousine and livery business is positively influenced by passengers and drivers increasingly participating in the TNC market, and we anticipate that it may outpace reductions in taxi business over time. Growth in our para-transit business is correlated with demographic trends in the U.S. We believe that our Insurance Subsidiaries can continue to grow these specialty products to within a market share of 20% without having a disproportionate share of the market. Atlas’ focus has been, and continues to be, utilizing our experience and strong value proposition to maximize underwriting profit. It is important to note that we continue to see favorable market trends within our niche and believe that increased opportunity to expand underwriting margin still exists. These projections are subject to change should the competitive environment reverse from current trends.
Net Claims Incurred
The loss ratio relating to the net claims incurred for the year ended December 31, 2017 was 94.5% compared to 78.8% for the year ended December 31, 2016. The loss ratio increase was primarily the result of the Company’s re-estimation of its unpaid claims liabilities on prior accident years, creating a 15.7% increase in loss ratio for the year ended December 31, 2017. Atlas experienced $75.4 million in unfavorable prior accident year development for the year ended December 31, 2017. The unfavorable development is primarily from our core commercial automobile liability line in the states of Louisiana, Michigan and New York, mostly from accident years 2015 and prior.
Atlas performed a comprehensive review of its reserves, and based on year-end actuarial work coupled with a detailed internal file audit for claims with reserves not established by the Company’s predictive analytics tools, overall reserves were strengthened.
Facts Surrounding Reserve Changes
Atlas identified that claim expenses in Michigan were significantly outpacing other states and took a significant charge for the year ended December 31, 2016. Although exposure in Michigan was reduced to approximately 1.4% of the Company’s insured vehicles in force by year end 2017, payments for claims in this state continued to be disproportionate to historic premiums earned.
Remaining liability for non-New York Global Liberty business written prior to 2016 is expected to settle for greater amounts than previously expected.
Overall, the actuarially determined liability for remaining claims related to accident years 2015 and prior in general was indicated to be significantly higher than carried reserves.
Risk selection and pricing precision supported by predictive modeling in underwriting beginning in 2015 appears to have contributed improvement in expected loss ratio for premiums earned in 2016 and 2017.
Payment activity in calendar year 2017 attributed to the use of predictive modeling in claims was accelerated as expected. The Company believes that this represents an ultimate reduction in future expected losses, but it appears to be too early for credit to be given to this potential outcome from an actuarial perspective.
While the Company did see positive trends relating to more recent accident years in which predictive modeling had an impact, based on year-end work, it is clear that the challenges from the past outpaced more recent benefits.
Based on year end 2017 actuarial work, Atlas determined that this significant reserve increase was necessary to ensure sufficient IBNR levels to extinguish the remaining claims especially for older accident years.
Atlas intends to only write its products in states where it believes the Company can generate an above average underwriting profit. As a specialty insurer, Atlas puts a priority on addressing changes in our market in a nimble way. To this end, in recent years Atlas enhanced and initiated numerous underwriting and claim related processes designed to leverage our experience in the specialty light commercial auto sector, including the elevated use of predictive analytics. We have proactively compressed settlement time, particularly with respect to larger claims, providing earlier visibility into potentially changing claim trends. Atlas expects to continue to deliver improvements on more recent accident years by maintaining existing operating efficiency and further improving loss ratios through appropriate underwriting and pricing, disciplined claims handling as well as further leveraging the investments it has made in predictive analytics. However, credit for such improvement will not be recognized until it is reflected in future loss settlements.
The following tables summarize the claims and claims adjustment expenses incurred, net of reinsurance by line of business and accident year:
| Claims and Claims Adjustment Expenses Incurred, Net of Reinsurance ($ in ‘000s) |
| | | | | | | | | | | | | | | | | | | | |
| Year Ended December 31, 2017 | | Year Ended December 31, 2016 |
| Accident Year | Commercial Auto Liability | Other | Total | | Accident Year | Commercial Auto Liability | Other | Total |
| 2012 and prior | $ | 3,402 |
| $ | (456 | ) | $ | 2,946 |
| | 2011 and prior | $ | 3,374 |
| $ | 1,323 |
| $ | 4,697 |
|
| 2013 | 9,209 |
| 30 |
| 9,239 |
| | 2012 | 4,348 |
| 101 |
| 4,449 |
|
| 2014 | 23,037 |
| 603 |
| 23,640 |
| | 2013 | 10,764 |
| 131 |
| 10,895 |
|
| 2015 | 30,025 |
| 1,020 |
| 31,045 |
| | 2014 | 16,946 |
| 148 |
| 17,094 |
|
| 2016 | 7,693 |
| 834 |
| 8,527 |
| | 2015 | (4,930 | ) | 408 |
| (4,522 | ) |
| 2017 | 114,531 |
| 13,945 |
| 128,476 |
| | 2016 | 90,713 |
| 11,420 |
| 102,133 |
|
| Totals | $ | 187,897 |
| $ | 15,976 |
| $ | 203,873 |
| | Totals | $ | 121,215 |
| $ | 13,531 |
| $ | 134,746 |
|
Acquisition Costs and Other Underwriting Expenses
Acquisition costs represent commissions and taxes incurred on net premiums earned offset by ceding commission on business reinsured. Acquisition costs were $27.9 million for the year ended December 31, 2017, or 12.9% of net premiums earned, as compared to $18.8 million, or 11.0%, for the year ended December 31, 2016.
The table below indicates the impact of the various components of acquisition costs on the combined ratio for the years ended December 31, 2017 and 2016:
|
| | | | | | | | | | |
| ($ in ‘000s, percentages to net premiums earned) | | | | |
| Year Ended December 31, | 2017 | % | 2016 | % |
| Net premiums earned | $ | 215,771 |
| 100.0 | % | $ | 171,058 |
| 100.0 | % |
| Gross commissions incurred excluding contingent | 28,416 |
| 13.2 | % | 21,993 |
| 12.9 | % |
| Gross contingent commissions incurred | 3,458 |
| 1.6 | % | 2,618 |
| 1.5 | % |
| Premium and other taxes incurred | 7,315 |
| 3.4 | % | 6,257 |
| 3.6 | % |
| Total gross commissions and taxes incurred | 39,189 |
| 18.2 | % | 30,868 |
| 18.0 | % |
| Ceded commissions incurred excluding contingent | (9,447 | ) | (4.4 | )% | (10,966 | ) | (6.4 | )% |
| Ceded contingent commissions incurred | (1,857 | ) | (0.9 | )% | (1,099 | ) | (0.6 | )% |
| Total ceded commissions incurred | (11,304 | ) | (5.3 | )% | (12,065 | ) | (7.0 | )% |
| Total | $ | 27,885 |
| 12.9 | % | $ | 18,803 |
| 11.0 | % |
Gross commissions incurred excluding contingent commissions increased by $6.4 million over the prior year period. This increase resulted from premium growth in business where higher commission rates applied. Gross contingent commissions incurred increased by $840,000 over the prior year period primarily as a result of new agents becoming eligible for contingent commissions and premium growth. Gross contingent commissions are awarded based on the combination of developed loss experience and premium growth. Premium and other taxes incurred increased by $1.1 million over the prior year period as a result of premium growth.
Ceded commissions incurred excluding contingent commissions decreased by $1.5 million over the prior year period primarily due to the decrease in ceded premiums written for the Quota Share. Ceded contingent commissions incurred increased by $758,000 over the prior period. Ceded contingent commissions are based on loss experience. The increase in ceded contingent commissions resulted from favorable loss ratios on Atlas’ excess of loss reinsurance agreements and the Global Quota Share offset by unfavorable loss ratios on the Quota Share. As shown in the table in the ‘Combined Ratio’ section, on a pro-forma basis, without the effect of the Quota Share and Global Quota Share, the acquisition costs would have been 15.4% for the year ended December 31, 2017, as compared to 15.1% for the year ended December 31, 2016.
The other underwriting expense ratio (including share-based compensation expenses and expenses incurred related to stock purchase agreements) was 15.1% for the year ended December 31, 2017 compared to 13.1% for the year ended December 31, 2016. Other underwriting expenses increased by approximately $10.0 million over the prior year period. Depreciation, leasehold improvement amortization and facility costs related to Atlas’ new headquarters building increased by $806,000. Salary, payroll taxes and employee benefit costs decreased by $581,000. Because salary, payroll taxes and employee benefit costs decreased and gross premiums written and gross unearned premium reserves increased, DPAC amortization increased by $1.6 million. No expenses were recovered pursuant to stock purchase agreements during 2017, as compared to $6.3 million during 2016. The termination of Gateway’s workers’ compensation retroactive reinsurance agreement increased expenses by $1.7 million for year ended December 31, 2017. Directors fees increased by $30,000 over the prior year period due to the addition of a new board member during 2017.
Changes in our Quota Share reinsurance during 2017 had an impact on the reported other underwriting expense ratio when comparing year to year. As shown in the table in the ‘Combined Ratio’ section, on a pro-forma basis, without the effect of the Quota Share, the other underwriting expense ratio would have been 13.5% for the year ended December 31, 2017 compared to 11.0% for the year ended December 31, 2016. The 2016 ratio includes benefits from expenses recovered relating to acquisitions and stock purchase agreements, which decreased this ratio by 3.1%.
While the Quota Share and Global Quota Share provide a ceding commission to offset underwriting expense, this commission reduces acquisition costs rather than other underwriting expenses on the statements of income and comprehensive income. With this in mind, acquisition costs, and other underwriting expenses should be examined either collectively as total underwriting expenses or independent of the effects of the Quota Share and Global Quota Share ceding commissions to understand operating efficiency.
Expenses Related to Stock Purchase Agreements
Atlas did not incur or recover any expenses pursuant to stock purchase agreements for the year ended December 31, 2017. Atlas recovered $6.3 million of expenses pursuant to the contingent adjustments of the Gateway and Anchor stock purchase agreements that included the redemption and cancellation of preferred shares for the year ended December 31, 2016.
Combined Ratio
Atlas’ combined ratio for the year ended December 31, 2017 was 122.5%, compared to 102.9% for the year ended December 31, 2016.
Underwriting profitability, as opposed to overall profitability or net earnings, is measured by the combined ratio. The combined ratio is the sum of the claims and claims adjustment expense ratio, the acquisition cost ratio, and the underwriting expense ratio. The change in the combined ratio is attributable to the factors described in the ‘Net Premiums Earned’, ‘Net Claims Incurred’, and ‘Acquisition Costs and Other Underwriting Expenses’ sections above.
The table below indicates the impact of the Quota Share and Global Quota Share on the various components of the combined ratio for the years ended December 31, 2017 and 2016:
|
| | | | | | | | | | |
| ($ in ‘000s, percentages to net premiums earned) | |
| Year Ended December 31, | 2017 | 2016 |
| Gross of Quota Share and Global Quota Share: | Amount | % | Amount | % |
| Net premiums earned | $ | 240,994 |
| 100.0 | % | $ | 204,228 |
| 100.0 | % |
Net claims incurred1 | 224,368 |
| 93.1 | % | 151,873 |
| 74.4 | % |
| Acquisition costs | 37,028 |
| 15.4 | % | 30,827 |
| 15.1 | % |
| Other insurance general and administrative expenses | 30,548 |
| 12.7 | % | 27,983 |
| 13.7 | % |
| DPAC amortization | 806 |
| 0.3 | % | (746 | ) | (0.4 | )% |
| Expenses recovered related to acquisitions and stock purchase agreements | — |
| — | % | (6,297 | ) | (3.1 | )% |
| Share-based compensation expense | 1,176 |
| 0.5 | % | 1,552 |
| 0.8 | % |
| Total underwriting loss and combined ratio | $ | (52,932 | ) | 122.0 | % | $ | (964 | ) | 100.5 | % |
| | | | | |
| Net of Quota Share and Global Quota Share: | | | | |
| Net premiums earned | $ | 215,771 |
| 100.0 | % | $ | 171,058 |
| 100.0 | % |
| Net claims incurred | 203,873 |
| 94.5 | % | 134,746 |
| 78.8 | % |
| Acquisition costs | 27,885 |
| 12.9 | % | 18,803 |
| 11.0 | % |
| Other insurance general and administrative expenses | 30,548 |
| 14.2 | % | 27,983 |
| 16.3 | % |
| DPAC amortization | 806 |
| 0.4 | % | (746 | ) | (0.4 | )% |
| Expenses recovered related to acquisitions and stock purchase agreements | — |
| — | % | (6,297 | ) | (3.7 | )% |
| Share-based compensation expense | 1,176 |
| 0.5 | % | 1,552 |
| 0.9 | % |
| Total underwriting loss and combined ratio | $ | (48,517 | ) | 122.5 | % | $ | (4,983 | ) | 102.9 | % |
1 - For 2017, net claims incurred, gross of the quota share, for the current accident year was $143.3 million with a combined ratio impact of 59.5%. For the prior accident years net claims incurred, gross of the quota share was $81.0 million with a combined ratio impact of 33.6%. For 2016, net claims incurred, gross of the quota share, for the current accident year was $115.2 million with a combined ratio impact of 56.5%. For the prior accident years net claims incurred, gross of the quota share was $36.7 million with a combined ratio impact of 17.9%.
Net Investment Income
Net investment income is primarily comprised of interest income, dividend income, and income from other invested assets, net of investment expenses, which are comprised of investment management fees, custodial fees, and allocated salaries. Net investment income, net of investment expenses, increased by 1.5% to $4.9 million for the year ended December 31, 2017, compared to $4.8 million for the year ended December 31, 2016. These amounts are primarily comprised of interest income. This increase was primarily due to an increase in interest income from fixed income securities with higher coupon rates and a decrease in investment manager costs. The gross yield on our fixed income securities was 2.3% and 2.2% for the years ended December 31, 2017 and 2016, respectively. The gross yield on our cash and cash equivalents was 0.3% and 0.1% for the years ended December 31, 2017 and 2016, respectively. The increase in gross yield on our cash investments was due to higher interest rates on certain new accounts and higher balances in accounts earning greater interest. Equity method investments and collateral loans generated investment income of $1.9 million in each of the years ended December 31, 2017 and 2016.
Interest Expense
On April 26, 2017, Atlas issued $25 million of five-year 6.625% senior unsecured notes and received net proceeds of approximately $23.9 million after deducting underwriting discounts and commissions and other offering expenses. A portion of the net proceeds from this issuance, together with cash on hand, were used to repay all outstanding borrowings under the Loan Agreement, as defined below in the ‘Liquidity and Capital Resources’ section. Interest expense was $1.8 million and $1.0 million for the years ended December 31, 2017 and 2016, respectively. The increase in interest expense for the year ended December 31, 2017 primarily resulted from the accelerated amortization of debt issuance costs upon the repayment of outstanding amounts under the Loan Agreement and the higher interest rate related to the senior unsecured notes.
Net Realized Investment Gains
Net realized investment gains is comprised of the gains and losses from the sales of investments. Net realized investment gains for the year ended December 31, 2017 were $872,000 compared to $1.2 million for the year ended December 31, 2016. This decrease resulted from lower gains from the sale of fixed income securities partially offset by higher gains on the sale of equity securities and equity method investments.
Other Income
Atlas recorded other income of $435,000 and $467,000 for the years ended December 31, 2017 and 2016, respectively. The decrease in other income resulted from lower income from premium financing offset by higher rental income.
(Loss) Income before Income Taxes
Atlas generated a pre-tax loss of $44.2 million for the year ended December 31, 2017 compared to pre-tax income of $512,000 for year ended December 31, 2016. The causes of these changes are attributed to the combined effects of the reasons cited in the ‘Net Premiums Earned’, ‘Net Claims Incurred’, ‘Acquisition Costs and Other Underwriting Expenses’, ‘Net Investment Income’, ‘Interest Expense’, ‘Net Realized Investment Gains’, and ‘Other Income’ sections above.
Income Tax Benefit
Atlas recognized a tax benefit of $5.3 million for the year ended December 31, 2017 and $2.1 million for the year ended December 31, 2016. The following table reconciles the U.S. statutory marginal income tax rate of 35.0% to the effective tax rate for the years ended December 31, 2017 and 2016:
| Tax Rate Reconciliation ($ in ‘000s) |
| | | | | | | | | | | | | |
| Year Ended December 31, | 2017 | | 2016 |
| | Amount | | % | | Amount | | % |
| Provision for taxes at U.S. statutory marginal income tax rate | $ | (15,453 | ) | | 35.0 | % | | $ | 179 |
| | 35.0 | % |
| Nondeductible expenses | 51 |
| | (0.1 | )% | | 24 |
| | 4.7 | % |
| Tax-exempt income | (23 | ) | | 0.1 | % | | (39 | ) | | (7.6 | )% |
| State tax (net of federal benefit) | (2 | ) | | — | % | | 28 |
| | 5.5 | % |
| Stock compensation | (445 | ) | | 1.0 | % | | — |
| | — | % |
| Nondeductible acquisition accounting adjustment | — |
| | — | % | | (2,204 | ) | | (430.5 | )% |
| Change in statutory tax rate | 10,542 |
| | (23.9 | )% | | — |
| | — | % |
| Other | (13 | ) | | — | % | | (122 | ) | | (23.9 | )% |
| Provision for income taxes for continuing operations | $ | (5,343 | ) | | 12.1 | % | | $ | (2,134 | ) | | (416.8 | )% |
On December 22, 2017, the Tax Cuts and Jobs Act of 2017 (the “Tax Act”) was signed into law. Among other things, beginning with the 2018 tax year, the Tax Act reduced the Company’s corporate federal tax rate from a marginal rate of 35% to a flat 21%, eliminated the corporate Alternative Minimum Tax (“AMT”), changed reserving and other aspects of the computation of taxable income for insurance companies, and modified the net operating loss carryback and carryforward provisions for all entities in the group except for those subject to tax as property and casualty companies. The modified net operating loss provisions no longer allow a carryback to prior years to recover past taxes, but now allow an indefinite carryforward period subject to a yearly utilization limit. As discussed above, any net operating losses with respect to the insurance entities taxed as property and casualty companies retain the current net operating loss carryback and carryover provisions, which are two years carryback and 20 years carryforward. As of December 31, 2016, the Company measured its deferred tax items at the enacted rate in effect of 35%. Due to the Tax Act’s enactment, the Company’s deferred tax assets and liabilities as of December 31, 2017 have been re-measured at the new enacted tax rate of 21%. For the year ended December 31, 2017, the Company recognized income tax expense of $10.5 million related to reduction in the net deferred tax asset a result of this re-measurement.
Upon the transaction forming Atlas on December 31, 2010, a yearly limitation as required by IRC Section 382 that applies to changes in ownership on the future utilization of Atlas’ net operating loss carryforwards was calculated. The Insurance Subsidiaries’ prior parent retained those tax assets previously attributed to the Insurance Subsidiaries that could not be utilized by Atlas as a result of this limitation. As a result, Atlas’ ability to recognize future tax benefits associated with a portion of its deferred tax assets generated during prior years have been permanently limited to the amount determined under IRC Section 382. The result is a maximum expected net deferred tax asset, which Atlas has available after the merger and believed more-likely-than-not to be utilized in the future, after consideration of valuation allowance.
In assessing the need for a valuation allowance, Atlas considers both positive and negative evidence related to the likelihood of realization of the deferred tax assets.
Positive evidence evaluated when considering the need for a valuation allowance includes:
management’s expectations of future profit with vehicles in-force at their highest levels and steady new and renewal business;
anticipated ability to increase prices in core lines as the commercial auto market is firming;
predictive modeling in underwriting and claims are generating better priced risks that are expected to create overall profitability over time; and
positive growth trends in gross premiums written in each year since formation.
Negative evidence evaluated when considering the need for a valuation allowance includes:
net losses generated in the two most recent years; and
yearly limitation as required by IRC Section 382 on net operating loss carryforwards generated prior to 2013.
Net (Loss) Income and (Loss) Earnings per Common Share
Atlas had a net loss of $38.8 million for the year ended December 31, 2017 compared to net income of $2.6 million for the year ended December 31, 2016. After taking the impact of the liquidation preference of the preferred shares into consideration, the loss per common share diluted for the year ended December 31, 2017 was $3.22 versus earnings per common share diluted of $0.19 for the year ended December 31, 2016.
The following chart illustrates Atlas’ potential dilutive common shares for the years ended December 31, 2017 and 2016:
|
| | | | |
| Year Ended December 31, | 2017 | 2016 |
| Basic weighted average common shares outstanding | 12,064,880 |
| 12,045,519 |
|
| Dilutive potential ordinary shares: | | |
| Dilutive stock options | — |
| 177,364 |
|
| Dilutive shares upon preferred share conversion | — |
| — |
|
| Diluted weighted average common shares outstanding | 12,064,880 |
| 12,222,883 |
|
The effects of convertible instruments are excluded from the computation of earnings per common share diluted in periods in which the effect would be anti-dilutive. Convertible preferred shares are anti-dilutive when the amount of dividend declared or accumulated in the current period per common share obtainable upon conversion exceeds earnings per common share basic. For the year ended December 31, 2017, all exercisable stock options were deemed to be anti-dilutive. For the year ended December 31, 2016, all exercisable stock options were deemed to be dilutive and all of the convertible preferred shares were deemed to be anti-dilutive. The potentially dilutive impact for the convertible preferred stock excluded from the calculation due to anti-dilution is 441,357 common shares for the year ended December 31, 2016.
Year ended December 31, 2016 compared to year ended December 31, 2015:
Gross PremiumPremiums Written
The following table summarizes gross premiumpremiums written by line of business.
| Gross Premium Written by Line of Business ($ in '000s) | |
| Gross Premiums Written by Line of Business ($ in ‘000s) | | Gross Premiums Written by Line of Business ($ in ‘000s) |
| | Year Ended December 31, | 2016 | 2015 | % Change | 2016 | 2015 | % Change |
| Commercial automobile | $ | 223,801 |
| $ | 207,767 |
| 7.7 | % | $ | 223,801 |
| $ | 207,767 |
| 7.7 | % |
| Surety | (2 | ) | 177 |
| (101.1 | )% | |
| Other | 1,296 |
| 1,342 |
| (3.4 | )% | 1,294 |
| 1,519 |
| (14.8 | )% |
| Total | $ | 225,095 |
| $ | 209,286 |
| 7.6 | % | $ | 225,095 |
| $ | 209,286 |
| 7.6 | % |
For the year ended December 31, 2016, gross premiumpremiums written was $225.1 million compared to $209.3 million for the year ended December 31, 2015, representing a 7.6% increase. This increase primarily resulted from growth in livery/limousine and para-transit gross premiums written of approximately $41.1 million offset by a $25.6 million decrease in taxi gross premiums written. The growth in livery/limousine and para-transit gross premiums written resulted from having a full year'syear’s worth of Global Liberty premium for 2016 as compared to the 9-1/2 months we had in 2015, coupled with market share growth in those products. The decrease in taxi business included overall reduction in available vehicles to insure, a $4.3 million excess taxi account and a few larger fleet accounts that were not renewed during 2016 due to our disciplined underwriting practice.
For the year ended December 31, 2016, gross premiumpremiums written from commercial automobile was $223.8 million, representing a 7.7% increase relative to the year ended December 31, 2015. This increase is attributable to Atlas'Atlas’ continued geographic expansion as a positive response from both new and existing agents and insureds to Atlas'Atlas’ value proposition. We wrote $75.8 million and $86.8 million of new gross premiumpremiums written business for the years ended December 31, 2016 and 2015, respectively. Of these amounts, Global Liberty, our most recent acquisition, contributed $19.3 million and $20.6 million in new premiums written for the years ended December 31, 2016 and 2015, respectively. With respect to our traditional commercial automobile, which excludes excess taxi, gross premiumpremiums written was $215.7 million, an increase of 10.4% versus the year ended December 31, 2015. As a percentage of the Insurance Subsidiaries’ overall book of business, commercial auto gross premiumpremiums written represented 99.4% of gross, and 99.9% of net, premiumpremiums written for the year ended December 31, 2016 compared to 99.3% and 99.4%, respectively, during the year ended December 31, 2015.
In-force premium was $224.6 million and $210.6 million as of December 31, 2016 and December 31, 2015, respectively. The Company'sCompany’s gross unearned premium reserve wasreserves were $113.2 million and $108.2 million as of December 31, 2016 and December 31, 2015, respectively. The increase in gross unearned premium reserves and in-force premium since December 31, 2015 primarily resulted from growth in the states of California, Nevada, New Jersey, New York and Washington offset by a reduction in business in the state of Michigan.
Geographic Concentration
| Gross Premium Written by State ($ in '000s) | |
| Gross Premiums Written by State ($ in ‘000s) | | Gross Premiums Written by State ($ in ‘000s) |
| | Year Ended December 31, | 2016 | | 2015 | 2016 | | 2015 |
| New York | $ | 69,737 |
| 31.0 | % | | $ | 61,331 |
| 29.3 | % | $ | 69,737 |
| 31.0 | % | | $ | 61,331 |
| 29.3 | % |
| California | 29,784 |
| 13.2 | % | | 24,592 |
| 11.8 | % | 29,784 |
| 13.2 | % | | 24,592 |
| 11.8 | % |
| Illinois | 12,398 |
| 5.5 | % | | 11,741 |
| 5.6 | % | 12,398 |
| 5.5 | % | | 11,741 |
| 5.6 | % |
| Louisiana | 10,337 |
| 4.6 | % | | 11,884 |
| 5.7 | % | 10,337 |
| 4.6 | % | | 11,884 |
| 5.7 | % |
| Minnesota | 9,542 |
| 4.3 | % | | 11,178 |
| 5.3 | % | 9,542 |
| 4.3 | % | | 11,178 |
| 5.3 | % |
| Michigan | 9,002 |
| 4.0 | % | | 12,178 |
| 5.8 | % | 9,002 |
| 4.0 | % | | 12,178 |
| 5.8 | % |
| Nevada | 7,966 |
| 3.5 | % | | 4,536 |
| 2.2 | % | 7,966 |
| 3.5 | % | | 4,536 |
| 2.2 | % |
| Virginia | 7,940 |
| 3.5 | % | | 7,134 |
| 3.4 | % | 7,940 |
| 3.5 | % | | 7,134 |
| 3.4 | % |
| Texas | 7,881 |
| 3.5 | % | | 9,462 |
| 4.5 | % | 7,881 |
| 3.5 | % | | 9,462 |
| 4.5 | % |
| Ohio | 5,942 |
| 2.6 | % | | 6,124 |
| 2.9 | % | 5,942 |
| 2.6 | % | | 6,124 |
| 2.9 | % |
| Other | 54,566 |
| 24.3 | % | | 49,126 |
| 23.5 | % | 54,566 |
| 24.3 | % | | 49,126 |
| 23.5 | % |
| Total | $ | 225,095 |
| 100.0 | % | | $ | 209,286 |
| 100.0 | % | $ | 225,095 |
| 100.0 | % | | $ | 209,286 |
| 100.0 | % |
As illustrated by the table above, 31.0% of Atlas’ gross premiumpremiums written year ended December 31, 2016 came from New York and 58.6% came from the five states currently producing the most premium volume, as compared to 58.2% for the year ended December 31, 2015. Global Liberty experienced the highest gross premiumpremiums written growth among the Insurance Subsidiaries for the year ended December 31, 2016 in these top five states due to having a full year'syear’s worth of premium in 2016.
Ceded PremiumPremiums Written
Ceded premium written is equal to premium ceded under the terms of Atlas’ in force reinsurance treaties. Effective July 1, 2014, Atlas implemented a quota share reinsurance agreement with Swiss Reinsurance America Corporation ("Swiss Re") for its commercial auto and general liability lines of business ("Quota Share") written by American Country, American Service and Gateway, or collectively "ASI Pool Subsidiaries." This reinsurance agreement had an initial cession rate of 5%, which was increased to 15% effective April 1, 2015, and then was decreased to 5% effective July 1, 2016. The Quota Share provides the Company with financial flexibility to manage expected growth and the timing of potential future capital raising activities.
For 2015, Global Liberty had a 20% quota share reinsurance agreement with SCOR Reinsurance Company ("SCOR Re"). In 2016, this contract was replaced by a 25% quota share reinsurance agreement with Swiss Re for its commercial auto and general liability lines of business ("Global Quota Share").
Ceded premiumpremiums written increased 13.7% to $45.0 million for the year ended December 31, 2016 compared with $39.6 million for the year ended December 31, 2015 primarily due to Atlas'Atlas’ participation in the Quota Share and Global Quota Share, product mix and overall gross premium growth. As our limousine and para-transit business grows, we expect ceded premium written to increase because, under the current market conditions, the reinsurance costs are more expensive for these products. Excluding the Quota Share and Global Quota Share, ceded premiums written were $13.4 million and $10.5 million for the years ended December 31, 2016 and 2015, respectively.
Net PremiumPremiums Written
Net premium written is equal to gross premium written less the ceded premium written under the terms of Atlas’ in-force reinsurance treaties. Net premiumpremiums written increased 6.1% to $180.1 million for the year ended December 31, 2016 compared with $169.7 million for the year ended December 31, 2015. These changes are attributed to the combined effects of the reasons cited in the ‘Gross PremiumPremiums Written’ and ‘Ceded PremiumPremiums Written’ sections above.
Net PremiumPremiums Earned
Premiums are earned ratably over the term of the underlying policy. Net premiumpremiums earned increased by $19.0 million to $171.1 million for the year ended December 31, 2016, a 12.5% increase compared with $152.1 million for the year ended December 31, 2015. The increase in net premiums earned is attributable to the combined effects of the reasons cited in the ‘Gross PremiumPremiums Written’ and ‘Ceded PremiumPremiums Written’ sections above. Global Liberty accounted for $11.0 million of this increase. The remaining increase in net premiums earned premiums resulted from organic growth primarily in the states of California, Minnesota, Nevada, New York and Virginia.
Based on a ongoing analysis of the niche markets on which we focus, we believe that the total number of rides, and accordingly vehicle count, in these niche markets continues to grow. In 2016 we saw a decline in our taxi business as some passengers and drivers migrated to a transportation network market. However, this was generally offset by corresponding growth in our limousine and livery business. Growth in vehicle count in our limousine and livery business is positively influenced by passengers and drivers increasingly participating in the transportation network market and we anticipate that it may outpace reductions in taxi business over time. Growth in our para-transit business is correlated with demographic trends in the U.S. We believe that our Insurance Subsidiaries can continue to grow these specialty products to within a market share of 20% without having a disproportionate share of the market. Atlas’ focus has been, and continues to be, utilizing our expertise, experience and strong value proposition to maximize underwriting profit. It is important to note that we continue to see favorable market trends within our niche and believe that increased opportunity to expand underwriting margin still exists. These projections are subject to change should the competitive environment reverse from current trends.
Net Claims Incurred
The loss ratio relating to the net claims incurred for the year ended December 31, 2016 was 78.8% compared to 59.2% for the year ended December 31, 2015. The loss ratio increase was primarily the result of the Company'sCompany’s re-estimation of its unpaid claims liabilities on prior accident years, creating a 19.6% increase in loss ratio for the year ended December 31, 2016. Atlas experienced $32.6 million in unfavorable prior accident year development for the year ended December 31, 2016. The unfavorable development is primarily from our core commercial automobile liability line. Excluding pre-acquisition Global Liberty claims reserve development, the development of our core lines on prior accident years was $23.2 million for the year ended December 31, 2016. Michigan commercial automobile claims accounted for approximately 62.5% of this development.
As a percentage of the Company’s policy count, business written in the state of Michigan was reduced significantly on a year-over-year basis beginning in 2013 as a result of relative underperformance. In 2012, Michigan business represented 18.5% of total policy count; in the past year, policies in that state represented 4.5% of the total. Despite the reduction in relative exposure, losses paid in connection with Michigan claims have been disproportionate, representing 21% of all loss amounts paid in 2016 for commercial auto liability claims. Claims paid under $25,000 represented 43% of the total paid in the state with average severity in this cohort increasing 24% on a year over year basis in 2016. In particular, average severity for personal injury protection (“PIP”) coverage, which is mandatory in Michigan, paid in 2016 increased by 115% as compared to 2015, litigated PIP claim settlements increased by 25% year over year and PIP claims closing without payment decreased from 50% to 32%. Severity trends for large claims were more stable. In total, based on claim payment made through year-end 2016, Michigan claims for policy years 2010 through 2015 exceeded the amount that would have been proportionate by approximately $23 million.
Atlas will only write its products in states where it believes the Company can generate an above average underwriting profit. Having taken actions to eliminate this exposure, the Company anticipates business in Michigan to be less than 1% of Atlas’ in-force business by the end of 2017.
As a specialist, Atlas puts a priority on addressing changes in our market in a nimble way. To this end, in recent years Atlas enhanced and initiated numerous underwriting and claim related processes designed to leverage our expertise in the specialty light commercial auto sector, including the elevated use of predictive analytics. We have proactively compressed settlement time, particularly with respect to larger claims, providing earlier visibility into potentially changing claim trends. It is important to acknowledge our entire claims team’s excellent work, including our Michigan adjusters who are diligently addressing the challenges in that market. Observations from the year-end 2016 reserve analysis that led to the conclusion that reserve strengthening for older years appears appropriate also confirm our belief that the changes made in our claim process may yield an overall better result in our ultimate loss costs going forward. The Company is committed to learn from the factors surrounding our reserve strengthening to ensure we can react to changes in our industry and niche as quickly as possible in the future.
Pre-acquisition Global Liberty claims reserve development was $7.9 million for the year ended December 31, 2016. The remaining unfavorable prior year development of $1.5 million for the year ended December 31, 2016 is attributable to assigned risk pools and run-off non-core business.
We expectAtlas experienced $166,000 in unfavorable prior accident year development during the loss ratioyear ended December 31, 2015. Prior accident year unfavorable development on non-core lines and assigned risk pools was $870,000 for the year ended December 31, 2015. The unfavorable development on non-core lines and assigned risk pools was offset by favorable prior accident year development of $475,000 and $230,000 on our core lines and pre-acquisition Global Liberty claims reserves, respectively. This favorable development on our core lines was attributable to our traditional taxi and excess taxi program to remain withinproducts.
The following tables summarize the range of 45% to 50% of net earned premiums. We believe that our extensive experience and expertise with respect to underwritingclaims and claims management in all our commercial lines will allow us to maintain or improve loss ratios going forward. The Company is committed to retain this claims handling expertise as a core competency as the volumeadjustment expenses incurred, net of reinsurance by line of business increases.and accident year:
| Claims and Claims Adjustment Expenses Incurred, Net of Reinsurance ($ in ‘000s) |
| | | | | | | | | | | | | | | | | | | | |
| Year Ended December 31, 2016 | | Year Ended December 31, 2015 |
| Accident Year | Commercial Auto Liability | Other | Total | | Accident Year | Commercial Auto Liability | Other | Total |
| 2011 and prior | $ | 3,374 |
| $ | 1,323 |
| $ | 4,697 |
| | 2010 and prior | $ | 2,622 |
| $ | 156 |
| $ | 2,778 |
|
| 2012 | 4,348 |
| 101 |
| 4,449 |
| | 2011 | 288 |
| 305 |
| 593 |
|
| 2013 | 10,764 |
| 131 |
| 10,895 |
| | 2012 | 1,431 |
| (16 | ) | 1,415 |
|
| 2014 | 16,946 |
| 148 |
| 17,094 |
| | 2013 | 5,908 |
| (200 | ) | 5,708 |
|
| 2015 | (4,930 | ) | 408 |
| (4,522 | ) | | 2014 | (10,912 | ) | 584 |
| (10,328 | ) |
| 2016 | 90,713 |
| 11,420 |
| 102,133 |
| | 2015 | 79,062 |
| 10,766 |
| 89,828 |
|
| Totals | $ | 121,215 |
| $ | 13,531 |
| $ | 134,746 |
| | Totals | $ | 78,399 |
| $ | 11,595 |
| $ | 89,994 |
|
Acquisition Costs and Other Underwriting Expenses
Acquisition costs represent commissions and taxes incurred on net premium earned offset by ceding commission on business reinsured by the Quota Share and Global Quota Share. Acquisition costs were $18.8 million for the year ended December 31, 2016, or 11.0% of net premiumpremiums earned, as compared to 12.2% for the year ended December 31, 2015. The decrease in the ratio is primarily due to the Quota Share'sShare’s and Global Quota Share'sShare’s ceding commissions. On
The table below indicates the impact of the various components of acquisition costs on the combined ratio for the years ended December 31, 2016 and 2015:
|
| | | | | | | | | | |
| ($ in ‘000s, percentages to net premiums earned) | | | | |
| Year Ended December 31, | 2016 | % | 2015 | % |
| Net premiums earned | $ | 171,058 |
| 100.0 | % | $ | 152,064 |
| 100.0 | % |
| Gross commissions incurred excluding contingent | 21,993 |
| 12.9 | % | 19,200 |
| 12.6 | % |
| Gross contingent commissions incurred | 2,618 |
| 1.5 | % | 2,257 |
| 1.5 | % |
| Premium and other taxes incurred | 6,257 |
| 3.6 | % | 4,933 |
| 3.3 | % |
| Total gross commissions and taxes incurred | 30,868 |
| 18.0 | % | 26,390 |
| 17.4 | % |
| Ceded commissions incurred excluding contingent | (10,966 | ) | (6.4 | )% | (6,807 | ) | (4.5 | )% |
| Ceded contingent commissions incurred | (1,099 | ) | (0.6 | )% | (991 | ) | (0.7 | )% |
| Total ceded commissions incurred | (12,065 | ) | (7.0 | )% | (7,798 | ) | (5.2 | )% |
| Total | $ | 18,803 |
| 11.0 | % | $ | 18,592 |
| 12.2 | % |
As discussed above in ‘Gross Premiums Written’, we wrote a full year’s worth of Global Liberty premium for 2016 as compared to the 9-1/2months we had in 2015. Due to this increase, coupled with market share growth in our livery/limousine and para-transit products where higher commission rates applied, gross commissions incurred excluding contingent commissions increased by $2.8 million over the prior year period. Gross contingent commissions incurred increased by $361,000 over the prior year period primarily as a result of Global Liberty business being included in the calculations. Premium and other taxes incurred increased by $1.3 million over the prior year period as a result of premium growth.
Ceded commissions incurred excluding contingent commissions increased by $4.2 million over the prior year period primarily due to the increase in ceded premiums written for the Quota Share and Global Quota Share. Ceded contingent commissions incurred increased by $108,000 over the prior period. The increase in ceded contingent commissions resulted from favorable loss ratios on Atlas’ excess of loss reinsurance agreements offset by unfavorable loss ratios on the Quota Share. As shown in the table in the ‘Combined Ratio’ section, on a pro-forma basis, without the effect of the Quota Share and Global Quota Share, the acquisition costs would have been 15.1% for the year ended December 31, 2016, as compared to 14.7% for the year ended December 31, 2015.
The other underwriting expense ratio (including share-based compensation expenses and expenses incurred related to acquisitions and stock purchase agreements) was 13.1% for the year ended December 31, 2016 compared to 16.8% for the year ended December 31, 2015. Expenses recovered pursuant to stock purchase agreements lowered the other underwriting expense ratio by 3.7% for the year ended December 31, 2016. Bad debt expense totaled $2.4 million for the year ended December 31, 2016 compared to $622,000 for the year ended December 31, 2015. The increase resulted from the re-estimation of the allowance and the reserving for specific premium receivable accounts past due. Bad debt expense increased the other underwriting expense ratio by 1.4% for the year ended December 31, 2016. Changes in our Quota Share reinsurance during 2016 had an impact on the reported other underwriting expense ratio when comparing year to year. OnAs shown in the table in the ‘Combined Ratio’ section, on a pro-forma basis, without the effect of the Quota Share, the other underwriting expense ratio would have been 11.0% for the year ended December 31, 2016 compared to 14.9% for the year ended December 31, 2015. The growth of our core lines and our increasing operational scale has had a positive impact on this ratio.
Also, whileExpenses Related to Acquisitions and Stock Purchase Agreements
Atlas recovered $6.3 million of expenses pursuant to the Quota Sharecontingent adjustments of the Gateway and Global Quota Share provide a ceding commissionAnchor stock purchase agreements that included the redemption and cancellation of preferred shares for the year ended December 31, 2016. For the year ended December 31, 2015, Atlas recognized total expenses of $1.9 million related to offset underwritingthe acquisition of Anchor and pursuant to the contingent adjustments relative to the Gateway stock purchase agreement. The Anchor costs of $999,000 were incurred to effect the business combination and included legal fees, advisory services, accounting fees, and internal general and administrative costs. The Gateway expense this commission reduces acquisition costs rather than other underwriting expenses onof $942,000 related to the income statement. With this in mind, acquisition coststerms of the Gateway stock purchase agreement and other underwriting expenses should be examined collectively as total underwriting expensesthe issuance of preferred shares pursuant to understand operating efficiency.the terms of such agreement.
Combined Ratio
Atlas'Atlas’ combined ratio for the year ended December 31, 2016 was 102.9%, compared to 88.2% for the year ended December 31, 2015.
Underwriting profitability, as opposed to overall profitability or net earnings, is measured by the combined ratio. The combined ratio is the sum of the claims and claims adjustment expense ratio, the acquisition cost ratio, and the underwriting expense ratio.
The change in underwriting profitability is attributable to the factors described in the 'Net Premium Earned'‘Net Premiums Earned’, ‘Net Claims Incurred’, ‘Acquisition Costs and Other Underwriting Expenses’ sections above.
The table below indicates the impact of the Quota Share and Global Quota Share on the various components of the combined ratio for the years ended December 31, 2016 and 2015:
| | | ($ in '000s, percentages to net earned premiums) | | |
| ($ in ‘000s, percentages to net premiums earned) | | |
| Year Ended December 31, | 2016 | 2015 | 2016 | 2015 |
| Gross of Quota Share and Global Quota Share: | Amount | % | Amount | % | Amount | % | Amount | % |
| Net premiums earned | $ | 204,228 |
| 100.0 | % | $ | 170,737 |
| 100.0 | % | $ | 204,228 |
| 100.0 | % | $ | 170,737 |
| 100.0 | % |
Net claims incurred1 | 151,873 |
| 74.4 | % | 99,394 |
| 58.2 | % | 151,873 |
| 74.4 | % | 99,394 |
| 58.2 | % |
| Acquisition costs | 30,827 |
| 15.1 | % | 25,093 |
| 14.7 | % | 30,827 |
| 15.1 | % | 25,093 |
| 14.7 | % |
Other insurance general and administrative expenses2 | 27,237 |
| 13.3 | % | 21,971 |
| 12.9 | % | 27,983 |
| 13.7 | % | 22,356 |
| 13.1 | % |
| DPAC amortization | | (746 | ) | (0.4 | )% | (385 | ) | (0.2 | )% |
Expenses (recovered) incurred related to acquisitions and stock purchase agreements3 | (6,297 | ) | (3.1 | )% | 1,941 |
| 1.1 | % | (6,297 | ) | (3.1 | )% | 1,941 |
| 1.1 | % |
| Share-based compensation expense | 1,552 |
| 0.8 | % | 1,613 |
| 0.9 | % | 1,552 |
| 0.8 | % | 1,613 |
| 0.9 | % |
| Total underwriting (loss) profit and combined ratio | $ | (964 | ) | 100.5 | % | $ | 20,725 |
| 87.8 | % | $ | (964 | ) | 100.5 | % | $ | 20,725 |
| 87.8 | % |
| | | | | | | | | |
| Net of Quota Share and Global Quota Share: | | | | | | | | |
| Net premiums earned | $ | 171,058 |
| 100.0 | % | $ | 152,064 |
| 100.0 | % | $ | 171,058 |
| 100.0 | % | $ | 152,064 |
| 100.0 | % |
| Net claims incurred | 134,746 |
| 78.8 | % | 89,994 |
| 59.2 | % | 134,746 |
| 78.8 | % | 89,994 |
| 59.2 | % |
| Acquisition costs | 18,803 |
| 11.0 | % | 18,592 |
| 12.2 | % | 18,803 |
| 11.0 | % | 18,592 |
| 12.2 | % |
Other insurance general and administrative expenses2 | 27,237 |
| 15.9 | % | 21,971 |
| 14.4 | % | 27,983 |
| 16.3 | % | 22,356 |
| 14.7 | % |
| DPAC amortization | | (746 | ) | (0.4 | )% | (385 | ) | (0.3 | )% |
Expenses (recovered) incurred related to acquisitions and stock purchase agreements3 | (6,297 | ) | (3.7 | )% | 1,941 |
| 1.3 | % | (6,297 | ) | (3.7 | )% | 1,941 |
| 1.3 | % |
| Share-based compensation expense | 1,552 |
| 0.9 | % | 1,613 |
| 1.1 | % | 1,552 |
| 0.9 | % | 1,613 |
| 1.1 | % |
| Total underwriting (loss) profit and combined ratio | $ | (4,983 | ) | 102.9 | % | $ | 17,953 |
| 88.2 | % | $ | (4,983 | ) | 102.9 | % | $ | 17,953 |
| 88.2 | % |
1 - For 2016, net claims incurred, gross of the quota share, for the current accident year was $115.2 million with a combined ratio impact of 56.5%. For the prior accident years net claims incurred, gross of the quota share was $36.7 million with a combined ratio impact of 17.9%.
2 - For 2015, we restated our presentation for amortization of loan costs from other underwriting expense to interest expense in accordance with the Company'sCompany’s adoption of Accounting Standards Update 2015-03. The restatement decreased other insurance general and administrative expense and increased the total underwriting profit by $56,000. The restatement had a negligible impact on the other insurance general and administrative expense ratio and the combined ratio for the year ended December 31, 2015. For 2015, we combined our presentation of amortization of intangible assets and other insurance general and administrative expenses.
3 - For 2015, we reclassified our presentation for costs related to acquisition and stock purchase agreements from non-operating expenses to other underwriting expenses. The reclassification decreased both gross and net total underwriting profit by $1.9 million, increased the gross combined ratio by 1.1% and increased the net combined ratio by 1.3% for the year ended December 31, 2015.
Net Investment Income
Net investment income is primarily comprised of interest income, dividend income, and income from other invested assets, net of investment expenses, which are comprised of investment management fees, custodial fees, and allocated salaries. Net investment income, net of investment expenses, increased by 21.3% to $4.8 million for the year ended December 31, 2016, compared to $4.0 million for the year ended December 31, 2015. These amounts are primarily comprised of interest income. This increase was primarily due to the acquisition of Anchor and change in investment mix with higher yields. The gross yield on our fixed income securities was 2.2% for each of the years ended December 31, 2016 and 2015. The gross yield on our cash and cash equivalents was 0.1% for each of the years ended December 31, 2016 and 2015. For the year ended December 31, 2016, equity method investments and collateral loans generated investment income of $1.9 million, compared to investment income of $1.3 million for the year ended December 31, 2015. This increase is primarily due to interest income on our collateral loan investments.
Interest Expense
Interest expense was $1.0 million and $694,000 for the years ended December 31, 2016 and 2015, respectively. The increase in interest expense for the year ended December 31, 2016 primarily resulted from increased borrowings under the Loan Agreement and slight increases in the LIBOR.
Net Realized Investment Gains
Net realized investment gains is comprised of the gains and losses from the sales of investments. Net realized investment gains for the year ended December 31, 2016 were $1.2 million compared to $455,000 for the year ended December 31, 2015. This increase resulted primarily from gains on the sale of state/political subdivision and corporate fixed income securities under favorable market conditions.
Other Income
Atlas recorded other income for the year ended December 31, 2016 of $467,000 compared to other income of $356,000 for the year ended December 31, 2015. The increase in other income resulted from rental income and the recovery of previously escheated funds.
Expenses Related to Acquisitions and Stock Purchase Agreements
Atlas recovered $6.3 million of expenses pursuant to the contingent adjustments of the Gateway and Anchor stock purchase agreements that included the redemption and cancellation of preferred shares for the year ended December 31, 2016. For the year ended December 31, 2015, Atlas recognized total expenses of $1.9 million related to the acquisition of Anchor and pursuant to the contingent adjustments relative to the Gateway stock purchase agreement. The Anchor costs of $999,000 were incurred to effect the business combination and included legal fees, advisory services, accounting fees, and internal general and administrative costs. The Gateway expense of $942,000 related to the terms of the Gateway stock purchase agreement and the issuance of preferred shares pursuant to the terms of such agreement.
Income before Income Taxes
Atlas generated pre-tax income of $512,000 for the year ended December 31, 2016 compared to pre-tax income of $22.0 million for year ended December 31, 2015. The causes of these changes are attributed to the combined effects of the reasons cited in the 'Net Premium Earned'‘Net Premiums Earned’, 'Net‘Net Claims Incurred'Incurred’, 'Acquisition‘Acquisition Costs and Other Underwriting Expenses'Expenses’, 'Net‘Net Investment Income'Income’, 'Net‘Interest Expense’, ‘Net Realized Investment Gains'Gains’, and 'Other Income'‘Other Income’ sections above.
Income Tax (Benefit) Expense
Atlas recognized $2.1 million of tax benefit for the year ended December 31, 2016 and recognized $7.6 million of tax expense for the year ended December 31, 2015. The following table reconciles the U.S. statutory marginal income tax rate of 35.0% to the effective tax rate for the years ended December 31, 2016 and 2015:
| Tax Rate Reconciliation ($ in '000s) |
| | | | | | | | | | | | | |
| Year Ended December 31, | 2016 | | 2015 |
| | Amount | | % | | Amount | | % |
| Provision for taxes at U.S. statutory marginal income tax rate | $ | 179 |
| | 35.0 | % | | $ | 7,716 |
| | 35.0 | % |
| Nondeductible expenses | 24 |
| | 4.7 | % | | 124 |
| | 0.6 | % |
| Tax-exempt income | (39 | ) | | (7.6 | )% | | (89 | ) | | (0.4 | )% |
| State tax (net of federal benefit) | 28 |
| | 5.5 | % | | 118 |
| | 0.5 | % |
| Nondeductible acquisition accounting adjustment | (2,204 | ) | | (430.5 | )% | | 329 |
| | 1.5 | % |
| Change in statutory tax rate | — |
| | — | % | | (471 | ) | | (2.1 | )% |
| Other | (122 | ) | | (23.9 | )% | | (111 | ) | | (0.6 | )% |
| Provision for income taxes for continuing operations | $ | (2,134 | ) | | (416.8 | )% | | $ | 7,616 |
| | 34.5 | % |
Upon the transaction forming Atlas on December 31, 2010, a yearly limitation as required by IRC Section 382 that applies to changes in ownership on the future utilization of Atlas’ net operating loss carryforwards was calculated. The Insurance Subsidiaries’ prior parent retained those tax assets previously attributed to the Insurance Subsidiaries that could not be utilized by Atlas as a result of this limitation. As a result, Atlas’ ability to recognize future tax benefits associated with a portion of its deferred tax assets generated during prior years have been permanently limited to the amount determined under IRC Section 382. The result is a maximum expected net deferred tax asset, which Atlas has available after the merger and believed more-likely-than-not to be utilized in the future, after consideration of valuation allowance.| Tax Rate Reconciliation ($ in ‘000s) |
| | | | | | | | | | | | | |
| Year Ended December 31, | 2016 | | 2015 |
| | Amount | | % | | Amount | | % |
| Provision for taxes at U.S. statutory marginal income tax rate | $ | 179 |
| | 35.0 | % | | $ | 7,716 |
| | 35.0 | % |
| Nondeductible expenses | 24 |
| | 4.7 | % | | 124 |
| | 0.6 | % |
| Tax-exempt income | (39 | ) | | (7.6 | )% | | (89 | ) | | (0.4 | )% |
| State tax (net of federal benefit) | 28 |
| | 5.5 | % | | 118 |
| | 0.5 | % |
| Nondeductible acquisition accounting adjustment | (2,204 | ) | | (430.5 | )% | | 329 |
| | 1.5 | % |
| Change in statutory tax rate | — |
| | — | % | | (471 | ) | | (2.1 | )% |
| Other | (122 | ) | | (23.9 | )% | | (111 | ) | | (0.6 | )% |
| Provision for income taxes for continuing operations | $ | (2,134 | ) | | (416.8 | )% | | $ | 7,616 |
| | 34.5 | % |
Net Income and Earnings per Common Share
Atlas had net income of $2.6 million for the year ended December 31, 2016 compared to $14.4 million for the year ended December 31, 2015. After taking the impact of the liquidation preference of the preferred shares into consideration, the earnings per common share diluted for the year ended December 31, 2016 was $0.19 versus earnings per common share diluted of $1.13 for the year ended December 31, 2015.
The following chart illustrates Atlas'Atlas’ potential dilutive common shares for the years ended December 31, 2016 and 2015:
|
| | | | |
| Year Ended December 31, | 2016 | 2015 |
| Basic weighted average common shares outstanding | 12,045,519 |
| 11,975,579 |
|
| Dilutive potential ordinary shares: | | |
| Dilutive stock options | 177,364 |
| 186,656 |
|
| Dilutive shares upon preferred share conversion | — |
| 573,444 |
|
| Diluted weighted average common shares outstanding | 12,222,883 |
| 12,735,679 |
|
The effects of convertible instruments are excluded from the computation of earnings per common share diluted in periods in which the effect would be anti-dilutive. Convertible preferred shares are anti-dilutive when the amount of dividend declared or accumulated in the current period per common share obtainable upon conversion exceeds earnings per common share basic.
For the year ended December 31, 2016, all exercisable stock options were deemed to be dilutive and all of the convertible preferred shares were deemed to be anti-dilutive. The potentially dilutive impact for the convertible preferred stock excluded from the calculation due to anti-dilution is 441,357 common shares for the year ended December 31, 2016. For the year ended December 31, 2015, all of the convertible preferred shares and all exercisable stock options were deemed to be dilutive.
Year ended December 31, 2015 compared to year endedDecember 31, 2014:
Gross Premium Written
The following table summarizes gross premium written by line of business.
| Gross Premium Written by Line of Business ($ in '000s) |
| | | | | | | | |
| Year Ended December 31, | 2015 | 2014 | % Change |
| Commercial automobile | $ | 207,767 |
| $ | 119,539 |
| 73.8 | % |
| Surety | 177 |
| 2,959 |
| (94.0 | )% |
| Other | 1,342 |
| (66 | ) | (2133.3 | )% |
| Total | $ | 209,286 |
| $ | 122,432 |
| 70.9 | % |
For the year ended December 31, 2015, gross premium written was $209.3 million compared to $122.4 million for the year ended December 31, 2014, representing a 70.9% increase. Global Liberty accounted for $39.8 million or 45.6% of this increase of gross premium written. Total gross premium written related to the excess taxi program was $12.4 million and $13.0 million for the years ended December 31, 2015 and 2014, respectively, and is included in the "commercial automobile" line of business.
For the year ended December 31, 2015, gross premium written from commercial automobile was $207.8 million, representing a 73.8% increase relative to the year ended December 31, 2014. This substantial increase is primarily the result of the planned expansion of the commercial auto business. Excluding Global Liberty, we wrote $66.2 million and $44.8 million of new gross premium written business for the years ended December 31, 2015 and 2014, respectively. With respect to our traditional commercial automobile, which excludes excess taxi, gross premium written was $195.4 million, an increase of 83.4% versus the year ended December 31, 2014. As a percentage of the Insurance Subsidiaries’ overall book of business, commercial auto gross premium written represented 99.3% of gross, and 99.4% of net, premium written for the year ended December 31, 2015 compared to 97.6% and 99.6%, respectively, during the year ended December 31, 2014.
Geographic Concentration
| Gross Premium Written by State ($ in '000s) |
| | | | | | | | | | | |
| Year Ended December 31, | 2015 | | 2014 |
| New York | $ | 61,331 |
| 29.3 | % | | $ | 28,977 |
| 23.7 | % |
| California | 24,592 |
| 11.8 | % | | 9,417 |
| 7.7 | % |
| Michigan | 12,178 |
| 5.8 | % | | 10,104 |
| 8.3 | % |
| Louisiana | 11,884 |
| 5.7 | % | | 6,053 |
| 4.9 | % |
| Illinois | 11,741 |
| 5.6 | % | | 12,947 |
| 10.6 | % |
| Minnesota | 11,178 |
| 5.3 | % | | 6,770 |
| 5.5 | % |
| Texas | 9,462 |
| 4.5 | % | | 4,702 |
| 3.8 | % |
| Virginia | 7,134 |
| 3.4 | % | | 3,865 |
| 3.2 | % |
| Ohio | 6,124 |
| 2.9 | % | | 4,995 |
| 4.1 | % |
| Nevada | 4,536 |
| 2.2 | % | | 1,543 |
| 1.3 | % |
| Other | 49,126 |
| 23.5 | % | | 33,059 |
| 26.9 | % |
| Total | $ | 209,286 |
| 100.0 | % | | $ | 122,432 |
| 100.0 | % |
As illustrated by the table above, 29.3% of Atlas’ gross premium written for the year ended December 31, 2015 came from New York and 58.2% came from the five states currently producing the most premium volume, as compared to 55.8% for the year ended December 31, 2014. Our commitment to expanding geographically resulted in 29 states with more than $1 million in written premium in 2015 compared to 23 in 2014.
Ceded Premium Written
Ceded premium written is equal to premium ceded under the terms of Atlas’ in-force reinsurance treaties. The percentage of premium ceded is driven by the business mix within our total premium base. From the period of April 1, 2014 to March 31, 2015, the Quota Share's cession rate was 5%. We increased this percentage to 15% effective April 1, 2015. As a result of the Quota Share, the acquisition of Global Liberty and overall gross premium growth, we saw our ceded premium written increase 259.7% to $39.6 million for the year ended December 31, 2015 compared with $11.0 million for the year ended December 31, 2014. Excluding the Quota Share and Global Quota Share, ceded premiums written were $10.5 million and $4.0 million for the years ended December 31, 2015 and 2014, respectively.
Net Premium Written
Net premium written is equal to gross premium written less the ceded premium written under the terms of Atlas’ in-force reinsurance treaties. Net premium written increased 52.3% to $169.7 million for the year ended December 31, 2015 compared with $111.4 million for the year ended December 31, 2014. These changes are attributed to the combined effects of the reasons cited in the ‘Gross Premium Written’ and ‘Ceded Premium Written’ sections above.
Net Premium Earned
Premiums are earned ratably over the term of the underlying policy. Net premium earned was $152.1 million for the year ended December 31, 2015, a 55.0% increase compared with $98.1 million for the year ended December 31, 2014. The increase in net premiums earned is attributable to the combined effects of the reasons cited in the ‘Gross Premium Written’ and ‘Ceded Premium Written’ sections above.
Net Claims Incurred
The loss ratio relating to the net claims incurred for the year ended December 31, 2015 was 59.2% compared to 62.3% for the year ended December 31, 2014. The loss ratio improvement relative to the prior year was primarily the result of Atlas' core commercial auto program, creating a 1.2% decrease in loss ratio for the year ended December 31, 2015. Atlas experienced $166,000 in unfavorable prior year development for the year ended December 31, 2015. Unfavorable prior accident year development on non-core lines and assigned risk pools was $870,000 for the year ended December 31, 2015. This increase was offset by favorable prior accident year development of $475,000 and $230,000 on our core lines and pre-acquisition Global Liberty claims reserves, respectively. This favorable development on our core lines was attributable to our traditional taxi and excess taxi products.
Acquisition Costs and Other Underwriting Expenses
Acquisition costs represent commissions and taxes incurred on net premium earned offset by ceding commission on business reinsured by the Quota Share. Acquisition costs were $18.6 million for the year ended December 31, 2015, or 12.2% of net premium earned, as compared to 14.3% for the year ended December 31, 2014. On a pro-forma basis, without the effect of the Quota Share, the acquisition costs would have been 14.7% for the year ended December 31, 2015, as compared to 14.6% for the year ended December 31, 2014.
The other underwriting expense ratio (including share-based compensation expenses and expenses incurred related to acquisitions and stock purchase agreements) was 16.8% for the year ended December 31, 2015 compared to 14.8% for the year ended December 31, 2014. This increase in the ratio was primarily due the effects of the Quota Share. On a pro-forma basis, without the effect of the Quota Share, the other underwriting costs would have been 14.9% for the year ended December 31, 2015, as compared to 14.7% for the year ended December 31, 2014.
Combined Ratio
Atlas' combined ratio for the year ended December 31, 2015 was 88.2%, compared to 91.4% for the year ended December 31, 2014. The change in underwriting profitability is attributable to the factors described in the 'Net Premium Earned', ‘Net Claims Incurred’, ‘Acquisition Costs and Other Underwriting Expenses’ sections above.
The table below indicates the impact of the Quota Share on various components of the combined ratio for the years ended December 31, 2015 and 2014:
|
| | | | | | | | | | |
| ($ in '000s, percentages to net earned premiums) | |
| Year Ended December 31, | 2015 | 2014 |
| Gross of Quota Share: | Amount | % | Amount | % |
| Net premiums earned | $ | 170,737 |
| 100.0 | % | $ | 99,223 |
| 100.0 | % |
| Net claims incurred | 99,394 |
| 58.2 | % | 61,629 |
| 62.1 | % |
| Acquisition costs | 25,093 |
| 14.7 | % | 14,447 |
| 14.6 | % |
Other insurance general and administrative expenses1 | 21,971 |
| 12.9 | % | 12,393 |
| 12.5 | % |
Expenses incurred related to acquisitions and stock purchase agreements2 | 1,941 |
| 1.1 | % | 694 |
| 0.7 | % |
| Share-based compensation expense | 1,613 |
| 0.9 | % | 1,470 |
| 1.5 | % |
| Total underwriting profit and combined ratio | $ | 20,725 |
| 87.8 | % | $ | 8,590 |
| 91.4 | % |
| | | | | |
| Net of Quota Share: | | | | |
| Net premiums earned | $ | 152,064 |
| 100.0 | % | $ | 98,124 |
| 100.0 | % |
| Net claims incurred | 89,994 |
| 59.2 | % | 61,078 |
| 62.3 | % |
| Acquisition costs | 18,592 |
| 12.2 | % | 14,048 |
| 14.3 | % |
Other insurance general and administrative expenses1 | 21,971 |
| 14.4 | % | 12,393 |
| 12.6 | % |
Expenses incurred related to acquisitions and stock purchase agreements2 | 1,941 |
| 1.3 | % | 694 |
| 0.7 | % |
| Share-based compensation expense | 1,613 |
| 1.1 | % | 1,470 |
| 1.5 | % |
| Total underwriting profit and combined ratio | $ | 17,953 |
| 88.2 | % | $ | 8,441 |
| 91.4 | % |
1 - For 2015, we restated our presentation for amortization of loan costs from other underwriting expense to interest expense in accordance with the Company's adoption of Accounting Standards Update 2015-03. The restatement decreased other insurance general and administrative expense and increased the total underwriting profit by $56,000. The restatement had a negligible impact on the other insurance general and administrative expense ratio and the combined ratio for the year ended December 31, 2015. For 2015, we combined our presentation of amortization of intangible assets and other insurance general and administrative expenses.
2 - For 2015 and 2014, we reclassified our presentation for costs related to acquisition and stock purchase agreements from non-operating expenses to other underwriting expenses. The reclassification decreased both gross and net total underwriting profit by $1.9 million and $694,000, respectively, increased the gross combined ratio by 1.1% and 0.7%, respectively, and increased the net combined ratio by 1.3% and 0.7%, respectively, for the years ended December 31, 2015 and 2014.
Net Investment Income
Net investment income, net of investment expenses, increased by 27.8% to $4.0 million for the year ended December 31, 2015, compared to $3.1 million for the year ended December 31, 2014. These amounts are primarily comprised of interest income. This increase was primarily due to higher return on certain securities in our investment portfolio. The gross yield on our fixed income securities was 2.2% for each of the years ended December 31, 2015 and 2014. The gross yield on our cash and cash equivalents was 0.1% for each of the years ended December 31, 2015 and 2014. For the year ended December 31, 2015, equity method investments and collateral loans generated investment income of $1.3 million, compared to investment income of $693,000 for the year ended December 31, 2014. The increase resulted from favorable changes to the equity in investees.
Net Realized Investment Gains
Net realized investment gains for the year ended December 31, 2015 were $455,000 compared to $382,000 for the year ended December 31, 2014. This increase resulted primarily from gains on the sale of fixed income securities under favorable market conditions offset by losses on common stock and real estate sold in Alabama.
Other Income
Atlas recorded other income for the year ended December 31, 2015 of $356,000 compared to other income of $2,000 for the year ended December 31, 2014. The increase in other income was mostly fee income generated by our premium finance companies.
Expenses Related to Acquisitions and Stock Purchase Agreements
For the year ended December 31, 2015, Atlas recognized total expenses of $1.9 million related to the acquisition of Anchor and pursuant to the contingent adjustments relative to the Gateway stock purchase agreement. The Anchor costs of $999,000 were incurred to effect the business combination and included legal fees, advisory services, accounting fees, and internal general and administrative costs. The Gateway expense of $942,000 related to the terms of the Gateway stock purchase agreement and the issuance of preferred shares pursuant to the terms of such agreement.
For the year ended year ended December 31, 2014, Atlas recognized $694,000 of expenses related to the acquisition of Anchor.
Income before Income Taxes
Atlas generated pre-tax income of $22.0 million for the year ended December 31, 2015 compared to pre-tax income of $11.9 million for year ended December 31, 2014. The causes of these changes are attributed to the combined effects of the reasons cited in the 'Net Premium Earned', 'Net Claims Incurred', 'Acquisition Costs and Other Underwriting Expenses', 'Net Investment Income', 'Net Realized Investment Gains', and 'Other Income' sections above.
Income Tax Expense (Benefit)
Atlas recognized $7.6 million of tax expense for the year ended December 31, 2015 and recognized $5.8 million of tax benefit for the year ended December 31, 2014. The Company was able to reverse its deferred tax asset valuation allowance to offset substantially all current income tax expense for the year ended December 31, 2014. The following table reconciles the U.S. statutory marginal income tax rate of 35.0% and 34.0% to the effective tax rate for the years ended December 31, 2015 and 2014, respectively:
| Tax Rate Reconciliation ($ in '000s) |
| | | | | | | | | | | | | |
| Year Ended December 31, | 2015 | | 2014 |
| | Amount | | % | | Amount | | % |
| Provision for taxes at U.S. statutory marginal income tax rate | $ | 7,716 |
| | 35.0 | % | | $ | 4,058 |
| | 34.0 | % |
| Provision for deferred tax assets deemed unrealizable (valuation allowance) | — |
| | — | % | | (9,446 | ) | | (79.1 | )% |
| Nondeductible expenses | 124 |
| | 0.6 | % | | 136 |
| | 1.1 | % |
| Tax-exempt income | (89 | ) | | (0.4 | )% | | — |
| | — | % |
| State tax (net of federal benefit) | 118 |
| | 0.5 | % | | 11 |
| | 0.1 | % |
| Tax net operating loss limitation write-down (excluding valuation allowance) | — |
| | — | % | | (519 | ) | | (4.3 | )% |
| Nondeductible acquisition accounting adjustment | 329 |
| | 1.5 | % | | — |
| | — | % |
| Change in statutory tax rate | (471 | ) | | (2.1 | )% | | — |
| | — | % |
| Other | (111 | ) | | (0.6 | )% | | (7 | ) | | (0.1 | )% |
| Provision for income taxes for continuing operations | $ | 7,616 |
| | 34.5 | % | | $ | (5,767 | ) | | (48.3 | )% |
Upon the transaction forming Atlas on December 31, 2010, a yearly limitation as required by IRC Section 382 that applies to changes in ownership on the future utilization of Atlas’ net operating loss carryforwards was calculated. The Insurance Subsidiaries’ prior parent retained those tax assets previously attributed to the Insurance Subsidiaries that could not be utilized by Atlas as a result of this limitation. As a result, Atlas’ ability to recognize future tax benefits associated with a portion of its deferred tax assets generated during prior years have been permanently limited to the amount determined under IRC Section 382. The result is a maximum expected net deferred tax asset, which Atlas has available after the merger and believed more-likely-than-not to be utilized in the future, after consideration of valuation allowance.
As part of our on-going analysis of deferred tax assets, management has assessed both positive and negative evidence according to guidance provided by the FASB. Based on this guidance we have determined that it is more likely than not that the Company will be able to fully utilize its DTAs as a result of the significant positive evidence and the lack of negative evidence. As such we have evaluated our valuation allowance and determined that all DTAs net of DTLs are available to offset income in all future periods and no valuation allowance is needed. This conclusion is based upon management’s evaluation of the new information it has analyzed and not from management’s new evaluation or new interpretation of information that was available in a previous financial reporting period. Accordingly, the Company recorded a reversal of its deferred tax asset valuation allowance of $9.4 million for the year ended December 31, 2014 commensurate with this conclusion.
Net Income and Earnings per Common Share
Atlas' net income was $14.4 million for the year ended December 31, 2015 versus net income of $17.7 million for the year ended December 31, 2014. After taking the impact of the liquidation preference of the preferred shares into consideration, the earnings per common share diluted for the year ended December 31, 2015 was $1.13 versus earnings per common share diluted of $1.56 for the year ended December 31, 2014.
The following chart illustrates Atlas' potential dilutive common shares for the years ended December 31, 2015 and 2014:
|
| | | | |
| Year Ended December 31, | 2015 | 2014 |
| Basic weighted average common shares outstanding | 11,975,579 |
| 10,937,181 |
|
| Dilutive potential ordinary shares: | | |
| Dilutive stock options | 186,656 |
| 150,407 |
|
| Dilutive shares upon preferred share conversion | 573,444 |
| 254,000 |
|
| Diluted weighted average common shares outstanding | 12,735,679 |
| 11,341,588 |
|
For the years ended December 31, 2015 and 2014, all of the convertible preferred shares and all exercisable stock options were deemed to be dilutive.
IV. FINANCIAL CONDITION
| | | Consolidated Statements of Financial Condition | | | | | | |
| | | | | | | |
| ($ in '000s, except for share and per share data) | December 31,
2016 | | December 31,
2015 | |
| ($ in ‘000s, except for share and per share data) | | December 31,
2017 | | December 31,
2016 |
| Assets | | | | | | |
| Investments, available for sale | | | | | | |
| Fixed income securities, at fair value (amortized cost $157,451and $185,455) | $ | 156,487 |
| | $ | 183,773 |
| |
| Equity securities, at fair value (cost $5,598 and $4,147) | 6,223 |
| | 4,240 |
| |
| Fixed income securities, at fair value (amortized cost $158,411 and $157,451) | | $ | 157,984 |
| | $ | 156,487 |
|
| Equity securities, at fair value (cost $7,969 and $5,598) | | 8,446 |
| | 6,223 |
|
| Other investments | 32,181 |
| | 22,937 |
| 31,438 |
| | 32,181 |
|
| Total Investments | 194,891 |
| | 210,950 |
| 197,868 |
| | 194,891 |
|
| Cash and cash equivalents | 29,888 |
| | 22,354 |
| 45,615 |
| | 29,888 |
|
| Accrued investment income | 1,228 |
| | 1,036 |
| 1,248 |
| | 1,228 |
|
| Premiums receivable (net of allowance of $2,366 and $846) | 77,386 |
| | 82,529 |
| |
| Premiums receivable (net of allowance of $3,418 and $2,366) | | 79,664 |
| | 77,386 |
|
| Reinsurance recoverables on amounts paid | 7,786 |
| | 3,277 |
| 7,982 |
| | 7,786 |
|
| Reinsurance recoverables on amounts unpaid | 35,370 |
| | 29,399 |
| 53,402 |
| | 35,370 |
|
| Prepaid reinsurance premiums | 13,372 |
| | 17,412 |
| 12,878 |
| | 13,372 |
|
| Deferred policy acquisition costs | 13,222 |
| | 10,235 |
| 14,797 |
| | 13,222 |
|
| Deferred tax asset, net | 18,498 |
| | 17,166 |
| 16,985 |
| | 18,498 |
|
| Goodwill | 2,726 |
| | 2,726 |
| 2,726 |
| | 2,726 |
|
| Intangible assets, net | 4,535 |
| | 4,925 |
| 4,145 |
| | 4,535 |
|
| Property and equipment, net | 11,770 |
| | 2,589 |
| 24,439 |
| | 11,770 |
|
| Other assets | 12,905 |
| | 6,694 |
| 20,754 |
| | 12,905 |
|
| Total Assets | $ | 423,577 |
| | $ | 411,292 |
| $ | 482,503 |
| | $ | 423,577 |
|
| | | | | | | |
| Liabilities | | | | | | |
| Claims liabilities | $ | 139,004 |
| | $ | 127,011 |
| $ | 211,648 |
| | $ | 139,004 |
|
| Unearned premiums | 113,171 |
| | 108,202 |
| |
| Unearned premium reserves | | 128,043 |
| | 113,171 |
|
| Due to reinsurers | 8,369 |
| | 10,781 |
| 8,411 |
| | 8,369 |
|
| Notes payable, net | 19,187 |
| | 17,219 |
| 24,031 |
| | 19,187 |
|
| Other liabilities and accrued expenses | 16,504 |
| | 18,457 |
| 19,725 |
| | 16,504 |
|
| Total Liabilities | $ | 296,235 |
| | $ | 281,670 |
| $ | 391,858 |
| | $ | 296,235 |
|
| | | | | | | |
| Shareholders’ Equity | | | | |
| Preferred shares, $0.001 par value, 100,000,000 shares authorized, shares issued and outstanding: December 31, 2016 - 0 and December 31, 2015 - 6,940,500. Liquidation value $1.00 per share | $ | — |
| | $ | 6,941 |
| |
| Ordinary voting common shares, $0.003 par value, 266,666,667 shares authorized, shares issued and outstanding: December 31, 2016 - 11,895,104 and December 31, 2015 - 11,883,025 | 36 |
| | 36 |
| |
| Restricted voting common shares, $0.003 par value, 33,333,334 shares authorized, shares issued and outstanding: December 31, 2016 - 128,191 and December 31, 2015 - 132,863 | — |
| | — |
| |
| Shareholders' Equity | | | | |
| Ordinary voting common shares, $0.003 par value, 266,666,667 shares authorized, shares issued and outstanding: December 31, 2017 - 12,164,041 and December 31, 2016 - 11,895,104 | | $ | 36 |
| | $ | 36 |
|
| Restricted voting common shares, $0.003 par value, 33,333,334 shares authorized, shares issued and outstanding: December 31, 2017 - 0 and December 31, 2016 - 128,191 | | — |
| | — |
|
| Additional paid-in capital | 199,244 |
| | 198,041 |
| 201,105 |
| | 199,244 |
|
| Retained deficit | (71,718 | ) | | (74,364 | ) | (110,535 | ) | | (71,718 | ) |
| Accumulated other comprehensive loss, net of tax | (220 | ) | | (1,032 | ) | |
| Total Shareholders’ Equity | $ | 127,342 |
| | $ | 129,622 |
| |
| Total Liabilities and Shareholders’ Equity | $ | 423,577 |
| | $ | 411,292 |
| |
| Accumulated other comprehensive income (loss), net of tax | | 39 |
| | (220 | ) |
| Total Shareholders' Equity | | $ | 90,645 |
| | $ | 127,342 |
|
| Total Liabilities and Shareholders' Equity | | $ | 482,503 |
| | $ | 423,577 |
|
Investments
Overview and Strategy
Atlas aligns its securities portfolio to support the liabilities and operating cash needs of the Insurance Subsidiaries, to preserve capital and to generate investment returns. Atlas invests predominantly in corporate and government bonds with a portion of the portfolio in relatively short durations that correlate with the payout patterns of Atlas’ claims liabilities. Atlas also invests opportunistically in selective direct investments with favorable return attributes. A third-party investment management firm manages Atlas’ investment portfolio pursuant to the Company’s investment policies and guidelines as approved by its Board of Directors. Atlas monitors the third-party investment manager’s performance and its compliance with both its mandate and Atlas’ investment policies and guidelines.
Atlas’ investment guidelines stress the preservation of capital, market liquidity to support payment of liabilities and the diversification of risk. With respect to fixed income securities, Atlas generally purchases securities with the expectation of holding them to their maturities; however, the securities are available for sale if liquidity needs arise. To the extent that interest rates increase or decrease, unrealized gains or losses may result. We believe that our investment philosophy and approach significantly mitigate the likelihood of such gains or losses being realized.
Portfolio Composition
Atlas held securities with a fair value of $166.4 million and $162.7 million as of December 31, 2017 and December 31, 2016, respectively, which were primarily comprised of fixed income securities. The securities held by the Insurance Subsidiaries must comply with applicable regulations that prescribe the type, quality and concentration of securities. These regulations in the various jurisdictions in which the Insurance Subsidiaries are domiciled permit investments in government, state, municipal and corporate bonds, preferred and common equities, and other high quality investments, within specified limits and subject to certain qualifications.
The fair value for Atlas’ investments in fixed income securities and equities by type and sector are as follows:
| Fair Value of securities portfolio ($ in '000s) | |
| Fair Value of securities portfolio ($ in ‘000s) | | Fair Value of securities portfolio ($ in ‘000s) |
| | As of December 31, | As of December 31, | 2016 | 2015 | As of December 31, | 2017 | 2016 |
| Fixed Income Securities: | Fixed Income Securities: | | Fixed Income Securities: | |
| | U.S. Treasury and other U.S. government obligations | $ | 22,474 |
| $ | 23,483 |
| U.S. Treasury and other U.S. government obligations | $ | 21,186 |
| $ | 22,474 |
|
| | States, municipalities and political subdivisions | 10,470 |
| 22,154 |
| States, municipalities and political subdivisions | 13,243 |
| 10,470 |
|
| | Corporate | | Corporate | |
| | | Banking/financial services | 22,852 |
| 21,914 |
| | Banking/financial services | 21,382 |
| 22,852 |
|
| | | Consumer goods | 8,593 |
| 7,735 |
| | Consumer goods | 9,679 |
| 8,593 |
|
| | | Capital goods | 7,873 |
| 15,095 |
| | Capital goods | 7,992 |
| 7,873 |
|
| | | Energy | 3,735 |
| 4,406 |
| | Energy | 7,515 |
| 3,735 |
|
| | | Telecommunications/utilities | 7,617 |
| 11,875 |
| | Telecommunications/utilities | 11,215 |
| 7,617 |
|
| | | Health care | 1,357 |
| 3,021 |
| | Health care | 1,059 |
| 1,357 |
|
| | Total Corporate | 52,027 |
| 64,046 |
| Total Corporate | 58,842 |
| 52,027 |
|
| | Mortgage Backed | | Mortgage Backed | |
| | | Mortgage backed - agency | 34,014 |
| 34,673 |
| | Mortgage backed - agency | 30,613 |
| 34,014 |
|
| | | Mortgage backed - commercial | 21,158 |
| 19,875 |
| | Mortgage backed - commercial | 22,587 |
| 21,158 |
|
| | Total Mortgage Backed | 55,172 |
| 54,548 |
| Total Mortgage Backed | 53,200 |
| 55,172 |
|
| | Other asset backed | 16,344 |
| 19,542 |
| Other asset backed | 11,513 |
| 16,344 |
|
| Total Fixed Income Securities | Total Fixed Income Securities | $ | 156,487 |
| $ | 183,773 |
| Total Fixed Income Securities | $ | 157,984 |
| $ | 156,487 |
|
| Equities | Equities | 6,223 |
| 4,240 |
| Equities | 8,446 |
| 6,223 |
|
| Totals | Totals | $ | 162,710 |
| $ | 188,013 |
| Totals | $ | 166,430 |
| $ | 162,710 |
|
TotalFor the year ended December 31, 2017, total investment holdings declinedincreased to $197.9 million from $194.9 million due toas of December 31, 2016. This increase resulted from net purchases of fixed income securities and equities, positive changes in the salemarket values of fixed income securities and equities and increases in Atlas’ share of the net book value of equity method investments and the returnoffset by net sales of capital to support operations and to purchase the building and land for the Company's new headquarters in Schaumburg, Illinois.equity method investments.
Most of the Company’s holdings are impacted by the U.S economy, and we anticipate a very moderate impact from the effect of global economic conditions on the domestic economy. Global economic conditions may create brief periods of market volatility, but we do not believe it will alter the fundamental outlook of the Company’s investment holdings.
Other Investments
Atlas'Atlas’ other investments are comprised of collateral loans and various limited partnerships that invest in income-producing real estate, equities, or insurance linked securities. Atlas accounts for these limited partnership investments using the equity method of accounting. As of December 31, 2016,2017, the carrying values of these other investments were approximately $32.2$31.4 million versus approximately $22.9$32.2 million as of December 31, 2015.2016. The carrying values of the equity method limited partnerships were $24.9$25.3 million and $22.8$24.9 million as of December 31, 20162017 and December 31, 2015,2016, respectively. The increase in the carrying value of the limited partnerships was primarily due to the purchase of investments and favorable changes in Atlas’ share of the net book value of certain limited partnerships offset by the return of capital. The carrying value of these investments is Atlas'Atlas’ share of the net book value for each limited partnership, an amount that approximates fair value. Atlas receives payments on a routine basis that approximate the income earned on one of the limited partnerships that invest in income-producing real estate. The carrying values of the collateral loans were $7.2$6.2 million and $98,000$7.2 million as of December 31, 20162017 and December 31, 2015,2016, respectively. The increase in the carrying value of the collateral loansdecrease was due to the investment in threepartial return of principal of one collateral loan offset by additional loans acquired in 2016.2017.
The following table summarizes investments in equity method investments by investment type as of December 31, 20162017 and December 31, 2015:2016:
| | | ($ in '000s) | Unfunded Commitments | Carrying Value | |
| ($ in ‘000s) | | Unfunded Commitments | Carrying Value |
| As of December 31, | 2016 | 2015 | 2017 | 2016 |
| Real estate | $ | 2,497 |
| $ | 10,514 |
| $ | 10,202 |
| |
Real estate1 | | $ | 2,842 |
| $ | 10,660 |
| $ | 10,797 |
|
| Insurance linked securities | — |
| 9,178 |
| 8,747 |
| — |
| 9,073 |
| 9,178 |
|
| Activist hedge funds | — |
| 4,336 |
| 3,685 |
| — |
| 4,367 |
| 4,336 |
|
| Venture capital | 300 |
| 906 |
| 205 |
| |
Venture capital1 | | 4,150 |
| 853 |
| 623 |
|
| Other joint venture | | — |
| 325 |
| — |
|
| Total Equity Method Investments | $ | 2,797 |
| $ | 24,934 |
| $ | 22,839 |
| $ | 6,992 |
| $ | 25,278 |
| $ | 24,934 |
|
1- We recategorized the carrying value of one limited partnership that was valued at $283,000 as of December 31, 2016 from ‘Venture capital’ to ‘Real estate’ based on its operations.
Liquidity and Cash Flow Risk
The following table summarizes the amortized cost and fair value by contractual maturities of the fixed income securities portfolio, excluding cash and cash equivalents, at the dates indicated.indicated:
| Amortized Cost and Fair Value of Fixed Income Securities by Contractual Maturity Date ($ in '000s) | |
| Amortized Cost and Fair Value of Fixed Income Securities by Contractual Maturity Date ($ in ‘000s) | | Amortized Cost and Fair Value of Fixed Income Securities by Contractual Maturity Date ($ in ‘000s) |
| | As of December 31, | 2016 | | 2015 | 2017 | | 2016 |
| | Amortized Cost | Fair Value | % | | Amortized Cost | Fair Value | % | Amortized Cost | Fair Value | % | | Amortized Cost | Fair Value | % |
| Due in less than one year | $ | 8,729 |
| $ | 8,732 |
| 5.6 | % | | $ | 11,494 |
| $ | 11,518 |
| 6.3 | % | $ | 11,149 |
| $ | 11,141 |
| 7.0 | % | | $ | 8,729 |
| $ | 8,732 |
| 5.6 | % |
| Due in one through five years | 43,772 |
| 43,808 |
| 28.0 | % | | 55,371 |
| 54,752 |
| 29.8 | % | 33,941 |
| 33,857 |
| 21.4 | % | | 43,772 |
| 43,808 |
| 28.0 | % |
| Due after five through ten years | 27,618 |
| 27,263 |
| 17.4 | % | | 35,462 |
| 35,148 |
| 19.1 | % | 41,542 |
| 41,538 |
| 26.3 | % | | 27,618 |
| 27,263 |
| 17.4 | % |
| Due after ten years | 5,389 |
| 5,168 |
| 3.3 | % | | 8,645 |
| 8,265 |
| 4.5 | % | 6,614 |
| 6,735 |
| 4.3 | % | | 5,389 |
| 5,168 |
| 3.3 | % |
| Total contractual maturity | 85,508 |
| 84,971 |
| 54.3 | % | | 110,972 |
| 109,683 |
| 59.7 | % | 93,246 |
| 93,271 |
| 59.0 | % | | 85,508 |
| 84,971 |
| 54.3 | % |
| Total mortgage and asset backed | 71,943 |
| 71,516 |
| 45.7 | % | | 74,483 |
| 74,090 |
| 40.3 | % | 65,165 |
| 64,713 |
| 41.0 | % | | 71,943 |
| 71,516 |
| 45.7 | % |
| Total | $ | 157,451 |
| $ | 156,487 |
| 100.0 | % | | $ | 185,455 |
| $ | 183,773 |
| 100.0 | % | $ | 158,411 |
| $ | 157,984 |
| 100.0 | % | | $ | 157,451 |
| $ | 156,487 |
| 100.0 | % |
As of December 31, 2016, 33.6%2017, 28.4% of the fixed income securities, including treasury bills, bankers’ acceptances, government bonds and corporate bonds had contractual maturities of five years or less, compared to 36.1%33.6% as of December 31, 2015.2016. Actual maturities may differ from contractual maturities, because certain issuers have the right to call or prepay obligations with or without call or prepayment penalties. Atlas holds cash and high grade short-term assets, which, along with fixed income security maturities, management believes are sufficient for the payment of claims on a timely basis. In the event that additional cash is required to meet obligations to policyholders, Atlas believes that a high quality securities portfolio provides us with sufficient liquidity. As of December 31, 2016,2017, the fixed income securities had a weighted average life of 4.14.9 years and a duration of 3.43.9 years, compared to a weighted average life of 4.1 years and a duration of 3.33.4 years, as of December 31, 2015.2016. The increase in weighted average life of the fixed income securities portfolio was the result of the reinvestment of proceeds from the maturity and sales of fixed income securities with longer average lives. Changes in interest rates may have a modest market value impact on the Atlas portfolio relative to longer duration portfolios. Atlas can and typically does hold bonds to maturity by matching duration with the anticipated liquidity needs.
The debt-to-equity ratio is the sum of the Company'sCompany’s long-term debt and interest payable divided by total shareholders'shareholders’ equity. The Company'sCompany’s debt-to-equity ratio as of December 31, 20162017 and December 31, 20152016 was 15.2%26.8% and 14.9%15.2%, respectively. The increase is primarily the result of the redemptionincrease in notes payable and cancellation of preferred sharesinterest payable and additional draws on our line of credit with Fifth Third Bank.the decrease in shareholders’ equity. Refer to the 'Shareholders' Equity'‘Shareholders’ Equity’ and 'Liquidity‘Liquidity and Capital Resources'Resources’ subsections of the 'Financial Condition'‘Financial Condition’ section for further information.
Credit Risk
Credit risk is defined as the risk of financial loss due to failure of the other party to a financial instrument to discharge an obligation. Atlas is exposed to credit risk principally through its investments and balances receivable from policyholders, agents and reinsurers. It monitors concentration and credit quality risk through policies designed to limit and monitor its exposure to individual issuers or related groups (with the exception of U.S. government bonds) as well as through ongoing review of the credit ratings of issuers in the securities portfolio. Credit exposure to any one individual policyholder is not material. The Company'sCompany’s insurance policies, however, are distributed by agents who may manage cash collection on its behalf pursuant to the terms of their agency agreement. Atlas has protocols to evaluate the financial condition of its reinsurers and monitors concentrations of credit risk arising from similar geographic regions, activities, or economic characteristics of the reinsurers to minimize its exposure to significant losses from reinsurers’ insolvency.
As of December 31, 2016, Atlas'2017, Atlas’ allowance for bad debt was $2.4$3.4 million, compared to $846,000$2.4 million as of December 31, 2015.2016. This increase in the allowance for bad debt was related to the re-estimation of the allowance, and the reserving for specificwhich is based on premium receivable accounts past due.growth.
The following table summarizes the composition of the fair value of the fixed income securities portfolio, excluding cash and cash equivalents, as of the dates indicated, by ratings assigned by Fitch, S&P or Moody’s Investors Service. The fixed income securities portfolio consists of predominantly investment grade securities in corporate and government bonds with 99.2%99.3% rated ‘BBB’ or better as of December 31, 20162017 compared to 99.3%99.2% as of December 31, 2015.2016.
| Credit Ratings of Fixed Income Securities Portfolio ($ in '000s) |
| | | | | | | | | | | |
| As of December 31, | 2016 | | 2015 |
| | Amount | % of Total | | Amount1 | % of Total |
AAA/Aaa1 | $ | 44,521 |
| 28.5 | % | | $ | 44,110 |
| 24.0 | % |
AA/Aa1 | 64,324 |
| 41.1 | % | | 83,116 |
| 45.2 | % |
| A/A | 23,427 |
| 15.0 | % | | 28,765 |
| 15.7 | % |
| BBB/Baa | 22,886 |
| 14.6 | % | | 26,512 |
| 14.4 | % |
| BB | 1,114 |
| 0.7 | % | | 1,270 |
| 0.7 | % |
| B | 215 |
| 0.1 | % | | — |
| — | % |
| Total Fixed Income Securities | $ | 156,487 |
| 100.0 | % | | $ | 183,773 |
| 100.0 | % |
1 - In 2016, our external investment portfolio manager switched rating agencies for U.S. Treasury, agency and mortgage backed securities from Fitch or Moody's 'AAA' to S&P 'AA.' As a result, we have restated fair values of these fixed income securities as of December 31, 2015 using the S&P rating for comparative purposes.| Credit Ratings of Fixed Income Securities Portfolio ($ in ‘000s) |
| | | | | | | | | | | |
| As of December 31, | 2017 | | 2016 |
| | Fair Value | % of Total | | Fair Value | % of Total |
| AAA/Aaa | $ | 42,978 |
| 27.2 | % | | $ | 44,521 |
| 28.5 | % |
| AA/Aa | 58,173 |
| 36.8 | % | | 64,324 |
| 41.1 | % |
| A/A | 27,384 |
| 17.3 | % | | 23,427 |
| 15.0 | % |
| BBB/Baa | 28,348 |
| 18.0 | % | | 22,886 |
| 14.6 | % |
| BB | 875 |
| 0.6 | % | | 1,114 |
| 0.7 | % |
| B | 226 |
| 0.1 | % | | 215 |
| 0.1 | % |
| Total Fixed Income Securities | $ | 157,984 |
| 100.0 | % | | $ | 156,487 |
| 100.0 | % |
Other-than-temporary impairment
Atlas recognizes losses on securities for which a decline in market value was deemed to be other-than-temporary.other than temporary. Management performs a quarterly analysis of the securities holdings to determine if declines in market value are other-than-temporary.other than temporary. Atlas did not recognize any charges for securities impairments that were considered other-than-temporaryother than temporary for the years ended December 31, 2017, 2016, 2015, and 2014.2015.
The length of time securities may be held in an unrealized loss position may vary based on the opinion of the appointed investment manager and their respective analyses related to valuation and to the various credit risks that may prevent us from recapturing the principal investment. In cases of securities with a maturity date where the appointed investment manager determines that there is little or no risk of default prior to the maturity of a holding, Atlas would elect to hold the security in an unrealized loss position until the price recovers or the security matures. In situations where facts emerge that might increase the risk associated with recapture of principal, Atlas may elect to sell securities at a loss.
The total fair value of the securities in an unrealized loss position as of December 31, 20162017 was $91.9$108.1 million compared to $123.6$91.9 million as of December 31, 2015.2016. Unrealized losses as of December 31, 2017 were $1.4 million compared to $1.6 million as of December 31, 2016. This decrease wasin unrealized losses resulted primarily driven by the positive changesfrom increases in market value during 2016.values of our fixed income securities (see Note 5, ‘Investments’). Atlas has the ability and intent to hold the securities in an unrealized loss position until their fair value is recovered. Therefore, Atlas does not expect the market value loss position of these investments to be realized in the near term.
Due from Reinsurers and Other Insurers
Atlas purchases reinsurance from third parties in order to reduce its liability on individual risks and its exposure to large claims. Reinsurance is coverage purchased by one insurance company from another for part of the risk originally underwritten by the purchasing (ceding) insurance company. The practice of ceding insurance to reinsurers allows an insurance company to reduce its exposure to claims by size, geographic area, and type of risk or on a particular policy. An effect of ceding insurance is to permit an insurance company to write additional insurance for risks in greater number or in larger amounts than it would otherwise insure independently, based on its statutory capital, risk tolerance and other factors.
Atlas generally purchases reinsurance to limit net exposure to a maximum amount on any one claim of $500,000 with respect to commercial automobile liability claims. Atlas also purchases reinsurance to protect against awards in excess of its policy limits. Atlas continually evaluates and adjusts its reinsurance needs based on business volume, mix, and supply levels. As a result, the Company has entered into the Quota Share with Swiss Re for ASI Pool Subsidiaries.Subsidiaries and the Global Quota Share with Swiss Re for Global Liberty. Under this contract,these contracts, cessions can be increased at our election should we want to utilize it as a means of deleveraging. This facility gives us flexibility in terms of the timing and approach to potential future capital raising activities in light of anticipated increased operating leverage. Global Liberty historically maintained lower reinsurance retention limits. For 2015,Prior to 2016, Global Liberty had a 20% quota share reinsurance with SCOR Re. In 2016, this contract was replaced by the Global Quota Share.
Reinsurance ceded does not relieve Atlas of its ultimate liability to its insured in the event that any reinsurer is unable to meet their obligations under its reinsurance contracts. Therefore, Atlas enters into reinsurance contracts with only those reinsurers deemed to have sufficient financial resources to provide the requested coverage. Reinsurance treaties are generally subject to cancellation by the reinsurers or Atlas on the anniversary date and are subject to renegotiation annually. Atlas regularly evaluates the financial condition of its reinsurers and monitors the concentrations of credit risk to minimize its exposure to significant claims as a result of the insolvency of a reinsurer. Atlas believes that the amounts it has recorded as reinsurance recoverables are appropriately established. Estimating amounts of reinsurance recoverables, however, is subject to various uncertainties, and the amounts ultimately recoverable may vary from amounts currently recorded. Atlas had $43.2$61.4 million recoverable from third party reinsurers (exclusive of amounts prepaid) and other insurers as of December 31, 20162017 as compared to $32.7$43.2 million as of December 31, 2015.2016. The increase in the amount recoverable from third party reinsurers resulted from an increase in case and incurred but not reported (“IBNR”) reserves and ana slight increase in amounts recoverable on paid claims. The increase in amounts recoverable on paid claims is related to the timing of the settlement of the Quota Share balances.
Estimating amounts of reinsurance recoverables is also impacted by the uncertainties involved in the establishment of provisions for unpaid claims and claims adjustment expenses. As underlying reserves potentially develop, the amounts ultimately recoverable may vary from amounts currently recorded. Atlas’ reinsurance recoverables are generally unsecured, with the exception of the new reinsurance agreement established as a condition to close the Gateway acquisition, which is secured by a letter of credit valued at 150% of the claims and claims adjustment expense reserves.unsecured. Atlas regularly evaluates its reinsurers, and the respective amounts recoverable, and an allowance for uncollectible reinsurance is provided for, if needed.
Atlas’ largest reinsurance partners are Great American Insurance Company (“Great American”), a subsidiary of American Financial Group, Inc., General Reinsurance Corporation ("(“Gen Re"Re”), a subsidiary of Berkshire Hathaway, Inc., SCOR Re, a subsidiary of SCOR U.S. Corporation, Swiss Re, a subsidiary of Swiss Reinsurance Company Ltd. and White Rock Insurance (SAC) Ltd. ("(“White Rock"Rock”). Great American has a financial strength rating of A1 from Moody's,Moody’s, Gen Re has a financial strength rating of AA+ from Standard & Poor's,Fitch, SCOR Re has a financial strength rating of Aa3AA- from Moody's,Fitch, Swiss Re has a financial strength rating of Aa3 from Moody's,Moody’s, and White Rock is unrated. The White Rock balances are specifically related to the Gateway workers'Gateway’s run-off workers’ compensation program that was exitedreinsured with White Rock. This reinsurance agreement was terminated during 2013 and are fully secured by a letter of credit and funds held on deposit.2017.
Deferred Tax Asset
| Components of Deferred Tax ($ in '000s) | |
| Components of Deferred Tax ($ in ‘000s) | | Components of Deferred Tax ($ in ‘000s) |
| | As of December 31, | 2016 | 2015 | 2017 | 2016 |
| Deferred tax assets: | | |
| Gross deferred tax assets: | | |
| Losses carried forward | $ | 14,535 |
| $ | 12,656 |
| $ | 13,313 |
| $ | 14,535 |
|
| Unpaid claims liabilities and unearned premiums | 8,546 |
| 8,122 |
| |
| Claims liabilities and unearned premium reserves | | 6,171 |
| 8,546 |
|
| Tax credits | 662 |
| 662 |
| 1,172 |
| 662 |
|
| Investments | — |
| 36 |
| |
| Commissions | 1,269 |
| 1,306 |
| 623 |
| 1,269 |
|
| All other | 2,184 |
| 1,457 |
| |
| Stock compensation | | 602 |
| 1,157 |
|
| Other | | 1,094 |
| 1,027 |
|
| Total gross deferred tax assets | 27,196 |
| 24,239 |
| 22,975 |
| 27,196 |
|
| | | |
| Deferred tax liabilities: | | |
| Gross deferred tax liabilities: | | |
| Deferred policy acquisition costs | 4,628 |
| 3,582 |
| 3,107 |
| 4,628 |
|
| Investments | 475 |
| — |
| 213 |
| 475 |
|
| Fixed assets | 559 |
| 401 |
| 847 |
| 559 |
|
| Intangible assets | 1,328 |
| 1,465 |
| 715 |
| 1,328 |
|
| All other | 1,708 |
| 1,625 |
| |
| Other | | 1,108 |
| 1,708 |
|
| Total gross deferred tax liabilities | 8,698 |
| 7,073 |
| 5,990 |
| 8,698 |
|
| Net deferred tax assets | $ | 18,498 |
| $ | 17,166 |
| $ | 16,985 |
| $ | 18,498 |
|
Based on Atlas’ expectations of future taxable income, its ability to change its investment strategy, as well as reversing gross future tax liabilities, management believes it is more likely than not that Atlas will fully realize the net future tax assets. The Company, therefore, released its remaining valuation allowance as of December 31, 2014.
On July 22, 2013, as a result of shareholder activity, a "triggering event"“triggering event” as determined under IRC Section 382 occurred. As a result, under IRC Section 382, the use of the Company'sCompany’s net operating loss and other carry-forwards generated prior to the “triggering event” will be limited as a result of this "ownership“ownership change” for tax purposes, which is defined as a cumulative change of more than 50% during any three-year period by shareholders owning 5% or greater portions of the Company'sCompany’s shares.
Due to this triggering event, the Company estimates that it will retain total tax effected federal net operating loss carryforwards of approximately $14.5$13.3 million as of December 31, 2016.2017.
Atlas has the following total net operating loss carryforwards as of December 31, 2016:2017:
| Net Operating Loss Carryforward by Expiry ($ in '000s) | |
| Net Operating Loss Carryforward by Expiry ($ in ‘000s) | | Net Operating Loss Carryforward by Expiry ($ in ‘000s) |
| | Year of Occurrence | Year of Expiration | Amount | Year of Expiration | Amount |
| 2001 | 2021 | $ | 5,007 |
| 2021 | $ | 5,007 |
|
| 2002 | 2022 | 4,317 |
| 2022 | 4,317 |
|
| 2006 | 2026 | 7,825 |
| 2026 | 7,825 |
|
| 2007 | 2027 | 5,131 |
| 2027 | 5,131 |
|
| 2008 | 2028 | 1,949 |
| 2028 | 1,949 |
|
| 2009 | 2029 | 1,949 |
| 2029 | 1,949 |
|
| 2010 | 2030 | 1,949 |
| 2030 | 1,949 |
|
| 2011 | 2031 | 4,166 |
| 2031 | 4,166 |
|
| 2012 | 2032 | 9,235 |
| 2032 | 9,236 |
|
| 2015 | 2035 | 1 |
| 2035 | 1 |
|
| 2017 | | 2037 | 21,864 |
|
| Total | | $ | 41,529 |
| | $ | 63,394 |
|
NOLs and other carryforwards generated in 2015 and 2017 are not limited by IRC Section 382.
Buildings and Land
In the fourth quarter of 2016, Atlas purchased a property in Schaumburg, Illinois to serve as the new corporate headquarters to replace the current headquarters when our current office space lease expires in 2017. The building and land were purchased for $9.3 million.
On November 13, 2015, Atlas sold one During the year ended December 31, 2017, the Company purchased furnishings and made improvements to this building. The total cost of its two properties located in Alabamafurnishings and recognized a lossimprovements was approximately $11.3 million. See MD&A,‘Contractual Obligations’ section below, Note 8, ‘Commitments and Contingencies’ and Note 9 ‘Property and Equipment’ for further discussion of $20,000. The remaining property is listed for sale for an amount greater than its carried value.the new corporate headquarters.
Claims Liabilities
The table below shows the amounts of total case reserves and IBNR reserves as of December 31, 20162017 and as of December 31, 2015. The provision for unpaid claims and claims adjustment expenses increased by 9.4% to $139.0 million as of December 31, 2016 compared to $127.0 million as of December 31, 2015. During the year ended December 31, 2016, case reserves increased by 5.4% compared to December 31, 2015, while IBNR reserves increased by 12.0%. The increase in case reserves resulted from management's review of outstanding unpaid personal injury protection claims, particularly in the state of Michigan. The increase in IBNR related primarily to premium growth and updates in the estimated costs on outstanding unpaid claims.
| Provision for Unpaid Claims by Type - Gross of Reinsurance ($ in '000s) |
| | | | | | | | |
| As of December 31, | 2016 | 2015 | YTD% Change |
| Case reserves | $ | 52,132 |
| $ | 49,441 |
| 5.4 | % |
| IBNR | 86,872 |
| 77,570 |
| 12.0 | % |
| Total | $ | 139,004 |
| $ | 127,011 |
| 9.4 | % |
| Provision for Unpaid Claims by Line of Business – Gross of Reinsurance ($ in '000s) |
| | | | | | | | |
| As of December 31, | 2016 | 2015 | YTD% Change |
| Commercial automobile liability | $ | 132,732 |
| $ | 115,950 |
| 14.5 | % |
| Other | 6,272 |
| 11,061 |
| (43.3 | )% |
| Total | $ | 139,004 |
| $ | 127,011 |
| 9.4 | % |
| Provision for Unpaid Claims by Line of Business - Net of Reinsurance Recoverables ($ in '000s) |
| | | | | | | | |
| As of December 31, | 2016 | 2015 | YTD% Change |
| Commercial automobile liability | $ | 101,220 |
| $ | 95,173 |
| 6.4 | % |
| Other | 2,414 |
| 2,439 |
| (1.0 | )% |
| Total | $ | 103,634 |
| $ | 97,612 |
| 6.2 | % |
2016. The other line of business is comprised of Gateway'sour surety program (currently in run off), Gateway’s truck and workers'workers’ compensation programs (currently in run off), American Service'sService’s non-standard personal lines business (currently in run off), Atlas' workers'Atlas’ workers’ compensation related to taxi, other liability, Global Liberty'sLiberty’s homeowners program (currently in run off) and assigned risk pool business. See MD&A, 'Overview'‘Overview’ section for further information regarding these lines of business.
| Provision for Unpaid Claims by Type - Gross of Reinsurance ($ in ‘000s) |
| | | | | | | | |
| As of December 31, | 2017 | 2016 | YTD% Change |
| Case reserves | $ | 62,769 |
| $ | 52,132 |
| 20.4 | % |
| IBNR | 148,879 |
| 86,872 |
| 71.4 | % |
| Total | $ | 211,648 |
| $ | 139,004 |
| 52.3 | % |
| Provision for Unpaid Claims by Line of Business – Gross of Reinsurance ($ in ‘000s) |
| | | | | | | | |
| As of December 31, | 2017 | 2016 | YTD% Change |
| Commercial automobile liability | $ | 204,654 |
| $ | 132,732 |
| 54.2 | % |
| Other | 6,994 |
| 6,272 |
| 11.5 | % |
| Total | $ | 211,648 |
| $ | 139,004 |
| 52.3 | % |
| Provision for Unpaid Claims by Line of Business - Net of Reinsurance Recoverables ($ in ‘000s) |
| | | | | | | | |
| As of December 31, | 2017 | 2016 | YTD% Change |
| Commercial automobile liability | $ | 153,319 |
| $ | 101,220 |
| 51.5 | % |
| Other | 4,927 |
| 2,414 |
| 104.1 | % |
| Total | $ | 158,246 |
| $ | 103,634 |
| 52.7 | % |
The provision for unpaid claims and claims adjustment expenses increased by 52.3% to $211.6 million as of December 31, 2017 compared to $139.0 million as of December 31, 2016. During the year ended December 31, 2017, case reserves increased by 20.4% compared to December 31, 2016, while IBNR reserves increased by 71.4%. The increase in case reserves resulted from the increase in current accident year claims due to business growth offset by a decrease in claims in older accident years due to the acceleration of claim payments for those years. Based on year end 2017 actuarial work Atlas determined that a significant IBNR increase was necessary to ensure levels are sufficient to extinguish the remaining claims, especially for older accident years.
The following tables summarize the provision for unpaid claims, gross of reinsurance by type and line of business and accident year:
| Provision for Unpaid Claims, Gross of Reinsurance ($ in ‘000s) |
| | | | | | | | | | | | | | | | | | | |
| As of December 31, 2017 | Case Reserves | | IBNR |
| Accident Year | Commercial Auto Liability | Other | Total | | Commercial Auto Liability | Other | Total |
| 2016 and prior | $ | 30,393 |
| $ | 2,219 |
| $ | 32,612 |
| | $ | 65,017 |
| $ | 4,057 |
| $ | 69,074 |
|
| 2017 | 30,619 |
| (462 | ) | 30,157 |
| | 78,625 |
| 1,180 |
| 79,805 |
|
| Totals | $ | 61,012 |
| $ | 1,757 |
| $ | 62,769 |
| | $ | 143,642 |
| $ | 5,237 |
| $ | 148,879 |
|
| Provision for Unpaid Claims, Gross of Reinsurance ($ in ‘000s) |
| | | | | | | | | | | | | | | | | | | |
| As of December 31, 2016 | Case Reserves | | IBNR |
| Accident Year | Commercial Auto Liability | Other | Total | | Commercial Auto Liability | Other | Total |
| 2015 and prior | $ | 25,295 |
| $ | 3,129 |
| $ | 28,424 |
| | $ | 24,558 |
| $ | 2,553 |
| $ | 27,111 |
|
| 2016 | 24,222 |
| (514 | ) | 23,708 |
| | 58,657 |
| 1,104 |
| 59,761 |
|
| Totals | $ | 49,517 |
| $ | 2,615 |
| $ | 52,132 |
| | $ | 83,215 |
| $ | 3,657 |
| $ | 86,872 |
|
The following tables summarize the provision for unpaid claims, net of reinsurance by type and line of business and accident year:
| Provision for Unpaid Claims, Net of Reinsurance Recoverables ($ in ‘000s) |
| | | | | | | | | | | | | | | | | | | |
| As of December 31, 2017 | Case Reserves | | IBNR |
| Accident Year | Commercial Auto Liability | Other | Total | | Commercial Auto Liability | Other | Total |
| 2016 and prior | $ | 25,701 |
| $ | 1,303 |
| $ | 27,004 |
| | $ | 50,309 |
| $ | 3,089 |
| $ | 53,398 |
|
| 2017 | 27,421 |
| (309 | ) | 27,112 |
| | 49,888 |
| 844 |
| 50,732 |
|
| Totals | $ | 53,122 |
| $ | 994 |
| $ | 54,116 |
| | $ | 100,197 |
| $ | 3,933 |
| $ | 104,130 |
|
| Provision for Unpaid Claims, Net of Reinsurance Recoverables ($ in ‘000s) |
| | | | | | | | | | | | | | | | | | | |
| As of December 31, 2016 | Case Reserves | | IBNR |
| Accident Year | Commercial Auto Liability | Other | Total | | Commercial Auto Liability | Other | Total |
| 2015 and prior | $ | 21,909 |
| $ | 1,350 |
| $ | 23,259 |
| | $ | 16,869 |
| $ | 1,023 |
| $ | 17,892 |
|
| 2016 | 20,461 |
| (338 | ) | 20,123 |
| | 41,981 |
| 379 |
| 42,360 |
|
| Totals | $ | 42,370 |
| $ | 1,012 |
| $ | 43,382 |
| | $ | 58,850 |
| $ | 1,402 |
| $ | 60,252 |
|
The changes in the provision for unpaid claims and claims adjustment expenses, net of amounts recoverable from reinsurers, for the years ended December 31, 2017, 2016, 2015, and 20142015 were as follows ($ in '000s)‘000s):
| | | For the year ended December 31, | 2016 | | 2015 | | 2014 | 2017 | | 2016 | | 2015 |
| Unpaid claims and claims adjustment expenses, beginning of period | $ | 127,011 |
| | $ | 102,430 |
| | $ | 101,385 |
| $ | 139,004 |
| | $ | 127,011 |
| | $ | 102,430 |
|
| Less: reinsurance recoverable | 29,399 |
| | 18,421 |
| | 18,144 |
| 35,370 |
| | 29,399 |
| | 18,421 |
|
| Net unpaid claims and claims adjustment expenses, beginning of period | 97,612 |
| | 84,009 |
| | 83,241 |
| 103,634 |
| | 97,612 |
| | 84,009 |
|
| | | | | | | | | | | |
| Net reserves acquired | — |
| | 19,396 |
| | — |
| — |
| | — |
| | 19,396 |
|
| | | | | | | | | | | |
| Change in retroactive reinsurance ceded | 107 |
| | 2,037 |
| | 2,415 |
| 1,361 |
| | 107 |
| | 2,037 |
|
| | | | | | | | | | | |
| Incurred related to: | | | | | | | | | | |
| Current year | 102,133 |
| | 89,828 |
| | 61,680 |
| 128,476 |
| | 102,133 |
| | 89,828 |
|
| Prior years | 32,613 |
| | 166 |
| | (602 | ) | 75,397 |
| | 32,613 |
| | 166 |
|
| | 134,746 |
| | 89,994 |
| | 61,078 |
| 203,873 |
| | 134,746 |
| | 89,994 |
|
| Paid related to: | | | | | | | | | | |
| Current year | 39,652 |
| | 32,402 |
| | 19,427 |
| 50,626 |
| | 39,652 |
| | 32,402 |
|
| Prior years | 89,179 |
| | 65,422 |
| | 43,298 |
| 99,996 |
| | 89,179 |
| | 65,422 |
|
| | 128,831 |
| | 97,824 |
| | 62,725 |
| 150,622 |
| | 128,831 |
| | 97,824 |
|
| | | | | | | | | | | |
| Net unpaid claims and claims adjustment expenses, end of period | $ | 103,634 |
| | $ | 97,612 |
| | $ | 84,009 |
| $ | 158,246 |
| | $ | 103,634 |
| | $ | 97,612 |
|
| Add: reinsurance recoverable | 35,370 |
| | 29,399 |
| | 18,421 |
| 53,402 |
| | 35,370 |
| | 29,399 |
|
| Unpaid claims and claims adjustment expenses, end of period | $ | 139,004 |
| | $ | 127,011 |
| | $ | 102,430 |
| $ | 211,648 |
| | $ | 139,004 |
| | $ | 127,011 |
|
The process of establishing the estimated provision for unpaid claims and claims adjustment expenses is complex and imprecise, as it relies on the judgment and opinions of a large number of individuals, on historical precedent and trends, on prevailing legal, economic, social and regulatory trends and on expectations as to future developments. The process of determining the provision necessarily involves risks that the actual results may deviate, perhaps substantially, from the best estimates made. The change to the provision for unpaid claims and claims adjustment expenses is consistent with the changes in written premium. However, because the establishment of reserves is an inherently uncertain process involving estimates, current provisions may not be sufficient. Adjustments to reserves, both positive and negative, are reflected quarterly in the statement of income as estimates are updated.
The financial statements are presented on a calendar year basis for all data. Claims payments and changes in reserves, however, may be made on accidents that occurred in prior years, not solely on business that is currently insured. Calendar year claims consist of payments and reserve changes that have been recorded in the financial statements during the applicable reporting period, without regard to the period in which the accident occurred. Calendar year results do not change after the end of the applicable reporting period, even as new claim information develops. Accident year claims consist of payments and reserve changes that are assigned to the period in which the accident occurred. Accident year results will change over time as the estimates of claims change due to payments and reserve changes for all accidents that occurred during that period.
Atlas experienced $75.4 million in unfavorable prior accident year development for the year ended December 31, 2017 as reflected as incurred related to prior years in the table above. The unfavorable development is primarily from our core commercial automobile liability line. Atlas previously identified that claim expenses in Michigan were significantly outpacing other states and took a significant charge. Although exposure in Michigan was reduced to approximately 1.4% of the Company’s insured vehicles inforce by year end 2017, payments for claims in this state continued to be disproportionate to historic premiums earned. In addition, the remaining liability for non-New York Global Liberty business written prior to 2016 is expected to settle for greater amounts than previously expected. Overall, the actuarially determined liability for remaining claims related to accident year 2015 and prior in general, across all jurisdictions, was indicated to be significantly higher than carried reserves.
Atlas experienced $32.6 million in unfavorable prior accident year development for the year ended December 31, 2016 as reflected as incurred related to prior years in the table above. The unfavorable development is primarily from our core commercial automobile liability line. In the fourth quarter, the Company performed a comprehensive review of its reserves as a result of changing loss payment trends identified through year-end actuarial work, and ultimately decided that it was appropriate to strengthen reserves. Excluding pre-acquisition Global Liberty reserve development, the development of our core lines on prior accident years was $23.2 million for the year ended December 31, 2016. Michigan commercial automobile claims accounted for approximately 62.5% of this development. Pre-acquisition Global Liberty claims reserve development was $7.9 million for the year ended December 31, 2016. The remaining unfavorable prior year development of $1.5 million for the year ended December 31, 2016 is attributable to assigned risk pools and run-off of non-core business. See MD&A, 'Results of Operations,' '2016 vs 2015,' 'Net Claims Incurred' for further information on the development reported in the Consolidated Financial Statements for the year ended December 31, 2016.
Atlas experienced $166,000 in unfavorable prior accident year development forduring the year ended December 31, 2015 as reflected as incurred related to prior years in the table above. Prior accident year development on non-core lines and assigned risk pools was $870,000 for the year ended December 31, 2015. This increase was offset by favorable prior accident year development of $475,000 and $230,000 on our core lines and pre-acquisition Global Liberty claims reserves, respectively. This favorable development on our core lines was attributable to our traditional taxi and excess taxi products.
Atlas experienced favorable prior year development during the year ended December 31, 2014 of $352,000 on its core lines and $250,000 on its non-core lines as reflected as incurred related to prior years in the table above. The favorable development on our core lines was primarily related to pre-acquisition Gateway claims reserves.
Contractual Obligations
The table below summarizes future payments under contractual obligations and estimated claims settlements for the year ended December 31, 2016:2017:
| | | ($ in '000s) | | Total | | Less than 1 year | | 1-3 years | | 3-5 years | | More than 5 years | |
| Notes payable | | $ | 19,400 |
| | $ | — |
| | $ | 3,900 |
| | $ | 15,500 |
| | $ | — |
| |
| ($ in ‘000s) | | | Total | | Less than 1 year | | 1-3 years | | 3-5 years | | More than 5 years |
| Notes payable, including interest payments | | | $ | 33,281 |
| | $ | 1,656 |
| | $ | 3,312 |
| | $ | 28,313 |
| | $ | — |
|
| Operating leases | | 5,778 |
| | 1,703 |
| | 1,993 |
| | 1,936 |
| | 146 |
| | 4,269 |
| | 1,053 |
| | 2,122 |
| | 1,094 |
| | — |
|
| Estimated claims liabilities, net of reinsurance | | 103,634 |
| | 48,515 |
| | 39,984 |
| | 11,033 |
| | 4,102 |
| | 158,246 |
| | 76,671 |
| | 60,658 |
| | 14,484 |
| | 6,433 |
|
| Other contractual obligations | | | 1,150 |
| | 1,150 |
| | — |
| | — |
| | — |
|
| Total | | $ | 128,812 |
| | $ | 50,218 |
| | $ | 45,877 |
| | $ | 28,469 |
| | $ | 4,248 |
| | $ | 196,946 |
| | $ | 80,530 |
| | $ | 66,092 |
| | $ | 43,891 |
| | $ | 6,433 |
|
Notes payable does not includeOn April 26, 2017, Atlas issued $25 million of five-year 6.625% senior unsecured notes. Total interest expense over the interest payments and non-utilization fees relatedfive years is expected to the balance outstanding as of December 31, 2016. The interest rate is variable basedbe $8.3 million. Interest on the one-month LIBOR ratesenior unsecured notes is payable quarterly on each January 26, April 26, July 26 and non-utilization fees are variable based on the level of borrowing. The notes payable require interest-only payments until the principal is due. Refer to 'Liquidity and Capital Resource' section below for further discussion of the notes payable.
The operating leases do not include the future sublease income related to Atlas' New York lease due to the uncertain timing of the commencement of the sublease.October 26.
Estimated claims liabilities are calculated based on actuarial assumptions and may differ from actual future claims settlements. The amounts in the table above have been presented net of reinsurance.
The Company entered into various contracts to renovate and furnish the building that was purchased in 2016 to serve as the Company’s new headquarters (see Note 8, ‘Commitments and Contingencies’ and Note 9, ‘Property and Equipment’). The remaining contractual obligations related to the renovation and furnishing of Atlas’ new headquarters building are included under ‘Other contractual obligations’.
As of December 31, 2016,2017, we had contractual obligations to provide additional funds for investments in limited liability investments included in other investments for up to $2.8$7.0 million not included in the table above. There is no certainty of when these amounts will be required to be provided.
Off-Balance Sheet Arrangements
As of December 31, 2016,2017, we did not have any material off-balance sheet arrangements as defined by SEC rules.
Shareholders’ Equity
The table below identifies changes in shareholders’ equity for the years ended years ended December 31, 2017, 2016, 2015, and 2014:2015:
| Changes in Shareholders' Equity | |
| Changes in Shareholders’ Equity | | Changes in Shareholders’ Equity |
| | ($ in '000s) | Preferred Shares | Ordinary Voting Common Shares | Restricted Voting Common Shares | Additional Paid-in Capital | Retained Deficit | Accumulated Other Comprehensive (Loss) Income | Total Share-holders' Equity | |
| Balance December 31, 2013 | $ | 2,000 |
| $ | 28 |
| $ | — |
| $ | 169,595 |
| $ | (106,496 | ) | $ | (1,429 | ) | $ | 63,698 |
| |
| ($ in ‘000s) | | Ordinary Voting Common Shares | Restricted Voting Common Shares | Additional Paid-In Capital | Retained Deficit | Accumulated Other Comprehensive Income (Loss) | Total Shareholders' Equity |
Balance December 31, 2014 r | | $ | 34 |
| $ | — |
| $ | 196,079 |
| $ | (88,794 | ) | $ | 80 |
| $ | 107,399 |
|
| Net income | — |
| — |
| — |
| — |
| 17,702 |
| — |
| 17,702 |
| — |
| — |
| — |
| 14,430 |
| — |
| 14,430 |
|
| Proceeds from U.S. public offering, net of offering costs | — |
| 6 |
| — |
| 25,015 |
| — |
| — |
| 25,021 |
| |
| Other comprehensive income | — |
| — |
| — |
| — |
| — |
| 1,509 |
| 1,509 |
| |
| Share-based compensation | — |
| — |
| — |
| 1,469 |
| — |
| — |
| 1,469 |
| |
| Balance December 31, 2014 | $ | 2,000 |
| $ | 34 |
| $ | — |
| $ | 196,079 |
| $ | (88,794 | ) | $ | 80 |
| $ | 109,399 |
| |
| Net income | — |
| — |
| — |
| — |
| 14,430 |
| — |
| 14,430 |
| |
| Issuance of preferred shares | 4,941 |
| — |
| — |
| — |
| — |
| — |
| 4,941 |
| |
| Other comprehensive loss | — |
| — |
| — |
| — |
| — |
| (1,112 | ) | (1,112 | ) | — |
| — |
| — |
| — |
| (1,112 | ) | (1,112 | ) |
| Options exercised | — |
| — |
| — |
| 145 |
| — |
| — |
| 145 |
| — |
| — |
| 145 |
| — |
| — |
| 145 |
|
| Share-based compensation | — |
| 2 |
| | 1,817 |
| — |
| — |
| 1,819 |
| 2 |
| | 1,817 |
| — |
| — |
| 1,819 |
|
| Balance December 31, 2015 | $ | 6,941 |
| $ | 36 |
| $ | — |
| $ | 198,041 |
| $ | (74,364 | ) | $ | (1,032 | ) | $ | 129,622 |
| |
Balance December 31, 2015 r | | $ | 36 |
| $ | — |
| $ | 198,041 |
| $ | (74,364 | ) | $ | (1,032 | ) | $ | 122,681 |
|
| Net income | — |
| — |
| — |
| — |
| 2,646 |
| — |
| 2,646 |
| — |
| — |
| — |
| 2,646 |
| — |
| 2,646 |
|
| Preferred dividends paid | — |
| — |
| — |
| (409 | ) | — |
| — |
| (409 | ) | — |
| — |
| (409 | ) | — |
| — |
| (409 | ) |
| Retirement of preferred shares | (6,941 | ) | — |
| — |
| — |
| — |
| — |
| (6,941 | ) | |
| Other comprehensive income | — |
| — |
| — |
| — |
| — |
| 812 |
| 812 |
| — |
| — |
| — |
| — |
| 812 |
| 812 |
|
| Share-based compensation | — |
| — |
| — |
| 1,612 |
| — |
| — |
| 1,612 |
| — |
| — |
| 1,612 |
| — |
| — |
| 1,612 |
|
| Balance December 31, 2016 | $ | — |
| $ | 36 |
| $ | — |
| $ | 199,244 |
| $ | (71,718 | ) | $ | (220 | ) | $ | 127,342 |
| $ | 36 |
| $ | — |
| $ | 199,244 |
| $ | (71,718 | ) | $ | (220 | ) | $ | 127,342 |
|
| ASU 2018-02, reclassification of certain tax effects | | — |
| — |
| — |
| (7 | ) | 7 |
| — |
|
| Net loss | | — |
| — |
| — |
| (38,810 | ) | — |
| (38,810 | ) |
| Other comprehensive income | | — |
| — |
| — |
| — |
| 252 |
| 252 |
|
| Options exercised | | — |
| — |
| 655 |
| — |
| — |
| 655 |
|
| Share-based compensation | | — |
| — |
| 1,176 |
| — |
| — |
| 1,176 |
|
| Other | | — |
| — |
| 30 |
| — |
| — |
| 30 |
|
| Balance December 31, 2017 | | $ | 36 |
| $ | — |
| $ | 201,105 |
| $ | (110,535 | ) | $ | 39 |
| $ | 90,645 |
|
r - Prior to the year ended December 31, 2017, the Company presented preferred shares issued as contingent consideration within the permanent equity section of the Consolidated Statements of Financial Position. In accordance with Financial Accounting Standards Board (“FASB”) ASC Topic 480 - Distinguishing Liabilities from Equity, contingent consideration issued as preferred shares wherein the number of shares to be issued is variable should be classified outside of permanent equity and reflected as mezzanine equity on the Consolidated Statements of Financial Position.
For the year ended December 31, 2017, the Company has restated the Consolidated Statements of Shareholders’ Equity to remove the preferred shares and related activity as previously stated for the periods as of January 1, 2015 and for the years ended December 31, 2015 and 2016. Although this impacted total equity for 2015, it had no impact on total equity as of December 31, 2016 due to the redemption and clawback of preferred shares previously issued. In addition, this change did not impact the Consolidated Statements of Financial Position, Consolidated Statements of Income (Loss) and Comprehensive Income (Loss), earnings per common share or the Consolidated Statements of Cash Flows. The Company has evaluated the effect of the incorrect presentation in the prior period, both qualitatively and quantitatively, and concluded that it did not have a material impact on, nor did it require amendment of, any previously filed annual or quarterly consolidated financial statements. See Note 20, ‘Change in Accounting Principle and Error Corrections’ for additional information regarding preferred shares.
As of March 10,December 31, 2017, there were 11,902,51212,164,041 ordinary voting common shares outstanding and no preferred shares outstanding.
During 2017, the 128,191 restricted voting common shares outstanding.
that were beneficially owned or controlled by Kingsway were sold to non-affiliates of Kingsway. The holders of restricted voting common shares are entitled to vote at all meetings of shareholders, except at meetings of holders of a specific class that are entitled to vote separately as a class. The restricted voting common shares as a class shall not carry more than 30% of the aggregate votes eligible to be voted at a general meeting of common shareholders. All of the issued and outstandingThe Kingsway-owned restricted voting common shares are beneficially owned or controlled by Kingsway Financial Services, Inc. (including its subsidiaries and affiliated companies, "Kingsway"). The restricted voting common shares will convert to ordinary voting common shares in the event that these Kingsway owned shares are sold to non-affiliates of Kingsway. During 2016, 4,672 restricted voting common shares wereautomatically converted to ordinary voting common shares dueupon their sale to the sale by Kingswaynon-affiliates of theKingsway. There are no restricted voting common shares to a non-affiliate.outstanding as of December 31, 2017.
There were 22,22414,816 and 29,63122,224 non-vested restricted stock units ("RSUs"(“RSUs”) issued as of December 31, 20162017 and December 31, 2015,2016, respectively. These RSUs are participative and are included in the computations of earnings per common share and book value per common share for these periods.
During the year ended December 31, 2017, the Company issued 7,408 ordinary voting common shares as a result of the vesting of RSUs. During the year ended December 31, 2017, the Company issued 133,338 ordinary voting common shares as a result of the exercise of options. During the year ended December 31, 2016, the Company issued 7,407 ordinary voting common shares as a result of the vesting of RSUs. During the year ended December 31, 2015, the Company issued 7,407 ordinary voting common shares as a result of the vesting of RSUs and 200,000 non-vested restricted voting common shares to a director and the officers, respectively. During the year ended December 31, 2015, the Company issued 36,895 ordinary voting common shares to a director as a result of exercising options. These shares were granted and issued under the Company's
Mezzanine Equity Incentive Plan.
During the first quarter of 2015, the Company issued 4,000,000 preferred shares as a portion of the consideration related to the Anchor acquisition and an additional 940,500 preferred shares pursuant to the Gateway stock purchase agreement. During the first quarter of 2016, the companyCompany canceled 401,940 preferred shares pursuant to the Gateway stock purchase agreement. During the third quarter of 2016, the Company redeemed all 2,538,560 of the remaining preferred shares issued to the former owner of Gateway. During the fourth quarter of 2016, Atlasthe Company canceled the remaining 4,000,000 preferred shares held by the former owner of Anchor pursuant to the terms of the Anchor stock purchase agreement. As of December 31, 2017 and December 31, 2016, there were no outstanding preferred shares. The Gateway preferred shares redeemed and canceled during 2016 and the preferred shares issued during the first quarter of 2015 pursuant to the Gateway stock purchase agreement have been recorded as a recovery of acquisition expense and additional acquisition expense, respectively, and not as an adjustment to goodwill, because the fair value of the contingent consideration was determined to be zero at the date of the Gateway acquisition. In accordance with U.S. GAAP, such adjustments are reflected in the statements of income statementand comprehensive income in the period that the contingency is re-estimated. The Anchor cancellation was recorded as a recovery of acquisition expense.
Preferred shareholders are entitled to dividends on a cumulative basis, whether or not declared by the Board of Directors, at the rate of $0.045 per share per year (4.5%) and may be paid in cash or in additional preferred shares at the option of Atlas. In liquidation, dissolution or winding-up of Atlas, preferred shareholders receive the greater of $1.00 per share plus all declared and unpaid dividends or the amount they would receive in liquidation if the preferred shares had been converted to restricted voting common shares or ordinary voting common shares immediately prior to liquidation. Preferred shareholders are not entitled to vote.
The former owners of Gateway and Anchor earned $94,000 and $187,000, respectively, in dividends on the preferred shares during the year ended December 31, 2016. On September 30, 2016, Atlas paid $409,000 in dividends earned on the preferred shares to the former owner of Gateway, the cumulative amount to which they were entitled through September 15, 2016, leaving no accrued and unpaid dividends owed to the former owner of Gateway. The cumulative amountAs of December 31, 2017 and December 31, 2016, Atlas has accrued and unpaid$333,000 in dividends toon the preferred shares for the former owner of Anchor, was $333,000 as of December 31, 2016. As of December 31, 2016, thewhich remains unpaid. The paid claims development on Global Liberty'sLiberty’s pre-acquisition claims reserves was in excess of $4.0 million, and as a result, pursuant to the terms of the Anchor stock purchase agreement, dividends will no longer accrue to the former owner of Anchor. As of December 31, 2016, there were no preferred shares outstanding. Although the re-issuance of preferred shares to the former owner of Anchor may be highly unlikely, the contingent consideration terms of the Anchor stock purchase agreement will remain in effect for a period of five years from the date of acquisition.
On May 13, 2014, an aggregate of 2,000,000 Atlas ordinary voting common shares were offered in a subsequent public offering in the United States at a price of $12.50 per share. Atlas also granted the underwriters an option to purchase up to an aggregate of 300,000 additional shares at the public offering price of $12.50 per share to cover over-allotments, if any. On May 27, 2014, the underwriters exercised this option and purchased an additional 161,000 shares. After underwriting and other expenses, total proceeds of $25.0 million were realized on the issuance of the shares. A portion of the net proceeds from the offering was used to support the acquisition of Anchor Holdings Group, Inc. and its affiliated entities.
Book Value per OrdinaryCommon Share
Book value per ordinarycommon share was as follows:
| | | ($ in '000s, except for shares and per share data) | December 31, 2016 | December 31, 2015 | |
| Shareholders' equity | $ | 127,342 |
| $ | 129,622 |
| |
| Less: Preferred stock in equity | — |
| 6,941 |
| |
| ($ in ‘000s, except for shares and per share data) | | ($ in ‘000s, except for shares and per share data) | December 31, 2017 | December 31, 2016 |
| Shareholders’ equity | | Shareholders’ equity | $ | 90,645 |
| $ | 127,342 |
|
| Less: Accumulated dividends on preferred stock | Less: Accumulated dividends on preferred stock | 333 |
| 460 |
| Less: Accumulated dividends on preferred stock | 333 |
| 333 |
|
| Common equity | Common equity | $ | 127,009 |
| $ | 122,221 |
| Common equity | $ | 90,312 |
| $ | 127,009 |
|
| Participative shares: | Participative shares: | | Participative shares: | |
| Common shares outstanding | Common shares outstanding | 12,023,295 |
| 12,015,888 |
| Common shares outstanding | 12,164,041 |
| 12,023,295 |
|
| Restricted stock units (RSUs) | Restricted stock units (RSUs) | 22,224 |
| 29,631 |
| Restricted stock units (RSUs) | 14,816 |
| 22,224 |
|
| Total participative shares | 12,045,519 |
| 12,045,519 |
| |
| Book value per participative share outstanding | $ | 10.54 |
| $ | 10.15 |
| |
| Total common shares | | Total common shares | 12,178,857 |
| 12,045,519 |
|
| Book value per common share outstanding | | Book value per common share outstanding | $ | 7.42 |
| $ | 10.54 |
|
Book value per common share increaseddecreased by $0.39$3.12 relative to December 31, 20152016 as follows: a decrease of $0.38$2.35 related to net incomeloss after tax (excluding expenses recovered pursuant to stock purchase agreements), a decrease of $0.87 related to the change in statutory tax rate due to the Tax Act, an increase of $0.07$0.05 related to realized investment gains after tax, an increase of $0.07$0.02 related to the change in unrealized gains/losses after tax, and a net increase of $0.13$0.03 related to share-based compensation impacts, a $0.02 decrease related to preferred dividends and an increase of $0.52 related to expenses recovered pursuant to stock purchase agreements. The causes of theseimpacts. These changes are attributed to the combined effects of the reasons cited in the 'Net Premium Earned'‘Net Premiums Earned’, 'Net‘Net Claims Incurred'Incurred’, 'Acquisition‘Acquisition Costs and Other Underwriting Expenses'Expenses’, 'Net‘Net Investment Income'Income’, 'Net‘Interest Expense’, ‘Net Realized Investment Gains'Gains’, and 'Other Income'‘Other Income’ subsections of the 'Operating Results'‘Operating Results’ section.
Liquidity and Capital Resources
Liquidity Management - The purpose of liquidity management is to ensure there is sufficient cash to meet all financial commitments and obligations as they become due. The liquidity requirements of Atlas’ business have been met primarily by funds generated from operations, asset maturities and income and other returns received on securities. Cash provided from these sources is used primarily for payment of claims and operating expenses. The timing and amount of catastrophe claims are inherently unpredictable andAtlas may create increased liquidity requirements.also use cash provided from these sources to repurchase common shares in open market transactions under the new Share Repurchase Program.
As a holding company, Atlas may derive cash from its subsidiaries generally in the form of dividends and in the future may charge management fees to the extent allowed by statute or other regulatory approval requirements to meet its obligations. The Insurance Subsidiaries fund their obligations primarily through premium and investment income and maturities in their securities portfolio. Refer also to the discussion in the MD&A's 'Investments&A’s ‘Investments Overview and Strategy'Strategy’ section. The Insurance Subsidiaries require regulatory approval for the return of capital and, in certain circumstances, payment of dividends. In the event that dividends and management fees available to the holding company are inadequate to service its obligations, the holding company would need to raise capital, sell assets or incur debt obligations.
On May 7, 2014,April 26, 2017, Atlas issued $25 million of five-year 6.625% senior unsecured notes and received net proceeds of approximately $23.9 million after deducting underwriting discounts and commissions and other estimated offering expenses. Interest on the senior unsecured notes is payable quarterly on each January 26, April 26, July 26 and October 26. Atlas may, at its option, beginning with the interest payment date of April 26, 2020, and on any scheduled interest payment date thereafter, redeem the senior unsecured notes, in whole or in part, at a redemption price equal to 100% of the principal amount plus accrued and unpaid interest to, but excluding, the date of redemption. The senior unsecured notes will rank senior in right of payment to any of Atlas’ existing and future indebtedness that is by its terms expressly subordinated or junior in right of payment to the senior unsecured notes. The senior unsecured notes will rank equally in right of payment to all of Atlas’ existing and future senior indebtedness, but will be effectively subordinated to any secured indebtedness to the extent of the value of the collateral securing such secured indebtedness. In addition, the senior unsecured notes will be structurally subordinated to the indebtedness and other obligations of Atlas’ subsidiaries.
The senior unsecured notes were issued under an indenture and supplemental indenture that contain covenants that, among other things, limit: (i) the ability of Atlas to merge or consolidate, or lease, sell, assign or transfer all or substantially all of its assets; (ii) the ability of Atlas to sell or otherwise dispose of the equity securities of certain of its subsidiaries; (iii) the ability of certain of Atlas’ subsidiaries to issue equity securities; (iv) the ability of Atlas to permit certain of its subsidiaries to merge or consolidate, or lease, sell, assign or transfer all or substantially all of their respective assets; and (v) the ability of Atlas and its subsidiaries to incur debt secured by equity securities of certain of its subsidiaries.
On March 9, 2015, American Insurance Acquisition, Inc. (“American Acquisition”), a wholly-owned direct subsidiary of Atlas, entered into a loan and security agreement (“Former Loan Agreement”) for a $10.0 million revolving loan facility with Fifth Third Bank. Under the Former Loan Agreement, funds could be borrowed and re-borrowed on a revolving basis by American Acquisition, from the closing date until (but not including) May 7, 2015, the loan maturity date. The interest rate on the advances under the revolving loan facility was generally LIBOR plus 2.75%, provided that, during a default, interest would accrue at a rate equal to LIBOR plus 5%. In addition, there was a non-utilization fee equal to 0.25% per annum of an amount equal to $10.0 million less the daily average of the aggregate principal amount of the revolving loans outstanding plus the aggregate amount of the letter of credit obligations outstanding.
On March 9, 2015, American Acquisition entered into a loan and security agreement (“Loan Agreement”) for a $35.0 million loan facility with Fifth Third Bank. On May 7, 2016, American Acquisition entered into a Modification of Loan Documents with Fifth Third Bank to amend its Loan Agreement. The Loan Agreement, as modified, includesincluded a $30.0 million line of credit ("(“Draw Amount"Amount”), which can becould have been drawn in increments at any time until December 31, 2016. The $30.0 million line of credit hashad a five year term and bearsbore interest at one-month LIBOR plus 4.5%, effectively 5.27% as of December 31, 2016.. The Loan Agreement also includesincluded a $5.0 million revolving line of credit ("Revolver"(“Revolver”), which could have been drawn upon until May 7, 2018, that bearsbore interest at one month LIBOR plus 2.75%, effectively 3.52% as of December 31, 2016. This $5.0 million revolving line of credit may be drawn upon until May 7, 2018 and replaces the $10.0 million revolving line of credit American Acquisition previously had in place with Fifth Third Bank under the Former Loan Agreement..
The Loan Agreement also providesprovided for the issuance of letters of credit in an amount up to $2.0 million outstanding at any time. In addition, there iswas a non-utilization fee for each of the $30.0 million line of credit and $5.0 million revolving line of credit equal to 0.50% per annum of an amount equal to $30.0 million and $5.0 million, respectively, less the daily average of the aggregate principal amount outstanding under such credit lines (plus, in the case of the $30.0 million line of credit, the aggregate amount of the letter of credit obligations outstanding).
The Loan Agreement requires American Acquisition to comply with customary affirmative and negative covenants, including those governing indebtedness, liens, investments, sales of assets, issuance of securities, and distributions. The Loan Agreement also requires American Acquisition to make mandatory prepayments under certain conditions and to comply with certain financial covenants, including the ASI Pool Subsidiaries maintainingwas terminated in April 2017. Atlas used a combined statutory net worth in an amount not less than $60 million (subject to adjustment) and maintaining a minimum funded debt to Earnings Before Interest, Taxes, Depreciation and Amortization ratio (the "EBITDA Ratio"). The Loan Agreement is secured by substantially allportion of the property of American Acquisition, including allnet proceeds of the senior unsecured notes offering, together with cash on hand, for the repayment of all outstanding shares ofbalances under the ASI Pool Subsidiaries.Draw Amount and Revolver, $15.5 million and $3.9 million, respectively.
At December 31, 2016, American Acquisition was in compliance with the covenants of the Loan Agreement. In February 2017, American Acquisition filed its statutorily required financial statements for the year ended December 31, 2016, which are used to determine on-going compliance with the covenants contained in the Loan Agreement. As a result of the reserve strengthening described in this annual report on Form 10-K and its effect on American Acquisition’s December 31, 2016 financial statements, American Acquisition iswas not in compliance with the Loan Agreements’ EBITDA Ratio covenant as of March 13, 2017. American Acquisition hashad a thirty day period to cure this covenant non-compliance, and the Company and American Acquisition have been in discussionsagreed with the lender regardingto a modification to the loan covenants to more specifically address the effects of reserve modifications and/or obtaining a waiver with respect to the existing non-compliance.
As of December 31, 2016, $3.9Interest expense on notes payable was $1.8 million, in funds were accessed from the Revolver, of which $2,000,000 was accessed during 2016, including a portion that was used to repurchase preferred shares from the former owner of Gateway while $100,000 was repaid during 2016. $15.5$1.0 million, in funds were accessed against the Draw Amount as of December 31, 2016. All $15.5 million of the Draw Amount was accessed in 2015 and contributed to the ASI Pool Subsidiaries in exchange for surplus notes that carry a variable interest rate of prime plus 2% with a maturity date of April 30, 2020. No letters of credit were issued under the terms of this Loan
Agreement as of December 31, 2016. As of December 31, 2016, the unused funds$694,000 for the Revolver and the Draw Amount were $1.1 million and $14.5 million, respectively. The unused funds for the Draw Amount can no longer be drawn.
For the yearyears ended December 31, 2017, 2016, American Acquisition incurred interest expense, including amortized loan costs, of $1.0 million in connection with the Loan Agreement. For the year ended December 31,and 2015, interest expense, including amortized loan costs, was $694,000. As of December 31, 2016, unamortized bank fees associated with the Loan Agreement were $213,000. These bank fees will be amortized over the next 38 months.respectively.
The following table summarizes consolidated cash flow activities: | Summary of Cash Flows ($ in ‘000s) | | | For the years ended December 31, | 2016 | | 2015 | | 2014 | 2017 | | 2016 | | 2015 |
| Net cash flows provided by operating activities | $ | 170 |
| | $ | 8,814 |
| | $ | 13,716 |
| $ | 26,472 |
| | $ | 170 |
| | $ | 8,814 |
|
| Net cash flows provided by (used in) investing activities | 8,412 |
| | (40,354 | ) | | (11,963 | ) | |
| Net cash flows (used in) provided by financing activities | (1,048 | ) | | 17,308 |
| | 25,022 |
| |
| Net cash flows (used in) provided by investing activities | | (15,909 | ) | | 8,412 |
| | (40,354 | ) |
| Net cash flows provided by (used in) financing activities | | 5,164 |
| | (1,048 | ) | | 17,308 |
|
| Net increase (decrease) in cash | $ | 7,534 |
| | $ | (14,232 | ) | | $ | 26,775 |
| $ | 15,727 |
| | $ | 7,534 |
| | $ | (14,232 | ) |
Cash provided by operations during the years ended December 31, 2017, 2016, 2015, and 20142015 was primarily as a result of net income.income and increases in unpaid claims liabilities and unearned premium reserves. We receive most premiums in advance of the payment of claims. Our ability to generate positive operating cash flows depends on the frequency and severity of claims and the timing of collection of premiums receivable and reinsurance recoverables on paid claims.
Cash used in investing activities during the year ended December 31, 2017 was due to the net purchases of fixed income and equity securities and the furnishings and improvements for the Company’s new headquarters offset by the net sales of other investments. Cash provided by investing activities during the year ended December 31, 2016 was due to the net sale of invested assets offset by the purchase of a building and land to be used for the Company's futureCompany’s headquarters. Cash used byin investing activities during the yearsyear ended December 31, 2015 and 2014 was due to the net purchase of invested assets and the acquisition of Anchor. For the year ended December 31, 2015, investing activities included $11.0 million in cash used in the Anchor acquisition net of the cash received.
Cash provided by financing activities during the year ended December 31, 2017 resulted from the proceeds of the issuance of the Company’s senior unsecured notes and options exercised partially offset by the repayment of the Revolver and Draw Amount. Cash used in financing activities during the year ended December 31, 2016 resulted from the buyback of preferred shares pursuant to the Gateway stock purchase agreement partially offset by the proceeds from the Revolver and Draw Amount. Cash provided by financing activities during the year ended December 31, 2015 resulted from proceeds from the Revolver and Draw Amount and the exercise of options. Cash provided by financing activities during
On March 21, 2017, the Company’s Board of Directors approved a Share Repurchase Program of up to 650,000 shares of ordinary voting common shares. The repurchases may be made from time to time in open market transactions, privately-negotiated transactions, block purchases, or otherwise in accordance with securities laws at the discretion of the Company’s management until March 21, 2018. The Company’s decisions around the timing, volume, and nature of share repurchases, and the ultimate amount of shares repurchased, will be dependent on market conditions, applicable securities laws, and other factors. The Share Repurchase Program and the Board’s authorization of the program may be modified, suspended, or discontinued at any time. During the year ended December 31, 2014 was the result of the capital raise in the second quarter of 2014.2017, no shares were repurchased under this Share Repurchase Program.
Capital resources - The Company manages capital using both regulatory capital measures and internal metrics. The Company’s capital is primarily derived from common shareholders’ equity, retained deficit and accumulated other comprehensive income (loss).
As a holding company, Atlas could derive cash from its Insurance Subsidiaries generally in the form of dividends to meet its obligations, which will primarily consist of operating expense payments and debt payments. Atlas’ Insurance Subsidiaries fund their obligations primarily through premium and investment income and maturities in the securities portfolio. The Insurance Subsidiaries require regulatory approval for the return of capital and, in certain circumstances, prior to the payment of dividends. In the event that dividends available to the holding company are inadequate to cover its operating expenses and debt payments, the holding company would need to raise capital, sell assets or incur future debt.
The Insurance Subsidiaries must each maintain a minimum statutory capital and surplus of $1.5 million, $2.4 million, and $3.5 million under the provisions of the Illinois Insurance Code, the Missouri Insurance Code, and New York Insurance Code, respectively. Dividends may only be paid from statutory unassigned surplus, and payments may not be made if such surplus is less than a stipulated amount. The dividend restriction for the ASI Pool Subsidiaries is the greater of statutory net income or 10% of total statutory capital and surplus. The dividend restriction for Global Liberty is the lower of 10% of statutory surplus or 100% of adjusted net investment income for the preceding twelve month period.
Net loss computed under statutory-basis accounting was $1.3$9.1 million, $1.2$15.2 million, $1.1$5.9 million, and $49,000$5.1 million for American Country, American Service, Gateway and Global Liberty, respectively, for the year ended December 31, 2016.2017. Net incomeloss for the year ended December 31, 20152016 was $3.4$1.3 million, $6.1$1.2 million, $2.0$1.1 million, and $1.2 million$49,000 for American Country, American Service, Gateway and Global Liberty, respectively. The combined statutory capital and surplus of the Insurance Subsidiaries was $113.9$87.8 million and $118.5$113.9 million as of December 31, 20162017 and December 31, 2015,2016, respectively.
Atlas did not declare or pay any dividends to its common shareholders during the years ended December 31, 20162017 and 2015.2016.
Item 7A. Quantitative and Qualitative Disclosures about Market Risk
Market Risk
Market risk is the risk that Atlas will incur losses due to adverse changes in interest rates, currency exchange rates or equity prices. Having increased our mortgage and asset backed securities holdings, our primary market risk exposures in the fixed income securities portfolio are to changes in interest rates, inflation and the uncertainty of prepayment assumptions. Because Atlas’ securities portfolio is comprised of primarily fixed income securities, periodic changes in interest rate levels generally impact its financial results to the extent that the securities in its available-for-sale portfolio are recorded at market value. During periods of rising interest rates, the market value of the existing fixed income securities will generally decrease, and realized gains on fixed income securities will likely be reduced. The reverse is true during periods of declining interest rates. Changes in inflation can influence the interest rates, which can impact the fair value of our available-for-sale fixed income portfolio and yields on new investments.
Although mortgages can have a contractual term of a certain number of years, quite often mortgages are paid off much sooner. Because of these unscheduled prepayments, predicting the maturity of mortgage backed securities can be problematic. In addition, mortgage backed securities are marketable and can trade at premiums, discounts or par value, depending upon changes in current market rates. A current-coupon pass through trades at par value, while high-coupon pass throughs trade at premiums and low-coupon securities trade at discounts. Prepayment speed can affect premium and discount pass-throughs adversely. Prepayments at par value result in cash flows that can only be reinvested at the lower, current rate. Consequently, faster-than-anticipated prepayments deny the investor the high cash flows that justified the premium price in the first place. On the other hand, slower prepayments offer the investor more time to earn the higher coupon rate. For mortgage backed securities trading at a discount pass-through, faster-than-expected prepayments can allow the investor to reinvest in securities with higher coupon rates. The reverse happens when prepayments are slower than expected. The investor can be forced to hold on to the lower coupons for a longer period of time, thereby reducing realized yield.
With a weighted average contractual duration of 3.43.9 years, changes in interest rates will have a modest market value impact on the Atlas fixed income portfolio relative to longer duration portfolios. Atlas can, and typically does, hold bonds to maturity by matching duration with the anticipated liquidity needs.
Atlas'Atlas’ available-for-sale equity securities are primarily subject to equity price risk. Equity price risk is the risk of loss in the fair value of equity securities due to the adverse changes in equity prices. The available-for-sale equity securities portfolio is approximately 3.2%4.3% of Atlas'Atlas’ total investment portfolio, and any adverse impact from equity price risk would not be material to Atlas'Atlas’ investment portfolio.
Interest Rate Risk
Sensitivity analysis expresses the potential loss in future earnings, fair values, or cash flows of market sensitive instruments resulting from one or more selected hypothetical changes in interest rates, foreign currency exchange rates, commodity prices, and other relevant market rates or prices over a select period of time. The actual results may differ from the hypothetical results below, since the analysis does not include any action that would be taken by the company to reduce the negative impact of changes in the interest rate.
Atlas’ available-for-sale fixed income securities held as of December 31, 20162017 were $156.5$158.0 million. A 100 basis point increase in interest rates on such held fixed income securities would have increased net investment income and income before income taxes by approximately $137,000.$131,000. Conversely, a 100 basis point decrease in interest rates on such held fixed income securities would decrease net investment income and income before income taxes by $194,000.$163,000. Atlas uses a 1 year time period with a 100 basis point increase and decrease to determine the impact on the fixed income security portfolio.
A 100 basis point increase would have also decreased other comprehensive income by approximately $5.6$6.6 million due to “mark-to-market” requirements; however, holding investments to maturity would be expected to mitigate this impact. Conversely, a 100 basis point decrease would increase other comprehensive income by the same amount. The impacts described here are approximately linear to the change in interest rates. Atlas uses the duration of the portfolio to determine the impact on other comprehensive income from 100 basis point changes in the interest rate.
Atlas' notes payable have variable interest components subject to interest rate risk. As of December 31, 2016, Atlas has a $15.5 million line of credit outstanding with interest at one-month LIBOR plus 4.5% and a $3.9 million revolving line of credit outstanding that bears interest at one-month LIBOR plus 2.75%. Totalfive-year 6.625% senior unsecured notes payable subject to interest rate risk as of December 31, 2016 was $19.42017 with an outstanding balance of $24.0 million. For the sensitivity analysis, an instantaneous 100 basis point increase and decrease are assumed on the outstanding balance as of December 31, 2016.market discount rate and the change in net present value from these hypothetical changes in the market discount rate are measured. An instantaneous 100 basis point increase in the one-month LIBOR ratedecrease would increase interest paymentsthe fair market value on notes payable by $194,000.$988,000. Conversely, an instantaneous 100 basis point decreaseincrease would decrease interest paymentsthe fair market value on notes payable by $194,000.$945,000.
Credit Risk
Atlas is exposed to credit risk principally through its fixed income securities and balances receivable from policyholders and reinsurers. Atlas controls and monitors concentration and credit quality risk through policies to limit and monitor its exposure to individual issuers or related groups (with the exception of U.S. Government bonds) as well as through ongoing review of the credit ratings of issuers held in the securities portfolio. Atlas’ credit exposure to any one individual policyholder is not material. Atlas has policies requiring evaluation of the financial condition of its reinsurers and monitors concentrations of credit risk arising from similar geographic regions, activities, or economic characteristics of the reinsurers to minimize its exposure to significant losses from reinsurer insolvency.
Equity price risk
This is the risk of loss due to adverse movements in equity prices. Atlas'Atlas’ investment in equity securities comprises a small percentage of its total portfolio, and as a result, the exposure to this type of risk is minimal.
Foreign currency risk
Atlas is not currently exposed to material changes in the U.S. dollar currency exchange rates with any other foreign currency.
Liquidity and Cash Flow Risk
Liquidity risk is the risk of having insufficient cash resources to meet current financial obligations without raising funds at unfavorable rates or selling assets on a forced basis. Liquidity risk arises from general business activities and in the course of managing the assets and liabilities of Atlas. There is the risk of loss to the extent that the sale of a security prior to its maturity is required to provide liquidity to satisfy policyholder and other cash outflows. Cash flow risk arises from risk that future inflation of policyholder cash flow exceeds returns on long-term investment securities. The purpose of liquidity and cash flow management is to ensure that there is sufficient cash to meet all financial commitments and obligations as they fall due. The liquidity and cash flow requirements of Atlas’ business have been met primarily by funds generated from operations, asset maturities and income and other returns received on securities. Cash provided from these sources is used primarily for claims and claims adjustment expense payments and operating expenses. The timing and amount of catastrophe and/or single large loss claims are inherently unpredictable and may create increased liquidity requirements. We purchase reinsurance coverage in an effort to mitigate the risk of an unexpected rise in claims severity or frequency from catastrophe and/or single large loss claims. The availability, amount and cost of the reinsurance depend on market conditions and may fluctuate significantly.
Underwriting Risk
Underwriting risk is the risk that the total cost of claims and acquisition expenses will exceed premiums received and can arise from numerous factors, including pricing risk, reserving risk, catastrophic claims risk, reinsurance coverage risk and the risk that claims and claims adjustment expense reserves are not sufficient.
Item 8. Financial Statements and Supplemental Schedules
Report of Independent Registered Public Accounting Firm
on Internal Controls over Financial Reporting
Board of Directors and Shareholders
Atlas Financial Holdings, Inc.
Schaumburg, Illinois
Opinion on Internal Control over Financial Reporting
We have audited Atlas Financial Holdings, Inc.’s (the “Company’s”) internal control over financial reporting as of December 31, 2016,2017, based on criteria established in Internal Control - Integrated Framework (2013)issued by the Committee of Sponsoring Organizations of the Treadway Commission (the “COSO criteria”). In our opinion, the Company maintained, in all material respects, effective internal control over financial reporting as of December 31, 2017, based on the COSO criteria)criteria. Atlas Financial Holdings, Inc.’s
We also have audited, in accordance with the standards of the Public Company Accounting Oversight Board (United States) (“PCAOB”), the consolidated statements of financial position of the Company and subsidiaries as of December 31, 2017 and 2016, the related consolidated statements of income (loss) and comprehensive income (loss), shareholders’ equity, and cash flows for each of the three years in the period ended December 31, 2017, and the related notes and financial statement schedules listed in the accompanying index, and our report dated April 2, 2018 expressed an unqualified opinion thereon.
Basis for Opinion
The Company’s management is responsible for maintaining effective internal control over financial reporting and for its assessment of the effectiveness of internal control over financial reporting, included in the accompanying Item“Item 9A, Management’s Report on Internal Control Overover Financial Reporting.Reporting”. Our responsibility is to express an opinion on the company’sCompany’s internal control over financial reporting based on our audit.
We are a public accounting firm registered with the PCAOB and are required to be independent with respect to the Company in accordance with U.S. federal securities laws and the applicable rules and regulations of the Securities and Exchange Commission and the PCAOB.
We conducted our audit of internal control over financial reporting in accordance with the standards of the Public Company Accounting Oversight Board (United States).PCAOB. Those standards require that we plan and perform the audit to obtain reasonable assurance about whether effective internal control over financial reporting was maintained in all material respects. Our audit included obtaining an understanding of internal control over financial reporting, assessing the risk that a material weakness exists, and testing and evaluating the design and operating effectiveness of internal control based on the assessed risk. Our audit also included performing such other procedures as we considered necessary in the circumstances. We believe that our audit provides a reasonable basis for our opinion.
Definition and Limitations of Internal Control over Financial Reporting
A company’s internal control over financial reporting is a process designed to provide reasonable assurance regarding the reliability of financial reporting and the preparation of financial statements for external purposes in accordance with generally accepted accounting principles. A company’s internal control over financial reporting includes those policies and procedures that (1) pertain to the maintenance of records that, in reasonable detail, accurately and fairly reflect the transactions and dispositions of the assets of the company; (2) provide reasonable assurance that transactions are recorded as necessary to permit preparation of financial statements in accordance with generally accepted accounting principles, and that receipts and expenditures of the company are being made only in accordance with authorizations of management and directors of the company; and (3) provide reasonable assurance regarding prevention or timely detection of unauthorized acquisition, use, or disposition of the company’s assets that could have a material effect on the financial statements.
Because of its inherent limitations, internal control over financial reporting may not prevent or detect misstatements. Also, projections of any evaluation of effectiveness to future periods are subject to the risk that controls may become inadequate because of changes in conditions, or that the degree of compliance with the policies or procedures may deteriorate.
In our opinion, /s/ BDO USA, LLP
Grand Rapids, MI
April 2, 2018
Report of Independent Registered Public Accounting Firm
Shareholders and Board of Directors
Atlas Financial Holdings, Inc. maintained, in all material respects, effective internal control over financial reporting as of December 31, 2016, based
Schaumburg, Illinois
Opinion on the COSO criteria.Consolidated Financial Statements
We also have audited in accordance with the standards of the Public Company Accounting Oversight Board (United States), theaccompanying consolidated statements of financial position of Atlas Financial Holdings, Inc. (the “Company”) and subsidiaries as of December 31, 20162017 and 2015, and2016, the related consolidated statements of income (loss) and comprehensive income (loss), shareholders’ equity, and cash flows for each of the three years in the period ended December 31, 2016,2017, and our report dated March 13, 2017 expressed an unqualified opinion thereon.
/s/ BDO USA, LLP
Grand Rapids, Michigan
March 13, 2017
Report of Independent Registered Public Accounting Firm
Board of Directorsthe related notes and Shareholders
Atlas Financial Holdings, Inc.
We have auditedfinancial statement schedules listed in the accompanying index (collectively referred to as the “consolidated financial statements”). In our opinion, the consolidated financial statements ofpresent fairly, in all material respects, the financial position of Atlas Financial Holdings, Inc. as ofthe Company and subsidiaries at December 31, 2017 and 2016, and 2015the results of their operations and the related consolidated statements of income and comprehensive income, shareholders’ equity, andtheir cash flows for each of the three years in the period ended December 31, 2016. In connection with our audits of the consolidated financial statements, we have also audited the financial statements schedules listed in the accompanying index. These consolidated financial statements and financial statement schedules are the responsibility of the Company’s management. Our responsibility is to express an opinion on these financial statements and schedules based on our audits.
We conducted our audits in accordance with the standards of the Public Company Accounting Oversight Board (United States). Those standards require that we plan and perform the audit to obtain reasonable assurance about whether the financial statements are free of material misstatement. An audit includes examining, on a test basis, evidence supporting the amounts and disclosures in the financial statements, assessing the accounting principles used and significant estimates made by management, as well as evaluating the overall presentation of the financial statements and schedules. We believe that our audits provide a reasonable basis for our opinion.
In our opinion, the consolidated financial statements referred to above present fairly, in all material respects, the financial position of Atlas Financial Holdings, Inc. as of December 31, 2016 and 2015, and the results of its operations and its cash flows for the each of the three years in the period ended December 31, 2016,2017, in conformity with accounting principles generally accepted in the United States of America.
Also, in our opinion, the financial statement schedules, when considered in relation to the consolidated financial statements taken as a whole, present fairly, in all material respects, the information set forth therein.
We also have audited, in accordance with the standards of the Public Company Accounting Oversight Board (United States) (“PCAOB”), Atlas Financial Holdings, Inc.’sthe Company's internal control over financial reporting as of December 31, 2016,2017, based on criteria established in Internal Control - Integrated Framework (2013) issued by the Committee of Sponsoring Organizations of the Treadway Commission (COSO)(“COSO”) and our report dated March 13, 2017April 2, 2018 expressed an unqualified opinion thereon.
Basis for Opinion
These consolidated financial statements are the responsibility of the Company’s management. Our responsibility is to express an opinion on the Company’s consolidated financial statements based on our audits. We are a public accounting firm registered with the PCAOB and are required to be independent with respect to the Company in accordance with the U.S. federal securities laws and the applicable rules and regulations of the Securities and Exchange Commission and the PCAOB.
We conducted our audits in accordance with the standards of the PCAOB. Those standards require that we plan and perform the audit to obtain reasonable assurance about whether the consolidated financial statements are free of material misstatement, whether due to error or fraud.
Our audits included performing procedures to assess the risks of material misstatement of the consolidated financial statements, whether due to error or fraud, and performing procedures that respond to those risks. Such procedures included examining, on a test basis, evidence regarding the amounts and disclosures in the consolidated financial statements. Our audits also included evaluating the accounting principles used and significant estimates made by management, as well as evaluating the overall presentation of the consolidated financial statements. We believe that our audits provide a reasonable basis for our opinion.
/s/ BDO USA, LLP
We have served as the Company's auditor since 2014.
Grand Rapids, MichiganMI
March 13, 2017April 2, 2018
ATLAS FINANCIAL HOLDINGS, INC.
CONSOLIDATED STATEMENTS OF FINANCIAL POSITION
($ in '000s,‘000s, except for share and per share data)
| | | | December 31,
2016 | | December 31,
2015 | December 31,
2017 | | December 31,
2016 |
| Assets | | | | | | |
| Investments, available for sale | | | | | | |
| Fixed income securities, at fair value (amortized cost $157,451and $185,455) | $ | 156,487 |
| | $ | 183,773 |
| |
| Equity securities, at fair value (cost $5,598 and $4,147) | 6,223 |
| | 4,240 |
| |
| Fixed income securities, at fair value (amortized cost $158,411 and $157,451) | | $ | 157,984 |
| | $ | 156,487 |
|
| Equity securities, at fair value (cost $7,969 and $5,598) | | 8,446 |
| | 6,223 |
|
| Other investments | 32,181 |
| | 22,937 |
| 31,438 |
| | 32,181 |
|
| Total Investments | 194,891 |
| | 210,950 |
| 197,868 |
| | 194,891 |
|
| Cash and cash equivalents | 29,888 |
| | 22,354 |
| 45,615 |
| | 29,888 |
|
| Accrued investment income | 1,228 |
| | 1,036 |
| 1,248 |
| | 1,228 |
|
| Premiums receivable (net of allowance of $2,366 and $846) | 77,386 |
| | 82,529 |
| |
| Premiums receivable (net of allowance of $3,418 and $2,366) | | 79,664 |
| | 77,386 |
|
| Reinsurance recoverables on amounts paid | 7,786 |
| | 3,277 |
| 7,982 |
| | 7,786 |
|
| Reinsurance recoverables on amounts unpaid | 35,370 |
| | 29,399 |
| 53,402 |
| | 35,370 |
|
| Prepaid reinsurance premiums | 13,372 |
| | 17,412 |
| 12,878 |
| | 13,372 |
|
| Deferred policy acquisition costs | 13,222 |
| | 10,235 |
| 14,797 |
| | 13,222 |
|
| Deferred tax asset, net | 18,498 |
| | 17,166 |
| 16,985 |
| | 18,498 |
|
| Goodwill | 2,726 |
| | 2,726 |
| 2,726 |
| | 2,726 |
|
| Intangible assets, net | 4,535 |
| | 4,925 |
| 4,145 |
| | 4,535 |
|
| Property and equipment, net | 11,770 |
| | 2,589 |
| 24,439 |
| | 11,770 |
|
| Other assets | 12,905 |
| | 6,694 |
| 20,754 |
| | 12,905 |
|
| Total Assets | $ | 423,577 |
| | $ | 411,292 |
| $ | 482,503 |
| | $ | 423,577 |
|
| | | | | | | |
| Liabilities | | | | | | |
| Claims liabilities | $ | 139,004 |
| | $ | 127,011 |
| $ | 211,648 |
| | $ | 139,004 |
|
| Unearned premiums | 113,171 |
| | 108,202 |
| |
| Unearned premium reserves | | 128,043 |
| | 113,171 |
|
| Due to reinsurers | 8,369 |
| | 10,781 |
| 8,411 |
| | 8,369 |
|
| Notes payable, net | 19,187 |
| | 17,219 |
| 24,031 |
| | 19,187 |
|
| Other liabilities and accrued expenses | 16,504 |
| | 18,457 |
| 19,725 |
| | 16,504 |
|
| Total Liabilities | $ | 296,235 |
| | $ | 281,670 |
| $ | 391,858 |
| | $ | 296,235 |
|
| Commitments and contingencies (see Note 8) |
| |
|
| |
|
| Shareholders’ Equity | | | | | | |
| Preferred shares, $0.001 par value, 100,000,000 shares authorized, shares issued and outstanding: December 31, 2016 - 0 and December 31, 2015 - 6,940,500. Liquidation value $1.00 per share | $ | — |
| | $ | 6,941 |
| |
| Ordinary voting common shares, $0.003 par value, 266,666,667 shares authorized, shares issued and outstanding: December 31, 2016 - 11,895,104 and December 31, 2015 - 11,883,025 | 36 |
| | 36 |
| |
| Restricted voting common shares, $0.003 par value, 33,333,334 shares authorized, shares issued and outstanding: December 31, 2016 - 128,191 and December 31, 2015 - 132,863 | — |
| | — |
| |
| Ordinary voting common shares, $0.003 par value, 266,666,667 shares authorized, shares issued and outstanding: December 31, 2017 - 12,164,041 and December 31, 2016 - 11,895,104 | | $ | 36 |
| | $ | 36 |
|
| Restricted voting common shares, $0.003 par value, 33,333,334 shares authorized, shares issued and outstanding: December 31, 2017 - 0 and December 31, 2016 - 128,191 | | — |
| | — |
|
| Additional paid-in capital | 199,244 |
| | 198,041 |
| 201,105 |
| | 199,244 |
|
| Retained deficit | (71,718 | ) | | (74,364 | ) | (110,535 | ) | | (71,718 | ) |
| Accumulated other comprehensive loss, net of tax | (220 | ) | | (1,032 | ) | |
| Total Shareholders’ Equity | $ | 127,342 |
| | $ | 129,622 |
| |
| Total Liabilities and Shareholders’ Equity | $ | 423,577 |
| | $ | 411,292 |
| |
| Accumulated other comprehensive income (loss), net of tax | | 39 |
| | (220 | ) |
| Total Shareholders' Equity | | $ | 90,645 |
| | $ | 127,342 |
|
| Total Liabilities and Shareholders' Equity | | $ | 482,503 |
| | $ | 423,577 |
|
See accompanying Notes to Consolidated Financial Statements.
ATLAS FINANCIAL HOLDINGS, INC.
CONSOLIDATED STATEMENTS OF INCOME (LOSS) AND COMPREHENSIVE INCOME (LOSS)
($ in '000s,‘000s, except for share and per share data)
| | | Consolidated Statements of Income | Year Ended December 31, | |
| Consolidated Statements of Income (Loss) | | Year Ended December 31, |
| | 2016 | | 2015 | | 2014 | 2017 | | 2016 | | 2015 |
| Net premiums earned | $ | 171,058 |
| | $ | 152,064 |
| | $ | 98,124 |
| $ | 215,771 |
| | $ | 171,058 |
| | $ | 152,064 |
|
| Net investment income | 4,824 |
| | 3,976 |
| | 3,110 |
| 4,897 |
| | 4,824 |
| | 3,976 |
|
| Net realized investment gains | 1,230 |
| | 455 |
| | 382 |
| |
| Net realized gains | | 872 |
| | 1,230 |
| | 455 |
|
| Other income | 467 |
| | 356 |
| | 2 |
| 435 |
| | 467 |
| | 356 |
|
| Total revenue | 177,579 |
| | 156,851 |
| | 101,618 |
| 221,975 |
| | 177,579 |
| | 156,851 |
|
| Net claims incurred | 134,746 |
| | 89,994 |
| | 61,078 |
| 203,873 |
| | 134,746 |
| | 89,994 |
|
| Acquisition costs | 18,803 |
| | 18,592 |
| | 14,048 |
| 27,885 |
| | 18,803 |
| | 18,592 |
|
| Other underwriting expenses | 28,399 |
| | 23,269 |
| | 13,863 |
| 32,140 |
| | 28,399 |
| | 23,269 |
|
| Amortization of intangible assets | 390 |
| | 315 |
| | — |
| 390 |
| | 390 |
| | 315 |
|
| Interest expense | 1,026 |
| | 694 |
| | — |
| 1,840 |
| | 1,026 |
| | 694 |
|
| Expenses (recovered) incurred pursuant to stock purchase agreements | (6,297 | ) | | 942 |
| | — |
| — |
| | (6,297 | ) | | 942 |
|
| Expenses incurred related to acquisition of subsidiaries | — |
| | 999 |
| | 694 |
| — |
| | — |
| | 999 |
|
| Total expenses | 177,067 |
| | 134,805 |
| | 89,683 |
| 266,128 |
| | 177,067 |
| | 134,805 |
|
| Income from operations before income tax expense | 512 |
| | 22,046 |
| | 11,935 |
| |
| (Loss) income from operations before income taxes | | (44,153 | ) | | 512 |
| | 22,046 |
|
| Income tax (benefit) expense | (2,134 | ) | | 7,616 |
| | (5,767 | ) | (5,343 | ) | | (2,134 | ) | | 7,616 |
|
| Net income | 2,646 |
| | 14,430 |
| | 17,702 |
| |
| Net (loss) income | | (38,810 | ) | | 2,646 |
| | 14,430 |
|
| Less: Preferred share dividends | 281 |
| | 276 |
| | 94 |
| — |
| | 281 |
| | 276 |
|
| Net income attributable to common shareholders | $ | 2,365 |
| | $ | 14,154 |
| | $ | 17,608 |
| |
| Net (loss) income attributable to common shareholders | | $ | (38,810 | ) | | $ | 2,365 |
| | $ | 14,154 |
|
| | | | | | | | | | | |
| Basic weighted average common shares outstanding | 12,045,519 | | 11,975,579 | | 10,937,181 | 12,064,880 | | 12,045,519 | | 11,975,579 |
| Earnings per common share basic | $ | 0.20 |
| | $ | 1.18 |
| | $ | 1.61 |
| |
| (Loss) earnings per common share basic | | $ | (3.22 | ) | | $ | 0.20 |
| | $ | 1.18 |
|
| Diluted weighted average common shares outstanding | 12,222,883 | | 12,735,679 | | 11,341,588 | 12,064,880 | | 12,222,883 | | 12,735,679 |
| Earnings per common share diluted | $ | 0.19 |
| | $ | 1.13 |
| | $ | 1.56 |
| |
| (Loss) earnings per common share diluted | | $ | (3.22 | ) | | $ | 0.19 |
| | $ | 1.13 |
|
| | | | | | | | | | | |
| Consolidated Statements of Comprehensive Income | | | | | | |
| Consolidated Statements of Comprehensive Income (Loss) | | | | | | |
| | | | | | | | | | | |
| Net income | $ | 2,646 |
| | $ | 14,430 |
| | $ | 17,702 |
| |
| Net (loss) income | | $ | (38,810 | ) | | $ | 2,646 |
| | $ | 14,430 |
|
| | | | | | | | | | | |
| Other comprehensive income (loss): | | | | | | | | | | |
| Changes in net unrealized investment gains (losses) | 855 |
| | (1,912 | ) | | 2,029 |
| 437 |
| | 855 |
| | (1,912 | ) |
| Reclassification to income of net realized investment gains | 394 |
| | 203 |
| | 257 |
| |
| Effect of income tax | (437 | ) | | 597 |
| | (777 | ) | |
| Reclassification to net (loss) income | | (49 | ) | | 394 |
| | 203 |
|
| Effect of income taxes | | (136 | ) | | (437 | ) | | 597 |
|
| Other comprehensive income (loss) | 812 |
| | (1,112 | ) | | 1,509 |
| 252 |
| | 812 |
| | (1,112 | ) |
| Total comprehensive income | $ | 3,458 |
| | $ | 13,318 |
| | $ | 19,211 |
| |
| | | | | | | |
| Total comprehensive (loss) income | | $ | (38,558 | ) | | $ | 3,458 |
| | $ | 13,318 |
|
See accompanying Notes to Consolidated Financial Statements.
ATLAS FINANCIAL HOLDINGS, INC.
CONSOLIDATED STATEMENTS OF SHAREHOLDERS’ EQUITY
($ in '000s)‘000s)
| |
| Preferred Shares | Ordinary Voting Common Shares | Restricted Voting Common Shares | Additional Paid-in Capital | Retained Deficit | Accumulated Other Comprehensive (Loss) Income | Total Share-holders' Equity | Ordinary Voting Common Shares | Restricted Voting Common Shares | Additional Paid-In Capital | Retained Deficit | Accumulated Other Comprehensive Income (Loss) | Total Shareholders' Equity |
| Balance December 31, 2013 | $ | 2,000 |
| $ | 28 |
| $ | — |
| $ | 169,595 |
| $ | (106,496 | ) | $ | (1,429 | ) | $ | 63,698 |
| |
Balance December 31, 2014 r | | $ | 34 |
| $ | — |
| $ | 196,079 |
| $ | (88,794 | ) | $ | 80 |
| $ | 107,399 |
|
| Net income | — |
| — |
| — |
| — |
| 17,702 |
| — |
| 17,702 |
| — |
| — |
| — |
| 14,430 |
| — |
| 14,430 |
|
| Proceeds from U.S. public offering, net of offering costs | — |
| 6 |
| — |
| 25,015 |
| — |
| — |
| 25,021 |
| |
| Other comprehensive income | — |
| — |
| — |
| — |
| — |
| 1,509 |
| 1,509 |
| |
| Share-based compensation | — |
| — |
| — |
| 1,469 |
| — |
| — |
| 1,469 |
| |
| Balance December 31, 2014 | $ | 2,000 |
| $ | 34 |
| $ | — |
| $ | 196,079 |
| $ | (88,794 | ) | $ | 80 |
| $ | 109,399 |
| |
| Net income | — |
| — |
| — |
| — |
| 14,430 |
| — |
| 14,430 |
| |
| Issuance of preferred shares | 4,941 |
| — |
| — |
| — |
| — |
| — |
| 4,941 |
| |
| Other comprehensive loss | — |
| — |
| — |
| — |
| — |
| (1,112 | ) | (1,112 | ) | — |
| — |
| — |
| — |
| (1,112 | ) | (1,112 | ) |
| Options exercised | — |
| — |
| — |
| 145 |
| — |
| — |
| 145 |
| — |
| — |
| 145 |
| — |
| — |
| 145 |
|
| Share-based compensation | — |
| 2 |
| — |
| 1,817 |
| — |
| — |
| 1,819 |
| 2 |
| — |
| 1,817 |
| — |
| — |
| 1,819 |
|
| Balance December 31, 2015 | $ | 6,941 |
| $ | 36 |
| $ | — |
| $ | 198,041 |
| $ | (74,364 | ) | $ | (1,032 | ) | $ | 129,622 |
| |
Balance December 31, 2015 r | | $ | 36 |
| $ | — |
| $ | 198,041 |
| $ | (74,364 | ) | $ | (1,032 | ) | $ | 122,681 |
|
| Net income | — |
| — |
| — |
| — |
| 2,646 |
| — |
| 2,646 |
| — |
| — |
| — |
| 2,646 |
| — |
| 2,646 |
|
| Preferred dividends paid | — |
| — |
| — |
| (409 | ) | — |
| — |
| (409 | ) | — |
| — |
| (409 | ) | — |
| — |
| (409 | ) |
| Retirement of preferred shares | (6,941 | ) | — |
| — |
| — |
| — |
| — |
| (6,941 | ) | |
| Other comprehensive income | — |
| — |
| — |
| — |
| — |
| 812 |
| 812 |
| — |
| — |
| — |
| — |
| 812 |
| 812 |
|
| Share-based compensation | — |
| — |
| — |
| 1,612 |
| — |
| — |
| 1,612 |
| — |
| — |
| 1,612 |
| — |
| — |
| 1,612 |
|
| Balance December 31, 2016 | $ | — |
| $ | 36 |
| $ | — |
| $ | 199,244 |
| $ | (71,718 | ) | $ | (220 | ) | $ | 127,342 |
| $ | 36 |
| $ | — |
| $ | 199,244 |
| $ | (71,718 | ) | $ | (220 | ) | $ | 127,342 |
|
| ASU 2018-02, reclassification of certain tax effects | | — |
| — |
| — |
| (7 | ) | 7 |
| — |
|
| Net loss | | — |
| — |
| — |
| (38,810 | ) | — |
| (38,810 | ) |
| Other comprehensive income | | — |
| — |
| — |
| — |
| 252 |
| 252 |
|
| Options exercised | | — |
| — |
| 655 |
| — |
| — |
| 655 |
|
| Share-based compensation | | — |
| — |
| 1,176 |
| — |
| — |
| 1,176 |
|
| Other | | — |
| — |
| 30 |
| — |
| — |
| 30 |
|
| Balance December 31, 2017 | | $ | 36 |
| $ | — |
| $ | 201,105 |
| $ | (110,535 | ) | $ | 39 |
| $ | 90,645 |
|
r - Prior to the year ended December 31, 2017, the Company presented preferred shares issued as contingent consideration within the permanent equity section of the Consolidated Statements of Financial Position. In accordance with Financial Accounting Standards Board (“FASB”) ASC Topic 480 - Distinguishing Liabilities from Equity, contingent consideration issued as preferred shares wherein the number of shares to be issued is variable should be classified outside of permanent equity and reflected as mezzanine equity on the Consolidated Statements of Financial Position.
For the year ended December 31, 2017, the Company has restated the Consolidated Statements of Shareholders’ Equity to remove the preferred shares and related activity as previously stated for the periods as of January 1, 2015 and for the years ended December 31, 2015 and 2016. Although this impacted total equity for 2015, it had no impact on total equity as of December 31, 2016 due to the redemption and clawback of preferred shares previously issued. In addition, this change did not impact the Consolidated Statements of Financial Position, Consolidated Statements of Income (Loss) and Comprehensive Income (Loss), earnings per common share or the Consolidated Statements of Cash Flows. The Company has evaluated the effect of the incorrect presentation in the prior period, both qualitatively and quantitatively, and concluded that it did not have a material impact on, nor did it require amendment of, any previously filed annual or quarterly consolidated financial statements. See Note 20, ‘Change in Accounting Principle and Error Corrections’ for additional information regarding the preferred shares restatement.
See accompanying Notes to Consolidated Financial Statements.
ATLAS FINANCIAL HOLDINGS, INC.
CONSOLIDATED STATEMENTS OF CASH FLOWS
($ in '000s)‘000s)
| | | | Year Ended December 31, | Year Ended December 31, |
| | 2016 | | 2015 | | 2014 | 2017 | | 2016 | | 2015 |
| Operating activities: | | | | | | | | | | |
| Net income | $ | 2,646 |
| | $ | 14,430 |
| | $ | 17,702 |
| |
| Adjustments to reconcile net income to net cash provided by operating activities: | | | | | | |
| Net (loss) income | | $ | (38,810 | ) | | $ | 2,646 |
| | $ | 14,430 |
|
| Adjustments to reconcile net (loss) income to net cash flows provided by operating activities: | | | | | | |
| Depreciation and amortization of property and equipment | 1,000 |
| | 966 |
| | 856 |
| 1,372 |
| | 1,000 |
| | 966 |
|
| Share-based compensation expense | 1,612 |
| | 1,819 |
| | 1,469 |
| 1,176 |
| | 1,612 |
| | 1,819 |
|
| Amortization of deferred gain on sale of headquarters building | (43 | ) | | (43 | ) | | (43 | ) | (17 | ) | | (43 | ) | | (43 | ) |
| Amortization of intangible assets | 390 |
| | 315 |
| | — |
| 390 |
| | 390 |
| | 315 |
|
| Deferred income taxes | 452 |
| | (174 | ) | | (8,776 | ) | 1,376 |
| | 452 |
| | (174 | ) |
| Net realized gains | (1,230 | ) | | (455 | ) | | (382 | ) | (872 | ) | | (1,230 | ) | | (455 | ) |
| Gain in equity of investees | (1,271 | ) | | (1,238 | ) | | (632 | ) | (810 | ) | | (1,271 | ) | | (1,238 | ) |
| Amortization of bond premiums and discounts | 1,217 |
| | 1,525 |
| | 756 |
| 961 |
| | 1,217 |
| | 1,525 |
|
| Amortization of financing costs | 67 |
| | 56 |
| | — |
| 365 |
| | 67 |
| | 56 |
|
| Expenses (recovered) incurred pursuant to stock purchase agreements | (6,623 | ) | | 941 |
| | — |
| — |
| | (6,623 | ) | | 941 |
|
| Net changes in operating assets and liabilities (net of acquisition): | | | | | | |
| Premiums receivable and other assets, net | (1,067 | ) | | (26,188 | ) | | (11,826 | ) | |
| Due from reinsurers and other insurers | (6,440 | ) | | (7,931 | ) | | (2,925 | ) | |
| Net changes in operating assets and liabilities: | | | | | | |
| Accrued investment income | | (20 | ) | | (192 | ) | | (13 | ) |
| Premiums receivable, net | | (2,278 | ) | | 5,143 |
| | (35,144 | ) |
| Due from reinsurers and prepaid reinsurance premiums | | (17,735 | ) | | (6,440 | ) | | (7,931 | ) |
| Deferred policy acquisition costs | (2,987 | ) | | (240 | ) | | (1,492 | ) | (1,575 | ) | | (2,987 | ) | | (240 | ) |
| Accrued investment income | (192 | ) | | (13 | ) | | 34 |
| |
| Other assets | | (7,847 | ) | | (6,210 | ) | | 8,956 |
|
| Claims liabilities | 11,993 |
| | (6,150 | ) | | 1,045 |
| 72,644 |
| | 11,993 |
| | (6,150 | ) |
| Unearned premiums | 4,969 |
| | 26,276 |
| | 14,718 |
| |
| Due to reinsurers and other insurers | (2,412 | ) | | 3,542 |
| | (157 | ) | |
| Unearned premium reserves | | 14,872 |
| | 4,969 |
| | 26,276 |
|
| Due to reinsurers | | 42 |
| | (2,412 | ) | | 3,542 |
|
| Other liabilities and accrued expenses | (1,911 | ) | | 1,376 |
| | 3,369 |
| 3,238 |
| | (1,911 | ) | | 1,376 |
|
| Net cash flows provided by operating activities | 170 |
| | 8,814 |
| | 13,716 |
| 26,472 |
| | 170 |
| | 8,814 |
|
| | | | | | | | | | | |
| Investing activities: | | | | | | | | | | |
| Purchase of subsidiary (net of cash acquired) | — |
| | (10,956 | ) | | — |
| — |
| | — |
| | (10,956 | ) |
| Purchases of: | | | | | | | | | | |
| Fixed income securities | (58,061 | ) | | (78,921 | ) | | (31,671 | ) | (48,529 | ) | | (58,061 | ) | | (78,921 | ) |
| Equity securities | (2,000 | ) | | (3,340 | ) | | (1,969 | ) | (7,900 | ) | | (2,000 | ) | | (3,340 | ) |
| Other investments | (11,404 | ) | | (7,332 | ) | | (12,500 | ) | (3,615 | ) | | (11,404 | ) | | (7,332 | ) |
| Property, equipment and other | (10,181 | ) | | (713 | ) | | (1,167 | ) | (14,055 | ) | | (10,181 | ) | | (713 | ) |
| Proceeds from sale and maturity of: | | | | | | | | | | |
| Fixed income securities | 86,013 |
| | 59,395 |
| | 35,332 |
| 46,853 |
| | 86,013 |
| | 59,395 |
|
| Equity securities | 615 |
| | 1,402 |
| | 12 |
| 6,161 |
| | 615 |
| | 1,402 |
|
| Other investments | 3,430 |
| | — |
| | — |
| 5,174 |
| | 3,430 |
| | — |
|
| Property, equipment and other | | 2 |
| | — |
| | — |
|
| Assets held for sale | — |
| | 111 |
| | — |
| — |
| | — |
| | 111 |
|
| Net cash flows provided by (used in) investing activities | 8,412 |
| | (40,354 | ) | | (11,963 | ) | |
| Net cash flows (used in) provided by investing activities | | (15,909 | ) | | 8,412 |
| | (40,354 | ) |
| | | | | | | | | | | |
| Financing activities: | | | | | | | | | | |
| Preferred share buyback | (2,539 | ) | | — |
| | — |
| — |
| | (2,539 | ) | | — |
|
| Proceeds from U.S. public offering, net of offering costs | — |
| | — |
| | 25,021 |
| |
| Proceeds from notes payable, net of financing costs | 2,000 |
| | 17,663 |
| | — |
| |
| Capital contributions | | 30 |
| | — |
| | — |
|
| Proceeds from notes payable, net of issuance costs | | 23,879 |
| | 2,000 |
| | 17,663 |
|
| Repayment of notes payable | (100 | ) | | (500 | ) | | — |
| (19,400 | ) | | (100 | ) | | (500 | ) |
| Preferred dividends paid | (409 | ) | | — |
| | — |
| — |
| | (409 | ) | | — |
|
| Options exercised | — |
| | 145 |
| | 1 |
| 655 |
| | — |
| | 145 |
|
| Net cash flows (used in) provided by financing activities | (1,048 | ) | | 17,308 |
| | 25,022 |
| |
| Net cash flows provided by (used in) financing activities | | 5,164 |
| | (1,048 | ) | | 17,308 |
|
| | | | | | | | | | | |
| Net change in cash and cash equivalents | 7,534 |
| | (14,232 | ) | | 26,775 |
| 15,727 |
| | 7,534 |
| | (14,232 | ) |
| | | | | | | | | | | |
| Cash and cash equivalents, beginning of period | 22,354 |
| | 36,586 |
| | 9,811 |
| 29,888 |
| | 22,354 |
| | 36,586 |
|
| Cash and cash equivalents, end of period | $ | 29,888 |
| | $ | 22,354 |
| | $ | 36,586 |
| $ | 45,615 |
| | $ | 29,888 |
| | $ | 22,354 |
|
| | | Supplemental disclosure of cash information: | Year Ended December 31, | Year Ended December 31, |
| | 2016 | | 2015 | | 2014 | 2017 | | 2016 | | 2015 |
| Cash paid for: | | | | | | | | | | |
| Income taxes | $ | 7,015 |
| | $ | 8,636 |
| | $ | 3,308 |
| $ | 744 |
| | $ | 7,015 |
| | $ | 8,636 |
|
| Interest | 885 |
| | 567 |
| | — |
| 1,338 |
| | 885 |
| | 567 |
|
| | | | | | | | | | | |
| Supplemental disclosure of noncash investing and financing activities: | | | | | | | | | | |
| Issuance of preferred shares related to purchase of subsidiary | $ | — |
| | $ | 4,000 |
| | $ | — |
| $ | — |
| | $ | — |
| | $ | 4,000 |
|
| Issuance of preferred shares pursuant to Gateway stock purchase agreement | — |
| | 941 |
| | — |
| — |
| | — |
| | 941 |
|
| Redemption of preferred shares related to Gateway stock purchase agreement | (2,297 | ) | | — |
| | — |
| — |
| | (2,297 | ) | | — |
|
| Cancellation of preferred shares pursuant to Anchor stock purchase agreement | (4,000 | ) | | — |
| | — |
| — |
| | (4,000 | ) | | — |
|
See accompanying Notes to Consolidated Financial Statements.
ATLAS FINANCIAL HOLDINGS, INC.
NOTES TO CONSOLIDATED FINANCIAL STATEMENTS
| |
| 1. | NATURE OF OPERATIONS AND BASIS OF PRESENTATION |
Atlas Financial Holdings, Inc. ("Atlas"(“Atlas” or "We"“We” or the "Company"“Company”) commenced operations on December 31, 2010. The primary business of Atlas is underwriting commercial automobile insurance in the United States, with a niche market orientation and focus on insurance for the “light” commercial automobile sector. This sector includes taxi cabs, non-emergency para-transit, limousine, livery and business autos. Automobile insurance products provide insurance coverage in three major areas: liability, accident benefits and physical damage. Liability insurance provides coverage subject to policy terms and conditions where the insured is determined to be responsible and/or liable for an automobile accident, for the payment for injuries and property damage to third parties. Accident benefit policies or personal injury protection policies provide coverage for loss of income, medical and rehabilitation expenses for insured persons who are injured in an automobile accident, regardless of fault. Physical damage coverage subject to policy terms and conditions provides for the payment of damages to an insured automobile arising from a collision with another object or from other risks such as fire or theft. In the short run, automobile physical damage and liability coverage generally provides more predictable results than automobile accident benefit or personal injury insurance.
Atlas'Atlas’ business is carried out through its "Insurance Subsidiaries"“Insurance Subsidiaries”: American Country Insurance Company (“American Country”), American Service Insurance Company, Inc. (“American Service”), Gateway Insurance Company ("Gateway"(“Gateway”), and as of March 11, 2015, Global Liberty Insurance Company of New York ("(“Global Liberty"Liberty”); and other non-insurance company subsidiaries: Anchor Group Management Inc. ("(“Anchor Management"Management”), Plainview Premium Finance Company, Inc. ("(“Plainview Delaware"Delaware”) and, Plainview Delaware's wholly-ownedDelaware’s wholly owned subsidiary, Plainview Premium Finance Company of California, Inc. ("(“Plainview California"California” and together with Plainview Delaware, "Plainview"“Plainview”), UBI Holdings Inc. (“UBI Holdings”) and UBI Holdings’ wholly-owned subsidiary, DriveOn Digital IP Inc. (“DOIP” and together with UBI Holdings, “UBI”).
The Insurance Subsidiaries distribute their insurance products through a network of retail independent agents. Together, the Insurance Subsidiaries are licensed to write property and casualty insurance in 49 states and the District of Columbia in the United States. Atlas'Atlas’ core products are actively distributed in 42 of those states plus the District of Columbia. The Insurance Subsidiaries share common management and operating infrastructure.
Atlas'Atlas’ ordinary voting common shares are listed on the NASDAQ stock exchange under the symbol "AFH."“AFH.”
Basis of presentation - These statements have been prepared in conformity with accounting principles generally accepted in the United States of America ("(“U.S. GAAP"GAAP”). The consolidated financial statements include the accounts of Atlas and the entities it controls. Equity investments in entities that we do not consolidate, including corporate entities in which we have significant influence and partnership and partnership-like entities in which we have more than minor influence over operating and financial policies, are accounted for under the equity method unless we have elected the fair value option. All significant intercompany accounts and transactions have been eliminated.
Seasonality - The property and casualty ("(“P&C"&C”) insurance business is seasonal in nature. While Atlas'Atlas’ net premiums earned are generally stable from quarter to quarter, Atlas'Atlas’ gross premiums written follow the common renewal dates for the "light"“light” commercial risks that represent its core lines of business. For example, January 1 and March 1 are common taxi cab renewal dates in Illinois and New York, respectively. Additionally, we implemented our New York “excess taxi program” in the third quarter of 2012, which has an annual renewal date in the third quarter. Net underwriting income is driven mainly by the timing and nature of claims, which can vary widely.
Summary of Significant Accounting Policies
Principles of consolidation - The consolidated financial statements include the accounts of Atlas and the entities it controls. Subsidiaries are entities over which Atlas, directly or indirectly, has the power to govern the financial and operating policies in order to obtain the benefits from their activities, generally accompanying an equity shareholding of more than one half of the voting rights. Subsidiaries are fully consolidated from the date on which control is transferred to Atlas and would be de-consolidated from the date that control ceases. The operating results of subsidiaries acquired or disposed of during the year will be included in the consolidated statements of income (loss) and comprehensive income (loss) from the effective date of acquisition and up to the effective date of disposal, as appropriate. All significant intercompany transactions and balances are eliminated in consolidation. Accounting policies of subsidiaries have been changed where necessary to ensure consistency with the policies adopted by Atlas.
The following are Atlas’ subsidiaries, all of which are 100% owned, either directly or indirectly, together with the jurisdiction of incorporation, that are included in consolidated financial statements:
American Insurance Acquisition Inc. (Delaware)
American Country Insurance Company (Illinois)
American Service Insurance Company, Inc. (Illinois)
Camelot Services, Inc. (Missouri) - merged into American Insurance Acquisition Inc. during the fourth quarter of 2014
Gateway Insurance Company (Missouri)
Anchor Holdings Group, Inc. (New York)
Global Liberty Insurance Company of New York (New York)
Plainview Premium Finance Company, Inc. (Delaware)
Plainview Premium Finance Company of California, Inc. (California)
Anchor Group Management Inc. (New York)
UBI Holdings Inc. (Delaware)
DriveOn Digital IP Inc. (Delaware)
Prior to the year ended December 31, 2017, the Company presented preferred shares issued as contingent consideration within the permanent equity section of the Consolidated Statements of Financial Position. In accordance with Financial Accounting Standards Board (“FASB”) ASC Topic 480 - Distinguishing Liabilities from Equity, contingent consideration issued as preferred shares wherein the number of shares to be issued is variable should be classified outside of permanent equity and reflected as mezzanine equity on the Consolidated Statements of Financial Position.
For the year ended December 31, 2017, the Company has restated the Consolidated Statements of Shareholders’ Equity to remove the preferred shares and related activity as previously stated for the periods as of January 1, 2015 and for the years ended December 31, 2015 and 2016. Although this impacted total equity for 2015, it had no impact on total equity as of December 31, 2016 due to the redemption and clawback of preferred shares previously issued. In addition, this change did not impact the Consolidated Statements of Financial Position, Consolidated Statements of Income (Loss) and Comprehensive Income (Loss), earnings per common share or the Consolidated Statements of Cash Flows. The Company has evaluated the effect of the incorrect presentation in the prior period, both qualitatively and quantitatively, and concluded that it did not have a material impact on, nor did it require amendment of, any previously filed annual or quarterly consolidated financial statements. See Note 20, ‘Change in Accounting Principle and Error Corrections’ for additional information regarding the preferred shares restatement.
Estimates and assumptions - The preparation of financial statements requires management to make estimates and assumptions that affect the reported amounts of assets and liabilities and the disclosure of contingent assets and liabilities at the date of the financial statements and reported amounts of revenues and expenses during the reporting period. Actual results could differ from these estimates and changes in estimates are recorded in the accounting period in which they are determined. The liability for unpaid claims and claims adjustment expenses and related amounts recoverable from reinsurers represents the most significant estimate in the accompanying financial statements, and differences between such changesestimates and actual results could be material. Significant estimates in the accompanying financial statements also include the fair values of investments, deferred policy acquisition cost recoverability, deferred tax asset valuation and business combinations.
Financial instruments - Financial instruments are recognized and derecognizedunrecognized using trade date accounting, since that is the date Atlas contractually commits to the purchase or sale with the counterparty.
Effective interest method - For securities other than mortgage backed and asset backed, Atlas utilizes the effective interest method to calculate the amortized cost of the financial asset and to amortize the premium or accrete the discount or premium over the remaining life. The effective interest rate is the rate that discounts the estimated future cash flows through the expected life of the financial instrument. Mortgage backed and asset backed securities are valued using the retrospective adjustment method, which uses the effective interest method and includes anticipated prepayments. Interest income is reported net of amortization of premium and accretion of discount. Realized gains and losses on disposition of available-for-sale securities are based on the net proceeds and the adjusted cost of the securities sold using the specific identification method.
Cash and cash equivalents - Cash and cash equivalents include cash and highly liquid securities with original maturities of 90 days or less.
Available for sale - Investments in fixed income and equity securities are classified as available for sale. Securities are classified as available for sale when Atlas may decide to sell those securities due to changes in market interest rates, liquidity needs, changes in yields or alternative investments, and for other reasons. Available-for-sale securities are carried at fair value, with unrealized gains and losses, net of income tax,taxes, included as a separate component of accumulated other comprehensive income (loss) in shareholders'shareholders’ equity.
Impairment of financial assets - Atlas assesses, on a quarterly basis, whether there is evidence that a financial asset or group of financial assets is impaired. An investment is considered impaired when the fair value of the investment is less than its cost or amortized cost. When an investment is impaired, the Company must make a determination as to whether the impairment is other-than-temporary.other than temporary.
The analysis includes some or all of the following procedures as deemed appropriate by management:
| |
| ◦ | identifying all security holdings in unrealized loss positions that have existed for at least six months or other circumstances that management believes may impact the recoverability of the security; |
| |
| ◦ | obtaining a valuation analysis from third party investment managers regarding these holdings based on their knowledge, experience and other market based valuation techniques; |
| |
| ◦ | reviewing the trading range of certain securities over the preceding calendar period; |
| |
| ◦ | assessing whether declines in market value are other than temporary for debt security holdings based on credit ratings from third party security rating agencies; and |
| |
| ◦ | determining the necessary provision for declines in market value that are considered other than temporary based on the analyses performed. |
The risks and uncertainties inherent in the assessment methodology utilized to determine declines in market value that are other than temporary include, but may not be limited to, the following:
| |
| ◦ | the opinion of professional investment managers could prove to be incorrect; |
| |
| ◦ | the past trading patterns of individual securities may not reflect future valuation trends; |
| |
| ◦ | the credit ratings assigned by independent credit rating agencies may prove to be incorrect due to unforeseen or unknown facts related to a company’s financial situation; and |
| |
| ◦ | the debt service pattern of non-investment grade securities may not reflect future debt service capabilities and may not reflect a company’s unknown underlying financial problems. |
Under Accounting Standards Codification ("ASC"(“ASC”), with respect to an investment in an impaired debt security, other-than-temporary impairment ("OTTI"(“OTTI”) occurs if (a) there is intent to sell the debt security, (b) it is more likely than not it will be required to sell the debt security before its anticipated recovery, or (c) it is probable that all amounts due will be unable to be collected such that the entire cost basis of the security will not be recovered. If Atlas intends to sell the debt security, or will more likely than not be required to sell the debt security before the anticipated recovery, a loss in the entire amount of the impairment is reflected in net investment gains (losses) on investments in the consolidated statements of income.income (loss). If Atlas determines that it is probable it will be unable to collect all amounts and Atlas has no intent to sell the debt security, a credit loss is recognized in net investment gains (losses) on investments in the consolidated statements of income (loss) to the extent that the present value of expected cash flows is less than the amortized cost basis; any difference between fair value and the new amortized cost basis (net of the credit loss) is reflected in other comprehensive income (losses), net of applicable income taxes.
For equity securities, the Company evaluates its ability to retain its investment in the issuer for a period of time sufficient to allow for any anticipated recovery in fair value. Evidence considered to determine anticipated recovery are analysts'analysts’ reports on the near-term prospects of the issuer and the financial condition of the issuer or the industry, in addition to the length and extent of the market value decline. If an OTTI is identified, the equity security is adjusted to fair value through a charge to earnings.
Fair values of financial instruments - Atlas has used the following methods and assumptions in estimating its fair value disclosures:
Fair values for investments are based on quoted market prices, when available. If quoted market prices are not available, fair values are based on quoted market prices of comparable instruments or values obtained from independent pricing services.
Atlas'
Atlas’ fixed income portfolio is managed by a SEC registered investment advisor specializing in the management of insurance company portfolios. Management works directly with them to ensure that Atlas benefits from their expertise and also evaluates investments as well as specific positions independently using internal resources. Atlas'Atlas’ investment advisor has a team of credit analysts for all investment grade fixed income sectors. The investment process begins with an independent analyst review of each security'ssecurity’s credit worthiness using both quantitative tools and qualitative review. At the issuer level, this includes reviews of past financial data, trends in financial stability, projections for the future, reliability of the management team in place, market data (credit spread, equity prices, trends in this data for the issuer and the issuer'sissuer’s industry). Reviews also consider industry trends and the macro-economic environment. This analysis is continuous, integrating new information as it becomes available. As of December 31, 2016,2017, this process did not generate any significant difference in the rating assessment between Atlas'Atlas’ review and the rating agencies.
Atlas employs specific control processes to determine the reasonableness of the fair value of its financial assets. These processes are designed to supplement those performed by Atlas'Atlas’ investment advisor to ensure that the values received from them are accurately recorded and that the data inputs and the valuation techniques utilized are appropriate, consistently applied, and that the assumptions are reasonable and consistent with the objective of determining fair value. For example, on a continuing basis, Atlas assesses the reasonableness of individual security values that have stale prices or whose changes exceed certain thresholds as compared to previous values received from Atlas'Atlas’ investment advisor or to expected prices. The portfolio is reviewed routinely for transaction volumes, new issuances, any changes in spreads, as well as the overall movement of interest rates along the yield curve to determine if sufficient activity and liquidity exists to provide a credible source for market valuations. When fair value determinations are expected to be more variable, they are validated through reviews by members of management or the Board of Directors who have relevant expertise and who are independent of those charged with executing investment transactions.
Atlas employs a fair value hierarchy to categorize the inputs it uses in valuation techniques to measure the fair value. The hierarchy is comprised of quoted prices in active markets (Level 1), third party pricing models using available trade, bid and market information (Level 2) and internal models without observable market information (Level 3). The Company recognizes transfers between levels of the fair value hierarchy at the end of the period in which events occur impacting the availability of inputs to the fair value methodology.
Premiums receivable - Premiums receivable include premium balances due and uncollected and installment premiums not yet due from agents and insureds.
Atlas evaluates the collectibility of accounts receivable based on a combination of factors. When aware of a specific customer'scustomer’s inability to meet its financial obligations, such as in the case of bankruptcy or deterioration in the customer'scustomer’s operating results or financial position, Atlas records a specific reserve for bad debt to reduce the related receivable to the amount Atlas reasonably believes is collectible. Atlas also records reserves for bad debt for all other customers based on a variety of factors, including the length of time the receivables are past due and historical collection experience. Accounts are reviewed for potential write-off on a case-by-case basis. Accounts deemed uncollectible are written off, net of expected recoveries. If circumstances related to specific customers change, estimates of the recoverability of receivables could be further adjusted.
Deferred policy acquisition costs ("DPAC"(“DPAC”) - Atlas defers producers’ commissions, premium taxes and other underwriting costs directly relating to the successful acquisition of premiums written to the extent they are considered recoverable. These costs are then expensed as the related premiums are earned. The method followed in determining the deferred policy acquisition costs limits the deferral to its realizable value by giving consideration to estimated future claims and expenses to be incurred as premiums are earned. Changes in estimates, if any, are recorded in the accounting period in which they are determined. Anticipated investment income is included in determining the realizable value of the deferred policy acquisition costs. Atlas’ deferred policy acquisition costs are reported net of deferred ceding commissions.
When anticipated claims, claims adjustment expenses, commissions and other acquisition costs exceed recorded unearned premium and any future installment premiums on existing policies, a premium deficiency reserve is recognized by recording a reduction to DPAC with a corresponding charge to operations. Atlas utilizes anticipated investment income as a factor in its premium deficiency calculation. Atlas concluded that no premium deficiency adjustments were necessary in any of the years ended December 31, 2017, 2016, 2015, and 2014.2015.
Income taxes - Income taxes expense (benefit) includes all taxes based on taxable income (loss) of Atlas and its subsidiaries, and are recognized in the statementstatements of income and comprehensive income except to the extent that they relate to items recognized directly in other comprehensive income, in which case the income tax effect is also recognized in other comprehensive income.
Deferred taxes are recognized based on the differences in the tax basis of assets, liabilities and items recognized directly in equity and the financial reporting basis of such items.
Deferred tax assets are recognized only to the extent that it is probable that future taxable income will be available against which they can be utilized. Deferred tax assets and liabilities are measured using enacted tax rates expected to apply to taxable income in the years in which those temporary differences are expected to be recovered or settled. The effect on future tax assets and liabilities of a change in tax rates is recognized in income in the period of enactment.
When considering the extent of the valuation allowance on Atlas'Atlas’ deferred tax asset, weight is given by management to both positive and negative evidence. U.S. GAAP states that a cumulative loss in recent years is a significant piece of negative evidence that is difficult to overcome in determining that a valuation allowance is not needed against deferred tax assets. However, the strength and trend of earnings, as well as other relevant factors are considered.
Atlas accounts for uncertain tax positions in accordance with the income taxes accounting guidance. Atlas analyzes filing positions in the federal and state jurisdiction where it is required to file tax returns, as well as the open tax years in these jurisdictions. Atlas would recognize interest and penalties related to unrecognized tax benefits as a component of the provision for federal income taxes.
Goodwill – Atlas recognized goodwill as part of the acquisition of Anchor Holdings Group, Inc. The amounts recognized represent the cost of the acquisition above the fair value of the net assets acquired. Atlas reviews goodwill at least annually for impairment. Atlas concluded that there was no goodwill impairment in eitherany of the years ended December 31, 2017, 2016, and 2015.
Intangible assets – Atlas recognized intangible assets as part of the acquisitions of Gateway and Anchor Holdings Group, Inc. The intangible assets are classified as either indefinite-lived or definite-lived depending on whether the useful lives can be identified. Atlas indefinite-lived intangible assets consist of state insurance licenses, and these intangible assets are reviewed for impairment at least annually. Atlas concluded that there was no indefinite-lived intangible asset impairment in any of the years ended December 31, 2017, 2016, 2015, and 2014.2015. Definite-lived intangible assets are amortized over their useful lives on a straight-line basis except for customer related intangibles, which are on an accelerated basis. Atlas definite-lived intangible assets consist of trade names and trademarks with useful lives of 15 years and customer relationships with useful lives of 10 years.
Business combinations - The value of certain assets and liabilities acquired are subject to adjustment from the initial purchase price allocation as additional information is obtained, including, but not limited to, valuation of separately identifiable intangibles, the preferred stock issued to the seller, and deferred taxes.
The valuations are finalized within 12 months of the close of the acquisition (not including claims reserve development consideration, if applicable). The changes upon finalization to the initial purchase price allocation and valuation of assets and liabilities may result in an adjustment to identifiable intangible assets and goodwill. Adjustments to the provisional amounts identified during the measurement period are recognized in the reporting period in which the adjustment amounts are determined. The effect of changes in depreciation, amortization, or other income effects, if any, as a result of the change to the provisional amounts, calculated as if the accounting had been completed at the acquisition date, are recorded in the financial statements and presented separately on the statements of income statementand comprehensive income in the reporting period in which the adjustment amounts are determined.
Property and equipment – Buildings, office equipment, and internal use software are stated at historical cost less depreciation. Subsequent costs are included in the asset’s carrying amount or capitalized as a separate asset only when it is probable that future economic benefits will be realized. Land is stated at historical cost. Repairs and maintenance are recognized as an expense during the period incurred. Depreciation on buildings and building improvements are provided on a straight-line basis over the estimated useful life of 33 years. Depreciation on equipment is provided on a straight-line basis over the estimated useful lives which range from 5 years for vehicles, 5 years for furniture, 5 years for enterprise software and 3 years for all other software and computer equipment and the term of the lease for leased equipment.
Insurance contracts – Contracts under which Atlas’ Insurance Subsidiaries accept risk at the inception of the contract from another party (the insured holder of the policy) by agreeing to compensate the policyholder or other insured beneficiary if a specified future event (the insured event) adversely affects the holder of the policy are classified as insurance contracts. All policies are short-duration contracts.
Revenue recognition - Premium income is recognized on a pro rata basis over the terms of the respective insurance contracts. Unearned premiumspremium reserves represent the portion of premiums written that are related to the unexpired terms of the policies in force.
Claims liabilities - The provision for unpaid claims represent the estimated liabilities for reported claims, plus those incurred but not yet reported and the related estimated claims adjustment expenses, such as legal fees. Unpaid claims adjustment expenses are determined using case-basis evaluations and statistical analyses, including insurance industry claims data, and represent estimates of the ultimate cost of all claims incurred. Although considerable variability is inherent in such estimates, management believes that the liability for unpaid claims and claims adjustment expenses is adequate. The estimates are continually reviewed and adjusted as necessary; such adjustments are included in current operations and are accounted for as changes in estimates.
Reinsurance - As part of Atlas’ insurance risk management policies, portions of its insurance risk is ceded to reinsurers. Reinsurance premiums and claims expenses are accounted for on a basis consistent with those used in accounting for the original policies issued and the terms of the reinsurance contracts. Premiums and claims ceded to other companies have been reported as a reduction of premium revenue and claims incurred. Commissions paid to Atlas by reinsurers on business ceded have been accounted for as a reduction of the related policy acquisition costs. Reinsurance recoverables are recorded for that portion of paid and unpaid claims and claims adjustment expenses that are ceded to other companies. Prepaid reinsurance premiums are recorded for unearned premiums that have been ceded to other companies.
Share-based compensation - Atlas has a share-based compensation plan that is described in Note 12, 'Share-Based‘Share-Based Compensation,'’ to the Consolidated Financial Statements. Atlas uses the fair-value method of accounting to determine and account for equity settled transactions and to determine stock-based compensation for awards granted to employees and non-employees. For stock-based compensation for awards granted to employees and non-employees that include a performance provision, the Monte-Carlo simulation model is utilized to determine fair value. Stock-based compensation prior to 2015 was valued using the Black-Scholes option pricing model. Compensation expense is recognized over the period that the stock options vest, with a corresponding increase to additional paid in capital.
For option awards with graded vesting, expense is recognized on a straight line basis over the service period for the entire award.
Operating segments - Atlas operates in one business segment, the property and casualty insurance business.
Reclassifications - Certain accounts in the prior years'years’ consolidated financial statement have been reclassified for comparative purposes to conform to the current year'syear’s presentation.
2. NEW ACCOUNTING STANDARDS
Pertinent Accounting Standard Updates ("ASUs"(“ASUs”) are issued from time to time by the Financial Accounting Standards Board ("FASB")FASB and are adopted by the Company as they become effective. All recently issued accounting pronouncements with effective dates prior to January 1, 20172018 have been adopted by the company.Company.
Recently Adopted
In February 2018, the FASB issued ASU 2018-02, Income Statement—Reporting Comprehensive Income (Topic 220): Reclassification of Certain Tax Effects from Accumulated Other Comprehensive Income. This update provides guidance on the reclassification of stranded tax effects in accumulated other comprehensive income (“AOCI”) resulting from the Tax Cuts and Jobs Act of 2017 (the “Tax Act”). Companies will have the option to reclassify the effect of the change in the federal corporate tax rate on gross deferred tax items and related valuation allowances for item in AOCI. For public entities, this guidance is effective for years beginning after December 15, 2018, including interim periods within those years. Early adoption is permitted. This update can be applied retrospectively or at the beginning of the period of adoption. The Company elected to early adopt and will apply the change at the beginning of the period of adoption within the Consolidated Statements of Financial Position and Consolidated Statements of Shareholders’ Equity. The adoption of this ASU resulted in a increase to AOCI and an decrease in retained earnings of $7,000 for the year ended December 31, 2017 with no net effect on total shareholders’ equity.
In January 2017, the FASB issued ASU 2017-04, Intangibles—Goodwill and Other (Topic 350): Simplifying the Test for Goodwill Impairment. The provisions of this update simplify the subsequent measurement of goodwill by eliminating Step 2 from the quantitative analysis. For public entities, this guidance is effective for years beginning after December 15, 2019, including interim periods within those years. Early adoption is permitted after January 1, 2017. Atlas has goodwill associated with one of the insurance subsidiaries and is subject to annual goodwill impairment testing. Atlas early adopted this ASU beginning with the 2017 goodwill impairment testing. The adoption of this ASU did not have any required prior period adjustments and did not have an impact on the consolidated financial statements.
In March 2016, the FASB issued ASU 2016-09, Compensation - Stock Compensation (Topic 718). The provisions of this update simplify certain areas around share-based compensation transactions including income taxes and cash flow classifications. Each amendment within this update has specific guidance on the method of application, which includes prospective, retrospective, and modified retrospective applications. For public entities, this guidance is effective for years beginning after December 15, 2016, including interim periods within those years. Early adoption is permitted. The Company adopted this ASU in the first quarter of 2017. Atlas did not have any tax “windfall” net operating loss carryforwards as of January 1, 2017, therefore no cumulative effect adjustment is needed. All tax related cash flows are included in the operating section of the Consolidated Statements of Cash Flows with other income taxes retrospectively. Atlas has made the election to estimate future forfeitures, which is consistent with current accounting treatment.
Not Yet Adopted
In May 2017, the FASB issued ASU 2017-09, Compensation—Stock Compensation (Topic 718): Scope of Modification Accounting. This update provides guidance on when an entity should apply modification accounting when changes are made to a share-based compensation award. For public entities, this guidance is effective for years beginning after December 15, 2017, including interim periods within those years. Early adoption is permitted. The Company plans on adopting the update on the required effective date using the prescribed prospective approach. The adoption of this ASU is not expected to have ana material impact on the consolidated financial statements. Atlas is planning on early adoption beginning with the 2017 goodwill impairment testing.
In JanuaryMarch 2017, the FASB issued ASU 2017-03,2017-08, Accounting ChangesReceivables—Nonrefundable Fees and Error Corrections (Topic 250) and Investments—Equity Method and Joint Ventures (Topic 323)Other Costs (Subtopic 310-20): Amendments to SEC Paragraphs Pursuant to Staff Announcements at the September 22, 2016 and November 17, 2016 EITF Meetings (SEC Update)Premium Amortization on Purchased Callable Debt Securities. This update adds referencesshortens the amortization period for certain callable fixed income securities held at a premium to the SEC Staff commentsearliest possible call date. For public entities, this guidance is effective for years beginning after December 15, 2018, including interim periods within those years. Early adoption is permitted. The Company plans on howadopting the update on the required effective date using the prescribed modified retrospective approach. Atlas has a company should evaluate ASUsnumber of fixed income securities that are callable and held at a premium. The amount of the difference in amortization from current accounting treatment to the change prescribed in this ASU will be adoptedrecorded upon adoption as an adjustment to retained earnings and treated as a change in accounting principle. Atlas is currently evaluating the future topotential impact of the ASU 2014-09, ASU 2016-02 and ASU 2016-13. This ASU was effective upon issuance and has been adopted by Atlas. As such, Atlas has reviewedon these disclosures and all disclosures pertaining to ASUs thatcertain securities, which will be adopted to provide additional qualitative information.change as securities mature, are sold, or are purchased.
In October 2016, the FASB issued ASU 2016-16, Income Taxes (Topic 740): Intra-Entity Transfers of Assets Other Than Inventory. The provisions of this update modify the income tax consequences for intra entityintra-entity transaction not involving inventory. For public entities, this guidance is effective for years beginning after December 15, 2017, including interim periods within those years. Early adoption is permitted. The Company plans on adopting the update on the required effective date using the prescribed modified retrospective approach. Although Atlas has a number of fixed income securities that were transferred between companies owned by Atlas, creating temporary tax differences thatthis ASU will be reversed upon adoption as an adjustment to retained earnings. The current balance of this adjustment is not considered material toaffect the consolidated financial statement results. The amountstatements, because the transactions are between two U.S. entities that are part of the adjustment may declinesame consolidated group, the transactions were elected to be deferred for U.S. tax purposes until the items leave the group, which is consistent with the pre-tax GAAP treatment, and the Company already reports as certainpart of its computational approach, the State tax results (which are zero) under the new ASU. If the sales were between a U.S. company and a foreign affiliate or between non-consolidated U.S. affiliates this would be applicable. However, the investment sales did not fall under either of these securities mature or are sold.two fact patterns.
In August 2016, the FASB issued ASU 2016-15, Statement of Cash Flows (Topic 230). The provisions of this update address the diversity in practice of eight issues on the statement of cash flow statement.flows. For public entities, this guidance is effective for years beginning after December 15, 2017, including interim periods within those years. Early adoption is permitted. The Company plans on adopting the update on the required effective date by retrospectively restating all required amounts for the periods presented in the consolidated financial statements. Atlas'Atlas’ current presentation of the cash flows statementits Consolidated Statements of Cash Flows is not expected to change as a result of this ASU. Atlas is planning on electingplans to elect the cumulative earnings approach for distributions from equity method investees upon adoption, which is consistent with current practice.
In June 2016, the FASB issued ASU 2016-13, Financial Instruments - Credit Losses (Topic 326). The provisions of this update require an entity to broaden the information that it considers in developing its allowance for credit losses for assets. For public entities, this guidance is effective for years beginning after December 15, 2019, including interim periods within those years. Early adoption is permitted. The Company plans on adopting the update on the required effective date. Atlas does not currently have any investments with credit losses recorded or other significant credit allowances, therefore the provisions of this update are not expected to have a material impact on the consolidated financial statements.statements upon adoption. Atlas will continue to monitor the investment portfolio and other financial instruments until adoption for any changes.
In March 2016, the FASB issued ASU 2016-09, Compensation - Stock Compensation (Topic 718). The provisions of this update simplify certain areas around share-based compensation transactions including income taxes and cash flow classifications. Each amendment within this update has specific guidance on the method of application, which includes prospective, retrospective, and modified retrospective applications. For public entities, this guidance is effective for years beginning after December 15, 2016, including interim periods within those years. Early adoption is permitted. The Company plans on adopting the update on the required effective date. Atlas did not have any tax "windfall" net operating loss carryforwards as of January 1, 2017, therefore no cumulative effect adjustment is needed. All tax related cash flows will be included in the operating section of the Consolidated Statements of Cash Flows with other taxes retrospectively. Reclassifications will be made between the "Share-based compensation expense" and "Premiums receivable and other assets, net" lines of "Operating activities" for all prior periods. Atlas is making the election to estimate future forfeitures, which is consistent with current accounting treatment.
In February 2016, the FASB issued ASU 2016-02, Leases (Topic 842). The provisions of this update impact the classification criteria, disclosure requirements, and other specific transactions in lease accounting. The update requires the use of a modified retrospective approach, which requires leases to be measured at the beginning of the earliest period presented. For public entities, this guidance is effective for years beginning after December 15, 2018, including interim periods within those years. Early adoption is permitted. The Company plans on adopting the update on the required effective date using the modified retrospective approach to restate beginning with the earliest period presented. See Note 8, 'Commitments‘Commitments and Contingencies,' to the Consolidated Financial StatementsContingencies’ for further discussion of the future lease commitments. The adoption of this update is expected to increase both assets and liabilities, equally, on the Consolidated Statements of Financial PositionsPosition by the present value of the leases at each reporting date. There is no expected impact to any of Atlas'Atlas’ current financial covenants as a result of the increase to reported liabilities.
In January 2016, the FASB issued ASU 2016-01, Financial Instruments - Overall (Subtopic 825-10): Recognition and Measurement of Financial Assets and Financial Liabilities. One provision of this update requires that equity investments, except those accounted for under the equity method, be measured at fair value and changes in fair value recognized in net income. The provisions of this update are recognized as a cumulative-effect adjustment to the balance sheet as of the beginning of the fiscal year of adoption. For public entities, this guidance is effective for years beginning after December 15, 2017, including interim periods within those years. Early adoption is not permitted, except for certain provisions. The Company plans on adopting the update on the required effective date. Atlas has a small portion of its investment portfolio invested in equities covered within the scopeThe adoption of this ASU that will require anresult in the recognition of $377,000 of net after-tax unrealized gains on equity investments as a cumulative-effect adjustment to increase retained earnings upon adoption. The amount of the adjustment is not expected to be material to the consolidated financial statements. While the current impact of adoption is not expected to be material, the impact of this ASU could potentially add volatility to the company's earnings as a result of market risk.
In May 2015, the FASB issued ASU 2015-09, Financial Services - Insurance (Topic 944): Disclosures about Short-Duration Contracts. The new disclosures, which are required for annual periods beginning after December 31, 2015 and for interim periods beginning after December 31, 2016, are intended to provide additional information about insurance liabilities including the nature, amount, timing, and uncertainty of future cash flows related to those liabilities. The Company adopted this new disclosure in the fourth quarter of 2016. See Note 11, 'Claims Liabilities,' to the Consolidated Financial Statements for the additional disclosures required under this ASU.
In April 2015, the FASB issued ASU 2015-03, Interest - Imputation of Interest (Topic 835-30): Simplifying the Presentation of Debt Issuance Costs. The new disclosures require debt issuance costs related to a recognized debt liability be presented in the balance sheet as a direct deduction from the carrying amount of that debt liability. The amendments in this disclosure are effective for financial statements issued for fiscal years beginning after December 15, 2015, and interim periods within those fiscal years. The Company adopted this new disclosure in the first quarter of 2016. See Note 20, 'Change in Accounting Principle,' to the Consolidated Financial Statements for further discussion.decrease AOCI.
The FASB issued ASU 2014-09, ASU 2015-14, ASU 2016-10, ASU 2016-12, ASU 2016-20 and ASU 2017-05, Revenue from Contracts with Customers (Topic 606). This update is a comprehensive revenue recognition standard that applies to all entities that have contracts with customers, except for those that fall within the scope of other standards, such as insurance contracts. Updates may be applied retrospectively to each period presented or retrospectively with the cumulative effect recognized at the date of initial application. The update is now effective for interim and annual reporting periods beginning after December 15, 2017. Early adoption is permitted, but only for interim and annual periods beginning after December 15, 2016. The Company plans to adopt the update on the required effective date. While these updates to Topic 606 are expected to have a significant impact on many companies, mostthe majority of Atlas'Atlas’ revenue is derived from transactions that do not fall within the scope of Topic 606, namely insurance contracts, investment income, and lease income. The adoption of these ASUs arewill not expected to have a material impact on the consolidated financial statements. Atlas will continue to monitor and examine transactions that could potentially fall within the scope of Topic 606.
All other recently issued pronouncements with effective dates after December 31, 20162017 are not expected to have a material impact on the Consolidated Financial Statements.consolidated financial statements.
3. ACQUISITIONS
Acquisition of Anchor Holdings Group, Inc. et. al.
On March 11, 2015, Atlas acquired Anchor Holdings Group, Inc., a privately owned insurance holding company, and its wholly owned subsidiary, Global Liberty, along with its affiliated entities, Anchor Management, and Plainview (collectively, "Anchor"“Anchor”), from an unaffiliated third party. Anchor provides specialized commercial insurance products, including commercial automobile insurance to niche markets such as taxi, black car and sedan service owners and operators primarily in the New York market. Atlas'Atlas’ acquisition of Anchor expands our distribution channel for core commercial automobile lines and provides incremental licensure as well as important infrastructure in the large New York market. Global Liberty also wrote homeowners insurance in the northeast, which was put into runoff, subject to applicable regulatory requirements, prior to the transaction.
Under the terms of the stock purchase agreement, the purchase price was based on the combined U.S. GAAP book value of Anchor as of December 31, 2014. The total purchase price for the combined entities of Anchor was $23.2 million, consisting of a combination of cash and Atlas preferred shares, and is estimated atwas approximately 1.3 times combined U.S. GAAP book value. Consideration consisted of approximately $19.2 million in cash and $4.0 million of Atlas preferred shares (consisting of a total of 4,000,000 preferred shares at $1.00 per preferred share), subject to the future development of Global Liberty’s actual claims reserves for certain lines of business during the five year period after the acquisition. During the fourth quarter of 2016, Atlas canceled all 4,000,000 of the preferred shares pursuant to the terms of the Anchor stock purchase agreement due to the adverse development of Global Liberty’s pre-acquisition claims reserves.
The Anchor acquisition was accounted for using the acquisition method. Atlas began consolidating Anchor on March 11, 2015, therefore their financial results are included in Atlas'Atlas’ consolidated financial results starting with the three month period ended March 31, 2015. However, the following unaudited pro forma summary presents Atlas'Atlas’ consolidated financial information for the yearsyear ended December 31, 2015 and 2014 as if Anchor had been acquired on January 1, 2014. These amounts have been calculated after applying the Company'sCompany’s accounting policies had the acquisition been completed on January 1, 2014. These results were prepared for comparative purposes only and do not purport to be indicative of the results of operations that may have actually resulted had the acquisition occurred on the indicated dates, nor are they indicative of potential future operating results of the Company.
| | | ($ in '000s, except per share information) | Year Ended | |
| ($ in ‘000s, except per share information) | | Year Ended |
| | December 31, 2015 | December 31, 2014 | December 31, 2015 |
| Revenue | $ | 162,311 |
| $ | 134,883 |
| $ | 162,311 |
|
Income from operations before income tax expense1 | 23,601 |
| 16,212 |
| |
Income from operations before income taxes1 | | 23,601 |
|
Net income1 | 15,420 |
| 20,370 |
| 15,420 |
|
Earnings per common share basic 1 | $ | 1.26 |
| $ | 1.84 |
| $ | 1.26 |
|
Earnings per common share diluted 1 | $ | 1.21 |
| $ | 1.77 |
| $ | 1.21 |
|
1 - Excludes expenses incurred in the connection with the Anchor acquisition
From the date of acquisition through December 31, 2015, Anchor earned revenue of $27.5 million and net income of $2.4 million.
The value of certain assets and liabilities acquired are subject to adjustment as additional information is obtained, including, but not limited to, valuation of separately identifiable intangibles, the preferred stock issued to the seller, and deferred taxes. The valuations were finalized during the year ended December 31, 2015 (not including claims reserve development consideration). The changes upon finalization to the preliminary valuation of assets and liabilities resulted in an adjustment to identifiable intangible assets, goodwill, deferred tax and other liabilities. The following table presents the adjusted values of assets acquired and liabilities assumed for the Anchor acquisition based on its estimated fair value on March 11, 2015.
|
| | | |
| ($ in '000s) | |
| Purchase Consideration | |
| Cash | $ | 19,199 |
|
| Preferred stock | 4,000 |
|
| Total | $ | 23,199 |
|
| | |
| Allocation of Purchase Price | |
| | |
| Cash and investments | $ | 48,508 |
|
| Other current assets | 33,303 |
|
| Property and equipment | 22 |
|
| Goodwill | 2,726 |
|
| Intangible assets | 4,500 |
|
| Total Assets | $ | 89,059 |
|
| | |
| Claims liabilities | $ | 30,731 |
|
| Unearned premiums | 22,976 |
|
| Accounts payable and other liabilities | 11,231 |
|
| Deferred tax liabilities, net | 922 |
|
| Total Liabilities | $ | 65,860 |
|
| | |
| Net assets acquired | $ | 23,199 |
|
The acquisition of Anchor resulted in the recognition of intangible assets and goodwill valued at $4.5 million and $2.7 million, respectively. The Company recorded an adjustment to the purchase price allocation and amortization related to the identified intangible assets during the fourth quarter of 2015. Atlas recognized amortization expense of $390,000, $390,000 and $315,000 for the years ended December 31, 2017, 2016 and 2015, respectively, related to intangible assets acquired in the Anchor transaction. Atlas incurred no transaction expenses related to the Anchor acquisition for the yearyears ended December 31, 2017 and 2016, and $999,000 in transaction expenses for the year ended December 31, 2015 and $694,000 in transaction expenses for the year ended December 31, 2014.2015.
Intangible Assets
The following table presents a summary of definite-lived intangible assets by major asset class as of December 31, 20162017 and December 31, 2015:2016:
| | | ($ in '000s) | | | |
| ($ in ‘000s) | | | |
| As of December 31, 2017 | | Economic Useful Life | | Gross Carrying Amount | Accumulated Amortization | Net |
| Trade name and trademark | | 15 years | | $ | 1,800 |
| $ | 337 |
| $ | 1,463 |
|
| Customer relationship | | 10 years | | 2,700 |
| 758 |
| 1,942 |
|
| State insurance licenses | | Indefinite | | 740 |
| — |
| 740 |
|
| | | | $ | 5,240 |
| $ | 1,095 |
| $ | 4,145 |
|
| | | | |
| As of December 31, 2016 | Economic Useful Life | | Gross Carrying Amount | Accumulated Amortization | Net | Economic Useful Life | | Gross Carrying Amount | Accumulated Amortization | Net |
| Trade name and trademark | 15 years | | $ | 1,800 |
| $ | 217 |
| $ | 1,583 |
| 15 years | | $ | 1,800 |
| $ | 217 |
| $ | 1,583 |
|
| Customer relationship | 10 years | | 2,700 |
| 488 |
| 2,212 |
| 10 years | | 2,700 |
| 488 |
| 2,212 |
|
| State insurance licenses | Indefinite | | 740 |
| — |
| 740 |
| Indefinite | | 740 |
| — |
| 740 |
|
| | | $ | 5,240 |
| $ | 705 |
| $ | 4,535 |
| | $ | 5,240 |
| $ | 705 |
| $ | 4,535 |
|
| | | | |
| As of December 31, 2015 | Economic Useful Life | | Gross Carrying Amount | Accumulated Amortization | Net | |
| Trade name and trademark | 15 years | | $ | 1,800 |
| $ | 97 |
| $ | 1,703 |
| |
| Customer relationship | 10 years | | 2,700 |
| 218 |
| 2,482 |
| |
| State insurance licenses | Indefinite | | 740 |
| — |
| 740 |
| |
| | | $ | 5,240 |
| $ | 315 |
| $ | 4,925 |
| |
Estimated future amortization expense for definite-lived intangible assets is $390,000 for each of the next five years.
Acquisition of Gateway Insurance Company
In 2013 we acquired Camelot Services, Inc. ("(“Camelot Services"Services”), a privately owned insurance holding company, and its sole subsidiary Gateway from an unaffiliated third party. Gateway provides specialized commercial insurance products, including commercial automobile insurance to niche markets such as taxi, black car and sedan service owners and operators.
Under the terms of the stock purchase agreement, additional consideration may be paid to the seller, or returned to us by the seller, depending upon, among other things, the future development of Gateway’s actual claims reserves for certain lines of business and the utilization of certain deferred tax assets over time. During the third quarter of 2016, the Company and the former owner of Camelot Services agreed to settle the additional consideration related to future claim development and the utilization of certain tax assets. Atlas redeemed all 2,538,560 of the remaining preferred shares issued as additional consideration and paid all accrued dividends.
The acquisition of Gateway resulted in the recognition of intangible assets, comprised entirely of state insurance licenses valued at $740,000. The state insurance licenses are considered to have an indefinite life and will not be amortized, but will be evaluated for impairment at least annually. Thus, Atlas recognized no amortization expense during the years ended December 31, 2017, 2016, 2015, and 20142015 related to intangible assets acquired in the Gateway transaction.
4. EARNINGS PER SHARE
Earnings per ordinary voting common share, restricted voting common share, and participative restricted stock unit ("RSU"(“RSU”) (collectively, the "common shares"“common shares”) for the years ended December 31, 2016,2017, December 31, 2015,2016, and December 31, 20142015 are as follows ($ in '000s,‘000s, except share and per share amounts):
| | | Year Ended December 31, | 2016 | 2015 | 2014 | 2017 | 2016 | 2015 |
| Basic: | | |
| Income from operations before income tax expense | $ | 512 |
| $ | 22,046 |
| $ | 11,935 |
| |
| (Loss) income from operations before income taxes | | $ | (44,153 | ) | $ | 512 |
| $ | 22,046 |
|
| Income tax (benefit) expense | (2,134 | ) | 7,616 |
| (5,767 | ) | (5,343 | ) | (2,134 | ) | 7,616 |
|
| Net income | $ | 2,646 |
| $ | 14,430 |
| $ | 17,702 |
| |
| Net (loss) income | | $ | (38,810 | ) | $ | 2,646 |
| $ | 14,430 |
|
| Less: Preferred share dividends | 281 |
| 276 |
| 94 |
| — |
| 281 |
| 276 |
|
| Net income attributable to common shareholders for earnings per common share basic | $ | 2,365 |
| $ | 14,154 |
| $ | 17,608 |
| |
| Net (loss) income attributable to common shareholders | | $ | (38,810 | ) | $ | 2,365 |
| $ | 14,154 |
|
| Basic weighted average common shares outstanding | 12,045,519 |
| 11,975,579 |
| 10,937,181 |
| 12,064,880 |
| 12,045,519 |
| 11,975,579 |
|
| Earnings per common share basic | $ | 0.20 |
| $ | 1.18 |
| $ | 1.61 |
| |
| (Loss) earnings per common share basic | | $ | (3.22 | ) | $ | 0.20 |
| $ | 1.18 |
|
| | | |
| Diluted: | | |
| Basic weighted average common shares outstanding | 12,045,519 |
| 11,975,579 |
| 10,937,181 |
| 12,064,880 |
| 12,045,519 |
| 11,975,579 |
|
| Dilutive potential ordinary shares: | | |
| Dilutive stock options outstanding | 177,364 |
| 186,656 | 150,407 | — |
| 177,364 |
| 186,656 |
|
| Dilutive shares upon preferred share conversion | — |
| 573,444 | 254,000 | — |
| — |
| 573,444 |
|
| Diluted weighted average common shares outstanding | 12,222,883 | 12,735,679 | 11,341,588 | 12,064,880 |
| 12,222,883 |
| 12,735,679 |
|
| Earnings per common share diluted | $ | 0.19 |
| $ | 1.13 |
| $ | 1.56 |
| |
| (Loss) earnings per common share diluted | | $ | (3.22 | ) | $ | 0.19 |
| $ | 1.13 |
|
Earnings per common share diluted is computed by dividing net income by the weighted average number of common shares outstanding for each period plus the incremental number of shares added as a result of converting dilutive potential ordinary voting common shares, calculated using the treasury stock method (or, in the case of the convertible preferred shares, using the "if-converted"“if-converted” method).
Atlas’ dilutive potential ordinary voting common shares consist of outstanding stock options to purchase ordinary voting common shares and, for the 2016 and 2015 computation, preferred shares potentially convertible to ordinary voting common shares at the option of the holder at any date after December 31, 2018 (2,538,560 preferred shares at the rate of 0.1270 ordinary voting common shares for each preferred share related to the Gateway acquisition, all of which were redeemed during the third quarter of 2016, are considered to have been redeemed on the last day of the third quarter of 2016) and after March 11, 2020 (4,000,000 preferred shares at the rate of 0.0500 ordinary voting common shares for each preferred share related to the Anchor acquisition, all of which were canceled as of December 31, 2016). Refer to Note 14, 'Share‘Share Capital' and Mezzanine Equity,’ to the Consolidated Financial Statements for further discussion regarding the redemption and cancellation of the preferred shares.
The effects of these convertible instruments are excluded from the computation of earnings per common share diluted in periods in which the effect would be anti-dilutive. Convertible preferred shares are anti-dilutive when the amount of dividenddividends declared or accumulated in the current period per common share obtainable upon conversion exceeds earnings per common share basic. For the year ended December 31, 2017, all exercisable stock options were deemed to be anti-dilutive. For the year ended December 31, 2016, all exercisable stock options were deemed to be dilutive and all of the convertible preferred shares were deemed to be anti-dilutive. The potentially dilutive impact for the convertible preferred stock excluded from the calculation due to anti-dilution is 441,357 common shares for the year ended December 31, 2016. For the yearsyear ended December 31, 2015, and 2014, all of the convertible preferred shares and all exercisable stock options were deemed to be dilutive.
5. INVESTMENTS
The cost or amortized cost, gross unrealized gains and losses and fair value for Atlas’ investments in fixed income securities and equities are as follows as of ($ in '000s)‘000s):
| | | December 31, 2016 | Cost or Amortized Cost | Gross Unrealized Gains | Gross Unrealized Losses | Fair Value | |
| December 31, 2017 | | December 31, 2017 | Cost or Amortized Cost | Gross Unrealized Gains | Gross Unrealized Losses | Fair Value |
| Fixed Income Securities: | Fixed Income Securities: | | Fixed Income Securities: | |
| | U.S. Treasury and other U.S. government obligations | $ | 22,716 |
| $ | 15 |
| $ | (257 | ) | $ | 22,474 |
| U.S. Treasury and other U.S. government obligations | $ | 21,488 |
| $ | — |
| $ | (302 | ) | $ | 21,186 |
|
| | States, municipalities and political subdivisions | 10,647 |
| 25 |
| (202 | ) | 10,470 |
| States, municipalities and political subdivisions | 13,265 |
| 78 |
| (100 | ) | 13,243 |
|
| | Corporate | | Corporate | |
| | | Banking/financial services | 22,890 |
| 105 |
| (143 | ) | 22,852 |
| | Banking/financial services | 21,246 |
| 189 |
| (53 | ) | 21,382 |
|
| | | Consumer goods | 8,637 |
| 45 |
| (89 | ) | 8,593 |
| | Consumer goods | 9,674 |
| 70 |
| (65 | ) | 9,679 |
|
| | | Capital goods | 7,807 |
| 109 |
| (43 | ) | 7,873 |
| | Capital goods | 7,822 |
| 181 |
| (11 | ) | 7,992 |
|
| | | Energy | 3,689 |
| 88 |
| (42 | ) | 3,735 |
| | Energy | 7,460 |
| 81 |
| (26 | ) | 7,515 |
|
| | | Telecommunications/utilities | 7,746 |
| 22 |
| (151 | ) | 7,617 |
| | Telecommunications/utilities | 11,179 |
| 109 |
| (73 | ) | 11,215 |
|
| | | Health care | 1,376 |
| 3 |
| (22 | ) | 1,357 |
| | Health care | 1,112 |
| 1 |
| (54 | ) | 1,059 |
|
| | Total Corporate | 52,145 |
| 372 |
| (490 | ) | 52,027 |
| Total Corporate | 58,493 |
| 631 |
| (282 | ) | 58,842 |
|
| | Mortgage Backed | | Mortgage Backed | |
| | | Mortgage backed - agency | 34,332 |
| 98 |
| (416 | ) | 34,014 |
| | Mortgage backed - agency | 30,920 |
| 57 |
| (364 | ) | 30,613 |
|
| | | Mortgage backed - commercial | 21,277 |
| 132 |
| (251 | ) | 21,158 |
| | Mortgage backed - commercial | 22,689 |
| 153 |
| (255 | ) | 22,587 |
|
| | Total Mortgage Backed | 55,609 |
| 230 |
| (667 | ) | 55,172 |
| Total Mortgage Backed | 53,609 |
| 210 |
| (619 | ) | 53,200 |
|
| | Other asset backed | 16,334 |
| 39 |
| (29 | ) | 16,344 |
| Other asset backed | 11,556 |
| 8 |
| (51 | ) | 11,513 |
|
| Total Fixed Income Securities | Total Fixed Income Securities | $ | 157,451 |
| $ | 681 |
| $ | (1,645 | ) | $ | 156,487 |
| Total Fixed Income Securities | $ | 158,411 |
| $ | 927 |
| $ | (1,354 | ) | $ | 157,984 |
|
| Equities | Equities | 5,598 |
| 625 |
| — |
| 6,223 |
| Equities | 7,969 |
| 503 |
| (26 | ) | 8,446 |
|
| Totals | Totals | $ | 163,049 |
| $ | 1,306 |
| $ | (1,645 | ) | $ | 162,710 |
| Totals | $ | 166,380 |
| $ | 1,430 |
| $ | (1,380 | ) | $ | 166,430 |
|
| | | December 31, 2015 | Cost or Amortized Cost | Gross Unrealized Gains | Gross Unrealized Losses | Fair Value | |
| December 31, 2016 | | December 31, 2016 | Cost or Amortized Cost | Gross Unrealized Gains | Gross Unrealized Losses | Fair Value |
| Fixed Income Securities: | Fixed Income Securities: | | Fixed Income Securities: | |
| | U.S. Treasury and other U.S. government obligations | $ | 23,555 |
| $ | 12 |
| $ | (84 | ) | $ | 23,483 |
| U.S. Treasury and other U.S. government obligations | $ | 22,716 |
| $ | 15 |
| $ | (257 | ) | $ | 22,474 |
|
| | States, municipalities and political subdivisions | 21,974 |
| 232 |
| (52 | ) | 22,154 |
| States, municipalities and political subdivisions | 10,647 |
| 25 |
| (202 | ) | 10,470 |
|
| | Corporate | | Corporate | |
| | | Banking/financial services | 21,963 |
| 117 |
| (166 | ) | 21,914 |
| | Banking/financial services | 22,890 |
| 105 |
| (143 | ) | 22,852 |
|
| | | Consumer goods | 7,813 |
| 43 |
| (121 | ) | 7,735 |
| | Consumer goods | 8,637 |
| 45 |
| (89 | ) | 8,593 |
|
| | | Capital goods | 15,524 |
| 127 |
| (556 | ) | 15,095 |
| | Capital goods | 7,807 |
| 109 |
| (43 | ) | 7,873 |
|
| | | Energy | 4,807 |
| — |
| (401 | ) | 4,406 |
| | Energy | 3,689 |
| 88 |
| (42 | ) | 3,735 |
|
| | | Telecommunications/utilities | 12,298 |
| 27 |
| (450 | ) | 11,875 |
| | Telecommunications/utilities | 7,746 |
| 22 |
| (151 | ) | 7,617 |
|
| | | Health care | 3,038 |
| — |
| (17 | ) | 3,021 |
| | Health care | 1,376 |
| 3 |
| (22 | ) | 1,357 |
|
| | Total Corporate | 65,443 |
| 314 |
| (1,711 | ) | 64,046 |
| Total Corporate | 52,145 |
| 372 |
| (490 | ) | 52,027 |
|
| | Mortgage Backed | | Mortgage Backed | |
| | | Mortgage backed - agency | 34,874 |
| 112 |
| (313 | ) | 34,673 |
| | Mortgage backed - agency | 34,332 |
| 98 |
| (416 | ) | 34,014 |
|
| | | Mortgage backed - commercial | 19,961 |
| 158 |
| (244 | ) | 19,875 |
| | Mortgage backed - commercial | 21,277 |
| 132 |
| (251 | ) | 21,158 |
|
| | Total Mortgage Backed | 54,835 |
| 270 |
| (557 | ) | 54,548 |
| Total Mortgage Backed | 55,609 |
| 230 |
| (667 | ) | 55,172 |
|
| | Other asset backed | 19,648 |
| 14 |
| (120 | ) | 19,542 |
| Other asset backed | 16,334 |
| 39 |
| (29 | ) | 16,344 |
|
| Total Fixed Income Securities | Total Fixed Income Securities | $ | 185,455 |
| $ | 842 |
| $ | (2,524 | ) | $ | 183,773 |
| Total Fixed Income Securities | $ | 157,451 |
| $ | 681 |
| $ | (1,645 | ) | $ | 156,487 |
|
| Equities | Equities | 4,147 |
| 139 |
| (46 | ) | 4,240 |
| Equities | 5,598 |
| 625 |
| — |
| 6,223 |
|
| Totals | Totals | $ | 189,602 |
| $ | 981 |
| $ | (2,570 | ) | $ | 188,013 |
| Totals | $ | 163,049 |
| $ | 1,306 |
| $ | (1,645 | ) | $ | 162,710 |
|
The following table summarizes the amortized cost and fair value of fixed income securities by contractual maturity ($ in '000s)‘000s). As certain securities and debentures have the right to call or prepay obligations, the actual settlement dates may differ from contractual maturity.
| | | As of December 31, | 2016 | 2017 |
| | Amortized Cost | Fair Value | Amortized Cost | Fair Value |
| Due in less than one year | $ | 8,729 |
| $ | 8,732 |
| $ | 11,149 |
| $ | 11,141 |
|
| Due in one through five years | 43,772 |
| 43,808 |
| 33,941 |
| 33,857 |
|
| Due after five through ten years | 27,618 |
| 27,263 |
| 41,542 |
| 41,538 |
|
| Due after ten years | 5,389 |
| 5,168 |
| 6,614 |
| 6,735 |
|
| Total contractual maturity | 85,508 |
| 84,971 |
| 93,246 |
| 93,271 |
|
| Total mortgage and asset backed | 71,943 |
| 71,516 |
| 65,165 |
| 64,713 |
|
| Total | $ | 157,451 |
| $ | 156,487 |
| $ | 158,411 |
| $ | 157,984 |
|
Management performs a quarterly analysis of Atlas’ investment holdings to determine if declines in fair value are other than temporary. The analysis includes some or all of the following procedures as deemed appropriate by management:
| |
| ◦ | identifying all security holdings in unrealized loss positions that have existed for at least six months or other circumstances that management believes may impact the recoverability of the security; |
| |
| ◦ | obtaining a valuation analysis from third party investment managers regarding these holdings based on their knowledge, experience and other market based valuation techniques; |
| |
| ◦ | reviewing the trading range of certain securities over the preceding calendar period; |
| |
| ◦ | assessing whether declines in market value are other than temporary for debt security holdings based on credit ratings from third party security rating agencies; and |
| |
| ◦ | determining the necessary provision for declines in market value that are considered other than temporary based on the analyses performed. |
The risks and uncertainties inherent in the assessment methodology utilized to determine declines in market value that are other than temporary include, but may not be limited to, the following:
| |
| ◦ | the opinion of professional investment managers could prove to be incorrect; |
| |
| ◦ | the past trading patterns of individual securities may not reflect future valuation trends; |
| |
| ◦ | the credit ratings assigned by independent credit rating agencies may prove to be incorrect due to unforeseen or unknown facts related to a company’s financial situation; and |
| |
| ◦ | the debt service pattern of non-investment grade securities may not reflect future debt service capabilities and may not reflect a company’s unknown underlying financial problems. |
There were no other-than-temporary impairments recorded for the years ended December 31, 2017, 2016, 2015, and 20142015 as a result of the above analysis performed by management.
The aging of unrealized losses on the Company'sCompany’s investments in fixed income securities and equities is presented as follows ($ in '000s)‘000s):
|
| | | | | | | | | | | | | | | | | | | | | |
| | | Less Than 12 Months | | More Than 12 Months | | Total |
| As of December 31, 2017 | Fair Value | Unrealized Losses | | Fair Value | Unrealized Losses | | Fair Value | Unrealized Losses |
| Fixed Income Securities: | | | | | | | | |
| | U.S. Treasury and other U.S. government obligations | $ | 11,179 |
| $ | (110 | ) | | $ | 10,007 |
| $ | (192 | ) | | $ | 21,186 |
| $ | (302 | ) |
| | States, municipalities and political subdivisions | 5,355 |
| (36 | ) | | 2,818 |
| (64 | ) | | 8,173 |
| (100 | ) |
| | Corporate | | | | | | | | |
| | Banking/financial services | 6,021 |
| (26 | ) | | 1,931 |
| (27 | ) | | 7,952 |
| (53 | ) |
| | Consumer goods | 5,835 |
| (47 | ) | | 710 |
| (18 | ) | | 6,545 |
| (65 | ) |
| | Capital goods | 2,611 |
| (10 | ) | | 101 |
| (1 | ) | | 2,712 |
| (11 | ) |
| | Energy | 3,368 |
| (26 | ) | | — |
| — |
| | 3,368 |
| (26 | ) |
| | Telecommunications/utilities | 4,488 |
| (23 | ) | | 938 |
| (50 | ) | | 5,426 |
| (73 | ) |
| | Health care | 607 |
| (7 | ) | | 322 |
| (47 | ) | | 929 |
| (54 | ) |
| | Total Corporate | 22,930 |
| (139 | ) | | 4,002 |
| (143 | ) | | 26,932 |
| (282 | ) |
| | Mortgage Backed | | | | | | | | |
| | Mortgage backed - agency | 13,203 |
| (136 | ) | | 9,786 |
| (228 | ) | | 22,989 |
| (364 | ) |
| | Mortgage backed - commercial | 10,360 |
| (53 | ) | | 6,553 |
| (202 | ) | | 16,913 |
| (255 | ) |
| | Total Mortgage Backed | 23,563 |
| (189 | ) | | 16,339 |
| (430 | ) | | 39,902 |
| (619 | ) |
| | Other asset backed | 9,817 |
| (44 | ) | | 1,087 |
| (7 | ) | | 10,904 |
| (51 | ) |
| Total Fixed Income Securities | $ | 72,844 |
| $ | (518 | ) | | $ | 34,253 |
| $ | (836 | ) | | $ | 107,097 |
| $ | (1,354 | ) |
| Equities | 1,007 |
| (26 | ) | | — |
| — |
| | 1,007 |
| (26 | ) |
| Totals | $ | 73,851 |
| $ | (544 | ) | | $ | 34,253 |
| $ | (836 | ) | | $ | 108,104 |
| $ | (1,380 | ) |
|
| | | | | | | | | | | | | | | | | | | | | |
| | | Less Than 12 Months | | More Than 12 Months | | Total |
| As of December 31, 2016 | Fair Value | Unrealized Losses | | Fair Value | Unrealized Losses | | Fair Value | Unrealized Losses |
| Fixed Income Securities: | | | | | | | | |
| | U.S. Treasury and other U.S. government obligations | $ | 16,187 |
| $ | (257 | ) | | $ | — |
| $ | — |
| | $ | 16,187 |
| $ | (257 | ) |
| | States, municipalities and political subdivisions | 7,604 |
| (202 | ) | | — |
| — |
| | 7,604 |
| (202 | ) |
| | Corporate | | | | | | | | |
| | Banking/financial services | 12,429 |
| (143 | ) | | 132 |
| — |
| | 12,561 |
| (143 | ) |
| | Consumer goods | 5,453 |
| (83 | ) | | 222 |
| (6 | ) | | 5,675 |
| (89 | ) |
| | Capital goods | 3,224 |
| (37 | ) | | 100 |
| (6 | ) | | 3,324 |
| (43 | ) |
| | Energy | 229 |
| (1 | ) | | 959 |
| (41 | ) | | 1,188 |
| (42 | ) |
| | Telecommunications/utilities | 2,620 |
| (73 | ) | | 962 |
| (78 | ) | | 3,582 |
| (151 | ) |
| | Health care | 476 |
| (22 | ) | | — |
| — |
| | 476 |
| (22 | ) |
| | Total Corporate | 24,431 |
| (359 | ) | | 2,375 |
| (131 | ) | | 26,806 |
| (490 | ) |
| | Mortgage Backed | | | | | | | | |
| | Mortgage backed - agency | 21,818 |
| (372 | ) | | 2,092 |
| (44 | ) | | 23,910 |
| (416 | ) |
| | Mortgage backed - commercial | 10,235 |
| (205 | ) | | 2,053 |
| (46 | ) | | 12,288 |
| (251 | ) |
| | Total Mortgage Backed | 32,053 |
| (577 | ) | | 4,145 |
| (90 | ) | | 36,198 |
| (667 | ) |
| | Other asset backed | 977 |
| (2 | ) | | 4,118 |
| (27 | ) | | 5,095 |
| (29 | ) |
| Total Fixed Income Securities | $ | 81,252 |
| $ | (1,397 | ) | | $ | 10,638 |
| $ | (248 | ) | | $ | 91,890 |
| $ | (1,645 | ) |
|
| | | | | | | | | | | | | | | | | | | | | |
| | | Less Than 12 Months | | More Than 12 Months | | Total |
| As of December 31, 2015 | Fair Value | Unrealized Losses | | Fair Value | Unrealized Losses | | Fair Value | Unrealized Losses |
| Fixed Income Securities: | | | | | | | | |
| | U.S. Treasury and other U.S. government obligations | $ | 9,712 |
| $ | (49 | ) | | $ | 3,256 |
| $ | (35 | ) | | $ | 12,968 |
| $ | (84 | ) |
| | States, municipalities and political subdivisions | 5,870 |
| (46 | ) | | 553 |
| (6 | ) | | 6,423 |
| (52 | ) |
| | Corporate | | | | | | | | |
| | Banking/financial services | 12,216 |
| (161 | ) | | 595 |
| (5 | ) | | 12,811 |
| (166 | ) |
| | Consumer goods | 6,044 |
| (121 | ) | | — |
| — |
| | 6,044 |
| (121 | ) |
| | Capital goods | 9,425 |
| (428 | ) | | 755 |
| (128 | ) | | 10,180 |
| (556 | ) |
| | Energy | 3,862 |
| (337 | ) | | 544 |
| (64 | ) | | 4,406 |
| (401 | ) |
| | Telecommunications/utilities | 8,811 |
| (450 | ) | | — |
| — |
| | 8,811 |
| (450 | ) |
| | Health care | 3,021 |
| (17 | ) | | — |
| — |
| | 3,021 |
| (17 | ) |
| | Total Corporate | 43,379 |
| (1,514 | ) | | 1,894 |
| (197 | ) | | 45,273 |
| (1,711 | ) |
| | Mortgage Backed | | | | | | | | |
| | Mortgage backed - agency | 25,168 |
| (255 | ) | | 1,921 |
| (58 | ) | | 27,089 |
| (313 | ) |
| | Mortgage backed - commercial | 10,022 |
| (129 | ) | | 3,445 |
| (115 | ) | | 13,467 |
| (244 | ) |
| | Total Mortgage Backed | 35,190 |
| (384 | ) | | 5,366 |
| (173 | ) | | 40,556 |
| (557 | ) |
| | Other asset backed | 16,203 |
| (113 | ) | | 1,084 |
| (7 | ) | | 17,287 |
| (120 | ) |
| Total Fixed Income Securities | $ | 110,354 |
| $ | (2,106 | ) | | $ | 12,153 |
| $ | (418 | ) | | $ | 122,507 |
| $ | (2,524 | ) |
| Equities | 1,062 |
| (46 | ) | | — |
| — |
| | 1,062 |
| (46 | ) |
| Totals | $ | 111,416 |
| $ | (2,152 | ) | | $ | 12,153 |
| $ | (418 | ) | | $ | 123,569 |
| $ | (2,570 | ) |
As of December 31, 2017, we held 346 and 2 individual fixed income and equity securities, respectively, that were in an unrealized loss position, of which 103 individual fixed income securities were in a continuous loss position for longer than 12 months. As of December 31, 2016, we held 316 individual fixed income securities that were in an unrealized loss position, of which 39 individual fixed income securities were in a continuous loss position for longer than 12 months. As of December 31, 2015, we held 435 and 1 individual fixed income and equity securities, respectively, that were in an unrealized loss position, of which 35 individual fixed income securities were in a continuous loss position for longer than 12 months. We did not recognize the unrealized losses in earnings on these fixed income securities for the years ended December 31, 20162017 and 2015,2016, because we neither intend to sell the securities nor do we believe that it is more likely than not that we will be required to sell these securities before recovery of their amortized costs.
The following table summarizes the components of net investment income for the years ended December 31, 2017, 2016, 2015, and 20142015 ($ in '000s)‘000s):
| | | Year Ended December 31, | Year Ended December 31, | | 2016 | 2015 | 2014 | Year Ended December 31, | | 2017 | 2016 | 2015 |
| Total investment income | Total investment income | | | Total investment income | | |
| | Interest income | | $ | 3,747 |
| $ | 3,371 |
| $ | 2,848 |
| Interest income | | $ | 3,834 |
| $ | 3,747 |
| $ | 3,371 |
|
| | Dividends | | — |
| 43 |
| 20 |
| Dividends | | — |
| — |
| 43 |
|
| | Income from other investments | | 1,942 |
| 1,344 |
| 693 |
| Income from other investments | | 1,911 |
| 1,942 |
| 1,344 |
|
| Investment expenses | Investment expenses | | (865 | ) | (782 | ) | (451 | ) | Investment expenses | | (848 | ) | (865 | ) | (782 | ) |
| Net investment income | Net investment income | | $ | 4,824 |
| $ | 3,976 |
| $ | 3,110 |
| Net investment income | | $ | 4,897 |
| $ | 4,824 |
| $ | 3,976 |
|
The following table presents the aggregate proceeds, gross realized investment gains and gross realized investment losses from sales and calls of fixed income securities and equities for the years ended December 31, 2017, 2016, 2015, and 20142015 ($ in '000s)‘000s):
|
| | | | | | | | | | | | | | | | | | | | | | | | | | | | | |
| | 2016 | | 2015 | | 2014 |
| | Proceeds from Sales | Gains on Sales | Losses on Sales | | Proceeds from Sales | Gains on Sales | Losses on Sales | | Proceeds from Sales | Gains on Sales | Losses on Sales |
| Fixed income securities | $ | 57,938 |
| $ | 1,284 |
| $ | (119 | ) | | $ | 38,401 |
| $ | 574 |
| $ | (86 | ) | | $ | 24,942 |
| $ | 425 |
| $ | (59 | ) |
| Equities | 662 |
| 65 |
| — |
| | 1,402 |
| 69 |
| (81 | ) | | 13 |
| 6 |
| — |
|
| Total | $ | 58,600 |
| $ | 1,349 |
| $ | (119 | ) | | $ | 39,803 |
| $ | 643 |
| $ | (167 | ) | | $ | 24,955 |
| $ | 431 |
| $ | (59 | ) |
|
| | | | | | | | | |
| Year Ended December 31, | 2017 | 2016 | 2015 |
Fixed income securities1: | | | |
| Proceeds from sales and calls | $ | 24,274 |
| $ | 59,161 |
| $ | 32,089 |
|
| Gross realized investment gains | 300 |
| 1,296 |
| 686 |
|
| Gross realized investment losses | (55 | ) | (131 | ) | (199 | ) |
| Equities: | | | |
| Proceeds from sales | 6,161 |
| 662 |
| 1,402 |
|
| Gross realized investment gains | 635 |
| 65 |
| 69 |
|
| Gross realized investment losses | (2 | ) | — |
| (81 | ) |
| Total: | | | |
| Proceeds from sales and calls | $ | 30,435 |
| $ | 59,823 |
| $ | 33,491 |
|
| Gross realized investment gains | 935 |
| 1,361 |
| 755 |
|
| Gross realized investment losses | (57 | ) | (131 | ) | (280 | ) |
1- The proceeds from sales and calls, gross realized investment gains and gross realized investment losses on fixed income securities for the years ended December 31, 2016 and 2015 were restated to include both voluntary and involuntary calls.
The following table summarizes the components of net investment realized gains (losses) for the years ended December 31, 2017, 2016, 2015, and 20142015 ($ in '000s)‘000s):
| | | Year Ended December 31, | 2016 | 2015 | 2014 | 2017 | 2016 | 2015 |
| Fixed income securities | $ | 1,165 |
| $ | 487 |
| $ | 366 |
| $ | 245 |
| $ | 1,165 |
| $ | 487 |
|
| Equities | 65 |
| (12 | ) | 6 |
| 633 |
| 65 |
| (12 | ) |
| Other | — |
| (20 | ) | 10 |
| (6 | ) | — |
| (20 | ) |
| Net investment realized gains | $ | 1,230 |
| $ | 455 |
| $ | 382 |
| |
| Net realized gains | | $ | 872 |
| $ | 1,230 |
| $ | 455 |
|
Other Investments:
Atlas'Atlas’ other investments are comprised of collateral loans and various limited partnerships that invest in income-producing real estate, equities, or catastrophe bonds.insurance linked securities. Atlas accounts for these limited partnership investments using the equity method of accounting. As of December 31, 2016,2017, the carrying values of these other investments were approximately $32.2$31.4 million versus approximately $22.9$32.2 million as of December 31, 2015.2016. The carrying values of the equity method limited partnerships were $24.9$25.3 million and $22.8$24.9 million as of December 31, 20162017 and December 31, 2015,2016, respectively. The carrying value of these investments is Atlas'Atlas’ share of the net book value for each limited partnership, an amount that approximates fair value. Atlas receives payments on a routine basis that approximate the income earned on one of the limited partnerships that invest in income-producing real estate.partnership. The carrying valuesvalue of the collateral loans werewas $6.2 million and $7.2 million and $98,000 as of December 31, 20162017 and December 31, 2015,2016, respectively.
Net realized investment gains were $6,000 for the year ended December 31, 2017 and resulted from the sale of one equity method investment. There were no net realized investment gains or losses for the years ended December 31, 2016 and 2015.
The following table summarizes investments in equity method investments by investment type as of December 31, 20162017 and December 31, 20152016 ($ in '000s)‘000s):
| | | | Unfunded Commitments | Carrying Value | Unfunded Commitments | Carrying Value |
| As of December 31, | 2016 | 2015 | 2017 | 2016 |
| Real estate | $ | 2,497 |
| $ | 10,514 |
| $ | 10,202 |
| |
Real estate1 | | $ | 2,842 |
| $ | 10,660 |
| $ | 10,797 |
|
| Insurance linked securities | — |
| 9,178 |
| 8,747 |
| — |
| 9,073 |
| 9,178 |
|
| Activist hedge funds | — |
| 4,336 |
| 3,685 |
| — |
| 4,367 |
| 4,336 |
|
| Venture capital | 300 |
| 906 |
| 205 |
| |
Venture capital1 | | 4,150 |
| 853 |
| 623 |
|
| Other joint venture | | — |
| 325 |
| — |
|
| Total Equity Method Investments | $ | 2,797 |
| $ | 24,934 |
| $ | 22,839 |
| $ | 6,992 |
| $ | 25,278 |
| $ | 24,934 |
|
1- We recategorized the carrying value of one limited partnership that was valued at $283,000 as of December 31, 2016 from ‘Venture capital’ to ‘Real estate’ based on its operations.
The Company recognizes an impairment loss for equity method limited partnerships when evidence demonstrates that the loss is other-than-temporary. To determine if an other-than-temporary impairment has occurred, the Company evaluates whether or not the investee could sustain a level of earnings that would justify the carrying amount of the investment. Collateral loans are considered impaired when it is probable that the Company will not collect the contractual principal and interest. Valuation allowances are established for impaired loans equal to the fair value of the collateral less costs to sell or the present value of the loan'sloan’s expected future repayment cash flows discounted at the loan'sloan’s original effective interest rate. Valuation allowances are adjusted for subsequent changes in the fair value of the collateral less costs to sell or the present value of the loan'sloan’s expected future repayment cash flows. As of December 31, 20162017 and as of December 31, 2015,2016, the Company had no valuation allowances established for impaired loans.
Collateral pledged:
As of December 31, 2017 and 2016, bonds, cash and 2015, bonds and term depositscash equivalents with a fair value of $15.1$15.0 million and $15.8$15.1 million, respectively, were on deposit with state and provincial regulatory authorities. Also, from time to time, the Company pledges securities to and deposits cash with third parties to collateralize liabilities incurred under its policies of reinsurance assumed and other commitments made by the Company. As of December 31, 20162017 and as of December 31, 2015,2016, the amounts of such pledged securities were $5.6$12.2 million and $3.6$5.6 million, respectively. Collateral pledging transactions are conducted under terms that are common and customary to standard collateral pledging and are subject to the Company’s standard risk management controls. These assets and investment income related thereto remain the property of the Company while pledged. Neither the state and/or provincial regulatory authorities nor any other third party has the right to re-pledge or sell said securities held on deposit.
6. FAIR VALUE OF FINANCIAL INSTRUMENTS
U.S. GAAP requires certain assets and liabilities to be reported at fair value in the financial statements and provides a framework for establishing that fair value. Level 1 inputs are given the highest priority in the hierarchy while Level 3 inputs are given the lowest priority. Assets and liabilities carried at fair value are classified in one of the following three categories based on the nature of the inputs to the valuation technique used:
Level 1 - Observable inputs that reflect unadjusted quoted prices for identical assets or liabilities in active markets as of the reporting date. Active markets are those in which transactions for the asset or liability occur in sufficient frequency and volume to provide pricing information on an ongoing basis.
Level 2 - Observable market-based inputs or unobservable inputs that are corroborated by market data.
Level 3 - Unobservable inputs that are not corroborated by market data. These inputs reflect management'smanagement’s best estimate of fair value using its own assumptions about the assumptions a market participant would use in pricing the asset or liability.
Assets and liabilities are classified in their entirety based on the lowest level of input that is significant to the fair value measurement. Atlas'Atlas’ assessment of the significance of a particular input to the fair value measurement requires judgment, and may affect the placement of the asset or liability within the fair value hierarchy levels.
The following is a summary of significant valuation techniques for assets measured at fair value on a recurring basis:
Level 1
Equities: Comprised of publicly-traded common stocks. Valuation is based on unadjusted quoted prices for identical assets in active markets that Atlas can access.
Fixed Income: Comprised of certain U.S. Treasury fixed income securities. Valuation is based on unadjusted quoted prices for identical assets in active markets that Atlas can access.
Level 2
States, Municipalities and Political Subdivisions: Comprised of U.S. States, Territories and Possessions, U.S. Political Subdivisions of States, Territories and Possessions, U.S. Special Revenue and Special Assessment Obligations. The primary inputs to the valuation include quoted prices for identical assets in inactive markets or similar assets in active or inactive markets, contractual cash flows, benchmark yields and credit spreads.
Corporate Bonds: Comprised of investment-grade fixed income securities. The primary inputs to the valuation include quoted prices for identical assets in inactive markets or similar assets in active or inactive markets, contractual cash flows, benchmark yields and credit spreads.
Mortgage-backed and Other asset-backed: Comprised of securities that are collateralized by mortgage obligations and other assets. The primary inputs to the valuation include quoted prices for identical assets in inactive markets or similar assets in active or inactive markets, contractual cash flows, benchmark yields, collateral performance and credit spreads.
The following table summarizes Atlas'Atlas’ investments at fair value as of December 31, 20162017 and December 31, 20152016 ($ in '000s)‘000s):
| | | December 31, 2016 | Level 1 | Level 2 | Level 3 | Total | |
| December 31, 2017 | | Level 1 | Level 2 | Level 3 | Total |
| Fixed Income Securities: | | |
| U.S. Treasury and other U.S. government obligations | $ | 22,474 |
| $ | — |
| $ | — |
| $ | 22,474 |
| $ | 21,186 |
| $ | — |
| $ | — |
| $ | 21,186 |
|
| States, municipalities and political subdivisions | — |
| 10,470 |
| — |
| 10,470 |
| — |
| 13,243 |
| — |
| 13,243 |
|
| Corporate | | |
| Banking/financial services | — |
| 22,852 |
| — |
| 22,852 |
| — |
| 21,382 |
| — |
| 21,382 |
|
| Consumer goods | — |
| 8,593 |
| — |
| 8,593 |
| — |
| 9,679 |
| — |
| 9,679 |
|
| Capital goods | — |
| 7,873 |
| — |
| 7,873 |
| — |
| 7,992 |
| — |
| 7,992 |
|
| Energy | — |
| 3,735 |
| — |
| 3,735 |
| — |
| 7,515 |
| — |
| 7,515 |
|
| Telecommunications/utilities | — |
| 7,617 |
| — |
| 7,617 |
| — |
| 11,215 |
| — |
| 11,215 |
|
| Health care | — |
| 1,357 |
| — |
| 1,357 |
| — |
| 1,059 |
| — |
| 1,059 |
|
| Total Corporate | — |
| 52,027 |
| — |
| 52,027 |
| — |
| 58,842 |
| — |
| 58,842 |
|
| Mortgage Backed | | |
| Mortgage backed - agency | — |
| 34,014 |
| — |
| 34,014 |
| — |
| 30,613 |
| — |
| 30,613 |
|
| Mortgage backed - commercial | — |
| 21,158 |
| — |
| 21,158 |
| — |
| 22,587 |
| — |
| 22,587 |
|
| Total Mortgage Backed | — |
| 55,172 |
| — |
| 55,172 |
| — |
| 53,200 |
| — |
| 53,200 |
|
| Other asset backed | — |
| 16,344 |
| — |
| 16,344 |
| — |
| 11,513 |
| — |
| 11,513 |
|
| Total Fixed Income Securities | $ | 22,474 |
| $ | 134,013 |
| $ | — |
| $ | 156,487 |
| $ | 21,186 |
| $ | 136,798 |
| $ | — |
| $ | 157,984 |
|
| Equities | 6,223 |
| — |
| — |
| 6,223 |
| 8,446 |
| — |
| — |
| 8,446 |
|
| Totals | $ | 28,697 |
| $ | 134,013 |
| $ | — |
| $ | 162,710 |
| $ | 29,632 |
| $ | 136,798 |
| $ | — |
| $ | 166,430 |
|
| | | December 31, 2015 | Level 1 | Level 2 | Level 3 | Total | |
| December 31, 2016 | | Level 1 | Level 2 | Level 3 | Total |
| Fixed Income Securities: | | |
| U.S. Treasury and other U.S. government obligations | $ | 23,483 |
| $ | — |
| $ | — |
| $ | 23,483 |
| $ | 22,474 |
| $ | — |
| $ | — |
| $ | 22,474 |
|
| States, municipalities and political subdivisions | — |
| 22,154 |
| — |
| 22,154 |
| — |
| 10,470 |
| — |
| 10,470 |
|
| Corporate | | |
| Banking/financial services | — |
| 21,914 |
| — |
| 21,914 |
| — |
| 22,852 |
| — |
| 22,852 |
|
| Consumer goods | — |
| 7,735 |
| — |
| 7,735 |
| — |
| 8,593 |
| — |
| 8,593 |
|
| Capital goods | — |
| 15,095 |
| — |
| 15,095 |
| — |
| 7,873 |
| — |
| 7,873 |
|
| Energy | — |
| 4,406 |
| — |
| 4,406 |
| — |
| 3,735 |
| — |
| 3,735 |
|
| Telecommunications/utilities | — |
| 11,875 |
| — |
| 11,875 |
| — |
| 7,617 |
| — |
| 7,617 |
|
| Health care | — |
| 3,021 |
| — |
| 3,021 |
| — |
| 1,357 |
| — |
| 1,357 |
|
| Total Corporate | — |
| 64,046 |
| — |
| 64,046 |
| — |
| 52,027 |
| — |
| 52,027 |
|
| Mortgage Backed | | |
| Mortgage backed - agency | — |
| 34,673 |
| — |
| 34,673 |
| — |
| 34,014 |
| — |
| 34,014 |
|
| Mortgage backed - commercial | — |
| 19,875 |
| — |
| 19,875 |
| — |
| 21,158 |
| — |
| 21,158 |
|
| Total Mortgage Backed | — |
| 54,548 |
| — |
| 54,548 |
| — |
| 55,172 |
| — |
| 55,172 |
|
| Other asset backed | — |
| 19,542 |
| — |
| 19,542 |
| — |
| 16,344 |
| — |
| 16,344 |
|
| Total Fixed Income Securities | $ | 23,483 |
| $ | 160,290 |
| $ | — |
| $ | 183,773 |
| $ | 22,474 |
| $ | 134,013 |
| $ | — |
| $ | 156,487 |
|
| Equities | 4,240 |
| — |
| — |
| 4,240 |
| 6,223 |
| — |
| — |
| 6,223 |
|
| Totals | $ | 27,723 |
| $ | 160,290 |
| $ | — |
| $ | 188,013 |
| $ | 28,697 |
| $ | 134,013 |
| $ | — |
| $ | 162,710 |
|
Atlas primarily uses the services of external securities pricing vendors to obtain these values. Atlas then reviews these valuations to ensure that the values are accurately recorded and that the data inputs and valuation techniques utilized are appropriate, consistently applied, and that the assumptions are reasonable and consistent with the objective of determining fair value.
Though Atlas believes the valuation methods used in determining fair value are appropriate, different methodologies or assumptions could result in a different fair value as of December 31, 2016.2017. Management does not believe that reasonable changes to the inputs to its valuation methodology would result in a significantly higher or lower fair value measurement.
The Company had no fair value investments classified as Level 3 as of December 31, 20162017 and December 31, 2015.2016. There were no transfers in or out of Level 2 or Level 3 during the years ended December 31, 20162017 and 2015.2016.
7. INCOME TAXES
Atlas'On December 22, 2017, the Tax Act was signed into law. Among other things, beginning with the 2018 tax year, the Tax Act reduced the Company’s corporate federal tax rate from a marginal rate of 35% to a flat 21%, eliminated the corporate Alternative Minimum Tax (“AMT”), changed reserving and other aspects of the computation of taxable income for insurance companies, and modified the net operating loss carryback and carryforward provisions for all entities in the group except for those subject to tax as property and casualty companies. The modified net operating loss provisions no longer allow a carryback to prior years to recover past taxes, but now allow an indefinite carryforward period subject to a yearly utilization limit. As discussed above, any net operating losses with respect to the insurance entities taxed as property and casualty companies retain the current net operating loss carryback and carryover provisions, which are two years carryback and 20 years carryforward. As of December 31, 2016, the Company measured its deferred tax items at the enacted rate in effect of 35%. Due to the Tax Act’s enactment, the Company’s deferred tax assets and liabilities as of December 31, 2017 have been re-measured at the new enacted tax rate of 21%. For the year ended December 31, 2017, the Company recognized income tax expense of $10.5 million related to reduction in the net deferred tax asset a result of this re-measurement.
Atlas’ effective tax rate was 12.1%, (416.8)%, 34.5%, and (48.3)%34.5% for the years ended December 31, 2017, 2016, 2015, and 2014,2015, respectively. The table below reconciles the U.S. statutory marginal income tax rate to the effective tax rate ($ in '000s)‘000s):
| | | Year Ended December 31, | 2016 | | 2015 | | 2014 | 2017 | | 2016 | | 2015 |
| | Amount | | % | | Amount | | % | | Amount | | % | Amount | | % | | Amount | | % | | Amount | | % |
| Provision for taxes at U.S. statutory marginal income tax rate | $ | 179 |
| | 35.0 | % | | $ | 7,716 |
| | 35.0 | % | | $ | 4,058 |
| | 34.0 | % | $ | (15,453 | ) | | 35.0 | % | | $ | 179 |
| | 35.0 | % | | $ | 7,716 |
| | 35.0 | % |
| Provision for deferred tax assets deemed unrealizable (valuation allowance) | — |
| | — | % | | — |
| | — | % | | (9,446 | ) | | (79.1 | )% | |
| Nondeductible expenses | 24 |
| | 4.7 | % | | 124 |
| | 0.6 | % | | 136 |
| | 1.1 | % | 51 |
| | (0.1 | )% | | 24 |
| | 4.7 | % | | 124 |
| | 0.6 | % |
| Tax-exempt income | (39 | ) | | (7.6 | )% | | (89 | ) | | (0.4 | )% | | — |
| | — | % | (23 | ) | | 0.1 | % | | (39 | ) | | (7.6 | )% | | (89 | ) | | (0.4 | )% |
| State tax (net of federal benefit) | 28 |
| | 5.5 | % | | 118 |
| | 0.5 | % | | 11 |
| | 0.1 | % | (2 | ) | | — | % | | 28 |
| | 5.5 | % | | 118 |
| | 0.5 | % |
| Tax net operating loss limitation write-down (excluding valuation allowance) | — |
| | — | % | | — |
| | — | % | | (519 | ) | | (4.3 | )% | |
| Stock compensation | | (445 | ) | | 1.0 | % | | — |
| | — | % | | — |
| | — | % |
| Nondeductible acquisition accounting adjustment | (2,204 | ) | | (430.5 | )% | | 329 |
| | 1.5 | % | | — |
| | — | % | — |
| | — | % | | (2,204 | ) | | (430.5 | )% | | 329 |
| | 1.5 | % |
| Change in statutory tax rate | — |
| | — | % | | (471 | ) | | (2.1 | )% | | — |
| | — | % | 10,542 |
| | (23.9 | )% | | — |
| | — | % | | (471 | ) | | (2.1 | )% |
| Other | (122 | ) | | (23.9 | )% | | (111 | ) | | (0.6 | )% | | (7 | ) | | (0.1 | )% | (13 | ) | | — | % | | (122 | ) | | (23.9 | )% | | (111 | ) | | (0.6 | )% |
| Provision for income taxes for continuing operations | $ | (2,134 | ) | | (416.8 | )% | | $ | 7,616 |
| | 34.5 | % | | $ | (5,767 | ) | | (48.3 | )% | $ | (5,343 | ) | | 12.1 | % | | $ | (2,134 | ) | | (416.8 | )% | | $ | 7,616 |
| | 34.5 | % |
Income tax (benefit) expense consists of the following for the years ended December 31, 2017, 2016, 2015, and 20142015 ($ in '000s)‘000s): | | | Year Ended December 31, | 2016 | 2015 | 2014 | 2017 | 2016 | 2015 |
| Current tax (benefit) expense | $ | (2,586 | ) | $ | 7,790 |
| $ | 3,009 |
| $ | (6,719 | ) | $ | (2,586 | ) | $ | 7,790 |
|
| Deferred tax expense (benefit), net of change in valuation allowance | 452 |
| (174 | ) | (8,776 | ) | |
| Deferred tax expense (benefit) | | 1,376 |
| 452 |
| (174 | ) |
| Total | $ | (2,134 | ) | $ | 7,616 |
| $ | (5,767 | ) | $ | (5,343 | ) | $ | (2,134 | ) | $ | 7,616 |
|
Upon the transaction forming Atlas on December 31, 2010, a yearly limitation as required by U.S. Internal Revenue Code of 1986 (as amended, "IRC"“IRC”) Section 382 that applies to changes in ownership on the future utilization of Atlas’ net operating loss carryforwards was calculated. The Insurance Subsidiaries’ prior parent retained those tax assets previously attributed to the Insurance Subsidiaries, which could not be utilized by Atlas as a result of this limitation. As a result, Atlas’ ability to recognize future tax benefits associated with a portion of its deferred tax assets generated during prior years has been permanently limited to the amount determined under IRC Section 382. The result is a maximum expected net deferred tax asset that Atlas has available after the merger, which is believed more-likely-than-not to be utilized in the future, after consideration of valuation allowance.
On July 22, 2013, due to shareholder activity, a "triggering event"“triggering event” as determined under IRC Section 382 occurred. As a result, under IRC Section 382, the use of the Company'sCompany’s net operating loss and other carryforwards generated prior to the “triggering event” will be limited as a result of this "ownership“ownership change” for tax purposes, which is defined as a cumulative change of more than 50% during any three-year period by shareholders owning 5% or greater portions of the Company'sCompany’s shares. Due to this triggering event, the Company estimates that it will retain total tax effected federal net operating loss carryforwards of approximately $14.5$13.3 million as of December 31, 2016.2017.
The components of net deferred income tax assets and liabilities as of December 31, 20162017 and December 31, 20152016 are as follows ($ in '000s)‘000s):
| | | | December 31, 2016 | December 31, 2015 | December 31, 2017 | December 31, 2016 |
| Deferred tax assets: | | |
| Gross deferred tax assets: | | |
| Losses carried forward | $ | 14,535 |
| $ | 12,656 |
| $ | 13,313 |
| $ | 14,535 |
|
| Unpaid claims liabilities and unearned premiums | 8,546 |
| 8,122 |
| |
| Claims liabilities and unearned premium reserves | | 6,171 |
| 8,546 |
|
| Tax credits | 662 |
| 662 |
| 1,172 |
| 662 |
|
| Investments | — |
| 36 |
| |
| Commissions | 1,269 |
| 1,306 |
| 623 |
| 1,269 |
|
| All other | 2,184 |
| 1,457 |
| |
| Stock compensation | | 602 |
| 1,157 |
|
| Other | | 1,094 |
| 1,027 |
|
| Total gross deferred tax assets | 27,196 |
| 24,239 |
| 22,975 |
| 27,196 |
|
| | | |
| Deferred tax liabilities: | | |
| Gross deferred tax liabilities: | | |
| Deferred policy acquisition costs | 4,628 |
| 3,582 |
| 3,107 |
| 4,628 |
|
| Investments | 475 |
| — |
| 213 |
| 475 |
|
| Fixed assets | 559 |
| 401 |
| 847 |
| 559 |
|
| Intangible assets | 1,328 |
| 1,465 |
| 715 |
| 1,328 |
|
| All other | 1,708 |
| 1,625 |
| |
| Other | | 1,108 |
| 1,708 |
|
| Total gross deferred tax liabilities | 8,698 |
| 7,073 |
| 5,990 |
| 8,698 |
|
| Net deferred tax assets | $ | 18,498 |
| $ | 17,166 |
| $ | 16,985 |
| $ | 18,498 |
|
Amounts and expiration dates of the operating loss carryforwards as of December 31, 20162017 are as follows ($ in '000s)‘000s):
| | | Year of Occurrence | Year of Expiration | Amount | Year of Expiration | Amount |
| 2001 | 2021 | $ | 5,007 |
| 2021 | $ | 5,007 |
|
| 2002 | 2022 | 4,317 |
| 2022 | 4,317 |
|
| 2006 | 2026 | 7,825 |
| 2026 | 7,825 |
|
| 2007 | 2027 | 5,131 |
| 2027 | 5,131 |
|
| 2008 | 2028 | 1,949 |
| 2028 | 1,949 |
|
| 2009 | 2029 | 1,949 |
| 2029 | 1,949 |
|
| 2010 | 2030 | 1,949 |
| 2030 | 1,949 |
|
| 2011 | 2031 | 4,166 |
| 2031 | 4,166 |
|
| 2012 | 2032 | 9,235 |
| 2032 | 9,236 |
|
| 2015 | 2035 | 1 |
| 2035 | 1 |
|
| 2017 | | 2037 | 21,864 |
|
| Total | | $ | 41,529 |
| | $ | 63,394 |
|
NOLs and other carryforwards generated in 2015 and 2017 are not limited by IRC Section 382.
Atlas has not established a valuation allowance for its gross future deferred tax assets as of December 31, 20162017 or as of December 31, 2015.2016. Based on Atlas’ expectations of future taxable income, its ability to change its investment strategy, as well as reversing gross future tax liabilities, management believes it is more likely than not that Atlas will fully realize the net future tax assets. The Company, therefore, released its remainingHowever, there can be no guarantee that a valuation allowance as of December 31, 2014.will not be required in the future.
Atlas accounts for uncertain tax positions in accordance with the income taxes accounting guidance. Atlas has analyzed filing positions in the federal and state jurisdictions where it is required to file tax returns, as well as the open tax years in these jurisdictions. Atlas believes that its federal and state income tax filing positions and deductions will be sustained on audit and does not anticipate any adjustments that will result in a material change to its financial position. Therefore, no reserves for uncertain federal and state income tax positions have been recorded. Atlas would recognize interest and penalties related to unrecognized tax benefits as a component of the provision for federal income taxes. Atlas did not incur any federal income tax related interest income, interest expense or penalties for the years ended December 31, 2017, 2016, 2015, and 2014.2015. The IRSInternal Revenue Service (“IRS”) completed its audit of tax year 2012 during the three month period ended March 31, 2016. No changes to tax year 2012 were made to our reported tax. Tax years 20132014 and years thereafter are subject to examination by the Internal Revenue Service ("IRS").IRS.
8. COMMITMENTS AND CONTINGENCIES
On May 22, 2012, Atlas closed the sale and leaseback of the former headquarters building to 150 Northwest Point, LLC, a Delaware limited liability company. Atlas recognized a gain on the sale of this property of $213,000, which will bewas deferred and recognized over the initial five year lease term, which endsended in May 2017. The deferred gain was completely recognized at the end of the second quarter. Atlas recognized $43,000$17,000 as an offset to rent expense for the year ended December 31, 2017 and $43,000 for each of the years ended December 31, 2016 2015, and 2014.2015. Total rental expense recognized on the former headquarters building was $740,000, $743,000 $704,000 and $707,000$704,000 for the years ended December 31, 2017, 2016, and 2015, and 2014, respectively. The increase in rental expense on the headquarters building for the year ended December 31, 2016 was primarily due to the leasing of additional space.
As of December 31, 2016,2017, Atlas has the following future minimum rentals, related principally to office space, required under operating leases having initial or remaining noncancelable lease terms in excess of one year ($ in '000s)‘000s):
| | | Year | 2017 | 2018 | 2019 | 2020 | 2021 | 2022 & Beyond | Total | 2018 | 2019 | 2020 | 2021 | 2022 | 2023 & Beyond | Total |
| Amount | $ | 1,033 |
| $ | 997 |
| $ | 996 |
| $ | 990 |
| $ | 946 |
| $ | 146 |
| $ | 5,108 |
| $ | 1,053 |
| $ | 1,066 |
| $ | 1,056 |
| $ | 937 |
| $ | 157 |
| $ | — |
| $ | 4,269 |
|
Excluded fromThe Company has entered into various contracts to renovate and furnish the table above isbuilding that was purchased in 2016 to serve as the Company’s new headquarters, which the Company moved into on October 27, 2017. As of December 31, 2017, the remaining amount for the headquarter building due to a remaining noncancelable lease term of less than one year and future sublease incomecontractual obligations related to an existing lease due to the uncertain timingrenovation and furnishing of the beginning of the sublease. Total rental expense for the headquarterAtlas’ new headquarters building in 2017 will be approximately $661,000.are $1.2 million.
The Company has entered into subscription agreements to allow for participation by the Company in limited liability investments, which invest in income-producing real estate, equities and insurance linked securities. As of December 31, 2016,2017, the unfunded commitments are $2.8$7.0 million.
In the ordinary course of its business, Atlas is involved in legal proceedings, including lawsuits, regulatory examinations and inquiries. Based on currently available information, the Company does not believe that it is reasonably possible that any of its pending legal proceedings will have a material effect on the Company's Consolidated Financial Statements.
Atlas is exposed to credit risk on balances receivable from policyholders, agents and reinsurers. Credit exposure to any one individual policyholder is not material. The Company'sCompany’s policies, however, are distributed by agents who may manage cash collection on its behalf pursuant to the terms of their agency agreement. Atlas has procedures to monitor and minimize its exposure to delinquent agent balances, including, but not limited to, reviewing account current statements, processing policy cancellations for non-payment and other collection efforts deemed appropriate. Atlas also has procedures to evaluate the financial condition of its reinsurers and monitors concentrations of credit risk arising from similar geographic regions, activities, or economic characteristics of the reinsurers to minimize its exposure to significant losses from reinsurers’ insolvency.
Virtually all states require insurers licensed to do business therein to bear a portion of contingent and incurred claims handling expenses and the unfunded amount of “covered” claims and unearned premium obligations of impaired or insolvent insurance companies, either up to the policy'spolicy’s limit, the applicable guaranty fund covered claims obligation cap, or 100% of statutorily defined workers'workers’ compensation benefits, subject to applicable deductibles. These obligations are funded by assessments, made on a retrospective, prospective or pre-funded basis, which are levied by guaranty associations within the state, up to prescribed limits (typically 2% of “net direct written premium”), on all member insurers in the state on the basis of the proportionate share of the premiums written by member insurers in certain covered lines of business in which the impaired, insolvent or failed insurer was engaged.
In addition, as a condition to the ability to conduct business in certain states (and within the jurisdiction of some local governments), insurance companies are subject to or required to participate in various premium or claims based insurance-related assessments, including non-voluntary assigned risk pools, underwriting associations, workers'workers’ compensation second-injury funds, reinsurance funds and other state insurance facilities. Atlas'Atlas’ proportionate share of these various premium or claims based insurance-related assessments, including non-voluntary assigned risk pools, underwriting associations, workers'workers’ compensation second-injury funds, reinsurance funds and other state insurance facilities is not expected to be material.
9. PROPERTY AND EQUIPMENT
Atlas held the following property and equipment, including internal use software, as of December 31, 20162017 and December 31, 20152016 (excluding assets held for sale) ($ in '000s)‘000s):
| | | As of December 31, | 2016 | | 2015 | 2017 | | 2016 |
| Buildings | $ | 7,425 |
| | $ | — |
| $ | 7,425 |
| | $ | 7,425 |
|
| Land | 1,840 |
| | — |
| 1,840 |
| | 1,840 |
|
| Building improvements | 139 |
| | — |
| 7,900 |
| | 139 |
|
| Leasehold improvements | 527 |
| | 507 |
| 140 |
| | 527 |
|
| Internal use software | 8,078 |
| | 7,611 |
| 9,567 |
| | 8,078 |
|
| Computer equipment | 2,464 |
| | 2,225 |
| 1,465 |
| | 2,464 |
|
| Furniture and other office equipment | 586 |
| | 593 |
| 2,582 |
| | 586 |
|
| Total | $ | 21,059 |
| | $ | 10,936 |
| $ | 30,919 |
| | $ | 21,059 |
|
| Accumulated depreciation | (9,289 | ) | | (8,347 | ) | (6,480 | ) | | (9,289 | ) |
| Total property and equipment, net | $ | 11,770 |
| | $ | 2,589 |
| $ | 24,439 |
| | $ | 11,770 |
|
Depreciation expense and amortization was $1.4 million, $1.0 million, $966,000, and $856,000$966,000 for the years ended December 31, 2017, 2016, 2015, and 2014,2015, respectively.
During the year ended December 31, 2016, Atlas purchased a building and land for $9.3 million to serve as its new corporate headquarters to replace the currentits former leased office space. Atlas’ Chicago area staff moved into this space in late October 2017 and occupies approximately 70,000 square feet on the late second or earlyand third quarter of 2017. Atlas plans to move into the new location after the necessary renovations are completed. There is currently an unaffiliated tenant leasing one of the three floors of the new building. An unrelated tenant occupies the remaining office space on the first floor of the building. Rental income related to this lease agreement for the years ended December 31, 2017 and 2016, was $415,000 and $69,000, respectively. Depreciation expense related to the building and its improvements was $171,000 for the year ended December 31, 2017. There was no depreciation expense related to the building and its improvements recorded for the year ended December 31, 2016.
Effective July 1,Net realized losses on the disposal and sales of equipment were $12,000 for the year ended December 31, 2017. There were no realized gains or losses on the disposal of property or equipment for the year ended December 31, 2016. For the year ended December 31, 2015, the Company implementedsold property in Alabama and recognized a new policy management software and began amortizing the costloss of the software. Total capitalized cost of the software was approximately $2.1 million. Amortization expense for the new software for the years ended December 31, 2016 and 2015 were $401,000 and $186,000, respectively.$20,000.
10. REINSURANCE CEDED
As is customary in the insurance industry, Atlas reinsures portions of certain insurance policies it writes, thereby providing a greater diversification of risk and minimizing exposure on larger risks. Atlas remains contingently at risk with respect to any reinsurance ceded and would incur an additional loss if an assuming company were unable to meet its obligation under the reinsurance treaty.
Atlas monitors the financial condition of its reinsurers to minimize its exposure to significant losses from reinsurer insolvencies. Letters of credit are maintained for any unauthorized reinsurer to cover ceded unearned premium reserves, ceded claims and claims adjustment expense reserve balances and ceded paid claims. These policies mitigate the risk of credit quality or dispute from becoming a danger to financial strength. To date, the Company has not experienced any material difficulties in collecting reinsurance recoverables.
Premiums written, premiums earned and amounts related to reinsurance as of and for the years ended December 31, 2017, 2016, 2015, and 20142015 are as follows ($ in '000s)‘000s):
| | | | 2016 | 2015 | 2014 | 2017 | 2016 | 2015 |
| Direct premiums written | $ | 221,723 |
| $ | 208,570 |
| $ | 122,339 |
| $ | 261,276 |
| $ | 221,723 |
| $ | 208,570 |
|
| Assumed premiums written | 3,372 |
| 716 |
| 93 |
| 14,685 |
| 3,372 |
| 716 |
|
| Ceded premiums written | (45,028 | ) | (39,609 | ) | (11,011 | ) | (44,825 | ) | (45,028 | ) | (39,609 | ) |
| Net premiums written | $ | 180,067 |
| $ | 169,677 |
| $ | 111,421 |
| $ | 231,136 |
| $ | 180,067 |
| $ | 169,677 |
|
| | |
| Direct premiums earned | $ | 217,053 |
| $ | 182,376 |
| $ | 107,587 |
| $ | 251,293 |
| $ | 217,053 |
| $ | 182,376 |
|
| Assumed premiums earned | 3,074 |
| 634 |
| 126 |
| 9,796 |
| 3,074 |
| 634 |
|
| Ceded premiums earned | (49,069 | ) | (30,946 | ) | (9,589 | ) | (45,318 | ) | (49,069 | ) | (30,946 | ) |
| Net premiums earned | $ | 171,058 |
| $ | 152,064 |
| $ | 98,124 |
| $ | 215,771 |
| $ | 171,058 |
| $ | 152,064 |
|
| | | |
| Ceded claims and claims adjustment expenses | 32,496 |
| 19,113 |
| 8,783 |
| 46,643 |
| 32,496 |
| 19,113 |
|
| Ceding commissions | 12,065 |
| 7,798 |
| 2,374 |
| 11,304 |
| 12,065 |
| 7,798 |
|
| | | |
| Reinsurance recoverables on unpaid claims and claims adjustment expenses | 35,370 |
| 29,399 |
| 18,421 |
| 53,402 |
| 35,370 |
| 29,399 |
|
| Prepaid reinsurance premiums | 13,372 |
| 17,412 |
| 3,628 |
| 12,878 |
| 13,372 |
| 17,412 |
|
| Reinsurance recoverables on paid claims and claims adjustment expenses | 7,786 |
| 3,277 |
| 2,230 |
| 7,982 |
| 7,786 |
| 3,277 |
|
| | | |
11. CLAIMS LIABILITIES
Unpaid claims and claims adjustment expenses
The changes in the provision for unpaid claims and claims adjustment expenses, net of amounts recoverable from reinsurers, for the years ended December 31, 2017, 2016, 2015, and 20142015 were as follows ($ in '000s)‘000s):
| | | As of the year ended December 31, | 2016 | | 2015 | | 2014 | 2017 | | 2016 | | 2015 |
| Unpaid claims and claims adjustment expenses, beginning of period | $ | 127,011 |
| | $ | 102,430 |
| | $ | 101,385 |
| $ | 139,004 |
| | $ | 127,011 |
| | $ | 102,430 |
|
| Less: reinsurance recoverable | 29,399 |
| | 18,421 |
| | 18,144 |
| 35,370 |
| | 29,399 |
| | 18,421 |
|
| Net unpaid claims and claims adjustment expenses, beginning of period | 97,612 |
| | 84,009 |
| | 83,241 |
| 103,634 |
| | 97,612 |
| | 84,009 |
|
| | | | | | | | | | | |
| Net reserves acquired | — |
| | 19,396 |
| | — |
| — |
| | — |
| | 19,396 |
|
| | | | | | | | | | | |
| Change in retroactive reinsurance ceded | 107 |
| | 2,037 |
| | 2,415 |
| 1,361 |
| | 107 |
| | 2,037 |
|
| | | | | | | | | | | |
| Incurred related to: | | | | | | | | | | |
| Current year | 102,133 |
| | 89,828 |
| | 61,680 |
| 128,476 |
| | 102,133 |
| | 89,828 |
|
| Prior years | 32,613 |
| | 166 |
| | (602 | ) | 75,397 |
| | 32,613 |
| | 166 |
|
| | 134,746 |
| | 89,994 |
| | 61,078 |
| 203,873 |
| | 134,746 |
| | 89,994 |
|
| Paid related to: | | | | | | | | | | |
| Current year | 39,652 |
| | 32,402 |
| | 19,427 |
| 50,626 |
| | 39,652 |
| | 32,402 |
|
| Prior years | 89,179 |
| | 65,422 |
| | 43,298 |
| 99,996 |
| | 89,179 |
| | 65,422 |
|
| | 128,831 |
| | 97,824 |
| | 62,725 |
| 150,622 |
| | 128,831 |
| | 97,824 |
|
| | | | | | | | | | | |
| Net unpaid claims and claims adjustment expenses, end of period | 103,634 |
| | 97,612 |
| | 84,009 |
| 158,246 |
| | 103,634 |
| | 97,612 |
|
| Add: reinsurance recoverable | 35,370 |
| | 29,399 |
| | 18,421 |
| 53,402 |
| | 35,370 |
| | 29,399 |
|
| Unpaid claims and claims adjustment expenses, end of period | $ | 139,004 |
| | $ | 127,011 |
| | $ | 102,430 |
| $ | 211,648 |
| | $ | 139,004 |
| | $ | 127,011 |
|
The process of establishing the estimated provision for unpaid claims and claims adjustment expenses is complex and imprecise, as it relies on the judgment and opinions of a large number of individuals, on historical precedent and trends, on prevailing legal, economic, social and regulatory trends and on expectations as to future developments. The process of determining the provision necessarily involves risks that the actual results may deviate, perhaps substantially, from the best estimates made.
Atlas experienced $75.4 million in unfavorable prior accident year development for the year ended December 31, 2017 as reflected as incurred related to prior years in the table above. The unfavorable development is primarily from our core commercial automobile liability line. Atlas previously identified that claim expenses in Michigan were significantly outpacing other states and took a significant charge. Although exposure in Michigan was reduced to approximately 1.4% of the Company’s insured vehicles inforce by year end 2017, payments for claims in this state continued to be disproportionate to historic premiums earned. In addition, the remaining liability for non-New York Global Liberty business written prior to 2016 is expected to settle for greater amounts than previously expected. Overall, the actuarially determined liability for remaining claims related to accident year 2015 and prior in general, across all jurisdictions, was indicated to be higher than carried reserves.
Atlas experienced $32.6 million in unfavorable prior accident year development for the year ended December 31, 2016 as reflected as incurred related to prior years in the table above. The unfavorable development is primarily from our core commercial automobile liability line. Excluding pre-acquisition Global Liberty reserve development, the development of our core lines on prior accident years was $23.2 million for the year ended December 31, 2016. Michigan commercial automobile claims accounted for approximately 62.5% of this development. Pre-acquisition Global Liberty claims reserve development was $7.9 million for the year ended December 31, 2016. The remaining unfavorable prior year development of $1.5 million for the year ended December 31, 2016 is attributable to assigned risk pools and run-off of non-core business.
Atlas experienced $166,000 in unfavorable prior accident year development forduring the year ended December 31, 2015 as reflected as incurred related to prior years in the table above. Prior accident year unfavorable development on non-core lines and assigned risk pools was $870,000 for the year ended December 31, 2015. This increaseThe unfavorable development on non-core lines and assigned risk pools was offset by favorable prior accident year development of $475,000 and $230,000 on our core lines and pre-acquisition Global Liberty claims reserves, respectively. This favorable development on our core lines was attributable to our traditional taxi and excess taxi products.
Atlas experienced favorable prior year development during the year ended December 31, 2014 of $352,000 on its core lines and $250,000 on its non-core lines as reflected as incurred related to prior years in the table above. The favorable development on our core lines was primarily related to pre-acquisition Gateway claims reserves.
Short-duration insurance contracts
For purposes of this discussion, Atlas will disaggregate data based on the type of coverage into commercial automobile liability, including personal injury protection, and all other lines. Commercial automobile liability is the main line of business that Atlas operates. All other lines includes commercial automobile physical damage, taxi workers'workers’ compensation, other liability and Atlas'Atlas’ short duration lines that are currently in run-off. Amounts related to the Gateway and Global Liberty acquisitions have been included retrospectively for all years presented in the tables below.
Claims payments and changes in reserves may be made on accidents that occurred in prior years, not solely on business that is currently insured. Calendar year claims consist of payments and reserve changes that have been recorded in the financial statements during the applicable reporting period, without regard to the period in which the accident occurred. Calendar year results do not change after the end of the applicable reporting period, even as new claim information develops. Accident year claims consist of payments and reserve changes that are assigned to the period in which the accident occurred. Accident year results will change over time as the estimates of claims change due to payments and reserve changes for all accidents that occurred during that period.
The following is information about incurred and paid claims and claims adjustment expenses development for the year ended December 31, 2016,2017, net of reinsurance, as well as cumulative claim frequency and the total of incurred but not reported liabilities plus expected development on reported claims included within the net incurred claims amounts. The information about incurred and paid claims development for the years ended December 31, 20072008 to 2015, is presented as unaudited supplementary information.
Commercial Automobile Liability
| | | Incurred Claims and Allocated Claims Adjustment Expenses, Net of Reinsurance ($ in '000s, except cumulative number of reported claims) | |
| Incurred Claims and Allocated Claims Adjustment Expenses, Net of Reinsurance ($ in ‘000s, except cumulative number of reported claims) | | Incurred Claims and Allocated Claims Adjustment Expenses, Net of Reinsurance ($ in ‘000s, except cumulative number of reported claims) |
| | For the Years Ended December 31, | As of the year ended December 31, 2016 | For the Years Ended December 31, | As of the year ended December 31, 2017 |
| Accident Year | 2007 unaudited | 2008 unaudited | 2009 unaudited | 2010 unaudited | 2011 unaudited | 2012 unaudited | 2013 unaudited | 2014 unaudited | 2015 unaudited | 2016
| Incurred but Not Reported Liabilities, Net of Reinsurance | Cumulative Number of Reported Claims | 2008
unaudited | 2009
unaudited | 2010
unaudited | 2011
unaudited | 2012
unaudited | 2013
unaudited | 2014
unaudited | 2015
unaudited | 2016 | 2017 | Incurred but Not Reported Liabilities, Net of Reinsurance | Cumulative Number of Reported Claims |
| 2007 | $ | 30,198 |
| $ | 29,158 |
| $ | 29,811 |
| $ | 31,068 |
| $ | 33,028 |
| $ | 33,249 |
| $ | 34,160 |
| $ | 34,146 |
| $ | 34,448 |
| $ | 34,644 |
| $ | 19 |
| 19,853 |
| |
| 2008 | | 29,391 |
| 29,434 |
| 29,225 |
| 29,543 |
| 27,922 |
| 28,015 |
| 27,474 |
| 28,005 |
| 28,496 |
| 68 |
| 15,763 |
| $ | 29,391 |
| $ | 29,434 |
| $ | 29,225 |
| $ | 29,543 |
| $ | 27,922 |
| $ | 28,015 |
| $ | 27,474 |
| $ | 28,005 |
| $ | 28,496 |
| $ | 28,789 |
| $ | 31 |
| 15,764 |
|
| 2009 | | 37,394 |
| 40,309 |
| 43,889 |
| 43,604 |
| 42,909 |
| 42,326 |
| 42,987 |
| 43,728 |
| 121 |
| 13,230 |
| | 37,394 |
| 40,309 |
| 43,889 |
| 43,604 |
| 42,909 |
| 42,326 |
| 42,987 |
| 43,728 |
| 43,902 |
| 61 |
| 13,238 |
|
| 2010 | | 35,877 |
| 34,677 |
| 35,711 |
| 37,026 |
| 37,205 |
| 38,002 |
| 38,841 |
| 251 |
| 8,562 |
| | 35,877 |
| 34,677 |
| 35,711 |
| 37,026 |
| 37,205 |
| 38,002 |
| 38,841 |
| 39,246 |
| 122 |
| 8,575 |
|
| 2011 | | 31,044 |
| 38,822 |
| 34,887 |
| 34,720 |
| 35,136 |
| 36,080 |
| 241 |
| 7,819 |
| | 31,044 |
| 38,822 |
| 34,887 |
| 34,720 |
| 35,136 |
| 36,080 |
| 36,472 |
| 149 |
| 7,833 |
|
| 2012 | | 35,948 |
| 37,839 |
| 38,972 |
| 40,429 |
| 44,627 |
| 810 |
| 9,353 |
| | 35,948 |
| 37,839 |
| 38,972 |
| 40,429 |
| 44,627 |
| 46,755 |
| 804 |
| 9,376 |
|
| 2013 | | 48,449 |
| 48,636 |
| 53,656 |
| 64,687 |
| 617 |
| 11,658 |
| | 48,449 |
| 48,636 |
| 53,656 |
| 64,687 |
| 73,749 |
| 3,446 |
| 11,725 |
|
| 2014 | | 61,145 |
| 53,005 |
| 69,555 |
| 3,787 |
| 14,438 |
| | 61,145 |
| 53,005 |
| 69,555 |
| 92,245 |
| 8,432 |
| 14,659 |
|
| 2015 | | 69,060 |
| 67,184 |
| 9,078 |
| 18,407 |
| | 69,060 |
| 67,184 |
| 96,521 |
| 14,255 |
| 19,021 |
|
| 2016 | | 80,824 |
| 38,517 |
| 16,457 |
| | 80,824 |
| 87,516 |
| 20,274 |
| 19,373 |
|
| 2017 | | | 101,983 |
| 46,580 |
| 18,516 |
|
| Total | | Total | $ | 508,666 |
| | | | Total | $ | 647,178 |
| | |
| | | | | |
| | Cumulative Paid Claims and Allocated Claims Adjustment Expenses, Net of Reinsurance ($ in '000s) | | | Cumulative Paid Claims and Allocated Claims Adjustment Expenses, Net of Reinsurance ($ in ‘000s) | | |
| | For the Years Ended December 31, | | | For the Years Ended December 31, | | |
| Accident Year | 2007
unaudited | 2008
unaudited | 20091 unaudited | 2010
unaudited | 2011
unaudited | 2012
unaudited | 2013
unaudited | 2014
unaudited | 2015
unaudited | 2016
| | | 2008
unaudited | 20091
unaudited | 2010
unaudited | 2011
unaudited | 2012
unaudited | 2013
unaudited | 2014
unaudited | 2015
unaudited | 2016 | 2017 | | |
| 2007 | $ | 5,392 |
| $ | 12,698 |
| $ | 3,030 |
| $ | 13,901 |
| $ | 22,937 |
| $ | 29,255 |
| $ | 31,398 |
| $ | 33,134 |
| $ | 33,787 |
| $ | 34,524 |
| | | |
| 2008 | | 6,201 |
| (6,438 | ) | 7,256 |
| 16,010 |
| 20,234 |
| 23,282 |
| 25,060 |
| 27,039 |
| 28,136 |
| | | $ | 6,201 |
| $ | (6,438 | ) | $ | 7,256 |
| $ | 16,010 |
| $ | 20,234 |
| $ | 23,282 |
| $ | 25,060 |
| $ | 27,039 |
| $ | 28,136 |
| $ | 28,601 |
| | |
| 2009 | | (3,218 | ) | 10,711 |
| 24,468 |
| 31,784 |
| 36,385 |
| 39,664 |
| 42,030 |
| 43,287 |
| | | | (3,218 | ) | 10,711 |
| 24,468 |
| 31,784 |
| 36,385 |
| 39,664 |
| 42,030 |
| 43,287 |
| 43,707 |
| | |
| 2010 | | 10,097 |
| 20,483 |
| 26,654 |
| 31,300 |
| 34,831 |
| 37,051 |
| 38,187 |
| | | | 10,097 |
| 20,483 |
| 26,654 |
| 31,300 |
| 34,831 |
| 37,051 |
| 38,187 |
| 38,930 |
| | |
| 2011 | | 8,725 |
| 18,980 |
| 24,978 |
| 29,660 |
| 33,217 |
| 35,324 |
| | | | 8,725 |
| 18,980 |
| 24,978 |
| 29,660 |
| 33,217 |
| 35,324 |
| 36,058 |
| | |
| 2012 | | 8,385 |
| 18,230 |
| 26,995 |
| 35,563 |
| 41,587 |
| | | | 8,385 |
| 18,230 |
| 26,995 |
| 35,563 |
| 41,587 |
| 44,835 |
| | |
| 2013 | | 10,358 |
| 27,198 |
| 43,117 |
| 59,973 |
| | | | 10,358 |
| 27,198 |
| 43,117 |
| 59,973 |
| 68,612 |
| | |
| 2014 | | 15,404 |
| 38,257 |
| 60,486 |
| | | | 15,404 |
| 38,257 |
| 60,486 |
| 81,141 |
| | |
| 2015 | | 18,597 |
| 49,556 |
| | | | 18,597 |
| 49,556 |
| 76,398 |
| | |
| 2016 | | 21,850 |
| | | | 21,850 |
| 53,812 |
| | |
| 2017 | | | 27,977 |
| | |
| Total | | $ | 412,910 |
| | | | $ | 500,071 |
| | |
| All outstanding liabilities before 2007, net of reinsurance | | 149 |
| | | |
| All outstanding liabilities before 2008, net of reinsurance | | All outstanding liabilities before 2008, net of reinsurance | | 200 |
| | |
| Liabilities for claims and allocated claims adjustment expenses, net of reinsurance | Liabilities for claims and allocated claims adjustment expenses, net of reinsurance | | $ | 95,905 |
| | | Liabilities for claims and allocated claims adjustment expenses, net of reinsurance | | $ | 147,307 |
| | |
| | | | | |
1 - year 2009 - negative amounts resulted from the commutation of reinsurance agreements | | | | |
1 - year 2009 - negative amounts resulted from the termination of reinsurance agreements | | 1 - year 2009 - negative amounts resulted from the termination of reinsurance agreements | | | |
Other short-duration lines
| | | Incurred Claims and Allocated Claims Adjustment Expenses, Net of Reinsurance ($ in '000s, except cumulative number of reported claims) | |
| Incurred Claims and Allocated Claims Adjustment Expenses, Net of Reinsurance ($ in ‘000s, except cumulative number of reported claims) | | Incurred Claims and Allocated Claims Adjustment Expenses, Net of Reinsurance ($ in ‘000s, except cumulative number of reported claims) |
| | For the Years Ended December 31, | As of the year ended December 31, 2016 | For the Years Ended December 31, | As of the year ended December 31, 2017 |
| Accident Year | 2007
unaudited | 2008
unaudited | 2009
unaudited | 2010
unaudited | 2011
unaudited | 2012
unaudited | 2013
unaudited | 2014
unaudited | 2015
unaudited | 2016
| Incurred but Not Reported Liabilities, Net of Reinsurance | Cumulative Number of Reported Claims | 2008
unaudited | 2009
unaudited | 2010
unaudited | 2011
unaudited | 2012
unaudited | 2013
unaudited | 2014
unaudited | 2015
unaudited | 2016 | 2017 | Incurred but Not Reported Liabilities, Net of Reinsurance | Cumulative Number of Reported Claims |
| 2007 | $ | 23,699 |
| $ | 25,236 |
| $ | 26,956 |
| $ | 26,184 |
| $ | 25,705 |
| $ | 25,467 |
| $ | 25,601 |
| $ | 25,488 |
| $ | 25,475 |
| $ | 25,513 |
| $ | 5 |
| 33,296 |
| |
| 2008 | | 34,673 |
| 38,502 |
| 36,796 |
| 36,489 |
| 36,580 |
| 36,576 |
| 36,222 |
| 36,254 |
| 36,260 |
| 8 |
| 47,049 |
| $ | 34,673 |
| $ | 38,502 |
| $ | 36,796 |
| $ | 36,489 |
| $ | 36,580 |
| $ | 36,576 |
| $ | 36,222 |
| $ | 36,254 |
| $ | 36,260 |
| $ | 36,233 |
| $ | 4 |
| 47,047 |
|
| 2009 | | 35,688 |
| 34,764 |
| 34,626 |
| 35,453 |
| 36,343 |
| 36,202 |
| 36,736 |
| 37,061 |
| 93 |
| 27,846 |
| | 35,688 |
| 34,764 |
| 34,626 |
| 35,453 |
| 36,343 |
| 36,202 |
| 36,736 |
| 37,061 |
| 37,070 |
| 54 |
| 27,847 |
|
| 2010 | | 26,884 |
| 27,729 |
| 24,714 |
| 24,922 |
| 24,392 |
| 24,456 |
| 24,477 |
| 24 |
| 14,330 |
| | 26,884 |
| 27,729 |
| 24,714 |
| 24,922 |
| 24,392 |
| 24,456 |
| 24,477 |
| 24,478 |
| 4 |
| 14,330 |
|
| 2011 | | 20,315 |
| 22,176 |
| 22,310 |
| 21,782 |
| 22,122 |
| 22,941 |
| 599 |
| 10,001 |
| | 20,315 |
| 22,176 |
| 22,310 |
| 21,782 |
| 22,122 |
| 22,941 |
| 22,414 |
| 22 |
| 10,002 |
|
| 2012 | | 13,054 |
| 12,723 |
| 13,634 |
| 13,854 |
| 13,934 |
| 129 |
| 3,614 |
| | 13,054 |
| 12,723 |
| 13,634 |
| 13,854 |
| 13,934 |
| 14,109 |
| 308 |
| 3,615 |
|
| 2013 | | 5,897 |
| 4,754 |
| 4,556 |
| 4,687 |
| 18 |
| 2,148 |
| | 5,897 |
| 4,754 |
| 4,556 |
| 4,687 |
| 4,711 |
| 90 |
| 2,149 |
|
| 2014 | | 6,645 |
| 6,849 |
| 6,978 |
| 116 |
| 2,937 |
| | 6,645 |
| 6,849 |
| 6,978 |
| 7,580 |
| 571 |
| 2,945 |
|
| 2015 | | 8,320 |
| 8,616 |
| 277 |
| 3,942 |
| | 8,320 |
| 8,616 |
| 9,591 |
| 1,148 |
| 3,968 |
|
| 2016 | | 9,357 |
| 277 |
| 4,397 |
| | 9,357 |
| 9,960 |
| 428 |
| 4,686 |
|
| 2017 | | | 11,086 |
| 775 |
| 5,013 |
|
| Total | | Total | $ | 189,824 |
| | | | Total | $ | 177,232 |
| | |
| | | | | |
| | Cumulative Paid Claims and Allocated Claims Adjustment Expenses, Net of Reinsurance ($ in '000s) | | | Cumulative Paid Claims and Allocated Claims Adjustment Expenses, Net of Reinsurance ($ in ‘000s) | | |
| | For the Years Ended December 31, | | | For the Years Ended December 31, | | |
| Accident Year | 2007
unaudited | 2008
unaudited | 2009
unaudited | 2010
unaudited | 2011
unaudited | 2012
unaudited | 2013
unaudited | 2014
unaudited | 2015
unaudited | 2016
| | | 2008
unaudited | 2009
unaudited | 2010
unaudited | 2011
unaudited | 2012
unaudited | 2013
unaudited | 2014
unaudited | 2015
unaudited | 2016 | 2017 | | |
| 2007 | $ | 12,845 |
| $ | 20,777 |
| $ | 20,384 |
| $ | 23,725 |
| $ | 24,392 |
| $ | 24,769 |
| $ | 25,016 |
| $ | 25,385 |
| $ | 25,410 |
| $ | 25,492 |
| | | |
| 2008 | | 21,304 |
| 23,263 |
| 30,657 |
| 33,915 |
| 35,442 |
| 36,112 |
| 36,149 |
| 36,222 |
| 36,224 |
| | | $ | 21,304 |
| $ | 23,263 |
| $ | 30,657 |
| $ | 33,915 |
| $ | 35,442 |
| $ | 36,112 |
| $ | 36,149 |
| $ | 36,222 |
| $ | 36,224 |
| $ | 36,224 |
| | |
| 2009 | | 11,296 |
| 25,422 |
| 30,343 |
| 33,186 |
| 34,375 |
| 35,785 |
| 36,164 |
| 36,499 |
| | | | 11,296 |
| 25,422 |
| 30,343 |
| 33,186 |
| 34,375 |
| 35,785 |
| 36,164 |
| 36,499 |
| 36,714 |
| | |
| 2010 | | 14,182 |
| 20,420 |
| 22,596 |
| 23,812 |
| 24,225 |
| 24,368 |
| 24,414 |
| | | | 14,182 |
| 20,420 |
| 22,596 |
| 23,812 |
| 24,225 |
| 24,368 |
| 24,414 |
| 24,452 |
| | |
| 2011 | | 11,517 |
| 17,419 |
| 19,696 |
| 20,939 |
| 21,600 |
| 22,235 |
| | | | 11,517 |
| 17,419 |
| 19,696 |
| 20,939 |
| 21,600 |
| 22,235 |
| 22,326 |
| | |
| 2012 | | 6,446 |
| 9,789 |
| 11,554 |
| 12,782 |
| 13,343 |
| | | | 6,446 |
| 9,789 |
| 11,554 |
| 12,782 |
| 13,343 |
| 13,317 |
| | |
| 2013 | | 4,195 |
| 4,602 |
| 4,603 |
| 4,612 |
| | | | 4,195 |
| 4,602 |
| 4,603 |
| 4,612 |
| 4,641 |
| | |
| 2014 | | 6,154 |
| 6,677 |
| 6,728 |
| | | | 6,154 |
| 6,677 |
| 6,728 |
| 6,820 |
| | |
| 2015 | | 7,886 |
| 8,154 |
| | | | 7,886 |
| 8,154 |
| 8,291 |
| | |
| 2016 | | 9,413 |
| | | | 9,413 |
| 9,802 |
| | |
| 2017 | | | 10,619 |
| | |
| Total | | $ | 187,114 |
| | | | $ | 173,206 |
| | |
| All outstanding liabilities before 2007, net of reinsurance | | 830 |
| | | |
| All outstanding liabilities before 2008, net of reinsurance | | All outstanding liabilities before 2008, net of reinsurance | | 699 |
| | |
| Liabilities for claims and allocated claims adjustment expenses, net of reinsurance | Liabilities for claims and allocated claims adjustment expenses, net of reinsurance | | $ | 3,540 |
| | | Liabilities for claims and allocated claims adjustment expenses, net of reinsurance | | $ | 4,725 |
| | |
Incurred claims and allocated claim adjustment expenses, net of reinsurance, show how the initial estimate of incurred claims develop for each of the past 10 accident years. Incurred but not reported liabilities, net of reinsurance, by accident year are estimates that are based on the difference between the reported claims and the estimate of the ultimate paid claims and claims adjustment expenses for known and unknown claims. These estimates involve actuarial and statistical projections at a given point in time of what we expect the cost of the ultimate settlement and administration of known and unknown claims. The process reflects the uncertainties and significant judgmental factors inherent in estimating future results of both known and unknown claims, and as such, the process is inherently complex and imprecise. We utilize a third party actuarial firm to assist us in the estimation process.
The cumulative number of reported claims for commercial automobile liability was calculated using actual number of claims at the feature/coverage level. For the other lines, claim counts were calculated using actual claim counts at the feature/coverage level for all claims excluding those from assigned risk pools and surety. The actual claim counts for assigned risk pools and surety may not be available for all years presented and are therefore not included in the reported claims amounts.
The reconciliation of the net incurred and paid claims and claims adjustment expenses development tables to the liability for claims and claims adjustment expenses in the consolidated statement of financial position as of December 31, 20162017 is as follows ($ in '000s)‘000s):
| | | As of December 31, | 2016 | 2017 |
| Net outstanding liabilities: | | |
| Commercial automobile liability | $ | 95,905 |
| $ | 147,307 |
|
| Other short-duration lines | 3,540 |
| 4,725 |
|
| Unpaid claims and allocated claims adjustment expenses, net of reinsurance | 99,445 |
| 152,032 |
|
| | | |
| Reinsurance recoverable on unpaid claims and claims adjustment expenses: | | |
| Commercial automobile liability | 31,511 |
| 51,335 |
|
| Other short-duration lines | 3,859 |
| 2,067 |
|
| Total reinsurance recoverable on unpaid claims and claims adjustment expenses | 35,370 |
| 53,402 |
|
| | | |
| Unallocated claims adjustment expenses | 5,550 |
| 6,214 |
|
| Retroactive reinsurance ceded | (1,361 | ) | |
| Total | 4,189 |
| |
| | | |
| Unpaid claims and claims adjustment expenses, gross of reinsurance | $ | 139,004 |
| $ | 211,648 |
|
The following is supplementary information about the average annual percentage payout of incurred claims by age, net of amounts recoverable from reinsurers, for the year ended December 31, 20162017 (amounts are unaudited).
| | Average Annual Percentage Payout of Incurred Claims by Age, Net of Reinsurance | | Average Annual Percentage Payout of Incurred Claims by Age, Net of Reinsurance |
| | Years | 1 | 2 | 3 | 4 | 5 | 6 | 7 | 8 | 9 | 10 | 1 | 2 | 3 | 4 | 5 | 6 | 7 | 8 | 9 | 10 |
| Commercial automobile liability | 19.2 | % | 21.2 | % | 20.0 | % | 21.3 | % | 14.0 | % | 9.6 | % | 5.2 | % | 4.9 | % | 2.9 | % | 2.1 | % | 18.4 | % | 20.0 | % | 25.4 | % | 19.3 | % | 11.4 | % | 7.3 | % | 4.1 | % | 3.9 | % | 2.4 | % | 1.6 | % |
| Other short-duration lines | 66.4 | % | 18.8 | % | 8.0 | % | 7.0 | % | 3.1 | % | 2.1 | % | 0.6 | % | 0.9 | % | 0.1 | % | 0.3 | % | 68.7 | % | 15.7 | % | 8.4 | % | 5.3 | % | 2.8 | % | 1.8 | % | 0.4 | % | 0.4 | % | 0.3 | % | — | % |
12. SHARE-BASED COMPENSATION
On January 6, 2011, Atlas adopted a stock option plan (the “Stock Option Plan”) in order to advance the interests of Atlas by providing incentives to eligible persons defined in the plan. In the second quarter of 2013, a new equity incentive plan (the “Equity Incentive Plan”) was approved by the Company'sCompany’s common shareholders at the Annual General Meeting, and Atlas ceased to grant new stock options under the preceding Stock Option Plan. The Equity Incentive Plan is a securities based compensation plan, pursuant to which Atlas may issue restricted stock grants for ordinary voting common shares, restricted units, stock grants for ordinary voting common shares, stock options and other forms of equity incentives to eligible persons as part of their compensation. The Equity Incentive Plan is considered an amendment and restatement of the Stock Option Plan, although outstanding stock options issued pursuant to the Stock Option Plan will continue to be governed by the terms of the Stock Option Plan.
Stock options - Stock option activity for the years ended December 31, 20162017 and 20152016 follows (prices in Canadian dollars designated with "C$"“C$” and United States dollars designated with "US$"“US$”):
| | | | 2016 | 2015 | 2017 | 2016 |
| C$ Denominated: | Number of Shares | Average Exercise Price | Number of Shares | Average Exercise Price | Number of Shares | Average Exercise Price | Number of Shares | Average Exercise Price |
| Outstanding, beginning of period | 187,728 |
|
| C$6.22 |
| 224,623 |
|
| C$6.05 |
| 187,728 |
|
| C$6.22 |
| 187,728 |
|
| C$6.22 |
|
| Granted | — |
| — |
| — |
| — |
| — |
| — |
| — |
| — |
|
| Exercised | — |
| — |
| (36,895 | ) |
| C$5.21 |
| (133,338 | ) |
| C$6.31 |
| — |
| — |
|
| Outstanding, end of period | 187,728 |
|
| C$6.22 |
| 187,728 |
|
| C$6.22 |
| 54,390 |
|
| C$6.00 |
| 187,728 |
|
| C$6.22 |
|
| | | | | | | | | |
| | 2016 | 2015 | 2017 | 2016 |
| US$ Denominated: | Number of Shares | Average Exercise Price | Number of Shares | Average Exercise Price | Number of Shares | Average Exercise Price | Number of Shares | Average Exercise Price |
| Outstanding, beginning of period | 375,000 |
| US$17.01 |
| 175,000 |
| US$13.26 |
| 375,000 |
| US$17.01 |
| 375,000 |
| US$17.01 |
|
| Granted | — |
| — |
| 200,000 |
| US$20.29 |
| — |
| — |
| — |
| — |
|
| Exercised | — |
| — |
| — |
| — |
| — |
| — |
| — |
| — |
|
| Outstanding, end of period | 375,000 |
| US$17.01 |
| 375,000 |
| US$17.01 |
| 375,000 |
| US$17.01 |
| 375,000 |
| US$17.01 |
|
Information about options outstanding as of December 31, 20162017 is as follows: | | | Grant Date | Expiration Date | Number Outstanding | Number Exercisable | Expiration Date | Number Outstanding | Number Exercisable |
| January 18, 2011 | January 18, 2021 | 96,060 |
| 96,060 |
| January 18, 2021 | 54,390 |
| 54,390 |
|
| January 11, 2013 | January 11, 2023 | 91,668 |
| 91,668 |
| |
| March 6, 2014 | March 6, 2024 | 175,000 |
| 116,667 |
| March 6, 2024 | 175,000 |
| 175,000 |
|
| March 12, 2015 | March 12, 2025 | 200,000 |
| — |
| March 12, 2025 | 200,000 |
| — |
|
| Total | | 562,728 |
| 304,395 |
| | 429,390 |
| 229,390 |
|
There are 304,395229,390 stock options that are exercisable as of December 31, 2016.2017. The stock option grants outstanding have a weighted average remaining life of 6.826.26 years and have an intrinsic value of $3.4$2.2 million as of December 31, 2016. 2017.
Under the Equity Incentive Plan, a director who either directly or indirectly purchases up to $100,000 of Atlas ordinary voting common stock on the open market, through the employee stock purchase plan, or via other means acceptable under this plan (see Note 13, ‘Other Employee Benefit Plans’) will receive a 3 to 1 matching grant of restricted stock grants for ordinary voting common shares (or for Canadian taxpayers, restricted stock units) based on the aggregate purchase price of ordinary voting common shares the director purchases during the six month period that began on June 18, 2013 and ended on December 31, 2013, or for new directors within 6 months of their initial appointment date (the “Purchase Period”). Matching share grants of 148,152 restricted stock grants for ordinary voting common shares and 37,038 restricted stock units were made on February 28, 2014 (the “Grant Date”). The number of ordinary voting common shares issued on the Grant Date were determined by dividing (A) the dollar amount of the Company matching contribution due based on purchases during the Purchase Period by (B) the closing common share price of one share of Company ordinary voting common stock at close of market on June 17, 2013 (the “Closing Price”) which was $8.10 per share. The restricted stock grants for ordinary voting common shares will vest 20% on each anniversary of the Grant Date, subject to the terms of the Guidelines. The matching grant will be subject to all of the terms and conditions of the Equity Incentive Plan and applicable grant agreements.
On March 12, 2015, the Board of Directors of Atlas granted equity awards of (i) 200,000 restricted stock grants for ordinary voting common shares of the Company and (ii) 200,000 options to acquire ordinary voting common shares to the executive officers of the Company as part of the Company’s annual compensation process. The awards were made under the Company’s Equity Incentive Plan.
The awards vest in 5 equal annual installments of 20%, provided that an installment shall not vest unless an annual performance target based on specific book value growth rates linked to return on equity goals.goals is met. In the event the performance target is not met in any year, the 20% installment for such year shall not vest, but such non-vested installment shall carry forward and can become vested in future years (up to the fifth year from the date of grant), subject to achievement in a future year of the applicable performance target for such year. AsFor the year ended December 31, 2017, 40,000 shares of each of the restricted stock grants for ordinary voting common shares and the options to acquire ordinary voting common shares vested. For the year ended December 31, 2016, performance targets linked to these awards were not achieved, and therefore no vesting has occurred.
The Monte-Carlo simulation model was used, for both the options and restricted stock grants for ordinary voting common share grants,shares, to estimate the fair value of compensation expense as a result of the performance based component of these grants. Utilizing the Monte-Carlo simulation model, the fair values were $1.5 million and $1.9 million for the options and restricted stock grants for ordinary voting common share grants,shares, respectively. This expense will be amortized over the anticipated vesting period.
Restricted shares - The activity for the restricted voting common shares and restricted share units for the years ended December 31, 20162017 and 20152016 are as follows:
| | | | 2016 | 2015 | 2017 | 2016 |
| | Number of Shares | Weighted Average Fair Value at Grant Date | Number of Shares | Weighted Average Fair Value at Grant Date | Number of Shares | Weighted Average Fair Value at Grant Date | Number of Shares | Weighted Average Fair Value at Grant Date |
| Non-vested, beginning of period | 348,155 |
| $ | 15.53 |
| 185,190 |
| $ | 12.20 |
| 311,120 |
| $ | 15.92 |
| 348,155 |
| $ | 15.53 |
|
| Granted | — |
| — |
| 200,000 |
| 17.99 |
| — |
| — |
| — |
| — |
|
| Vested | (37,035 | ) | 12.20 |
| (37,035 | ) | 12.20 |
| (77,040 | ) | 15.21 |
| (37,035 | ) | 12.20 |
|
| Non-vested, end of period | 311,120 |
| $ | 15.92 |
| 348,155 |
| $ | 15.53 |
| 234,080 |
| $ | 16.15 |
| 311,120 |
| $ | 15.92 |
|
In accordance with ASC 718 (Stock-Based Compensation), Atlas has recognized share-based compensation expense on a straight-line basis over the requisite service period of the last separately vesting portion of the award. Share-based compensation expense is a component of other underwriting expenses on the statements of income statement.and comprehensive income. Atlas recognized $1.2 million, $1.6 million $1.8 million and $1.5$1.8 million in share-based compensation expense, including income tax expense, for the years ended December 31, 2017, 2016, 2015, and 2014,2015, respectively. Total unearned share-based compensation expense was $1.0 million$660,000 related to all stock option grants and $2.2$1.4 million related to restricted stock grants for ordinary voting common shares and restricted share units as of December 31, 2016.2017. This unearned share-based compensation expense will be amortized over the next 3826 months.
13. OTHER EMPLOYEE BENEFIT PLANS
Defined Contribution Plan - Atlas has a defined contribution 401(k) plan covering all qualified employees of Atlas and its subsidiaries. Contributions to this plan are limited based on IRS guidelines. Atlas matches 100% of the employee contribution up to 2.5% of annual earnings, plus 50% of additional contributions up to 2.5% of annual earnings, for a total maximum expense of 3.75% of annual earnings per participant. Atlas'Atlas’ matching contributions are discretionary. Employees are 100% vested in their own contributions and vest in Atlas contributions based on years of service equally over 5 years with 100% vested after 5 years. Company contributions were $441,000, $424,000, $300,000, and $204,000$300,000 for the years ended December 31, 2017, 2016, 2015, and 2014,2015, respectively.
Employee Stock Purchase Plan - The Atlas Employee Stock Purchase Plan (the “ESPP”) encourages employee interest in the operation, growth and development of Atlas and provides an additional investment opportunity to employees. Full time and permanent part time employees working more than 30 hours per week are allowed to invest up to 7.5% of adjusted salary in Atlas ordinary voting common shares. Atlas matches 100% of the employee contribution up to 2.5% of annual earnings, plus 50% of additional contributions up to 5% of annual earnings, for a total maximum expense of 5% of annual earnings per participant. Atlas'Atlas’ matching contributions are discretionary. Atlas also pays all administrative costs related to this plan. For the years ended December 31, 2017, 2016, and 2015, and 2014, Atlas'Atlas’ costs incurred related to the matching portion of the ESPP were $212,000, $199,000, $151,000, and $113,000,$151,000, respectively. Share purchases pursuant to this plan are made in the open market.
14. SHARE CAPITAL AND MEZZANINE EQUITY
Share Capital
The share capital is as follows:
| | | As of December 31, | | 2016 | 2015 | | 2017 | 2016 |
| | Shares Authorized | Shares Issued and Outstanding | Amount ($ in '000s) | Shares Issued and Outstanding | Amount ($ in '000s) | Shares Authorized | Shares Issued and Outstanding | Amount ($ in ‘000s) | Shares Issued and Outstanding | Amount ($ in ‘000s) |
| Preferred Shares | 100,000,000 |
| — |
| $ | — |
| 6,940,500 |
| $ | 6,941 |
| |
| | | | | | |
| Ordinary voting common shares | 266,666,667 |
| 11,895,104 |
| $ | 36 |
| 11,883,025 |
| $ | 36 |
| 266,666,667 |
| 12,164,041 |
| $ | 36 |
| 11,895,104 |
| $ | 36 |
|
| Restricted voting common shares | 33,333,334 |
| 128,191 |
| — |
| 132,863 |
| — |
| 33,333,334 |
| — |
| — |
| 128,191 |
| — |
|
| Total common shares | 300,000,001 |
| 12,023,295 |
| $ | 36 |
| 12,015,888 |
| $ | 36 |
| 300,000,001 |
| 12,164,041 |
| $ | 36 |
| 12,023,295 |
| $ | 36 |
|
All ofDuring 2017, the issued and outstanding128,191 restricted voting common shares arethat were beneficially owned or controlled by Kingsway Financial Services, Inc. (including its subsidiaries and affiliated companies, "Kingsway"“Kingsway”). were sold to non-affiliates of Kingsway. The restricted voting common shares are entitled to vote at all meetings of shareholders, except at meetings of holders of a specific class that are entitled to vote separately as a class. The restricted voting common shares as a class shall not carry more than 30% of the aggregate votes eligible to be voted at a general meeting of common shareholders. The Kingsway-owned restricted voting common shares will convert to ordinary voting common shares in the event that these Kingsway-owned shares are sold to non-affiliates of Kingsway. During 2016, 4,672 restricted voting common shares wereautomatically converted to ordinary voting common shares dueupon their sale to the sale by Kingswaynon-affiliates of theKingsway. There are no restricted voting common shares to a non-affiliate.outstanding as of December 31, 2017.
There were 22,22414,816 and 29,63122,224 non-vested restricted stock units ("RSUs"(“RSUs”) as of December 31, 20162017 and December 31, 2015,2016, respectively. These RSUs are participative and are included in the computations of earnings per common share and book value per common share for these periods.
During the year ended December 31, 2017, the Company issued 7,408 ordinary voting common shares as a result of the vesting of RSUs. During the year ended December 31, 2017, the Company issued 133,338 ordinary voting common shares as a result of the exercise of options. During the year ended December 31, 2016, the Company issued 7,407 ordinary voting common shares as a result of the vesting of RSUs.
On March 21, 2017, the Company’s Board of Directors approved a Share Repurchase Program of up to 650,000 shares of common stock. The repurchases may be made from time to time in open market transactions, privately-negotiated transactions, block purchases, or otherwise in accordance with securities laws at the discretion of the Company’s management until March 21, 2018. The Company’s decisions around the timing, volume, and nature of share repurchases, and the ultimate amount of shares repurchased, will be dependent on market conditions, applicable securities laws, and other factors. The share repurchase program and the Board’s authorization of the program may be modified, suspended, or discontinued at any time. During 2017, no shares were repurchased under this Share Repurchase Program.
Mezzanine Equity
Prior to the year ended December 31, 2015,2017, the Company presented preferred shares issued 7,407 ordinary voting common shares as a resultcontingent consideration within the permanent equity section of the vestingConsolidated Statements of RSUs and 200,000 non-vested restricted voting commonFinancial Position. In accordance with FASB ASC Topic 480 - Distinguishing Liabilities from Equity, contingent consideration issued as preferred shares wherein the number of shares to a directorbe issued is variable should be classified outside of permanent equity and reflected as mezzanine equity on the officers, respectively. DuringConsolidated Statements of Financial Position.
For the year ended December 31, 2015,2017, the Company issued 36,895 ordinary votinghas restated the Consolidated Statements of Shareholders’ Equity to remove the preferred shares and related activity as previously stated for the periods as of January 1, 2015 and for the years ended December 31, 2015 and 2016. Although this impacted total equity for 2015, it had no impact on total equity as of December 31, 2016 due to the redemption and clawback of preferred shares previously issued. In addition, this change did not impact the Consolidated Statements of Financial Position, Consolidated Statements of Income (Loss) and Comprehensive Income (Loss), earnings per common shares toshare or the Consolidated Statements of Cash Flows. The Company has evaluated the effect of the incorrect presentation in the prior period, both qualitatively and quantitatively, and concluded that it did not have a director as a resultmaterial impact on, nor did it require amendment of, exercising options. These shares were granted and issued under the Company's Equity Incentive Plan.any previously filed annual or quarterly consolidated financial statements.
During the first quarter of 2015, the Company issued 4,000,000 preferred shares as a portion of the consideration related to the Anchor acquisition and an additional 940,500 preferred shares pursuant to the Gateway stock purchase agreement. During the first quarter of 2016, the companyCompany canceled 401,940 preferred shares pursuant to the Gateway stock purchase agreement. During the third quarter of 2016, the Company redeemed all 2,538,560 of the remaining preferred shares issued to the former owner of Gateway. During the fourth quarter of 2016, the companyCompany canceled the remaining 4,000,000 preferred shares pursuant to the Anchor stock purchase agreement. As of December 31, 2017 and December 31, 2016, there were no outstanding preferred shares. The preferred shares redeemed and canceled during 2016 and the preferred shares issued during the first quarter of 2015 pursuant to the Gateway stock purchase agreement have been recorded as a recovery of acquisition expense and additional acquisition expense, respectively, and not as an adjustment to goodwill, because the fair value of the contingent consideration was determined to be zero at the date of acquisition. In accordance with U.S. GAAP, such adjustments are reflected in the statements of income statementand comprehensive income in the period that the contingency is re-estimated. The Anchor cancellation was recorded as a recovery of acquisition expense.
Preferred shareholders are entitled to dividends on a cumulative basis, whether or not declared by the Board of Directors, at the rate of $0.045 per share per year (4.5%) and may be paid in cash or in additional preferred shares at the option of Atlas. In liquidation, dissolution or winding-up of Atlas, preferred shareholders receive the greater of $1.00 per share plus all declared and unpaid dividends or the amount they would receive in liquidation if the preferred shares had been converted to restricted voting common shares or ordinary voting common shares immediately prior to liquidation. Preferred shareholders are not entitled to vote.
The former owners of Gateway and Anchor earned $94,000 and $187,000, respectively, in dividends on the preferred shares during the year ended December 31, 2016.
On September 30, 2016, Atlas paid $409,000 in dividends earned on the preferred shares to the former owner of Gateway, the cumulative amount to which they were entitled through September 15, 2016, leaving no accrued and unpaid dividends owed to the former owner of Gateway. As of December 31, 2017 and December 31, 2016, Atlas has accrued $333,000 in dividends on the preferred shares for the former owner of Anchor, which remains unpaid. As of December 31, 2016, theThe paid claims development on Global Liberty'sLiberty’s pre-acquisition claims reserves was in excess of $4.0 million, and as a result, pursuant to the terms of the Anchor stock purchase agreement, dividends will no longer accrue to the former owner of Anchor. As of December 31, 2016, there were no preferred shares outstanding.
On May 13, 2014, an aggregate of 2,000,000 Atlas ordinary voting common shares were offered in a subsequent public offering in the United States at a price of $12.50 per share. Atlas also granted the underwriters an option to purchase up to an aggregate of 300,000 additional shares at the public offering price of $12.50 per share to cover over-allotments, if any. On May 27, 2014, the underwriters exercised this option and purchased an additional 161,000 shares. After underwriting and other expenses, total proceeds of $25.0 million were realized on the issuance of the shares. A portion of the net proceeds from the offering was used to support the acquisition of Anchor Holdings Group, Inc. and its affiliated entities.
15. DEFERRED POLICY ACQUISITION COSTS
Deferred policy acquisition costs represent those costs that are incremental and directly related to the successful acquisition of new or renewal written premium. Such deferred policy acquisition costs generally include agent commissions, premium taxes and a portion of employee compensation and benefits directly related to time spent performing specific acquisition or renewal activities. The method followed in determining the deferred policy acquisition costs limits the deferral to its realizable value by giving consideration to estimated future claims and expenses to be incurred as premiums are earned. Changes in estimates, if any, are recorded in the accounting period in which they are determined. Anticipated investment income is included in determining the realizable value of the deferred policy acquisition costs. Atlas’ deferred policy acquisition costs are reported net of deferred ceding commissions.
Policy acquisition costs are deferred and amortized over the period in which the related premiums written are earned, typically 12 months. Deferred policy acquisition costs for the years ended December 31, 2017, 2016, 2015, and 20142015 ($ in '000s)‘000s) were:
| | | Year Ended December 31, | 2016 | | 2015 | | 2014 | 2017 | | 2016 | | 2015 |
| Balance, beginning of period | $ | 10,235 |
| | $ | 8,166 |
| | $ | 6,674 |
| $ | 13,222 |
| | $ | 10,235 |
| | $ | 8,166 |
|
| Acquisition costs deferred | 21,790 |
| | 20,661 |
| | 15,540 |
| 29,460 |
| | 21,790 |
| | 20,661 |
|
| Amortization charged to income | (18,803 | ) | | (18,592 | ) | | (14,048 | ) | (27,885 | ) | | (18,803 | ) | | (18,592 | ) |
| Balance, end of period | $ | 13,222 |
| | $ | 10,235 |
| | $ | 8,166 |
| $ | 14,797 |
| | $ | 13,222 |
| | $ | 10,235 |
|
16. RELATED PARTY TRANSACTIONS
During the periods presented, a portion of the Company’s investment portfolio, was allocated to other than fixed income (“OTFI”) investmentswhich is included in “Other Investments” on the Consolidated Statements of Financial Position, included investment vehicles whichthat are considered related-party transactions and which represented 8.4% and 3.6% of invested assets of the Company astransactions. As of December 31, 20162017 and December 31, 2015, respectively.2016 these related-party transactions comprised 8.4% of our investment portfolio. In these transactions, one or more of the Company’s directors or entities affiliated with such directors may invest in andand/or manage these vehicles. Under the Company’s current investment guidelines, OTFI investments (including any related party OTFI investments) may not exceed the lesser of a total of 15% of the Company’s overall invested assets or 50% of the Company’s statutory surplus (“Allowable OTFI Allocation”), with no new single investment to represent more than 20% of the Company’s Allowable OTFI Allocation assets at the time said investment is made. These related-party transactions are consistent with the Company’s investment guidelines and have been reviewed and approved by the Investment Committee of the Company’s Board of Directors. The Company believes that these transactions leverage investment resources that would otherwise not be available to the Company.
17. SELECTED QUARTERLY FINANCIAL DATA (UNAUDITED)
| | ($ in ‘000s, except per share data) | | | 2016 | 2017 |
| | Q4 | Q3 | Q2 | Q1 | Q4 | Q3 | Q2 | Q1 |
| Gross premium written | $ | 51,984 |
| $ | 60,733 |
| $ | 48,353 |
| $ | 64,025 |
| |
| Net premium earned | 44,252 |
| 43,251 |
| 41,802 |
| 41,753 |
| |
| Gross premiums written | | $ | 54,213 |
| $ | 65,898 |
| $ | 57,354 |
| $ | 98,496 |
|
| Net premiums earned | | 57,431 |
| 55,865 |
| 54,049 |
| 48,426 |
|
| Net (loss) income | (13,561 | ) | 6,496 |
| 4,900 |
| 4,811 |
| (54,297 | ) | 5,125 |
| 5,510 |
| 4,852 |
|
| Net (loss) income attributable to common shareholders | (13,608 | ) | 6,423 |
| 4,822 |
| 4,728 |
| (54,297 | ) | 5,125 |
| 5,510 |
| 4,852 |
|
| (Loss) earnings per common share basic | $ | (1.13 | ) | $ | 0.53 |
| $ | 0.40 |
| $ | 0.39 |
| $ | (4.48 | ) | $ | 0.43 |
| $ | 0.46 |
| $ | 0.40 |
|
| (Loss) earnings per common share diluted | $ | (1.13 | ) | $ | 0.51 |
| $ | 0.38 |
| $ | 0.38 |
| $ | (4.48 | ) | $ | 0.42 |
| $ | 0.45 |
| $ | 0.40 |
|
|
| | | | | | | | | | | | |
| ($ in ‘000s, except per share data) |
| | 2015 |
| | Q4 | Q3 | Q2 | Q1 |
| Gross premium written | $ | 52,423 |
| $ | 65,315 |
| $ | 46,575 |
| $ | 44,973 |
|
| Net premium earned | 41,927 |
| 41,666 |
| 38,304 |
| 30,167 |
|
| Net income | 4,333 |
| 4,024 |
| 3,936 |
| 2,137 |
|
| Net income attributable to common shareholders | 4,253 |
| 3,943 |
| 3,856 |
| 2,102 |
|
| Earnings per common share basic | $ | 0.35 |
| $ | 0.33 |
| $ | 0.32 |
| $ | 0.18 |
|
| Earnings per common share diluted | $ | 0.34 |
| $ | 0.32 |
| $ | 0.31 |
| $ | 0.17 |
|
|
| | | | | | | | | | | | |
| ($ in ‘000s, except per share data) |
| | 2016 |
| | Q4 | Q3 | Q2 | Q1 |
| Gross premiums written | $ | 51,984 |
| $ | 60,733 |
| $ | 48,353 |
| $ | 64,025 |
|
| Net premiums earned | 44,252 |
| 43,251 |
| 41,802 |
| 41,753 |
|
| Net (loss) income | (13,561 | ) | 6,496 |
| 4,900 |
| 4,811 |
|
| Net (loss) income attributable to common shareholders | (13,608 | ) | 6,423 |
| 4,822 |
| 4,728 |
|
| (Loss) earnings per common share basic | $ | (1.13 | ) | $ | 0.53 |
| $ | 0.40 |
| $ | 0.39 |
|
| (Loss) earnings per common share diluted | $ | (1.13 | ) | $ | 0.51 |
| $ | 0.38 |
| $ | 0.38 |
|
18. NOTES PAYABLE
On May 7, 2014,April 26, 2017, Atlas issued $25 million of five-year 6.625% senior unsecured notes and received net proceeds of approximately $23.9 million after deducting underwriting discounts and commissions and other estimated offering expenses. Interest on the senior unsecured notes is payable quarterly on each January 26, April 26, July 26 and October 26. Atlas may, at its option, beginning with the interest payment date of April 26, 2020, and on any scheduled interest payment date thereafter, redeem the senior unsecured notes, in whole or in part, at a redemption price equal to 100% of the principal amount plus accrued and unpaid interest to, but excluding, the date of redemption. The senior unsecured notes will rank senior in right of payment to any of Atlas’ existing and future indebtedness that is by its terms expressly subordinated or junior in right of payment to the senior unsecured notes. The senior unsecured notes will rank equally in right of payment to all of Atlas’ existing and future senior indebtedness, but will be effectively subordinated to any secured indebtedness to the extent of the value of the collateral securing such secured indebtedness. In addition, the senior unsecured notes will be structurally subordinated to the indebtedness and other obligations of Atlas’ subsidiaries.
The senior unsecured notes were issued under an indenture and supplemental indenture that contain covenants that, among other things, limit: (i) the ability of Atlas to merge or consolidate, or lease, sell, assign or transfer all or substantially all of its assets; (ii) the ability of Atlas to sell or otherwise dispose of the equity securities of certain of its subsidiaries; (iii) the ability of certain of Atlas’ subsidiaries to issue equity securities; (iv) the ability of Atlas to permit certain of its subsidiaries to merge or consolidate, or lease, sell, assign or transfer all or substantially all of their respective assets; and (v) the ability of Atlas and its subsidiaries to incur debt secured by equity securities of certain of its subsidiaries.
On March 9, 2015, American Insurance Acquisition, Inc. (“American Acquisition”), a wholly-owned direct subsidiary of Atlas, entered into a loan and security agreement (“Former Loan Agreement”) for a $10.0 million revolving loan facility with Fifth Third Bank. Under the Former Loan Agreement, funds could be borrowed and re-borrowed on a revolving basis by American Acquisition, from the closing date until (but not including) May 7, 2015, the loan maturity date. The interest rate on the advances under the revolving loan facility was generally LIBOR plus 2.75%, provided that, during a default, interest would accrue at a rate equal to LIBOR plus 5%. In addition, there was a non-utilization fee equal to 0.25% per annum of an amount equal to $10.0 million less the daily average of the aggregate principal amount of the revolving loans outstanding plus the aggregate amount of the letter of credit obligations outstanding.
On March 9, 2015, American Acquisition entered into a loan and security agreement (“Loan Agreement”) for a $35.0 million loan facility with Fifth Third Bank. On May 7, 2016, American Acquisition entered into a Modification of Loan Documents with Fifth Third Bank to amend its Loan Agreement. The Loan Agreement, as modified, includesincluded a $30.0 million line of credit ("(“Draw Amount"Amount”), which can becould have been drawn in increments at any time until December 31, 2016. The $30.0 million line of credit hashad a five year term and bearsbore interest at one-month LIBOR plus 4.5%, effectively 5.27% as of December 31, 2016.. The Loan Agreement also includesincluded a $5.0 million revolving line of credit ("Revolver"(“Revolver”), which could have been drawn upon until May 7, 2018, that bearsbore interest at one month LIBOR plus 2.75%, effectively 3.52% as of December 31, 2016. This $5.0 million revolving line of credit may be drawn upon until May 7, 2018 and replaces the $10.0 million revolving line of credit American Acquisition previously had in place with Fifth Third Bank under the Former Loan Agreement..
The Loan Agreement also providesprovided for the issuance of letters of credit in an amount up to $2.0 million outstanding at any time. In addition, there iswas a non-utilization fee for each of the $30.0 million line of credit and $5.0 million revolving line of credit equal to 0.50% per annum of an amount equal to $30.0 million and $5.0 million, respectively, less the daily average of the aggregate principal amount outstanding under such credit lines (plus, in the case of the $30.0 million line of credit, the aggregate amount of the letter of credit obligations outstanding).
The Loan Agreement requires American Acquisition to comply with customary affirmative and negative covenants, including those governing indebtedness, liens, investments, sales of assets, issuance of securities, and distributions. The Loan Agreement also requires American Acquisition to make mandatory prepayments under certain conditions and to comply with certain financial covenants, including the ASI Pool Subsidiaries (defined below) maintainingwas terminated in April 2017. Atlas used a combined statutory net worth in an amount not less than $60 million (subject to adjustment) and maintaining a minimum funded debt to Earnings Before Interest, Taxes, Depreciation and Amortization ratio (the "EBITDA Ratio"). The Loan Agreement is secured by substantially allportion of the property of American Acquisition, including allnet proceeds of the senior unsecured notes offering, together with cash on hand, for the repayment of all outstanding shares of American Country, American Servicebalances under the Draw Amount and Gateway, which are wholly-owned direct subsidiaries of American Acquisition (the “ASI Pool Subsidiaries”).Revolver, $15.5 million and $3.9 million, respectively.
At December 31, 2016, American Acquisition was in compliance with the covenants of the Loan Agreement. In February 2017, American Acquisition filed its statutorily required financial statements for the year ended December 31, 2016, which are used to determine on-going compliance with the covenants contained in the Loan Agreement. As a result of the reserve strengthening described in this annual report on Form 10-K and its effect on American Acquisition’s December 31, 2016 financial statements, American Acquisition iswas not in compliance with the Loan Agreements’ EBITDA Ratio covenant as of March 13, 2017. American Acquisition hashad a thirty day period to cure this covenant non-compliance, and the Company and American Acquisition have been in discussionsagreed with the lender regardingto a modification to the loan covenants to more specifically address the effects of reserve modifications and/or obtaining a waiver with respect to the existing non-compliance.
As of December 31, 2016, $3.9Interest expense on notes payable was $1.8 million, in funds were accessed from the Revolver, of which $2,000,000 was accessed during 2016, including a portion that was used to repurchase preferred shares from the former owner of Gateway while $100,000 was repaid during 2016. $15.5$1.0 million, in funds were accessed against the Draw Amount as of December 31, 2016. All $15.5 million of the Draw Amount was accessed in 2015 and contributed to the ASI Pool Subsidiaries in exchange for surplus notes that carry a variable interest rate of prime plus 2% with a maturity date of April 30, 2020. No letters of credit were issued under the terms of this Loan Agreement as of December 31, 2016. As of December 31, 2016, the unused funds$694,000 for the Revolver and the Draw Amount were $1.1 million and $14.5 million, respectively. The unused funds for the Draw Amount can no longer be drawn.
For the yearyears ended December 31, 2017, 2016, American Acquisition incurred interest expense, including amortized loan costs, of $1.0 million in connection with the Loan Agreement. For the year ended December 31,and 2015, interest expense, including amortized loan costs, was $694,000. As of December 31, 2016, unamortized bank fees associated with the Loan Agreement were $213,000. These bank fees will be amortized over the next 38 months.respectively.
Notes payable outstanding as of December 31, 20162017 and 20152016 ($ in '000s)‘000s) were:
| | | | December 31, 2016 | December 31, 2015 | December 31, 2017 | December 31, 2016 |
| 6.625% Senior Unsecured Notes due April 26, 2022 | | $ | 25,000 |
| $ | — |
|
| Revolver | $ | 3,900 |
| $ | 2,000 |
| — |
| 3,900 |
|
| Draw Amount | 15,500 |
| 15,500 |
| — |
| 15,500 |
|
| Total outstanding borrowings | 19,400 |
| 17,500 |
| 25,000 |
| 19,400 |
|
| Unamortized issuance costs | (213 | ) | (281 | ) | (969 | ) | (213 | ) |
| Total notes payable | $ | 19,187 |
| $ | 17,219 |
| $ | 24,031 |
| $ | 19,187 |
|
19. STATUTORY INFORMATION
As a holding company, Atlas could derive cash from its Insurance Subsidiaries generally in the form of dividends to meet its obligations, which will primarily consist of operating expense payments and debt payments. Atlas’ Insurance Subsidiaries fund their obligations primarily through premium and investment income and maturities in the securities portfolio. The Insurance Subsidiaries require regulatory approval for the return of capital and, in certain circumstances, prior to the payment of dividends. In the event that dividends available to the holding company are inadequate to cover its operating expenses and debt payments, the holding company would need to raise capital, sell assets or incur future debt.
The Insurance Subsidiaries must each maintain a minimum statutory capital and surplus of $1.5 million, $2.4 million, and $3.5 million under the provisions of the Illinois Insurance Code, the Missouri Insurance Code, and New York Insurance Code, respectively. Dividends may only be paid from statutory unassigned surplus, and payments may not be made if such surplus is less than a stipulated amount. The dividend restriction for the ASI Pool Subsidiaries is the greater of statutory net income or 10% of total statutory capital and surplus. The dividend restriction for Global Liberty is the lower of 10% of statutory surplus or 100% of adjusted net investment income for the preceding twelve month period.
Net loss computed under statutory-basis accounting was $1.3$9.1 million, $1.2$15.2 million, $1.1$5.9 million, and $49,000$5.1 million for American Country, American Service, Gateway and Global Liberty, respectively, for the year ended December 31, 2016.2017. Net incomeloss for the year ended December 31, 20152016 was $3.4$1.3 million, $6.1$1.2 million, $2.0$1.1 million, and $1.2 million$49,000 for American Country, American Service, Gateway and Global Liberty, respectively. The combined statutory capital and surplus of the Insurance Subsidiaries was $113.9$87.8 million and $118.5$113.9 million as of December 31, 20162017 and December 31, 2015,2016, respectively.
Atlas did not declare or pay any dividends to its common shareholders during the years ended December 31, 20162017 and 2015.2016.
20. CHANGE IN ACCOUNTING PRINCIPLE AND ERROR CORRECTIONS
Change in Accounting Principle
In April 2015, the FASB issued ASU 2015-03, Interest - Imputation of Interest (Topic 835-30): Simplifying the Presentation of Debt Issuance Costs. The Company adopted this new disclosure duringelected to early adopt ASU 2018-02, Income Statement—Reporting Comprehensive Income (Topic 220): Reclassification of Certain Tax Effects from Accumulated Other Comprehensive Income, for the first quarteryear ended December 31, 2017. This update provides guidance on the reclassification of 2016 and applied its provisions retrospectively. Understranded tax effects in AOCI resulting from the new guidance, unamortized debt issuance costs are to be presentedTax Act. We reclassified the effect of the change in the balance sheet as a direct deduction from the carrying amount of the debt liability.federal corporate tax rate on gross deferred tax items and related valuation allowances for item in AOCI. The adoption of this new disclosure reduced other assetsASU resulted in a increase to AOCI and notes payable by $281,000.an decrease in retained earnings of $7,000 for the year ended December 31, 2017 with no net effect on total shareholders’ equity.
Error Corrections
Prior to the year ended December 31, 2017, the Company presented preferred shares issued as contingent consideration within the permanent equity section of the Consolidated Statements of Financial Position. In accordance with FASB ASC Topic 480 - Distinguishing Liabilities from Equity, contingent consideration issued as preferred shares wherein the number of shares to be issued is variable should be classified outside of permanent equity and reflected as mezzanine equity on the Consolidated Statements of Financial Position.
For the year ended December 31, 2017, the Company has restated the Consolidated Statements of Shareholders’ Equity to remove the preferred shares and related activity as previously stated for the periods as of January 1, 2015 and for the years ended December 31, 2015 and 2016. Although this impacted total equity for 2015, it had no impact on total equity as of December 31, 2016 due to the redemption and clawback of preferred shares previously issued. In addition, this change did not impact the Consolidated Statements of Financial Position, Consolidated Statements of Income (Loss) and Comprehensive Income (Loss), earnings per common share or the Consolidated Statements of Cash Flows. The Company has evaluated the effect of the incorrect presentation in the prior period, both qualitatively and quantitatively, and concluded that it did not have a material impact on, nor did it require amendment of, any previously filed annual or quarterly consolidated financial statements.
The following line items presented in the Consolidated Statements of Financial Position as of December 31, 2015Shareholders’ Equity were affected by the adoption of the new disclosure:restatement:
|
| | | | | | | | | |
| ($ in '000s) | As Originally Reported | As Adjusted | Effect of Change |
| | | | |
| Impact on Assets as of December 31, 2015: | | | |
Other assets1 | $ | 6,975 |
| $ | 6,694 |
| $ | (281 | ) |
| Total Assets | 411,573 |
| 411,292 |
| (281 | ) |
| Impact on Liabilities and Shareholders' Equity as of December 31, 2015: | | | |
| Notes payable | 17,500 |
| 17,219 |
| (281 | ) |
| Total Liabilities | 281,951 |
| 281,670 |
| (281 | ) |
| Total Liabilities and Shareholders' Equity | 411,573 |
| 411,292 |
| (281 | ) |
|
| | | | | | |
| ($ in ‘000s) | As Originally Reported | As Adjusted | Effect of Change |
| Impact on Total Shareholders’ Equity column as of: | | | |
| December 31, 2014 | 109,399 |
| 107,399 |
| (2,000 | ) |
| December 31, 2015 | 129,622 |
| 122,681 |
| (6,941 | ) |
| December 31, 2016 | 127,342 |
| 127,342 |
| — |
|
21. SUBSEQUENT EVENTS
1 - Other assets asOn March 5, 2018, a complaint was filed in the U.S. District Court for the Northern District of December 31, 2015 includes the balance previously reported as Assets held for saleIllinois asserting claims under the column "As Originally Reported"federal securities laws against the Company and two of its executive officers on behalf of a putative class of purchasers of the Company’s securities, styled Fryman v. Atlas Financial Holdings, Inc., et al., No. 1:18-cv-01640 (N.D. Ill.). In the complaint, the plaintiff asserts claims on behalf of a putative class consisting of purchasers of the Company’s securities between March 13, 2017 and March 2, 2018. The complaint alleges that the defendants violated Sections 10(b) and 20(a) of the Securities Exchange Act of 1934 and Rule 10b-5 promulgated thereunder by making allegedly false and misleading statements or failing to disclose certain information regarding the adequacy of the Company’s reserves. The complaint seeks, among other remedies, unspecified damages, attorneys’ fees and other costs, equitable and/or injunctive relief, and such other relief as the court may find just and proper. Under applicable provisions of the federal securities laws, motions for appointment as lead plaintiffs must be filed within sixty days after a notice announcing the filing of the Fryman complaint. The Company and the other defendants anticipate that they will file a motion to dismiss the complaint for failure to state a claim upon which relief can be granted. Under the federal securities laws, discovery and other proceedings automatically will be stayed during the pendency of any such motion to dismiss.
Item 9. Changes in and Disagreements with Accountants on Accounting and Financial Disclosure
None.
ItemItem 9A. Controls and Procedures
Evaluation of Disclosure Controls and Procedures
We have established disclosure controls and procedures to ensure that material information relating to us, including our consolidated subsidiaries, is made known to the officers who certify our financial reports and to the members of senior management and the Board of Directors.
Based on management’s evaluation as of December 31, 2016,2017, our president and chief executive officer and our vice president, chief financial officer and treasurer have concluded that our disclosure controls and procedures (as defined in Rules 13a-15(e) and 15d-15(e) under the Exchange Act) are effective to ensure that the information required to be disclosed by us in our reports that we file or submit under the Exchange Act is recorded, processed, summarized and reported within the time periods specified in the SEC rules and forms, and is accumulated and communicated to our management, including our president and chief executive officer and our vice president, chief financial officer and treasurer to allow timely decisions regarding required disclosure.
Changes in Internal Controls
There were no changes to our internal control over financial reporting during the fiscal quarter ended December 31, 20162017 that have materially affected, or are reasonably likely to materially affect, our internal control over financial reporting.
Management’s Report on Internal Control Over Financial Reporting
Our management is responsible for establishing and maintaining adequate internal control over financial reporting, as such term is defined in Exchange Act Rule 13a-15(f). Under the supervision and with the participation of our management, including our chief executive officer and chief financial officer, we conducted an evaluation of the effectiveness of our internal control over financial reporting based on the framework in Internal Control - Integrated Framework issued in 2013 by the Committee of Sponsoring Organizations of the Treadway Commission. Based on such evaluation, we have concluded that the Company'sCompany’s internal control over financial reporting is effective as of December 31, 2016.2017.
Our management does not expect that the Company'sCompany’s controls and procedures over financial reporting will prevent all errors and frauds. A control system, no matter how well designed and operated, can provide only reasonable, not absolute, assurance that the objectives of the control system are met. Further, a control system'ssystem’s design must reflect the fact that there are resource constraints, and the benefits of controls must be considered relative to their costs. Because of the inherent limitations in all control systems, no evaluation of controls can provide absolute assurance that all control issues and instances of fraud, if any, within the Company have been detected. These inherent limitations include the realities that judgments in decision-making can be faulty and that breakdowns can occur because of simple mistake or error.
Additionally, controls can be circumvented by the individual acts of some persons, by collusion of two or more people, or by management override of control. The design of any system of controls also is based, in part, upon certain assumptions about the likelihood of future events, and there can be no assurance that any design will successfully achieve its stated goals under all potential future conditions; over time, controls may become inadequate because of changes in conditions, or the degree of compliance with the policies or procedures may deteriorate. Because of the inherent limitations in a cost-effective control system, misstatements due to error or fraud may occur and not be detected.
The independent registered public accounting firm of BDO USA, LLP, as auditors of the consolidated financial statements of Atlas and its subsidiaries, has issued an attestation report on the effectiveness of management'smanagement’s internal control over financial reporting based on criteria established in Internal Control - Integrated Framework issued in 2013 by the Committee of Sponsoring Organizations of the Treadway Commission. The attestation report is included in Item 8 under the heading "Report“Report of Independent Registered Public Accounting Firm on Internal Controls over Financial Reporting,"” and is incorporated herein by reference.
Item 9B. Other Information
None.
Part III.
Item 10. Directors, Executive Officers and Corporate Governance
The information required by this Item will be included in our proxy statement relating to our 20172018 annual general meeting of shareholders ("(“Proxy Statement"Statement”), which information is incorporated by reference in this Annual Report on Form 10-K.
Item 11. Executive Compensation
The information required by this Item will be included in the Proxy Statement, which information is incorporated by reference in this Annual Report on Form 10-K.
Item 12. Security Ownership of Certain Beneficial Owners and Management and Related Stockholder Matters
The information required by this Item will be included in the Proxy Statement, which information is incorporated by reference in this Annual Report on Form 10-K.
Item 13. Certain Relationships and Related Transactions, and Director Independence
The information required by this Item will be included in the Proxy Statement, which information is incorporated by reference in this Annual Report on Form 10-K.
Item 14. Principal Accounting Fees and Services
The information required by this Item will be included in the Proxy Statement, which information is incorporated by reference in this Annual Report on Form 10-K.
Part IV.
Item 15. Exhibits and Financial Statement Schedules
(a) (1) The following consolidated financial statements, notes thereto and related information of Atlas Financial Holdings, Inc. are included in Item 8.
Consolidated Statements of Income (Loss) and Comprehensive Income (Loss)
Consolidated Statements of Financial Position
Consolidated Statements of Shareholders’ Equity
Consolidated Statements of Cash Flows
Notes to Consolidated Financial Statements
Report of Independent Registered Public Accounting Firm on Internal Controls over Financial Reporting
Report of Independent Registered Public Accounting Firm
(a) (2) The following additional financial statement schedules and independent auditors'auditors’ report are furnished herewith pursuant to the requirements of Form 10-K:
Schedules required to be filed under the provisions of Regulation S-X Article 7:
Schedule II - Condensed Financial Information of Registrant
Schedule IV - Reinsurance
Schedule V - Valuation and qualifying accounts
Schedule VI - Supplemental information concerning property - casualty insurance operations
All other schedules pursuant to Article 7 of Regulation S-X are omitted because they are not applicable, or because the required information is included in the consolidated financial statements or in the notes thereto.
(a) (3) The following is a list of the exhibits filed as part of this Form 10-K. The exhibit numbers followed by an asterisk (*) indicate exhibits that are management contracts or compensatory plans or arrangements.
|
| | | |
| Exhibit | Description | | |
| 3.1 | |
| 3.2 | |
4.1(1) | |
4.2(1) | |
| 4.3 | |
| 4.4 | Form |
| 4.5 | |
| 4.6 | |
| 4.7 | |
| 4.8 | |
10.1(1) | |
10.2(1) | |
10.3(1) | |
10.4(1) | |
| 10.5 | |
|
| | | |
10.6(2) | |
10.7(2) | |
10.8(2) | |
10.9(2) | |
| 10.10 | |
| 10.11 | |
| 10.12 | |
| 10.13 | |
| 10.14 | |
| 10.15 | |
| 10.16 | |
| 10.17 | |
| 10.18 | |
| 10.19 | |
| 10.20 | |
| 10.21 | |
| 10.22 | |
| 10.23 | |
| 10.24 | |
| 14 | |
| 21 | |
| 23.1 | |
| Item 31 – Rule 13a-14(a)/15d-14(a) Certifications |
| 31.1 | |
| 31.2 | |
| Item 32 – Section 1350 Certifications |
| 32.1 | |
| 32.2 | |
|
| |
| Item 101 - Interactive Data Files |
| 101.INS | XBRL Instance Document |
| 101.SCH | XBRL Taxonomy Extension Schema Document |
| 101.CAL | XBRL Taxonomy Extension Calculation Linkbase Document |
| 101.DEF | XBRL Taxonomy Extension Definition Linkbase Document |
| 101.LAB | XBRL Taxonomy Extension Label Linkbase Document |
| 101.PRE | XBRL Taxonomy Extension Presentation Linkbase Document |
(1) Incorporated by reference from our annual report on Form 10-K for the year ended December 31, 2011, filed on March 26, 2012.
(2) Incorporated by reference from our quarterly report on Form 10-Q for the quarter ended SeptemberJune 30, 2012, filed on November 4,August 13, 2012.
(*) Management contracts and compensatory plans or agreements.
Item 16. Form 10-K Summary
None.
SIGNATURES
Pursuant to the requirements of Section 13 or 15(d) of the Securities Exchange Act of 1934, the registrant has duly caused this report to be signed on its behalf by the undersigned, thereunto duly authorized.
|
| | | | |
| | | ATLAS FINANCIAL HOLDINGS, INC. (Registrant) |
| | |
/s/ Paul A. Romano
By: Paul A. Romano (Vice President and Chief Financial Officer) |
| | | March 13, 2017April 2, 2018 |
Pursuant to the requirements of the Securities Exchange Act of 1934, this report has been signed below by the following persons on behalf of the registrant and in the capacities and on the dates indicated.
|
| | | | |
| | | | | |
| Signature | | Title | | Date |
| | | | | |
/s/ Scott D. Wollney
Scott D. Wollney | | President, Chief Executive Officer and Director | | March 13, 2017April 2, 2018 |
/s/ Paul A. Romano
Paul A. Romano | |
Vice President, Chief Financial Officer and Principal Accounting Officer | | March 13, 2017April 2, 2018 |
/s/ Gordon G. Pratt
Gordon G. Pratt | | Director, Chairman of the Board | | March 13, 2017April 2, 2018 |
/s/ Jordan M. Kupinsky
Jordan M. Kupinsky | | Director | | March 13, 2017 |
/s/ Larry G. Swets, Jr.
Larry G. Swets, Jr.
| | Director | | March 13, 2017April 2, 2018 |
/s/ John T. Fitzgerald
John T. Fitzgerald | | Director | | March 13, 2017April 2, 2018 |
/s/ Walter F. Walker
Walter F. Walker
| | Director | | April 2, 2018 |
Schedule II – Condensed Financial Information of Registrant
Statements of Income (Loss) and Comprehensive Income (Loss)
|
| | | | | | | | | |
| ($ in '000s) | Year ended December 31, |
| | 2016 | 2015 | 2014 |
| Net investment gain | $ | — |
| $ | 7 |
| $ | 16 |
|
| Other underwriting (income) expense | (4,550 | ) | 2,566 |
| 1,825 |
|
| Income (loss) from operations before income tax | 4,550 |
| (2,559 | ) | (1,809 | ) |
| Income tax benefit | (559 | ) | (577 | ) | (498 | ) |
| Income (loss) before equity in net income of subsidiaries | $ | 5,109 |
| $ | (1,982 | ) | $ | (1,311 | ) |
| Equity in net (loss) income of subsidiaries | (2,463 | ) | 16,412 |
| 19,013 |
|
| Net income | $ | 2,646 |
| $ | 14,430 |
| $ | 17,702 |
|
| | | | |
| Other comprehensive income (loss): | | | |
| Changes in net unrealized gains (losses) | 855 |
| (1,912 | ) | 2,029 |
|
| Reclassification to income of net realized gains | 394 |
| 203 |
| 257 |
|
| Effect of income tax | (437 | ) | 597 |
| (777 | ) |
| Other comprehensive income (loss) for the period | 812 |
| (1,112 | ) | 1,509 |
|
| Total comprehensive income | $ | 3,458 |
| $ | 13,318 |
| $ | 19,211 |
|
| | | | |
| See accompanying Notes to Condensed Financial Information of Registrant | | | |
|
| | | | | | | | | |
| ($ in ‘000s) | Year ended December 31, |
| | 2017 | 2016 | 2015 |
| Net investment (expense) income | $ | (4 | ) | $ | — |
| $ | 7 |
|
| Other underwriting expense (income) | 1,436 |
| (4,550 | ) | 2,566 |
|
| Interest expense | 1,266 |
| — |
| — |
|
| (Loss) income from operations before income taxes | (2,706 | ) | 4,550 |
| (2,559 | ) |
| Income tax benefit | (115 | ) | (559 | ) | (577 | ) |
| (Loss) income before equity in net income of subsidiaries | $ | (2,591 | ) | $ | 5,109 |
| $ | (1,982 | ) |
| Equity in net (loss) income of subsidiaries | (36,219 | ) | (2,463 | ) | 16,412 |
|
| Net (loss) income | $ | (38,810 | ) | $ | 2,646 |
| $ | 14,430 |
|
| | | | |
| Other comprehensive income (loss): | | | |
| Changes in net unrealized investment gains (losses) | 437 |
| 855 |
| (1,912 | ) |
| Reclassification to net (loss) income | (49 | ) | 394 |
| 203 |
|
| Effect of income taxes | (136 | ) | (437 | ) | 597 |
|
| Other comprehensive income (loss) | 252 |
| 812 |
| (1,112 | ) |
| Total comprehensive (loss) income | $ | (38,558 | ) | $ | 3,458 |
| $ | 13,318 |
|
| | | | |
| See accompanying Notes to Condensed Financial Information of Registrant | | | |
Schedule II – Condensed Financial Information of Registrant (continued)
Statements of Financial Position
| | ($ in '000s, except share and per share data) | December 31, | |
($ in ‘000s, except share and per share data) | | December 31, |
| 2016 | 2015 | 2017 | 2016 |
| Assets | | |
| Cash and cash equivalents | $ | 271 |
| $ | 162 |
| $ | 4,233 |
| $ | 271 |
|
| Accounts receivable and other assets | — |
| 479 |
| |
| Deferred tax asset, net | 3,404 |
| 766 |
| 4,116 |
| 3,404 |
|
| Investment in subsidiaries | 126,564 |
| 128,215 |
| 109,897 |
| 126,564 |
|
| Total Assets | $ | 130,239 |
| $ | 129,622 |
| $ | 118,246 |
| $ | 130,239 |
|
| | | |
| Liabilities | | |
| Notes payable, net | | $ | 24,031 |
| $ | — |
|
| Other liabilities and accrued expenses | $ | 2,897 |
| $ | — |
| 3,570 |
| 2,897 |
|
| Total Liabilities | $ | 2,897 |
| $ | — |
| $ | 27,601 |
| $ | 2,897 |
|
| | | |
| Shareholders’ Equity | | |
| Preferred shares, $0.001 par value, 100,000,000 shares authorized, shares issued and outstanding: December 31, 2016 - 0 and December 31, 2015 - 6,940,500. Liquidation value $1.00 per share | $ | — |
| $ | 6,941 |
| |
| Ordinary voting common shares, $0.003 par value, 266,666,667 shares authorized, shares issued and outstanding: December 31, 2016 - 11,895,104 and December 31, 2015 - 11,883,025 | 36 |
| 36 |
| |
| Restricted voting common shares, $0.003 par value, 33,333,334 shares authorized, shares issued and outstanding: December 31, 2016 - 128,191 and December 31, 2015 - 132,863 | — |
| — |
| |
| Ordinary voting common shares, $0.003 par value, 266,666,667 shares authorized, shares issued and outstanding: December 31, 2017 - 12,164,041 and December 31, 2016 - 11,895,104 | | $ | 36 |
| $ | 36 |
|
| Restricted voting common shares, $0.003 par value, 33,333,334 shares authorized, shares issued and outstanding: December 31, 2017 - 0 and December 31, 2016 - 128,191 | | — |
| — |
|
| Additional paid-in capital | 199,244 |
| 198,041 |
| 201,105 |
| 199,244 |
|
| Retained deficit | (71,718 | ) | (74,364 | ) | (110,535 | ) | (71,718 | ) |
| Accumulated other comprehensive loss, net of tax | (220 | ) | (1,032 | ) | |
| Accumulated other comprehensive income (loss), net of tax | | 39 |
| (220 | ) |
| Total Shareholders’ Equity | 127,342 |
| 129,622 |
| 90,645 |
| 127,342 |
|
| Total Liabilities and Shareholders’ Equity | $ | 130,239 |
| $ | 129,622 |
| $ | 118,246 |
| $ | 130,239 |
|
| | | |
| See accompanying notes to Condensed Financial Information of Registrant | | |
Schedule II – Condensed Financial Information of Registrant (continued)
Statements of Cash Flow
| | | ($ in '000s) | Year Ended December 31, | |
| ($ in ‘000s) | | Year Ended December 31, |
| | 2016 | 2015 | 2014 | 2017 | 2016 | 2015 |
| Operating Activities: | | |
| Net income | $ | 2,646 |
| $ | 14,430 |
| $ | 17,702 |
| |
| Adjustments to reconcile net income to net cash provided by (used in) operating activities: | | |
| Net (loss) income | | $ | (38,810 | ) | $ | 2,646 |
| $ | 14,430 |
|
| Adjustments to reconcile net (loss) income to net cash flows (used in) provided by operating activities: | | |
| Equity in net loss (income) of subsidiaries | 2,463 |
| (16,412 | ) | (19,013 | ) | 36,219 |
| 2,463 |
| (16,412 | ) |
| Share-based compensation expense | 1,612 |
| 1,819 |
| 1,469 |
| 1,176 |
| 1,612 |
| 1,819 |
|
| Deferred income taxes | (417 | ) | (251 | ) | (301 | ) | (712 | ) | (417 | ) | (251 | ) |
| Amortization of financing costs | | 152 |
| — |
| — |
|
| Expenses (recovered) incurred pursuant to stock purchase agreements | (6,623 | ) | 941 |
| — |
| — |
| (6,623 | ) | 941 |
|
| Net changes in operating assets and liabilities: | | |
| Accounts receivable and other assets | 479 |
| (476 | ) | 22 |
| |
| Other assets | | — |
| 479 |
| (476 | ) |
| Other liabilities and accrued expenses | 2,897 |
| (34 | ) | (112 | ) | 673 |
| 2,897 |
| (34 | ) |
| Net cash flows provided by (used in) operating activities | 3,057 |
| 17 |
| (233 | ) | |
| Net cash flows (used in) provided by operating activities | | (1,302 | ) | 3,057 |
| 17 |
|
| | | |
| Investing activities: | | |
| Capital contributions made to subsidiaries | — |
| (23,428 | ) | (1,650 | ) | (19,300 | ) | — |
| (23,428 | ) |
| Net cash flows used in investing activities | — |
| (23,428 | ) | (1,650 | ) | (19,300 | ) | — |
| (23,428 | ) |
| | | |
| Financing activities: | | |
| Preferred share buyback | (2,539 | ) | — |
| — |
| — |
| (2,539 | ) | — |
|
| Proceeds from U.S. public offering, net of offering costs | — |
| — |
| 25,021 |
| |
| Capital contribution | | 30 |
| — |
| — |
|
| Proceeds from notes payable, net of issuance costs | | 23,879 |
| — |
| — |
|
| Preferred dividends paid | (409 | ) | — |
| — |
| — |
| (409 | ) | — |
|
| Options exercised | — |
| 145 |
| 1 |
| 655 |
| — |
| 145 |
|
| Net cash flows (used in) provided by financing activities | (2,948 | ) | 145 |
| 25,022 |
| |
| Net cash flows provided by (used in) financing activities | | 24,564 |
| (2,948 | ) | 145 |
|
| Net change in cash and cash equivalents | 109 |
| (23,266 | ) | 23,139 |
| 3,962 |
| 109 |
| (23,266 | ) |
| Cash and cash equivalents, beginning of year | 162 |
| 23,428 |
| 289 |
| 271 |
| 162 |
| 23,428 |
|
| Cash and cash equivalents, end of year | $ | 271 |
| $ | 162 |
| $ | 23,428 |
| $ | 4,233 |
| $ | 271 |
| $ | 162 |
|
| | | |
| Supplemental disclosure of cash information: | | |
| | | |
| Cash (recovered) paid for: | | |
| Cash paid (recovered) for: | | |
| Interest | | $ | 828 |
| $ | — |
| $ | — |
|
| Income taxes | $ | (3,464 | ) | $ | 85 |
| $ | (210 | ) | (192 | ) | (3,464 | ) | 85 |
|
| | | |
| Supplemental disclosure of noncash investing and financing activities: | | |
| Issuance of preferred shares related to acquisition of subsidiary | $ | — |
| $ | 4,000 |
| $ | — |
| $ | — |
| $ | — |
| $ | 4,000 |
|
| Issuance of preferred shares related to Gateway stock purchase agreement | — |
| 941 |
| — |
| — |
| — |
| 941 |
|
| Redemption of preferred shares related to Gateway stock purchase agreement | (2,297 | ) | — |
| — |
| — |
| (2,297 | ) | — |
|
| Cancellation of preferred shares related to Anchor stock purchase agreement | (4,000 | ) | — |
| — |
| — |
| (4,000 | ) | — |
|
| | | |
| See accompanying notes to Condensed Financial Information of Registrant | | |
Schedule II – Condensed Financial Information of Registrant (continued)
Notes to Condensed Financial Information
The financial statements of the Registrant should be read in conjunction with the Consolidated Financial Statements and notes thereto included in Item 8.
On April 26, 2017, Atlas issued $25 million of five-year 6.625% senior unsecured notes and received net proceeds of approximately $23.9 million after deducting underwriting discounts and commissions and other estimated offering expenses, as described in Note 18, ‘Notes Payable’. Atlas has no other long-term debt obligations.
See Note 21, ‘Subsequent Events’ for the details of potential litigation.
Atlas has no material contingencies long-term debt obligations or guarantees.guarantees except as disclosed in Note 21, ‘Subsequent Event’ to the Consolidated Financial Statements.
Atlas has not received cash dividends from its subsidiaries since its inception on December 31, 2010.
Schedule IV – Reinsurance | | | ($ in '000s) | Gross Amount | Ceded to Other Companies | Assumed from Other Companies | Net Amount | % of Amount Assumed to Net | |
| ($ in ‘000s) | | Gross Amount | Ceded to Other Companies | Assumed from Other Companies | Net Amount | % of Amount Assumed to Net |
| December 31, 2017 | | | |
| Premiums earned | | $ | 251,293 |
| $ | (45,318 | ) | $ | 9,796 |
| $ | 215,771 |
| 4.5 | % |
| | | | |
| December 31, 2016 | | | | |
| Premiums earned | $ | 217,053 |
| $ | (49,069 | ) | $ | 3,074 |
| $ | 171,058 |
| 1.8 | % | $ | 217,053 |
| $ | (49,069 | ) | $ | 3,074 |
| $ | 171,058 |
| 1.8 | % |
| | | | | |
| December 31, 2015 | | | | |
| Premiums earned | $ | 182,376 |
| $ | (30,946 | ) | $ | 634 |
| $ | 152,064 |
| 0.4 | % | $ | 182,376 |
| $ | (30,946 | ) | $ | 634 |
| $ | 152,064 |
| 0.4 | % |
| | | | | |
| December 31, 2014 | | | |
| Premiums earned | $ | 107,587 |
| $ | (9,589 | ) | $ | 126 |
| $ | 98,124 |
| 0.1 | % | |
| | | | |
Schedule V – Valuation and qualifying accounts | | | ($ in '000s) | Balance at Beginning of Period | Charged to Expenses | Other Additions | Deductions | Balance at End of Period | |
| ($ in ‘000s) | | Balance at Beginning of Period | Charged to Expenses | Other Additions | Deductions | Balance at End of Period |
| December 31, 2017 | | |
| Allowance for uncollectible receivables | | $ | 2,366 |
| $ | 2,365 |
| $ | — |
| $ | (1,313 | ) | $ | 3,418 |
|
| Valuation allowance for deferred tax assets | | — |
| — |
| — |
| — |
| — |
|
| | | |
| December 31, 2016 | | |
| Allowance for uncollectible receivables | $ | 846 |
| $ | 2,397 |
| $ | 12 |
| $ | (889 | ) | $ | 2,366 |
| $ | 846 |
| $ | 2,397 |
| $ | 12 |
| $ | (889 | ) | $ | 2,366 |
|
| Valuation allowance for deferred tax assets | — |
| — |
| — |
| — |
| — |
| — |
| — |
| — |
| — |
| — |
|
| | | |
| December 31, 2015 | | |
| Allowance for uncollectible receivables | $ | 560 |
| $ | 566 |
| $ | 8 |
| $ | (288 | ) | $ | 846 |
| $ | 560 |
| $ | 566 |
| $ | 8 |
| $ | (288 | ) | $ | 846 |
|
| Valuation allowance for deferred tax assets | — |
| — |
| — |
| — |
| — |
| — |
| — |
| — |
| — |
| — |
|
| | | |
| December 31, 2014 | | |
| Allowance for uncollectible receivables | $ | 776 |
| $ | 505 |
| $ | 172 |
| $ | (893 | ) | $ | 560 |
| |
| Valuation allowance for deferred tax assets | 9,446 |
| (9,446 | ) | — |
| — |
| — |
| |
| | | |
Schedule VI - Supplemental information concerning property-casualty insurance operations | | | ($ in '000s) | Year Ended December 31, | |
| ($ in ‘000s) | | ($ in ‘000s) | Year Ended December 31, |
| | | 2016 | 2015 | 2014 | | 2017 | 2016 | 2015 |
| Deferred policy acquisition costs | Deferred policy acquisition costs | $ | 13,222 |
| $ | 10,235 |
| $ | 8,166 |
| Deferred policy acquisition costs | $ | 14,797 |
| $ | 13,222 |
| $ | 10,235 |
|
| Claims liabilities | Claims liabilities | 139,004 |
| 127,011 |
| 102,430 |
| Claims liabilities | 211,648 |
| 139,004 |
| 127,011 |
|
| Unearned premiums | 113,171 |
| 108,202 |
| 58,950 |
| |
| Unearned premium reserves | | Unearned premium reserves | 128,043 |
| 113,171 |
| 108,202 |
|
| Net premiums earned | Net premiums earned | 171,058 |
| 152,064 |
| 98,124 |
| Net premiums earned | 215,771 |
| 171,058 |
| 152,064 |
|
| Net investment income | Net investment income | 4,824 |
| 3,976 |
| 3,110 |
| Net investment income | 4,897 |
| 4,824 |
| 3,976 |
|
| Claims and claims adjustment expenses incurred | Claims and claims adjustment expenses incurred | | Claims and claims adjustment expenses incurred | |
| | Current year | 102,133 |
| 89,828 |
| 61,680 |
| Current year | 128,476 |
| 102,133 |
| 89,828 |
|
| | Prior year | 32,613 |
| 166 |
| (602 | ) | Prior year | 75,397 |
| 32,613 |
| 166 |
|
| Amortization of deferred policy acquisition costs | Amortization of deferred policy acquisition costs | 18,803 |
| 18,592 |
| 14,048 |
| Amortization of deferred policy acquisition costs | 27,885 |
| 18,803 |
| 18,592 |
|
| Paid claims and claims adjustment expenses | Paid claims and claims adjustment expenses | 128,831 |
| 97,824 |
| 62,725 |
| Paid claims and claims adjustment expenses | 150,622 |
| 128,831 |
| 97,824 |
|
| Gross premium written | 225,095 |
| 209,286 |
| 122,432 |
| |
| Gross premiums written | | Gross premiums written | 275,961 |
| 225,095 |
| 209,286 |
|