UNITED STATES
SECURITIES AND EXCHANGE COMMISSION
WASHINGTON, D.C. 20549
FORM 10-K
ANNUAL REPORT PURSUANT TO SECTION 13 OR 15(d) OF THE SECURITIES EXCHANGE ACT OF 1934
|
| | |
| For the fiscal year ended: | | COMMISSION FILE NUMBER: |
December 31, 20182019 | | 000-54627 |
ATLAS FINANCIAL HOLDINGS, INC.
(EXACT NAME OF REGISTRANT AS SPECIFIED IN ITS CHARTER)
|
| | |
| CAYMAN ISLANDS | | 27-5466079 |
| (State or other jurisdiction of | | (I.R.S. Employer |
| incorporation or organization) | | Identification No.) |
| | |
| 953 AMERICAN LANE, 3RD FLOOR | | 60173 |
| Schaumburg, IL | | (Zip Code) |
| (Address of principal executive offices) | | |
Registrant’s telephone number, including area code: (847) 472-6700
Securities registered pursuant to Section 12(b) of the Act:
|
| | | | |
| Title of each class | | Trading Symbol(s) | | Name of each exchange on which registered |
| Common, $0.003 par value per share | | AFHAFHIF | | Nasdaq Capital Market |
6.625% Senior Unsecured Notes due 2022 | | AFHBL | | OTC Markets - Pink Sheets
|
Securities registered pursuant to Section 12(g) of the Act: None
Indicate by check mark if the registrant is a well-known seasoned issuer, as defined in Rule 405 of the Securities Act. Yes ¨ No þ
Indicate by check mark if the registrant is not required to file reports pursuant to Section 13 or Section 15(d) of the Act. Yes ¨ No þ
Indicate by check mark whether the Registrant (1) has filed all reports required to be filed by Section 13 or 15(d) of the Securities Exchange Act of 1934 during the preceding 12 months (or for such shorter period that the Registrant was required to file such reports), and (2) has been subject to such filing requirements for the past 90 days. Yes þ¨ No ¨þ
Indicate by check mark whether the registrant has submitted electronically every Interactive Data File required to be submitted pursuant to Rule 405 of Regulation S-T (§ 232.405 of this chapter) during the preceding 12 months (or for such shorter period that the registrant was required to submit such files). Yes þ No ¨
Indicate by check mark whether the registrant is a large accelerated filer, an accelerated filer, a non-accelerated filer, a smaller reporting company, or an emerging growth company. See the definitions of “large accelerated filer,” “accelerated filer,” “smaller reporting company,” and “emerging growth company” in Rule 12b-2 of the Exchange Act.
Large Accelerated Filer ¨ Accelerated Filer þ¨
Non-Accelerated Filer ¨ Smaller Reporting Company þ
Emerging Growth Company ¨
If an emerging growth company, indicate by check mark if the registrant has elected not to use the extended transition period for complying with any new or revised financial accounting standards provided pursuant to Section 13(a) of the Exchange Act. ¨
Indicate by check mark whether the registrant has filed a report on and attestation to its management’s assessment of the effectiveness of its internal control over financial reporting under Section 404(b) of the Sarbanes-Oxley Act (15 U.S.C. 7262(b) by the registered public accounting firm that prepared or issued its audit report. ¨
Indicate by check mark whether the registrant is a shell company (as defined in Rule 12b-2 of the Act). Yes ¨ No þ
State the aggregate market value of the voting and non-voting common equity held by non-affiliates computed by reference to the price at which the common equity was last sold, or the average bid and asked price of such common equity, as of the last business day of the registrant’s most recently completed second fiscal quarter.
There were 11,942,81211,993,293 shares of the Registrant’s common stock outstanding as of March 8, 2019,November 6, 2020, all of which are ordinary voting common shares. There are no outstanding restricted voting common shares. As of the last business day of the Registrant’s most recently completed second fiscal quarter, the aggregate market value of the Registrant’s common equity held by non-affiliates of the Registrant was approximately $90.7$7.5 million (based upon the closing sale price of the Registrant’s common shares on June 30, 2018)2019).
For purposes of the foregoing calculation only, which is required by Form 10-K, the Registrant has included in the shares owned by affiliates those shares owned by directors and officers of the Registrant, and such inclusion shall not be construed as an admission that any such person is an affiliate for any purpose.
Explanatory Note:
This Annual Report on Form 10-K for Atlas Financial Holdings, Inc. (the “Company”) relates to the fiscal year ended December 31, 2018.2019. As previously disclosed, the Company has been unable to previously file this annual report due to delays in the year end audit process. Unless otherwise noted, disclosures in this annual report, including disclosures regarding the Company’s financial and operating condition, are as of December 31, 2018.2019. An overview of certain developments that occurred since December 31, 20182019 is included in ‘Item 1, 20192020 Developments’ and “Risk Factors - Risks Related to 20192020 Developments.” We expect to file our Quarterly Reports on Form 10-Q for the quarters ended March 31, 2019,2020, June 30, 20192020 and September 30, 2019, as well as our Annual Report on Form 10-K for the fiscal year ended December 31, 2019,2020 as soon as practicable.
Atlas Financial Holdings, Inc.
Index to Annual Report on Form 10-K
December 31, 20182019
Part I
Item 1. Business
Overview
Atlas Financial Holdings, Inc. (“Atlas” or “We” or “the Company”) is a financial services holding company whose subsidiaries specializeprimarily in the business of generating, underwriting ofand servicing commercial automobile insurance policies, focusingin the United States, with a niche market orientation and focus on insurance for the “light” commercial automobile sector. This sector includesincluding taxi cabs, non-emergencynonemergency para-transit, limousine, limousine/livery (including transportation network company drivers) and business auto.
Our business currently focuses on a managing general agency strategy. Primarily through our wholly owned subsidiary, Anchor Group Management, Inc. (“AGMI”), we are focused on maintaining and recapturing business we have historically written in the taxi, livery/limo and paratransit sectors as well as generating new business that fits our current underwriting parameters. We are also actively pursuing additional programs in the “light” commercial auto space where we believe our expertise, infrastructure and insurance technology will enable us to increase scale and profitability, but there can be no assurance that these programs will materialize. Our Team believes that the specialized infrastructure and technology platforms we’ve developed over the years to support our traditional business will enable us to provide comparative advantages as a managing general agency in other commercial auto segments. In particular, our ability to efficiently manage large numbers of small or highly transactional accounts through our technology platform and workflows is a differentiator. We are also evaluating opportunities to leverage our optOnTM insuretech platform which was developed to provide micro-duration commercial automobile insurance for gig-economy drivers via a proprietary mobile app based ecosystem.
With roots dating back to 1925 selling insurance for taxi cabs, wecertain of our subsidiaries are onesome of the oldest insurers of taxi and livery businesses in the United States (“U.S.”). This heritage serves as the foundation of our hyper-focused specialty insurance business that embraces continuous improvement, analytics and technology. The expanding segment of commercially licensed drivers operating through transportation network companies (��(“TNCs”) are included in the livery product. Our goal is to be the preferred specialty insurance businessprovider in any geographic area where our value proposition delivers benefit to all stakeholders.
In 2019, the Company implemented a change in strategy which emphasizes the managing agency operations it owns with the objective of establishing business relationships with other unrelated insurance carriers. As part of this strategic transition, the Company expects to deploy its experience, technology and expertise in the niche segment in which Atlas traditionally focused, but de-emphasize its reliance on wholly owned insurers and rely more on external risk-taking partners. We believe that this approach will reduce certain significant risks and capital requirements related to traditional primary insurance company operations (see Item 1A., Risk Factors).
We were originally formed as JJR VI, a Canadian capital pool company, on December 21, 2009 under the laws of Ontario, Canada. On December 31, 2010, we completed a reverse merger wherein American Service Insurance Company, Inc. (“American Service”) and American Country Insurance Company (“American Country”), in exchange for the consideration set out below, were transferred to us by Kingsway America Inc. (“KAI”), a wholly owned subsidiary of Kingsway Financial Services Inc. (“KFSI”). Prior to the transaction, American Service and American Country were wholly owned subsidiaries of KAI. American Country commenced operations in 1979. In 1983, American Service began as a non-standard personal and commercial auto insurer writing business in the Chicago, Illinois area.
On December 31, 2010, following the reverse merger transaction described immediately hereafter, we filed a Certificate of Registration by Way of Continuation in the Cayman Islands to re-domesticate as a Cayman Islands company. In addition, on December 30, 2010 we filed a Certificate of Incorporation on Change of Name to change our name to Atlas Financial Holdings, Inc. Our current organization is a result of a reverse merger transaction involving the following companies:
| |
| (a) | JJR VI, sponsored by JJR Capital, a Toronto based merchant bank; |
| |
| (b) | American Insurance Acquisition Inc. (“American Acquisition”), a corporation formed under the laws of Delaware as a wholly owned subsidiary of KAI; and |
| |
| (c) | Atlas Acquisition Corp., a Delaware corporation wholly-owned by JJR VI and formed for the purpose of merging with and into American Acquisition. |
In connection with the reverse merger transaction, KAI transferred 100% of the capital stock of each of American Service and American Country to American Acquisition in exchange for C$35.1 million of common shares and $18.0 million of preferred shares of American Acquisition and promissory notes worth C$7.7 million, aggregating C$60.8 million. In addition, American Acquisition raised C$8.0 million through a private placement offering of subscription receipts to qualified investors in both the U.S. and Canada at a price of C$6.00 per subscription receipt.
KAI received 4,601,621 restricted voting common shares of our company, then valued at $27.8 million, along with 18,000,000 non-voting preferred shares of our company, then valued at $18.0 million, and C$8.0 million cash for total consideration of C$60.8 million in exchange for 100% of the outstanding shares of American Acquisition and full payment of certain promissory notes. Investors in the American Acquisition private placement offering of subscription receipts received 1,327,834 of our ordinary voting common shares, plus warrants to purchase one ordinary voting common share of our company for each subscription receipt at C$6.00 at any time until December 31, 2013. Every 10 common shares of JJR VI held by the shareholders of JJR VI immediately prior to the reverse merger were, upon consummation of the merger, consolidated into one ordinary voting common share of JJR VI. Upon re-domestication in the Cayman Islands, these consolidated shares were then exchanged on a one-for-one basis for our ordinary voting common shares.
In connection with the acquisition of American Service and American Country, we streamlined the operations of the insurance subsidiaries to focus on the “light” commercial automobile lines of business. During 2011 and 2012, we disposed of non-core assets and placed into run-off certain non-core lines of business previously written by the insurance subsidiaries. Since disposing of these non-core assets and lines of business, our strategic focus has beenbecame the underwriting of specialty commercial insurance for users of “light” vehicles in the U.S.
On December 7, 2012, a shareholder meeting was held where a one-for-three reverse stock split was unanimously approved. When the reverse stock split took effect on January 29, 2013, it decreased the authorized and outstanding ordinary voting common shares and restricted voting common shares at a ratio of one-for-three. The primary objective of the reverse stock split was to increase the per share price of Atlas’ ordinary voting common shares to meet certain listing requirements of the NASDAQ StockCapital Market.
Unless otherwise noted, all historical share and per share values in this Annual Report on Form 10-K reflect the one-for-three reverse stock split.
On January 2, 2013, we acquired Camelot Services, Inc. (“Camelot Services”), a privately owned insurance holding company, and its sole subsidiary, Gateway Insurance Company (“Gateway”), from an unaffiliated third party. This transaction was contractually deemed effective as of January 1, 2013. Gateway provides specialized commercial insurance products, including commercial automobile insurance to niche markets such as taxi, black car and sedan service owners and operators. Gateway also wrote contractor’s workers’ compensation insurance, which we ceased writing as part of the transaction. An indemnity reinsurance agreement was entered into pursuant to which 100% of Gateway’s workers’ compensation business was ceded to a third party captive reinsurer funded by the seller as part of the transaction.
Under the terms of the stock purchase agreement, the purchase price equaled the adjusted book value of Camelot Services as of December 31, 2012, subject to certain pre and post-closing adjustments, including, among others, the future development of Gateway’s actual claims reserves for certain lines of business and the utilization of certain deferred tax assets over time. The total purchase price for all of Camelot Services’ outstanding shares was $14.3 million, consisting of a combination of cash and Atlas preferred shares. Consideration consisted of a $6.0 million dividend paid by Gateway immediately prior to the closing, $2.0 million of Atlas preferred shares (consisting of a total of 2,000,000 preferred shares) and $6.3 million in cash. Pursuant to the terms of the stock purchase agreement, the Company issued an additional 940,500 preferred shares due to the favorable development of Gateway’s actual claims reserves for certain lines of business during the first quarter of 2015. During the first quarter of 2016, the Company canceled 401,940 preferred shares pursuant to the Gateway stock purchase agreement due to the unfavorable development of Gateway’s actual claims reserves for certain lines of business. During the third quarter of 2016, the Company and the former owner of Camelot Services agreed to settle the additional consideration related to future claims development and utilization of certain tax assets. Atlas redeemed all 2,538,560 of the remaining preferred shares issued to the former owner of Gateway.
On February 11, 2013, an aggregate of 4,125,000 Atlas ordinary voting common shares were offered in Atlas’ initial public offering in the U.S. 1,500,000 ordinary voting common shares were offered by Atlas and 2,625,000 ordinary voting common shares were sold by KAI at a price of $5.85 per share. Atlas also granted the underwriters an option to purchase up to an aggregate of 618,750 additional shares at the public offering price of $5.85 per share to cover over-allotments, if any. On March 11, 2013, the underwriters exercised this option and purchased an additional 451,500 shares. After underwriting and other expenses, total proceeds of $9.8 million were realized on the issuance of the shares. SinceAt that time, Atlas’ shares have tradedbegan trading on the NASDAQ under the symbol “AFH.”“AFH” (see Item 1, 2020 Developments). The principal purposes of the initial offering in the U.S. were to create a public market in the U.S. for Atlas’ ordinary voting common shares and thereby enable future access to the public equity markets in the U.S. by Atlas and its shareholders, and to obtain additional capital.capital for general corporate purposes and to repurchase outstanding preferred shares issued in connection with the above described reverse merger.
On June 5, 2013, Atlas delisted from the Toronto Stock Exchange.
On August 1, 2013, Atlas used the net proceeds from the U.S. initial public offering to partially fund the repurchase of 18,000,000 of its outstanding preferred shares owned by KAI for $16.2 million. These preferred shares had accrued dividends on a cumulative basis at a rate of $0.045 per share per year (4.5%) and were convertible into 2,286,000 common shares at the option of the holder after December 31, 2015. These shares were redeemed in their entirety for $0.90 for every dollar of outstanding face value plus accrued interest.
On May 13, 2014, an aggregate of 2,000,000 Atlas ordinary voting common shares were offered in a subsequent public offering in the U.S. at a price of $12.50 per share. Atlas also granted the underwriters an option to purchase up to an aggregate of 300,000 additional shares at the public offering price of $12.50 per share to cover over-allotments, if any. On May 27, 2014, the underwriters exercised this option and purchased an additional 161,000 shares. After underwriting and other expenses, total proceeds of $25.0 million were realized on the issuance of the shares. A portion of the net proceeds from the offering was used to support the acquisition of Anchor Holdings Group, Inc. and its affiliated entities as described further below.
During the fourth quarter of 2014, Camelot Services was merged into American Acquisition.
On March 11, 2015, we acquired Anchor Holdings Group, Inc. (“Anchor Holdings”), a privately owned insurance holding company, and its wholly owned subsidiary, Global Liberty Insurance Company of New York (“Global Liberty”), along with its affiliated entities, Anchor Group Management Inc. (“AGMI”),AGMI, Plainview Premium Finance Company, Inc. (“Plainview Delaware”) and Plainview Delaware’s wholly owned subsidiary, Plainview Premium Finance Company of California, Inc. (“Plainview California”), and together with Anchor Holdings, Global Liberty, AGMI, and Plainview Delaware, “Anchor,”) from an unaffiliated third party for a total purchase price of $23.2 million, consisting of a combination of cash and Atlas preferred shares that was approximately 1.3 times combined U.S. GAAP book value. Consideration consisted of approximately $19.2 million in cash and $4.0 million of Atlas preferred shares (consisting of a total of 4,000,000 preferred shares at $1.00 per preferred share). Anchor provides specialized commercial insurance products, including commercial automobile insurance to niche markets such as taxi, black car and sedan service owners and operators primarily in the New York market. During the fourth quarter of 2016, the companyCompany canceled 4,000,000 preferred shares pursuant to the Anchor stock purchase agreement due to unfavorable development of Global Liberty’s pre-acquisition claims reserves. Although the re-issuance of preferred shares to the former owner of Anchor may be highly unlikely,
theThe contingent consideration terms of the Anchor stock purchase agreement will remain in effect forexpired after a period of five years from the date of acquisition.
OurPrior to the strategic transition referenced above, our core business iswas the underwriting of commercial automobile insurance policies, focusing on the “light” commercial automobile sector, which is carried out through American Country, American Service and Gateway (collectively, the “ASI Pool Companies”) and Global Liberty (together with the ASI Pool Companies, our “Insurance Subsidiaries”), along with our wholly owned managing general agency, AGMI. As previously announced, the ASI Pool Companies were placed into rehabilitation under the statutory control of the Illinois Department of Insurance during the second half of 2019. Regulatory actions were taken in certain states, including restriction, suspension, or revocation of certain state licenses and certificates of authority held by the ASI Pool Companies preceding and following the initiation of rehabilitation. The Company’s current strategy focuses on AGMI’s operation as the primary go-foward business. During 2019, we worked with insurance regulators and advisors to evaluate and take steps intended to achieve the best outcome for stakeholders in connection with our Insurance Subsidiaries have been in rehabilitation since July 8, 2019.pursuant to regulatory actions. See ‘Item 1, 20192020 Developments’ for certain developments with respect to the Company and the Insurance Subsidiaries subsequent to December 31, 2018.2019. As a result of management no longer having financial control of the
ASI Pool Companies, they have been deconsolidated from this report. During the fourth quarter of 2019, the Company began actively pursuing the potential sale of Global Liberty, and as a result, Global Liberty has been classified as discontinued operations. These determinations impact the financial presentation in this report and are more fully described throughout. We feel that the current presentation best represents the aspects of Atlas’ business on which the Company intends to focus going forward.
Competitive Strengths
Our value proposition is driven by our competitive strengths, which include the following:
Focus on niche commercial insurance business.
We target niche markets that support pricing deemed to be adequate based on historical results and subsequent estimations of future outcomes. While the commercial automobile insurance market has generally faced loss related challenges in recent years, we believe that we are ablehave endeavored to adapt to changing market needs in advance of our competitors through our strategic commitment, the use of technology, analytics and operating scale. We endeavorbelieve that our current managing agency based strategy will allow us to develop and deliver superior specialty insurance products and services to meet our customers' needs with a focus on innovation.innovation and a reduced need to risk the Company’s capital as compared to a traditional insurance carrier.
There are a limited number of competitors specializing in these lines of business. Management believes a strong value proposition is very important to attract new business and can result in desirable retention levels as policies renew on an annual basis. Commercial auto rates have continued to increase year-over-year with the U.S. industry reporting thirty-five (35) consecutive quarterly rate increases (source: The Council of Insurance Agents & Brokers’ Commercial Property/Casualty Market Report Q1 2020).
Strong market presence with recognized brands and long-standing distribution relationships.
OurAtlas and AGMI have focused on building a strong specialty brand based on our Insurance Subsidiaries have aSubsidiaries’ long heritage as insurers of taxi, livery and para-transit businesses. All of our Insurance SubsidiariesAGMI serves as the Company’s customer facing brand identity. We believe we have strong brand recognition and long-standing distribution relationships in target markets. Our understanding of the markets we serve remains current through regular interaction between AGMI andwith our independent retail agents. Our Insurance Subsidiaries are currently licensed in more states than those in which weWe have currently electedbeen pursuing and have established relationships with insurance carrier partners to do business,complement or replace our own carriers and we routinely re-evaluate all markets to assess future potential opportunities and risks. There are also a relatively limited number of agents who specialize in these lines of business. As a result, strategic relationships with independent retail agents are important to ensure efficient distribution. AGMI’s policy system enables point of sale interface with our distribution channel providing operating efficiency and customer service benefits.
Underwriting and claims handling experience.
Atlas has extensive experience with respect to underwriting and claims management in our specialty area of insurance. Our underwriting and claims infrastructure includes an extensive data repository, proprietary technologies, deep market knowledge and established market relationships. Analysis of the substantial data available through our operating companies informs our product and pricing decisions. The Company’s recent results includeincluded a re-estimation of claim related reserves primarilywhich has been a challenge for older accidentmany, if not most, insurers in commercial auto in the U.S. in recent years. We believe our underwriting and claims handling activities will result in enhanced risk selection, high quality service to our customers and greater control over claims costs. We are committed to continuous improvement related to this underwriting and claims handling experience as a core competency, especially in light of the challenges facing the commercial automobile insurance industry in general. In recent years, we invested significantly in the use of machine learning based predictive analytics in both our underwriting and claims areas to further leverage this heritage. These aspects of our business model continue to be relevant value drivers in connection with our managing general agency focused strategy.
Scalable operations.
Significant changes haveprogress has been made in aligning our organization’s infrastructure cost base to our expected revenue and strategic direction going forward. The core functions of our Insurance Subsidiaries were integrated into a common operating platform. WeManagement of this platform is being led by AGMI. According to data compiled by S&P Global, the total addressable market size for commercial auto in total was approximately $45 billion in direct written premiums in 2019 in the U.S. Historically, Atlas concentrated on public auto which is a smaller subset of that total market (estimated at $2 - $3 billion), and we believe that our businessinfrastructure is well positionedwell-positioned to scale to support proportionate market share of approximately 20% in allof that subset. In light of the marketschallenges faced in which2019 coupled with the subsequent events disclosed in this report, we operate. As a resulthave reduced the size of our shift to a Managing General Agency (“MGA”) focused strategy, our business model is dependent on support from unrelated insurance underwriting partners. Our business can also operate efficiently at smaller scale.volume and staffing (see Item 1, 2020 Developments). Commercial automobile insurance is a cyclical business, and our priority will always be to increase or decrease market share based on an expected underwritingability to generate profitable results rather than focusing solely on top line revenue. We plan to continue to evaluate, and where beneficial, deploy, new technologies and analytics to maximize efficiency and scalability. Our goal is to recapture historically profitable business that ceased being written or was lost in 2019 and grow incrementally through our managing agency operations of AGMI. We are also exploring potential opportunities to expand the focus of our operations beyond traditional public auto into incremental subsets of commercial auto where our operational strengths and capabilities can create value.
Experienced management team.
We have a talented and experienced management team who have decades of experience in the property and casualty (“P&C”) insurance industry. Our senior management team has worked in the P&C industry for an average of more than 25 years and with the Insurance Subsidiaries, directly or indirectly, for an average of 15 years. We believe our team has the necessary experience and commitment to address current challenges and produce improved results going forward.
Strategic Focus
|
| |
| Vision | To always be the preferred specialty insurance business in any geographic areas where our value proposition delivers benefit to all stakeholders. |
| Mission | To develop and deliver superior specialty insurance products and services to meet our customers’ needs with a focus on innovation and the effective use of technology and analytics to deliver consistent operating profit for the insurance businesses we own. |
We seek to achieve our vision and mission through the design, sophisticated underwritingpricing and efficient delivery of specialty insurance products and services. Our understanding of the markets we serve will remain current through interaction with our retail producers. Analysis of the substantial data available through our operating companies will drive product and pricing decisions. We intend towill focus on our key strengths and leverage our geographic footprint, products and services only to the extent that these activities support our vision and mission. We will target niche markets that are expected to support adequate pricing and will be best able to adapt to changing market needs ahead of our competitors due to our scale,scaleable platform, business partnerships and strategic commitment.
Outlook
Through infrastructure re-organization, planned dispositions, and by placing certain lines offocusing on AGMI as our primary business, into run-off, our Insurance Subsidiarieswe have streamlined operations to focus on the lines of business we believe will leverage our core competencies and produce favorable underwriting resultspositive income going forward. WeGlobal Liberty’s business continues to be focused around New York based accounts, and the operation was considered discontinued operations in the fourth quarter of 2019. As a result of management no longer having control of the ASI Pool Companies, they have been deconsolidated from this report. AGMI began transitioning business to external risk taking partners, and we believe we have aligned the organization’s infrastructure cost base to our expected revenue stream. Westream and integrated the core functions of our insurance businesses into a common, best practice based, operating platform. Management believes that, over time, our insurance businesses are well-positioned to support proportionate marketcapture share in our current target markets and potentially expand into other specialty lines of approximately 20% in all of the markets in which we operate with better than industry level profitability.commercial automobile insurance as a managing agency. Based on current market conditions, coupledsteps taken to wind down or sell historically challenged aspects of our business combined with underwriting and claim related initiatives implemented in recent years,the strategic change focusing on our managing agency business, we believe future underwriting results shouldwill improve. Our insurance businesses have a long heritage with respect to our core lines of business and will benefit from the efficient operating infrastructure currently in place. Through its Insurance Subsidiaries, external risk-taking partners, and AGMI, Atlas actively wrote business in 42 states and the District of Columbia during 2018.2019.
We believe that the most significant opportunities going forward are:
(i) continually managing our independent retail agency and customer relationships,
(ii) increasing or decreasing premium volume in business segments to optimize profit at AGMI and geographic markets based on underwriting results and anticipated future outcomes and our risk-taking partners,
(iii) evaluating and implementing strategic activities to optimize the value of our infrastructure and experience. Primary potential risks related to these activities include: (a) the impact of prior year reserve strengthening onregulatory actions related to our Insurance Subsidiaries, (b) not being able to achieve the expected support from reinsurancerisk-taking or distribution partners, and (c) insurance market conditions becoming or remaining “soft” for a sustained period of time.time, (d) marginally higher fixed costs in the near term related to the current scale of operations, and (e) the continued impact of COVID-19 on the economy and on the markets we serve, and
(iv) pursuing opportunities to leverage the proprietary optOnTM insuretech platform developed by Atlas for gig-economy drivers.
We intend to identify and prioritize market expansion opportunities based on strategic priorities, the comparative strength of our value proposition relative to competitors, the market opportunity and the legal and regulatory environment.environments.
We intend to improve profitability by undertaking the following:
Focus on most profitable business.
In the past, we have identified and exited segments that are under-performing on our overall book of business. We areAs a managing agent, we remain committed to continuing to make this a high priority with a focus on geographic, line of business level and competitive analysis. This will be important to attract and maintain external risk-taking parters and to optimize revenue and margin for AGMI over time. As the market environment evolves, our objective is to react as quickly as possible to address under performing segments and focus on more profitable ones.
Maintain legacy distribution relationships.
We continue to build upon relationships with independent retail agents that have been our Insurance Subsidiaries’ distribution partners for several years. These partners have been contracted with AGMI for a number of years, and we cultivate these relationships. We develop and maintain strategic distribution relationships with a relatively small number ofmore than three hundred independent retail agents with substantial market presence in each state in which we currently operate. We expect to continue to increase the distribution of our core products in the states where we are actively writing insurance.
Expand our market presence.presence using our existing assets.
We are committed to diversification by leveraging our experience, historical data and market research to expand our business into previously untapped markets to the extent incremental markets meet our criteria. A significant portion of the Company’s business in recent years relates to the expansion and evolution of TNC operators. We will continueplan to seek opportunities to expand into additional states or product lines where we are licensed, but not currently active, to the extent that our market expansion criteria is met in a given state or business line. Such potential expansion is also subjectline and where our risk-taking partners are committed to availability of capital or reinsuranceprovide support. In the alternative, we will endeavor to quickly adjustWe believe that both our pricing and underwriting or reduce“traditional” managing agency infrastructure as well as our exposure to potentially under-performing products.proprietary digital insuretech platform, optOnTM are valuable assets which can be scaled significantly over time.
Develop and maintain new or existing strategic partnerships.
We plan to continue to leverage our relationships with reinsurersexisting and other existing or new business partners. The combination of Insurance Subsidiaries and our wholly owned managing general agency provideOur objective is to build a diversified platform with flexibility in terms of both capital support as well as partnership structures and revenue streams. We look for opportunities to leverage the investments we have made in the areas of technology and analytics in pursuit of this objective. As a managing general agency, maintaining contractual relationships with risk-taking partners is necessary in order for AGMI to issue insurance policies. In 2019, we established a relationship with one such carrier for our paratransit business and established another complementary relationship for taxi/livery/limo/TNC business (see Item 1, 2020 Developments).
Market
Our primary target market is made up of small to mid-size taxi, limousine, other livery, including TNC drivers/operators, and non-emergency para-transit operators. The “light” commercial automobile policies we underwrite provide coverage for lightweight commercial vehicles typically with the minimum limits prescribed by statute, municipal or other regulatory requirements. The majority of our policyholders are individual owners or small fleet operators. In certain jurisdictions like Illinois, Louisiana, Nevada and New York, we have also been successful working with larger operators who retain a meaningful amount of their own risk of loss through higher retentions, self-insurance or self-funded captive insurance entity arrangements. In these cases, we provide support in the areas of day-to-day policy administration and claims handling consistent with the value proposition we offer to all of our insureds, generally on a fee for service basis. We may also provide excess coverage above the levels of risk retained by the insureds where a better than average loss ratio is expected. Through these arrangements, we believe we are able to effectively utilize the significant specialized operating infrastructure we maintain to generate revenue from business segments that may otherwise be more price sensitive.are often highly competitive.
The “light” commercial automobile sector is a subset of the broader commercial automobile insurance industry segment, which over the long term has been historically profitable. In more recent years, the commercial automobile insurance industry has seen profitability pressure. Data compiled by S&P Global also indicates that in 20182019 the total market for commercial automobile liability insurance was approximately $40.4$45.4 billion. The size of the commercial automobile insurance market can be affected significantly by many factors, such as the underwriting capacity and underwriting criteria of automobile insurance carriers and general economic conditions. Historically, the commercial automobile insurance market has been characterized by periods of excess underwriting capacity and increased price competition (“Soft Market”) followed by periods of reduced underwriting capacity and higher premium rates.rates (“Hard Market”). Commercial auto insurance is currently in what has been a prolonged Hard Market with the U.S. insurance industry reporting approximately 35 sequential quarters of rate increases (source: U.S. Counsel of Insurance Agents and Brokers).
We believe thatSubsequent to year end 2019, COVID-19 dramatically impacted the addressable market, and at the time of filing it is difficult to estimate the near and longer-term effect on market size and potential revenue.
Historically, operators of “light” commercial automobiles may be less likely than other business segments within the commercial automobile insurance market to take vehicles out of service, as their businesses and business reputations rely heavily on availability. This may be different post COVID-19. Our target market has changed in recent years as a result of TNC and other trends related
to mobility. The significant expansion of TNC has resulted in a reduction in taxi vehicles available to insure; however, it has increased the number of livery operators. Market research also suggests that the combined addressable markets between traditional taxi, livery and TNC companies expanded duringin recent years, prior to COVID-19. At the time of this period.report, the impact of COVID-19 on our customers appears to have resulted in an approximate reduction of trips and vehicles in operation in the range of 30% to as much as 90% since the end of 2019. This directly impacts our revenue and the ability to generate new business.
Currently, we distribute our products only in the U.S. ThroughDuring 2019, most of our business was written by AGMI through our Insurance Subsidiaries, we arewhich were licensed to write P&C insurance in 49 states plus the District of Columbia. As noted previously certain state licenses held by the ASI Pool Companies were restricted, suspended or revoked. We also began to transition certain lines of business to an external risk-taking partner. The following table reflects, in percentages, the principal geographic distribution of gross premiums written in 2018.2019. No other jurisdiction accounted for more than 5%. AGMI is also licensedmaintains state licenses on a nationwide basis.basis, as required by law or regulation.
|
| | |
| Distribution of Gross Premiums Written by Jurisdiction |
| New York | 38.438.5 | % |
| California | 16.220.6 |
|
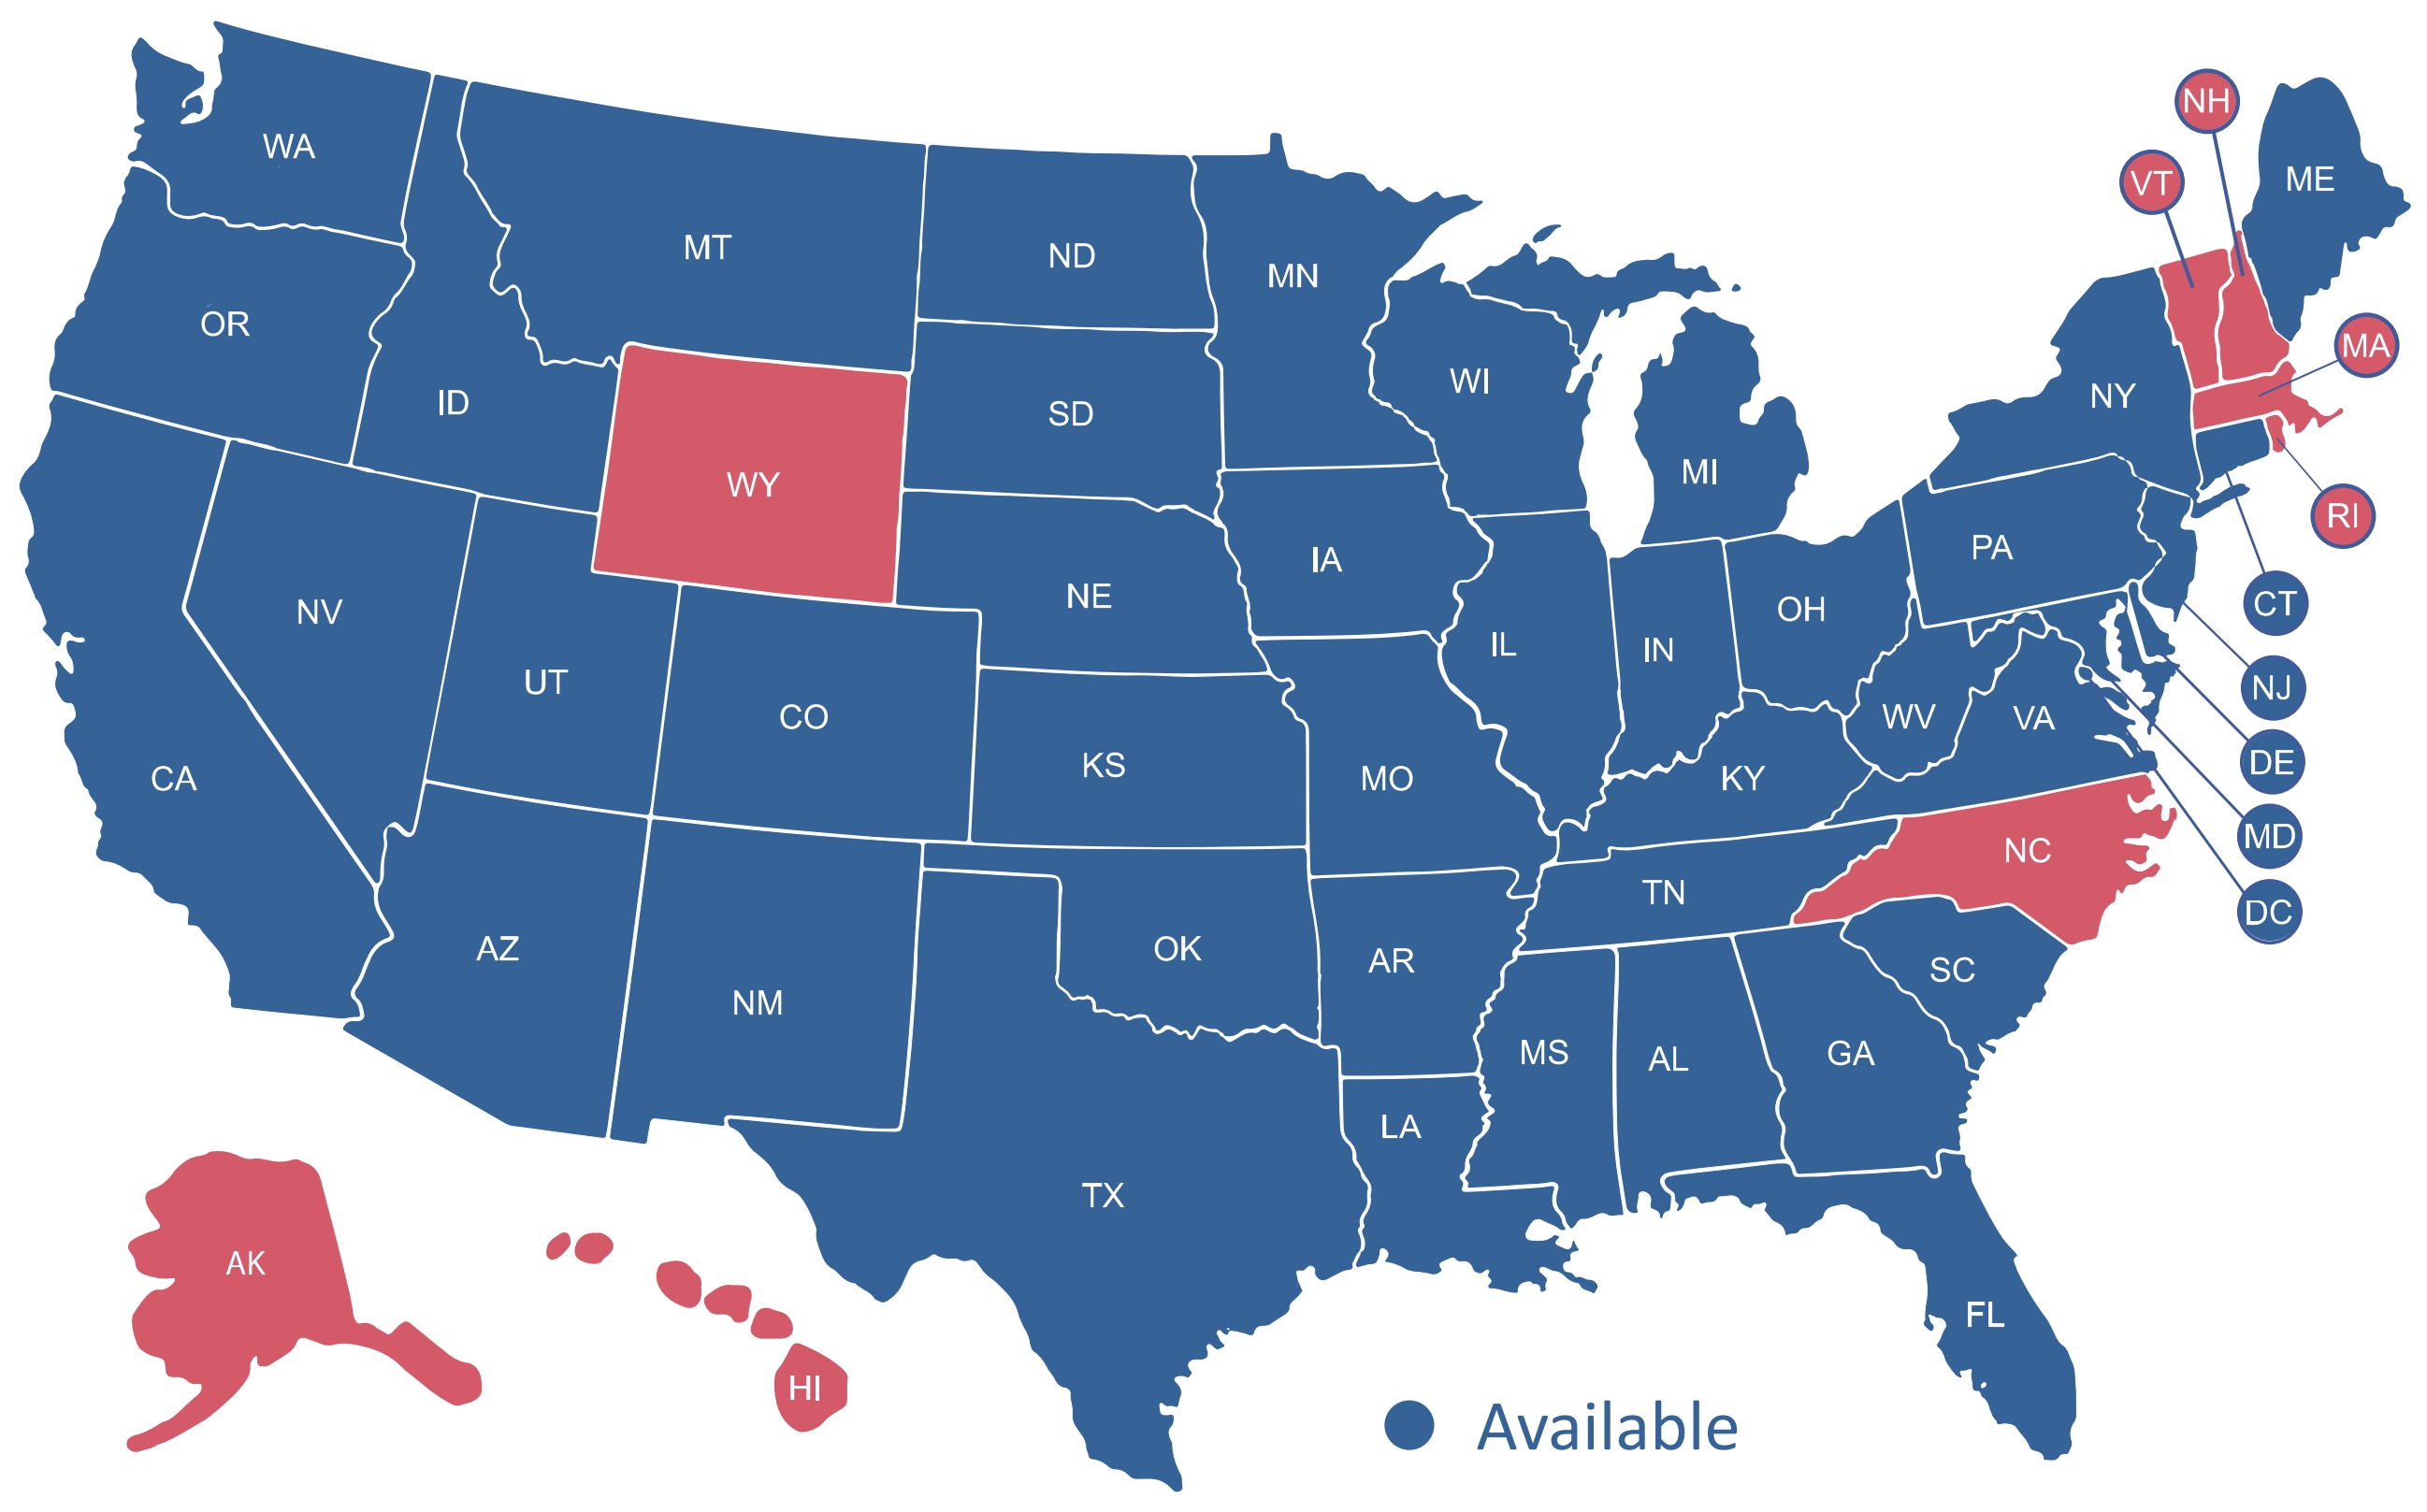
The diagram below outlines the states where we are focused on actively writing new insurance policies and where we believe the comparative strength of our value proposition, the market opportunity, and the legal and regulatory environment will provide favorable results going forward (the blue states in the below diagram).
Agency Relationships
Independent retail agents are recruited by us directly utilizing marketing efforts targeting the specialty niche upon which we focus. Interested agents are evaluated based on their experience, expertise and ethical dealing. Typically,Historically, our Company enters into distribution relationships with approximately one out of every ten agents seeking an agency contract. Our independent agent partners contract with AGMI through which business can be written with our Insurance Subsidiaries or strategic partners.risk-taking insurance companies with whom we have entered into underwriting agreements. We do not provide exclusive territories to our independent retail agents, nor do we expect to be their only insurance market. We are generally interested in acting as one of a relatively small number of insurance partners with whom our independent retail agents place business and are also careful to try not to oversaturate the distribution channel in any given geographic market. This helps to ensure that we are ableour ability to receive the maximum number of submissions for underwriting evaluation without unnecessary downstream pressure from agents to write business that does not fit our underwriting model.
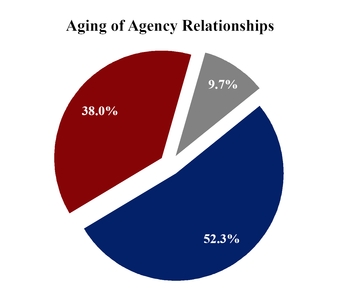
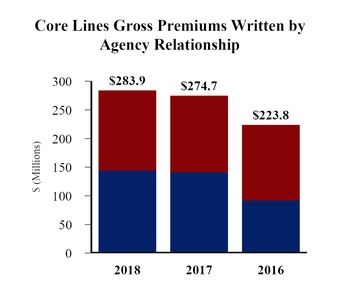
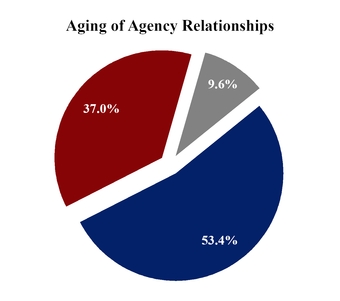
Agents receive commission as a percentage of premiums (generally 10%) as their primary compensation from us. Larger agents may also be eligible for profit sharing based on the growth and underwriting profitability related to their book of business with us. The quality of business presented and written by each independent retail agent is evaluated regularly by our underwriters and is also reviewed quarterly by senior management. Key metrics for evaluation include overall accuracy and adequacy of underwriting information, performance relative to agreed commitments, support with respect to claims presented by their customersunder insurance policies we issue (as applicable) and overall underwriting profitability of the agent’s book of business. The re-estimation of claims related reserves impacts the evaluation of underwriting results and profit sharing commissions. While we rely on our independent retail agents for distribution and customer support, underwriting and claims handling responsibilities are retained by us.AGMI and the risk-taking insurance companies which whom we have contractual agreements. As shown in the charts below, many of our agents have had direct relationships with our Insurance SubsidiariesCompany for a number of years.

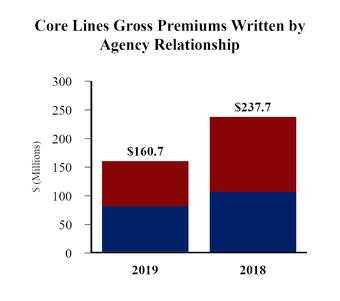
Our agents are appointed with AGMI and are able to access programs we manage with multiple risk-taking partners. The premium reduction seen in 2019 was a result of the elimination of less profitable business coupled with the impact of the ASI Pool Companies being deconsolidated and Global Liberty being classified as discontinued operations. We maintain agreements with more than 300 active independent producers in the context of our current strategic direction and believe that AGMI’s value proposition and the programs we launched in 2019 and 2020 remain important to this distribution channel.
Seasonality
Our P&C insurance business is seasonal in nature. Our ability to generate written premiumcommission income is also impacted by the timing of policy effective periods in the states in which we operate whileand products provided by our net premiums earned generally follow a relatively smooth trend from quarter to quarter. Changes in the amount of quota share or other reinsurance that we may use will also impact net earned premiums period over period. Also, our gross premiums written are impacted by certain common renewal dates in larger metropolitan markets for the light commercial risks that represent our core lines of business.business partners. For example, January 1st and March 1st are common taxi cab renewal dates in Illinois and New York, respectively. Our New York “excess taxi program” has an annual renewal date in the third quarter. Net underwriting income is driven mainly by the timing and nature of claims, coupled with actuarial estimation of future claim liabilities, which can vary widely.
Competition
The insurance industry is competitive in allgeneral. In markets in which AGMI operates, competitors enter and exit from time-to-time, and while we endeavor to monitor and understand the Insurance Subsidiaries operate.impact this has on our business, even a small number of market participants can impact our ability to capture market share and generate revenue. Our Company strives to deliver a strong value proposition to our agents, policyholders and business partners with the goal of maintaining a comparative advantage in various market conditions. We strive to leverage expertise, technology and analytics to generate better than industry underwriting profit.profit for the risk-taking partners with whom AGMI contracts. While historic results have been challenging, we have implemented rate changes, analytics based underwriting and claim processesas well as other process changes and shifted our business mix significantly. We believe these activities are important to produce more profitable business,results, especially in a changing environment.
Our Company competes on a number of factors, such as brand and distribution strength, pricing, agency relationships, policy support, claimsspecialized service and market reputation. In our core commercial automobile lines, the primary offerings are policies at the minimum prescribed limits in each state, as established by statutory, municipal and other regulations. We believe our Company differentiates itself from many larger companies competing for this specialty business by exclusively focusing on these lines of insurance. We believe our exclusive focus results in the deployment of underwriting and claimsinsurance professionals who are more familiar with issues common in specialty insurance businesses and provides our customers with better service. We leverage machine learning based predictive analytics and other technologies, such as telematics, to further differentiate ourselves from our competitors. AGMI has been able to successfully establish strategic relationships with risk-taking partners based on these attributes which we believe differentiate our operations from others.
Our competitors generally fall into two categories. The first is made up of large generalist insurers who often sell their products to our niche through intermediaries, such as managing general agents or wholesalers. The second consists primarily of smaller local insurance companies. These smaller companies may focus primarily on one or more of our niche markets. Or, as is typical in the majority of geographic areas where we compete, they have a broader focus, often writing a significant amount of non-standard lines of business. As a managing general agency leveraging the assets, experience and infrastructure developed over many years in our specialized business, we believe AGMI can offer a comparative advantage relative to both of these categories of competitors.
Regulation
We are subject to extensive regulation, particularly at the state level. The method, extent and substance of such regulation varies by state, but generally has its source in statutes and regulations that establish standards and requirements for conducting the business of insurance and that delegate regulatory authority to state insurance regulatory agencies. Insurance companies can also be subject to so-called “desk drawer rules” of state insurance regulators, which are regulatory rules or best practices that have not been codified or formally adopted through regulatory proceedings. In general, such regulation is intended for the protection of those who purchase or use insurance products issued by our Insurance Subsidiaries,managing general agency not the holders of securities issued by us.our security holders. These laws and regulations have a significant impact on our business and relate to a wide variety of matters including accounting methods, agent and company licensure, claims procedures, corporate governance, examinations, investing practices, policy forms, pricing, trade practices, reserve estimation and underwriting standards.
In recent years, the state insurance regulatory framework has come under increased federal scrutiny. Most recently, pursuant to the Dodd-Frank Regulatory Reform Act of 2010, the Federal Insurance Office was formed for the purpose of, among other things, examining and evaluating the effectiveness of the current insurance and reinsurance regulatory framework. In addition, state legislators and insurance regulators continue to examine the appropriate nature and scope of state insurance regulation.
Many state laws require insurers to file insurance policy forms and/or insurance premium rates and underwriting rules with state insurance regulators. In some states, such rates, forms and/or rules must be approved prior to use. While these requirements vary from state to state, generally speaking, regulators review premium rates to ensure they are not excessive, inadequate or unfairly discriminatory. This could impact the timing and ability of AGMI’s implementation of programs and/or program changes with risk-taking partners.
As a result, the speed with which an insurer can change prices in response to competition or increased costs depends, in part, on whether the premium rate laws and regulations (i) require prior approval of the premium rates to be charged, (ii) permit the insurer to file and use the forms, rates and rules immediately, subject to further review, or (iii) permit the insurer to immediately use the forms, rates and/or rules and to subsequently file them with the regulator. When state laws and regulations significantly restrict both underwriting and pricing, it can become more difficult for an insurer to make adjustments quickly in response to changes, which could affect profitability.their profitability and impact programs managed by AGMI. Historical results and actuarial work related thereto are often required to support rate changes and may limit the magnitude of such changes in a given period.
Insurance companiesIn many states, managing general agencies are required to report their financial conditionmaintain specific licenses. Other corporate and results of operationsindividual agency licenses are also required in accordanceconnection with statutory accounting principles prescribed or permitted by state insurance laws and regulations and the National Association of Insurance Commissioners (“NAIC”). As a result, industry dataour go-forward business strategy. AGMI is available that enables comparisons between insurance companies, including competitors who are not subjectcurrently licensed, as required, in jurisdictions where we intend to the requirement to prepare financial statements in conformity with accounting principles generally accepted in the United States of America (“U.S. GAAP”). We frequently use industry publications containing statutory financial information to assess our competitive position. State insurance laws and regulations also prescribe the form and content of statutory financial statements, require the performance of periodic financial examinations of insurers, establish standards for the types and amounts of investments insurers may hold and require minimum capital and surplus levels. Additional requirements include risk-based capital (“RBC”) rules, thresholds intended to enable state insurance regulators to assess the level of risk inherent in an insurance company’sgenerate business and consider itemsmaintaining such as asset risk, credit risk, underwriting risk and otherlicenses is critical to our business risks relevant to its
operations. The NAIC RBC formula generates the regulatory minimum amount of capital that a company is required to maintain to avoid regulatory action. There are four levels of action that a company can trigger under the formula: company action, regulatory action, authorized control and mandatory control levels. Each RBC level requires some particular action on the part of the regulator, the company, or both. For example, an insurer that breaches the Company Action Level must produce a plan to restore its RBC levels. As of December 31, 2018, the total adjusted capital of three of our Insurance Subsidiaries exceeded the minimum levels required under RBC requirements, while one subsidiary breached the Company Action Level. We are working with the appropriate regulators to address this RBC breach. We do not expect that this situation will impede our ability to execute on strategic plans.model.
It is difficult to predict what specific measures at the state or federal level will be adopted or what effect any such measures would have on us, AGMI, or our Insurance Subsidiaries.subsidiaries. See “Risk Factors - RisksRisk Related to 20192020 Developments - Regulatory Developments” for certain developments with respect to the Insurance Subsidiaries subsequent to December 31, 2018.2019.
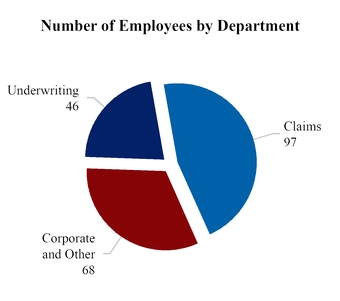
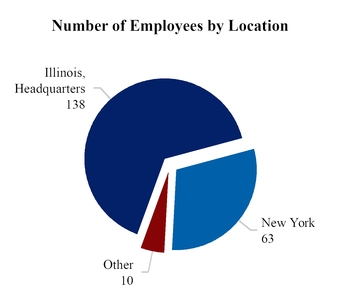
Employees
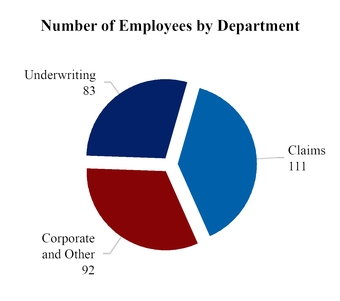
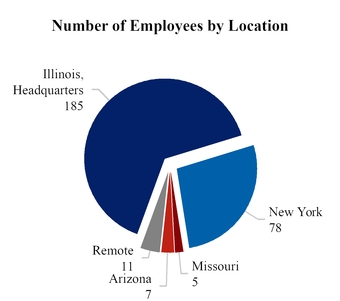
As of December 31, 2018,2019, we had 286211 full-time employees working within three main departments: Underwriting, Claims, and Corporate and Other. The Corporate and Other category includes executive, information technology, finance, facilities management and human resources. The Claims category includes in-house legal. As noted in other areas of this document, headcount reductions were implemented following COVID-19 in 2020 (see Item 1, 2020 Developments). Staffing is currently aligned consistent with our strategic commitment to a managing general agency model while continuing to utilize performance and productivity metrics developed over a number of years. We are committed to maintaining the appropriate level of staffing to deliver a strong value proposition to our business partners and customers while endeavoring to optimize EBITDA from AGMI.
Available Information About Atlas
The address of our registered office is Cricket Square, Hutchins Drive, PO Box 2681, Grand Cayman, KY1-1111, Cayman Islands. Our operating headquarters are located at 953 American Lane, 3rd Floor, Schaumburg, Illinois 60173, USA. We maintain a website at http://www.atlas-fin.com. Information on our website or any other website does not constitute a part of this Annual Report on Form 10-K. Atlas files with the Securities and Exchange Commission (“SEC”) and makes available free of charge on its website the Annual Report on Form 10-K, Quarterly Reports on Form10-Q, Current Reports on Form 8-K, proxy statements, and amendments to those reports filed or furnished pursuant to Section 13(a) or 15(d) of the Exchange Act (15 U.S.C. 78m(a) or 78o(d)) as soon as reasonably practicable after those reports are electronically filed with, or furnished to, the SEC. To access these filings, go to the CompanyCompany’s website, using the “Investor Relations” heading. These reports are also available on the SEC’s website at http://www.sec.gov.
20192020 Developments
As previously disclosed, since December 31, 2018, the Company was unable to timely file this Annual Report on Form 10-K for the fiscal year ended December 31, 20182019 and its Quarterly Reports on Form 10-Q for the periods ended March 31, 2020, June 30, 2020, and September 30, 20192020 due to delays in the year end audit process. As a result, the Company received a number of delinquency notices from Nasdaq related to these filings as well as other matters. On August 31, 2020, the Company filed a Current Report on Form 8-K advising that Nasdaq grantedwould suspend trading in the Company’s requestsecurities effective at the open of business on September 2, 2020. Nasdaq filed a Form 25 Notification of Delisting with the SEC on October 27, 2020 notifying the SEC of Nasdaq’s determination to moveremove the Company’s common shares from listing on Nasdaq under Section 12(b) of the Exchange Act. The formal delisting of the Company’s common shares from Nasdaq Global Market tobecame effective on November 6, 2020, ten days after the Form 25 was filed. In connection with the suspension of trading on The Nasdaq Capital Market, and granted the Company an extension to regain compliance with its listing obligations. The Company’s ordinarycommon shares continuebegan to trade on the Nasdaq Capital Market, whileOTC Markets system effective with the Company’s 6.625% Senior Unsecured Notes due 2022 movedopen of the markets on September 2, 2020.
On May 1, 2020, American Acquisition entered into a Paycheck Protection Program Promissory Note (the "PPP Note") with respect to a loan of $4,600,500 (the "PPP Loan") from Fifth Third Bank, National Association. The PPP Loan was obtained pursuant to the OTC Pink SheetsPaycheck Protection Program (the "PPP") of the Coronavirus Aid, Relief, and Economic Security Act (the "CARES Act") administered by the U.S. Small Business Administration ("SBA"). The PPP Loan matures on October 17, 2019. There canMay 1, 2022 and bears interest at a rate of 1.00% per annum. The PPP Loan is payable in 18 equal monthly payments of $257,611.48 which was to commence December 1, 2020. The PPP Loan may be prepaid at any time prior to maturity with no assurance thatprepayment penalties. American Acquisition has applied for loan forgiveness pursuant to the Company will be able to regain compliance with Nasdaq listing requirements.terms of the PPP as certain of the criteria have been met and is awaiting the results of the forgiveness decision.
On April 29, 2019, RSM US, LLP ("RSM") was dismissed as the Corporation’s independent registered public accounting firm. At the time RSM was dismissed, the Corporation had not yet engaged a successor independent registered public accounting firm. On October 31, 2019, Baker Tilly Virchow Krause, LLP (“Baker Tilly”) was engaged as the Company’s independent registered public accounting firm to audit the Company’s financial statements commencing with the fiscal year ended December 31, 2018.
Throughout 2019, the Company has been exploring strategic alternatives, including, but not limited to, further strengthening its processes, reviewing its capital allocationMay 8, 2020, American Acquisition and opportunities, a potential sale of the Company or certain assets, and balance sheet strengthening options with the goal of facilitating shareholder value generation. Atlas concluded that the utilization of its wholly owned MGA operation to work with strategic external insurance and reinsurance partners will enable the Company to leverage its focus, experience and infrastructure to create value for stakeholders. A definitive agreement was executed effective June 10, 2019 between Atlas and American Financial Group, Inc. (NYSE: AFG), under which Atlas will act as an underwriting manager for AFG’s National Interstate (“NATL”) subsidiary and transition new and renewal paratransit business to NATL paper for this book of business. The Company is working on additional arrangements with the objective of establishing MGA relationships in connection with the Company’s other lines of business as well. The Company agreed that should it choose to sell its MGA operations, 49% of the proceeds from any future sale of AGMI would be provided to the ASI Pool Companies to facilitate the rehabilitation process. There can be no assurance that any portion of the proceeds allocated to the ASI Pool Companies would be available for distribution to the Company.
During 2019, the Illinois Department of Insurance (the “Department”) placed all three of the ASI Pool Companies (after Gateway was redomesticated in Illinois) into rehabilitation with the Director (as defined below) as statutory liquidator of the Department as the statutory rehabilitator. While in rehabilitation, the operations of such insurance subsidiaries will be overseen by the statutory rehabilitator although Atlas continues to maintain its legal ownership of theGateway signed a stock of the ASI Pool Companies. Management’s overriding strategic plan continues to include a transition of business from these insurance companies to alternative markets within a reasonable period of time utilizing the existing platform of the MGA to work with strategic external insurance and reinsurance partners.
Effective August 15, 2019, no new business was written by the ASI Pool Companies, and only New York area new business was written by Global Liberty, which is focusing its resources on New York area business to leverage the subsidiary’s heritage in this large and specific market. The ASI Pool Companies and Global Liberty continued to write renewal business that met their underwriting standards during 2019. Non-renewals related to ASI Pool Companies’ insurance policies began towards the end of 2019.
On January 22, 2020, the Company announced a non-binding letter of intentpurchase agreement with Buckle Corp. (“Buckle”), a technology-driven financial services company, to purchase the stock of Gateway and Gateway’s corporate charter and state licenses from its statutory rehabilitator in a collaborative transaction as an important next step in Atlas’ indirect subsidiarystrategic plan. Buckle’s core business focuses on part-time transportation network company (“TNC”) drivers and is complementary to Atlas’ focus on full-time drivers in the Livery, Paratransit, Taxi and TNC segments.
On June 10, 2020, the required court orders were entered to place Gateway in liquidation, with the Director of Insurance of the State of Illinois (the “Director”) acting as the statutory liquidator. This was necessary to facilitate the above described transaction with Buckle. The the sale of stock, charter and state licenses of Gateway to Buckle closed effective June 16, 2020. The Company and Buckle entered into an underwriting agreement whereby Gateway under Buckle’s ownership became a risk-taking partner for AGMI. The Company and Buckle also entered into a professional services agreement in furtherance of related strategic activities.
Subsequent to the Gateway transaction, Buckle proposed terms to acquire the stock, charter and state licenses of American Country and American Service. In connection therewith, a required court order was entered on August 11, 2020 to place American Country and American Service in liquidation, with the Director acting as the statutory liquidator. American Acquisition and the Director as statutory liquidator of American County and American Service signed a stock purchase agreement on November 2, 2020. The closing of this pending transaction is subject to regulatory approval and other conditions.
In July 2020, the Company announced that AGMI’s underwriting agreement with National Interstate Insurance Company (“Gateway”National Interstate”), for paratransit business was extended and its corporate charter and forty-seven (47) state insurance licenses as well as state statutory deposits, subject to regulatory and other necessary approvals, for $4.7 million plus the value of all purchased deposits, such amount to be paidexpanded. Further to the Rehabilitatorextension and expansion, the Company and National Interstate executed a renewal rights agreement with respect to paratransit accounts with eight or more vehicles (“Large Paratransit Accounts”). Pursuant to this agreement, the Company and National Interstate will work together to transition the handling of Large Paratransit Accounts to NATL. The Company received $2.9 million as consideration from National Interstate as consideration for this transaction. Under the benefitpreviously announced expanded agreement AGMI will manage owner operators and fleets with seven or less vehicles (“Small Paratransit Accounts”) until at least August 2021. If the Small Paratransit Account program is not extended further, NATL continues to retain the option to purchase renewal rights on this segment at the expiration of the rehabilitation estate of Gateway, with a tentative closing date in March of 2020. The Company anticipates that Buckle will engageagreement period. Under the MGA and certain other subsidiariesterms of the agreements, the Company to provide services to Buckle and that Buckle will lease space atnot compete with NATL for Large Paratransit Accounts for a period of three years following the Company’s headquarters and its Melville, NY office.
The transaction will be subject to court approval and a bid process established byLarge Paratransit Account renewal rights transaction. Other previously disclosed material terms of the Rehabilitator and approved byagreements between the court, and there can be no assurance that the transaction will be consummated on the terms described herein or at all.parties remains unchanged.
The Company’s numerous Current Reports on Form 8-K and press releases since December 31, 20182019 provide more detailed disclosures regarding the above events.
In light of the impact of COVID-19 and other factors impacting near term business activity, the Company implemented meaningful expense reduction initiatives in 2020, including reduction in employee headcount which will be reflected in subsequent financial statements.
Item 1A. Risk Factors
You should read the following risk factors carefully in connection with evaluating our business and the forward-looking information contained in this Annual Report on Form 10-K. Any of the following risks could materially and adversely affect our business, operating results, financial condition and the actual outcome of matters as to which forward-looking statements are made in this Annual Report on Form 10-K. While we believe we have identified and discussed below the key risk factors affecting our business, there may be additional risks and uncertainties that are not presently known or that are not currently believed to be significant that may adversely affect our business, operating results or financial condition in the future.
Risks Related to 20192020 Developments
Continued delays in the filing of our periodic reports with the SEC could result in theThe delisting of our common stock which would materially and adversely affect our stock price, financial condition and/or results of operations.
As a result of the need for additional time to complete our year-end audit process for the fiscal year ended December 31, 2018,2019, we were unable to file this Annual Report on Form 10-K with the SEC on a timely basis. We also have yet to file our Quarterly Reports on Form 10-Q for the quarters ended March 31, 2019,2020, June 30, 20192020, and September 30, 2019,2020, as we could not file suchthe Quarterly ReportsReport until this Annual Report on Form 10-K was filed. As a result, we remain non-compliant with Nasdaq Listing Rule 5250(c)(1) requiring the timely filing of periodic reports, which may resultdisclosed in the delisting2020 Developments section of our common stock should we fail to file such reports within a time-frame acceptable to Nasdaq. In addition, the Company is not in compliance with Nasdaq Listing Rule 5450(a)(1), because the closing bid price of our common stock for the last 30 consecutive business days was below the minimum bid price of $1 per share, which may result in the delisting of our common stock should we fail to regain compliance by June 2, 2020 (the deadline set forth in the extension granted by Nasdaq). To regain compliance,this report, the Company’s common stock must have a closing bid price of at least $1 per share for a minimum of ten consecutive business days duringwas suspended from the compliance period, thus the Company may need to effect a reverse stock split to regain compliance. The Company is also not in compliance with Nasdaq Listing Rule 5620(a) as a result of the Company’s failure to hold an annual general meeting of shareholders during 2019.NASDAQ and was formally delisted on November 6, 2020.
It is the Company’s intent to hold an annual general meeting of shareholders in 2020 and to fully regain compliance with all applicable Nasdaq listing standards as soon as practicable, although there can be no assurance that itDelisting will be able to do so. Delisting would likely have a material adverse effect on us by, among other things, reducing:
The liquidity of our common stock;
The market price of our common stock;
The number of institutional and other investors that will consider investing in our common stock;
The number of market makers in our common stock;
The availability of information concerning the trading prices and volume of our common stock;
The number of broker-dealers willing to execute trades in shares of our common stock;
Our ability to access the public markets to raise debt or equity capital;
Our ability to use our equity as consideration in any merger transaction; and
The effectiveness of equity-based compensation plans for our employees used to attract and retain individuals important to our operations.
Regulatory Developments
As previously disclosed, during 2019, the ASI Pool Companies were subject to an agreed order of rehabilitation with the Illinois insurance regulator following discussions of reserve levels, andlevels. As disclosed in the operations2020 Developments section of this report, the ASI Pool Companies are currently overseen bywere placed in liquidation during 2020. During the statutory rehabilitator. In addition, no new business is being written byfourth quarter of 2019, Global Liberty was classified as discontinued operations. Therefore, the ASI Pool Companies, certain of their state insurance licenses have been revoked, and other states have taken or may take action to suspend or terminate the licenses of the Insurance Companies. Therefore, thefuture performance and financial results of the Company are more reliant on the results of AGMI. There are cost sharingAGMI and other arrangementsstrategic initiatives. The Company’s objective continues to be working with insurance regulators to achieve the best outcome for all stakeholders in place between AGMI andconnection with the Insurance Subsidiaries related to support for the rehabilitationresidual value of the ASI Pool Companies, which are subjectCompanies; however, the value of the stock of these subsidiaries to regulatory approvalthe Company is uncertain and couldmay be restricted in the future.zero. In addition, the Company agreed that should it choose to sell its MGA operations, 49% of the proceeds from any future sale of AGMI would be provided to the estates of the ASI Pool Companies to facilitateCompanies. While the rehabilitation process. ThereCompany maintains the final claim against the estate as 100% indirect shareholder, there can be no assurance that any portion of the proceeds allocated to the ASI Pool Companies or their estate(s) would be available for distribution to the Company.
Risks Relating to our Business Generally
An economic downturn, as well as unstable economic conditions in the states in which we operate, could adversely affect our results of operations and financial condition.
A decline in economic activity could adversely impact us in future years as a result of reductions in the amount of insurance coverage that our clients purchase due to reductions in their businesses. Any such reduction or decline (whether caused by an overall economic decline or declines in certain industries) could adversely impact our revenues. Some of our clients may experience liquidity problems or other financial difficulties in the event of a prolonged deterioration in the economy, which could have an adverse effect on our results of operations and financial condition. If our clients become financially less stable, enter bankruptcy, liquidate their operations or consolidate, our revenues and collectibility of receivables could be adversely affected.
Volatility or declines in premiums or other adverse trends in the insurance industry may seriously undermine our profitability.
We derive much of our revenue from commissions and fees from our managing general agency. While we have a role in connection with pricing-related activities, we do not ultimately determine the insurance premiums on which our commissions are generally based as rate levels require input and approval from both our risk-taking partners as well as state insurance regulators. Moreover, insurance premiums are cyclical in nature and may vary widely based on market conditions. Because of market cycles for insurance product pricing, which we cannot predict or control, our revenues and profitability can be volatile or remain depressed for significant periods of time.
As underwriting enterprises outsource the production of premium revenue to non-affiliated agents such as us, those companies may seek to further minimize their expenses by reducing the commission rates payable to insurance agents or brokers. The reduction of these commission rates, along with general volatility and/or declines in premiums, may significantly affect our profitability. Because we do not determine the timing or extent of premium pricing changes, it is difficult to forecast our commission revenues precisely, including whether they will significantly decline. As a result, we may have to adjust our budgets for future acquisitions, capital expenditures, dividend payments, debt repayments and other expenditures to account for unexpected changes in revenues, and any decreases in premium rates may adversely affect the results of our operations.
In addition, there have been and may be various trends in the insurance industry toward alternative insurance markets, including, among other things, greater levels of self-insurance, captives, rent-a-captives, risk retention groups and non-insurance capital markets-based solutions to traditional insurance. While historically we have been able to participate in certain of these activities on behalf of our clients and obtain fee revenue for such services, there can be no assurance that we will realize revenues and profitability as favorable as those realized from our traditional brokerage activities. Our ability to generate premium-based commission revenue may also be challenged by the growing desire of some clients to compensate brokers based upon flat fees rather than variable commission rates. This could negatively impact us, because fees are generally not indexed for inflation and might not increase with premiums as commissions do or with the level of service provided.
The highly competitive environment in which we operate could have an adverse effect on our business, results of operations and financial condition.
The commercial automobile insurance business can be highly competitive in general and also in our target markets, and, except for regulatory considerations, there are relatively few barriers to entry. Many of our competitors are substantially larger and may enjoy better name recognition, substantially greater financial resources, higher ratings by rating agencies, broader and more diversified product lines, and more widespread agency relationships than we have. Our underwriting profits could be adversely impacted if new entrants or existing competitors try to compete with our products, services and programs or offer similar or better products at or below our prices. Insurers in our markets generally compete on the basis of price, consumer recognition, coverages offered, claims handling, financial stability, customer service and geographic coverage.
Changes in the nature of the markets we serve could impact the size of our market and/or the market share available to us.
The industry we serve is being impacted by the introduction of mobile applications, including, but not limited to, TNCs, on-line dispatch and tracking, in-vehicle technologies and other technology-related changes. These technologies could change the size of the overall addressable market we serve and may also impact the nature of the risks we insure.
Our ability to generate written premiums is impacted by seasonality, which may cause fluctuations in our operating results and to our stock price.
The P&C insurance business is seasonal in nature. Our ability to generate written premium is also impacted by the timing of policy effective periods in the states in which we operate, while our net premiums earned generally follow a relatively smooth trend from quarter to quarter. Also, our gross premiums written are impacted by certain common renewal dates in larger metropolitan markets for the light commercial risks that represent our core lines of business. For example, January 1st and March 1st are common taxi cab renewal dates in Illinois and New York, respectively. Our New York “excess taxi program” has an annual renewal date in the third quarter. Net underwriting income is driven mainly by the timing and nature of claims, which can vary widely. As a result of this seasonality, investors may not be able to predict our annual operating results based on a quarter-to-quarter comparison of our operating results. Additionally, this seasonality may cause fluctuations in our stock price. We believe seasonality will have an ongoing impact on our business.
Our ability to maintain programs with risk-taking partners may depend on the availability and cost of reinsurance coverage.
Reinsurance is the practice of transferring part of an insurance company’s liability and premium under an insurance policy to another insurance company. Most insurance companies use reinsurance arrangements to limit and manage the amount of risk they retain, to stabilize underwriting results and to increase underwriting capacity. The availability and cost of reinsurance are subject to current market conditions and may vary significantly over time. Any decrease in the amount of our reinsurance will increase risk of loss. We may be unable to maintain programs if desired reinsurance coverage, or reinsurance coverage in adequate amounts and at favorable rates, is unavailable.
Our geographic concentration ties our performance to the business, economic, regulatory and other conditions of certain states.
Some jurisdictions generate a more significant percentage of our total premiums than others. Our revenues and profitability are subject to the prevailing regulatory, legal, economic, political, demographic, competitive, weather and other conditions in the principal states in which we do business. Changes in any of these conditions could make it less attractive for us to do business in such states and would have a more pronounced effect on us compared to companies that are more geographically diversified. In addition, our exposure to severe losses from localized perils, such as earthquakes, hurricanes, tropical storms, tornadoes, wind, ice storms, hail, fires, terrorism, riots and explosions, is increased in those areas where we have written significant numbers of P&C insurance policies. Given our geographic concentration, negative publicity regarding our products and services could have a material adverse effect on our business and operations, as could other regional factors impacting the local economies in a particular market.
The level of revenue generated by our business impacts profitability, especially in the near-term. We may experience difficulty in managing historic and future growth, which could adversely affect our results of operations and financial condition.
Maintaining and/or increasing our current level of revenue would require geographic expansion and increased market share via our expanded distribution network. Continued growth could impose significant demands on management, including the need to identify, recruit, maintain and integrate additional employees. Growth may also place a strain on management systems and operational and financial resources, and such systems, procedures and internal controls may not be adequate to support operations as they expand. Incremental merger and acquisition activities could affect our minimum efficient scale. Alternatively, a reduction in revenue creates potential challenges in terms of expense ratios and other factors that could have an adverse impact on profit.
Provisions in our organizational documents, corporate laws and the insurance laws of Illinois, New York and other states could impede an attempt to replace or remove management or directors or prevent or delay a merger or sale, which could diminish the value of our shares.
Our Memorandum of Association, Articles of Association and Code of Regulations and the corporate laws and the insurance laws of various states contain provisions that could impede an attempt to replace or remove management or directors or prevent the sale of the Insurance Subsidiaries that shareholders might consider to be in their best interests. These provisions include, among others:
requiring a vote of holders of 5% of the ordinary voting common shares to call a special meeting of shareholders;
requiring a two-thirds vote to amend the Articles of Association;
requiring the affirmative vote of a majority of the voting power of shares represented at a special meeting of shareholders; and
statutory requirements prohibiting a merger, consolidation, combination or majority share acquisition between Insurance Subsidiaries and an interested shareholder or an affiliate of an interested shareholder without regulatory approval.
These provisions may prevent shareholders from receiving the benefit of any premium over the market price of our shares offered by a bidder in a potential takeover and may adversely affect the prevailing market price of our shares if they are viewed as discouraging takeover attempts. In addition, insurance regulatory provisions may delay, defer or prevent a takeover attempt that shareholders may consider in their best interest. For example, under applicable state statutes, subject to limited exceptions, no person or entity may, directly or indirectly, acquire control of a domestic insurer without the prior approval of the state insurance regulator. Regulatory requirements could make a potential acquisition of our Company more difficult and may prevent shareholders from receiving the benefit from any premium over the market price of our shares offered by a bidder in a takeover context. Even in the absence of a takeover attempt, the existence of these provisions may adversely affect the prevailing market price of our shares if they are viewed as discouraging takeover attempts in the future.
If we are not able to attract and retain independent agents and brokers, our revenues could be negatively affected.
We market and distribute our insurance programs exclusively through independent insurance agents and specialty insurance brokers. As a result, our business depends in large part on the marketing efforts of these agents and brokers and on our ability to offer insurance products and services that meet the requirements of the agents, the brokers and their customers. However, these agents and brokers are not obligated to sell or promote our products and many sell or promote competitors’ insurance products in addition to our products. Some of our competitors have higher financial strength ratings, offer a larger variety of products, set lower prices for insurance coverage and/or offer higher commissions than we do. Therefore, we may not be able to attract and retain independent agents and brokers to sell our insurance products. Our inability to retain independent agents and brokers or the failure or inability of independent agents and brokers to market our insurance products successfully could have a material adverse impact on our business, financial condition and results of operations.
We rely on independent agents and other producers to submit insurance applications into our systems and to collect premiums from our policyholders, which exposes us to risks that our producers fail to meet their obligations to us.
We market and distribute automobile insurance products through a network of independent agents and other producers in the U.S. The producers submit business through our wholly owned subsidiary AGMI. We rely, and will continue to rely, heavily on these producers to attract new business. Independent producers generally have the ability to bind insurance policies and collect premiums on our behalf, actions over which we have a limited ability to exercise preventative control. Although underwriting controls and audit procedures are in place with the objective of providing control over this process, such procedures may not be successful, and in the event that an independent agent exceeds their authority by binding us on a risk that does not comply with our underwriting guidelines, we may be at risk for that policy until we effect a cancellation. Any improper use of such authority may result in claims that could have a material adverse effect on our business, results of operations and financial condition. In addition, in accordance with industry practice, policyholders often pay the premiums for their policies to producers for payment to us. These premiums may be considered paid when received by the producer, and thereafter, the customer is no longer liable to us for those amounts, whether or not we have actually received these premium payments from the producer. Consequently, we assume a degree of risk associated with our reliance on independent agents in connection with the settlement of insurance premium balances.
If we are unable to apply technology effectively in driving value for our clients through technology-based solutions or gain internal efficiencies and effective internal controls through the application of technology and related tools, our operating results, client relationships, growth and compliance programs could be adversely affected.
Our future success depends, in part, on our ability to anticipate and respond effectively to the threat and opportunity presented by digital disruption and developments in technology. These may include new applications or insurance-related services based on artificial intelligence, machine learning, robotics, blockchain or new approaches to data mining. We may be exposed to competitive risks related to the adoption and application of new technologies by established market participants (for example, through disintermediation) or new entrants such as technology companies, “Insuretech” start-up companies and others. These new entrants are focused on using technology and innovation, including artificial intelligence and blockchain, to simplify and improve the client experience, increase efficiencies, alter business models and effect other potentially disruptive changes in the industries in which we operate. If we fail to develop and implement technology solutions and technical expertise among our employees that anticipate and keep pace with rapid and continuing changes in technology, industry standards, client preferences and internal control standards, our value proposition and operating efficiency could be adversely affected. We may not be successful in anticipating or responding to these developments on a timely and cost-effective basis and our ideas may not be accepted in the marketplace. Additionally, the effort to gain technological expertise and develop new technologies in our business requires us to incur significant expenses. If we cannot offer new technologies as quickly as our competitors, or if our competitors develop more cost-effective technologies or product offerings, we could experience a material adverse effect on our operating results, client relationships, growth and compliance programs.
In some cases, we depend on key third-party vendors and partners to provide technology and other support for our strategic initiatives. If these third parties fail to perform their obligations or cease to work with us, our ability to execute on our strategic initiatives could be adversely affected.
The occurrence of widespread health emergencies could have a material adverse effect on our business and results of operations.
The recent outbreak of coronavirus (“COVID-19”), which has been identified as a “pandemic”, has resulted in decreased economic activity and ongoing health concerns, which have adversely affected the broader global economy. Federal, State and local governments have taken a variety of actions in efforts to lessen the effects of the pandemic on individuals. Federal and global actions designed to reduce the adverse impact on the U.S. and European economies have been taken and others may be forthcoming. At this time, the extent to which COVID-19 and resulting consequences may impact our business and results of operations, and the duration of such impact, is uncertain. However, health emergencies such as COVID-19 or related significant public health and safety events, such as quarantine measures, travel restrictions, and the potential impact on our business partners and customers could have a material adverse effect on our business and delay the implementation of our business strategy. As noted earlier in this document, our customers’ business activity has been reduced significantly which has a negative effect on our revenue and business opportunity. Civil unrest, whether related or unrelated to COVID-19, could also have an adverse impact on our customers, business partners, or our own business.
Regulatory, Legal and Accounting Risks
We are subject to comprehensive regulation, and our results may be unfavorably impacted by these regulations.
As a holding company that owns insurance businesses domiciled in the U.S., we and our subsidiaries are subject to comprehensive laws, regulations and rules. These laws, regulations and rules generally delegate regulatory, supervisory and administrative powers to state insurance regulators. Insurance regulations are generally designed to protect policyholders rather than security holders, and are related to matters, including, but not limited to:
rate setting;
regulatory capital ratios and solvency requirements;
restrictions on the amount, type, nature, quality and quantity of securities and other investments in which insurers may invest;
the maintenance of adequate reserves for unearned premiums and unpaid, and incurred but not reported, claims;
restrictions on the types of terms that can be included in insurance policies;
standards for accounting;
marketing practices;
claims settlement practices;
the examination of insurance companies by regulatory authorities, including periodic financial and market conduct examinations;
requirements to comply with medical privacy laws as a result of our administration of Gateway’s run-off and American Country’s transportation workers’ compensation business;
underwriting requirements related to Global Liberty’s run-off property insurance program;
the licensing of insurers and their agents;
limitations on dividends and transactions with affiliates;
approval of certain reinsurance transactions;
insolvency proceedings;
ability to enter and exit certain insurance markets, cancel policies or non-renew policies; and
data privacy.
Such laws, regulations and rules increase our legal and financial compliance costs and make some activities more time-consuming and costly. Any failure to monitor and address any internal control issues could adversely impact operating results. In addition, the Sarbanes-Oxley Act requires, among other things, that we maintain effective disclosure controls and procedures and internal control over financial reporting. A deficiency in internal control exists when the design or operation of a control does not allow management or employees, in the normal course of performing their assigned functions, to prevent or detect and correct misstatements on a timely basis. A significant deficiency is a deficiency, or combination of deficiencies, in internal control that is
less severe than a material weakness, yet important enough to merit attention by those charged with governance. A material weakness is a deficiency, or combination of deficiencies, in internal control, such that there is a reasonable possibility that a material misstatement of the entity’s financial statements will not be prevented, or detected and corrected, on a timely basis.
State insurance departments conduct periodic examinations of the affairs of insurance companies and require filing of annual and other reports relating to the financial condition of insurance companies, holding company issues and other matters. Our business depends on compliance with applicable laws, regulations and rules and our ability to maintain valid licenses and approvals for our operations. Regulatory authorities may deny or revoke licenses for various reasons, including violations of laws, regulations and rules. Changes in the level of regulation of the insurance industry or changes in laws, regulations and rules themselves or interpretations thereof by regulatory authorities could have a material adverse effect on our operations. Insurance regulators also have the power to place our Insurance Subsidiaries into various forms of statutory receivership in certain circumstances (see Item 1, 2020 Developments).
It is not possible to predict the future impact of changing federal and state regulation on our operations, and there can be no assurance that laws enacted in the future will not be more restrictive than existing laws, regulations and rules. New or more restrictive laws, regulations and rules, including changes in current tax or other regulatory interpretations, could make it more expensive for us to conduct our businesses, restrict or reduce the premiums our Insurance Subsidiaries are able to charge or otherwise change the way we do business.
Our business is subject to risks related to litigation and regulatory actions.
We may, from time to time, be subject to a variety of legal and regulatory actions relating to our current and past business operations, including, but not limited to:
disputes over coverage or claims adjudication, including claims alleging that we or our subsidiaries have acted in bad faith in the administration of claims by our policyholders;
disputes regarding sales practices, disclosure, policy issuance and cancellation, premium refunds, licensing, regulatory compliance, setting of appropriate reserves and compensation arrangements;
limitations on the conduct of our business;
disputes with our agents, producers or network providers over compensation or the termination of our contracts with such agents, producers or network providers, including any alleged claim that they may make against us in connection with a dispute whether in the scope of their agreements or otherwise;
disputes with taxing authorities regarding tax liabilities; and
disputes relating to certain businesses acquired or disposed of by us.
As insurance industry practices and regulatory, judicial and industry conditions change, unexpected and unintended issues related to pricing, claims, coverage and business practices may emerge. Plaintiffs often target P&C insurers in purported class action litigation relating to claims handling and insurance sales practices. The resolution and implications of new underwriting, claims and coverage issues could have a negative effect on our business by extending coverage beyond our underwriting intent, increasing the size of claims or otherwise requiring us to change our practices. The effects of unforeseen emerging claims and coverage issues could negatively impact revenues, results of operations and reputation. Current and future court decisions and legislative activity may increase our exposure to these or other types of claims. Multi-party or class action claims may present additional exposure to substantial economic, non-economic or punitive damage awards. An unfavorable result with respect to even one of these claims, if it resulted in a significant damage award or a judicial ruling that was otherwise detrimental, could create a precedent that could have a material adverse effect on our results of operations and financial condition. This risk of potential liability may make reasonable settlements of claims more difficult to obtain. We cannot determine with any certainty what new theories of recovery may evolve or what their impact may be on our business.
From time to time, the Company is subject to governmental or administrative investigations and proceedings. We can be subject to regulatory action, restrictions or heightened compliance or reporting requirements in certain states. If we are not able to successfully comply with or lift the heightened compliance or disclosure requirements applicable in one or more of these states or any new requirements that a state may impose in the future, we may not be able to expand our operations in such state in accordance with our growth strategy or we could be subject to additional regulatory requirements that could impose a material burden on our expansion strategy or limit or prohibit our ability to write new and renewal insurance policies in such state. Any such limitation or prohibition could have a material adverse effect on our results of operations and financial condition and on our ability to execute our strategy in the future. The result of these inquiries could lead to additional requirements, restrictions or limitations being placed on us or our Insurance Subsidiaries, any of which could increase our costs of regulatory compliance and could have an adverse effect on our ability to operate our business. As a general matter, we cannot predict the outcome of regulatory investigations, proceedings and reviews and cannot guarantee that such investigations, proceedings or reviews or related litigation
or changes in operating policies and practices would not materially and adversely affect our results of operations and financial condition. In addition, we have experienced difficulties with our relationships with regulatory bodies in various jurisdictions, and if such difficulties arise in the future, they could have a material adverse effect on our ability to do business in that jurisdiction (see Item 1, 2020 Developments).
Failure to maintain the security of personal data and the availability of critical systems may result in lost business, reputational damage, legal costs and regulatory fines.
Our subsidiaries obtain and store vast amounts of personal data that can present significant risks to the Company and its customers and employees. Various laws and regulations govern the use and storage of such data, including, but not limited to, social security numbers, credit card and banking data. The Company’s data systems are vulnerable to security breaches due to the sophistication of cyber-attacks, viruses, malware, hackers and other external hazards, as well as inadvertent errors, equipment and system failures, and employee misconduct. The Company also relies on the ability of its business partners to maintain secure systems and processes that comply with legal requirements and protect personal data. These risks and regulatory requirements related to personal data security expose the Company to potential data loss, damage to our reputation, compliance and litigation, regulatory investigation and remediation costs. In the event of non-compliance with the Payment Card Industry Data Security Standard, an information security standard for organizations that handle cardholder information for the major debit, credit, prepaid, e-purse, ATM and point-of-sale cards, such organizations could prevent our subsidiaries from collecting premium payments from customers by way of such cards and impose significant fines on our subsidiaries. There can be no assurances that our preventative actions will be sufficient to prevent or mitigate the risk of cyber-attacks.
Changes in data privacy and protection laws and regulations, or any failure to comply with such laws and regulations, could adversely affect our business and financial results.
We are subject to a variety of continuously evolving and developing laws and regulations globally regarding privacy, data protection, and data security, including those related to the collection, storage, handling, use, disclosure, transfer, and security of personal data. These laws apply to transfers of information among our affiliates, as well as to transactions we enter into with third party vendors. Significant uncertainty exists as privacy and data protection laws may be interpreted and applied differently from country to country, which may create inconsistent or conflicting requirements. Complying with enhanced obligations imposed by various new and emerging laws is resulting in significant costs of developing, implementing or securing our servers and is requiring us to allocate more resources to new privacy compliance processes and to improved technologies, adding to our IT and compliance costs.
If our company were not to be treated as a U.S. corporation for U.S. federal income tax purposes, certain tax inefficiencies would result and certain adverse tax rules would apply.
Pursuant to certain “expatriation” provisions of the U.S. Internal Revenue Code of 1986, as amended (“IRC”), the reverse merger agreement relating to the reverse merger transaction described below provides that the parties intend to treat our company as a U.S. corporation for U.S. federal income tax purposes. The expatriation provisions are complex, are largely unsettled and subject to differing interpretations, and are subject to change, perhaps retroactively. If the Company were not to be treated as a U.S. corporation for U.S. federal income tax purposes, certain tax inefficiencies and adverse tax consequences and reporting requirements would result for both the Company and the recipients and holders of stock in the Company, including that dividend distributions from our subsidiaries to us would be subject to 30% U.S. withholding tax, with no available reduction and that members of the consolidated group may not be permitted to file a consolidated U.S. tax return resulting in the acceleration of cash tax outflow and potential permanent loss of tax benefits associated with net operating loss carryforwards (“NOLs”) that could have otherwise been utilized.
Our use of losses may be subject to limitations, and the tax liability of our company may be increased.
Our ability to utilize the NOLs is subject to the rules of Section 382 of the IRC. Section 382 generally restricts the use of NOLs after an “ownership change.” An ownership change occurs if, among other things, the stockholders (or specified groups of stockholders) who own or have owned, directly or indirectly, five percent (5%) or more of our common stock or are otherwise treated as five percent (5%) stockholders under Section 382 and the regulations promulgated thereunder increase their aggregate percentage ownership of our stock by more than 50 percentage points over the lowest percentage of the stock owned by these stockholders over a three-year rolling period. In the event of an ownership change, Section 382 imposes an annual limitation on the amount of taxable income a corporation may offset with NOLs. This annual limitation is generally equal to the product of the value of our stock on the date of the ownership change, multiplied by the long-term tax-exempt rate published monthly by the Internal Revenue Service. Any unused annual limitation may be carried over to later years until the applicable expiration date for the respective NOL carryforwards.
The rules of Section 382 are complex and subject to varying interpretations. Because of our numerous equity issuances, which have included the issuance of various classes of convertible securities and warrants, uncertainty existed as to whether we may
have undergone an ownership change in the past or as a result of our 2013 U.S. public offering. Based upon management’s assessment, it was determined that at the date of the U.S. public offering there was not an “ownership change” as defined by Section 382. However, on July 22, 2013, as a result of shareholder activity, a “triggering event” as determined under IRC Section 382 was reached. As a result, under IRC Section 382, the use of the Company’s NOLs and other carryforwards generated prior to the “triggering event” will be limited as a result of this “ownership change” for tax purposes, which is defined as a cumulative change of more than 50% during any three-year period by shareholders of the Company’s shares.
NOLs and other carryforwards generated in 2018 and 2019 could be limited by IRC Section 382.
Further limitations on the utilization of losses may apply because of the “dual consolidated loss” rules, which will also require the Company to recapture into income the amount of any such utilized losses in certain circumstances. As a result of the application of these rules, the future tax liability of the Company and our subsidiaries could be significantly increased. In addition, taxable income may also be recognized by our Company or our Insurance Subsidiaries in connection with the 2010 reverse merger transaction.
We are subject to a number of contingencies and legal proceedings which, if determined unfavorably to us, would adversely affect our financial results.
We are or have been subject to numerous claims, tax assessments, lawsuits and proceedings that arise in the ordinary course of business. Such claims, lawsuits and other proceedings include claims for damages based on allegations that our employees or sub-agents improperly failed to procure coverage, report claims on behalf of clients, provide underwriting enterprises with complete and accurate information relating to the risks being insured, or provide clients with appropriate consulting, advisory, pension and claims handling services. There is the risk that our employees or sub-agents may fail to appropriately apply funds that we hold for our clients on a fiduciary basis. Certain of our benefits and retirement consultants provide investment advice or decision-making services to clients. If these clients experience investment losses, our reputation could be damaged and our financial results could be negatively affected as a result of claims asserted against us and lost business. It is possible that, if the outcomes of these contingencies and legal proceedings were not favorable to us, it could materially adversely affect our future financial results. In addition, our results of operations, financial condition or liquidity may be adversely affected if, in the future, our insurance coverage proves to be inadequate or unavailable or we experience an increase in liabilities for which we self-insure. We have purchased errors and omissions insurance and other insurance to provide protection against losses that arise in such matters. Accruals for these items, net of insurance receivables, when applicable, have been provided to the extent that losses are deemed probable and are reasonably estimable. These accruals and receivables are adjusted from time to time as current developments warrant.
Changes in our accounting estimates and assumptions could negatively affect our financial position and operating results.
We prepare our consolidated financial statements in accordance with U.S. generally accepted accounting principles (which we refer to as GAAP). These accounting principles require us to make estimates and assumptions that affect the reported amounts of assets and liabilities, and the disclosure of contingent assets and liabilities at the date of our consolidated financial statements. We are also required to make certain judgments and estimates that affect the disclosed and recorded amounts of revenues and expenses related to the impact of the adoption of and accounting under Topic 606. We periodically evaluate our estimates and assumptions, including those relating to the valuation of goodwill and other intangible assets, investments, income taxes, revenue recognition, deferred costs, stock-based compensation, claims handling obligations, litigation and contingencies. We base our estimates on historical experience and various assumptions that we believe to be reasonable based on specific circumstances. Such estimates and assumptions could change in the future as more information becomes known, which could impact the amounts reported and disclosed in our consolidated financial statements. Further, as additional guidance relating to the Tax Act is released, our estimates related to the Tax Act may change. Additionally, changes in accounting standards (see Note 2 to our 2019 consolidated financial statements) could increase costs to the organization and could have an adverse impact on our future financial position and results of operations.
Risks Relating to our Investments, Debt and Common Stock
Market fluctuations, changes in interest rates or a need to generate liquidity could have significant and negative effects on our investment portfolio. We may not be able to realize our investment objectives, which could significantly reduce our net income.
Especially in our Insurance Subsidiaries, we depend on income from our securities portfolio for a portion of our earnings. Investment returns are an important part of our overall profitability. A significant decline in investment yields in the securities portfolio or an impairment of securities owned could have a material adverse effect on our business, results of operations and financial condition. To the extent applicable based on our strategic focus and business operations (see Item 1, 2020 Developments), we currently maintain and intend to maintain a securities portfolio comprised primarily of investment grade fixed income securities. Despite
the Company’s best efforts, we cannot predict which industry sectors or specific investments in which we maintain investments may suffer losses as a result of potential declines in commercial and economic activity. Accordingly, adverse fluctuations in the fixed income or equity markets could adversely impact profitability, financial condition or cash flows. If we are forced to sell portfolio securities that have unrealized losses for liquidity purposes rather than holding them to maturity or recovery, we would realize investment losses on those securities when that determination was made. We could also experience a loss of principal in fixed and non-fixed income investments. In addition, certain of our investments, including our investments in limited partnerships owning income producing properties, are illiquid and difficult to value.
Our ability to achieve our investment objectives is affected by general economic conditions that are beyond our control. General economic conditions can adversely affect the markets for interest rate sensitive securities, including liquidity in such markets, the level and volatility of interest rates and, consequently, the value of fixed maturity securities. Should the economy experience a recession in the future, we expect price volatility of our securities to increase.
Difficult conditions in the economy generally may materially and adversely affect our business, results of operations and statement of financial position, and these conditions may not improve in the near future.
Potential for instability in the global financial markets present additional risks and uncertainties for our business. In particular, deterioration in the public debt markets could lead to additional investment losses and an erosion of capital as a result of a reduction in the fair value of investment securities.
Sources of economic and market instability include, but are not limited to, the impact of the United Kingdom European Union membership referendum (“Brexit”), a potential economic slowdown in Europe, China or the U.S., the impact of trade negotiations, reduced accommodation from the Federal Reserve and Exposure other Central Banks, and the effects of a pandemic or other health crisis (see “The occurrence of widespread health emergencies could have a material adverse effect on our business and results of operations.” above).
Risks from these events, or other currently known or unknown events could lead to worsening economic conditions, widening of credit spreads or bankruptcies which could negatively impact the financial position of the company.
Atlas’ Insurance Subsidiaries’ portfolios are managed by an SEC registered investment adviser specializing in the management of insurance company portfolios. We and our investment manager consider these issues in connection with current asset allocation decisions with the object of avoiding them going forward. However, depending on market conditions going forward, we could incur substantial realized and additional unrealized losses in future periods, which could have an adverse impact on the results of operations and financial condition. There can be no assurance that the market outlook will improve in the near future. We previously experienced and could experience again a reduction in capital in certain of our Insurance Subsidiaries below levels required by the regulators in the jurisdictions in which we operate.
We have debt outstanding that could adversely affect our financial flexibility and subjects us to restrictions and limitations that could significantly impact our ability to operate our business.
As of December 31, 2019, we had total debt outstanding of approximately $25 million. The level of debt outstanding each period could adversely affect our financial flexibility. We also bear risk at the time our debt matures. Our ability to make interest and principal payments, to refinance our debt obligations and to fund our acquisition program and planned capital expenditures will depend on our ability to generate cash from operations. This, to a certain extent, is subject to general economic, financial, competitive, legislative, regulatory and other factors that are beyond our control, such as an environment of rising interest rates. If Atlas incurs additional debt or liabilities, or if we are unable to maintain a level of cash flows from operating activities, Atlas’ ability to pay its obligations on its senior unsecured notes (“Senior Unsecured Notes”) could be adversely affected. Although the Senior Unsecured Notes are “senior notes,” they would be subordinate to any senior secured indebtedness the Company may incur and structurally subordinate to all liabilities of Atlas’ subsidiaries, which increases the risk that Atlas will be unable to meet its obligations on the Senior Unsecured Notes when they mature. Atlas’ ability to pay interest on the Senior Unsecured Notes as it comes due and the principal of the Senior Unsecured Notes at their maturity may be limited by regulatory constraints, including, without limitation, state insurance laws that limit the ability of Atlas’ insurance company subsidiaries to pay dividends. Especially in the context of rehabilitation, certain of our Insurance Subsidiaries are restricted from distributing capital to the holding company, which could impact the ability to pay debt obligations in the future. See “Item 1, Business” and “Item 1A, Risk Factors - Risks Related to 2020 Developments - Regulatory Developments” for certain developments with respect to the Insurance Subsidiaries subsequent to December 31, 2019.
Although the Senior Unsecured Notes are listed on the OTC Pink Sheets, moving from Nasdaq effective October 17, 2019, there can be no assurance that an active trading market for the Senior Unsecured Notes will develop, or if one does develop, that it will be maintained. The price at which holders will be able to sell their Senior Unsecured Notes prior to maturity will depend on a number of factors and may be substantially less than the amount originally invested. Holders of the Senior Unsecured Notes will
have limited rights if there is an event of default. Atlas may redeem the Senior Unsecured Notes before maturity, and holders of the redeemed Senior Unsecured Notes may be unable to reinvest the proceeds at the same or a higher rate of return.
The price of our common stock may fluctuate significantly, and this may make it difficult for you to resell shares of common stock owned by you at times or at prices you find attractive.
The trading price of our common stock may fluctuate widely as a result of a number of factors, including the risk factors described above, many of which are outside our control. In addition, the stock market is subject to fluctuations in the share prices and trading volumes that affect the market prices of the shares of many companies. These broad market fluctuations have adversely affected and may adversely affect the market price of our common stock.
Stockholder class action lawsuits may be instituted against us following a period of volatility in our stock price. Any such litigation could result in substantial cost and a diversion of management’s attention and resources. At this time this report was filed, the Company’s common shares were listed on the OTC Pink Stock Exchange (see Item 1, 2020 Developments).
We may not have access to capital or risk-taking partners in the future.
We may need new or additional financing in the future to conduct our operations or expand our business. However, we may be unable to raise capital on favorable terms, or at all, including as a result of disruptions, uncertainty and volatility in the global credit markets, or due to any sustained weakness in the general economic conditions and/or financial markets in the U.S. or globally. From time to time, we may rely on access to financial markets as a source of liquidity for operations, acquisitions and general corporate purposes. AGMI’s business model relies on contractual arrangements with risk-taking partners to issue insurance policies. Pursuant to the terms of our contractual relationships with such partners, programs may not be renewed in the future and we may not be able to establish relationships with additional partners to support existing or new business.
The limited public float and trading volume for our shares may have an adverse impact on the share price or make it difficult to liquidate.
Our securities are held by a relatively small number of shareholders. Future sales of substantial amounts of our shares in the public market, or the perception that these sales could occur, may adversely impact the market price of our shares, and our shares could be difficult to liquidate. At this time this report was filed, the Company’s common shares were listed on the OTC Pink Stock Exchange, which reduces liquidity (see Item 1, 2020 Developments).
We do not anticipate paying any cash dividends on our common stock for the foreseeable future.
We currently intend to retain our future earnings, if any, for the foreseeable future, for working capital and other general corporate purposes. We do not intend to pay any dividends to holders of our ordinary voting common shares. As a result, capital appreciation in the price of our ordinary voting common shares, if any, will be the only source of gain on an investment in our ordinary voting common shares. We have never declared or paid cash dividends on our common stock since Atlas’ inception in 2010. Any future determination to pay dividends on our common stock will be at the discretion of our board of directors, subject to applicable laws, and will depend on our financial condition, results of operations, capital requirements, general business conditions and other factors that our board of directors considers relevant. In addition, the insurance laws and regulations governing our Insurance Subsidiaries contain restrictions on the ability to pay dividends, or to make other distributions to Atlas, which may limit Atlas’ ability to pay dividends to its common shareholders.
Risks primarily related to our Insurance Subsidiaries
As noted in Item 1, three of the Insurance Subsidiaries have been deconsolidated in this report in connection with being placed into rehabilitation, and the fourth Insurance Subsidiary is classified as discontinued operations (see Item 1, 2020 Developments).
The Insurance Subsidiaries’ provisions for unpaid claims and claims adjustment expenses may be inadequate, which would result in a reduction in our net income and might adversely affect our financial condition.
Our successThe value of our Insurance Subsidiaries or their estates in liquidation depends upon ourthe ability to accurately assess and pricecover liabilities with the risks covered byassets of the insurance policiesestate. Prior to the ASI Pool Companies being put into rehabilitation in 2019, we write. We establishhistorically established reserves to cover our estimated liability for the payment of claims and expenses related to the administration of claims incurred on the insurance policies we write.wrote. Establishing an appropriate level of reserves is an inherently uncertain process. Our provisions for unpaid claims and claims adjustment expenses do not represent an exact calculation of actual liability, but are estimates involving actuarial and statistical projections at a given point in time of what we expect to be the cost of the ultimate settlement and administration of known and unknown claims. The process for establishing the provision for unpaid claims and claims adjustment expenses reflects the uncertainties and significant judgmental factors inherent in estimating future results of both known and unknown claims, and as such, the process is inherently complex and imprecise. We utilize independentutilized third party actuarial firms to assist us in estimating the provision for unpaid claims and claims adjustment expenses. These estimates arewere based upon various factors, including:
actuarial and statistical projections of the cost of settlement and administration of claims, reflecting facts and circumstances then known;
historical claims information;
assessments of currently available data;
estimates of future trends in claims severity and frequency;
judicial theories of liability;
economic factors, such as inflation;
estimates and assumptions regarding judicial and legislative trends, and actions such as class action lawsuits and judicial interpretation of coverages or policy exclusions; and
the level of insurance fraud.
Most or all of these factors are not directly quantifiable, particularly on a prospective basis, and the effects of these and unforeseen factors could negatively impact our ability to accurately assess the risks of the policies that we write. In addition, there may be significant reporting lags between the occurrence of the insured event and the time it is actually reported to the insurer and additional lags between the time of reporting and final settlement of claims. Unfavorable development in any of these factors could cause the level of reserves to be inadequate. The following factors may have a substantial impact on future claims incurred:
the amounts of claims payments;
the expenses that the Insurance Subsidiaries incur in resolving claims;
legislative and judicial developments; and
changes in economic conditions, including inflation.
As time passes and more information about the claims becomes known, the estimates are adjusted upward or downward to reflect this additional information. Because of the elements of uncertainty encompassed in this estimation process, and the extended time it can take to settle many of the more substantial claims, several years of experience may be required before a meaningful comparison can be made between actual claim costs and the original provision for unpaid claims and claims adjustment expenses. The development of the provision for unpaid claims and claims adjustment expenses is shown by the difference between estimates of claims liabilities as of the initial year end and the re-estimated liability at each subsequent year end. Favorable development (reserve redundancy) means that the original claims estimates were higher than subsequently determined or re-estimated. Unfavorable development (reserve deficiency) means that the original claims estimates were lower than subsequently determined or re-estimated.
Government regulators could require that we increase reserves if they determine that provisions for unpaid claims are understated. Increases to the provision for unpaid claims and claims adjustment expenses cause a reduction in our Insurance Subsidiaries’an insurance subsidiary’s surplus, which could cause a downgrading of our Insurance Subsidiaries’ ratings.its rating. Any such downgrade could, in turn, adversely affect their ability to sell insurance policies. See “Risk Factors - Risks Related to 2019 Developments - Regulatory Developments” for certain developments with respect to the Insurance Subsidiaries subsequent to December 31, 2018.
For the companies that we acquired or will acquire, the provisions for unpaid claims and claims adjustment expenses may be inadequate at the timeThe value of purchase, which would result in a reduction in our net income and might adversely affect our financial condition.
We cannot guarantee that the provisions for unpaid claims and claims adjustment expenses of the companies that we acquired are or will be adequate. We became or will become responsible for the historical claims reserves established by the acquired company’s management upon completion of acquisitions. While the stock purchase agreement provides for certain protections in this regard, there can be no assurances they will be sufficient to offset any adverse development to the acquired company’s historical claims reserves. Any unfavorable development in an acquired company’s claims reserves would reduce our net income and have an adverse effect on our financial position to the extent it exceeds the protections provided for in the stock purchase agreement related to each acquisition.
Our successInsurance Subsidiaries depends on our ability to accurately price the risks we underwrite.
Our results of operations and the financial condition of the Insurance Subsidiaries depend on our ability to underwrite and set premium rates accurately for a wide variety of risks. Adequate rates are necessary to generate premiums sufficient to pay claims, claims adjustment expenses and underwriting expenses and to earn a profit. To price our products accurately, we must collect and properly analyze a substantial amount of data; develop, test and apply appropriate pricing techniques; closely monitor and timely recognize changes in trends; and project both severity and frequency of claims with reasonable accuracy. Our ability to undertake these efforts successfully, and as a result price our products accurately, is subject to a number of risks and uncertainties, some of which are outside our control, including:
the availability of sufficient reliable data and our ability to properly analyze available data;
the uncertainties that inherently characterize estimates and assumptions;
underlying trends or changes affecting risk and loss costs;
our selection and application of appropriate pricing techniques; and
changes in applicable legal liability standards and in the civil litigation system generally.uncertainties.
Consequently, we could under priceunderprice risks, which would adversely affect our profit margins, or we could overprice risks, which could reduce our sales volume and competitiveness. In either case, our profitability could be materially and adversely affected.
Our Insurance Subsidiaries rely on independent agents and other producers to bind insurance policies on and to collect premiums from our policyholders, which exposes us to risks that our producers fail to meet their obligations to us.
Our Insurance Subsidiaries market and distribute automobile insurance products through a network of independent agents and other producers in the U.S. The producers submit business through our wholly owned subsidiary AGMI. We rely, and will continue to rely, heavily on these producers to attract new business. Independent producers generally have the ability to bind insurance policies and collect premiums on our behalf, actions over which we have a limited ability to exercise preventative control. Although underwriting controls and audit procedures are in place with the objective of providing control over this process, such procedures may not be successful, and in the event that an independent agent exceeds their authority by binding us on a risk that does not comply with our underwriting guidelines, we may be at risk for that policy until we effect a cancellation. Any improper use of such authority may result in claims that could have a material adverse effect on our business, results of operations and financial condition. In addition, in accordance with industry practice, policyholders often pay the premiums for their policies to producers for payment to us. These premiums may be considered paid when received by the producer, and thereafter, the customer is no longer liable to us for those amounts, whether or not we have actually received these premium payments from the producer. Consequently, we assume a degree of risk associated with our reliance on independent agents in connection with the settlement of insurance premium balances.
Our Insurance Subsidiaries may be unable to mitigate their risk or increase their underwriting capacity through reinsurance arrangements, which could adversely affect our business, financial condition and results of operations. If reinsurance rates rise significantly or reinsurance becomes unavailable or reinsurers are unable to pay our claims, we may be adversely affected.
In order to reduce underwriting risk and increase underwriting capacity, our Insurance Subsidiaries transfer portions of our insurance risk to other insurers through reinsurance contracts. We generally purchase reinsurance from third parties in order to reduce our liability on individual risks. Reinsurance does not relieve us of our primary liability to our Insurance Subsidiaries’ insureds. During 2018, we had ceded premiums written of $86.4 million to our reinsurers. The availability, cost and structure of reinsurance protection are subject to prevailing market conditions that are outside of our control and which may affect our level of business and profitability. Our ability to provide insurance at competitive premium rates and coverage limits on a continuing basis depends in part upon the extent to which we can obtain adequate reinsurance in amounts and at rates that will not adversely affect our competitive position. There are no assurances that we will be able to maintain our current reinsurance facilities, which generally are subject to annual renewal. If we are unable to renew any of these facilities upon their expiration or to obtain other reinsurance facilities in adequate amounts and at favorable rates, we may need to modify our underwriting practices or reduce our underwriting commitments, which could adversely affect our results of operations.
Our Insurance Subsidiaries are subject to credit risk with respect to the obligations of reinsurers and certain of our insureds. The inability of our risk sharing partners to meet their obligations could adversely affect our profitability.
Although the reinsurers are liable to us to the extent of risk ceded to them, we remain ultimately liable to policyholders on all risks, even those reinsured. As a result, ceded reinsurance arrangements do not limit our ultimate obligations to policyholders to pay claims. We are subject to credit risks with respect to the financial strength of our reinsurers. We are also subject to the risk that their reinsurers may dispute their obligations to pay our claims. As a result, we may not recover sufficient amounts for claims that we submit to reinsurers, if at all. As of December 31, 2018, we had an aggregate of $81.2 million of reinsurance recoverables, of which $69.1 million were unsecured. In addition, our reinsurance agreements are subject to specified limits, and we would not have reinsurance coverage to the extent that those limits are exceeded.
With respect to insurance programs, the Insurance Subsidiaries are subject to credit risk with respect to the payment of claims and on the portion of risk exposure either ceded to captives established by their clients or deductibles retained by their clients. No assurance can be given regarding the future ability of these entities to meet their obligations. The inability of our risk sharing partners to meet their obligations could adversely affect our profitability.
The exclusions and limitations in our policies may not be enforceable.
Many of the policies we issue include exclusions or other conditions that define and limit coverage, which exclusions and conditions are designed to manage our exposure to certain types of risks and expanding theories of legal liability. In addition, many of our policies limit the period during which a policyholder may bring a claim under the policy, which period in many cases is shorter than the statutory period under which these claims can be brought by our policyholders. While these exclusions and limitations help us assess and control our claims exposure, it is possible that a court or regulatory authority could nullify or void an exclusion or limitation, or legislation could be enacted modifying or barring the use of these exclusions and limitations. This could result in higher than anticipated claims and claims adjustment expenses by extending coverage beyond our underwriting intent or increasing the number or size of claims, which could have a material adverse effect on our operating results. In some instances, these changes may not become apparent until some time after we have issued the insurance policies that are affected by the changes. As a result, the full extent of liability under our insurance contracts may not be known for many years after a policy is issued.
The occurrence of severe catastrophic events may have a material adverse effect on our financial results and financial condition.
Although our business strategy generally precludes us from writing significant amounts of catastrophe exposed business, most P&C insurance contains some exposure to catastrophic claims. We have only limited exposure to natural and man-made disasters, such as hurricane, typhoon, windstorm, flood, earthquake, acts of war, acts of terrorism and political instability. While we carefully manage our aggregate exposure to catastrophes, modeling errors and the incidence and severity of catastrophes, such as hurricanes, windstorms and large-scale terrorist attacks are inherently unpredictable, and our claims from catastrophes could be substantial. In addition, it is possible that we may experience an unusual frequency of smaller claims in a particular period. In either case, the consequences could have a substantially volatile effect on our financial condition or results of operations for any fiscal quarter or year, which could have a material adverse effect on our ability to write new business. These claims could deplete our shareholders’ equity. Increases in the values and geographic concentrations of insured property and the effects of inflation have resulted in increased severity of industry claims from catastrophic events in recent years, and we expect that those factors will increase the
severity of catastrophe claims in the future. It is also possible that catastrophic claims could have an impact on our investment portfolio.
The risk models we use to quantify catastrophe exposures and risk accumulations may prove inadequate in predicting all outcomes from potential catastrophe events.
We rely on widely accepted and industry-recognized catastrophe risk modeling, primarily in conjunction with our reinsurance partners, to help us quantify our aggregate exposure to any one event. As with any model of physical systems, particularly those with low frequencies of occurrence and potentially high severity of outcomes, the accuracy of the model’s predictions is largely dependent on the accuracy and quality of the data provided in the underwriting process and the judgments of our employees and other industry professionals. These models do not anticipate all potential perils or events that could result in a catastrophic loss to us. Furthermore, it is often difficult for models to anticipate and incorporate events that have not been experienced during or as a result of prior catastrophes. Accordingly, it is possible for us to be subject to events or contingencies that have not been anticipated by our catastrophe risk models and which could have a material adverse effect on our reserves and results of operations.
Financial Risks
We are a holding company dependent on the results of operations of our subsidiaries and their ability to pay dividends and other distributions to us.
Atlas is a holding company with no significant operations of its own and a legal entity separate and distinct from our Insurance Subsidiaries. As a result, our only sources of income are dividends and other distributions from our subsidiaries. We will be limited by the earnings of those subsidiaries, and the distribution or other payment of such earnings to them in the form of dividends, loans, advances or the reimbursement of expenses. The payment of dividends, the making of loans and advances or the reimbursement of expenses by our Insurance Subsidiaries is contingent upon the earnings of those subsidiaries and is subject to various business considerations and various statutory and regulatory restrictions imposed by the insurance laws of the domiciliary jurisdiction of such subsidiaries. In the states of domicile of our Insurance Subsidiaries, dividends may only be paid out of earned surplus and cannot be paid when the surplus of the company fails to meet minimum requirements or when payment of the dividend or distribution would reduce its surplus to less than the minimum amount. The state insurance regulator must be notified in advance of the payment of an extraordinary dividend and be given the opportunity to disapprove any such dividend. Prior to entering into any loan or certain other agreements between one or more of our Insurance Subsidiaries and Atlas or our other affiliates, advance notice must be provided to the state insurance regulator, and the insurance regulator has the opportunity to disapprove such loan or agreement. Additionally, insurance regulators have broad powers to prevent reduction of statutory capital and surplus to inadequate levels and could refuse to permit the payment of dividends calculated under any applicable formula. As a result, we may not be able to receive dividends or other distributions from our Insurance Subsidiaries at times and in amounts necessary to meet our operating needs, to pay dividends to shareholders or to pay corporate expenses. The inability of our Insurance Subsidiaries to pay dividends or make other distributions could have a material adverse effect on our business and financial condition. See “Risk Factors - Risks Related to 2019 Developments - Regulatory Developments” for certain developments with respect to the Insurance Subsidiaries subsequent to December 31, 2018.
Our Insurance Subsidiaries are subject to minimum capital and surplus requirements. Failure to meet these requirements may subject us to regulatory action.
Atlas’ Insurance Subsidiaries are subject to minimum capital and surplus requirements imposed under laws of the states in which the companies are domiciled as well as in the states where we conduct business. Any failure by one of our Insurance Subsidiaries to meet minimum capital and surplus requirements imposed by applicable state law may subject it to corrective action, which may include requiring adoption of a comprehensive financial plan, revocation of its license to sell insurance products or placing the subsidiary under state regulatory control. Any new minimum capital and surplus requirements adopted in the future may require us to increase the capital and surplus of our Insurance Subsidiaries, which we may not be able to do. As discussed above, the ASI Pool Companies were placed into rehabilitation during 2019, and in 2020 were placed into liquidation. As indicated elsewhere in this document, certain of the ASI Pool Companies’ state license were restricted, suspended, or revoked before and after the were placed into rehabilitation. See “Risk Factors - Risks Related to 20192020 Developments - Regulatory Developments” for certain developments with respect to the Insurance Subsidiaries subsequent to December 31, 2018.2019.
We are subject to assessments and other surcharges from state guaranty funds and mandatory state insurance facilities, which may reduceimpact our profitability.Insurance Subsidiaries.
Virtually all states require insurers licensed to do business therein to bear a portion of contingent and incurred claims handling expenses and the unfunded amount of “covered” claims and unearned premium obligations of impaired or insolvent insurance companies, either up to the policy’s limit, the applicable guaranty fund covered claims obligation cap, or 100% of statutorily defined workers’ compensation benefits, subject to applicable deductibles. These obligations are funded by assessments, made on a retrospective, prospective or pre-funded basis, which are levied by guaranty associations within the state, up to prescribed limits (typically 2% of “net direct premiums written”), on all member insurers in the state on the basis of the proportionate share of the
premiums written by member insurers in certain covered lines of business in which the impaired, insolvent or failed insurer was engaged. Accordingly, the total amount of assessments levied on us by the states in which we are licensed to write insurance may increase as we increase our premiums written. In addition, as a condition to the ability to conduct business in certain states (and within the jurisdiction of some local governments), insurance companies are subject to or required to participate in various premium or claims based insurance-related assessments, including mandatory (a/k/a “involuntary”) insurance pools, underwriting associations, workers’ compensation second-injury funds, reinsurance funds and other state insurance facilities. Although we may be entitled to take premium tax credit (or offsets), recover policy surcharges or include assessments in future premium rate structures for payments we make under these facilities, the effect of these assessments and insurance-related arrangements, or changes in them, could reduce our profitability in any given period or limit our ability to grow our business.
Market fluctuations, changes in interest rates or a need to generate liquidity could have significant and negative effects on our investment portfolio. We may not be able to realize our investment objectives, which could significantly reduce our net income.
We depend on income from our securities portfolio for a portion of our earnings. Investment returns are an important part of our overall profitability. A significant decline in investment yields in the securities portfolio or an impairment of securities owned could have a material adverse effect on our business, results of operations and financial condition. We currently maintain and intend to continue to maintain a securities portfolio comprised primarily of investment grade fixed income securities. Despite the Company’s best efforts, we cannot predict which industry sectors or specific investments in which we maintain investments may suffer losses as a result of potential declines in commercial and economic activity. Accordingly, adverse fluctuations in the fixed income or equity markets could adversely impact profitability, financial condition or cash flows. If we are forced to sell portfolio securities that have unrealized losses for liquidity purposes rather than holding them to maturity or recovery, we would realize investment losses on those securities when that determination was made. We could also experience a loss of principal in fixed and non-fixed income investments. In addition, certain of our investments, including our investments in limited partnerships owning income producing properties, are illiquid and difficult to value.
Our ability to achieve our investment objectives is affected by general economic conditions that are beyond our control. General economic conditions can adversely affect the markets for interest rate sensitive securities, including liquidity in such markets, the level and volatility of interest rates and, consequently, the value of fixed maturity securities. Should the economy experience a recession in the future, we expect price volatility of our securities to increase.
Difficult conditions in the economy generally may materially and adversely affect our business, results of operations and statement of financial position, and these conditions may not improve in the near future.
Potential for instability in the global financial markets present additional risks and uncertainties for our business. In particular, deterioration in the public debt markets could lead to additional investment losses and an erosion of capital as a result of a reduction in the fair value of investment securities.
Sources of economic and market instability include, but are not limited to, the impact of the United Kingdom European Union membership referendum (“Brexit”), a potential economic slowdown in Europe, China or the U.S., the impact of trade negotiations, and reduced accommodation from the Federal Reserve and other Central Banks.
Risks from these events, or other currently known or unknown events could lead to worsening economic conditions, widening of credit spreads or bankruptcies which could negatively impact the financial position of the company.
Atlas’ portfolio is managed by an SEC registered investment adviser specializing in the management of insurance company portfolios. We and our investment manager consider these issues in connection with current asset allocation decisions with the object of avoiding them going forward. However, depending on market conditions going forward, we could incur substantial realized and additional unrealized losses in future periods, which could have an adverse impact on the results of operations and financial condition. There can be no assurance that the market outlook will improve in the near future. We could also experience a reduction in capital in the Insurance Subsidiaries below levels required by the regulators in the jurisdictions in which we operate.
Our Insurance Subsidiaries may rely on a fronting reinsurance arrangement to market some of its insurance products.
Under a fronting reinsurance arrangement, we generally enter into a 100% quota share reinsurance agreement whereby we assume from the ceding reinsurer substantially all of its gross liability under the policies issued by them and on behalf of us. We are generally entitled to 100% of the net premiums received on policies reinsured, less the ceding fee to the ceding reinsurer, the commission paid to the general agent and premium taxes on the policies. We assume and are liable for substantially all losses incurred in connection with the risks under the reinsurance agreement, including judgments and settlements. The ceding insurance company may require us to post substantial collateral to secure the reinsured risks. Certain trust accounts for the benefit of the ceding insurance company and other unaffiliated third parties have been established with collateral on deposit under the terms and conditions of the relevant trust agreements. The value of collateral could fall below the levels required under these agreements,
putting the subsidiary or subsidiaries in breach of the agreement. Effective October 1, 2019, this program started the non-renewal process and is in run-off.
We may not have access to capital inBecause the future.
We may need new or additional financing in the future to conduct our operations or expand our business. However, we may be unable to raise capital on favorable terms, or at all, including as a result of disruptions, uncertainty and volatility in the global credit markets, or due to any sustained weakness in the general economic conditions and/or financial markets in the U.S. or globally. From time to time, we may rely on access to financial markets as a source of liquidity for operations, acquisitions and general corporate purposes.
The limited public float and trading volume for our shares may have an adverse impact on the share price or make it difficult to liquidate.
Our securities are held by a relatively small number of shareholders. Future sales of substantial amounts of our shares in the public market, or the perception that these sales could occur, may adversely impact the market price of our shares, and our shares could be difficult to liquidate.
We do not anticipate paying any cash dividends on our common stock for the foreseeable future.
We currently intend to retain our future earnings, if any, for the foreseeable future, for working capital and other general corporate purposes. We do not intend to pay any dividends to holders of our ordinary voting common shares. As a result, capital appreciation in the price of our ordinary voting common shares, if any, will be the only source of gain on an investment in our ordinary voting common shares. We have never declared or paid cash dividends on our common stock since Atlas’ inception in 2010. Any future determination to pay dividends on our common stock will be at the discretion of our board of directors, subject to applicable laws, and will depend on our financial condition, results of operations, capital requirements, general business conditions and other factors that our board of directors considers relevant. In addition, the insurance laws and regulations governing our Insurance Subsidiaries contain restrictions on the ability to pay dividends, or to make other distributions to Atlas, which may limit Atlas’ ability to pay dividends to its common shareholders.
Unlike the holders of our ordinary voting common shares, holders of our preferred shares are entitled to dividends on a cumulative basis whether or not declared by our board of directors, at a rate of $0.045 per preferred share per year, which must be paid or declared and set apart before any dividend may be paid on our ordinary voting common shares. We paid $409,000 of preferred dividends during 2016 on the preferred shares held by the former owner of Gateway. All of the preferred shares held by the former owner of Gateway were repurchased on September 30, 2016, and therefore, no additional dividends have accrued or will accrue on those preferred shares. During the fourth quarter of 2016, Atlas canceled the 4,000,000 preferred shares held by the former owner of Anchor. As of December 31, 2016, the paid claims development on Global Liberty’s pre-acquisition claims reserves was in excess of $4,000,000, and as a result, pursuant to the terms of the Anchor stock purchase agreement, dividends will no longer accrue to the former owner of Anchor. As of December 31, 2016, there were no preferred shares outstanding. Although the re-issuance of preferred shares to the former owner of Anchor may be highly unlikely, the contingent consideration terms of the Anchor stock purchase agreement will remain in effect for a period of five years from the date of acquisition. During 2018, Atlas paid $333,000 in dividends earned on the preferred shares to the former owner of Anchor, the cumulative amount to which they were entitled through December 31, 2017, leaving no accrued or unpaid dividends.
Risks Related to the Company’s Senior Unsecured Notes
If Atlas incurs additional debt or liabilities, or if we are unable to maintain a level of cash flows from operating activities, Atlas’ ability to pay its obligations on its senior unsecured notes (“Senior Unsecured Notes”) could be adversely affected. Although the Senior Unsecured Notes are “senior notes,” they would be subordinate to any senior secured indebtedness the Company may incur and structurally subordinate to all liabilities of Atlas’ subsidiaries, which increases the risk that Atlas will be unable to meet its obligations on the Senior Unsecured Notes when they mature. Atlas’ ability to pay interest on the Senior Unsecured Notes as it comes due and the principal of the Senior Unsecured Notes at their maturity may be limited by regulatory constraints, including, without limitation, state insurance laws that limit the ability of Atlas’ insurance company subsidiaries to pay dividends. Especially in the context of rehabilitation, certain of our Insurance Subsidiaries are restricted from distributing capital to the holding company, which could impact the ability to pay debt obligations in the future. See “Item 1A, Risk Factors - Risks Related to 2019 Developments - Regulatory Developments” for certain developments with respect to the Insurance Subsidiaries subsequent to December 31, 2018. Although the Senior Unsecured Notes are listed on the OTC Pink Sheets, moving from Nasdaq effective October 17, 2019, there can be no assurance that an active trading market for the Senior Unsecured Notes will develop, or if one does develop, that it will be maintained. The price at which holders will be able to sell their Senior Unsecured Notes prior to maturity will depend on a number of factors and may be substantially less than the amount originally invested. Holders of the Senior Unsecured Notes will have limited rights if there is an event of default. Atlas may redeem the Senior Unsecured Notes before maturity, and holders of the redeemed Senior Unsecured Notes may be unable to reinvest the proceeds at the same or a higher rate of return.
Compliance Risks
We are subject to comprehensive regulation, and our results may be unfavorably impacted by these regulations.
As a holding company that owns insurance companies domiciled in the U.S., we and our Insurance Subsidiaries are subject to comprehensive laws, regulations and rules. These laws, regulations and rules generally delegate regulatory, supervisory and administrative powers to state insurance regulators. Insurance regulations are generally designed to protect policyholders rather than shareholders, and are related to matters, including, but not limited to:
rate setting;
RBC ratio and solvency requirements;
restrictions on the amount, type, nature, quality and quantity of securities and other investments in which insurers may invest;
the maintenance of adequate reserves for unearned premiums and unpaid, and incurred but not reported, claims;
restrictions on the types of terms that can be included in insurance policies;
standards for accounting;
marketing practices;
claims settlement practices;
the examination of insurance companies by regulatory authorities, including periodic financial and market conduct examinations;
requirements to comply with medical privacy laws as a result of our administration of Gateway’s run-off and American Country’s transportation workers’ compensation business;
underwriting requirements related to Global Liberty’s run-off property insurance program;
the licensing of insurers and their agents;
limitations on dividends and transactions with affiliates;
approval of certain reinsurance transactions;
insolvency proceedings;
ability to enter and exit certain insurance markets, cancel policies or non-renew policies; and
data privacy.
Such laws, regulations and rules increase our legal and financial compliance costs and make some activities more time-consuming and costly. Any failure to monitor and address any internal control issues could adversely impact operating results. In addition, the Sarbanes-Oxley Act requires, among other things, that we maintain effective disclosure controls and procedures and internal control over financial reporting. A deficiency in internal control exists when the design or operation of a control does not allow management or employees, in the normal course of performing their assigned functions, to prevent or detect and correct misstatements on a timely basis. A significant deficiency is a deficiency, or combination of deficiencies, in internal control that is less severe than a material weakness, yet important enough to merit attention by those charged with governance. A material weakness is a deficiency, or combination of deficiencies, in internal control, such that there is a reasonable possibility that a material misstatement of the entity’s financial statements will not be prevented, or detected and corrected, on a timely basis.
State insurance departments conduct periodic examinations of the affairs of insurance companies and require filing of annual and other reports relating to the financial condition of insurance companies, holding company issues and other matters. Our business depends on compliance with applicable laws, regulations and rules and our ability to maintain valid licenses and approvals for our operations. Regulatory authorities may deny or revoke licenses for various reasons, including violations of laws, regulations and rules. Changes in the level of regulation of the insurance industry or changes in laws, regulations and rules themselves or interpretations thereof by regulatory authorities could have a material adverse effect on our operations. Because we are subject to insurance laws, regulations and rules of many jurisdictions that are administered by different regulatory and governmental authorities, there is also a risk that one authority’s interpretation of a legal or regulatory issue may conflict with another authority’s interpretation of the same issue. Insurance companies are also subject to “desk drawer rules” of state insurance regulators, which are regulatory rules that have not been codified or formally adopted through regulatory proceedings. In addition, we could face
individual, group and class-action lawsuits by our policyholders and others for alleged violations of certain state laws, regulations and rules. Each of these regulatory risks could have an adverse effect on our profitability.
As a result of our administration of Gateway’s run-off and American Country’s transportation workers’ compensation business, we are required to comply with state and federal laws governing the collection, transmission, security and privacy of health information that result in significant compliance costs, and any failure to comply with these laws could result in material criminal and civil penalties. These laws and rules are subject to administrative interpretation and many are derived from the privacy provisions in the Federal Gramm-Leach-Bliley Act of 2002. The Gramm-Leach-Bliley Act, which, among other things, protects consumers from the unauthorized dissemination of certain personal information, and various state laws and regulations addressing privacy issues, require us to maintain appropriate procedures for managing and protecting certain personal information of our customers and to fully disclose our privacy practices to our customers. Given the complexity of these privacy regulations, the possibility that the regulations may change, and the fact that the regulations are subject to changing and potentially conflicting interpretation, our ability to maintain compliance with the privacy requirements of state and federal law is uncertain and the costs of compliance are significant.
Most states have adopted either statutes or regulations or have issued bulletins or informal rules that regulate the anticipated withdrawal of a product, line or sub-line of insurance business from the insurance marketplace in their state. While what constitutes a “withdrawal” or its equivalent under each state’s statutory or regulatory scheme varies, our Insurance Subsidiaries can be subjected to regulatory requirements in connection with any withdrawal, including, but not limited to, making notice and/or plan filings with the applicable insurance regulator in certain states and possibly requiring the prior approval of the applicable state regulator. A failure by our Insurance Subsidiaries to comply with and satisfy these regulatory requirements in connection with any withdrawals could lead to regulatory fines, cause a distraction for management requiring us to continue to administer withdrawn business for longer than anticipated and could result in our Insurance Subsidiaries continuing to write undesirable business, which could have an adverse impact on our reserves, results of operations and financial condition.
It is not possible to predict the future impact of changing federal and state regulation on our operations, and there can be no assurance that laws enacted in the future will not be more restrictive than existing laws, regulations and rules. New or more restrictive laws, regulations and rules, including changes in current tax or other regulatory interpretations, could make it more expensive for us to conduct our businesses, restrict or reduce the premiums our Insurance Subsidiaries are able to charge or otherwise change the way we do business. In addition, economic and financial market turmoil or other conditions, circumstances or events may result in U.S. federal oversight of the insurance industry in general. See “Risk Factors - Risks Related to 2019 Developments - Regulatory Developments” for certain developments with respect to the Insurance Subsidiaries subsequent to December 31, 2018.
Our business is subject to risks related to litigation and regulatory actions.
We may, from time to time, be subject to a variety of legal and regulatory actions relating to our current and past business operations, including, but not limited to:
disputes over coverage or claims adjudication, including claims alleging that we or our Insurance Subsidiaries have acted in bad faith in the administration of claims by our policyholders;
disputes regarding sales practices, disclosure, policy issuance and cancellation, premium refunds, licensing, regulatory compliance, setting of appropriate reserves and compensation arrangements;
limitations on the conduct of our business;
disputes with our agents, producers or network providers over compensation or the termination of our contracts with such agents, producers or network providers, including any alleged claim that they may make against us in connection with a dispute whether in the scope of their agreements or otherwise;
disputes with taxing authorities regarding tax liabilities; and
disputes relating to certain businesses acquired or disposed of by us.
As insurance industry practices and regulatory, judicial and industry conditions change, unexpected and unintended issues related to pricing, claims, coverage and business practices may emerge. Plaintiffs often target P&C insurers in purported class action litigation relating to claims handling and insurance sales practices. The resolution and implications of new underwriting, claims and coverage issues could have a negative effect on our business by extending coverage beyond our underwriting intent, increasing the size of claims or otherwise requiring us to change our practices. The effects of unforeseen emerging claims and coverage issues could negatively impact revenues, results of operations and reputation. Current and future court decisions and legislative activity may increase our exposure to these or other types of claims. Multi-party or class action claims may present additional exposure to substantial economic, non-economic or punitive damage awards. An unfavorable result with respect to even one of these claims, if it resulted in a significant damage award or a judicial ruling that was otherwise detrimental, could create a precedent that could
have a material adverse effect on our results of operations and financial condition. This risk of potential liability may make reasonable settlements of claims more difficult to obtain. We cannot determine with any certainty what new theories of recovery may evolve or what their impact may be on our business.
From time to time, the Company is subject to governmental or administrative investigations and proceedings. We can be subject to regulatory action, restrictions or heightened compliance or reporting requirements in certain states. If we are not able to successfully comply with or lift the heightened compliance or disclosure requirements applicable in one or more of these states or any new requirements that a state may impose in the future, we may not be able to expand our operations in such state in accordance with our growth strategy or we could be subject to additional regulatory requirements that could impose a material burden on our expansion strategy or limit or prohibit our ability to write new and renewal insurance policies in such state. Any such limitation or prohibition could have a material adverse effect on our results of operations and financial condition and on our ability to execute our strategy in the future. The result of these inquiries could lead to additional requirements, restrictions or limitations being placed on us or our Insurance Subsidiaries, any of which could increase our costs of regulatory compliance and could have an adverse effect on our ability to operate our business. As a general matter, we cannot predict the outcome of regulatory investigations, proceedings and reviews and cannot guarantee that such investigations, proceedings or reviews or related litigation or changes in operating policies and practices would not materially and adversely affect our results of operations and financial condition. In addition, we have experienced difficulties with our relationships with regulatory bodies in various jurisdictions, and if such difficulties arise in the future, they could have a material adverse effect on our ability to do business in that jurisdiction.
Our business could be adversely affected as a result of changing political, regulatory, economic or other influences.
The insurance industry is subject to changing political, economic and regulatory influences. These influences affect the practices and operation of insurance and reinsurance organizations. Legislatures in the U.S. and other jurisdictions have periodically considered programs to reform or amend their respective insurance and reinsurance regulatory systems. Recently, the insurance and reinsurance regulatory framework has been subject to increased scrutiny in many jurisdictions. Changes in current insurance laws, regulations and rules may result in increased governmental involvement in or supervision of the insurance industry or may otherwise change the business and economic environment in which insurance industry participants operate. Historically, the automobile insurance industry has been under pressure from time to time from regulators, legislators or special interest groups to reduce, freeze or set rates at levels that are not necessarily related to underlying costs or risks, including initiatives to reduce automobile and other commercial line insurance rates. These changes may limit the ability of our Insurance Subsidiaries to price automobile insurance adequately and could require us to discontinue unprofitable product lines, make unplanned modifications of our products and services, or result in delays or cancellations of sales of our products and services.
Failure to maintain the security of personal data and the availability of critical systems may result in lost business, reputation damage, legal costs and regulatory fines.
Our Insurance Subsidiaries obtain and store vast amounts of personal data that can present significant risks to the Company and its customers and employees. Various laws and regulations govern the use and storage of such data, including, but not limited to, social security numbers, credit card and banking data. The Company’s data systems are vulnerable to security breaches due to the sophistication of cyber-attacks, viruses, malware, hackers and other external hazards, as well as inadvertent errors, equipment and system failures, and employee misconduct. The Company also relies on the ability of its business partners to maintain secure systems and processes that comply with legal requirements and protect personal data. These risks and regulatory requirements related to personal data security expose the Company to potential data loss, damage to our reputation, compliance and litigation, regulatory investigation and remediation costs. In the event of non-compliance with the Payment Card Industry Data Security Standard, an information security standard for organizations that handle cardholder information for the major debit, credit, prepaid, e-purse, ATM and point-of-sale cards, such organizations could prevent our subsidiaries from collecting premium payments from customers by way of such cards and impose significant fines on our subsidiaries. There can be no assurances that our preventative actions will be sufficient to prevent or mitigate the risk of cyber-attacks.
The Company’s business operations rely on the continuous availability of its computer systems. In addition to disruptions caused by cyber-attacks or other data breaches, such systems may be adversely affected by natural and man-made catastrophes. The Company’s failure to maintain business continuity in the wake of such events may prevent the timely completion of critical processes across its operations, including, but not limited to, insurance policy administration, claims processing, billing and payroll. These failures could result in significant loss of business, fines and litigation, and there can be no assurances that our cyber risk insurance coverage will be sufficient in the event of a cyber incident.
The requirements of being a U.S. public company may strain our resources and divert management’s attention.
As a U.S. public company, we are subject to the reporting requirements of the Securities Exchange Act of 1934, as amended (which we refer to herein as the “Exchange Act”), the Sarbanes-Oxley Act, the Dodd-Frank Act, the listing requirements of the NASDAQ Stock Market and other applicable securities rules and regulations. Compliance with these rules and regulations increases our legal and financial compliance costs, makes some activities more difficult, time-consuming or costly and increases demand on our systems and resources, which may increase now that we are no longer an “emerging growth company.” The Exchange Act requires, among other things, that we file annual, quarterly and current reports with respect to our business and operating results. The Sarbanes-Oxley Act requires, among other things, that we maintain effective disclosure controls and procedures and internal control over financial reporting. In order to maintain and, if required, improve our disclosure controls and procedures and internal control over financial reporting to meet this standard, significant resources and management oversight may be required. As a result, management’s attention may be diverted from other business concerns, which could adversely affect our business and operating results. We may need to hire more employees in the future or engage outside consultants to comply with these requirements, which will increase our costs and expenses.
In addition, changing laws, regulations and standards in the U.S. relating to corporate governance and public disclosure are creating uncertainty for public companies, increasing legal and financial compliance costs, and making some activities more time consuming. These laws, regulations and standards are subject to varying interpretations, in many cases due to their lack of specificity, and, as a result, their application in practice may evolve over time as new guidance is provided by regulatory and governing bodies. This could result in continuing uncertainty regarding compliance matters and higher costs necessitated by ongoing revisions to disclosure and governance practices. We intend to invest resources to comply with evolving laws, regulations and standards, and this investment may result in increased general and administrative expenses and a diversion of management’s time and attention from revenue-generating activities to compliance activities. If our efforts to comply with new laws, regulations and standards differ from the activities intended by regulatory or governing bodies due to ambiguities related to their application and practice, regulatory authorities may initiate legal proceedings against us and our business and operating results may be adversely affected.
As a result of disclosure of information in this Annual Report on Form 10-K and in filings required of a public company in the U.S., our business, results of operations, cash flows and financial condition will become more visible, which may result in threatened or actual litigation, including by competitors and other third parties. If such claims are successful, our business and operating results could be adversely affected, and even if the claims do not result in litigation or are resolved in our favor, these claims, and the time and resources necessary to resolve them, could divert the resources of our management and adversely affect our business and operating results.
Strategic and Operational Risks
Our geographic concentration ties our performance to the business, economic, regulatory and other conditions of certain states.
Some jurisdictions generate a more significant percentage of our total premiums than others. Our revenues and profitability are subject to the prevailing regulatory, legal, economic, political, demographic, competitive, weather and other conditions in the principal states in which we do business. Changes in any of these conditions could make it less attractive for us to do business in such states and would have a more pronounced effect on us compared to companies that are more geographically diversified. In addition, our exposure to severe losses from localized perils, such as earthquakes, hurricanes, tropical storms, tornadoes, wind, ice storms, hail, fires, terrorism, riots and explosions, is increased in those areas where we have written significant numbers of P&C insurance policies. Given our geographic concentration, negative publicity regarding our products and services could have a material adverse effect on our business and operations, as could other regional factors impacting the local economies in that market.
The level of earned premiums generated by our business impacts profitability, especially in the near-term. We may experience difficulty in managing historic and future growth, which could adversely affect our results of operations and financial condition.
Maintaining and/or increasing our current level of earned premiums would require geographic expansion and increased market share via our expanded distribution network. Continued growth could impose significant demands on management, including the need to identify, recruit, maintain and integrate additional employees. Growth may also place a strain on management systems and operational and financial resources, and such systems, procedures and internal controls may not be adequate to support operations as they expand. Incremental merger and acquisition activities could affect our minimum efficient scale. Alternatively, a reduction in earned premiums creates potential challenges in terms of expense ratios and other factors that impact profit.
The integration and management of acquired books of business, acquired businesses and other growth initiatives involve numerous risks that could adversely affect our profitability, and are contingent on many factors, including:
expanding our financial, operational and management information systems;
managing our relationships with independent agents, brokers and legacy program managers, including maintaining adequate controls;
expanding our executive management and the infrastructure required to effectively control our growth;
maintaining ratings of our Insurance Subsidiaries;
increasing the statutory capital of our Insurance Subsidiaries to support growth in written premiums;
accurately setting claims provisions for new business where historical underwriting experience may not be available;
obtaining regulatory approval for appropriate premium rates where applicable; and
obtaining the required regulatory approvals to offer additional insurance products or to expand into additional states or other jurisdictions.
Our failure to grow our earned premiums or to manage our growth effectively could have a material adverse effect on our business, financial condition or results of operations.
Engaging in acquisitions involves risks, and if we are unable to effectively manage these risks, our business may be materially harmed.
Acquisitions of similar insurance providers have been a material component of our growth strategy. From time to time, subject to availability of suitable opportunities, market conditions and capital needs or support, we have and, in the future, may engage in discussions concerning acquisition opportunities and, as a result of such discussions, may enter into acquisition transactions. Upon the announcement of an acquisition or other type of business combination, our share price may fall depending on numerous factors, including, but not limited to, the intended target, the size of the acquisition, the purchase price and the potential dilution to existing shareholders. It is also possible that an acquisition could dilute earnings per common share. Acquisitions entail numerous risks, including the following:
difficulties in the integration of the acquired business;
assumption of unknown material liabilities, including deficient provisions for unpaid claims and claims adjustment expenses;
diversion of management’s attention from other business concerns;
failure to achieve financial or operating objectives; and
potential loss of policyholders or key employees of acquired companies.
We may be unable to integrate or profitably operate any business, operations, personnel, services or products we may acquire in the future, which may result in our inability to realize expected revenue increases, cost savings, increases in geographic or product presence, and other projected benefits from the acquisition. Integration may result in the loss of key employees, disruption to our existing businesses or the business of the acquired company, or otherwise harm our ability to retain customers and employees or achieve the anticipated benefits of the acquisition. Time and resources spent on integration may also impair our ability to grow our existing businesses. Also, the negative effect of any financial commitments required by regulatory authorities or rating agencies in acquisitions or business combinations may be greater than expected.
Provisions in our organizational documents, corporate laws and the insurance laws of Illinois, New York and other states could impede an attempt to replace or remove management or directors or prevent or delay a merger or sale, which could diminish the value of our shares.
Our Memorandum of Association, Articles of Association and Code of Regulations and the corporate laws and the insurance laws of various states contain provisions that could impede an attempt to replace or remove management or directors or prevent the sale of the Insurance Subsidiaries that shareholders might consider to be in their best interests. These provisions include, among others:
requiring a vote of holders of 5% of the ordinary voting common shares to call a special meeting of shareholders;
requiring a two-thirds vote to amend the Articles of Association;
requiring the affirmative vote of a majority of the voting power of shares represented at a special meeting of shareholders; and
statutory requirements prohibiting a merger, consolidation, combination or majority share acquisition between Insurance Subsidiaries and an interested shareholder or an affiliate of an interested shareholder without regulatory approval.
These provisions may prevent shareholders from receiving the benefit of any premium over the market price of our shares offered by a bidder in a potential takeover and may adversely affect the prevailing market price of our shares if they are viewed as discouraging takeover attempts.
In addition, insurance regulatory provisions may delay, defer or prevent a takeover attempt that shareholders may consider in their best interest. For example, under applicable state statutes, subject to limited exceptions, no person or entity may, directly or indirectly, acquire control of a domestic insurer without the prior approval of the state insurance regulator. Under the insurance laws, “control” (including the terms “controlling,” “controlled by” and “under common control with”) is generally defined to include acquisition of a certain percentage or more of an insurer’s voting securities (such as 10% or more under Illinois, Missouri and New York law). These requirements would require a potential bidder to obtain prior approval from the insurance departments of the states in which the Insurance Subsidiaries are domiciled and commercially domiciled and may require pre-acquisition notification in other states. Obtaining these approvals could result in material delays or deter any such transaction. Regulatory requirements could make a potential acquisition of our company more difficult and may prevent shareholders from receiving the benefit from any premium over the market price of our shares offered by a bidder in a takeover context. Even in the absence of a takeover attempt, the existence of these provisions may adversely affect the prevailing market price of our shares if they are viewed as discouraging takeover attempts in the future.
Our business depends upon key employees, and if we are unable to retain the services of these key employees or to attract and retain additional qualified personnel, our business may suffer.
Our operations depend, to a great extent, upon the ability of executive management and other key employees to implement our business strategy and our ability to attract and retain additional qualified personnel in the future. The loss of the services of any of our key employees, or the inability to identify, hire and retain other highly qualified personnel in the future could adversely affect the quality and profitability of our business operations. In addition, we must forecast volume and other factors in changing business environments with reasonable accuracy and adjust our hiring and employment levels accordingly. Our failure to recognize the need for such adjustments, or our failure or inability to react appropriately on a timely basis, could lead to over-staffing (which could adversely affect our cost structure) or under-staffing (which could impair our ability to service current product lines and new lines of business). In either event, our financial results and customer relationships could be adversely affected.
Market and Competition Risks
Because the Insurance Subsidiaries areprovide commercial automobile insurers,insurance, conditions in that industry could adversely affect their business.
The majority of the gross premiums written by our Insurance Subsidiariessubsidiaries are generated from commercial automobile insurance policies. Adverse developments in the market for commercial automobile insurance, including those which could result from potential declines in commercial and economic activity, could cause our results of operations to suffer. The commercial automobile insurance industry is cyclical. Historically, the industry has been characterized by periods of price competitionInsurance Subsidiaries’ and excess capacity followed by periods of higher premium rates and shortages of underwriting capacity. These fluctuations in the business cycle have negatively impacted and could continue to negatively impact the revenues of our company. The results of the Insurance Subsidiaries, and in turn, us, may also be affected by risks, to the extent they are covered by the insurance policies we issue, that impact the commercial automobile industry related to severe weather conditions, floods, hurricanes, tornadoes, earthquakes and tsunamis, as well as explosions, terrorist attacks and riots. The Insurance Subsidiaries’AGMI’s commercial automobile insurance business may also be affected by cost trends that negatively impact profitability, such as a continuing economic downturn, inflation in vehicle repair
costs, vehicle replacement parts costs, used vehicle prices, fuel costs and medical care costs. Increased costs related to the handling and litigation of claims may also negatively impact profitability. Legacy business previously written by us also includes private passenger auto, surety and other P&C insurance business. Adverse developments relative to previously written or current business could have a negative impact on our results.
The insurance and related businesses in which we operate may be subject to periodic negative publicity, which may negatively impact our financial results.
The products and services of the Insurance Subsidiaries are ultimately distributed to individual and business customers. From time to time, consumer advocacy groups or the media may focus attention on insurance products and services, thereby subjecting the industry to periodic negative publicity. We also may be negatively impacted if participants in one or more of our markets engage in practices resulting in increased public attention to our business. Negative publicity may also result in increased regulation and legislative scrutiny of practices in the P&C insurance industry as well as increased litigation. These factors may further increase our costs of doing business and adversely affect our profitability by impeding our ability to market our products and services, requiring us to change our products or services or by increasing the regulatory burdens under which we operate.
The highly competitive environment in which we operate could have an adverse effect on our business, results of operations and financial condition.
The commercial automobile insurance business is highly competitive, and, except for regulatory considerations, there are relatively few barriers to entry. Many of our competitors are substantially larger and may enjoy better name recognition, substantially greater financial resources, higher ratings by rating agencies, broader and more diversified product lines, and more widespread agency relationships than we have. Our underwriting profits could be adversely impacted if new entrants or existing competitors try to compete with our products, services and programs or offer similar or better products at or below our prices. Insurers in our markets generally compete on the basis of price, consumer recognition, coverages offered, claims handling, financial stability, customer service and geographic coverage. Although pricing is influenced to some degree by that of our competitors, it is not in our best interest to compete solely on price, and we may, from time to time, experience a loss of market share during periods of intense price competition. Our business could be adversely impacted by the loss of business to competitors offering competitive insurance products at lower prices. This competition could affect our ability to attract and retain profitable business. Pricing sophistication and related underwriting and marketing programs use a number of risk evaluation factors. For auto insurance, these factors can include, but are not limited to, vehicle make, model and year; driver age; territory; years licensed; claims history; years insured with prior carrier; prior liability limits; prior lapse in coverage; and insurance scoring based on credit report information. We believe our pricing model will generate future underwriting profits; however, past performance is not a perfect indicator of future driver performance.
Changes in the nature of the markets we serve could impact the size of our market and/or the market share available to us.
The industry we serve is being impacted by the introduction of mobile applications, including, but not limited to, TNCs, on-line dispatch and tracking, in-vehicle technologies and other technology-related changes. These technologies could change the size of the overall addressable market we serve and may also impact the nature of the risks we insure.
If we are not able to attract and retain independent agents and brokers, our revenues could be negatively affected.
We market and distribute our insurance programs exclusively through independent insurance agents and specialty insurance brokers. As a result, our business depends in large part on the marketing efforts of these agents and brokers and on our ability to offer insurance products and services that meet the requirements of the agents, the brokers and their customers. However, these agents and brokers are not obligated to sell or promote our products and many sell or promote competitors’ insurance products in addition to our products. Some of our competitors have higher financial strength ratings, offer a larger variety of products, set lower prices for insurance coverage and/or offer higher commissions than we do. Therefore, we may not be able to continue to attract and retain independent agents and brokers to sell our insurance products. The failure or inability of independent agents and brokers to market our insurance products successfully could have a material adverse impact on our business, financial condition and results of operations.
If we are unable to maintain our claims-paying ratings or negotiate fronting reinsurance arrangements, our ability to write insurance and to compete with other insurance companies may be adversely impacted. A decline in rating could adversely affect our position in the insurance market, make it more difficult to market our insurance products and cause our premiums and earnings to decrease.
Financial ratings are an important factor influencing the competitive position of insurance companies. Third party rating agencies assess and rate the claims-paying ability of insurers and reinsurers based upon criteria that they have established. Periodically, these rating agencies evaluate the business to confirm that it continues to meet the criteria of the ratings previously assigned. Financial strength ratings are an important factor in establishing the competitive position of insurance companies and may be expected to have an effect on an insurance company’s premiums. The Insurance Subsidiaries are rated by A.M. Best, which issues independent opinions of an insurer’s financial strength and its ability to meet policyholder obligations. A.M. Best ratings range from “A++” (Superior) to “F” (In Liquidation), with a total of 16 separate rating categories. The objective of A.M. Best’s rating system is to provide potential policyholders and other interested parties an opinion of an insurer’s financial strength and ability to meet ongoing obligations, including paying claims.
On June 15, 2018, A.M. Best downgraded the financial strength ratings of American Country, American Service and Gateway to “C” and Global Liberty to “C++.” On March 20, 2019, A.M. Best affirmed rating of the ASI Pool Companies and downgraded Global Liberty to “C+”. Concurrently A.M. Best withdrew these ratings as the Insurance Subsidiaries requested to no longer participate in A.M. Best’s interactive rating process. Most of our business is not sensitive to the A.M. Best rating. However, there is a limited amount of business that, due to airport or port authority requirements, require an A.M. Best rating in excess of those assigned to our companies. We have endeavored to mitigate the impact of those requirements through arrangements with unaffiliated insurance and reinsurance companies with a higher rating, but there can be no assurance that this will be successful. If our companies fail to maintain the existing or negotiate a new fronting reinsurance arrangement, it could result in a substantial loss of business to other competitors with higher ratings, causing premiums and earnings to decrease. Futhermore, our withdrawal from A.M. Best’s rating process may inhibit our ability to secure new business if potential customers do not want to engage an insurance company without an A.M. Best rating.
Our ability to generate written premiums is impacted by seasonality, which may cause fluctuations in our operating results and to our stock price.
The P&C insurance business is seasonal in nature. Our ability to generate written premium is also impacted by the timing of policy effective periods in the states in which we operate, while our net premiums earned generally follow a relatively smooth trend from quarter to quarter. Also, our gross premiums written are impacted by certain common renewal dates in larger metropolitan markets for the light commercial risks that represent our core lines of business. For example, January 1st and March 1st are common taxi cab renewal dates in Illinois and New York, respectively. Our New York “excess taxi program” has an annual renewal date in the third quarter. Net underwriting income is driven mainly by the timing and nature of claims, which can vary widely. As a result of this seasonality, investors may not be able to predict our annual operating results based on a quarter-to-quarter comparison of our operating results. Additionally, this seasonality may cause fluctuations in our stock price. We believe seasonality will have an ongoing impact on our business.
Our ability to manage our exposure to underwriting risks depends on the availability and cost of reinsurance coverage.
Reinsurance is the practice of transferring part of an insurance company’s liability and premium under an insurance policy to another insurance company. We use reinsurance arrangements to limit and manage the amount of risk we retain, to stabilize our underwriting results and to increase our underwriting capacity. The availability and cost of reinsurance are subject to current market conditions and may vary significantly over time. Any decrease in the amount of our reinsurance will increase our risk of loss. We may be unable to maintain our desired reinsurance coverage or to obtain other reinsurance coverage in adequate amounts and at favorable rates. If we are unable to renew our expiring coverage or obtain new coverage, it will be more difficult for us to manage our underwriting risks and operate our business profitably.
It is also possible that the losses we experience on risks that we have reinsured will exceed the coverage limits on the reinsurance. If the amount of our reinsurance coverage is insufficient, our insurance losses could increase substantially.
U.S. Tax Risks
If our company were not to be treated as a U.S. corporation for U.S. federal income tax purposes, certain tax inefficiencies would result and certain adverse tax rules would apply.
Pursuant to certain “expatriation” provisions of the U.S. Internal Revenue Code of 1986, as amended (“IRC”), the reverse merger agreement relating to the reverse merger transaction described below provides that the parties intend to treat our company as a
U.S. corporation for U.S. federal income tax purposes. The expatriation provisions are complex, are largely unsettled and subject to differing interpretations, and are subject to change, perhaps retroactively. If our company was not to be treated as a U.S. corporation for U.S. federal income tax purposes, certain tax inefficiencies and adverse tax consequences and reporting requirements would result for both our company and the recipients and holders of stock in our company, including that dividend distributions from our Insurance Subsidiaries to us would be subject to 30% U.S. withholding tax, with no available reduction and that members of the consolidated group may not be permitted to file a consolidated U.S. tax return resulting in the acceleration of cash tax outflow and potential permanent loss of tax benefits associated with net operating loss carryforwards (“NOLs”) that could have otherwise been utilized.
Our use of losses may be subject to limitations, and the tax liability of our company may be increased.
Our ability to utilize the NOLs is subject to the rules of Section 382 of the IRC. Section 382 generally restricts the use of NOLs after an “ownership change.” An ownership change occurs if, among other things, the stockholders (or specified groups of stockholders) who own or have owned, directly or indirectly, five percent (5%) or more of our common stock or are otherwise treated as five percent (5%) stockholders under Section 382 and the regulations promulgated thereunder increase their aggregate percentage ownership of our stock by more than 50 percentage points over the lowest percentage of the stock owned by these stockholders over a three-year rolling period. In the event of an ownership change, Section 382 imposes an annual limitation on the amount of taxable income a corporation may offset with NOLs. This annual limitation is generally equal to the product of the value of our stock on the date of the ownership change, multiplied by the long-term tax-exempt rate published monthly by the Internal Revenue Service. Any unused annual limitation may be carried over to later years until the applicable expiration date for the respective NOL carryforwards.
The rules of Section 382 are complex and subject to varying interpretations. Because of our numerous equity issuances, which have included the issuance of various classes of convertible securities and warrants, uncertainty existed as to whether we may have undergone an ownership change in the past or as a result of our 2013 U.S. public offering. Based upon management’s assessment, it was determined that at the date of the U.S. public offering there was not an “ownership change” as defined by Section 382. However, on July 22, 2013, as a result of shareholder activity, a “triggering event” as determined under IRC Section 382 was reached. As a result, under IRC Section 382, the use of the Company’s NOLs and other carryforwards generated prior to the “triggering event” will be limited as a result of this “ownership change” for tax purposes, which is defined as a cumulative change of more than 50% during any three-year period by shareholders of the Company’s shares.
|
| | | | |
| Net Operating Loss Carryforward as of December 31, 2018 by Expiry |
| ($ in ‘000s) | | |
| Year of Occurrence | Year of Expiration | Amount |
| 2001 | 2021 | $ | 5,007 |
|
| 2002 | 2022 | 4,317 |
|
| 2006 | 2026 | 7,825 |
|
| 2007 | 2027 | 5,131 |
|
| 2008 | 2028 | 1,949 |
|
| 2009 | 2029 | 1,949 |
|
| 2010 | 2030 | 1,949 |
|
| 2011 | 2031 | 4,166 |
|
| 2012 | 2032 | 9,236 |
|
| 2015 | 2035 | 1 |
|
| 2017 | 2037 | 27,313 |
|
| 2018 | 2038 | 47,653 |
|
| 2018 | Indefinite | 4,106 |
|
| Total | | $ | 120,602 |
|
| | | |
NOLs and other carryforwards generated in 2017 and 2018 are not limited by IRC Section 382.
Further limitations on the utilization of losses may apply because of the “dual consolidated loss” rules, which will also require our company to recapture into income the amount of any such utilized losses in certain circumstances. As a result of the application of these rules, the future tax liability of our company and our Insurance Subsidiaries could be significantly increased. In addition, taxable income may also be recognized by our company or our Insurance Subsidiaries in connection with the 2010 reverse merger transaction.
Item 1B. Unresolved Staff Comments
None.
Item 2. Properties
Our corporate headquarters is located at 953 American Lane, 3rd Floor, Schaumburg, Illinois 60173, USA. The Company-owned facility consists of one three-story office building with approximately 110,000 square feet. An unaffiliated tenant currently leases one floor of the building. We believe that the Schaumburg facility will be sufficient space to support the growth and expansion of our business.
We also lease four additional office spaces to support regional underwriting, claims, and corporate and other operations. The St. Louis, Missouri lease is 4,375 square feet of office space and effective through June 2021. The Manhattan, New York lease is 1,796 square feet of office space andwas effective through February 2020.2020 at which point it was not renewed. Upon completion of the Anchor acquisition, we assumed a lease for 25,396 square feet of office space in Melville, New York, which is effective through March 2022. The Scottsdale, Arizona lease is 2,107 square feet of office space and effective through November 2020.2020, which we did not renew upon expiration.
We own one property in Alabama, which comprises approximately 13.6 acres of land and is currently held for sale.
Item 3. Legal Proceedings
On March 5, 2018, a complaint was filed in the U.S. District Court for the Northern District of Illinois asserting claims under the federal securities laws against the Company and two of its executive officers on behalf of a putative class of purchasers of the Company’s securities, styled Fryman v. Atlas Financial Holdings, Inc., et al., No. 1:18-cv-01640 (N.D. Ill.). Plaintiffs filed an amended complaintcomplaints on July 30, 2018. Defendants filed a motion to dismiss, which was fully briefed as of December 12, 2018. On April 1, 2019, before the Court had addressed defendants’ pending motion to dismiss, the plaintiffs filed a motion for leave to amend their complaint to include allegations relating to the Company’s press release dated March 4, 2019 disclosing a further increase in its loss reserves. The Court subsequently granted plaintiffs leave to file a second amended complaint, which plaintiffs filed on2018, April 9, 2019. On June 5, 2019, before the defendants had responded to the second amended complaint, plaintiffs filed a motion for leave to file a third amended complaint to add allegations relating to developments occurring after the Company’s March 4, 2019 press release. The Court subsequently granted the motion for leave, and plaintiffs filed the third amended complaint on June 12, 2019. In the third amended complaint, the plaintiffs assertsasserted claims under Sections 10(b) and 20(a) of the Securities Exchange Act of 1934 and Rule 10b-5 promulgated thereunder on behalf of a putative class consisting of purchasers of the Company’s securities between February 22, 2017 and April 30, 2019. The complaint alleges2019, alleging that the defendants violated Sections 10(b) and 20(a) of the Securities Exchange Act of 1934 and Rule 10b-5 promulgated thereunder by makingmade allegedly false and misleading statements or failing to disclose certain information regarding the adequacy of the Company’s insurance reserves. The complaint seeks, among other remedies, unspecified damages, attorneys’ fees and other costs, equitable and/or injunctive relief, and such other relief as the court may find just and proper.
Defendants filed a motion to dismiss the third amended complaint, which the Court granted, with leave to amend, in an opinion and order entered on May 26, 2020. In its opinion, the Court held that plaintiffs had failed to adequately allege any false or misleading misstatement of material fact concerning the Company’s insurance reserves and failed to allege facts that would support the required strong inference of scienter. Plaintiffs filed a fourth amended complaint on JulyJune 30, 2020, in which the claims asserted are substantially similar to those asserted in the third amended complaint. Defendants filed a motion to dismiss the fourth amended complaint on August 17, 2019, and briefing on that motion2020. Briefing was completed on October 31, 2019. The motion remains pending before the Court. Under the federal securities laws, discovery and other proceedings automatically will be stayed during the pendency of the motion to dismiss.November 2, 2020.
In addition, in connection with our operations, we are, from time to time, named as defendants in actions for damages and costs allegedly sustained by plaintiffs in connection with claims against the insurance policies we underwrite. While it is not possible to estimate the outcome of the various proceedings at this time, such actions have generally been resolved with minimal damages or expense in excess of amounts provided, and the Company does not believe that it will incur any significant additional loss or expense in connection with such actions.
Item 4. Mine Safety Disclosures
Not applicable.
Part II
Item 5. Market for Registrant’s Common Equity, Related Stockholder Matters and Issuer Purchases of Equity Securities
As of March 8, 2019,November 6, 2020, there were approximately 17552,923 shareholders of record of our ordinary voting common shares. Our ordinary voting common shares have been listed on the NASDAQ under the symbol “AFH” since February 12, 2013 and were previously listed on the Toronto Stock Exchange - Venture (“TSXV”) under the same symbol beginning January 6, 2011.2011 (see Item 1, 2020 Developments). On June 5, 2013, the Company delisted from the TSXV. As of March 8, 2019,November 6, 2020, there were 11,942,81211,993,293 ordinary voting common shares and no restricted voting common shares outstanding.
On March 21, 2017, the Company’s Board of Directors approved a Share Repurchase Program of up to 650,000 shares of common stock. The repurchases could have been made from time to time in open market transactions, privately-negotiated transactions, block purchases, or otherwise in accordance with securities laws at the discretion of the Company’s management until March 21, 2018. The Share Repurchase Program was not extended. The Company’s decisions around the timing, volume, and nature of share repurchases, and the ultimate amount of shares repurchased, was dependent on market conditions, applicable securities laws, and other factors. The share repurchase program and the Board’s authorization of the program could have been modified, suspended, or discontinued at any time. During 2018, 255,505 shares were repurchased under this Share Repurchase Program.
During 2017, the 128,191 restricted voting common shares that were beneficially owned or controlled by KFSI (including its subsidiaries and affiliated companies, “Kingsway”) were sold to non-affiliates of Kingsway. The Kingsway-owned restricted voting common shares automatically converted to ordinary voting common shares upon their sale to non-affiliates of Kingsway.
Due to insurance regulations there are restrictions on our Insurance Subsidiaries (American Country, American Service, Gateway and Global Liberty) that limit the Company’s ability to pay dividends. We did not pay any dividends to our common shareholders during 2017, 2018, 2019 or to dateto-date in 2020, and we have no current plans to pay dividends to our common shareholders. See ‘Part II, Item 7, Management’s Discussion and Analysis, Liquidity and Capital Resources’ for further discussion of regulatory dividend restrictions.
Performance Graph
The following graph shows the cumulative five-year total return on $100 invested on December 31, 2013 in (i) Atlas common stock, (ii) the Russell 2000 Index and (iii) the S&P Global Financial U.S. Insurance P&C Index, in each case with dividends reinvested. The comparisons in the graph below are based on historical data and are not intended to forecast the possible future performance of Atlas common stock.
|
| | | | | | | | | | | | | | | | | | |
| Company/Index | 12/31/13 | 12/31/14 | 12/31/15 | 12/31/16 | 12/31/17 | 12/31/18 |
| Atlas Financial Holdings | $ | 100.00 |
| $ | 110.87 |
| $ | 135.19 |
| $ | 122.62 |
| $ | 139.61 |
| $ | 54.96 |
|
| Russel 2000 Index | $ | 100.00 |
| $ | 104.89 |
| $ | 100.26 |
| $ | 121.63 |
| $ | 139.44 |
| $ | 124.09 |
|
| S&P Global U.S. Insurance P&C Index | $ | 100.00 |
| $ | 114.85 |
| $ | 118.80 |
| $ | 140.21 |
| $ | 160.30 |
| $ | 154.12 |
|
Equity Compensation Plan Information
|
| | | |
| | Number of securities to be issued upon exercise of outstanding options, warrants and rights (a)2 | Weighted average exercise price of outstanding options, warrants and rights (b)3 | Number of securities remaining available for future issuance under equity compensation plans (excluding securities reflected in column (a))4 (c) |
Equity compensation plans approved by security holders1 | 402,195 | — | 791,502 |
|
| | | |
| | Number of securities to be issued upon exercise of outstanding options, warrants and rights (a)2 | Weighted average exercise price of outstanding options, warrants and rights (b)3 | Number of securities remaining available for future issuance under equity compensation plans (excluding securities reflected in column (a))4 |
Equity compensation plans approved by security holders1 | 402,195 | — | 792,086 |
| |
1 | The Company has no equity compensation plans that were not approved by its security holders. |
| |
2 | SumSummation of 402,195 shares outstanding under the January 18, 2011, March 6, 2014 and the March 12, 2015 equity compensation plans. |
| |
3 | Average price not computed due to currency differences. |
| |
4 | Equal to the remainder allowable according to the 2013 Equity Incentive Plan (10% of issued and outstanding ordinary voting common shares). |
Purchases of Equity Securities
No unregistered securities were sold during 2018.2019. No repurchases of equity securities were made during the three month period ended December 31, 2018.2019.
Item 6. Selected Financial Data
The following table has selected financial information for the periods ended andWe are a smaller reporting company as defined in Rule 12b-2 of the dates indicated. These historical resultsExchange Act; therefore, pursuant to Regulation S-K, we are not necessarily indicative of the resultsrequired to be expected from any future period and should be read in conjunction with our consolidated financial statements and the related notes and the section ofmake disclosures under this Annual Report on Form 10-K entitled “Management’s Discussion and Analysis of Financial Condition and Results of Operations.”item.
|
| | | | | | | | | | | | | | | |
| ($ in ‘000s, except for share and per share data) | 2018 | 2017 | 2016 | 2015 | 2014 |
| Net premiums earned | $ | 218,218 |
| $ | 215,771 |
| $ | 171,058 |
| $ | 152,064 |
| $ | 98,124 |
|
| Total revenue | 221,766 |
| 221,975 |
| 177,579 |
| 156,851 |
| 101,618 |
|
| Net (loss) income attributable to common shareholders | (80,012 | ) | (38,810 | ) | 2,365 |
| 14,154 |
| 17,608 |
|
| (Loss) earnings per common share basic | $ | (6.67 | ) | $ | (3.22 | ) | $ | 0.20 |
| $ | 1.18 |
| $ | 1.61 |
|
| (Loss) earnings per common share diluted | $ | (6.67 | ) | $ | (3.22 | ) | $ | 0.19 |
| $ | 1.13 |
| $ | 1.56 |
|
| Combined ratio | 129.0 | % | 122.5 | % | 102.9 | % | 88.2 | % | 91.4 | % |
| | | | | | |
| Cash and invested assets | $ | 200,610 |
| $ | 243,483 |
| $ | 224,779 |
| $ | 233,304 |
| $ | 179,994 |
|
| Total assets | 470,338 |
| 482,503 |
| 423,577 |
| 411,292 |
| 283,911 |
|
| Notes payable | 24,255 |
| 24,031 |
| 19,187 |
| 17,219 |
| — |
|
| Total liabilities | 464,639 |
| 391,858 |
| 296,235 |
| 281,670 |
| 174,512 |
|
| Mezzanine equity | — |
| — |
| — |
| 6,941 |
| 2,000 |
|
| Total shareholders’ equity | 5,699 |
| 90,645 |
| 127,342 |
| 122,681 |
| 107,399 |
|
| Common and restricted shares issued | 12,192,475 |
| 12,164,041 |
| 12,023,295 |
| 12,015,888 |
| 11,771,586 |
|
| Common and restricted shares outstanding | 11,936,970 |
| 12,164,041 |
| 12,023,295 |
| 12,015,888 |
| 11,771,586 |
|
| Book value per common share outstanding | $ | 0.48 |
| $ | 7.42 |
| $ | 10.54 |
| $ | 10.15 |
| $ | 9.08 |
|
These results include the acquisition of Anchor on March 11, 2015, which will affect the comparability of the data. See ‘Part II, Item 8, Note 3, Goodwill and Intangible Assets,’ in the Notes to Consolidated Financial Statements for further discussion of the impact of this acquisition.
Item 7. Management’s Discussion and Analysis (“MD&A”) of Financial Condition and Results of Operations and Financial Condition
The following discussion and analysis of our financial condition and results of operations should be read in conjunction with our consolidated financial statements and related notes that appear elsewhere in this report. In this discussion and analysis, the term “common share” refers to the summation of restricted voting common shares, ordinary voting common shares and participative restricted stock units when used to describe earnings (loss) or book value per common share. All amounts are in U.S. dollars, except for amounts preceded by “C” as Canadian dollars, share and per share amounts.
Forward-Looking Statements
In addition to the historical consolidated financial information, this report contains “forward-looking statements,” within the meaning of the Private Securities Litigation Reform Act of 1995, which may include, but are not limited to, statements with respect to estimates of future expenses, revenue and profitability; trends affecting financial condition, cash flows and results of operations; the availability and terms of additional capital; dependence on key suppliers and other strategic partners; industry trends; the competitive and regulatory environment; the successful integration of acquisitions; the impact of losing one or more senior executives or failing to attract additional key personnel; and, other factors referenced in this report. Factors that could cause or contribute to these differences include those discussed below and elsewhere, particularly in ‘Part I, Item 1A, Risk Factors.’
Often, but not always, forward-looking statements can be identified by the use of words such as “plans,” “expects,” “is expected,” “budget,” “scheduled,” “estimates,” “forecasts,” “intends,” “anticipates,” “believes” or variations (including negative variations) of such words and phrases, or state that certain actions, events or results “may,” “could,” “would,” “might” or “will” be taken, occur or be achieved. Forward-looking statements involve known and unknown risks, uncertainties and other factors which may cause the actual results, performance or achievements of Atlas to be materially different from any future results, performance or achievements expressed or implied by the forward-looking statements. Such factors include, among others, general business, economic, competitive, political, regulatory and social uncertainties.
Although Atlas has attempted to identify important factors that could cause actual actions, events or results to differ materially from those described in forward-looking statements, there may be other factors that cause actions, events or results to differ from those anticipated, estimated or intended. Forward-looking statements contained herein are made as of the date of this report, and Atlas disclaims any obligation to update any forward-looking statements, whether as a result of new information, future events or results, or otherwise. There can be no assurance that forward-looking statements will prove to be accurate, as actual results and future events could differ materially from those anticipated in such statements. Accordingly, readers should not place undue reliance on forward-looking statements due to the inherent uncertainty in them.
I. Company Overview
We are a technology driven financial services holding company incorporated under the laws of the Cayman Islands. Our coreprimary business is thegenerating, underwriting ofand servicing commercial automobile insurance policies, focusingin the United States, with a niche market orientation and focus on insurance for the “light” commercial automobile sector, which is carried outsector.
Our business currently focuses on a managing general agency strategy. Primarily through our Insurance Subsidiaries (American Country, American Service, Gateway and Global Liberty) in conjunction with our wholly owned subsidiary, Anchor Group Management, Inc. (“AGMI”), we are focused on maintaining and recapturing business we have historically written in the taxi, livery/limo and paratransit sectors as well as generating new business that fits our current underwriting parameters. We are also actively pursuing additional programs in the “light” commercial auto space where we believe our expertise, infrastructure and insurance technology will enable us to increase scale and profitability, but there can be no assurance that these programs will materialize. We believe that the specialized infrastructure and technology platforms we’ve developed over the years to support our traditional business will enable us to provide comparative advantages as a managing general agency AGMI. Thisin other commercial auto segments. In particular, our ability to efficiently manage large numbers of small or highly transactional accounts through our technology platform and workflows is a differentiator. We are also evaluating opportunities to leverage our optOnTM insuretech platform which was developed to provide micro-duration commercial automobile insurance for gig-economy drivers via a proprietary mobile app based ecosystem.
The sector on which we traditionally focused includes taxi cabs, non-emergency para-transit, limousine, livery, including certain transportation network companies (“TNCs”) drivers/operators, and business auto. Our goal is to always be the preferred specialty insurance business in any geographic areas where our value proposition delivers benefit to all stakeholders. During 2018,2019, our Insurance Subsidiaries were licensed to write property and casualty (“P&C”) insurance in 49 states and the District of Columbia in the United States (“U.S.”) (see Item 1, 2020 Developments). DuringAs noted elsewhere in this report, certain state licenses held by the 2018 fiscal year,ASI Pool companies were restricted, suspended or revoked. As of the Insurance Subsidiaries distributed theirend of 2019, the ASI Pool Companies were no longer writing new insurance policies and began non-renewing existing policies. AGMI distributes our products through a network of
independent retail agents, and actively wrote insurance in 42 states and the District of Columbia.Columbia during 2019. We embrace continuous improvement, analytics and technology as a means of building on the strong heritage our subsidiary companies cultivated in the niche markets we serve.
Since Atlas’ formation in 2010, we have disposed of non-core assets, consolidated infrastructure and placed into run-off certain non-core lines of business previously written by our Insurance Subsidiaries. Our focus going forward is the underwriting of commercial automobile insurance in the U.S. Substantially all of our new premiums written are in “light” commercial automobile lines of business. See ‘Item 1, 2019 Developments’ and “Risk Factors - Risk Related to 2019 Developments - Regulatory Developments” for certain developments with respect to the Company and the Insurance Subsidiaries subsequent to December 31, 2018.
Commercial Automobile
Our primary target market is made up of small to mid-size taxi, limousine, other livery, including TNC drivers/operators, and non-emergency para-transit operators. The “light” commercial automobile policies we underwrite provide coverage for lightweight commercial vehicles typically with the minimum limits prescribed by statute, municipal or other regulatory requirements. The majority of our policyholders are individual owners or small fleet operators. In certain jurisdictions like Illinois, Louisiana, Nevada and New York, we have also been successful working with larger operators who retain a meaningful amount of their own risk of loss through higher retentions, self-insurance or self-funded captive insurance entity arrangements. In these cases, we provide support in the areas of day-to-day policy administration and claims handling consistent with the value proposition we offer to all of our insureds, generally on a fee for service basis. We may also provide excess coverage above the levels of risk retained by the insureds where a better than average loss ratio is expected. Through these arrangements, we are able to effectively utilize the significant specialized operating infrastructure we maintain to generate revenue from business segments that may otherwise be more price sensitive.Industry Trends
The “light” commercial automobile sector is a subset of the broader commercial automobile insurance industry segment, which over the long term has been historically profitable. In more recent years, the commercial automobile insurance industry has seen profitability pressure. Data compiled by S&P Global also indicates that in 20182019 the total market for commercial automobile liability insurance was approximately $40.4$45.4 billion. The size of the commercial automobile insurance market can be affected significantly by many factors, such as the underwriting capacity and underwriting criteria of automobile insurance carriers and general economic conditions. Historically, the commercial automobile insurance market has been characterized by periods of excess underwriting capacity and increased price competition (“Soft Market”) followed by periods of reduced underwriting capacity and higher premium rates.rates (“Hard Market”). As the the filing of this report, commercial auto insurance has been in a prolonged Hard Market with approximately 35 consecutive quarters of rate increases (source: U.S. Counsel of Insurance Agents and Brokers).
We believe thatHistorically, operators of “light” commercial automobiles maywere expected to be less likely than other business segments within the commercial automobile insurance market to take vehicles out of service, as their businesses and business reputations rely heavily on availability. Our target market has changed in recent years as a result of TNC and other trends related to mobility. The significant expansion of TNC has resulted in a reduction in taxi vehicles available to insure; however, it has increased the number of livery operators. Market research also suggests that the combined addressable markets between traditional taxi, livery and TNC companies expanded during this period.
Other LinesFactors Affecting Our Results of BusinessOperations
Other linesWe generate commission revenue from selling policies in the commercial auto markets on behalf of businessour insurance carrier partners, which compensate us through first year and renewal commissions. We use our proprietary technology and processes to generate and obtain consumer leads and allocate those leads to agents whom we believe are best suited for those consumers. As a result, one of the primary factors affecting our growth is our total number of agents, comprised of both existing core agents and the number of new agents that we contract to sell new policies. We view agents as a critical component of helping consumers through the purchasing process to enable them to identify the most appropriate coverage that suits their needs. Through our surety program, Gateway’s truckyears of experience, we have expanded our recruiting efforts and workers’ compensationenhanced our training programs, American Service’s non-standard personal lines business, Atlas’ workers’ compensation relatedboth of which have allowed us to taxi, other liability, Global Liberty’s homeowners programexpand our agent force. We have also developed proprietary technologies and assigned risk pool business. Allprocesses that enable us to expand our lead acquisition efforts to maintain agent productivity.
The amount of revenue we expect to recognize is based on multiple factors, including our commission rates with our insurance carrier partners and the other lines of business are currently in run-off except for other liability and assigned risk pool business.
Our surety program primarily consisted of U.S. Customs bonds. We engage a former affiliate, Avalon Risk Management, to help coordinate customer service and claims handlingmarket demand for the surety bonds written as this program runs-off. This non-core programtypes of products we offer. The higher our hit ratios on new policies and the higher the our retention ratios the more revenue we expect to generate. Additionally, we may earn certain volume-based compensation from some unrelated risk taking partners , which can include a renewal rights component. Our goal is 100% reinsured to an unrelated third partymaximize policyholder lifetime value by optimizing efficiency and has been transitionedscale, which starts by providing consumers with a transparent, valuable and best-in-class consumer experience by endeavoring to another carrier.support our distribution channel effectively and providing insurance solutions that meet the specific needs of our customers.
The Gateway truck and workers’ compensation programs were put into run-off during 2012. The workers’ compensation programRecent Events
Prior to the strategic transition referenced above, our core business was 100% reinsured retrospectively and prospectively to an unrelated third party. The workers’ compensation reinsurance agreement was terminated during 2017.
Non-standard automobile insurance is principally provided to individuals who do not qualify for standard automobile insurance coverage becausethe underwriting of their payment history, driving record, place of residence, age, vehicle type or other factors. Such drivers typically represent higher than normal risks and pay higher insurance rates for comparable coverage. Consistent with Atlas’ focus on commercial automobile insurance Atlas has transitioned away frompolicies, focusing on the non-standard auto line. Our“light” commercial automobile sector, through American Country, American Service and Gateway (collectively, the “ASI Pool Companies”) and Global Liberty (together with the ASI Pool Companies, our “Insurance Subsidiaries”), along with our wholly owned managing general agency, AGMI. As previously announced, the ASI Pool Companies were in rehabilitation under the statutory control of the Illinois Department of Insurance during the second half of 2019. Regulatory actions were taken in certain states, including restriction, suspension, or revocation of certain state licenses and certificates of authority held by the ASI Pool Companies preceding and following the initiation of rehabilitation.
The Company’s current strategy focuses on AGMI’s managing general agency operation as the primary go-forward business. During 2019 we worked with insurance regulators and advisors to evaluate and take steps intended to achieve the best outcome for stakeholders in connection with our Insurance Subsidiaries ceased writing new and renewal policies of this type in 2011, and earned premium discontinued in 2012, allowing surplus and resourcespursuant to be devotedregulatory actions. See ‘Item 1, 2020 Developments’ for certain developments with respect to the expected growthCompany and the Insurance Subsidiaries subsequent to December 31, 2019. As a result of management no longer having financial control of the commercial automobileASI Pool Companies, they have been deconsolidated from this report. During the fourth quarter of 2019, the Company began actively pursuing the potential sale of Global Liberty, and as a result, Global Liberty has been classified as discontinued operations. These determinations impact the financial presentation in
this report and are more fully described throughout. We feel that the current presentation best represents the aspects of Atlas’ business on which the Company intends to focus going forward.
In December 2019, a novel strain of coronavirus, COVID-19, was reported in Wuhan, China. COVID-19 has since spread rapidly to other countries, including the United States, and the World Health Organization formally declared the COVID-19 outbreak a pandemic in March 2020. With social distancing measures having been implemented to curtail the spread of the virus, we enacted a robust business continuity plan, including a work-from-home policy for all of our employees. We believe our technology platform and pre-existing remote agent capabilities have allowed for a seamless transition to a remote working environment and that our technology platforms continue to provide agents with tools and company contacts necessary to quote our products to our markets.
COVID-19 has dramatically reduced the addressable market. At the time of filing, it is difficult to estimate the near and longer-term impact on market size and potential revenue, and the impact of COVID-19 on our customers appears to have resulted in an approximately reduction of trips and vehicles in operation in the range of 30% to as much as 90% as compared to the end of 2019. This directly impacts our revenue and the ability to generate new business.
Global Liberty’s homeowners program, which is substantially reinsured, was placed into run-off prior to Atlas’ acquisition.There is a relatively small book of business, which is substantially reinsured, that is still in run-off.
Atlas’ workers’ compensation related to taxi and other liability are ancillary products that are offered only to insureds who purchase our commercial automobile insurance products. The workers’ compensation program was non-renewed in 2018 due to limited demand.
Assigned risk pools are established by state governments to cover high-risk insureds who cannot purchase insurance through conventional means.
II. Application of Critical Accounting Estimates
The preparation of financial statements in conformity with accounting principles generally accepted in the United States of America (“U.S. GAAP”) requires management to adopt accounting policies and make estimates and assumptions that affect amounts reported in the consolidated financial statements. The most critical estimates include those used in determining:
Revenue recognition
Fair value of financial assets;
Impairment of financial assets;
Deferred policy acquisition costs;
Claims liabilities;
Valuation of deferred tax assets; and
Reinsurance.assets.
In making these determinations, management makes subjective and complex judgments that frequently require estimates about matters that are inherently uncertain. Many of these policies, estimates and related judgments are common in the insurance and financial services industries; others are specific to our businesses and operations. It is reasonably likely that changes in these items could occur from period to period and result in a material impact on our consolidated financial statements.
A brief summary of each of these critical accounting estimates follows. For a more detailed discussion of the effect of these estimates on our consolidated financial statements, and the judgments and assumptions related to these estimates, see the referenced sections of this document. For a complete summary of our significant accounting policies, see ‘Part II, Item 8, Note 1, Nature of Operations and Basis of Presentation,’ in the Notes to Consolidated Financial Statements.
Revenue Recognition
In accordance with ASC 606, revenue is recognized when a customer obtains control of promised goods or services and is recognized in an amount that reflects the consideration that an entity expects to receive in exchange for those goods or services. We apply the following five-step model in order to determine this amount: (i) identification of the promised goods in the contract; (ii) determination of whether the promised goods are performance obligations, including whether they are distinct in the context of the contract; (iii) measurement of the transaction price, including the constraint on variable consideration; (iv) allocation of the transaction price to the performance obligations; and (v) recognition of revenue when (or as) we satisfy each performance obligation.
Significant management judgments and estimates must be made in connection with determination of the revenue to be recognized in any accounting period. If we made different judgments or utilized different estimates for any period, material differences in the amount and timing of revenue recognized could result. The accounting estimates and judgments related to the recognition of revenue require us to make assumptions about numerous factors such as the determination of the policy price. Before the adoption of ASC 606, we were already using a similar method to calculate the revenue value of commission on premiums written through affiliates so we believe we have the ability to make reasonable estimates for these items and have the appropriate accounting policies and controls in place to do so. The uncertainty associated with the variable consideration is subsequently resolved when the policy is issued, renews, and any adjustments are recognized to the underlying premium in the period incurred.
Fair Value of Financial Assets
Atlas has used the following methods and assumptions in estimating fair value:
Fair values for bonds and equity securities are based on quoted market prices, when available. If quoted market prices are not available, fair values are based on quoted market prices of comparable instruments or values obtained from independent pricing services. Atlas employs a fair value hierarchy to categorize the inputs it uses in valuation techniques to measure the fair value. The hierarchy is comprised of quoted prices in active markets (Level 1), third party pricing models using available trade, bid and market information (Level 2) and internal models without observable market information (Level 3). The Company recognizes transfers between levels of the fair value hierarchy at the end of the period in which events occur impacting the availability of inputs to the fair value methodology. Typically, transfers from Level 2 to Level 3 occur due to collateral performance.
Atlas’ fixed income portfolio is managed by a Securities and Exchange Commission (“SEC”) registered investment adviser specializing in the management of insurance company portfolios. Management works directly with them to ensure that Atlas benefits from their expertise and also evaluates investments as well as specific positions independently using internal resources. Atlas’ investment adviseradvisor has a team of credit analysts for all investment grade fixed income sectors. The investment process begins with an independent analyst review of each security’s credit worthiness using both quantitative tools and qualitative review. At the issuer level, this includes reviews of past financial data, trends in financial stability, projections for the future, reliability of the management team in place and market data (credit spread, equity prices, trends in this data for the issuer and the issuer’s industry). Reviews also consider industry trends and the macro-economic environment. This analysis is continuous, integrating new information as it becomes available. As of December 31, 2018,2019, this process did not generate any significant difference in the rating assessment between Atlas’ review and the rating agencies.
Atlas employs specific control processes to determine the reasonableness of the fair value of its financial assets. These processes are designed to supplement those performed by our external portfolio manager to help ensure that the values received from them are accurately recorded and that the data inputs and the valuation techniques utilized are appropriate, consistently applied, and that the assumptions are reasonable and consistent with the objective of determining fair value. For example, on a continuing basis, Atlas assesses the reasonableness of individual security values which have stale prices or whose changes exceed certain thresholds as compared to previous values received from our external portfolio manager or to expected prices. The portfolio is reviewed routinely for transaction volumes, new issuances, any changes in spreads, as well as the overall movement of interest rates along the yield curve to determine if sufficient activity and liquidity exists to provide a credible source for market valuations. When fair value determinations are expected to be more variable, they are validated through reviews by members of management or the Board of Directors who have relevant expertise and who are independent of those charged with executing investment transactions.
Changes in inflation can influence the interest rates which can impact the fair value of our available-for-sale fixed income portfolio and yields on new investments. The Investment Committee of the Board of Directors considers inflation when providing guidance and analyzing the investment portfolio to provide a stable source of income to supplement underwriting income.
Impairment of Financial Assets
Atlas assesses, on a quarterly basis, whether there is objective evidence that a financial asset or group of financial assets is impaired. An investment is considered impaired when the fair value of the investment is less than its cost or amortized cost. When an investment is impaired, the Company must make a determination as to whether the impairment is other-than-temporary.
Under U.S. GAAP, with respect to an investment in an impaired debt security, other-than-temporary impairment (“OTTI”) occurs if (a) there is intent to sell the debt security, (b) it is more likely than not it will be required to sell the debt security before its anticipated recovery, or (c) it is probable that all amounts due will be unable to be collected such that the entire cost basis of the security will not be recovered. If Atlas intends to sell the debt security, or will more likely than not be required to sell the debt security before the anticipated recovery, a loss in the entire amount of the impairment is reflected in net realized gains (losses) on investments in the consolidated statements of (loss) income and comprehensive (loss) income.operations. If Atlas determines that it is probable it will be unable to collect all amounts and Atlas has no intent to sell the debt security, a credit loss is recognized in net realized gains (losses) on investments in the consolidated statements of (loss) income and comprehensive (loss) incomeoperations to the extent that the fair value is less than the amortized cost basis; any difference between fair value and the new amortized cost basis (net of the credit loss) is reflected in accumulated other comprehensive (loss) income, net of applicable income taxes.
For equity securities, the Company evaluates its ability to retain its investment in the issuer for a period of time sufficient to allow for any anticipated recovery in fair value. Evidence considered to determine anticipated recovery are analysts’ reports on the near-term prospects of the issuer and the financial condition of the issuer or the industry, in addition to the length and extent of the market value decline. If an OTTI is identified, the equity security is adjusted to fair value through a charge to earnings.
Seeearnings (see ‘Part II, Item 8, Note 5, Investments’ in the Notes to Consolidated Financial Statements for further discussion of OTTI.Statements).
Deferred Policy Acquisition Costs
Atlas defers brokers’ commissions, premium taxes and other underwriting and marketing costs directly relating to the successful acquisition of premiums written to the extent they are considered recoverable. The other underwriting and marketing costs include a percentage of salary and related expense, payroll taxes and travel of our marketing and underwriting employees. The percentage is derived from an annual persistency rate study using policy and vehicle counts to compute a hit ratio. The deferred costs are then expensed as the related premiums are earned. The method followed in determining the deferred policy acquisition costs (“DPAC”) limits the deferral to its realizable value by giving consideration to estimated future claims and expenses to be incurred as premiums are earned. Changes in estimates, if any, are recorded in the accounting period in which they are determined. Anticipated investment income is included in determining the realizable value of the DPAC. Atlas’ DPAC are reported net of deferred ceding commissions.
Claims Liabilities
The provision for unpaid claim and claim adjustment expenses represent the estimated liabilities for reported claims, plus those incurred but not yet reported (“IBNR”), and the related estimated claim adjustment expenses. Unpaid claim expenses are determined using case-basis evaluations and statistical analyses, including insurance industry claims data, and represent estimates of the ultimate cost of all claims incurred. Although considerable variability is inherent in such estimates, management believes that the liability for unpaid claim and claim adjustment expenses is adequate. The estimates are continually reviewed and adjusted as necessary; such adjustments are included in current operations and are accounted for as changes in estimates.
Atlas considers the impact of inflation when establishing adequate rates and estimating the provision for unpaid claim and claim adjustment expenses. We establish reserves to cover our estimated liability for the payment of claims and expenses related to the administration of claims incurred on the insurance policies we write. Inflation has a larger impact the longer the time between the issuance of the policy and the final settlement of claims. Greater than expected claims costs above the established reserves will require an increase in claims reserves and reduce the earnings in the period the deficiency was established. We consider the impact of inflation on these reserves when establishing policy rates.
Management utilizes independent actuaries to provide guidance for the establishment of the Company’s liabilities for unpaid claim, claim adjustment expenses, and IBNR. In establishing the ultimate claims liability, actuarial judgment is relied upon in order to make appropriate assumptions to determine a best estimate of ultimate claim liabilities. There are inherent uncertainties associated with this estimation process, especially when a company is undergoing changes in its claim settlement practices or when behaviors of policyholders are influenced by external factors and/or market dynamics. As an example, during calendar year 2016, the Company introduced predictive analytics in addition to making significant efforts to reduce claim tail risk by accelerating claim closure rates. These changes have had a material impact on claim development as described further in ‘Part II, Item 8, Note 11, Claims Liabilities’ in the Notes to Consolidated Financial Statements.
At any given point in time, the recorded claim liabilities represent our best estimate of the ultimate settlement and administration cost of insured claims incurred and unpaid. Since the process of estimating claim and claim adjustment liabilities requires significant judgment due to a number of variables, such as fluctuations in inflation, judicial decisions, legislative changes and changes in
claim handling procedures, the ultimate liability may exceed or be less than these estimates. Claim liabilities are revised as additional information becomes available, and adjustments, if any, are reflected in earnings in the periods in which they are determined.
In selecting development factors and averages described in ‘Part II, Item 8, Note 11, Claims Liabilities’ in the Notes to Consolidated Financial Statements, due consideration is given to how the historical experience patterns change from one year to the next over the course of several consecutive years of recent history. Predictions surrounding these patterns drive the estimates that are produced by each method and are based on statistical techniques that follow standard actuarial practices.
In compliance with annual statutory reporting requirements, our appointed independent actuaries provide a Statement of Actuarial Opinion (“SAO”) indicating that carried claim liabilities recorded at each annual balance sheet date make a reasonable provision for the Insurance Subsidiaries’ claim liabilities obligations under the term of contracts and agreements with our policyholders. Recorded claim liabilities are compared to the indicated range provided in the actuary’s report accompanying the SAO. At December 31, 2018, the recorded amount for claim liabilities falls within the range determined by the appointed independent actuaries.
The methods employed by actuaries include a range of estimated claim liabilities, each reflecting a level of uncertainty. Projections of claim liabilities are subject to potentially large variability in the estimation process since the ultimate disposition of claims incurred prior to the financial statement date, whether reported or not, is subject to the outcome of events that have not yet occurred. Examples of these events include jury decisions, court interpretations, legislative changes, and economic conditions. Any estimate of future costs is subject to the inherent limitation on one’s ability to predict the aggregate course of future events. It should therefore be expected that the actual emergence of claim liabilities will vary, perhaps materially, from any estimate.
We believe our claim liability reserves are appropriately established based on available methodology, facts, technology, laws and regulations. We calculate and record a single best reserve estimate, in conformance with generally accepted actuarial standards, for reported and unreported claim liabilities.
Valuation of Deferred Tax Assets
Deferred taxes are recognized using the asset and liability method of accounting. Under this method, the future tax consequences attributable to temporary differences in the tax basis of assets, liabilities and items recognized directly in equity and the financial reporting basis of such items are recognized in the financial statements by recording deferred tax assets (“DTAs”) or deferred tax liabilities (“DTLs”).
DTAs related to the carry-forward of unused tax losses and credits, and those arising from temporary differences are recognized only to the extent that it is probable that future taxable income will be available against which they can be utilized. DTAs and DTLs are measured using enacted tax rates expected to apply to taxable income in the years in which those temporary differences are expected to be recovered or settled. The effect on future tax assets and liabilities of a change in tax rates is recognized in income in the period that includes the date of enactment or substantive enactment.
In assessing the need for a valuation allowance, Atlas considers both positive and negative evidence related to the likelihood of realization of the DTAs. Atlas performs an assessment of recoverability of its DTAs on a quarterly basis. If, based on the weight of available evidence, it is more likely than not the DTAs will not be realized, a valuation allowance is recognized in income in the period that such determination is made. As of December 31, 2018, Atlas has recorded a valuation allowance of $32.5 million and $29.4 million recorded against the Company’s DTAs. The Company had no valuation allowancefor its gross future deferred tax assets as of December 31, 2017.2019 and 2018, respectively.
Reinsurance
As part of Atlas’ insurance risk management policies, portions of its insurance risk is ceded to reinsurers. Reinsurance premiums and claims adjustment expenses are accounted for on a basis consistent with those used in accounting for the original policies issued and the terms of the reinsurance contracts. Premiums and claims and claims adjustment expenses ceded to other companies have been reported as a reduction of premium revenue and incurred claims. Commissions paid to Atlas by reinsurers on business ceded have been accounted for as a reduction of the related policy acquisition costs. Reinsurance recoverables are recorded for that portion of paid and unpaid claims and claims adjustment expenses that are ceded to other companies. Prepaid reinsurance premiums are recorded for unearned premiums that have been ceded to other companies.
III. Operating Results
Highlights
Gross premiums written were $286.6$160.7 million in 2018, an increase2019, a decrease of 3.9%32.8% from $276.0$239.1 million in 2017.
In-force premium was $286.1 million as of December 31, 2018, an increase of $17.6 million from $268.5 million as of December 31, 2017.
2018.Total revenue was $221.8$120.6 million in 20182019 compared to $222.0$191.4 million in 2017.2018.
Underwriting loss was $63.2$9.0 million in 20182019 compared to an underwriting loss of $48.5$52.4 million in 2017.
The combined ratio was 129.0% in 2018, an increase of 6.5 points, compared to 122.5% in 2017.2018.
Net loss from continuing operations was $80.0$13.0 million (including $4.4 million of loss on disposal of the ASI Pool entities), or $1.09 loss per common share diluted, in 2019 compared to a net loss from continuing operations of $68.6 million, or $6.67$5.72 loss per common share diluted, in 2018, compared to a net loss of $38.8 million, or $3.22 loss per common share diluted, in 2017, representing a decreasean increase in earnings per common share diluted of $3.45.$4.63.
BookNet loss from discontinued operations was $7.4 million, or $0.62 loss per common share diluted in 2019 compared to a net loss from discontinued operations of $11.4 million, or $0.95 loss per common share diluted, in 2018, representing an increase in earnings per common share diluted of $0.33.
Including the change in accounting treatment in the fourth quarter of 2019, book value per common share decreased $6.94$1.19 to $(0.71) as of December 31, 2019 from $0.48 as of December 31, 2018 from $7.42 as of December 31, 2017.
Return on equity was a negative 166.1% in 2018 as compared to a negative 35.6% in 2017.2018.
| | Consolidated Performance | | ($ in ‘000s, except per share data) | Year ended December 31, | Year ended December 31, |
| | 2018 | 2017 | 2016 | 2019 | 2018 |
| Gross premiums written | $ | 286,614 |
| $ | 275,961 |
| $ | 225,095 |
| $ | 160,684 |
| $ | 239,074 |
|
| Net premiums earned | 218,218 |
| 215,771 |
| 171,058 |
| 110,241 |
| 180,686 |
|
| Commission income | | 7,458 |
| 7,877 |
|
| Net claims incurred | 220,662 |
| 203,873 |
| 134,746 |
| 80,767 |
| 182,256 |
|
| Underwriting expense: | | |
| Acquisition costs | 26,115 |
| 27,885 |
| 18,803 |
| 11,825 |
| 28,383 |
|
| Share-based compensation | 1,201 |
| 1,176 |
| 1,552 |
| |
| Expenses recovered related to acquisitions and stock purchase agreements | (520 | ) | — |
| (6,297 | ) | |
| Expenses incurred (recovered) related to acquisitions and stock purchase agreements | | — |
| (520 | ) |
| DPAC amortization | (225 | ) | 806 |
| (746 | ) | 1,498 |
| (225 | ) |
| Other underwriting expenses | 34,139 |
| 30,548 |
| 27,983 |
| 32,651 |
| 31,021 |
|
| Total underwriting expenses | 60,710 |
| 60,415 |
| 41,295 |
| 45,974 |
| 58,659 |
|
| Underwriting loss | (63,154 | ) | (48,517 | ) | (4,983 | ) | (9,042 | ) | (52,352 | ) |
| Net investment income | 2,647 |
| 4,897 |
| 4,824 |
| 1,902 |
| 1,793 |
|
| Goodwill impairment loss | (2,726 | ) | — |
| — |
| |
| Goodwill and intangible asset impairment loss | | (740 | ) | (2,726 | ) |
| Loss from operating activities, before income taxes | (63,233 | ) | (43,620 | ) | (159 | ) | (7,880 | ) | (53,285 | ) |
| Interest expense | (1,869 | ) | (1,840 | ) | (1,026 | ) | (1,466 | ) | (1,869 | ) |
| Loss from change in fair value of equity securities | (198 | ) | — |
| — |
| (277 | ) | (198 | ) |
| Realized gains and other income | 1,099 |
| 1,307 |
| 1,697 |
| 1,274 |
| 1,220 |
|
| Net (loss) income before income taxes | (64,201 | ) | (44,153 | ) | 512 |
| |
| Income tax expense (benefit) | 15,811 |
| (5,343 | ) | (2,134 | ) | |
| Net (loss) income | $ | (80,012 | ) | $ | (38,810 | ) | $ | 2,646 |
| |
| Loss on disposal of subsidiaries | | (4,427 | ) | — |
|
| Net loss before income taxes | | (12,776 | ) | (54,132 | ) |
| Income tax expense | | 223 |
| 14,494 |
|
| Loss from discontinued operations, net of tax | | (7,427 | ) | (11,386 | ) |
| Net loss | | $ | (20,426 | ) | $ | (80,012 | ) |
| | | |
Key Financial Ratios1 | | |
| Loss ratio | 101.1 | % | 94.5 | % | 78.8 % |
| 73.3 | % | 100.9 | % |
| Underwriting expense ratio: | | |
| Acquisition cost ratio | 12.0 |
| 12.9 |
| 11.0 |
| 10.7 |
| 15.8 |
|
| Share-based compensation ratio | 0.6 |
| 0.5 |
| 0.9 |
| |
| Expenses recovered related to acquisitions and stock purchase agreements ratio | (0.2 | ) | — |
| (3.7 | ) | |
| Expenses incurred (recovered) related to acquisitions and stock purchase agreements ratio | | — |
| (0.2 | ) |
| DPAC amortization ratio | (0.1 | ) | 0.4 |
| (0.4 | ) | 1.4 |
| (0.1 | ) |
| Other underwriting expense ratio | 15.6 |
| 14.2 |
| 16.3 |
| 29.6 |
| 17.2 |
|
| Total underwriting expense ratio | 27.9 |
| 28.0 |
| 24.1 |
| 41.7 |
| 32.5 |
|
| Combined ratio | 129.0 | % | 122.5 | % | 102.9 | % | 115.0 | % | 133.4 | % |
| (Loss) earnings per common share diluted | $ | (6.67 | ) | $ | (3.22 | ) | $ | 0.19 |
| $ | (1.09 | ) | $ | (5.72 | ) |
| Book value per common share | $ | 0.48 |
| $ | 7.42 |
| $ | 10.54 |
| $ | (0.71 | ) | $ | 0.48 |
|
| Return on equity | (166.1) | % | (35.6) | % | 2.1 | % | |
| |
1 | Ratios are calculated as a percentage of net premiums earned. |
Revenues
We deriveHistorically, our revenues were derived primarily from premiums from our insurance policies and income from our investment portfolio. As a larger percentage of our premium is written by AGMI with unrelated strategic risk-taking partners, commission is expected to represent the majority of the Company’s revenue going forward. Our underwriting approach is to price our products with the objective of generating underwriting profit for the insurance companies we own.own and with whom we partner. The Company’s philosophy is to prioritize improvement in underwritingprofit margin over top line growth. As with all P&C insurance companies,businesses, the impact of price changes, and other underwriting activities and market conditions is reflected in our financial results over time. Underwriting changes on our in-force policies occur as they are renewed. This cycle generally takes twelve months for our entire book of business and up to an additional twelve months to earn a full year of premium and recognize commissions at the renewal rate.
We approach investment and capital management with the intention of supporting insurance operations by providing a stable source of income to supplement underwriting income. The goals of our investment policy are to protect capital while optimizing investment income and capital appreciation and to maintain appropriate liquidity. We follow a formal investment policy, and the Board of Directors reviews the portfolio performance at least quarterly for compliance with the established guidelines. The Investment Committee of the Board of Directors provides interim guidance and analysis with respect to asset allocation, as deemed appropriate.
Expenses
Net claims incurred expenses are a function of the amount and type of insurance contracts we write and of the claims experience of the underlying risks. We record net claims incurred based on an actuarial analysis of the estimated claims we expect to be reported on contracts written. We seek to establish case reserves at our Insurance Subsidiaries at the maximum probable exposure, based on our historical claims experience and, beginning in 2016, the use of claim related predictive analytics. Our ability to estimate net claims incurred accurately at the time of pricing our contracts is a critical factor in determining our profitability. The amount reported under net claims incurred in any period includes payments in the period net of the change in the value of the reserves for net claims incurred between the beginning and the end of the period, as well as estimation of potential future trends or changes. While the Company relieshas always relied on independent actuarial professionals and internal controls in this regard, the estimation of reserves is inherently uncertain. We are committed to continuous improvement in this area of our business. As a result of the ASI Pool Companies being placed in rehabilitation by the Illinois Department of Insurance, management of the Company no longer has the authority to establish reserves for these entities. The strategic shift undertaken by the Company coupled with regulatory actions related to the ASI Pool Companies had a major effect on our business. Expenses related to the deconsolidated entities no longer have an impact on our operating results beginning in Q4 2019. Also, beginning in Q4 2019, Global Liberty is classified as a discontinued operation and its expenses will be considered as such. Going forward, all expenses will be related to the MGA, to optOnTM and to the parent company structure.
Acquisition costs at our Insurance Subsidiaries consist principally of brokerage and agent commissions and, to a lesser extent, premium taxes. The brokerage and agent commissions paid to our external producers are reduced by ceding commissions received from assuming reinsurers that represent a percentage of the premiums on insurance policies and reinsurance contracts written and vary depending upon the amount and types of contracts written.
Other underwriting expenses consist primarily of personnel related expenses (including salaries, benefits and certain costs associated with awards under our equity compensation plans, such as share-based compensation expense) and other general operating expenses. We believe that because a portion of our personnel expenses are relatively fixed in nature, changes in premium writings may impact our operating scale and operating expense ratios. Commissions and other fee related revenue were earned and recognized in connection with policies managed by AGMI for the discontinued operations of Global Liberty, the Q4 2019 policies managed for the deconsolidated ASI Pool Companies and the external program related to National Interstate.
Gross Premiums Written
Re-underwriting actions began in 2017 in response to the Company’s higher commercial auto loss trends in recent years. These actions resulted in a combination of rate increases and the non-renewal of certain under performing accounts in 2018. Starting in 2016, we saw a decline in our taxi business as some passengers and drivers migrated to a TNC market. However, this was generally offset by corresponding growth in our limousine and livery business. Growth in vehicle count in our limousine and livery business is positively influenced by passengers and drivers increasingly participating in the TNC market. With an ever-aging population that has better medical care and longer lifespans, the demand for para-transit services continues to rise. We anticipate that para-transit businesses may need to collaborate with ride-sharing companies in order to meet the increase in demand. Recognizing that ride-share drivers have unique insurance risks, Atlas developed a new mobile, on-demand, commercial insurance product for ride-share drivers, optOnTM, which we launched as an Illinois only pilot in October 2018. The easy-to-use mobile app provides short-term primary insurance coverage for ride-share drivers across all ride-share driving periods in a fully digital ecosystem with premium priced per mile. The Company is evaluating the best way to strategically expand on this technology. |
| | | | | | | | | | | | | |
| Gross Premiums Written by Line of Business |
| ($ in ‘000s) | Year ended December 31, | % Change |
| | 2018 | 2017 | 2016 | 2018 vs. 2017 | 2017 vs. 2016 |
| Commercial automobile | $ | 283,907 |
| $ | 274,705 |
| $ | 223,801 |
| 3.3 | % | 22.7 | % |
| Other | 2,707 |
| 1,256 |
| 1,294 |
| 115.5 |
| (3.0 | ) |
| Total | $ | 286,614 |
| $ | 275,961 |
| $ | 225,095 |
| 3.9 | % | 22.6 | % |
| | | | | | |
Gross premiums written were $286.6$160.7 million in 2019 compared to $239.1 million in 2018, compared to $276.0 million in 2017, representing an increasea decrease of 3.9%32.8%. The increasedecrease is primarily due to growthre-underwriting activities during the first half of calendar year 2019 as well as the deconsolidation of policies for the ASI Pool Companies beginning in our para-transit and livery/TNC lines, primarily in New York and California, partially offset by a decrease in taxi gross premiums written. The decrease in taxi business resulted from the non-renewal of one large Illinois account and the loss of airport business in certain states due to the lowering of the A.M. Best ratings of American Country, American Service and Gateway, or collectively, the “ASI Pool Subsidiaries.”
Gross premiums written were $276.0 million in 2017 compared to $225.1 million in 2016, representing a 22.6% increase. The increase primarily resulted from growth in livery/limousine and para-transitQ4 2019. These gross premiums written primarily in New York, California and New Jersey, offsetamounts do not include premiums produced by a decrease in taxi gross premiums written in Louisiana and Nevada and in all lines in Minnesota and Michigan.AGMI with non-owned risk taking partners.
New premium business on our core lines represented approximately 31.6%, 40.7% and 33.9% of the total gross premiums written in 2018, 2017 and 2016, respectively. The decrease in new business premium growth from 2017 to 2018 occurred due to smaller fleet size in our livery/TNC business and less taxi business. The increase in new business growth from 2016 to 2017 primarily resulted from one large New York livery/TNC account written and growth in all products in the states of California and New Jersey.
In-force premium was $286.1 million, $268.5 million and $224.6 million as of December 31, 2018, 2017 and 2016, respectively. Gross unearned premium reserves were $134.0 million and $128.0 million as of December 31, 2018 and 2017, respectively. The increase in gross unearned premium reserves and in-force premium since December, 31, 2017 primarily resulted from growth in our para-transit and livery/TNC lines during the second half of 2018. Gross unearned premium reserves were $128.0 million and $113.2 million as of December 31, 2017 and 2016, respectively. The increase in gross unearned premium reserves and in-force premium since December 31, 2016 primarily resulted from growth in the states of California, New Jersey and New York, offset by a reduction in business in the states of Louisiana, Michigan and Minnesota. |
| | | | | | | | |
| Gross Premiums Written by Line of Business |
| ($ in ‘000s) | Year ended December 31, | % Change |
| | 2019 | 2018 | 2019 vs. 2018 |
| Commercial automobile | $ | 138,034 |
| $ | 237,729 |
| (41.9 | )% |
| Other | 22,650 |
| 1,345 |
| 1,584.0 |
|
| Total | $ | 160,684 |
| $ | 239,074 |
| (32.8 | )% |
| | | | |
Geographic Concentration
| | | Gross Premiums Written by State | Gross Premiums Written by State | | | Gross Premiums Written by State |
| ($ in ‘000s) | Year ended December 31, | Year ended December 31, |
| | 2018 | 2017 | 2016 | 2019 | 2018 |
| New York | $ | 110,031 |
| 38.4 | % | $ | 99,374 |
| 36.0 | % | $ | 69,737 |
| 31.0 | % | $ | 61,902 |
| 38.5 | % | $ | 82,207 |
| 34.4 | % |
| California | 46,566 |
| 16.2 |
| 42,165 |
| 15.3 |
| 29,784 |
| 13.2 |
| 33,062 |
| 20.6 |
| 44,924 |
| 18.8 |
|
| New Jersey | 12,465 |
| 4.3 |
| 11,090 |
| 4.0 |
| 4,881 |
| 2.2 |
| |
| Virginia | | 7,840 |
| 4.9 |
| 9,119 |
| 3.8 |
|
| Illinois | 11,599 |
| 4.0 |
| 15,664 |
| 5.7 |
| 12,398 |
| 5.5 |
| 6,439 |
| 4.0 |
| 11,599 |
| 4.9 |
|
| Virginia | 10,009 |
| 3.5 |
| 8,704 |
| 3.2 |
| 7,940 |
| 3.5 |
| |
| Minnesota | | 4,203 |
| 2.6 |
| 5,862 |
| 2.5 |
|
| Louisiana | 7,526 |
| 2.6 |
| 6,140 |
| 2.2 |
| 10,337 |
| 4.6 |
| 4,190 |
| 2.6 |
| 7,526 |
| 3.1 |
|
| Texas | | 3,753 |
| 2.3 |
| 7,017 |
| 2.9 |
|
| Georgia | | 3,670 |
| 2.3 |
| 5,768 |
| 2.4 |
|
| Ohio | 7,335 |
| 2.6 |
| 7,204 |
| 2.6 |
| 5,942 |
| 2.6 |
| 3,282 |
| 2.0 |
| 7,335 |
| 3.1 |
|
| Texas | 7,045 |
| 2.5 |
| 8,511 |
| 3.1 |
| 7,881 |
| 3.5 |
| |
| Nevada | 5,947 |
| 2.1 |
| 6,449 |
| 2.3 |
| 7,966 |
| 3.5 |
| 2,678 |
| 1.7 |
| 5,947 |
| 2.5 |
|
| Minnesota | 5,862 |
| 2.0 |
| 6,453 |
| 2.3 |
| 9,542 |
| 4.3 |
| |
| Other | 62,229 |
| 21.8 |
| 64,207 |
| 23.3 |
| 58,687 |
| 26.1 |
| 29,665 |
| 18.5 |
| 51,770 |
| 21.6 |
|
| Total | $ | 286,614 |
| 100.0 | % | $ | 275,961 |
| 100.0 | % | $ | 225,095 |
| 100.0 | % | $ | 160,684 |
| 100.0 | % | $ | 239,074 |
| 100.0 | % |
| | | | | | | | | | | |
As illustrated by the table above, 38.4%, 36.0%38.5% and 31.0%34.4% of Atlas’ gross premiums written with our Insurance Subsidiaries in 2018, 20172019 and 2016,2018, respectively, came from New York. The five states currently producing the most premium volume accounted for 66.4%70.6% of gross premiums written in 2018,2019, as compared to 64.2% and 55.4%64.4% in 2017 and 2016, respectively. In 2018, the increase in New York gross premiums written came from growth in the livery/TNC line, and the increase in California gross premiums written resulted from growth in all products. In 2017, approximately 62.5% of the increase in New York gross premiums written came from one new large limousine fleet account.2018.
Ceded Premiums Written
Ceded premiums written is equal to premiums ceded under the terms of Atlas’ in force reinsurance treaties. Atlas generally purchasespurchased reinsurance in an effort to limit net exposure on any one claim to a maximum amount of $500,000 with respect to commercial automobile liability claims. This Excess of Loss reinsurance iswas primarily secured through General Reinsurance Corporation (“Gen Re”), a subsidiary of Berkshire Hathaway, Inc. Atlas also purchasespurchased reinsurance from Gen Re in an effort to protect against awards in excess of its policy limits. Effective July 1, 2014, Atlas implemented a quota share reinsurance agreement with Swiss Reinsurance America Corporation (“Swiss Re”) for its commercial auto and general liability lines of business (“Quota Share”) written by the ASI Pool Subsidiaries.Companies. The Quota Share agreement had an initial cession rate of 5%, which was increased to 15% effective April 1, 2015 and then was decreased to 5% effective July 1, 2016. Effective April 1, 2018, the Quota Share cession rate was increased to 30%. The Quota Share provides the Company with financial flexibility to manage expected growth and the timing of potential future capital raising activities. Global Liberty has a 25% quota share reinsurance agreement with Swiss Re for its commercial auto and general liability lines of business (“Global Quota Share”). The cession rate of the Global Quota Share remainedwas increased to 30% in 2019 and was at 25% for 2018, 2017 and 2016.2018.
Ceded premiums written increased 92.8%0.1% to $86.4$72.9 million in 20182019 compared to $44.8$72.8 million in 2017,2018, primarily due to the increase in the Quota Share cession rate. Ceded premiums written decreased 0.5% to $44.8 million in 2017 compared to $45.0 million in 2016, primarily due to reductions in the cession rates of the Quota Share agreement and Global Liberty’s commercial automobile excess of loss
These reinsurance contracts, offset by premium growth as compared to the prior year period. As our limousine and para-transit business grows, we expect ceded premiums written to increase, because, under the current market conditions, the reinsurance costs are more expensive for these products.agreements were terminated on or before December 31, 2019.
Net Premiums Written
Net premiums written is equal to gross premiums written less the ceded premiums written under the terms of Atlas’ in-force reinsurance treaties. Net premiums written totaled $200.2$87.8 million in 2018,2019, a decrease of 13.4%47.2% from $231.1$166.3 million in 2017, following an increase of 28.4% in 2017 from $180.1 million in 2016.2018. The changes are attributed to the combined effects of the reasons cited in the ‘Gross Premiums Written’ and ‘Ceded Premiums Written’ sections above.
Net Premiums Earned
Premiums are earned ratably over the term of the underlying policy. Net premiums earned totaled $218.2$110.2 million in 2018, an increase2019, a decrease of 1.1%39.0% compared to $215.8$180.7 million in 2017, following an increase of 26.1% in 2017 compared to $171.1 million in 2016.2018. The changes are attributed to the combined effects of the reasons cited in the ‘Gross Premiums Written’ and ‘Ceded Premiums Written’ sections above.
Commission Income
AGMI earns commission for the sale of first year and renewal policies from our insurance carrier partners, which are presented in our consolidated statements of operations as commission revenue. Our contracts with our insurance carrier partners contain a commission percentage that is used to compute the total commission due per policy written. Our commission revenue is recognized upon the sale or renewal of a policy. After a policy is sold, we have policy management obligations to the policyholder and the insurance carrier partner, including, but not limited to, policy endorsements, policy cancellations and policy restatements. Therefore, we do incur additional expense related to our policy management requirements. Most costs associated with the sale of an individual policy are incurred prior to or at the time of the initial sale of an individual policy.
Commissions relating to the business processed by AGMI decreased by $419,000, or 5.3%, from $7.9 million in 2018 to $7.5 million in 2019 and includes commission revenue generated from deconsolidated subsidiaries and discontinued operations as well as commissions generated from our new program with National Interstate Insurance Company which began in November 2019.
Net Claims Incurred
The loss ratio relating to the net claims incurred was 101.1%, 94.5%73.3% and 78.8 %100.9% in 2018, 20172019 and 2016,2018, respectively. The loss ratio increasedecrease in 20182019 was primarily the result of disciplined risk selection and improved pricing, the reserve strengtheningdecrease of incurred on prior accident years between 2013year claims from $71.6 million in 2018 to $2.2 million in 2019, and 2017, which created a 6.6% increase in the loss ratio for 2018. The loss ratio increase in 2017 was primarily the result of the Company’s re-estimationdeconsolidation of its unpaid claims liabilities on prior accident years, creating a 15.7% increase in the loss ratio in 2017.
We experienced unfavorable reserve development of $82.7 million, $75.4 million and $32.6 million in 2018, 2017 and 2016, respectively, which is reported by accident year and line of business in the tables below.
Reserve Development for the Years Ended December 31,
2018:
Year-end 2018 reserve estimates for the Insurance Subsidiaries were strengthened to the high point of the actuarial range established by the outside independent actuaries for each entity based on December 31, 2018 data, claim settlement activities, and other factors evaluated subsequent to the receipt of the 2018 actuarial opinions. While the Company believes that the changes made to its claim process will result in better outcomes than would have otherwise been the case, uncertainty regarding the ultimate outcome exists, and it cannot be assumed that reserve estimates will be adequate. Primarily as a result of regulatory concerns regarding reserve levels, the ASI Pool Companies were placed into rehabilitation in 2019. See ‘Item 1, 2019 Developments’ and “Item 1A, Risk Factors - Risks Related to 2019 Developments - Regulatory Developments” for certain developments with respect to the Company and the Insurance Subsidiaries subsequent to December 31, 2018. Incremental claim outcomes and other factors could result in future adjustments to reserves and reserve estimates.
2017:
Atlas identified that claim expenses in Michigan were significantly outpacing other states and took a significant charge in 2016. Although exposure in Michigan was reduced to approximately 1.4%discontinued operations classification of the Company’s insured vehicles in force by year end 2017, payments for claims in this state continued to be disproportionate to historic premiums earned.
Remaining liability for non-New York Global Liberty business written prior to 2016 was expected to settle for greater amounts than previously expected.
Overall, the actuarially determined liability for remaining claims related to accident years 2015 and prior in general was indicated to be significantly higher than carried reserves.
Risk selection and pricing precision supported by predictive modeling in underwriting beginning in 2015 appears to have contributed improvement in expected loss ratio for premiums earned in 2016 and 2017.
Payment activity in calendar year 2017 attributed to the use of predictive modeling in claims was accelerated as expected. The Company believes that this represents an ultimate reduction in future expected losses, but it appears to be too early for credit to be given to this potential outcome from an actuarial perspective.
While the Company did see positive trends relating to more recent accident years in which predictive modeling had an impact, based on year-end work, the challenges from the past outpaced more recent benefits.
Based on year-end 2017 actuarial work, Atlas determined that this significant reserve increase was necessary to ensure sufficient IBNR levels to extinguish the remaining claims especially for older accident years.
2016:
The unfavorable development was primarily from our core commercial automobile liability line.
Excluding pre-acquisition Global Liberty reserve development, the development of our core lines on prior accident years was $23.2 million in 2016.
Michigan commercial automobile claims accounted for approximately 62.5% of this $23.2 million development.
Pre-acquisition Global Liberty claims reserve development was $7.9 million in 2016.
The remaining unfavorable prior year development of $1.5 million in 2016 is attributable to assigned risk pools and run-off of non-core business.
Atlas intends to only write its products in areas where it believes the Company can generate an above average underwriting profit. As a specialty insurer, Atlas puts a priority on addressing changes in our market in a nimble way. Despite industry challenges that have impacted our results in recent years, Atlas enhanced and initiated numerous underwriting and claim related processes designed to leverage our experience in the specialty light commercial auto sector, including the elevated use of predictive analytics. We have proactively compressed settlement time, particularly with respect to larger claims, providing earlier visibility into potentially changing claim trends. Atlas endeavored to maintain operating efficiency and improve loss ratios through appropriate underwriting and pricing, disciplined claims handling, as well as further leveraging the investments it has made in predictive analytics. However, the impact of such improvement will only be recognized if positive results are reflected in future loss settlements. In the meantime, overall reserve levels are being set based on the estimates provided by the Insurance Subsidiaries’ outside independent actuaries and include strengthening related to prior accident years. Under the MGA focused strategy implemented in 2019, the Company expects to create value for its stakeholders through partnerships with unrelated risk bearing insurers and reinsurers.
|
| | | | | | | | | |
| Claims and Claims Adjustment Expenses Incurred, Net of Reinsurance |
| ($ in ‘000s) | |
| Accident Year | Commercial Auto Liability | Other | Total |
| | Year ended December 31, 2018 |
| 2013 and prior | $ | 7,390 |
| $ | (69 | ) | $ | 7,321 |
|
| 2014 | 8,349 |
| 352 |
| 8,701 |
|
| 2015 | 26,642 |
| (600 | ) | 26,042 |
|
| 2016 | 17,594 |
| 32 |
| 17,626 |
|
| 2017 | 21,572 |
| 1,484 |
| 23,056 |
|
| 2018 | 123,017 |
| 14,899 |
| 137,916 |
|
| Total | $ | 204,564 |
| $ | 16,098 |
| $ | 220,662 |
|
| | | | |
| | Year ended December 31, 2017 |
| 2012 and prior | $ | 3,402 |
| $ | (456 | ) | $ | 2,946 |
|
| 2013 | 9,209 |
| 30 |
| 9,239 |
|
| 2014 | 23,037 |
| 603 |
| 23,640 |
|
| 2015 | 30,025 |
| 1,020 |
| 31,045 |
|
| 2016 | 7,693 |
| 834 |
| 8,527 |
|
| 2017 | 114,531 |
| 13,945 |
| 128,476 |
|
| Total | $ | 187,897 |
| $ | 15,976 |
| $ | 203,873 |
|
| | | | |
| | Year ended December 31, 2016 |
| 2011 and prior | $ | 3,374 |
| $ | 1,323 |
| $ | 4,697 |
|
| 2012 | 4,348 |
| 101 |
| 4,449 |
|
| 2013 | 10,764 |
| 131 |
| 10,895 |
|
| 2014 | 16,946 |
| 148 |
| 17,094 |
|
| 2015 | (4,930 | ) | 408 |
| (4,522 | ) |
| 2016 | 90,713 |
| 11,420 |
| 102,133 |
|
| Total | $ | 121,215 |
| $ | 13,531 |
| $ | 134,746 |
|
| | | | |
during Q4 2019.
Acquisition Costs
Acquisition costs represent commissions and taxes incurred on net premiums earned, offset by ceding commission on business reinsured. Acquisition costs were $26.1 million, $27.9$11.8 million and $18.8$28.4 million in 2018, 20172019 and 2016,2018, respectively, representing 12.0%, 12.9%10.7% and 11.0%15.8% of net premiums earned, respectively.
| | Acquisition Cost Impact on the Combined Ratio | | ($ in ‘000s, percentages to net premiums earned) | Year ended December 31, | Year ended December 31, |
| | 2018 | 2017 | 2016 | 2019 | 2018 |
| Net premiums earned | $ | 218,218 |
| 100.0 | % | $ | 215,771 |
| 100.0 | % | $ | 171,058 |
| 100.0 | % | $ | 110,241 |
| 100.0 | % | $ | 180,686 |
| 100.0 | % |
| Gross commissions incurred excluding profit sharing | 30,599 |
| 14.0 |
| 28,416 |
| 13.2 |
| 21,993 |
| 12.9 |
| 22,844 |
| 20.7 |
| 29,914 |
| 16.6 |
|
| Gross profit sharing commissions incurred | 1,917 |
| 0.9 |
| 3,458 |
| 1.6 |
| 2,618 |
| 1.5 |
| 76 |
| 0.1 |
| 1,917 |
| 1.1 |
|
| Premium and other taxes incurred | 8,117 |
| 3.7 |
| 7,315 |
| 3.4 |
| 6,257 |
| 3.6 |
| 5,287 |
| 4.8 |
| 6,810 |
| 3.8 |
|
| Total gross commissions and taxes incurred | 40,633 |
| 18.6 |
| 39,189 |
| 18.2 |
| 30,868 |
| 18.0 |
| 28,207 |
| 25.6 |
| 38,641 |
| 21.5 |
|
| Ceded commissions incurred excluding profit sharing | (14,976 | ) | (6.8 | ) | (9,447 | ) | (4.4 | ) | (10,966 | ) | (6.4 | ) | (15,747 | ) | (14.3 | ) | (10,450 | ) | (5.8 | ) |
| Ceded profit sharing commissions incurred | 458 |
| 0.2 |
| (1,857 | ) | (0.9 | ) | (1,099 | ) | (0.6 | ) | (635 | ) | (0.6 | ) | 192 |
| 0.1 |
|
| Total ceded commissions incurred | (14,518 | ) | (6.6 | ) | (11,304 | ) | (5.3 | ) | (12,065 | ) | (7.0 | ) | (16,382 | ) | (14.9 | ) | (10,258 | ) | (5.7 | ) |
| Total | $ | 26,115 |
| 12.0 | % | $ | 27,885 |
| 12.9 | % | $ | 18,803 |
| 11.0 | % | $ | 11,825 |
| 10.7 | % | $ | 28,383 |
| 15.8 | % |
| | | | | | | | | | | |
Gross commissions incurred excluding profit sharing commissions increaseddecreased by $2.2$7.1 million in 20182019 compared to 2017.2018. The increasedecrease resulted from higher than average acquisition costs on reinsurance business assumed, partially offset by certain TNC business underwritten at zero commissions.the reduction of Earned Premium for 2019 compared to 2018. Gross profit sharing commissions incurred decreased by $1.5$1.8 million in 20182019 compared to 2017,2018, primarily as a result of fewer agents being eligible for profit sharing commissions.commissions as a result of increased loss ratios for a given agent. Gross profit sharing commissions are awarded based on the combination of developed loss experience and premium growth. Premium and other taxes incurred increaseddecreased by $802,000$1.5 million in 20182019 compared to 20172018 as a result of premium growth in jurisdictions with higher premium tax rates, offset by attrition in states with lower rates.
Gross commissions incurred excluding profit sharing commissions increased by $6.4 million in 2017the reduction of Earned Premium for 2019 compared to 2016. The increase resulted from premium growth in business where higher commission rates applied. Gross profit sharing commissions incurred increased by $840,000 in 2017 compared to 2016 primarily as a result of new agents becoming eligible for profit sharing commissions and premium growth. Premium and other taxes incurred increased by $1.1 million in 2017 compared to 2016 as a result of premium growth.2018.
Ceded commissions incurred excluding profit sharing commissions increased by $5.5$5.3 million in 20182019 compared to 2017,2018, primarily due to the increase in the Quota Share cession rate.rate beginning in Q2 2018. Ceded profit sharing commissions incurred decreasedincreased by $2.3 million$827,000 in 20182019 compared to 2017.2018. Ceded profit sharing commissions are based on loss experience.
Deferred Policy Acquisition Costs (DPAC)
Our assessment of the historic DPAC definition, methodology and computation that was utilized when the organization was insurance company focused is no longer relevant based upon the new strategic direction to a managing general agency. Historically, the Company computed DPAC based on its costs to obtain insurance policy quotes (the prior definition of the “contract”). This computation deferred a percentage of underwriting expenses based upon the activities of certain underwriting departments that supported the new and renewal business activities and the actual amount of bound and issued policies as a percentage of quote/submission activities. Due to the strategic shift that occurred in Q4 2019, the Company determined that the historic DPAC asset as of October 1, 2020 of $1.2 million cannot be supported going forward and adjusted it through the statement of operations as of Q4 2019.
Other Underwriting Expenses
Other underwriting expenses including share based compensation and amortization of intangible assets increased $1.6 million to $32.7 million in 2019 compared to $31.0 million in 2018. The net increase was derived from the following:
Decrease in salary and salary related expenses of $2.1 million as a result of employee reductions during 2019,
increase in professional fees and expenses of $3.5 million as a result of rehabilitation of the ASI Pool Companies and the discontinued operations status of Global Liberty,
increase in depreciation and amortization of $1.4 million related to the implementation of enterprise software during 2019,
decrease in ceded profit sharing commissions resulted from unfavorable loss ratios on the Quota Share and Global Quota Share.
Ceded commissions incurred excluding profit sharing commissions decreased by $1.5banking charges of $1.4 million in 2017 compared to 2016 primarily duerelating to the decrease in ceded premiums written for the Quota Share. Ceded profit sharing commissions incurred increased by $758,000premium activities in 2017 compared2019 versus 2018, and
increase relating to 2016. The increase in ceded profit sharing commissions resulted from favorable loss ratios on Atlas’ excessall other expenses of loss reinsurance agreements and the Global Quota Share, offset by unfavorable loss ratios on the Quota Share.
Other Underwriting Expenses$285,000.
The other underwritingCompany’s expense ratio (including share-based compensation expenses and expenses incurred relatedstructure will continue to stock purchase agreements) was 16.0%, 15.1% and 13.1% in 2018, 2017 and 2016, respectively.
2018 vs. 2017:
Other underwriting expenses increased by approximately $2.1 million overbe modified to reflect the prior year period.
Depreciation, leasehold improvement amortization and facility costs increased by $599,000 comparedchange from its historic insurance company structure to the prior year period because Atlas’ new headquarters building operated forits continuing operation primarily as a full year in 2018.
Salary, payroll taxes and employee benefit costs increased by $0.1 million.
DPAC amortization decreased by $1.0 million compared to the prior year period due to an increase in the percentage applied to deferrable expenses.
Expenses recovered pursuant to stock purchase agreements were $520,000. During 2017, there were no expenses recovered pursuant to stock purchase agreements.
Maintenance costs related to Atlas’ enterprise policy management software increased by approximately $1.0 million.
Professional fees increased by $1.1 million primarily due to an increase in legal fees.
Bank fees increased by $952,000 over the prior year period due to an increase in charges related to processing customer payments.
2017 vs. 2016:
Other underwriting expenses increased by approximately $10.0 million over the prior year period.
Depreciation, leasehold improvement amortization and facility costs related to Atlas’ new headquarters building increased by $806,000 compared to the prior year period.
Salary, payroll taxes and employee benefit costs decreased by $581,000.
Because salary, payroll taxes and employee benefit costs decreased and gross premiums written and gross unearned premium reserves increased, DPAC amortization increased by $1.6 million.
There were no expenses recovered pursuant to stock purchase agreements. During 2016, there were $6.3 million in expenses recovered pursuant to stock purchase agreements.
The termination of Gateway’s workers’ compensation retroactive reinsurance agreement increased expenses by $1.7 million.
Directors fees increased by $30,000 over the prior year period due to the addition of a new board member.managing general agency.
Expenses Related to Stock Purchase Agreements
Atlas did not incur or recover any expenses pursuant to stock purchase agreements in 2019. Atlas recovered $520,000 of expenses pursuant to the contingent adjustments of the Anchor stock purchase agreements related to the claim reserve contingency in 2018. Atlas did not incur or recover any expenses pursuant to stock purchase agreements in 2017. Atlas recovered $6.3 million of expenses pursuant to the contingent adjustments of the Gateway and Anchor stock purchase agreements that included the redemption and cancellation of preferred shares in 2016.
Combined Ratio
Atlas’ combined ratio was 129.0%, 122.5%115.0% and 102.9%133.4% in 2018, 20172019 and 2016,2018, respectively.
Underwriting profitability,The underwriting profit or loss at our Insurance Subsidiaries, as opposed to overall profitability or net earnings, is measured by the combined ratio. The combined ratio is the sum of the claims and claims adjustment expense ratio, the acquisition cost ratio and the underwriting expense ratio. The change in the combined ratio is attributable to the factors described in the ‘Net Premiums Earned,’ ‘Net Claims Incurred,’ ‘Acquisition Costs’ and ‘Other Underwriting Expenses’ sections above.
Net Investment Income
Net investment income is primarily comprised of interest income, dividend income and income from other invested assets held by our Insurance Subsidiaries, net of investment expenses, which are comprised of investment management fees, custodial fees and allocated salaries. Net investment income, net of investment expenses, was $2.6$1.9 million in 2018, a decrease2019, an increase of 45.9%6.1%, compared to $4.9$1.8 million in 2017, following an increase of 1.5% in 2017 compared to $4.8 million in 2016. These amounts are primarily comprised of interest income. In 2018, the decrease resulted from lower returns on equity method investments and less interest income from collateral loans due to loan pay-offs, partially offset by higher interest income on our fixed income securities portfolio. In 2017, the increase was primarily due to an increase in interest income from fixed income securities with higher coupon rates and a decrease in investment manager costs. The gross yield on our fixed income securities was 2.6%, 2.3% and 2.2% in 2018, 2017 and 2016, respectively. The gross yield on our cash and cash equivalents was 0.7%, 0.3% and 0.1% in 2018, 2017 and 2016, respectively. In 2018, the increase in the gross yield on our cash investments was due to higher interest rates on certain accounts and higher balances in accounts earning
greater interest. In 2017, the increase in gross yield on our cash investments was due to higher interest rates on certain new accounts and higher balances in accounts earning greater interest.2018. Equity method investments and collateral loans generated investment income of $793,000 in 2019 and investment losses of $470,000$543,000 in 2018, and investment income of $1.9 million in both 2017 and 2016.respectively.
Goodwill and Intangible Asset Impairment Loss
The Company performed an assessment of the recoverability of goodwill related to Anchor Group Holdings, Inc. as of December 31, 2018. As a result of continued poor results driven from reserve development, declining premium base, and its March 2019 withdrawal from the A.M. Best interactive rating process, the Company concluded that it should impair the goodwill associated with the acquisition of Anchor Group Holdings, Inc. The resulting assessment reduced the carrying value of goodwill to $0, which resulted in a goodwillan impairment loss of $2.7 million for 2018. There were no goodwill impairment losses during 2017 and 2016.In 2019, the Company fully impaired intangible assets not subject to amortization in the amount of $740,000 relating to the Gateway acquisition.
Interest Expense
On April 26, 2017, Atlas issued $25 million of five-year 6.625% senior unsecured notes and received net proceeds of approximately $23.9 million after deducting underwriting discounts and commissions and other offering expenses. A portion of the net proceeds from this issuance, together with cash on hand, were used to repay all outstanding borrowings under the Loan Agreement, as defined below in the ‘Liquidity and Capital Resources’ section. Interest expense was $1.5 million and $1.9 million $1.8 millionin 2019 and $1.0 million in 2018, 2017 and 2016, respectively. The increasedecrease in interest expense from 20172018 to 20182019 was due to a full year’s worth of interest expense in 2018 on the senior unsecured notes, partially offset by the decrease in amortization of debt issuance costs upon the repayment of outstanding amounts under the Loan Agreement in 2017. Thean increase in interest income of $244,000 relating to interest income from IRS tax refunds, an increase of $267,000 in interest income relating to surplus notes from deconsolidated entities, and in increase in mortgage interest expense from 2016of $97,000 due to 2017 primarily resulted from the accelerated amortization of debt issuance costs upon the repayment of outstanding amounts under the Loan Agreement and higher interest rate related to the senior unsecured notes.deconsolidated entities.
Loss from Change in Fair Value of Equity Securities
Beginning January 1, 2018, Atlas adopted Accounting Standards Update 2016-01, which requires changes in the unrealized market value of equities held at fair value to be recorded through net income. In 2019 and 2018, Atlas recorded losses of $277,000 and $198,000, respectively, through net income related to the changes in the unrealized amounts on equities held at fair value.
Net Realized Investment Gains
Net realized investment gains is comprised of the gains and losses from the sales of investments. Net realized investment gains decreased 34.3%increased 18.5% to $573,000$821,000 in 2019 from $693,000 in 2018, from $872,000 in 2017, due to losses from the sale of fixed income securities, partially offset by gains from the sale of equity securities. Net realized investment gains decreased 29.1% to $872,000 in 2017 from $1.2 million in 2016, due to lower gains from the sale of fixed income securities, partially offset by higher gains on the sale of equity securities and equity method investments.
Other Incomesecurities.
Atlas recorded other income of $526,000, $435,000$453,000 and $467,000$527,000 in 2018, 20172019 and 2016,2018, respectively.
(Loss) IncomeLoss before Income Taxes
Atlas generated pre-tax loss from continuing operations of $64.2$12.8 million and $44.2$54.1 million in 2019 and 2018, and 2017, respectively, and pre-tax income of $512,000 in 2016.respectively. The causes of these changes are attributed to the combined effects of the reasons cited in the ‘Net Premiums Earned,’ ‘Net Claims Incurred,’ ‘Acquisition Costs,’ ‘Other Underwriting Expenses,’ ‘Net Investment Income,’ ‘Goodwill Impairment Loss,’ ‘Interest Expense,’ ‘Loss from Change in Fair Value of Equity Securities,’ ‘Net Realized Investment Gains’ and ‘Other Income’ sections above.
Income Taxes
Atlas recognizedrecorded income tax expense of $15.8$223,000 and $14.5 million in 20182019 and income tax benefits of $5.3 million and $2.1 million in 2017 and 2016,2018, respectively.
| | Tax Rate Reconciliation | | ($ in ‘000s) | Year ended December 31, | Year ended December 31, |
| | 2018 | 2017 | 2016 | 2019 | 2018 |
| Provision for taxes at U.S. statutory marginal income tax rate | $ | (13,482 | ) | 21.0 | % | $ | (15,453 | ) | 35.0 | % | $ | 179 |
| 35.0 | % | $ | (2,683 | ) | 21.0 | % | $ | (11,368 | ) | 21.0 | % |
| Provision for deferred tax assets deemed unrealizable (valuation allowance) | 28,830 |
| (44.9 | ) | — |
| — |
| — |
| — |
| 2,779 |
| (21.8 | ) | 25,397 |
| (46.9 | ) |
| Nondeductible expenses | 62 |
| (0.1 | ) | 51 |
| (0.1 | ) | 24 |
| 4.7 |
| 28 |
| (0.2 | ) | 59 |
| (0.1 | ) |
| Tax-exempt income | (12 | ) | — |
| (23 | ) | 0.1 |
| (39 | ) | (7.6 | ) | (3 | ) | — |
| (9 | ) | — |
|
| State tax (net of federal benefit) | (2 | ) | — |
| (2 | ) | — |
| 28 |
| 5.5 |
| 71 |
| (0.6 | ) | (2 | ) | — |
|
| Stock compensation | (42 | ) | 0.1 |
| (458 | ) | 1.0 |
| — |
| — |
| 31 |
| (0.2 | ) | (42 | ) | 0.1 |
|
| Nondeductible goodwill | 572 |
| (0.9 | ) | — |
| — |
| — |
| — |
| |
| Nondeductible acquisition accounting adjustment | (109 | ) | 0.2 |
| — |
| — |
| (2,204 | ) | (430.5 | ) | — |
| — |
| (109 | ) | 0.2 |
|
| Change in statutory tax rate | — |
| — |
| 10,542 |
| (23.9 | ) | — |
| — |
| |
| Other | (6 | ) | — |
| — |
| — |
| (122 | ) | (23.9 | ) | — |
| — |
| (4 | ) | — |
|
| Provision for income taxes for continuing operations | $ | 15,811 |
| (24.6 | )% | $ | (5,343 | ) | 12.1 | % | $ | (2,134 | ) | (416.8 | )% | $ | 223 |
| (1.8 | )% | $ | 14,494 |
| (26.8 | )% |
| | | | | | | | | | | |
On December 22, 2017,During 2013 and 2019, due to shareholder activity, a “triggering events” as determined under IRC Section 382 occurred. As a result, under IRC Section 382, the Tax Cuts and Jobs Actuse of 2017 (“Tax Act”) was signed into law. Among other things, beginning with the 2018 tax year, the Tax Act reduced the Company’s corporate federal tax rate from a marginal rate of 35% to a flat 21%, eliminated the corporate Alternative Minimum Tax (“AMT”), changed reserving and other aspects of the computation of taxable income for insurance companies, and modified the net operating loss carryback and carryforward provisions for all entities inother carryforwards generated prior to the group except for those subject to tax as P&C companies. The modified net operating loss provisions no longer allow a carryback to prior years to recover past taxes, but now allow an indefinite carryforward period“triggering events” will be subject to a yearly utilization limit. As discussed above, any net operating losses with respect to the insurance entities taxed as P&C companies retain the current net operating loss carryback and carryover provisions, which are two years carryback and 20 years carryforward. As of December 31, 2016, the Company measured its deferred tax items at the enacted rate in effect of 35%. Due to the Tax Act’s enactment, the Company’s deferred tax assets and liabilities as of December 31, 2017 were re-measured at the new enacted tax rate of 21%. In 2017, the Company recognized income tax expense of $10.5 million related to reduction in the net deferred tax assetlimitation as a result of this re-measurement.
Upon“ownership change” for tax purposes, which is defined as a cumulative change of more than 50% during any three-year period by shareholders owning 5% or greater portions of the transaction forming Atlas on December 31, 2010, a yearly limitation as required by Internal Revenue Code (“IRC”)Company’s shares. Due to the mechanics of the Section 382 that applies to changes in ownershipcalculation when there are multiple triggering events the Company’s losses will generally be limited based on the future utilizationthresholds of Atlas’ net operating loss carryforwards was calculated.the 2019 triggering event. The Insurance Subsidiaries’ prior parent retained those tax assets previously attributed toCompany has established a valuation allowance against the Insurance SubsidiariesNOLs that could not be utilized by Atlaswill expire unused as a result of thisthe yearly limitation. As a result, Atlas’ ability to recognize future tax benefits associated with a portion of its deferred tax assets generated during prior years have been permanently limited to the amount determined under IRC Section 382. The result is a maximum expected net deferred tax asset, which Atlas has available after the merger and believed more-likely-than-not to be utilized in the future, after consideration of a valuation allowance.
In assessing the need for a valuation allowance, Atlas considers both positive and negative evidence related to the likelihood of realization of the deferred tax assets.
Positive evidence evaluated when considering the need for a valuation allowance includes:
management’s expectations of future profit with vehicles in-force at their highest levels and steady new and renewal business;
anticipated ability to increase prices in core lines as the commercial auto market is firming;
predictive modeling in underwriting and claims which we believe are generating better priced risks that are expected to create overall profitability over time; and
positive growth trends in gross premiums written in each year since formation.
Negative evidence evaluated when considering the need for a valuation allowance includes:
net losses generated in the three most recent years; and
yearly limitation as required by IRC Section 382 on net operating loss carryforwards generated prior to 2013.
Net (Loss) IncomeLoss and (Loss) EarningsLoss per Common Share
Atlas had net loss of $20.4 million and $80.0 million in 2019 and $38.8 million in 2018, and 2017, respectively, and net income of $2.6 million in 2016.respectively. Loss per common share diluted was $6.67$1.09 and $3.22$5.72 in 2019 and 2018, and 2017, respectively. After taking the impact of the liquidation preference of the preferred shares into consideration, earnings per common share diluted were $0.19 in 2016.
| | Potential Dilutive Common Shares | | | Year ended December 31, | Year ended December 31, |
| | 2018 | 2017 | 2016 | 2019 | 2018 |
| Basic weighted average common shares outstanding | 11,992,808 |
| 12,064,880 |
| 12,045,519 |
| 11,954,494 |
| 11,992,808 |
|
| Dilutive potential ordinary shares: | | |
| Dilutive stock options | — |
| — |
| 177,364 |
| — |
| — |
|
| Diluted weighted average common shares outstanding | 11,992,808 |
| 12,064,880 |
| 12,222,883 |
| 11,954,494 |
| 11,992,808 |
|
| | | |
The effects of convertible instruments are excluded from the computation of earnings per common share diluted in periods in which the effect would be anti-dilutive. Convertible preferred shares are anti-dilutive when the amount of dividend declared or accumulated in the current period per common share obtainable upon conversion exceeds earnings per common share basic. In 20182019 and 2017,2018, all exercisable stock options were deemed to be anti-dilutive. The potentially dilutive impact for all exercisable stock options excluded from the calculation due to anti-dilution is 16,372 and 71,475 common shares for 2018 and 2017, respectively. In 2016, all exercisable stock options were deemed to be dilutive and all of the convertible preferred shares were deemed to be anti-dilutive. The potentially dilutive impact for the convertible preferred stock excluded from the calculation due to anti-dilution is 441,357 common shares for 2016.
IV. Financial Condition
The following presentation and analysis reflects the deconsolidation of the ASI Pool Companies as of Q4 2019 and the classification of Global Liberty as discontinued operations.
| | | Consolidated Statements of Financial Condition | | |
| ($ in ‘000s, except for share and per share data) | December 31, | December 31, |
| | 2018 | 2017 | 2019 | 2018 |
| Assets | | |
| Investments, available for sale | | |
| Fixed income securities, available for sale, at fair value (amortized cost $133,213 and $158,411) | $ | 129,991 |
| $ | 157,984 |
| |
| Equity securities, at fair value (cost $5,650 and $7,969) | 5,929 |
| 8,446 |
| |
| Fixed income securities, available for sale, at fair value (amortized cost $0 and $98,855) | | $ | — |
| $ | 96,590 |
|
| Equity securities, at fair value (cost $0 and $5,650) | | — |
| 5,929 |
|
| Short-term investments | 4,745 |
| — |
| — |
| 4,493 |
|
| Other investments | 25,043 |
| 31,438 |
| — |
| 23,722 |
|
| Total investments | 165,708 |
| 197,868 |
| — |
| 130,734 |
|
| Cash and cash equivalents | 34,902 |
| 45,615 |
| 9,025 |
| 29,480 |
|
| Restricted cash | | 7,122 |
| 4,675 |
|
| Accrued investment income | 749 |
| 1,248 |
| — |
| 548 |
|
| Premiums receivable (net of allowance of $5,115 and $3,418) | 88,596 |
| 79,664 |
| |
| Premiums receivable (net of allowance of $800 and $5,115) | | 38,607 |
| 88,596 |
|
| Reinsurance recoverables on amounts paid | 12,388 |
| 7,982 |
| — |
| 10,260 |
|
| Reinsurance recoverables on amounts unpaid | 68,771 |
| 53,402 |
| — |
| 55,265 |
|
| Prepaid reinsurance premiums | 36,898 |
| 12,878 |
| — |
| 31,151 |
|
| Deferred policy acquisition costs | 7,309 |
| 14,797 |
| — |
| 5,918 |
|
| Deferred tax asset, net | — |
| 16,985 |
| |
| Goodwill, net | — |
| 2,726 |
| |
| Intangible assets, net | 3,755 |
| 4,145 |
| 2,625 |
| 3,755 |
|
| Property and equipment, net | 31,363 |
| 24,439 |
| 21,793 |
| 29,866 |
|
| Right-of-use assets | | 1,592 |
| — |
|
| Notes receivable | | 15,500 |
| — |
|
| Other assets | 19,899 |
| 20,754 |
| 3,295 |
| 15,011 |
|
| Assets held for sale | | 51,302 |
| 65,079 |
|
| Total assets | $ | 470,338 |
| $ | 482,503 |
| $ | 150,861 |
| $ | 470,338 |
|
| | | |
| Liabilities | | |
| Claims liabilities | $ | 273,496 |
| $ | 211,648 |
| $ | — |
| $ | 226,487 |
|
| Unearned premium reserves | 134,040 |
| 128,043 |
| — |
| 111,461 |
|
| Due to reinsurers | 15,849 |
| 8,411 |
| — |
| 13,494 |
|
| Premiums payable | | 43,988 |
| — |
|
| Lease liability | | 1,993 |
| — |
|
| Due to deconsolidated affiliates | | 11,172 |
| — |
|
| Notes payable, net | 24,255 |
| 24,031 |
| 32,100 |
| 24,255 |
|
| Other liabilities and accrued expenses | 16,999 |
| 19,725 |
| 7,302 |
| 15,573 |
|
| Liabilities held for sale | | 62,767 |
| 73,369 |
|
| Total liabilities | $ | 464,639 |
| $ | 391,858 |
| $ | 159,322 |
| $ | 464,639 |
|
| | | |
| Shareholders' equity | | |
| Ordinary voting common shares, $0.003 par value, 266,666,667 shares authorized, shares issued: December 31, 2018 - 12,192,475 and December 31, 2017 - 12,164,041; shares outstanding: December 31, 2018 - 11,936,970 and December 31, 2017 - 12,164,041 | $ | 36 |
| $ | 36 |
| |
| Restricted voting common shares, $0.003 par value, 33,333,334 shares authorized, shares issued and outstanding: December 31, 2018 and December 31, 2017 - 0 | — |
| — |
| |
| Ordinary voting common shares, $0.003 par value, 266,666,667 shares authorized, shares issued: December 31, 2019 - 12,198,319 and December 31, 2018 - 12,192,475; shares outstanding: December 31, 2019 - 11,942,812 and December 31, 2018 - 11,936,970 | | $ | 36 |
| $ | 36 |
|
| Restricted voting common shares, $0.003 par value, 33,333,334 shares authorized, shares issued and outstanding: December 31, 2019 and December 31, 2018 - 0 | | — |
| — |
|
| Additional paid-in capital | 202,298 |
| 201,105 |
| 81,548 |
| 202,298 |
|
| Treasury stock, at cost: December 31, 2018 - 255,505 and December 31, 2017 - 0 shares of ordinary voting common shares | (3,000 | ) | — |
| |
| Retained deficit | (190,503 | ) | (110,535 | ) | |
| Accumulated other comprehensive (loss) income, net of tax | (3,132 | ) | 39 |
| |
| Total shareholders' equity | $ | 5,699 |
| $ | 90,645 |
| |
| Total liabilities and shareholders' equity | $ | 470,338 |
| $ | 482,503 |
| |
| | | |
|
| | | | | | |
| Treasury stock, at cost: 255,505 shares of ordinary common voting shares at December 31, 2019 and December 31, 2018, respectively | (3,000 | ) | (3,000 | ) |
| Retained deficit | (87,469 | ) | (190,503 | ) |
| Accumulated other comprehensive income (loss), net of tax | 424 |
| (3,132 | ) |
| Total shareholders' equity | $ | (8,461 | ) | $ | 5,699 |
|
| Total liabilities and shareholders' equity | $ | 150,861 |
| $ | 470,338 |
|
| | | |
Investments
Overview and Strategy
Atlas aligns its securities portfolio to support the liabilities and operating cash needs of the Insurance Subsidiaries, to preserve capital and to generate investment returns. Atlas invests predominantly in corporate and government bonds with a portion of the portfolio in relatively short durations that correlate with the payout patterns of Atlas’ claims liabilities. Atlas also invests opportunistically in selective direct investments with favorable return attributes. A third-party investment management firm manages Atlas’ investment portfolio pursuant to the Company’s investment policies and guidelines as approved by its Board of Directors. Atlas monitors the third-party investment manager’s performance and its compliance with both its mandate and Atlas’ investment policies and guidelines.
Atlas’ investment guidelines stress the preservation of capital, market liquidity to support payment of liabilities and the diversification of risk. With respect to fixed income securities, Atlas generally purchases securities with the expectation of holding them to their maturities; however, the securities are available for sale if liquidity needs arise. To the extent that interest rates increase or decrease, unrealized gains or losses may result. We believe that our investment philosophy and approach significantly mitigate the likelihood of such gains or losses being realized.
It should be noted that due to the deconsolidation of the ASI Pool Companies and the discontinued operation classification of Global Liberty and the accounting treatment thereof, the tables below show no investment balances as of December 31, 2019, however, the Insurance Subsidiaries continue to hold invested assets as of December 31, 2019.
| | Carrying Value of Investments, including Cash and Cash Equivalents | | ($ in ‘000s) | As of December 31, | As of December 31, |
| | 2018 | 2017 | 2019 | 2018 |
| Fixed income securities: | | |
| U.S. Treasury and other U.S. government obligations | $ | 20,196 |
| $ | 21,186 |
| $ | — |
| $ | 12,888 |
|
| States, municipalities and political subdivisions | 8,843 |
| 13,243 |
| — |
| 5,833 |
|
| Corporate | | |
| Banking/financial services | 13,124 |
| 21,382 |
| — |
| 10,479 |
|
| Consumer goods | 9,790 |
| 9,679 |
| — |
| 7,901 |
|
| Capital goods | 3,547 |
| 7,992 |
| — |
| 1,956 |
|
| Energy | 6,812 |
| 7,515 |
| — |
| 5,932 |
|
| Telecommunications/utilities | 8,323 |
| 11,215 |
| — |
| 4,566 |
|
| Health care | 755 |
| 1,059 |
| — |
| 755 |
|
| Total corporate | 42,351 |
| 58,842 |
| — |
| 31,589 |
|
| Mortgage-backed | | |
| Agency | 25,128 |
| 30,613 |
| — |
| 17,970 |
|
| Commercial | 19,622 |
| 22,587 |
| — |
| 17,425 |
|
| Total mortgage-backed | 44,750 |
| 53,200 |
| — |
| 35,395 |
|
| Other asset-backed | 13,851 |
| 11,513 |
| — |
| 10,885 |
|
| Total fixed income securities | $ | 129,991 |
| $ | 157,984 |
| $ | — |
| $ | 96,590 |
|
| Equities | 5,929 |
| 8,446 |
| — |
| 5,929 |
|
| Short-term investments | 4,745 |
| — |
| — |
| 4,493 |
|
| Other investments | 25,043 |
| 31,438 |
| — |
| 23,722 |
|
| Total investments | $ | 165,708 |
| $ | 197,868 |
| $ | — |
| $ | 130,734 |
|
| Cash and cash equivalents | 34,902 |
| 45,615 |
| 9,025 |
| 29,480 |
|
| Total | $ | 200,610 |
| $ | 243,483 |
| $ | 9,025 |
| $ | 160,214 |
|
| | | |
Portfolio Composition
Atlas held securities, short-term investments and other investments with a carrying value of $165.7 million$0 and $197.9$130.7 million as of December 31, 20182019 and 2017,2018, respectively, which were primarily comprised of fixed income securities. The decrease resulted from the net salesdeconsolidation of fixed income securitiesthe ASI Pool Companies and equities, the repaymentclassification of two collateral loans, return of capital of certain equity method investments and negative changes in market values.Global Liberty as a discontinued operation.
The securities held by the Insurance Subsidiaries must comply with applicable regulations that prescribe the type, quality and concentration of securities. These regulations in the various jurisdictions in which the Insurance Subsidiaries are domiciled permit investments in government, state, municipal and corporate bonds, preferred and common equities, and other high quality
investments, within specified limits and subject to certain qualifications. The Company’s use of quota share reinsurance can impact the relationship between invested assets and premiums written over time as well as the desired duration of the portfolio.
Most of the Company’s holdings are impacted by the U.S.U.S economy, and we anticipate a moderate impact from the effect of global economic conditions on the domestic economy. Global economic conditions may create brief periods of market volatility, but we do not believe it will meaningfully alter the fundamental outlook of the Company’s investment holdings.
Short-Term Investments
Atlas’ short-term investments are comprised of bonds and money market funds. As of December 31, 2018, short-termShort-term investments totaled $4.7 million. Atlas had no short-term investments$0 and $4.5 million as of December 31, 2017.2019 and 2018, respectively. The decrease resulted from the deconsolidation of the ASI Pool Companies and the classification of Global Liberty as a discontinued operation.
Other Investments
Atlas’ other investments are comprised of collateral loans and various limited partnerships that invest in income-producing real estate, equities or insurance linked securities. Atlas accounts for these limited partnership investments using the equity method of accounting. The carrying values of these other investments were $25.0 million$0 and $31.4$23.7 million as of December 31, 20182019 and 2017,2018, respectively. The carrying values of the equity method limited partnerships were $24.0 million$0 and $25.3$22.7 million as of December 31, 20182019 and 2017,2018, respectively. The decrease in the carrying value of the limited partnerships was primarily due to the returndeconsolidation of capital offset by contributions to other equity method limited partnerships.the ASI Pool Companies and the classification of Global Liberty as a discontinued operation. The carrying value of these investments is Atlas’ share of the net book value for each limited partnership, an amount that approximates fair value. Atlas receives payments on a routine basis that approximates the income earned on one of the limited partnerships that invest in income-producing real estate. The carrying values of the collateral loans were $1.0 million$0 and $6.2$1.0 million as of December 31, 20182019 and 2017,2018, respectively. The decrease was due toresulted from the repaymentdeconsolidation of two collateral loans.the ASI Pool Companies and the classification of Global Liberty as a discontinued operation.
|
| | | | | | | | | |
| Equity Method Investments by Type |
| ($ in ‘000s) | As of December 31, |
| | 2018 | 2018 | 2017 |
| | Unfunded Commitments | Carrying Value |
| Real estate | $ | 2,887 |
| $ | 11,085 |
| $ | 10,660 |
|
| Insurance linked securities | — |
| 6,694 |
| 9,073 |
|
| Activist hedge funds | — |
| 3,911 |
| 4,367 |
|
| Venture capital | 3,070 |
| 2,015 |
| 853 |
|
| Other joint venture | — |
| 325 |
| 325 |
|
| Total equity method investments | $ | 5,957 |
| $ | 24,030 |
| $ | 25,278 |
|
| | | | |
Due to the timing of financial information of the Company’s equity method investments, certain investments are recorded on a financial reporting lag of one to three months. |
| | | | | | | | | |
| Equity Method Investments by Type |
| ($ in ‘000s) | As of December 31, |
| | 2019 | 2019 | 2018 |
| | Unfunded Commitments | Carrying Value |
| Real estate | $ | — |
| $ | — |
| $ | 9,764 |
|
| Insurance linked securities | — |
| — |
| 6,694 |
|
| Activist hedge funds | — |
| — |
| 3,911 |
|
| Venture capital | — |
| — |
| 2,015 |
|
| Other joint venture | — |
| — |
| 325 |
|
| Total equity method investments | $ | — |
| $ | — |
| $ | 22,709 |
|
| | | | |
Liquidity and Cash Flow Risk
As of December 31, 2018, 26.1%23.9% of the fixed income securities, including treasury bills, bankers’ acceptances, government bonds and corporate bonds had contractual maturities of five years or less, compared to 28.4% as of December 31, 2017.less. Actual maturities may differ from contractual maturities, because certain issuers have the right to call or prepay obligations with or without call or prepayment penalties. Atlas holdsThe Insurance Subsidiaries hold cash and high grade short-term assets, which, along with fixed income security maturities, management believes are sufficient for the payment of claims on a timely basis. InAs a result of the event that additional cash is required to meet obligations to policyholders, Atlas believes thatdeconsolidation of the ASI Pool Companies and the classification of Global Liberty as a high quality securities portfolio provides us with sufficient liquidity. As of December 31, 2018, the fixed income securities had a weighted average life of 4.8 years and a duration of 3.8 years, compared to a weighted average life of 4.9 years and a duration of 3.9 yearsdiscontinued operation as of December 31, 2017. Changes in interest rates may have a modest market value impact2019, there were no fixed income securities on the Atlas portfolio relative to longer duration portfolios. Atlas can and typically does hold bonds to maturity by matching duration with the anticipated liquidity needs.consolidated statements of financial position.
| | Amortized Cost and Fair Value of Fixed Income Securities by Contractual Maturity Date | | ($ in ‘000s) | As of December 31, | As of December 31, |
| | 2018 | 2017 | 2019 | 2018 |
| | Amortized Cost | Fair Value | % | Amortized Cost | Fair Value | % | Amortized Cost | Fair Value | % | Amortized Cost | Fair Value | % |
| Due in less than one year | $ | 5,573 |
| $ | 5,546 |
| 4.3 | % | $ | 11,149 |
| $ | 11,141 |
| 7.0 | % | $ | — |
| $ | — |
| — | % | $ | 3,587 |
| $ | 3,568 |
| 3.7 | % |
| Due in one through five years | 29,000 |
| 28,324 |
| 21.8 |
| 33,941 |
| 33,857 |
| 21.4 |
| — |
| — |
| — |
| 19,923 |
| 19,499 |
| 20.2 |
|
| Due after five through ten years | 33,790 |
| 32,724 |
| 25.2 |
| 41,542 |
| 41,538 |
| 26.3 |
| — |
| — |
| — |
| 26,235 |
| 25,384 |
| 26.3 |
|
| Due after ten years | 5,100 |
| 4,796 |
| 3.7 |
| 6,614 |
| 6,735 |
| 4.3 |
| — |
| — |
| — |
| 1,934 |
| 1,859 |
| 1.9 |
|
| Total contractual maturity | 73,463 |
| 71,390 |
| 55.0 |
| 93,246 |
| 93,271 |
| 59.0 |
| — |
| — |
| — |
| 51,679 |
| 50,310 |
| 52.1 |
|
| Total mortgage and asset-backed | 59,750 |
| 58,601 |
| 45.0 |
| 65,165 |
| 64,713 |
| 41.0 |
| — |
| — |
| — |
| 47,176 |
| 46,280 |
| 47.9 |
|
| Total | $ | 133,213 |
| $ | 129,991 |
| 100.0 | % | $ | 158,411 |
| $ | 157,984 |
| 100.0 | % | $ | — |
| $ | — |
| — | % | $ | 98,855 |
| $ | 96,590 |
| 100.0 | % |
| | | | | | | | | |
The debt-to-equity ratio is the sum of the Company’s long-term debt and interest payable divided by total shareholders’ equity. The Company’s debt-to-equity ratio as of December 31, 2019 and 2018 was (382.7)% and 2017 was 430.5% and 26.8%, respectively. The increasedecrease is the result of the decrease in shareholders’ equity.deconsolidation of the ASI Pool Companies and the classification of Global Liberty as a discontinued operation. See the ‘Shareholders’Changes in Shareholders’ Equity’ and ‘Liquidity and Capital Resources’ subsections of the ‘Financial Condition’ section for further information.
Credit Risk
Credit risk is defined as the risk of financial loss due to failure of the other party to a financial instrument to discharge an obligation. Atlas is exposed to credit risk principally through its investments and balances receivable from policyholders, agents and reinsurers. It monitors concentration and credit quality risk through policies designed to limit and monitor its exposure to individual issuers or related groups (with the exception of U.S. government bonds) as well as through ongoing review of the credit ratings of issuers in the securities portfolio. Credit exposure to any one individual policyholder is not material. The Company’s insurance policies, however, are distributed by agents who may manage cash collection on its behalf pursuant to the terms of their agency agreement. Atlas has protocols to evaluate the financial condition of its reinsurers and monitors concentrations of credit risk arising from similar geographic regions, activities or economic characteristics of the reinsurers to minimize its exposure to significant losses from reinsurers’ insolvency. The fixed income securities portfolio consists of predominantly investment grade securities in corporate and government bonds with 99.5% rated ‘BBB’ or better were 99.5% as of December 31, 2018 compared2018. The deconsolidation of the ASI Pool Companies and the classification Global Liberty as a discontinued operation have removed all fixed income securities from the presentation on the consolidated statements of financial position, but continue to 99.3%hold fixed income investments, as of December 31, 2017.2019.
| | Credit Ratings1 of Fixed Income Securities Portfolio | Credit Ratings1 of Fixed Income Securities Portfolio | Credit Ratings1 of Fixed Income Securities Portfolio |
| ($ in ‘000s) | As of December 31, | As of December 31, |
| | 2018 | 2017 | 2019 | 2018 |
| | Fair Value | % of Total | Fair Value | % of Total | Fair Value | % of Total | Fair Value | % of Total |
| AAA/Aaa | $ | 38,478 |
| 29.6 | % | $ | 42,978 |
| 27.2 | % | $ | — |
| — | % | $ | 29,325 |
| 30.4 | % |
| AA/Aa | 50,273 |
| 38.7 |
| 58,173 |
| 36.8 |
| — |
| — |
| 36,426 |
| 37.7 |
|
| A/A | 20,729 |
| 16.0 |
| 27,384 |
| 17.3 |
| — |
| — |
| 15,798 |
| 16.4 |
|
| BBB/Baa | 19,808 |
| 15.2 |
| 28,348 |
| 18.0 |
| — |
| — |
| 14,485 |
| 15.0 |
|
| BB | 557 |
| 0.4 |
| 875 |
| 0.6 |
| — |
| — |
| 556 |
| 0.5 |
|
| B | — |
| — |
| 226 |
| 0.1 |
| |
| CCC | 146 |
| 0.1 |
| — |
| — |
| |
| Total fixed income securities | $ | 129,991 |
| 100.0 | % | $ | 157,984 |
| 100.0 | % | $ | — |
| — | % | $ | 96,590 |
| 100.0 | % |
| | | | | | | | | |
| |
1 | Ratings assigned by Fitch, S&P or Moody’s Investors Service. |
Other-Than-Temporary Impairment
Atlas recognizes losses on securities for which a decline in market value was deemed to be other-than-temporary. Management performs a quarterly analysis of the securities holdings to determine if declines in market value are other-than-temporary.other than temporary. Atlas did not recognize any charges for securities impairments that were considered other-than-temporary in 2018, 20172019 or 2016.2018.
The length of time securities may be held in an unrealized loss position may vary based on the opinion of the appointed investment manager and their respective analyses related to valuation and to the various credit risks that may prevent us from recapturing the principal investment. In cases of securities with a maturity date where the appointed investment manager determines that there is
little or no risk of default prior to the maturity of a holding, Atlas would elect to hold the security in an unrealized loss position
until the price recovers or the security matures. In situations where facts emerge that might increase the risk associated with recapture of principal, Atlas may elect to sell securities at a loss.
The total fair value of the securities in an unrealized loss position was $115.4$0 as of December 31, 2019 compared to $82.4 million as of December 31, 2018 compared to $108.12018. Unrealized losses were $0 and $2.5 million as of December 31, 2017. Unrealized losses were $3.4 million2019 and $1.4 million as of December 31, 2018, and 2017, respectively. The increasedecrease in unrealized losses primarily resulted from negative changes in market valuesthe deconsolidation of the ASI Pool Companies and the classification Global Liberty as a discontinued operation (see ‘Part II, Item 8, Note 5, Investments’ in the Notes to Consolidated Financial Statements). Atlas has the ability and intent to hold the securities in an unrealized loss position until their fair value is recovered. Therefore, Atlas does not expect the market value loss position of these investments to be realized in the near term.
Allowance for Bad Debt
As of December 31, 2018,2019, Atlas’ allowance for bad debt was $5.1 million,$800,000, compared to $3.4$5.1 million as of December 31, 2017.2018. The increasedecrease in the allowance for bad debt resulted from an analysisthe deconsolidation of certain past due balances during 2018.
Due from Reinsurers
Atlas purchases reinsurance from third parties in order to reduce its liability on individual risks and its exposure to large claims. Reinsurance is coverage purchased by one insurance company from another for part of the risk originally underwritten by the purchasing (ceding) insurance company. The practice of ceding insurance to reinsurers allows an insurance company to reduce its exposure to claims by size, geographic area and type of risk, or on a particular policy. An effect of ceding insurance is to permit an insurance company to write additional insurance for risks in greater numbers or in larger amounts than it would otherwise insure independently, based on its statutory capital, risk tolerance and other factors.
Atlas generally purchases reinsurance to limit net exposure to a maximum amount on any one loss of $500,000 with respect to commercial automobile liability claims. Atlas also purchases reinsurance to protect against awards in excess of its policy limits. Atlas continually evaluates and adjusts its reinsurance needs based on business volume, mix and supply levels. As a result, the Company has entered into the Quota Share with Swiss Re for ASI Pool Subsidiaries and the Global Quota Share with Swiss Re for Global Liberty. Under the Quota Share, cessions can be increased at our election should we want to utilize it as a means of deleveraging. This gives us flexibility in terms of the timing and approach to potential future capital raising activities in light of anticipated increased operating leverage.
Reinsurance ceded does not relieve Atlas of its ultimate liability to its insureds in the event that any reinsurer is unable to meet their obligations under its reinsurance contracts. Therefore, Atlas enters into reinsurance contracts with only those reinsurers deemed to have sufficient financial resources to provide the requested coverage. Reinsurance treaties are generally subject to cancellation by the reinsurers or Atlas on the anniversary date and are subject to renegotiation annually. Atlas regularly evaluates the financial condition of its reinsurers and monitors the concentrations of credit risk to minimize its exposure to significant claims as a result of the insolvency of a reinsurer. Atlas believes that the amounts it has recorded as reinsurance recoverables are appropriately established. Estimating amounts of reinsurance recoverables, however, is subject to various uncertainties, and the amounts ultimately recoverable may vary from amounts currently recorded. As shown in the below table, Atlas had $81.2 million recoverable from third party reinsurers (exclusive of amounts prepaid) as of December 31, 2018 compared to $61.4 million as of December 31, 2017. The increase in the amount recoverable from third party reinsurers resulted from an increase in ceded case and IBNR reserves and the timing of the collection of amounts recoverable on paid claims.
Estimating amounts of reinsurance recoverables is also impacted by the uncertainties involved in the establishment of provisions for unpaid claims and claims adjustment expenses. As underlying reserves potentially develop, the amounts ultimately recoverable may vary from amounts currently recorded. Atlas’ reinsurance recoverables are generally unsecured. Atlas regularly evaluates its reinsurers, and the respective amounts recoverable, and an allowance for uncollectible reinsurance is provided for, if needed.
|
| | | | | | | |
| Reinsurance Recoverables on Amounts Paid and Unpaid by Reinsurer |
| ($ in ‘000s) | A.M. Best Financial Strength Rating | As of December 31, |
| | 2018 | 2017 |
| General Reinsurance Corporation | A++ | $ | 47,592 |
| $ | 32,505 |
|
| Swiss Reinsurance America Corporation | A+ | 28,241 |
| 22,241 |
|
| Other | | 5,326 |
| 6,638 |
|
| Total | | $ | 81,159 |
| $ | 61,384 |
|
| | | | |
During 2019, the Company received notice from General Reinsurance Corporation that effective July 31, 2019, the XOL reinsurance coverage for the ASI Pool Companies would terminate onand the classification of Global Liberty as a cut-off basis. Additionally, effective September 30, 2019, the ASI Pool Companies Quota Share contract with Swiss Reinsurance America Corporation was terminated on a run-off basis.discontinued operation.
Deferred Tax AssetAssets
| | Components of Deferred Tax | | ($ in ‘000s) | As of December 31, | As of December 31, |
| | 2018 | 2017 | 2019 | 2018 |
| Gross deferred tax assets: | | |
| Losses carried forward | $ | 25,326 |
| $ | 13,313 |
| $ | 10,264 |
| $ | 25,326 |
|
| Claims liabilities and unearned premium reserves | 5,949 |
| 6,171 |
| 554 |
| 5,949 |
|
| Investment in affiliates | | 24,450 |
| — |
|
| Bad debts | 1,009 |
| — |
| 168 |
| 1,009 |
|
| Tax credits | — |
| 1,172 |
| |
| Commissions | — |
| 623 |
| |
| Stock compensation | 760 |
| 602 |
| 873 |
| 760 |
|
| Other | 418 |
| 1,094 |
| 81 |
| 418 |
|
| Valuation allowance | (29,416 | ) | — |
| (32,522 | ) | (29,416 | ) |
| Total gross deferred tax assets | 4,046 |
| 22,975 |
| 3,868 |
| 4,046 |
|
| | | |
| Gross deferred tax liabilities: | | |
| Deferred policy acquisition costs | 1,535 |
| 3,107 |
| 112 |
| 1,535 |
|
| Investments | 189 |
| 213 |
| 116 |
| 189 |
|
| Fixed assets | 1,371 |
| 847 |
| 2,099 |
| 1,371 |
|
| Intangible assets | 633 |
| 715 |
| 551 |
| 633 |
|
| Other | 318 |
| 1,108 |
| 990 |
| 318 |
|
| Total gross deferred tax liabilities | 4,046 |
| 5,990 |
| 3,868 |
| 4,046 |
|
| Net deferred tax assets | $ | — |
| $ | 16,985 |
| $ | — |
| $ | — |
|
| | | |
Deferred tax assets are recognized only to the extent that it is probable that future taxable income will be available against which they can be utilized. When considering the extent of the valuation allowance on Atlas’ DTA,deferred tax assets, weight is given by management to both positive and negative evidence. U.S. GAAP states that a cumulative loss in recent years is a significant piece of negative evidence that is difficult to overcome in determining that a valuation allowance is not needed against DTAs.deferred tax assets. Based on Atlas’ cumulative loss in recent years, Atlas has established a valuation allowance of $32.5 million and $29.4 million for its gross future deferred tax assets as of December 31, 2018. 2019 and 2018, respectively.
The Company had no valuation allowance as of December 31, 2017.
On July 22, 2013, as a result of shareholder activity, a “triggering event” as determined under IRC Section 382 occurred.change in control for Federal income tax purposes in 2019. As a result, the use of the Company’s net operating loss and other carry-forwards generated priorlosses are subject to a yearly limitation by the “triggering event” will be limited as a result of this “ownership change” for tax purposes, which is defined as a cumulative change of more than 50% during any three-year period by shareholders owning 5% or greater portions of the Company’s shares.
Due to this triggering event, the Company estimates that it will retain total tax effected federal net operating loss carryforwards (“NOLs”) of approximately $25.3 million as of December 31, 2018. NOLs and other carryforwards generated in 2017 and 2018 are not limited by IRC Section 382.Internal Revenue Code.
| | | Net Operating Loss Carryforward as of December 31, 2018 by Expiry | |
| Net Operating Loss Carryforward as of December 31, 2019 by Expiry | | Net Operating Loss Carryforward as of December 31, 2019 by Expiry |
| ($ in ‘000s) | | | | |
| Year of Occurrence | Year of Expiration | Amount | Year of Expiration | Amount |
| 2001 | 2021 | $ | 5,007 |
| |
| 2002 | 2022 | 4,317 |
| |
| 2006 | 2026 | 7,825 |
| |
| 2007 | 2027 | 5,131 |
| |
| 2008 | 2028 | 1,949 |
| |
| 2009 | 2029 | 1,949 |
| |
| 2010 | 2030 | 1,949 |
| |
| 2011 | 2031 | 4,166 |
| 2031 | $ | 1 |
|
| 2012 | 2032 | 9,236 |
| 2032 | 70 |
|
| 2015 | 2035 | 1 |
| 2035 | 1 |
|
| 2017 | 2037 | 27,313 |
| 2037 | 13,649 |
|
| 2018 | 2038 | 47,653 |
| 2038 | 10,439 |
|
| 2018 | Indefinite | 4,106 |
| Indefinite | 8,566 |
|
| 2019 | | 2039 | 11,747 |
|
| 2019 | | Indefinite | 4,404 |
|
| Total | | $ | 120,602 |
| | $ | 48,877 |
|
| | | | | |
Buildings and Land
In the fourth quarter of 2016, Atlas purchased a building and land for $9.3 million to serve as its corporate headquarters. The Company purchased furnishings and made improvements to this building of $16,500 and $1.1 million $11.3 millionin 2019 and $139,00 in 2018, 2017 and 2016, respectively. See ‘Part II, Item 8, Note 9, Property and Equipment’ in the Notes to Consolidated Financial Statements for further discussion of the new corporate headquarters.
Claims Liabilities
|
| | | | | | | | |
| Provision for Unpaid Claims by Type, Gross of Reinsurance |
| ($ in ‘000s) | As of December 31, | |
| | 2018 | 2017 | % Change |
| Case reserves | $ | 78,191 |
| $ | 62,769 |
| 24.6 | % |
| IBNR | 195,305 |
| 148,879 |
| 31.2 |
|
| Total | $ | 273,496 |
| $ | 211,648 |
| 29.2 | % |
| | | | |
|
| | | | | | | | |
| Provision for Unpaid Claims by Line of Business, Gross of Reinsurance |
| ($ in ‘000s) | As of December 31, | |
| | 2018 | 2017 | % Change |
| Commercial automobile liability | $ | 268,728 |
| $ | 204,654 |
| 31.3 | % |
Other1 | 4,768 |
| 6,994 |
| (31.8 | ) |
| Total | $ | 273,496 |
| $ | 211,648 |
| 29.2 | % |
| | | | |
|
| | | | | | | | |
| Provision for Unpaid Claims by Type, Gross of Reinsurance |
| ($ in ‘000s) | As of December 31, | |
| | 2019 | 2018 | % Change |
| Case reserves | $ | — |
| $ | 59,740 |
| (100.0 | )% |
| IBNR | — |
| 166,747 |
| (100.0 | ) |
| Total | $ | — |
| $ | 226,487 |
| (100.0 | )% |
| | | | |
| | | Provision for Unpaid Claims by Line of Business, Net of Reinsurance Recoverables | |
| Provision for Unpaid Claims by Line of Business, Gross of Reinsurance | | Provision for Unpaid Claims by Line of Business, Gross of Reinsurance |
| ($ in ‘000s) | As of December 31, | | As of December 31, | |
| | 2018 | 2017 | % Change | 2019 | 2018 | % Change |
| Commercial automobile liability | $ | 200,984 |
| $ | 153,319 |
| 31.1 | % | $ | — |
| $ | 221,243 |
| (100.0 | )% |
Other1 | 3,741 |
| 4,927 |
| (24.1 | ) | — |
| 5,244 |
| (100.0 | ) |
| Total | $ | 204,725 |
| $ | 158,246 |
| 29.4 | % | $ | — |
| $ | 226,487 |
| (100.0 | )% |
| | | | | |
|
| | | | | | | | |
| Provision for Unpaid Claims by Line of Business, Net of Reinsurance Recoverables |
| ($ in ‘000s) | As of December 31, | |
| | 2019 | 2018 | % Change |
| Commercial automobile liability | $ | — |
| $ | 167,009 |
| (100.0 | )% |
Other1 | — |
| 4,213 |
| (100.0 | ) |
| Total | $ | — |
| $ | 171,222 |
| (100.0 | )% |
| | | | |
| |
1 | See ‘Part II, Item 7, MD&A, Company Overview’ section for further information regarding the other lines of business. |
The provision for unpaidAs a result of the deconsolidation of the ASI Pool Companies and the classification of Global Liberty discontinued operations, all claims and claims adjustment expenses increased by 29.2%liabilities have been reduced to $273.5 million as of December 31, 2018 compared to $211.6 million as of December 31, 2017. During 2018, case reserves increased by 24.6% compared to 2017, while
IBNR reserves increased by 31.2%. The increase in case reserves was primarily due to an increase in new and re-opened claims reported on the three most recent accident years. The increase in IBNR was primarily due to the settlement of claims reported on prior accident years for our commercial auto and non-voluntary assigned risk programs above established case reserves for 2018.
|
| | | | | | | | | | | | | | | | | | |
| Provision for Unpaid Claims, Gross of Reinsurance |
| ($ in ‘000s) | Case Reserves | IBNR |
| Accident Year | Commercial Auto Liability | Other | Total | Commercial Auto Liability | Other | Total |
| | As of December 31, 2018 |
| Current Year | $ | 47,109 |
| $ | 1,210 |
| $ | 48,319 |
| $ | 107,944 |
| $ | 2,782 |
| $ | 110,726 |
|
| Prior Years | 30,039 |
| (167 | ) | 29,872 |
| 83,636 |
| 943 |
| 84,579 |
|
| Total | $ | 77,148 |
| $ | 1,043 |
| $ | 78,191 |
| $ | 191,580 |
| $ | 3,725 |
| $ | 195,305 |
|
| | | | | | | |
| | As of December 31, 2017 |
| Current Year | $ | 30,619 |
| $ | (462 | ) | $ | 30,157 |
| $ | 78,625 |
| $ | 1,180 |
| $ | 79,805 |
|
| Prior Years | 30,393 |
| 2,219 |
| 32,612 |
| 65,017 |
| 4,057 |
| 69,074 |
|
| Total | $ | 61,012 |
| $ | 1,757 |
| $ | 62,769 |
| $ | 143,642 |
| $ | 5,237 |
| $ | 148,879 |
|
| | | | | | | |
|
| | | | | | | | | | | | | | | | | | |
| Provision for Unpaid Claims, Net of Reinsurance Recoverables |
| ($ in ‘000s) | Case Reserves | IBNR |
| Accident Year | Commercial Auto Liability | Other | Total | Commercial Auto Liability | Other | Total |
| | As of December 31, 2018 |
| Current Year | $ | 40,073 |
| $ | 481 |
| $ | 40,554 |
| $ | 76,337 |
| $ | 2,556 |
| $ | 78,893 |
|
| Prior Years | 26,502 |
| (105 | ) | 26,397 |
| 58,072 |
| 809 |
| 58,881 |
|
| Total | $ | 66,575 |
| $ | 376 |
| $ | 66,951 |
| $ | 134,409 |
| $ | 3,365 |
| $ | 137,774 |
|
| | | | | | | |
| | As of December 31, 2017 |
| Current Year | $ | 27,421 |
| $ | (309 | ) | $ | 27,112 |
| $ | 49,888 |
| $ | 844 |
| $ | 50,732 |
|
| Prior Years | 25,701 |
| 1,303 |
| 27,004 |
| 50,309 |
| 3,089 |
| 53,398 |
|
| Total | $ | 53,122 |
| $ | 994 |
| $ | 54,116 |
| $ | 100,197 |
| $ | 3,933 |
| $ | 104,130 |
|
| | | | | | | |
|
| | | | | | | | | |
| Changes in the Provision for Unpaid Claims and Claims Adjustment Expenses, Net of Reinsurance Recoverables |
| ($ in ‘000s) | Year ended December 31, |
| | 2018 | 2017 | 2016 |
| Unpaid claims and claims adjustment expenses, beginning of period | $ | 211,648 |
| $ | 139,004 |
| $ | 127,011 |
|
| Less: reinsurance recoverable | 53,402 |
| 35,370 |
| 29,399 |
|
| Net unpaid claims and claims adjustment expenses, beginning of period | 158,246 |
| 103,634 |
| 97,612 |
|
| | | | |
| Change in retroactive reinsurance ceded | — |
| 1,361 |
| 107 |
|
| | | | |
| Incurred related to: | | | |
| Current year | 137,916 |
| 128,476 |
| 102,133 |
|
| Prior years | 82,746 |
| 75,397 |
| 32,613 |
|
| | 220,662 |
| 203,873 |
| 134,746 |
|
| Paid related to: | | | |
| Current year | 52,637 |
| 50,626 |
| 39,652 |
|
| Prior years | 121,546 |
| 99,996 |
| 89,179 |
|
| | 174,183 |
| 150,622 |
| 128,831 |
|
| | | | |
| Net unpaid claims and claims adjustment expenses, end of period | $ | 204,725 |
| $ | 158,246 |
| $ | 103,634 |
|
| Add: reinsurance recoverable | 68,771 |
| 53,402 |
| 35,370 |
|
| Unpaid claims and claims adjustment expenses, end of period | $ | 273,496 |
| $ | 211,648 |
| $ | 139,004 |
|
| | | | |
|
| | | | | | | | | | | | | | | | | | |
| Provision for Unpaid Claims, Gross of Reinsurance |
| ($ in ‘000s) | Case Reserves | IBNR |
| Accident Year | Commercial Auto Liability | Other | Total | Commercial Auto Liability | Other | Total |
| | As of December 31, 2019 |
| Current Year | $ | — |
| $ | — |
| $ | — |
| $ | — |
| $ | — |
| $ | — |
|
| Prior Years | — |
| — |
| — |
| — |
| — |
| — |
|
| Total | $ | — |
| $ | — |
| $ | — |
| $ | — |
| $ | — |
| $ | — |
|
| | | | | | | |
| | As of December 31, 2018 |
| Current Year | $ | 32,630 |
| $ | 2,366 |
| $ | 34,996 |
| $ | 94,906 |
| $ | 2,250 |
| $ | 97,156 |
|
| Prior Years | 24,545 |
| 199 |
| 24,744 |
| 69,162 |
| 429 |
| 69,591 |
|
| Total | $ | 57,175 |
| $ | 2,565 |
| $ | 59,740 |
| $ | 164,068 |
| $ | 2,679 |
| $ | 166,747 |
|
| | | | | | | |
|
| | | | | | | | | | | | | | | | | | |
| Provision for Unpaid Claims, Net of Reinsurance Recoverables |
| ($ in ‘000s) | Case Reserves | IBNR |
| Accident Year | Commercial Auto Liability | Other | Total | Commercial Auto Liability | Other | Total |
| | As of December 31, 2019 |
| Current Year | $ | — |
| $ | — |
| $ | — |
| $ | — |
| $ | — |
| $ | — |
|
| Prior Years | — |
| — |
| — |
| — |
| — |
| — |
|
| Total | $ | — |
| $ | — |
| $ | — |
| $ | — |
| $ | — |
| $ | — |
|
| | | | | | | |
| | As of December 31, 2018 |
| Current Year | $ | 30,117 |
| $ | 1,363 |
| $ | 31,480 |
| $ | 66,656 |
| $ | 2,249 |
| $ | 68,905 |
|
| Prior Years | 22,409 |
| 172 |
| 22,581 |
| 47,827 |
| 429 |
| 48,256 |
|
| Total | $ | 52,526 |
| $ | 1,535 |
| $ | 54,061 |
| $ | 114,483 |
| $ | 2,678 |
| $ | 117,161 |
|
| | | | | | | |
|
| | | | | | |
| Changes in the Provision for Unpaid Claims and Claims Adjustment Expenses, Net of Reinsurance Recoverables |
| ($ in ‘000s) | Year ended December 31, |
| | 2019 | 2018 |
| Unpaid claims and claims adjustment expenses, beginning of period | $ | 226,487 |
| $ | 171,513 |
|
| Less: reinsurance recoverable | 55,265 |
| 41,373 |
|
| Net unpaid claims and claims adjustment expenses, beginning of period | 171,222 |
| 130,140 |
|
| | | |
| Incurred related to: | | |
| Current year | 78,612 |
| 110,621 |
|
| Prior years | 2,155 |
| 71,635 |
|
| | 80,767 |
| 182,256 |
|
| Paid related to: | | |
| Current year | 22,176 |
| 39,784 |
|
| Prior years | 89,970 |
| 101,390 |
|
| | 112,146 |
| 141,174 |
|
| | | |
| Reduction in liability from deconsolidation | 139,843 |
| — |
|
| | | |
| Net unpaid claims and claims adjustment expenses, end of period | $ | — |
| $ | 171,222 |
|
| Add: reinsurance recoverable | — |
| 55,265 |
|
| Unpaid claims and claims adjustment expenses, end of period | $ | — |
| $ | 226,487 |
|
| | | |
The process of establishing the estimated provision for unpaid claims and claims adjustment expenses is complex and imprecise, as it relies on the judgment and opinions of a large number of individuals, on historical precedent and trends, on prevailing legal, economic, social and regulatory trends, and on expectations as to future developments. The process of determining the provision necessarily involves risks that the actual results may deviate, perhaps substantially, from the best estimates made. The change to the provision for unpaid claims and claims adjustment expenses is consistent with the changes in written premium. However, because the establishment of reserves is an inherently uncertain process involving estimates, current provisions may not be sufficient. Adjustments to reserves, both positive and negative, are reflected quarterly in the statementconsolidated statements of incomeoperations as estimates are updated.
The financial statements are presented on a calendar year basis for all data. Claims payments and changes in reserves, however, may be made on accidents that occurred in prior years, not solely on business that is currently insured. Calendar year claims consist of payments and reserve changes that have been recorded in the financial statements during the applicable reporting period, without regard to the period in which the accident occurred. Calendar year results do not change after the end of the applicable reporting period, even as new claim information develops. Accident year claims consist of payments and reserve changes that are assigned to the period in which the accident occurred. Accident year results will change over time as the estimates of claims change due to payments and reserve changes for all accidents that occurred during that period.
As of September 30, 2019, the results of the ASI Pool Companies have been deconsolidated. Through September 30, 2019, the incurred related to prior years primarily related to unfavorable development on involuntary assigned risk pools and run-off commercial auto. Assigned risk pools are established by state governments to cover high-risk insureds who cannot purchase insurance through conventional means.
Atlas experienced $82.7$71.6 million in unfavorable prior accident year development in 2018 as reflected as incurred related to prior years in the table above. The unfavorable development is primarily from our core commercial automobile liability line and was mostlylines with $58.7 million of the development related to claims from accident years 20132015 through 2017.
Atlas experienced $75.4 million in unfavorable prior accident year development in 2017 as reflected as incurred related Year-end 2018 reserve estimates for the ASI Pool Companies were strengthened to prior years in the table above. The unfavorable development is primarily from our core commercial automobile liability line. Atlas previously identified that claim expenses in Michigan were significantly outpacing other states and took a significant charge. Although exposure in Michigan was reduced to approximately 1.4%high point of the Company’s insured vehicles inforceactuarial range established by year end 2017, paymentsthe outside independent actuaries for claims in this state continued to be disproportionate to historic premiums earned. In addition, the remaining liability for non-New York Global Liberty business written prior to 2016 is expected to settle for greater amounts than previously expected. Overall, the actuarially determined liability for remaining claims related to accident year 2015 and prior in general, across all jurisdictions, was indicated to be significantly higher than carried reserves.
Atlas experienced $32.6 million in unfavorable prior accident year development in 2016 as reflected as incurred related to prior years in the table above. The unfavorable development is primarily from our core commercial automobile liability line. Excluding pre-acquisition Global Liberty reserve development, the development of our core lines on prior accident years was $23.2 million in 2016. Michigan commercial automobile claims accounted for approximately 62.5% of this development. Pre-acquisition Global Liberty claims reserve development was $7.9 million in 2016. The remaining unfavorable prior year development of $1.5 million for 2016 is attributable to assigned risk pools and run-off of non-core business.
Contractual Obligations
|
| | | | | | | | | | | | | | | |
| Future Payments and Estimated Claims Settlements |
| ($ in ‘000s) | Year ended December 31, 2018 |
| | Total | Less than 1 year | 1-3 years | 3-5 years | More than 5 years |
| Notes payable, including interest payments | $ | 31,625 |
| $ | 1,656 |
| $ | 3,313 |
| $ | 26,656 |
| $ | — |
|
| Operating leases | 3,369 |
| 1,137 |
| 2,042 |
| 190 |
| — |
|
| Estimated claims liabilities, net of reinsurance | 204,725 |
| 88,558 |
| 69,601 |
| 24,731 |
| 21,835 |
|
| Total | $ | 239,719 |
| $ | 91,351 |
| $ | 74,956 |
| $ | 51,577 |
| $ | 21,835 |
|
| | | | | | |
Estimated claims liabilities are calculatedeach entity based on actuarial assumptions and may differ from actual future claims settlements. The amounts in the table above have been presented net of reinsurance.
As of December 31, 2018 we had contractual obligationsdata, claim settlement activities, and other factors evaluated subsequent to provide additional funds for investments in limited liability investments included in other investments for up to $6.0 million not included in the table above. There is no certaintyreceipt of when these amounts will be required to be provided.the 2018 actuarial opinions.
Off-Balance Sheet Arrangements
As of December 31, 2018,2019, we did not have any material off-balance sheet arrangements as defined by SEC rules.within the meaning of Item 303 of Regulation S-K.
Changes in Shareholders’ Equity
| | | ($ in ‘000s) | Ordinary Voting Common Shares | Restricted Voting Common Shares | Additional Paid-In Capital | Treasury Stock | Retained Deficit | Accumulated Other Comprehensive (Loss) Income | Total Shareholders' Equity | Ordinary Voting Common Shares | Restricted Voting Common Shares | Additional Paid-In Capital | Treasury Stock | Retained Deficit | Accumulated Other Comprehensive Income (Loss) | Total Shareholders' Equity (Deficit) |
| Balance December 31, 2015 | $ | 36 |
| $ | — |
| $ | 198,041 |
| $ | — |
| $ | (74,364 | ) | $ | (1,032 | ) | $ | 122,681 |
| |
| Net income | — |
| — |
| — |
| — |
| 2,646 |
| — |
| 2,646 |
| |
| Preferred dividends paid | — |
| — |
| (409 | ) | — |
| — |
| — |
| (409 | ) | |
| Other comprehensive income | — |
| — |
| — |
| — |
| — |
| 812 |
| 812 |
| |
| Share-based compensation | — |
| — |
| 1,612 |
| — |
| — |
| — |
| 1,612 |
| |
| Balance December 31, 2016 | $ | 36 |
| $ | — |
| $ | 199,244 |
| $ | — |
| $ | (71,718 | ) | $ | (220 | ) | $ | 127,342 |
| |
| ASU 2018-02, reclassification of certain tax effects | — |
| — |
| — |
| — |
| (7 | ) | 7 |
| — |
| |
| Net loss | — |
| — |
| — |
| — |
| (38,810 | ) | — |
| (38,810 | ) | |
| Other comprehensive income | — |
| — |
| — |
| — |
| — |
| 252 |
| 252 |
| |
| Options exercised | — |
| — |
| 655 |
| — |
| — |
| — |
| 655 |
| |
| Share-based compensation | — |
| — |
| 1,176 |
| — |
| — |
| — |
| 1,176 |
| |
| Other | — |
| — |
| 30 |
| — |
| — |
| — |
| 30 |
| |
| Balance December 31, 2017 | $ | 36 |
| $ | — |
| $ | 201,105 |
| $ | — |
| $ | (110,535 | ) | $ | 39 |
| $ | 90,645 |
| $ | 36 |
| $ | — |
| $ | 201,105 |
| $ | — |
| $ | (110,535 | ) | $ | 39 |
| $ | 90,645 |
|
| Cumulative effect of new accounting principle in period of adoption | — |
| — |
| — |
| — |
| 377 |
| (377 | ) | — |
| — |
| — |
| — |
| — |
| 377 |
| (377 | ) | — |
|
| Net loss | — |
| — |
| — |
| — |
| (80,012 | ) | — |
| (80,012 | ) | — |
| — |
| — |
| — |
| (80,012 | ) | — |
| (80,012 | ) |
| Purchase of treasury stock | — |
| — |
| — |
| (3,000 | ) | — |
| — |
| (3,000 | ) | — |
| — |
| — |
| (3,000 | ) | — |
| — |
| (3,000 | ) |
| Preferred dividends paid | — |
| — |
| — |
| — |
| (333 | ) | — |
| (333 | ) | — |
| — |
| — |
| — |
| (333 | ) | — |
| (333 | ) |
| Other comprehensive loss | — |
| — |
| — |
| — |
| — |
| (2,794 | ) | (2,794 | ) | |
| Other comprehensive income | | — |
| — |
| — |
| — |
| — |
| (2,794 | ) | (2,794 | ) |
| Share-based compensation | — |
| — |
| 1,201 |
| — |
| — |
| — |
| 1,201 |
| — |
| — |
| 1,201 |
| — |
| — |
| — |
| 1,201 |
|
| Other | — |
| — |
| (8 | ) | — |
| — |
| — |
| (8 | ) | — |
| — |
| (8 | ) | — |
| — |
| — |
| (8 | ) |
| Balance December 31, 2018 | $ | 36 |
| $ | — |
| $ | 202,298 |
| $ | (3,000 | ) | $ | (190,503 | ) | $ | (3,132 | ) | $ | 5,699 |
| $ | 36 |
| $ | — |
| $ | 202,298 |
| $ | (3,000 | ) | $ | (190,503 | ) | $ | (3,132 | ) | $ | 5,699 |
|
| Deconsolidation of ASI Pool Companies | | — |
| — |
| (121,622 | ) | — |
| 123,460 |
| (604 | ) | 1,234 |
|
| Net loss | | — |
| — |
| — |
| — |
| (20,426 | ) | — |
| (20,426 | ) |
| Other comprehensive loss | | — |
| — |
| — |
| — |
| — |
| 4,160 |
| 4,160 |
|
| Share-based compensation | | — |
| — |
| 872 |
| — |
| — |
| — |
| 872 |
|
| Balance December 31, 2019 | | $ | 36 |
| $ | — |
| $ | 81,548 |
| $ | (3,000 | ) | $ | (87,469 | ) | $ | 424 |
| $ | (8,461 | ) |
As of December 31, 2018,2019, there were 11,936,970$11,942,812 ordinary voting common shares outstanding and no preferred shares outstanding.
On March 21, 2017, the Company’s Board of Directors approved a Share Repurchase Program of up to 650,000 shares of common stock. The repurchases could be made from time to time in open market transactions, privately-negotiated transactions, block purchases, or otherwise in accordance with securities laws at the discretion of the Company’s management until March 21, 2018. The Share Repurchase Program was not extended. The Company’s decisions around the timing, volume, and nature of share repurchases, and the ultimate amount of shares repurchased, was dependent on market conditions, applicable securities laws, and other factors. The share repurchase program and the Board’s authorization of the program could have been modified, suspended, or discontinued at any time. During 2018, 255,505 shares were repurchased under this Share Repurchase Program.
During 2017, the 128,191 restricted voting common shares that were beneficially owned or controlled by Kingsway were sold to non-affiliates of Kingsway. The restricted voting common shares are entitled to vote at all meetings of shareholders, except at meetings of holders of a specific class that are entitled to vote separately as a class. The restricted voting common shares as a class shall not carry more than 30% of the aggregate votes eligible to be voted at a general meeting of common shareholders. The Kingsway-owned restricted voting common shares automatically converted to ordinary voting common shares upon their sale to non-affiliates of Kingsway. There are no restricted voting common shares outstanding as of December 31, 2018.
On December 31, 2018, the Company awarded grants for ordinary voting common shares of the Company to its external directors pursuant to a director equity award agreement dated December 31, 2018. The awards, which were approved by the Company’s Board of Directors in March 2018, were valued at $40,000 per external director (“Aggregate Award”) and were made under the Company’s Equity Incentive Plan. The number of restricted stock units awarded was determined by dividing (A) the Aggregate Award by (B) the closing price of one share of Company ordinary voting common share at the close of market on April 4, 2018, which was $10.50 per share. For new directors, the Aggregate Award is proportionate to the director’s start date and priced as of that same day. During 2018, the Company awarded 17,524 Restricted Stock Unit (“RSU”)RSU grants having an aggregate grant date fair value of $179,000. The RSUs will vest 33.3% on January 1 of each year for the next three years.
There were 24,93211,682 and 14,81624,932 non-vested RSUs issued as of December 31, 20182019 and 2017,2018, respectively. The RSUs are participative and are included in the computations of earnings per common share and book value per common share for these periods.
During 2019, the Company issued 5,842 ordinary voting common shares as a result of the vesting of RSUs. During 2018, the Company issued 7,408 ordinary voting common shares as a result of the vesting of RSUs and 27,195 ordinary voting common shares, then immediately canceled 6,169 shares, as a result of a cashless exercise of options. During 2017, the Company issued 7,408 ordinary voting common shares as a result of the vesting of RSUs and 133,338 ordinary voting common shares as a result of the exercise of options.
Mezzanine Equity
During the first quarter of 2016, the Company canceled 401,940There were no preferred shares pursuant to the Gateway stock purchase agreement. During the third quarter of 2016, the Company redeemed all 2,538,560 of the remaining preferred shares issued to the former owner of Gateway. During the fourth quarter of 2016, the Company canceled the remaining 4,000,000 preferred shares pursuant to the Anchor stock purchase agreement. Asoutstanding as of December 31, 20182019 and 2017, there were no outstanding preferred shares. The preferred shares redeemed and canceled during 2016 pursuant to the Gateway stock purchase agreement have been recorded as a recovery of acquisition expense and additional acquisition expense, respectively, and not as an adjustment to goodwill, because the fair value of the contingent consideration was determined to be zero at the date of acquisition. In accordance with U.S. GAAP, such adjustments are reflected in the statements of (loss) income and comprehensive (loss) income in the period that the contingency is re-estimated. The Anchor cancellation was recorded as a recovery of acquisition expense.2018.
Preferred shareholders are entitled to dividends on a cumulative basis, whether or not declared by the Board of Directors, at the rate of $0.045 per share per year (4.5%) and may be paid in cash or in additional preferred shares at the option of Atlas. In liquidation, dissolution or winding-up of Atlas, preferred shareholders receive the greater of $1.00 per share plus all declared and unpaid dividends or the amount they would receive in liquidation if the preferred shares had been converted to restricted voting common shares or ordinary voting common shares immediately prior to liquidation. Preferred shareholders are not entitled to vote.
On September 30, 2016, Atlas paid $409,000 in dividends earned on the preferred shares to the former owner of Gateway, the cumulative amount to which they were entitled through September 15, 2016, leaving no accrued and unpaid dividends owed to the former owner of Gateway. During 2018, Atlas paid $333,000 in dividends earned on the preferred shares then outstanding to the former owner of Anchor, the cumulative amount to which they were entitled through December 31, 2017, leaving no accrued or unpaid dividends.
The paid claims development on Global Liberty’s pre-acquisition claims reserves was in excess of $4.0 million, and as a result, pursuant to the terms of the Anchor stock purchase agreement, dividends will no longer accrue to the former owner of Anchor. Although the re-issuance of preferred shares to the former owner of Anchor may be highly unlikely, the contingent consideration terms of the Anchor stock purchase agreement will remain in effect for a period of five years from the date of acquisition.
Book Value
|
| | | | | | | |
| Book Value per Common Share | | |
| ($ in ‘000s, except for share and per share data) | December 31, |
| | 2018 | 2017 |
| Shareholders’ equity | $ | 5,699 |
| $ | 90,645 |
|
| Less: Accumulated dividends on preferred stock | — |
| 333 |
|
| Common equity | $ | 5,699 |
| $ | 90,312 |
|
| Common shares: | | |
| Common shares outstanding | 11,936,970 |
| 12,164,041 |
|
| Restricted stock units | 24,932 |
| 14,816 |
|
| Total common shares | 11,961,902 |
| 12,178,857 |
|
| Book value per common share outstanding | $ | 0.48 |
| $ | 7.42 |
|
|
| | | | | | |
| Changes to Book Value per Common Share | | |
| As of December 31, 2017 | | $ | 7.42 |
|
| Net loss, after tax | 1.34 |
| |
| Loss reserve estimate change | (5.46 | ) | |
| Loss from change in fair value of equity securities | (0.01 | ) | |
| Realized investment gains, after tax | 0.04 |
| |
| Changes in unrealized gains and losses, after tax | (0.23 | ) | |
| Share repurchases | (0.09 | ) | |
| Shares issued | (0.02 | ) | |
| Share-based compensation | 0.08 |
| |
| Goodwill impairment | (0.18 | ) | |
| Valuation allowance against DTAs related to net operating losses | (2.41 | ) | |
| Year-to-date decrease to book value per common share | | (6.94 | ) |
| As of December 31, 2018 | | $ | 0.48 |
|
| | | | |
|
| | | | | | | |
| Book Value per Common Share | | |
| ($ in ‘000s, except for share and per share data) | December 31, |
| | 2019 | 2018 |
| Shareholders’ equity | $ | (8,461 | ) | $ | 5,699 |
|
| Less: Accumulated dividends on preferred stock | — |
| — |
|
| Common equity | $ | (8,461 | ) | $ | 5,699 |
|
| Common shares: | | |
| Common shares outstanding | 11,942,812 |
| 11,936,970 |
|
| Restricted stock units | 11,682 |
| 24,932 |
|
| Total common shares | 11,954,494 |
| 11,961,902 |
|
| Book value per common share outstanding | $ | (0.71 | ) | $ | 0.48 |
|
The changes to book value per common share are attributed to the combined effects of the reasons cited in the ‘Net Premiums Earned,’ ‘Net Claims Incurred,’ ‘Acquisition Costs,’ ‘Other Underwriting Expenses,’ ‘Net Investment Income,’ ‘Goodwill Impairment Loss,’ ‘Interest Expense,’ ‘Loss from Change in Fair Value of Equity Securities,’ ‘Net Realized Investment Gains’ and ‘Other Income’ subsections of the ‘Operating Results’ section.
Liquidity and Capital Resources
Liquidity Management
The purpose of liquidity management is to ensure there is sufficient cash to meet all financial commitments and obligations as they become due. The liquidity requirements of Atlas’ business have been met primarily by funds generated from operations, asset maturities and income, and other returns received on securities. Cash provided from these sources is used primarily for payment of claims, commissions and general expenses. Atlas may also use cash provided from these sources to repurchase common shares in open market transactions. As discussed above in the ‘Changes in Shareholders’ Equity’ section, 255,505 shares were repurchased under the Share Repurchase Program during 2018.
As a holding company, Atlas may derive cash from its subsidiaries generally in the form of dividends and in the future may charge management fees to the extent allowed by statute or other regulatory approval requirements to meet its obligations. AGMI funds its obligations primarily through commission revenue generated by the production of insurance premiums for related and third party entities. The Insurance Subsidiaries fund their obligations primarily through premiums collected, investment income and proceeds from the sales and maturity of investments, and capital contributions from their parents. Refer also to the discussion above in the ‘Investments Overview and Strategy’ section. The Insurance Subsidiaries require regulatory approval for the return of capital and, in certain circumstances, payment of dividends. In the event that dividends and management fees available to the holding company are inadequate to service its obligations, the holding company would need to raise capital, sell assets or incur debt obligations. See “Risk Factors - Risks Related to 2019 Developments - Regulatory Developments” for certain developments with respect to the Insurance Subsidiaries subsequent to December 31, 2018.
On April 26, 2017, Atlas issued $25 million of five-year 6.625% senior unsecured notes and received net proceeds of approximately $23.9 million after deducting underwriting discounts and commissions and other estimated offering expenses. Interest on the senior unsecured notes is payable quarterly on each January 26, April 26, July 26 and October 26. Atlas may, at its option, beginning with the interest payment date of April 26, 2020, and on any scheduled interest payment date thereafter, redeem the senior unsecured notes, in whole or in part, at a redemption price equal to 100% of the principal amount plus accrued and unpaid interest to, but excluding, the date of redemption. The senior unsecured notes will rank senior in right of payment to any of Atlas’ existing and future indebtedness that is by its terms expressly subordinated or junior in right of payment to the senior unsecured notes. The senior unsecured notes will rank equally in right of payment to all of Atlas’ existing and future senior indebtedness, but will be effectively subordinated to any secured indebtedness to the extent of the value of the collateral securing such secured indebtedness. In addition, the senior unsecured notes will be structurally subordinated to the indebtedness and other obligations of Atlas’ subsidiaries.
The senior unsecured notes were issued under an indenture and supplemental indenture that contain covenants that, among other things, limit: (i) the ability of Atlas to merge or consolidate, or lease, sell, assign or transfer all or substantially all of its assets; (ii) the ability of Atlas to sell or otherwise dispose of the equity securities of certain of its subsidiaries; (iii) the ability of certain of Atlas’ subsidiaries to issue equity securities; (iv) the ability of Atlas to permit certain of its subsidiaries to merge or consolidate,
or lease, sell, assign or transfer all or substantially all of their respective assets; and (v) the ability of Atlas and its subsidiaries to incur debt secured by equity securities of certain of its subsidiaries.
On March 9, 2015, American Insurance Acquisition, Inc. (“American Acquisition”), a wholly-owned direct subsidiary of Atlas, entered into a loan and security agreement (“Loan Agreement”) for a $35.0 million loan facility with Fifth Third Bank. On May 7, 2016, American Acquisition entered into a Modification of Loan Documents with Fifth Third Bank to amend its Loan Agreement. The Loan Agreement, as modified, included a $30.0 million line of credit (“Draw Amount”), which could have been drawn in increments at any time until December 31, 2016. The $30.0 million line of credit had a five year term and bore interest at one-month LIBOR plus 4.5%. The Loan Agreement also included a $5.0 million revolving line of credit (“Revolver”), which could have been drawn upon until May 7, 2018, that bore interest at one month LIBOR plus 2.75%.
The Loan Agreement also provided for the issuance of letters of credit in an amount up to $2.0 million outstanding at any time. In addition, there was a non-utilization fee for each of the $30.0 million line of credit and $5.0 million revolving line of credit equal to 0.50% per annum of an amount equal to $30.0 million and $5.0 million, respectively, less the daily average of the aggregate principal amount outstanding under such credit lines (plus, in the case of the $30.0 million line of credit, the aggregate amount of the letter of credit obligations outstanding).
The Loan Agreement was terminated in April 2017. Atlas used a portion of the net proceeds of the senior unsecured notes offering, together with cash on hand, for the repayment of all outstanding balances under the Draw Amount and Revolver, $15.5 million and $3.9 million, respectively.
At December 31, 2016, American Acquisition was in compliance with the covenants of the Loan Agreement. In February 2017, American Acquisition filed its statutorily required financial statements for the year ended December 31, 2016, which are used to determine on-going compliance with the covenants contained in the Loan Agreement. As a result of the reserve strengthening and its effect on American Acquisition’s December 31, 2016 financial statements, American Acquisition was not in compliance with the Loan Agreements’ EBITDA Ratio covenant as of March 13, 2017. American Acquisition had a thirty day period to cure this covenant non-compliance, and the Company and American Acquisition agreed with the lender to a modification to the loan covenants to more specifically address the effects of reserve modifications and/or obtaining a waiver with respect to the existing non-compliance.
Interest expense on notes payable was $2.0 million and $1.9 million $1.8 millionin 2019 and $1.0 million in 2018, 2017 and 2016, respectively.
|
| | | | | | | | | |
| Summary of Consolidated Cash Flows |
| ($ in ‘000s) | Year ended December 31, |
| | 2018 | 2017 | 2016 |
| Net cash flows (used in) provided by operating activities | $ | (26,442 | ) | $ | 26,472 |
| $ | 170 |
|
| Net cash flows provided by (used in) investing activities | 19,070 |
| (15,909 | ) | 8,412 |
|
| Net cash flows (used in) provided by financing activities | (3,341 | ) | 5,164 |
| (1,048 | ) |
| Net (decrease) increase in cash | $ | (10,713 | ) | $ | 15,727 |
| $ | 7,534 |
|
| | | | |
|
| | | | | | |
| Summary of Consolidated Cash Flows |
| ($ in ‘000s) | Year ended December 31, |
| | 2019 | 2018 |
| Net cash flows used in operating activities | $ | (48,758 | ) | $ | (26,442 | ) |
| Net cash flows provided by investing activities | 67,742 |
| 19,070 |
|
| Net cash flows used in financing activities | (183 | ) | (3,341 | ) |
| Net increase (decrease) in cash | $ | 11,836 |
| $ | (6,443 | ) |
| | | |
Cash used in operations during 2019 was primarily a result of the effect of deconsolidation of the ASI Pool Companies and the discontinued operation classification of Global Liberty (see Item 1, 2020 Developments). Cash used in operations during 2018 was primarily a result of net loss and increases in (i) premiums receivable and unearned premium reserves due to premium growth, (ii) reinsurance recoverable on paid amounts, prepaid reinsurance premiums and reinsurance premiums payable due to changes in the Quota Share cession rate, and (iii) unpaid claims liabilities due to growth and the re-estimation of the ultimate claims incurred on prior accident years. Cash provided by operations during 2017years, and 2016 was primarily a result of net income and increases in unpaid claims liabilities and unearned premium reserves. We receive most premiums in advance(iv) the effect of the paymentdiscontinued operation classification of claims. OurGlobal Liberty. Going forward, our ability to generate positive operating cash flows from continuing operations depends on commission income generated from the frequencyproduction of premiums for related and severitythird party insurance carrier partners.
Cash provided by investing activities during 2019 was due to liquidation of investments of the ASI Pool Companies to support the run-off of claims and operating activities while these companies were in rehabilitation, and, the timingeffect of collectionthe discontinued operation classification of premiums receivable and reinsurance recoverables on paid claims.
Global Liberty (see Item 1, 2020 Developments). Cash provided by investing activities during 2018 was due to the net sales and maturities of fixed income securities, the net sales of equity securities and the repayment of two collateral loans, partially offset by property and equipment purchases. purchases and the effect of the discontinued operation classification of Global Liberty.
Cash used in investingfinancing activities during 20172019 was primarily a result of the deconsolidation of the ASI Pool Companies and the repayment during the fourth quarter of 2019 of principal on mortgage notes due to the net purchases of fixed income and equity securities and the furnishings and improvements for the Company’s new headquarters, offset by the net sales of other investments. Cash provided by investing activities during 2016 was due to the net sale of invested assets, offset by the purchase of a building and land used for the Company’s headquarters.
deconsolidation entities (see Item 1, 2020 Developments). Cash used in financing activities during 2018 was primarily a result of shares repurchased under the Share Repurchase Program. Cash provided by financing activities during 2017 resulted from
From time to time the proceeds ofCompany may seek to repurchase Company debt through cash repurchases in the issuance of the Company’s senior unsecured notesopen market or otherwise. Such repurchases, if any, will be on terms and options exercised, partially offsetprices determined by the repaymentCompany, and will depend upon market conditions, liquidity needs and other factors. The amount of the Revolver and Draw Amount. Cash used in financing activities during 2016 resulted from the buyback of preferred shares pursuant to the Gateway stock purchase agreement, partially offset by the proceeds from the Revolver and Draw Amount.
such repurchases may be material.
Capital Resources
The Company manages capital using both regulatory capital measures and internal metrics. The Company’s capital is primarily derived from common shareholders’ equity, retained deficit and accumulated other comprehensive (loss) income.
As a holding company, Atlas could derive cash from its Insurance Subsidiariessubsidiaries generally in the form of dividends to meet its obligations, which will primarily consist of operating expense payments and debt payments. Atlas’ Insurance SubsidiariesAtlas subsidiaries fund their obligations primarily through premiumcommission and investment income and maturities in the securities portfolio. The Insurance Subsidiaries require regulatory approval for the return of capital, loans or advances and, in certain circumstances, prior to the payment of dividends. In the event that dividends available to the holding company are inadequate to cover its operating expenses and debt payments, the holding company would need to raise capital, sell assets or incur future debt.fee income.
The Insurance Subsidiaries must each maintain a minimum statutory capital and surplus of $1.5 million, $2.4 million and $3.5 million under the provisions of the Illinois Insurance Code, the Missouri Insurance Code and the New York Insurance Code, respectively. Dividends may only be paid from statutory unassigned surplus, and payments may not be made if such surplus is less than a stipulated amount. The dividend restriction for the ASI Pool Subsidiaries is the greater of statutory net income or 10% of total statutory capital and surplus. The dividend restriction for Global Liberty is the lower of 10% of statutory surplus or 100% of adjusted net investment income for the preceding twelve months. Atlas' Insurance Subsidiaries did not declare or pay any dividends to Atlas during 2018 or 2017. See “Risk Factors - Risks Related to 2019 Developments - Regulatory Developments” for certain developments with respect to the Insurance Subsidiaries subsequent to December 31, 2018. |
| | | | | | | | | |
| Statutory Net Loss and Surplus of Atlas’ Insurance Subsidiaries | |
| ($ in ‘000s) | Year ended December 31, |
| | 2018 | 2017 | 2016 |
| Net loss computed under statutory-basis accounting | $ | 49,648 |
| $ | 35,199 |
| $ | 3,585 |
|
| | | | |
| Combined statutory capital and surplus | $ | 14,377 |
| $ | 87,813 |
| $ | 113,943 |
|
| | | | |
Item 7A. Quantitative and Qualitative Disclosures about Market Risk
Market risk is the risk that Atlas will incur losses due to adverse changesWe are a smaller reporting company as defined in interest rates, currency exchange rates or equity prices. Having increased our mortgage and asset-backed securities holdings, our primary market risk exposures in the fixed income securities portfolio are to changes in interest rates, inflation and the uncertainty of prepayment assumptions. Because Atlas’ securities portfolio is comprised of primarily fixed income securities, periodic changes in interest rate levels generally impact its financial results to the extent that the securities in its available-for-sale portfolio are recorded at market value. During periods of rising interest rates, the market valueRule 12b-2 of the existing fixed income securities will generally decrease, and realized gains on fixed income securities will likely be reduced. The reverse is true during periods of declining interest rates. Changes in inflation can influence the interest rates, which can impact the fair value of our available-for-sale fixed income portfolio and yields on new investments.
Although mortgages can have a contractual term of a certain number of years, quite often mortgagesExchange Act; therefore, pursuant to Regulation S-K, we are paid off much sooner. Because of these unscheduled prepayments, predicting the maturity of mortgage backed securities can be problematic. In addition, mortgage-backed securities are marketable and can trade at premiums, discounts or par value, depending upon changes in current market rates. A current-coupon pass-through trades at par value, while high-coupon pass-throughs trade at premiums and low-coupon securities trade at discounts. Prepayment speed can affect premium and discount pass-throughs adversely. Prepayments at par value result in cash flows that can only be reinvested at the lower, current rate. Consequently, faster-than-anticipated prepayments deny the investor the high cash flows that justified the premium price in the first place. On the other hand, slower prepayments offer the investor more timenot required to earn the higher coupon rate. For mortgage-backed securities trading at a discount pass-through, faster-than-expected prepayments can allow the investor to reinvest in securities with higher coupon rates. The reverse happens when prepayments are slower than expected. The investor can be forced to hold on to the lower coupons for a longer period of time, thereby reducing realized yield.
With a weighted average contractual duration of 3.8 years, changes in interest rates are expected to have a modest market value impact on the Atlas fixed income portfolio relative to longer duration portfolios. Atlas can, and typically does, hold bonds to maturity by matching duration with the anticipated liquidity needs.
Equity Price Risk
Atlas’ equity securities are primarily subject to equity price risk. Equity price risk is the risk of loss in the fair value of equity securities due to the adverse changes in equity prices. The equity securities portfolio is approximately 3.6% of Atlas’ total investment portfolio, and any adverse impact from equity price risk would not be material to Atlas’ investment portfolio.
Interest Rate Risk
Sensitivity analysis expresses the potential loss in future earnings, fair values or cash flows of market sensitive instruments resulting from one or more selected hypothetical changes in interest rates, foreign currency exchange rates, commodity prices and other relevant market rates or prices over a select period of time. The actual results may differ from the hypothetical results below, since the analysis does not include any action that would be taken by the company to reduce the negative impact of changes in the interest rate.
Atlas’ available-for-sale fixed income securities held as of December 31, 2018 were $130.0 million. A 100 basis point increase in interest rates on such held fixed income securities would have increased net investment income and income before income taxes by approximately $101,000. Conversely, a 100 basis point decrease in interest rates on such held fixed income securities would decrease net investment income and income before income taxes by $107,000. Atlas uses a 1 year time period with a 100 basis point increase and decrease to determine the impact on the fixed income security portfolio.
A 100 basis point increase would have also decreased other comprehensive income by approximately $5.4 million due to “mark-to-market” requirements; however, holding investments to maturity would be expected to mitigatemake disclosures under this impact. Conversely, a 100 basis point decrease would increase other comprehensive income by the same amount. The impacts described here are approximately linear to the change in interest rates. Atlas uses the duration of the portfolio to determine the impact on other comprehensive income from 100 basis point changes in the interest rate.
On April 26, 2017, Atlas issued five-year 6.625% senior unsecured notes. As of December 31, 2018, the senior unsecured notes have an outstanding balance of $24.3 million. Atlas may, at its option, beginning with the interest payment date of April 26, 2020, and on any scheduled interest payment date thereafter, redeem the senior unsecured notes, in whole or in part, at a redemption price equal to 100% of the principal amount plus accrued and unpaid interest to, but excluding, the date of redemption. For the sensitivity analysis, an instantaneous 100 basis point increase and decrease are assumed on the market discount rate and the change in net present value from these hypothetical changes in the market discount rate are measured. An instantaneous 100 basis pointitem.
decrease would increase the fair market value on notes payable by $789,000. Conversely, an instantaneous 100 basis point increase would decrease the fair market value on notes payable by $762,000.
Credit Risk
Atlas is exposed to credit risk principally through its fixed income securities and balances receivable from policyholders and reinsurers. Atlas controls and monitors concentration and credit quality risk through policies to limit and monitor its exposure to individual issuers or related groups (with the exception of U.S. Government bonds) as well as through ongoing review of the credit ratings of issuers held in the securities portfolio. Atlas’ credit exposure to any one individual policyholder is not material. Atlas has policies requiring evaluation of the financial condition of its reinsurers and monitors concentrations of credit risk arising from similar geographic regions, activities or economic characteristics of the reinsurers to minimize its exposure to significant losses from reinsurer insolvency.
Foreign Currency Risk
Atlas is not currently exposed to material changes in the U.S. dollar currency exchange rates with any other foreign currency.
Liquidity and Cash Flow Risk
Liquidity risk is the risk of having insufficient cash resources to meet current financial obligations without raising funds at unfavorable rates or selling assets on a forced basis. Liquidity risk arises from general business activities and in the course of managing the assets and liabilities of Atlas. There is the risk of loss to the extent that the sale of a security prior to its maturity is required to provide liquidity to satisfy policyholder and other cash outflows. Cash flow risk arises from risk that future inflation of policyholder cash flow exceeds returns on long-term investment securities. The purpose of liquidity and cash flow management is to ensure that there is sufficient cash to meet all financial commitments and obligations as they fall due. The liquidity and cash flow requirements of Atlas’ business have been met primarily by funds generated from operations, asset maturities and income and other returns received on securities. Cash provided from these sources is used primarily for claims and claims adjustment expense payments and operating expenses. The timing and amount of catastrophe and/or single large loss claims are inherently unpredictable and may create increased liquidity requirements. We purchase reinsurance coverage in an effort to mitigate the risk of an unexpected rise in claims severity or frequency from catastrophe and/or single large loss claims. The availability, amount and cost of the reinsurance depends on market conditions and may fluctuate significantly.
Underwriting Risk
Underwriting risk is the risk that the total cost of claims and acquisition expenses will exceed premiums received and can arise from numerous factors, including pricing risk, reserving risk, catastrophic claims risk, reinsurance coverage risk and the risk that claims and claims adjustment expense reserves are not sufficient.
Item 8. Financial Statements and Supplemental Schedules
Report of Independent Registered Public Accounting Firm
Shareholders and Board of Directors
Atlas Financial Holdings, Inc.
Schaumburg, Illinois
Opinion on the Consolidated Financial Statements
We have audited the accompanying consolidated statementstatements of financial position of Atlas Financial Holdings, Inc. (the “Company”"Company") and subsidiaries as of December 31, 2019 and 2018, the related consolidated statements of loss andoperations, comprehensive loss,(loss) income, shareholders’ (deficit) equity, and cash flows, for the yearyears then ended, December 31, 2018, and the related notes and financial statement schedules (collectively referred to as the “consolidated"consolidated financial statements”statements"). In our opinion, the consolidated financial statements present fairly, in all material respects, the financial position of the Company and its subsidiaries atas of December 31, 2019 and 2018, and the results of their operations and their cash flows for the yearyears then ended, December 31, 2018, in conformity with accounting principles generally accepted in the United States of America.
We also have audited, in accordance with the standards of the Public Company Accounting Oversight Board (United States) (“PCAOB”), the Company's internal control over financial reporting as of December 31, 2018, based on criteria established in Internal Control - Integrated Framework (2013) issued by the Committee of Sponsoring Organizations of the Treadway Commission (“COSO”) and our report dated February 12, 2020 expressed an adverse opinion.
Basis for Opinion
These consolidated financial statements are the responsibility of the Company’sCompany's management. Our responsibility is to express an opinion on the Company’s consolidated financial statements based on our audit. We are a public accounting firm registered with the PCAOB and are required to be independent with respect to the Company in accordance with the U.S. federal securities laws and the applicable rules and regulations of the Securities and Exchange Commission and the PCAOB.
We conducted our audit in accordance with the standards of the PCAOB. Those standards require that we plan and perform the audit to obtain reasonable assurance about whether the consolidated financial statements are free of material misstatement, whether due to error or fraud. Our audit included performing procedures to assess the risks of material misstatement of the consolidated financial statements, whether due to error or fraud, and performing procedures that respond to those risks. Such procedures included examining, on a test basis, evidence regarding the amounts and disclosures in the consolidated financial statements. Our audit also included evaluating the accounting principles used and significant estimates made by management, as well as evaluating the overall presentation of the consolidated financial statements. We believe that our audit provides a reasonable basis for our opinion.
Emphasis of a Matter
As disclosed in Note 20 to the consolidated financial statements, Atlas Financial Holdings, Inc. has been exploring strategic alternatives to its business model as all three of its Illinois domesticated insurance companies were placed into rehabilitation with the Illinois Department of Insurance in 2019. The Company plans to reduce its risk as an insurance carrier and transition to a managing general agency business model. The Company will utilize its existing managing general agency platform to effectuate this change in its business model and work with strategic external insurance and reinsurance partners. Our opinion is not modified with respect to this matter.
/s/ Baker Tilly Virchow Krause, LLP
We have served as the Company’s auditor since 2019.
Milwaukee, WI
February 12, 2020
Report of Independent Registered Public Accounting Firm
Board of Directors and Shareholders
Atlas Financial Holdings, Inc.
Schaumburg, Illinois
Adverse Opinion on Internal Control over Financial Reporting
We have audited Atlas Financial Holdings, Inc.’s (the “Company’s”) internal control over financial reporting as of December 31, 2018, based on criteria established in Internal Control - Integrated Framework (2013) issued by the Committee of Sponsoring Organizations of the Treadway Commission (“COSO”). In our opinion, because of the effect of the material weakness described in the following paragraph on the achievement of the objectives of the control criteria, the Company has not maintained effective internal control over financial reporting as of December 31, 2018, based on criteria established in Internal Control - Integrated Framework (2013) issued by COSO.
A material weakness is a control deficiency, or a combination of deficiencies, in internal control over financial reporting, such that there is a reasonable possibility that a material misstatement of the Company’s annual or interim consolidated financial statements will not be prevented or detected on a timely basis. The following material weakness has been identified: The Company did not have an effective internal control in place to monitor the progress of all aspects of its financial reporting close process to timely identify delays, as described in the accompanying Management’s Report on Internal Control over Financial Reporting (“Management’s Report”). This material weakness was considered in determining the nature, timing, and extent of audit tests applied in our audit of the 2018 consolidated financial statements, and this report does not affect our report dated February 12, 2020, on those consolidated financial statements.
We also have audited, in accordance with the standards of the Public Company Accounting Oversight Board (United States) (“PCAOB”), the consolidated statement of financial position and the related statements of (loss) income and comprehensive (loss) income, shareholders’ equity, and cash flows of the Company, and our report dated February 12, 2020 expressed an unqualified opinion.
Basis for Opinion
The Company’s management is responsible for maintaining effective internal control over financial reporting, and for its assessment of the effectiveness of internal control over financial reporting, included in the accompanying Annual Report on Form 10-K. Our responsibility is to express an opinion on the Company’s internal control over financial reporting based on our audit. We are a public accounting firm registered with the PCAOB and are required to be independent with respect to the Company in accordance with the U.S. federal securities laws and the applicable rules and regulations of the Securities and Exchange Commission and the PCAOB.
We conducted our audit in accordance with the standards of the PCAOB. Those standards require that we plan and perform the audit to obtain reasonable assurance about whether effective internal control over financial reporting was maintained in all material respects. Our audit of internal control over financial reporting included obtaining an understanding of internal control over financial reporting, assessing the risk that a material weakness exists, and testing and evaluating the design and operating effectiveness of internal control based on the assessed risk. Our audit also included performing such other procedures as we considered necessary in the circumstances. We believe that our audit provides a reasonable basis for our opinion.
Definition and Limitations of Internal Control over Financial Reporting
A company's internal control over financial reporting is a process designed to provide reasonable assurance regarding the reliability of financial reporting and the preparation of financial statements for external purposes in accordance with generally accepted accounting principles. A company's internal control over financial reporting includes those policies and procedures that (1) pertain to the maintenance of records that, in reasonable detail, accurately and fairly reflect the transactions and dispositions of the assets of the company; (2) provide reasonable assurance that transactions are recorded as necessary to permit preparation of financial statements in accordance with generally accepted accounting principles, and that receipts and expenditures of the company are being made only in accordance with authorizations of management and directors of the company; and (3) provide reasonable assurance regarding prevention or timely detection of unauthorized acquisition, use, or disposition of the company's assets that could have a material effect on the financial statements.
Because of its inherent limitations, internal control over financial reporting may not prevent or detect misstatements. Also, projections of any evaluation of effectiveness to future periods are subject to the risk that controls may become inadequate because of changes in conditions, or that the degree of compliance
with the policies or procedures may deteriorate.
/s/ Baker Tilly Virchow Krause, LLP
Milwaukee, WI
February 12, 2020
Report of Independent Registered Public Accounting Firm
Shareholders and Board of Directors
Atlas Financial Holdings, Inc.
Schaumburg, Illinois
Opinion on the Consolidated Financial Statements
We have audited the accompanying consolidated statement of financial position of Atlas Financial Holdings, Inc. (the “Company”) and subsidiaries as of December 31, 2017, the related consolidated statements of (loss) income and comprehensive (loss) income, shareholders’ equity, and cash flows for the years ended December 31, 2017 and 2016, and the related notes and financial statement schedules listed in the accompanying index (collectively referred to as the “consolidated financial statements”). In our opinion, the consolidated financial statements present fairly, in all material respects, the financial position of the Company and subsidiaries at December 31, 2017, and the results of their operations and their cash flows for the years ended December 31, 2017 and 2016, in conformity with accounting principles generally accepted in the United States of America.
Basis for Opinion
These consolidated financial statements are the responsibility of the Company’s management. Our responsibility is to express an opinion on the Company’sCompany's consolidated financial statements based on our audits. We are a public accounting firm registered with the PCAOBPublic Company Accounting Oversight Board (United States) ("PCAOB") and are required to be independent with respect to the Company in accordance with the U.S. federal securities laws and the applicable rules and regulations of the Securities and Exchange Commission and the PCAOB.
We conducted our audits in accordance with the standards of the PCAOB. Those standards require that we plan and perform the audit to obtain reasonable assurance about whether the consolidated financial statements are free of material misstatement, whether due to error or fraud.
Our audits included performing procedures to assess the risks of material misstatement of the consolidated financial statements, whether due to error or fraud, and performing procedures that respond to those risks. Such procedures included examining, on a test basis, evidence regarding the amounts and disclosures in the consolidated financial statements. Our audits also included evaluating the accounting principles used and significant estimates made by management, as well as evaluating the overall presentation of the consolidated financial statements. We believe that our audits provide a reasonable basis for our opinion.
Emphasis of Matters
As disclosed in Note 19 to the consolidated financial statements, the Company lost control of the ASI Pool Companies effective October 1, 2019 and deconsolidated them from the consolidated financial statements as of that date. The financial results of the ASI Pool Companies are included in the consolidated statements of operations through the October 1, 2019 de-recognition date. Our opinion is not modified with respect to this matter.
As disclosed in Note 19 to the consolidated financial statements, Global Liberty Insurance Company of New York has been classified as held for sale and presented as a discontinued operation for all periods presented as the Company began actively pursuing the potential sale of Global Liberty Insurance Company of New York during the fourth quarter of 2019 as a result of the Company’s strategic shift in its business model, which includes a transition to a managing general agency model. Our opinion is not modified with respect to this matter.
We have served as the Company’s auditor since 2019.
/s/ BDO USA,Baker Tilly US, LLP
Grand Rapids, MichiganMilwaukee, Wisconsin
February 12,December 3, 2020
Atlas Financial Holdings, Inc.
Consolidated Statements of Financial Position
| | | ($ in ‘000s, except for share and per share data) | December 31, | December 31, |
| | 2018 | 2017 | 2019 | 2018 |
| Assets | | |
| Investments | | |
| Fixed income securities, available for sale, at fair value (amortized cost $133,213 and $158,411) | $ | 129,991 |
| $ | 157,984 |
| |
| Equity securities, at fair value (cost $5,650 and $7,969) | 5,929 |
| 8,446 |
| |
| Fixed income securities, available for sale, at fair value (amortized cost $0 and $98,855) | | $ | — |
| $ | 96,590 |
|
| Equity securities, at fair value (cost $0 and $5,650) | | — |
| 5,929 |
|
| Short-term investments, at cost | 4,745 |
| — |
| — |
| 4,493 |
|
| Other investments | 25,043 |
| 31,438 |
| — |
| 23,722 |
|
| Total investments | 165,708 |
| 197,868 |
| — |
| 130,734 |
|
| Cash and cash equivalents | 34,902 |
| 45,615 |
| 9,025 |
| 29,480 |
|
| Restricted cash | | 7,122 |
| 4,675 |
|
| Accrued investment income | 749 |
| 1,248 |
| — |
| 548 |
|
| Premiums receivable (net of allowance of $5,115 and $3,418) | 88,596 |
| 79,664 |
| |
| Premiums receivable (net of allowance of $800 and $5,115) | | 38,607 |
| 88,596 |
|
| Reinsurance recoverables on amounts paid | 12,388 |
| 7,982 |
| — |
| 10,260 |
|
| Reinsurance recoverables on amounts unpaid | 68,771 |
| 53,402 |
| — |
| 55,265 |
|
| Prepaid reinsurance premiums | 36,898 |
| 12,878 |
| — |
| 31,151 |
|
| Deferred policy acquisition costs | 7,309 |
| 14,797 |
| |
| Deferred tax asset, net | — |
| 16,985 |
| |
| Goodwill, net | — |
| 2,726 |
| |
| Deferred policy acquisition costs, net | | — |
| 5,918 |
|
| Intangible assets, net | 3,755 |
| 4,145 |
| 2,625 |
| 3,755 |
|
| Property and equipment, net | 31,363 |
| 24,439 |
| 21,793 |
| 29,866 |
|
| Right-of-use asset | | 1,592 |
| — |
|
| Notes receivable | | 15,500 |
| — |
|
| Other assets | 19,899 |
| 20,754 |
| 3,295 |
| 15,011 |
|
| Assets held for sale | | 51,302 |
| 65,079 |
|
| Total assets | $ | 470,338 |
| $ | 482,503 |
| $ | 150,861 |
| $ | 470,338 |
|
| | | |
| Liabilities | | |
| Claims liabilities | $ | 273,496 |
| $ | 211,648 |
| $ | — |
| $ | 226,487 |
|
| Unearned premium reserves | 134,040 |
| 128,043 |
| — |
| 111,461 |
|
| Due to reinsurers | 15,849 |
| 8,411 |
| — |
| 13,494 |
|
| Premiums payable | | 43,988 |
| — |
|
| Lease liability | | 1,993 |
| — |
|
| Due to deconsolidated affiliates | | 11,172 |
| — |
|
| Notes payable, net | 24,255 |
| 24,031 |
| 32,100 |
| 24,255 |
|
| Other liabilities and accrued expenses | 16,999 |
| 19,725 |
| 7,302 |
| 15,573 |
|
| Liabilities held for sale | | 62,767 |
| 73,369 |
|
| Total liabilities | $ | 464,639 |
| $ | 391,858 |
| $ | 159,322 |
| $ | 464,639 |
|
| Commitments and contingencies (see Note 8) |
| |
| Commitments and contingencies (See Note 8) | |
|
| Shareholders’ equity | | |
| Ordinary voting common shares, $0.003 par value, 266,666,667 shares authorized, shares issued: December 31, 2018 - 12,192,475 and December 31, 2017 - 12,164,041; shares outstanding: December 31, 2018 - 11,936,970 and December 31, 2017 - 12,164,041 | $ | 36 |
| $ | 36 |
| |
| Restricted voting common shares, $0.003 par value, 33,333,334 shares authorized, shares issued and outstanding: December 31, 2018 and December 31, 2017 - 0 | — |
| — |
| |
| Ordinary voting common shares, $0.003 par value, 266,666,667 shares authorized, shares issued: December 31, 2019 - 12,198,319 and December 31, 2018 - 12,192,475; shares outstanding: December 31, 2019 - 11,942,812 and December 31, 2018 - 11,936,970 | | $ | 36 |
| $ | 36 |
|
| Additional paid-in capital | 202,298 |
| 201,105 |
| 81,548 |
| 202,298 |
|
| Treasury stock, at cost: December 31, 2018 - 255,505 and December 31, 2017 - 0 shares of ordinary voting common shares | (3,000 | ) | — |
| |
| Treasury stock, at cost: 255,505 shares of ordinary common voting shares at December 31, 2019 and December 31, 2018, respectively | | (3,000 | ) | (3,000 | ) |
| Retained deficit | (190,503 | ) | (110,535 | ) | (87,469 | ) | (190,503 | ) |
| Accumulated other comprehensive (loss) income, net of tax | (3,132 | ) | 39 |
| |
| Total shareholders' equity | $ | 5,699 |
| $ | 90,645 |
| |
| Accumulated other comprehensive income (loss), net of tax | | 424 |
| (3,132 | ) |
| Total shareholders' (deficit) equity | | $ | (8,461 | ) | $ | 5,699 |
|
| Total liabilities and shareholders' equity | $ | 470,338 |
| $ | 482,503 |
| $ | 150,861 |
| $ | 470,338 |
|
| | | |
See accompanying Notes to Consolidated Financial Statements.
Atlas Financial Holdings, Inc.
Consolidated Statements of (Loss) Income
and Comprehensive (Loss) IncomeOperations
|
| | | | | | | | | |
| Consolidated Statements of (Loss) Income |
| ($ in ‘000s, except for share and per share data) | Year ended December 31, |
| | 2018 | 2017 | 2016 |
| Net premiums earned | $ | 218,218 |
| $ | 215,771 |
| $ | 171,058 |
|
| Net investment income | 2,647 |
| 4,897 |
| 4,824 |
|
| Loss from change in fair value of equity securities | (198 | ) | — |
| — |
|
| Net realized gains | 573 |
| 872 |
| 1,230 |
|
| Other income | 526 |
| 435 |
| 467 |
|
| Total revenue | 221,766 |
| 221,975 |
| 177,579 |
|
| Net claims incurred | 220,662 |
| 203,873 |
| 134,746 |
|
| Acquisition costs | 26,115 |
| 27,885 |
| 18,803 |
|
| Other underwriting expenses | 34,725 |
| 32,140 |
| 28,399 |
|
| Amortization of intangible assets | 390 |
| 390 |
| 390 |
|
| Goodwill impairment loss | 2,726 |
| — |
| — |
|
| Interest expense | 1,869 |
| 1,840 |
| 1,026 |
|
| Expenses recovered pursuant to stock purchase agreements | (520 | ) | — |
| (6,297 | ) |
| Total expenses | 285,967 |
| 266,128 |
| 177,067 |
|
| (Loss) income from operations before income taxes | (64,201 | ) | (44,153 | ) | 512 |
|
| Income tax expense (benefit) | 15,811 |
| (5,343 | ) | (2,134 | ) |
| Net (loss) income | (80,012 | ) | (38,810 | ) | 2,646 |
|
| Less: Preferred share dividends | — |
| — |
| 281 |
|
| Net (loss) income attributable to common shareholders | $ | (80,012 | ) | $ | (38,810 | ) | $ | 2,365 |
|
| | | | |
| Basic weighted average common shares outstanding | 11,992,808 | 12,064,880 | 12,045,519 |
| (Loss) earnings per common share basic | $ | (6.67 | ) | $ | (3.22 | ) | $ | 0.20 |
|
| Diluted weighted average common shares outstanding | 11,992,808 | 12,064,880 | 12,222,883 |
| (Loss) earnings per common share diluted | $ | (6.67 | ) | $ | (3.22 | ) | $ | 0.19 |
|
| | | | |
| Consolidated Statements of Comprehensive (Loss) Income |
| Net (loss) income | $ | (80,012 | ) | $ | (38,810 | ) | $ | 2,646 |
|
| | | | |
| Other comprehensive (loss) income: | | | |
| Changes in net unrealized investment (losses) gains | (3,078 | ) | 437 |
| 855 |
|
| Reclassification to net income (loss) | 284 |
| (49 | ) | 394 |
|
| Effect of income taxes | — |
| (136 | ) | (437 | ) |
| Other comprehensive (loss) income | (2,794 | ) | 252 |
| 812 |
|
| Total comprehensive (loss) income | $ | (82,806 | ) | $ | (38,558 | ) | $ | 3,458 |
|
| | | | |
|
| | | | | | |
| Consolidated Statements of Operations |
| ($ in ‘000s, except for share and per share data) | Year ended December 31, |
| | 2019 | 2018 |
| Net premiums earned | $ | 110,241 |
| $ | 180,686 |
|
| Commission income | 7,458 |
| 7,877 |
|
| Net investment income | 1,902 |
| 1,793 |
|
| Loss from change in fair value of equity securities | (277 | ) | (198 | ) |
| Net realized gains | 821 |
| 693 |
|
| Other income | 453 |
| 527 |
|
| Total revenue | 120,598 |
| 191,378 |
|
| Net claims incurred | 80,767 |
| 182,256 |
|
| Acquisition costs | 11,825 |
| 28,383 |
|
| Other underwriting expenses | 33,759 |
| 30,406 |
|
| Amortization of intangible assets | 390 |
| 390 |
|
| Intangible asset and goodwill impairment loss | 740 |
| 2,726 |
|
| Interest expense, net | 1,466 |
| 1,869 |
|
| Expenses recovered pursuant to stock purchase agreements | — |
| (520 | ) |
| Loss on disposal of subsidiaries | 4,427 |
| — |
|
| Total expenses | 133,374 |
| 245,510 |
|
| Loss from operations before income taxes | (12,776 | ) | (54,132 | ) |
| Income tax expense | 223 |
| 14,494 |
|
| Loss from continuing operations | (12,999 | ) | (68,626 | ) |
| Loss from discontinued operations, net of tax | (7,427 | ) | (11,386 | ) |
| Net loss | $ | (20,426 | ) | $ | (80,012 | ) |
| | | |
| Basic net loss per share attributable to common shareholders | | |
| Continuing operations | $ | (1.09 | ) | $ | (5.72 | ) |
| Discontinued operations | (0.62 | ) | (0.95 | ) |
| Net loss | $ | (1.71 | ) | $ | (6.67 | ) |
| Diluted net loss per share attributable to common shareholders | | |
| Continuing operations | $ | (1.09 | ) | $ | (5.72 | ) |
| Discontinued operations | (0.62 | ) | (0.95 | ) |
| Net loss | $ | (1.71 | ) | $ | (6.67 | ) |
| Basic weighted average common shares outstanding | 11,954,494 |
| 11,992,808 |
|
| Diluted weighted average common shares outstanding | 11,954,494 |
| 11,992,808 |
|
| | | |
| Consolidated Statements of Comprehensive Income (Loss) |
| Net loss | $ | (20,426 | ) | $ | (80,012 | ) |
| | | |
| Other comprehensive income (loss): | | |
| Changes in net unrealized investment gains (losses) | 1,917 |
| (3,078 | ) |
| Reclassification to net income | 2,243 |
| 284 |
|
| Other comprehensive income (loss) | 4,160 |
| (2,794 | ) |
| Total comprehensive loss | $ | (16,266 | ) | $ | (82,806 | ) |
| | | |
See accompanying Notes to Consolidated Financial Statements.
Atlas Financial Holdings, Inc.
Consolidated Statements of Shareholders’ (Deficit) Equity
| | | ($ in ‘000s) | Ordinary Voting Common Shares | Restricted Voting Common Shares | Additional Paid-In Capital | Treasury Stock | Retained Deficit | Accumulated Other Comprehensive (Loss)/Income | Total Shareholders' Equity | Ordinary Voting Common Shares | Additional Paid-In Capital | Treasury Stock | Retained Deficit | Accumulated Other Comprehensive Income (Loss) | Total Shareholders' Equity (Deficit) |
Balance December 31, 2015 | $ | 36 |
| $ | — |
| $ | 198,041 |
| $ | — |
| $ | (74,364 | ) | $ | (1,032 | ) | $ | 122,681 |
| |
| Net income | — |
| — |
| — |
| — |
| 2,646 |
| — |
| 2,646 |
| |
| Preferred dividends paid | — |
| — |
| (409 | ) | — |
| — |
| — |
| (409 | ) | |
| Other comprehensive income | — |
| — |
| — |
| — |
| — |
| 812 |
| 812 |
| |
| Share-based compensation | — |
| — |
| 1,612 |
| — |
| — |
| — |
| 1,612 |
| |
| Balance December 31, 2016 | $ | 36 |
| $ | — |
| $ | 199,244 |
| $ | — |
| $ | (71,718 | ) | $ | (220 | ) | $ | 127,342 |
| |
| ASU 2018-02, reclassification of certain tax effects | — |
| — |
| — |
| — |
| (7 | ) | 7 |
| — |
| |
| Net loss | — |
| — |
| — |
| — |
| (38,810 | ) | — |
| (38,810 | ) | |
| Other comprehensive income | — |
| — |
| — |
| — |
| — |
| 252 |
| 252 |
| |
| Options exercised | — |
| — |
| 655 |
| — |
| — |
| — |
| 655 |
| |
| Share-based compensation | — |
| — |
| 1,176 |
| — |
| — |
| — |
| 1,176 |
| |
| Other | — |
| — |
| 30 |
| — |
| — |
| — |
| 30 |
| |
| Balance December 31, 2017 | $ | 36 |
| $ | — |
| $ | 201,105 |
| $ | — |
| $ | (110,535 | ) | $ | 39 |
| $ | 90,645 |
| $ | 36 |
| $ | 201,105 |
| $ | — |
| $ | (110,535 | ) | $ | 39 |
| $ | 90,645 |
|
| Cumulative effect of new accounting principle in period of adoption | — |
| — |
| — |
| — |
| 377 |
| (377 | ) | — |
| — |
| — |
| — |
| 377 |
| (377 | ) | — |
|
| Net loss | — |
| — |
| — |
| — |
| (80,012 | ) | — |
| (80,012 | ) | — |
| — |
| — |
| (80,012 | ) | — |
| (80,012 | ) |
| Purchase of treasury stock | — |
| — |
| — |
| (3,000 | ) | — |
| — |
| (3,000 | ) | — |
| — |
| (3,000 | ) | — |
| — |
| (3,000 | ) |
| Preferred dividends paid | — |
| — |
| — |
| — |
| (333 | ) | — |
| (333 | ) | — |
| — |
| — |
| (333 | ) | — |
| (333 | ) |
| Other comprehensive loss | — |
| — |
| — |
| — |
| — |
| (2,794 | ) | (2,794 | ) | — |
| — |
| — |
| — |
| (2,794 | ) | (2,794 | ) |
| Share-based compensation | — |
| — |
| 1,201 |
| — |
| — |
| — |
| 1,201 |
| — |
| 1,201 |
| — |
| — |
| — |
| 1,201 |
|
| Other | — |
| — |
| (8 | ) | — |
| — |
| — |
| (8 | ) | — |
| (8 | ) | — |
| — |
| — |
| (8 | ) |
| Balance December 31, 2018 | $ | 36 |
| $ | — |
| $ | 202,298 |
| $ | (3,000 | ) | $ | (190,503 | ) | $ | (3,132 | ) | $ | 5,699 |
| $ | 36 |
| $ | 202,298 |
| $ | (3,000 | ) | $ | (190,503 | ) | $ | (3,132 | ) | $ | 5,699 |
|
| Deconsolidation of ASI Pool | | — |
| (121,622 | ) | — |
| 123,460 |
| (604 | ) | 1,234 |
|
| Net loss | | — |
| — |
| — |
| (20,426 | ) | — |
| (20,426 | ) |
| Other comprehensive income | | — |
| — |
| — |
| — |
| 4,160 |
| 4,160 |
|
| Share-based compensation | | — |
| 872 |
| — |
| — |
| — |
| 872 |
|
| Balance December 31, 2019 | | $ | 36 |
| $ | 81,548 |
| $ | (3,000 | ) | $ | (87,469 | ) | $ | 424 |
| $ | (8,461 | ) |
See accompanying Notes to Consolidated Financial Statements.
Atlas Financial Holdings, Inc.
Consolidated Statements of Cash Flows
| | | ($ in ‘000s) | Year ended December 31, | Year ended December 31, |
| | 2018 | 2017 | 2016 | 2019 | 2018 |
| Operating activities: | | |
| Net (loss) income | $ | (80,012 | ) | $ | (38,810 | ) | $ | 2,646 |
| |
| Adjustments to reconcile net (loss) income to net cash flows (used in) provided by operating activities: | |
| Net loss | | $ | (20,426 | ) | $ | (80,012 | ) |
| Adjustments to reconcile net loss to net cash flows used in operating activities: | | Adjustments to reconcile net loss to net cash flows used in operating activities: |
| Loss from discontinued operations, net of taxes | | 7,427 |
| 11,386 |
|
| Depreciation and amortization | 2,911 |
| 1,372 |
| 1,000 |
| 3,850 |
| 2,548 |
|
| Share-based compensation expense | 1,201 |
| 1,176 |
| 1,612 |
| 872 |
| 1,201 |
|
| Amortization of deferred gain on sale of headquarters building | — |
| (17 | ) | (43 | ) | |
| Loss on deconsolidation of subsidiaries | | 4,427 |
| — |
|
| Amortization of intangible assets and goodwill impairment | 3,116 |
| 390 |
| 390 |
| 1,130 |
| 3,116 |
|
| Deferred income taxes | 16,985 |
| 1,376 |
| 452 |
| — |
| 15,768 |
|
| Loss from change in fair value of equity securities | 198 |
| — |
| — |
| 277 |
| 198 |
|
| Net realized gains | (573 | ) | (872 | ) | (1,230 | ) | (821 | ) | (693 | ) |
| Loss (gain) in equity of investees | 188 |
| (810 | ) | (1,271 | ) | |
| (Gain) loss in equity of investees | | (563 | ) | 261 |
|
| Amortization of bond premiums and discounts | 648 |
| 961 |
| 1,217 |
| 218 |
| 476 |
|
| Amortization of financing costs | 224 |
| 365 |
| 67 |
| 224 |
| 224 |
|
| Expenses recovered pursuant to stock purchase agreements | — |
| — |
| (6,623 | ) | |
| Net changes in operating assets and liabilities: | | |
| Accrued investment income | 500 |
| (20 | ) | (192 | ) | 200 |
| 322 |
|
| Premiums receivable, net | (8,932 | ) | (2,278 | ) | 5,143 |
| 39,669 |
| (9,800 | ) |
| Due from reinsurers and prepaid reinsurance premiums | (43,795 | ) | (17,735 | ) | (6,440 | ) | (12,708 | ) | (43,784 | ) |
| Deferred policy acquisition costs | 7,488 |
| (1,575 | ) | (2,987 | ) | 3,064 |
| 7,308 |
|
| Other assets | 854 |
| (7,847 | ) | (6,210 | ) | 7,226 |
| 3,308 |
|
| Claims liabilities | 61,848 |
| 72,644 |
| 11,993 |
| (21,484 | ) | 54,974 |
|
| Unearned premium reserves | 5,997 |
| 14,872 |
| 4,969 |
| (15,879 | ) | 10,891 |
|
| Due to reinsurers | 7,438 |
| 42 |
| (2,412 | ) | (6,522 | ) | 7,610 |
|
| Premiums payable | | (24,320 | ) | — |
|
| Due to deconsolidated affiliates | | 392 |
| — |
|
| Other liabilities and accrued expenses | (2,726 | ) | 3,238 |
| (1,911 | ) | (2,276 | ) | (3,042 | ) |
| Net cash flows (used in) provided by operating activities | (26,442 | ) | 26,472 |
| 170 |
| |
| Net cash flows used in operating activities - continuing operations | | (36,023 | ) | (17,740 | ) |
| Net cash flows used in operating activities - discontinued operations | | (12,735 | ) | (8,702 | ) |
| Net cash flows used in operating activities | | (48,758 | ) | (26,442 | ) |
| Investing activities: | | |
| Purchases of: | | |
| Fixed income securities | (42,873 | ) | (48,529 | ) | (58,061 | ) | (11,506 | ) | (37,266 | ) |
| Equity securities | (2,350 | ) | (7,900 | ) | (2,000 | ) | — |
| (2,350 | ) |
| Short-term investments | (4,873 | ) | — |
| — |
| (11,716 | ) | (1,161 | ) |
| Other investments | (1,161 | ) | (3,615 | ) | (11,404 | ) | (680 | ) | (4,620 | ) |
| Property, equipment and other | (9,832 | ) | (14,055 | ) | (10,181 | ) | (2,546 | ) | (8,335 | ) |
| Proceeds from sale and maturity of: | | |
| Fixed income securities | 67,114 |
| 46,853 |
| 86,013 |
| 52,364 |
| 55,412 |
|
| Equity securities | 5,458 |
| 6,161 |
| 615 |
| 5,997 |
| 5,458 |
|
| Short-term investments | 128 |
| — |
| — |
| 7,261 |
| 128 |
|
| Other investments | 7,459 |
| 5,174 |
| 3,430 |
| 8,868 |
| 7,372 |
|
| Property, equipment and other | — |
| 2 |
| — |
| |
| Net cash flows provided by (used in) investing activities | 19,070 |
| (15,909 | ) | 8,412 |
| |
| Net cash flows provided by investing activities - continuing operations | | 48,042 |
| 14,638 |
|
| Net cash flows provided by investing activities - discontinued operations | | 19,700 |
| 4,432 |
|
| Net cash flows provided by investing activities | | 67,742 |
| 19,070 |
|
| Financing activities: | | |
| Purchase of treasury stock | (3,000 | ) | — |
| — |
| — |
| (3,000 | ) |
| Preferred share buyback | — |
| — |
| (2,539 | ) | |
| Capital contributions | — |
| 30 |
| — |
| |
| Proceeds from notes payable, net of issuance costs | — |
| 23,879 |
| 2,000 |
| |
| Repayment of notes payable | — |
| (19,400 | ) | (100 | ) | (183 | ) | — |
|
| Preferred dividends paid | (333 | ) | — |
| (409 | ) | — |
| (333 | ) |
| Options exercised | — |
| 655 |
| — |
| |
| Other | (8 | ) | — |
| — |
| — |
| (8 | ) |
| Net cash flows (used in) provided by financing activities | (3,341 | ) | 5,164 |
| (1,048 | ) | |
| Net change in cash and cash equivalents | (10,713 | ) | 15,727 |
| 7,534 |
| |
| Cash and cash equivalents, beginning of period | 45,615 |
| 29,888 |
| 22,354 |
| |
| Cash and cash equivalents, end of period | $ | 34,902 |
| $ | 45,615 |
| $ | 29,888 |
| |
| | | |
| Net cash flows used in financing activities - continuing operations | | (183 | ) | (3,341 | ) |
| Net cash flows provided by financing activities - discontinued operations | | — |
| — |
|
| Net cash flows used in financing activities | | (183 | ) | (3,341 | ) |
Atlas Financial Holdings, Inc.
Consolidated Statements of Cash Flows
|
| | | | | | | | | |
| ($ in ‘000s) | Year ended December 31, |
| | 2018 | 2017 | 2016 |
| Supplemental disclosure of cash information: | | | |
| Cash (recovered) paid for: | | | |
| Income taxes | $ | (1,724 | ) | $ | 744 |
| $ | 7,015 |
|
| Interest | 1,656 |
| 1,338 |
| 885 |
|
| | | | |
| Supplemental disclosure of noncash investing and financing activities: |
| Redemption of preferred shares related to Gateway stock purchase agreement | $ | — |
| $ | — |
| $ | (2,297 | ) |
| Cancellation of preferred shares pursuant to Anchor stock purchase agreement | — |
| — |
| (4,000 | ) |
|
| | | | | | |
| ($ in ‘000s) | Year ended December 31, |
| | 2019 | 2018 |
| Net change in cash and cash equivalents and restricted cash - continuing operations | 11,836 |
| (6,443 | ) |
| Cash and cash equivalents and restricted cash, beginning of period | 34,902 |
| 45,615 |
|
| Less: cash and cash equivalents of discontinued operations - beginning of period | 747 |
| 5,017 |
|
| Cash and cash equivalents and restricted cash of continuing operations, beginning of period | 34,155 |
| 40,598 |
|
| Less: cash and restricted cash of ASI Pool Companies at September 30, 2019 | 29,844 |
| — |
|
| | | |
| Cash and cash equivalents and restricted cash of continuing operations, end of period | $ | 16,147 |
| $ | 34,155 |
|
| | | |
|
| | | | | | |
| | Year ended December 31, |
| | 2019 | 2018 |
| Supplemental disclosure of cash information: | | |
| Cash (recovered) paid for: | | |
| Income taxes | $ | (14,354 | ) | $ | (1,724 | ) |
| Interest | $ | 1,753 |
| $ | 1,656 |
|
See accompanying Notes to Consolidated Financial Statements.
Atlas Financial Holdings, Inc.
Notes to Consolidated Financial Statements
1. Nature of Operations and Basis of Presentation
Atlas Financial Holdings, Inc. (“Atlas” or “We” or the “Company”) commenced operations on December 31, 2010. The primary business of Atlas is underwriting commercial automobile insurance in the United Statesfocuses on a managing general agency strategy, primarily through our wholly owned subsidiary, Anchor Group Management, Inc. (“U.S.”AGMI”), with. AGMI focuses on a niche market orientation and focus on insurance for the “light” commercial automobile sector. This sector includes taxi cabs, non-emergency para-transit, limousine, livery, including certain transportation network companies (“TNC”) drivers/operators, and business autos. Automobile insurance products provide insurance coverage in three major areas: liability, accident benefits and physical damage. Liability insurance provides coverage subject to policy terms and conditions where the insured is determined to be responsible and/or liable for an automobile accident, for the payment for injuries and property damage to third parties. Accident benefit policies or personal injury protection policies provide coverage for loss of income, medical and rehabilitation expenses for insured persons who are injured in an automobile accident, regardless of fault. Physical damage coverage subject to policy terms and conditions provides for the payment of damages to an insured automobile arising from a collision with another object or from other risks such as fire or theft. In the short run, automobile physical damage and liability coverage generally provides more predictable results than automobile accident benefit or personal injury insurance.
Atlas’ business is carried out through its “Insurance Subsidiaries”: American Country Insurance Company (“American Country”), American Service Insurance Company, Inc. (“American Service”), Gateway Insurance Company (“Gateway”), and Global Liberty Insurance Company of New York (“Global Liberty”); and other non-insurance company subsidiaries: Anchor Group Management Inc. (“AGMI”),AGMI, Plainview Premium Finance Company, Inc. (“Plainview Delaware”), UBI Holdings Inc. (“UBI Holdings”) and UBI Holdings’ wholly-owned subsidiaries, optOn Digital IP Inc. (“OOIP”) and optOn Insurance Agency Inc. (“optOn” and together with OOIP and UBI Holdings, “UBI”).
ThePrior to a strategic transition, our core business was the underwriting of commercial automobile insurance policies, focusing on the “light” commercial automobile sector, through American Country, American Service and Gateway (collectively, the “ASI Pool Companies”) and Global Liberty (together with the ASI Pool Companies, our “Insurance Subsidiaries”), along with our wholly owned managing general agency, AGMI. As previously announced, the ASI Pool Companies were placed into rehabilitation under the statutory control of the Illinois Department of Insurance Subsidiaries distribute their insurance products through AGMI, whichduring the second half of 2019 and have been deconsolidated from these financial statements as of October 2019 as a result of these actions. Other regulatory actions were taken in certain states, including restriction, suspension, or revocation of certain state licenses and certificates of authority held by the ASI Pool Companies preceding and following the initiation of rehabilitation.
During the fourth quarter of 2019, the Company began actively pursuing the potential sale of Global Liberty, and as a result, Global Liberty has contractedbeen classified as a networkdiscontinued operation.
Atlas’ ordinary voting common shares were listed on the Nasdaq stock exchange under the symbol “AFH” as of retail independent agents. Together, the Insurance Subsidiaries are licensedDecember 31, 2019. Subsequent to write property and casualty (“P&C”) insurance in 49 states and the District of Columbia in the U.S. Atlas’ core products are actively distributed in 42 of those states plus the District of Columbia. The Insurance Subsidiaries and the Company’s other non-insurance subsidiaries share common management and operating infrastructure.
year-end, Atlas’ ordinary voting common shares are listed on the NASDAQOTC stock exchange under the symbol “AFH.”“AFHIF” (see Item 1, 2020 Developments).
Basis of Presentation
These statements have been prepared in conformity with accounting principles generally accepted in the United States of America (“U.S. GAAP”). The consolidated financial statements include the accounts of Atlas and the entities it controls. Equity investments in entities that we do not consolidate, including corporate entities in which we have significant influence and partnership and partnership-like entities in which we have more than minor influence over operating and financial policies, are accounted for under the equity method unless we have elected the fair value option. All significant intercompany accounts and transactions have been eliminated.
Seasonality
The P&C insurance business is seasonal in nature. While Atlas’ net premiums earned are generally stable from quarterOur ability to quarter, Atlas’ gross premiums written followgenerate commission income is also impacted by the common renewal dates fortiming of policy effective periods in the “light” commercial risks that represent its core lines of business.states in which we operate and products provided by our business partners. For example, January 1st and March 1st are common taxi cab renewal dates in Illinois and New York, respectively. Our New York “excess taxi program” has an annual renewal date in the third quarter. Net underwriting income is driven mainly by the timing and nature of claims, which can vary widely.
Summary of Significant Accounting Policies
Principles of Consolidation
The consolidated financial statements include the accounts of Atlas and the entities it controls. Subsidiaries are entities over which Atlas, directly or indirectly, has the power to govern the financial and operating policies in order to obtain the benefits from their activities, generally accompanying an equity shareholding of more than one half of the voting rights. Subsidiaries are fully consolidated from the date on which control is transferred to Atlas and would be de-consolidateddeconsolidated from the date that control ceases. The operating results of subsidiaries acquired or disposed of during the year will be included in the consolidated statements of (loss) income and comprehensive (loss) incomeoperations from the effective date of acquisition and up to the effective date of disposal, as appropriate. All significant intercompany transactions and balances are eliminated in consolidation. Accounting policies of subsidiaries have been changed where necessary to ensure consistency with the policies adopted by Atlas.
The following are Atlas’ subsidiaries, all of which are 100% owned, either directly or indirectly, together with the jurisdiction of incorporation, that are included in consolidated financial statements:
American Country Insurance Company (Illinois)
American Insurance Acquisition Inc. (Delaware)
American Service Insurance Company, Inc. (Illinois)
Anchor Group Management Inc. (New York)
Anchor Holdings Group, Inc. (New York)
Gateway Insurance Company (Missouri)
Global Liberty Insurance Company of New York (New York), classified as a discontinued operation
Plainview Premium Finance Company, Inc. (Delaware), merged into American Insurance Acquisition, Inc. during 2018
UBI Holdings Inc. (Delaware)
optOn Digital IP Inc. (Delaware)
optOn Insurance Agency Inc. (Delaware)
The following are Atlas’ subsidiaries, all of which are 100% owned, either directly or indirectly, together with the jurisdiction of incorporation, that are not included in consolidated financial statements effective October 2019 as management no longer has direct financial control of the entities:
American Country Insurance Company (Illinois)
American Service Insurance Company, Inc. (Illinois)
Gateway Insurance Company (Illinois)
Estimates and Assumptions
The preparation of financial statements requires management to make estimates and assumptions that affect the reported amounts of assets and liabilities and the disclosure of contingent assets and liabilities at the date of the financial statements and reported amounts of revenues and expenses during the reporting period. Actual results could differ from these estimates, and changes in estimates are recorded in the accounting period in which they are determined. The liability for unpaid claims and claims adjustment expenses and related amounts recoverable from reinsurers represents the most significant estimate in the accompanying financial statements, and differences between such estimates and actual results could be material. Significant estimates in the accompanying financial statements also include the fair values of investments, deferred policy acquisition cost recoverability and deferred tax asset valuation and business combinations.valuation.
Financial Instruments
Financial instruments are recognized and unrecognized using trade date accounting, since that is the date Atlas contractually commits to the purchase or sale with the counterparty.counter-party.
Investment Income and Realized Gains (Losses)
For securities other than mortgage-backed and asset-backed, Atlas utilizes the effective interest method to calculate the amortized cost of the financial asset and to amortize the premium or accrete the discount over the remaining life. The effective interest rate is the rate that discounts the estimated future cash flows through the expected life of the financial instrument. Mortgage-backed and asset-backed securities are valued using the retrospective adjustment method, which uses the effective interest method and includes anticipated prepayments. Interest income is reported net of amortization of premium and accretion of discount. Realized gains and losses on disposition of available-for-sale securities are based on the net proceeds and the adjusted cost of the securities sold using the specific identification method.
Cash and Cash Equivalents
Cash and cash equivalents include cash and highly liquid securities with original maturities of 90 days or less.
Short-Term Investments
Short-term investments consist of investments with original maturities between three months and one year and are reported at cost, which approximates fair value.
Restricted Cash
In its capacity as a managing general agent, the Company collects premiums from agents and insureds and after deducting our commissions and/or fees, remits the premiums to the respective insurance underwriters. These unremitted amounts are reported as restricted cash in the accompanying consolidated statements of financial position with the related liability reported as premiums payable.
Investments
Investments in fixed income are classified as available-for-sale. Securities are classified as available-for-sale when Atlas may decide to sell those securities due to changes in market interest rates, liquidity needs, changes in yields or alternative investments, and for other reasons. Available-for-sale securities are carried at fair value, with unrealized gains and losses, net of income taxes, included as a separate component of accumulated other comprehensive (loss) income in shareholders’ equity.
In the normal course of investing activities, the Company enters into relationships with variable interest entities (“VIE”), as an investor in limited partnerships or limited liability company. The Company is not the primary beneficiary of these VIEs, and therefore does not consolidate them. The Company determines whether it is the primary beneficiary of a VIE based on a qualitative assessment of the relative power and benefits of the Company and the other participants in the VIE. The Company’s maximum exposure to loss with respect to these investments is limited to the investment carrying values and any unfunded commitments.
Fair Values of Financial Instruments
Atlas has used the following methods and assumptions in estimating its fair value disclosures:
Fair values for investments are based on quoted market prices, when available. If quoted market prices are not available, fair values are based on quoted market prices of comparable instruments or values obtained from independent pricing services.
Atlas’ fixed income portfolio is managed by a Securities and Exchange Commission (“SEC”) registered investment adviser specializing in the management of insurance company portfolios. Management works directly with them to ensure that Atlas benefits from their expertise and also evaluates investments as well as specific positions independently using internal resources. Atlas’ investment adviser has a team of credit analysts for all investment grade fixed income sectors. The investment process begins with an independent analyst review of each security’s credit worthiness using both quantitative tools and qualitative review. At the issuer level, this includes reviews of past financial data, trends in financial stability, projections for the future, reliability of the management team in place and market data (credit spread, equity prices, trends in this data for the issuer and the issuer’s industry). Reviews also consider industry trends and the macro-economic environment. This analysis is continuous, integrating new information as it becomes available. As of December 31, 2018,2019, this process did not generate any significant difference in the rating assessment between Atlas’ review and the rating agencies.
Atlas employs specific control processes to determine the reasonableness of the fair value of its financial assets. These processes are designed to supplement those performed by Atlas’ investment adviser to ensure that the values received from them are accurately recorded and that the data inputs and the valuation techniques utilized are appropriate, consistently applied, and that the assumptions are reasonable and consistent with the objective of determining fair value. For example, on a continuing basis, Atlas assesses the reasonableness of individual security values that have stale prices or whose changes exceed certain thresholds as compared to previous values received from Atlas’ investment adviser or to expected prices. The portfolio is reviewed routinely for transaction volumes, new issuances, any changes in spreads, as well as the overall movement of interest rates along the yield curve to determine if sufficient activity and liquidity exists to provide a credible source for market valuations. When fair value determinations are expected to be more variable, they are validated through reviews by members of management or the Board of Directors who have relevant expertise and who are independent of those charged with executing investment transactions.
Atlas employs a fair value hierarchy to categorize the inputs it uses in valuation techniques to measure the fair value. The hierarchy is comprised of quoted prices in active markets (Level 1), third party pricing models using available trade, bid and market information (Level 2), and internal models without observable market information (Level 3). The Company recognizes transfers between levels of the fair value hierarchy at the end of the period in which events occur impacting the availability of inputs to the fair value methodology.
Premiums Receivable
Premiums receivable include premium balances due and uncollected and installment premiums not yet due from agents and insureds.
Atlas evaluates the collectibility of accounts receivable based on a combination of factors. When aware of a specific customer’s inability to meet its financial obligations, such as in the case of bankruptcy or deterioration in the customer’s operating results or financial position, Atlas records a specific reserve for bad debt to reduce the related receivable to the amount Atlas reasonably believes is collectible. Atlas also records reserves for bad debt for all other customers based on a variety of factors, including the length of time the receivables are past due and historical collection experience. Accounts are reviewed for potential write-off on a case-by-case basis. Accounts deemed uncollectible are written off, net of expected recoveries. If circumstances related to specific customers change, estimates of the recoverability of receivables could be further adjusted.
Deferred Policy Acquisition Costs
Atlas defers producers’ commissions, premium taxes and other underwritingincurs costs directly relatingto fulfill a contract (or anticipated contract) with a client. Those costs are incurred prior to the successful acquisitioneffective date of premiums writtenthe contract and relate to fulfilling our primary placement obligations to our clients. Our costs to fulfill prior to the extent theyeffective date are considered recoverable.capitalized and amortized on the effective date. These fulfillment activities include collecting underwriting information and negotiating their placement with an insurance carrier. The majority of costs that we incur relate to compensation and benefits of our underwriting staff. Costs incurred during preplacement activities are expected to be recovered in the future. If the capitalized costs are then expensed as the related premiums are earned. The method followed in determining the deferred policy acquisitions costs (“DPAC”) limits the deferral to its realizable value by giving consideration to estimated future claims and expensesno longer deemed to be incurred as premiums are earned. Changes in estimates, if any, are recorded in the accounting period in whichrecoverable, then they are determined. Anticipated investment income is included in determining the realizable value of the DPAC. Atlas’ DPAC are reported net of deferred ceding commissions.
When anticipated claims, claims adjustment expenses, commissions and other acquisition costs exceed recorded unearned premium and any future installment premiums on existing policies, a premium deficiency reserve is recognized by recording a reduction to DPAC with a corresponding charge to operations. Atlas utilizes anticipated investment income as a factor in its premium deficiency calculation. Atlas concluded that no premium deficiency adjustments were necessary in 2018, 2017 or 2016.would be expensed.
Income Taxes
Income tax expense (benefit) includes all taxes based on taxable (loss) income or loss of Atlas and its subsidiaries, and is recognized in the statements of (loss) income and comprehensive (loss) incomeoperations except to the extent that they relate to items recognized directly in other comprehensive income, in which case the income tax effect is also recognized in other comprehensive (loss) income.income or loss.
Deferred taxes are recognized based on the differences in the tax basis of assets, liabilities and items recognized directly in equity and the financial reporting basis of such items.
Deferred tax assets are recognized only to the extent that it is probable that future taxable income will be available against which they can be utilized. Deferred tax assets and liabilities (“DTAs” and “DTLs”) are measured using enacted tax rates expected to apply to taxable income in the years in which those temporary differences are expected to be recovered or settled. The effect on future tax assets and liabilities of a change in tax rates is recognized in income in the period of enactment.
When considering the extent of the valuation allowance on Atlas’ DTA,DTAs, weight is given by management to both positive and negative evidence. U.S. GAAP states that a cumulative loss in recent years is a significant piece of negative evidence that is difficult to overcome in determining that a valuation allowance is not needed against DTAs. However, the strength and trend of earnings, as well as other relevant factors are considered.
Atlas accounts for uncertain tax positions in accordance with the income taxes accounting guidance. Atlas analyzes filing positions in the federal and state jurisdiction where it is required to file tax returns, as well as the open tax years in these jurisdictions. Atlas would recognize interest and penalties related to unrecognized tax benefits as a component of the provision for federal income taxes.
Goodwill
Atlas recognized goodwill as part of the acquisition of Anchor Holdings Group, Inc. The amounts recognized represent the cost of the acquisition above the fair value of the net assets acquired. Atlas reviews goodwill at least annually for impairment.
Intangible Assets
Atlas recognized intangible assets as part of the acquisitions of Gateway and Anchor Holdings Group, Inc. The intangible assets are classified as either indefinite-lived or definite-lived depending on whether the useful lives can be identified. Atlas indefinite-lived intangible assets consistconsisted of state insurance licenses, and these intangible assets are reviewed for impairment at least annually. Definite-lived intangible assets are amortized over their useful lives on a straight-line basis except for customer related intangibles, which are on an accelerated basis. Atlas definite-lived intangible assets consist of trade names and trademarks with useful lives of 15 years and customer relationships with useful lives of 10 years. The intangible assets are reviewed for impairment at least annually.
Property and Equipment
Buildings, office equipment and internal use software are stated at historical cost less depreciation and amortization. Subsequent costs are included in the asset’s carrying amount or capitalized as a separate asset only when it is probable that future economic benefits will be realized. Land is stated at historical cost.
Internal use software includes costs associated with the Company’s policy and claims system including costs to develop those systems. Costs incurred during the preliminary project stage are expensed as incurred; costs incurred for activities during the application development stage are capitalized; and costs incurred during the post-implementation/operation stage are expensed as incurred. Upon reaching the post-implementation/operation stage of the development of internal use software, the capitalized costs are amortized over the estimated useful life of the asset.
Depreciation on buildings and building improvements are provided on a straight-line basis over the estimated useful life of 33 years for buildings and 10 years for building improvements. Depreciation and amortization on equipment and internal use software is provided on a straight-line basis over the estimated useful lives which range from 5 years for vehicles, 5 years for furniture, 5 years for enterprise software and 3 years for all other software and computer equipment and the term of the lease for leased equipment.
Repairs and maintenance are recognized as an expense during the period incurred.
Insurance Contracts
Contracts under which Atlas’ Insurance Subsidiaries accept risk at the inception of the contract from another party (the insured holder of the policy) by agreeing to compensate the policyholder or other insured beneficiary if a specified future event (the insured event) adversely affects the holder of the policy are classified as insurance contracts. All policies are short-duration contracts.
Revenue Recognition
Revenues from contracts with customers include both commission and fee income. The recognition and measurement of revenue is based on the assessments of individual contract terms. As an MGA, the Company has contracts with various insurance carriers which determines the Company’s commission income revenue. Each contract specifies what our performance obligations are as an MGA and what determines our commission income revenue, generally gross written premiums, net of cancellations and refunds. Under these contracts there are a number of performance obligations; however, it is the bundle of these services and not a single obligation that results in the performance of the MGA under the contracts. The Company considers these performance obligations as a non-bifurcated bundle of services where the performance obligations are satisfied simultaneous to the point in time where the Company issues a policy, endorses a policy, or cancels a policy to an insured. The commission rate stated in the individual contract is the standalone selling price of these non-bifurcated services which is allocated to the service bundle and not to any individual obligation under the various contracts.
The revenue included as commission income for 2019 and 2018 totaled $7.5 million and $7.9 million, respectively.
The balance of receivables related to contracts with customers, which is recorded as part of premiums receivable on the Consolidated Statements of Financial Position as of December 31, 2019 totaled $1.4 million and is all commission receivable.
Premium income is recognized on a pro rata basis over the terms of the respective insurance contracts. Unearned premium reserves represent the portion of premiums written that are related to the unexpired terms of the policies in force.
Claims Liabilities
The provision for unpaid claims represent the estimated liabilities for reported claims reported prior to the close of the accounting period, estimates for unreported claims based on industry data and actuarial estimates, plus related estimated claim adjustment expenses based on the experience of the Company. Unpaid claim adjustment expenses are determined using case-basis evaluations and statistical analyses, including insurance industry claims data, and represent estimates of the ultimate cost of all claims incurred.
The amount of uncertainty in the estimates is significantly affected by such factors as the amount of claims experience relative to the development period, knowledge of the actual facts and circumstances and the amount of insurance risk retained. The actuarial methods for making estimates for unpaid claims and for establishing the ultimate liability are periodically reviewed, and any adjustments are reflected in current operations.
Reinsurance
As part of Atlas’ insurance risk management policies, portions of its insurance risk is ceded to reinsurers. Reinsurance premiums and claims expenses are accounted for on a basis consistent with those used in accounting for the original policies issued and the terms of the reinsurance contracts. Premiums and claims ceded to other companies have been reported as a reduction of premium revenue and claims incurred. Commissions paid to Atlas by reinsurers on business ceded have been accounted for as a reduction of the related policy acquisition costs. Reinsurance recoverables are recorded for that portion of paid and unpaid claims and claims adjustment expenses that are ceded to other companies. Prepaid reinsurance premiums are recorded for unearned premiums that have been ceded to other companies.
Share-Based Compensation
Atlas has a share-based compensation plan that is described in Note 12, ‘Share-Based Compensation,’ to the Consolidated Financial Statements. Atlas uses the fair-value method of accounting to determine and account for equity settled transactions and to determine stock-based compensation for awards granted to employees and non-employees. Compensation expense is estimated based on the fair value of the award at the grant date and is recognized in net income over the requisite service period with a corresponding increase to additional paid in capital. The share-based compensation expense associated with awards that have graded vesting features and vest based on service conditions is calculated on a straight-line basis over the requisite service period for the entire award. Compensation expense recognized in connection with performance awards is based on the achievement of the specified performance and service conditions. During the recognition period compensation expense is accrued based on the performance condition that is probable of achievement. The final measure of compensation expense recognized over the requisite service period reflects the final performance outcome.
Operating Segments
Atlas operates in one business segment, the P&C insurance agency business.
Reclassifications
Certain accounts in the prior years’ consolidated financial statement have been reclassified for comparative purposes to conform to the current year’s presentation.
2. New Accounting Standards
Pertinent Accounting Standard Updates (“ASUs”) are issued from time to time by the FASB and are adopted by the Company as they become effective. All recently issued accounting pronouncements with effective dates prior to January 1, 20192020 have been adopted by the Company.
Recently Adopted
Leases
In March 2019, December 2018, July 2018 and February 2016, the FASB issued ASI 2019-01 Leases (Topic 842) Codification Improvements, ASU 2018-20 Leases (Topic 842) Narrow-Scope Improvements for Lessors, ASU 2018-11 Leases (Topic 842): Targeted Improvements and ASU 2018-10 Codification Improvements to Topic 842, Leases and ASU 2016-02, Leases (Topic 842), respectively. The provisions of these updates impact the classification criteria, disclosure requirements, and other specific transactions in lease accounting. The updates require either the use of a modified retrospective approach, which requires leases to be measured at the beginning of the earliest period presented, or the transition method, which requires entities to recognize a cumulative-effect adjustment to the opening balance of retained earnings in the period of adoption. The Company adopted the updates on January 1, 2019 using the transition method with no change to comparative periods. See Note 16, Leases, for further discussion of future lease commitments. The adoption of these updates resulted in the recognition of both a right-of-use asset and lease liability in the amounts of approximately $2.5 million and $3.1 million, respectively. There was no impact to any of Atlas’ current financial covenants as a result of the increase to reported liabilities.
Premium Amortization on Purchased Callable Debt Securities
In March 2017, the FASB issued ASU 2017-08, Receivables-Nonrefundable Fees and Other Costs (Subtopic 310-20): Premium Amortization on Purchased Callable Debt Securities. This guidance shortens the amortization period to the earliest call date for certain purchased callable debt securities held at a premium that have explicit, noncontingent call features and are callable at a fixed price and preset date. For public entities, this guidance is effective for years beginning after December 31, 2018, including interim periods within those years. The Company adopted the update on January 1, 2019 with no impact on the Company’s consolidated financial statements because Global Liberty’s callable debt securities, that are held at a premium, are amortized to the earliest call date, which is consistent with current accounting treatment.
Stock Compensation
In May 2017, the FASB issued ASU 2017-09, Compensation-Stock Compensation (Topic 718): Scope of Modification Accounting. This update provides guidance on when an entity should apply modification accounting when changes are made to a share-based compensation award. For public entities, this guidance is effective for years beginning after December 15, 2017, including interim periods within those years. Early adoption is permitted. The Company adopted the update in the first quarter of 2018 using the prescribed prospective approach. The adoption of this ASU did not have an impact on the consolidated financial statements.
Income Taxes
In October 2016, the FASB issued ASU 2016-16, Income Taxes (Topic 740): Intra-Entity Transfers of Assets Other Than Inventory. The provisions of this update modify the income tax consequences for intra-entity transactions not involving inventory. For public entities, this guidance is effective for years beginning after December 15, 2017, including interim periods within those years. Early adoption is permitted. The Company adopted the update in the first quarter of 2018 using the prescribed modified retrospective approach. Although Atlas has a number of fixed income securities that were transferred between companies owned by Atlas, this ASU did not affect the consolidated financial statements, because the transactions arewere between two U.S. entities that are part of the same consolidated group, the transactions were elected to be deferred for U.S. tax purposes until the items leave the group, which is consistent with the pre-tax GAAP treatment, and the Company already reports as part of its computational approach, the State tax results (which are zero) under the new ASU.
Statement of Cash Flows
In August 2016, the FASB issued ASU 2016-15, Statement of Cash Flows (Topic 230). The provisions of this update address the diversity in practice of eight issues on the statement of cash flows. For public entities, this guidance is effective for years beginning after December 15, 2017, including interim periods within those years. Early adoption is permitted. The Company adopted the update in the first quarter of 2018 using the prescribed retrospective approach by restating all prior periods presented. Atlas’ presentation of its consolidated statements of cash flows did not change as a result of this ASU. Atlas elected the cumulative earnings approach for distributions from equity method investees upon adoption, which was consistent under prior GAAP treatment.
Financial Instruments - Recognition and Measurement
In January 2016, the FASB issued ASU 2016-01, Financial Instruments - Overall (Subtopic 825-10): Recognition and Measurement of Financial Assets and Financial Liabilities. One provision of this update requires that equity investments, except those accounted for under the equity method, be measured at fair value and changes in fair value recognized in net income. The provisions of this update are recognized as a cumulative-effect adjustment to the balance sheet as of the beginning of the fiscal year of adoption. For public entities, this guidance is effective for years beginning after December 15, 2017, including interim periods within those years. Early adoption is not permitted, except for certain provisions. The Company adopted the update in the first quarter of 2018. The adoption of this ASU resulted in the recognition of $377,000 of net after-tax unrealized gains on equity investments as a cumulative-effect adjustment to increase retained earnings and decrease accumulated other comprehensive income. The investment section of the consolidated statements of financial position has been modified from year end to reflect that equity securities are no longer classified as available-for-sale. Changes in the fair value of equity securities are recorded as income (loss) in the consolidated statements of income and comprehensive income and as an adjustment to net income in the consolidated statements of cash flows.
Revenue Recognition
The FASB issued ASU 2014-09, ASU 2015-14, ASU 2016-10, ASU 2016-12, ASU 2016-20 and ASU 2017-05, Revenue from Contracts with Customers (Topic 606). This update is a comprehensive revenue recognition standard that applies to all entities that have contracts with customers. The core principal of the new accounting guidance is that an entity should recognize revenue when it transfers promised goods or services to customers exceptin an amount that reflects the consideration to which the entity expects to be entitled in exchange for those that fall withingoods or services. The guidance also requires additional disclosure about the scopenature, timing and uncertainty of other standards, such as insurance contracts. Updates may be applied retrospectivelyrevenue and cash flows arising from customer contracts, including significant judgments and changes in judgments and assets recognized from costs incurred to each period presentedobtain or retrospectively with the cumulative effect recognized at the date of initial application. The update is now effective for interim and annual reporting periods beginning after December 15, 2017. The Companyfulfill a contract. Atlas adopted the update in the first quarter of 2018 withwhich resulted no impact on the consolidated financial statements. While these updates to Topic 606 are expected to have a significant impact on many companies, Atlas’ revenue is derived from transactions that do not fall within the scope of Topic 606, namely insurance contracts, investment income, and lease income.
Not Yet Adopted
Fair Value Measurement
In August 2018, the FASB issued ASU 2018-13, Fair Value Measurement (Topic 820): Disclosure Framework-Changes to the Disclosure Requirements for Fair Value Measurement. The amendments in this update eliminate, add and modify certain disclosure
requirements for fair value measurements. This guidance is effective for years beginning after December 15, 2019, including interim periods within those years. Early adoption is permitted. The Company plans on adopting the update on the required effective date. Atlas does not currently have any Level 3 fair value measurements, therefore the provisions of this update are not expected to have a material impact on the consolidated financial statements upon adoption. Atlas will continue to monitor the investment portfolio until adoption for any changes.
Leases
In March 2019, December 2018, July 2018 and February 2016, the FASB issued ASU 2019-01 Leases (Topic 842) Codification Improvements, ASU 2018-20 Leases (Topic 842) Narrow-Scope Improvements for Lessors, ASU 2018-11 Leases (Topic 842): Targeted Improvements and ASU 2018-10 Codification Improvements to Topic 842, Leases and ASU 2016-02, Leases (Topic 842), respectively. The provisions of these updates impact the classification criteria, disclosure requirements, and other specific transactions in lease accounting. The update requires either the use of a modified retrospective approach, which requires leases to be measured at the beginning of the earliest period presented, or the transition method, which requires entities to recognize a cumulative-effect adjustment to the opening balance of retained earnings in the period of adoption. For public entities, this guidance is effective for years beginning after December 15, 2018, including interim periods within those years. Early adoption is permitted. The Company plans on adopting the update on the required effective date using the transition method with no change to comparative periods. See ‘Part II, Item 8, Note 8, Commitments and Contingencies’ in the Notes to Consolidated Financial Statements for further discussion of the future lease commitments. The adoption of this update will result in the recognition of both a right-of-use asset and lease liability equal to the present value of the lease payments on the date of adoption, which will be less than 1% of total assets and total liabilities. The adoption of this guidance is not expected to have a material effect on the Company’s consolidated financial statements. There is no expected impact to any of Atlas’ current financial covenants as a result of the increase to reported liabilities.
Premium Amortization on Purchased Callable Debt Securities
In March 2017, the FASB issued ASU 2017-08, Receivables-Nonrefundable Fees and Other Costs (Subtopic 310-20): Premium Amortization on Purchased Callable Debt Securities. This guidance shortens the amortization period to the earliest call date for certain purchased callable debt securities held at a premium that have explicit, noncontingent call features and are callable at a fixed price and preset date. For public entities, this guidance is effective for years beginning after December 15, 2018, including interim periods within those years. Early adoption is permitted. The Company plans on adopting the update on the required effective date. The adoption of this ASU is not expected to have an impact on the Company’s consolidated financial statements because Atlas’ callable debt securities, that are held at a premium, are amortized to the earliest call date, which is consistent with current accounting treatment.
Financial Instruments - Credit Losses
In June 2016, the FASB issued ASU 2016-13, Financial Instruments - Credit Losses (Topic 326). The provisions of this update require an entity to broaden the information that it considers in developing its allowance for credit losses for assets. For public entities, this guidance is effective for years beginning after December 15, 2019, including interim periods within those years. Early adoption is permitted. The Company plans on adopting the update on the required effective date. Atlas does not currently have any investments with credit losses recorded or other significant credit allowance,allowances, therefore the provisions of this update are not expected to have a material impact on the consolidated financial statements upon adoption. The Company plans on adopting the update on the required effective date.Atlas will continue to monitor Global Liberty’s investment portfolio and other financial instruments until adoption for any changes.
All other recently issued pronouncements with effective dates after December 31, 20182019 are not expected to have a material impact on the consolidated financial statements.
3. Goodwill and Intangible Assets
Goodwill and indefinite-lived intangible assets are tested for impairment annually or when a triggering evenevent occurs. During the fourth quarter of 2018, the Company performed an assessment of the recoverability of goodwill related to Anchor Group Holdings, Inc. as of December 31, 2018. Based on the assessment, the Company reduced the carrying value of goodwill to $0, which resulted in a goodwill impairment loss of $2.7 million for 2018. There were no goodwill impairment losses during 20172019. As a result of the liquidation and 2016.
Atlas concluded that there was nosubsequent sale of Gateway Insurance Company, the Company recorded an impairment loss of $740,000 of indefinite-lived intangible asset impairment in 2018, 2017 or 2016.assets during 2019.
|
| | | | | | |
| Changes in the Carrying Amount of Goodwill | |
| ($ in ‘000s) | 2019 | 2018 |
| Balance as of January 1, |
|
|
| Goodwill | $ | 2,726 |
| $ | 2,726 |
|
| Accumulated impairment losses | (2,726 | ) | — |
|
| | — |
| 2,726 |
|
| Additions | — |
| — |
|
| Impairment losses | — |
| (2,726 | ) |
| Balance as of December 31, | | |
| Goodwill | 2,726 |
| 2,726 |
|
| Accumulated impairment losses | (2,726 | ) | (2,726 | ) |
| | $ | — |
| $ | — |
|
| | | |
|
| | | | | | |
| Changes in the Carrying Amount of Goodwill | |
| ($ in ‘000s) | 2018 | 2017 |
| Balance as of January 1, |
|
|
| Goodwill | $ | 2,726 |
| $ | 2,726 |
|
| Accumulated impairment losses | — |
| — |
|
| | 2,726 |
| 2,726 |
|
| Additions | — |
| — |
|
| Impairment losses | (2,726 | ) | — |
|
| Balance as of December 31, | | |
| Goodwill | 2,726 |
| 2,726 |
|
| Accumulated impairment losses | (2,726 | ) | — |
|
| | $ | — |
| $ | 2,726 |
|
| | | |
| | Intangible Assets by Major Asset Class | | ($ in ‘000s) | Economic Useful Life | Gross Carrying Amount | Accumulated Amortization | Net | Economic Useful Life | Gross Carrying Amount | Accumulated Amortization | Net |
| |
| As of December 31, 2019 | | | |
| Trade name and trademark | | 15 years | $ | 1,800 |
| $ | 581 |
| $ | 1,219 |
|
| Customer relationship | | 10 years | 2,700 |
| 1,294 |
| 1,406 |
|
| | | | $ | 4,500 |
| $ | 1,875 |
| $ | 2,625 |
|
| | Economic Useful Life | Gross Carrying Amount | Accumulated Amortization | Net | | |
| As of December 31, 2018 | |
| Trade name and trademark | 15 years | $ | 1,800 |
| $ | 459 |
| $ | 1,341 |
| 15 years | $ | 1,800 |
| $ | 459 |
| $ | 1,341 |
|
| Customer relationship | 10 years | 2,700 |
| 1,026 |
| 1,674 |
| 10 years | 2,700 |
| 1,026 |
| 1,674 |
|
| State insurance licenses | Indefinite | 740 |
| — |
| 740 |
| Indefinite | 740 |
| — |
| 740 |
|
| | | $ | 5,240 |
| $ | 1,485 |
| $ | 3,755 |
| | $ | 5,240 |
| $ | 1,485 |
| $ | 3,755 |
|
| | | | | |
| As of December 31, 2017 | | |
| Trade name and trademark | 15 years | $ | 1,800 |
| $ | 337 |
| $ | 1,463 |
| |
| Customer relationship | 10 years | 2,700 |
| 758 |
| 1,942 |
| |
| State insurance licenses | Indefinite | 740 |
| — |
| 740 |
| |
| | | $ | 5,240 |
| $ | 1,095 |
| $ | 4,145 |
| |
| | | | |
Atlas recognized amortization expense of $390,000 in each of the twelve months ended December 31, 2018, 20172019 and, 2016.2018. Estimated future amortization expense for definite-lived intangible assets is $390,000 for each of the next five years.
4. EarningsLoss From Continuing Operations per Share
| | | Computations of Basic and Diluted Earnings per Common Share | |
| Computations of Basic and Diluted Loss per Common Share from Continuing Operations | | Computations of Basic and Diluted Loss per Common Share from Continuing Operations |
| ($ in ‘000s, except share and per share amounts) | Year ended December 31, | Year ended December 31, |
| | 2018 | 2017 | 2016 | 2019 | 2018 |
| Basic | | |
| (Loss) income from operations before income taxes | $ | (64,201 | ) | $ | (44,153 | ) | $ | 512 |
| |
| Income tax expense (benefit) | 15,811 |
| (5,343 | ) | (2,134 | ) | |
| Net (loss) income | $ | (80,012 | ) | $ | (38,810 | ) | $ | 2,646 |
| |
| Less: Preferred share dividends | — |
| — |
| 281 |
| |
| Net (loss) income attributable to common shareholders | $ | (80,012 | ) | $ | (38,810 | ) | $ | 2,365 |
| |
| Loss from continuing operations before income taxes | | $ | (12,776 | ) | $ | (54,132 | ) |
| Income tax expense | | 223 |
| 14,494 |
|
| Net loss attributable to common shareholders from continuing operations | | $ | (12,999 | ) | $ | (68,626 | ) |
| Basic weighted average common shares outstanding | 11,992,808 |
| 12,064,880 |
| 12,045,519 |
| 11,954,494 |
| 11,992,808 |
|
| (Loss) earnings per common share basic | $ | (6.67 | ) | $ | (3.22 | ) | $ | 0.20 |
| |
| Loss per common share basic from continuing operations | | $ | (1.09 | ) | $ | (5.72 | ) |
| | | |
| Diluted | | |
| Basic weighted average common shares outstanding | 11,992,808 |
| 12,064,880 |
| 12,045,519 |
| 11,954,494 |
| 11,992,808 |
|
| Dilutive potential ordinary shares: | | |
| Dilutive stock options outstanding | — |
| — |
| 177,364 |
| — |
| — |
|
| Diluted weighted average common shares outstanding | 11,992,808 |
| 12,064,880 |
| 12,222,883 |
| 11,954,494 |
| 11,992,808 |
|
| (Loss) earnings per common share diluted | $ | (6.67 | ) | $ | (3.22 | ) | $ | 0.19 |
| |
| Loss per common share diluted from continuing operations | | $ | (1.09 | ) | $ | (5.72 | ) |
Common shares are defined as ordinary voting common shares, restricted voting common shares and participative restricted stock units (“RSUs”). Earnings per common share diluted is computed by dividing net income by the weighted average number of common shares outstanding for each period plus the incremental number of shares added as a result of converting dilutive potential ordinary voting common shares, calculated using the treasury stock method (or, in the case of the convertible preferred shares, using the “if-converted” method).
method. Atlas’ potential dilutive potential ordinary voting common shares consistconsists of outstanding stock options to purchase ordinary voting common shares and for the 2016 computation, preferred shares potentially convertiblewarrants to purchase 2,387,368 ordinary voting common shares at the option of the holder at any date after December 31, 2018 (2,538,560 preferred shares at the rate of 0.1270 ordinary voting common sharesAtlas for each preferred share related to the Gateway acquisition, all of which were redeemed during the third quarter of 2016, are considered to have been redeemed on the last day of the third quarter of 2016) and after March 11, 2020 (4,000,000 preferred shares at the rate of 0.0500 ordinary voting common shares for each preferred share related to the Anchor acquisition, all of which were canceled as of December 31, 2016). See ‘Part II, Item 8, Note 14, Share Capital and Mezzanine Equity,’ in the Notes to the Consolidated Financial Statements for further discussion regarding the redemption and cancellation of the preferred shares.$0.69 per share.
The effects of these convertible instruments are excluded from the computation of earnings per common share diluted in periods in which the effect would be anti-dilutive. Convertible preferred shares are anti-dilutive when the amount of dividends declared or accumulated in the current period per common share obtainable upon conversion exceeds earnings per common share basic. In 20182019 and 2017,2018, all exercisable stock options were deemed to be anti-dilutive. The potentially dilutive impact for all exercisable stock options excluded from the calculation due to anti-dilution is 16,3720 and 71,47516,372 common shares for 2019 and 2018, and 2017, respectively. In 2016, all exercisable stock options were deemed to be dilutive and all of the convertible preferred shares were deemed to be anti-dilutive. The potentially dilutive impact for the convertible preferred stock excluded from the calculation due to anti-dilution is 441,357 common shares for 2016.
5. Investments
Atlas adopted ASU 2016-01 as of January 1, 2018, which requires equity investments, except those accounted for under the equity method, to be measured at fair value and changes in fair value to be recognized in net income. Prior periods have not been restated forIt should be noted that due to the current presentation, per the guidance in the ASU. See ‘Part II, Item 8, Note 2, New Accounting Standards,’ in the Notes to Consolidated Financial Statements for a summarydeconsolidation of the changes.ASI Pool Companies and the discontinued operation classification of Global Liberty, no tables have been disclosed with respect to investment holdings at December 31, 2019. Results of operations through September 30, 2019 of the ASI Pool Companies have been disclosed where applicable.
|
| | | | | | | | | | | | | | |
| Cost or Amortized Cost, Gross Unrealized Gains and Losses, and Fair Value of Investments |
| ($ in ‘000s) | Cost or Amortized Cost | Gross Unrealized Gains | Gross Unrealized Losses | Fair Value |
| December 31, 2018 | | | | |
| Fixed income securities: | | | | |
| U.S. Treasury and other U.S. government obligations | $ | 20,522 |
| $ | 30 |
| $ | (356 | ) | $ | 20,196 |
|
| States, municipalities and political subdivisions | 8,970 |
| 19 |
| (146 | ) | 8,843 |
|
| Corporate | | | | |
| Banking/financial services | 13,482 |
| 9 |
| (367 | ) | 13,124 |
|
| Consumer goods | 10,108 |
| 1 |
| (319 | ) | 9,790 |
|
| Capital goods | 3,711 |
| 36 |
| (200 | ) | 3,547 |
|
| Energy | 7,191 |
| — |
| (379 | ) | 6,812 |
|
| Telecommunications/utilities | 8,647 |
| 1 |
| (325 | ) | 8,323 |
|
| Health care | 832 |
| — |
| (77 | ) | 755 |
|
| Total corporate | 43,971 |
| 47 |
| (1,667 | ) | 42,351 |
|
| Mortgage-backed | | | | |
| Agency | 25,778 |
| 6 |
| (656 | ) | 25,128 |
|
| Commercial | 20,091 |
| 105 |
| (574 | ) | 19,622 |
|
| Total mortgage-backed | 45,869 |
| 111 |
| (1,230 | ) | 44,750 |
|
| Other asset-backed | 13,881 |
| 13 |
| (43 | ) | 13,851 |
|
| Total fixed income securities | $ | 133,213 |
| $ | 220 |
| $ | (3,442 | ) | $ | 129,991 |
|
| | | | | | | |
| December 31, 2017 | | | | |
| Fixed income securities: | | | | |
| U.S. Treasury and other U.S. government obligations | $ | 21,488 |
| $ | — |
| $ | (302 | ) | $ | 21,186 |
|
| States, municipalities and political subdivisions | 13,265 |
| 78 |
| (100 | ) | 13,243 |
|
| Corporate | | | | |
| Banking/financial services | 21,246 |
| 189 |
| (53 | ) | 21,382 |
|
| Consumer goods | 9,674 |
| 70 |
| (65 | ) | 9,679 |
|
| Capital goods | 7,822 |
| 181 |
| (11 | ) | 7,992 |
|
| Energy | 7,460 |
| 81 |
| (26 | ) | 7,515 |
|
| Telecommunications/utilities | 11,179 |
| 109 |
| (73 | ) | 11,215 |
|
| Health care | 1,112 |
| 1 |
| (54 | ) | 1,059 |
|
| Total corporate | 58,493 |
| 631 |
| (282 | ) | 58,842 |
|
| Mortgage-backed | | | | |
| Agency | 30,920 |
| 57 |
| (364 | ) | 30,613 |
|
| Commercial | 22,689 |
| 153 |
| (255 | ) | 22,587 |
|
| Total mortgage-backed | 53,609 |
| 210 |
| (619 | ) | 53,200 |
|
| Other asset-backed | 11,556 |
| 8 |
| (51 | ) | 11,513 |
|
| Total fixed income securities | $ | 158,411 |
| $ | 927 |
| $ | (1,354 | ) | $ | 157,984 |
|
| Equities | 7,969 |
| 503 |
| (26 | ) | 8,446 |
|
| Total | $ | 166,380 |
| $ | 1,430 |
| $ | (1,380 | ) | $ | 166,430 |
|
| | | | | | | |
|
| | | | | | |
| Amortized Cost and Fair Value of Fixed Income Securities by Contractual Maturity |
| ($ in ‘000s) | Amortized Cost | Fair Value |
| As of December 31, 2018 |
| Due in less than one year | $ | 5,573 |
| $ | 5,546 |
|
| Due in one through five years | 29,000 |
| 28,324 |
|
| Due after five through ten years | 33,790 |
| 32,724 |
|
| Due after ten years | 5,100 |
| 4,796 |
|
| Total contractual maturity | 73,463 |
| 71,390 |
|
| Total mortgage and asset-backed | 59,750 |
| 58,601 |
|
| Total | $ | 133,213 |
| $ | 129,991 |
|
| | | |
As certain securities and debentures have the right to call or prepay obligations, the actual settlement dates may differ from contractual maturity. |
| | | | | | | | | | | | | | |
| Cost or Amortized Cost, Gross Unrealized Gains and Losses, and Fair Value of Investments |
| ($ in ‘000s) | Cost or Amortized Cost | Gross Unrealized Gains | Gross Unrealized Losses | Fair Value |
| December 31, 2018 | | | | |
| Fixed income securities: | | | | |
| U.S. Treasury and other U.S. government obligations | $ | 13,070 |
| $ | 30 |
| $ | (212 | ) | $ | 12,888 |
|
| States, municipalities and political subdivisions | 5,893 |
| 19 |
| (79 | ) | 5,833 |
|
| Corporate | | | | |
| Banking/financial services | 10,786 |
| 5 |
| (312 | ) | 10,479 |
|
| Consumer goods | 8,185 |
| — |
| (284 | ) | 7,901 |
|
| Capital goods | 1,994 |
| 36 |
| (74 | ) | 1,956 |
|
| Energy | 6,192 |
| — |
| (260 | ) | 5,932 |
|
| Telecommunications/utilities | 4,727 |
| 1 |
| (162 | ) | 4,566 |
|
| Health care | 832 |
| — |
| (77 | ) | 755 |
|
| Total corporate | 32,716 |
| 42 |
| (1,169 | ) | 31,589 |
|
| Mortgage-backed | | | | |
| Agency | 18,454 |
| 5 |
| (489 | ) | 17,970 |
|
| Commercial | 17,826 |
| 105 |
| (506 | ) | 17,425 |
|
| Total mortgage-backed | 36,280 |
| 110 |
| (995 | ) | 35,395 |
|
| Other asset-backed | 10,896 |
| 16 |
| (27 | ) | 10,885 |
|
| Total fixed income securities | $ | 98,855 |
| $ | 217 |
| $ | (2,482 | ) | $ | 96,590 |
|
| | | | | | | |
Atlas assesses, on a quarterly basis, whether there is evidence that a financial asset or group of financial assets is impaired. An investment is considered impaired when the fair value of the investment is less than its cost or amortized cost. When an investment is impaired, the Company must make a determination as to whether the impairment is other-than-temporary.
The analysis includes some or all of the following procedures as deemed appropriate by management:
identifying all security holdings in unrealized loss positions that have existed for at least six months or other circumstances that management believes may impact the recoverability of the security;
obtaining a valuation analysis from third party investment managers regarding these holdings based on their knowledge, experience and other market based valuation techniques;
reviewing the trading range of certain securities over the preceding calendar period;
assessing whether declines in market value are other-than-temporary for debt security holdings based on credit ratings from third party security rating agencies; and
determining the necessary provision for declines in market value that are considered other-than-temporary based on the analyses performed.
The risks and uncertainties inherent in the assessment methodology utilized to determine declines in market value that are other-than-temporary include, but may not be limited to, the following:
the opinion of professional investment managers could prove to be incorrect;
the past trading patterns of individual securities may not reflect future valuation trends;
the credit ratings assigned by independent credit rating agencies may prove to be incorrect due to unforeseen or unknown facts related to a company’s financial situation; and
the debt service pattern of non-investment grade securities may not reflect future debt service capabilities and may not reflect a company’s unknown underlying financial problems.
Under the ASC, with respect to an investment in an impaired debt security, other-than-temporary impairment (“OTTI”) occurs if (a) there is intent to sell the debt security, (b) it is more likely than not it will be required to sell the debt security before its anticipated recovery, or (c) it is probable that all amounts due will be unable to be collected such that the entire cost basis of the security will not be recovered. If Atlas intends to sell the debt security, or will more likely than not be required to sell the debt security before the anticipated recovery, a loss in the entire amount of the impairment is reflected in net investment gains (losses) on investments in the consolidated statements of (loss) income.operations. If Atlas determines that it is probable it will be unable to collect all amounts and Atlas has no intent to sell the debt security, a credit loss is recognized in net investment gains (losses) on investments in the consolidated statements of (loss) incomeoperations to the extent that the present value of expected cash flows is less than the amortized cost basis; any difference between fair value and the new amortized cost basis (net of the credit loss) is reflected in other comprehensive (loss) income,loss, net of applicable income taxes.
For equity securities, the Company evaluates its ability to retain its investment in the issuer for a period of time sufficient to allow for any anticipated recovery in fair value. Evidence considered to determine anticipated recovery are analysts’ reports on the near-term prospects of the issuer and the financial condition of the issuer or the industry, in addition to the length and extent of the market value decline. If an OTTI is identified, the equity security is adjusted to fair value through a charge to earnings.
There were no other-than-temporary impairments recorded in 2018, 20172019 or 20162018 as a result of the OTTI analysis performed by management.
| | Aging of Unrealized Losses in Fixed Income Securities and Equities | | ($ in ‘000s) | ($ in ‘000s) | Less Than 12 Months | | More Than 12 Months | | Total | ($ in ‘000s) | Less Than 12 Months | | More Than 12 Months | | Total |
| | | Fair Value | Unrealized Losses | | Fair Value | Unrealized Losses | | Fair Value | Unrealized Losses | | Fair Value | Unrealized Losses | | Fair Value | Unrealized Losses | | Fair Value | Unrealized Losses |
| December 31, 2018 | December 31, 2018 | | | | | | December 31, 2018 | | | | | |
| Fixed income securities: | Fixed income securities: | | | | | | Fixed income securities: | | | | | |
| U.S. Treasury and other U.S. government obligations | U.S. Treasury and other U.S. government obligations | $ | 507 |
| $ | — |
| | $ | 15,857 |
| $ | (356 | ) | | $ | 16,364 |
| $ | (356 | ) | U.S. Treasury and other U.S. government obligations | $ | 507 |
| $ | — |
| | $ | 8,549 |
| $ | (212 | ) | | $ | 9,056 |
| $ | (212 | ) |
| States, municipalities and political subdivisions | States, municipalities and political subdivisions | 1,687 |
| (27 | ) | | 4,875 |
| (119 | ) | | 6,562 |
| (146 | ) | States, municipalities and political subdivisions | 1,009 |
| (17 | ) | | 2,993 |
| (62 | ) | | 4,002 |
| (79 | ) |
| Corporate | Corporate | | | | | | Corporate | | | | | |
| Banking/financial services | Banking/financial services | 8,376 |
| (235 | ) | | 3,861 |
| (132 | ) | | 12,237 |
| (367 | ) | Banking/financial services | 6,309 |
| (195 | ) | | 3,466 |
| (117 | ) | | 9,775 |
| (312 | ) |
| Consumer goods | Consumer goods | 5,442 |
| (176 | ) | | 4,132 |
| (143 | ) | | 9,574 |
| (319 | ) | Consumer goods | 4,664 |
| (163 | ) | | 3,087 |
| (121 | ) | | 7,751 |
| (284 | ) |
| Capital goods | Capital goods | 1,727 |
| (135 | ) | | 1,430 |
| (65 | ) | | 3,157 |
| (200 | ) | Capital goods | 707 |
| (28 | ) | | 859 |
| (46 | ) | | 1,566 |
| (74 | ) |
| Energy | Energy | 4,516 |
| (295 | ) | | 2,296 |
| (84 | ) | | 6,812 |
| (379 | ) | Energy | 3,839 |
| (178 | ) | | 2,093 |
| (82 | ) | | 5,932 |
| (260 | ) |
| Telecommunications/utilities | Telecommunications/utilities | 3,806 |
| (99 | ) | | 4,259 |
| (226 | ) | | 8,065 |
| (325 | ) | Telecommunications/utilities | 1,447 |
| (39 | ) | | 2,862 |
| (123 | ) | | 4,309 |
| (162 | ) |
| Health care | Health care | 127 |
| (2 | ) | | 628 |
| (75 | ) | | 755 |
| (77 | ) | Health care | 127 |
| (2 | ) | | 628 |
| (75 | ) | | 755 |
| (77 | ) |
| Total corporate | Total corporate | 23,994 |
| (942 | ) | | 16,606 |
| (725 | ) | | 40,600 |
| (1,667 | ) | Total corporate | 17,093 |
| (605 | ) | | 12,995 |
| (564 | ) | | 30,088 |
| (1,169 | ) |
| Mortgage-backed | Mortgage-backed | | | | | | Mortgage-backed | | | | | |
| Agency | Agency | 5,035 |
| (72 | ) | | 19,210 |
| (584 | ) | | 24,245 |
| (656 | ) | Agency | 2,310 |
| (36 | ) | | 14,964 |
| (453 | ) | | 17,274 |
| (489 | ) |
| Commercial | Commercial | 5,256 |
| (149 | ) | | 11,062 |
| (425 | ) | | 16,318 |
| (574 | ) | Commercial | 4,319 |
| (121 | ) | | 9,082 |
| (385 | ) | | 13,401 |
| (506 | ) |
| Total mortgage-backed | Total mortgage-backed | 10,291 |
| (221 | ) | | 30,272 |
| (1,009 | ) | | 40,563 |
| (1,230 | ) | Total mortgage-backed | 6,629 |
| (157 | ) | | 24,046 |
| (838 | ) | | 30,675 |
| (995 | ) |
| Other asset-backed | Other asset-backed | 9,568 |
| (22 | ) | | 1,748 |
| (21 | ) | | 11,316 |
| (43 | ) | Other asset-backed | 7,381 |
| (12 | ) | | 1,220 |
| (15 | ) | | 8,601 |
| (27 | ) |
| Total fixed income securities | Total fixed income securities | $ | 46,047 |
| $ | (1,212 | ) | | $ | 69,358 |
| $ | (2,230 | ) | | $ | 115,405 |
| $ | (3,442 | ) | Total fixed income securities | $ | 32,619 |
| $ | (791 | ) | | $ | 49,803 |
| $ | (1,691 | ) | | $ | 82,422 |
| $ | (2,482 | ) |
| | | | | | | | | | | | | |
| December 31, 2017 | | | | | | |
| Fixed income securities: | | | | | | |
| U.S. Treasury and other U.S. government obligations | $ | 11,179 |
| $ | (110 | ) | | $ | 10,007 |
| $ | (192 | ) | | $ | 21,186 |
| $ | (302 | ) | |
| States, municipalities and political subdivisions | 5,355 |
| (36 | ) | | 2,818 |
| (64 | ) | | 8,173 |
| (100 | ) | |
| Corporate | | | | | | |
| Banking/financial services | 6,021 |
| (26 | ) | | 1,931 |
| (27 | ) | | 7,952 |
| (53 | ) | |
| Consumer goods | 5,835 |
| (47 | ) | | 710 |
| (18 | ) | | 6,545 |
| (65 | ) | |
| Capital goods | 2,611 |
| (10 | ) | | 101 |
| (1 | ) | | 2,712 |
| (11 | ) | |
| Energy | 3,368 |
| (26 | ) | | — |
| — |
| | 3,368 |
| (26 | ) | |
| Telecommunications/utilities | 4,488 |
| (23 | ) | | 938 |
| (50 | ) | | 5,426 |
| (73 | ) | |
| Health care | 607 |
| (7 | ) | | 322 |
| (47 | ) | | 929 |
| (54 | ) | |
| Total corporate | 22,930 |
| (139 | ) | | 4,002 |
| (143 | ) | | 26,932 |
| (282 | ) | |
| Mortgage-backed | | | | | | |
| Agency | 13,203 |
| (136 | ) | | 9,786 |
| (228 | ) | | 22,989 |
| (364 | ) | |
| Commercial | 10,360 |
| (53 | ) | | 6,553 |
| (202 | ) | | 16,913 |
| (255 | ) | |
| Total mortgage-backed | 23,563 |
| (189 | ) | | 16,339 |
| (430 | ) | | 39,902 |
| (619 | ) | |
| Other asset-backed | 9,817 |
| (44 | ) | | 1,087 |
| (7 | ) | | 10,904 |
| (51 | ) | |
| Total fixed income securities | $ | 72,844 |
| $ | (518 | ) | | $ | 34,253 |
| $ | (836 | ) | | $ | 107,097 |
| $ | (1,354 | ) | |
| Equities | 1,007 |
| (26 | ) | | — |
| — |
| | 1,007 |
| (26 | ) | |
| Total | $ | 73,851 |
| $ | (544 | ) | | $ | 34,253 |
| $ | (836 | ) | | $ | 108,104 |
| $ | (1,380 | ) | |
| | | | | | | | |
As of December 31, 2018, we held 391 individual fixed income securities that were in an unrealized loss position, of which 246 individual fixed income securities were in a continuous loss position for longer than 12 months. As of December 31, 2017, we held 346270 and 20 individual fixed income and equity securities, respectively, that were in an unrealized loss position, of which 103164 individual fixed income securities were in a continuous loss position for longer than 12 months. We
did not recognize the unrealized losses in earnings on these fixed income securities in 2018, or 2017, because we neither intend to sell the securities nor do we believe that it is more likely than not that we will be required to sell these securities before recovery of their amortized costs.
| | Components of Net Investment Income | | ($ in ‘000s) | ($ in ‘000s) | Year ended December 31, | ($ in ‘000s) | Year ended December 31, |
| | | 2018 | 2017 | 2016 | | 2019 | 2018 |
| Total investment income | Total investment income | | Total investment income | |
| Interest income | Interest income | $ | 4,115 |
| $ | 3,834 |
| $ | 3,747 |
| Interest income | $ | 1,877 |
| $ | 3,052 |
|
| (Loss) income from other investments | (470 | ) | 1,911 |
| 1,942 |
| |
| Income from other investments | | Income from other investments | 793 |
| (543 | ) |
| Investment expenses | Investment expenses | (998 | ) | (848 | ) | (865 | ) | Investment expenses | (768 | ) | (716 | ) |
| Net investment income | Net investment income | $ | 2,647 |
| $ | 4,897 |
| $ | 4,824 |
| Net investment income | $ | 1,902 |
| $ | 1,793 |
|
| | | | | |
| | Aggregate Proceeds and Gross Realized Investment Gains and Losses | | ($ in ‘000s) | Year ended December 31, | Year ended December 31, |
| | 2018 | 2017 | 2016 | 2019 | 2018 |
Fixed income securities1: | | |
| Fixed income securities: | | |
| Proceeds from sales and calls | $ | 49,247 |
| $ | 24,274 |
| $ | 59,161 |
| $ | 42,406 |
| $ | 42,037 |
|
| Gross realized investment gains | 343 |
| 300 |
| 1,296 |
| 450 |
| 330 |
|
| Gross realized investment losses | (652 | ) | (55 | ) | (131 | ) | (205 | ) | (520 | ) |
| Equities: | | |
| Proceeds from sales | 5,458 |
| 6,161 |
| 662 |
| 5,997 |
| 5,458 |
|
| Gross realized investment gains | 814 |
| 635 |
| 65 |
| 443 |
| 815 |
|
| Gross realized investment losses | (25 | ) | (2 | ) | — |
| (96 | ) | (25 | ) |
| Other investments: | | |
| Proceeds from sales | 93 |
| (6 | ) | — |
| 3,997 |
| 93 |
|
| Gross realized investment gains | 93 |
| — |
| — |
| 250 |
| 93 |
|
| Gross realized investment losses | — |
| (6 | ) | — |
| (21 | ) | — |
|
| Total: | | |
| Proceeds from sales and calls | $ | 54,798 |
| $ | 30,429 |
| $ | 59,823 |
| $ | 52,400 |
| $ | 47,588 |
|
| Gross realized investment gains | 1,250 |
| 935 |
| 1,361 |
| 1,143 |
| 1,238 |
|
| Gross realized investment losses | (677 | ) | (63 | ) | (131 | ) | (322 | ) | (545 | ) |
| |
1
| The proceeds from sales and calls, gross realized investment gains and gross realized investment losses on fixed income securities in 2016 were restated to include both voluntary and involuntary calls. |
| | Components of Net Realized Gains (Losses) | | ($ in ‘000s) | Year ended December 31, | Year ended December 31, |
| | 2018 | 2017 | 2016 | 2019 | 2018 |
| Fixed income securities | $ | (309 | ) | $ | 245 |
| $ | 1,165 |
| $ | 245 |
| $ | (190 | ) |
| Equities | 789 |
| 633 |
| 65 |
| 347 |
| 790 |
|
| Other investments | 93 |
| (6 | ) | — |
| 229 |
| 93 |
|
| Net realized gains | $ | 573 |
| $ | 872 |
| $ | 1,230 |
| $ | 821 |
| $ | 693 |
|
| | | |
Other Investments
Atlas’ other investments are comprised of collateral loans and various limited partnerships that invest in income-producing real estate, equities or insurance linked securities. Atlas accounts for these limited partnership investments using the equity method of accounting. The carrying values of the equity method limited partnerships were $24.0 million and $25.3was $22.7 million as of December 31, 2018 and 2017, respectively.2018. The carrying value of these investments is Atlas’ share of the net book value for each limited
partnership. The carrying values of the collateral loans were $1.0 million and $6.2 million as of December 31, 2018 and 2017, respectively.2018.
| | Equity Method Investments by Type | | ($ in ‘000s) | As of December 31, | As of December 31, |
| | 2018 | 2017 | 2019 | 2018 |
| | Unfunded Commitments | Carrying Value | Unfunded Commitments | Carrying Value |
| Real estate | $ | 2,887 |
| $ | 11,085 |
| $ | 10,660 |
| $ | — |
| $ | — |
| $ | 9,764 |
|
| Insurance linked securities | — |
| 6,694 |
| 9,073 |
| — |
| — |
| 6,694 |
|
| Activist hedge funds | — |
| 3,911 |
| 4,367 |
| — |
| — |
| 3,911 |
|
| Venture capital | 3,070 |
| 2,015 |
| 853 |
| — |
| — |
| 2,015 |
|
| Other joint venture | — |
| 325 |
| 325 |
| — |
| — |
| 325 |
|
| Total equity method investments | $ | 5,957 |
| $ | 24,030 |
| $ | 25,278 |
| $ | — |
| $ | — |
| $ | 22,709 |
|
| | | |
Due to the timing of financial information of the Company’s equity method investments, certain investments are recorded on a financial reporting lag of one to three months.
The Company recognizes an impairment loss for equity method limited partnerships when evidence demonstrates that the loss is other-than-temporary. To determine if an other-than-temporary impairment has occurred, the Company evaluates whether or not the investee could sustain a level of earnings that would justify the carrying amount of the investment. Collateral loans are considered impaired when it is probable that the Company will not collect the contractual principal and interest. Valuation allowances are established for impaired loans equal to the fair value of the collateral less costs to sell or the present value of the loan’s expected future repayment cash flows discounted at the loan’s original effective interest rate. Valuation allowances are adjusted for subsequent changes in the fair value of the collateral less costs to sell or the present value of the loan’s expected future repayment cash flows. As of December 31, 20182019 and 2017,2018, the Company had no valuation allowances established for impaired equity method limited partnerships and loans.
Short-Term Investments
Atlas’ short-term investments are comprised of fixed income securities. As of December 31, 2018, short-term investmentssecurities which totaled $4.7 million. Atlas had no short-term investments$4.5 million as of December 31, 2017.2018.
Collateral Pledged
As of December 31, 2018, and 2017, bonds, cash and cash equivalents with a fair value of $14.9$13.7 million, and $15.0 million, respectively, were on deposit with state and provincial regulatory authorities. Also, from time to time, the Company pledges securities to and deposits cash with third parties to collateralize liabilities incurred under its policies of reinsurance assumed and other commitments made by the Company. As of December 31, 2018, and 2017, the amounts of such pledged securities were $31.3 million and $12.2 million, respectively.million. Collateral pledging transactions are conducted under terms that are common and customary to standard collateral pledging and are subject to the Company’s standard risk management controls. These assets and investment income related thereto remain the property of the Company while pledged. Neither the state and/or provincial regulatory authorities nor any other third party has the right to re-pledge or sell said securities held on deposit.
6. Fair Value of Financial Instruments
U.S. GAAP requires certain assets and liabilities to be reported at fair value in the financial statements and provides a framework for establishing that fair value. Level 1 inputs are given the highest priority in the hierarchy while Level 3 inputs are given the lowest priority. Assets and liabilities carried at fair value are classified in one of the following three categories based on the nature of the inputs to the valuation technique used:
|
| |
| Level 1 | Observable inputs that reflect unadjusted quoted prices for identical assets or liabilities in active markets as of the reporting date. Active markets are those in which transactions for the asset or liability occur in sufficient frequency and volume to provide pricing information on an ongoing basis. |
| Level 2 | Observable market-based inputs or unobservable inputs that are corroborated by market data. |
| Level 3 | Unobservable inputs that are not corroborated by market data. These inputs reflect management’s best estimate of fair value using its own assumptions about the assumptions a market participant would use in pricing the asset or liability. |
Assets and liabilities are classified in their entirety based on the lowest level of input that is significant to the fair value measurement. Atlas’ assessment of the significance of a particular input to the fair value measurement requires judgment, and may affect the placement of the asset or liability within the fair value hierarchy levels.
The following is a summary of significant valuation techniques for assets measured at fair value on a recurring basis:
|
| | |
| Level 1 | U.S. treasury and other U.S. government obligations | Comprised of certain U.S. Treasury fixed income securities. Valuation is based on unadjusted quoted prices for identical assets in active markets that Atlas can access. |
| Equities | Comprised of publicly-traded common stocks. Valuation is based on unadjusted quoted prices for identical assets in active markets that Atlas can access. |
| Level 2 | States, municipalities and political subdivisions | Comprised of U.S. States, Territories and Possessions, U.S. Political Subdivisions of States, Territories and Possessions, U.S. Special Revenue and Special Assessment Obligations. The primary inputs to the valuation include quoted prices for identical assets in inactive markets or similar assets in active or inactive markets, contractual cash flows, benchmark yields and credit spreads. |
| Corporate bonds | Comprised of investment-grade fixed income securities. The primary inputs to the valuation include quoted prices for identical assets in inactive markets or similar assets in active or inactive markets, contractual cash flows, benchmark yields and credit spreads. |
| Mortgage-backed and other asset-backed | Comprised of securities that are collateralized by mortgage obligations and other assets. The primary inputs to the valuation include quoted prices for identical assets in inactive markets or similar assets in active or inactive markets, contractual cash flows, benchmark yields, collateral performance and credit spreads. |
It should be noted that due to the deconsolidation of the ASI Pool Companies and the discontinued operation classification of Global Liberty, no tables have been disclosed with respect to investment holdings at December 31, 2019.
| | Investments at Fair Value | | ($ in ‘000s) | Level 1 | Level 2 | Level 3 | Total | Level 1 | Level 2 | Level 3 | Total |
| As of December 31, 2018 | | |
| Fixed income securities: | | |
| U.S. Treasury and other U.S. government obligations | $ | 20,196 |
| $ | — |
| $ | — |
| $ | 20,196 |
| $ | 12,888 |
| $ | — |
| $ | — |
| $ | 12,888 |
|
| States, municipalities and political subdivisions | — |
| 8,843 |
| — |
| 8,843 |
| — |
| 5,833 |
| — |
| 5,833 |
|
| Corporate | | |
| Banking/financial services | — |
| 13,124 |
| — |
| 13,124 |
| — |
| 10,479 |
| — |
| 10,479 |
|
| Consumer goods | — |
| 9,790 |
| — |
| 9,790 |
| — |
| 7,901 |
| — |
| 7,901 |
|
| Capital goods | — |
| 3,547 |
| — |
| 3,547 |
| — |
| 1,956 |
| — |
| 1,956 |
|
| Energy | — |
| 6,812 |
| — |
| 6,812 |
| — |
| 5,932 |
| — |
| 5,932 |
|
| Telecommunications/utilities | — |
| 8,323 |
| — |
| 8,323 |
| — |
| 4,566 |
| — |
| 4,566 |
|
| Health care | — |
| 755 |
| — |
| 755 |
| — |
| 755 |
| — |
| 755 |
|
| Total corporate | — |
| 42,351 |
| — |
| 42,351 |
| — |
| 31,589 |
| — |
| 31,589 |
|
| Mortgage-backed | | |
| Agency | — |
| 25,128 |
| — |
| 25,128 |
| — |
| 17,970 |
| — |
| 17,970 |
|
| Commercial | — |
| 19,622 |
| — |
| 19,622 |
| — |
| 17,425 |
| — |
| 17,425 |
|
| Total mortgage-backed | — |
| 44,750 |
| — |
| 44,750 |
| — |
| 35,395 |
| — |
| 35,395 |
|
| Other asset-backed | — |
| 13,851 |
| — |
| 13,851 |
| — |
| 10,885 |
| — |
| 10,885 |
|
| Total fixed income securities | $ | 20,196 |
| $ | 109,795 |
| $ | — |
| $ | 129,991 |
| $ | 12,888 |
| $ | 83,702 |
| $ | — |
| $ | 96,590 |
|
| Equities | 5,929 |
| — |
| — |
| 5,929 |
| 5,929 |
| — |
| — |
| 5,929 |
|
| Total | $ | 26,125 |
| $ | 109,795 |
| $ | — |
| $ | 135,920 |
| $ | 18,817 |
| $ | 83,702 |
| $ | — |
| $ | 102,519 |
|
| | | |
| As of December 31, 2017 | | |
| Fixed income securities: | | |
| U.S. Treasury and other U.S. government obligations | $ | 21,186 |
| $ | — |
| $ | — |
| $ | 21,186 |
| |
| States, municipalities and political subdivisions | — |
| 13,243 |
| — |
| 13,243 |
| |
| Corporate | | |
| Banking/financial services | — |
| 21,382 |
| — |
| 21,382 |
| |
| Consumer goods | — |
| 9,679 |
| — |
| 9,679 |
| |
| Capital goods | — |
| 7,992 |
| — |
| 7,992 |
| |
| Energy | — |
| 7,515 |
| — |
| 7,515 |
| |
| Telecommunications/utilities | — |
| 11,215 |
| — |
| 11,215 |
| |
| Health care | — |
| 1,059 |
| — |
| 1,059 |
| |
| Total corporate | — |
| 58,842 |
| — |
| 58,842 |
| |
| Mortgage-backed | | |
| Agency | — |
| 30,613 |
| — |
| 30,613 |
| |
| Commercial | — |
| 22,587 |
| — |
| 22,587 |
| |
| Total mortgage-backed | — |
| 53,200 |
| — |
| 53,200 |
| |
| Other asset-backed | — |
| 11,513 |
| — |
| 11,513 |
| |
| Total fixed income securities | $ | 21,186 |
| $ | 136,798 |
| $ | — |
| $ | 157,984 |
| |
| Equities | 8,446 |
| — |
| — |
| 8,446 |
| |
| Total | $ | 29,632 |
| $ | 136,798 |
| $ | — |
| $ | 166,430 |
| |
| | | |
Atlas primarily uses the services of external securities pricing vendors to obtain these values. Atlas then reviews these valuations to ensure that the values are accurately recorded and that the data inputs and valuation techniques utilized are appropriate, consistently applied, and that the assumptions are reasonable and consistent with the objective of determining fair value.
Though Atlas believes the valuation methods used in determining fair value are appropriate, different methodologies or assumptions could result in a different fair value as of December 31, 2018.value. Management does not believe that reasonable changes to the inputs to its valuation methodology would result in a significantly higher or lower fair value measurement.
The Company had no fair value investments classified as Level 3 as of December 31, 2018 and 2017.2018. There were no transfers in or out of Level 2 or Level 3 during 2018 and 2017.2018.
7. Income Taxes
On December 22, 2017, the Tax Act was signed into law. Among other things, beginning with the 2018 tax year, the Tax Act reduced the Company’s corporate federal tax rate from a marginal rate of 35% to a flat 21%, eliminated the corporate Alternative Minimum Tax (“AMT”), changed reserving and other aspects of the computation of taxable income for insurance companies, and modified the net operating loss carryback and carryforward provisions for all entities in the group except for those subject to tax as P&C companies. The modified net operating loss provisions no longer allow a carryback to prior years to recover past taxes, but now allow an indefinite carryforward period subject to a yearly utilization limit. As discussed above, any net operating losses with respect to the insurance entities taxed as P&C companies retain the current net operating loss carryback and carryover provisions, which are two years carryback and 20 years carryforward. As of December 31, 2016, the Company measured its deferred tax items at the enacted rate in effect of 35%. Due to the Tax Act’s enactment, the Company’s deferred tax assets and liabilities as of December 31, 2017 have been re-measured at the new enacted tax rate of 21%. In 2017, the Company recognized income tax expense of $10.5 million related to reduction in the net deferred tax asset as a result of this re-measurement.Atlas’ effective tax rate was (24.6)%, 12.1% and (416.8)% in 2018, 2017 and 2016, respectively. |
| | | | | | | | | | |
| Reconciliation of U.S. Statutory Marginal Income Tax Rate to the Effective Tax Rate - Continuing Operations |
| ($ in ‘000s) | Year ended December 31, |
| | 2019 | 2018 |
| | Amount | % | Amount | % |
| Provision for taxes at U.S. statutory marginal income tax rate | $ | (2,683 | ) | 21.0 | % | $ | (11,368 | ) | 21.0 | % |
| Provision for deferred tax assets deemed unrealizable (valuation allowance) | 2,779 |
| (21.8 | ) | 25,397 |
| (46.9 | ) |
| Nondeductible expenses | 28 |
| (0.2 | ) | 59 |
| (0.1 | ) |
| Tax-exempt income | (3 | ) | — |
| (9 | ) | — |
|
| State tax (net of federal benefit) | 71 |
| (0.6 | ) | (2 | ) | — |
|
| Stock compensation | 31 |
| (0.2 | ) | (42 | ) | 0.1 |
|
| Nondeductible goodwill | — |
| — |
| 572 |
| (1.1 | ) |
| Nondeductible acquisition accounting adjustment | — |
| — |
| (109 | ) | 0.2 |
|
| Other | — |
| — |
| (4 | ) | — |
|
| Provision for income taxes for continuing operations | $ | 223 |
| (1.8 | )% | $ | 14,494 |
| (26.8 | )% |
| | | | | |
|
| | | | | | | | | | | | | | | |
| Reconciliation of U.S. Statutory Marginal Income Tax Rate to the Effective Tax Rate |
| ($ in ‘000s) | Year ended December 31, |
| | 2018 | 2017 | 2016 |
| | Amount | % | Amount | % | Amount | % |
| Provision for taxes at U.S. statutory marginal income tax rate | $ | (13,482 | ) | 21.0 | % | $ | (15,453 | ) | 35.0 | % | $ | 179 |
| 35.0 | % |
| Provision for deferred tax assets deemed unrealizable (valuation allowance) | 28,830 |
| (44.9 | ) | — |
| — |
| — |
| — |
|
| Nondeductible expenses | 62 |
| (0.1 | ) | 51 |
| (0.1 | ) | 24 |
| 4.7 |
|
| Tax-exempt income | (12 | ) | — |
| (23 | ) | 0.1 |
| (39 | ) | (7.6 | ) |
| State tax (net of federal benefit) | (2 | ) | — |
| (2 | ) | — |
| 28 |
| 5.5 |
|
| Stock compensation | (42 | ) | 0.1 |
| (458 | ) | 1.0 |
| — |
| — |
|
| Nondeductible goodwill | 572 |
| (0.9 | ) | — |
| — |
| — |
| — |
|
| Nondeductible acquisition accounting adjustment | (109 | ) | 0.2 |
| — |
| — |
| (2,204 | ) | (430.5 | ) |
| Change in statutory tax rate | — |
| — |
| 10,542 |
| (23.9 | ) | — |
| — |
|
| Other | (6 | ) | — |
| — |
| — |
| (122 | ) | (23.9 | ) |
| Provision for income taxes for continuing operations | $ | 15,811 |
| (24.6 | )% | $ | (5,343 | ) | 12.1 | % | $ | (2,134 | ) | (416.8 | )% |
| | | | | | | |
|
| | | | | | | | | | |
| Reconciliation of U.S. Statutory Marginal Income Tax Rate to the Effective Tax Rate - Discontinued Operations |
| ($ in ‘000s) | Year ended December 31, |
| | 2019 | 2018 |
| | Amount | % | Amount | % |
| Provision for taxes at U.S. statutory marginal income tax rate | $ | (1,560 | ) | 21.0 | % | $ | (2,114 | ) | 21.0 | % |
| Provision for deferred tax assets deemed unrealizable (valuation allowance) | 1,559 |
| (21.0 | ) | 3,432 |
| (34.1 | ) |
| Nondeductible expenses | 3 |
| — |
| 3 |
| — |
|
| Tax-exempt income | (2 | ) | — |
| (4 | ) | — |
|
| Provision for income taxes for discontinued operations | $ | — |
| — | % | $ | 1,317 |
| (13.1 | )% |
| | | | | |
|
| | | | | | | | | |
| Components of Income Tax Expense (Benefit) |
| ($ in ‘000s) | Year ended December 31, |
| | 2018 | 2017 | 2016 |
| Current tax benefit | $ | (1,174 | ) | $ | (6,719 | ) | $ | (2,586 | ) |
| Deferred tax (benefit) expense | (11,845 | ) | 1,376 |
| 452 |
|
| Change in deferred tax valuation allowance | 28,830 |
| — |
| — |
|
| Total | $ | 15,811 |
| $ | (5,343 | ) | $ | (2,134 | ) |
| | | | |
|
| | | | | | |
| Components of Income Tax Expense - Continuing Operations |
| ($ in ‘000s) | Year ended December 31, |
| | 2019 | 2018 |
| Current tax expense (benefit) | $ | 223 |
| $ | (1,091 | ) |
| Deferred tax benefit | (2,779 | ) | (9,830 | ) |
| Increase in deferred tax valuation allowance | 2,779 |
| 25,415 |
|
| Total | $ | 223 |
| $ | 14,494 |
|
| | | |
Upon the transaction forming Atlas on December 31, 2010, a yearly limitation as required by U.S. Internal Revenue Code of 1986 (as amended, “IRC”) Section 382 that applies to changes in ownership on the future utilization of Atlas’ net operating loss carryforwards was calculated. The Insurance Subsidiaries’ prior parent retained those tax assets previously attributed to the Insurance Subsidiaries, which could not be utilized by Atlas as a result of this limitation. As a result, Atlas’ ability to recognize future tax benefits associated with a portion of its deferred tax assets generated during prior years has been permanently limited to the amount determined under IRC Section 382. The result is a maximum expected net deferred tax asset that Atlas has available after the merger, which is believed more-likely-than-not to be utilized in the future, after consideration of the valuation allowance. |
| | | | | | |
| Components of Income Tax Expense - Discontinued Operations |
| ($ in ‘000s) | Year ended December 31, |
| | 2019 | 2018 |
| Current tax expense (benefit) | $ | — |
| $ | (83 | ) |
| Deferred tax benefit | (1,559 | ) | (2,015 | ) |
| Increase in deferred tax valuation allowance | 1,559 |
| 3,415 |
|
| Total | $ | — |
| $ | 1,317 |
|
| | | |
On July 22,During 2013 and 2019, due to shareholder activity, a “triggering event”events” as determined under IRC Section 382 occurred. As a result, under IRC Section 382, the use of the Company’s net operating loss and other carryforwards generated prior to the “triggering event”events” will be limitedsubject to a yearly limitation as a result of this “ownership change” for tax purposes, which is defined as a cumulative change of more than 50% during any three-year period by shareholders owning 5% or greater portions of the Company’s shares. Due to thisthe mechanics of the Section 382 calculation when there are multiple triggering event,events the Company’s losses will generally be limited based on the thresholds of the 2019 triggering event. The Company estimateshas established a valuation allowance against the NOLs that it will retain total tax effected federal net operating loss carryforwards (“NOLs”)expire unused as a result of approximately $25.3 million as of December 31, 2018.the yearly limitation.
| | Components of Deferred Income Tax Assets and Liabilities | | ($ in ‘000s) | December 31, | December 31, |
| | 2018 | 2017 | 2019 | 2018 |
| Gross deferred tax assets: | | |
| Losses carried forward | $ | 25,326 |
| $ | 13,313 |
| $ | 10,264 |
| $ | 25,326 |
|
| Claims liabilities and unearned premium reserves | 5,949 |
| 6,171 |
| 554 |
| 5,949 |
|
| Investment in affiliates | | 24,450 |
| — |
|
| Bad debts | 1,009 |
| — |
| 168 |
| 1,009 |
|
| Tax credits | — |
| 1,172 |
| |
| Commissions | — |
| 623 |
| |
| Stock compensation | 760 |
| 602 |
| 873 |
| 760 |
|
| Other | 418 |
| 1,094 |
| 81 |
| 418 |
|
| Valuation allowance | (29,416 | ) | — |
| (32,522 | ) | (29,416 | ) |
| Total gross deferred tax assets | 4,046 |
| 22,975 |
| 3,868 |
| 4,046 |
|
| | | |
| Gross deferred tax liabilities: | | |
| Deferred policy acquisition costs | 1,535 |
| 3,107 |
| 112 |
| 1,535 |
|
| Investments | 189 |
| 213 |
| 116 |
| 189 |
|
| Fixed assets | 1,371 |
| 847 |
| 2,099 |
| 1,371 |
|
| Intangible assets | 633 |
| 715 |
| 551 |
| 633 |
|
| Other | 318 |
| 1,108 |
| 990 |
| 318 |
|
| Total gross deferred tax liabilities | 4,046 |
| 5,990 |
| 3,868 |
| 4,046 |
|
| Net deferred tax assets | $ | — |
| $ | 16,985 |
| $ | — |
| $ | — |
|
| | | |
|
| | | | |
| Net Operating Loss Carryforward as of December 31, 2018 by Expiry Date |
| ($ in ‘000s) | | |
| Year of Occurrence | Year of Expiration | Amount |
| 2001 | 2021 | $ | 5,007 |
|
| 2002 | 2022 | 4,317 |
|
| 2006 | 2026 | 7,825 |
|
| 2007 | 2027 | 5,131 |
|
| 2008 | 2028 | 1,949 |
|
| 2009 | 2029 | 1,949 |
|
| 2010 | 2030 | 1,949 |
|
| 2011 | 2031 | 4,166 |
|
| 2012 | 2032 | 9,236 |
|
| 2015 | 2035 | 1 |
|
| 2017 | 2037 | 27,313 |
|
| 2018 | 2038 | 47,653 |
|
| 2018 | Indefinite | 4,106 |
|
| Total | | $ | 120,602 |
|
| | | |
NOLs and other carryforwards generated in 2017 and 2018 are not limited by IRC Section 382. |
| | | | |
| Net Operating Loss Carryforward as of December 31, 2019 by Expiry Date |
| ($ in ‘000s) | | |
| Year of Occurrence | Year of Expiration | Amount |
| 2011 | 2031 | $ | 1 |
|
| 2012 | 2032 | 70 |
|
| 2015 | 2035 | 1 |
|
| 2017 | 2037 | 13,649 |
|
| 2018 | 2038 | 10,439 |
|
| 2018 | Indefinite | 8,566 |
|
| 2019 | 2039 | 11,747 |
|
| 2019 | Indefinite | 4,404 |
|
| Total | | $ | 48,877 |
|
| | | |
Deferred tax assets are recognized only to the extent that it is probable that future taxable income will be available against which they can be utilized. When considering the extent of the valuation allowance on Atlas’ DTA,deferred tax assets, weight is given by management to both positive and negative evidence. U.S. GAAP states that a cumulative loss in recent years is a significant piece of negative
evidence that is difficult to overcome in determining that a valuation allowance is not needed against DTAs.deferred tax assets. Based on Atlas’ cumulative loss in recent years and certain deferred tax assets subject to a yearly limitation under Section 382 which will likely result in expiration before utilization, Atlas has established a valuation allowance of $32.5 million and $29.4 million for its gross future deferred tax assets as of December 31, 2018. The Company had no valuation allowance as of December 31, 2017.2019 and 2018, respectively.
Atlas accounts for uncertain tax positions in accordance with the income taxes accounting guidance. Atlas has analyzed filing positions in the federal and state jurisdictions where it is required to file tax returns, as well as the open tax years in these jurisdictions. Atlas believes that its federal and state income tax filing positions and deductions will be sustained on audit and does not anticipate any adjustments that will result in a material change to its financial position. Therefore, no reserves for uncertain federal and state income tax positions have been recorded. Atlas would recognize interest and penalties related to unrecognized tax benefits as a component of the provision for federal income taxes. Atlas did not incur any federal income tax related interest income, interest expense or penalties in 2018, 20172019 or 2016.2018. Tax years 2015 and years thereafter are subject to examination by the Internal Revenue Service (“IRS”).
8. Commitments and Contingencies
On May 22, 2012, Atlas closed the sale and leaseback of its former headquarters building to 150 Northwest Point, LLC, a Delaware limited liability company. Atlas recognized a gain on the sale of this property of $213,000, which was deferred and recognized over the initial five year lease term, which ended in May 2017. The deferred gain was completely recognized at the end of the second quarter in 2017. There was no offset to rent expense recognized in 2018. Atlas recognized $17,000 and $43,000 as an offset to rent expense in 2017 and 2016, respectively. There was no rental expense recognized on the former headquarters building in 2018. Total rental expense recognized on the former headquarters building was $740,000 and $743,000 in 2017 and 2016, respectively.
|
| | | | | | | | | | | | | | | | | | | | | |
Future Minimum Rentals1 |
| ($ in ‘000s) | | | | | | | |
| Year | 2019 | 2020 | 2021 | 2022 | 2023 | 2024 & Beyond | Total |
| Amount | $ | 1,137 |
| $ | 1,088 |
| $ | 954 |
| $ | 174 |
| $ | 16 |
| $ | — |
| $ | 3,369 |
|
| |
1
| Related principally to office space, required under operating leases, having initial or remaining non-cancelable lease terms in excess of one year. |
The Company has entered into subscription agreements to allow for participation by the Company in limited liability investments, which invest in income-producing real estate, equities and insurance linked securities. As of December 31, 2018, the unfunded commitments are $6.0 million.
In the ordinary course of its business, Atlas is involved in legal proceedings, including lawsuits, regulatory examinations and inquiries.
Atlas is exposed to credit risk on balances receivable from policyholders, agentsinsureds and reinsurers.agents. Credit exposure to any one individual policyholderinsured is not material. The Company’s policies however,placed with risk taking partners are distributed by agents who may manage cash collection on its behalf pursuant to the terms of their agency agreement. Atlas has procedures to monitor and minimize its exposure to delinquent agent balances, including, but not limited to, reviewing account current statements, processing policy cancellations for non-payment and other collection efforts deemed appropriate. Atlas also has procedures to evaluate the financial condition of its reinsurers and monitors concentrations of credit risk arising from similar geographic regions, activities or economic characteristics of the reinsurers to minimize its exposure to significant losses from reinsurers’ insolvency.
Virtually all states require insurers licensed to do business therein to bear a portion of contingent and incurred claims handling expenses and the unfunded amount of “covered” claims and unearned premium obligations of impaired or insolvent insurance companies, either up to the policy’s limit, the applicable guaranty fund covered claims obligation cap, or 100% of statutorily defined workers’ compensation benefits, subject to applicable deductibles. These obligations are funded by assessments, made on a retrospective, prospective or pre-funded basis, which are levied by guaranty associations within the state, up to prescribed limits (typically 2% of “net direct premiums written”), on all member insurers in the state on the basis of the proportionate share of the premiums written by member insurers in certain covered lines of business in which the impaired, insolvent or failed insurer was engaged.
In addition, as a condition to the ability to conduct business in certain states (and within the jurisdiction of some local governments), insurance companies are subject to or required to participate in various premium or claims based insurance-related assessments, including non-voluntary assigned risk pools, underwriting associations, workers’ compensation second-injury funds, reinsurance funds and other state insurance facilities. Atlas’ proportionate share of these various premium or claims based insurance-related assessments, including non-voluntary assigned risk pools, underwriting associations, workers’ compensation second-injury funds, reinsurance funds and other state insurance facilities, is not expected to be material.
9. Property and Equipment
| | Property and Equipment Held1 | Property and Equipment Held1 | Property and Equipment Held1 |
| ($ in ‘000s) | As of December 31, | As of December 31, |
| | 2018 | 2017 | 2019 | 2018 |
| Buildings | $ | 7,425 |
| $ | 7,425 |
| $ | 7,425 |
| $ | 7,425 |
|
| Land | 1,840 |
| 1,840 |
| 1,840 |
| 1,840 |
|
| Building improvements | 9,006 |
| 7,900 |
| 9,023 |
| 9,006 |
|
| Leasehold improvements | 190 |
| 140 |
| 193 |
| 190 |
|
| Internal use software | 17,575 |
| 9,567 |
| 12,610 |
| 16,078 |
|
| Computer equipment | 1,821 |
| 1,465 |
| 1,925 |
| 1,821 |
|
| Furniture and other office equipment | 2,897 |
| 2,582 |
| 1,150 |
| 2,897 |
|
| Total | $ | 40,754 |
| $ | 30,919 |
| $ | 34,166 |
| $ | 39,257 |
|
| Accumulated depreciation | (9,391 | ) | (6,480 | ) | (12,373 | ) | (9,391 | ) |
| Total property and equipment, net | $ | 31,363 |
| $ | 24,439 |
| $ | 21,793 |
| $ | 29,866 |
|
| | | |
| |
1 | Excluding assets held for sale. |
Depreciation expense and amortization from continuing operations was $2.9 million, $1.4$3.9 million and $1.0$2.5 million in 2019 and 2018, 2017respectively. As part of a cost sharing agreement with affiliates under common ownership, depreciation expense of $250,000 and 2016,$363,000 was allocated to Global during 2019 and 2018 respectively.
During 2016, Atlas purchased a building and land for $9.3 million to serve as its new corporate headquarters to replace its former leased office space. Atlas’ Chicago area staff moved into this space in late October 2017 and occupies approximately 70,000 square feet in the building. An unrelated tenant occupies the remaining office space in the building. The Company made improvements to its corporate headquarters building of $20,000 and $1.1 million $7.8 millionin 2019 and $139,000 in 2018, 2017 and 2016, respectively. Rental income related to this lease agreement was $408,000 and $433,000 $415,000in 2019 and $69,000 in 2018, 2017 and 2016, respectively. Depreciation expense related to the building and its improvements was $1.1 million and $171,000$1.1 million in 2019 and 2018, and 2017, respectively. There was no depreciation expense related to the building and its improvements recorded in 2016.
For the years ended December 31, 2018, 2017,2019 and 20162018 the Company capitalized $7.9 million, $2.9$2.4 million and $449,000,$6.4 million, respectively, of costs incurred, consisting primarily of external consultants and internal labor costs incurred during the application development stage of the internal-use software. Substantially all of the costs incurred during the period were part of the application development stage. For the years ended December 31, 2018, 2017,2019 and 2016,2018, there was $705,000, $563,000,$1.9 million and $576,000,$667,000, respectively, of amortization expense recorded for projects in the post-implementation/operationpost-implementation stage.
Net realized gains on the disposal and sales of equipment were $2,000 in 2018, and net realized losses on the disposal and sales of equipment were $12,000was $21,000 and $2,000 in 2017. There were no realized gains or losses on the disposal of property or equipment in 2016.2019 and 2018, respectively.
10. Reinsurance Ceded
As is customary in the insurance industry, Atlas reinsures portions of certain insurance policies it writes, thereby providing a greater diversification of risk and minimizing exposure on larger risks. Atlas remains contingently at risk with respect to any reinsurance ceded and would incur an additional loss if an assuming company were unable to meet its obligation under the reinsurance treaty.
Atlas monitors the financial condition of its reinsurers to minimize its exposure to significant losses from reinsurer insolvencies. Letters of credit are maintained for any unauthorized reinsurer to cover ceded unearned premium reserves, ceded claims and claims adjustment expense reserve balances and ceded paid claims. These policies mitigate the risk of credit quality or dispute from becoming a danger to financial strength. To date, the Company has not experienced any material difficulties in collecting reinsurance recoverables.
| | Premiums Written, Premiums Earned and Amounts Related to Reinsurance | | ($ in ‘000s) | Year ended December 31, | Year ended December 31, |
| | 2018 | 2017 | 2016 | 2019 | 2018 |
| Direct premiums written | $ | 253,068 |
| $ | 261,276 |
| $ | 221,723 |
| $ | 133,827 |
| $ | 206,535 |
|
| Assumed premiums written | 33,546 |
| 14,685 |
| 3,372 |
| 26,857 |
| 32,539 |
|
| Ceded premiums written | (86,419 | ) | (44,825 | ) | (45,028 | ) | (72,911 | ) | (72,811 | ) |
| Net premiums written | $ | 200,195 |
| $ | 231,136 |
| $ | 180,067 |
| $ | 87,773 |
| $ | 166,263 |
|
| | |
| Direct premiums earned | $ | 257,646 |
| $ | 251,293 |
| $ | 217,053 |
| $ | 149,609 |
| $ | 205,923 |
|
| Assumed premiums earned | 22,972 |
| 9,796 |
| 3,074 |
| 26,954 |
| 22,261 |
|
| Ceded premiums earned | (62,400 | ) | (45,318 | ) | (49,069 | ) | (66,322 | ) | (47,498 | ) |
| Net premiums earned | $ | 218,218 |
| $ | 215,771 |
| $ | 171,058 |
| $ | 110,241 |
| $ | 180,686 |
|
| | | |
| Ceded claims and claims adjustment expenses | 53,201 |
| 46,643 |
| 32,496 |
| $ | 31,551 |
| $ | 36,652 |
|
| Ceding commissions | 14,518 |
| 11,304 |
| 12,065 |
| $ | 16,382 |
| $ | 10,258 |
|
| | | |
| Reinsurance recoverables on unpaid claims and claims adjustment expenses | 68,771 |
| 53,402 |
| 35,370 |
| — |
| $ | 55,265 |
|
| Prepaid reinsurance premiums | 36,898 |
| 12,878 |
| 13,372 |
| — |
| $ | 31,151 |
|
| Reinsurance recoverables on paid claims and claims adjustment expenses | 12,388 |
| 7,982 |
| 7,786 |
| — |
| $ | 10,260 |
|
During 2019, the Company received notice from General Reinsurance Corporation (“Gen Re”) that effective July 31, 2019, the XOL reinsurance coverage for the ASI Pool Companies would terminate on a cut-off basis. Additionally, effective September 30, 2019, the ASI Pool Companies’ Quota Share contract with Swiss Reinsurance America Corporation (“Swiss Re”) was terminated on a run-off basis. During 2020, the Company received notice from Gen Re that effective January 1, 2020, the XOL reinsurance coverage for Global Liberty would terminate on a run-off basis. See “Part 1, Item 1, 2020 Developments” for certain developments with respect to the ASI Pool Companies and Global Liberty subsequent to December 31, 2019.
11. Claims Liabilities
Unpaid Claims and Claims Adjustment Expenses
| | Changes in the Provision for Unpaid Claims and Claims Adjustment Expenses, Net of Reinsurance Recoverables | | ($ in ‘000s) | Year ended December 31, | Year ended December 31, |
| | 2018 | 2017 | 2016 | 2019 | 2018 |
| Unpaid claims and claims adjustment expenses, beginning of period | $ | 211,648 |
| $ | 139,004 |
| $ | 127,011 |
| $ | 226,487 |
| $ | 171,513 |
|
| Less: reinsurance recoverable | 53,402 |
| 35,370 |
| 29,399 |
| 55,265 |
| 41,373 |
|
| Net unpaid claims and claims adjustment expenses, beginning of period | 158,246 |
| 103,634 |
| 97,612 |
| 171,222 |
| 130,140 |
|
| | | |
| Change in retroactive reinsurance ceded | — |
| 1,361 |
| 107 |
| |
| | | |
| Incurred related to: | | |
| Current year | 137,916 |
| 128,476 |
| 102,133 |
| 78,612 |
| 110,621 |
|
| Prior years | 82,746 |
| 75,397 |
| 32,613 |
| 2,155 |
| 71,635 |
|
| | | 80,767 |
| 182,256 |
|
| | 220,662 |
| 203,873 |
| 134,746 |
| |
| Paid related to: | | |
| Current year | 52,637 |
| 50,626 |
| 39,652 |
| 22,176 |
| 39,784 |
|
| Prior years | 121,546 |
| 99,996 |
| 89,179 |
| 89,970 |
| 101,390 |
|
| | 174,183 |
| 150,622 |
| 128,831 |
| 112,146 |
| 141,174 |
|
| | | |
| Reduction in liability from deconsolidation | | 139,843 |
| — |
|
| | | |
| Net unpaid claims and claims adjustment expenses, end of period | 204,725 |
| 158,246 |
| 103,634 |
| — |
| 171,222 |
|
| Add: reinsurance recoverable | 68,771 |
| 53,402 |
| 35,370 |
| — |
| 55,265 |
|
| Unpaid claims and claims adjustment expenses, end of period | $ | 273,496 |
| $ | 211,648 |
| $ | 139,004 |
| $ | — |
| $ | 226,487 |
|
| | | |
The process of establishing the estimated provision for unpaid claims and claims adjustment expenses is complex and imprecise, as it relies on the judgment and opinions of a large number of individuals, on historical precedent and trends, on prevailing legal, economic, social and regulatory trends, and on expectations as to future developments. The process of determining the provision necessarily involves risks that the actual results may deviate, perhaps substantially, from the best estimates made.
As of October 1, 2019, the results of the ASI Pool Companies have been deconsolidated. Through September 30, 2019, the incurred related to prior years primarily related to unfavorable development on involuntary assigned risk pools and run-off commercial auto. Assigned risk pools are established by state governments to cover high-risk insureds who cannot purchase insurance through conventional means.
Atlas experienced $82.7$71.6 million in unfavorable prior accident year development in 2018 as reflected as incurred related to prior years in the table above. The unfavorable development is primarily from our core lines with $66.4$58.7 million of the development related to claims from accident years 2015 through 2017. Year-end 2018 reserve estimates for the Insurance SubsidiariesASI Pool Companies were strengthened to the high point of the actuarial range established by the outside independent actuaries for each entity based on December 31, 2018 data, claim settlement activities, and other factors evaluated subsequent to the receipt of the 2018 actuarial opinions. While the Company believes that the changes made to its claim process will result in better outcomes than would have otherwise been the case, uncertainty regarding the ultimate outcome exists, and it cannot be assumed that reserve estimates will be adequate. Primarily as a result of regulatory concerns regarding reserve levels, the ASI Pool Companies were placed into rehabilitation in 2019. See ‘Item 1, 2019 Developments’ and “Item 1A, Risk Factors - Risks Related to 2019 Developments - Regulatory Developments” for certain developments with respect to the Company and the Insurance Subsidiaries subsequent to December 31, 2018. Incremental claim outcomes and other factors could result in future adjustments to reserves and reserve estimates.
Atlas experienced $75.4 million in unfavorable prior accident year development in 2017 as reflected as incurred related to prior years in the table above. The unfavorable development is primarily from our core commercial automobile liability line. Atlas previously identified that claim expenses in Michigan were significantly outpacing other states and took a significant charge. Although exposure in Michigan was reduced to approximately 1.4% of the Company’s insured vehicles inforce by year end 2017, payments for claims in this state continued to be disproportionate to historic premiums earned. In addition, the remaining liability for non-New York Global Liberty business written prior to 2016 is expected to settle for greater amounts than previously expected. Overall, the actuarially determined liability for remaining claims related to accident year 2015 and prior, in general, across all jurisdictions, was indicated to be higher than carried reserves.
Atlas experienced $32.6 million in unfavorable prior accident year development in 2016 as reflected as incurred related to prior years in the table above. The unfavorable development is primarily from our core commercial automobile liability line. Excluding
pre-acquisition Global Liberty reserve development, the development of our core lines on prior accident years was $23.2 million in 2016. Michigan commercial automobile claims accounted for approximately 62.5% of this development. Pre-acquisition Global Liberty claims reserve development was $7.9 million in 2016. The remaining unfavorable prior year development of $1.5 million in 2016 is attributable to assigned risk pools and run-off of non-core business.
Short-Duration Insurance Contracts
For purposes of this discussion, Atlas will disaggregate data based on the type of coverage into commercial automobile liability, including personal injury protection, and all other lines. Commercial automobile liability is the main line of business that Atlas operates. All other lines includes commercial automobile physical damage, taxi workers’ compensation, other liability and Atlas’ short duration lines that are currently in run-off. Amounts related to the Gateway and Global Liberty acquisitions have been included retrospectively for all years presented in the tables below.
Claims payments and changes in reserves may be made on accidents that occurred in prior years, not solely on business that is currently insured. Calendar year claims consist of payments and reserve changes that have been recorded in the financial statements during the applicable reporting period, without regard to the period in which the accident occurred. Calendar year results do not change after the end of the applicable reporting period, even as new claim information develops. Accident year claims consist of payments and reserve changes that are assigned to the period in which the accident occurred. Accident year results will change over time as the estimates of claims change due to payments and reserve changes for all accidents that occurred during that period.
The following is information about incurred and paid claims and claims adjustment expenses development for the year ended December 31, 2018, net of reinsurance, as well as cumulative claim frequency and the total of incurred but not reported liabilities plus expected development on reported claims included within the net incurred claims amounts. The information about incurred and paid claims development for the years ended December 31, 2009 to 2015, is presented as unaudited supplementary information.
Commercial Automobile Liability
|
| | | | | | | | | | | | | | | | | | | | | | | | | | | | | | | | | | | |
| Incurred Claims and Allocated Claims Adjustment Expenses, Net of Reinsurance |
| ($ in ‘000s, except cumulative number of reported claims) | |
| | Year ended December 31, | As of December 31, 2018 |
| Accident Year | 2009 unaudited | 2010 unaudited | 2011 unaudited | 2012 unaudited | 2013 unaudited | 2014 unaudited | 2015 unaudited | 2016 | 2017 | 2018 | Incurred but Not Reported Liabilities, Net of Reinsurance | Cumulative Number of Reported Claims |
| 2009 | $ | 37,394 |
| $ | 40,309 |
| $ | 43,889 |
| $ | 43,604 |
| $ | 42,909 |
| $ | 42,326 |
| $ | 42,987 |
| $ | 43,728 |
| $ | 43,902 |
| $ | 44,542 |
| $ | 70 |
| 13,243 |
|
| 2010 | | 35,877 |
| 34,677 |
| 35,711 |
| 37,026 |
| 37,205 |
| 38,002 |
| 38,841 |
| 39,246 |
| 39,488 |
| 129 |
| 8,577 |
|
| 2011 | | | 31,044 |
| 38,822 |
| 34,887 |
| 34,720 |
| 35,136 |
| 36,080 |
| 36,472 |
| 36,986 |
| 251 |
| 7,835 |
|
| 2012 | | | | 35,948 |
| 37,839 |
| 38,972 |
| 40,429 |
| 44,627 |
| 46,755 |
| 47,780 |
| 807 |
| 9,391 |
|
| 2013 | | | | | 48,449 |
| 48,636 |
| 53,656 |
| 64,687 |
| 73,749 |
| 78,701 |
| 1,928 |
| 11,764 |
|
| 2014 | | | | | | 61,145 |
| 53,005 |
| 69,555 |
| 92,245 |
| 100,546 |
| 6,344 |
| 14,738 |
|
| 2015 | | | | | | | 69,060 |
| 67,184 |
| 96,521 |
| 122,995 |
| 17,837 |
| 19,275 |
|
| 2016 | | | | | | | | 80,824 |
| 87,516 |
| 104,504 |
| 13,926 |
| 20,063 |
|
| 2017 | | | | | | | | | 101,983 |
| 120,510 |
| 31,118 |
| 22,660 |
|
| 2018 | | | | | | | | | | 111,288 |
| 55,380 |
| 19,570 |
|
| Total | | | | | | | | | Total | $ | 807,340 |
| | |
| | | | | | | | | | | | | |
| Cumulative Paid Claims and Allocated Claims Adjustment Expenses, Net of Reinsurance |
| ($ in ‘000s) | | |
| | Year ended December 31, | | |
| Accident Year | 2009 unaudited1 | 2010 unaudited | 2011 unaudited | 2012 unaudited | 2013 unaudited | 2014 unaudited | 2015 unaudited | 2016 | 2017 | 2018 | | |
| 2009 | $ | (3,218 | ) | $ | 10,711 |
| $ | 24,468 |
| $ | 31,784 |
| $ | 36,385 |
| $ | 39,664 |
| $ | 42,030 |
| $ | 43,287 |
| $ | 43,707 |
| $ | 44,415 |
| | |
| 2010 | | 10,097 |
| 20,483 |
| 26,654 |
| 31,300 |
| 34,831 |
| 37,051 |
| 38,187 |
| 38,930 |
| 39,262 |
| | |
| 2011 | | | 8,725 |
| 18,980 |
| 24,978 |
| 29,660 |
| 33,217 |
| 35,324 |
| 36,058 |
| 36,660 |
| | |
| 2012 | | | | 8,385 |
| 18,230 |
| 26,995 |
| 35,563 |
| 41,587 |
| 44,835 |
| 46,702 |
| | |
| 2013 | | | | | 10,358 |
| 27,198 |
| 43,117 |
| 59,973 |
| 68,612 |
| 75,491 |
| | |
| 2014 | | | | | | 15,404 |
| 38,257 |
| 60,486 |
| 81,141 |
| 92,593 |
| | |
| 2015 | | | | | | | 18,597 |
| 49,556 |
| 76,398 |
| 101,323 |
| | |
| 2016 | | | | | | | | 21,850 |
| 53,812 |
| 81,330 |
| | |
| 2017 | | | | | | | | | 27,977 |
| 66,055 |
| | |
| 2018 | | | | | | | | | | 29,404 |
| | |
| Total | | | | | | | | | | $ | 613,235 |
| | |
| All outstanding liabilities before 2009, net of reinsurance | | 318 |
| | |
| Liabilities for claims and allocated claims adjustment expenses, net of reinsurance | | $ | 194,423 |
| | |
| | | | | | | | | | | | | |
| |
1
| Year 2009 negative amounts results from the termination of reinsurance agreements. |
Other Short-Duration Lines
|
| | | | | | | | | | | | | | | | | | | | | | | | | | | | | | | | | | | |
| Incurred Claims and Allocated Claims Adjustment Expenses, Net of Reinsurance |
| ($ in ‘000s, except cumulative number of reported claims) | |
| | Year ended December 31, | As of December 31, 2018 |
| Accident Year | 2009 unaudited | 2010 unaudited | 2011 unaudited | 2012 unaudited | 2013 unaudited | 2014 unaudited | 2015 unaudited | 2016 | 2017 | 2018 | Incurred but Not Reported Liabilities, Net of Reinsurance | Cumulative Number of Reported Claims |
| 2009 | $ | 35,688 |
| $ | 34,764 |
| $ | 34,626 |
| $ | 35,453 |
| $ | 36,343 |
| $ | 36,202 |
| $ | 36,736 |
| $ | 37,061 |
| $ | 37,070 |
| $ | 37,423 |
| $ | 3 |
| 27,847 |
|
| 2010 | | 26,884 |
| 27,729 |
| 24,714 |
| 24,922 |
| 24,392 |
| 24,456 |
| 24,477 |
| 24,478 |
| 24,526 |
| 29 |
| 14,331 |
|
| 2011 | | | 20,315 |
| 22,176 |
| 22,310 |
| 21,782 |
| 22,122 |
| 22,941 |
| 22,414 |
| 22,408 |
| 20 |
| 10,002 |
|
| 2012 | | | | 13,054 |
| 12,723 |
| 13,634 |
| 13,854 |
| 13,934 |
| 14,109 |
| 13,674 |
| 32 |
| 3,616 |
|
| 2013 | | | | | 5,897 |
| 4,754 |
| 4,556 |
| 4,687 |
| 4,711 |
| 4,655 |
| 20 |
| 2,149 |
|
| 2014 | | | | | | 6,645 |
| 6,849 |
| 6,978 |
| 7,580 |
| 7,909 |
| 889 |
| 2,945 |
|
| 2015 | | | | | | | 8,320 |
| 8,616 |
| 9,591 |
| 9,036 |
| 454 |
| 3,979 |
|
| 2016 | | | | | | | | 9,357 |
| 9,960 |
| 9,983 |
| 305 |
| 4,708 |
|
| 2017 | | | | | | | | | 11,086 |
| 12,302 |
| 408 |
| 5,323 |
|
| 2018 | | | | | | | | | | 12,190 |
| 746 |
| 4,885 |
|
| Total | | | | | | | | | Total | $ | 154,106 |
| | |
| | | | | | | | | | | | | |
| Cumulative Paid Claims and Allocated Claims Adjustment Expenses, Net of Reinsurance |
| ($ in ‘000s) | | |
| | For the Years Ended December 31, | | |
| Accident Year | 2009 unaudited | 2010 unaudited | 2011 unaudited | 2012 unaudited | 2013 unaudited | 2014 unaudited | 2015 unaudited | 2016 | 2017 | 2018 | | |
| 2009 | $ | 11,296 |
| $ | 25,422 |
| $ | 30,343 |
| $ | 33,186 |
| $ | 34,375 |
| $ | 35,785 |
| $ | 36,164 |
| $ | 36,499 |
| $ | 36,714 |
| $ | 37,119 |
| | |
| 2010 | | 14,182 |
| 20,420 |
| 22,596 |
| 23,812 |
| 24,225 |
| 24,368 |
| 24,414 |
| 24,452 |
| 24,492 |
| | |
| 2011 | | | 11,517 |
| 17,419 |
| 19,696 |
| 20,939 |
| 21,600 |
| 22,235 |
| 22,326 |
| 22,331 |
| | |
| 2012 | | | | 6,446 |
| 9,789 |
| 11,554 |
| 12,782 |
| 13,343 |
| 13,317 |
| 13,621 |
| | |
| 2013 | | | | | 4,195 |
| 4,602 |
| 4,603 |
| 4,612 |
| 4,641 |
| 4,627 |
| | |
| 2014 | | | | | | 6,154 |
| 6,677 |
| 6,728 |
| 6,820 |
| 6,833 |
| | |
| 2015 | | | | | | | 7,886 |
| 8,154 |
| 8,291 |
| 8,474 |
| | |
| 2016 | | | | | | | | 9,413 |
| 9,802 |
| 9,859 |
| | |
| 2017 | | | | | | | | | 10,619 |
| 12,238 |
| | |
| 2018 | | | | | | | | | | 11,548 |
| | |
| Total | | | | | | | | | | $ | 151,142 |
| | |
| All outstanding liabilities before 2009, net of reinsurance | | 595 |
| | |
| Liabilities for claims and allocated claims adjustment expenses, net of reinsurance | | $ | 3,559 |
| | |
| | | | | | | | | | | | | |
Incurred claims and allocated claim adjustment expenses, net of reinsurance, show how the initial estimate of incurred claims develop for each of the past 10 accident years. Incurred but not reported liabilities, net of reinsurance, by accident year are estimates that are based on the difference between the reported claims and the estimate of the ultimate paid claims and claims adjustment expenses for known and unknown claims. These estimates involve actuarial and statistical projections at a given point in time of what we expect the cost of the ultimate settlement and administration of known and unknown claims. The process reflects the uncertainties and significant judgmental factors inherent in estimating future results of both known and unknown claims, and as such, the process is inherently complex and imprecise. We utilize a third party actuarial firm to assist us in the estimation process.
The cumulative number of reported claims for commercial automobile liability was calculated using actual number of claims at the feature/coverage level. For the other lines, claim counts were calculated using actual claim counts at the feature/coverage level for all claims excluding those from assigned risk pools and surety. The actual claim counts for assigned risk pools and surety may not be available for all years presented and are therefore not included in the reported claims amounts.
The following table reconciles the net incurred and paid claims and claims adjustment expenses development tables to the liability for claims and claims adjustment expenses in the consolidated statement of financial position as of December 31, 2018.
|
| | | |
| Reconciliation of Unpaid Claims and Claims Adjustment Expenses |
| ($ in ‘000s) | As of December 31, 2018 |
| Net outstanding liabilities: | |
| Commercial automobile liability | $ | 194,423 |
|
| Other short-duration lines | 3,559 |
|
| Unpaid claims and allocated claims adjustment expenses, net of reinsurance | 197,982 |
|
| | |
| Reinsurance recoverable on unpaid claims and claims adjustment expenses: | |
| Commercial automobile liability | 67,744 |
|
| Other short-duration lines | 1,027 |
|
| Total reinsurance recoverable on unpaid claims and claims adjustment expenses | 68,771 |
|
| | |
| Unallocated claims adjustment expenses | 6,743 |
|
| | |
| Unpaid claims and claims adjustment expenses, gross of reinsurance | $ | 273,496 |
|
| | |
The following is supplementary information about the average annual percentage payout of incurred claims by age, net of amounts recoverable from reinsurers, for the year ended December 31, 2018 (amounts are unaudited).
|
| | | | | | | | | | | | | | | | | | | | |
| Average Annual Percentage Payout of Incurred Claims by Age, Net of Reinsurance |
| | Year ended December 31, 2018 |
| Years | 1 | 2 | 3 | 4 | 5 | 6 | 7 | 8 | 9 | 10 |
| Commercial automobile liability | 17.4 | % | 26.4 | % | 21.4 | % | 17.3 | % | 10.6 | % | 6.8 | % | 3.5 | % | 2.1 | % | 0.9 | % | 1.6 | % |
| Other short-duration lines | 71.7 | % | 16.6 | % | 6.0 | % | 4.3 | % | 2.1 | % | 1.3 | % | 1.0 | % | 0.4 | % | 0.4 | % | 1.1 | % |
12. Share-Based Compensation
On January 6, 2011, Atlas adopted a stock option plan (“Stock Option Plan”) in order to advance the interests of Atlas by providing incentives to eligible persons defined in the plan. In the second quarter of 2013, a new equity incentive plan (“Equity Incentive Plan”) was approved by the Company’s common shareholders at the Annual General Meeting, and Atlas ceased to grant new stock options under the preceding Stock Option Plan. The Equity Incentive Plan is a securities based compensation plan, pursuant to which Atlas may issue restricted stock grants for ordinary voting common shares, restricted stock, stock grants for ordinary voting common shares, stock options and other forms of equity incentives to eligible persons as part of their compensation. The Equity Incentive Plan is considered an amendment and restatement of the Stock Option Plan, although outstanding stock options issued pursuant to the Stock Option Plan will continue to be governed by the terms of the Stock Option Plan.
Stock Options
| | Stock Option Activity | | (prices in Canadian dollars designated with “C$” and U.S. dollars designated with “US$”) | Year ended December 31, | Year ended December 31, |
| 2018 | 2017 | 2019 | 2018 |
| | Number of Options | Weighted Average Exercise Price | Number of Options | Weighted Average Exercise Price | Number of Options | Weighted Average Exercise Price | Number of Options | Weighted Average Exercise Price |
| C$ Denominated: | | | | | | | | |
| Outstanding, beginning of period | 54,390 |
|
| C$6.00 |
| 187,728 |
|
| C$6.22 |
| 27,195 |
|
| C$6.00 |
| 54,390 |
|
| C$6.00 |
|
| Granted | — |
| — |
| — |
| — |
| — |
| — |
| — |
| — |
|
| Exercised | (27,195 | ) |
| C$6.00 |
| (133,338 | ) |
| C$6.31 |
| — |
|
| C$— |
| (27,195 | ) |
| C$6.00 |
|
| Outstanding, end of period | 27,195 |
|
| C$6.00 |
| 54,390 |
|
| C$6.00 |
| 27,195 |
|
| C$6.00 |
| 27,195 |
|
| C$6.00 |
|
| | | | | | | | | |
| US$ Denominated: | | | | | | | | |
| Outstanding, beginning of period | 375,000 |
| US$17.01 |
| 375,000 |
| US$17.01 |
| 375,000 |
| US$17.01 |
| 375,000 |
| US$17.01 |
|
| Granted | — |
| — |
| — |
| — |
| — |
| — |
| — |
| — |
|
| Exercised | — |
| — |
| — |
| — |
| — |
| — |
| — |
| — |
|
| Outstanding, end of period | 375,000 |
| US$17.01 |
| 375,000 |
| US$17.01 |
| 375,000 |
| US$17.01 |
| 375,000 |
| US$17.01 |
|
| | | | | | | | | |
|
| | | | | |
| Options Outstanding |
| As of December 31, 2018 |
| Grant Date | Expiration Date | Number Outstanding | Number Exercisable |
| January 18, 2011 | January 18, 2021 | 27,195 |
| 27,195 |
|
| March 6, 2014 | March 6, 2024 | 175,000 |
| — |
|
| March 12, 2015 | March 12, 2025 | 200,000 |
| — |
|
| Total | | 402,195 |
| 27,195 |
|
| | | | |
|
| | | | | |
| Options Outstanding |
| As of December 31, 2019 |
| Grant Date | Expiration Date | Number Outstanding | Number Exercisable |
| January 18, 2011 | January 18, 2021 | 27,195 |
| — |
|
| March 6, 2014 | March 6, 2024 | 175,000 |
| — |
|
| March 12, 2015 | March 12, 2025 | 200,000 |
| — |
|
| Total | | 402,195 |
| — |
|
| | | |
There are 27,195no stock options that are exercisable as of December 31, 2018.2019. The stock option grants outstanding have a weighted average remaining life of 5.484.48 years and have an intrinsic value of $100,000$0 as of December 31, 2018.2019.
Under the Equity Incentive Plan, a director who either directly or indirectly purchases up to $100,000 of Atlas ordinary voting common stock on the open market, through the employee stock purchase plan, or via other means acceptable under this plan (see ‘Part II, Item 8, Note 13, Other Employee Benefit Plans’ in the Notes to Consolidated Financial Statements) will receive a 3 to 1 matching grant of restricted stock grants for ordinary voting common shares (or, for Canadian taxpayers, restricted stock units) based on the aggregate purchase price of ordinary voting common shares the director purchases during the 6 month period that began on June 18, 2013 and ended on December 31, 2013, or for new directors within 6 months of their initial appointment date (“Purchase Period”). Matching share grants of 148,152 restricted stock grants for ordinary voting common shares and 37,038 restricted stock units were made on February 28, 2014 (“Grant Date”). The number of ordinary voting common shares issued on the Grant Date were determined by dividing (A) the dollar amount of the Company matching contribution due based on purchases during the Purchase Period by (B) the closing common share price of one share of Company ordinary voting common share at close of market on June 17, 2013 (“Closing Price”), which was $8.10 per share. The restricted stock grants for ordinary voting common shares will vest 20% on each anniversary of the Grant Date, subject to the terms of the Guidelines. The matching grant will be subject to all of the terms and conditions of the Equity Incentive Plan and applicable grant agreements. The matching grant award was discontinued during 2018 with no additional grants under the program since those discussed above.2018.
On December 31, 2018, the Company awarded restricted stock unit grants for ordinary voting common shares of the Company to its external directors pursuant to a director equity award agreement dated December 31, 2018. The awards, which were approved by the Company’s Board of Directors in March 2018, were valued at $40,000 per external director (“Aggregate Award”) and were made under the Company’s Equity Incentive Plan. The number of restricted stock units awarded was determined by dividing (A) the Aggregate Award by (B) the closing price of one share of Company ordinary voting common share at the close of market on April 4, 2018, which was $10.50 per share. For new directors, the Aggregate Award is proportionate to the director’s start date and priced as of that same day. During 2018, the Company awarded 17,524 RSU grants having an aggregate grant date fair value of $179,000. The RSUs will vest 33.3% on January 1 of each year for the next threetwo years.
On March 12, 2015, the Board of Directors of Atlas granted equity awards of (i) 200,000 restricted stock grants for ordinary voting common shares of the Company and (ii) 200,000 options to acquire ordinary voting common shares to the executive officers of the Company as part of the Company’s annual compensation process. The awards were made under the Company’s Equity Incentive Plan. The awards vest in five equal annual installments of 20%, provided that an installment shall not vest unless an annual performance target based on specific book value growth rates linked to return on equity goals is met. In the event the performance target is not met in any year, the 20% installment for such year shall not vest, but such non-vested installment shall carry forward and can become vested in future years (up to the fifth year from the date of grant), subject to achievement in a future year of the applicable performance target for such year. In 2018,2019, no shares of either the restricted stock grants for ordinary voting common shares or the options to acquire ordinary voting common shares vested, due to not meeting annual performance targets. In 2017, 40,000 shares of each of the restricted stock grants for ordinary voting common shares and the options to acquire ordinary voting common shares vested.
The Monte-Carlo simulation model was used, for both the options and restricted stock grants for ordinary voting common shares, to estimate the fair value of compensation expense as a result of the performance based component of these grants. Utilizing the Monte-Carlo simulation model, the fair values were $1.5 million and $1.9 million for the options and restricted stock grants for ordinary voting common shares, respectively. This expense will be amortized over the anticipated vesting period.
Restricted Shares
| | Restricted Stock Grants for Ordinary Voting Common Shares and Restricted Share Unit Activity | | | Year ended December 31, | Year ended December 31, |
| | 2018 | 2017 | 2019 | 2018 |
| | Number of Shares | Weighted Average Fair Value at Grant Date | Number of Shares | Weighted Average Fair Value at Grant Date | Number of Shares | Weighted Average Fair Value at Grant Date | Number of Shares | Weighted Average Fair Value at Grant Date |
| Non-vested, beginning of period | 234,080 |
| $ | 16.15 |
| 311,120 |
| $ | 15.92 |
| 207,156 |
| $ | 16.50 |
| 234,080 |
| $ | 16.15 |
|
| Granted | 17,524 |
| 10.22 |
| — |
| — |
| — |
| — |
| 17,524 |
| 10.22 |
|
| Vested | (44,448 | ) | 12.20 |
| (77,040 | ) | 15.21 |
| (28,066 | ) | 11.79 |
| (44,448 | ) | 12.20 |
|
| Canceled | | (7,408 | ) | 12.20 |
| — |
| — |
|
| Non-vested, end of period | 207,156 |
| $ | 16.50 |
| 234,080 |
| $ | 16.15 |
| 171,682 |
| $ | 17.46 |
| 207,156 |
| $ | 16.50 |
|
| | | | | | | | | |
In accordance with ASC 718 (Stock-Based Compensation), Atlas has recognized share-based compensation expense on a straight-line basis over the requisite service period of the last separately vesting portion of the award. Share-based compensation expense is a component of other underwriting expenses on the statements of (loss) income and comprehensive (loss) income.operations. Atlas recognized share-based compensation expense of $872,000 and $1.2 million in each of the years ended December 31, 2019 and 2018, and 2017 and $1.6 million in 2016.respectively. As of December 31, 2018,2019, there was $644,000$124,000 of unrecognized total compensation expense related to all restricted stock and restricted stock units grants for ordinary voting common shares. The expense will be amortized over a weighted average period of 1.2 years.7 months.
13. Other Employee Benefit Plans
Defined Contribution Plan
Atlas has a defined contribution 401(k) plan covering all qualified employees of Atlas and its subsidiaries. Contributions to this plan are limited based on IRS guidelines. Atlas matches 100% of the employee contribution up to 2.5% of annual earnings, plus 50% of additional contributions up to 2.5% of annual earnings, for a total maximum expense of 3.75% of annual earnings per participant. Atlas’ matching contributions are discretionary. Employees are 100% vested in their own contributions and vest in Atlas contributions based on years of service equally over 5 years with 100% vested after 5 years. Company contributions were $543,000, $441,000$386,000 and $424,000$443,000 and in 2018, 20172019 and 2016,2018, respectively.
Employee Stock Purchase Plan
The Atlas Employee Stock Purchase Plan (“ESPP”) encourages employee interest in the operation, growth and development of Atlas and provides an additional investment opportunity to employees. Full time and permanent part time employees working more than 30 hours per week are allowed to invest up to 7.5% of adjusted salary in Atlas ordinary voting common shares. Atlas matches 100% of the employee contribution up to 2.5% of annual earnings, plus 50% of additional contributions up to 5% of annual earnings, for a total maximum expense of 5% of annual earnings per participant. Atlas’ matching contributions are discretionary. Atlas also pays all administrative costs related to this plan. In 2018, 20172019 and 2016,2018, Atlas’ costs incurred related to the matching portion of the ESPP were $239,000, $212,000$108,000 and $199,000,$206,000, respectively. Share purchases pursuant to this plan are made in the open market.
14. Share Capital, Warrants and Mezzanine Equity
Share Capital
|
| | | | | | | | | | | | | | | | |
| Share Capital Activity | | |
| | | As of December 31, |
| | | 2018 | 2017 |
| | Shares Authorized | Shares Issued | Shares Outstanding | Amount ($ in ‘000s) | Shares Issued | Shares Outstanding | Amount ($ in ‘000s) |
| Ordinary voting common shares | 266,666,667 |
| 12,192,475 |
| 11,936,970 |
| $ | 36 |
| 12,164,041 |
| 12,164,041 |
| $ | 36 |
|
| Restricted voting common shares | 33,333,334 |
| — |
| — |
| — |
| — |
| — |
| — |
|
| Total common shares | 300,000,001 |
| 12,192,475 |
| 11,936,970 |
| $ | 36 |
| 12,164,041 |
| 12,164,041 |
| $ | 36 |
|
| | | | | | | | |
During 2017, the 128,191 restricted voting common shares that were beneficially owned or controlled by Kingsway Financial Services, Inc. (including its subsidiaries and affiliated companies, “Kingsway”) were sold to non-affiliates of Kingsway. The restricted voting common shares are entitled to vote at all meetings of shareholders, except at meetings of holders of a specific class that are entitled to vote separately as a class. The restricted voting common shares as a class shall not carry more than 30% of the aggregate votes eligible to be voted at a general meeting of common shareholders. The Kingsway-owned restricted voting common shares automatically converted to ordinary voting common shares upon their sale to non-affiliates of Kingsway. There are no restricted voting common shares outstanding as of December 31, 2018. |
| | | | | | | | | | | | | | | | |
| Share Capital Activity | | |
| | | As of December 31, |
| | | 2019 | 2018 |
| | Shares Authorized | Shares Issued | Shares Outstanding | Amount ($ in ‘000s) | Shares Issued | Shares Outstanding | Amount ($ in ‘000s) |
| Ordinary voting common shares | 266,666,667 |
| 12,198,319 |
| 11,942,812 |
| $ | 36 |
| 12,192,475 |
| 11,936,970 |
| $ | 36 |
|
| Restricted voting common shares | 33,333,334 |
| — |
| — |
| — |
| — |
| — |
| — |
|
| Total common shares | 300,000,001 |
| 12,198,319 |
| 11,942,812 |
| $ | 36 |
| 12,192,475 |
| 11,936,970 |
| $ | 36 |
|
| | | | | | | | |
There were 24,93211,682 and 14,81624,932 non-vested RSUs as of December 31, 20182019 and 2017,2018, respectively. These RSUs are participative and are included in the computations of earnings per common share and book value per common share for these periods.
During 2019, the Company issued 5,842 ordinary voting common shares as a result of the vesting of RSUs. During 2018, the Company issued 7,408 ordinary voting common shares as a result of the vesting of RSUs and 27,195 ordinary voting common shares, then immediately canceled 6,169 shares, as a result of a cashless exercise of options. During 2017, the Company issued 7,408 ordinary voting common shares as a result of the vesting of RSUs and 133,338 ordinary voting common shares as a result of the exercise of options.
On March 21, 2017, the Company’s Board of Directors approved a Share Repurchase Program of up to 650,000 shares of common stock. The repurchases could be made from time to time in open market transactions, privately-negotiated transactions, block purchases, or otherwise in accordance with securities laws at the discretion of the Company’s management until March 21, 2018. The Share Repurchase Program was not extended. The Company’s decisions around the timing, volume, and nature of share repurchases, and the ultimate amount of shares repurchased, was dependent on market conditions, applicable securities laws and
other factors. The Share Repurchase Program and the Board’s authorization of the program could have been modified, suspended or discontinued at any time. During 2018, 255,505 shares were repurchased under the Share Repurchase Program. No
Warrants
The Schedule 13G filed by American Financial Group, Inc., a parent holding company, on January 31, 2020 states that as of December 31, 2019 it has sole voting power to vote 2,387,368 ordinary voting common shares were repurchasedand sole power to dispose of 2,387,368 ordinary voting common shares. These shares are represented by warrants to purchase 2,387,368 ordinary voting common shares until June 10, 2024, under a Warrant Agreement dated June 10, 2019 (the “Warrant Agreement”), at an initial exercise price of $0.69 per share, with both the Share Repurchase Program during 2017.number of ordinary voting common shares subject to the Warrant Agreement and the exercise price subject to adjustment as set forth in the Warrant Agreement.
Atlas did not declare or pay any dividends to its common shareholders during 20182019 or 2017.2018.
Mezzanine Equity
During the first quarter of 2016, the Company canceled 401,940There were no preferred shares pursuant to the Gateway stock purchase agreement. During the third quarter of 2016, the Company redeemed all 2,538,560 of the remaining preferred shares issued to the former owner of Gateway. During the fourth quarter of 2016, the Company canceled the remaining 4,000,000 preferred shares pursuant to the Anchor stock purchase agreement. Asoutstanding as of December 31, 20182019 and 2017, there were no outstanding preferred shares. The preferred shares redeemed and canceled during 2016 pursuant to the Gateway stock purchase agreement have been recorded as a recovery of acquisition expense and additional acquisition expense, respectively, and not as an adjustment to goodwill, because the fair value of the contingent consideration was determined to be zero at the date of acquisition. In accordance with U.S. GAAP, such adjustments are reflected in the statements of (loss) income and comprehensive (loss) income in the period that the contingency is re-estimated. The Anchor cancellation was recorded as a recovery of acquisition expense.2018.
Preferred shareholders are entitled to dividends on a cumulative basis, whether or not declared by the Board of Directors, at the rate of $0.045 per share per year (4.5%) and may be paid in cash or in additional preferred shares at the option of Atlas. In liquidation, dissolution or winding-up of Atlas, preferred shareholders receive the greater of $1.00 per share plus all declared and unpaid dividends or the amount they would receive in liquidation if the preferred shares had been converted to restricted voting common shares or ordinary voting common shares immediately prior to liquidation. Preferred shareholders are not entitled to vote.
On September 30, 2016, Atlas paid $409,000 in dividends earned on the preferred shares to the former owner of Gateway, the cumulative amount to which they were entitled through September 15, 2016, leaving no accrued and unpaid dividends owed to the former owner of Gateway. During 2018, Atlas paid $333,000 in dividends earned on the preferred shares then outstanding to the former owner of Anchor, the cumulative amount to which they were entitled through December 31, 2017, leaving no accrued or unpaid dividends. The paid claims development on Global Liberty’s pre-acquisition claims reserves was in excess of $4.0 million, and as a result, pursuant to the terms of the Anchor stock purchase agreement, dividends will no longer accrue to the former owner of Anchor.
15. Deferred Policy Acquisition Costs
DPAC represent those costs that are incremental and directly related to the successful acquisition of new or renewal written premium. Such DPAC generally includes agent commissions, premium taxes and a portion of employee compensation and benefits directly related to time spent performing specific acquisition or renewal activities. The method followed in determining the DPAC limits the deferral to its realizable value by giving consideration to estimated future claims and expenses to be incurred as premiums are earned. Changes in estimates, if any, are recorded in the accounting period in which they are determined. Anticipated investment income is included in determining the realizable value of the DPAC. Atlas’ DPAC are reported net of deferred ceding commissions.
Policy acquisition costs are deferred and amortized over the period in which the related premiums written are earned, typically 12 months.
| | | Components of Deferred Policy Acquisition Costs | | Components of Deferred Policy Acquisition Costs |
| ($ in ‘000s) | Year ended December 31, | Year ended December 31, |
| | 2018 | 2017 | 2016 | 2019 | 2018 |
| Balance, beginning of period | $ | 14,797 |
| $ | 13,222 |
| $ | 10,235 |
| $ | 5,918 |
| $ | 13,226 |
|
| Acquisition costs deferred | 18,627 |
| 29,460 |
| 21,790 |
| 24,563 |
| 21,075 |
|
| Amortization charged to operations | (26,115 | ) | (27,885 | ) | (18,803 | ) | |
| Amortization charged to income | | (11,825 | ) | (28,383 | ) |
| Reduction of acquisition costs from deconsolidation of ASI Pool Companies | | (18,656 | ) | — |
|
| Balance, end of period | $ | 7,309 |
| $ | 14,797 |
| $ | 13,222 |
| $ | — |
| $ | 5,918 |
|
| | | |
16. Leases
The Company adopted ASC 842 - Leases as of January 1, 2019, using the transition method wherein entities were allowed to initially apply the new lease standard at adoption date and recognize a cumulative-effect adjustment to the opening balance of retained earnings in the period of adoption. Accordingly, all periods prior to January 1, 2019 were presented in accordance with the previous ASC 840 - Leases, and no retrospective adjustments were made to the comparative periods presented. Adoption of ASC 842 resulted in an increase of operating lease right-of-use assets (“ROU”) totaling approximately $2.5 million in other assets on the condensed consolidated statements of financial positions and operating lease liabilities of approximately $3.1 million and a decrease of net deferred rent liabilities of approximately $600,000 in other liabilities and accrued expenses on the condensed consolidated statements of financial position as of January 1, 2019.
We currently lease real estate space, automobiles, and certain equipment under non-cancelable operating lease agreements. Leases with an initial term of 12 months or less, which are immaterial to the Company, are not recorded in the condensed consolidated statement of financial position. The Company has elected the practical expedient to account for each separate lease component of a contract and its associated non-lease components as a single lease component, thus causing all fixed payments to be capitalized. The Company also elected the package of practical expedients permitted within the new standard, which among other things, allows the Company to carry forward historical lease classification. Variable lease payment amounts that cannot be determined at the commencement of the lease, such as increases to lease payments based on changes in index rates or usage, are not recorded in the condensed consolidated statement of financial position.
Certain agreements include an option to extend or renew the lease term at our option. The operating lease liability includes lease payments related to options to extend or renew the lease term if the Company is reasonably certain of exercising those options. Lease payments are discounted using the implicit discount rate in the lease. If the implicit discount rate for the lease cannot be readily determined, the Company uses an estimate of its incremental borrowing rate. The Company did not have any contracts accounted for as finance leases as of December 31, 2019 or January 1, 2019.
|
| | | |
| Lease Expense |
| ($ in ‘000s) | 2019 |
| Operating leases | $ | 904 |
|
| Variable lease cost | 332 |
|
| Total | $ | 1,236 |
|
| | |
|
| | | |
| Other Operating Lease Information |
| ($ in ‘000s) | 2019 |
| Cash paid for amounts included in the measurement of lease liabilities reported in operating cash flows | $ | 1,237 |
|
| Right-of-use assets obtained in exchange for new lease liabilities | 31 |
|
| Total | $ | 1,268 |
|
| | |
| Weighted-average remaining lease term | 2.1 years |
|
| Weighted-average discount rate | 3.6 | % |
The following table presents the undiscounted contractual maturities of the Company’s operating lease liability:
|
| | | |
| Contractual Operating Lease Liabilities |
| ($ in ‘000s) | 2019 |
| 2020 | $ | 951 |
|
| 2021 | 898 |
|
| 2022 | 179 |
|
| 2023 | 23 |
|
| Total lease payments | $ | 2,051 |
|
| Impact of discounting | (58 | ) |
| Operating lease liability | $ | 1,993 |
|
| | |
17. Related Party Transactions
See ‘Item 13, Certain Relationships and Related Transactions, and Director Independence ” for disclosure regarding the Company’s related party transactions.
17. Selected Quarterly Financial Data (unaudited)
|
| | | | | | | | | | | | |
| ($ in ‘000s, except per share data) | Q4 | Q3 | Q2 | Q1 |
| | 2018 |
| Gross premiums written | $ | 57,749 |
| $ | 75,917 |
| $ | 57,359 |
| $ | 95,589 |
|
| Net premiums earned | 52,506 |
| 54,461 |
| 55,359 |
| 55,892 |
|
| Net (loss) income attributable to common shareholders | (96,722 | ) | 5,605 |
| 5,576 |
| 5,529 |
|
| (Loss) earnings per common share basic | $ | (8.06 | ) | $ | 0.47 |
| $ | 0.47 |
| $ | 0.46 |
|
| (Loss) earnings per common share diluted | $ | (8.06 | ) | $ | 0.47 |
| $ | 0.47 |
| $ | 0.45 |
|
| | | | | |
| | 2017 |
| Gross premiums written | $ | 54,213 |
| $ | 65,898 |
| $ | 57,354 |
| $ | 98,496 |
|
| Net premiums earned | 57,431 |
| 55,865 |
| 54,049 |
| 48,426 |
|
| Net (loss) income attributable to common shareholders | (54,297 | ) | 5,125 |
| 5,510 |
| 4,852 |
|
| (Loss) earnings per common share basic | $ | (4.48 | ) | $ | 0.43 |
| $ | 0.46 |
| $ | 0.40 |
|
| (Loss) earnings per common share diluted | $ | (4.48 | ) | $ | 0.42 |
| $ | 0.45 |
| $ | 0.40 |
|
18. Notes Payable
On April 26, 2017, Atlas issued $25 million of five-year 6.625% senior unsecured notes and received net proceeds of approximately $23.9 million after deducting underwriting discounts and commissions and other estimated offering expenses. Interest on the senior unsecured notes is payable quarterly on each January 26, April 26, July 26 and October 26. Atlas may, at its option, beginning with the interest payment date of April 26, 2020, and on any scheduled interest payment date thereafter, redeem the senior unsecured notes, in whole or in part, at a redemption price equal to 100% of the principal amount plus accrued and unpaid interest to, but excluding, the date of redemption. The senior unsecured notes will rank senior in right of payment to any of Atlas’ existing and future indebtedness that is by its terms expressly subordinated or junior in right of payment to the senior unsecured notes. The senior unsecured notes will rank equally in right of payment to all of Atlas’ existing and future senior indebtedness, but will be effectively subordinated to any secured indebtedness to the extent of the value of the collateral securing such secured indebtedness. In addition, the senior unsecured notes will be structurally subordinated to the indebtedness and other obligations of Atlas’ subsidiaries.
The senior unsecured notes were issued under an indenture and supplemental indenture that contain covenants that, among other things, limit: (i) the ability of Atlas to merge or consolidate, or lease, sell, assign or transfer all or substantially all of its assets; (ii) the ability of Atlas to sell or otherwise dispose of the equity securities of certain of its subsidiaries; (iii) the ability of certain of Atlas’ subsidiaries to issue equity securities; (iv) the ability of Atlas to permit certain of its subsidiaries to merge or consolidate, or lease, sell, assign or transfer all or substantially all of their respective assets; and (v) the ability of Atlas and its subsidiaries to incur debt secured by equity securities of certain of its subsidiaries.
On March 9, 2015, American Insurance Acquisition, Inc. (“American Acquisition”), a wholly-owned direct subsidiary of Atlas,November 10, 2016, AIA entered into a loanten-year 5.0% fixed rate mortgage agreement with the Insurance Subsidiaries totaling $10.7 million with principal and security agreement (“Loan Agreement”) for a $35.0 million loan facility with Fifth Third Bank. On May 7, 2016, American Acquisition entered into a Modificationinterest payments due monthly. The mortgage is secured by the Company’s headquarters and was previously eliminated in consolidation. The amount payable as of Loan Documents with Fifth Third Bank to amend its Loan Agreement. The Loan Agreement, as modified, included a $30.0 million line of credit (“Draw Amount”), which could have been drawn in increments at any time until December 31, 2016. The $30.0 million line of credit had a five year term and bore interest at one-month LIBOR plus 4.5%. The Loan Agreement also included a $5.0 million revolving line of credit (“Revolver”), which could have been drawn upon until May 7, 2018, that bore interest at one month LIBOR plus 2.75%.
The Loan Agreement also provided for the issuance of letters of credit in an amount up to $2.0 million outstanding at any time. In addition, there was a non-utilization fee for each of the $30.0 million line of credit and $5.0 million revolving line of credit equal to 0.50% per annum of an amount equal to $30.0 million and $5.0 million, respectively, less the daily average of the aggregate principal amount outstanding under such credit lines (plus, in the case of the $30.0 million line of credit, the aggregate amount of the letter of credit obligations outstanding).
At December 31, 2016, American Acquisition was in compliance with the covenants of the Loan Agreement. In February 2017, American Acquisition filed its statutorily required financial statements for 2016, which are used to determine on-going compliance with the covenants contained in the Loan Agreement. As a result of the reserve strengthening and its effect on American Acquisition’s 2016 financial statements, American Acquisition was not in compliance with the Loan Agreements’ EBITDA Ratio covenant as of March 13, 2017. American Acquisition had a thirty day period to cure this covenant non-compliance, and the Company and American Acquisition agreed with the lender to a modification2019 is due to the loan covenants to more specifically address the effects of reserve modifications and/or obtaining a waiver with respect to the existing non-compliance.
The Loan Agreement was terminated in April 2017. Atlas used a portion of the net proceeds of the senior unsecured notes offering, together with cash on hand, for the repayment of all outstanding balances under the Draw Amount and Revolver, $15.5 million and $3.9 million, respectively.ASI Pool Companies.
Interest expense on notes payable was $2.0 million and $1.9 million $1.8 millionin 2019 and $1.0 million in 2018, 2017 and 2016, respectively.
| | Notes Payable Outstanding | | ($ in ‘000s) | As of December 31, | As of December 31, |
| | 2018 | 2017 | 2019 | 2018 |
| 6.625% Senior Unsecured Notes due April 26, 2022 | $ | 25,000 |
| $ | 25,000 |
| $ | 25,000 |
| $ | 25,000 |
|
| 5.0% Mortgage due November 10, 2026 | | 7,621 |
| — |
|
| Total outstanding borrowings | | 32,621 |
| 25,000 |
|
| Unamortized issuance costs | (745 | ) | (969 | ) | (521 | ) | (745 | ) |
| Total notes payable | $ | 24,255 |
| $ | 24,031 |
| $ | 32,100 |
| $ | 24,255 |
|
| | | |
19. Statutory InformationDeconsolidation and Discontinued Operations
Atlas’ Insurance Subsidiaries are requiredDeconsolidation
While AFH indirectly owns the stock of the ASI Pool Companies, as of October 1, 2019 AFH management no longer has statutory responsibility or authority over the financial activities of the ASI Pool Companies, and, therefore, the Company has deconsolidated the ASI Pool Companies on that date. This resulted in the ASI Pool Companies being classified as variable interest entities for which the Company is no longer the primary beneficiary. The Company recognized a loss of $4.4 million relating to report theirthe deconsolidation during the year ended December 31, 2019, which was the remaining equity of the ASI Pool Companies as of the deconsolidation date. The financial condition and results of the ASI Pool Companies are included in the consolidated statements of operations in accordance with statutory accounting principles prescribed or permitted by state insurance laws and regulations andthrough the National AssociationOctober 1, 2019 disposal date. There was not re-measurement of Insurance Commissioners (“NAIC”). State insurance laws and regulations also prescribeany retained interest since no future value was assigned to the form and content of statutory financial statements, require the performance of periodic financial examinations of insurers, establish standards for the types and amounts of investments insurers may hold and require minimum capital and surplus levels. The Insurance Subsidiaries must each maintaindeconsolidated entities as a minimum statutory capital and surplus of $1.5 million, $2.4 million and $3.5 million under the provisionsresult of the Illinois Insurance Code,rehabilitation. Management will continue supporting the Missouri Insurance Code andadministrative activities of the New York Insurance Code, respectively. ASI Pool Companies as required by the OSD, however, will have no control over the financial activities of these entities.
As part of the deconsolidation, notes receivable from the ASI Pool companies with an outstanding principal balance of $15.5 million are now presented on the Consolidated Statements of Financial Position as of December 31, 2018, 2017 and 2016,2019. On May 1, 2015, AIAI entered into subordinated surplus debentures (“Surplus Notes”) with the ASI Pool Companies that had a maturity date of April 30, 2020 carrying a variable interest equal to the corporate base rate as reported by the largest bank (measured in assets) with its head office located in Chicago, Illinois, in effect on the first business day of each month for the term of our Insurance Subsidiaries individuallythe Surplus Notes plus two percent per annum on the unpaid principal balance with a maximum variable interest rate for any month not to exceed the minimum required statutory capital and surplus requirements. See “Risk Factors - Risks Related to 2019 Developments - Regulatory Developments” for certain developments with respect to the Insurance Subsidiaries subsequent to December 31, 2018.
|
| | | | | | | | | |
| Statutory Net Loss and Surplus of Atlas’ Insurance Subsidiaries | |
| ($ in ‘000s) | Year Ended December 31, |
| | 2018 | 2017 | 2016 |
| Statutory net loss | $ | 49,648 |
| $ | 35,199 |
| $ | 3,585 |
|
| | | | |
| Combined statutory capital and surplus | $ | 14,377 |
| $ | 87,813 |
| $ | 113,943 |
|
| | | | |
Additional requirements include risk-based capital (“RBC”) rules, thresholds intended to enable state insurance regulators to assess the level of risk inherent in an insurance company’s business and consider items such as asset risk, credit risk, underwriting risk and other business risks relevant to its operations. The NAIC RBC formula generates the regulatory minimum amount of capital that a company is required to maintain to avoid regulatory action. There are four levels of action that a company can trigger under the formula: company action, regulatory action, authorized control and mandatory control levels. Each RBC level requires some particular action on the part of the regulator, the company, or both. For example, an insurer that breaches the Company Action Level must produce a plan to restore its RBC levels. As of December 31, 2018, the total adjusted capital of three of our Insurance Subsidiaries exceeded the minimum levels required under RBC requirements, with one subsidiary breaching the Company Action Level. We are working with the appropriate regulators to restore its RBC levels. We do not expect that this restoration will impede our ability to execute on strategic plans. See “Risk Factors - Risks Related to 2019 Developments - Regulatory Developments” for certain developments with respect to the Insurance Subsidiaries subsequent to December 31, 2018.
As a holding company, Atlas could derive cash from its Insurance Subsidiaries generally in the form of dividends to meet its obligations, which will primarily consist of operating expense payments and debt payments. Atlas’ Insurance Subsidiaries fund their obligations primarily through premium and investment income and maturities in the securities portfolio. The Insurance Subsidiaries require regulatory approvalinitial rate for the returnSurplus Notes by more than ten percent per annum. These Surplus Notes are subject to various terms and conditions as set forth by the Illinois Department of capital, loans or advancesInsurance and in certain circumstances,the Missouri Department of Insurance and require prior towritten approvals for the payment of dividends. Ininterest and/or the event that dividends availablereduction in principal. These Surplus Notes could be used at some point to the holding company are inadequateoffset future amounts payable to cover its operating expenses and debt payments, the holding company would need to raise capital, sell assets or incur future debt.
Dividends may only be paid from statutory unassigned surplus, and payments may not be made if such surplus is less than a stipulated amount. The dividend restriction for the ASI Pool Subsidiaries is the greater of statutory net income or 10% of total statutory capital and surplus. The dividend restriction for Global Liberty is the lower of 10% of statutory surplus or 100% of adjusted net investment income for the preceding twelve months. Atlas' Insurance Subsidiaries did not declare or pay any dividends to Atlas during 2018 or 2017.Companies.
20. Subsequent EventsDiscontinued Operations
Throughout 2019, the Company hashad been exploring strategic alternatives including but not limited to, further strengthening its processes, reviewing its capital allocation and opportunities, a potential sale of the Company or certain assets and balance sheet strengthening options with the goal of facilitating shareholder value generation. Atlas concluded that the utilizationAs part of its wholly owned MGA operation to work witha strategic external insurance and reinsurance partners will enableshift, the Company has classified Global Liberty as discontinued operations and the results of their operations are reported separately for all periods presented.
Summary financial information for Global Liberty included in loss from discontinued operations, net of tax in the consolidated statements of operations for the years ended December 31, 2019 and 2018 is presented below:
|
| | | | | | |
| Loss From Discontinued Operations |
| ($ in ‘000s) | Year ended December 31, |
| | 2019 | 2018 |
| Net premiums earned | $ | 27,862 |
| $ | 37,533 |
|
| Net investment income | 437 |
| 854 |
|
| Net realized losses | (9 | ) | (119 | ) |
| Total revenue | 28,290 |
| 38,268 |
|
| Net claims incurred | 25,833 |
| 38,405 |
|
| Acquisition costs | 5,467 |
| 5,608 |
|
| Other underwriting expenses | 4,504 |
| 4,324 |
|
| Interest (income) | (87 | ) | — |
|
| Total expenses | 35,717 |
| 48,337 |
|
| Loss from operations before income taxes | (7,427 | ) | (10,069 | ) |
| Income tax expense | — |
| 1,317 |
|
| Net loss | $ | (7,427 | ) | $ | (11,386 | ) |
| | | |
| Statements of Comprehensive Loss |
| Net loss | $ | (7,427 | ) | $ | (11,386 | ) |
| | | |
| Other comprehensive income (loss): | | |
| Changes in net unrealized investment gains (losses) | 634 |
| (633 | ) |
| Reclassification to net income (loss) | 547 |
| (55 | ) |
| Other comprehensive income (loss) | 1,181 |
| (688 | ) |
| Total comprehensive loss | $ | (6,246 | ) | $ | (12,074 | ) |
| | | |
The assets and liabilities of Global Liberty are presented as held for sale in the consolidated statements of financial position at December 31, 2019 and 2018 is presented below:
|
| | | | | | |
| ($ in ‘000s) | December 31, |
| | 2019 | 2018 |
| Assets | | |
| Investments | | |
| Fixed income securities, available for sale, at fair value (amortized cost $14,016 and $34,358) | $ | 14,239 |
| $ | 33,401 |
|
| Short-term investments, at cost | 491 |
| 252 |
|
| Other investments | 1,315 |
| 1,321 |
|
| Total investments | 16,045 |
| 34,974 |
|
| Cash and cash equivalents | 7,712 |
| 748 |
|
| Accrued investment income | 78 |
| 201 |
|
| Reinsurance recoverables on amounts paid | 2,227 |
| 2,128 |
|
| Reinsurance recoverables on amounts unpaid | 18,339 |
| 13,507 |
|
| Prepaid reinsurance premiums | 3,765 |
| 5,747 |
|
| Deferred policy acquisition costs | 534 |
| 1,391 |
|
| Property and equipment, net | 1,741 |
| 1,497 |
|
| Other assets | 861 |
| 4,886 |
|
| Total assets | $ | 51,302 |
| $ | 65,079 |
|
| | | |
| Liabilities | | |
| Claims liabilities | $ | 46,771 |
| $ | 47,009 |
|
| Unearned premium reserves | 12,423 |
| 22,579 |
|
| Due to reinsurers | 1,019 |
| 2,354 |
|
| Other liabilities and accrued expenses | 2,554 |
| 1,427 |
|
| Total liabilities | $ | 62,767 |
| $ | 73,369 |
|
| | | |
20. Subsequent Events
As previously disclosed, the Company was unable to leveragetimely file this Annual Report on Form 10-K for the fiscal year ended December 31, 2019 and its focus, experienceQuarterly Reports on Form 10-Q for the periods ended March 31, 2020, June 30, 2020, and infrastructureSeptember 30, 2020 due to create value for stakeholders. A definitive agreement was executeddelays in the year end audit process. As a result, the Company received delinquency notices from Nasdaq related to these filings as well as other matters. On August 31, 2020, the Company filed a Current Report on Form 8-K advising that Nasdaq would suspend trading in the Company’s securities effective June 10, 2019 between Atlas and American Financial Group, Inc. (NYSE: AFG), under which Atlas will act as an underwriting manager for AFG’s National Interstate (“NATL”) subsidiary and transition new and renewal paratransitat the open of business to NATL paper for this bookon September 2, 2020. Nasdaq filed a Form 25 Notification of business. The Company is working on additional arrangementsDelisting with the objectiveSEC on October 27, 2020 notifying the SEC of establishing MGA relationships inNasdaq’s determination to remove the Company’s common shares from listing on Nasdaq under Section 12(b) of the Exchange Act. The formal delisting of the Company’s common shares from Nasdaq became effective on November 6, 2020, ten days after the Form 25 was filed. In connection with the suspension of trading on The Nasdaq Capital Market, the Company’s other lines of business as well. The Company agreed that should it choosecommon shares began to sell its MGA operations, 49%trade on the OTC Markets system effective with the open of the proceedsmarkets on September 2, 2020.
On May 1, 2020, American Acquisition entered into a Paycheck Protection Program Promissory Note (the "PPP Note") with respect to a loan of $4,600,500 (the "PPP Loan") from any future sale of AGMI would be providedFifth Third Bank, National Association. The PPP Loan was obtained pursuant to the ASI Pool Companies to facilitate the rehabilitation process. There can be no assurance that any portionPaycheck Protection Program (the "PPP") of the proceeds allocatedCoronavirus Aid, Relief, and Economic Security Act (the "CARES Act") administered by the U.S. Small Business Administration ("SBA"). The PPP Loan matures on May 1, 2022 and bears interest at a rate of 1.00% per annum. The PPP Loan is payable in 18 equal monthly payments of $257,611.48 which was to commence December 1, 2020. The PPP Loan may be prepaid at any time prior to maturity with no prepayment penalties. American Acquisition has applied for loan forgiveness pursuant to the ASI Pool Companies would be available for distribution to the Company.
During 2019, the Illinois Department of Insurance (the “Department”) placed all threeterms of the ASI Pool Companies (after Gateway was redomesticated in Illinois) into rehabilitation withPPP as certain of the criteria have been met and is awaiting the results of the forgiveness decision.
On May 8, 2020, American Acquisition and the Director (as defined below) as statutory liquidator of the Department as the statutory rehabilitator. While in rehabilitation, the operations of such insurance subsidiaries will be overseen by the statutory rehabilitator although Atlas continues to maintain its legal ownership of theGateway signed a stock of the ASI Pool Companies. Management’s overriding strategic plan continues to include a transition of business from these insurance companies to alternative markets within a reasonable period of time utilizing the existing platform of the MGA to work with strategic external insurance and reinsurance partners.
Effective August 15, 2019, no new business was written by the ASI Pool Companies, and only New York area new business was written by Global Liberty, which is focusing its resources on New York area business to leverage the subsidiary’s heritage in this large and specific market. The ASI Pool Companies and Global Liberty continued to write renewal business that met their underwriting standards during 2019. Non-renewals related to ASI Pool Companies’ insurance policies began towards the end of 2019.
On January 22, 2020, the Company announced a non-binding letter of intentpurchase agreement with Buckle Corp. (“Buckle”), a technology-driven financial services company, to purchase the stock of Gateway and Gateway’s corporate charter and state licenses from its statutory rehabilitator in a collaborative transaction as an important next step in Atlas’ indirect subsidiarystrategic plan. Buckle’s core business focuses on part-time transportation network company (“TNC”) drivers and is complementary to Atlas’ focus on full-time drivers in the Livery, Paratransit, Taxi and TNC segments.
On June 10, 2020, the required court orders were entered to place Gateway in liquidation, with the Director of Insurance of the State of Illinois (the “Director”) acting as the statutory liquidator. This was necessary to facilitate the above described transaction with Buckle. The the sale of stock, charter and state licenses of Gateway to Buckle closed effective June 16, 2020. The Company and Buckle entered into an underwriting agreement whereby Gateway under Buckle’s ownership became a risk-taking partner for AGMI. The Company and Buckle also entered into a professional services agreement in furtherance of related strategic activities.
Subsequent to the Gateway transaction, Buckle proposed terms to acquire the stock, charter and state licenses of American Country and American Service. In connection therewith, a required court order was entered on August 11, 2020 to place American Country and American Service in liquidation, with the Director acting as the statutory liquidator. American Acquisition and the Director as statutory liquidator of American County and American Service signed a stock purchase agreement on November 2, 2020. The closing of this pending transaction is subject to regulatory approval and other conditions.
In July 2020, the Company announced that AGMI’s underwriting agreement with National Interstate Insurance Company (“Gateway”National Interstate”), for paratransit business was extended and expanded. Further to the extension and expansion, the Company and National Interstate executed a renewal rights agreement with respect to paratransit accounts with eight or more vehicles (“Large Paratransit Accounts”). Pursuant to this agreement, the Company and National Interstate will work together to transition the handling of Large Paratransit Accounts to NATL. The Company received $2.9 million as consideration from National Interstate as consideration for this transaction. Under the previously announced expanded agreement AGMI will manage owner operators and fleets with seven or less vehicles (“Small Paratransit Accounts”) until at least August 2021. If the Small Paratransit Account program is not extended further, NATL continues to retain the option to purchase renewal rights on this segment at the expiration of the agreement period. Under the terms of the agreements, the Company will not compete with NATL for Large Paratransit Accounts for a period of three years following the Large Paratransit Account renewal rights transaction. Other previously disclosed material terms of the agreements between the parties remains unchanged.
The Company’s numerous Current Reports on Form 8-K and its corporate charter and forty-seven (47) state insurance licenses as well as state statutory deposits, subject to regulatorypress releases since December 31, 2019 provide more detailed disclosures regarding the above events.
In light of the impact of COVID-19 and other necessary approvals, for $4.7 million plus the value of all purchased deposits, such amount to be paid to the Rehabilitator for the benefit of the rehabilitation estate of Gateway, with a tentative closing date in March of 2020. The Company anticipates that Buckle will engage the MGA and certain other subsidiaries offactors impacting near term business activity, the Company to provide services to Buckle and that Buckle will lease space at the Company’s headquarters and its Melville, NY office.
The transactionimplemented meaningful expense reduction initiatives in 2020, including reduction in employee headcount which will be subject to court approval and a bid process established by the Rehabilitator and approved by the court, and there can be no assurance that the transaction will be consummated on the terms described herein or at all.reflected in subsequent financial statements.
Item 9. Changes in and Disagreements with Accountants on Accounting and Financial Disclosure
None.
Item 9A. Controls and Procedures
Evaluation of Disclosure Controls and Procedures
We maintain disclosure controls and procedures designed to provide reasonable assurance that information required to be disclosed in our reports filed pursuant to the Securities Exchange Act of 1934, as amended (the “Exchange Act”) is recorded, processed, summarized, and reported within the time periods specified in the SEC’s rules and forms, and that such information is accumulated and communicated to our management, including our Chief Executive Officer and Chief Financial Officer, as appropriate, to allow timely decisions regarding required disclosure. A control system, no matter how well conceived and operated, can provide only reasonable, not absolute, assurance that the objectives of the control system are met.
As of December 31, 2018,2019, our Chief Executive Officer and Chief Financial Officer carried out an evaluation of the effectiveness of our disclosure controls and procedures as such term is defined in Rule 13a-15(e) under the Exchange Act, and concluded as of the end of the period covered by this report that our disclosure controls and procedures were not effective due to failure to timely file certain periodic reports during 2019 and 2020 as discussed below in connection with our internal control over financial reportingreporting.
Management’s Report on Internal Control Over Financial Reporting
Our management is responsible for establishing and maintaining adequate internal control over financial reporting, as such term is defined in Exchange Act Rule 13a-15(f).
The Company’s internal control over financial reporting is a process designed to provide reasonable assurance regarding the reliability of financial reporting and the preparation of financial statements for external purposes in accordance with generally accepted accounting principles. The Company’s internal control over financial reporting includes those policies and procedures that:
| |
| i. | Pertain to the maintenance of records that, in reasonable detail, accurately and fairly reflect the transactions and dispositions of the assets of the company; |
| |
| ii. | Provide reasonable assurance that transactions are recorded as necessary to permit preparation of financial statements in accordance with generally accepted accounting principles, and that receipts and expenditures of the Company are in accordance with authorizations of management and directors of the Company; and |
| |
| iii. | Provide reasonable assurance regarding prevention or timely detection of unauthorized acquisition, use or disposition of the Company’s assets that could have a material effect on the financial statements. |
Because of its inherent limitations, internal control over financial reporting may not prevent or detect misstatements.
A material weakness is a deficiency, or combination of deficiencies, in internal control over financial reporting such that there is a reasonable possibility that a material misstatement of the Company’s annual or interim financial statements will not be prevented or detected on a timely basis.
Under the supervision of our management, including our Chief Executive Officer and Chief Financial Officer, we conducted an evaluation of the effectiveness of our internal control over financial reporting using the criteria established in Internal Control - Integrated Framework (2013) issued by the Committee of Sponsoring Organizations of the Treadway Commission (COSO). Based on our assessment of those criteria, management concluded that our internal control over financial reporting as of December 31, 20182019 was not effective due to the material weakness described below:
Timely identification of financial closing delays: Through a confluence of events involving the Company’s former auditor which we do not believe could have reasonably been anticipated, theThe Company did not timely file its Annual Report on Form 10-K containing its audited financial statements for the year ending December 31, 2018 and therefore did not have an effective internal control2019 due to the delays in place to monitor the progress of all aspectsfiling of its Annual Report on Form 10-K containing its audited financial reporting close process to timely identify delays,statements for the year ending December 31, 2018 resulting in the Company being unable to timely meet its financial reporting requirements with the SEC and Nasdaq.
The delay in the completion of the audit of the Company’s financial statements for the fiscal year ended December 31, 2018 was due to the previously disclosed disagreement with the Company’s former independent registered public accounting firm with respect to insurance reserves in certain of the Company’s insurance subsidiaries for the fiscal year ended December 31, 2018. The Company dismissed its former independent registered public accounting firm on April 29, 2019. As a result of
this disagreement and termination, the audit of the Company’s financial statements for the fiscal year ended December 31, 2018 could not be completed in such time as to remain compliant with SEC and Nasdaq reporting requirements.
Remediation Plan for Material Weakness in Internal Control over Financial Reporting
With respect to the material weakness related to timely identification of financial closing delays and the resulting failure to timely file, the Company engaged another independent registered public accounting firm to complete the audit of its December 31, 2018 financial statements. The Company has also taken steps to monitor the progress of all aspects of its financial closing process including more detailed discussions as needed with its independent registered public accounting firm regarding insurance reserve calculations.extraordinary accounting matters and related disclosures. The Company expects to file its delayed Quarterly Reports on Form 10-Q for the periods ending March 31, June 30 and September 30, 20192020 as soon as practicable.
Changes in Internal Control over Financial Reporting
There were no changes in the Company’s internal control over financial reporting identified in connection with management’s evaluation pursuant to Rules 13a-15(d) or 15d-15(d) of the Exchange Act during the quarter ended December 31, 20182019 that have materially affected, or are reasonably likely to materially affect, the Company’s internal control over financial reporting. Further, there have been no such changes since December 31, 20182019 other than the action described in Remediation Plan for Material Weaknesses in Internal Control over Financial Reporting.
The Company’s independent registered public accounting firm has audited the Company’s internal control over financial reporting as of December 31, 2018, as stated in the Report of Independent Registered Public Accounting Firm, appearing under Item 8.
Item 9B. Other Information
None.
Part III
Item 10. Directors, Executive Officers and Corporate Governance
|
| | | |
| Director | Director since | Principal Occupation | Current Committees |
| Scott D. Wollney | 2010 | Chairman, President, and Chief Executive Officer and Director of Atlas Financial Holdings, Inc. | IC |
Gordon G. Pratt | 2010 | Managing Member of Fund Management Group LLC | CC |
| Ronald E. Konezny | 2018 | Chief Executive Officer and Director of Digi International | AC, CC*, NCGC |
| Jordan M. Kupinsky | 2009 | President of Justley Capital Corporation | AC*, CC*,CC, IC, NCGC |
| Walter F. Walker | 2013 | Owner and Chief Investment Officer of Hana Road Capital LLC | AC, CC, IC*, NCG |
John T. Fitzgerald | 2013 | President, Chief Executive Officer and Director of Kingsway Financial Services Inc. | AC, CC, NGC*NCGC* |
AC = Audit Committee CC = Compensation Committee IC = Investment Committee NCGC = Nominating and Corporate Governance Committee
* Denotes committee chair.
Each nominee, other than Mr. Ronald Konezny, was previously elected at Atlas' annual meeting on May 22, 2018, for one-year terms. Mr. Konezny was elected byOn July 29, 2020, Gordon Pratt informed the Company that he would retire from the Board of Directors of the Company effective July 10, 2018. Effective January 2, 2018,August 1, 2020. Mr. Larry Swets retired fromPratt’s decision to retire was not the Atlasresult of any disagreement with the Company. Following Mr. Pratt’s retirement, Mr. Wollney was named Chairman of the Board of Directors. and Mr. Kupinsky was named Lead Director.
On February 27, 2019, Mr.September 16, 2020, John T. Fitzgerald informed Atlas that he will not stand for reelection toresigned from the Atlas Board of Directors. Mr. Fitzgerald's decision not to stand for reelection was not the result of any disagreement with the Company.
The following sets forth the name, age, and business experience during at least the past five years, indicating their principal occupation during the period, and the name and principal business of the organization by which they were employed, and qualifications of each person serving as a director of the Company as of December 31, 2018.2019.
|
| |
| SCOTT WOLLNEY |
Chairman, President, and Chief Executive Officer and Director |
| | |
| Age: | 5152 |
| |
Principal Occupation: Chairman, President and Chief Executive Officer and Director of Atlas Financial Holdings, Inc. |
Business Experience:
President and Chief Executive Officer since December 31, 2010.
President and Chief Executive Officer of Kingsway America Inc. (“KAI”), a property and casualty holding company, from July 2009 until December 31, 2010.
President and Chief Executive Officer of Lincoln General Insurance Company (a subsidiary of KAI), a property and casualty insurance company, from May 2008 to March 2009.
President of Avalon Risk Management, Inc., an insurance broker, from January 1998 to May 2008.
Qualifications:
MBA graduate of Northwestern University's Kellogg School of Management with a concentration in finance and management strategy.
Bachelor of Arts degree from the University of Illinois.
Experience building successful businesses as well as re-organizing challenged companies around a focused strategy to address legacy issues and set them on a path for future success.
Direct experience and expertise with respect to the numerous disciplines that are critical to the insurance business.
Other Board Service:
Director of 1347 Property Insurance Holdings, Inc., a property and casualty insurance holding company.
|
| |
GORDON PRATT |
Director and Chairman of the Board |
| |
Age: | 57 |
|
Principal Occupation: Managing Member of Fund Management Group LLC
|
Business Experience:
Managing Member of Fund Management Group LLC, a privately-held investment and holding company, organized in Connecticut and headquartered in Florida since 2004.
Director, President and Chief Executive Officer of 1347 Capital Corp., a NASDAQ listed special purpose acquisition company. Upon 1347 Capital Corp's merger, on July 20, 2016, 1347 Capital Corp. was renamed Limbach Holdings, Inc.
Senior Vice-President, Finance of the Willis Group, an insurance brokerage company, in New York from June 2004 to April 2006, prior to which he was an equity holder and Managing Director of Hales Capital Advisors, a private equity firm, and co-founder and Managing Partner for Distribution Partners Investment Capital L.P., a private equity fund focused on the insurance industry.
Before joining Hales, served as Senior Vice President and member of the management committee of Conning & Company, a third party investment manager, where he helped to raise and invest capital for three Conning private equity funds.
Began career in 1986 at The Chase Manhattan Bank, N.A., a financial institution, in New York.
Qualifications:
Master of Management degree from Northwestern University's Kellogg School of Management.
Bachelor of Arts degree from Cornell University.
Experience evaluating financial statements for more than 50 insurance companies and/or their holding company parents. Such evaluations include companies' uses of accounting estimates, accruals and provisions.
Experience with investing and offers his opinion to company management teams based upon his evaluations concerning financial statements, which cover a wide range of complexity and accounting issues.
Understanding of internal controls and procedures for financial reporting for insurance companies and/or insurance holding company parents from his services as a member of certain boards of directors.
Other Board Service:
Director, Chairman of the Board and member of the Compensation Committee of Limbach Holdings, Inc., a NASDAQ listed integrated building systems provider, since 2014.
Director of 1347 Property Insurance Holdings, Inc. from November 2013 to March 2017.
Chairman of the Board of 1347 Capital LLC, a private investment advisory firm from March 2014 to June 2016.
Chairman and Vice Chairman of the boards of directors of United Insurance Holdings Corp. and its predecessor company FMG Acquisition Corp., NASDAQ listed companies, from 2007 through 2012.
|
| |
RONALD KONEZNY
|
| Director |
| | |
| Age: | 52 |
| |
Principal Occupation: Chief Executive Officer and Director of Digi International |
Business Experience:
Chief Executive Officer and Director of Digi International, a leading provider of solutions to industrial and commercial clients worldwide, since December 17, 2014.
General Manager of Worldwide Transportation and Logistics Division at Trimble Navigation Limited and PeopleNet Communications Corporation, both transportation and logistics technology companies, from August 2011 to September 2013.
Founded PeopleNet Communications Corporation in 1995. Served as Chief Executive Officer since July 23, 2007. Served as Chief Operating Officer and Chief Financial Officer from 2001 to 2007 and Chief Technology Officer from 1996 to 2007.
Qualifications:
Bachelor of Arts degree in Economics from Northwestern University and a Phi Eta Sigma nominee.
Possesses extensive business, operating and executive expertise.
Experience improving companies' profitability to sustainable double-digit levels and expanding recurring revenue business.
Direct experience with multiple successful acquisitions.
Other Board Service:
Director of Sentera since 2020
President, CEO and Director of Digi International Inc. since December 17, 2014.
Former Director of I.D. Systems, Inc. from June 2014 through June 2018.
Served on the Boards of Directors of the National Private Truck Council Institute and the Truckload Carriers Association.
|
| |
JORDAN KUPINSKY
|
| Director |
| | |
| Age: | 4647 |
| |
Principal Occupation: Senior Vice President & Managing Director of JustleyWindsor Private Capital Corporation |
Business Experience:
Senior Vice President and Managing Director at Windsor Private Capital, a private merchant banking firm, since July 2019.
President of Justley Capital Corporation, a private investment and advisory firm, since September 2016.2008.
Partner with JJR Private Capital, an independent private capital and diversified merchant bank, from April 2008 to September 2016.
Managing Director with Windsor Private Capital, a private merchant banking firm, from January 2011 to July 2014.
Vice President at Greenhill & Co., an independent global investment banking firm, listed on the NYSE, focused on mergers and acquisitions and financial restructuring from March 2006 to May 2008.
Vice President of Corporate Development and General Counsel at Minacs Worldwide Inc., a publicly traded company on the TSX, from July 2002 to February 2005.
Began career practicing corporate securities law at Torys LLP in Toronto from 1997 to 1999.
An investment banking associate at Houlihan Lokey Howard & Zukin from 1999 to 2002.
Qualifications:
Joint MBA and JD degree from the Schulich School of Business and Osgoode Hall Law School at York University.
Experience in financial statement review with both public and private companies.
Direct experience includes securities law, financial analysis and corporate governance.
Other Board Service:
Former Chairman of Concordia International Corp. from 2016 through 2019 and former Director from 2013 through May 2018.
Director of both private and public companies, including having served as a director of Perk Inc. from November 2014 to January 2017, Xceed Mortgage Corporation from May 2012 to July 2013 when the sale of Xceed to MCAN Mortgage Corporation was completed.
Director of the following TSXV publicly traded entities: WB II Acquisition Corporation, a capital pool company, from February 2012 to July 2013, WB III Acquisition Corporation, a capital pool company, from June 2013 to December 2014, Ferrum Americas, an iron ore exploration company, from June 2010 to July 2011, and J5 Acquisition Corporation, a capital pool company, from July 2009 to July 2011.
|
| |
| WALTER WALKER |
| Director |
| | |
| Age: | 6566 |
| |
Principal Occupation: Owner and Chief Investment Officer of Hana Road Capital LLC |
Business Experience:
Formed Hana Road Capital LLC, an equity investment fund, where he remains as its owner and Chief Investment Officer since late 2007.
Chief Executive Officer and President of the Seattle Sonics and Storm from 2001 until their sale in 2006, as well as minority owner. During his executive tenure, the Sonics had the fifth best winning percentage in the NBA and the Storm won the WNBA title in 2004.
President and General Manager of the Seattle SuperSonics in September 1994 to 2001. During his seven years as General Manager, the Sonics had the third best winning percentage (65.1%) in the NBA and won the Western Conference Championship in 1996.
Formed Walker Capital, Inc., a San Francisco based money management firm, in April 1994.
Vice President of Goldman, Sachs & Co.’s Private Client Services group from 1987 through 1994.
Qualifications:
Chartered Financial Analyst (1992).
Masters of Business Administration from Stanford University Graduate School of Business.
Named as one of six recipients of the NCAA Silver Anniversary Scholar-Athlete Awards in 2001 and was a member of the NCAA Honors Committee from 2016 through 2019.
Bachelor of Arts degree in Psychology from the University of Virginia as an Academic All-American.
Other Board Service:
Served on the Board of Visitors at the University of Virginia from 1997 to 2001.
Member of the Advisory Council of Stone Arch Capital, a Minneapolis based private equity firm, since 2005.
Independent trustee and Chair of the Audit Committee at Smead Capital Management, a Seattle based mutual fund, since 2015.
Previously served on the boards of multiple public companies and non-profits.
|
| |
JOHN T. FITZGERALD |
Director |
| |
Age: | 48 |
|
Principal Occupation: President & Chief Executive Officer of Kingsway Financial Services, Inc.
|
Business Experience:
Currently President and Chief Executive Officer of Kingsway Financial Services, Inc. (“Kingsway”) since 2018 and Managing Member of Argo Management Group, LLC (“Argo”) since 2002.
Co-founded Argo, a private equity investment partnership, in 2002 which was subsequently sold to Kingsway in 2016.
Former managing director of Adirondack Capital, LLC, a financial futures and derivatives trading firm, from January 1998 through June 2001.
Qualifications:
Masters of Business Administration from Northwestern University’s Kellogg School of Management with concentrations in Finance, Accounting, and Management Strategy.
Bachelor of Science degree in Finance from DePaul University with highest honor, Beta Gamma Sigma.
Extensive transactional and operating experience in extended warranty, insurance, consumer products manufacturing, marketing and distribution operations.
Seat-owner on the Chicago Board of Trade from 1998 through 2004.
Other Board Service:
Director of Kingsway since April 2016.
Director of Itasca Capital Ltd., an advisory and investment firm, from June 2016 through December 2019.
Executive Officers
Biographical information for each of the executive officers of Atlas and its insurance subsidiaries is set out below, except for Scott Wollney, President & Chief Executive Officer, whose biographical information is contained above. None of the below officers serve as directors for any other reporting issuers.
|
| |
| PAUL ROMANO |
| Vice President, Chief Financial Officer and Principal Accounting Officer |
| | |
| Age: | 5859 |
| |
Date First Appointed as an Officer: December 31, 2010 |
Business Experience:
Vice President and Chief Financial Officer since December 31, 2010.
Vice President and Treasurer of KAI from March 2010 to December 2010.
Vice President, Data Management of Lincoln General Insurance Company, a property and casualty insurance company, from October 2008 to March 2009.
Various Vice President and Director positions with American Country Insurance Company, a property and casualty insurance company, which became a subsidiary of the Corporation on December 31, 2010, and its affiliates from 2002 to 2008.
Qualifications:
Certified Public Accountant designation in the State of Illinois.
Master of Business Administration degree from the Northwestern University's Kellogg School of Management (1996).
Bachelor of Science, Accounting, from the University of Illinois (1984).
|
| |
| JOSEPH SHUGRUE |
| Chief Operating Officer |
| | |
| Age: | 5657 |
| |
Date First Appointed as an Officer: December 31, 2010 |
Business Experience:
Vice President, Claims from December 31, 2010 through December 17, 2019.
Various senior management positions at KAI and American Service Insurance Company, which became a subsidiary of the Company on December 31, 2010, from March 1, 2004 to December 31, 2010.
Various positions with other specialized insurance businesses beginning in October 1986.
|
| |
| BRUCE GILES |
| Vice President, Underwriting |
| | |
| Age: | 6061 |
| |
Date First Appointed as an Officer: December 31, 2010 |
Business Experience:
Vice President, Underwriting since December 31, 2010.
Assistant Vice President of Commercial Underwriting for KAI, with whom he held various positions from December 2003 to June 2010.
Various positions with Allstate Insurance Group, CIGNA and other insurance companies from 1981 to 2003.
|
| |
LESLIE DIMAGGIO (1)
|
Vice President, Operations and Information Technology |
| |
Age: | 51 |
|
Date First Appointed as an Officer: December 31, 2010
|
| |
1
| On December 16, 2019, it was announced that Ms. DiMaggio notified the Company that she would resign from the Company effective December 27, 2019. |
Business Experience:
Vice President, Operations and IT since December 31, 2010.
Vice President, Information Technology for KAI from November 2008 to June 2010.
President, Chief Executive Officer and Chief Operations Officer of Southern United Fire Insurance Company, a property and casualty insurance company, from April 2007 to November 2008.
Various executive positions at KAI from 2000 to 2008
Various positions with other specialized insurance businesses.
Code of Business Conduct and Ethics
We have a Code of Business Conduct and Ethics that applies to all of our employees, officers and directors. The Code of Business Conduct and Ethics is designed to promote honest and ethical conduct, full, fair, accurate, timely and understandable disclosure of financial information in our public filings and communications, and compliance with applicable laws, rules and regulations. The Code of Business Conduct and Ethics is posted on our website at www.atlas-fin.com under “Investor Relations-Corporate Governance.” A written copy is available to shareholders, free of charge, upon written request to us, to the attention of Scott Wollney.
Audit Committee
During 2018,2019, the Audit Committee was comprised of Jordan Kupinsky (Chairman), Walter Walker and John Fitzgerald. Each member of the Audit Committee is independent under NASDAQ Rule 5605(a)(2) and Rule 10A-3 of the Exchange Act and meets the financial literacy requirements of the NASDAQ rules.
The Board has determined that Mr. Kupinsky, Mr. Walker and Mr. Fitzgerald, because of their accounting and financial management expertise discussed above are all considered “audit committee financial experts” as that term is defined under the Exchange Act and, accordingly, that at least one audit committee financial expert is serving on the Company’s Audit Committee.
Item 11. Executive Compensation
Director Compensation
During the fiscal year ended December 31, 2018,2019, the Company paid cash compensation for services rendered to the non-employee directors of our Board, and we reimbursed the out-of-pocket expenses of our directors incurred in connection with attendance at or participation in meetings of the Board. With respect to non-employee directors, a combination of equity and cash is provided to reflect a focus on both (i) long-term performance and shareholder value and (ii) compensation for the Board’s continuing oversight and corporate governance role.
Each non-employee, independent director receives an annual cash retainer of $55,000, plus a stipend for each committee the director is a member of. The Chairman of the Board receives an additional $20,000 retainer. The chair of the Audit Committee receives an additional $10,000$15,000 retainer for his service as a committee chair. The chairs of the Compensation and Investment Committee each receive an additional $7,000 for their service as a committee chair.
The following table shows the compensation earned by directors for the most recently completed fiscal year. Named Executive Officers who also act as our directors do not receive any additional compensation for services rendered in such capacity, other than as paid by us to such officers in their capacity as officers and other than the stock awards granted to Mr. Wollney as part of the Director Stock Matching Program. See “Summary Compensation Table” under the heading Executive Compensation for information regarding the compensation paid to our Named Executive Officers.
| | | Name | Fees Earned or Paid in Cash | Stock Awards 6 | Total Compensation | Fees Earned or Paid in Cash | Stock Awards 5 | Total Compensation |
Gordon Pratt 1 | $98,500 | $130,010 | $228,510 | $78,500 | $10,274 | $88,774 |
Jordan Kupinsky 2 | $90,500 | $130,010 | $220,510 | $80,500 | $10,274 | $90,774 |
John T. Fitzgerald 2 | $69,000 | $— | $69,000 | $55,000 | $10,274 | $65,274 |
Walter Walker 3 | $65,500 | $— | $65,500 | |
Ronald Konezny 4 | $26,005 | $— | $26,005 | |
Scott Wollney 5 | $— | $130,010 | |
Walter Walker 2 | | $65,500 | $10,274 | $75,774 |
Ronald Konezny 3 | | $55,000 | $6,165 | $61,165 |
Scott Wollney 4 | | $— |
| |
1 | As of December 31, 2018,2019, Mr. Pratt had an aggregate of 11,2182,540 stock awards outstanding, subject to vesting per the Director Stock Matching Program and Equity Incentive Plan. Additionally, Mr. Pratt has 27,195 option awards outstanding. |
| |
2 | As of December 31, 2018,2019, each of Mr. Kupinsky, Mr. Fitzgerald and Mr. FitzgeraldWalker had an aggregate of 11,2182,540 stock awards outstanding, subject to vesting per the Director Stock Matching Program and Equity Incentive Plan. Mr. Kupinksy,Mr. Fitzgerald, and Mr. FitzgeraldWalker had no option awards outstanding. |
| |
3 | As of December 31, 2018, Mr. Walker had an aggregate of 3,810 stock awards outstanding, subject to vesting per the Equity Incentive Plan. Mr. Walker had no option awards outstanding. |
| |
4
| As of December 31, 2018,2019, Mr. Konezny had an aggregate of 2,2841,522 stock awards outstanding, subject to vesting per the Equity Incentive Plan. Mr. Konezny had no option awards outstanding. |
| |
54
| As of December 31, 2018,2019, Mr. Wollney had an aggregate of 7,408 stock awards outstanding, subject to vesting per the Director Stock Matching Program. Mr. Wollney also had an aggregate of 154,500 option awards outstanding as of December 31, 20182019 and 80,000 restricted ordinary share awards received solely for his services as an executive officer and not for his services as a director, as disclosed in the section “Outstanding Equity Awards at 20182019 Fiscal Year End”. |
| |
65
| Stock Awards consist of stock vested as part of the Director Stock Matching Program. The shares and units were issued on February 28, 2014 to each Director provided that they purchased at least $100,000 during a defined time period in 2013. The shares and units vest 20% on each anniversary of the grant date, provided that (i) the director has maintained ownership of the up to $100,000 investment made to qualify for the award; (ii) his service is continuous from the Grant Date through the applicable date upon which vesting is scheduled to occur; and (iii) he has, as of the date upon which vesting is scheduled to occur, not indicated that he will not be submitting his name for re-election as a director of the Company. See ‘Part II, Item 8, Note 12, Share-Based Compensation’ in the Notes to Consolidated Financial Statements for further discussion regarding the valuation of stock awards. |
Executive Compensation
Compensation for executive officers is reviewed annually by the Compensation Committee. Current compensation was set based on the following criteria: (i) our size and scale; (ii) nature of our strategic objectives; and (iii) each executive’s role and responsibility. Industry data (such as surveys compiled by Towers Watson and the Property and Casualty Insurers Association for the P&C insurance industry), past paid consultant reports, as well as the potential for incentive compensation are taken into consideration in the regular evaluation of base salary.
Employment agreements were executed with our executives in 2011 with an initial effective term of January 1, 2011 through December 31, 2012 and subsequent annual terms commencing January 1, 2013. These agreements provide for compensation based on a combination of base salary and incentive compensation. Incentive compensation in subsequent years will be based on a combination of financial results and the achievement of strategic objectives, as determined by the Compensation Committee of the Board. No incentive compensation was earned during 20182019 or 2017.2018. Final determination of incentive compensation is subject to approval by the Board. Return on equity is a primary metric utilized in evaluating such results.
Employment Agreements with Named Executive Officers
Employment agreements were executed in 2011 with our Named Executive Officers with an initial effective term of January 1, 2011 through December 31, 2012 and subsequent annual terms commencing January 1, 2013(1). The key terms of such employment agreements include:
| |
| (a) | employment being “at-will” and, subject to the severance and post-termination obligations described below, the employment agreement being terminable by either party at any time; |
| |
| (b) | an annual base salary as set out in the table under the “Summary Compensation Table” section; |
| |
| (c) | the executive being entitled to participate in such employee benefit plans as we shall approve, including retirement plans, paid vacation and sick days/paid time off, disability plans, our Stock Option Plan, our Equity Incentive Plan, or such other plans as may be offered from time to time; and |
| |
| (d) | severance payments and post-termination obligations as further described below under “Termination and Change of Control Benefits” section. |
| |
1(1) | As previously disclosed, on October 7, 2019, new employmentAtlas Financial Holdings, Inc. (the “Company”) and its wholly-owned subsidiary Anchor Group Management, Inc. entered into agreements were entered into.regarding a newly adopted near term incentive program with certain senior executives of the Company, including each of Scott Wollney, Paul Romano and Joseph Shugrue, the Company’s Chief Executive Officer, Chief Financial Officer and Vice President, Chief Operating Officer, respectively (each such individual, an “Executive,” and each such agreement, an “Agreement”). Pursuant to the terms of the Agreements, each Executive is entitled to receive, under certain conditions, (i) a cash retention bonus equal to thirty percent (30%) of such Executive’s current base salary (which has not increased since 2017)(a “Retention Amount”), and (ii) an Incentive Amount of up to seventy percent (70%) of such Executive’s current base salary plus a set number of Company common shares (an “Incentive Amount”). |
The Retention Amount will be paid in the first payroll period following December 31, 2020, provided the Executive remains employed by the Company or its subsidiaries through such date. In addition, to the extent that an Executive is terminated for any reason other than “for cause” on or before June 30, 2021 and is entitled to any severance amount under any then-existing Company policy, any Retention Amount previously paid will be deducted from any severance payment due.
The Incentive Amount will be paid incrementally (in proportionate amounts of cash and shares) only upon the competition of certain milestones within the eighteen (18) month period from the date of the Agreements; provided, however, that not more than one-sixth (1/6th) of the Incentive Amount will be paid in any quarter, with the first available evaluation period being in the fourth quarter of 2019. The milestones are the same for each Agreement and relate to the (i) transition of gross written paratransit premium pursuant to a previously announced agreement with American Financial Group ("AFG") and their subsidiary National Interstate Insurance Company (“NATL”), (ii) placement of gross written non-paratransit premium with alternative markets, (iii) progress with respect to the rehabilitation plan for the ASI Pool Companies (defined below) as represented by regulatory approval of certain expense sharing arrangements and related payments between the Company and its subsidiaries and (iv) sale or disposition of Company assets, all as further described in the Agreements.
Compensation Committee
The Compensation Committee was comprised of Jordan Kupinsky (Chairman), Gordon Pratt and John Fitzgerald. Each member of the Compensation Committee is independent. We are currently in compliance with NASDAQ Rule 5605(d)(2)(A), which requires a compensation committee be comprised of at least two members, each of whom must be an independent director. The Compensation Committee met 34 times during the fiscal year ended December 31, 2018.2019.
The Compensation Committee oversees our remuneration policies and practices. The principal responsibilities of the Compensation Committee include: (i) periodically reviewing and advising the Board concerning the Company’s overall compensation philosophy, policies and plans; (ii) reviewing and making recommendations to the Board regarding all compensation of the Company’s chief executive officer and all other executive officers and director compensation; and (iii) administering the Company’s incentive compensation plans and approving grants of options and other equity awards to all executive officers and directors under such plans.
The Compensation Committee reviewed executive compensation with management in the course of the 20192020 budgeting process. As set forth in the Compensation Committee's charter, the Compensation Committee may delegate the day-to-day administration of the Company's equity compensation plans to one or more officers and employees of the Company or an affiliate thereof. Authority was extended to management within the approved budget for compensation. Mr. Wollney, in consultation with the Compensation Committee, set the executive compensation for the named executive officers other than Mr. Wollney.
During the year ended December 31, 2018, the Compensation Committee and the Board engaged Meridian Compensation Partners, LLC (“Meridian”) for the purposes of analyzing director compensation. Meridian was tasked to compare the relative ranking among the Company and 10 peer companies based on the most recently available public data as of October 1, 2018 and also considered broader compensation data from the NACD’s 2017-2018 Director Compensation Report. Total compensation amounts and structure for the director positions were evaluated, including the following publicly available components of pay: director fees, chairman stipends, committee member fees, equity compensation and long-term incentives. As part of this analysis, Meridian outlined adjustments to more closely align the Company’s director compensation to the peer group. The Compensation Committee plans to engage advisors, evaluate available industry data, and assess the appropriateness of director and executive officer compensation based on the Company’s situation.
Summary Compensation Table
The following table sets forth information concerning the total compensation for each of the Named Executive Officers during each of the last two fiscal years.
| | | ($) | | | | |
| Name and Principal Position | Year | Salary | Bonus | Stock Awards 1 | Option Awards | All Other Compensation 2 | Total Compensation | Year | Salary | Bonus | Stock Awards 1 | Option Awards | All Other Compensation 2 | Total Compensation |
Scott Wollney President, Chief Executive Officer and Director | 2018 | $ | 450,000 |
| $ | — |
| $ | 130,010 |
| $ | — |
| $ | 29,309 |
| $ | 609,319 |
| 2019 | $ | 450,000 |
| $ | — |
| $ | — |
| $ | — |
| $ | 37,219 |
| $ | 487,219 |
|
| 2017 | $ | 450,000 |
| $ | — |
| $ | 100,008 |
| $ | — |
| $ | 32,703 |
| $ | 582,711 |
| 2018 | $ | 450,000 |
| $ | — |
| $ | 130,010 |
| $ | — |
| $ | 29,309 |
| $ | 609,319 |
|
Paul A. Romano Vice President and Chief Financial Officer | 2018 | $ | 254,808 |
| $ | — |
| $ | — |
| $ | — |
| $ | 36,073 |
| $ | 290,881 |
| 2019 | $ | 254,808 |
| $ | — |
| $ | — |
| $ | — |
| $ | 29,413 |
| $ | 284,221 |
|
| 2017 | $ | 254,808 |
| $ | — |
| $ | — |
| $ | — |
| $ | 31,833 |
| $ | 286,641 |
| 2018 | $ | 254,808 |
| $ | — |
| $ | — |
| $ | — |
| $ | 36,073 |
| $ | 290,881 |
|
Leslie DiMaggio Vice President, Operations & IT | 2018 | $ | 224,231 |
| $ | — |
| $ | — |
| $ | — |
| $ | 15,602 |
| $ | 239,833 |
| |
| 2017 | $ | 239,685 |
| $ | — |
| $ | — |
| $ | — |
| $ | 13,665 |
| $ | 253,350 |
| |
Joseph Shugrue Vice President, Chief Operating Officer | | 2019 | $ | 228,894 |
| $ | — |
| $ | — |
| $ | — |
| $ | 11,149 |
| $ | 240,043 |
|
| 2018 | $ | 225,000 |
| $ | — |
| $ | — |
| $ | — |
| $ | 10,666 |
| $ | 235,666 |
|
| |
1 | Mr. Wollney's Stock Awards for 2018 and 2017 are pursuant to the Director Stock Matching Program described under “Director Compensation” as compensation for his services as a director. The value of the stock awards consists of 7,408 shares which vested at the market price on February 28, 2018 and 2017, respectively.2018. |
| |
2 | Includes company contributions to 401(k) plan, employee stock purchase plan and annual car allowance. |
Stock Option Plan
On January 3, 2011, we adopted a 10% rolling stock option plan (“Stock Option Plan”) in order to advance our interests by providing certain “Eligible Persons” (any employee, officer, director, or consultant who is approved for participation in the Stock Option Plan by the Compensation Committee) with incentives. In connection with completion of the offering of our Voting Shares in February 2013, the Compensation Committee of the Board performed a review of our executive and director compensation, including our Stock Option Plan. This review included, among other considerations, comparisons to industry data, including the executive and director compensation programs of other publicly traded property and casualty insurance companies. As a result, our executive compensation and director compensation was increased to bring us in line with other public companies in our industry. These changes included a new Equity Incentive Plan. See the “Equity Incentive Plan” section below.
Prior to the adoption of the Equity Incentive Plan, the Stock Option Plan provided for the granting of options to purchase Voting Shares to Eligible Persons. Options were granted at the discretion of the Compensation Committee in such number determined at the time of grant, subject to the limits set out in the Stock Option Plan. The number of Voting Shares issuable under the Stock Option Plan was limited to not more than 10% of the number of Voting Shares that were issued and outstanding as of the date of the grant of an option. Any increase in the issued and outstanding Voting Shares would have resulted in an increase in the available number of Voting Shares issuable under the Stock Option Plan, and any exercises of options or expirations or terminations of options would make new grants available under the Stock Option Plan.
The exercise price of all options was established by the Compensation Committee at the time of grant, provided that the exercise price would not be less than the market price of the Voting Shares on the date of grant. Under the Stock Option Plan, market price was equal to the volume weighted average trading price of the Voting Shares on the NASDAQ (the principal stock exchange on
which the Voting Shares arewere listed for trading) for the five trading days immediately preceding the date on which the option is granted. The expiry of options was also established by the Compensation Committee at the time of the grant, provided that the options have a maximum term of ten years. The Compensation Committee determined when any option will become exercisable and whether the option will be exercisable in installments or pursuant to a vesting schedule. In the event of a change of control, vesting may be accelerated.
Equity Incentive Plan
In the second quarter of 2013, a new Equity Incentive Plan was approved by shareholders at our annual general meeting. As of such date, Atlas ceased to grant new stock options under the existing Stock Option Plan discussed above. The Equity Incentive Plan is a new securities based compensation plan pursuant to which Atlas may issue restricted shares, restricted units, stock options and other forms of equity incentives to eligible persons as part of their compensation. The Equity Incentive Plan is considered an amendment and restatement of the Stock Option Plan, although outstanding stock options issued pursuant to the Stock Option Plan will continue to be governed by the terms of the Stock Option Plan.
On March 12, 2015, Atlas granted 200,000 restricted Ordinary Shares and options to purchase 200,000 Voting Shares under the Equity Incentive Plan, all of which were granted to the Company’s officers. The awards vest in five equal annual installments of 20%, provided that an installment shall not vest unless an annual performance target based on book value growth equal to an annual 15% return on average equity is attained. In the event the performance target is not met in any year, the 20% installment for such year shall not vest, but such unvested installment shall carry forward and can vest in future years (up to the fifth year from the date of grant), subject to achievement in a future year of the applicable cumulative performance target expected through such year. The options have an exercise price of $20.29 per share and expire on March 12, 2025. In the event of a change of control, vesting may be accelerated.
On December 31, 2018, Atlas granted 17,524 restricted stock units under the Equity Incentive Plan, all of which were granted to the Company's independent directors. The awards vest in three equal installments on January 1 of each of the next three years, beginning on January 1, 2019. The restricted stock units were approved by the Board of Directors during March 2018.
Outstanding Equity Awards at 20182019 Fiscal Year End
The following table sets forth all equity awards held by the Named Executive Officers that were outstanding at the end of the most recently completed fiscal year. | | | Outstanding Equity Awards as at December 31, 2018 | |
| Outstanding Equity Awards as at December 31, 2019 | | Outstanding Equity Awards as at December 31, 2019 |
| | | Option Awards 3 | Stock Awards | | Option Awards | Stock Awards |
| Name and Principal Position | Grant date | Number of securities underlying unexercised options
(#) exercisable 1 | Number of securities underlying unexercised options
(#) unexercisable 1 | Option exercise
price ($) | Option expiration date | Number of shares or units of stock that have not vested (#) 2 | Market value of shares or units of stock that have not vested ($) | Equity incentive plan awards: Number of unearned shares, units or other rights that have not vested (#) | Equity incentive plan awards: Market or payout value of unearned shares, units or other rights that have not vested ($) | Grant date | Number of securities underlying unexercised options
(#) exercisable 1 | Number of securities underlying unexercised options
(#) unexercisable 1 | Option exercise
price ($) | Option expiration date | Number of shares or units of stock that have not vested (#) | Market value of shares or units of stock that have not vested ($) | Equity incentive plan awards: Number of unearned shares, units or other rights that have not vested (#) | Equity incentive plan awards: Market or payout value of unearned shares, units or other rights that have not vested ($) |
Scott Wollney
President, Chief Executive Officer and Director | February 28, 2014 | — | 14,816 | td19,861 | — | — | |
| March 6, 2014 | 54,500 | — | td3.26 | March 6, 2024 | — | — | — | |
| March 12, 2015 | 20,000 | 80,000 | td0.29 | March 12, 2025 | — | — | 80,000 | $647,200 | |
Scott Wollney
Chairman, President and Chief Executive Officer | | March 6, 2014 | 54,500 | — | td3.26 | March 6, 2024 | — | — | — |
| March 12, 2015 | 20,000 | 80,000 | td0.29 | March 12, 2025 | — | — | 80,000 | $34,400 |
Paul A. Romano
Vice President and Chief Financial Officer | March 6, 2014 | 35,000 | — | td3.26 | March 6, 2024 | — | — | March 6, 2014 | 35,000 | — | td3.26 | March 6, 2024 | — | — |
| March 12, 2015 | 5,000 | 20,000 | td0.29 | March 12, 2025 | — | — | 20,000 | td61,800 | March 12, 2015 | 5,000 | 20,000 | td0.29 | March 12, 2025 | — | — | 20,000 | $8,600 |
Leslie DiMaggio
Vice President, Operations & IT | March 6, 2014 | 28,500 | — | td3.26 | March 6, 2024 | — | — | — | |
| March 12, 2015 | 5,000 | 20,000 | td0.29 | March 12, 2025 | — | — | 20,000 | td61,800 | |
Joseph Shugrue
Chief Operating Officer | | March 6, 2014 | 28,500 | — | td3.26 | March 6, 2024 | — | — | — |
| March 12, 2015 | 5,000 | 20,000 | td0.29 | March 12, 2025 | — | — | 20,000 | $8,600 |
| |
1 | The March 6, 2014 grants vest equally on the first, second and third anniversary dates of the grant date. The March 12, 2015 grants vest 20% equally on the first, second, third, fourth and fifth anniversary pending a return on equity as described in the “Equity Incentive Plan” section of this Proxy Statement. |
| |
2
| The February 28, 2014 Stock Awards vest 20% on each anniversary of the grant date. The March 12, 2015 Stock Awards vest 20% equally on the first, second, third, fourth and fifth anniversary pending a return on equity as described in the “Equity Incentive Plan” section of this Proxy Statement. |
| |
3
| Vesting of stock awards under the Director Stock Matching Program (in the case of Mr. Wollney) and the Equity Incentive Plan (in the case of all Named Executive Officers and other members of the Company’s executive team) resulted in tax related reimbursement obligations to the Company. These obligations, as well as obligations under personal loans of certain members of the Company’s executive team, were due in the fourth quarter of 2017. These obligations were funded by the exercise of vested stock options and the subsequent sale of Company stock received in connection with such exercises. |
Pension Plan Benefits
We do not currently maintain any pension or retirement plans that provide for payments or benefits at, following or in connection with retirement.
Termination and Change of Control Benefits
We are party to employment agreements effective January 1, 2011 with the Named Executive Officers pursuant to which, if we terminate the executive without Cause (as defined in the employment agreement), or the executive’s employment is terminated in connection with a Change of Control (as defined in the employment agreement), the executive will be entitled to certain payments and benefits as set out below.
|
| | | |
| If terminated without Cause: | Continuation of base salary for: 1 | Lump-sum payment equal to: | Continuation of employee health benefits covered under COBRA for: 1, 2 |
| 2018 | 12 months | Most recently awarded bonus | 12 months |
| 2017 | 12 months | Most recently awarded bonus | 12 months |
| |
1 | The continuation of base salary and COBRA benefits will cease on the first of the month immediately following the date on which the executive becomes employed by a subsequent employer. |
| |
2 | Continuation coverage will continue for the period set forth in this column, or the maximum period of time allowed by law, if shorter. |
If, after a Change of Control (as defined in the employment agreement), the executive maintains employment with us (or our successor) for at least 180 days, the executive may terminate his employment at will and will be entitled to certain severance payments and post-termination benefits. Such payments and benefits shall mirror the payments and benefits that would have been in effect had we terminated the executive’s employment without Cause on such date.
Item 12. Security Ownership of Certain Beneficial Owners and Management and Related Stockholder Matters
The following table sets forth information concerning the beneficial ownership of the Voting Shares held on March 31, 2019November 6, 2020 by (i) each person known to us to own beneficially more than 5% of the total issued and outstanding Voting Shares, (ii) each of our directors and director nominees, (iii) each of our named executive officers, and (iv) all directors and executive officers as a group.
The options included in the below beneficial ownership table are exercisable within 60 days of March 31, 2019.November 6, 2020. Unless otherwise indicated, each person has sole voting and investment power over the shares listed.
|
| | | | |
| Name and Address of Beneficial Owner | Number of Voting Shares Owned 1, 2 | Percentage of Total Outstanding Voting Shares 1, 2 |
| 5% Beneficial Owners |
Ariel Investments, LLC 3, 9 200 E. Randolph Street, Suite 2900 Chicago, IL 60601 | 1,737,158 |
| 14.6 | % |
Tieton Capital Management 4, 9
4700 Tieton Drive, Suite C
Yakima, WA 98908 | 764,720 |
| 6.4 | % |
Wellington Management Group LLP 6, 9
280 Congress Street
Boston, MA 02210 | 704,347 |
| 5.9 | % |
Capital Returns Management, LLC 5, 9
641 Lexington Avenue, 18th Floor
New York, NY 10022 | 698,534 |
| 5.9 | % |
| Executive Officers and Directors |
Gordon Pratt 7 | 461,443 |
| 3.9 | % |
Scott Wollney 8 | 401,658 |
| 3.4 | % |
| Jordan Kupinsky | 65,162 |
| * |
|
| John Fitzgerald | 64,164 |
| * |
|
| Walter Walker | 390,733 |
| 3.3 | % |
| Ronald E. Konezny | 2,284 |
| * |
|
Larry Swets, Jr. 10 | — |
| * |
|
Paul Romano 8 | 120,891 |
| 1.0 | % |
Leslie DiMaggio 8 | 111,730 |
| * |
|
| All Directors and Executive Officers as a Group (9 individuals) | 1,835,262 |
| 15.4 | % |
|
| | | | |
| Name and Address of Beneficial Owner | Number of Voting Shares Owned 1, 2 | Percentage of Total Outstanding Voting Shares 1, 2 |
| 5% Beneficial Owners |
American Financial Group, Inc. 4 301 East Fourth Street Cincinnati, OH 45202 | 2,387,368 |
| 19.7 | % |
Renaissance Technologies LLC 5 800 Third Avenue New York, NY 10022 | 953,342 |
| 7.9 | % |
| Executive Officers and Directors |
Gordon Pratt 3 | 463,983 |
| 3.9 | % |
| Scott Wollney | 431,390 |
| 3.6 | % |
| Jordan Kupinsky | 66,432 |
| * |
|
| John Fitzgerald | 66,704 |
| * |
|
| Walter Walker | 393,273 |
| 3.3 | % |
| Ronald E. Konezny | 3,045 |
| * |
|
| Paul Romano | 171,045 |
| 1.4 | % |
| Joseph Shugrue | 123,153 |
| 1.0 | % |
| All Directors and Executive Officers as a Group (9 individuals) | 1,838,031 |
| 15.3 | % |
| |
| * | Indicates that ownership is less than 1% |
| |
1 | As of March 31, 2019,November 6, 2020, there were 11,936,97011,993,293 Voting Shares outstanding. Included in the shares above are the following convertible securities, exercisable within 60 days of MarchAugust 31, 2019,2020, that are deemed to be beneficially owned by the persons holding them for the purpose of computing that person’s percentage ownership: Gordon Pratt (managed through Atlas Investors LLC, see (7)(3) below) holds 27,195 options; Scott Wollney holds 74,500 options; Jordan Kupinsky holds 7,408 restricted stock units; Paul Romano holds 40,000 options; and Leslie DiMaggioJoseph Shugrue holds 33,500 options. The shares underlying these convertible securities are not treated as outstanding for the purpose of computing the percentage beneficial ownership of any other person. |
| |
2 | Under Rule 13d-3, a beneficial owner of a security includes any person who, directly or indirectly, through any contract, arrangement, understanding, relationship, or otherwise has or shares: (i) voting power, which includes the power to vote, or to direct the voting of shares; and/or (ii) investment power, which includes the power to dispose or direct the disposition of shares. Certain shares may be deemed to be beneficially owned by more than one person (if, for example, persons share the power to vote or the power to dispose of the shares). In addition, shares are deemed to be beneficially owned by a person if the person has the right to acquire beneficial ownership of the shares (for example, upon exercise of a vested option) within 60 days of the date as of which the information is provided. Any securities not outstanding which are subject to such acquisition rights shall be deemed to be outstanding for the purpose of computing the percentage of outstanding securities of the class owned by such person but shall not be deemed to be outstanding for the purpose of computing the percentage of the class owned by any other person. As a result, the percentage of outstanding shares of any person as shown in this table does not necessarily reflect the person’s actual ownership or voting power with respect to the number of shares outstanding. |
| |
3 | The Schedule 13G/A filed by Ariel Investments, LLC, an investment adviser, on February 14, 2019 states that as of December 31, 2018, it has sole power to vote 1,494,258 Voting Shares and sole power to dispose of 1,737,158 Voting Shares. |
| |
4
| The Schedule 13G filed by Tieton Capital Management, an investment adviser, on January 30, 2019 states that as of December 31, 2018, it has shared power to vote 764,720 Voting Shares and shared power to dispose of 764,720 Voting Shares. |
| |
5
| The Schedule 13G filed by Capital Returns Management, LLC (“CRM”), an investment adviser, on February 13, 2019 states that as of December 31, 2018, it has shared power to vote 698,534 Voting Shares and shared power to dispose of 698,534 Voting Shares. Such schedule also identifies Ronald D. Bobman, an |
individual and control person with shared power to vote 698,534 Voting Shares and shared power to dispose of 698,534 Voting Shares. CRM serves as the investment manager of Capital Returns Master, Ltd. (“Master”) and as a sub-adviser of MAP 41 Segregated Portfolio, a segregated portfolio of LMA SPC (“MAP”). CRM is wholly owned by Mr. Bobman. In such capacities, CRM and Mr. Bobman may be deemed to beneficially own, and to have the power to vote or direct the vote of, and the power to direct the disposition of the 698,534 shares, which consists of 223,700 shares held for the account of Master and 474,834 shares held for the account of MAP.
| |
6
| The Schedule 13G/A filed by Wellington Management Group LLP, a parent holding company, on February 12, 2019 states that as of December 31, 2018, it has shared power to vote 704,347 Voting Shares and shared power to dispose of 704,347 Voting Shares. Such schedule also identifies Wellington Group Holdings LLP, a holding company with shared power to vote 704,347 Voting Shares and shared power to dispose of 704,347 Voting Shares; Wellington Investment Advisors Holdings LLP, a holding company with shared power to vote 704,347 Voting Shares and shared power to dispose of 704,347 Voting Shares; and Wellington Management Company LLP, an investment adviser with shared power to vote 687,174 Voting Shares and shared power to dispose of 687,174 Voting Shares as subsidiaries which acquired the security being reported on by the parent holding company. Such schedule also identifies Wellington Trust Company, NA as the only client of the investment advisers named in such schedule that has the right to receive, or the power to direct the receipt of, dividends from, or the proceeds from the sale of, such securities with respect to more than five percent of the Voting Shares. Wellington Trust Company, NA, a bank acting in its capacity as investment adviser, filed a separate Schedule 13G/A on February 12, 2019 stating that as of December 31, 2018, it has shared power to vote 637,776 Voting Shares and shared power to dispose of 637,776 Voting Shares. |
| |
7
| Mr. Pratt holds 434,248463,983 Voting Shares which are held either directly or through Atlas Investors LLC, of which Mr. Pratt is a Managing Member. In July 2016, Fund Management Group LLC (“FMG”) pledged 110,255 shares of the Company as security for a loan in the amount of $750,000 due July 2019. At the time the loan was made, such shares were worth 200% of the principal and interest that would be due at the time of the loan's maturity. FMG is required to post additional collateral should the value of its current collateral fall below 150% of the principal and interest that would be due at the time of the loan's maturity. Under certain circumstances, the holder of the pledged shares has the right to sell such shares in order to satisfy any amount outstanding under the loan. In May 2018, FMG pledged 25,000 shares of the Company as security for the $750,000 loan due July 2019. FMG has pledged a total of 135,255 shares of the Company. As of the date of this report, no additional collateral and no sale of pledged shares has occurred. |
| |
84
| AsThe Schedule 13G/A filed by American Financial Group, Inc., a parent holding company, on January 31, 2020 states that as of MarchDecember 31, 2019 Scott Wollney had 180,724 Voting Shares, Paul Romano had 14,530it has sole power to vote 2,387,368 Voting Shares and Leslie DiMaggio had 14,488sole power to dispose of 2,387,368 Voting Shares. These shares represent warrants to purchase 2,387,368 Voting Shares pledgeduntil June 10, 2024, under a Warrant Agreement dated June 10, 2019 (the “Warrant Agreement”), at an initial exercise price of $0.69 per share, with both the number of Voting Shares subject to the Warrant Agreement and the exercise price subject to adjustment as set forth in the Warrant Agreement. Such schedule also identifies Great American Insurance Company, an insurance company, as the subsidiary which acquired the security for personal loans.being reported on by the parent holding company. |
| |
95
| As set forth in schedules filed subsequent to March 31, 2019, the applicable beneficial owner’s holding have since been reduced to zero. On June 14, 2019, American Financial Group, Inc. filed aThe Schedule 13G reflecting beneficialfiled by Renaissance Technologies LLC, an investment adviser (“RTC”) and Renaissance Technologies Holdings Corporation, a parent holding company (“RTHC”), on February 12, 2020 states that as of May 9, 2019, each of them has sole power to vote 953,243 Voting Shares and sole power to dispose of 953,243 Voting Shares, as the voting shares are beneficially owned by RTHC, because of RTHC’s majority ownership exceeding 5%. |
| |
10
| Mr. Swets retiredof RTC. Such schedule also states that certain funds and accounts managed by RTC have the right to receive dividends and proceeds from the Boardsale of Directors on January 2, 2018.the Voting Shares. |
Item 13. Certain Relationships and Related Transactions, and Director Independence
Related Person Transactions
We have established procedures for reviewing transactions between us and our directors and executive officers, their immediate family members and entities with which they have a position or relationship. These procedures help us evaluate whether any such related party transaction could impair the independence of a director or present a conflict of interest on the part of a director or executive officer.
Directors are considered independent if they are not an executive officer or employee of the Company and have no relationship which, in the opinion of the Board, would interfere with the exercise of independent judgment in carrying out the responsibilities of a director. There are sixfour directors on the Board, of which fivethree are independent directors for purposes of Rule 5605(a)(2) of the Nasdaq Capital Market. Mr. Swets, who retired from the Board effective January 2, 2018 was also an independent director.directors. Scott Wollney is not independent, as he is a member of our management. A majority of the Board is independent. Mr. Pratt and Mr. Fitzgerald who resigned from the Board effective August 1, 2020 and September 16, 2020, respectively, were also independent directors.
Our Audit Committee charter specifically requires the Audit Committee to review and approve all related party transactions that are required to be disclosed under Item 404 of Regulation S-K. In addition, our Code of Business Conduct and Ethics requires our directors, executive officers and all employees to provide full disclosure of the circumstances surrounding any potential conflict of interest and refrain from any related decision making process. Directors and officers must provide this full disclosure to our senior executives and our Audit Committee.
To capture all relevant information with respect to such transactions, we annually require each of our directors and executive officers to complete a Code of Business Conduct and Ethics as well as a Director and Officer Questionnaire that, among other things, elicits information about related party transactions. Our senior executives review the information disclosed in these documents, and review any unique circumstances potentially involving a related party transaction with our Chief Financial Officer, other members of management and the Audit Committee, as warranted. The Audit Committee, and possibly the full Board, would review any specific fact patterns as required.
As further described below, the Company has participated in certain investments with Kingsway, some of which also involve participation by Company directors Gordon Pratt and John T. Fitzgerald, and former director Larry Swets, Jr., (in 2018 Messrs. Swets and Fitzgerald were also directors and executive officers of Kingsway). We believe that it is beneficial for us to be able to leverage the collective expertise of Kingsway and our directors with respect to the sourcing of certain investments for inclusion in our investment portfolio, especially given the industry experience shared by the parties. The aggregate value of the investments described below, which are held by Global Liberty, make up less than 5.1%1% of the Company's investment portfolio as of December 31, 2018.2019 and are included in assets held for sale on the Consolidated Statements of Financial Position. Under the Company's current investment guidelines, other than fixed income (“OTFI”) investments (including any related party OTFI investments) may
not exceed the lesser of a total of 15% of the Company's overall cash and invested assets or 50% of the Company's statutory surplus (“Allowable OTFI Allocation”), with no new single investment to represent more than 20% of the Company's Allowable OTFI Allocation assets at the time such investment is made. Should the OTFI exceed these thresholds, the Company would seek to liquidate these positions in an economically beneficial manner. The related party transactions described below are consistent with the Company's current investment guidelines and have been reviewed and approved by both the Investment Committee of the Company's Board of Directors as well as the Audit Committee pursuant to the Company's policy on related party transactions described above.
Real Estate InvestmentsInvestment
The CompanyGlobal Liberty and Kingsway America, Inc. have participated in the following transactionstransaction involving the acquisition and management of revenue producing real estate:
As of December 31, 2018,2019, the Company, Kingsway America, Inc. and a third party real estate manager have investments in four separate ventures,a venture with each venturethe purpose of acquiring, improving and managing underutilized retail real estate. Total aggregate investment in these venturesthis venture by the three parties is approximately $8.3$2.4 million, with AtlasGlobal Liberty and Kingsway America, Inc. investing approximately $5.1$1.3 million and $2.4 million, respectively, in all four ventures.$656,000, respectively. The outstanding third party debt as of MarchJuly 31, 20192020 totaled $7.5$3.5 million.
The Company Principal and Kingsway have invested in a portfolio of net leased office properties managed by a third party. The Companyinterest paid totaled $136,000 and Kingsway have made aggregate investments of approximately $2.5 million and $6.1 million, respectively, in$207,000 during the properties.
Other Transactions
In addition to the real estate related transactions described above, the Company has also participated in the following transactions:
During 2017, the Company had $5.0 million outstanding related to debt investment in 1347 Investors, LLC (“SPAC Sponsor”) which was the sponsor of 1347 Capital Corp., a special purpose acquisition company which has since merged with and into Limbach Holdings, Inc., a NASDAQ listed company (“Limbach”). In December 2017, the Company received $2.6 million from SPAC Sponsor to settle a portion of this debt which left approximately $2.4 million of the debt investment outstanding as ofyear ended December 31, 2017. The remaining outstanding $2.4 million balance was subsequently paid in full in January 2018 by SPAC Sponsor. Such debt investment bore interest at an annual rate of 13%. SPAC Sponsor, of which Mr. Swets is a manager, owns equity securities of Limbach having a market value of approximately $33.7 million as of April 13, 2018. Messrs. Swets and Pratt are members of the board of directors of Limbach, and Messrs. Swets, Fitzgerald, individually, and Mr. Pratt, directly and indirectly, own equity in Limbach and the SPAC Sponsor. The Company received interest payments on such debt of approximately $986,000 during 2017.
During 2018, the Company decreased its debt investment by $1.6 million in an entity in which Kingsway owns an approximate 45.6% ownership interest. The total outstanding debt owed to the Company was paid in Q1 2019 along with a liquidation of its equity interest in this entity. Kingsway’s debt investment was paid in full in Q1 2019. Mr. Swets, Mr. Fitzgerald and Paul Romano, the Chief Financial Officer of the Company, served on the board of managers of this entity, and Messrs. Pratt and Fitzgerald own direct and indirect investments in the entity. The debt investment bears interest at an annual rate of 14%, and the Company received interest payments on such debt of approximately $112,000 during 2018.
Item 14. Principal Accounting Fees and Services
Audit and Non-Audit Fees
The aggregate fees billed by the Company’s external auditors for the financial years ending December 31, 20182019 and December 31, 2017,2018, are set out in the table below.
|
| | | | | |
| (US$) | Year | Audit Fees1 | Audit-Related Fees2 | Tax Fees3 | All Other Fees4 |
| Auditor |
Baker Tilly Virchow Krause,US, LLP | December 31, 2019 | $669,806 | Nil | Nil | Nil |
| Baker Tilly US, LLP | December 31, 2018 | $632,719851,685 | Nil | Nil | Nil |
RSM US LLP 5 | Q3-Q4 2018 | $458,622 | Nil | Nil | Nil |
| BDO USA, LLP | Q1-Q2 2018 | $60,216 | Nil | Nil | Nil |
BDO USA, LLP | December 31, 2017 | $796,502 | Nil | Nil | Nil |
| |
1 | Fees related to our annual audit, review of our quarterly reports on Form 10-Q and review of documents filed with the SEC. |
| |
2 | Fees related to procedures associated with the adoption of the new accounting standards and acquisitions. |
| |
3 | Fees related to tax compliance services and tax preparation services. |
| |
4 | Fees for other incidental expenses. |
| |
5 | Fees paid to RSM US LLP during the period they were engaged to complete the 2018 audit; however they were terminated prior to completing the audit. |
Pre-Approval Policies and Procedures
The Audit Committee has adopted specific policies and procedures for the engagement of non-audit services as described in its charter which is available on the Company's website at www.atlas-fin.com in the “Corporate Governance” section under Investor Relations. The Audit Committee shall approve all audit engagements and pre-approve the provision by the external auditors of all non-audit services, including fees and terms for all audit engagements and non-audit engagements, and in such regard the Audit Committee may establish the types of non-audit services the external auditors shall be prohibited from providing and shall establish the types of audit, audit related and non-audit services for which the Audit Committee will retain the external auditors. The Audit Committee may delegate to one or more of its members the authority to pre-approve non-audit services, provided that any such delegated pre-approval shall be exercised in accordance with the types of particular non-audit services authorized by the Audit Committee to be provided by the external auditor and the exercise of such delegated pre-approvals shall be presented to the full Audit Committee at its next scheduled meeting following such pre-approval. The Audit Committee has reviewed and approved the incurrence of all of the fees described above for 20182019 and 2017.2018.
Part IV
Item 15. Exhibits and Financial Statement Schedules
(a) (1) The following consolidated financial statements, notes thereto and related information of Atlas Financial Holdings, Inc. are included in Part II, Item 8.
Consolidated Statements of (Loss) Income and Comprehensive (Loss) IncomeOperations
Consolidated Statements of Financial Position
Consolidated Statements of Shareholders’ Equity (Deficit)
Consolidated Statements of Cash Flows
Notes to Consolidated Financial Statements
Report of Independent Registered Public Accounting Firm on Internal Controls over Financial Reporting
Report of Independent Registered Public Accounting Firm
(a) (2) The following additional financial statement schedules and independent auditors’ report are furnished herewith pursuant to the requirements of Form 10-K:
Schedules required to be filed under the provisions of Regulation S-X Article 7:
| |
| – | Schedule II - Condensed Financial Information of Registrant |
| |
| – | Schedule IV - Reinsurance |
| |
| – | Schedule V - Valuation and qualifying accounts |
| |
| – | Schedule VI - Supplemental information concerning property - casualty insurance operations |
All other schedules pursuant to Article 7 of Regulation S-X are omitted because they are not applicable, or because the required information is included in the consolidated financial statements or in the notes thereto.
(a) (3) The following is a list of the exhibits filed as part of this Annual Report on Form 10-K. The exhibit numbers followed by an asterisk (*) indicate exhibits that are management contracts or compensatory plans or arrangements.
|
| | | |
| Exhibit | Description | | |
| 3.1 | |
| 3.2 | |
4.1(1) | |
4.2(1) | |
| 4.3 | |
| 4.4 | |
| 4.5 | |
| 4.6 | |
| 4.7 | |
| 4.8 | |
| 4.9 | |
| 4.10 | |
10.1(1) | |
10.2(1) | |
10.3(1) | |
|
| | | |
| 10.5 | |
10.6(2) | |
10.7(2) | |
10.8(2) | |
10.9(2) | |
| 10.10 | |
| 10.11 | |
| 10.12 | |
| 10.13 | |
| 10.14 | |
| 10.15 | |
| 10.16 | |
| 10.17 | |
| 10.18 | |
| 10.19 | |
| 10.20 | |
| 10.21 | |
| 10.22 | |
| 10.23 | |
| 10.24 | |
| 10.25 | |
| 10.26 | |
| 10.27 | |
| 10.28 | |
| 10.29 | |
| 14 | |
| 16.1 | |
| 16.2 | |
| 21 | |
| 23.1 | |
23.2 | | | |
|
| | | |
| Item 31 – Rule 13a-14(a)/15d-14(a) Certifications |
| 31.1 | |
| 31.2 | |
| Item 32 – Section 1350 Certifications |
| 32.1 | |
|
| |
| Item 101 - Interactive Data Files |
| 101.INS | XBRL Instance Document |
| 101.SCH | XBRL Taxonomy Extension Schema Document |
| 101.CAL | XBRL Taxonomy Extension Calculation Linkbase Document |
| 101.DEF | XBRL Taxonomy Extension Definition Linkbase Document |
| 101.LAB | XBRL Taxonomy Extension Label Linkbase Document |
| 101.PRE | XBRL Taxonomy Extension Presentation Linkbase Document |
| |
1 | Incorporated by reference from our annual report on Form 10-K for the year ended December 31, 2011, filed on March 26, 2012. |
| |
2 | Incorporated by reference from our quarterly report on Form 10-Q for the quarter ended June 30, 2012, filed on August 13, 2012. |
* Management contracts and compensatory plans or agreements.
Item 16. Form 10-K Summary
None.
Signatures
Pursuant to the requirements of Section 13 or 15(d) of the Securities Exchange Act of 1934, the registrant has duly caused this report to be signed on its behalf by the undersigned, thereunto duly authorized.
|
| | |
ATLAS FINANCIAL HOLDINGS, INC. (Registrant) |
| /s/ Paul A. Romano |
By: Paul A. Romano Vice President and Chief Financial Officer (Principal Accounting Officer) |
February 12,December 3, 2020 |
Pursuant to the requirements of the Securities Exchange Act of 1934, this report has been signed below by the following persons on behalf of the registrant and in the capacities and on the dates indicated.
|
| | | | |
| Signature | | Title | | Date |
| /s/ Scott D. Wollney | | Chairman, President, and Chief Executive Officer and Director
| | February 12,December 3, 2020 |
| Scott D. Wollney | | |
| /s/ Paul A. Romano | | Vice President and Chief Financial Officer (Principal Accounting Officer) | | February 12,December 3, 2020 |
| Paul A. Romano | | |
/s/ Gordon G. Pratt
| | Director, Chairman of the Board | | February 12, 2020 |
Gordon G. Pratt | | |
/s/ John T. Fitzgerald | | Director | | February 12, 2020 |
John T. Fitzgerald | | |
| /s/ Ronald E. Konezny | | Director | | February 12,December 3, 2020 |
| Ronald E. Konezny | | |
| /s/ Jordan M. Kupinsky | | Director | | February 12,December 3, 2020 |
| Jordan M. Kupinsky | | |
| /s/ Walter F. Walker | | Director | | February 12,December 3, 2020 |
| Walter F. Walker | | |
Schedule II – Condensed Financial Information of Registrant
Statements of (Loss) Income and Comprehensive (Loss) IncomeOperations
|
| | | | | | | | | |
| ($ in ‘000s) | Year ended December 31, |
| | 2018 | 2017 | 2016 |
| Net investment expense | $ | (21 | ) | $ | (4 | ) | $ | — |
|
| Other underwriting (expense) income | (2,926 | ) | (1,436 | ) | 4,550 |
|
| Interest expense | (1,871 | ) | (1,266 | ) | — |
|
| (Loss) income from operations before income taxes | (4,818 | ) | (2,706 | ) | 4,550 |
|
| Income tax expense (benefit) | 4,141 |
| (115 | ) | (559 | ) |
| (Loss) income before equity in net income of subsidiaries | $ | (8,959 | ) | $ | (2,591 | ) | $ | 5,109 |
|
| Equity in net loss of subsidiaries | (71,053 | ) | (36,219 | ) | (2,463 | ) |
| Net (loss) income | $ | (80,012 | ) | $ | (38,810 | ) | $ | 2,646 |
|
| | | | |
| Other comprehensive (loss) income: | | | |
| Changes in net unrealized investment (losses) gains | (3,078 | ) | 437 |
| 855 |
|
| Reclassification to net income (loss) | 284 |
| (49 | ) | 394 |
|
| Effect of income taxes | — |
| (136 | ) | (437 | ) |
| Other comprehensive (loss) income | (2,794 | ) | 252 |
| 812 |
|
| Total comprehensive (loss) income | $ | (82,806 | ) | $ | (38,558 | ) | $ | 3,458 |
|
| | | | |
|
| | | | | | |
| ($ in ‘000s) | Year ended December 31, |
| | 2019 | 2018 |
| Net investment expense | $ | (6 | ) | $ | (21 | ) |
| Other underwriting expense | (6,254 | ) | (2,926 | ) |
| Interest expense | (1,897 | ) | (1,871 | ) |
| Loss from operations before income taxes | (8,157 | ) | (4,818 | ) |
| Income tax (benefit) expense | (392 | ) | 4,141 |
|
| Loss before equity in net loss of subsidiaries | $ | (7,765 | ) | $ | (8,959 | ) |
| Equity in net loss of subsidiaries | (12,661 | ) | (71,053 | ) |
| Net loss | $ | (20,426 | ) | $ | (80,012 | ) |
| | | |
| Other comprehensive income (loss): | | |
| Changes in net unrealized investment gains (losses) | 1,917 |
| (3,078 | ) |
| Reclassification to net income | 2,243 |
| 284 |
|
| Other comprehensive income (loss) | 4,160 |
| (2,794 | ) |
| Total comprehensive loss | $ | (16,266 | ) | $ | (82,806 | ) |
| | | |
Statements of Financial Position
| | | ($ in ‘000s, except share and per share data) | December 31, | December 31, |
| 2018 | 2017 | 2019 | 2018 |
| Assets | | |
| Cash and cash equivalents | $ | 371 |
| $ | 4,233 |
| $ | 1,966 |
| $ | 371 |
|
| Deferred tax asset, net | — |
| 4,116 |
| |
| Investment in subsidiaries | 36,049 |
| 109,897 |
| 28,782 |
| 36,049 |
|
| Total Assets | $ | 36,420 |
| $ | 118,246 |
| $ | 30,748 |
| $ | 36,420 |
|
| | | |
| Liabilities | | |
| Notes payable, net | $ | 24,255 |
| $ | 24,031 |
| $ | 24,479 |
| $ | 24,255 |
|
| Other liabilities and accrued expenses | 6,466 |
| 3,570 |
| 14,730 |
| 6,466 |
|
| Total Liabilities | $ | 30,721 |
| $ | 27,601 |
| $ | 39,209 |
| $ | 30,721 |
|
| | | |
| Shareholders’ Equity | | |
| Ordinary voting common shares, $0.003 par value, 266,666,667 shares authorized, shares issued: December 31, 2018 - 12,192,475 and December 31, 2017 12,164,041; shares outstanding: December 31, 2018 - 11,936,970 and December 31, 2017 - 12,164,041 | $ | 36 |
| $ | 36 |
| |
| Restricted voting common shares, $0.003 par value, 33,333,334 shares authorized, shares issued and outstanding: December 31, 2018 and December 31, 2017 - 0 | — |
| — |
| |
| Ordinary voting common shares, $0.003 par value, 266,666,667 shares authorized, shares issued: December 31, 2019 - 12,198,319 and December 31, 2018 12,192,475; shares outstanding: December 31, 2019 - 11,942,812 and December 31, 2018 - 11,936,970 | | $ | 36 |
| $ | 36 |
|
| Restricted voting common shares, $0.003 par value, 33,333,334 shares authorized, shares issued and outstanding: December 31, 2019 and December 31, 2018 - 0 | | — |
| — |
|
| Additional paid in capital | 202,298 |
| 201,105 |
| 81,548 |
| 202,298 |
|
| Treasury stock, at cost: December 31, 2018 - 255,505 and December 31, 2017 - 0 shares of ordinary voting common shares | (3,000 | ) | — |
| |
| Treasury stock, at cost: 255,505 shares of ordinary common voting shares at December 31, 2019 and December 31, 2018, respectively | | (3,000 | ) | (3,000 | ) |
| Retained deficit | (190,503 | ) | (110,535 | ) | (87,469 | ) | (190,503 | ) |
| Accumulated other comprehensive (loss) income, net of tax | (3,132 | ) | 39 |
| |
| Accumulated other comprehensive income (loss), net of tax | | 424 |
| (3,132 | ) |
| Total Shareholders’ Equity | $ | 5,699 |
| $ | 90,645 |
| $ | (8,461 | ) | $ | 5,699 |
|
| Total Liabilities and Shareholders’ Equity | $ | 36,420 |
| $ | 118,246 |
| $ | 30,748 |
| $ | 36,420 |
|
| | | |
See accompanying Notes to Condensed Financial Information of Registrant.
Schedule II (Continued) – Condensed Financial Information of Registrant
Statements of Cash Flows
| | | ($ in ‘000s) | Year ended December 31, | Year ended December 31, |
| | 2018 | 2017 | 2016 | 2019 | 2018 |
| Operating activities: | | |
| Net (loss) income | $ | (80,012 | ) | $ | (38,810 | ) | $ | 2,646 |
| |
| Adjustments to reconcile net (loss) income to net cash flows (used in) provided by operating activities: | |
| Net loss | | $ | (20,426 | ) | $ | (80,012 | ) |
| Adjustments to reconcile net loss to net cash flows provided by (used in) operating activities: | | Adjustments to reconcile net loss to net cash flows provided by (used in) operating activities: |
| Equity in net loss of subsidiaries | 71,053 |
| 36,219 |
| 2,463 |
| 12,661 |
| 71,053 |
|
| Share-based compensation expense | 1,201 |
| 1,176 |
| 1,612 |
| 872 |
| 1,201 |
|
| Deferred income taxes | 4,116 |
| (712 | ) | (417 | ) | — |
| 4,116 |
|
| Amortization of financing costs | 224 |
| 152 |
| — |
| 224 |
| 224 |
|
| Expenses recovered pursuant to stock purchase agreements | — |
| — |
| (6,623 | ) | |
| Net changes in operating assets and liabilities: | | |
| Other assets | — |
| — |
| 479 |
| |
| Other liabilities and accrued expenses | 2,897 |
| 673 |
| 2,897 |
| 8,264 |
| 2,897 |
|
| Net cash flows (used in) provided by operating activities | (521 | ) | (1,302 | ) | 3,057 |
| |
| | | |
| Investing activities: | | |
| Capital contributions made to subsidiaries | — |
| (19,300 | ) | — |
| |
| Net cash flows used in investing activities | — |
| (19,300 | ) | — |
| |
| Net cash flows provided by (used in) operating activities | | 1,595 |
| (521 | ) |
| | | |
| Financing activities: | | |
| Preferred share buyback | — |
| — |
| (2,539 | ) | |
| Capital contribution | (8 | ) | 30 |
| — |
| — |
| (8 | ) |
| Repurchase of common shares | (3,000 | ) | — |
| — |
| — |
| (3,000 | ) |
| Proceeds from notes payable, net of issuance costs | — |
| 23,879 |
| — |
| |
| Preferred dividends paid | (333 | ) | — |
| (409 | ) | — |
| (333 | ) |
| Options exercised | — |
| 655 |
| — |
| |
| Net cash flows (used in) provided by financing activities | (3,341 | ) | 24,564 |
| (2,948 | ) | |
| Net cash flows provided by (used in) financing activities | | — |
| (3,341 | ) |
| | | |
| Net change in cash and cash equivalents | (3,862 | ) | 3,962 |
| 109 |
| 1,595 |
| (3,862 | ) |
| Cash and cash equivalents, beginning of year | 4,233 |
| 271 |
| 162 |
| 371 |
| 4,233 |
|
| Cash and cash equivalents, end of year | $ | 371 |
| $ | 4,233 |
| $ | 271 |
| $ | 1,966 |
| $ | 371 |
|
| | | |
| Supplemental disclosure of cash paid (recovered) for: | | |
| Interest | $ | 1,656 |
| $ | 828 |
| $ | — |
| $ | 1,656 |
| $ | 1,656 |
|
| Income taxes | (1,806 | ) | (192 | ) | (3,464 | ) | 5,763 |
| (1,806 | ) |
| | | |
| Supplemental disclosure of noncash investing and financing activities: | |
| Redemption of preferred shares related to Gateway stock purchase agreement | $ | — |
| $ | — |
| $ | (2,297 | ) | |
| Cancellation of preferred shares related to Anchor stock purchase agreement | — |
| — |
| (4,000 | ) | |
See accompanying Notes to Condensed Financial Information of Registrant.
Schedule II (Continued) – Condensed Financial Information of Registrant
Notes to Condensed Financial Information
The financial statements of the Registrant should be read in conjunction with the Consolidated Financial Statements and notes thereto included in ‘Part II, Item 8.’
On April 26, 2017, Atlas issued $25 million of five-year 6.625% senior unsecured notes and received net proceeds of approximately $23.9 million after deducting underwriting discounts and commissions and other estimated offering expenses, as described in ‘Part II, Item 8, Note 18, Notes Payable.’ Atlas has no other long-term debt obligations.
Atlas has not received cash dividends from its subsidiaries since its inception on December 31, 2010.
Schedule IV – Reinsurance | | | ($ in ‘000s) | Gross Amount | Ceded to Other Companies | Assumed from Other Companies | Net Amount | % of Amount Assumed to Net | Gross Amount | Ceded to Other Companies | Assumed from Other Companies | Net Amount | % of Amount Assumed to Net |
| Premiums Earned |
| December 31, 2019 | | $ | 149,609 |
| $ | (66,322 | ) | $ | 26,954 |
| $ | 110,241 |
| 24.5 | % |
| | | | |
| December 31, 2018 | $ | 257,646 |
| $ | (62,400 | ) | $ | 22,972 |
| $ | 218,218 |
| 10.5 | % | $ | 205,923 |
| $ | (47,498 | ) | $ | 22,261 |
| $ | 180,686 |
| 12.3 | % |
| | | | |
| December 31, 2017 | $ | 251,293 |
| $ | (45,318 | ) | $ | 9,796 |
| $ | 215,771 |
| 4.5 | % | |
| | | | |
| December 31, 2016 | $ | 217,053 |
| $ | (49,069 | ) | $ | 3,074 |
| $ | 171,058 |
| 1.8 | % | |
Schedule V – Valuation and Qualifying Accounts | | | ($ in ‘000s) | Balance at Beginning of Period | Charged to Expenses | Other Additions | Deductions | Balance at End of Period | Balance at Beginning of Period | Charged to Expenses | Other Additions | Deductions | Balance at End of Period |
| December 31, 2019 | | |
| Allowance for uncollectible receivables | | $ | 5,115 |
| $ | 3,596 |
| $ | — |
| $ | (7,911 | ) | $ | 800 |
|
| Valuation allowance for deferred tax assets | | 25,415 |
| 2,113 |
| — |
| (24,385 | ) | 3,143 |
|
| | | |
| December 31, 2018 | | |
| Allowance for uncollectible receivables | $ | 3,418 |
| $ | 2,344 |
| $ | — |
| $ | (647 | ) | $ | 5,115 |
| $ | 3,418 |
| $ | 2,322 |
| $ | — |
| $ | (625 | ) | $ | 5,115 |
|
| Valuation allowance for deferred tax assets | — |
| 28,830 |
| — |
| — |
| 28,830 |
| — |
| 25,415 |
| — |
| — |
| 25,415 |
|
| | | |
| December 31, 2017 | | |
| Allowance for uncollectible receivables | $ | 2,366 |
| $ | 2,365 |
| $ | — |
| $ | (1,313 | ) | $ | 3,418 |
| |
| Valuation allowance for deferred tax assets | — |
| — |
| — |
| — |
| — |
| |
| | | |
| December 31, 2016 | | |
| Allowance for uncollectible receivables | $ | 846 |
| $ | 2,397 |
| $ | 12 |
| $ | (889 | ) | $ | 2,366 |
| |
| Valuation allowance for deferred tax assets | — |
| — |
| — |
| — |
| — |
| |
Schedule VI - Supplemental Information Concerning Property-Casualty Insurance Operations | | | ($ in ‘000s) | ($ in ‘000s) | Year ended December 31, | ($ in ‘000s) | Year ended December 31, |
| | | 2018 | 2017 | 2016 | | 2019 | 2018 |
| Deferred policy acquisition costs | Deferred policy acquisition costs | $ | 7,309 |
| $ | 14,797 |
| $ | 13,222 |
| Deferred policy acquisition costs | $ | — |
| $ | 5,918 |
|
| Claims liabilities | Claims liabilities | 273,496 |
| 211,648 |
| 139,004 |
| Claims liabilities | — |
| 226,487 |
|
| Unearned premium reserves | Unearned premium reserves | 134,040 |
| 128,043 |
| 113,171 |
| Unearned premium reserves | — |
| 111,461 |
|
| Net premiums earned | Net premiums earned | 218,218 |
| 215,771 |
| 171,058 |
| Net premiums earned | 110,241 |
| 180,686 |
|
| Net investment income | Net investment income | 2,647 |
| 4,897 |
| 4,824 |
| Net investment income | 1,902 |
| 1,793 |
|
| Claims and claims adjustment expenses incurred | Claims and claims adjustment expenses incurred | | Claims and claims adjustment expenses incurred | |
| Current year | Current year | 137,916 |
| 128,476 |
| 102,133 |
| Current year | 78,612 |
| 110,621 |
|
| Prior year | Prior year | 82,746 |
| 75,397 |
| 32,613 |
| Prior year | 2,155 |
| 71,635 |
|
| Amortization of deferred policy acquisition costs | Amortization of deferred policy acquisition costs | 26,115 |
| 27,885 |
| 18,803 |
| Amortization of deferred policy acquisition costs | 11,825 |
| 28,383 |
|
| Paid claims and claims adjustment expenses | Paid claims and claims adjustment expenses | 174,183 |
| 150,622 |
| 128,831 |
| Paid claims and claims adjustment expenses | 112,146 |
| 141,174 |
|
| Gross premiums written | Gross premiums written | 286,614 |
| 275,961 |
| 225,095 |
| Gross premiums written | 160,684 |
| 239,074 |
|