Table of Contents

UNITED STATES
SECURITIES AND EXCHANGE COMMISSION
Washington, D.C. 20549

FORM 10-K
ANNUAL REPORT PURSUANT TO SECTION 13 OR 15(d) OF THE SECURITIES EXCHANGE ACT OF 1934
For the fiscal year ended December 31, 20172021
OR
TRANSITION REPORT PURSUANT TO SECTION 13 OR 15(d) OF THE SECURITIES EXCHANGE ACT OF 1934
For the transition period from                to            
Commission File No. 000-54899
TCG BDC, INC.
(Exact name of Registrant as specified in its charter)
Maryland 80-0789789
(State or other jurisdiction of

incorporation or organization)
 
(I.R.S. Employer

Identification Number)
520 MadisonOne Vanderbilt Avenue, 40th Floor,Suite 3400, New York, NY 1002210017
(Address of principal executive office) (Zip Code)
(212) 813-4900
(Registrant’s telephone number, including area code)

Securities registered pursuant to Section 12(b) of the Act:
Title of each classTrading Symbol(s)Name of each exchange on which registered
Common Stock, par value $0.01 per shareCGBDThe NASDAQNasdaq Global Select Market
Securities registered pursuant to Section 12(g) of the Act: None

Indicate by check mark if the registrant is a well-known seasoned issuer, as defined in Rule 405 of the Securities Act.    Yes  x    No  x
Indicate by check mark if the registrant is not required to file reports pursuant to Section 13 or Section 15(d) of the Act.    Yes  ☐    No  x
Indicate by check mark whether the registrant (1) has filed all reports required to be filed by Section 13 or 15(d) of the Securities Exchange Act of 1934 during the preceding 12 months (or for such shorter period that the registrant was required to file such reports), and (2) has been subject to such filing requirements for the past 90 days:    Yes  x    No  ☐
Indicate by check mark whether the registrant has submitted electronically and posted on its corporate Web site, if any, every Interactive Data File required to be submitted and posted pursuant to Rule 405 of Regulation S-T (§232.405 of this chapter) during the preceding 12 months (or for such shorter period that the registrant was required to submit and post such files).    Yes  ☐    No  ☐
Indicate by check mark if disclosure of delinquent filers pursuant to Item 405 of Regulation S-K (§ 229.405 of this chapter) is not contained herein, and will not be contained, to the best of registrant’s knowledge, in definitive proxy or information statements incorporated by reference in Part III of this Form 10-K or any amendment to this Form 10-K.  ☐
Indicate by check mark whether the registrant is a large accelerated filer, an accelerated filer, a non-accelerated filer, or a smaller reporting company. See definitions of “large accelerated filer,” “accelerated filer,” and “smaller reporting company” in Rule 12b-2 of the Exchange Act. (Check one):
Large accelerated filer x  Accelerated filer 
Non-accelerated filer ☐ (Do not check if a smaller reporting company)  Smaller reporting company 
If an emerging growth company, indicate by check mark if the registrant has elected not to use the extended transition period complying with any new or revised financial accounting standards provided pursuant to Section 13(a) of the Exchange Act. ☐
Indicate by check mark whether the Registrant has filed a report on and attestation to its management's assessment of the effectiveness of its internal control over financial reporting under Section 404(b) of the Sarbanes-Oxley Act (15 U.S.C. 7262(b)) by the registered public accounting firm that prepared or issued its report. x
Indicate by check mark whether the registrant is a shell company (as defined in Rule 12b-2 of the Exchange Act).    Yes  ☐    No  x
The aggregate market value of the registrant’s common stock at June 30, 2017,2021, based on the closing price of the common stock on that date of $18.01$13.21 on The NASDAQNasdaq Global Select Market, held by those persons deemed by the registrant to be non-affiliates was approximately $1,059,269,766.$741,468,238.
The number of shares of the registrant’s common stock, $0.01 par value per share, outstanding at February 27, 201818, 2022 was 62,568,651.52,842,456.
Documents Incorporated by Reference: Portions of the registrant’s Proxy Statement for its 20182022 Annual Meeting of Stockholders to be filed not later than 120 days after the end of the fiscal year covered by this Annual Report on Form 10-K are incorporated by reference into Part III of this Form 10-K.


TCG BDC, INC.
INDEX
 
Part I
Item 1.
Item 1A.
Item 1B.
Item 2.
Item 3.
Item 4.
Part II
Item 5.
Item 6.
Item 7.
Item 7A.
Item 8.
Item 9.
Item 9A.
Item 9B.
Item 9C.
Part III
Item 10.
Item 11.
Item 12.
Item 13.
Item 14.
Part IV
Item 15.
Item 16.


CAUTIONARY STATEMENT REGARDING FORWARD-LOOKING STATEMENTS
We have included or incorporated by reference in this Form 10-K, and from time to time our management may make, “forward-looking statements”. These forward-looking statements are not historical facts, but instead relate to future events or the future performance or financial condition of TCG BDC, Inc. (together with its consolidated subsidiaries, “we,” “us,” “our,” “TCG BDC” or the “Company”). These statements are based on current expectations, estimates and projections about us, our current or prospective portfolio investments, our industry, our beliefs, and our assumptions. The forward-looking statements contained in this Form 10-K and the documents incorporated by reference herein involve a number of risks and uncertainties, including statements concerning:
our, or our portfolio companies’, future business, operations, operating results or prospects;prospects, including our and their ability to achieve our respective objectives as a result of the current COVID-19 pandemic;
the return or impact of current and future investments;
the general economy and its impact on the industries in which we invest and the impact of the COVID-19 pandemic thereon;
the impact of any protracted decline in the liquidity of credit markets on our business;
the impact of fluctuations in interest rates on our business;business, including from the discontinuation of LIBOR and the implementation of alternatives to LIBOR;
the valuation of our investments in portfolio companies, particularly those having no liquid trading market, and the impact of the COVID-19 pandemic thereon;
the impact of supply chain constraints on our portfolio companies and the global economy;
the elevating levels of inflation, and its impact on our portfolio companies and on the industries in which we invest;
the impact on our business of changes in laws, policies or regulations (including the interpretation thereof) affecting our operations or the operations of our portfolio companies;
our ability to recover unrealized losses;
market conditions and our ability to access alternative debt markets and additional debt and equity capital and the impact of the COVID-19 pandemic thereon;
our contractual arrangements and relationships with third parties;
uncertainty surrounding the financial stability of the United States, Europe and China;
the social, geopolitical, financial, trade and legal implications of the exit of the United Kingdom from the European Union, or Brexit;
competition with other entities and our affiliates for investment opportunities;
the speculative and illiquid nature of our investments;
the use of borrowed money to finance a portion of our investments;
our expected financings and investments;
the adequacy of our cash resources and working capital;
the timing, form and amount of any dividend distributions;
the timing of cash flows, if any, from the operations of our portfolio companies and the impact of the COVID-19 pandemic thereon;
the ability to consummate acquisitions;
the ability of our investment adviser to locate suitable investments for us and to monitor and administer our investments;
currency fluctuations could adversely affect the results of our investments in foreign companies, particularly to the extent that we receive payments denominated in foreign currency rather than U.S. dollars;
our future operating results;
the impact of changes in laws, policies or regulations (including the interpretation thereof) affecting our operations or the operationsinformation technology system failures, data security breaches, data privacy compliance, network disruptions, and cybersecurity attacks;
1

the valuation of our investments in portfolio companies, particularly those having no liquid trading market;
our ability to recover unrealized losses;
market conditions and our ability to access alternative debt markets and additional debt and equity capital;
our contractual arrangements and relationships with third parties;
the general economy and its impact on the industries in which we invest;
the financial condition of and ability of our current and prospective portfolio companies to achieve their objectives;
competition with other entities and our affiliates for investment opportunities;
the speculative and illiquid nature of our investments;
the use of borrowed money to finance a portion of our investments;
our expected financings and investments;
the adequacy of our cash resources and working capital;
the loss of key personnel;
the costs associated with being a publicly traded entity;
the timing, form and amount of any dividend distributions;
the timing of cash flows, if any, from the operations of our portfolio companies;
the ability to consummate acquisitions;
the ability of our investment adviser to locate suitable investments for us and to monitor and administer our investments;
the ability of The Carlyle Group Employee Co., L.L.C. and CELF Advisors LLP to attract and retain highly talented professionals that can provide services to our investment adviser and administrator;
our ability to maintain our status as a business development company; and
our intent to satisfy the requirements of a regulated investment company under Subchapter M of the Internal Revenue Code of 1986, as amended.


We use words such as “anticipates,” “believes,” “expects,” “intends,” “will,” “should,” “may,” “plans,” “continue,” “believes,” “seeks,” “estimates,” “would,” “could,” “targets,” “projects,” “outlook,” “potential,” “predicts” and variations of these words and similar expressions to identify forward-looking statements, although not all forward-looking statements include these words. Our actual results and condition could differ materially from those implied or expressed in the forward-looking statements for any reason, including the factors set forth in “Risk Factors” in Part I, Item 1A of and elsewhere in this Form 10-K.
We have based the forward-looking statements included in this Form 10-K on information available to us on the date of this Form 10-K, and we assume no obligation to update any such forward-looking statements. Although we undertake no obligation to revise or update any forward-looking statements, whether as a result of new information, future events or otherwise, you are advised to consult any additional disclosures that we may make directly to you or through reports that we have filed or in the future may file with the Securities and Exchange Commission (the “SEC”), including our annual reports on Form 10-K, registration statements on Form N-2, quarterly reports on Form 10-Q and current reports on Form 8-K.


2


PART I
In this annual report, except where the context suggests otherwise:
the terms “we,” “us,” “our,” “Company” and “TCG BDC” refer to TCG BDC, Inc., a Maryland corporation and its consolidated subsidiaries;
the term “SPV” refers to TCG BDC SPV LLC, oura wholly owned and consolidated subsidiary;
the term “2015-1 Issuer” refers to Carlyle Direct Lending CLO 2015-1R LLC (formerly known as Carlyle GMS Finance MM CLO 2015-1 LLC, ourLLC), a wholly owned and consolidated subsidiary;
the term “Carlyle” refers to The Carlyle Group Inc. (formerly known as The Carlyle Group L.P.) (NASDAQ: CG) and its affiliates and its consolidated subsidiaries (other than portfolio companies of its affiliated funds);
the term “CDL” refers to the Carlyle Direct Lending platform, which is Carlyle’s direct lending business unit that operates within the broader Carlyle Global Credit segment;
the terms “CGCA” and “Administrator” refer to Carlyle Global Credit Administration L.L.C. (formerly known as Carlyle GMS Finance Administration L.L.C.), our administrator, a wholly owned and consolidated subsidiary of Carlyle;
the terms “CGCIM” and “Investment Adviser” refer to Carlyle Global Credit Investment Management L.L.C. (formerly known as Carlyle GMS Investment Management L.L.C.), our investment adviser, a wholly owned and consolidated subsidiary of Carlyle;
the term “Credit Fund” refers to Middle Market Credit Fund, LLC, an unconsolidated limited liability company, in which we own a 50% economic interest and co-manage with Credit Partners USA LLC, and its wholly owned and consolidated subsidiaries;subsidiary;
the term “Credit Fund II” refers to Middle Market Credit Fund II, LLC, an unconsolidated limited liability company, in which we own an 84.13% economic interest and co-manage with Cliffwater Corporate Lending Fund ("CCLF"), and its wholly owned and consolidated subsidiary; and
references to “this Form 10-K” are to our Annual Report on Form 10-K for the year ended December 31, 2017.2021.
Item 1. Business
We are an externally managed specialty finance company focused on lendingwhose primary focus is making directly originated loans to middle market companies. We are managed by our Investment Adviser, a wholly owned subsidiary of The Carlyle Group L.P.Inc. We have elected to be regulated as a business development company (“BDC”) under the Investment Company Act of 1940, as amended (together with the rules and regulations promulgated thereunder, the “Investment Company Act”). In addition, we have elected to be treated, and intend to continue to comply with the requirements to qualify annually, as a regulated investment company (“RIC”) under the Internal Revenue Code of 1986, as amended (together with the rules and regulations promulgated thereunder, the “Code”). Since weWe commenced investment operations in May 2013 through December 31, 2017, we have invested approximately $3.6 billionand closed our initial public offering in aggregate principal amount of debt and equity investments prior to any subsequent exits or repayments.June 2017.
Our investment objective is to generate current income and, to a lesser extent, capital appreciation primarily through secured debt investments in U.S. middle market companies supported by financial sponsors. Our core investment strategy focuses on lending to U.S. middle market companies, which we define as companies with approximately $10$25 million to $100 million of earnings before interest, taxes, depreciation and amortization (“EBITDA”), which we believe is a useful proxy for cash flow. This core strategy is supplemented with complementary specialty lending and opportunistic investing strategies, which take advantage of the broad capabilities of Carlyle's Global Credit platform while offering risk-diversifying portfolio benefits. We seek to achieve our investment objective primarily through direct originationsorigination of secured debt instruments, including first lien senior secured loans (which may include stand-alone first lien loans, first lien/last out loans and “unitranche” loans) and second lien senior secured loans (collectively, “Middle Market Senior Loans”), with the balancea minority of our assets invested in higher yielding investments (which may include unsecured debt, mezzanine debt and investments in equities).
We invest primarily in loans to middle market companies whose debt, if rated, is rated below investment grade, and, if not rated, would likely be rated below investment grade if it were rated (that is, below BBB- or Baa3, which is often referred to as “junk”). Exposure to below investment grade instruments involves certain risks, including speculation with respect to the borrower’s capacity to pay interest and repay principal. See Item 1A of this Form 10-K “Risk Factors— Risks Related to Our Investments— Our investments are risky and speculative”.
3

We generate revenues primarily in the form of interest income from the investments we hold. In addition, we generate income from dividends on direct equity investments, capital gains on the sales of loans and debt and equity securities and various loan origination and other fees.

In conducting our investment activities, we believe that we benefit from the significant scale and resources of Carlyle, including our Investment Adviser and its affiliates. We have operated our business as a BDC since we began our investment activities in May 2013.
Formation Transactions and Corporate Structure
We were formed in February 2012 as a Maryland corporation structured as an externally managed, non-diversified closed-end investment company. On May 2, 2013, we elected to be regulated as a BDC under the Investment Company Act and commenced substantial investment operations upon the completion of our initial closing of equity capital commitments. In addition, for U.S. federal income tax purposes, we have elected to be treated as a RIC under the Code commencing with our taxable year ended December 31, 2013.
Effective on March 15, 2017, we changed our name from “Carlyle GMS Finance, Inc.” to “TCG BDC, Inc.” On June 19, 2017, we closed our initial public offering, issuing 9,454,200 shares of our common stock (including shares issued pursuant to the exercise of the underwriters’ over-allotment option on July 5, 2017) at a public offering price of $18.50 per share. Shares of common stock of TCG BDC began trading on the NASDAQNasdaq Global Select Market under the symbol “CGBD” on June 14, 2017.
Our Investment Adviser
Our investment activities are managed by our Investment Adviser.Adviser, a Delaware limited liability company and an investment adviser registered with the SEC under the Investment Advisers Act of 1940, as amended (the “Advisers Act”). The principal executive offices of our Investment Adviser are located at 520 MadisonOne Vanderbilt Avenue, 40th Floor,Suite 3400, New York, NY 10022,10017, with additional offices in Chicago, Boston and Los Angeles. Our Investment Adviser is responsible for sourcing potential investments, conducting research and due diligence on prospective investments, analyzing and equity sponsors, analyzing investment opportunities, structuring our investments and monitoring our investments on an ongoing basis.
Our Investment Adviser is served by an origination, capital markets, underwriting and portfolio management teamteams comprised of experienced investment professionals in CDL, which is Carlyle’s direct lending business unit that operates within the broader Carlyleacross Carlyle's Global Credit segment.segment, as defined below. Our investment approach is focused on long-term credit performance and principal preservation. Our Investment Adviser’s investment team utilizes a rigorous, systematic, and consistent investment process, refined over Carlyle’s 30-year34-year history investing in private markets across multiple cycles, designed to achieve enhanced risk-adjusted returns.
Our Investment Adviser’s seven-personfive-person investment committee is responsible for reviewing and approving our investment opportunities. The members of the investment committee have experience investing through different credit cycles. The investment committee is led by Michael A. Hart,Mark Jenkins, a Managing Director of Carlyle,and Head of CDL, Chairman of our Board of Directors and our Chief Executive Officer and also includes Jeffrey S. Levin, Managing Director of Carlyle and our President.Global Credit at Carlyle.
Our Investment Adviser also serves, and may serve in the future, as investment adviser to other existing and future affiliated BDCs that have investment objectives similar to our investment objectives.
Our Investment Adviser entered into a personnel agreement with The Carlyle Group Employee Co., L.L.C. (“Carlyle Employee Co.”), an affiliate of our Investment Adviser, pursuant to which Carlyle Employee Co. provides our Investment Adviser with access to investment professionals that comprise our Investment Adviser’s investment team. As of December 31, 2017,2021, our Investment Adviser’s investment team included a team of 29 dedicatedmore than 180 investment professionals. The seven members of ourprofessionals across the Global Credit segment. Our Investment Adviser’s investment committee have an averagecomprises five of 22the most senior credit professionals within the Global Credit segment, with backgrounds and expertise across asset classes and over 26 years of average industry experience.experience and 10 years of average tenure. In addition, our Investment Adviser and its investment team are supported by a team of finance, operations and administrative professionals currently employed by Carlyle Employee Co. and CELF Advisors LLP (“CELF”), botha wholly owned subsidiariessubsidiary of Carlyle.
Our Investment Adviser, its investment professionals, our executive officers and directors, and other current and future principals of our Investment Adviser serve or may serve as investment advisers, officers, directors or principals of entities or investment funds that operate in the same or a related line of business as we do and/or investment funds, accounts and other similar arrangements advised by Carlyle. An affiliated investment fund, account or other similar arrangement currently formed or formed in the future and managed by our Investment Adviser or its affiliates may have overlapping investment objectives
4

and strategies with our own and, accordingly, may invest in asset classes similar to those targeted by us. As a result, our Investment Adviser and/or its affiliates may face conflicts of interest arising out of the investment advisory activities of our Investment Adviser and other operations of Carlyle. See “—Allocation of Investment Opportunities and Potential Conflicts of Interest” and “Risk Factors—Risks Related to Our Business and Structure—There are significant potential conflicts of interest,


including the management of other investment funds and accounts by our Investment Adviser, which could impact our investment returns” in Part I, Item 1A of this Form 10-K for more information.
Our Administrator
CGCA, a Delaware limited liability company, serves as our Administrator. Pursuant to an administration agreement between us and the Administrator (the “Administration Agreement”), our Administrator provides services to us and we reimburse our Administrator for its costs and expenses and our allocable portion of overhead incurred by our Administrator in performing its obligations under the Administration Agreement, including our allocable portion of the compensation of certain of our officers and staff. In addition, our Administrator has entered into a sub-administration agreementsagreement with Carlyle Employee Co. and CELF (the “Carlyle Sub-Administration Agreements”Agreement”), which provideprovides our Administrator with access to personnel. Our Administrator has also entered into a sub-administration agreement with State Street Bank and Trust Company (“State Street” and such agreement, the “State Street Sub-Administration Agreement” and, together with the Carlyle Sub-Administration Agreements,Agreement, the “Sub-Administration Agreements”), pursuant to which State Street provides for certain administrative and professional services. State Street also serves as our custodian.
Carlyle
Our Investment Adviser and Administrator are affiliates of Carlyle. Carlyle is onea global investment firm with deep industry expertise that deploys private capital across three business segments: Global Private Equity, Global Credit and Investment Solutions. With $301 billion of assets under management (“AUM”) as of December 31, 2021, Carlyle’s purpose is to invest wisely and create value on behalf of its investors, portfolio companies and the world’s largestcommunities in which we live and most diversified multi-product global alternative asset management firms.invest. Carlyle employs nearly 1,850 employees, including more than 690 investment professionals in 26 offices across five continents, and its affiliates advise an array of specialized investment funds and other investment vehicles that invest across a range of industries, geographies, asset classes and investment strategies. Since its founding in Washington, D.C. in 1987, Carlyleserves more than 2,850 active carry fund investors from 89 countries.
Carlyle’s Global Credit segment, which currently has grown to become a leading global alternative asset manager with approximately $195$73.4 billion in assets under management, (“AUM”)advises a group of 87 active funds that pursue investment strategies across 317 investment vehiclesthe credit spectrum, including: liquid credit, illiquid credit, and real assets credit, a well as of December 31, 2017.
Carlylecross-platform vehicles. Global Credit is onehas been Carlyle’s fastest-growing segment in total AUM over the past three years, and Carlyle continues to expand its reach into additional areas of focus, such as real estate credit. Since the largest integrated credit platformsestablishment of Global Credit in 1999, these various capital sources provide the industry with approximately $33 billion in AUMopportunity for Carlyle to offer highly customizable and nearly 130 employees with multiple offices, including New York, Chicago and Los Angeles, as of December 31, 2017. Carlyle Global Credit’s investment strategies include loans and structured credit, direct lending (i.e., CDL), opportunistic credit, energy credit and distressed credit. CDL advises four funds, including us, totaling, in the aggregate, approximately $2.9 billion in AUM as of December 31, 2017.creative financing solutions to borrowers to meet their specific capital needs.
Primary areas of focus for Carlyle’s Global Credit segment include:
Liquid Credit
Loans and Structured Credit. The structured credit funds invest primarily in performing senior secured bank loans through structured vehiclesCLOs and other investment vehicles. In 2021, Carlyle closed eleven new U.S. CLOs and three CLOs in Europe with a total of $5.9 billion and $1.5 billion, respectively, of AUM at December 31, 2021. As of December 31, 2017,2021, Carlyle’s loans and structured credit team advised 4667 structured credit funds and two carryother structured credit funds in the United States Europe, and AsiaEurope totaling, in the aggregate, approximately $21.6$34.1 billion in AUM.
Illiquid Credit
Direct Lending. Carlyle’s direct lending business includes Carlyle’s BDCs, which invest primarily in middle market first lien loans (which include unitranche, “first out” and “last out” loans) and second lien loans of middle market companies, typically defined as companies with annual EBITDA ranging from $10$25 million to $100 million, that often lack access to the broadly syndicated loan and bond markets. As of December 31, 2017,2021, Carlyle’s direct lending investment team advised four funds consisting of twothree BDCs (including us), a CLO,the Company) and a corporate mezzanine fund that is past its investment period,six separately managed accounts, totaling, in the aggregate, approximately $2.9$6.6 billion in AUM.
Opportunistic Credit. Carlyle’s opportunistic credit team invests primarily in highly-structured and privately-negotiated capital solutions supporting corporate borrowers through secured loans, senior subordinated debt, mezzanine debt, convertible notes, and other debt like instruments, as well as preferred and common equity in such borrowers. The team will also look to invest in special situations (i.e., event-driven opportunities that exhibit hybrid credit and equity features) as well as market dislocations (i.e., primary and secondary market investments
5

in liquid debt instruments that arise as a result of temporary market volatility). As of December 31, 2017,2021, Carlyle’s opportunistic credit team advised two funds and one fundseparately managed account totaling, in the aggregate, approximately $0.8$7.8 billion in AUM.
Energy Credit. Carlyle’s energy credit team invests primarily in privately-negotiated mezzanine debt investments in North American energy and power projects and companies. As of December 31, 2017, Carlyle’s energy credit team advised two funds with approximately $4.7 billion in AUM.
Distressed Credit. The distressed credit funds generally invest in liquid and illiquid securities and obligations, including secured debt, senior and subordinated unsecured debt, convertible debt obligations, preferred stock


and public and private equity of financially distressed companies in defensive and asset-rich industries. In certain investments, these funds may seek to restructure pre-reorganization debt claims into controlling positions in the equity of the reorganized companies. As of December 31, 2017,2021, Carlyle’s distressed credit team advised three funds totaling, in the aggregate, approximately $3.4$3.0 billion in AUM.
Real Assets Credit
Aircraft Financing and Servicing. Carlyle Aviation Partners, Ltd. (“Carlyle Aviation Partners”) is Carlyle's multi-strategy investment platform that is engaged in commercial aviation aircraft financing and investment throughout commercial aviation industry. As of December 31, 2021, Carlyle Aviation Partners had approximately $10.2 billion in AUM across five active carry funds, in addition to securitization vehicles, liquid strategies and other vehicles.
Infrastructure Debt. Our Infrastructure debt team invests primarily in directly originated and privately negotiated debt instruments related to global infrastructure projects, primarily in the power, energy, transportation, water/waste, telecommunications and social infrastructure sectors. The team focuses primarily on senior, subordinated, and mezzanine debt and seeks to invest primarily in developed markets within the Organization for Economic Cooperation and Development (“OECD”). As of December 31, 2021, Carlyle’s infrastructure debt team managed $2.0 billion in AUM.
Other Credit
Insurance Solutions. Carlyle Insurance Solutions (“CIS”) combines our deep insurance expertise with portfolio construction capabilities, capital sourcing and asset origination strengths to provide comprehensive liability funding/reinsurance, asset management and advisory solutions for (re)insurance companies and fund investors. The CIS team oversees the investment in Fortitude. As of December 31, 2021, AUM related to capital raised from third-party investors to acquire a controlling interest in Fortitude was $3.2 billion, and Fortitude and AIG have committed approximately $7.0 billion of capital to-date to various Carlyle strategies.
Global Capital Markets. Carlyle Global Capital Markets (“GCM”) is a loan syndication and capital markets business that launched in 2018. The primary focus of GCM is to arrange, place, underwrite, originate and syndicate loans and underwrite securities of third parties and Carlyle portfolio companies through TCG Capital Markets L.L.C. and TCG Senior Funding L.L.C. TCG Capital Markets is a FINRA registered broker dealer. GCM may also act as the initial purchaser of such loans and securities. GCM receives fees, including underwriting, placement, structuring, transaction and syndication fees, commissions, underwriting and original issue discounts, interest payments and other compensation, which may be payable in cash or securities and/or loans, in respect of the activities described above and may elect to waive such fees.

Strategic Relationships
We have established, two highly differentiatedand may in the future establish, strategic relationships that expandmay diversify our product offering, and increase our scale, enhancingenhance our investment opportunities and optimizing selectivity rates, as we determine which creditsorigination capabilities or provide the best risk adjusted returns for our stockholders. In early 2015, our Investment Adviser developed a key strategic relationship with Madison Capital Funding LLC (“Madison Capital”), a prominent non-bank finance company that is a subsidiary of New York Life Insurance Company, which has allowed us to offer various lending solutions to potential borrowers and has increased our coverage of U.S. middle market private equity firms. Additionally,other benefits. To this end, in early 2016, we agreed to co-invest withand Credit Partners USA LLC (“Credit Partners”), a wholly owned subsidiary of PSP Investments Holding USA LLC, an affiliate of a large Canadian pension fund, agreed to formco-invest through Credit Fund, a joint venture primarily focused on investing in first lien loans to middle market companies. Since its inception and through December 31, 2021, Credit Fund has invested in over $3.1 billion (before any repayments or exits) of senior secured loans. We and Credit Partners each have 50% economic ownership of Credit Fund and have commitments to fund, from time to time, capital of up to $400$250 million each. See “Additionally, in November 2020, we and Cliffwater Corporate Lending Fund (“CCLF”), an investment vehicle managed by Cliffwater LLC, agreed to co-invest through Middle Market Credit Fund II, LLC (“Credit Fund II”), a joint venture primarily focused on investing in senior secured loans of middle market companies. The initial portfolio of Credit Fund II was comprised predominantly of senior secured loans contributed by TCG BDC. We and CCLF have 84.13% and 15.87% ownership in Credit Fund II, respectively.
6


—Competitive Strengths—Strategic RelationshipsTable of Contents.”
Competitive Strengths
Carlyle Global Credit’s key competitive strengths are based on Carlyle’s integrated platform – with a breadth of capabilities, scale of capital and depth of expertise – which Carlyle believes allows it to mitigate competition and thereby improve our ability to deliver on the expectations of shareholders. We believe the following characteristics distinguish Carlyle’s capabilities in private credit:
Market LeadingProven Direct Origination PlatformApproach. We have access to CDL’s strongCarlyle Direct Lending’s business directly originates nearly 100% of its investments, sourced from both the dedicated direct origination platform, with coverage of over 200 private equity firms and over 150 lending institutions. We take a regional approach to client coverage with offices in New York City, Chicago and Los Angeles. The origination team is highly experienced,as well as from the many adjacent capabilities across the Carlyle Credit platform. This origination approach has resulted in a strong and maintains deep relationshipsdiversified flow of opportunities, approximately 1,850 per annum, from which Carlyle believes it can select investments with a broad network of financial sponsors, commercial and investment banks, and finance companies, which are expected to continue to generate a significant amount of investment opportunities.the best potential risk/reward characteristics.
Scaled Investment Platform andBreadth of Capabilities. CDL is an established, scaledCarlyle believes it has one of the broadest credit investment capabilities in the market today. As a global private credit platform, withCarlyle has the ability to invest across the entire capital structure. CDL’s broad capabilities and ability to offer a full financing solution give us access to a wide funnel of opportunities, allow us to select high quality credits, construct the optimal financing package as it relates to price and terms, assert greater control over documentation, and generate attractive risk-adjusted returns for our stockholders. We believe CDL’s hold sizes are among the largest in the middle market, which we believe results in the ability to generate premium economics, as sponsors are willing to pay higher spreads for financing certainty. CDL’s large hold sizes and strategic relationships enable us to provide certainty with regards to spreads, fees, structure and covenants. Furthermore, the breadth of CDL’s debt offerings also allows us to deploy capital at a measured pace across credit cycles and construct a portfolio that will perform in a broad range of economic conditions.
One Carlyle Capabilities Leading to Superior Credit Performance. We benefit from our Investment Adviser’s utilization of the broader resources of Carlyle, which includes access to Carlyle’s relationships and institutional knowledge from almost three decades of private market investing. Our underwriting process leverages Carlyle’s over 650 investment professionals across multiple alternative investment asset classes, approximately 40 operating executives, information obtained through direct ownership of over 270 companies and lending relationships with over 700 companies, 13 credit industry research analysts, and in-house government affairs and economic research teams. Our systematic and consistent approach is augmented by industry expertise and tenured underwriting professionals who both lead our Investment Adviser’s investment team and serve on our Investment Adviser’s investment committee. Strong credit underwriting has been a key component of our investing process, where our Investment Adviser seeks to select borrowers whose businesses are expected to generate substantial cash flows, to have leading management teams, stable operating histories, high barriers to entry and meaningful equity value, and to retain significant value.
Experienced Investment Team. Our Investment Adviser’s investment team comprises investment professionals in CDL who have extensive middle market lending experience. The investment team consists of 29 dedicated investment professionals. The seven members of our Investment Adviser’s investment committee have an average of 22 years of industry experience. We believe the breadth and depth of the investment team in sourcing, structuring, executing, and monitoring a broad range of private investments provides us with a significant competitive advantage in building a high quality portfolio of investments.
Carefully Constructed Portfolio of Diversified Senior Secured, Floating Rate Loans. Our portfolio has been defensively constructed, exhibits strong credit quality, generates stable risk-adjusted returns and allows us to generate meaningful investment income, and consequently dividend income, for our stockholders. We have invested approximately $3.6 billion since our inception in directly originated middle market loans. Our portfolio is highly diversified by borrower, industry sector, sponsor relationships and other metrics. As of December 31, 2017, we had a portfolio of 107 investments in 90 portfolio


companies across 28 industries and 57 unique sponsors. As of December 31, 2017, approximately 99.3% of our debt investments bore interest at floating rates, subject to interest rate floors, and 77.8% of our portfolio was invested in first lien, unitranche, second lien, junior debt investments (including 12.1% first lien/last out loans).
Strategic Relationships. Our strategic relationships enhance our ability to provide full financingand preferred equity. Carlyle Credit can potentially serve as a one-stop shop, providing creative and holistic solutions to ourfor borrowers which results in our being able to generate optimal economics, significant access to diligence and control over documentation terms. Additionally, these relationships further strengthen our origination platform and ability to develop creative financing solutions to invest throughacross the capital structure, based on where we believe the best risk-adjusted returnwhich allows it to pursue investment opportunities reside. Our Investment Adviser’s strategic relationship with Madison Capital, a leading middle market senior lender with approximately $8.7limited competition.
Scale of Capital. With $73.4 billion of AUM as of December 31, 2017, allows us to offer2021 across its platform, Carlyle Global Credit maintains a significant capital base that can provide a full unitranche financing solution. This product provides middlecapital solution, delivering certainty of execution for borrowers and mitigating opportunities for competitive disintermediation.
Depth of Expertise. Carlyle is a market companiesleading global platform with certainty for financing without syndication risk$301 billion of AUM, an experienced and generates attractive risk-adjusted returns on these investments for our stockholders. Madison Capital providestenured bench of more than 690 investment professionals with well-established, long-standing relationships with sponsors, management teams, and industry experts, as of December 31, 2021. Carlyle believes that it brings differentiated diligence insights and extensive experience to inform credit selection. As a firm, Carlyle seeks to bring the first lien/first out portioncollective power of the unitranche loan,global platform with respect to individual investments, including sector credit analysts, Carlyle Private Equity’s deep knowledge and relationships with potential customers, suppliers or competitors of a given company, and internal dedicated diligence groups (e.g., government affairs and environment, social and corporate governance (“ESG”)). Carlyle believes this integrated and collaborative approach allows it to move faster and with higher conviction than its competitors in many scenarios.
Rigorous Credit Selection. Carlyle employs a robust, iterative and heavily documented underwriting process for its Direct Lending business, which allows us to provideconsists of four “gates” where a credit is reviewed and requires sign-off, including (i) at the first lien/last out portion. Collectively, wepoint of origination, (ii) by the underwriting team, (iii) by Carlyle Direct Lending’s screening committee (the “Direct Lending Screening Committee” or the “Screening Committee”) and Madison Capital have providedfinally (iv) by Carlyle Direct Lending’s investment committee at our Investment Adviser (“Direct Lending Investment Committee” or “Investment Committee”). This rigorous diligence approach has allowed for a less than 3% closing rate on the approximately 1,850 transactions that were reviewed by the deal team over $1.1 billion (before any repayments or exits) of unitranche loans to middle market companies. The relationship has been extremely successful, and we frequently invest alongside Madison Capital onthe past 12 months.
Defensive Approach. Carlyle approaches the direct lending business with a varietydefensive mindset that permeates all aspects of investment opportunities (inselection. On a strategic level, Carlyle seeks to construct well diversified portfolios, heavily weighted towards non-cyclical industries, and applies only moderate leverage at the portfolio level. In addition, in individual asset selection, Carlyle favors sponsored over non-sponsored borrowers, seeks to unitranche loans).
Separately, Credit Fund, our strategic joint venturetransact with Credit Partners,sponsors it knows well (approximately 80% of Carlyle Direct Lending’s business is with repeat sponsors), works with companies it knows well via its significant incumbencies, and primarily invests in first lien loanstransactions where Carlyle maintains leadership or roles with significant influence (approximately 85% of middle-market companies. Since its inception and through December 31, 2017, Credit Fund has provided over $1.2 billion (before any repayments or exits) of senior secured loans. This joint venture provides us with an enhanced first lien loan product for certain transactions, thus further increasing our deal flow, and resultsoriginations having a titled role in an increased number of borrowers in our portfolio, which provides strategic benefits as we build incumbent positions for future growth and investment opportunity.
The following highlights illustrate our accomplishments since the commencement of our operations:
Investmentsrecent years).—Inclusive of the use of leverage and recycled proceeds from sales and paydowns, we have deployed approximately $2.6 billion in 144 funded first lien debt investments, $448 million in 41 funded second lien debt investments, $127 million in 27 structured finance obligations, $14 million in 13 equity investments and $307 million in one investment fund through December 31, 2017.
Facilities and the 2015-1 Notes—On May 24, 2013, our wholly owned subsidiary, the SPV, entered into a senior secured revolving credit facility (as amended, the “SPV Credit Facility”) with a maximum principal amount of $400 million. In addition, on March 21, 2014, we entered into a senior secured revolving credit facility (as amended, the “Credit Facility” and, together with the SPV Credit Facility, the “Facilities”) with a maximum principal amount of $413 million. Further, on June 26, 2015, we completed a $400 million term debt securitization (the “2015-1 Debt Securitization”). The notes offered in the 2015-1 Debt Securitization (the “2015-1 Notes”) were issued by the 2015-1 Issuer, our wholly owned and consolidated subsidiary.
Market Opportunity
We believe the middle market lending environment provides attractive investment opportunities as a result of a combination of the following factors:
Favorable Market Environment. We believe the middle market remains one of the most attractive investment areas due to its large size, superior value relative to the broadly syndicated loan market, and supply-demand imbalance that continues to favor non-bank lenders. We believe market yields remain attractive and leverage levels at middle market companies are stable, creating a favorable investment environment.
7

Large and Growing U.S. Middle Market. The U.S. middle market direct lending asset class has undergone tremendous growth and maturation over the past decade and is one of the largest sub-segments of private credit, a now $800+ billion market.Carlyle believes this growth has been driven by fundamentally sound, secular drivers, including the expansion of private market by many measures,activity, increased bank regulation and consolidation and structural changes in liquid credit markets, all of which is expected to enable us to invest selectively as approximately 70% of middle market loan volume is sponsor-backed. According to S&P Capital IQ, as of December 31, 2017, there are over 70,000 U.S. middle market companies generating between $20 million and $1 billion in annual revenue, compared with approximately 3,500 companies with revenue greater than $1 billion. We believe these middle market companies, both sponsored and non-sponsored, representcreate a significant growth segment of the U.S. economy and often require substantial capital investments to grow.opportunity for private credit investing.
Leverage, Pricing and Risk. According to the S&P Global Market Intelligence LCD Quarterly Leveraged Lending Review (Q4 2017), middle market companies are less levered, have larger equity contributions, experience lower rates of default, and achieve higher recoveries versus large cap broadly syndicated loans. Middle market loans also tend to achieve more attractive pricing and structures, including documentation, covenants and information/governance, than broadly


syndicated loans. Over the 3 year period from 2015 to 2017, middle market loans have exhibited an approximate 200 basis points spread premium over broadly syndicated loans according to the S&P Global Market Intelligence LCD Leveraged Loan Index.
Market Environment Favors Non-Traditional Lenders. Traditional middle market lenders, such as commercial and regional banks and commercial finance companies, have contracted their origination and lending activities and are focusing on more liquid asset classes or have exited the business. At the same time, institutional investors have sought to invest in larger, more liquid offerings, limiting the ability of middle market companies to raise debt capital through public capital markets. This has resulted in other capital providers, such as specialty finance companies, structured-credit vehicles such as CLOs, BDCs, and private investment funds, actively investing in the middle market. We believe the aforementioned changes and restrictions have created a large and growing market opportunity for alternative lenders such as us.
Favorable Capital Markets Trends. Current and future demand for middle market financings, driven by private equity investment and upcoming maturities are expected to provide us with ample deal flow. Current data from the Thompson Reuters LPC Middle Market Quarterly Report (as of December 31, 2017) suggests that approximately $595 billion of upcoming loan maturities for middle market companies are due between 2018 and 2023, and the PitchBook PE & VE Fundraising and Capital Overhang Report suggests that there is over $566 billion of uninvested capital in 2010–YTD Q1 2017 vintage private equity funds. We believe these refinancings and uninvested capital will provide a steady flow of attractive opportunities for well-positioned lenders with deep and longstanding sponsor and market relationships, particularly for providers of full capital structure financing solutions.
Benefits of Traditional Middle Market Focus. We believeCarlyle believes that there are significant advantagesmeaningful benefits to investing in our focus on the traditional middle market a market we categorizedirectly originated assets, which allows the strategy to include borrowersgenerate excess return as compared to traditional fixed income asset classes, with EBITDA in the range of approximately $10 million to $100 million.comparable risk performance. The excess return is generated by prudently taking incremental complexity and illiquidity risk. Traditional middle market companies are generally less levered than companies with EBITDA in excess of $100 million and loans to those borrowers offer more attractive economics in the form of upfront fees, spreads and prepayment penalties. SeniorIn addition, senior secured middle market loans typically have strong defensive characteristics: these loans havecharacteristics and structural protections, including priority in payment among a portfolio company’s security holders and they carry the least risk among investments in the capital structure; these investments, which are secured by the portfolio company’s assets, typically contain carefullystructure and covenants, with a majority of middle market loans structured covenant packages which allow lenderswith financial covenants relative to take early action in situations where obligors underperform; and these characteristics can provide protection against credit deterioration. Middle market lenders like us are often able to complete more thorough due diligence investigations prior to investment than lenders in the broadly syndicated space.markets. Additional protection may be gained through better credit documentation and control, enhanced management and diligence access, monitoring of assets, and significantly more influence in the instance of a workout scenario.
Market Environment Favors Non-Traditional Lenders. The direct lending asset class has also benefited from an ongoing secular trend in the banking industry. Post Great Financial Crisis (“GFC”) in 2008, as tougher regulations have reshaped the landscape, traditional banks have reduced their lending capabilities by nearly 50% over the past ten years. As banks have retreated due to a number of new laws, regulations and regulatory guidance, including the Dodd-Frank Wall Street Reform and Consumer Protection Act, the federal bank regulatory agencies’ leveraged lending guidelines and Basel III regulatory capital framework, institutional investors have increased their lending capabilities to fill the void. Post-GFC, institutional investors now originate over 80% of primary leveraged loan issuances in the U.S., generating an incremental capital opportunity for the asset class.
Favorable Capital Markets Trends. Over the past two decades, Carlyle has witnessed a secular trend with respect to the shift in economic activity from public to privately owned businesses due to less appetite for public market exposure. The number of public companies in the U.S. has dropped by over 50% from its peak, with a mirror image increase in the rise of private equity-backed companies. Overall public listing activity has declined by approximately two-thirds over the past forty years. These privately owned companies often prefer to finance themselves through the private markets, which has allowed for a natural expansion of the market opportunity for direct lenders on a secular basis for over a decade. Given current market dynamics, Carlyle believes that the asset class will continue to expand.
Investment Strategy
We primarily target U.S.loans to U.S.-based middle market companies generally controlled by private equity investment firms that require capital for growth, acquisitions, recapitalizations, and refinancings, and leveraged buyouts. Wewith a focus on companies controlled by private equity investment firms. In addition, we may also make opportunistic loans to independentlyinvestments in non-private equity owned and publicly held middle market companies.public or private companies of various sizes; as well as invest in certain non-U.S.-based borrowers. We seek to partner with strong management teams executing long-term, growthvalue-maximizing strategies. Target businessesinvestments typically exhibit some or all of the following characteristics:
Borrowers with EBITDA of $10—$25—$100 million;
Minimum of 35% original sponsor cash equity in each transaction (typically higher);Leading market positions;
Sustainable leading positions in their respective markets;Defensible business strategies with significant barriers to entry;
Scalable revenuesDiversified product offerings, customer bases and operating cash flow;supplier profiles;
Experienced management teams with successful track records;
Stable, predictableSignificant valuation cushion, typically expressed as a significant equity investment from a financial sponsor;
Demonstrated stability and/or growth of revenue;
Predictable cash flows with low technology and market risks;limited risks of disruption;
Diversified product offering and customer base;
Low capital expenditures requirements; and
A North American base of operations;
Strong customer relationships;
Products, services or distribution channels having distinctive competitive advantages; and
Defensible niche strategy or other barriers to entry.operations.
8


While we believe that the criteria listed above are important in identifying and investing in prospective portfolio companies, not all of these criteria will be necessarily met by each prospective portfolio company. In addition, we may change our investment objective and/or investment criteria over time without notice to or consent from our investors.
Investment ApproachCriteria and Risk MonitoringTransactional Structures
We invest primarily in transactions supported by private equity sponsors. We seek to invest in the following types of Investmentsassets, with an emphasis on senior debt:
Our Investment Adviser utilizes a rigorous, systematictraditional cash flow senior secured debt;
unitranche senior secured debt financings;
“last out” unitranche debt;
second lien senior debt;
traditional subordinated debt;
preferred and consistent due diligence underwriting processcommon equity co-investments; and
secondary and other opportunistic asset purchases.
As noted above, we may also from time to evaluatetime participate in traditional subordinated debt financings, preferred and common equity co-investments. We may also make secondary purchases of all investment opportunities. Our Investment Adviser’s investment teams primarily consist of origination professionals, research analysts and underwriters. An investment team works on a particular transaction from initial screening through closing, and the same team continues to monitor the credit for the life cycle of the investment.above types of investments and other securities on an opportunistic basis.
We view ourInvestment Process
Origination
The direct lending investment process as consistingteam’s multi-channel origination model generates attractive investment opportunities through a variety of the phases described below:
Origination. Our Investment Adviser has built a strong direct origination platform with coverage ofsources, including over 200250 private equity firms, and over 150 lending institutions. Our Investment Adviser’s origination team sources approximately 800 opportunities per year for us with an ultimate investment rate by us of less than 10% annually. The scale of our Investment Adviser’s origination platform allows us to maximize access to investment opportunities and enhance overall investment selectivity. We further seek to reduce risk by partnering with experienced sponsors with strong track records. We believe lending to companies owned by leading private equity firms (versus non-sponsored companies) has several important and potentially defensive characteristics. Sponsor involvement provides for:
maximization of investment opportunities as approximately 70% offinancial institutions, other middle market loan volume is sponsor backed as of December 31, 2017, according to the S&P Global Market Intelligence LCD Middle Market Fact Sheet;
validation of enterprise value;
support, as needed, in strategy, operationslenders, strategic relationships and governance of portfolio companies;arrangements, financial advisors, and
the potential for additional capital commitment by sponsor if company requires financial support.
experienced management teams. The origination team supplements these relationships through personal visits and marketing campaigns focused on maximizing investment deal flow. It is their responsibility to identify specific opportunities, refine opportunities through candid exploration of the underlying facts and circumstances and to apply creative and flexible solutions to solve clients’a borrower or sponsor’s financing needs. The eight origination personnelprofessionals are located in New York, Chicago, Boston and Los Angeles. Each originator maintains long-standing relationships with potential sources of deal flow and is responsible for covering a specified target market. We believe thosemarket, organized by geography and secondarily by sector. Carlyle believes the originators’ strengthstrengths and breadth of relationships across a wide range of markets generate numerous financing opportunities, which should enable our Investment Adviserit to be highly selective through its diligence and investment process, with less than 3% of total deals screened over the past 12 months closing. The direct lending investment team has cultivated very strong relationships with private equity sponsors with whom it works closely in recommending investments.sourcing and executing transactions. Carlyle believes that borrowers benefit from full financing solutions, access to the vast Carlyle network, and reliable execution.
Underwriting
The underwriting process is led by an experienced team of senior underwriters with an average of 14 years of experience that are organized by sector and benefit from a deep base of shared information enabled by platform integration, as well as OneCarlyle resources. The typical deal timeline is sixty to ninety days and follows a multi-faceted four-step process:
Transaction 1.Screening. AfterThe deal team reviews marketing materials and industry reports, compiles debt and equity comparables, reaches out to industry experts within the senior originator has completedCarlyle network, builds an initial screen, the investment team will preparecash flow model incorporating downside scenarios, identifies key credit strengths and present a consistent screening template that includes business description, proposed transaction financing structures, preliminary financial analysis, initial assessment of investment merits and key risks and market/industry considerationsformulates a view on structure. The deal team then presents an initial analysis through a screening memo to the Screening Committee for high-level feedback and a subset of our Investment Adviser’s investment committee. During this early stage, the investment team also assesses initial adherencedecision to move forward with environmental, social, and governance policies.additional credit work. Based on feedback from the committee, the deal team will prepare and disseminate an outcomeoutcomes email that documents the takeaways from the meeting, including preferred financing structure as well as terms, key diligence items and next steps.
Underwriting.2.Formal Review. The next step is full credit analysis and in-depth due diligence. DuringFollowing an indication from the investmentScreening Committee to move forward in the diligence process, the investmentdeal team will compile a detailed diligence list and prepare for in-depth credit analysis. During this process, the deal team works closely with the private equity sponsor / borrower in all aspects of due diligence, including onsite meetings,diligence. Formal due diligence calls,includes meeting with the management team, reviewing the data room and reviewperforming key financial analyses, creating
9

a more detailed financial model with sensitivities assuming various market environments, reviewing sell-side and third-party research, which includes industry reports and financial diligence, reports. Our Investment Adviser also conducts an independent evaluationfollowing up with industry experts within the Carlyle network for additional feedback, and drafting the commitment papers and term sheet.
As part of the business, utilizing bothextensive due diligence process, the deal team fully leverages all internal and external sources. A key differentiator is our Investment Adviser’s integrated credit platform and collaborative efforts that leverage Carlyle’s broaderCarlyle resources which include access to Carlyle’s relationships and institutional knowledge.aid in investment decisions. This includes speaking to the private equityCarlyle Private Equity investment professionals (in accordance with information barrier restrictions),to discuss broad industry trends, as well as Carlyle operating executives, Carlyle’s Chief Economist & Directorchief economist and director of Research,research, Carlyle’s Government Affairsgovernment affairs professionals and anysenior executive officers within Carlyle’s private equity portfolio.portfolio, including over 270 companies worldwide. In addition, wethe deal team may utilize multiple third partythird-party expert networks to supplement itstheir work to gain further insight into company and industry factors from various thought leaders across the company’s markets. From
Carlyle enhanced its diligence process by incorporating formal ESG reviews, and our Investment Adviser utilizes this process as it seeks to achieve our investment objective. While ESG has always been a piece of the multiplescreening process, all deals will now be thoroughly vetted leveraging sector- and sub-sector-specific Sustainability Accounting Standards Board standards. ESG diligence sources noted above,incorporates country risk assessments for corruption and anti-money laundering concerns as well. The underwriters are responsible for assessing these ESG risks and including their assessment in the deal memo that the Screening and Investment Committees will review.
The formal review part of the process is iterative and involves re-screening with members of the Screening Committee, typically two to four times over the course of the deal, to produce a fulsome investment memo and provide a full term sheet and commitment papers, subject to outstanding diligence items.
3.Final Investment Committee Approval. After the Screening Committee has signed off on the investment memo, which consists of approval by the Investment Adviser’s Chief Investment Officer, Head of Underwriting, Chief Risk Officer, and a senior Managing Director, the deal team prepares for the Investment Committee approval process. The deal team reviews and summarizes final third-party industry work, the final quality of earnings report, and tax, legal, IT, HR and insurance diligence packets, conducts relevant background checks, performs outstanding ESG and regulatory due diligence, and begins drafting the definitive legal documentation for the transaction. Once the credit work for the transaction has been finalized, the deal team will finalize the investment memo and present the investment to the Investment Committee, where approval by a majority of the committee is required to approve a transaction.
4.Closing. Once the investment has been approved and prior to funding, the deal team will prepare a highly detailedclosing memo for the Investment Committee documenting any updates since approval, changes to key legal terms, and the final financial covenant analysis. Once the sponsor / borrower legal diligence, and the know your customer, anti-money laundering and legal documentation have been finalized, the transaction will close and fund.
The deal team focuses on lending to companies that it believes are performing, high quality businesses with a focus on strong fundamentals, market leadership with unique competitive advantages and high barriers to entry, positive cash flow generation on a historical and pro-forma basis including downside scenarios, and modest loan-to-value across economic cycles. The deal team crafts a fulsome memo that includes,with pages including, but is not limited to, the following:diligence completed on a variety of industry, company-specific, financial and legal topics. Topics may include:
Industry
Industry growth, including total potential market opportunity, current market share and potential new business development
OverviewKey industry trends and risk of the opportunitydisruption (with focus on technological disruption)
Competitive landscape and investment team recommendationside-by-side analysis of key competitors
Structure, termsMarket position and pricing of the proposed facilitiescompany reputation
Industry fragmentation and consolidation trends
M&A trends and valuation multiples
Barriers to entry for new adjacent or substitute players
Regulatory framework
Company
Revenue visibility and quality
10


Price and volume trends
SourcesDetails on products and usesservices, including concentration and margins
Sponsor background, historyCustomers, including customer concentration
RisksContracts, including maturity / termination provisions, renewal waterfalls, ability to pass through costs and mitigantsexclusivity
Detailed analysis of historical financial statements,Supply chain, including analysis of supplier concentration, raw material exposure, pricing power and logistics
Management team, including quality, depth and reputation
Sales and marketing team
IT and technology platform
Details on real estate and leases
Environmental, regulatory, or legal issues and insurance coverage
Financial
Cyclicality
Seasonality
Fixed and variable costs
EBITDA adjustments where appropriate
Projections,Capital expenditures, including management/sponsor casebreakdown between maintenance and base case,growth
Working capital requirements, including aging and write-offs
Detailed, bottom up cash flow modeling with assumptions clearly described,sensitivities for key business risks
Foreign exchange exposure
Accounting policies, including revenue and EBITDA bridge, where appropriatecosts recognition
Downside case analysisBonding requirements
Fixed/variable cost analysisClaims on income streams and off-balance sheet liabilities
Business/product description
Customers & suppliers
Industry trendsTax characteristics and analysis
Competition
Managementtax shield
Legal environmental, regulatory issues (if applicable)
Capital markets/syndication strategy (if applicable)
Items as to which approval is conditional and which require further due diligence and/or subsequent resolution
Monitoring. DiversificationDefinitions of our portfolio isEBITDA and indebtedness
Financial covenants and ability of a sponsor to invest incremental capital into the borrower
Affirmative covenants, including but not limited to reporting requirements, audits, budgets, and maintaining good standing
Permitted indebtedness, permitted liens and incremental facilities (including most favored nation protection)
Restricted payments and tax distributions
Permitted acquisitions and investments
Permitted divestures and mandatory prepayments
Events of defaults and cure periods
Security and collateral packages
Assignability of key tenet of our risk management strategy, including diversification by borrower, industry sector, sponsor relationshipscontracts, leases, material IP and other metrics. Additionally, we viewkey collateral
Limitations on fundamental changes and transferring collateral
Enforcement of remedies
Voting and assignment provisions
Other debt agreements and relevant intercreditor and subordination agreements
Portfolio and Risk Management
The investment team views proactive portfolio monitoring as a vital part of its investment process, which includes the continuous review of a borrower by portfolio management, underwriting and workout professionals, with multiple layers of risk review and oversight. The investment process. Our Investment Adviserteam follows a rigorous monitoring strategy that utilizes a proprietary dashboard template
11

for each transaction, which tracks financial performance, covenant compliance, follow-on transactions and amendments, and real-time updates to internal risk ratings based on qualitative and quantitative factors. The portfolio management process involves a variety of ongoing and scheduled reviews that allow for early detection of issues and escalation to the Investment Committee and workout team to avoid credit surveillance report and software system, an objective rules-based Internal Risk Rating system and proprietary valuation modellosses. This process includes detailed portfolio dashboard updates, monthly reviews of watch list credits, quarterly meetings to assess risk in the portfolio. In addition to monthlyconduct formal portfolio reviews, our Investment Adviserfocused on technical analysis of financial performance and portfolio diversification, and ongoing ad-hoc meetings to handle borrower-specific requests, including follow-on transactions and amendments.
In connection with the quarterly portfolio reviews, the investment team also compiles a quarterly risk report that examines, among other metrics,things, migration in the portfolio and loan level investment mix, industry diversification, Internal Risk Ratings,internal risk ratings, revenue and EBITDA and leverage. Our
Frequency of review of individual loans is determined on a case-by-case basis, based on internal risk ratings as laid out below, total exposure and other criteria set forth by the Investment Adviser supplements theseCommittee. The direct lending team has developed an internal risk policy which regularly assesses the risk profile of each investment and rates them based on the following categories, which are referred to as internal risk ratings.
RatingDefinition
1Borrower is operating above expectations, and the trends and risk factors are generally favorable.
2Borrower is operating generally as expected or at an acceptable level of performance. The level of risk to our initial cost bases is similar to the risk to our initial cost basis at the time of origination. This is the initial risk rating assigned to all new borrowers.
3Borrower is operating below expectations and level of risk to our cost basis has increased since the time of origination. The borrower may be out of compliance with debt covenants. Payments are generally current although there may be higher risk of payment default.
4Borrower is operating materially below expectations and the loan’s risk has increased materially since origination. In addition to the borrower being generally out of compliance with debt covenants, loan payments may be past due, but generally not by more than 120 days. It is anticipated that we may not recoup our initial cost basis and may realize a loss of our initial cost basis upon exit.
5Borrower is operating substantially below expectations and the loan’s risk has increased substantially since origination. Most or all of the debt covenants are out of compliance and payments are substantially delinquent. It is anticipated that we will not recoup our initial cost basis and may realize a substantial loss of our initial cost basis upon exit.
Beyond the policies with additionaldetailed above, our Investment Adviser’s investment team performs analyses and projections including stress scenarios, to assess the potential exposure of ourthe portfolio to variable macroeconomic factors and market conditions. For more informationSample analysis includes impact from falling energy prices, volatility in foreign exchange rates, Brexit, interest rate sensitivity and quite notably, the COVID-19 pandemic. These analyses can take the form of periodic (weekly/monthly/quarterly) reports as well as ad hoc analysis based on the Internal Risk Ratings of our portfolio, see Part II, Item 7 of this Form 10-K “Management’s Discussion and Analysis of Financial Condition and Results of Operations—Portfolio and Investment Activity.”current market conditions.


Portfolio Composition
As of December 31, 20172021 and 2016,2020, the fair value of our investments was approximately $1,967.5$1,913 million and $1,422.8$1,826 million, respectively, in 90117 and 86117 portfolio companies/structured finance obligations/investment fund,funds, respectively. The type, geography and industry
12

composition of our investments, each as a percentage of the fair value of our investments as of December 31, 20172021 and 2016,2020, were as follows:
 As of December 31,
Type—% of Fair Value20212020
First Lien Debt64.4 %67.0 %
Second Lien Debt17.9 15.6 
Equity Investments4.0 1.9 
Investment Funds13.7 15.5 
Total100.0 %100.0 %
  As of December 31,
Type—% of Fair Value 2017 2016
First Lien Debt (excluding First Lien/Last Out) 65.75% 67.15%
First Lien/Last Out Unitranche 12.08
 12.94
Second Lien Debt 12.51
 12.08
Structured Finance Obligations 
 0.37
Equity Investments 0.89
 0.46
Investment Fund 8.77
 7.00
Total 100.00% 100.00%
 As of December 31,
Type—% of Fair Value of First and Second Lien Debt20212020
Floating Rate98.4 %99.1 %
Fixed Rate1.6 0.9 
Total100.0 %100.0 %
 As of December 31,
Geography—% of Fair Value20212020
Canada2.5 %1.4 %
Cyprus0.4 0.4 
Italy0.3 — 
Luxembourg2.0 1.6 
United Kingdom5.0 4.9 
United States89.8 91.7 
Total100.0 %100.0 %
13

  As of December 31,
Type—% of Fair Value of First and Second Lien Debt 2017 2016
Floating Rate 99.34% 99.25%
Fixed Rate 0.66
 0.75
Total 100.00% 100.00%

  As of December 31,
Geography—% of Fair Value 2017 2016
Cayman Islands % 0.37%
United Kingdom 0.68
 1.47
United States 99.32
 98.16
Total 100.00% 100.00%


 As of December 31, As of December 31,
Industry—% of Fair Value 2017 2016Industry—% of Fair Value20212020
Aerospace & Defense 3.17% 4.31%Aerospace & Defense8.7 %4.8 %
Automotive 0.55
 2.70
Automotive4.9 3.2 
Banking, Finance, Insurance & Real Estate 8.84
 10.59
Banking, Finance, Insurance & Real Estate5.1 5.3 
Beverage, Food & Tobacco 2.57
 1.08
Beverage, Food & Tobacco4.4 4.4 
Business Services 9.10
 9.97
Business Services5.4 7.3 
Capital Equipment 2.07
 2.62
Capital Equipment3.5 2.6 
Chemicals, Plastics & Rubber 1.67
 1.39
Chemicals, Plastics & Rubber3.2 1.4 
Construction & Building 1.25
 1.67
Construction & Building0.6 0.1 
Consumer Goods: DurableConsumer Goods: Durable— 0.6 
Consumer Goods: Non-DurableConsumer Goods: Non-Durable0.3 0.1 
Consumer Services 6.16
 5.62
Consumer Services1.4 1.9 
Containers, Packaging & Glass 1.71
 3.35
Containers, Packaging & Glass2.7 3.2 
Durable Consumer Goods 3.02
 1.40
Energy: Electricity 2.15
 2.59
Energy: Oil & Gas 0.78
 0.77
Energy: Oil & Gas2.2 2.2 
Environmental Industries 1.82
 2.90
Environmental Industries3.6 3.4 
Forest Products & Paper 2.64
 1.68
Healthcare & Pharmaceuticals 11.83
 11.36
Healthcare & Pharmaceuticals12.0 6.5 
High Tech Industries 9.49
 3.26
High Tech Industries7.9 11.3 
Hotel, Gaming & Leisure 2.37
 2.11
Hotel, Gaming & Leisure5.9 4.4 
Investment Fund 8.77
 7.00
Investment FundsInvestment Funds13.7 15.5 
Media: Advertising, Printing & Publishing 1.78
 5.06
Media: Advertising, Printing & Publishing0.4 2.0 
Media: Diversified & ProductionMedia: Diversified & Production1.0 1.1 
Metals & Mining 0.40
 0.72
Metals & Mining0.1 — 
Non-durable Consumer Goods 2.68
 2.06
Retail 
 0.58
Retail2.4 1.9 
Software 2.85
 0.79
Software5.5 4.7 
Sovereign & Public Finance 0.09
 
Sovereign & Public Finance0.7 2.1 
Structured Finance 
 0.37
Telecommunications 4.01
 7.76
Telecommunications4.0 5.4 
Transportation: Cargo 4.34
 2.41
Transportation: Cargo— 1.6 
Transportation: Consumer 1.86
 1.96
Transportation: Consumer— 1.5 
Utilities: ElectricUtilities: Electric— — 
Wholesale 2.03
 1.92
Wholesale0.4 1.5 
Total 100.00% 100.00%Total100.0 %100.0 %
See the Consolidated Schedules of Investments as of December 31, 20172021 and 20162020 in our consolidated financial statements in Part II, Item 8 of this Form 10-K for more information on these investments, including a list of companies and type, cost and fair value of investments.
Allocation of Investment Opportunities and Potential Conflicts of Interest
An affiliated investment fund, account or other similar arrangement currently formed or formed in the future and managed by our Investment Adviser or its affiliates may have overlapping investment objectives and strategies with our own and, accordingly, may invest in asset classes similar to those targeted by us. This creates potential conflicts in allocating investment opportunities among the Companyus and such other investment funds, accounts and similar arrangements, particularly in circumstances where the availability or liquidity of such investment opportunities is limited or where co-investments by the Companyus and other funds, accounts or arrangements are not permitted under applicable law, as discussed below.
For example, Carlyle sponsors several investment funds, accounts and other similar arrangements, including, without limitation, structured credit funds, as well as future closed-end registered investment companies, BDCs, carry funds, and managed accounts and structured credit funds. Our Investment Adviser’s investment team formsfunds it may sponsor in the exclusive Carlyle platform for U.S. middle market debt investments.future. The SEC has granted us exemptive relief that permits us and certain of our affiliates to co-invest in suitable negotiated investments (the “Exemptive Relief”). If Carlyle is presented with investment opportunities that generally fall within our investment objective and other board-established criteria and those of other Carlyle funds, accounts or


other similar arrangements (including other existing and future affiliated BDCs) whether focused on a debt
14

strategy or otherwise, Carlyle allocates such opportunities among us and such other Carlyle funds, accounts or other similar arrangements in a manner consistent with the Exemptive Relief, our Investment Adviser’s allocation policies and procedures and Carlyle’s other allocation policies and procedures, where applicable, as discussed below. More specifically, investment opportunities in suitable negotiated investments for investment funds, accounts and other similar arrangements managed by our Investment Adviser, and other funds, accounts or similar arrangements managed by affiliated investment advisers that seek to co-invest with us or other Carlyle BDCs, are allocated in accordance with the Exemptive Relief. Investment opportunities for all other investment funds, accounts and other similar arrangements not managed by our Investment Adviser are allocated in accordance with their respective investment advisers’ and Carlyle’s other allocation policies and procedures. Such policies and procedures may result in certain investment opportunities that are attractive to us being allocated to other funds that are not managed by our Investment Adviser. Carlyle’s, including our Investment Adviser’s, allocation policies and procedures are designed to allocate investment opportunities fairly and equitably among its clients over time, taking into account a variety of factors which may include the sourcing of the transaction, the nature of the investment focus of each such other Carlyle fund, accounts or other similar arrangements, each fund’s, account’s or similar arrangement’s desired level of investment, the relative amounts of capital available for investment, the nature and extent of involvement in the transaction on the part of the respective teams of investment professionals, any requirements contained in the limited partnership agreements and other governing agreements of the Carlyle funds, accounts or other similar arrangements and other considerations deemed relevant by Carlyle in good faith, including suitability considerations and reputational matters. The application of these considerations may cause differences in the performance of different Carlyle funds, accounts and similar arrangements that have similar strategies.
Because we are a BDC, we are not generally permitted to make loans to companies controlled by Carlyle or other funds managed by Carlyle.
We are also not permitted to make any co-investments with clients of our Investment Adviser or its affiliates (including any fund managed by Carlyle) without complying with our Exemptive Relief, subject to certain exceptions, including with respect to our downstream affiliates. Co-investments made under the Exemptive Relief are subject to compliance with the conditions and other requirements contained in the Exemptive Relief, which could limit our ability to participate in a co-investment transaction. We may also co-invest with funds managed by Carlyle or any of its downstream affiliates, subject to compliance with applicable law and regulations, existing regulatory guidance, and our Investment Adviser’s and Carlyle’s other allocation policies and procedures.
While Carlyle and our Investment Adviser seek to implement their respective allocation processes in a fair and equitable manner under the particular circumstances, there can be no assurance that it will result in equivalent allocation of or participation in investment opportunities or equivalent performance of investments allocated to us as compared to the other entities. In some cases, due to information barriers that are in place, we and other Carlyle investment funds, accounts or other similar arrangements may compete with each other for specific investment opportunities without being aware that they are competing with each other. Carlyle has a conflict system in place above these information barriers to identify potential conflicts early in the process and determine if an allocation decision needs to be made.made or if an investment is precluded. If the conflicts system detects a potential conflict, the legal and compliance departments of Carlyle assess investment opportunities to determine whether a particular investment opportunity is required to be allocated to a particular investment fund, account or other similar arrangement (including us) or is prohibited from being allocated to a particular investment fund, account or similar arrangement. Subject to a determination by the legal and compliance departments (if applicable), portfolio management teams and, as applicable, the Investment Adviser's allocation committees, are then charged with ensuring that investment opportunities are allocated to the appropriate investment fund, account or similar arrangement.arrangement in accordance with our Investment Adviser's allocation policies and procedures. In addition, in some cases Carlyle and our Investment Adviser may make investment recommendations to investment funds, accounts and other similar arrangements where the investment funds, accounts and other similar arrangements make the investment independently of Carlyle and our Investment Adviser. As a result, there are circumstances where investments appropriate for us are instead allocated, in whole or in part, to such other investment funds, accounts or other similar arrangements irrespective of our Investment Adviser’s and Carlyle’s other policies and procedures regarding allocation of investments. Where Carlyle otherwise has discretion to allocate investment opportunities among various funds, accounts and other similar arrangements, it should be noted that Carlyle may determine to allocate such investment opportunities away from us.
During periods of unusual market conditions, our Investment Adviser may deviate from its normal trade allocation practices. For example, this may occur with respect to the management of unlevered and/or long-only investment funds, accounts or similar arrangements that are typically managed on a side-by-side basis with levered and/or long-short investment funds, accounts or similar arrangements.
For potential conflicts of interest in allocating investment opportunities among the Company and other investment funds, accounts or similar arrangements advised by Carlyle, see Part I, Item 1A of this Form 10-K “Risk Factors—Risks Related
15

to Our Business and Structure—There are significant potential conflicts of interest, including the management of other investment funds and accounts by our Investment Adviser, which could impact our investment returns.
Election to be Taxed as a RIC


We have elected to be treated, and intend to continue to qualify annually, as a RIC for U.S. federal income tax purposes under Subchapter M of the Code. As a RIC, we generally will not pay corporate-level U.S. federal income taxes on any net ordinary income or capital gains that we timely distribute to our stockholders as dividends. Instead, dividends we distribute generally will be taxable to the holders of our common stock, and any net operating losses, foreign tax credits and other tax attributes may not pass through to the holders of our common stock. To qualify as a RIC, we must, among other things, meet certain source-of-income and asset diversification requirements (as described below). In addition, we must distribute to our stockholders on an annual basis at least 90% of our investment company taxable income (generally, our net ordinary income plus the excess of our realized net short-term capital gains over realized net long-term capital losses, determined without regard to the dividends paid deduction) for any taxable year (the “Annual Distribution Requirement”). The following discussion assumes that we qualify as a RIC and have satisfied the Annual Distribution Requirement.
If we:
we (1) qualify as a RIC;RIC, and
(2) satisfy the Annual Distribution Requirement,
then we are not subject to U.S. federal income tax on the portion of our net taxable income we distribute (or are deemed to distribute) to stockholders. We are subject to U.S. federal income tax at regular corporate rates on any income or capital gains not distributed (or deemed distributed) to our stockholders.
In addition, if we fail to distribute in a timely manner an amount at least equal to the sum of (1) 98% of our ordinary income for the calendar year, (2) 98.2% of our capital gain net income (both long-term and short-term) for the one-year period ending October 31 in that calendar year and (3) any income realized, but not distributed, in the preceding year (the “Excise Tax Distribution Requirements”), we are liable for a 4% excise tax on the portion of the undistributed amounts of such income that are less than the amounts required to be distributed based on the Excise Tax Distribution Requirements. For this purpose, however, any ordinary income or capital gain net income retained by us that is subject to corporate income tax for the tax year ending in that calendar year is considered to have been distributed by year end (or earlier if estimated taxes are paid). We currently intend to make sufficient distributions each taxable year to satisfy the Excise Tax Distribution Requirements.
In order to qualify as a RIC for U.S. federal income tax purposes, we must, among other things:
 
continue to qualify as a BDC under the Investment Company Act at all times during each taxable year;
derive in each taxable year at least 90% of our gross income from dividends, interest, payments with respect to loans of certain securities, gains from the sale of stock or other securities or foreign currencies, net income from certain “qualified publicly traded partnerships,” or other income derived with respect to our business of investing in such stock or securities or foreign currencies (the “90% Gross Income Test”); and
diversify our holdings so that at the end of each quarter of the taxable year:
at least 50% of the value of our assets consists of cash, cash equivalents, U.S. government securities, securities of other RICs, and other securities if such other securities of any one issuer do not represent more than 5% of the value of our assets or more than 10% of the outstanding voting securities of the issuer; and
no more than 25% of the value of our assets is invested in the securities, other than U.S. government securities or securities of other RICs, of one issuer, or two or more issuers that are controlled, as determined under applicable Code rules, by us and that are engaged in the same or similar or related trades or businesses, or of certain “qualified publicly traded partnerships” (the “Diversification Tests”).
Moreover, our ability to dispose of assets to meet our distribution requirements may be limited by (1) the illiquid nature of our portfolio and/or (2) other requirements relating to our qualification as a RIC, including the Diversification Tests. If we dispose of assets in order to meet the Annual Distribution Requirement or the Excise Tax Distribution Requirements, we may make such dispositions at times that, from an investment standpoint, are not advantageous. If we are prohibited from making distributions or are unable to raise additional debt or equity capital or sell assets to make distributions, we may not be able to make sufficient distributions to satisfy the Annual Distribution Requirement, and therefore would not be able to maintain our qualification as a RIC. Additionally, we may make investments that result in the recognition of ordinary income rather than capital gain, or that prevent us from accruing a long-term holding period. These investments may prevent us from


making capital gain distributions as described below. We intend to monitor our transactions, make the appropriate tax elections and make the appropriate entries in our books and records when we make any such investments in order to mitigate the effect of these rules.
16

A RIC is limited in its ability to deduct expenses in excess of its “investment company taxable income” (which is, generally, ordinary income plus net realized short-term capital gains in excess of net realized long-term capital losses). If our expenses in a given year exceed gross taxable income, we would have a net operating loss for that year. However, a RIC is not permitted to carry forward net operating losses to subsequent years. In addition, expenses can be used only to offset investment company taxable income, not net capital gain. Due to these limits on the deductibility of expenses, we may for U.S. federal income tax purposes have aggregate taxable income for several years that we distribute and that is taxable to our stockholders even if such income is greater than the aggregate net income we actually earned during those years. Such distributions may be made from our cash assets or by liquidation of investments, if necessary. We may realize gains or losses from such liquidations. In the event we realize net capital gains from such transactions, a holder may receive a larger capital gain distribution than the holder would have received in the absence of such transactions.
Regulation
General—Regulation as a Business Development Company
We have elected to be regulated as a BDC under the Investment Company Act and have elected to be treated as a RIC under the Code. A BDC must be organized in the United States for the purpose of investing in or lending to primarily private companies and making significant managerial assistance available to them. A BDC may use capital provided by public stockholders and from other sources to make long-term, private investments in businesses. A publicly-traded BDC provides stockholders with the ability to retain the liquidity of a publicly traded stock while sharing in the possible benefits, if any, of investing in primarily privately owned companies.
We may not change the nature of our business so as to cease to be, or withdraw our election as, a BDC unless authorized by vote of a majority of the outstanding voting securities, as required by the Investment Company Act. A majority of the outstanding voting securities of a company is defined under the Investment Company Act as the lesser of: (a) 67% or more of such company’s voting securities present at a meeting if more than 50% of the outstanding voting securities of such company are present or represented by proxy, or (b) more than 50% of the outstanding voting securities of such company. We do not anticipate any substantial change in the nature of our business.
As with other companies regulated by the Investment Company Act, a BDC must adhere to certain substantive regulatory requirements. A majority of our directors must be persons who are not “interested persons,” as that term is defined in Section 2(a)(19) of the Investment Company Act (such directors are referred to as the “Independent Directors” and the directors who are not Independent Directors are referred to as the “Interested Directors”). We are required to provide and maintain a bond issued by a reputable fidelity insurance company to protect the BDC. Furthermore, as a BDC, we are prohibited from protecting any director or officer against any liability to us or our stockholders arising from willful misfeasance, bad faith, gross negligence or reckless disregard of the duties involved in the conduct of such person’s office.
The Investment Company Act contains prohibitions and restrictions relating to certain transactions between BDCs and certain affiliates (including any investment advisers or sub-advisers), principal underwriters and certain affiliates of those affiliates or underwriters. Because we are a BDC, we are not generally permitted to make loans to companies controlled by Carlyle or other funds managed by Carlyle. We are also not permitted to make any co-investments with our Investment Adviser or its affiliates (including any fund managed by Carlyle) without complying with our Exemptive Relief, subject to certain exceptions, including with respect to our downstream affiliates. Co-investments made under the Exemptive Relief are subject to compliance with the conditions and other requirements contained in the Exemptive Relief, which could limit our ability to participate in a co-investment transaction. We may also co-invest with funds managed by Carlyle or any of its downstream affiliates, subject to compliance with applicable law and regulations, existing regulatory guidance, and our Investment Adviser’s allocation policies and procedures.
As a BDC, we are generally required to meet an asset coveragea minimum “asset coverage” ratio defined under the Investment Company Act as the ratioafter each issuance of oursenior securities. “Asset coverage” generally refers to a company’s total assets, (lessless all liabilities and indebtedness not represented by senior securities) to our outstanding“senior securities,” as defined in the Investment Company Act, divided by total senior securities representing indebtedness and, if applicable, preferred stock. “Senior securities” for this purpose includes borrowings from banks or other lenders, debt securities and preferred stock. On April 9, 2018 and June 6, 2018, our Board of at leastDirectors, including a “required majority” (as such term is defined in Section 57(o) of the Investment Company Act), and our stockholders, respectively, approved the application to us of the 150% minimum asset coverage ratio set forth in Section 61(a)(2) of the 1940 Act. As a result, the minimum asset coverage ratio applicable to us was reduced from 200% to 150%, effective as of June 7, 2018, the first day after each issuanceour 2018 annual meeting of senior securities.stockholders.
17

We may invest up to 100% of our assets in securities acquired directly from issuers in privately negotiated transactions. With respect to such securities, we may, for the purpose of public resale, be deemed an “underwriter” as that term is defined in the Securities Act of 1933, as amended (the “Securities Act”). Our intention is to not write (sell) or buy put or call


options to manage risks associated with the publicly traded securities of our portfolio companies. We may enter into hedging transactions to manage the risks associated with interest rate and currency fluctuations. We may purchase or otherwise receive warrants or options to purchase the common stock of our portfolio companies in connection with acquisition financings or other investments. In connection with such an acquisition, we may acquire rights to require the issuers of acquired securities or their affiliates to repurchase them under certain circumstances.
We do not intend to acquire securities issued by any investment company that exceed the limits imposed by the Investment Company Act. Under these limits, except for registered money market funds, we generally cannot acquire more than 3% of the voting stock of any investment company (unless certain conditions are satisfied), invest more than 5% of the value of our total assets in the securities of one investment company or invest more than 10% of the value of our total assets in the securities of investment companies in the aggregate. The portion of our portfolio invested in securities issued by investment companies ordinarily will subject our stockholders to additional indirect expenses. Our investment portfolio is also subject to diversification requirements by virtue of our intended status to be a RIC for U.S. tax purposes. See Part I, Item 1A of this Form 10-K “Risk Factors—Risks Related to Our Business and Structure” for more information.
In addition, investment companies registered under the Investment Company Act and private funds that are excluded from the definition of “investment company” pursuant to either Section 3(c)(1) or 3(c)(7) of the Investment Company Act may not acquire directly or through a controlled entity more than 3% of our total outstanding voting stock (measured at the time of the acquisition), unless the funds comply with an exemption under the Investment Company Act. As a result, certain of our investors may hold a smaller position in our shares than if they were not subject to these restrictions.
We are generally not able to issue and sell our common stock at a price below net asset value ("NAV") per share. We may, however, sell our common stock, or warrants, options or rights to acquire our common stock, at a price below the then-current NAV of our common stock if our Independent Directors determine that such sale is in our best interests and the best interests of our stockholders, and our stockholders approve such sale. In any such case, the price at which our common stock is to be issued and sold may not be less than a price that, in the determination of our Independent Directors, closely approximates the market value of such shares (less any distributing commission or discount). In addition, we may generally issue new shares of our common stock at a price below NAV in rights offerings to existing stockholders, in payment of dividends and in certain other limited circumstances. Pursuant to approval granted at a special meeting of stockholders held on October 28, 2021, we are authorized, with the approval of the Board of Directors, to sell or otherwise issue shares of our common stock at a price below the then-current NAV per share, subject to certain limitations (including that the number of shares issued does not exceed 25% of our then-outstanding common stock immediately prior to each such offering). Such stockholder approval expires on October 28, 2022. See Part I, Item 1A of this Form 10-K Risk Factors—Risks Related to Our Business and Structure—Regulations governing our operation as a BDC affect our ability to, and the way in which we will, raise additional capital. As a BDC, the necessity of raising additional capital may expose us to risks, including the typical risks associated with leverage.leverageWe may, however, sell our common stock, or warrants, options or rights to acquire our common stock, at a price below the then-currentand “—The NAV per share of our common stock may be diluted if our Board of Directors determines that such sale is in our best interests and the best interests of our stockholders, and our stockholders approve such sale. In addition, we may generally issue newsell shares of our common stock in one or more offerings at a priceprices below the then current NAV in rights offerings to existing stockholders, in paymentper share of dividends and in certain other limited circumstances.our common stock.”
We will be periodically examinedare subject to periodic examination by the SEC for compliance with the Investment Company Act.
As a BDC, we are subject to certain risks and uncertainties. See Part I, Item 1A of this Form 10-K “Risk Factors—Risks Related to Our Business and Structure.
Qualifying Assets
As a BDC, we generally have to invest at least 70% of our total assets in “qualifying assets,” including securities and indebtedness of private U.S. companies and certain public U.S. companies, cash, cash equivalents, U.S. government securities and high-quality debt investments that mature in one year or less. We also may invest up to 30% of our portfolio opportunistically in “non-qualifyingnon-qualifying assets,” which will be driven primarily through opportunities sourced through as permitted by the CDL platform. However,Investment Company Act. Specifically, as part of this 30% basket, we may invest in entities that are not considered “eligible portfolio companies” (as defined in the Investment Company Act), including companies located outside of the United States, entities that are operating pursuant to certain exceptions under the Investment Company Act, a BDC may not acquire any asset other than assets ofand publicly traded entities whose public equity market capitalization exceeds the type listed in Section 55(a) oflevels provided for under the Investment Company Act, which are referred to as “qualifying assets,” unless, at the time the acquisition is made, qualifying assets represent at least 70% of the BDC’s total assets. The principal categories of qualifying assets relevant to our proposed business are the following:Act.
18


(1)Securities purchased in transactions not involving any public offering from the issuer of such securities, which issuer (subject to certain limited exceptions) is an eligible portfolio company, or from any person who is, or has been during the preceding 13 months, an affiliated person of an eligible portfolio company, or from any other person, subject to such rules as may be prescribed by the SEC. An eligible portfolio company is defined in the Investment Company Act as any issuer which:
a.is organized under the laws of, and has its principal place of business in, the United States;
b.is not an investment company (other than a small business investment company wholly owned by the BDC) or a company that would be an investment company but for certain exclusions under the Investment Company Act; and
c.satisfies any of the following:
i.does not have any class of securities that is traded on a national securities exchange;
ii.has a class of securities listed on a national securities exchange, but has an aggregate market value of outstanding voting and non-voting common equity of less than $250 million;
iii.is controlled by a BDC or a group of companies including a BDC and the BDC has an affiliated person who is a director of the eligible portfolio company; or
iv.is a small and solvent company having total assets of not more than $4.0 million and capital and surplus of not less than $2.0 million.
(2)Securities of any eligible portfolio company which we control.
(3)Securities purchased in a private transaction from a U.S. issuer that is not an investment company or from an affiliated person of the issuer, or in transactions incident thereto, if the issuer is in bankruptcy and subject to reorganization or if the issuer, immediately prior to the purchase of its securities, was unable to meet its obligations as they came due without material assistance other than conventional lending or financing arrangements.
(4)Securities of an eligible portfolio company purchased from any person in a private transaction if there is no ready market for such securities and we already own 60% of the outstanding equity of the eligible portfolio company.
(5)Securities received in exchange for or distributed on or with respect to securities described in (1) through (4) above, or pursuant to the exercise of warrants or rights relating to such securities.
(6)Cash, cash equivalents, U.S. government securities or high-quality debt securities maturing in one year or less from the time of investment.
Managerial Assistance to Portfolio Companies
A    As a BDC, we must have been organized under the laws of, and have its principal place of business in, any state or states within the United Statesoffer, and must be operated for the purpose of making investments in the types of securities described in (1), (2) or (3) above. However, in order to count portfolio securities as qualifying assets for the purpose of the 70% test, the BDC must either control the issuer of the securities or must offer to make available to the issuer of the securities (other than small and solvent companies described above)provide upon request, significant managerial assistance; except that, where the BDC purchases such securities in conjunction with one or more other persons acting together, oneassistance to certain of the other persons in the group may make available such managerial assistance. Making available managerialour portfolio companies. This assistance means,could involve, among other things, any arrangement wherebymonitoring the BDC, through its directors,operations of our portfolio companies, participating in board and management meetings, consulting with and advising officers or employees, offers to provide,of portfolio companies and if accepted, does so provide, significant guidanceproviding other organizational and counsel concerning the management, operations or business objectives and policies of a portfolio company.financial guidance. Our Investment Adviser or an affiliate thereof may provide such managerialall or a portion of this assistance onpursuant to our behalf to portfolio companies that request such assistance.administration agreement, the costs of which will be reimbursed by us. We may receive fees for these services.

Temporary Investments
Pending investment in other types of “qualifying assets,” as described above, our investments may consist of cash, cash equivalents, U.S. government securities or high-quality debt securities maturing in one year or less from the time of


investment, which we refer to, collectively, as “temporary investments,” so that 70% of our assets are qualifying assets. We may also invest in U.S. Treasury bills or in repurchase agreements, provided that such agreements are fully collateralized by cash or securities issued by the U.S. government or its agencies. A repurchase agreement involves the purchase by an investor, such as us, of a specified security and the simultaneous agreement by the seller to repurchase it at an agreed-upon future date and at a price which is greater than the purchase price by an amount that reflects an agreed-upon interest rate. There is no percentage restriction on the proportion of our assets that may be invested in such repurchase agreements. However, if more than 25% of our gross assets constitute repurchase agreements from a single counterparty, we would not meet the diversification tests in order to qualify as a RIC. Thus, we do not intend to enter into repurchase agreements with a single counterparty in excess of this limit. Our Investment Adviser will monitor the creditworthiness of the counterparties with which we enter into repurchase agreement transactions.
Indebtedness and Senior Securities
We are permitted, under specified conditions, to issue multiple classes of indebtedness and one class of stock senior to our common stock if our asset coverage, as defined in the Investment Company Act, is at least equal to 200%150% immediately after each such issuance. In addition, while any senior securities remain outstanding, we must make provisions to prohibit any distribution to our stockholders or the repurchase of such securities or shares unless we meet the applicable asset coverage ratios at the time of the distribution or repurchase. We may also borrow amounts up to 5% of the value of our total assets for temporary or emergency purposes without regard to asset coverage. For a discussion of the risks associated with leverage, see Part I, Item 1A of this Form 10-K “Risk Factor—Risks Relating to Our Business and Structure—Regulations governing our operation as a BDC affect our ability to, and the way in which we will, raise additional capital. As a BDC, the necessity of raising additional capital may expose us to risks, including the typical risks associated with leverage.
CodeCodes of Ethics
We have adopted a code of ethics pursuant to Rule 17j-1 under the Investment Company Act and our Investment Adviser have eachhas adopted a code of ethics pursuant to Rule 17j-1 under the Investment Company Act and Rule 204A-1 under the Advisers Act, respectively that establishes(collectively, the “Rule 17j-1 Codes of Ethics”), which establish procedures for personal investments and restricts certain transactions byand apply to, among others, our personnel. Our codesChief Executive Officer and Chief Financial Officer. The Rule 17j-1Codes of ethicsEthics generally do not permit investments by our and our Investment Adviser’s personnel subject to them in securities that may be purchased or sold by us. Our codeThe Rule 17j-1 Code of ethics isEthics are filed with the SEC. For informationSEC (www.sec.gov).
We have also adopted a Code of Ethics for Principal Executive and Senior Financial Officers under the Sarbanes-Oxley Act of 2002 (the “SOX Code of Ethics”), which applies to, among others, our Chief Executive Officer and Chief Financial Officer. The SOX Code of Ethics is available free of charge on howour website (http://www.tcgbdc.com).
There have been no material changes to obtain a copythe Rule 17j-1 Code of Ethics or the SOX Code of Ethics or material waivers of the code of ethics, see “—Reporting Obligations and Available Information.that apply to our Chief Executive Officer or Chief Financial Officer.
Compliance Policies and Procedures
We and our Investment Adviser have each adopted and implemented written policies and procedures reasonably designed to detect and prevent violation of the federal securities laws and are required to review these compliance policies and procedures annually for their adequacy and the effectiveness of their implementation and designate aimplementation. Our Chief Compliance Officer to beis responsible for administering thethese policies and procedures.


Sarbanes-Oxley Act of 2002
The Sarbanes-Oxley Act of 2002, as amended (the “Sarbanes-Oxley Act”) imposes a wide variety of regulatory
19

requirements on publicly-held companies and their insiders. Many of these requirements affect us. For example:
 
pursuant to Rule 13a-14 of the Securities and Exchange Act of 1934, as amended (the “Exchange Act”), our Chief Executive Officer and Chief Financial Officer must certify the accuracy of the financial statements contained in our periodic reports;
pursuant to Item 307 of Regulation S-K, our periodic reports must disclose our conclusions about the effectiveness of our disclosure controls and procedures;
pursuant to Rule 13a-15 of the Exchange Act, our management must prepare a report regarding its assessment of our internal control over financial reporting and must obtain an audit of the effectiveness of internal control over financial reporting performed by our independent registered public accounting firm; and
pursuant to Item 308 of Regulation S-K and Rule 13a-15 of the Exchange Act, our periodic reports must disclose whether there were significant changes in our internal controls over financial reporting or in other factors that could significantly affect these controls subsequent to the date of their evaluation, including any corrective actions with regard to material weaknesses.
The Sarbanes-Oxley Act requires us to review our current policies and procedures to determine whether we comply with the Sarbanes-Oxley Act and the regulations promulgated thereunder. We will continue to monitor our compliance with all regulations that are adopted under the Sarbanes-Oxley Act and will take actions necessary to ensure that we are in compliance therewith.
Jumpstart Our Business Startups Act
Until December 31, 2017, we were an “emerging growth company,” as that term is used in the Jumpstart Our Business Startups Act, or the JOBS Act. As of June 30, 2017, the market value of the common stock held by non-affiliates exceeded $700 million. Accordingly, we ceased to be an emerging growth company as of December 31, 2017.
Proxy Voting Policies and Procedures
We have delegated our proxy voting responsibility to our Investment Adviser. The proxy voting policies and procedures of our Investment Adviser are set forth below. These guidelines are reviewed periodically by our Investment Adviser and our Independent Directors, and, accordingly, are subject to change.
An investment adviser registered under the Advisers Act has a fiduciary duty to act solely in the best interests of its clients. As part of this duty, our Investment Adviser recognizes that it must vote portfolio securities in a timely manner free of conflicts of interest and in the best interests of its clients.
These policies and procedures for voting proxies are intended to comply with Section 206 of, and Rule 206(4)-6 under, the Advisers Act.
Our Investment Adviser will vote proxies relating to our portfolio securities in what it perceives to be the best interest of our stockholders. Our Investment Adviser will review on a case-by-case basis each proposal submitted to a stockholder vote to determine its impact on the portfolio securities held by us. Although our Investment Adviser will generally vote against proposals that may have a negative impact on our portfolio securities, it may vote for such a proposal if there exist compelling long-term reasons to do so.
Our Investment Adviser’s proxy voting decisions will be made by its investment committee. To ensure that the vote is not the product of a conflict of interest, our Investment Adviser will require that: (1) anyone involved in the decision making process disclose to our Investment Adviser’s investment committee, and Independent Directors, any potential conflict that he or she is aware of and any contact that he or she has had with any interested party regarding a proxy vote; and (2) employees involved in the decision making process or vote administration are prohibited from revealing how our Investment Adviser intends to vote on a proposal in order to reduce any attempted influence from interested parties.

Stockholders may obtain information regarding how we voted proxies by making a written request for proxy voting information to: TCG BDC, Inc., c/o Carlyle Global Credit Investment Management L.L.C., 520 MadisonOne Vanderbilt Avenue, 40th Floor,Suite 3400, New York, NY 10022.10017.
Privacy Principles
We endeavor to maintain the privacy of our stockholders and to safeguard their non-public personal information. The following information is provided to help stockholders understand what non-public personal information we collect, how we protect that information and why, in certain cases, we may share that information with select other parties.
20

We may collect non-public personal information about stockholders from our subscription agreements or other forms, such as name, address, account number and the types and amounts of investments, and information about transactions with us or our affiliates, such as participation in other investment programs, ownership of certain types of accounts or other account data and activity. We may disclose the non-public personal information that we collect from our stockholders or former stockholders, as described above, to our affiliates and service providers and as allowed by applicable law or regulation. Any party that receives this information from us is permitted to use it only for the services required by us and as allowed by applicable law or regulation, and is not permitted to share or use this information for any other purpose. We permit access only by authorized personnel who need access to that non-public personal information to provide services to us and our stockholders. We also maintain physical, electronic and procedural safeguards for non-public personal information that are designed to comply with applicable law.
Compliance with Listing Requirements
Our shares of common stock began trading on the NASDAQNasdaq Global Select Market under the symbol “CGBD” on June 14, 2017. As a listed company on the NASDAQNasdaq Global Select Market, we are subject to various listing standards including corporate governance listing standards. We will monitor our compliance with all listing standards and will take actions necessary to ensure that we are in compliance therewith.
Reporting Obligations and Available Information
We furnish our stockholders with annual reports containing audited financial statements, quarterly reports, and such other periodic reports as we determine to be appropriate or as may be required by law. We are required to comply with all periodic reporting, proxy solicitation and other applicable requirements under the Exchange Act.
Our annual reports on Form 10-K, quarterly reports on Form 10-Q, current reports on Form 8-K, Definitive Proxy Statement on Schedule 14A, as well as reports on Forms 3, 4 and 5 regarding directors, officers or 10% beneficial owners of us, filed or furnished pursuant to section 13(a), 15(d) or 16(a) of the Exchange Act, are available free of charge on our website (http://www.tcgbdc.com).
Stockholders and the public may also read and copy any materials we file with the SEC at the SEC’s Public Reference Room at 100 F Street, NE, Washington, DC 20549. The public may also obtain information on the operation of the Public Reference Room by calling the SEC at 1-800-SEC-0330. The SEC also maintains a website (www.sec.gov) that contains such information.reports, proxy and information statements, and other information regarding issuers that file electronically with the SEC, including us, which can be accessed at www.sec.gov.
Competition
Our primary competitors in providing financing to middle market companies include public and private funds, other BDCs, commercial and investment banks, collateralized loan obligations, commercial finance companies and, to the extent they provide an alternative form of financing, private equity and hedge funds. Many of our potential competitors are substantially larger and have considerably greater financial, technical and marketing resources than we do. For example, some competitors may have a lower cost of funds and access to funding sources that will not be available to us. In addition, some of our competitors may have higher risk tolerances or different risk assessments than we do, which could allow them to consider a wider variety of investments and establish more relationships than us. Furthermore, many of our competitors are not subject to the regulatory restrictions that the Investment Company Act and the Code impose on us. We cannot assure you that the competitive pressures we will face will not have a material adverse effect on our business, financial condition and results of operations. Also, as a result of this competition, we may not be able to take advantage of attractive investment opportunities from time to time, and we can offer no assurance that we will be able to identify and make investments that are consistent with our investment objective.

We expect to use the expertise of the members of our Investment Adviser’s investment committee and its investment team to assess investment risks and determine appropriate pricing for our investments. In addition, we expect that extensive direct origination resources, broad product capabilities, ability to commit capital in scale and the relationships developed bydepth of expertise of our Investment Adviser’s investment team will enable us to learn about and compete effectively for, financing opportunities with attractive middle market companies in the industries in which we seek to invest. For additional information concerning the competitive risks we face, see Part I, Item 1A of this Form 10-K “Risk Factors—Risks Related to Our Investments—We operate in a highly competitive market for investment opportunities, and compete with investment vehicles sponsored or advised by our affiliates”affiliates.
21

Staffing
We do not currently have any employees. Our Chief Financial Officer, anda Managing Director of Carlyle, Treasurer and Chief OperatingPrincipal Accounting Officer, each a Managing Director of Carlyle, and our Chief Compliance Officer and Secretary, a Vice PresidentManaging Director of Carlyle, are retained by our Administrator pursuant to the Carlyle Sub-Administration Agreements.Agreement. Each of these professionals performs their respective functions for us under the terms of our Administration Agreement.
Our day-to-day investment operations are managed by our Investment Adviser. Pursuant to its personnel agreement with Carlyle Employee Co., our Investment Adviser has access to the members of its investment committee, and a team of additional experienced investment professionals who, collectively, comprise the Investment Adviser’s investment team. Our Investment Adviser may hire additional investment professionals to provide services to us.
22

Item 1A. Risk Factors
Potential investors should be aware
Summary of Risk Factors
The following is only a summary of the principal risks that an investment in the Company involves a high degree of risk. There can be no assurance that the Company’s investment objective will be achieved or that an investor will receive a return of its capital. In addition, there will be occasions when the Investment Adviser and its affiliates may encounter potential conflicts of interest in connection with the Company. The risks set out below are not the only risks we face. Additional risks and uncertainties not currently known to us or that we currently deem to be immaterial also may materially adversely affect our business, financial condition, and/or operating results.results of operations and cash flows. The following considerations,should be read in addition toconjunction with the considerationscomplete discussion of risk factors we face, which are set forth elsewhere herein, should be carefully evaluated before making an investment in the Company. If any of the following events occur, our business, financial condition and operating result could be materially and adversely affected. In such case, the NAV and the trading price of our common stock and the trading price, if any, of any other securities that we may issue could decline, and you may lose all or part of your investment.below under "—Risk Factors".
Risks Related to Our Business and Structure
CapitalWe are currently operating in a period of capital markets disruption and economic uncertainty, and capital markets may experience periods of disruption and instability.instability in the future. These market conditions may materially and adversely affect debt and equity capital markets in the United States and abroad, which may in the future have a negative impact on our business and operations.
From time to time, capital markets may experience periods of disruption and instability. During such periods of market disruption and instability, we and other companies in the financial services sector may have limited access, if available, to alternative markets for debt and equity capital. Equity capital may be difficult to raise because, subject to some limited exceptions which will apply to us as a BDC, we will generally not be able to issue additional shares of our common stock at a price less than NAV without first obtaining approval for such issuance from our stockholders and our Independent Directors. In addition, our ability to incur indebtedness (including by issuing preferred stock) is limited by applicable regulations such that our asset coverage, as defined in the Investment Company Act, must equal at least 200% immediately after each time we incur indebtedness. The debt capital that will be available, if at all, may be at a higher cost and on less favorable terms and conditions in the future. Any inability to raise capital could have a negative effect on our business, financial condition and results of operations.
Given the extreme volatility and dislocation in the capital markets from time to time, many BDCs have faced,COVID-19 pandemic has adversely affected, and may in the future face, a challenging environment in whichcontinue to raise or access capital. In addition, significant changes in the capital markets, including the extreme volatility and disruption from time to time, has had, and may in the future have, a negative effect on the valuations of our investments and on the potential for liquidity events involving these investments. While most of our investments are not publicly traded, applicable accounting standards require us to assume as part of our valuation process that our investments are sold in a principal market to market participants (even if we plan on holding an investment through its maturity). As a result, volatility in the capital markets can adversely affect, our investment valuations. Further,portfolio companies and the illiquidityresults of our investments may make it difficult for us to sell such investments if required and to value such investments. As a result, we may realize significantly less than the value at which we will have recorded our investments. An inability to raise capital, andoperations.

any required sale of our investments for liquidity purposes, could have a material adverse impact on our business, financial condition or results of operations.
Economic recessions or downturns could impair our portfolio companies and harm our operating results.
ManyInflation may adversely affect the business, results of the portfolio companies in which we make investments may be susceptible to economic slowdowns or recessionsoperations and may be unable to repay the loans we made to them during these periods. Therefore, our non-performing assets may increase and the valuefinancial condition of our portfolio may decrease during these periods as we are required to record our investments at their current fair value. Adverse economic conditions also may decrease the value of collateral securing some of our loans and the value of our equity investments. Economic slowdowns or recessions could lead to financial losses in our portfolio and a decrease in revenues, net income and assets. Unfavorable economic conditions also could increase our and our portfolio companies’ funding costs, limit our and our portfolio companies’ access to the capital markets or result in a decision by lenders not to extend credit to us or our portfolio companies. These events could prevent us from increasing investments and harm our operating results.
A portfolio company’s failure to satisfy financial or operating covenants imposed by us or other lenders could lead to defaults and, potentially, acceleration of the time when the loans are due and foreclosure on its secured assets, which could trigger cross-defaults under other agreements and jeopardize the portfolio company’s ability to meet its obligations under the debt that we hold. We may incur additional expenses to the extent necessary to seek recovery upon default or to negotiate new terms with a defaulting portfolio company. In addition, if one of our portfolio companies were to go bankrupt, depending on the facts and circumstances, including the extent to which we will actually provide significant managerial assistance to that portfolio company, a bankruptcy court might subordinate all or a portion of our claim to that of other creditors.
We are dependent upon our Investment Adviser for our future success.
We do not have any employees. We depend on the diligence, skillsuccess, and networkthere are significant potential conflicts of business contacts of our Investment Adviser’s investment professionals and CDL to source appropriate investments for us. We depend on members of our Investment Adviser’s investment team to appropriately analyze our investments and our Investment Adviser’s investment committee to approve and monitor our middle market portfolio investments. Our Investment Adviser’s investment committee, together with the other members of its investment team, evaluate, negotiate, structure, close and monitor our investments. Our future success will depend on the continued availability of the members of our Investment Adviser’s investment committee and the other investment professionals available to our Investment Adviser. Neither we nor our Investment Adviser has employment agreements with these individuals or other key personnel, and we cannot provide any assurance that unforeseen business, medical, personal or other circumstances would not lead any such individual to terminate his or her relationship with us. The loss of Mr. Hart, or any of the other senior investment professionals tointerest which our Investment Adviser has access, could have a material adverse effect on our ability to achieveimpact our investment objective as well as on our financial condition and results of operations. In addition, we cannot assure you that CGCIM will remain our investment adviser or that we will continue to have access to Carlyle’s investment professionals or its information and deal flow. Further, the can be no assurance that CGCIM will replicate its own or Carlyle’s historical success, and we caution you that our investment returns could be substantially lower than the returns achieved by other Carlyle-managed funds.returns.

Our financial condition, results of operations and ability to achieve our investment objective depend on our ability to source investments, access financing and manage future growth effectively.
Our ability to achieve our investment objective and to grow depends on our ability to acquire suitable investments and monitor and administer those investments, which depends, in turn, on our Investment Adviser’s ability to identify, invest in and monitor companies that meet our investment criteria.
Accomplishing this result on a cost-effective basis is largely a function of our Investment Adviser’s structuring of the investment process, its ability to provide competent, attentive and efficient services to us and its ability to access financing for us on acceptable terms. Our Investment Adviser’s investment team has substantial responsibilities under the investment advisory agreement between us and our Investment Adviser (the “Investment Advisory Agreement”) and in connection with managing us and certain other investment funds and accounts advised by our Investment Adviser, and may also be called upon to provide managerial assistance to our portfolio companies. These demands on their time, which will increase as the number of investments grow, may distract them or slow the rate of investment. In order for us to grow, Carlyle will need to hire, train, supervise, manage and retain new employees. However, we can offer no assurance that any such investment professionals will contribute effectively to the work of our Investment Adviser. Any failure to manage our future growth effectively could have a material adverse effect on our business, financial condition and results of operations.
We may need to raise additional capital to grow because we must distribute most of our income.


We may need additional capital to fund growthexperience fluctuations in our investments, and a reduction in the availability of new capital could limit our ability to grow. We have elected to be treated, and intend to qualify annually, as a RIC for U.S. federal income tax purposes under Subchapter M of the Code. To maintain our status as a RIC, among other requirements, we must distribute on a timely basis at least 90% of our investment company taxable income to our stockholders to maintain our RIC status. As a result, any such cash earnings may not be available to fund investment originations or repay maturing debt. We have borrowed under the Facilities and through the issuance of the 2015-1 Notes and in the future may borrow under additional debt facilities from financial institutions. We must continue to issue additional debt and equity securities to fund our growth. If we fail to obtain funds from such sources or from other sources to fund our investments, it could limit our ability to grow, which may have an adverse effect on the value of our securities. We may pursue growth through acquisitions or strategic investments in new businesses. Completion and timing of any such acquisitions or strategic investments may be subject to a number of contingencies and risks. There can be no assurance that the integration of an acquired business will be successful or that an acquired business will prove to be profitable or sustainable.quarterly results.
In addition, as a BDC, our ability to borrow or issue preferred stock may be restricted if our total assets are less than 200% of our total borrowings and preferred stock. Furthermore, equity capital may be difficult to raise because, subject to some limited exceptions, as a BDC, we are generally not able to issue additional shares of our common stock at a price per share less than NAV without first obtaining approval for such issuance from our stockholders and our Independent Directors.
Any failure on our part to maintain our status as a BDC or RIC would reduce our operating flexibility, may hinder our achievement of our investment objective, may limit our investment choices and may subject us to greater regulation.
The Investment Company Act imposes numerous constraints on the operations of BDCs and RICs that do not applyWe may need to other types of investment vehicles. For example, under the Investment Company Act,raise additional capital to grow because we are required as a BDC to invest at least 70%must distribute most of our total assets in specified types of “qualifying assets,” primarily in private U.S. companies or thinly-traded U.S. public companies, cash, cash equivalents, U.S. government securities and other high quality debt investments that mature in one year or less. In addition, in order to continue to qualify as a RIC for U.S. federal income tax purposes, we are required to satisfy certain source-of-income, diversification and distribution requirements. These constraints, among others, may hinder our ability to take advantage of attractive investment opportunities and to achieve our investment objective. See Part I, Item 1 of this Form 10-K “Business—Election to be Taxed as a RIC.”
Furthermore, any failure to comply with the requirements imposed on us as a BDC by the Investment Company Act could cause the SEC to bring an enforcement action against us and/or expose us to claims of private litigants. In addition, upon approval of a majority of our outstanding voting securities as required by the Investment Company Act, we may elect to withdraw our status as a BDC. If we decide to withdraw our election, or if we otherwise fail to qualify, or maintain our qualification, as a BDC, we might be regulated as a closed-end investment company that is required to register under the Investment Company Act, which would subject us to additional regulatory restrictions, significantly decrease our operating flexibility and could significantly increase our cost of doing business. In addition, any such failure could cause an event of default under our outstanding indebtedness, which could have a material adverse effect on our business, financial condition or results of operations.
income. Regulations governing our operation as a BDC affect our ability to, and the way in which we will, raise additional capital. As a BDC, the necessity of raising additional capital may expose us
Pursuant to risks, including the typical risks associated with leverage.
We may issue debt securities or preferred stock and/or borrow money from banks or other financial institutions, which we refer to collectively as “senior securities,” up to the maximum amount permittedapproval granted by the Investment Company Act. In addition, we may seek to securitize certain of our loans. Under the provisions of the Investment Company Act,stockholders, we are permitted, as a BDC, to issue senior securities only in amounts such that our asset coverage ratio, as defined in the Investment Company Act, equals at least 200% of total assets less all liabilities and indebtedness not represented by senior securities, after each issuance of senior securities. If the value of our assets declines, we may be unable to satisfy this test, which may prohibit us from paying dividends and could prevent us from maintaining our status as a RIC or may prohibit us from repurchasing shares of our common stock. If that happens, we may be requiredauthorized to sell a portionor issue shares of our investments and, depending on the nature of our leverage, repay a portion of our indebtedness at a time when such sales may be disadvantageous. Accordingly, any failure to satisfy this test could have a material adverse effect on our business, financial condition or results of operations. As of December 31, 2017, our asset coverage calculated in accordance with the Investment Company Act was 234.86%. Also, any amounts that we use to service our indebtedness would not be available for distributions to our common stockholders. Furthermore, as a result of issuing senior securities, our common stockholders would also be exposed to typical risks associated with increased leverage, including an increased risk of loss resulting from increased indebtedness.


If we issue preferred stock, the preferred stock would rank “senior” to common stock in our capital structure, preferred stockholders would have separate voting rights on certain matters and might have other rights, preferences, or privileges more favorable than those of our common stockholders, and the issuance of preferred stock could have the effect of delaying, deferring or preventing a transaction or a change of control that might involve a premium price for holders of our common stock or otherwise be in their best interest.
We are not generally able to issue and sell our common stock at a price below the then current NAV per share. We may, however, sellThe NAV per share of our common stock or warrants, options or rights to acquiremay be diluted if we sell shares of our common stock at a priceprices below the then-current NAV per share of our common stock if our Board determines that such sale is in the best interests of us and our stockholders and our stockholders approve such sale. In any such case, the price at which our securities are to be issued and sold may not be less than a price that, in the determination of our Board of Directors, closely approximates the market value of such securities (less any distributing commission or discount). If we raise additional funds by issuing more common stock, or senior securities convertible into, or exchangeable for, our common stock, then the percentage ownership of our stockholders at that time will decrease, and holders of our common stock might experience dilution.stock.

We borrow money, which magnifies the potential for gain or loss on amounts invested and may increase the risk of investing in us.
As part of our business strategy, we, including through our wholly owned subsidiaries, borrow from and may in the future issue additional senior debt securities to banks, insurance companies and other lenders. Holders of these loans or senior securities would have fixed-dollar claims on our assets that are superior to the claims of our stockholders. If the value of our assets decreases, leverage will cause our NAV to decline more sharply than it otherwise would have without leverage. Similarly, any decrease in our income would cause our net income to decline more sharply than it would have if we had not borrowed. This decline could negatively affect our ability to make dividend payments on our common stock.
Our ability to service our borrowings depends largely on our financial performance and is subject to prevailing economic conditions and competitive pressures. In addition, our management fees are payable based on our gross assets, including assets acquired through the use of leverage (but excluding cash and any temporary investments in cash-equivalents), which may give our Investment Adviser an incentive to use leverage to make additional investments. See “—We may be obligated to pay our Investment Adviser incentive compensation even if we incur a loss.” The amount of leverage that we employ will depend on our Investment Adviser’s and our Board of Directors’ assessment of market and other factors at the time of any proposed borrowing. We cannot assure you that we will be able to obtain credit at all or on terms acceptable to us.
In addition to having fixed-dollar claims on our assets that are superior to the claims of our common stockholders, obligations to lenders may be secured by a first priority security interest in our portfolio of investments and cash. In the case of a liquidation event, those lenders would receive proceeds to the extent of their security interest before any distributions are made to our stockholders. In addition, as the holder of the preferred interests issued by the 2015-1 Issuer (the “2015-1 Issuer Preferred Interests”) on the closing date of the 2015-1 Debt Securitization in exchange for our contribution to the 2015-1 Issuer of the initial closing date loan portfolio (i.e., the subordinated class of the 2015-1 Securitization), we may be required to absorb losses with respect to the 2015-1 Debt Securitization.
Our Facilities and the 2015-1 Notes impose financial and operating covenants that restrict our business activities, remedies on default and similar matters. As of December 31, 2017, we were in material compliance with the operating and financial covenants of our Facilities and the 2015-1 Notes. However, our continued compliance with these covenants depends on many factors, some of which are beyond our control. Accordingly, although we believe we will continue to be in compliance, we cannot assure you that we will continue to comply with the covenants in our Facilities and the 2015-1 Notes. Failure to comply with these covenants could result in a default. If we were unable to obtain a waiver of a default from the lenders or holders of that indebtedness, as applicable, those lenders or holders could accelerate repayment under that indebtedness, which may result in cross-acceleration of other indebtedness. An acceleration could have a material adverse impact on our business, financial condition and results of operations. Lastly, we may be unable to obtain additional leverage, which would, in turn, affect our return on capital.
As of December 31, 2017, we had a combined $835.9 million of outstanding consolidated indebtedness under our Facilities and 2015-1 Notes. Our annualized interest cost as of December 31, 2017, was 3.52%, excluding fees (such as fees on undrawn amounts and amortization of upfront fees). Since we generally pay interest at a floating rate on our Facilities and 2015-1 Notes, an increase in interest rates will generally increase our borrowing costs.


The following table illustrates the effect of leverage on returns from an investment in our common stock assuming various annual returns on our portfolio, net of expenses. The calculations in the table below are hypothetical, and actual returns may be higher or lower than those appearing in the table below.
 
Assumed Return on Our Portfolio (Net of Expenses)
 (10)%(5)%0%5%10%
Corresponding return to common stockholder (1)
   (20.54)%   (11.58)%   (2.61)%   6.35%   15.32%

(1)Assumes, as of December 31, 2017, (i) $2,021.4 million in total assets, (ii) $835.9 million in outstanding indebtedness, (iii) $1,127 million in net assets and (iv) weighted average interest rate, excluding fees (such as fees on undrawn amounts and amortization of financing costs), of 3.52%.
Based on an outstanding indebtedness of $835.9 million as of December 31, 2017, and the weighted average effective annual interest rate, excluding fees (such as fees on undrawn amounts and amortization of financing costs), of 3.52% as of that date, our investment portfolio at fair value would have had to produce an annual return of approximately 1.46% to cover annual interest payments on the outstanding debt. For more information on our indebtedness, see Part II, Item 7 of this Form 10-K “Management’s Discussion and Analysis of Financial Condition and Results of Operations—Financial Condition, Liquidity and Capital Resources.
Our indebtedness could adversely affect our business, financial conditions or results of operations.
We cannot assure you that our business will generate sufficient cash flow from operations or that future borrowings will be available to us under our credit facilities or otherwise in an amount sufficient to enable us to repay our indebtedness or to fund our other liquidity needs. We may need to refinance all or a portion of our indebtedness on or before it matures. We cannot assure you that we will be able to refinance any of our indebtedness on commercially reasonable terms or at all. If we cannot service our indebtedness, we may have to take actions such as selling assets or seeking additional equity. We cannot assure you that any such actions, if necessary, could be effected on commercially reasonable terms or at all, or on terms that would not be disadvantageous to our stockholders or on terms that would not require us to breach the terms and conditions of our existing or future debt agreements.
Changes in interest rates may increase our cost of capital, reduce the ability of our portfolio companies to service their debt obligations and decrease our net investment income.
General interest rate fluctuations The discontinuation of LIBOR and changes in credit spreads on floating rate loans may have a substantial negative impact on our investments and investment opportunities and, accordingly, may have a material adverse effect on our rate of return on invested capital, our net investment income and our NAV. Substantially all of our debt investments have variable interest rates that reset periodically based on benchmarks such as the London Interbank Offered Rate (“LIBOR” or “L”) and the U.S. Prime Rate (“Prime Rate” or “P”), so an increase in interest rates from their historically low present levels may make it more difficult for our portfolio companies to service their obligations under the debt investments that we will hold. Rising interest rates could also cause portfolio companies to shift cash from other productive uses to the payment of interest, which may have a material adverse effect on their business and operations and could, over time, lead to increased defaults. In addition, on July 27, 2017, the U.K. Financial Conduct Authority announced that it intends to stop persuading or compelling banks to submit LIBOR rates after 2021. At this time, it is not possible to predict the effect of any such changes, any establishmentadoption of alternative reference rates or any other reforms to LIBOR that may be enacted in the United Kingdom or elsewhere. adversely affect our business and results of operations.
The eliminationimpact of LIBOR or any other changes or reforms to the determination or supervision of LIBOR could have an adverse impact on the market for or value of any LIBOR-linked securities, loans, and other financial obligations or extensions of credit held by or due to us orBrexit on our overall financial condition or results of operations. Itinvestments is unclear how increased regulatory oversightuncertain and changes in the method for determining LIBOR may affect the value of the financial obligations to be held by or issued to us that are linked to LIBOR, or how such changes could adversely affect our results of operations or financial condition.business.
Furthermore, to the extent we borrow money to make investments, our net investment income depends, in part, upon the difference between the rate at which we borrow funds and the rate at which we invest those funds. As a result, we can offer no assurance that a significant change in market interest rates will not have a material adverse effect on our net investment income to the extent we use debt to finance our investments. In periods of rising interest rates, our cost of funds would increase, which could reduce our net investment income.
In addition, a rise in the general level of interest rates can be expected to lead to higher interest rates applicable to our debt investments. Accordingly, an increase in interest rates would make it easier for us to meet or exceed the incentive fee


hurdle rate in our Investment Advisory Agreement and may result in a substantial increase in the amount of incentive fees payable to our Investment Adviser with respect to our pre-incentive fee net investment income.
We may experience fluctuations in our quarterly results.
We could experience fluctuations in our quarterly operating results due to a number of factors, including, the pace at which investments are made, the interest rate payable on the debt securities we acquire, the default rate on such securities, rates of repayment, the level of our expenses, variations in and the timing of the recognition of realized and unrealized gains or losses and changes in unrealized appreciation or depreciation, the degree to which we encounter competition in our markets and general economic conditions. As a result of these factors, results for any period should not be relied upon as being indicative of performance in future periods.
There are significant potential conflicts of interest, including the management of other investment funds and accounts by our Investment Adviser, which could impact our investment returns.
Our executive officers and directors, other current and future principals of our Investment Adviser and certain members of our Investment Adviser’s investment committee may serve as officers, directors or principals of other entities and affiliates of our Investment Adviser and funds managed by our affiliates that operate in the same or a related line of business as we do. Currently, our executive officers, as well as the other principals of our Investment Adviser manage other funds affiliated with Carlyle, including other existing and future affiliated BDCs, including TCG BDC II, Inc. (“BDC II”). In addition, our Investment Adviser’s investment team has responsibilities for sourcing and managing U.S. middle market debt investments for certain other investment funds and accounts. Accordingly, they have obligations to investors in those entities, the fulfillment of which may not be in the best interests of, or may be adverse to the interests of, us or our stockholders. Although the professional staff of our Investment Adviser will devote as much time to our management as appropriate to enable our Investment Adviser to perform its duties in accordance with the Investment Advisory Agreement, the investment professionals of our Investment Adviser may have conflicts in allocating their time and services among us, on the one hand, and investment vehicles managed by Carlyle or one or more of its affiliates on the other hand.
Our Investment Adviser may face conflicts in allocating investment opportunities between us and affiliated investment vehicles that have overlapping objectives with ours. Although our Investment Adviser will endeavor to allocate investment opportunities in a fair and equitable manner in accordance with its allocation policies and procedures, it is possible that, in the future, we may not be given the opportunity to participate in investments made by investment funds managed by our Investment Adviser or an investment manager affiliated with our Investment Adviser, including Carlyle.
We and our affiliates may own investments at different levels of a portfolio company’s capital structure or otherwise own different classes of a portfolio company’s securities, which may give rise to conflicts of interest or perceived conflicts of interest. Conflicts may also arise because portfolio decisions regarding our portfolio may benefit our affiliates. Our affiliates may pursue or enforce rights with respect to one of our portfolio companies, and those activities may have an adverse effect on us.
As a result of the expansion of Carlyle’s platform into various lines of business in the alternative asset management industry, Carlyle is subject to a number of actual and potential conflicts of interest and subject to greater regulatory oversight than that to which it would otherwise be subject if it had just one line of business. In addition, as Carlyle expands its platform, the allocation of investment opportunities among its investment funds, including us, is expected to become more complex. In addressing these conflicts and regulatory requirements across Carlyle’s various businesses, Carlyle has and may continue to implement certain policies and procedures (for example, information barriers). In addition, we may come into possession of material non-public information with respect to issuers in which we may be considering making an investment. As a consequence, we may be precluded from providing such information or other ideas to other funds affiliated with Carlyle that benefit from such information or we may be precluded from otherwise consummating a contemplated investment. To the extent we or any other funds affiliated with Carlyle fail to appropriately deal with any such conflicts, it could negatively impact our reputation or Carlyle’s reputation and our ability to raise additional funds and the willingness of counterparties to do business with us or result in potential litigation against us.
In the ordinary course of business, we may enter into transactions with affiliates and portfolio companies that may be considered related party transactions. We have implemented certain policies and procedures whereby certain of our executive officers screen each of our transactions for any possible affiliations between the proposed portfolio investment, us and other affiliated persons, including our Investment Adviser, stockholders that own more than 5% of us, employees, officers and directors of us and our Investment Adviser and certain persons directly or indirectly controlling, controlled by or under common control with the foregoing persons. We will not enter into any agreements unless and until we are satisfied that doing


so will not raise concerns under the Investment Company Act or, if such concerns exist, we have taken appropriate actions to seek Board of Directors review and approval or SEC exemptive relief for such transaction.
In the course of our investing activities, we pay management and incentive fees to our Investment Adviser and reimburse our Investment Adviser for certain expenses it incurs in accordance with our Investment Advisory Agreement. As a result, investors in our common stock invest on a “gross” basis and receive distributions on a “net” basis after expenses, resulting in a lower rate of return than an investor might achieve through direct investments. Accordingly, there may be times when the senior management team of our Investment Adviser has interests that differ from those of our stockholders, giving rise to a conflict.
In addition, we pay our Administrator, an affiliate of our Investment Adviser, its costs and expenses and our allocable portion of overhead incurred by it in performing its obligations under the Administration Agreement, including, compensation paid to or compensatory distributions received by our officers (including our Chief Compliance Officer and Chief Financial Officer) and their respective staff who provide services to us, operations staff who provide services to us, and internal audit staff in their role of performing our Sarbanes-Oxley Act internal control assessment. These arrangements create conflicts of interest that our Board of Directors monitors.
We may be obligated to pay our Investment Adviser incentive compensation even if we incur a loss.
Our Investment Adviser is entitled to incentive compensation for each calendar quarter in an amount equal to a percentage of the excess of our pre-incentive fee net investment income for that quarter (before deducting incentive compensation) above a performance threshold for that quarter. In calculating our performance threshold, we use net assets which results in a lower hurdle rate than if we used gross assets like we do for determining our base management fee. Our pre-incentive fee net investment income for incentive compensation purposes excludes realized and unrealized capital losses and depreciation that we may incur in the calendar quarter, even if such capital losses or depreciation result in a net loss on our statement of operations for that quarter. Thus, we may be required to pay our Investment Adviser incentive compensation for a calendar quarter even if there is a decline in the value of our portfolio or we incur a net loss for that quarter.
Our fee structure may induce our Investment Adviser to pursue speculative investments and incur leverage, and investors may bear the cost of multiple levels of fees and expenses.
The incentive fees payable by us to our Investment Adviser may create an incentive for our Investment Adviser to pursue investments on our behalf that are riskier or more speculative than would be the case in the absence of such compensation arrangement. The incentive fees payable to our Investment Adviser are calculated based on a percentage of our return on invested capital. This may encourage our Investment Adviser to use leverage to increase the return on our investments. Under certain circumstances, the use of leverage may increase the likelihood of default, which would impair the value of our securities. In addition, our Investment Adviser receives the incentive fees based, in part, upon net capital gains realized on our investments. Unlike that portion of the incentive fees based on income, there is no hurdle rate applicable to the portion of the incentive fees based on net capital gains. As a result, our Investment Adviser may have a tendency to invest more capital in investments that are likely to result in capital gains as compared to income producing securities. Such a practice could result in our investing in more speculative securities than would otherwise be the case, which could result in higher investment losses, particularly during economic downturns.
The “catch-up” portion of the incentive fees may encourage our Investment Adviser to accelerate or defer interest payable by portfolio companies from one calendar quarter to another, potentially resulting in fluctuations in timing and dividend amounts.
Moreover, because the base management fees payable to our Investment Adviser are payable based on our gross assets, including those assets acquired through the use of leverage, our Investment Adviser has a financial incentive to incur leverage which may not be consistent with our stockholders’ interests.
We may invest, to the extent permitted by law, in the securities and instruments of other investment companies, including private funds, and, to the extent we so invest, bear our ratable share of any such investment company’s expenses, including management and performance fees. We also remain obligated to pay management and incentive fees to our Investment Adviser with respect to the assets invested in the securities and instruments of other investment companies. With respect to each of these investments, each of our stockholders bears his or her share of the management and incentive fees of our Investment Adviser as well as indirectly bearing the management and performance fees and other expenses of any investment companies in which we invest.


We will be subject to corporate-level income tax if we are unable to maintain our qualification as a RIC for U.S. federal income tax purposes under Subchapter M of the Code.
Although we have elected to be treated, and intend to qualify annually, as a RIC for U.S. federal income tax purposes under Subchapter M of the Code, we cannot assure you that we will be able to maintain RIC status. To maintain RIC status and be relieved of U.S. federal income taxes on income and gains distributed to our stockholders, we must, among other things, have in effect an election to be treated, and continue to qualify, as a BDC under the Investment Company Act at all times during each taxable year and meet the Annual Distribution Requirement, the 90% Gross Income Test and the Diversification Tests (each as defined and explained more fully in Part I, Item 1 of this Form 10-K “Business—Election to be Taxed as a RIC.”).
If we fail to maintain our RIC status for any reason, and we do not qualify for certain relief provisions under the Code, we would be subject to corporate-level U.S. federal income tax (and any applicable U.S. state and local taxes) regardless of whether we make any distributions to our stockholders. In this event, the resulting taxes and any resulting penalties could substantially reduce our net assets, the amount of our income available for distribution and the amount of our distributions to our stockholders, which would have a material adverse effect on our financial performance. For additional discussion regarding the tax implications of a RIC, see Part I, Item 1 of this Form 10-K “Business—Election to be Taxed as a RIC.
We may have difficulty satisfying the Annual Distribution Requirement in order to maintain our RIC status if we recognize income before or without receiving cash representing such income.
We may make investments that produce income that is not matched by a corresponding cash receipt by us, such as original issue discount (“OID”), which may arise, for example, if we receive warrants in connection with the making of a loan, or payment-in-kind (“PIK”) interest representing contractual interest added to the loan principal balance and due at the end of the loan term. Any such income would be treated as income earned by us and therefore would be subject to the Annual Distribution Requirement (as defined and explained more fully in Part I, Item 1 of this Form 10-K “Business—Election to be Taxed as a RIC.”). Such investments may require us to borrow money or dispose of other securities in order to comply with those requirements. However, under the Investment Company Act, we are not permitted to make distributions to our stockholders while our debt obligations and other senior securities are outstanding unless an “asset coverage” test is met. See Part I, Item 1 of this Form 10-K “Business—Regulation—Indebtedness and Senior Securities.”
If we are prohibited from making distributions or are unable to raise additional debt or equity capital or sell assets to make distributions, we may not be able to make sufficient distributions to satisfy the Annual Distribution Requirement, and therefore would not be able to maintain our qualification as a RIC. Additionally, we may make investments that result in the recognition of ordinary income rather than capital gain, or that prevent us from accruing a long-term holding period. These investments may prevent us from making capital gain distributions. See Part I, Item 1 of this Form 10-K “Business—Election to be Taxed as a RIC.
A portion of our income and fees may not be qualifying income for purposes of the income source requirement.
Some of the income and fees that we may recognize will not satisfy the income source requirement applicable to RICs. In order to ensure that such income and fees do not disqualify us as a RIC for a failure to satisfy such requirement, we may be required to recognize such income and fees indirectly through one or more entities treated as corporations for U.S. federal income tax purposes. Such corporations will be required to pay U.S. corporate income tax on their earnings, which ultimately will reduce the amount of income available for distribution.
If we are not treated as a “publicly offered regulated investment company,” as defined in the Code, certain U.S. stockholders will be treated as having received a dividend from us in the amount of such U.S. stockholders’ allocable share of the management and incentive fees paid to our Investment Adviser and certain of our other expenses, and these fees and expenses will be treated as miscellaneous itemized deductions of such U.S. stockholders.
We expect to be treated as a “publicly offered regulated investment company” as a result of shares of our common stock being treated as regularly traded on an established securities market. However, we cannot assure you that we will be treated as a publicly offered regulated investment company for all years. If we are not treated as a publicly offered regulated investment company for any calendar year, each U.S. stockholder that is an individual, trust or estate will be treated as having received a dividend from us in the amount of such U.S. stockholder’s allocable share of the management and incentive fees paid to our Investment Adviser and certain of our other expenses for the calendar year, and these fees and expenses will be treated as miscellaneous itemized deductions of such U.S. stockholder. Miscellaneous itemized deductions generally are deductible by a U.S. stockholder that is an individual, trust or estate only to the extent that the aggregate of such U.S.


us.
stockholder’s miscellaneous itemized deductions exceeds 2% of such U.S. stockholder’s adjusted gross income for U.S. federal income tax purposes, are not deductible for purposes of the alternative minimum tax and are subject to the overall limitation on itemized deductions under the Code. See Part I, Item 1 of this Form 10-K “Business—Election to be Taxed as a RIC.
After we ceased to be an emerging growth company on December 31, 2017, we became obligated to maintain proper and effective internal control over financial reporting. We may not complete our analysis of our internal control over financial reporting in a timely manner, or our internal controls may not be determined to be effective, which may adversely affect investor confidence in our company and, as a result, the value of our securities.
After we ceased to be an emerging growth company on December 31, 2017, we became required to comply with the independent auditor attestation requirements of Section 404. Complying with Section 404 requires a rigorous compliance program as well as adequate time and resources. We may not be able to complete our internal control evaluation, testing and any required remediation in a timely fashion. If we are not able to implement the applicable requirements of Section 404 in a timely manner or with adequate compliance, our operations, financial reporting or financial results could be adversely affected. Matters impacting our internal controls may cause us to be unable to report our financial information on a timely basis and thereby subject us to adverse regulatory consequences, including sanctions by the SEC or violations of applicable stock exchange listing rules, and result in a breach of the covenants under the agreements governing any of our financing arrangements. There could also be a negative reaction in the financial markets due to a loss of investor confidence in us and the reliability of our financial statements. Confidence in the reliability of our financial statements could also suffer if we or our independent registered public accounting firm were to report a material weakness in our internal controls over financial reporting. This could materially adversely affect us and lead to a decline in the price of our securities.
Our internal control over financial reporting may not prevent or detect misstatements because of its inherent limitations. Even effective internal controls can provide only reasonable assurance with respect to the preparation and fair presentation of financial statements. If we fail to maintain the adequacy of our internal controls including any failureover financial reporting, we may not be able to implement required new or improved controls, or if we experience difficulties in their implementation, our business and operating results could be harmed and we could fail to meetaccurately report our financial reporting obligations.results.
Certain investors are limited in their ability to make significant investments in us.
Private funds that are excluded from the definition of “investment company” either pursuant to Section 3(c)(1) or 3(c)(7) of the Investment Company Act are restricted from acquiring directly or through a controlled entity more than 3% of our total outstanding voting stock (measured at the time of the acquisition). Investment companies registered under the Investment Company Act and BDCs are also subject to this restriction as well as other limitations under the Investment Company Act that would restrict the amount that they are able to invest in our securities. As a result, certain investors will be limited in their ability to make significant investments in us at a time that they might desire to do so.
Our Board of Directors is authorized to reclassify any unissued shares of common stock into one or more classes of preferred stock, which could convey special rights and privileges to its owners.
UnderProvisions of the Maryland General Corporation Law (“MGCL”) and of our charter (our “Charter”), our Board of Directors is authorized to classify and reclassify any authorized but unissued shares of stock into one or more classes of stock, including preferred stock. Prior to the issuance of shares of each class or series, the Board of Directors is required by Maryland law and our Charter to set the terms, preferences, conversion or other rights, voting powers, restrictions, limitations as to dividends or other distributions, qualifications and terms or conditions of redemption for each class or series. Thus, the Board of Directors could authorize the issuance of shares of preferred stock with terms and conditions which could have the effect of delaying, deferring or preventing a transaction or a change in control that might involve a premium price for holders of our common stock or otherwise be in their best interest. The cost of any such reclassification would be borne by our existing common stockholders. Certain matters under the Investment Company Act require the separate vote of the holders of any issued and outstanding preferred stock. For example, holders of preferred stock would vote separately from the holders of common stock on a proposal to cease operations as a BDC. In addition, the Investment Company Act provides that holders of preferred stock are entitled to vote separately from holders of common stock to elect two preferred stock directors. We currently have no plans to issue preferred stock, but may determine to do so in the future. The issuance of preferred stock convertible into shares of common stock might also reduce the net income per share and NAV per share of our common stock upon conversion, provided, that we will only be permitted to issue such convertible preferred stock to the extent we comply with the requirements of Section 61 of the Investment Company Act, including obtaining common stockholder approval. In addition, under the Investment Company Act, participating preferred stock and preferred stock constitutes a “senior security” for purposes of the 200% asset coverage test. These effects, among others, could have an adverse effect on an investment in our common stock.


Provisions of the MGCL and of our Charter and bylaws could deter takeover attempts and have an adverse impact on the price of our common stock.
The MGCL and our Charter and bylaws contain provisions that may discourage, delay or make more difficult a change in control of us or the removal of our directors. We are subject to the Maryland Business Combination Act (“MBCA”), subject to any applicable requirements of the Investment Company Act. Our Board of Directors has adopted a resolution exempting from the MBCA any business combination between us and any other person, subject to prior approval of such business combination by our Board of Directors, including approval by a majority of our Independent Directors. If the resolution exempting business combinations is repealed or our Board of Directors does not approve a business combination, the MBCA may discourage third parties from trying to acquire control of us and increase the difficulty of consummating such an offer. Our bylaws exempt from the Maryland Control Share Acquisition Act (“Control Share Act”) acquisitions of our stock by any person. If we amend our bylaws to repeal the exemption from the Control Share Act, the Control Share Act also may make it more difficult for a third party to obtain control of us and increase the difficulty of consummating such a transaction. However, we will amend our bylaws to be subject to the Control Share Act only if our Board of Directors determines that it would be in our best interests and if the SEC staff does not object to our determination that our being subject to the Control Share Act does not conflict with the Investment Company Act.
We have also adopted measures that may make it difficult for a third party to obtain control of us, including provisions of our Charter classifying our Board of Directors in three classes serving staggered three-year terms, and authorizing our Board of Directors to classify or reclassify shares of our stock in one or more classes or series, to cause the issuance of additional shares of our stock, to amend our Charter without stockholder approval and to increase or decrease the number of shares of stock or the number of shares of stock of any class or series that we have authority to issue. These provisions, as well as other provisions of our Charter and bylaws, may delay, defer or prevent a transaction or a change in control that might otherwise be in the best interests of our stockholders.
Our Board of Directors may change our investment objective, operating policies and strategies without prior notice and without stockholder approval.
Our Board of Directors has the authority to modify or, if applicable, waive our investment objectives, operating policies and strategies without prior notice (except as required by the Investment Company Act) and without stockholder approval. In addition, none of our investment policies is fundamental and any of them may be changed without stockholder approval. However, absent stockholder approval, we may not change the nature of our business so as to cease to be, or withdraw our election as, a BDC. We cannot predict the effect any changes to our current investment objectives, operating policies or strategies would have on our business, operating results and value of our stock. Nevertheless, the effects may adversely affect our business and impact our ability to make distributions.
A failure in our operational systems or infrastructure, or those of third parties, as well as cyber-attacks could significantly disrupt our business or negatively affect our liquidity, financial condition or results of operations.
We rely heavily on our and third parties’ financial, accounting, information and other data processing systems. Any failure or interruption of those systems, including as a result of the termination of an agreement with any third-party service providers, could cause delays or other problems in our activities. We face various security threats on a regular basis, including ongoing cyber-security threats to and attacks on our information technology infrastructure that are intended to gain access to our proprietary information, destroy data or disable, degrade or sabotage our systems. The result of these incidents may include disrupted operations, misstated or unreliable financial data, liability for stolen assets or information, increased cybersecurity protection and insurance costs, litigation and damage to our business relationships.
We operate in a business that is highly dependent on information systems, and technology. Carlyle has implemented processes, procedures and internal controls to help mitigate cybersecuritysystems failures could significantly disrupt our business.
Cybersecurity risks and cyber intrusions, but these measures, as well asincidents may adversely affect our increased awarenessbusiness, results of the nature and extent of a risk of a cyber-incident, do not guarantee that a cyber-incident will not occur and/or that our financial results, operations or confidential information will not be negatively impacted by such an incident. The information systems and technology that we rely on may not continue to be able to accommodatefinancial condition or those of our growth, and the cost of maintaining such systems may increase from its current level. Such a failure to accommodate growth, or an increase in costs related to such information systems, could have a material adverse effect on us.portfolio companies.
Changes in laws or regulations governing our business or the businesses of our portfolio companies, changes in the interpretation thereof or newly enacted laws or regulations, and any failure by us or our portfolio companies to comply with these laws or regulations may adversely affect our business and the businesses of our portfolio companies.
23


We and our portfolio companies are subject to laws and regulations at the U.S. federal, state and local levels and, in some cases, foreign levels. These laws and regulations, as well as their interpretation, may change from time to time, and new laws, regulations and interpretations may also come into effect. Any such new or changed laws or regulations could have a material adverse effect on our business or the business of our portfolio companies. The legal, tax and regulatory environment for BDCs, investment advisers and the instruments that they utilize (including derivative instruments) is continuously evolving. In addition, there is significant uncertainty regarding recently enacted legislation (including the Dodd-Frank Wall Street Reform and Consumer Protection Act (the “Dodd-Frank Act”) and the regulations that have recently been adopted and future regulations that may or may not be adopted pursuant to such legislation) and, consequently, the full impact that such legislation will ultimately have on us and the markets in which we trade and invest is not fully known. Such uncertainty and any resulting confusion may itself be detrimental to the efficient functioning of the markets and the success of certain investment strategies.
In addition, as private equity firms become more influential participants in the U.S. and global financial markets and economy generally, there recently has been pressure for greater governmental scrutiny and/or regulation of the private equity industry. It is uncertain as to what form and in what jurisdictions such enhanced scrutiny and/or regulation, if any, on the private equity industry may ultimately take. Therefore, there can be no assurance as to whether any such scrutiny or initiatives will have an adverse impact on the private equity industry, including our ability to effect operating improvements or restructurings of our portfolio companies or otherwise achieve our objectives.
Over the last several years, there also has been an increase in regulatory attention to the extension of credit outside of the traditional banking sector, raising the possibility that some portion of the non-bank financial sector will be subject to new regulation. While it cannot be known at this time whether any regulation will be implemented or what form it will take, increased regulation of non-bank credit extension could negatively impact our operating results or financial condition, impose additional costs on us, intensify the regulatory supervision of us or otherwise adversely affect our business.
On February 3, 2017, President Trump signed Executive Order 13772 (the “Executive Order”) announcing the new Administration’s policy to regulate the U.S. financial system in a manner consistent with certain “Core Principles,” including regulation that is efficient, effective and appropriately tailored. The Executive Order directed the Secretary of the Treasury, in consultation with the heads of the member agencies of the Financial Stability Oversight Council, to report to the President on the extent to which existing laws, regulations and other government policies promote the Core Principles and to identify any laws, regulations or other government policies that inhibit federal regulation of the U.S. financial system.
On June 12, 2017, the U.S. Department of the Treasury (“Treasury”) published the first of several reports in response to the Executive Order on the depository system covering banks and other savings institutions. On October 6, 2017, the Treasury released a second report outlining ways to streamline and reform the U.S. regulatory system for capital markets, followed by a third report, on October 26, 2017, examining the current regulatory framework for the asset management and insurance industries. Subsequent reports are expected to address: retail and institutional investment products and vehicles, as well as non‑bank financial institutions, financial technology and financial innovation.
On June 8, 2017, the U.S. House of Representatives passed the Financial Choice Act, which includes legislation intended to repeal or replace substantial portions of the Dodd‑Frank Act. Among other things, the proposed law would repeal the Volcker Rule limiting certain proprietary investment and trading activities by banks, eliminate the authority of regulators to designate asset managers and other large non‑bank institutions as “systemically important financial institutions” or “SIFIs,” and repeal the Department of Labor (“DOL”) “fiduciary rule” governing standards for dealing with retirement plans until the SEC issues standards for similar dealings by broker‑dealers and limiting the substance of any subsequent DOL rule to the SEC standards. The bill has been referred to the Senate, where it is unlikely to pass in its current form. On November 16, 2017, a bipartisan group of U.S. Senators, led by Senate Banking Committee Chairman, introduced the Economic Growth, Regulatory Relief, and Consumer Protection Act (the “Senate Regulatory Relief Bill”). The Senate Regulatory Relief Bill would revise various post-crisis regulatory requirements and provide targeted regulatory relief to certain financial institutions. Among the most significant of its proposed amendments to the Dodd-Frank Act are a substantial increase in the $50 billion asset threshold for automatic regulation of bank holding companies as SIFIs, an exemption from the Volcker Rule for insured depository institutions with less than $10 billion in consolidated assets and lower levels of trading assets and liabilities, as well as amendments to the liquidity leverage ratio and supplementary leverage ratio requirements. On December 5, 2017, the Senate Banking Committee approved the Senate Regulatory Relief Bill. If the legislation is adopted in the Senate, it remains unclear whether and how it would be reconciled with its House-passed counterpart, the Financial Choice Act, which is substantially different in scope and substance, and ultimately approved by both chambers of Congress.
At this time it is unclear what impact the Administration’s policies in response to the Executive Order, the Financial Choice Act, the Senate Regulatory Relief Bill or other pending legislation and developments will have on regulations that affect our, our competitors’ and our portfolio companies’ businesses.


Pending legislation may allow us to incur additional leverage.
As a BDC, under the Investment Company Act we generally are not permitted to incur borrowings, issue debt securities or issue preferred stock unless immediately after the borrowing or issuance the ratio of total assets (less total liabilities other than indebtedness) to total indebtedness plus preferred stock, is at least 200%. Recent legislation introduced in the U.S. Congress, if passed, would modify this section of the Investment Company Act and increase the amount of debt that BDCs may incur by modifying the asset coverage percentage from 200% to 150%. As a result, we may be able to incur additional indebtedness in the future and you may face increased investment risk. In addition, since our base management fee is calculated as a percentage of the value of our gross assets, including assets acquired through the incurrence of debt but excluding cash and cash equivalents, our base management fee expenses will increase if we incur additional indebtedness.
Recently passed tax reform, Public Law No. 115-97 (the “Tax Cuts and Jobs Act”), and other changes in laws or regulations related to U.S. federal income taxation could adversely affect us and our investors.
On December 22, 2017, the President signed into law the Tax Cuts and Jobs Act, which significantly revised the Internal Revenue Code, including, a reduction in the corporate income tax rate, a new limitation on the deductibility of interest expense, and significant changes to the taxation of income earned from foreign sources and foreign subsidiaries. The Tax Cuts and Jobs Act also authorizes the IRS to issue regulations with respect to the new provisions. While we do not anticipate any immediate material impact on our calculation of NAV, we cannot predict how the changes in the Tax Cuts and Jobs Act, or regulations or other guidance issued under it, might affect us or our business in the long-term. The impact of the Tax Cuts and Jobs Act on our business in the long-term may differ, possibly materially, due to, among other things, changes in interpretations and assumptions that management has made, guidance that may be issued and actions that management may take as a result of the Tax Cuts and Jobs Act. The impact of this legislation on holders of our securities is uncertain and could be adverse. We urge the purchasers of our securities in any offering made pursuant to this prospectus and an accompanying prospectus supplement to consult with their tax advisors with respect to such legislation and the potential tax consequences of investing in our securities.
Our Investment Adviser, Administrator and sub-administrators are able to resign upon 60 days’ notice, and we may not be able to find a suitable replacement within that time, resulting in a disruption in our operations that could adversely affect our financial condition, business and results of operations.
Our Investment Adviser, our Administrator and our sub-administrators have the right to resign under the Investment Advisory Agreement, the Administration Agreement and the Sub-Administration Agreements, respectively, upon 60 days’ written notice, whether a replacement has been found or not. If any of them resigns, it may be difficult to find a replacement with similar expertise and ability to provide the same or equivalent services on acceptable terms within 60 days, or at all. If a replacement is not found quickly, our business, results of operation and financial condition as well as our ability to pay distributions are likely to be adversely affected and the value of our shares may decline. In addition, the coordination of our internal management and investment activities is likely to suffer if we are unable to identify and reach an agreement with a single institution or group of executives having the expertise possessed by our Investment Adviser, our Administrator and their affiliates, including certain of our sub-administrators. Even if a comparable service provider or individuals performing such services are retained, whether internal or external, their integration into our business and lack of familiarity with our investment objective may result in additional costs and time delays that may materially adversely affect our business, results of operations and financial condition. Moreover, the termination by our Investment Adviser of our Investment Advisory Agreement for any reason will be an event of default under the SPV Credit Facility, which could result in the immediate acceleration of the amounts due under the SPV Credit Facility. Similarly, it will be an event of default under the Credit Facility if our Investment Adviser or an affiliate of our Investment Adviser ceases to manage us, which could result in the immediate acceleration of the amounts due under the Credit Facility.
Our Investment Adviser’s liability is limited under the Investment Advisory Agreement, and we are required to indemnify our Investment Adviser against certain liabilities, which may lead our Investment Adviser to act in a riskier manner on our behalf than it would when acting for its own account.
Our Investment Adviser has not assumed any responsibility to us other than to render the services described in the Investment Advisory Agreement, and it will not be responsible for any action of our Board of Directors in declining to follow our Investment Adviser’s advice or recommendations. Pursuant to the Investment Advisory Agreement, our Investment Adviser and its members and their respective officers, managers, partners, agents, employees, controlling persons and members and any other person or entities affiliated with it will not be liable to us for their acts under the Investment Advisory Agreement, absent willful misfeasance, bad faith, gross negligence or reckless disregard in the performance of their duties. We have agreed to indemnify, defend and protect our Investment Adviser and its members and their respective officers, managers, partners, agents,


employees, controlling persons and members and any other person or entities affiliated with it with respect to all damages, liabilities, costs and expenses arising out of or otherwise based upon the performance of any of our Investment Adviser’s duties or obligations under the Investment Advisory Agreement or otherwise as an Investment Adviser for us, and not arising out of willful misfeasance, bad faith, gross negligence or reckless disregard in the performance of their duties under the Investment Advisory and Agreement. These protections may lead our Investment Adviser to act in a riskier manner when acting on our behalf than it would when acting for its own account. See “Risks Related to Our Business and StructureOur fee structure may induce our Investment Adviser to pursue speculative investments and incur leverage, and investors may bear the cost of multiple levels of fees and expenses.
We are subject to certain risks as a result of our direct interest in the 2015-1 Issuer Preferred Interests.
Because each of the SPV and the 2015-1 Issuer is disregarded as an entity separate from its owner for U.S. federal income tax purposes, the sale or contribution by the SPV to us and the sale or contribution by us to the 2015-1 Issuer as part of the 2015-1 Debt Securitization did not constitute a taxable event for U.S. federal income tax purposes. If the U.S. Internal Revenue Service were to take a contrary position, there could be a material adverse effect on our business, financial condition, results of operations or cash flows.
The 2015-1 Issuer Preferred Interests are subordinated obligations of the 2015-1 Issuer.
The 2015-1 Issuer is the residual claimant on funds, if any, remaining after holders of all classes of the 2015-1 Notes have been paid in full on each payment date or upon maturity of the 2015-1 Notes under the 2015-1 Debt Securitization documents. The 2015-1 Issuer Preferred Interests represent all of the equity interest in the 2015-1 Issuer and, as the holder of the 2015-1 Issuer Preferred Interests, we may receive distributions, if any, only to the extent that the 2015-1 Issuer makes distributions out of funds remaining after holders of all classes of the 2015-1 Notes have been paid in full on each payment date any amounts due and owing on such payment date or upon maturity of the 2015-1 Notes. There is no guarantee that we will receive any distributions as the holders of the 2015-1 Issuer Preferred Interests.
The interests of holders of the 2015-1 Notes issued by the 2015-1 Issuer may not be aligned with our interests.
The 2015-1 Notes are the debt obligations ranking senior in right of payment to our interests. As such, there are circumstances in which the interests of holders of the 2015-1 Notes may not be aligned with our interests. For example, under the terms of the 2015-1 Issuer, holders of the 2015-1 Notes have the right to receive payments of principal and interest prior to distribution to our interests.
For as long as the 2015-1 Notes remain outstanding, holders of the 2015-1 Notes have the right to act, in certain circumstances, with respect to the portfolio loans in ways that may benefit their interests but not the interests of holders of the 2015-1 Issuer Preferred Interests, including by exercising remedies under the indenture governing the 2015-1 Notes (the “2015-1 Indenture”).
If an event of default has occurred and acceleration occurs in accordance with the terms of the 2015-1 Indenture, the 2015-1 Notes then outstanding will be paid in full before any further payment or distribution to the 2015-1 Issuer Preferred Interests. In addition, if an event of default occurs, holders of a majority of the 2015-1 Notes then outstanding will be entitled to determine the remedies to be exercised under the 2015-1 Indenture, subject to the terms of the 2015-1 Indenture. For example, upon the occurrence of an event of default with respect to the notes issued by the 2015-1 Issuer, the trustee or holders of a majority of the 2015-1 Notes then outstanding may declare the principal, together with any accrued interest, of all the 2015-1 Notes to be immediately due and payable. This would have the effect of accelerating the principal on such notes, triggering a repayment obligation on the part of the 2015-1 Issuer. If at such time the portfolio loans of the 2015-1 Issuer were not performing well, the 2015-1 Issuer may not have sufficient proceeds available to enable the trustee under the 2015-1 Indenture to pay a distribution to holders of the 2015-1 Issuer Preferred Interests.
Remedies pursued by the holders of the 2015-1 Notes could be adverse to the interests of the holders of the 2015-1 Issuer Preferred Interests, and the holders of the 2015-1 Notes have no obligation to consider any possible adverse effect on such other interests. Thus, any remedies pursued by the holders of the 2015-1 Notes may not be in our best interests and we may not receive payments or distributions upon an acceleration of the 2015-1 Notes. Any failure of the 2015-1 Issuer to make distributions on the 2015-1 Issuer Preferred Interests we hold, directly or indirectly, whether as a result of an event of default or otherwise, could have a material adverse effect on our business, financial condition, results of operations and cash flows and may result in an inability of us to make distributions sufficient to allow for us to qualify as a RIC for U.S. federal income tax purposes.


The 2015-1 Issuer may fail to meet certain asset coverage tests.
Under the documents governing the 2015-1 Debt Securitization, there are two coverage tests applicable to the 2015-1 Notes.
The first such test compares the amount of interest received on the portfolio loans held by the 2015-1 Issuer to the amount of interest payable in respect of the 2015-1 Notes. To meet this first test, interest received on the portfolio loans must equal at least 120% of the interest payable in respect of the 2015-1 Notes issued by the 2015-1 Issuer.
The second such test compares the adjusted collateral principal amount of the portfolio loans of the 2015-1 Debt Securitization to the aggregate outstanding principal amount of the 2015-1 Notes. To meet this second test at any time, the adjusted collateral principal amount of the portfolio loans must equal at least 140% of the outstanding principal amount of the 2015-1 Notes.
If any coverage test with respect to the 2015-1 Notes is not met, proceeds from the portfolio of loans that otherwise would have been distributed to the holders of the 2015-1 Issuer Preferred Interests will instead be used to redeem first the 2015-1 Notes, to the extent necessary to satisfy the applicable asset coverage tests on a pro forma basis after giving effect to all payments made in respect of the 2015-1 Notes, which we refer to as a mandatory redemption, or to obtain the necessary ratings confirmation. There is no guarantee that the 2015-1 Notes will meet either of these coverage tests, and thus, we may not receive distributions as the holders of the 2015-1 Issuer Preferred Interests.
We may not receive cash from the 2015-1 Issuer.
We receive cash from the 2015-1 Issuer only to the extent of payments on the distributions, if any, with respect to the 2015-1 Issuer Preferred Interests as permitted under the 2015-1 Debt Securitization. The 2015-1 Issuer may only make payments on the 2015-1 Issuer Preferred Interests to the extent permitted by the payment priority provisions of the 2015-1 Indenture, as applicable, which generally provide, distribution to Preferred Interests holder may not be made on any payment date unless all amounts owing under the 2015-1 Notes are paid in full. There is no guarantee that we will receive any distributions as the holders of the 2015-1 Issuer Preferred Interests.
In addition, if the 2015-1 Issuer does not meet the asset coverage tests or the interest coverage test set forth in the documents governing the 2015-1 Debt Securitization, cash would be diverted to first pay the 2015-1 Notes in amounts sufficient to cause such tests to be satisfied. Even if we do not receive cash directly from the 2015-1 Issuer, such amount will still be treated as income subject to our requirement to distribute 90% of our net investment income to our shareholders. Therefore, in the event that we fail to receive cash directly from the 2015-1 Issuer, we could be unable to make such distributions in amounts sufficient to maintain our status as a RIC for U.S. federal income tax purposes, or at all.
We may be required to assume liabilities of the 2015-1 Issuer and are indirectly liable for certain representations and warranties in connection with the 2015-1 Debt Securitization.
As part of the 2015-1 Debt Securitization, we entered into a contribution agreement under which we are required to repurchase any loan (or participation interest therein) which was sold to the 2015-1 Issuer in breach of any representation or warranty made by us with respect to such loan on the date such loan was sold. To the extent we fail to satisfy any such repurchase obligation, the trustee of the 2015-1 Debt Securitization may, on behalf of the 2015-1 Issuer, bring an action against us to enforce these repurchase obligations.
The structure of the 2015-1 Debt Securitization is intended to prevent, in the event of our bankruptcy, the consolidation of the 2015-1 Issuer with our operations. If the true sale of the assets in the 2015-1 Debt Securitization were not respected in the event of our insolvency, a trustee or debtor-in-possession might reclaim the assets of the 2015-1 Issuer for our estate. However, in doing so, we would become directly liable for all of the indebtedness then outstanding under the 2015-1 Debt Securitization, which would equal the full amount of debt of the 2015-1 Issuer reflected on our consolidated balance sheet.
In addition, in connection with 2015-1 Debt Securitization, the Company has made customary representations, warranties and covenants to the 2015-1 Issuer. We remain liable for any breach of such representations for the life of the 2015-1 Debt Securitization.
Risks Related to Our Investments

Our investments are risky and speculative, generally illiquid and typically do not have a readily available market price.
We operate in a highly competitive market for investment opportunities, and compete with investment vehicles sponsored or advised by our affiliates.

Our portfolio companies may be highly leveraged, may incur debt that ranks equally with, or senior to, some of our investments in such companies, and may be concentrated in a limited number of portfolio companies and industries.
Declines in the prices of corporate debt securities and illiquidity in the corporate debt markets may adversely affect the fair value of our portfolio investments, reducing our NAV through increased net unrealized depreciation.
To the extent we make investments in restructurings and reorganizations they may be subject to greater regulatory and legal risks than other traditional direct investments in portfolio companies.
The due diligence investigation that our Investment Adviser carries out with respect to an investment opportunity may not reveal or highlight all relevant facts that may be necessary or helpful in evaluating such investment opportunity. The financial projections of our portfolio companies could prove inaccurate.
Our portfolio companies prepay loans from time to time, which may have the effect of reducing our investment income if the returned capital cannot be invested in transactions with equal or greater yields.
LoansWe invest through joint ventures, partnerships or other special purpose vehicles and our investments through these vehicles may entail greater risks, or risks that we otherwise would not incur, if we otherwise made such investments directly.
Our ability to enter into transactions with Carlyle and our other affiliates is restricted.
Our failure to make follow-on investments in our portfolio companies could impair the value of our investments.
Because we generally do not hold controlling equity interests in our portfolio companies, we may not be in a position to exercise control over our portfolio companies.
There are generally prepayablecertain risks associated with holding debt obligations that have original issue discount or payment-in-kind interest.
Risks Related to an Investment in Our Common Stock and Other Securities That We May Issue
Investing in our securities involves a high degree of risk. The market price of our securities may fluctuate significantly. Our shares of common stock have traded at a discount to NAV and may do so again.
We issued the Preferred Stock in May 2020 and we may in the future determine to issue additional preferred stock, which could adversely affect the market value of our common stock.
Purchases of our common stock under our stock repurchase program, and sales of substantial amounts of our common stock in the public market, may have affected, or could in the future affect, the public price of our common stock.
Our stockholders will experience dilution in their ownership percentage if they opt out of our dividend reinvestment plan.
There is a risk that our stockholders may not receive distributions or that our distributions may not grow over time.
Our stockholders may receive shares of our common stock as dividends, which could result in adverse tax consequences to them. Non-U.S. stockholders may be subject to withholding of U.S. federal income tax on dividends we pay.
We may have difficulty paying our required distributions if we recognize taxable income before or without receiving cash representing such income.
Risk Factors
An investment in the Company involves a high degree of risk. You should carefully consider these risk factors, together with all of the other information included in this report, before you decide whether to make an investment in the Company. There can be no assurance that the Company’s investment objective will be achieved or that an investor will receive a return of its capital. In addition, there will be occasions when the Investment Adviser and its affiliates may encounter potential conflicts of interest in connection with the Company. The risks set out below are not the only risks we face. Additional risks and uncertainties not currently known to us or that we currently deem to be immaterial also may materially adversely affect our business, financial condition and/or operating results. The following considerations, in addition to the considerations set forth elsewhere herein, should be carefully evaluated before making an investment in the Company. If any time, most of them at no premiumthe following events occur, our business, financial condition and operating result could be materially and adversely affected. In such case, the NAV and the trading price of our common stock and the trading price, if any, of any other securities that we may issue could decline, and you may lose all or part of your investment.
24

Risks Related to par. Our Business and Structure
We are generallycurrently operating in a period of capital markets disruption and economic uncertainty, and capital markets may experience periods of disruption and instability in the future. These market conditions may materially and adversely affect debt and equity capital markets in the United States and abroad, which may have a negative impact on our business and operations.
U.S. capital markets have experienced extreme volatility and disruption following the global outbreak of COVID-19 that began in December 2019, as evidenced by the volatility in global stock markets as a result of, among other things, uncertainty surrounding the COVID-19 pandemic and the impact of supply chain disruptions. Despite actions of the U.S. federal government and foreign governments, these events have contributed to unpredictable general economic conditions that are materially and adversely impacting the broader financial and credit markets. These and future market disruptions and/or illiquidity would be expected to have an adverse effect on our business, financial condition, results of operations and cash flows, as well as the businesses of our portfolio companies, and the broader financial and credit markets.
At various times, such disruptions have resulted in, and may in the future result in, a lack of liquidity in parts of the debt capital markets, significant write-offs in the financial services sector and the repricing of credit risk. Such conditions may occur for a prolonged period of time again, and may materially worsen in the future, including as a result of U.S. government shutdowns, or future downgrades to the U.S. government's sovereign credit rating or the perceived credit worthiness of the U.S. or other large global economies. In addition, the current U.S. political environment and the resulting uncertainties regarding actual and potential shifts in U.S. foreign investment, trade, taxation, economic, environmental and other policies under the current Administration, as well as the impact of geopolitical tension, such as a deterioration in the bilateral relationship between the U.S. and China or an escalation in conflict between Russia and Ukraine, could lead to disruption, instability and volatility in the global markets. Unfavorable economic conditions also would be expected to increase our funding costs, limit our access to the capital markets or result in a decision by lenders not to extend credit to us. These events have limited and could continue to limit our investment originations, and limit our ability to grow and could have a material negative impact on our operating results, financial condition, results of operations and cash flows and the fair values of our debt and equity investments.
In addition, the U.S. and global capital markets have in the past, and may in the future, experience periods of extreme volatility and disruption during economic downturns and recessions. Trade wars and volatility in the U.S. repo market, the U.S. high yield bond markets, the Chinese stock markets and global markets for commodities may affect other financial markets worldwide. In addition, while recent government stimulus measures worldwide have reduced volatility in the financial markets, volatility may return as such measures are phased out, and the long-term impacts of such stimulus on fiscal policy and inflation remain unknown. Increases to budget deficits, which have been exacerbated by the COVID-19 pandemic, or direct and contingent sovereign debt may create concerns about the ability of certain nations to service their sovereign debt obligations and any risks resulting from any such debt crisis in Europe, the U.S. or elsewhere could have a detrimental impact on the global economy, sovereign and non-sovereign debt in certain countries and the financial condition of financial institutions generally. Austerity measures that certain countries may agree to as part of any debt crisis or disruptions to major financial trading markets may adversely affect world economic conditions, our business and the businesses of our portfolio companies.
Additionally, the Federal Reserve is expected to raise the Federal Funds Rate in 2022. These developments, along with
the United States government’s credit and deficit concerns, global economic uncertainties and market volatility and the impacts of COVID-19, could cause interest rates to be volatile, which may negatively impact our ability to access the capital markets on favorable terms.
The COVID-19 pandemic has adversely affected, and may continue to adversely affect, our portfolio companies and the results of our operations.
In late 2019 and early 2020, SARS-CoV-2 and COVID-19 emerged in China and spread rapidly across the world, including the U.S. This outbreak has led, and for an unknown period of time will continue to lead, to disruptions in local, regional, national and global economic activity, adversely affected the functioning of financial markets, impacted market interest rates, increased economic and market uncertainty, and disrupted trade and supply chains. While economic activity has improved, disruptions to supply chains continue and significant inflation has been seen in many segments of the global economy. With respect to the U.S. credit markets (in particular for middle market loans), this outbreak has resulted in, and until fully resolved is likely to continue to result in, the following among other things: (i) government imposition of various forms of “stay at home” orders and the closing of “non-essential” businesses, resulting in significant disruption to the businesses of many middle-market loan borrowers including supply chains, demand and practical aspects of their operations, as well as in lay-offs of employees, and, while these effects are hoped to be temporary, some effects could be persistent or even permanent; (ii) increased draws by borrowers on revolving lines of credit; (iii) increased requests by borrowers for amendments and waivers of their credit agreements to avoid default, increased defaults by such borrowers and/or increased difficulty in obtaining refinancing at the maturity dates of their loans; (iv) volatility and disruption of these markets including greater volatility in pricing and spreads and difficulty in valuing loans during periods of increased volatility, and liquidity issues; and (v) rapidly
25

evolving proposals and/or actions by state and federal governments to address problems being experienced by the markets and by businesses and the economy in general which will not necessarily adequately address the problems facing the loan market and middle market businesses. Such conditions have required and may in the future require us to modify the payment terms of our investments, including changes in PIK interest provisions and/or cash interest rates. The performance of certain of our portfolio companies has been, and in the future may be, negatively impacted by these economic or other conditions, which can result in our receipt of reduced interest income from our portfolio companies and/or realized and unrealized losses related to our investments, and, in turn, may adversely affect distributable income and have a material adverse effect on our results of operations. In addition, as governments continue to respond to changing COVID-19 related conditions and impose certain COVID-19 mitigation measures, certain of our portfolio companies may experience increases in health and safety expenses, payroll costs and other operating expenses. It is impossible to determine the scope of this outbreak, or any future outbreaks, how long any such outbreak, market disruption or uncertainties may last, the effect any governmental actions will have or the full potential impact on us and our portfolio companies.
Further, from an operational perspective, our Investment Adviser’s investment professionals are currently working remotely. An extended period of remote work arrangements could strain our business continuity plans, introduce operational risk, including but not limited to cybersecurity risks, and impair our ability to manage our business. In addition, we are highly dependent on third party service providers for certain communication and information systems. As a result, we rely upon the successful implementation and execution of the business continuity planning of such providers in the current environment. If one or more of these third parties to whom we outsource certain critical business activities experience operational failures as a result of the impacts from the spread of COVID-19, or claim that they cannot perform due to a force majeure, it may have a material adverse effect on our business, financial condition, results of operations, liquidity and cash flows.
While several countries, as well as certain states in the United States, have relaxed public health restrictions with a view to partially or fully reopening their economies, recurring COVID-19 outbreaks and the spread of new COVID-19 variants have led to the re-introduction of such restrictions in certain states in the United States and globally and could continue to lead to the re-introduction of such restrictions elsewhere. These or new travel restrictions may result in a global economic downturn. Ineffectual treatment options could lead people to continue to self-isolate and not participate in the economy at pre-pandemic levels for a prolonged period of time. Even after the COVID-19 pandemic subsides, the U.S. economy and most other major global economies may experience an economic downturn, and we anticipate our business and operations could be materially adversely affected by a prolonged economic downturn and uncertainty in the U.S. and other major markets. Some economists and major investment banks have expressed concerns that the continued spread of the virus globally could lead to a world-wide economic downturn.
Inflation may adversely affect the business, results of operations and financial condition of our portfolio companies.
Certain of our portfolio companies are in industries that may be impacted by inflation. If such portfolio companies are unable to predictpass any increases in their costs of operations along to their customers, it could adversely affect their operating results and impact their ability to pay interest and principal on our loans, particularly if interest rates rise in response to inflation. In addition, any projected future decreases in our portfolio companies’ operating results due to inflation could adversely impact the ratefair value of those investments. Any decreases in the fair value of our investments could result in future realized or unrealized losses and frequencytherefore reduce our net assets resulting from operations.
Economic recessions or downturns could impair our portfolio companies and harm our operating results.
Many of such repayments. Whetherthe portfolio companies in which we make investments may be susceptible to economic slowdowns or recessions and may be unable to repay the loans we made to them during these periods. The ongoing effects of the COVID-19 pandemic, supply chain disruptions and inflation heighten these risks. Therefore, our non-performing assets may increase and the value of our portfolio may decrease during these periods as we are required to record our investments at their current fair value. Adverse economic conditions also may decrease the value of collateral securing some of our loans and the value of our equity investments. Economic slowdowns or recessions could lead to financial losses in our portfolio and a decrease in revenues, net income and assets. Unfavorable economic conditions also could increase our and our portfolio companies’ funding costs, limit our and our portfolio companies’ access to the capital markets or result in a decision by lenders not to extend credit to us or our portfolio companies. These events could prevent us from increasing investments and harm our operating results.
Any deterioration of general economic conditions may lead to significant declines in corporate earnings or loan is prepaidperformance, and the ability of corporate borrowers to service their debt, any of which could trigger a period of global economic slowdown, and have an adverse impact on our performance and financial results, and the value and the liquidity of our investments. In an economic downturn, we could have non-performing assets or an increase in non-performing assets, and we would anticipate that the value of our portfolio would decrease during these periods.
A portfolio company’s failure to satisfy financial or operating covenants imposed by us or other lenders could lead to defaults and, potentially, acceleration of the time when the loans are due and foreclosure on its secured assets, which could
26

trigger cross-defaults under other agreements and jeopardize the portfolio company’s ability to meet its obligations under the debt that we hold. We may incur additional expenses to the extent necessary to seek recovery upon default or to negotiate new terms with a defaulting portfolio company. In addition, if one of our portfolio companies were to go bankrupt, depending on the facts and circumstances, including the extent to which we will actually provide significant managerial assistance to that portfolio company, a bankruptcy court might subordinate all or a portion of our claim to that of other creditors.
We are dependent upon our Investment Adviser for our future success.
We do not have any employees. We depend on the diligence, skill, judgment and network of business contacts of our Investment Adviser’s investment professionals and CDL to source appropriate investments for us. We depend on members of our Investment Adviser’s investment team to appropriately analyze our investments and our Investment Adviser’s investment committee to approve and monitor our middle market portfolio investments. Our Investment Adviser’s investment committee, together with the other members of its investment team, evaluate, negotiate, structure, close and monitor our investments. Our future success will depend both on the continued positive performanceavailability of the portfolio companymembers of our Investment Adviser’s investment committee and the existenceother investment professionals available to our Investment Adviser. Neither we nor our Investment Adviser has employment agreements with these individuals or other key personnel, and we cannot provide any assurance that unforeseen business, medical, personal or other circumstances would not lead any such individual to terminate his or her relationship with us. The loss of favorable financingany senior investment professionals to which our Investment Adviser has access, including members of our Investment Adviser's investment committee, or a significant number of the investment professionals of our Investment Adviser, could have a material adverse effect on our ability to achieve our investment objective as well as on our financial condition and results of operations. The market for qualified professionals is extremely competitive across levels and areas of expertise, and our Investment Adviser may not be successful in its efforts to recruit, retain and motivate these professionals. In connection with the COVID-19 pandemic, there has been a shift to a hybrid work model and, in recruiting efforts, our Investment Adviser has seen increased focus by prospective candidates on remote and hybrid work arrangements and arrangements providing more flexibility, including around location. If there is a further shift to a longer-term fully remote model that does not require maintaining close proximity to a company’s offices in the markets in which our Investment Adviser competes for talent, it may experience an even further increase in competition for talent and it may be difficult to recruit and retain investment professionals.
In addition, we cannot assure you that CGCIM will remain our investment adviser or that we will continue to have access to Carlyle’s investment professionals or its information and deal flow. If, due to extraordinary market conditions or other reasons, we and other funds managed by our Investment Adviser or its affiliates were to incur substantial losses, the revenues of our Investment Adviser and its affiliates may decline substantially. Such losses may hamper our Investment Adviser's and its affiliates' ability to provide the same level of service to us as it would have. Further, there can be no assurance that allowCGCIM will replicate its own or Carlyle’s historical success, and we caution you that our investment returns could be substantially lower than the returns achieved by other Carlyle-managed funds.

Our financial condition, results of operations and ability to achieve our investment objective depend on our ability to source investments, access financing and manage future growth effectively.
Our ability to achieve our investment objective and to grow depends on our ability to acquire suitable investments and monitor and administer those investments, which depends, in turn, on our Investment Adviser’s ability to identify, invest in and monitor companies that meet our investment criteria.
Accomplishing this result on a cost-effective basis is largely a function of our Investment Adviser’s structuring of the investment process, its ability to provide competent, attentive and efficient services to us and its ability to access financing for us on acceptable terms. Our Investment Adviser’s investment team has substantial responsibilities under the investment advisory agreement between us and our Investment Adviser (the “Investment Advisory Agreement”) and in connection with managing us and certain other investment funds and accounts advised by our Investment Adviser, and may also be called upon to provide managerial assistance to our portfolio companies. These demands on their time, which will increase as the number of investments grow, may distract them or slow the rate of investment. In order for us to grow, Carlyle will need to hire, train, supervise, manage and retain new employees. However, we can offer no assurance that any such investment professionals will contribute effectively to the work of our Investment Adviser. Any failure to manage our future growth effectively could have a material adverse effect on our business, financial condition and results of operations.
We may need to raise additional capital to grow because we must distribute most of our income.
We may need to raise additional capital to fund growth in our investments, and a reduction in the availability of new capital could limit our ability to grow. If we fail to obtain funds from such sources or from other sources to fund our investments, it could limit our ability to grow, which may have an adverse effect on the value of our securities. We have elected
27

to be treated, and intend to qualify annually, as a RIC for U.S. federal income tax purposes under Subchapter M of the Code. To maintain our status as a RIC, among other requirements, we must distribute on a timely basis at least 90% of our investment company taxable income to our stockholders to maintain our RIC status. As a result, any such cash earnings may not be available to fund investment originations or repay maturing debt.
We expect to issue additional debt and equity securities to fund our growth. We may pursue growth through acquisitions or strategic investments in new businesses. Completion and timing of any such acquisitions or strategic investments may be subject to a number of contingencies and risks. There can be no assurance that the integration of an acquired business will be successful or that an acquired business will prove to be profitable or sustainable.
We have borrowed under the credit facilities and through the issuance of debt securities and in the future may borrow under additional debt facilities from financial institutions. As of December 31, 2021, we had issued and outstanding $1,046.9 million aggregate principal amount of indebtedness, and $50.0 million aggregate liquidation preference of the Preferred Stock. In addition, as a BDC, our ability to borrow or issue preferred stock may be restricted if our total assets are less than 150% of our total borrowings and preferred stock. Furthermore, equity capital may be difficult to raise because, subject to some limited exceptions, as a BDC, we are generally not able to issue additional shares of our common stock at a price per share less than NAV without first obtaining approval for such issuance from our stockholders and our Independent Directors. Pursuant to approval granted at a special meeting of stockholders held on October 28, 2021, we are authorized, with the approval of the Board of Directors, to sell or otherwise issue shares of our common stock at a price below the then-current NAV per share, subject to certain limitations (including that the number of shares issued does not exceed 25% of our then-outstanding common stock immediately prior to each such offering). Such stockholder approval expires on October 28, 2022.
Any failure on our part to maintain our status as a BDC or RIC would reduce our operating flexibility, may hinder our achievement of our investment objective, may limit our investment choices and may subject us to greater regulation.
The Investment Company Act imposes numerous constraints on the operations of BDCs and RICs that do not apply to other types of investment vehicles. For example, under the Investment Company Act, we are required as a BDC to invest at least 70% of our total assets in specified types of “qualifying assets,” primarily in private U.S. companies or thinly-traded U.S. public companies, cash, cash equivalents, U.S. government securities and other high quality debt investments that mature in one year or less. In addition, in order to continue to qualify as a RIC for U.S. federal income tax purposes, we are required to satisfy certain source-of-income, diversification and distribution requirements. These constraints, among others, may hinder our ability to take advantage of attractive investment opportunities and to achieve our investment objective. See Part I, Item 1 of this Form 10-K “Business—Election to be Taxed as a RIC” for additional information.
Furthermore, any failure to comply with the requirements imposed on us as a BDC by the Investment Company Act could cause the SEC to bring an enforcement action against us and/or expose us to claims of private litigants. In addition, upon approval of a majority of our outstanding voting securities as required by the Investment Company Act, we may elect to withdraw our status as a BDC. If we decide to withdraw our election, or if we otherwise fail to qualify, or maintain our qualification, as a BDC, we might be regulated as a closed-end investment company that is required to register under the Investment Company Act, which would subject us to additional regulatory restrictions, significantly decrease our operating flexibility and could significantly increase our cost of doing business. In addition, any such failure could cause an event of default under our outstanding indebtedness, which could have a material adverse effect on our business, financial condition or results of operations.
Regulations governing our operation as a BDC affect our ability to, and the way in which we will, raise additional capital. As a BDC, the necessity of raising additional capital may expose us to risks, including the typical risks associated with leverage.
We may issue additional debt securities or preferred stock and/or borrow money from banks or other financial institutions, which we refer to collectively as “senior securities,” up to the maximum amount permitted by the Investment Company Act. In addition, we may continue to securitize certain of our loans. Under the provisions of the Investment Company Act, we are permitted, as a BDC, to issue senior securities only in amounts such that our asset coverage ratio, as defined in the Investment Company Act, equals at least 150% of total assets less all liabilities and indebtedness not represented by senior securities, after each issuance of senior securities. If the value of our assets declines, we may be unable to satisfy this test, which may prohibit us from paying dividends and could prevent us from maintaining our status as a RIC or may prohibit us from repurchasing shares of our common stock. If that happens, we may be required to sell a portion of our investments and, depending on the nature of our leverage, repay a portion of our indebtedness at a time when such sales may be disadvantageous. Accordingly, any failure to satisfy this test could have a material adverse effect on our business, financial condition or results of operations. As of December 31, 2021, our asset coverage calculated in accordance with the Investment Company Act was 181.94%. Also, any amounts that we use to service our indebtedness would not be available for distributions to our common
28

stockholders. Furthermore, as a result of issuing senior securities, our common stockholders would also be exposed to typical risks associated with increased leverage, including an increased risk of loss resulting from increased indebtedness.
On May 5, 2020, we issued and sold 2,000,000 shares of preferred stock to an affiliate of Carlyle in a private placement at a price of $25 per share (“Preferred Stock”). The Preferred Stock ranks “senior” to common stock in our capital structure, and preferred stockholders have separate voting rights on certain matters and have other rights, preferences, or privileges more favorable than those of our common stockholders. The issuance of the Preferred Stock and any additional preferred stock could have the effect of delaying, deferring or preventing a transaction or a change of control that might involve a premium price for holders of our common stock or otherwise be in their best interest.
We are not generally able to issue and sell our common stock at a price below the NAV per share. We may, however, sell our common stock, or warrants, options or rights to acquire our common stock, at a price below the then-current NAV per share of our common stock if our Independent Directors determine that such sale is in the best interests of us and our stockholders and our stockholders approve such sale. In any such case, the price at which our common stock are to be issued and sold may not be less than a price that, in the determination of our Independent Directors, closely approximates the market value of such shares (less any distributing commission or discount). Pursuant to approval granted at a special meeting of stockholders held on October 28, 2021, we are authorized, with the approval of the Board of Directors, to sell or otherwise issue shares of our common stock at a price below the then-current NAV per share, subject to certain limitations (including that the number of shares issued does not exceed 25% of our then-outstanding common stock immediately prior to each such offering). Such stockholder approval expires on October 28, 2022. See “—The NAV per share of our common stock may be diluted if we sell shares of our common stock in one or more offerings at prices below the then current NAV per share of our common stock.”
If we raise additional funds by issuing more common stock, or senior securities convertible into, or exchangeable for, our common stock, then the percentage ownership of our stockholders at that time will decrease, and holders of our common stock might experience dilution.
The NAV per share of our common stock may be diluted if we sell shares of our common stock in one or more offerings at prices below the then current NAV per share of our common stock.
Pursuant to approval granted at a special meeting of stockholders held on October 28, 2021, we are authorized, with the approval of the Board of Directors, to sell or otherwise issue shares of our common stock at a price below the then-current NAV per share, subject to certain limitations (including that the number of shares issued does not exceed 25% of our then-outstanding common stock immediately prior to each such offering). Such stockholder approval expires on October 28, 2022.
Any sale or other issuance of shares of our common stock at a price below NAV per share, including upon conversion of the Preferred Stock, would result in immediate dilution to our common stock and a reduction of our NAV per share. This dilution would occur as a result of the sale of shares at a price below the then current NAV per share of our common stock and a proportionately greater decrease in the stockholders’ interest in our earnings and assets and their voting interest in us than the increase in our assets resulting from such issuance. Because the number of shares of common stock that could be so issued and the timing of any issuance is not currently known, the actual dilutive effect cannot be predicted.

We borrow money, which magnifies the potential for gain or loss on amounts invested and may increase the risk of investing in us.
As part of our business strategy, we, including through our wholly owned subsidiaries, borrow from and issue senior debt securities to banks, insurance companies and other lenders. Holders of these loans or senior securities would have fixed-dollar claims on our assets that are superior to the claims of our stockholders. If the value of our assets decreases, leverage will cause our NAV to decline more sharply than it otherwise would have without leverage. Similarly, any decrease in our income would cause our net income to decline more sharply than it would have if we had not borrowed. This decline could negatively affect our ability to make dividend payments on our common stock.
Our ability to service our borrowings depends largely on our financial performance and is subject to prevailing economic conditions and competitive pressures. In addition, our management fees are payable based on our gross assets, including assets acquired through the use of leverage (but excluding cash and any temporary investments in cash-equivalents), which may give our Investment Adviser an incentive to use leverage to make additional investments. See “—We may be obligated to pay our Investment Adviser incentive compensation even if we incur a loss.” The amount of leverage that we employ will depend on our Investment Adviser’s and our Board of Directors’ assessment of market and other factors at the time of any proposed borrowing. We cannot assure you that we will be able to continue to obtain credit at all or on terms acceptable to us.
29

In addition to having fixed-dollar claims on our assets that are superior to the claims of our common stockholders, obligations to lenders may be secured by a first priority security interest in our portfolio companyof investments and cash. In the case of a liquidation event, those lenders would receive proceeds to the extent of their security interest before any distributions are made to our stockholders under certain circumstances. In addition, as the holder of the preferred interests issued by the 2015-1 Issuer (the “2015-1 Issuer Preferred Interests”) on the closing date of the 2015-1 Debt Securitization in exchange for our contribution to the 2015-1 Issuer of the initial closing date loan portfolio (i.e., the subordinated class of the 2015-1 Securitization), we may be required to absorb losses with respect to the 2015-1 Debt Securitization.
Our Credit Facility, the Senior Notes and the 2015-1R Notes impose financial and operating covenants that restrict our business activities, remedies on default and similar matters. As of December 31, 2021, we were in material compliance with the operating and financial covenants of our Credit Facility, the Senior Notes and the 2015-1R Notes. However, our continued compliance with these covenants depends on many factors, some of which are beyond our control. Accordingly, although we believe we will continue to be in compliance, we cannot assure you that we will continue to comply with the covenants in our Credit Facility, the Senior Notes and the 2015-1R Notes. Failure to comply with these covenants could result in a default. If we were unable to obtain a waiver of a default from the lenders or holders of that indebtedness, as applicable, those lenders or holders could accelerate repayment under that indebtedness, which may result in cross-acceleration of other indebtedness. An acceleration could have a material adverse impact on our business, financial condition and results of operations. Lastly, we may be unable to obtain additional leverage, which would, in turn, affect our return on capital.
As of December 31, 2021, we had a combined $1,046.9 million of outstanding consolidated indebtedness under our Credit Facility, Senior Notes and 2015-1R Notes. Our annualized interest cost as of December 31, 2021, was 2.75%, excluding fees (such as fees on undrawn amounts and amortization of upfront fees). Since we generally pay interest at a floating rate on our Credit Facility and 2015-1R Notes, an increase in interest rates will generally increase our borrowing costs.
The following table illustrates the effect of leverage on returns from an investment in our common stock assuming various annual returns on our portfolio, net of expenses. The calculations in the table below are hypothetical, and actual returns may be higher or lower than those appearing in the table below.
Assumed Return on Our Portfolio (Net of Expenses)
Assumed annual returns on the Company's portfolio (net of expenses)(10)%(5)%0%5%10%
Corresponding return to common stockholder (1)
(24.44)%(13.74)%(3.03)%7.67%18.38%
(1)    Assumes, as of December 31, 2021, (i) $2,031.4 million in total assets, (ii) $1,046.9 million in outstanding indebtedness, (iii) $948.8 million in net assets and (iv) weighted average effective annual interest rate, excluding fees (such as fees on undrawn amounts and amortization of financing costs), of 2.75%.
Based on an outstanding indebtedness of $1,046.9 million as of December 31, 2021, and the weighted average effective annual interest rate, excluding fees (such as fees on undrawn amounts and amortization of financing costs), of 2.75% as of that date, our investment portfolio at fair value would have had to produce an annual return of approximately 1.42% to cover annual interest payments on the outstanding debt. For more information on our indebtedness, see Part II, Item 7 of this Form 10-K “Management’s Discussion and Analysis of Financial Condition and Results of Operations—Financial Condition, Liquidity and Capital Resources.
Our indebtedness could adversely affect our business, financial conditions or results of operations.
We cannot assure you that our business will generate sufficient cash flow from operations or that future borrowings will be available to us under our credit facilities or otherwise in an amount sufficient to enable us to repay our indebtedness or to fund our other liquidity needs. We may need to refinance all or a portion of our indebtedness on or before it matures. We cannot assure you that we will be able to refinance any of our indebtedness on commercially reasonable terms or at all. If we cannot service our indebtedness, we may have to take actions such as selling assets or seeking additional equity. We cannot assure you that any such actions, if necessary, could be effected on commercially reasonable terms or at all, or on terms that would not be disadvantageous to our stockholders or on terms that would not require us to breach the terms and conditions of our existing or future debt agreements.
30

Changes in interest rates may increase our cost of capital, reduce the ability of our portfolio companies to replace existing financing with less expensive capital.service their debt obligations and decrease our net investment income.
General interest rate fluctuations and changes in credit spreads on floating rate loans may have a substantial negative impact on our investments and investment opportunities and, accordingly, may have a material adverse effect on our rate of return on invested capital, our net investment income and our NAV. Substantially all of our debt investments have variable interest rates that reset periodically based on benchmarks such as the London Interbank Offered Rate (“LIBOR” or “L”) and the U.S. Prime Rate (“Prime Rate” or “P”), so an increase in interest rates from their historically low present levels may make it more difficult for our portfolio companies to service their obligations under the debt investments that we hold. Rising interest rates could also cause portfolio companies to shift cash from other productive uses to the payment of interest, which may have a material adverse effect on their business and operations and could, over time, lead to increased defaults. Recent concerns about inflation have prompted officials from the Board of Governors of the Federal Reserve System (the “Federal Reserve Board”) to signal a policy shift that is currently expected to result in increases in interest rates over the course of 2022 and 2023.
Furthermore, because we typically borrow money to make investments, our net investment income depends, in part, upon the difference between the rate at which we borrow funds and the rate at which we invest those funds. As a result, we can offer no assurance that a significant change in market interest rates will not have a material adverse effect on our net investment income to the extent we use debt to finance our investments. In periods of rising interest rates, our cost of funds would increase, which could reduce our net investment income.
In general, rising interest rates will negatively impact the riskprice of a fixed rate debt instrument and falling interest rates will have a positive impact on price. Adjustable rate instruments also react to interest rate changes in a similar manner, although generally to a lesser degree (depending, however, on the characteristics of the reset terms, including the index chosen, frequency of reset and reset caps or floors, among other factors). Interest rate sensitivity is generally more pronounced and less predictable in instruments with uncertain payment or prepayment schedules.
In addition, a rise in the general level of floatinginterest rates can be expected to lead to higher interest rates applicable to our debt investments. Accordingly, an increase in interest rates would make it easier for us to meet or exceed the incentive fee hurdle rate loansin our Investment Advisory Agreement and may result in a substantial increase in the amount of incentive fees payable to our Investment Adviser with respect to our pre-incentive fee net investment income. Also, an increase in interest rates available to investors could make an investment in our common stock less attractive if other financing sourceswe are available. As market conditions change frequently, we will often be unablenot able to predict when, and if, this may be possible for eachincrease our distribution rate, which could reduce the value of our portfolio companies. Incommon stock.
The discontinuation of LIBOR and the adoption of alternative reference rates may adversely affect our business and results of operations.

On July 27, 2017, the UK Financial Conduct Authority announced that it intends to stop persuading or compelling banks to submit LIBOR rates after 2021. On March 5, 2021, ICE Benchmark Administration Limited (“ICE”) announced that all LIBOR settings will either cease to be provided by any administrator or no longer be representative: (a) immediately after December 31, 2021, in the case of somethe 1-week and 2-month U.S. dollar LIBOR settings; and (b) immediately after June 30, 2023, in the case of these loans, having the loan called early may haveremaining U.S. dollar LIBOR settings. It is unclear whether new methods of calculating LIBOR will be established such that it continues to exist. At this time, it is not possible to predict the effect of reducingany such changes, any establishment of alternative reference rates or any other reforms to LIBOR that may be enacted in the United Kingdom or elsewhere. It is possible that banks will not continue to provide submissions for the calculation of LIBOR. Similarly, it is not possible to predict whether LIBOR will continue to be viewed as an acceptable market benchmark, what rate or rates may become accepted alternatives to LIBOR, or what the effect of any such changes in views or alternatives may have on the financial markets for LIBOR-linked financial instruments.
To identify a successor rate for U.S. dollar LIBOR, the Alternative Reference Rates Committee (the “ARRC"), a U.S.-based group convened by the Federal Reserve Board and the Federal Reserve Bank of New York, was formed. Financial regulators in the United Kingdom, or the UK, the European Union, Japan and Switzerland also formed working groups with the aim of recommending alternatives to LIBOR denominated in their local currencies. On July 22, 2021, the ARRC formally recommended the Secured Overnight Financing Rate (“SOFR”) as its preferred alternative rate for LIBOR. SOFR is a measure of the cost of borrowing cash overnight, collateralized by U.S. Treasury securities, and is based on directly observable U.S. Treasury-backed repurchase transactions. Although SOFR appears to be the preferred replacement rate for U.S. dollar LIBOR, it is unclear if other benchmarks may emerge or if other rates will be adopted outside the U.S. The Bank of England’s current nominated replacement for GBP-LIBOR is the Sterling Overnight Interbank Average Rate (“SONIA”). Given the inherent differences between LIBOR and SOFR, or any other alternative benchmark rate that may be established, including SONIA, there remains uncertainty regarding the future utilization of LIBOR and the nature of any replacement rate.
31

In any event, LIBOR, to the extent it is published, is likely to perform differently than in the past and, ultimately, cease to exist as a global benchmark going forward. Until an alternative benchmark rate(s) becomes generally accepted and regularly implemented in the market, the uncertainty as to the future of LIBOR, its eventual phase-out, the transition to one or more alternate benchmark rate(s), and the implementation of such new benchmark rate(s) may impact a number of factors, which, either alone or in the aggregate, may cause a material adverse effect on our actualperformance and our ability to achieve its investment income belowobjective. The Investment Adviser does not have prior experience in investing during a period of benchmark rate transition and there can be no assurance that the Investment Adviser will be able to manage our expected investment income if the capital returned cannot be investedbusiness in transactions with equala profitable manner before, during or greater yields.after such transition.
The discontinuance of LIBOR may require us to renegotiate credit agreements entered into prior to the discontinuation of LIBOR with our portfolio companies that utilize LIBOR as a factor in determining the interest rate, in order to replace LIBOR with the new standard that is established, which may have an adverse effect on our ability to receive attractive returns.
If we are unable to do so, amounts outstanding under the Credit Facility may bear interest at a higher rate, which would increase the cost of our borrowings and, in turn, affect our return on capital.
Depending on several factors, including those set forth above, and the related costs of negotiating and documenting necessary changes to documentation, our business, financial projectionscondition and results of operations could be materially adversely impacted by the market transition or reform of certain reference rates and benchmarks. Other factors include the pace of the transition to replacement or reformed rates, the specific terms and parameters for and market acceptance of any alternative reference rates, prices and liquidity of trading markets for products based on alternative reference rates, and our ability to transition and develop appropriate systems and analytics for one or more alternative reference rates.

The impact of Brexit on our investments is uncertain and could adversely affect our business.
On January 31, 2020, the UK ended its membership in the European Union, or the EU, referred to as Brexit. Following the termination of a transition period, the UK and the EU entered into a trade and cooperation agreement to govern the future relationship between the parties, which was provisionally applied as of January 1, 2021 and entered into force on May 1, 2021 following ratification by the EU. With respect to financial services, the agreement leaves decisions on equivalence and adequacy to be determined by each of the UK and EU unilaterally in due course. As a result, certain UK licensed entities are unable to provide regulated services in a number of EU jurisdictions from the end of December 2020, absent regulatory relief or other measures implemented by individual countries. Such agreement is untested and may lead to ongoing political and economic uncertainty and periods of exacerbated volatility in both the United Kingdom and in wider European and global markets for some time. The longer term economic, legal, political and social implications of Brexit are unclear at this stage. Brexit has led to ongoing political and economic uncertainty and periods of increased volatility in both the UK and in wider European markets for some time. Brexit could lead to calls for similar referendums in other European jurisdictions, which could cause increased economic volatility in the European and global markets. This mid- to long-term uncertainty could have adverse effects on the economy generally and on our ability to earn attractive returns. In particular, currency volatility could mean that our returns are adversely affected by market movements and could make it more difficult, or more expensive, for us to execute prudent currency hedging policies. Potential decline in the value of the British Pound and/or the Euro against other currencies, along with the potential further downgrading of the UK’s sovereign credit rating, could also have an impact on the performance of certain investments made in the UK or Europe.
We may experience fluctuations in our quarterly results.
We could experience fluctuations in our quarterly operating results due to a number of factors, including, the pace at which investments are made, the interest rate payable on the debt securities we acquire, the default rate on such securities, rates of repayment, the level of our expenses, variations in and the timing of the recognition of realized and unrealized gains or losses and changes in unrealized appreciation or depreciation, the degree to which we encounter competition in our markets and general economic conditions. As a result of these factors, results for any period should not be relied upon as being indicative of performance in future periods.
There are significant potential conflicts of interest, including the management of other investment funds and accounts by our Investment Adviser, which could impact our investment returns.
Our executive officers and directors, other current and future principals of our Investment Adviser and certain members of our Investment Adviser’s investment committee currently serve, and may continue to service, as officers, directors or principals of other entities and affiliates of our Investment Adviser and funds managed by our affiliates that operate in the same or a related line of business as we do. Currently, our executive officers, as well as the other principals of our Investment Adviser manage other funds affiliated with Carlyle, including other existing and future affiliated BDCs, including TCG BDC II,
32

Inc. and Carlyle Secured Lending III. In addition, our Investment Adviser’s investment team has responsibilities for sourcing and managing U.S. middle market debt investments for certain other investment funds and accounts. Accordingly, they have obligations to investors in those entities, the fulfillment of which may not be in the best interests of, or may be adverse to the interests of, us or our stockholders. Although the professional staff of our Investment Adviser will devote as much time to our management as appropriate to enable our Investment Adviser to perform its duties in accordance with the Investment Advisory Agreement, the investment professionals of our Investment Adviser may have conflicts in allocating their time and services among us, on the one hand, and investment vehicles managed by Carlyle or one or more of its affiliates on the other hand.
Our Investment Adviser and its affiliated investment managers may face conflicts in allocating investment opportunities between us and affiliated investment vehicles that have overlapping objectives with ours. For example, certain affiliated investment vehicles may have arrangements that provide for higher management or incentive fees, greater expense reimbursements or overhead allocations, or permit the Investment Adviser and its affiliates to receive transaction fees not permitted under the Investment Company Act, all of which may contribute to this conflict of interest and create an incentive for our Investment Adviser or its affiliated managers to favor such other accounts. Furthermore, our Investment Adviser and its affiliated investment managers may form vehicles for the benefit of third-party investors that will be entitled to a portion of the allocation with respect to an investment. Such co-investment rights could result in us being allocated a smaller share of an investment than would otherwise be the case in the absence of such co-investment rights. Although our Investment Adviser will endeavor to allocate investment opportunities in a fair and equitable manner in accordance with its allocation policies and procedures, it is possible that, in the future, we may not be given the opportunity to participate in investments made by investment funds managed by our Investment Adviser or an investment manager affiliated with our Investment Adviser, including Carlyle.
We and our affiliates own, and may continue to own, investments at different levels of a portfolio company’s capital structure or otherwise own different classes of a portfolio company’s securities, which may give rise to conflicts of interest or perceived conflicts of interest. Conflicts may also arise because portfolio decisions regarding our portfolio may benefit our affiliates. Our affiliates may pursue or enforce rights with respect to one of our portfolio companies, and those activities may have an adverse effect on us.
It is possible that Carlyle or an affiliated investment vehicle will invest in a company that is or becomes a competitor of a portfolio company of ours. Such investment could prove inaccurate.create a conflict between us, on the one hand, and Carlyle or the affiliated investment vehicle, on the other hand. In such a situation, Carlyle or our Investment Adviser may also have a conflict in the allocation of its own resources to our portfolio company. In addition, certain affiliated investment vehicles will be focused primarily on investing in other funds that may have strategies that overlap and/or directly conflict and compete with us.
As a result of the expansion of Carlyle’s platform into various lines of business in the alternative asset management industry, Carlyle is subject to a number of actual and potential conflicts of interest and subject to greater regulatory oversight than that to which it would otherwise be subject if it had just one line of business. In addition, as Carlyle expands its platform, the allocation of investment opportunities among its investment funds, including us, is expected to become more complex. In addressing these conflicts and regulatory requirements across Carlyle’s various businesses, Carlyle has implemented, and may continue to implement, certain policies and procedures. For example, Carlyle has established an information barrier between Carlyle Global Credit, on the one hand, and the rest of Carlyle, on the other, which generally restricts the communications of Carlyle Global Credit with other Carlyle investment professionals pursuant to the information barrier policy. In addition, we may come into possession of material non-public information with respect to issuers in which we may be considering making an investment. As a consequence, we may be precluded from providing such information or other ideas to other funds affiliated with Carlyle that may benefit from such information or we may be precluded from otherwise consummating a contemplated investment. To the extent we or any other funds affiliated with Carlyle fail to appropriately deal with any such conflicts, it could negatively impact our reputation or Carlyle’s reputation and our ability to raise additional funds and the willingness of counterparties to do business with us or result in potential litigation against us.
In the ordinary course of business, we enter, and may continue to enter, into transactions with affiliates and portfolio companies that may be considered related party transactions. We have implemented certain policies and procedures whereby certain of our executive officers screen each of our transactions for any possible affiliations between the proposed portfolio investment, us and other affiliated persons, including our Investment Adviser, stockholders that own more than 5% of us, employees, officers and directors of us and our Investment Adviser and certain persons directly or indirectly controlling, controlled by or under common control with the foregoing persons. We will not enter into any agreements unless and until we are satisfied that doing so will not raise concerns under the Investment Company Act or, if such concerns exist, we have taken appropriate actions to seek Board of Directors review and approval or SEC exemptive relief for such transaction.
33

In the course of our investing activities, we pay management and incentive fees to our Investment Adviser and reimburse our Investment Adviser for certain expenses it incurs in accordance with our Investment Advisory Agreement. The base management fee is based on our gross assets and the incentive fee is paid on income, both of which include leverage. As a result, investors in our common stock invest on a “gross” basis and receive distributions on a “net” basis after expenses, resulting in a lower rate of return than an investor might achieve through direct investments. Because these fees are based on gross assets, our Investment Adviser benefits to the extent we incur debt or use leverage. Accordingly, there may be times when the senior management team of our Investment Adviser has interests that differ from those of our stockholders, giving rise to a conflict.
In addition, we pay our Administrator, an affiliate of our Investment Adviser, its costs and expenses and our allocable portion of overhead incurred by it in performing its obligations under the Administration Agreement, including, compensation paid to or compensatory distributions received by our officers (including our Chief Compliance Officer, Chief Financial Officer and Treasurer) and their respective staff who provide services to us, operations staff who provide services to us, and internal audit staff in their role of performing our Sarbanes-Oxley Act internal control assessment. These arrangements create conflicts of interest that our Board of Directors monitors. Despite Carlyle’s good faith judgment to arrive at a fair and reasonable expense allocation methodology, the use of any particular methodology may lead us to bear relatively more expense in certain instances and relatively less in other instances compared to what we would have borne if a different methodology had been used. However, Carlyle seeks to make allocations that are equitable on an overall basis in its good faith judgment.
We generally evaluate the capital structure of portfolio companies on the basis of financial projections prepared by the management of such portfolio companies. These projected operating results are normally based primarily on judgmentsmay be obligated to pay our Investment Adviser incentive compensation even if we incur a loss.
Our Investment Adviser is entitled to incentive compensation for each calendar quarter in an amount equal to a percentage of the excess of our pre-incentive fee net investment income for that quarter (before deducting incentive compensation) above a performance threshold for that quarter. In calculating our performance threshold, we use net assets which results in a lower hurdle rate than if we used gross assets like we do for determining our base management fee. Our pre-incentive fee net investment income for incentive compensation purposes excludes realized and unrealized capital losses and depreciation that we may incur in the calendar quarter, even if such capital losses or depreciation result in a net loss on our statement of the portfolio companies. In all cases, projections are only estimates of future resultsoperations for that are based upon assumptions made at the time that the projections are developed. General economic conditions, which are not predictable with accuracy, along with other factorsquarter. Thus, we may cause actual performancebe required to fall short of the financial projections that were used to establishpay our Investment Adviser incentive compensation for a given portfolio company’s capital structure. Because of the leverage thatcalendar quarter even if there is typically employed by our portfolio companies, this could cause a substantial decreasedecline in the value of our portfolio or we incur a net loss for that quarter.
Our fee structure may induce our Investment Adviser to pursue speculative investments and incur leverage, and investors may bear the cost of multiple levels of fees and expenses.
The incentive fees payable by us to our Investment Adviser may create an incentive for our Investment Adviser to pursue investments on our behalf that are riskier or more speculative than would be the case in the absence of such compensation arrangement. The incentive fees payable to our Investment Adviser are calculated based on a percentage of our return on invested capital. This may encourage our Investment Adviser to use leverage to increase the return on our investments. In particular, a portion of the incentive fees payable to the Investment Adviser is calculated based on the Company’s pre-incentive fee net investment income, expressed as a rate of return on the value of the Company’s net assets at the end of the immediately preceding calendar quarter, subject to a “hurdle rate” of 1.50% per quarter (6% annualized) and a “catch-up rate” of 1.82% per quarter (7.28% annualized). See Note 4 to the consolidated financial statements included in Part II, Item 8 of this Form 10-K. Accordingly, an increase in leverage may make it easier for the Company to meet or exceed the hurdle rate applicable to the income-based incentive fee and may result in an increase in the amount of income-based incentive fee payable to the Investment Adviser.
Under certain circumstances, the use of leverage may increase the likelihood of default, which would impair the value of our securities. In addition, our Investment Adviser receives the incentive fees based, in part, upon net capital gains realized on our investments. Unlike that portion of the incentive fees based on income, there is no hurdle rate applicable to the portion of the incentive fees based on net capital gains. As a result, our Investment Adviser may have incentive to invest more capital in investments that are likely to result in capital gains as compared to income producing securities. Such a practice could result in our investing in more speculative securities than would otherwise be the case, which could result in higher investment losses, particularly during economic downturns.
The “catch-up” portion of the incentive fees may encourage our Investment Adviser to accelerate or defer interest payable by portfolio companies from one calendar quarter to another, potentially resulting in fluctuations in timing and dividend amounts.
Additionally, the incentive fees payable by us to our Investment Adviser may create an incentive for our Investment Adviser to cause us to realize capital gains or losses that may not be in the best interest of us or our stockholders. Under the
34

incentive fee structure, our Investment Adviser benefits when we recognize capital gains and, because our Investment Adviser determines when an investment is sold, our Investment Adviser controls the timing of the recognition of such capital gains. Our Board of Directors is charged with protecting our stockholders’ interests by monitoring how our Investment Adviser addresses these and other conflicts of interest associated with its management services and compensation.
We may invest, to the extent permitted by law, in the securities and instruments of other investment companies, including private funds, and, to the extent we so invest, bear our ratable share of any such investment company’s expenses, including management and performance fees. We also remain obligated to pay management and incentive fees to our Investment Adviser with respect to the assets invested in the securities and instruments of other investment companies. With respect to each of these investments, each of our stockholders bears his or her share of the management and incentive fees of our Investment Adviser as well as indirectly bearing the management and performance fees and other expenses of any investment companies in which we invest.
We will be subject to corporate-level income tax if we are unable to maintain our qualification as a RIC for U.S. federal income tax purposes under Subchapter M of the Code.
Although we have elected to be treated, and intend to qualify annually, as a RIC for U.S. federal income tax purposes under Subchapter M of the Code, we cannot assure you that we will be able to maintain RIC status. To maintain RIC status and be relieved of U.S. federal income taxes on income and gains distributed to our stockholders, we must, among other things, have in effect an election to be treated, and continue to qualify, as a BDC under the Investment Company Act at all times during each taxable year and meet the Annual Distribution Requirement, the 90% Gross Income Test and the Diversification Tests (each as defined and explained more fully in Part I, Item 1 of this Form 10-K “Business—Election to be Taxed as a RIC.”).
If we fail to maintain our RIC status for any reason, and we do not qualify for certain relief provisions under the Code, we would be subject to corporate-level U.S. federal income tax (and any applicable U.S. state and local taxes) regardless of whether we make any distributions to our stockholders. In this event, the resulting taxes and any resulting penalties could substantially reduce our net assets, the amount of our income available for distribution and the amount of our distributions to our stockholders, which would have a material adverse effect on our financial performance. For additional discussion regarding the tax implications of a RIC, see Part I, Item 1 of this Form 10-K “Business—Election to be Taxed as a RIC.
A portion of our income and fees may not be qualifying income for purposes of the income source requirement.
Some of the income and fees that we may recognize will not satisfy the income source requirement applicable to RICs. In order to ensure that such income and fees do not disqualify us as a RIC for a failure to satisfy such requirement, we may be required to recognize such income and fees indirectly through one or more entities treated as corporations for U.S. federal income tax purposes. Such corporations will be required to pay U.S. corporate income tax on their earnings, which ultimately will reduce the amount of income available for distribution.
If we are not treated as a “publicly offered regulated investment company,” as defined in the Code, certain U.S. stockholders will be treated as having received a dividend from us in the amount of such U.S. stockholders’ allocable share of the management and incentive fees paid to our Investment Adviser and certain of our other expenses.
We expect to be treated as a “publicly offered regulated investment company” as a result of shares of our common stock being treated as regularly traded on an established securities market. However, we cannot assure you that we will be treated as a publicly offered regulated investment company for all years. If we are not treated as a publicly offered regulated investment company for any calendar year, each U.S. stockholder that is an individual, trust or estate will be treated as having received a dividend from us in the amount of such U.S. stockholder’s allocable share of the management and incentive fees paid to our Investment Adviser and certain of our other expenses for the calendar year, and these fees and expenses will be treated as miscellaneous itemized deductions of such U.S. stockholder. Miscellaneous itemized deductions generally are deductible by a U.S. stockholder that is an individual, trust or estate only for tax years of such U.S. stockholder beginning after 2025 and only to the extent that the aggregate of such U.S. stockholder’s miscellaneous itemized deductions exceeds 2% of such U.S. stockholder’s adjusted gross income for U.S. federal income tax purposes, are not deductible for purposes of the alternative minimum tax and are subject to the overall limitation on itemized deductions under the Code. See Part I, Item 1 of this Form 10-K “Business—Election to be Taxed as a RIC.
35

If we fail to maintain the adequacy of our internal controls over financial reporting, we may not be able to accurately report our financial results, which may adversely affect investor confidence in us and, as a result, the value of the securities we issue.
Effective internal controls over financial reporting are necessary for us to provide reliable financial reports. Matters impacting our internal controls may cause us to be unable to report our financial information on a timely basis and thereby subject us to adverse regulatory consequences, including sanctions by the SEC or violations of applicable stock exchange listing rules, and result in a breach of the covenants under the agreements governing any of our financing arrangements. There could also be a negative reaction in the financial markets due to a loss of investor confidence in us and the reliability of our financial statements. Additionally, if we identify one or more material weaknesses in our internal control over financial reporting, we will be unable to assert that our internal controls are effective. If we are unable to assert that our internal control over financial reporting is effective, or if our independent registered public accounting firm were to report a material weakness in our internal controls over financial reporting, we could lose investor confidence in the accuracy and completeness of our financial reports. This could materially adversely affect us and lead to a decline in the price of the securities we issue.
Our internal control over financial reporting may not prevent or detect misstatements because of its inherent limitations. Even effective internal controls can provide only reasonable assurance with respect to the preparation and fair presentation of financial statements. If we fail to maintain the adequacy of our internal controls, including any failure to implement required new or improved controls, or if we experience difficulties in their implementation, our operations, financial reporting or financial results could be harmed and we could fail to meet our financial reporting obligations.
Certain investors are limited in their ability to make significant investments in us.
Private funds that are excluded from the definition of “investment company” either pursuant to Section 3(c)(1) or 3(c)(7) of the Investment Company Act are restricted from acquiring directly or through a controlled entity more than 3% of our total outstanding voting stock (measured at the time of the acquisition), unless certain conditions are satisfied. Investment companies registered under the Investment Company Act and BDCs are also subject to this restriction as well as other limitations under the Investment Company Act that would restrict the amount that they are able to invest in our securities. As a result, certain investors will be limited in their ability to make significant investments in us at a time that they might desire to do so.
Our Board of Directors is authorized to reclassify any unissued shares of common stock into one or more classes of preferred stock, which could convey special rights and privileges to its owners.
Under the MGCL and our Charter, our Board of Directors is authorized to classify and reclassify any authorized but unissued shares of stock into one or more classes of stock, including preferred stock. Prior to the issuance of shares of each class or series, the Board of Directors is required by Maryland law and our Charter to set the terms, preferences, conversion or other rights, voting powers, restrictions, limitations as to dividends or other distributions, qualifications and terms or conditions of redemption for each class or series. Thus, the Board of Directors could authorize the issuance of shares of preferred stock with terms and conditions which could have the effect of delaying, deferring or preventing a transaction or a change in control that might involve a premium price for holders of our common stock or otherwise be in their best interest. The cost of any such reclassification would be borne by our existing common stockholders. Certain matters under the Investment Company Act require the separate vote of the holders of any issued and outstanding preferred stock. For example, holders of preferred stock would vote separately from the holders of common stock on a proposal to cease operations as a BDC. In addition, the Investment Company Act provides that holders of preferred stock are entitled to vote separately from holders of common stock to elect two preferred stock directors. We currently have no plans to issue additional preferred stock, but may determine to issue additional preferred stock in the future. The issuance of preferred stock convertible into shares of common stock might also reduce the net income per share and NAV per share of our common stock upon conversion, provided, that we will only be permitted to issue such convertible preferred stock to the extent we comply with the requirements of Section 61 of the Investment Company Act. In addition, under the Investment Company Act, participating preferred stock and preferred stock constitutes a “senior security” for purposes of the 150% asset coverage test. These effects, among others, could have an adverse effect on an investment in our common stock.
On May 5, 2020 we issued the Preferred Stock. See “—We issued the Preferred Stock in May 2020 and we may in the future determine to issue additional preferred stock, which could adversely affect the market value of our common stock,” “—Our stockholders may experience dilution upon the conversion of the Preferred Stock,” and “—Holders of the Preferred Stock have the right to elect members of the board of directors and class voting rights on certain matters.”
36

Provisions of the MGCL and of our Charter and bylaws could deter takeover attempts and have an adverse impact on the price of our common stock.
The MGCL and our Charter and bylaws contain provisions that may discourage, delay or make more difficult a change in control of us or the removal of our directors. We are subject to the Maryland Business Combination Act (“MBCA”), subject to any applicable requirements of the Investment Company Act. Our Board of Directors has adopted a resolution exempting from the MBCA any business combination between us and any other person, subject to prior approval of such business combination by our Board of Directors, including approval by a majority of our Independent Directors. If the resolution exempting business combinations is repealed or our Board of Directors does not approve a business combination, the MBCA may discourage third parties from trying to acquire control of us and increase the difficulty of consummating such an offer. Our bylaws exempt from the Maryland Control Share Acquisition Act (“Control Share Act”) acquisitions of our stock by any person. If we amend our bylaws to repeal the exemption from the Control Share Act, the Control Share Act also may make it more difficult for a third party to obtain control of us and increase the difficulty of consummating such a transaction. However, we will amend our bylaws to be subject to the Control Share Act only if our Board of Directors determines that it would be in our best interests and if the SEC staff does not object to our determination that our being subject to the Control Share Act does not conflict with the Investment Company Act.
We have also adopted measures that may make it difficult for a third party to obtain control of us, including provisions of our Charter classifying our Board of Directors in three classes serving staggered three-year terms, and authorizing our Board of Directors to classify or reclassify shares of our stock in one or more classes or series, to cause the issuance of additional shares of our stock, to amend our Charter without stockholder approval and to increase or decrease the number of shares of stock or the number of shares of stock of any class or series that we have authority to issue. These provisions, as well as other provisions of our Charter and bylaws, may delay, defer or prevent a transaction or a change in control that might otherwise be in the best interests of our stockholders.
Our Board of Directors may change our investment objective, operating policies and strategies without prior notice and without stockholder approval.
Our Board of Directors has the authority to modify or, if applicable, waive our investment objectives, operating policies and strategies without prior notice (except as required by the Investment Company Act) and without stockholder approval. In addition, none of our investment policies is fundamental and any of them may be changed without stockholder approval. However, absent stockholder approval, we may not change the nature of our business so as to cease to be, or withdraw our election as, a BDC. We cannot predict the effect any changes to our current investment objectives, operating policies or strategies would have on our business, operating results and value of our stock. Nevertheless, the effects may adversely affect our business and impact our ability to make distributions.
We are highly dependent on information systems, and systems failures could significantly disrupt our business, which may, in turn, negatively affect the market price of our common stock and our ability to pay dividends.
Our business is highly dependent on the communications and information systems of the Adviser, its affiliates and third parties. Any failure or interruption of those systems or services, including as a result of the termination or suspension of an agreement with any third-party service providers, could cause delays or other problems in our activities. Our financial, accounting, data processing, backup or other operating systems and facilities may fail to operate properly or become disabled or damaged as a result of a number of factors including events that are wholly or partially beyond our control and adversely affect our business. There could be:
sudden electrical or telecommunications outages;
natural disasters such as earthquakes, tornadoes and hurricanes;
disease pandemics;
events arising from local or larger scale political or social matters, including terrorist acts; and
cyber-attacks.
These events, in turn, could have a material adverse effect on our operating results and negatively affect the market price of our common stock and our ability to pay dividends to our stockholders.
37

Cybersecurity risks and cyber incidents may adversely affect our business or those of our portfolio companies by causing a disruption to our operations, a compromise or corruption of confidential information and/or damage to business relationships, or those of our portfolio companies, all of which could negatively impact our business, results of operations or financial condition.
Cyber incidents and cyber-attacks have been occurring globally at a more frequent and severe level and are expected to continue to increase in frequency and severity in the future. A cyber incident is considered to be any adverse event that threatens the confidentiality, integrity or availability of our information resources. These incidents may be an intentional attack or an unintentional event and could involve gaining unauthorized access to, use, alteration or destruction of our information systems for purposes of misappropriating assets, obtaining ransom payments, stealing confidential information, corrupting data or causing operational disruption, or may involve phishing. The result of these incidents may include disrupted operations, misstated or unreliable financial data, liability for stolen information, misappropriation of assets, increased cybersecurity protection and insurance costs, litigation and damage to our business relationships. This could result in significant losses, reputational damage, litigation, regulatory fines or penalties, or otherwise adversely affect our business, financial condition or results of operations. In addition, we may be required to expend significant additional resources to modify our protective measures and to investigate and remediate vulnerabilities or other exposures arising from operational and security risks. The costs related to cybersecurity incidents may not be fully insured or indemnified. As our and our portfolio companies’ reliance on technology has increased, so have the risks posed to our information systems, both internal and those provided by our Investment Adviser and third-party service providers, and the information systems of our portfolio companies. We, our Investment Adviser and its affiliates have implemented processes, procedures and internal controls to help mitigate cybersecurity risks and cyber intrusions, but these measures, as well as our increased awareness of the nature and extent of a risk of a cyber incident, may be ineffective and do not guarantee that a cyber incident will not occur or that our financial results, operations or confidential information will not be negatively impacted by such an incident.
Third parties with which we do business (including, but not limited to, service providers, such as accountants, custodians, transfer agents and administrators, and the issuers of securities in which we invest) may also be sources or targets of cybersecurity or other technological risks. We outsource certain functions and these relationships allow for the storage and processing of our information and assets, as well as certain investor, counterparty, employee and borrower information. While we engage in actions to reduce our exposure resulting from outsourcing, we cannot control the cybersecurity plans and systems put in place by these third parties and ongoing threats may result in unauthorized access, loss, exposure or destruction of data, or other cybersecurity incidents, with increased costs and other consequences, including those described above. Privacy and information security laws and regulation changes, and compliance with those changes, may also result in cost increases due to system changes and the development of new administrative processes.

Changes in laws or regulations governing our business or the businesses of our portfolio companies, changes in the interpretation thereof or newly enacted laws or regulations, and any failure by us or our portfolio companies to comply with these laws or regulations may adversely affect our business and the businesses of our portfolio companies.
We and our portfolio companies are subject to laws and regulations at the U.S. federal, state and local levels and, in some cases, foreign levels. These laws and regulations, as well as their interpretation, may change from time to time, and new laws, regulations and interpretations may also come into effect. Any such new or changed laws or regulations could have a material adverse effect on our business or the business of our portfolio companies. The legal, tax and regulatory environment for BDCs, investment advisers and the instruments that they utilize (including derivative instruments) is continuously evolving. In addition, there is significant uncertainty regarding recently enacted legislation and the regulations that have recently been adopted and future regulations that may or may not be adopted pursuant to such legislation) and, consequently, the full impact that such legislation will ultimately have on us and the markets in which we trade and invest is not fully known. Such uncertainty and any resulting confusion may itself be detrimental to the efficient functioning of the markets and the success of certain investment strategies.
In addition, as private equity firms become more influential participants in the U.S. and global financial markets and economy generally, there recently has been pressure for greater governmental scrutiny and/or regulation of the private equity industry. It is uncertain as to what form and in what jurisdictions such enhanced scrutiny and/or regulation, if any, on the private equity industry may ultimately take. Therefore, there can be no assurance as to whether any such scrutiny or initiatives will have an adverse impact on the private equity industry, including our ability to effect operating improvements or restructurings of our portfolio companies or otherwise achieve our objectives.
Over the last several years, there also has been an increase in regulatory attention to the extension of credit outside of the traditional banking sector, raising the possibility that some portion of the non-bank financial sector will be subject to new regulation. While it cannot be known at this time whether any regulation will be implemented or what form it will take,
38

increased regulation of non-bank credit extension could negatively impact our operating results or financial condition, impose additional costs on us, intensify the regulatory supervision of us or otherwise adversely affect our business.
Our Investment Adviser, Administrator and sub-administrators are able to resign upon 60 days’ notice, and we may not be able to find a suitable replacement within that time, resulting in a disruption in our operations that could adversely affect our financial condition, business and results of operations.
Our Investment Adviser, our Administrator and our sub-administrators have the right to resign under the Investment Advisory Agreement, the Administration Agreement and the Sub-Administration Agreements, respectively, upon 60 days’ written notice, whether a replacement has been found or not. If any of them resign, it may be difficult to find a replacement with similar expertise and ability to provide the same or equivalent services on acceptable terms within 60 days, or at all. If a replacement is not found quickly, our business, results of operation and financial condition as well as our ability to pay distributions are likely to be adversely affected and the value of our shares may decline. In addition, the coordination of our internal management and investment activities is likely to suffer if we are unable to identify and reach an agreement with a single institution or group of executives having the expertise possessed by our Investment Adviser, our Administrator and their affiliates, including certain of our sub-administrators. Even if a comparable service provider or individuals performing such services are retained, whether internal or external, their integration into our business and lack of familiarity with our investment objective may result in additional costs and time delays that may materially adversely affect our business, results of operations and financial condition. Moreover, it will be an event of default under the Credit Facility if our Investment Adviser or an affiliate of our Investment Adviser ceases to manage us, which could result in the immediate acceleration of the amounts due under the Credit Facility.
Our Investment Adviser’s liability is limited under the Investment Advisory Agreement, and we are required to indemnify our Investment Adviser against certain liabilities, which may lead our Investment Adviser to act in a riskier manner on our behalf than it would when acting for its own account.
Our Investment Adviser has not assumed any responsibility to us other than to render the services described in the Investment Advisory Agreement, and it will not be responsible for any action of our Board of Directors in declining to follow our Investment Adviser’s advice or recommendations. Pursuant to the Investment Advisory Agreement, our Investment Adviser and its members and their respective officers, managers, partners, agents, employees, controlling persons and members and any other person or entities affiliated with it will not be liable to us for their acts under the Investment Advisory Agreement, absent willful misfeasance, bad faith, gross negligence or reckless disregard in the performance of their duties. We have agreed to indemnify, defend and protect our Investment Adviser and its members and their respective officers, managers, partners, agents, employees, controlling persons and members and any other person or entities affiliated with it with respect to all damages, liabilities, costs and expenses arising out of or otherwise based upon the performance of any of our Investment Adviser’s duties or obligations under the Investment Advisory Agreement or otherwise as an Investment Adviser for us, and not arising out of willful misfeasance, bad faith, gross negligence or reckless disregard in the performance of their duties under the Investment Advisory and Agreement. These protections may lead our Investment Adviser to act in a riskier manner when acting on our behalf than it would when acting for its own account. See “Risks Related to Our Business and StructureOur fee structure may induce our Investment Adviser to pursue speculative investments and incur leverage, and investors may bear the cost of multiple levels of fees and expenses.” for additional information.
We are subject to certain risks as a result of our direct interest in the 2015-1 Issuer Preferred Interests.
Because each of the SPV and the 2015-1 Issuer is disregarded as an entity separate from its owner for U.S. federal income tax purposes, the sale or contribution by the SPV to us and the sale or contribution by us to the 2015-1 Issuer as part of the 2015-1 Debt Securitization and 2015-1 Debt Securitization Refinancing did not constitute a taxable event for U.S. federal income tax purposes. If the U.S. Internal Revenue Service were to take a contrary position, there could be a material adverse effect on our business, financial condition, results of operations or cash flows.
The 2015-1 Issuer Preferred Interests are subordinated obligations of the 2015-1 Issuer.
The 2015-1 Issuer is the residual claimant on funds, if any, remaining after holders of all classes of the 2015-1R Notes have been paid in full on each payment date or upon maturity of the 2015-1R Notes under the 2015-1 Debt Securitization Refinancing documents. The 2015-1 Issuer Preferred Interests represent all of the equity interest in the 2015-1 Issuer and, as the holder of the 2015-1 Issuer Preferred Interests, we may receive distributions, if any, only to the extent that the 2015-1 Issuer makes distributions out of funds remaining after holders of all classes of the 2015-1R Notes have been paid in full on each
39

payment date any amounts due and owing on such payment date or upon maturity of the 2015-1R Notes. There is no guarantee that we will receive any distributions as the holders of the 2015-1 Issuer Preferred Interests.
The interests of holders of the 2015-1R Notes issued by the 2015-1 Issuer may not be aligned with our interests.
The 2015-1R Notes are the debt obligations ranking senior in right of payment to our interests. As such, there are circumstances in which the interests of holders of the 2015-1R Notes may not be aligned with our interests. For example, under the terms of the 2015-1 Issuer, holders of the 2015-1R Notes have the right to receive payments of principal and interest prior to distribution to our interests.
For as long as the 2015-1R Notes remain outstanding, holders of the 2015-1R Notes have the right to act, in certain circumstances, with respect to the portfolio loans in ways that may benefit their interests but not the interests of holders of the 2015-1 Issuer Preferred Interests, including by exercising remedies under the indenture governing the 2015-1R Notes (the “2015-1 Indenture”).
If an event of default has occurred and acceleration occurs in accordance with the terms of the 2015-1 Indenture, the 2015-1R Notes then outstanding will be paid in full before any further payment or distribution to the 2015-1 Issuer Preferred Interests. In addition, if an event of default occurs, holders of a majority of the 2015-1R Notes then outstanding will be entitled to determine the remedies to be exercised under the 2015-1 Indenture, subject to the terms of the 2015-1 Indenture. For example, upon the occurrence of an event of default with respect to the notes issued by the 2015-1 Issuer, the trustee or holders of a majority of the 2015-1R Notes then outstanding may declare the principal, together with any accrued interest, of all the 2015-1R Notes to be immediately due and payable. This would have the effect of accelerating the principal on such notes, triggering a repayment obligation on the part of the 2015-1 Issuer. If at such time the portfolio loans of the 2015-1 Issuer were not performing well, the 2015-1 Issuer may not have sufficient proceeds available to enable the trustee under the 2015-1 Indenture to pay a distribution to holders of the 2015-1 Issuer Preferred Interests.
Remedies pursued by the holders of the 2015-1R Notes could be adverse to the interests of the holders of the 2015-1 Issuer Preferred Interests, and the holders of the 2015-1R Notes have no obligation to consider any possible adverse effect on such other interests. Thus, any remedies pursued by the holders of the 2015-1R Notes may not be in our best interests and we may not receive payments or distributions upon an acceleration of the 2015-1R Notes. Any failure of the 2015-1 Issuer to make distributions on the 2015-1 Issuer Preferred Interests we hold, directly or indirectly, whether as a result of an event of default or otherwise, could have a material adverse effect on our business, financial condition, results of operations and cash flows and may result in an inability of us to make distributions sufficient to allow for us to qualify as a RIC for U.S. federal income tax purposes.
The 2015-1 Issuer may fail to meet certain asset coverage tests.
Under the documents governing the 2015-1 Debt Securitization Refinancing, there are two coverage tests applicable to the 2015-1R Notes.
The first such test compares the amount of interest received on the portfolio loans held by the 2015-1 Issuer to the amount of interest payable in respect of the 2015-1R Notes. To meet this first test, interest received on the portfolio loans must equal at least 110% of the interest payable in respect of the 2015-1R Notes issued by the 2015-1 Issuer.
The second such test compares the adjusted collateral principal amount of the portfolio loans of the 2015-1 Debt Securitization Refinancing to the aggregate outstanding principal amount of the 2015-1R Notes. To meet this second test at any time, the adjusted collateral principal amount of the portfolio loans must equal at least 116.4% of the outstanding principal amount of the 2015-1R Notes.
If any coverage test with respect to the 2015-1R Notes is not met, proceeds from the portfolio of loans that otherwise would have been distributed to the holders of the 2015-1 Issuer Preferred Interests will instead be used to redeem first the 2015-1R Notes, to the extent necessary to satisfy the applicable asset coverage tests on a pro forma basis after giving effect to all payments made in respect of the 2015-1R Notes, which we refer to as a mandatory redemption, or to obtain the necessary ratings confirmation. There is no guarantee that the 2015-1R Notes will meet either of these coverage tests, and thus, we may not receive distributions as the holders of the 2015-1 Issuer Preferred Interests.
40

We may not receive cash from the 2015-1 Issuer.
We receive cash from the 2015-1 Issuer only to the extent of payments on the distributions, if any, with respect to the 2015-1 Issuer Preferred Interests as permitted under the 2015-1 Debt Securitization Refinancing. The 2015-1 Issuer may only make payments on the 2015-1 Issuer Preferred Interests to the extent permitted by the payment priority provisions of the 2015-1 Indenture, as applicable, which generally provide, distribution to Preferred Interests holder may not be made on any payment date unless all amounts owing under the 2015-1R Notes are paid in full. There is no guarantee that we will receive any distributions as the holders of the 2015-1 Issuer Preferred Interests.
In addition, if the 2015-1 Issuer does not meet the asset coverage tests or the interest coverage test set forth in the documents governing the 2015-1 Debt Securitization Refinancing, cash would be diverted to first pay the 2015-1R Notes in amounts sufficient to cause such tests to be satisfied. Even if we do not receive cash directly from the 2015-1 Issuer, such amount will still be treated as income subject to our requirement to distribute 90% of our net investment income to our stockholders. Therefore, in the event that we fail to receive cash directly from the 2015-1 Issuer, we could be unable to make such distributions in amounts sufficient to maintain our status as a RIC for U.S. federal income tax purposes, or at all.
We may be required to assume liabilities of the 2015-1 Issuer and are indirectly liable for certain representations and warranties in connection with the 2015-1 Debt Securitization Refinancing.
As part of the 2015-1 Debt Securitization Refinancing, we entered into a contribution agreement under which we are required to repurchase any loan (or participation interest therein) which was sold to the 2015-1 Issuer in breach of any representation or warranty made by us with respect to such loan on the date such loan was sold. To the extent we fail to satisfy any such repurchase obligation, the trustee of the 2015-1 Debt Securitization Refinancing may, on behalf of the 2015-1 Issuer, bring an action against us to enforce these repurchase obligations.
The structure of the 2015-1 Debt Securitization Refinancing is intended to prevent, in the event of our bankruptcy, the consolidation of the 2015-1 Issuer with our operations. If the true sale of the assets in the 2015-1 Debt Securitization Refinancing were not respected in the event of our insolvency, a trustee or debtor-in-possession might reclaim the assets of the 2015-1 Issuer for our estate. However, in doing so, we would become directly liable for all of the indebtedness then outstanding under the 2015-1 Debt Securitization Refinancing, which would equal the full amount of debt of the 2015-1 Issuer reflected on our consolidated balance sheet.
In addition, in connection with 2015-1 Debt Securitization Refinancing, the Company has made customary representations, warranties and covenants to the 2015-1 Issuer. We remain liable for any breach of such representations for the life of the 2015-1 Debt Securitization Refinancing.
Risks Related to Our Investments
Our investments are risky and speculative.
We invest primarily in loans to middle market companies whose debt, if rated, is rated below investment grade and, if not rated, would likely be rated below investment grade if it were rated. Investments rated below investment grade are generally considered higher risk than investment grade instruments. Bonds that are rated below investment grade are sometimes referred to as “high yield bonds” or “junk bonds.” Exposure to below investment grade instruments involves certain risks, including speculation with respect to the borrower’s capacity to pay interest and repay principal. In our first lien loans, the fact that a loan is secured does not guarantee that we will receive principal and interest payments according to the loan’s terms, or at all, or that we will be able to collect on the loan should we be forced to enforce our remedies. To the extent we hold second lien senior secured loans and junior debt investments, holders of first lien loans may be repaid before us in the event of a bankruptcy or other insolvency proceeding. This may result in an above average amount of risk and loss of principal. Unitranche loans generally allow the borrower to make a large lump sum payment of principal at the end of the loan term, and there is a heightened risk of loss if the borrower is unable to pay the lump sum or refinance the amount owed at maturity. When we invest in loans, we have acquired and may in the future acquire equity securities as well. However, we may not be able to realize gains from our equity interests, and any gains that we do realize on the disposition of any equity interests may not be sufficient to offset any other losses we experience.
Some of the loans in which we may invest may be “covenant-lite” loans, which means the loans contain fewer covenants than other loans (in some cases, none) and may not include terms which allow the lender to monitor the performance of the borrower and declare a default if certain criteria are breached. An investment by us in a covenant-lite loan may potentially hinder the ability to reprice credit risk associated with the issuer and reduce the ability to restructure a problematic
41

loan and mitigate potential loss. We may also experience delays in enforcing our rights under covenant-lite loans. As a result of these risks, our exposure to losses may be increased, which could result in an adverse impact on our net income and net asset value.
In addition, investing in middle market companies involves a number of significant risks, including:
these companies may have limited financial resources and may be unable to meet their obligations under their debt securities that we hold, which may be accompanied by a deterioration in the value of any collateral and a reduction in the likelihood of us realizing on any guarantees or security we may have obtained in connection with our investment;
they typically have shorter operating histories, narrower product lines and smaller market shares than larger businesses, which tend to render them more vulnerable to competitors’ actions and market conditions, as well as general economic downturns;
they are more likely to depend on the management talents and efforts of a small group of persons; therefore, the death, disability, resignation or termination of one or more of these persons could have a material adverse impact on a portfolio company and, in turn, on us;
there is generally little public information about these companies. These companies and their financial information are usually not subject to the Exchange Act and other regulations that govern public companies, and we may be unable to uncover all material information about these companies, which may prevent us from making a fully informed investment decision and cause us to lose money on our investments;
they generally have less predictable operating results, may from time to time be parties to litigation, may be engaged in rapidly changing businesses with products subject to a substantial risk of obsolescence, and may require substantial additional capital to support their operations, finance expansion or maintain their competitive position. In addition, our executive officers, directors and our Investment Adviser may, in the ordinary course of business, be named as defendants in litigation arising from our investments in the portfolio company. The inaccuracy ofcompanies;
changes in laws and regulations, as well as their interpretations, may adversely affect their business, financial projections could thus cause our performancestructure or prospects; and
they may have difficulty accessing the capital markets to fall short of our expectations.meet future capital needs, which may limit their ability to grow or to repay their outstanding indebtedness upon maturity.
Our portfolio securities are generally illiquid and typically do not have a readily available market price and, in such a case, we will value these securities at fair value as determined in good faith under procedures adopted by our Board of Directors or its designee, which valuation is inherently subjective and may not reflect what we may actually realize from the sale of the investment.
Substantially all of our portfolio investments are in the form of debt investments that are not publicly traded and are less liquid thanilliquid compared to publicly traded securities.securities, and there can be no assurance that we will be able to realize returns on such investments in a timely manner. The fair value of these illiquid portfolio securities is not readily determinable, and the due diligence process that our Investment Adviser undertakes in connection with our investments may not reveal all the facts that may be relevant in connection with such investment. We value these investments on at least a quarterly basis in accordance with our valuation policy, which is at all times consistent with accounting principles generally accepted in the United States (“USU.S. GAAP”). Our Board of Directors utilizes the services of a third-party valuation firm to aid it in determining the fair value of these investments as well as the recommendations of our Investment Adviser’s investment professionals, which are based upon the most recent portfolio company financial statements available and projected financial results of each portfolio company. The Board of Directors discusses valuations and determines, or will designate our Investment Adviser to determine, the fair value in good faith based on the input of our Investment Adviser (if not the Board's designee) and the third-party valuation firm. The participation of our Investment Adviser in our valuation process, and the indirect pecuniary interest in our Investment Adviser by the Interested Directors on our Board of Directors, could result in a conflict of interest, sincebecause the management fee is based on our gross assets and also because our Investment Adviser is receiving performance-based incentive fees.
The factors that are considered in the fair value pricing of our investments include the nature and realizable value of any collateral, the portfolio company’s ability to make payments and its earnings, the markets in which the portfolio company does business, comparisons to publicly traded companies, discounted cash flow, relevant credit market indices, and other relevant factors. When an external event such as a purchase transaction, public offering or subsequent equity sale occurs, we consider the pricing indicated by the external event to corroborate our valuation. Because such valuations, and particularly
42

valuations of private investments and private companies, are inherently uncertain, may fluctuate over short periods of time and may be based on estimates, our determinations of fair value may differ materially from the values that would have been used if a ready market for these securities existed. Also, since these valuations are, to a large extent, based on estimates, comparisons and qualitative evaluations of private information, it could make it more difficult for investors to value accurately our investments and could lead to undervaluation or overvaluation of our securities. In addition, the valuation of these types of securities may result in substantial write-downs and earnings volatility. If our Investment Adviser is unable to uncover all material information about these companies, we may not make a fully informed investment decision, and we may lose money on our investments. Also, privately held companies frequently have less diverse product lines and smaller market presence than larger competitors.
Decreases in the market values or fair values of our investments are recorded as unrealized depreciation. The effect of all of these factors on our portfolio can reduce our NAV by increasing net unrealized depreciation in our portfolio. Depending


on market conditions, we could incur substantial realized losses and may suffer unrealized losses, which could have a material adverse impact on our business, financial condition and results of operations.
Our NAV as of a particular date may be materially greater than or less than the value that would be realized if our assets were to be liquidated as of such date. For example, if we were required to sell a certain asset or all or a substantial portion of our assets on a particular date, the actual price that we would realize upon the disposition of such asset or assets could be materially less than the value of such asset or assets as reflected in our NAV. Volatile market conditions could also cause reduced liquidity in the market for certain assets, which could result in liquidation values that are materially less than the values of such assets as reflected in our NAV.
Our investments are risky and speculative.
We invest primarily in loans to middle market companies whose debt, if rated, is rated below investment grade and, if not rated, would likely be rated below investment grade if it were rated. Investments rated below investment grade are generally considered higher risk than investment grade instruments. Bonds that are rated below investment grade are sometimes referred to as “high yield bonds” or “junk bonds.” Exposure to below investment grade instruments involves certain risks, including speculation with respect to the borrower’s capacity to pay interest and repay principal. In our first lien senior secured loans, the fact that a loan is secured does not guarantee that we will receive principal and interest payments according to the loan’s terms, or at all, or that we will be able to collect on the loan should we be forced to enforce our remedies. To the extent we hold second lien senior secured loans and junior debt investments, holders of first lien loans may be repaid before us in the event of a bankruptcy or other insolvency proceeding. This may result in an above average amount of risk and loss of principal. Unitranche loans generally allow the borrower to make a large lump sum payment of principal at the end of the loan term, and there is a heightened risk of loss if the borrower is unable to pay the lump sum or refinance the amount owed at maturity. When we invest in loans, we may acquire equity securities as well. However, we may not be able to realize gains from our equity interests, and any gains that we do realize on the disposition of any equity interests may not be sufficient to offset any other losses we experience.
In addition, investing in middle market companies involves a number of significant risks, including:
these companies may have limited financial resources and may be unable to meet their obligations under their debt securities that we hold, which may be accompanied by a deterioration in the value of any collateral and a reduction in the likelihood of us realizing on any guarantees or security we may have obtained in connection with our investment;
they typically have shorter operating histories, narrower product lines and smaller market shares than larger businesses, which tend to render them more vulnerable to competitors’ actions and market conditions, as well as general economic downturns;
they are more likely to depend on the management talents and efforts of a small group of persons; therefore, the death, disability, resignation or termination of one or more of these persons could have a material adverse impact on a portfolio company and, in turn, on us;
there is generally little public information about these companies. These companies and their financial information are usually not subject to the Exchange Act and other regulations that govern public companies, and we may be unable to uncover all material information about these companies, which may prevent us from making a fully informed investment decision and cause us to lose money on our investments;
they generally have less predictable operating results, may from time to time be parties to litigation, may be engaged in rapidly changing businesses with products subject to a substantial risk of obsolescence, and may require substantial additional capital to support their operations, finance expansion or maintain their competitive position. In addition, our executive officers, directors and our Investment Adviser may, in the ordinary course of business, be named as defendants in litigation arising from our investments in the portfolio companies;
changes in laws and regulations, as well as their interpretations, may adversely affect their business, financial structure or prospects; and
they may have difficulty accessing the capital markets to meet future capital needs, which may limit their ability to grow or to repay their outstanding indebtedness upon maturity.
We operate in a highly competitive market for investment opportunities, and compete with investment vehicles sponsored or advised by our affiliates.

identifying, completing and realizing attractive investments is highly competitive and involves a high degree of uncertainty. The availability of investment opportunities generally will be subject to market conditions. In particular, in light of changes in such conditions, including changes in long-term interest rates, certain types of investments may not be available to us on terms that are as attractive as the terms on which opportunities were available to previous investment programs sponsored by Carlyle. A number of entities, including BDCs managed by our Investment Adviser or an affiliate, compete with us to make the types of investments that we target in middle market companies. We compete with other BDCs, public and private funds, commercial and investment banks, commercial finance companies, and, to the extent they provide an alternative form of financing, private equity funds, some of which may beare affiliates of us. Furthermore, over the past several years, an ever-increasing number of debt and credit opportunities funds have been formed and many such existing funds have grown substantially in size. Additional funds with similar objectives may be formed in the future by Carlyle or by other unrelated parties. Many of our competitors are substantially larger and have considerably greater financial, technical and marketing resources than we do. Consequently, it is possible that competition for appropriate investment opportunities may increase, thus reducing the number of investment opportunities available to us and adversely affecting the terms upon which investments can be made. Furthermore, many of our competitors are not subject to the regulatory restrictions that the Investment Company Act and the Code impose on us. The competitive pressures we face may have a material adverse effect on our business, financial condition and results of operations. Also, asAs a result of this competition, we may not be able to take advantage of attractive investment opportunities from time to time, and, accordingly, we may incur legal, due diligence and other costs on investments which may not be successful and we may not recover all of our costs, which would adversely affect returns. We can offer no assurance that we will be able to identify and make investments that are consistent with our investment objective.
We do not seek to compete primarily based on the interest rates we offer, and we believe that some of our competitors may make loans with interest rates that are comparable to or lower than the rates we offer. We may lose investment opportunities if we do not match our competitors’ pricing, terms and structure. However, if we match our competitors’ pricing, terms and structure, we may experience decreased net interest income and increased risk of credit loss.
Our portfolio companies may be highly leveraged.
Some of our portfolio companies are highly leveraged, which may have adverse consequences to these companies and to us as an investor. These companies may be subject to restrictive financial and operating covenants and the leverage may impair these companies’ ability to finance their future operations and capital needs. As a result, these companies’ flexibility to respond to changing business and economic conditions and to take advantage of business opportunities may be limited. Further, a leveraged company’s income and net assets will tend to increase or decrease at a greater rate than if borrowed money were not used. Moreover, rising interest rates may significantly increase a company's or project's interest expense, or a significant industry downturn may affect a company's ability to generate positive cash flow, in either case causing an inability of a
43

leveraged company to service outstanding debt. In the event such leveraged company cannot generate adequate cash flow to meet debt obligations, the company may default on its loan agreements or be forced into bankruptcy resulting in a restructuring or liquidation of the company. Leveraged companies may enter into bankruptcy proceedings at higher rates than companies that are not leveraged.
Depending on the facts and circumstances of our investments and the extent of our involvement in the management of a portfolio company, upon the bankruptcy of a portfolio company, a bankruptcy court may recharacterize our debt investments as equity interests and subordinate all or a portion of our claim to that of other creditors. This could occur even though we may have structured our investment as senior debt.
Our portfolio companies may incur debt that ranks equally with, or senior to, some of our investments in such companies and if there is a default, we may experience a loss on our investment.
To the extent we invest in second lien, mezzanine or other instruments, our portfolio companies typically may be permitted to incur other debt that ranks equally with, or senior to, such debt instruments. By their terms, such debt instruments may provide that the holders are entitled to receive payment of interest or principal on or before the dates on which we will be entitled to receive payments in respect of the debt securities in which we invest. Also, in the event of insolvency, liquidation, dissolution, reorganization or bankruptcy of a portfolio company, holders of debt instruments ranking senior to our investment in that portfolio company would typically be entitled to receive payment in full before we receive any distribution in respect of our investment. In such cases, after repaying such senior creditors, such portfolio company may not have sufficient remaining assets to use for repaying its obligation to us. In the case of debt ranking equally with debt securities in which we invest, we would have to share on an equal basis any distributions with other creditors holding such debt in the event of an insolvency, liquidation, dissolution, reorganization or bankruptcy of the relevant portfolio company.
The rights we may have with respect to the collateral securing the debt investments we make in our portfolio companies with senior debt outstanding may also be limited pursuant to the terms of one or more intercreditor agreements that we enter into with the holders of senior debt. Under such an intercreditor agreement, at any time that obligations that have the benefit of the first priority liens are outstanding, any of the following actions that may be taken in respect of the collateral will be at the direction of the holders of the obligations secured by the first priority liens: the ability to cause the commencement of enforcement proceedings against the collateral; the ability to control the conduct of such proceedings; the approval of amendments to collateral documents; releases of liens on the collateral; and waivers of past defaults under collateral documents. We may not replicatehave the ability to control or direct such actions, even if our historical performance or the historical success of Carlyle.rights are adversely affected.
We cannot providemay also make unsecured loans to portfolio companies. Liens on such portfolio companies’ collateral, if any, will secure the portfolio company’s obligations under its outstanding secured debt and may secure certain future debt that is permitted to be incurred by the portfolio company under its secured loan agreements. The holders of obligations secured by such liens will generally control the liquidation of, and be entitled to receive proceeds from, any realization of such collateral to repay their obligations in full before us. In addition, the value of such collateral in the event of liquidation will depend on market and economic conditions, the availability of buyers and other factors. There can be no assurance that the proceeds, if any, from sales of such collateral would be sufficient to satisfy our unsecured loan obligations after payment in full of all secured loan obligations. If such proceeds were not sufficient to repay the outstanding secured loan obligations, then our unsecured claims would rank equally with the unpaid portion of such secured creditors’ claims against the portfolio company’s remaining assets, if any.
Our portfolio may be concentrated in a limited number of portfolio companies and industries, which will subject us to a risk of significant loss if any of these companies defaults on its obligations under any of its debt instruments or if there is a downturn in a particular industry.
    We are classified as a non-diversified investment company within the meaning of the Investment Company Act, which means that we are not limited by the Investment Company Act with respect to the proportion of our assets that we may invest in securities of a single issuer, excluding limitations on investments in other investment companies. Although we do not intend to focus our investments in any specific industries, our portfolio may be concentrated in a limited number of portfolio companies and industries. Beyond the asset diversification requirements associated with our qualification as a RIC under Subchapter M of the Code and under the Credit Facility, Senior Notes and 2015-1R Notes, we do not have fixed guidelines for diversification, and while we do not target any specific industries, our investments may be concentrated in relatively few industries. As a result, the aggregate returns we will replicaterealize may be significantly adversely affected if a small number of investments perform poorly or if we need to write down the value of one or more investments. Additionally, a downturn in any particular industry in which we are invested could also significantly impact our own historicalaggregate returns.
44

Declines in the prices of corporate debt securities and illiquidity in the corporate debt markets may adversely affect the fair value of our portfolio investments, reducing our NAV through increased net unrealized depreciation.
As a BDC, we are required to account for our investments at market value or, if no market value is ascertainable, at fair value as determined in good faith by or under the direction of our Board of Directors. Decreases in the market values or fair values of our investments are recorded as unrealized depreciation. Depending on market conditions, we could incur substantial realized losses and suffer additional unrealized losses, which would reduce our NAV and have a material adverse impact on our business, financial condition and results of operations.
To the extent we make investments in restructurings and reorganizations they may be subject to greater regulatory and legal risks than other traditional direct investments in portfolio companies.
We have in the past and may in the future make investments in restructurings that involve, or otherwise invest in the debt securities of, companies that are experiencing or are expected to experience severe financial difficulties. These severe financial difficulties may never be overcome and may cause such companies to become subject to bankruptcy proceedings. As such, these investments could subject us to certain additional potential liabilities that may exceed the value of our original investment therein. The level of analytical sophistication, both financial and legal, necessary for successful financing to companies experiencing significant business and financial difficulties is unusually high.
The financial projections of our portfolio companies could prove inaccurate.
We generally evaluate the capital structure of portfolio companies on the basis of financial projections prepared by the management of such portfolio companies. These projected operating results are normally based primarily on judgments of the management of the portfolio companies. In all cases, projections are only estimates of future results that are based upon assumptions made at the time that the projections are developed. General economic conditions, which are not predictable with accuracy, along with other factors may cause actual performance to fall short of the historical successfinancial projections that were used to establish a given portfolio company’s capital structure. Because of Carlylethe leverage that is typically employed by our portfolio companies, this could cause a substantial decrease in the value of our investment in the portfolio company. The inaccuracy of financial projections could thus cause our performance to fall short of our expectations.
In addition, when sourcing debt investments, we expect to rely significantly upon representations made to us by the borrower. There can be no assurance that such representations are accurate or the historical performance of other companiescomplete, or that any due diligence undertaken would identify any misrepresentation or omission.
The due diligence investigation that our Investment Adviser carries out with respect to an investment opportunity may not reveal or highlight all relevant facts that may be necessary or helpful in evaluating such investment opportunity.
    Before we make investments, our Investment Adviser will typically conduct due diligence that it deems reasonable and ourappropriate based on the facts and circumstances applicable to each investment. Due diligence may entail evaluation of important and complex business, financial, tax, accounting, environmental and legal issues. Outside consultants, legal advisors, accountants, credit rating agencies, investment team advisedbanks and other third parties may be involved in the past. Accordingly,due diligence process to varying degrees depending on the type of investment. When conducting due diligence and making an assessment regarding an investment, our investment returns could be substantially lower thanInvestment Adviser will rely on the returns achievedresources available to it, including information provided by the Companyportfolio companies and, in the past, other Carlyle-managed funds orsome circumstances, third-party investigations. In addition, investment analyses and decisions by other clients of our Investment Adviser. We can offer no assuranceAdviser may be required to be undertaken on an expedited basis to take advantage of certain investment opportunities. In such cases, the information available to our Investment Adviser at the time of making an investment decision may be limited. The due diligence investigation that our Investment Adviser carries out with respect to an investment opportunity may not reveal or highlight all relevant facts that may be necessary or helpful in evaluating such investment opportunity. Moreover, the due diligence investigation does not ensure that such investment will be ablesuccessful. In addition, Carlyle's Environmental, Social and Governance program may cause us not to continuemake an investment we otherwise would have made or impact other action taken or refrained from.
Our portfolio companies prepay loans from time to implementtime, which may have the effect of reducing our investment objectiveincome if the returned capital cannot be invested in transactions with equal or greater yields.
Loans are generally prepayable at any time, most of them at no premium to par. We are generally unable to predict the same degreerate and frequency of success as it has hadsuch repayments. Whether a loan is prepaid will depend both on the continued positive performance of the portfolio company and the existence of favorable financing market conditions that allow such portfolio company the ability to replace existing financing with less expensive capital. In periods of rising interest rates, the risk of prepayment of floating
45

rate loans may increase if other financing sources are available. As market conditions change frequently, we will often be unable to predict when, and if, this may be possible for each of our portfolio companies. In the case of some of these loans, having the loan called early may have the effect of reducing our actual investment income below our expected investment income if the capital returned cannot be invested in transactions with equal or greater yields.
We invest through joint ventures, partnerships or other special purpose vehicles and our investments through these vehicles may entail greater risks, or risks that we otherwise would not incur, if we otherwise made such investments directly.
We make indirect investments in portfolio companies through joint ventures, partnerships or other special purpose vehicles (“Investment Vehicles”) including Credit Fund and Credit Fund II. In general, the risks associated with indirect investments in portfolio companies through an Investment Vehicle are similar to those associated with a direct investment in a portfolio company. While we intend to analyze the credit and business of a potential portfolio company in determining whether to make an investment through an Investment Vehicle, we will nonetheless be exposed to the creditworthiness of the Investment Vehicle. In the event of a bankruptcy proceeding against the portfolio company, the assets of the portfolio company would typically be used to satisfy its obligations prior to the satisfaction of our investment in the past.Investment Vehicle (i.e., our investment in the Investment Vehicle would be structurally subordinated to the obligations of the portfolio company). In addition, if we are to invest in an Investment Vehicle, we may be required to rely on our partners in the Investment Vehicle when making decisions regarding such Investment Vehicle’s investments, accordingly, the value of the investment could be adversely affected if our interests diverge from those of our partners in the Investment Vehicle.
Our ability to enter into transactions with Carlyle and our other affiliates is restricted.
As a BDC, we are required to comply with certain regulatory requirements. We and any company controlled by us, on the one hand, and our upstream affiliates, or our Investment Adviser and its affiliates, on the other hand, are prohibited under the Investment Company Act from knowingly participating in certain transactions without the prior approval of our Independent Directors (as defined below) and, in some cases, the SEC. Any person that owns, directly or indirectly, 5% or more of our outstanding voting securities is our upstream affiliate for purposes of the Investment Company Act, and we or a company controlled by us are generally prohibited from buying or selling any security (other than our securities) from or to such affiliate, absent the prior approval of our Independent Directors and so long as such person does not own more than 25% of our outstanding voting securities or otherwise control us. We or a company controlled by us are prohibited from buying or selling any security from or to our Investment Adviser or its affiliates, or any person who owns more than 25% of our voting securities or is otherwise deemed to control, be controlled by, or be under common control with, us, with such persons, absent the prior approval of the SEC.
The Investment Company Act also prohibits certain “joint” transactions with our upstream affiliates, or our Investment Adviser or its affiliates, which could include investments in the same portfolio company (whether at the same or different times), without prior approval of our Independent Directors and, in some cases, the SEC (other than in certain limited situations pursuant to current regulatory guidance as described below). The analysis of whether a particular transaction constitutes a joint transaction requires a review of the relevant facts and circumstances then existing. The SEC has granted us Exemptive Relief that permits us and certain present and future funds advised by our Investment Adviser and certain other present and future investment advisers controlling, controlled by or under common control with our Investment Adviser to co-invest in suitable negotiated investments. Co-investments made under the Exemptive Relief are subject to compliance with the conditions and other requirements contained in the Exemptive Relief, which could limit our ability to participate in a co-investment transaction. In addition to co-investing pursuant to our Exemptive Relief, we may also co-invest with funds managed by Carlyle or any of its downstream affiliates, subject to compliance with applicable law and regulations, existing regulatory guidance, our Investment Adviser’s allocation procedures and Carlyle’s other allocation policies and procedures, where applicable. For example, we may invest alongside such investors consistent with guidance promulgated by the SEC staff permitting us and an affiliated person to purchase interests in a single class of privately placed securities so long as certain conditions are met, including that we negotiate no term other than price. We may, in certain cases, also make investments in securities owned by affiliates that we acquire from non-affiliates. In such circumstances, our ability to participate in any restructuring of such investment or other transaction involving the issuer of such investment may be limited, and as a result, we may realize a loss on such investments that might have been prevented or reduced had we not been restricted in participating in such restructuring or other transaction.

To the extent we make investments in restructurings and reorganizations they may be subject to greater regulatory and legal risks than other traditional direct investments in portfolio companies.
We may make investments in restructurings that involve, or otherwise invest in the debt securities of, companies that are experiencing or are expected to experience severe financial difficulties. These severe financial difficulties may never be overcome and may cause such companies to become subject to bankruptcy proceedings. As such, these investments could subject us to certain additional potential liabilities that may exceed the value of our original investment therein. The level of analytical sophistication, both financial and legal, necessary for successful financing to companies experiencing significant business and financial difficulties is unusually high.
Our ability to extend financial commitments may be limited.
The SEC has proposed a new Rule 18f-4 under the Investment Company Act that, if enacted in the form proposed, could adversely impact the way we and other BDCs do business. In addition to imposing restrictions on the use of derivatives, the rule would generally limit our financial commitments to portfolio companies, together with our exposure to other transactions involving senior securities entered into by us other than in reliance of the rule, to not more than 150 percent of our NAV. We cannot assure you when or if the proposed rule will be adopted by the SEC, and if adopted, whether the final rule will constrain our ability to extend financial commitments.
Our portfolio may be concentrated in a limited number of portfolio companies and industries, which will subject us to a risk of significant loss if any of these companies defaults on its obligations under any of its debt instruments or if there is a downturn in a particular industry.
We are classified as a non-diversified investment company within the meaning of the Investment Company Act, which means that we are not limited by the Investment Company Act with respect to the proportion of our assets that we may invest in securities of a single issuer, excluding limitations on investments in other investment companies. Although we do not intend to focus our investments in any specific industries, our portfolio may be concentrated in a limited number of portfolio companies and industries. Beyond the asset diversification requirements associated with our qualification as a RIC under Subchapter M of the Code and under the Facilities and 2015-1 Notes, we do not have fixed guidelines for diversification, and while we do not target any specific industries, our investments may be concentrated in relatively few industries. As a result, the aggregate returns we will realize may be significantly adversely affected if a small number of investments perform poorly or if we need to write down the value of one or more investments. Additionally, a downturn in any particular industry in which we are invested could also significantly impact our aggregate returns.
Our portfolio companies may be highly leveraged.
Some of our portfolio companies may be highly leveraged, which may have adverse consequences to these companies and to us as an investor. These companies may be subject to restrictive financial and operating covenants and the leverage may impair these companies’ ability to finance their future operations and capital needs. As a result, these companies’ flexibility to respond to changing business and economic conditions and to take advantage of business opportunities may be limited. Further, a leveraged company’s income and net assets will tend to increase or decrease at a greater rate than if borrowed money were not used. Leveraged companies may enter into bankruptcy proceedings at higher rates than companies that are not leveraged.
Our failure to make follow-on investments in our portfolio companies could impair the value of our investments.
Following an initial investment in a portfolio company, we have made, and may continue to make, additional investments in that portfolio company as “follow-on” investments to:
46

increase or maintain in whole or in part our equity ownership percentage;
exercise warrants, options or convertible securities that were acquired in the original or subsequent financing; or
attempt to preserve or enhance the value of our investment.
We may elect not to make follow-on investments, may be constrained in our ability to employ available funds, or otherwise may lack sufficient funds to make those investments. We have the discretion to make any follow-on investments, subject to the availability of capital resources. However, doing so could be placing even more capital at risk in existing portfolio companies.


The failure to make follow-on investments may, in some circumstances, jeopardize the continued viability of a portfolio company and our initial investment, or may result in a missed opportunity for us to increase our participation in a successful investment. Even if we have sufficient capital to make a desired follow-on investment, we may elect not to make a follow-on investment because we may not want to increase our concentration of risk, because we prefer other opportunities or because we are inhibited by compliance with BDC requirements or the desire to maintain our tax status.
Declines in the prices of corporate debt securities and illiquidity in the corporate debt markets may adversely affect the fair value of our portfolio investments, reducing our NAV through increased net unrealized depreciation.
As a BDC, we are required to account for our investments at market value or, if no market value is ascertainable, at fair value as determined in good faith by or under the direction of our Board of Directors. Decreases in the market values or fair valuesThe disposition of our investments are recorded as unrealized depreciation. Depending on market conditions,may result in contingent liabilities.
A significant portion of our investments involve private securities. In connection with the disposition of an investment in private securities, we may face similar losses, which could reducebe required to make representations about the business and financial affairs of the portfolio company typical of those made in connection with the sale of a business. We may also be required to indemnify the purchasers of such investment to the extent that any such representations turn out to be inaccurate or with respect to potential liabilities. These arrangements may result in contingent liabilities that ultimately result in funding obligations that we must satisfy through our NAV and have a material adverse impact on our business, financial condition and resultsreturn of operations.distributions previously made to us.
Because we generally do not hold controlling equity interests in our portfolio companies, we may not be in a position to exercise control over our portfolio companies or to prevent decisions by management of our portfolio companies that could decrease the value of our investments.
Although we may do so in the future, currently we do not intend to hold controlling equity positions in our portfolio companies. Accordingly, we may not be able to control decisions relating to a minority equity investment, including decisions relating to the management and operation of the portfolio company and the timing and nature of any exit. As a result, we are subject to the risk that a portfolio company may make business decisions with which we disagree, and that the management and/or stockholders of a portfolio company may take risks or otherwise act in ways that are adverse to our interests. Due to the lack of liquidity of the investments that we typically hold in our portfolio companies, we may not be able to dispose of our investments in the event we disagree with the actions of a portfolio company and may therefore suffer a decrease in the value of our investments. If any of the foregoing were to occur, our financial condition, results of operations and cash flow could suffer as a result.
Our portfolio companiesinvestments in foreign securities may incur debtinvolve significant risks in addition to the risks inherent in U.S. investments.
Our investment strategy contemplates that ranks equally with, or senior to, somea portion of our investments in such companies.
To the extent we invest in second lien, mezzanine or other instruments, our portfolio companies typically may be permittedin securities of foreign companies. Investing in foreign companies may expose us to incur other debtadditional risks not typically associated with investing in U.S. companies. These risks include changes in exchange control regulations, political and social instability, expropriation, imposition of foreign taxes, less liquid markets and less available information than is generally the case in the United States, higher transaction costs, less government supervision of exchanges, brokers and issuers, less developed bankruptcy laws, difficulty in enforcing contractual obligations, lack of uniform accounting and auditing standards and greater price volatility. These risks are likely to be more pronounced for investments in companies located in emerging markets and particularly for middle-market companies in these economies.
Although most of our investments are denominated in U.S. dollars, our investments that ranks equally with, or seniorare denominated in a foreign currency are subject to such debt instruments. By their terms, such debt instruments may providethe risk that the holders are entitled to receive payment of interest or principal on or before the dates on which we will be entitled to receive payments in respect of the debt securities in which we invest. Also, in the event of insolvency, liquidation, dissolution, reorganization or bankruptcyvalue of a portfolio company, holders of debt instruments ranking seniorparticular currency may change in relation to our investment in that portfolio company would typically be entitled to receive payment in full before we receive any distribution in respect of our investment. In such cases, after repaying such senior creditors, such portfolio company may not have sufficient remaining assets to use for repaying its obligation to us. In the case of debt ranking equally with debt securities in which we invest, we would have to share on an equal basis any distributions with other creditors holding such debt in the event of an insolvency, liquidation, dissolution, reorganization or bankruptcy of the relevant portfolio company.
The rights we may have with respect to the collateral securing the debt investments we make in our portfolio companies with senior debt outstanding may also be limited pursuant to the terms of one or more intercreditor agreements that we enter into withother currencies. Among the holders of senior debt. Under such an intercreditor agreement, at any time that obligations that have the benefit of the first priority liens are outstanding, any of the following actionsfactors that may be takenaffect currency values are trade balances, the level of short-term interest rates, differences in respectrelative values of the collateral will be at the direction of the holders of the obligations secured by the first priority liens: the ability to cause the commencement of enforcement proceedings against the collateral; the ability to control the conduct of such proceedings; the approval of amendments to collateral documents; releases of liens on the collateral;similar assets in different currencies, long-term opportunities for investment and waivers of past defaults under collateral documents.capital appreciation, and political developments. We may not have the abilityemploy hedging techniques to control or direct such actions, even if our rights are adversely affected.
We may also make unsecured loans to portfolio companies. Liens on such portfolio companies’ collateral, if any, will secure the portfolio company’s obligations under its outstanding secured debt and may secure certain future debt that is permitted to be incurred by the portfolio company under its secured loan agreements. The holders of obligations secured by such liens will generally control the liquidation of, and be entitled to receive proceeds from, any realization of such collateral to repay their obligations in full before us. In addition, the value of such collateral in the event of liquidation will depend on market and economic conditions, the availability of buyers and other factors. Thereminimize these risks, but we can beoffer no assurance that the proceeds,we will, in fact, hedge currency risk or, that if any, from sales ofwe do, such collateral wouldstrategies will be sufficient to satisfy our unsecured loan obligations after payment in full of all secured loan obligations. If such proceeds were not sufficient to repay the outstanding secured loan obligations, then oureffective.
47


unsecured claims would rank equally with the unpaid portion of such secured creditors’ claims against the portfolio company’s remaining assets, if any.
We may expose ourselves to risks if we engage in hedging transactions.
If we engage in hedging transactions, we may expose ourselves to risks associated with such transactions. We may utilize instruments such as forward contracts, credit default swaps, currency options and interest rate swaps, caps, collars and floors to seek to hedge against fluctuations in the relative values of our portfolio positions from changes in currency exchange rates, credit risk premiums, and market interest rates. Hedging against a decline in the values of our portfolio positions does not eliminate the possibility of fluctuations in the values of such positions or prevent losses if the values of such positions decline. However, such hedging can establish other positions designed to gain from those same developments, thereby offsetting the decline in the value of such portfolio positions. Such hedging transactions may also limit the opportunity for gain if the values of the underlying portfolio positions should increase. It may not be possible to hedge against an exchange rate or interest rate fluctuation at an acceptable price that is generally anticipated.price. The success of any hedging transactions we may enter into will depend on our ability to correctly predict movements in currencies and interest rates. Therefore, while we may enter into such transactions to seek to reduce currency exchange rate and interest rate risks, unanticipated changes in currency exchange rates or interest rates may result in poorer overall investment performance than if we had not engaged in any such hedging transactions. In addition, the degree of correlation between price movements of the instruments used in a hedging strategy and price movements in the portfolio positions being hedged may vary. Moreover, for a variety of reasons, we may not seek to establish a perfect correlation between such hedging instruments and the portfolio holdings being hedged. Any such imperfect correlation may prevent us from achieving the effect of the intended hedge and expose us to risk of loss. In addition, it may not be possible to hedge fully or perfectly against currency fluctuations affecting the value of securities denominated in non-U.S. currencies because the value of those securities is likely to fluctuate as a result of factors not related to currency fluctuations. Income derived from hedging transactions is generally not eligible to be distributed to non-U.S. stockholders free from U.S. withholding tax. We may be unable or determine not to hedge against particular risks, including if we determine that available hedging transactions are not available at an appropriate price.
There are certain risks associated with holding debt obligations that have original issue discount or payment-in-kind interest.
OIDOriginal issue discount (“OID”) may arise if we hold securities issued at a discount or in certain other circumstances. OID and PIKpayment-in-kind (“PIK”) interest create the risk that incentive fees will be paid to the Investment Adviser based on non-cash accruals that ultimately may not be realized, while the Investment Adviser will be under no obligation to reimburse us for these fees. We hold investments that result in OID interest and PIK interest.
The higher interest rates of OID instruments reflect the payment deferral and increased credit risk associated with these instruments, and OID instruments generally represent a significantly higher credit risk than coupon loans. Even if the accounting conditions for income accrual are met, the borrower could still default when our actual collection is supposed to occur at the maturity of the obligation.
OID instruments may have unreliable valuations because their continuing accruals require continuing judgments about the collectability of the deferred payments and the value of any associated collateral. OID income may also create uncertainty about the source of our cash dividends.
For accounting purposes, any cash dividends to stockholders representing OID income are not treated as coming from paid-in capital, even if the cash to pay them comes from the proceeds of issuances of our common stock. As a result, despite the fact that a dividend representing OID income could be paid out of amounts invested by our stockholders, the Investment Company Act does not require that stockholders be given notice of this fact by reporting it as a return of capital.
PIK interest has the effect of generating investment income at a compounding rate, thereby further increasing the incentive fees payable to the Investment Adviser. Similarly, all things being equal, the deferral associated with PIK interest also increases the loan-to-value ratio at a compounding rate.
Our investments may be affected by force majeure events.
    Our investments may be affected by force majeure events (e.g. events beyond the control of the party claiming that the event has occurred, including, without limitation, acts of God, fire, flood, earthquakes, outbreaks of infectious disease, pandemic or any other serious public health concern, war, trade war, cyber security breaches, terrorism and labor strikes). Some force majeure events may adversely affect the ability of a party (including a portfolio company or a counterparty to us or a portfolio company) to perform its obligations until it is able to remedy the force majeure event. In addition, the cost to a portfolio company or us of repairing or replacing damaged assets resulting from such force majeure event could be considerable. Certain force majeure events (such as war or an outbreak of an infectious disease) could have a broader negative
48

impact on the world economy and international business activity generally, or in any of the countries in which we may invest specifically.
Risks Related to an Investment in Our Common Stock and Other Securities That We May Issue
Investing in our securities may involveinvolves a high degree of risk.
The investments we make in accordance with our investment objective may result in a higher amount of risk than alternative investment options and volatility or loss of principal. Our investments in portfolio companies may be highly


speculative and aggressive, and therefore an investment in our securities may not be suitable for someone with lower risk tolerance.
The market price of our securities may fluctuate significantly.
The market price and liquidity of the market for our common stock and any other securities that we may issue may be significantly affected by numerous factors, some of which are beyond our control and may not be directly related to our operating performance. These factors include:
changes or perceived changes in the value of our portfolio investments as a result of changes in market factors, such as interest rate shifts, and also portfolio specific performance, such as portfolio company defaults, among others reasons;
significant volatility in the market price and trading volume of securities of BDCs or other companies in our sector, which are not necessarily related to the operating performance of these companies;
price and volume fluctuations in the overall stock market from time to time;
the inclusion or exclusion of our securities from certain indices;
changes in law, regulatory policies or tax guidelines, particularly with respect to RICs or BDCs;
any loss of RIC or BDC status;
changes in our earnings or perceived changes or variations in our operating results;
changes or perceived changes in the value of our portfolio of investments;
changes in accounting guidelines governing valuation of our investments;
any shortfall in revenue or net income or any increase in losses from levels expected by investors or securities analysts;
the inability of our Investment Adviser to employ additional experienced investment professionals or the departure of any of our Investment Adviser’s key personnel;
short-selling pressure with respect to shares of our common stock or BDCs generally;
future sales of our securities convertible into or exchangeable or exercisable for our common stock or the conversion of such securities;
uncertainty surrounding the strength of the U.S. economic recoveryeconomy and where the debt market is in the credit cycle;
uncertainty surrounding the policies of the new presidential administration;
concerns regarding European sovereign debt;uncertainty between the U.S. and other countries with respect to trade policies, treaties, and tariffs;
the social, geopolitical, financial, trade and legal implications of Brexit;
the occurrence of one or more natural disasters, pandemic outbreaks or other health crises (including, but not limited to, the COVID-19 outbreak);
fluctuations in base interest rates, such as LIBOR, EURIBOR, the Federal Funds Rate or the Prime Rate;Rate, and the uncertainties regarding the future of LIBOR;
operating performance of companies comparable to us;
general economic trends and other external factors;factors, including the current COVID-19 pandemic; and
loss of a major funding source.
In the past, following periods of volatility in the market price of a company’s securities, securities class action litigation has often been brought against that company. If our stock price fluctuates significantly, we may be the target of
49

securities litigation in the future. Securities litigation could result in substantial costs and divert management’s attention and resources from our business.
Our shares of common stock have traded at a discount fromto NAV and may do so again, which could limit our ability to raise additional equity capital.
We cannot assure you that a trading market for our common stock can be sustained. In addition, we cannot predict the prices at which our common stock will trade. Shares of closed-end investment companies, including BDCs, frequently trade at a discount fromto NAV and our common stock may also be discounted in the market. This characteristic of closed-end investment companies is separate and distinct from the risk that our NAV per share may decline. We cannot predict whether our common stock will trade at, above or below NAV. The risk of loss associated with this characteristic of closed-end management investment companies may be greater for investors expecting to sell shares of common stock purchased in the offering soon after thean offering. Recently, the stocks of BDCs as an industry, including from time to time shares of our common stock, have traded below NAV and during much of 2009 traded at near historic lows as a result of concerns over liquidity, leverage restrictions and distribution requirements. See “Risk Factors—Risks RelatingRelated to Our Business and Structure—CapitalWe are currently operating in a period of capital markets disruption and economic uncertainty, and capital markets may experience periods of disruption and instability.instability in the future. These market conditions may materially and adversely affect debt and


equity capital markets in the United States and abroad, which may in the future have a negative impact on our business and operations.”
In addition, when our common stock is trading below its NAV, we will generally not be able to sell additional shares of our common stock to the public at its market price without, among other things, first obtaining the requisite approval of our stockholders. However, certainPursuant to approval granted at a special meeting of our stockholders who receivedheld on October 28, 2021, we are authorized, with the approval of the Board of Directors, to sell or otherwise issue shares of our common stock at a price below the then-current net asset value per share, subject to certain limitations (including that the number of shares issued does not exceed 25% of our then-outstanding common stock immediately prior to our initial public offering (our “pre-IPO investors”) may obligate us to initiate certain registered underwritten secondary offeringseach such offering). Such stockholder approval expires on behalf of such pre-IPO investors,October 28, 2022.
We issued the Preferred Stock in May 2020 and it is possible that shares will be sold in such offerings at prices below NAV. We believe any such sales will be perceived negatively by the market and could negatively impact future trading prices for our common stock.
Wewe may in the future determine to issue additional preferred stock, which could adversely affect the market value of our common stock.
On May 5, 2020 we issued the Preferred Stock. The Preferred Stock ranks senior to our common stock with respect to the payment of dividends and distribution of assets upon liquidation. The Preferred Stock has a liquidation preference equal to $25 per share (the “Liquidation Preference”) plus any accumulated but unpaid dividends up to but excluding the date of distribution.
The Preferred Stock is convertible, in whole or in part, at the option of the holder of the Preferred Stock into the number of shares of common stock equal to the Liquidation Preference plus any accumulated but unpaid dividends, divided by an initial conversion price of $9.50, subject to certain adjustments to prevent dilution as set forth in the articles supplementary (the “Articles Supplementary”) that established the terms of the Preferred Stock. The conversion price as of December 31, 2021 was $9.46.
Each holder of Preferred Stock is entitled to one vote on each matter submitted to a vote of our stockholders. In addition, for so long as we are subject to the Investment Company Act, the holders of Preferred Stock, voting separately as a single class, have the right to elect two members of the Board of Directors at all times, and the balance of the directors will be elected by the holders of the common stock and the Preferred Stock voting together.
The issuance of the Preferred Stock and any shares of additional preferred stock with dividend or conversion rights, liquidation preferences or other economic terms favorable to the holders of preferred stock could adversely affect the market price for our common stock by making an investment in the common stock less attractive. In addition, the dividends on the Preferred Stock and on any additional preferred stock we issue must be cumulative. Payment of dividends and repayment of the liquidation preference of the Preferred Stock and any additional preferred stock must take preference over any dividends or other payments to our common stockholders, and holders of the Preferred Stock or any additional preferred stock are not subject to any of our expenses or losses and are not entitled to participate in any income or appreciation in excess of their stated preference (other than convertible preferred stock that converts into common stock). In addition, under the Investment Company Act, the Preferred Stock and any additional preferred stock constitutesconstitute a “senior security” for purposes of the 200%150% asset coverage test.
Your interest in usOur stockholders may be diluted if you do not fully exercise your subscription rights in any rights offering. In addition, ifexperience dilution upon the subscription price is less thanconversion of the Preferred Stock.
If we deliver shares of common stock upon a conversion of the Preferred Stock at a time our NAV per share then youexceeds the conversion price in effect at such time, our stockholders may incur dilution. Our stockholders will also experience an immediate dilution in their ownership percentage of common stock upon our issuance of common stock in connection with the conversion of the aggregate NAV of your shares.
In the event we issue subscription rights, stockholders who do not fully exercise their subscription rights should expect that they will, at the completion of a rights offering pursuant to this prospectus and a prospectus supplement, own a smaller proportional interest in us than would otherwise be the case if they fully exercised their rights. We cannot state precisely the amount of any such dilution in share ownership because we do not know at this time what proportion of the shares will be purchased as a result of such rights offering.
Preferred Stock. In addition, if the subscription price is less than the NAV per shareany dividends paid on our common stock will also be paid on shares of our common stock then our stockholders would experience an immediate dilutionissued in connection with a conversion of the aggregate NAVPreferred Stock after such issuance.
50

Holders of the Preferred Stock have the right to elect members of the board of directors and class voting rights on certain matters.
Holders of the Preferred Stock and of any additional preferred stock we might issue, voting separately as a resultsingle class, would have the right to elect two members of the offering. The amountboard of directors at all times and in the event dividends become two full years in arrears would have the right to elect a majority of the directors until such arrearage is completely eliminated. In addition, preferred stockholders have class voting rights on certain matters, including changes in fundamental investment restrictions and conversion to open-end status, and accordingly can veto any decrease in NAV is not predictable because it is not known at this time what the subscription price and NAV per share will besuch changes. Restrictions imposed on the expiration datedeclarations and payment of a rights offeringdividends or what proportionother distributions to the holders of our common stock and preferred stock, both by the shares will be purchasedInvestment Company Act and by requirements imposed by rating agencies or the terms of our credit facilities, might impair our ability to maintain our qualification as a result ofRIC for federal income tax purposes. While we would intend to redeem our preferred stock to the extent necessary to enable us to distribute our income as required to maintain our qualification as a RIC, there can be no assurance that such rights offering. Such dilutionactions could be substantial.effected in time to meet the tax requirements. See Part I, Item 1 of this Form 10-K, "Business—Election to be Taxed as a RIC."
Purchases of our common stock under theour stock repurchase program, including a Company 10b5-1 Plan, may have resulted in the price of our common stock being higher than the price that otherwise might have existed in the open market.
Certain individuals affiliatedOn November 1, 2021, the Company’s Board of Directors authorized the continuation of a previously approved $150 million stock repurchase program (the “Company Stock Repurchase Program”). Under such authorization, the Company Stock Repurchase Program will continue in effect until the earlier of November 5, 2022 and the date on which $150 million has been used to repurchase shares (including amounts already used to repurchase common stock prior to the extension of the Program). Pursuant to the Program, the Company is authorized to repurchase its outstanding common stock in the open market and/or through privately negotiated transactions at prices not to exceed the Company’s net asset value per share as reported in its most recent financial statements, in accordance with Carlylethe guidelines specified in Rule 10b-18 of the Exchange Act, and the Company is authorized to determine, in its discretion, the timing, manner, price and amount of any repurchases, based upon the evaluation of economic and market conditions, stock price, available cash, applicable legal and regulatory requirements and other factors, which may include purchases pursuant to Rule 10b5-1 of the Exchange Act. The Program does not require the Company to repurchase any specific number of shares and there can be no assurance as to the amount of shares repurchased under the Program. The Program may be suspended, extended, modified or discontinued by the Company at any time, subject to applicable law.
Pursuant to the authorization described above, the Company adopted a 10b5-1 plan (the “10b5-1“Company 10b5-1 Plan”). The Company 10b5-1 Plan provides that purchases will be conducted on the open market in accordance with RulesRule 10b5-1 and 10b-18 under the Exchange Act and will otherwise be subject to applicable law, which may prohibit purchases under whichcertain circumstances. The amount of purchases made under the participants would buy up to $15 million in the aggregate of our common stock in the open market during the period beginning July 17, 2017 and ending on the earlier of the date on which the capital committed to theCompany 10b5-1 Plan had been exhausted or June 19, 2018, subject to certain conditions. The 10b5-1 Plan required the plan administrator to purchase sharesotherwise and how much will be purchased at any time is uncertain, dependent on prevailing market prices and trading volumes, all of common stock when the market price per share was below the Company’s most recently reported NAV per share (including any updates, corrections or adjustments publicly announced by the Company to any previously announced NAV per share). which we cannot predict.
These activities may have had the effect of maintaining the market price of our common stock or retarding a decline in the market price of the common stock, and, as a result, the price of our common stock may have been higher than the price that otherwise might have existed in the open market. As of February 22, 2018, the capital committed to the 10b5-1 Plan had been exhausted, and the 10b5-1 Plan was terminated in accordance with its terms.


Sales of substantial amounts of our common stock in the public market may have an adverse effect on the market price of our common stock.
As of February 27, 2018,18, 2022, we had 62,568,65153,142,454 shares of common stock outstanding. Sales of substantial amounts of our common stock, or the availability of such shares for sale, including as a result of the sale of our common stock issued upon conversion of the Preferred Stock, could adversely affect the prevailing market prices for our common stock. If this occurs and continues, it could impair our ability to raise additional capital through the sale of equity securities should we desire to do so.
Our stockholders will experience dilution in their ownership percentage if they opt out of our dividend reinvestment plan.
Our dividend reinvestment plan is an “opt out” dividend reinvestment plan, pursuant to which all dividends declared in cash payable to stockholders that do not elect to receive their distributions in cash are automatically reinvested in shares of our common stock, rather than receiving cash. As a result, our stockholders that “opt out” of our dividend reinvestment plan may experience dilution in their ownership percentage of our common stock over time. See Part II, Item 5 of this Form 10-K “Market for Registrant’s Common Equity, Related Stockholder Matters and Issuer Purchases of Equity Securities—Price Range of Common Stock” and “Market for Registrant’s Common Equity, Related Stockholder Matters and Issuer Purchases of Equity Securities—Distribution Policy” for a description of our dividend policy and obligations.
There
51

If the current period of capital market disruption and instability continues for an extended period of time, there is a risk that our stockholders may not receive distributions or that our distributions may not grow over time and a portion of our distributions to youour stockholders may be a return of capital for U.S. federal income tax purposes.
We intend to make distributions on a quarterly basis to our stockholders out of assets legally available for distribution. We cannot assure youIt is not assured that we will achieve investment results that will allow us to make a specified level of cash distributions or year-to-year increases in cash distributions. Our ability to pay distributions might be adversely affected by the impact of one or more of the risk factors described in this Form 10-K, including the COVID-19 pandemic described in this Form 10-K. For example, if corporate offices, retail stores, and manufacturing facilities and factories in the jurisdictions, including the United States, affected by the COVID-19 pandemic continue to be or are again subject to temporary closures for an extended period of time, it could result in reduced cash flows to us from our existing portfolio companies, which could reduce cash available for distribution to our stockholders.If we declare a dividend and if enough stockholders opt to receive cash distributions rather than participate in our dividend reinvestment plan, we may be forced to sell some of our investments in order to make cash dividend payments. In addition, due to the asset coverage test applicable to us as a BDC, we may be limited in our ability to make distributions. The FacilitiesPreferred Stock is entitled to be paid dividends in full prior to the declaration or payment of a dividend on our common stock. In addition, the Credit Facility may also limit our ability to declare dividends if we default under certain provisions. Further, if we invest a greater amount of assets in equity securities that do not pay current dividends, it could reduce the amount available for distribution. See Part II, Item 5 of this Form 10-K “Market for Registrant’s Common Equity, Related Stockholder Matters and Issuer Purchases of Equity Securities—Price Range of Common Stock.” The above referenced restrictions on distributions may also inhibit our ability to make required interest payments to holders of our debt, which may cause a default under the terms of our debt agreements. Such a default could materially increase our cost of raising capital, as well as cause us to incur penalties under the terms of our debt agreements.
The distributions we pay to our stockholders in a year may exceed our taxable income for that year and, accordingly, a portion of such distributions may constitute a return of capital for U.S. federal income tax purposes that would reduce a stockholder’s adjusted tax basis in its shares of our common stock or preferred stock and correspondingly increase such stockholder’s gain, or reduce such stockholder’s loss, on disposition of such shares. Distributions in excess of a stockholder’s adjusted tax basis in its shares of our common stock or preferred stock will constitute capital gains to such stockholder.
Our stockholders may receive shares of our common stock as dividends, which could result in adverse tax consequences to them.
In order to satisfy the Annual Distribution Requirement applicable to RICs, we will have the ability to declare a large portion of a dividend in shares of our common stock instead of in cash. As long as a portion of such dividend is paid in cash and certain requirements are met, the entire distribution generally will be treated as a dividend for U.S. federal income tax purposes. As a result, a stockholder generally would be taxed on 100% of the fair market value of the dividend on the date the dividend is received by the stockholder in the same manner as a cash dividend, even though most of the dividend was paid in shares of our common stock. If a U.S. stockholder sells the common stock that it receives as a dividend in order to pay this tax, the sales proceeds may be less than the amount included in income with respect to the dividend, depending on the trading price (if any) of our common stock at the time of the sale. Furthermore, with respect to non-U.S. stockholders, we may be required to withhold U.S. tax with respect to such dividends, including in respect of all or a portion of such dividend that is payable in common stock. In addition, if a significant number of our stockholders were to determine to sell shares of our common stock in order to pay taxes owed on dividends, it may put downward pressure on the trading price (if any) of our common stock. It is unclear whether and to what extent we will be able to pay taxable dividends of the type described in this paragraph.

We may have difficulty paying our required distributions if we recognize taxable income before or without receiving cash representing such income.
For U.S. federal income tax purposes, we will include in our taxable income certain amounts that we have not yet received in cash, such as OID or accruals on a contingent payment debt instrument, which may occur if we receive warrants in connection with the origination of a loan or possibly in other circumstances or contracted PIK interest, which generally represents contractual interest added to the loan balance and due at the end of the loan term. Such OIDpayments. Any such income would be treated as income earned by us and PIK interest willtherefore would be includedsubject to the Annual Distribution Requirement (as defined and explained more fully in our taxable income before we receive any corresponding cash payments.Part I, Item 1 of this Form 10-K “Business—Election to be Taxed as a RIC.”). We also may be required to include in our taxable income certain other amounts that we will not receive in cash. The credit risk associated with the collectability of deferred payments may be increased as and when a portfolio company increases the amount of interest on which it is deferring cash payment through deferred interest features. Our investments with a deferred interest feature may represent a higher credit risk than loans for which interest must be paid in full in cash on a regular basis. For example, even if
52

the accounting conditions for income accrual are met, the borrower could still default when our actual collection is scheduled to occur upon maturity of the obligation.
Because in certain cases we may recognize taxable income before or without receiving cash representing such income, we may have difficulty making distributions to our stockholders that will be sufficient to enable us to meet the Annual Distribution Requirement necessary for us to maintain our status as a RIC. Accordingly, we may need to sell some of our assets at times and/or at prices that we would not consider advantageous, we may need to raise additional equity or debt capital, or we may need to forego new investment opportunities or otherwise take actions that are disadvantageous to our business (or be unable to take actions that are advantageous to our business) to enable us to make distributions to our stockholders that will be sufficient to enable us to meet the Annual Distribution Requirement. However, under the Investment Company Act, we are not permitted to make distributions to our stockholders while our debt obligations and other senior securities are outstanding unless an “asset coverage” test is met. See Part I, Item 1 of this Form 10-K “Business—Regulation—Indebtedness and Senior Securities.”
If we are unable to obtain cash from other sources to meet the Annual Distribution Requirement, we may fail to qualify for the U.S. federal income tax benefits allowable to RICs and, thus, become subject to a corporate-level U.S. federal income tax (and any applicable U.S. state and local taxes). Additionally, we may make investments that result in the recognition of ordinary income rather than capital gain, or that prevent us from accruing a long-term holding period. These investments may prevent us from making capital gain distributions. See Part I, Item 1 of this Form 10-K “Business—Election to be Taxed as a RIC.
Alternatively, we may, with the consent of all our shareholders,stockholders, designate an amount as a consent dividend (i.e., a deemed dividend). In that case, although we would not distribute any actual cash to our shareholders,stockholders, the consent dividend would be treated like an actual dividend under the Code for all U.S. federal income tax purposes. This would allow us to deduct the amount of the consent dividend and our shareholdersstockholders would be required to include that amount in income as if it were actually distributed. For additional discussion regarding the tax implications of a RIC, see Part I, Item 1 of this Form 10-K “Business—Election to be Taxed as a RIC.”
Non-U.S. stockholders may be subject to withholding of U.S. federal income tax on dividends we pay.
Distributions of our “investment company taxable income” to a non-U.S. stockholder that are not effectively connected with the non-U.S. stockholder’s conduct of a trade or business within the United States may be subject to withholding of U.S. federal income tax at a 30% rate (or lower rate provided by an applicable income tax treaty) to the extent of our current or accumulated earnings and profits. Certain properly designated dividends are generally exempt from withholding of U.S. federal income tax, including certain dividends that are paid in respect of our (i) “qualified net interest income” (generally, our U.S.-source interest income, other than certain contingent interest and interest from obligations of a corporation or partnership in which we or the non-U.S. stockholder are at least a 10% shareholder, reduced by expenses that are allocable to such income) or (ii) “qualified short-term capital gains” (generally, the excess of our net short-term capital gain over our long-term capital loss for such taxable year), and certain other requirements were satisfied. No assurance can be given as to whether any of our distributions will be eligible for this exemption from withholding of U.S. federal income tax or, if eligible, will be designated as such by us. See Part I, Item 1 of this Form 10-K “Business—Election to be Taxed as a RIC.” for additional information.

The trading market or market value of any publicly issued debt securities may fluctuate.
Any publicly issued debt securities that we may issue may or may not have an established trading market. We cannot assure you that a trading market for any publicly issued debt securities will ever develop or be maintained if developed. In addition to our creditworthiness, many factors may materially adversely affect the trading market for, and market value of, any publicly issued debt securities. These factors include, but are not limited to, the following:
the time remaining to the maturity of such debt securities;
the outstanding principal amount of debt securities with terms identical to such debt securities;
the ratings assigned by national statistical ratings agencies;
the general economic environment;
the supply of such debt securities trading in the secondary market, if any;


the redemption or repayment features, if any, of such debt securities;
the level, direction and volatility of market interest rates generally; and
market rates of interest higher or lower than rates borne by such debt securities.
In addition, there may be a limited number of buyers if and when a decision is made to sell your debt securities. This too may materially adversely affect the market value of such debt securities or the trading market for the debt securities.
Terms relating to redemption may materially adversely affect your return on any debt securities that we may issue.
If such debt securities are redeemable at our option, we may choose to redeem such debt securities at times when prevailing interest rates are lower than the interest rate paid on the debt securities. In addition, if such debt securities are subject to mandatory redemption, we may be required to redeem the debt securities also at times when prevailing interest rates are lower than the interest rate paid on your debt securities. In this circumstance, an investor may not be able to reinvest the redemption proceeds in a comparable security at an effective interest rate as high as your debt securities being redeemed.
Our credit ratings may not reflect all risks of an investment in any debt securities that we may issue.
Our credit ratings are an assessment by third parties of our ability to pay our obligations. Consequently, real or anticipated changes in our credit ratings will generally affect the market value of our debt securities. Our credit ratings, however, may not reflect the potential impact of risks related to market conditions generally or other factors discussed above on the market value of or trading market for any publicly issued debt securities.
Holders of any preferred stock that we may issue would have the right to elect members of the board of directors and class voting rights on certain matters.
Holders of any preferred stock we might issue, voting separately as a single class, would have the right to elect two members of the board of directors at all times and in the event dividends become two full years in arrears would have the right to elect a majority of the directors until such arrearage is completely eliminated. In addition, preferred stockholders have class voting rights on certain matters, including changes in fundamental investment restrictions and conversion to open-end status, and accordingly can veto any such changes. Restrictions imposed on the declarations and payment of dividends or other distributions to the holders of our common stock and preferred stock, both by the Investment Company Act and by requirements imposed by rating agencies or the terms of our credit facilities, might impair our ability to maintain our qualification as a RIC for federal income tax purposes. While we would intend to redeem our preferred stock to the extent necessary to enable us to distribute our income as required to maintain our qualification as a RIC, there can be no assurance that such actions could be effected in time to meet the tax requirements.
Item 1B. Unresolved Staff Comments
None.
Item 2. Properties
We maintain our principal executive office at 520 MadisonOne Vanderbilt Avenue, 40th Floor,Suite 3400, New York, NY 10022.10017. We do not own any real estate.
Item 3. Legal Proceedings
The Company may become party to certain lawsuits in the ordinary course of business, including proceedings relating to the enforcement of our rights under contracts with our portfolio companies. The Company is not currently subject to any material legal proceedings, nor, to our knowledge, is any material legal proceeding threatened against the Company. See also Note 111 to the consolidated financial statements in Part II, Item 8 of this Form 10-K.
53

Item 4. Mine Safety Disclosures
Not applicable.

54


PART II
Item 5. Market for Registrant’s Common Equity, Related Stockholder Matters and Issuer Purchases of Equity Securities (dollar amounts in thousands, except per share data)
Price Range of Common Stock
Our common stock is traded on The NASDAQNasdaq Global Select Market under the symbol “CGBD.” Our common stock has historically traded at prices both above and below our NAV per share. It is not possible to predict whether our common stock will trade at, above or below NAV. See Part I, Item 1A of this Form 10-K “Risk Factors—Risks Related to an Investment in Our Securities—Our shares of common stock have traded at a discount fromto NAV and may do so again, which could limit our ability to raise additional equity capital.
The following table sets forth, for each fiscal quarter since our initial public offering, the NAV per share of our common stock, the range of high and low closing sales prices of our common stock, the closing sales price as a premium (discount) to NAV and the dividends or distributions declared by us. On February 27, 2018,18, 2022, the last reported closing sales price of our common stock on The NASDAQNasdaq Global Select Market was $17.37$13.75 per share, which represented a discount of approximately 4.14%18.7% to the NAV per share reported by us as of December 31, 2017.2021.
  Price Range   
 NAV(1)HighLowHigh Sales Price Premium (Discount) to NAV(2)Low Sales Price Premium (Discount) to NAV(2)Cash Dividend Per Share(3)
Year ended December 31, 2017      
Second Quarter (beginning June 14, 2017)
$18.14

$18.49

$18.01
1.93%(0.72)%
$0.37
Third Quarter
$18.18

$18.89

$18.00
3.91%(0.99)%
$0.37
Fourth Quarter
$18.12

$20.04

$17.04
10.60%(5.96)%$0.49
(1)NAV per share is determined as of the last day in the relevant quarter and therefore may not reflect the NAV per share on the date of the high and low closing sales prices. The NAVs shown are based on outstanding shares at the end of the relevant quarter.
(2)Calculated as the respective high or low closing sales price less NAV, divided by NAV (in each case, as of the applicable quarter).
(3)Represents the dividend or distribution declared in the relevant quarter. The cash dividend for the fourth quarter of the year ended December 31, 2017 included a special dividend of $0.12 per share.
Holders
As of February 27, 2018,18, 2022, there were approximately 1,73922 holders of record of our common stock (including Cede & Co.).
Distributions
To the extent that we have taxable income available, we intend to distribute quarterly dividends to our stockholders. The amount of our dividends, if any, will be determined by our Board of Directors. Any dividends to our stockholders will be declared out of assets legally available for distribution. We anticipate that our distributions will generally be paid from taxable earnings, including interest and capital gains generated by our investment portfolio, and any other income, including any other fees (other than fees for providing managerial assistance), such as commitment, origination, structuring, diligence and consulting fees or other fees, that we receive from portfolio companies. However, if we do not generate sufficient taxable earnings during a year, all or part of a distribution may constitute a return of capital. The specific tax characteristics of our dividends and other distributions will be reported to stockholders after the end of each calendar year.
We have elected to be treated, and intend to continue to qualify annually, as a RIC. To maintain our qualification as a RIC, we must, among other things, distribute at least 90% of our ordinary income and realized net short-term capital gains in excess of realized net long-term capital losses, if any, to our stockholders on an annual basis. In order to avoid certain excise taxes imposed on RICs, we intend to distribute during each calendar year an amount at least equal to the sum of: (1) 98% of our ordinary income for the calendar year; (2) 98.2% of our capital gain net income (both long-term and short-term) for the one-year period ending on October 31 of the calendar year; and, (3) any undistributed ordinary income and capital gain net income for preceding years that were not distributed during such years and on which we paid no U.S. federal income tax less certain


over-distributions in prior years. In addition, although we currently intend to distribute realized net capital gains (i.e., net long term capital gains in excess of short term capital losses), if any, at least annually, we may in the future decide to retain such capital gains for investment, pay U.S. federal income tax on such amounts at regular corporate tax rates, and elect to treat such gains as deemed distributions to stockholders. We can offer no assurance that we will achieve results that will permit the payment of any cash distributions and, to the extent that we issue senior securities, we will be prohibited from making distributions if doing so causes us to fail to maintain the asset coverage ratios stipulated by the Investment Company Act or if distributions are limited by the terms of any of our borrowings.
We intend to make distributions in cash unless a stockholder elects to receive dividends and/or long-term capital gains distributions in additional shares of common stock. See “—Dividend Reinvestment Plan” below. We can offer no assurance that we will achieve results that will permit the payment of any cash distributions and, if we issue senior securities, we will be prohibited from making distributions if doing so causes us to fail to maintain the asset coverage ratios stipulated by the Investment Company Act or if distributions are limited by the terms of any of our borrowings. The following table summarizes the Company’s dividends declared during the two most recent fiscal years and the current fiscal year to date:
Date Declared Record Date Payment Date Per Share Amount 
2016       
March 10, 2016 March 14, 2016 April 22, 2016 $0.40
 
June 8, 2016 June 8, 2016 July 22, 2016 $0.40
 
September 28, 2016 September 28, 2016 October 24, 2016 $0.40
 
December 29, 2016 December 29, 2016 January 24, 2017 $0.41
 
December 29, 2016 December 29, 2016 January 24, 2017 $0.07
(1)
Total     $1.68
 
2017       
March 20, 2017
 March 20, 2017
 April 24, 2017 $0.41
 
June 20, 2017 June 30, 2017 July 18, 2017 $0.37
 
August 7, 2017 September 29, 2017 October 18, 2017 $0.37
 
November 7, 2017 December 29, 2017 January 17, 2018 $0.37
 
December 13, 2017 December 29, 2017 January 17, 2018 $0.12
(1)
Total     $1.64
 
2018       
February 26, 2018 March 29, 2018 April 17, 2018 $0.37
 
(1)Represents a special dividend.
Dividend Reinvestment Plan
Prior to July 5, 2017, we had an “opt in” dividend reinvestment plan. Effective on July 5, 2017, we converted our “opt in” dividend reinvestment plan to an “opt out” dividend reinvestment plan that provides for reinvestment of our dividends and other distributions on behalf of our common stockholders, other than those stockholders who have “opted out” of the plan. As a result of adopting the plan, if our Board of Directors authorizes, and we declare, a cash dividend or distribution, our common stockholders who have not elected to “opt out” of our dividend reinvestment plan will have their cash dividends or distributions
55

automatically reinvested in additional shares of our common stock, rather than receiving cash. Each registered stockholder may elect to have such stockholder’s dividends and distributions distributed in cash rather than participate in the plan. For any registered stockholder that does not so elect, distributions on such stockholder’s shares will be reinvested by State Street Bank and Trust Company, our plan administrator, in additional shares. The number of shares to be issued to the stockholder will be determined based on the total dollar amount of the cash distribution payable, net of applicable withholding taxes. We intend to use primarily newly issued shares to implement the plan so long as the market value per share is equal to or greater than the net asset value per share on the relevant valuation date. If the market value per share is less than the net asset value per share on the relevant valuation date, the plan administrator would implement the plan through the purchase of common stock on behalf of participants in the open market, unless we instruct the plan administrator otherwise.
Recent Sales of Unregistered Securities and Use of Proceeds
Except as previously reported by the Company on its current reports on Form 8-K, theThe Company did not sell any securities during the period covered by this Form 10-K that were not registered under the Securities Act.

Stock Performance Graph
This graph comparesdepicts the stockholder return on our common stock from June 14, 2017 (the date our common stock commenced trading on The NASDAQNasdaq Global Select Market) to December 31, 2017 with2021 relative to that of the Standard & Poor’s BDC Index (the “S&P BDC Index”) and the Standard & Poor’s 500 Stock Index (the “S&P 500 Index”). This graph assumes that on June 14, 2017, $100 was invested in our common stock, the S&P BDC Index and the S&P 500 Index. The graph also assumes the reinvestment of all cash dividends prior to any tax effect.
The graph and other information furnished under this Part II, Item 5 of this Form 10-K shall not be deemed to be “soliciting material” or to be “filed” with the SEC or subject to Regulation 14A or 14C under, or to the liabilities of Section 18 of, the Exchange Act. The stock price performance included in the below graph is not necessarily indicative of future stock performance.
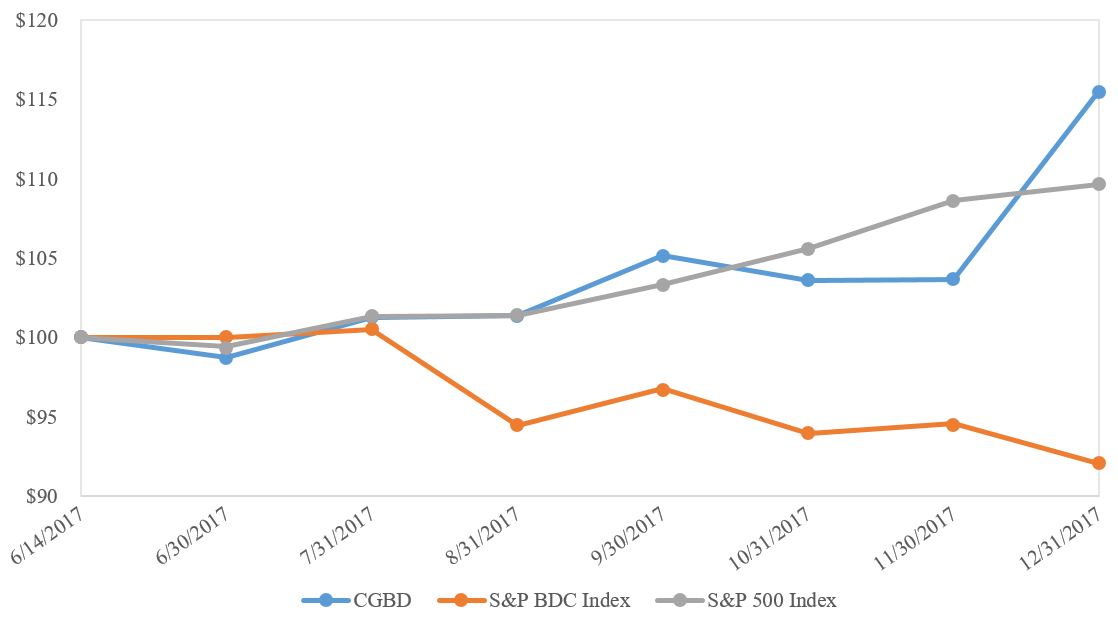
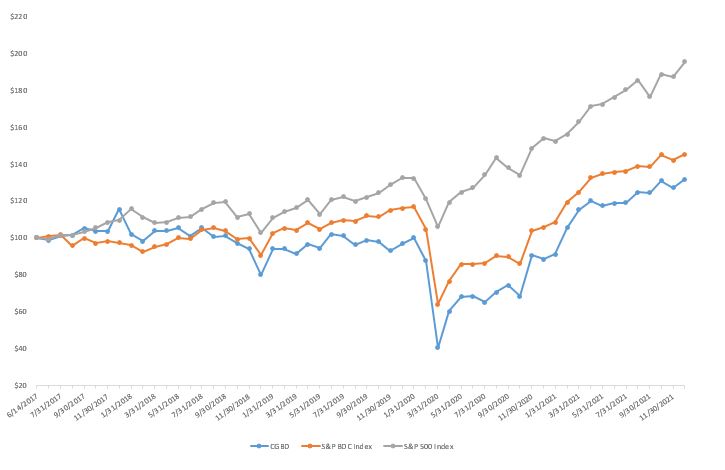
stockcompgrapha.jpg

56

Purchases of Equity Securities by the Issuer and Affiliated Purchasers
Share Purchases under the 10b5-1 Plan
The following table provides information regarding purchases of our common stock made by certain individuals affiliatedor on behalf of the Company or any “affiliated purchaser” (as defined in Rule 10b-18(a)(3) under the Exchange Act) during the fourth quarter of 2021.
Period
Total Number of Shares Purchased(1)
Average Price Paid Per Share
Total Number of Shares Purchased as Part of Publicly Announced Plans or Programs(1)(2)
Maximum (or Approximate Dollar Value) of Shares that May Yet Be Purchased Under the Plans or Programs
(Dollars in millions, except share and per share data)
October 1, 2021 through October 31, 2021158,751 $13.83 158,751 $30.5 
November 1, 2021 through November 30, 2021114,098 $14.03 114,098 $28.9 
December 1, 2021 through December 31, 2021299,141 $13.86 299,141 $24.7 
Total571,990 571,990 
(1)On trade date basis.
(2)On November 1, 2021, the Company's Board of Directors approved the continuation of the Company's Stock Repurchase Program until November 5, 2022, or until the date the approved dollar amount has been used to repurchase shares. Pursuant to the program, the Company is authorized to repurchase up to $150 million in the aggregate of its outstanding common stock in the open market and/or through privately negotiated transactions at prices not to exceed the Company’s net asset value per share as reported in its most recent financial statements, in accordance with Carlylethe guidelines specified in Rule 10b-18 of the Exchange Act. The timing, manner, price and amount of any repurchases will be determined by the Company, in its discretion, based upon the evaluation of economic and market conditions, stock price, available cash, applicable legal and regulatory requirements and other factors, and may include purchases pursuant to Rule 10b5-1 of the Exchange Act. The program does not require the Company to repurchase any specific number of shares and there can be no assurance as to the amount of shares repurchased under the program. The program may be suspended, extended, modified or discontinued by the Company at any time, subject to applicable law. As of December 31, 2021, the Company has repurchased an aggregate of $125.3 million pursuant to the Company Stock Repurchase Program. Pursuant to the authorization described above, the Company adopted the Company 10b5-1 Plan. The Company 10b5-1 Plan for each month from June 2017 (beginning June 14, 2017) through December 2017.provides that purchases will be conducted on the open market in accordance with Rules 10b5-1 and 10b-18 under the Exchange Act and will otherwise be subject to applicable law, which may prohibit purchases under certain circumstances. The amount of purchases made under the Company 10b5-1 Plan or otherwise and how much will be purchased at any time is uncertain, dependent on prevailing market prices and trading volumes, all of which we cannot predict. The Company's Stock Repurchase Program was originally approved by the Company's Board of Directors on November 5, 2018 and announced on November 6, 2018.
Period Total Number of Shares Purchased Average Price Paid Per Share 
Total Number of Shares Purchased as Part of Publicly Announced Plans or Programs(1)
 Maximum (or Approximate Dollar Value) of Shares that May Yet Be Purchased Under the Plans or Programs
June 14, 2017 through June 30, 2017 
 
 
 15,000
July 1, 2017 through July 31, 2017 171,246
 18.34
 171,246
 11,860
August 1, 2017 through August 31, 2017 14,490
 18.48
 14,490
 11,592
September 1, 2017 through September 30, 2017 
 
 
 11,592
October 1, 2017 through October 31, 2017 
 
 
 11,592
November 1, 2017 through November 30, 2017 13,209
 18.16
 13,209
 11,352
December 1, 2017 through December 31, 2017 114,030
 17.86
 114,030
 9,316
Total 312,975
   312,975
  
(1)Shares purchased by certain individuals affiliated with Carlyle pursuant to the 10b5-1 Plan, which was entered into on June 13, 2017. Under the 10b5-1 Plan, the participants would buy up to $15,000 in the aggregate of our common stock in the open market during the period beginning July 17, 2017 and ending on the earlier of the date on which the capital committed to the 10b5-1 Plan had been exhausted or June 19, 2018, subject to certain conditions. As of February 22, 2018, the capital committed to the 10b5-1 Plan had been exhausted, and the 10b5-1 Plan was terminated in accordance with its terms.


Item 6. Selected Financial Data[Reserved]
The tables below set forth our selected consolidated historical financial data for the periods indicated. The selected consolidated historical financial data as of and for the years ended December 31, 2017, 2016, 2015, 2014 and 2013 have been derived from our audited consolidated financial statements, which are included in “Financial Statements and Supplementary Data” in Part II, Item 8 of this Form 10-K. Our historical results are not necessarily indicative of future results. The selected financial data in this section is not intended to replace the financial statements and is qualified in its entirety by the financial statements and related notes included in this filing.
The selected consolidated financial information and other data presented below should be read in conjunction with the information contained in Part II, Item 7 of this Form 10-K “Management’s Discussion and Analysis of Financial Condition and Results of Operations,” the audited consolidated financial statements and the notes thereto in Part II, Item 8 of this Form 10-K, “Financial Statements and Supplementary Data”.
 For the years ended December 31,
 2017 2016 2015 2014 2013
(dollar amounts in thousands, except per share data)         
Consolidated Statements of Operations Data         
Income         
Total investment income$165,001
 $110,971
 $69,190
 $32,984
 $4,969
Expenses         
Net expenses (including excise tax expense)72,850
 51,350
 33,666
 18,724
 6,638
Net investment income (loss)92,151
 59,621
 35,524
 14,260
 (1.669)
Net realized gain (loss) on investments(11,692) (9,644) 1,164
 72
 63
Net change in unrealized appreciation (depreciation) on investments3,741
 19,832
 (18,015) (8,718) (321)
Net increase (decrease) in net assets resulting from operations84,200
 69,809
 18,673
 5,614
 (1,927)
Per Share Data         
Basic and diluted net investment income$1.74
 $1.65
 $1.43
 $1.09
 $(0.55)
Basic and diluted earnings$1.59
 $1.93
 $0.75
 $0.43
 $(0.64)
Dividends declared (1)$1.64
 $1.68
 $1.74
 $1.25
 $
(1)Cumulative per share dividends declared by the Company’s Board of Directors for the years ended December 31, 2017, 2016, 2015 and 2014. Cumulative per share dividends declared by the Company’s Board of Directors for the years ended December 31, 2017, 2016, and 2015 included a special dividend of $0.12, $0.07 and $0.18 per share, respectively. The Company’s Board of Directors did not declare a dividend during the year ended December 31, 2013.


 As of and for the years ended December 31,
 2017 2016 2015 2014 2013
(dollar amounts in thousands, except per share data)         
Consolidated Statements of Assets and Liabilities Data         
Investments—non-controlled/non-affiliated, at fair value$1,779,584
 $1,323,102
 $1,052,666
 $698,662
 $212,807
Investments—non-controlled/affiliated, at fair value15,431


Investments—controlled/affiliated, at fair value172,516
 99,657


Cash and cash equivalents32,039
 38,489
 41,837
 8,754
 42,010
Total assets2,021,383
 1,490,155
 1,104,032
 716,720
 260,967
Secured borrowings562,893
 421,885
 234,313
 308,441
 66,822
2015-1 Notes payable271,053
 270,849
 270,644
 
 
Total liabilities894,079
 726,018
 532,306
 378,463
 74,965
Total net assets1,127,304
 764,137
 571,726
 338,257
 186,002
Net assets per share$18.12
 $18.32
 $18.14
 $18.86
 $19.42
Other Data:         
Number of portfolio companies/structured finance obligation/investment fund at year end90
 86
 85
 72
 27
Average funded investments in new portfolio companies/structured finance obligations (1)$26,816
 $12,188
 $12,996
 $10,597
 $6,751
Total return based on NAV (2)7.86% 10.25% 5.41% 3.55% (2.90)%
(1)Average is calculated per portfolio company based on the total amount funded during the period divided by the number of portfolio companies invested/structured finance obligations made during the period.
(2)Total return is based on the change in NAV per share during the year plus the declared dividends, assuming reinvestment of dividends in accordance with the dividend reinvestment plan, divided by the beginning NAV for the year. Total return for the years/periods ended December 31, 2017, 2016, 2015, 2014 and 2013 was inclusive of $(0.11), $0.01, $0.11 and $0.09 and $0.32, respectively, per share increase in NAV related to the offering price of the Company’s common stock. Excluding the effects of the higher offering price of the Company’s common stock, total return would have been 8.46%, 10.20%, 4.83%, 3.09% and (4.50%), respectively (refer to Note 9 in Part II, Item 8 of this Form 10-K for additional information). Total return based on change in NAV for the year ended December 31, 2013 was calculated for the period from commencement of operations through December 31, 2013.
Item 7. Management’s Discussion and Analysis of Financial Condition and Results of Operations (dollar amounts in thousands, except per share data, unless otherwise indicated)
The following discussion and analysis of our financial condition and results of operations should be read in conjunction with Part I, Item 6 of this Form 10-K “Selected Financial Data” and our consolidated financial statements and related notes in Part II, Item 8 of this Form 10-K “Financial Statements and Supplementary Data.” This discussion contains forward-looking statements and involves numerous risks and uncertainties, including, but not limited to those described in Part I, Item 1A of this Form 10-K “Risk Factors.” Our actual results could differ materially from those anticipated by such forward-looking information due to factors discussed under “Risk Factors” and “Cautionary Statement Regarding Forward-Looking Statements” appearing elsewhere in this Form 10-K.
OVERVIEW
We are a Maryland corporation formed on February 8, 2012, and structured as an externally managed, non-diversified closed-end investment company. We have elected to be regulated as a BDC under the Investment Company Act. We have elected to be treated, and intend to continue to comply with the requirements to qualify annually, as a RIC under Subchapter M of the Code.
Our investment objective is to generate current income and, to a lesser extent, capital appreciation primarily through secured debt investments in U.S. middle market companies. Our core investment strategy focuses on lending to U.S. middle market companies supported by financial sponsors, which we define as companies with approximately $10$25 million to $100
57

$100 million of EBITDA.EBITDA, which we believe is a useful proxy for cash flow. This core strategy is supplemented with complementary specialty lending and opportunistic investing strategies, which take advantage of the broad capabilities of Carlyle’s Global Credit platform while offering risk diversifying portfolio benefits. We seek to achieve our investment objective primarily through direct originations of Middle Market Senior Loans, with the balancea minority of our assets invested in higher yielding investments (which may include unsecured debt, mezzanine debt and investments in equities). We generally make Middle Market Senior Loans to private U.S. middle market companies that are, in many cases, controlled by private equity firms. Depending on market conditions, we expect that between 70% and 80% of the


value of our assets will be invested in Middle Market Senior Loans. We expect that the composition of our portfolio will change over time given our Investment Adviser’s view on, among other things, the economic and credit environment (including with respect to interest rates) in which we are operating.
On June 19, 2017, we closed our IPO, issuing 9,454,200 shares of our common stock (including shares issued pursuant to the exercise of the underwriters’ over-allotment option on July 5, 2017) at a public offering price of $18.50 per share. Net of underwriting costs, we received cash proceeds of $169,488. Shares of common stock of TCG BDC began trading on the NASDAQNasdaq Global Select Market under the symbol “CGBD” on June 14, 2017.
On June 9, 2017, we acquired NF Investment Corp. (“NFIC”), a BDC managed by our Investment Advisor (the “NFIC Acquisition”). As a result, we issued 434,233 shares of common stock to the NFIC stockholders and approximately $145,602 in cash, and acquired approximately $153,648 in net assets.
We are externally managed by our Investment Adviser, an investment adviser registered under the Advisers Act. Our Administrator provides the administrative services necessary for us to operate. Both our Investment Adviser and our Administrator are wholly owned subsidiaries of Carlyle Investment Management L.L.C., a subsidiary of Carlyle. Our Investment Adviser’s five-person investment committee is responsible for reviewing and approving our investment opportunities. The members of the investment committee have experience investing through different credit cycles. As of December 31, 2021, our Investment Adviser’s investment team included a team of more than 180 investment professionals across the Carlyle Global Credit segment. Our Investment Adviser’s investment committee comprises five of the most senior credit professionals within the Global Credit segment, with backgrounds and expertise across asset classes and over 26 years of average industry experience and 10 years of average tenure. In addition, our Investment Adviser and its investment team are supported by a team of finance, operations and administrative professionals currently employed by Carlyle Employee Co., a wholly owned subsidiary of Carlyle.
In conducting our investment activities, we believe that we benefit from the significant scale, relationships and resources of Carlyle, including our Investment Adviser and its affiliates. We have operated our business as a BDC since we began our investment activities in May 2013.
KEY COMPONENTS OF OUR RESULTS OF OPERATIONS
Investments
Our level of investment activity can and does vary substantially from period to period depending on many factors, including the amount of debt available to middle market companies, the general economic environment and the competitive environment for the type of investments we make.
Revenue
We generate revenue primarily in the form of interest income on debt investments we hold. In addition, we generate income from dividends on direct equity investments, capital gains on the sales of loans and debt and equity securities and various loan origination and other fees. Our debt investments generally have a stated term of five to eight years and generally bear interest at a floating rate usually determined on the basis of a benchmark such as LIBOR. Interest on these debt investments is generally paid quarterly. In some instances, we receive payments on our debt investments based on scheduled amortization of the outstanding balances. In addition, we receive repayments of some of our debt investments prior to their scheduled maturity date. The frequency or volume of these repayments fluctuates significantly from period to period. Our portfolio activity also reflects the proceeds of sales of securities. We may also generate revenue in the form of commitment, origination, amendment, structuring or due diligence fees, fees for providing managerial assistance and consulting fees.
58

Expenses
Our primary operating expenses include the payment of: (i) investment advisory fees, including base management fees and incentive fees, to our Investment Adviser pursuant to the Investment Advisory Agreement between us and our Investment Adviser; (ii) costs and other expenses and our allocable portion of overhead incurred by our Administrator in performing its administrative obligations under the Administration Agreement between us and our Administrator; and (iii) other operating expenses as detailed below:
the costs associated with the private offering ofadministration fees payable under our common stock prior to our initial public offering;Administration Agreement and Sub-Administration Agreements, including related expenses;
the costs of any other offerings of our common stock and other securities, if any;
calculating individual asset values and our net asset value (including the cost and expenses of any independent valuation firms);
expenses, including travel expenses, incurred by our Investment Adviser, or members of our Investment Adviser team managing our investments, or payable to third parties, performing due diligence on prospective portfolio companies and, if necessary, expenses of enforcing our rights;
the base management fee and any incentive fee payable under our Investment Advisory Agreement;
certain costs and expenses relating to distributions paid on our shares;

administration fees payable under our Administration Agreement and Sub-Administration Agreements, including related expenses;
debt service and other costs of borrowings or other financing arrangements;
the allocated costs incurred by our Investment Adviser in providing managerial assistance to those portfolio companies that request it;
amounts payable to third parties relating to, or associated with, making or holding investments;
the costs associated with subscriptions to data service, research-related subscriptions and expenses and quotation equipment and services used in making or holding investments;
transfer agent and custodial fees;
costs of hedging;
commissions and other compensation payable to brokers or dealers;
federal and state registration fees;
any U.S. federal, state and local taxes, including any excise taxes;
independent director fees and expenses;
costs of preparing financial statements and maintaining books and records, costs of preparing tax returns, costs of Sarbanes-Oxley Act compliance and attestation and costs of filing reports or other documents with the SEC (or other regulatory bodies), and other reporting and compliance costs, including registration and listing fees, and the compensation of professionals responsible for the preparation or review of the foregoing;
the costs of any reports, proxy statements or other notices to our stockholders (including printing and mailing costs), the costs of any stockholders’ meetings and the compensation of investor relations personnel responsible for the preparation of the foregoing and related matters;
the costs of specialty and custom software for monitoring risk, compliance and overall portfolio, including any development costs incurred prior to the filing of our election to be regulated as a BDC;
our fidelity bond;
directors and officers/errors and omissions liability insurance, and any other insurance premiums;
indemnification payments;
direct fees and expenses associated with independent audits, agency, consulting and legal costs; and
all other expenses incurred by us or our Administrator in connection with administering our business, including our allocable share of certain officers and their staff compensation.
We expect our general and administrative expenses to be relatively stable or to decline as a percentage of total assets during periods of asset growth and to increase during periods of asset declines.
59

PORTFOLIO AND INVESTMENT ACTIVITY
As    Below is a summary of December 31, 2017, the fair valuecertain characteristics of our investments was approximately $1,967,531, comprised of 107 investments in 90investment portfolio companies/investment fund across 28 industries with 57 sponsors. As of December 31, 2016, the fair value of our investments was approximately $1,422,759, comprised of 98 investments in 86 portfolio companies/structured finance obligations/investment fund across 29 industries with 57 sponsors. As of December 31, 2015, the fair value of our investments was approximately $1,052,666, comprised of 97 investments in 85 portfolio companies/structured finance obligations across 27 industries.
Based on fair value as of December 31, 2017, our portfolio consisted of approximately 90.3% in secured debt (77.8% in first lien debt (including 12.1% in first lien/last out loans)2021, 2020 and 12.5% in second lien debt), 8.8% in Credit Fund, and 0.9% in equity investments. Based on fair value as of December 31, 2017, approximately 1% of our debt portfolio was invested in debt bearing a fixed interest rate and approximately 99% of our debt portfolio was invested in debt bearing a floating interest rate, which primarily are2019.
As of December 31,
202120202019
Count of investments154 160 136 
Count of portfolio companies / investment funds117 117 112 
Count of industries27 27 28 
Percentage of total investment fair value:
First lien debt64.4 %67.0 %78.3 %
Second lien debt17.9 %15.6 %11.0 %
Total secured debt82.3 %82.6 %89.3 %
Investment Funds13.7 %15.5 %9.6 %
Equity investments4.0 %1.9 %1.0 %
Percentage of debt investment fair value:
Floating rate (1)
98.4 %99.1 %99.7 %
Fixed interest rate1.6 %0.9 %0.3 %
(1) Primarily subject to interest rate floors.
Based on fair value as of December 31, 2016, our portfolio consisted of approximately 92.2% in secured debt (80.1% in first lien debt (including 12.9% in first lien/last out loans) and 12.1% in second lien debt), 7% in Credit Fund, 0.4% in structured finance obligations and 0.5% in equity investments. Based on fair value as of December 31, 2016, approximately 1%
60


of our debt portfolio was invested in debt bearing a fixed interest rate and approximately 99% of our debt portfolio was invested in debt bearing a floating interest rate with an interest rate floor.
Based on fair value as of December 31, 2015, our portfolio consisted of approximately 95.5% in secured debt (75.5% in first lien debt (including 11.7% in first lien/last out loans) and 20.0% in second lien debt), 4.3% in structured finance obligations and 0.2% in equity investments. Based on fair value as of December 31, 2015, approximately 3% of our debt portfolio was invested in debt bearing a fixed interest rate and approximately 97% of our debt portfolio was invested in debt bearing a floating interest rate with an interest rate floor.
Our investment activity for the years ended December 31, 2017, 20162021, 2020 and 20152019 is presented below (information presented herein is at amortized cost unless otherwise indicated):
For the years ended December 31, For the years ended December 31,
2017 2016 2015 202120202019
Investments:     Investments:
Total investments, beginning of year$1,429,981
 $1,079,720
 $707,701
Total investments, beginning of year$1,922,966 $2,201,451 $2,043,591 
New investments purchased1,340,824
 755,654
 597,811
New investments purchased851,422 705,743 1,000,467 
Net accretion of discount on investments11,747
 5,605
 3,035
Net accretion of discount on investments9,383 8,186 12,955 
Net realized gain (loss) on investments(11,692) (9,644) 1,164
Net realized gain (loss) on investments19,038 (58,472)(38,376)
Investments sold or repaid(799,848) (401,354) (229,991)Investments sold or repaid(845,256)(933,942)(817,186)
Total investments, end of year$1,971,012
 $1,429,981
 $1,079,720
Total investments, end of year$1,957,553 $1,922,966 $2,201,451 
Principal amount of investments funded:     Principal amount of investments funded:
First Lien Debt$991,406
 $604,514
 $481,510
First Lien Debt$696,018 $345,239 $726,489 
Second Lien Debt179,162
 38,950
 115,250
Second Lien Debt137,465 117,106 144,217 
Structured Finance Obligations
 
 15,760
Equity Investments8,887
 2,856
 1,507
Equity Investments46,600 12,233 5,436 
Investment Fund187,460
 119,785
 
Investment FundsInvestment Funds— 234,122 131,699 
Total$1,366,915
 $766,105
 $614,027
Total$880,083 $708,700 $1,007,841 
Principal amount of investments sold or repaid:     Principal amount of investments sold or repaid:
First Lien Debt$(585,414) $(254,921) $(191,718)First Lien Debt$(718,114)$(773,858)$(623,853)
Second Lien Debt(107,748) (83,279) (8,000)Second Lien Debt(92,370)(57,207)(88,695)
Structured Finance Obligations(27,000) (81,442) (39,475)
Investment Fund(112,594) (22,400) 
Equity InvestmentsEquity Investments(5,839)(1,282)(3,070)
Investment FundsInvestment Funds(23,000)(156,500)(145,200)
Total$(832,756) $(442,042) $(239,193)Total$(839,323)$(988,847)$(860,818)
Number of new funded investments50
 62
 46
Number of new funded investments48 48 51 
Average amount of new funded investments$26,816
 $12,188
 $12,996
Average amount of new funded investments$11,278 $8,781 $19,617 
Percentage of new funded debt investments at floating interest rates99% 100% 98%Percentage of new funded debt investments at floating interest rates98 %99 %99 %
Percentage of new funded debt investments at fixed interest rates1% % 2%Percentage of new funded debt investments at fixed interest rates%%%
As of December 31, 20172021 and 2016,2020, investments consisted of the following:
 December 31, 2017 December 31, 2016
 Amortized Cost Fair Value Amortized Cost Fair Value
First Lien Debt (excluding First Lien/Last Out)$1,295,406
 $1,293,641
 964,398
 955,478
First Lien/Last Out Unitranche246,925
 237,635
 180,928
 184,070
Second Lien Debt242,887
 246,233
 172,960
 171,864
Structured Finance Obligations
 
 9,239
 5,216
Equity Investments13,543
 17,506
 5,071
 6,474
Investment Fund172,251
 172,516
 97,385
 99,657
Total$1,971,012
 $1,967,531
 1,429,981
 1,422,759


 December 31, 2021December 31, 2020
 Amortized CostFair ValueAmortized CostFair Value
First Lien Debt$1,271,794 $1,232,084 $1,298,154 $1,224,063 
Second Lien Debt341,538 341,776 297,962 284,523 
Equity Investments73,125 77,093 32,754 33,877 
Investment Funds271,096 262,099 294,096 283,286 
Total$1,957,553 $1,913,052 $1,922,966 $1,825,749 
The weighted average yields(1) for our first and second lien debt, based on the amortized cost and fair value as of December 31, 20172021 and 2016,2020, were as follows:
 December 31, 2021December 31, 2020
 Amortized CostFair ValueAmortized CostFair Value
First Lien Debt7.31 %7.55 %7.21 %7.65 %
Second Lien Debt9.04 9.04 9.15 9.59 
First and Second Lien Debt Total7.68 %7.87 %7.57 %8.01 %
(1)Weighted average yields include the effect of accretion of discounts and amortization of premiums and are based on interest rates as of December 31, 2021 and 2020. Weighted average yield on debt and income producing securities at fair value is computed as (a) the annual stated interest rate or yield earned plus the net annual amortization of OID and market discount earned on accruing debt included in such securities, divided by (b) total first lien and second lien debt at fair value included in such securities. Weighted average yield on debt and income producing securities at amortized
61

 December 31, 2017 December 31, 2016
 Amortized Cost Fair Value Amortized Cost Fair Value
First Lien Debt (excluding First Lien/Last Out)8.35% 8.36% 7.09% 7.15%
First Lien/Last Out Unitranche10.02% 10.41% 12.33% 12.12%
First Lien Debt Total8.62% 8.68% 7.92% 7.96%
Second Lien Debt10.44% 10.30% 9.97% 10.04%
First and Second Lien Debt Total8.86% 8.90% 8.19% 8.23%
cost is computed as (a) the annual stated interest rate or yield earned plus the net annual amortization of OID and market discount earned on accruing debt included in such securities, divided by (b) total first lien and second lien debt at amortized cost included in such securities. Actual yields earned over the life of each investment could differ materially from the yields presented above.
(1)Weighted average yields include the effect of accretion of discounts and amortization of premiums and are based on interest rates as of December 31, 2017 and 2016. Weighted average yield on debt and income producing securities at fair value is computed as (a) the annual stated interest rate or yield earned plus the net annual amortization of OID and market discount earned on accruing debt included in such securities, divided by (b) total first lien and second lien debt at fair value included in such securities. Weighted average yield on debt and income producing securities at amortized cost is computed as (a) the annual stated interest rate or yield earned plus the net annual amortization of OID and market discount earned on accruing debt included in such securities, divided by (b) total first lien and second lien debt at amortized cost included in such securities. Actual yields earned over the life of each investment could differ materially from the yields presented above.
Total weighted average yields (which includes the effect of accretion of discount and amortization of premiums) of our first and second lien debt investments as measured on an amortized cost basis increased from 8.19%7.57% to 8.86%7.68% from December 31, 20162020 to December 31, 2017, which2021. The increase in weighted average yields was primarily due to the increase in 90-day LIBOR from 1.00% to 1.69%. Thenew fundings being originated at a higher weighted average yields on originationsyield than the yield of new investmentspositions that repaid or were approximately equivalent to the weighted average yields on sales/repayments of existing investments during the year ended December 31, 2017, excluding the impact of the change in LIBOR.sold.
The following table summarizes the fair value of our performing and non-accrual/non-performing investments as of December 31, 20172021 and 2016:2020:
December 31, 2017 December 31, 2016 December 31, 2021December 31, 2020
Fair Value Percentage Fair Value Percentage Fair ValuePercentageFair ValuePercentage
Performing$1,948,044
 99.01% $1,415,131
 99.46%Performing$1,836,501 96.0 %$1,767,613 96.8 %
Non-accrual (1)
19,487
 0.99
 7,628
 0.54
Non-accrual (1)
76,551 4.0 58,136 3.2 
Total$1,967,531
 100.00% $1,422,759
 100.00%Total$1,913,052 100.0 %$1,825,749 100.0 %
 
(1)Loans are generally placed on non-accrual status when principal or interest payments are past due 30 days or more or when there is reasonable doubt that principal or interest will be collected in full. Accrued and unpaid interest is generally reversed when a loan is placed on non-accrual status. Interest payments received on non-accrual loans may be recognized as income or applied to principal depending upon management’s judgment regarding collectability. Non-accrual loans are restored to accrual status when past due principal and interest has been paid current and, in management’s judgment, likely to remain current. Management may not place a loan on non-accrual status if the loan has sufficient collateral value and is in the process of collection. See
(1)For information regarding our non-accrual policy, see Note 2 to the consolidated financial statements included in Part II, Item 8 of this Form 10-K for more information on the accounting policies.
See the Consolidated Schedules of Investments as of December 31, 2017 and 2016 in our consolidated financial statements in Part II, Item 8 of this Form 10-K “Financial Statements and Supplementary Data” for more information on these investments, including a list of companies and type and amount of investments.10-K.
As part of the monitoring process, our Investment Adviser has developed risk assessment policies pursuant to which it regularly assesses the risk profile of each of our debt investments and rates each of them based on the following categories, which we refer to as “Internal Risk Ratings”:

Table. Pursuant to these risk policies, an Internal Risk Rating of Contents1 – 5, which are defined below, is assigned to each debt investment in our portfolio. Key drivers of internal risk ratings include financial metrics, financial covenants, liquidity and enterprise value coverage.

Internal Risk Ratings Definitions
RatingDefinition
1
Performing—Low Risk:Borrower is operating more than 10% ahead ofabove expectations, and the base case.
trends and risk factors are generally favorable.
2
Performing—Stable Risk:Borrower is operating within 10%generally as expected or at an acceptable level of performance. The level of risk to our initial cost bases is similar to the base case (above or below).risk to our initial cost basis at the time of origination. This is the initial risk rating assigned to all new borrowers.
3
Performing—Management Notice:Borrower is operating more than 10% below expectations and level of risk to our cost basis has increased since the base case. A financial covenant defaulttime of
origination. The borrower may have occurred, butbe out of compliance with debt covenants. Payments are generally current although there is a lowmay be higher risk of payment default.
4
Watch List:Borrower is operating materially below expectations and the loan’s risk has increased materially since origination. In addition to the borrower being generally out of compliance with debt covenants, loan payments may be past due, but generally not by more than 20% below the base case120 days. It is anticipated that we may not recoup our initial cost basis and there ismay realize a high riskloss of covenant default, or it may have already occurred. Payments are current although subject to greater uncertainty, and there is moderate to high risk of payment default.
our initial cost basis upon exit.
5
Watch List—Possible Loss:Borrower is operating more than 30%substantially below expectations and the base case. At the current level of operations and financial condition, the borrower does not have the ability to service and ultimately repay or refinance all outstanding debt on current terms. Payment default is very likely or may have occurred. Loss of principal is possible.
6
Watch List—Probable Loss: Borrower is operating more than 40% below the base case, and at the current level of operations and financial condition, the borrower does not have the ability to service and ultimately repay or refinance all outstanding debt on current terms. Payment default is very likely or may have already occurred. Additionally, the prospects for improvement in the borrower’s situation are sufficiently negative that impairment of someloan’s risk has increased substantially since origination. Most or all principalof the debt covenants are out of compliance and payments are substantially delinquent. It is probable.
anticipated that we will not recoup our initial cost basis and may realize a substantial loss of our initial cost basis upon exit.
Our Investment Adviser’s risk rating model is based on evaluating portfolio company performance in comparison to the base case when considering certain credit metrics including, but not limited to, adjusted EBITDA and net senior leverage as well as specific events including, but not limited to, default and impairment.
Our Investment Adviser monitors and, when appropriate, changes the investmentrisk ratings assigned to each debt investment in our portfolio. In connection with our quarterly valuation process, ourOur Investment Adviser reviews our investment ratings on a regular basis.in connection with our quarterly valuation process. The followingbelow table summarizes the Internal Risk Ratings assigned as of December 31, 20172021 and 2016:2020.
62

December 31, 2017 December 31, 2016 December 31, 2021December 31, 2020
(dollar amounts in millions)Fair Value % of Fair Value Fair Value % of Fair Value(dollar amounts in millions)Fair Value% of Fair ValueFair Value% of Fair Value
Internal Risk Rating 1$73.7
 4.15% $59.3
 4.52%Internal Risk Rating 1$3.8 0.2 %$19.1 1.3 %
Internal Risk Rating 21,399.6
 78.74
 1,055.7
 80.50
Internal Risk Rating 21,205.5 76.6 1,047.5 69.4 
Internal Risk Rating 3170.2
 9.57
 100.9
 7.70
Internal Risk Rating 3299.5 19.0 361.1 23.9 
Internal Risk Rating 4103.3
 5.81
 75.7
 5.77
Internal Risk Rating 427.6 1.8 48.1 3.2 
Internal Risk Rating 530.7
 1.73
 12.2
 0.93
Internal Risk Rating 537.5 2.4 32.8 2.2 
Internal Risk Rating 6
 
 7.6
 0.58
Total$1,777.5
 100.00% $1,311.4
 100.00%Total$1,573.9 100.0 %$1,508.6 100.0 %
As of December 31, 20172021 and 2016,2020, the weighted average Internal Risk Rating of our debt investment portfolio was 2.2.2.3 and 2.4, respectively. As of December 31, 20172021 and 2016, 102020, two and 8six of our debt investments with an aggregate fair value of $134.0$65.1 million and $95.5$80.9 million, respectively, were assigned an Internal Risk Rating of 4-6.4-5. As of December 31, 20172021 and December 31, 2016, one2020, five and five first lien debt investmentinvestments in the portfolio with a fair value of $19.5$76.6 million and $7.6$58.1 million, respectively, waswere on non-accrual status, which represented approximately 1.10%4.0% and 0.58%3.2%, respectively, of total first and second lien investments at fair value. The remaining first and second lien debt investments were performing and current on their interest payments as of December 31, 20172021 and 2016.2020. 
DuringSee the year endedConsolidated Schedules of Investments as of December 31, 2017, three2021 and 2020, in our consolidated financial statements in Part II, Item 8 of this Form 10-K “Financial Statements and Supplementary Data” for more information on our investments, with fair valueincluding a list of $45.9 million were downgraded to an Internal Risk Ratingcompanies and type and amount of 4 due to changes in financial condition and performance of the respective portfolio companies, one of which with fair value of $13.8 million was subsequently upgraded to an Internal Risk Rating of 2 due to a repayment in full. The remainder of the net increase in the aggregate fair value of debt investments assigned an Internal Risk Rating of 4-6 was primarily a result of the NFIC Acquisition and the transfer of nine overlapping debt investments with fair value of approximately $28.4 million into our debt investment portfolio from NFIC, one new investment with fair value of approximately $3.9 million acquired from NFIC, and, to a lesser extent, general market movements, as well as the restructuring of TwentyEighty, Inc., which occurred in the first quarter of 2017 and resulted in the upgrades of the new Term Loan A to an Internal Risk Rating of 2 and new Term Loan B to an Internal Risk Rating of 3. One investment with fair value of $7.1 million was sold.

investments.

CONSOLIDATED RESULTS OF OPERATIONS
For the years ended December 31, 2017, 20162021, 2020 and 20152019
The net increase or decrease in net assets from operations may vary substantially from period to period as a result of various factors, including the recognition of realized gains and losses and net change in unrealized appreciation and depreciation. As a result, quarterly comparisons may not be meaningful.
Investment Income
Investment income for the years ended December 31, 2017, 20162021, 2020 and 2015,2019, was as follows:
For the years ended December 31, For the years ended December 31,
2017 2016 2015 202120202019
Investment income:     Investment income:
First Lien Debt$119,222
 $83,713
 $45,654
First Lien Debt$108,345 $125,958 $168,750 
Second Lien Debt26,057
 23,190
 15,357
Second Lien Debt29,189 29,851 24,203 
Structured Finance Obligations
 887
 8,160
Equity Investments95
 13
 12
Equity Investments3,640 1,978 63 
Investment Fund19,453
 3,140
 
Investment FundsInvestment Funds30,064 24,277 27,931 
Cash174
 28
 7
Cash— 54 351 
Total investment income$165,001
 $110,971
 $69,190
Total investment income$171,238 $182,118 $221,298 
The increasedecrease in investment income for the year ended December 31, 20172021 from the comparable period in 20162020 was primarily driven by our deployment of capital, increasing investeda lower average investment balance, (including as a result of the NFIC Acquisition), increased fees and otherpartially offset by higher dividend income from syndications, amendments and prepayments, and increased interest and dividends from Credit Fund. Thethe Investment Funds. As of December 31, 2021, the size of our portfolio increased to $1,971,012$1,957,553 from $1,922,966 as of December 31, 2017 from $1,429,981 as of December 31, 20162020 at amortized cost, and total principal amount of investments outstanding increased to $2,000,315 as of December 31, 2017 from $1,467,133 as of December 31, 2016. The increase in interest income was also due to the increase in the weighted average yield, primarily due to the increase in LIBOR.cost. As of December 31, 2017,2021, the weighted average yield of our first and second lien debt increased to 8.86%7.68% from 8.19%7.57% as of December 31, 2016,2020, on amortized cost.cost, primarily due to new fundings being originated at a higher weighted average yield than the yield of positions that repaid or were sold.
The increasedecrease in investment income for the year ended December 31, 20162020 from the comparable period in 20152019 was primarily driven by our deploymentthe impact of capitalaverage LIBOR, lower average investment balance, and increasing invested balance.the impact of loans on non-accrual status. The size of our portfolio increaseddecreased to $1,429,981$1,922,966 as of December 31, 20162020 from $1,079,720$2,201,451 as of December 31, 2015,2019, at amortized cost, and total principal amount of investments outstanding increased to $1,467,133 as of December 31, 2016 from $1,142,364 as of December 31, 2015. The increase in interest income was also due to the increase in the weighted average yield.cost. As of December 31, 2016,2020, the weighted average yield of our first and second lien debt increaseddecreased to 8.19%7.57% from 7.93%8.22% as of December 31, 2015,2019, on amortized cost.cost, primarily due to the decrease in LIBOR.
63


Table of Contents
Interest income on our first and second lien debt investments is dependent on the composition and credit quality of the portfolio. Generally, we expect the portfolio to generate predictable quarterly interest income based on the terms stated in each loan’s credit agreement. As of December 31, 2017, one2021 and 2020, five and five first lien debt investmentinvestments in the portfolio was non-performing. Thewere on non-accrual with the fair value of the loan in the portfolio on non-accrual status was $19,487,$76,551 and $58,136, which represents approximately 0.99%4.0% and 3.2% of total investments at fair value.value, respectively. The remaining first and second lien debt investments were performing and current on their interest payments as of December 31, 20172021 and for the year then ended. As of December 31, 2016, one first lien debt investment in the portfolio was non-performing. The fair value of the loan in the portfolio on non-accrual status was $7,628, which represents approximately 0.54% of total investments at fair value. The remaining first and second lien debt investments were performing and current on their interest payments as of December 31, 2016 and for the year then ended. As of December 31, 2015 and for the year then ended, all of our first and second lien debt investments were performing and current on their interest payments.2020.
Net investment income (loss) for the years ended December 31, 2017, 20162021, 2020 and 20152019 was as follows:
 For the years ended December 31,
 2017 2016 2015
Total investment income$165,001
 $110,971
 $69,190
Net expenses(72,850) (51,350) (33,666)
Net investment income (loss)$92,151
 $59,621
 $35,524

Table of Contents

 For the years ended December 31,
 202120202019
Total investment income$171,238 $182,118 $221,298 
Net expenses (including Excise tax expense)(84,387)(93,311)(113,633)
Net investment income (loss)$86,851 $88,807 $107,665 
Expenses
For the years ended December 31, For the years ended December 31,
2017 2016 2015 202120202019
Base management fees$25,254
 $18,539
 $13,361
Base management fees$28,343 $28,648 $31,316 
Incentive fees21,084
 14,905
 8,881
Incentive fees17,680 18,555 22,872 
Professional fees2,895
 2,103
 1,845
Professional fees3,165 3,082 2,745 
Administrative service fees661
 703
 595
Administrative service fees1,338 679 539 
Interest expense24,510
 16,462
 9,582
Interest expense28,829 35,820 50,587 
Credit facility fees1,983
 2,573
 1,898
Credit facility fees1,924 3,761 3,079 
Directors’ fees and expenses443
 553
 419
Directors’ fees and expenses561 398 353 
Other general and administrative1,683
 1,616
 1,539
Other general and administrative1,765 1,795 1,738 
Excise tax expense264
 76
 
Excise tax expense782 573 404 
Waiver of base management fees(5,927) (6,180) (4,454)
Net expenses$72,850
 $51,350
 $33,666
Net expenses$84,387 $93,311 $113,633 
Interest expense and credit facility fees for the years ended December 31, 2017, 20162021, 2020 and 20152019 were comprised of the following:
For the years ended December 31, For the years ended December 31,
2017 2016 2015 202120202019
Interest expense$24,510
 $16,462
 $9,582
Interest expense$28,829 $35,820 $50,587 
Facility unused commitment fee1,117
 1,253
 847
Facility unused commitment fee1,161 1,766 1,263 
Amortization of deferred financing costs745
 1,213
 945
Amortization of deferred financing costs763 1,886 1,618 
Other fees121
 107
 106
Other fees— 109 198 
Total interest expense and credit facility fees$26,493
 $19,035
 $11,480
Total interest expense and credit facility fees$30,753 $39,581 $53,666 
Cash paid for interest expense$22,519
 $15,267
 $8,083
Cash paid for interest expense$29,355 $33,149 $49,981 
Average principal debt outstandingAverage principal debt outstanding$1,021,326 $1,111,397 $1,125,547 
Weighted average interest rateWeighted average interest rate2.76 %3.15 %4.41 %
The increasedecrease in interest expense for the year ended December 31, 20172021 compared to the comparable period in 20162020 was primarily driven by increased drawings under the Facilities related to increased deployment of capital for investments. For the year ended December 31, 2017, thelower weighted average interest rate increased to 3.32% from 2.81% for the comparable period in 2016,rates and lower average principal debt outstanding increased to $728,144 from $580,734 for the comparable period in 2016.
outstanding. The increasedecrease in interest expense for the year ended December 31, 20162020 compared to the comparable period in 20152019 was driven by increased usagelower LIBOR.
64


Table of Contents
Below is a summary of the Facilities related to increased deployment of capital to investments,base management fees and additional debt issued throughincentive fees incurred during the securitization in the form of the 2015-1 Notes (see Note 7 to the consolidated financial statements in Part II, Item 8 of this Form 10-K for more information). For the yearyears ended December 31, 2016, the average interest rate increased to 2.81% from 2.31% for the comparable period in 2015,2021, 2020 and average principal debt outstanding increased to $580,734 from $406,638 for the comparable period in 2015.2019:
For the years ended December 31,
202120202019
Base management fees$28,343 $28,648 $31,316 
Incentive fees on pre-incentive fee net investment income17,680 18,555 22,872 
Realized capital gains incentive fees— — — 
Accrued capital gains incentive fees— — — 
Total capital gains incentive fees— — — 
Total incentive fees17,680 18,555 22,872 
Total base management fees and incentive fees$46,023 $47,203 $54,188 
The increasedecrease in base management fees (and related waiver of base management fees, which terminated on September 30, 2017) and incentive fees related to pre-incentive fee net investment income for the year ended December 31, 20172021 from the comparable period in 2016 and2020 was driven by lower average fair value of investments during the year. The decrease in incentive fees for the year ended December 31, 20162021 from the comparable period in 2015 were2020 was driven by our deploymentlower pre-incentive fee net investment income. The decrease in base management fees for the year ended December 31, 2020 from the comparable period in 2019 was driven by lower average fair value of capital and our increasing invested balance. investments. The decrease in incentive fees for the year ended December 31, 2020 from the comparable period in 2019 was driven by lower pre-incentive fee net investment income.
For the years ended December 31, 2017, 20162021, 2020 and 2015, base management fees were $19,327, $12,359 and $8,907, respectively (net of waiver of $5,927, $6,180 and $4,454, respectively); incentive fees related to pre-incentive fee net investment income were $21,084, $14,905 and $8,881, respectively, and there were no incentive fees related to realized capital gains. For the years ended December 31, 2017, 2016 and 2015,2019, we recorded no accrued capital gains incentive fees based upon our cumulative net realized and unrealized appreciation (depreciation) as of December 31, 2017, 20162021, 2020 and 2015,2019, respectively. The accrual for any capital gains incentive fee under accounting principles generally accepted in the United States (“USU.S. GAAP”) in a given period may result in an additional expense if such cumulative amount is greater than in the prior period or a reduction of previously recorded expense if such cumulative amount is less than in the prior period. If such cumulative amount is negative, then there is no accrual. See Note 4 to the consolidated financial statements included in Part II, Item 8 of this Form 10-K for more information on our incentive and base management fees.

Table of Contents

Professional fees include legal, rating agencies, audit, tax, valuation, technology and other professional fees incurred related to the management of us. Administrative service fees represent fees paid to the Administrator for our allocable portion of overhead and other expenses incurred by the Administrator in performing its obligations under the administration agreement, including our allocable portion of the cost of certain of our executive officers and their respective staff. Other general and administrative expenses include insurance, filing, research, subscriptions and other costs. The increase in professional fees for the year ended December 31, 2017 from the comparable period in 2016 was driven by an increase in non-recurring professional fees related to the NFIC Acquisition.
Net Realized Gain (Loss) and Net Change in Unrealized Appreciation (Depreciation) on Investments
During the years ended December 31, 2017, 20162021, 2020 and 2015,2019, we had realized gains on 15, 10,34, 9, and 8,15 investments, respectively, totaling approximately $684, $864,$19,381, $1,473, and $1,622,$14,719, respectively, which was offset by realized losses on 12, 14,9, 20, and 6,13 investments, respectively, totaling approximately $12,376, $10,508,$343, $59,946, and $458,$53,062, respectively. During the years ended December 31, 2017, 20162021, 2020 and 2015,2019, we had a change in unrealized appreciation on 64, 104,110, 78, and 4891 investments, respectively, totaling approximately $38,290, $41,130,$71,264, $65,851, and $8,597,$70,167, respectively, which was offset by a change in unrealized depreciation on 71, 24,76, 97, and 71 investments, respectively, totaling approximately $34,549, $21,298,$18,583, $85,507, and $26,612,$76,220, respectively. In particular, effective January 31, 2017, TwentyEighty,
During October 2020, Direct Travel, Inc. (fka Miller Heiman, Inc.("Direct Travel") completed a restructuring whereby the lenders received the majority of the equity in Direct Travel, but maintained the principal balance in the existing debt. As part of the transaction, the lenders also provided a delayed draw term loan facility to support ongoing liquidity of the business. As part of the restructuring, we received an approximate 9% ownership stake in Direct Travel.

During October 2020, Central Security Group, Inc. completed a restructuring whereby a portion of the first lien debt held by us was convertedexchanged into new term loans andcommon equity. As a result, $10,943$8,566 of unrealized depreciation was reversed and we
realized a loss of $8,562 during the year ended December 31, 2020.
During April 2019, SolAero Technologies Corp. ("SolAero") completed a restructuring whereby a portion of the first lien debt held by us was exchanged into common equity. As a result, $9,460 of unrealized depreciation was reversed and we realized a loss of $7,738 on the investment$9,102 during the year ended December 31, 2017.2019. On December 31, 2019, we wrote off our remaining balance in the Product Quest Manufacturing, LLC ("Product Quest") first lien/last out, given our expectation of zero recovery.
65


Table of Contents
As a result, $32,270 of unrealized depreciation was reversed and we realized a loss of $32,270 during the year ended December 31, 2019. Additionally, during October 2019, we exited our equity investment in Twenty-Eighty, Inc. ("Twenty-Eighty"). As a result, $4,391 of unrealized appreciation was reversed and we realized a gain of $7,990 during the year ended December 31, 2019.
Net realized gain (loss) and net change in unrealized appreciation (depreciation) for the years ended December 31, 2021, 2020 and 2019 were as follows:
 For the years ended December 31,
 202120202019
Net realized gain (loss) on investments$19,038 $(58,473)$(38,376)
Net change in unrealized appreciation (depreciation) on investments52,681 (19,656)(6,053)
Net realized gain (loss) and net change in unrealized appreciation (depreciation) on investments$71,719 $(78,129)$(44,429)
Net realized gain (loss) and net change in unrealized appreciation (depreciation) by the type of investments for the years ended December 31, 2017, 20162021, 2020 and 20152019 were as follows:
 For the years ended December 31,
 2017 2016 2015
Net realized gain (loss) on investments$(11,692) $(9,644) $1,164
Net change in unrealized appreciation (depreciation) on investments3,741
 19,832
 (18,015)
Net realized gain (loss) and net change in unrealized appreciation (depreciation) on investments$(7,951) $10,188
 $(16,851)
Net realized gain (loss) and net change in unrealized appreciation (depreciation) by the type of investments for the years ended December 31, 2017, 2016 and 2015 were as follows:
 For the years ended December 31, For the years ended December 31,
 2017 2016 2015 202120202019
Type Net realized gain (loss) Net change in unrealized appreciation (depreciation) Net realized gain (loss) Net change in unrealized appreciation (depreciation) Net realized gain (loss) Net change in unrealized appreciation (depreciation)TypeNet realized gain (loss)Net change in unrealized appreciation (depreciation)Net realized gain (loss)Net change in unrealized appreciation (depreciation)Net realized gain (loss)Net change in unrealized appreciation (depreciation)
First Lien Debt $(8,240) $(5,277) $383
 $46
 $208
 $(3,160)First Lien Debt$2,413 $34,383 $(58,766)$(8,557)$(52,633)$4,894 
Second Lien Debt (360) 4,442
 275
 5,216
 
 (2,925)Second Lien Debt(125)13,677 (228)(13,965)— 1,003 
Structured Finance Obligations (3,092) 4,023
 (10,302) 11,105
 956
 (12,139)
Equity Investments 
 2,560
 
 1,193
 
 209
Equity Investments16,750 2,845 522 1,697 14,257 (7,751)
Investment Fund 
 (2,007) 
 2,272
 
 
Investment FundsInvestment Funds— 1,813 — (3,104)— (4,199)
Total $(11,692) $3,741
 $(9,644) $19,832
 $1,164
 $(18,015)Total$19,038 $52,718 $(58,472)$(23,929)$(38,376)$(6,053)
Net change in unrealized appreciation in our investments for the year ended December 31, 20172021 compared to the comparable period in 20162020 was primarily due to changesdriven by improving credit fundamentals and tightening market yields in various inputs utilized under our valuation methodology, including, but not limited to, market spreads, leverage multiples and borrower ratings, and the impact of exits.2021. Net change in unrealized depreciation in our investments for the year ended December 31, 20162020 compared to the comparable period in 20152019 was primarily duedriven by unrealized depreciation related to a widening spread environment duringinvestments more heavily impacted by the last six monthsCOVID-19 pandemic, combined with higher market yields. Net change in unrealized appreciation (depreciation) is also driven by changes in other inputs utilized under our valuation methodology, including, but not limited to, enterprise value multiples, borrower leverage multiples and borrower ratings, and the impact of the year.exits.
MIDDLE MARKET CREDIT FUND, LLC
Overview
On February 29, 2016, wethe Company and Credit Partners entered into an amended and restated limited liability company agreement, which was subsequently amended and restated on June 24, 2016 and February 22, 2021 (as amended, “the Limitedthe “Limited Liability Company Agreement”) to

Table of Contents

co-manage Credit Fund, an unconsolidateda Delaware limited liability company.company that is not consolidated in the Company’s consolidated financial statements. Credit Fund primarily invests in first lien loans of middle market companies. Credit Fund is managed by a six-member board of managers, on which wethe Company and Credit Partners each have equal representation. Establishing a quorum for Credit Fund’s board of managers requires at least four members to be present at a meeting, including at least two of ourthe Company’s representatives and two of Credit Partners’ representatives. WeThe Company and Credit Partners each have 50% economic ownership of Credit Fund and have commitments to fund, from time to time, capital of up to $400,000$250,000 each. Funding of such commitments generally requires the approval of the board of Credit Fund, including the board members appointed by us.the Company. By virtue of its membership interest, the Company and Credit Partners each indirectly bear an allocable share of all expenses and other obligations of Credit Fund.
Together with Credit Partners, we co-investthe Company co-invests through Credit Fund. Investment opportunities for Credit Fund are sourced primarily by usthe Company and ourits affiliates. Portfolio and investment decisions with respect to Credit Fund must be unanimously approved by a quorum of Credit Fund’s investment committee consisting of an equal number of representatives of usthe Company and Credit Partners. Therefore, although we ownthe Company owns more than 25% of the voting securities of Credit Fund, we dothe Company does not believe that we haveit has control over Credit Fund (other than for purposes of the Investment Company
66


Table of Contents
Act). Middle Market Credit Fund SPV, LLC (the “Credit(“Credit Fund Sub”) and, MMCF CLO 2017-1 LLC (the “2017-1 Issuer”), MMCF CLO 2019-2, LLC (the "2019-2 Issuer") and MMCF Warehouse II, LLC (“Credit Fund Warehouse II”), each a Delaware limited liability company, were formed on April 5, 2016 and October 6, 2017, November 26, 2018 and August 16, 2019, respectively. Credit Fund Sub, the 2019-2 Issuer, and 2017-1 IssuerCredit Fund Warehouse II are wholly owned subsidiaries of Credit Fund and are consolidated in Credit Fund’s consolidated financial statements commencing from the date of their respective formations. In December 2020, the 2017-1 Notes, as defined below, were redeemed in full and repaid in full. In August 2021, the 2019-2 Notes, as defined below, were redeemed and repaid in full. Credit Fund Sub and the 2017-1 IssuerCredit Fund Warehouse II primarily invest in first lien loans of middle market companies. Credit Fund and its wholly owned subsidiaries follow the same Internal Risk Rating systemSystem as us.the Company. Refer to “Debt” below for discussions regarding the credit facilities entered into and the notes issued by such wholly-owned subsidiaries.
Credit Fund, wethe Company and Credit Partners entered into an administration agreement with CGCA,Carlyle Global Credit Administration L.L.C., the administrative agent of Credit Fund (in such capacity, the “Administrative“Credit Fund Administrative Agent”), pursuant to which the Credit Fund Administrative Agent is delegated certain administrative and non-discretionary functions, is authorized to enter into sub-administration agreements at ourthe expense of Credit Fund with the approval of the board of managers of Credit Fund, and is reimbursed by Credit Fund for its costs and expenses and Credit Fund’s allocable portion of overhead incurred by the Credit Fund Administrative Agent in performing its obligations thereunder.
Selected Financial Data
Since inception of Credit Fund and through December 31, 20172021 and 2016,2020, the Company and Credit Partners each made capital contributions of $1,000$1 and $1 in members’ equity, respectively, and $86,500$216,000 and $35,000, respectively,$216,000 in subordinated loans, respectively, to Credit Fund. On May 25, 2021, the Company and Credit Partners received an aggregate return of capital on the subordinated loans of $46,000, of which the Company received $23,000. Below is certain summarized consolidated information for Credit Fund as of December 31, 2021 and 2020.
As of December 31,
20212020
ASSETS
Investments, at fair value (amortized cost of $940,092 and $1,080,538, respectively)$926,959 $1,056,381 
Cash and cash equivalents (1)
54,041 119,796 
Other assets7,698 7,553 
Total assets$988,698 $1,183,730 
LIABILITIES AND MEMBERS’ EQUITY
Secured borrowings$600,651 $514,261 
Notes payable, net of unamortized debt issuance costs of $0 and $1,559, respectively)— 253,933 
Other liabilities19,828 15,543 
Subordinated loans and members’ equity (2)
368,219 399,993 
Total liabilities and members’ equity$988,698 $1,183,730 
(1) As of December 31, 20172021 and 2016,2020, $10,816 and $83,574, respectively, of Credit Fund had net borrowings of $85,750Fund’s cash and $62,384, respectively, in mezzanine loans under a revolving credit facility with the Company (the “Credit Fund Facility”).cash equivalents was restricted.
(2) As of December 31, 20172021 and 2016, Credit Fund had2020, the fair value of the Company's ownership interest in the subordinated loans and members’ capitalmembers' equity was $184,141 and $205,891, respectively.
67


Table of $173,532 and $74,547, respectively. As of December 31, 2017 and 2016, the Company’s ownership interest in such subordinated loans and members’ capital was $86,766 and $37,273, respectively, and in such mezzanine loans was $85,750 and $62,384, respectively.Contents
As of December 31, 2017 and 2016, Credit Fund held cash and cash equivalents totaling $19,502 and $6,103, respectively.
As of December 31, 2017 and 2016, Credit Fund had total investments at fair value of $984,773 and $437,829, respectively, which was comprised of first lien senior secured loans and second lien senior secured loans to 51 and 28 portfolio companies, respectively. As of December 31, 2017 and 2016, no loans in Credit Fund’s portfolio were on non-accrual status or contained PIK provisions. All investments in the portfolio were floating rate debt investments with interest rate floors. The portfolio companies in Credit Fund are U.S. middle market companies in industries similar to those in which the Company may invest directly. Additionally, as of December 31, 2017 and 2016, Credit Fund had commitments to fund various undrawn revolvers and delayed draw investments to its portfolio companies totaling $72,458 and $30,361, respectively.
For the Years Ended December 31,
20212020
Total investment income$68,397 $83,476 
Expenses
Interest and credit facility expenses21,763 40,238 
Other expenses1,992 2,034 
Total expenses23,755 42,272 
Net investment income (loss)44,642 41,204 
Net realized gain (loss) on investments(1,440)— 
Net change in unrealized appreciation (depreciation) on investments11,024 (12,839)
Net increase in members’ equity resulting from operations$54,226 $28,365 
Below is a summary of Credit Fund’s portfolio, followed by a listing of the loans in Credit Fund’s portfolio as of December 31, 20172021 and 2016:2020:
As of December 31,
 20212020
Senior secured loans (1)
$942,930 $1,084,491 
Weighted average yields of senior secured loans based on amortized cost (2)
6.04 %6.03 %
Weighted average yields of senior secured loans based on fair value (2)
6.09 %6.15 %
Number of portfolio companies in Credit Fund45 54 
Average amount per portfolio company (1)
$20,954 $20,083 
Number of loans on non-accrual status— — 
Fair value of loans on non-accrual status$— $— 
Percentage of loans at floating interest rates (3) (4)
100.0 %97.7 %
Percentage of loans at fixed interest rates (4)
— %2.3 %
Fair value of loans with PIK provisions$— $24,113 
Percentage of portfolio with PIK provisions (4)
— %2.3 %
 As of December 31,
2017
As of December 31,
2016
Senior secured loans (1)
$993,380
$439,086
Weighted average yields of senior secured loans based on amortized cost (2)
6.80%6.47%
Weighted average yields of senior secured loans based on fair value (2)
6.79%6.41%
Number of portfolio companies in Credit Fund51
28
Average amount per portfolio company (1)
$19,478
$15,682
(1)At par/principal amount.

(1)At par/principal amount.
Table of Contents

(2)(2)Weighted average yields include the effect of accretion of discounts and amortization of premiums and are based on interest rates as of December 31, 2017 and 2016. Weighted average yield on debt and income producing securities at fair value is computed as (a) the annual stated interest rate or yield earned plus the net annual amortization of OID and market discount earned on accruing debt included in such securities, divided by (b) total first lien and second lien debt at fair value included in such securities. Weighted average yield on debt and income producing securities at amortized cost is computed as (a) the annual stated interest rate or yield earned plus the net annual amortization of OID and market discount earned on accruing debt included in such securities, divided by (b) total first lien and second lien debt at amortized cost included in such securities. Actual yields earned over the life of each investment could differ materially from the yields presented above.


Table of Contents

Consolidated Schedule of Investments as of December 31, 2017
Investments (1)
Industry Interest Rate  
Maturity
Date
 
Par/
Principal
Amount
 
Amortized
Cost (5)
 
Fair
Value (6)
First Lien Debt (99.39% of fair value)           
Acrisure, LLC (2)(3)(4)(11)
Banking, Finance, Insurance & Real Estate L + 4.25% (1.00% Floor) 11/22/2023 $21,097
 $21,055
 $21,291
Advanced Instruments, LLC (2)(3)(4)(7)(10)(11)(13)
Healthcare & Pharmaceuticals L + 5.25% (1.00% Floor) 10/31/2022 11,910
 11,793
 11,910
Alpha Packaging Holdings, Inc. (2)(3)(4)(13)
Containers, Packaging & Glass L + 4.25% (1.00% Floor) 5/12/2020 16,860
 16,812
 16,860
AM Conservation Holding Corporation (2)(3)(4)(13)
Energy: Electricity L + 4.50% (1.00% Floor) 10/31/2022 38,700
 38,433
 38,553
AMS Finco, S.A.R.L. (Alexander Mann Solutions) (United Kingdom) (2)(3)(4)(11)(13)
Business Services L + 5.50% (1.00% Floor) 5/26/2024 24,875
 24,646
 24,875
Anaren, Inc. (2)(3)(4)
Telecommunications L + 4.50% (1.00% Floor) 2/18/2021 9,993
 9,971
 9,993
AQA Acquisition Holding, Inc. (2)(3)(4)(7)(10)(13)
High Tech Industries L + 4.50% (1.00% Floor) 5/24/2023 27,403
 27,288
 27,403
Big Ass Fans, LLC (2)(3)(4)(13)
Capital Equipment L + 4.25% (1.00% Floor) 5/21/2024 8,000
 7,964
 8,010
Borchers, Inc. (2)(3)(4)(7)(10)(13)
Chemicals, Plastics & Rubber L + 4.50% (1.00% Floor) 11/1/2024 15,748
 15,694
 15,665
Brooks Equipment Company, LLC (2)(3)(4)(13)
Construction & Building L + 5.00% (1.00% Floor) 8/29/2020 7,061
 7,045
 7,061
DBI Holding LLC (2)(3)(4)(11)(13)
Transportation: Cargo L + 5.25% (1.00% Floor) 8/1/2021 19,800
 19,659
 19,833
DecoPac, Inc. (2)(3)(4)(7)(10)(13)
Non-durable Consumer Goods L + 4.25% (1.00% Floor) 9/29/2024 13,414
 13,270
 13,415
Dent Wizard International Corporation (2)(3)(4)(11)
Automotive L + 4.75% (1.00% Floor) 4/7/2020 24,502
 24,382
 24,475
DTI Holdco, Inc. (2)(3)(4)(11)(13)
High Tech Industries L + 5.25% (1.00% Floor) 9/30/2023 19,750
 19,575
 19,663
EIP Merger Sub, LLC (Evolve IP) (2)(3)(4)(8)(11)(13)
Telecommunications L + 6.25% (1.00% Floor) 6/7/2022 22,663
 22,127
 22,153
EIP Merger Sub, LLC (Evolve IP) (2)(3)(9)(11)(13)
Telecommunications L + 6.25% (1.00% Floor) 6/7/2022 1,500
 1,462
 1,470
Empower Payments Acquisitions, Inc. (2)(3)(4)(13)
Media: Advertising, Printing & Publishing L + 5.50% (1.00% Floor) 11/30/2023 17,325
 17,018
 17,325
FCX Holdings Corp. (2)(3)(4)(11)
Capital Equipment L + 4.50% (1.00% Floor) 8/4/2020 18,491
 18,438
 18,512
Golden West Packaging Group LLC (2)(3)(4)(11)(13)
Containers, Packaging & Glass L + 5.25% (1.00% Floor) 6/20/2023 20,895
 20,709
 20,895
HMT Holding Inc. (2)(3)(4)(7)(10)(13)
Energy: Oil & Gas L + 4.50% (1.00% Floor) 11/17/2023 35,062
 34,387
 34,709
J.S. Held LLC (2)(3)(4)(7)(10)(13)
Banking, Finance, Insurance & Real Estate L + 5.50% (1.00% Floor) 9/27/2023 18,204
 18,018
 18,144
Jensen Hughes, Inc. (2)(3)(4)(7)(10)(11)(13)
Utilities: Electric L + 5.00% (1.00% Floor) 12/4/2021 20,963
 20,784
 20,963
Kestra Financial, Inc. (2)(3)(4)(13)
Banking, Finance, Insurance & Real Estate L + 5.25% (1.00% Floor) 6/24/2022 17,206
 17,009
 17,203
Mold-Rite Plastics, LLC (2)(3)(4)(11)
Chemicals, Plastics & Rubber L + 4.50% (1.00% Floor) 12/14/2021 15,000
 14,946
 14,993
MSHC, Inc. (2)(3)(4)(13)
Construction & Building L + 4.25% (1.00% Floor) 7/31/2023 10,000
 9,957
 10,032
North American Dental Management, LLC (2)(3)(4)(7)(10)(11)(13)
Healthcare & Pharmaceuticals L + 5.00% (1.00% Floor) 7/7/2023 23,978
 23,157
 23,577
North Haven CA Holdings, Inc. (CoAdvantage) (2)(3)(4)(7)(10)(13)
Business Services L + 4.50% (1.00% Floor) 10/2/2023 31,565
 31,237
 31,436
Odyssey Logistics & Technology Corporation (2)(3)(4)(11)(13)
Transportation: Cargo L + 4.25% (1.00% Floor) 10/12/2024 20,000
 19,906
 19,998
PAI Holdco, Inc. (Parts Authority) (2)(3)(4)(7)(10)(11)(13)
Automotive L + 4.75% (1.00% Floor) 12/30/2022 16,564
 16,459
 16,515
Paradigm Acquisition Corp. (2)(3)(4)(13)
Business Services L + 4.25% (1.00% Floor) 10/12/2024 23,500
 23,445
 23,554
Pasternack Enterprises, Inc. (Infinite RF) (2)(3)(4)(11)
Capital Equipment L + 5.00% (1.00% Floor) 5/27/2022 20,228
 20,134
 20,174
Premier Senior Marketing, LLC (2)(3)(4)(11)(13)
Banking, Finance, Insurance & Real Estate L + 5.00% (1.00% Floor) 7/1/2022 11,675
 11,606
 11,628
PSI Services LLC (2)(3)(4)(7)(10)(11)(13)
Business Services L + 5.00% (1.00% Floor) 1/20/2023 30,676
 30,171
 30,082
Q Holding Company (2)(3)(4)(13)
Automotive L + 5.00% (1.00% Floor) 12/18/2021 17,277
 17,227
 17,277
QW Holding Corporation (Quala) (2)(3)(4)(7)(10)(11)(13)
Environmental Industries L + 6.75% (1.00% Floor) 8/31/2022 11,453
 10,879
 10,933
Radiology Partners, Inc. (2)(3)(4)(7)(10)(12)
Healthcare & Pharmaceuticals L + 5.75% (1.00% Floor) 12/4/2023 25,793
 25,494
 25,642
Restaurant Technologies, Inc. (2)(3)(4)(11)(13)
Retail L + 4.75% (1.00% Floor) 11/23/2022 17,369
 17,241
 17,219
Sovos Brands Intermediate, Inc. (2)(3)(4)(7)(10)(13)
Beverage, Food & Tobacco L + 4.50% (1.00% Floor) 7/18/2024 21,568
 21,419
 21,633
Superion (fka Ramundsen Public Sector, LLC) (2)(3)(4)(13)
Sovereign & Public Finance L + 4.25% (1.00% Floor) 2/1/2024 3,970
 3,955
 4,000
Surgical Information Systems, LLC (2)(3)(4)(9)(11)(13)
High Tech Industries L + 5.00% (1.00% Floor) 4/24/2023 30,000
 29,728
 30,075

Table of Contents

Consolidated Schedule of Investments as of December 31, 2017
Investments (1)
Industry Interest Rate  
Maturity
Date
 
Par/
Principal
Amount
 
Amortized
Cost (5)
 
Fair
Value (6)
Systems Maintenance Services Holding, Inc. (2)(3)(4)(11)(13)
High Tech Industries L + 5.00% (1.00% Floor) 10/28/2023 $24,255
 $24,126
 $20,617
T2 Systems Canada, Inc. (2)(3)(4)
Transportation: Consumer L + 6.75% (1.00% Floor) 9/28/2022 2,673
 2,617
 2,634
T2 Systems, Inc. (2)(3)(4)(7)(10)(13)
Transportation: Consumer L + 6.75% (1.00% Floor) 9/28/2022 15,929
 15,577
 15,679
Teaching Strategies, LLC (2)(3)(4)(7)(10)(11)(13)
Media: Advertising, Printing & Publishing L + 4.75% (1.00% Floor) 2/27/2023 17,964
 17,803
 17,952
The Original Cakerie, Ltd. (Canada) (2)(3)(4)(7)(10)(11)
Beverage, Food & Tobacco L + 5.00% (1.00% Floor) 7/20/2021 6,939
 6,879
 6,922
The Original Cakerie, Co. (Canada) (2)(3)(11)(13)
Beverage, Food & Tobacco L + 5.50% (1.00% Floor) 7/20/2021 3,585
 3,572
 3,579
ThoughtWorks, Inc. (2)(3)(11)(13)
Business Services L + 4.50% (1.00% Floor) 10/12/2024 8,000
 7,980
 8,032
U.S. Acute Care Solutions, LLC (2)(3)(4)(13)
Healthcare & Pharmaceuticals L + 5.00% (1.00% Floor) 5/15/2021 32,030
 31,808
 31,537
U.S. TelePacific Holdings Corp. (2)(3)(4)(13)
Telecommunications L + 5.00% (1.00% Floor) 5/2/2023 29,850
 29,566
 28,581
Valicor Environmental Services, LLC (2)(3)(4)(7)(10)(11)(13)
Environmental Industries L + 5.00% (1.00% Floor) 6/1/2023 27,047
 26,576
 26,984
WIRB - Copernicus Group, Inc. (2)(3)(4)(13)
Healthcare & Pharmaceuticals L + 5.00% (1.00% Floor) 8/12/2022 14,838
 14,780
 14,838
WRE Holding Corp. (2)(3)(4)(7)(10)(11)(13)
Environmental Industries L + 4.75% (1.00% Floor) 1/3/2023 5,367
 5,283
 5,279
Zest Holdings, LLC (2)(3)(4)(11)
Durable Consumer Goods L + 4.25% (1.00% Floor) 8/16/2023 19,152
 19,107
 19,272
Zywave, Inc. (2)(3)(4)(7)(10)(13)
High Tech Industries L + 5.00% (1.00% Floor) 11/17/2022 17,663
 17,508
 17,663
First Lien Debt Total        $977,682
 $978,718
Second Lien Debt (0.61% of fair value)           
Paradigm Acquisition Corp. (2)(3)(12)(13)
Business Services L + 8.50% (1.00% Floor) 10/12/2025 $4,800
 $4,753
 $4,792
Superion, LLC (fka Ramundsen Public Sector, LLC) (2)(3)(13)
Sovereign & Public Finance L + 8.50% (1.00% Floor) 2/1/2025 200
 198
 202
Zywave, Inc. (2)(3)(13)
High Tech Industries L + 9.00% (1.00% Floor) 11/17/2023 1,050
 1,036
 1,061
Second Lien Debt Total        $5,987
 $6,055
Total Investments        $983,669
 $984,773
(1)Unless otherwise indicated, issuers of investments held by Credit Fund are domiciled in the United States. As of December 31, 2017, the geographical composition of investments as a percentage of fair value was 1.07% in Canada, 2.52% in the United Kingdom and 96.41% in the United States.
(2)Variable rate loans to the portfolio companies bear interest at a rate that may be determined by reference to either LIBOR or an alternate base rate (commonly based on the Federal Funds Rate or the U.S. Prime Rate (“P”)), which generally resets quarterly. For each such loan, Credit Fund has provided the interest rate in effect as of December 31, 2017. As of December 31, 2017, all of Credit Fund’s LIBOR loans were indexed to the 90-day LIBOR rate at 1.69%, except for those loans as indicated in Notes 11 and 12 below.
(3)Loan includes interest rate floor feature.
(4)Denotes that all or a portion of the assets are owned by Credit Fund Sub. Credit Fund Sub has entered into a revolving credit facility (the “Credit Fund Sub Facility”). The lenders of the Credit Fund Sub Facility have a first lien security interest in substantially all of the assets of Credit Fund Sub. Accordingly, such assets are not available to creditors of Credit Fund.
(5)Amortized cost represents original cost, including origination fees and upfront fees received that are deemed to be an adjustment to yield, adjusted for the accretion/amortization of discounts/premiums, as applicable, on debt investments using the effective interest method.
(6)
Fair value is determined in good faith by or under the direction of the board of managers of Credit Fund, pursuant to Credit Fund’s valuation policy, with the fair value of all investments determined using significant unobservable inputs which is substantially similar to the valuation policy of the Company provided in “—Critical Accounting Policies—Fair Value Measurements.”
(7)Denotes that all or a portion of the assets are owned by Credit Fund. Credit Fund has entered into the Credit Fund Facility. The lenders of the Credit Fund Facility have a first lien security interest in substantially all of the assets of Credit Fund. Accordingly, such assets are not available to creditors of Credit Fund Sub.
(8)Credit Fund receives less than the stated interest rate of this loan as a result of an agreement among lenders. The interest rate reduction is 1.25% on EIP Merger Sub, LLC (Evolve IP). Pursuant to the agreement among lenders in respect of this loan, this investment represents a first lien/first out loan, which has first priority ahead of the first lien/last out loan with respect to principal, interest and other payments.
(9)In addition to the interest earned based on the stated interest rate of this loan, which is the amount reflected in this schedule, Credit Fund is entitled to receive additional interest as a result of an agreement among lenders as follows: EIP Merger Sub, LLC (Evolve IP) (3.97%) and Surgical Information Systems, LLC (1.01%). Pursuant to the agreement among lenders in respect of these loan, these investments represent a first lien/last out loan, which has a secondary priority behind the first lien/first out loan with respect to principal, interest and other payments.

Table of Contents

(10)As of December 31, 2017, Credit Fund had the following unfunded commitments to fund delayed draw and revolving senior secured loans:
First Lien Debt – unfunded delayed draw and revolving term loans commitments Type Unused Fee Par/ Principal Amount Fair Value
Advanced Instruments, LLC Revolver 0.50% $1,333
 $
AQA Acquisition Holding, Inc. Revolver 0.50% 2,459
 
Borchers, Inc. Revolver 0.50% 1,935
 (9)
DecoPac, Inc. Revolver 0.50% 1,457
 
HMT Holding Inc. Revolver 0.50% 4,938
 (43)
Jensen Hughes, Inc. Delayed Draw 1.00% 1,180
 
Jensen Hughes, Inc. Revolver 0.50% 2,000
 
J.S. Held LLC Delayed Draw 1.00% 2,253
 (7)
North American Dental Management, LLC Delayed Draw 1.00% 13,354
 (134)
North American Dental Management, LLC Revolver 0.50% 2,727
 (27)
North Haven CA Holdings, Inc. (CoAdvantage) Revolver 0.50% 3,362
 (12)
PAI Holdco, Inc. (Parts Authority) Delayed Draw 1.00% 3,286
 (8)
PSI Services LLC Revolver 0.50% 302
 (6)
QW Holding Corporation (Quala) Delayed Draw 1.00% 7,515
 (171)
QW Holding Corporation (Quala) Revolver 0.50% 3,849
 (88)
Radiology Partners, Inc. Delayed Draw 1.00% 2,483
 (12)
Radiology Partners, Inc. Revolver 0.50% 1,725
 (9)
Sovos Brands Intermediate, Inc. Revolver 0.50% 3,378
 9
T2 Systems, Inc. Revolver 0.50% 1,173
 (17)
Teaching Strategies, LLC Revolver 0.50% 1,900
 (1)
The Original Cakerie, Ltd. (Canada) Revolver 0.50% 1,665
 (3)
Valicor Environmental Services, LLC Revolver 0.50% 2,838
 (6)
WRE Holding Corp. Delayed Draw 1.04% 3,435
 (32)
WRE Holding Corp. Revolver 0.50% 748
 (7)
Zywave, Inc. Revolver 0.50% 1,163
 
Total unfunded commitments     $72,458
 $(583)
(11)As of December 31, 2017, this LIBOR loan was indexed to the 30-day LIBOR rate at 1.56%.
(12)As of December 31, 2017, this LIBOR loan was indexed to the 180-day LIBOR rate at 1.84%.
(13)Denotes that all or a portion of the assets are owned by the 2017-1 Issuer and secure the notes issued in connection with a $399,900 term debt securitization completed by Credit Fund on December 19, 2017 (the “2017-1 Debt Securitization”). Accordingly, such assets are not available to creditors of Credit Fund or Credit Fund Sub.


Table of Contents

Consolidated Schedule of Investments as of December 31, 2016
Investments (1)Industry Interest Rate Maturity Date Par/ Principal Amount Amortized Cost (5) Fair Value (6)
First Lien Debt (99.31% of fair value)           
AM Conservation Holding Corporation (2) (3) (4)
Energy: Electricity L + 4.75% (1.00% Floor) 10/31/2022 $30,000
 $29,721
 $29,925
Datapipe, Inc. (2) (3) (4) (11)
Telecommunications L + 4.75% (1.00% Floor) 3/15/2019 9,750
 9,654
 9,764
Dimora Brands, Inc. (fka TK USA Enterprises, Inc.) (2) (3) (4) (11)
Construction & Building L + 4.50% (1.00% Floor) 4/4/2023 19,850
 19,580
 19,723
Diversitech Corporation (2) (4) (10) (11)
Capital Equipment P + 3.50% 11/19/2021 14,803
 14,617
 14,803
DTI Holdco, Inc. (2) (3) (4) (7)
High Tech Industries L + 5.25% (1.00% Floor) 9/30/2023 19,950
 19,751
 19,651
DYK Prime Acquisition LLC (2) (3) (4)
Chemicals, Plastics & Rubber L + 4.75% (1.00% Floor) 4/1/2022 5,775
 5,735
 5,775
EAG, Inc. (2) (3) (4) (11)
Business Services L + 4.25% (1.00% Floor) 7/28/2018 8,713
 8,686
 8,720
EIP Merger Sub, LLC (Evolve IP) (2) (3) (4) (8)
Telecommunications L + 6.25% (1.00% Floor) 6/7/2021 22,971
 22,323
 22,509
EIP Merger Sub, LLC (Evolve IP) (2) (3) (4) (9)
Telecommunications L + 6.25% (1.00% Floor) 6/7/2021 1,500
 1,455
 1,468
Empower Payments Acquisitions, Inc. (2) (3) (7)
Media: Advertising, Printing & Publishing L + 5.50% (1.00% Floor) 11/30/2023 17,500
 17,154
 17,279
Generation Brands Holdings, Inc. (2) (3) (4)
Durable Consumer Goods L + 5.00% (1.00% Floor) 6/10/2022 19,900
 19,712
 20,099
Jensen Hughes, Inc. (2) (3) (4) (10)
Utilities: Electric L + 5.00% (1.00% Floor) 12/4/2021 20,409
 20,188
 20,327
Kestra Financial, Inc. (2) (3) (4)
Banking, Finance, Insurance & Real Estate L + 5.25% (1.00% Floor) 6/24/2022 19,900
 19,632
 19,814
MSHC, Inc. (2) (3) (4) (10)
Construction & Building L + 5.00% (1.00% Floor) 7/19/2021 13,177
 13,062
 13,003
PAI Holdco, Inc. (Parts Authority) (2) (3) (4)
Automotive L + 4.75% (1.00% Floor) 12/30/2022 9,950
 9,886
 9,950
Pasternack Enterprises, Inc. (Infinite RF) (2) (3) (4)
Capital Equipment L + 5.00% (1.00% Floor) 5/27/2022 11,941
 11,844
 11,941
Q Holding Company (2) (3) (4)
Automotive L + 5.00% (1.00% Floor) 12/18/2021 13,964
 13,828
 13,941
QW Holding Corporation (Quala) (2) (3) (4) (7) (10)
Environmental Industries L + 6.75% (1.00% Floor) 8/31/2022 8,975
 8,413
 9,030
RelaDyne Inc. (2) (3) (4) (10)
Wholesale L + 5.25% (1.00% Floor) 7/22/2022 23,514
 23,117
 23,443
Restaurant Technologies, Inc. (2) (3) (4)
Retail L + 4.75% (1.00% Floor) 11/23/2022 14,000
 13,871
 13,969
Systems Maintenance Services Holding, Inc. (2) (3) (4)
High Tech Industries L + 5.00% (1.00% Floor) 10/30/2023 12,000
 11,885
 12,001
T2 Systems Canada, Inc. (2) (3) (4) (11)
Transportation: Consumer L + 6.75% (1.00% Floor) 9/28/2022 2,700
 2,635
 2,727
T2 Systems, Inc. (2) (3) (4) (10) (11)
Transportation: Consumer L + 6.75% (1.00% Floor) 9/28/2022 15,300
 14,888
 15,473
The Original Cakerie, Ltd. (Canada) (2) (3) (4) (10)
Beverage, Food & Tobacco L + 5.00% (1.00% Floor) 7/20/2021 7,009
 6,946
 7,009
The Original Cakerie, Co. (Canada) (2) (3) (4)
Beverage, Food & Tobacco L + 5.50% (1.00% Floor) 7/20/2021 3,621
 3,591
 3,621
U.S. Acute Care Solutions, LLC (2) (3) (4)
Health & Pharmaceuticals L + 5.00% (1.00% Floor) 5/15/2021 26,400
 26,154
 26,336
U.S. Anesthesia Partners, Inc. (2) (3) (4)
Health & Pharmaceuticals L + 5.00% (1.00% Floor) 12/31/2019 10,374
 10,275
 10,362
Vantage Specialty Chemicals, Inc. (2) (3) (4) (11)
Chemicals, Plastics & Rubber L + 4.50% (1.00% Floor) 2/5/2021 17,910
 17,786
 17,903
WIRB – Copernicus Group, Inc. (2) (3) (4)
Health & Pharmaceuticals L + 5.00% (1.00% Floor) 8/12/2022 7,980
 7,916
 8,050
Zest Holdings, LLC (2) (3) (4)
Durable Consumer Goods L + 4.75% (1.00% Floor) 8/16/2020 8,700
 8,658
 8,749
Zywave, Inc. (2) (3) (4) (7) (10)
High Tech Industries L + 5.00% (1.00% Floor) 11/17/2022 17,500
 17,315
 17,434
First Lien Debt Total        $430,278
 $434,799
Second Lien Debt (0.69% of fair value)           
Vantage Specialty Chemicals, Inc. (2) (3) (4) (11)
Chemicals, Plastics & Rubber L + 8.75% (1.00% Floor) 2/5/2022 $2,000
 $1,960
 $1,987
Zywave, Inc. (2) (3) (4)
High Tech Industries L + 9.00% (1.00% Floor) 11/17/2023 1,050
 1,034
 1,043
Second Lien Debt Total        $2,994
 $3,030
Total Investments        $433,272
 $437,829
(1)Unless otherwise indicated, issuers of investments held by Credit Fund are domiciled in the United States. As of December 31, 2016, the geographical composition of investments as a percentage of fair value was 2.43% in Canada and 97.57% in the United States.
(2)Variable rate loans to the portfolio companies bear interest at a rate that may be determined by reference to either LIBOR (“L”) or an alternate base rate (commonly based on the Federal Funds Rate or the U.S. Prime Rate (“P”)), which generally resets quarterly. For each such loan, Credit Fund has provided the interest rate in effect as of December 31, 2016. As of December 31, 2016, all of Credit Fund’s LIBOR loans were indexed to the 90-day LIBOR rate at 1.00%, except for those loans as indicated in Note 11 below, and the U.S. Prime Rate loan was indexed at 3.75%.
(3)Loan includes interest rate floor feature.
(4)Denotes that all or a portion of the assets are owned by Credit Fund Sub. Credit Fund Sub has entered into a revolving credit facility (the “Credit Fund Sub Facility”). The lenders of the Credit Fund Sub Facility have a first lien security interest in substantially all of the assets of Credit Fund Sub. Accordingly, such assets are not available to creditors of Credit Fund.

Table of Contents

(5)Amortized cost represents original cost, including origination fees and upfront fees received that are deemed to be an adjustment to yield, adjusted for the accretion/amortization of discounts/premiums, as applicable, on debt investments using the effective interest method.
(6)
Fair value is determined in good faith by or under the direction of the board of managers of Credit Fund, pursuant to Credit Fund’s valuation policy, which is substantially similar to the valuation policy of the Company provided in “—Critical Accounting Policies—Fair Value Measurements.”
(7)Denotes that all or a portion of the assets are owned by Credit Fund. Credit Fund has entered into the Credit Fund Facility. The lenders of the Credit Fund Facility have a first lien security interest in substantially all of the assets of Credit Fund. Accordingly, such assets are not available to creditors of Credit Fund Sub.
(8)Credit Fund receives less than the stated interest rate of this loan as a result of an agreement among lenders. The interest rate reduction is 1.25% on EIP Merger Sub, LLC (Evolve IP). Pursuant to the agreement among lenders in respect of this loan, this investment represents a first lien/first out loan, which has first priority ahead of the first lien/last out loan with respect to principal, interest and other payments.
(9)In addition to the interest earned based on the stated interest rate of this loan, which is the amount reflected in this schedule, Credit Fund is entitled to receive additional interest as a result of an agreement among lenders as follows: EIP Merger Sub, LLC (Evolve IP) (3.84%). Pursuant to the agreement among lenders in respect of this loan, this investment represents a first lien/last out loan, which has a secondary priority behind the first lien/first out loan with respect to principal, interest and other payments.
(10)As of December 31, 2016, Credit Fund had the following unfunded commitments to fund delayed draw and revolving senior secured loans:
First Lien Debt – unfunded delayed draw and revolving term loans commitments Type Unused Fee Par/ Principal Amount Fair Value
Diversitech Corporation Delayed Draw 1.00% $5,000
 $
Jensen Hughes, Inc. Revolver 0.50% 2,000
 (7)
Jensen Hughes, Inc. Delayed Draw 0.50% 1,461
 (5)
MSHC, Inc. Delayed Draw 1.50% 1,790
 (21)
QW Holding Corporation (Quala) Revolver 1.00% 5,086
 14
QW Holding Corporation (Quala) Delayed Draw 1.00% 5,918
 17
RelaDyne Inc. Revolver 0.50% 2,162
 (6)
RelaDyne Inc. Delayed Draw 0.50% 1,824
 (5)
T2 Systems, Inc. Revolver 1.00% 1,955
 20
The Original Cakerie, Ltd. (Canada) Revolver 0.50% 1,665
 
Zywave, Inc. Revolver 0.50% 1,500
 (5)
Total unfunded commitments     $30,361
 $2
(11)As of December 31, 2016, this LIBOR loan was indexed to the 30-day LIBOR rate at 0.77%.

Table of Contents

Below is certain summarized consolidated financial information for Credit Fund as of December 31, 20172021 and 2016, respectively.2020. Weighted average yield on debt and income producing securities at fair value is computed as (a) the annual stated interest rate or yield earned plus the net annual amortization of OID and market discount earned on accruing debt included in such securities, divided by (b) total first lien and second lien debt at fair value included in such securities. Weighted average yield on debt and income producing securities at amortized cost is computed as (a) the annual stated interest rate or yield earned plus the net annual amortization of OID and market discount earned on accruing debt included in such securities, divided by (b) total first lien and second lien debt at amortized cost included in such securities. Actual yields earned over the life of each investment could differ materially from the yields presented above.
(3)Floating rate debt investments are generally subject to interest rate floors.
(4)Percentages based on fair value.

68


Table of Contents
Consolidated Schedule of Investments as of December 31, 2021
Investments (1)
FootnotesIndustry
Reference Rate & Spread (2)
Interest 
Rate 
(2)
Maturity
Date
Par/
Principal
Amount
Amortized
Cost (4)
Fair
Value (5)
First Lien Debt (100.0% of fair value)
ACR Group Borrower, LLC^+(2)(3)(6)Aerospace & DefenseL + 4.25%5.50%3/31/2028$34,477 $33,913 $34,477 
Acrisure, LLC+#(2)(3)Banking, Finance, Insurance & Real EstateL + 3.50%3.78%2/13/202725,376 25,353 25,203 
Acrisure, LLC+(2)(3)Banking, Finance, Insurance & Real EstateL + 4.25%4.75%2/13/20276,700 6,650 6,687 
Analogic Corporation^+(2)(3)(6)Capital EquipmentL + 5.25%6.25%6/22/202419,796 19,781 19,587 
Anchor Packaging, Inc.+#(2)(3)Containers, Packaging & GlassL + 4.00%4.10%7/18/202624,472 24,385 24,215 
API Technologies Corp.+#(2)(3)Aerospace & DefenseL + 4.25%4.35%5/9/202614,625 14,575 14,251 
Aptean, Inc.+#(2)(3)SoftwareL + 4.25%4.35%4/23/202612,157 12,113 12,087 
Avalign Technologies, Inc.+#(2)(3)Healthcare & PharmaceuticalsL + 4.50%4.63%12/22/202514,443 14,354 14,320 
Avenu Holdings, LLC+(2)(3)Sovereign & Public FinanceL + 5.25%6.25%9/28/202423,350 23,350 23,350 
BMS Holdings III Corp.+(2)(3)Construction & BuildingL + 5.50%6.50%9/30/202611,244 11,143 11,071 
Chartis Holding, LLC+(2)(3)(6)Business ServicesL + 5.50%6.50%5/1/20256,964 6,964 6,964 
Chemical Computing Group ULC (Canada)^+(2)(3)(6)SoftwareL + 4.50%5.50%8/30/202413,912 13,480 13,845 
Chudy Group, LLC^+(2)(3)(6)Healthcare & PharmaceuticalsL + 5.75%6.75%6/30/202733,021 32,465 33,657 
Diligent Corporation^+(2)(3)(6)TelecommunicationsL + 6.25%7.25%8/4/20259,049 8,816 9,228 
Divisions Holding Corporation+#(2)(3)Business ServicesL + 4.75%5.50%5/27/202824,938 24,706 24,953 
DTI Holdco, Inc.+(2)(3)High Tech IndustriesL + 4.75%5.75%9/30/202318,495 18,442 18,237 
Eliassen Group, LLC+(2)(3)Business ServicesL + 4.50%4.60%11/5/202415,159 15,103 15,152 
EPS Nass Parent, Inc.^+(2)(3)(6)Utilities: ElectricL + 5.75%6.75%4/19/202832,846 32,169 32,507 
EvolveIP, LLC^+(2)(3)(6)TelecommunicationsL + 5.50%6.50%6/7/202540,196 40,126 39,973 
Exactech, Inc.+#(2)(3)Healthcare & PharmaceuticalsL + 3.75%4.75%2/14/202521,307 21,221 21,073 
Excel Fitness Holdings, Inc.+#(2)(3)Hotel, Gaming & LeisureL + 5.25%6.25%10/7/202524,500 24,336 24,500 
Frontline Technologies Holdings, LLC+(2)(3)SoftwareL + 5.25%6.25%9/18/202314,736 14,269 14,736 
GSM Acquisition Corp.^+(2)(3)(6)Hotel, Gaming & LeisureL + 5.00%6.00%11/16/202625,623 25,331 25,396 
Heartland Home Services, Inc+(2)(3)(6)Consumer ServicesL + 6.00%7.00%12/15/202617,664 17,664 17,735 
HMT Holding Inc.^+(2)(3)(6)Energy: Oil & GasL + 5.75%6.75%11/17/202332,484 32,245 31,086 
Integrity Marketing Acquisition, LLC^+(2)(3)(6)Banking, Finance, Insurance & Real EstateL + 5.50%6.25%8/27/202532,853 32,309 32,403 
Jensen Hughes, Inc.+(2)(3)(6)Utilities: ElectricL + 4.50%5.50%3/22/202434,392 34,347 33,395 
K2 Insurance Services, LLC+(2)(3)(6)Banking, Finance, Insurance & Real EstateL + 5.00%6.00%7/1/202612,929 12,929 12,906 
KAMC Holdings, Inc.+#(2)(3)Energy: ElectricityL + 4.00%4.18%8/14/202613,685 13,638 11,450 
KBP Investments, LLC+(2)(3)(6)Beverage, Food & TobaccoL + 5.00%5.75%5/25/202736,973 36,599 36,570 
Odyssey Logistics & Technology Corp.+#(2)(3)Transportation: CargoL + 4.00%5.00%10/12/20249,605 9,580 9,509 
Output Services Group^+(2)(3)Media: Advertising, Printing & PublishingL + 4.50%5.50%3/27/202419,222 19,194 16,467 
Premise Health Holding Corp.+#(2)(3)Healthcare & PharmaceuticalsL + 3.50%3.72%7/10/202513,445 13,409 13,419 
69


Table of Contents
Consolidated Schedule of Investments as of December 31, 2021
Investments (1)
FootnotesIndustry
Reference Rate & Spread (2)
Interest 
Rate 
(2)
Maturity
Date
Par/
Principal
Amount
Amortized
Cost (4)
Fair
Value (5)
Q Holding Company+#(2)(3)AutomotiveL + 5.00%6.00%12/31/2023$21,515 $21,421 $21,098 
QW Holding Corporation^+(2)(3)(6)Environmental IndustriesL + 6.25%7.25%8/31/202414,116 13,887 13,645 
Radiology Partners, Inc.+#(2)(3)Healthcare & PharmaceuticalsL + 4.25%4.36%7/9/202527,686 27,603 27,245 
RevSpring Inc.+#(2)(3)Media: Advertising, Printing & PublishingL + 4.25%4.47%10/11/202529,149 29,001 29,067 
Striper Buyer, LLC+(2)(3)Containers, Packaging & GlassL + 5.50%6.25%12/30/202614,850 14,720 14,850 
Turbo Buyer, Inc.+(2)(3)(6)AutomotiveL + 6.00%7.00%12/2/202513,960 13,960 13,661 
U.S. TelePacific Holdings Corp.+(2)(3)TelecommunicationsL + 5.50%6.50%5/2/20236,660 6,643 4,995 
USALCO, LLC+(2)(3)Chemicals, Plastics & RubberL + 6.00%7.00%10/19/202714,995 14,704 14,704 
VRC Companies, LLC^+(2)(3)(6)Business ServicesL + 5.50%6.25%6/29/202726,520 26,103 26,162 
Welocalize, Inc.+(2)(3)(6)Business ServicesL + 4.75%5.75%12/23/202434,201 33,868 33,444 
WRE Holding Corp.^+(2)(3)(6)Environmental IndustriesSOFR + 5.50%6.50%1/3/20258,740 8,724 8,584 
Yellowstone Buyer Acquisition, LLC+(2)(3)Consumer Goods: DurableL + 5.75%6.75%9/13/202739,900 39,135 39,095 
First Lien Debt Total$934,728 $926,959 
Equity Investments (0.00% of fair value)
DBI Holding, LLC^Transportation: Cargo2,961 $— $— 
DBI Holding, LLC^Transportation: Cargo13,996 5,364 — 
Equity Investments Total$5,364 $— 
Total Investments$940,092 $926,959 
^ Denotes that all or a portion of the assets are owned by Credit Fund. Credit Fund commenced operationshas entered into a revolving credit facility (the "Credit Fund Facility"). Accordingly, such assets are not available to creditors of Credit Fund Sub or Credit Fund Warehouse II.
+ Denotes that all or a portion of the assets are owned by Credit Fund Sub. Credit Fund Sub has entered into a revolving credit facility (the “Credit Fund Sub Facility”). The lenders of the Credit Fund Sub Facility have a first lien security interest in May 2016.substantially all of the assets of Credit Fund Sub. Accordingly, such assets are not available to creditors of Credit Fund or Credit Fund Warehouse II.
# Denotes that all or a portion of the assets are owned by the Credit Fund Warehouse II. Credit Fund Warehouse II has entered into a revolving credit facility (the "Credit Fund Warehouse II"). The lenders of the Credit Fund Warehouse II Facility have a first lien security interest in substantially all of the assets of the Credit Fund Warehouse II. Accordingly, such assets are not available to creditors of Credit Fund or Credit Fund Sub.
(1)Unless otherwise indicated, issuers of investments held by Credit Fund are domiciled in the United States. As of December 31, 2021, the geographical composition of investments as a percentage of fair value was 1.5% in Canada and 98.5% in the United States. Certain portfolio company investments are subject to contractual restrictions on sales.
(2)Variable rate loans to the portfolio companies bear interest at a rate that is determined by reference to either LIBOR or an alternate base rate (commonly based on the Federal Funds Rate or the U.S. Prime Rate), which generally resets quarterly. For each such loan, Credit Fund has indicated the reference rate used and provided the spread and the interest rate in effect as of December 31, 2021. As of December 31, 2021, the reference rates for Credit Fund's variable rate loans were the 30-day LIBOR at 0.10%, the 90-day LIBOR at 0.22% and the 180-day LIBOR at 0.33%.
(3)Loan includes interest rate floor feature, which is generally 1.00%.
(4)Amortized cost represents original cost, including origination fees and upfront fees received that are deemed to be an adjustment to yield, adjusted for the accretion/amortization of discounts/premiums, as applicable, on debt investments using the effective interest method.
(5)Fair value is determined in good faith by or under the direction of the board of managers of Credit Fund, pursuant to Credit Fund’s valuation policy, with the fair value of all investments determined using significant unobservable inputs, which is substantially similar to the valuation policy of the Company provided in Note 3, Fair Value Measurements, to the consolidated financial statements in Part II, Item 8 of this Form 10-K.
70


Table of Contents
 December 31, 2017December 31, 2016
Selected Consolidated Balance Sheet Information  
ASSETS  
Investments, at fair value (amortized cost of $983,669 and $433,272, respectively)$984,773
$437,829
Cash and other assets26,441
11,326
Total assets$1,011,214
$449,155
LIABILITIES AND MEMBERS’ EQUITY  
Secured borrowings$377,686
$248,540
2017-1 Notes payable, net of unamortized debt issuance costs of $2,051348,938

Mezzanine loans85,750
62,384
Other liabilities25,308
63,684
Subordinated loans and members’ equity173,532
74,547
Liabilities and members’ equity$1,011,214
$449,155
   
 For the years ended
 December 31, 2017December 31, 2016
Selected Consolidated Statement of Operations Information:  
Total investment income$49,504
$9,973
Expenses  
Interest and credit facility expenses29,191
5,410
Other expenses3,493
1,266
Total expenses32,684
6,676
Net investment income (loss)16,820
3,297
Net realized gain (loss) on investments17
41
Net change in unrealized appreciation (depreciation) on investments(3,453)4,557
Net increase (decrease) resulting from operations$13,384
$7,895
(6)As of December 31, 2021, Credit Fund and Credit Fund Sub had the following unfunded commitments to fund delayed draw and revolving senior secured loans:
First Lien Debt – unfunded delayed draw and revolving term loans commitmentsTypeUnused FeePar/ Principal AmountFair Value
ACR Group Borrower, LLCRevolver0.38 %$7,350 $— 
Analogic CorporationRevolver0.50 847 (9)
Chartis Holding, LLCRevolver0.50 2,183 — 
Chemical Computing Group ULC (Canada)Revolver0.50 873 (4)
Chudy Group, LLCDelayed Draw1.00 5,517 88 
Chudy Group, LLCRevolver0.50 1,379 22 
Diligent CorporationDelayed Draw1.00 1,653 26 
Diligent CorporationRevolver0.50 703 11 
EPS Nass Parent, Inc.Delayed Draw1.00 3,136 (29)
EPS Nass Parent, Inc.Revolver0.50 941 (9)
EvolveIP, LLCRevolver0.50 3,360 (17)
GSM Acquisition Corp.Delayed Draw1.00 4,313 (33)
Heartland Home Services, IncRevolver0.50 746 
HMT Holding Inc.Revolver0.50 6,173 (223)
Integrity Marketing Acquisition, LLCDelayed Draw— 7,000 (71)
Integrity Marketing Acquisition, LLCDelayed Draw1.00 4,453 (45)
Jensen Hughes, Inc.Revolver0.50 2,000 (55)
K2 Insurance Services, LLCRevolver0.50 1,170 (2)
KBP Investments, LLCDelayed Draw1.00 503 (5)
KBP Investments, LLCDelayed Draw1.00 2,415 (24)
QW Holding CorporationDelayed Draw1.00 9,338 (162)
QW Holding CorporationRevolver0.50 3,794 (66)
Turbo Buyer, Inc.Revolver0.50 933 (19)
VRC Companies, LLCDelayed Draw0.75 2,521 (30)
VRC Companies, LLCRevolver0.50 833 (10)
Welocalize, Inc.Revolver0.50 3,375 (64)
Welocalize, Inc.Revolver0.50 2,250 (43)
WRE Holding Corp.Revolver0.50 624 (10)
Total unfunded commitments$80,383 $(780)


71


Table of Contents
Consolidated Schedule of Investments as of December 31, 2020
Investments (1)
FootnotesIndustry
Reference Rate & Spread (2)
Interest 
Rate 
(2)
Maturity
Date
Par/
Principal
Amount
Amortized
Cost (4)
Fair
Value (5)
First Lien Debt (97.5% of fair value)
Acrisure, LLC\#(2)(3)Banking, Finance, Insurance & Real EstateL + 3.50%3.65%2/15/2027$25,634 $25,606 $25,104 
Alku, LLC+#(2)(3)Business ServicesL + 5.50%5.75%7/29/202623,666 23,466 23,512 
Alpha Packaging Holdings, Inc.+\(2)(3)Containers, Packaging & GlassL + 6.00%7.00%11/12/202116,378 16,378 16,378 
AmeriLife Holdings LLC#(2)(3)Banking, Finance, Insurance & Real EstateL + 4.00%4.15%3/18/20279,951 9,929 9,802 
Analogic Corporation^+(2)(3)(6)Capital EquipmentL + 5.25%6.25%6/22/202418,857 18,837 18,857 
Anchor Packaging, Inc.+#(2)(3)Containers, Packaging & GlassL + 4.00%4.15%7/18/202624,723 24,617 24,656 
API Technologies Corp.+\(2)(3)Aerospace & DefenseL + 4.25%4.49%5/9/202614,775 14,713 13,999 
Aptean, Inc.+\(2)(3)SoftwareL + 4.25%4.40%4/23/202612,281 12,227 12,077 
AQA Acquisition Holding, Inc.+\(2)(3)(6)High Tech IndustriesL + 4.25%5.25%5/24/202318,759 18,752 18,757 
Astra Acquisition Corp.+#(2)(3)SoftwareL + 5.50%6.50%3/1/202728,783 28,392 28,783 
Avalign Technologies, Inc.+\(2)(3)Healthcare & PharmaceuticalsL + 4.50%4.73%12/22/202514,592 14,481 14,334 
Big Ass Fans, LLC+\#(2)(3)Capital EquipmentL + 3.75%4.75%5/21/202413,766 13,714 13,766 
BK Medical Holding Company, Inc.^+(2)(3)(6)Healthcare & PharmaceuticalsL + 5.25%6.25%6/22/202424,165 23,951 22,363 
Chemical Computing Group ULC (Canada)^+(2)(3)(6)SoftwareL + 5.00%6.00%8/30/202314,055 13,378 14,055 
Clarity Telecom LLC.+(2)(3)Media: Broadcasting & SubscriptionL + 4.25%4.40%8/30/202614,813 14,773 14,813 
Clearent Newco, LLC^(2)(3)(6)High Tech IndustriesL + 6.50%7.50%3/20/20254,079 4,079 3,907 
Clearent Newco, LLC^+\(2)(3)High Tech IndustriesL + 5.50%7.50%3/20/202529,486 29,236 28,722 
DecoPac, Inc.^+\(2)(3)(6)Non-durable Consumer GoodsL + 4.25%5.25%9/29/202412,336 12,253 12,318 
Diligent Corporation^+(2)(3)(6)TelecommunicationsL + 6.25%7.25%8/4/20258,683 8,411 8,819 
DTI Holdco, Inc.^+\(2)(3)High Tech IndustriesL + 4.75%5.75%9/30/202318,690 18,642 16,655 
Eliassen Group, LLC+\(2)(3)Business ServicesL + 4.25%4.40%11/5/20247,543 7,516 7,483 
EvolveIP, LLC^+(2)(3)(6)TelecommunicationsL + 5.75%6.75%6/7/202319,800 19,759 19,775 
Exactech, Inc.+\#(2)(3)Healthcare & PharmaceuticalsL + 3.75%4.75%2/14/202521,528 21,416 20,422 
Excel Fitness Holdings, Inc.+#(2)(3)Hotel, Gaming & LeisureL + 5.25%6.25%10/7/202524,750 24,546 22,780 
Frontline Technologies Holdings, LLC+(2)(3)SoftwareL + 5.75%6.75%9/18/202314,886 14,198 14,589 
Golden West Packaging Group LLC+\(2)(3)Containers, Packaging & GlassL + 5.25%6.25%6/20/202329,012 28,896 28,974 
HMT Holding Inc.+\(2)(3)(6)Energy: Oil & GasL + 5.00%6.00%11/17/202332,821 32,458 30,984 
Integrity Marketing Acquisition, LLC^+(2)(3)(6)Banking, Finance, Insurance & Real EstateL + 6.25%7.25%8/27/20257,836 7,701 7,956 
Jensen Hughes, Inc.+\(2)(3)(6)Utilities: ElectricL + 4.50%5.50%3/22/202434,584 34,489 33,424 
KAMC Holdings, Inc.+#(2)(3)Energy: ElectricityL + 4.00%4.23%8/14/202613,825 13,768 12,531 
KBP Investments, LLC^+(2)(3)(6)Beverage, Food & TobaccoL + 5.00%6.00%5/15/20239,292 9,059 9,350 
Marco Technologies, LLC^+\(2)(3)(6)Media: Advertising, Printing & PublishingL + 4.00%5.00%10/30/20237,332 7,293 7,332 
Mold-Rite Plastics, LLC+\(2)(3)Chemicals, Plastics & RubberL + 4.25%5.25%12/14/202114,520 14,501 14,520 
72


Table of Contents
Newport Group Holdings II, Inc.+\#(2)(3)Banking, Finance, Insurance & Real EstateL + 3.50%3.75%9/13/202523,475 23,285 23,405 
Odyssey Logistics & Technology Corp.+\#(2)(3)Transportation: CargoL + 4.00%5.00%10/12/2024$38,897 $38,773 $37,766 
Output Services Group^+\(2)(3)Media: Advertising, Printing & PublishingL + 4.50%5.50%3/27/202419,421 19,382 14,178 
Pasternack Enterprises, Inc.+\(2)(3)Capital EquipmentL + 4.00%5.00%7/2/202522,524 22,513 22,218 
Pharmalogic Holdings Corp.+\(2)(3)Healthcare & PharmaceuticalsL + 4.00%5.00%6/11/202311,205 11,189 11,158 
Premise Health Holding Corp.+\#(2)(3)Healthcare & PharmaceuticalsL + 3.50%3.75%7/10/202513,584 13,538 13,503 
Propel Insurance Agency, LLC^+\(2)(3)(6)Banking, Finance, Insurance & Real EstateL + 5.00%6.00%6/1/202438,134 37,662 37,716 
Q Holding Company+\#(2)(3)AutomotiveL + 5.00%6.00%12/31/202321,735 21,604 20,229 
QW Holding Corporation+(2)(3)(6)Environmental IndustriesL + 6.25%7.25%8/31/202211,566 11,465 10,727 
Radiology Partners, Inc.+\#(2)(3)Healthcare & PharmaceuticalsL + 4.25%4.81%7/9/202527,686 27,581 27,193 
RevSpring Inc.+\#(2)(3)Media: Advertising, Printing & PublishingL + 4.25%4.40%10/11/202529,449 29,265 29,199 
Situs Group Holdings Corporation+\(2)(3)Banking, Finance, Insurance & Real EstateL + 4.75%5.75%6/28/202514,781 14,689 14,636 
T2 Systems, Inc.^+(2)(3)(6)Transportation: ConsumerL + 6.75%7.75%9/28/202229,119 28,743 29,118 
The Original Cakerie, Ltd. (Canada)+\(2)(3)(6)Beverage, Food & TobaccoL + 4.50%5.50%7/20/20226,295 6,281 6,289 
The Original Cakerie, Ltd. (Canada)+(2)(3)Beverage, Food & TobaccoL + 5.00%6.00%7/20/20228,837 8,815 8,829 
Thoughtworks, Inc.\#(2)(3)Business ServicesL + 3.75%4.75%10/11/202411,704 11,683 11,704 
U.S. Acute Care Solutions, LLC+\(2)(3)Healthcare & PharmaceuticalsL + 6.00%7.00%5/15/202131,211 31,184 29,104 
U.S. TelePacific Holdings Corp.+\(2)(3)TelecommunicationsL + 5.50%6.50%5/2/202326,660 26,585 23,984 
VRC Companies, LLC+(2)(3)(6)Business ServicesL + 6.50%7.50%3/31/202330,582 29,464 30,582 
Water Holdings Acquisition LLC^+(2)(3)(6)Utilities: WaterL + 5.25%6.25%12/18/202626,316 25,520 25,516 
Welocalize, Inc.+(2)(3)(6)Business ServicesL + 4.50%5.50%12/23/202322,629 22,414 22,584 
WRE Holding Corp.^+(2)(3)(6)Environmental IndustriesL + 5.25%6.25%1/3/20238,367 8,336 8,252 
First Lien Debt Total$1,051,406 $1,029,687 
Second Lien Debt (2.3% of fair value)
DBI Holding, LLC^(2)Transportation: Cargo9.00% PIK9.00%2/1/2026$24,113 $23,768 $24,113 
Second Lien Debt Total$23,768 $24,113 
Equity Investments (0.2% of fair value)
DBI Holding, LLC^Transportation: Cargo2,961 $— $— 
DBI Holding, LLC^Transportation: Cargo13,996 5,364 2,581 
Equity Investments Total$5,364 $2,581 
Total Investments$1,080,538 $1,056,381 

^ Denotes that all or a portion of the assets are owned by Credit Fund. Credit Fund has entered into a revolving credit facility (the "Credit Fund Facility"). Accordingly, such assets are not available to creditors of Credit Fund Sub, the 2019-2 Issuer or Credit Fund Warehouse II.
+ Denotes that all or a portion of the assets are owned by Credit Fund Sub. Credit Fund Sub has entered into a revolving credit facility (the “Credit Fund Sub Facility”). The lenders of the Credit Fund Sub Facility have a first lien security interest in substantially all of the assets of Credit Fund Sub. Accordingly, such assets are not available to creditors of Credit Fund, the 2019-2 Issuer or Credit Fund Warehouse II.
\ Denotes that all or a portion of the assets are owned by the 2019-2 Issuer and secure the notes issued in connection with a $399,900 term debt securitization completed by Credit Fund on May 21, 2019 (the “2019-2 Debt Securitization”). Accordingly, such assets are not available to creditors of Credit Fund, Credit Fund Sub, or Credit Fund Warehouse II.
# Denotes that all or a portion of the assets are owned by the Credit Fund Warehouse II. Credit Fund Warehouse II has entered into a revolving credit facility (the "Credit Fund Warehouse II"). The lenders of the Credit Fund Warehouse II Facility have a first lien security interest in substantially all of the assets of the Credit Fund Warehouse II. Accordingly, such assets are not available to creditors of Credit Fund, Credit Fund Sub, or 2019-2 Issuer.
73


Table of Contents
(1)Unless otherwise indicated, issuers of investments held by Credit Fund are domiciled in the United States. As of December 31, 2020, the geographical composition of investments as a percentage of fair value was 2.8% in Canada and 97.2% in the United States. Certain portfolio company investments are subject to contractual restrictions on sales.
(2)Variable rate loans to the portfolio companies bear interest at a rate that is determined by reference to either LIBOR or an alternate base rate (commonly based on the Federal Funds Rate or the U.S. Prime Rate), which generally resets quarterly. For each such loan, Credit Fund has indicated the reference rate used and provided the spread and the interest rate in effect as of December 31, 2020. As of December 31, 2020, the reference rates for Credit Fund's variable rate loans were the 30-day LIBOR at 0.15%, the 90-day LIBOR at 0.25% and the 180-day LIBOR at 0.26%.
(3)Loan includes interest rate floor feature, which is generally 1.00%.
(4)Amortized cost represents original cost, including origination fees and upfront fees received that are deemed to be an adjustment to yield, adjusted for the accretion/amortization of discounts/premiums, as applicable, on debt investments using the effective interest method.
(5)Fair value is determined in good faith by or under the direction of the board of managers of Credit Fund, pursuant to Credit Fund’s valuation policy, with the fair value of all investments determined using significant unobservable inputs, which is substantially similar to the valuation policy of the Company provided in Note 3, Fair Value Measurements, to the consolidated financial statements in Part II, Item 8 of this Form 10-K.
(6)As of December 31, 2020, Credit Fund and Credit Fund Sub had the following unfunded commitments to fund delayed draw and revolving senior secured loans:
First Lien Debt – unfunded delayed draw and revolving term loans commitmentsTypeUnused FeePar/ Principal AmountFair Value
Analogic CorporationRevolver0.50 %$1,975 $— 
AQA Acquisition Holding, Inc.Revolver0.50 2,459 — 
BK Medical Holding Company, Inc.Revolver0.50 2,609 (176)
Chemical Computing Group ULC (Canada)Revolver0.50 873 — 
Clearent Newco, LLCDelayed Draw1.00 2,549 (66)
DecoPac, Inc.Revolver0.50 2,143 (3)
Diligent CorporationDelayed Draw1.00 2,109 25 
Diligent CorporationRevolver0.50 703 
EvolveIP, LLCDelayed Draw1.00 1,904 (2)
EvolveIP, LLCRevolver0.50 1,680 (2)
HMT Holding Inc.Revolver0.50 6,173 (291)
Integrity Marketing Acquistion, LLCDelayed Draw1.00 4,144 41 
Jensen Hughes, Inc.Delayed Draw1.00 1,127 (35)
Jensen Hughes, Inc.Revolver0.50 1,364 (43)
KBP Investments, LLCDelayed Draw1.00 503 
KBP Investments, LLCDelayed Draw1.00 10,190 30 
Marco Technologies, LLCDelayed Draw1.00 7,500 — 
Propel Insurance Agency, LLCRevolver0.50 1,905 (19)
Propel Insurance Agency, LLCDelayed Draw1.00 1,733 (17)
QW Holding CorporationRevolver0.50 5,498 (268)
QW Holding CorporationDelayed Draw1.00 161 (8)
T2 Systems, Inc.Revolver0.50 1,955 — 
The Original Cakerie, Ltd. (Canada)Revolver0.50 1,665 (1)
VRC Companies, LLCRevolver0.50 858 — 
Water Holdings Acquisition LLCDelayed Draw1.00 8,421 (168)
Water Holdings Acquisition LLCRevolver0.50 5,263 (105)
Welocalize, Inc.Revolver0.50 2,250 (4)
WRE Holding Corp.Revolver0.50 852 (10)
WRE Holding Corp.Delayed Draw1.00 563 (7)
Total unfunded commitments$81,129 $(1,120)
Debt
The Credit Fund, FacilityCredit Fund Sub and Credit Fund Warehouse II are party to separate credit facilities as described below. As of December 31, 2021 and 2020, Credit Fund, Credit Fund Sub, and Credit Fund Warehouse II were in compliance with all covenants and other requirements of their respective credit facility agreements. Below is a summary of the borrowings and repayments under the credit facilities for the respective periods.
74


Table of Contents
Credit Fund
Facility
Credit Fund Sub
Facility
Credit Fund Warehouse II Facility
Outstanding balance as of December 31, 2019$93,000 $343,506 $97,571 
Borrowings63,500 269,313 54,373 
Repayments(156,500)(191,960)(58,542)
Outstanding balance as of December 31, 2020— 420,859 93,402 
Borrowings— 444,000 52,250 
Repayments— (350,238)(59,622)
Outstanding balance as of December 31, 2021$— $514,621 $86,030 
Credit Fund Facility.On June 24, 2016, Credit Fund entered into the Credit Fund Facility with usthe Company, which was subsequently amended on June 5, 2017, October 2, 2017, November 3, 2017, June 22, 2018, June 29, 2018, February 21, 2019, March 20, 2020 and February 22, 2021, pursuant to which Credit Fund may from time to time request mezzanine loans from us, which was subsequently amended on June 5, 2017, October 2, 2017 and November 3, 2017.the Company. The maximum principal amount of the Credit Fund Facility is $175,000. The maturity date of the Credit Fund Facility is June 22, 2018.May 21, 2022. Amounts borrowed under the Credit Fund Facility bear interest at a rate of LIBOR plus 9.00%.
During the year ended December 31, 2017 and 2016, there were mezzanine loan borrowings of $135,960 and $84,784, respectively, and repayments of $112,594 and $22,400 under the Credit Fund Facility. As of December 31, 2017 and 2016, there were $85,750 and $62,384 in mezzanine loans outstanding.
Credit Fund Sub Facility
Facility.On June 24, 2016, Credit Fund Sub closed on the Credit Fund Sub Facility with lenders, which was subsequently amended on May 31, 2017, and October 27, 2017.2017, August 24, 2018, December 12, 2019, March 11, 2020 and May 3, 2021. The Credit Fund Sub Facility provides for secured borrowings during the applicable revolving period up to an amount equal to $640,000. The facility is secured by a first lien security interest in substantially all of the portfolio investments held by Credit Fund Sub. The maturity date of the Credit Fund Sub Facility is May 22, 2023.2024. Amounts borrowed under the Credit Fund Sub Facility bear interest at a rate of LIBOR plus 2.50%2.25%.
During the year ended December 31, 2017 and 2016, there wereCredit Fund Warehouse II Facility. On August 16, 2019, Credit Fund Warehouse II closed on a revolving credit facility (the "Credit Fund Warehouse II Facility") with lenders. The Credit Fund Warehouse II Facility provides for secured borrowings during the applicable revolving period up to an amount equal to $150,000. The Credit Fund Warehouse II Facility is secured by a first lien security interest in substantially all of $466,605 and $248,540, respectively, and repaymentsthe portfolio investments held by the Credit Fund Warehouse II Facility. The maturity date of $337,459 and $0, respectively,the Credit Fund Warehouse II Facility is August 16, 2022. Amounts borrowed under the Credit Fund Sub Facility. AsWarehouse II Facility bear interest at a rate of December 31, 2017LIBOR plus 1.50%. Amounts borrowed under the Credit Fund Warehouse II Facility during the first 12 months bore interest at a rate of LIBOR plus 1.05%, and 2016, there was $377,686 and $248,540amounts borrowed in secured borrowings outstanding, respectively.

Table of Contents

the second 12 months bore interest at LIBOR plus 1.15%.
2017-1 Notes
On December 19, 2017, Credit Fund completed a $399,900 term debt securitization (the “2017-1the 2017-1 Debt Securitization”).Securitization. The notes offered in the 2017-1 Debt Securitization (the “2017-1 Notes”) were issued by the 2017-1 Issuer, a wholly owned and consolidated subsidiary of Credit Fund, and are secured by a diversified portfolio of the 2017-1 Issuer consisting primarily of first and second lien senior secured loans. The 2017-1 Debt Securitization was executed through a private placement of the 2017-1 Notes, consisting of $231,700of:
$231,700 of Aaa/AAA Class A-1 Notes, which bearbore interest at the three-month LIBOR plus 1.17%; $48,300
$48,300 of Aa2/AA Class A-2 Notes, which bearbore interest at the three-month LIBOR plus 1.50%; $15,000
$15,000 of A2/A Class B-1 Notes, which bearbore interest at the three-month LIBOR plus 2.25%; $9,000
$9,000 of A2/A Class B-2 Notes which bearbore interest at 4.30%; $22,900
$22,900 of Baa2/BBB Class C Notes which bearbore interest at the three-month LIBOR plus 3.20%; and $25,100
$25,100 of Ba2/BB Class D Notes which bearbore interest at the three-month LIBOR plus 6.38%.
The 2017-1 Notes arewere scheduled to mature on January 15, 2028. Credit Fund received 100% of the preferred interests issued by the 2017-1 Issuer (the “2017-1 Issuer Preferred Interests”) on the closing date of the 2017-1 Debt Securitization in exchange for Credit Fund'sFund’s contribution to the 2017-1 Issuer of the initial closing date loan portfolio. The 2017-1 Issuer Preferred Interests dodid not bear interest and had a nominal value of $47,900 at closing.
The 2017-1 Notes were fully redeemed during the year ended December 31, 2020. As of the redemption date, the 2017-1 Issuer was in compliance with all covenants and other requirements of the indenture.
75


Table of Contents
2019-2 Notes
On May 21, 2019, Credit Fund completed the 2019-2 Debt Securitization. The notes offered in the 2019-2 Debt Securitization (the “2019-2 Notes”) were issued by the 2019-2 Issuer, a wholly owned and consolidated subsidiary of Credit Fund, and are secured by a diversified portfolio of the 2019-2 Issuer consisting primarily of first and second lien senior secured loans. The 2019-2 Debt Securitization was executed through a private placement of the 2019-2 Notes, consisting of:
$233,000 of Aaa/AAA Class A-1 Notes, which bore interest at the three-month LIBOR plus 1.50%;
$48,000 of Aa2/AA Class A-2 Notes, which bore interest at the three-month LIBOR plus 2.40%;
$23,000 of A2/A Class B Notes, which bore interest at the three-month LIBOR plus 3.45%;
$27,000 of Baa2/BBB- Class C Notes which bore interest at the three-month LIBOR plus 4.55%; and
$21,000 of Ba2/BB- Class D Notes which bore interest at the three-month LIBOR plus 8.03%.
    The 2019-2 Notes were scheduled to mature on April 15, 2029. Credit Fund received 100% of the preferred interests issued by the 2019-2 Issuer (the “2019-2 Issuer Preferred Interests”) on the closing date of the 2019-2 Debt Securitization in exchange for Credit Fund’s contribution to the 2019-2 Issuer of the initial closing date loan portfolio. The 2019-2 Issuer Preferred Interests did not bear interest and had a nominal value of $48,300 at closing.
The 2019-2 Notes were fully redeemed during the year ended December 31, 2021. As of the redemption date and December 31, 2020, the 2019-2 Issuer was in compliance with all covenants and other requirements of the indenture.
MIDDLE MARKET CREDIT FUND II, LLC
Overview
On November 3, 2020, the Company and CCLF entered into a limited liability company agreement to co-manage Credit Fund II, a Delaware limited liability company that is not consolidated in the Company's consolidated financial statements. Credit Fund II primarily invests in senior secured loans of middle market companies. Credit Fund II is managed by a four-member board, on which the Company and CCLF have equal representation. Establishing a quorum for Credit Fund II's board requires at least one of the Company's representatives and one of CCLF's representatives. The Company and CCLF have 84.13% and 15.87% economic ownership of Credit Fund II, respectively. By virtue of its membership interest, each of the Company and CCLF indirectly bears an allocable share of all expenses and other obligations of Credit Fund II.
Credit Fund II's initial portfolio consists of 45 senior secured loans of middle market companies with an aggregate principal balance of approximately $250 million. Credit Fund II's initial portfolio was funded on November 3, 2020 with existing senior secured debt investments contributed by the Company and as part of the transaction, the Company determined that the contribution met the requirements under ASC 860, Transfers and Servicing.
Credit Fund II is expected to make only limited new investments in senior secured loans of middle market companies. Portfolio and investment decisions with respect to Credit Fund II must be unanimously approved by a quorum of Credit Fund II’s board members consisting of at least one of the Company's representatives and one of CCLF's representatives. Therefore, although the Company owns more than 25% of the voting securities of Credit Fund II, the Company does not believe that it has control over Credit Fund (other than for purposes of the Investment Company Act).
Middle Market Credit Fund II SPV, LLC (“Credit Fund II Sub”), a Delaware limited liability company, was formed on September 4, 2020. Credit Fund II Sub is a wholly owned subsidiary of Credit Fund II and is consolidated in Credit Fund II’s consolidated financial statements commencing from the date of its formation. Credit Fund II Sub primarily holds investments in first lien loans of middle market companies, which are pledged as security for the Credit Fund II Senior Notes (see below).
Credit Fund II, the Company and CCLF entered into an administration agreement with Carlyle Global Credit Administration L.L.C., the administrative agent of Credit Fund II (in such capacity, the “Credit Fund II Administrative Agent”), pursuant to which the Credit Fund II Administrative Agent is delegated certain administrative and non-discretionary functions, is authorized to enter into sub-administration agreements at the expense of Credit Fund II with the approval of the board of managers of Credit Fund II, and is reimbursed by Credit Fund II for its costs and expenses and Credit Fund II’s allocable portion of overhead incurred by the Credit Fund II Administrative Agent in performing its obligations thereunder.
Credit Fund II Senior Notes
On November 3, 2020 and as amended on December 29, 2021, Credit Fund II Sub closed on the Credit Fund II Senior Notes (the “Credit Fund II Senior Notes”) with lenders. The Credit Fund II Senior Notes provides for secured borrowings
76


Table of Contents
totaling $157,500 with two tranches, A-1 and A-2 outstanding. The facility is secured by a first lien security interest in substantially all of the portfolio investments held by Credit Fund II Sub. The maturity date of the Credit Fund II Senior Notes Sub Facility is November 3, 2030. Amounts issued for the Class A-1 notes totaled $147,500 and bear interest at a rate of LIBOR plus 2.70%, and amounts issued for the Class A-2 notes totaled $10,000 and bear interest at LIBOR plus 3.20%. The A-1 Notes were rated AAA, and the A-2 Notes were rated AA by DBRS Morningstar. The terms of the Credit Fund II Senior Notes provide that as loans pay down, up to $50,000 is available from principal proceeds for reinvestment, and then the investment principal proceeds are used to directly pay down the principal balance on the Credit Fund II Senior Notes. As of December 31, 2021 and 2020, Credit Fund II Sub was in compliance with all covenants and other requirements of its respective credit agreements.
Selected Financial Data
Since inception of Credit Fund II and through December 31, 2021, the Company and CCLF each made capital contributions of $78,096 and $12,709 in members’ equity, respectively, to Credit Fund II. Below is certain summarized consolidated information for Credit Fund II as of December 31, 2021 and 2020.

As of December 31,
20212020
ASSETS
Investments, at fair value (amortized cost of $238,615 and $245,312, respectively)$239,289 $246,421 
Cash and cash equivalents (1)
10,092 1,385 
Other assets5,606 3,436 
Total assets$254,987 $251,242 
LIABILITIES AND MEMBERS’ EQUITY
Liabilities
Notes payable, net of unamortized debt issuance costs of $802 and $875, respectively$156,698 $156,625 
Other liabilities5,557 2,675 
Total members' equity (2)
92,732 91,942 
Total liabilities and members’ equity$254,987 $251,242 
(1) As of December 31, 2021 and 2020, all of Credit Fund II’s cash and cash equivalents was restricted.
(2) As of December 31, 2021 and 2020, the fair value of Company's ownership interest in the members' equity was $77,958 and $77,395, respectively.
For the Year Ended December 31,
20212020
Total investment income$18,822 $3,005 
Expenses
Interest and credit facility expenses4,695 766 
Other expenses897 498 
Total expenses5,592 1,264 
Net investment income (loss)13,230 1,741 
Net change in unrealized appreciation (depreciation) on investments(440)1,114 
Net increase (decrease) resulting from operations$12,790 $2,855 
77


Table of Contents
Below is a summary of Credit Fund II’s portfolio, followed by a listing of the loans in Credit Fund II’s portfolio as of December 31, 2021 and 2020:
As of December 31,
 20212020
Senior secured loans (1)
$240,878 $248,172 
Weighted average yields of senior secured loans based on amortized cost (2)
7.26 %7.32 %
Weighted average yields of senior secured loans based on fair value (2)
7.24 %7.29 %
Number of portfolio companies in Credit Fund II36 44 
Average amount per portfolio company (1)
$6,691 $5,640 
Percentage of portfolio at floating interest rates (3) (4)
97.7 %99.1 %
Percentage of portfolio at fixed interest rates (4)
2.3 %0.9 %
Fair value of loans with PIK provisions$17,453 $8,856 
Percentage of portfolio with PIK provisions (4)
7.3 %3.6 %
(1)At par/principal amount.
(2)Weighted average yields include the effect of accretion of discounts and amortization of premiums and are based on interest rates as of December 31, 2021 and 2020. Weighted average yield on debt and income producing securities at fair value is computed as (a) the annual stated interest rate or yield earned plus the net annual amortization of OID and market discount earned on accruing debt included in such securities, divided by (b) total first lien and second lien debt at fair value included in such securities. Weighted average yield on debt and income producing securities at amortized cost is computed as (a) the annual stated interest rate or yield earned plus the net annual amortization of OID and market discount earned on accruing debt included in such securities, divided by (b) total first lien and second lien debt at amortized cost included in such securities. Actual yields earned over the life of each investment could differ materially from the yields presented above.
(3)Floating rate debt investments are generally subject to interest rate floors.
(4)Percentages based on fair value.


78


Table of Contents

Consolidated Schedule of Investments as of December 31, 2021
Investments (1)
FootnotesIndustry
Reference Rate & Spread (2)
Interest Rate (2)
Maturity DatePar/ Principal Amount
Amortized Cost (4)
Fair Value (5)
First Lien Debt (87.0%) of fair value)
Airnov, Inc.^(2)(3)Containers, Packaging & GlassL + 5.00%6.00%12/19/2025$9,946 $9,930 $9,946 
American Physician Partners, LLC^(2)(3)Healthcare & PharmaceuticalsL + 6.75%, 1.50% PIK9.25%2/21/20228,415 8,415 8,415 
Appriss Health, LLC^(2)(3)Healthcare & PharmaceuticalsL + 7.25%8.25%5/6/20271,197 1,178 1,198 
Apptio, Inc.^(2)(3)SoftwareL + 7.25%8.25%1/10/20255,357 5,295 5,357 
Aurora Lux FinCo S.Á.R.L. (Luxembourg)^(2)(3)SoftwareL + 6.00%7.00%12/24/20264,355 4,273 3,924 
Avenu Holdings, LLC^(2)(3)Sovereign & Public FinanceL + 5.25%6.25%9/28/2024987 980 987 
BMS Holdings III Corp.^(2)(3)Construction & BuildingL + 5.50%6.50%9/30/20263,275 3,216 3,224 
Captive Resources Midco, LLC^(2)(3)Banking, Finance, Insurance & Real EstateL + 5.50%6.25%5/31/20278,193 8,108 8,147 
Chartis Holding, LLC^(2)(3)Business ServicesL + 5.50%6.50%5/1/20259,924 9,907 9,924 
Comar Holding Company, LLC^(2)(3)Containers, Packaging & GlassL + 5.75%6.75%6/18/20248,710 8,632 8,536 
Cority Software Inc. (Canada)^(2)(3)SoftwareL + 5.00%6.00%7/2/20268,712 8,591 8,707 
Dwyer Instruments, Inc^(2)(3)Capital EquipmentL + 5.50%6.25%7/21/202710,000 9,939 9,974 
Ethos Veterinary Health LLC^(2)(3)Consumer ServicesL + 4.75%4.85%5/15/20268,134 8,080 8,134 
EvolveIP, LLC^(2)(3)TelecommunicationsL + 5.50%6.50%6/7/20258,710 8,701 8,666 
Harbour Benefit Holdings, Inc.^(2)(3)Business ServicesL + 5.25%6.25%12/13/20244,717 4,707 4,669 
K2 Insurance Services, LLC^(2)(3)Banking, Finance, Insurance & Real EstateL + 5.00%6.00%7/1/20269,012 8,914 8,998 
Kaseya, Inc.^(2)(3)High Tech IndustriesL + 5.50%, 1.00% PIK7.50%5/3/20259,092 8,987 9,038 
Material Holdings, LLC^(2)(3)Business ServicesL + 5.75%6.50%8/19/20277,980 7,896 7,891 
Maverick Acquisition, Inc.^(2)(3)Aerospace & DefenseL + 6.00%7.00%6/1/20277,980 7,814 7,808 
National Technical Systems, Inc.^(2)(3)Aerospace & DefenseL + 5.50%6.50%6/12/20238,733 8,720 8,733 
NMI AcquisitionCo, Inc.^(2)(3)High Tech IndustriesL + 5.75%6.50%9/6/20258,708 8,680 8,601 
Redwood Services Group, LLC^(2)(3)High Tech IndustriesL + 6.00%7.00%6/6/20248,736 8,724 8,737 
Riveron Acquisition Holdings, Inc.^(2)(3)Banking, Finance, Insurance & Real EstateL + 5.75%6.75%5/22/20258,173 8,074 8,173 
RSC Acquisition, Inc.^(2)(3)Banking, Finance, Insurance & Real EstateL + 5.50%6.25%11/1/20268,401 8,277 8,434 
Superior Health Linens, LLC^(2)(3)Business ServicesL + 6.50%7.50%3/31/20226,875 6,875 6,875 
TCFI Aevex LLC^(2)(3)Aerospace & DefenseL + 6.00%7.00%3/18/20261,701 1,676 1,458 
Turbo Buyer, Inc.^(2)(3)AutomotiveL + 6.00%7.00%12/2/20258,091 7,950 7,929 
US INFRA SVCS Buyer, LLC^(2)(3)Environmental IndustriesL + 6.50%7.50%4/13/20263,267 3,217 3,189 
USLS Acquisition, Inc.^(2)(3)Business ServicesL + 5.50%6.50%11/30/20246,234 6,223 6,165 
Westfall Technik, Inc.^(2)(3)Chemicals, Plastics & RubberL + 5.75%6.75%9/13/20246,418 6,337 6,359 
First Lien Debt Total$208,316 $208,196 
Second Lien Debt (13.0%) of fair value
AI Convoy S.A.R.L (United Kingdom)^(2)(3)Aerospace & DefenseL + 8.25%9.25%1/17/20285,514 5,413 5,720 
AP Plastics Acquisition Holdings, LLC^(2)(3)Chemicals, Plastics & RubberL + 7.50%8.25%8/10/20294,500 4,410 4,526 
79


Table of Contents
Consolidated Schedule of Investments as of December 31, 2021
Investments (1)
FootnotesIndustry
Reference Rate & Spread (2)
Interest Rate (2)
Maturity DatePar/ Principal Amount
Amortized Cost (4)
Fair Value (5)
AQA Acquisition Holdings, Inc.^(2)(3)High Tech IndustriesL + 7.50%8.00%3/3/2029$5,000 $4,881 $5,004 
Quartz Holding Company^(2)(3)SoftwareL + 8.00%8.10%4/2/20274,852 4,781 4,852 
Tank Holding Corp.^(2)(3)Capital EquipmentL + 8.25%8.35%3/26/20275,514 5,446 5,569 
World 50, Inc.^(6)Business Services11.50%11.50%1/9/20275,465 5,368 5,422 
Second Lien Debt Total$30,299 $31,093 
Total Investments$238,615 $239,289 
^ Denotes that all or a portion of the assets are owned by Credit Fund II Sub. Credit Fund II Sub has entered into the Credit Fund II Sub Notes. The lenders of the Credit Fund II Sub Notes have a first lien security interest in substantially all of the assets of Credit Fund II Sub. Accordingly, such assets are not available to creditors of Credit Fund II.
(1)    Unless otherwise indicated, issuers of investments held by Credit Fund are domiciled in the United States. As of December 31, 2021, the geographical composition of investments as a percentage of fair value was 3.6% in Canada, 1.6% in Luxembourg, 2.4% in the United Kingdom and 92.4% in the United States. Certain portfolio company investments are subject to contractual restrictions on sales.
(2)Variable rate loans to the portfolio companies bear interest at a rate that is determined by reference to either LIBOR or an alternate base rate (commonly based on the Federal Funds Rate or the U.S. Prime Rate), which generally resets quarterly. For each such loan, Credit Fund II has indicated the reference rate used and provided the spread and the interest rate in effect as of December 31, 2021. As of December 31, 2021, the reference rates for Credit Fund II's variable rate loans were the 30-day LIBOR at 0.10%, the 90-day LIBOR at 0.22% and the 180-day LIBOR at 0.33%.
(3)Loan includes interest rate floor feature, which is generally 1.00%.
(4)Amortized cost represents original cost, including origination fees and upfront fees received that are deemed to be an adjustment to yield, adjusted for the accretion/amortization of discounts/premiums, as applicable, on debt investments using the effective interest method.
(5)Fair value is determined in good faith by or under the direction of the board of managers of Credit Fund II, pursuant to Credit Fund II’s valuation policy, with the fair value of all investments determined using significant unobservable inputs, which is substantially similar to the valuation policy of the Company provided in Note 3, Fair Value Measurements, to the consolidated financial statements included in Part II, Item 8 of the Form 10-K.
(6)Represents a corporate mezzanine loan, which is subordinated to senior secured term loans of the portfolio company.


80


Table of Contents
Consolidated Schedule of Investments as of December 31, 2020
Investments (1)
FootnotesIndustry
Reference Rate & Spread (2)
Interest Rate (2)
Maturity DatePar/ Principal Amount
Amortized Cost (4)
Fair Value (5)
First Lien Debt (90.1%) of fair value)
Airnov, Inc.^(2)(3)Containers, Packaging & GlassL + 5.25%6.25%12/19/2025$1,500 $1,481 $1,501 
Alpine SG, LLC^(2)(3)High Tech IndustriesL + 5.75%6.75%11/16/20224,411 4,390 4,378 
American Physician Partners, LLC^(2)(3)Healthcare & PharmaceuticalsL + 6.75%7.75%12/21/20218,725 8,679 8,265 
AMS Group HoldCo, LLC^(2)(3)Transportation: CargoL + 6.50%7.50%9/29/20238,182 8,096 8,079 
Apptio, Inc.^(2)(3)SoftwareL + 7.25%8.25%1/10/20255,357 5,278 5,437 
Aurora Lux FinCo S.Á.R.L. (Luxembourg)^(2)(3)SoftwareL + 5.75%6.75%12/24/20264,400 4,303 4,018 
Avenu Holdings, LLC^(2)(3)Sovereign & Public FinanceL + 5.25%6.25%9/28/2024997 987 997 
BMS Holdings III Corp.^(2)(3)Construction & BuildingL + 5.25%6.25%9/30/20263,308 3,239 3,270 
Captive Resources Midco, LLC^(2)(3)Banking, Finance, Insurance & Real EstateL + 5.75%6.75%5/31/20258,406 8,297 8,463 
Chartis Holding, LLC^(2)(3)Business ServicesL + 5.50%6.50%5/1/20251,496 1,474 1,497 
Comar Holding Company, LLC^(2)(3)Containers, Packaging & GlassL + 5.50%6.50%6/18/20248,799 8,692 8,832 
Cority Software Inc. (Canada)^(2)(3)SoftwareL + 5.25%6.25%7/2/20268,800 8,655 8,862 
Ensono, LP^(2)(3)TelecommunicationsL + 5.25%5.40%6/27/20256,292 6,246 6,245 
Ethos Veterinary Health LLC^(2)(3)Consumer ServicesL + 4.75%4.90%5/15/20268,182 8,117 8,070 
EvolveIP, LLC^(2)(3)TelecommunicationsL + 5.75%6.75%6/7/20238,799 8,784 8,790 
Innovative Business Services, LLC^(2)(3)High Tech IndustriesL + 5.50%6.50%4/5/20232,200 2,162 2,159 
K2 Insurance Services, LLC^(2)(3)Banking, Finance, Insurance & Real EstateL + 5.00%6.00%7/1/20246,927 6,827 6,928 
Kaseya, Inc.^(2)(3)High Tech IndustriesL + 4.00%, 3.00% PIK8.00%5/2/20258,822 8,688 8,856 
Mailgun Technologies, Inc.^(2)(3)High Tech IndustriesL + 5.00%6.00%3/26/20258,478 8,347 8,330 
National Technical Systems, Inc.^(2)(3)Aerospace & DefenseL + 5.50%6.50%6/12/20238,800 8,778 8,733 
NMI AcquisitionCo, Inc.^(2)(3)High Tech IndustriesL + 5.00%6.00%9/6/20228,799 8,732 8,711 
Paramit Corporation^(2)(3)Capital EquipmentL + 4.50%5.50%5/3/20251,000 992 980 
PPC Flexible Packaging, LLC^(2)(3)Containers, Packaging & GlassL + 6.00%7.00%11/23/20244,400 4,358 4,386 
Redwood Services Group, LLC^(2)(3)High Tech IndustriesL + 6.00%7.00%6/6/20233,300 3,279 3,291 
Reladyne, Inc.^(2)(3)WholesaleL + 5.00%6.00%7/22/20226,484 6,431 6,514 
Riveron Acquisition Holdings, Inc.^(2)(3)Banking, Finance, Insurance & Real EstateL + 5.75%6.75%5/22/20258,257 8,131 8,312 
RSC Acquisition, Inc.^(2)(3)Banking, Finance, Insurance & Real EstateL + 5.50%6.50%11/1/20268,487 8,341 8,572 
Smile Doctors, LLC^(2)(3)Healthcare & PharmaceuticalsL + 6.00%7.00%10/6/20226,509 6,507 6,379 
Sovos Brands Intermediate, Inc.^(2)(3)Beverage, Food & TobaccoL + 4.75%4.96%11/20/20252,200 2,182 2,181 
Superior Health Linens, LLC^(2)(3)Business ServicesL + 6.50%7.50%9/30/20217,199 7,178 7,162 
T2 Systems, Inc.^(2)(3)Transportation: ConsumerL + 6.75%7.75%9/28/20228,799 8,713 8,799 
TCFI Aevex LLC^(2)(3)Aerospace & DefenseL + 6.00%7.00%3/18/20261,718 1,688 1,712 
TSB Purchaser, Inc.^(2)(3)Media: Advertising, Printing & PublishingL + 6.00%7.00%5/14/20248,799 8,663 8,729 
Turbo Buyer, Inc.^(2)(3)AutomotiveL + 5.25%6.25%12/2/20258,174 8,001 8,249 
81


Table of Contents
Consolidated Schedule of Investments as of December 31, 2020
Investments (1)
FootnotesIndustry
Reference Rate & Spread (2)
Interest Rate (2)
Maturity DatePar/ Principal Amount
Amortized Cost (4)
Fair Value (5)
US INFRA SVCS Buyer, LLC^(2)(3)Environmental IndustriesL + 6.00%7.00%4/13/2026$3,300 $3,240 $3,292 
VRC Companies, LLC^(2)(3)Business ServicesL + 6.50%7.50%3/31/20234,311 4,271 4,311 
Zemax Software Holdings, LLC^(2)(3)SoftwareL + 5.75%6.75%6/25/20244,400 4,363 4,294 
Zenith Merger Sub, Inc.^(2)(3)Business ServicesL + 5.25%6.25%12/13/20234,399 4,370 4,367 
First Lien Debt Total$220,960 $221,951 
Second Lien Debt (9.9%) of fair value
AI Convoy S.A.R.L (United Kingdom)^(2)(3)Aerospace & DefenseL + 8.25%9.25%1/17/2028$5,514 $5,401 $5,676 
AQA Acquisition Holding, Inc.^(2)(3)High Tech IndustriesL + 8.00%9.00%5/24/20241,000 993 1,000 
Quartz Holding Company^(2)(3)SoftwareL + 8.00%8.15%4/2/20274,852 4,771 4,815 
Tank Holding Corp.^(2)(3)Capital EquipmentL + 8.25%8.40%3/26/20275,514 5,436 5,394 
Ultimate Baked Goods MIDCO, LLC^(2)(3)Beverage, Food & TobaccoL + 8.00%9.00%8/9/20265,514 5,428 5,257 
World 50, Inc.(6)Business Services11.50%11.50%1/9/20272,365 2,323 2,328 
Second Lien Debt Total$24,352 $24,470 
Total Investments$245,312 $246,421 
^ Denotes that all or a portion of the assets are owned by Credit Fund II Sub. Credit Fund II Sub has entered into the Credit Fund II Sub Notes. The lenders of the Credit Fund II Sub Notes have a first lien security interest in substantially all of the assets of Credit Fund II Sub. Accordingly, such assets are not available to creditors of Credit Fund II.
(1)    Unless otherwise indicated, issuers of investments held by Credit Fund are domiciled in the United States. As of December 31, 2020, the geographical composition of investments as a percentage of fair value was 3.6% in Canada, 1.6% in Luxembourg, 2.3% in the United Kingdom and 92.5% in the United States. Certain portfolio company investments are subject to contractual restrictions on sales.
(2)Variable rate loans to the portfolio companies bear interest at a rate that is determined by reference to either LIBOR or an alternate base rate (commonly based on the Federal Funds Rate or the U.S. Prime Rate), which generally resets quarterly. For each such loan, Credit Fund II has indicated the reference rate used and provided the spread and the interest rate in effect as of December 31, 2020. As of December 31, 2020, the reference rates for Credit Fund II's variable rate loans were the 30-day LIBOR at 0.15%, the 90-day LIBOR at 0.25% and the 180-day LIBOR at 0.26%.
(3)Loan includes interest rate floor feature, which is generally 1.00%.
(4)Amortized cost represents original cost, including origination fees and upfront fees received that are deemed to be an adjustment to yield, adjusted for the accretion/amortization of discounts/premiums, as applicable, on debt investments using the effective interest method.
(5)Fair value is determined in good faith by or under the direction of the board of managers of Credit Fund II, pursuant to Credit Fund II’s valuation policy, with the fair value of all investments determined using significant unobservable inputs, which is substantially similar to the valuation policy of the Company provided in Note 3, Fair Value Measurements, to the consolidated financial statements included in Part II, Item 8 of this form 10-K.
(6)Represents a corporate mezzanine loan, which is subordinated to senior secured term loans of the portfolio company.
FINANCIAL CONDITION, LIQUIDITY AND CAPITAL RESOURCES
We generate cash from the net proceeds of offerings of our common stock and through cash flows from operations, including investment sales and repayments as well as income earned on investments and cash equivalents. We may also fund a portion of our investments through borrowings under the Facilities,Credit Facility, as well asdefined below, the issuance of debt, and through securitization of a portion of our existing investments.
The SPV closedprimary use of existing funds and any funds raised in the future is expected to be for investments in portfolio companies, repayment of indebtedness, cash distributions to our stockholders and for other general corporate purposes. We believe our current cash position, available capacity on May 24, 2013 on the SPV Credit Facility,our revolving credit facilities – which was subsequently amended on June 30, 2014, June 19, 2015, June 9, 2016is well in excess of our unfunded commitments – and May 26, 2017. The SPV Credit Facility provides for secured borrowings during the applicable revolving period up to an amount equal to the lesser of $400,000 (the borrowing base as calculated pursuant to the terms of the SPV Credit Facility) and the amount of net cash proceedsprovided by operating activities will provide us with sufficient resources to meet our obligations and unpledged capital commitments the Company has received, with an accordion feature that can, subject to certain conditions, increase the aggregate maximum credit commitment up to an amount not to exceed $750,000, subject to restrictions imposed on borrowings under the Investment Company Act and certain restrictions and conditions set forth in the SPV Credit Facility, including adequate collateralcontinue to support such borrowings. The SPV Credit Facility imposes financial and operating covenants on us andour investment objectives, including reserving for the SPV that restrictcapital needs which may arise at our and its business activities. Continued compliance with these covenants will depend on many factors, some of which are beyond our control.portfolio companies.
We closed onOn March 21, 2014, the Company closed on a senior secured revolving credit facility (“the Credit Facility,Facility”), which was subsequently amended on January 8, 2015, May 25, 2016, and March 22, 2017.2017, September 25, 2018, June 14, 2019 and October 28, 2020. The maximum principal amount of the Credit Facility is $413,000,$688,000, subject to availability under the Credit Facility, which is based on certain advance rates multiplied by the value of the Company’s portfolio investments (subject to certain concentration limitations) net of certain other indebtedness that the Company may incur in accordance with the terms of the Credit Facility. Proceeds of the Credit Facility may be used for general corporate purposes, including the funding of portfolio investments. Maximum capacity under the Credit Facility may be increased, subject to certain conditions, to $550,000$900,000 through the exercise by the Company of an uncommitted accordion feature through which existing and new lenders may, at their option, agree to provide additional financing. The Credit Facility includes a $20,000$50,000 limit for swingline loans and a $5,000
82


Table of Contents
$20,000 limit for letters of credit. Subject to certain exceptions, the Credit Facility is secured by a first lien security interest in substantially all of the portfolio investments held by the Company. The Credit Facility includes customary covenants, including certain financial covenants related to asset coverage, shareholders’ equity and liquidity, certain limitations on the incurrence of additional indebtedness and liens, and other maintenance covenants, as well as usual and customary events of default for senior secured revolving credit facilities of this nature.
Although we believe that we and the SPV will remain in compliance, there are no assurances that we or the SPV will continue to comply with the covenants in the Credit Facility and SPV Credit Facility, as applicable.Facility. Failure to comply with these covenants could result in a default under the Credit Facility and/or the SPV Credit Facility that, if we or the SPV were unable to obtain a waiver from the applicable lenders, could result in the immediate acceleration of the amounts due under the Credit Facility, and/or the SPV Credit Facility, and thereby have a material adverse impact on our business, financial condition and results of operations.
For more information on the SPV Credit Facility and the Credit Facility, see Note 67 to the consolidated financial statements in Part II, Item 8 of this Form 10-K.
On December 30, 2019, the Company closed a private offering of $115.0 million in aggregate principal amount of 4.750% Senior Unsecured Notes due December 31, 2024 (the “2019 Notes”). Interest is payable quarterly, beginning March 31, 2020. On December 11, 2020, the Company issued an additional $75.0 million aggregate principal amount of senior unsecured notes due December 31, 2024 (the "2020 Notes", together with the 2019 Notes, the “Senior Notes”). The primary use2020 Notes bear interest at an interest rate of existing funds and any funds raised4.500%. The interest rates of the Senior Notes are subject to increase (up to an additional 1.00% over the stated rate of such notes) in the event that, subject to certain exceptions, the Senior Notes cease to have an investment grade rating. The Senior Notes are general unsecured obligations of the Company that rank pari passu with all outstanding and future is expected to be for investments in portfolio companies, repayment ofunsecured unsubordinated indebtedness cash distributions to our stockholders and for other general corporate purposes.

Table of Contents

issued by the Company.
On June 26, 2015, we completed the 2015-1 Debt Securitization. The 2015-1 Notes were issued by Carlyle Direct Lending CLO 2015-1R LLC (formerly known as Carlyle GMS Finance MM CLO 2015-1 LLCLLC) (the “2015-1 Issuer”), a wholly owned and consolidated subsidiary of us,us. On August 30, 2018, the 2015-1 Issuer refinanced the 2015-1 Debt Securitization (the “2015-1 Debt Securitization Refinancing”) by redeeming in full the 2015-1 Notes and issuing new notes (the “2015-1R Notes”). The 2015-1R Notes are secured by a diversified portfolio of the 2015-1 Issuer consisting primarily of first and second lien senior secured loans. TheOn the closing date of the 2015-1 Debt Securitization was executed through a private placement ofRefinancing, the 2015-1 Notes, consisting of $160,000 of Aaa/AAAIssuer, among other things:
(a) refinanced the issued Class A-1A Notes which bear interest atby redeeming in full the three-month London Interbank Offered Rate (“LIBOR”) plus 1.85%; $40,000 of Aaa/Class A-1A Notes and issuing new AAA Class A-1BA-1-1-R Notes in an aggregate principal amount of $234,800 which bear interest at the three-month LIBOR plus 1.75%1.55%;
(b) refinanced the issued Class A-1B Notes by redeeming in full the Class A-1B Notes and issuing new AAA Class A-1-2-R Notes in an aggregate principal amount of $50,000 which bear interest at the three-month LIBOR plus 1.48% for the first 24 months and the three-month LIBOR plus 2.05%1.78% thereafter; $27,000 of Aaa/AAA
(c) refinanced the issued Class A-1C Notes by redeeming in full the Class A-1C Notes and issuing new AAA Class A-1-3-R Notes in an aggregate principal amount of $25,000 which bear interest at 3.75%4.56%; and $46,000 of Aa2
(d) refinanced the issued Class A-2 Notes by redeeming in full the Class A-2 Notes and issuing new Class A-2-R Notes in an aggregate principal amount of $66,000 which bear interest at the three-month LIBOR plus 2.70%. The 2015-12.20%;
(e) issued new single-A Class B Notes were issuedand BBB- Class C Notes in aggregate principal amounts of $46,400 and $27,000, respectively, which bear interest at parthe three-month LIBOR plus 3.15% and are scheduled to mature on July 15, 2027. We received 100% of the preferred interests issued bythree-month LIBOR plus 4.00%, respectively;
(f) reduced the 2015-1 Issuer (the “2015-1 Issuer Preferred Interests”) on the closing date of the 2015-1 Debt Securitization in exchange for our contribution to the 2015-1 Issuer of the initial closing date loan portfolio. The 2015-1 Issuer Preferred Interests do not bear interest and hadby approximately $21,375 from a nominal value of $125,900 to approximately $104,525 at closing. close; and
(g) extended the reinvestment period end date and maturity date applicable to the 2015-1 Issuer to October 15, 2023 and October 15, 2031, respectively.
In connection with the contribution, we have made customary representations, warranties and covenants to the 2015-1 Issuer. The Class A-1A,A-1-1-R, Class A-1BA-1-2-R, Class A-1-3-R, Class A-2-R, Class B and Class A-1C and Class A-2C Notes are included in the consolidated financial statements included in Part II, Item 8 of this Form 10-K. The 2015-1 Issuer Preferred Interests were eliminated in consolidation.
83


Table of Contents
For more information on the 2015-1Senior Notes and the 2015-1R Notes, see Note 78 to the consolidated financial statements in Part II, Item 8 of this Form 10-K.
As of December 31, 20172021 and 2016,2020, we had $32,039$93,074 and $38,489,$68,419, respectively, in cash, cash equivalents and cash equivalents.restricted cash. The FacilitiesCredit Facility consisted of the following as of December 31, 20172021 and 2016:2020:
December 31, 2021
December 31, 2017 Total
Facility
Borrowings
Outstanding
Unused
Portion (1)
Amounts Available (2)
Total
Facility
 
Borrowings
Outstanding
 
Unused
Portion (1)
 
Amount
Available (2)
SPV Credit Facility$400,000
 $287,393
 $112,607
 $27,147
Credit Facility413,000
 275,500
 137,500
 137,500
Credit Facility$688,000 $407,655 $280,345 $280,706 
Total$813,000
 $562,893
 $250,107
 $164,647
Total$688,000 $407,655 $280,345 $280,706 
December 31, 2020
December 31, 2016 Total
Facility
Borrowings
Outstanding
Unused
Portion (1)
Amounts Available (2)
Total
Facility
 
Borrowings
Outstanding
 
Unused
Portion (1)
 
Amount
Available (2)
SPV Credit Facility$400,000
 $252,885
 $147,115
 $5,988
Credit Facility220,000
 169,000
 51,000
 51,000
Credit Facility$688,000 $347,949 $340,051 $207,365 
Total$620,000
 $421,885
 $198,115
 $56,988
Total$688,000 $347,949 $340,051 $207,365 
(1)The unused portion is the amount upon which commitment fees are based.
(2)Available for borrowing based on the computation of collateral to support the borrowings and subject to compliance with applicable covenants and financial ratios.
(1)The unused portion is the amount upon which commitment fees are based.
(2)Available for borrowing based on the computation of collateral to support the borrowings and subject to compliance with applicable covenants and financial ratios.
The following were the carrying values (before debt issuance costs) and fair values for the Senior Notes disclosed but not carried at fair value as of December 31, 2021 and 2020:
 December 31, 2021December 31, 2020
Carrying ValueFair ValueCarrying ValueFair Value
2019 Notes$115,000 $117,300 $115,000 $116,250 
2020 Notes75,000 75,530 75,000 75,000 
Total$190,000 $192,830 $190,000 $191,250 
The following were the carrying values (before debt issuance costs) and fair values of our 2015-1the Company's 2015-1R Notes disclosed but not carried at fair value as of December 31, 20172021 and 2016.2020:
 December 31, 2021December 31, 2020
2015-1R NotesCarrying ValueFair ValueCarrying ValueFair Value
Aaa/AAA Class A-1-1-R Notes$234,800 $234,941 $234,800 $230,996 
Aaa/AAA Class A-1-2-R Notes50,000 50,075 50,000 49,645 
Aaa/AAA Class A-1-3-R Notes25,000 24,680 25,000 25,017 
AA Class A-2-R Notes66,000 66,003 66,000 64,895 
A Class B Notes46,400 46,430 46,400 45,291 
BBB- Class C Notes27,000 26,714 27,000 24,592 
Total$449,200 $448,843 $449,200 $440,436 
 December 31, 2017 December 31, 2016
 Carrying Value Fair Value Carrying Value Fair Value
Aaa/AAA Class A-1A Notes$160,000
 $160,064
 $160,000
 $160,072
Aaa/AAA Class A-1B Notes40,000
 40,020
 40,000
 39,960
Aaa/AAA Class A-1C Notes27,000
 27,014
 27,000
 26,951
Aa2 Class A-2 Notes46,000
 46,027
 46,000
 45,784
Total$273,000
 $273,125
 $273,000
 $272,767


Equity Activity
On June 9, 2017, in connection with the NFIC Acquisition, the Company issued 434,233 sharesAs of common stock valued at approximately $8,046. See Note 14 to theDecember 31, 2021 and 2020, we had a combined $1,046,855 and $987,149, respectively, of outstanding consolidated financial statements in Part II, Item 8 of this Form 10-K for additional information regarding the NFIC Acquisition.
On June 19, 2017, we closed our IPO, issuing 9,454,200 shares of our common stock (including shares issued pursuant to the exercise of the underwriters’ over-allotment option on July 5, 2017) at a public offering price of $18.50 per

Table of Contents

share. Net of underwriting costs, we received cash proceeds of $169,488. Shares of common stock of TCG BDC began trading on the NASDAQ Global Select Marketindebtedness under the symbol “CGBD” on June 14, 2017. UponCredit Facility, the completion of2015-1R Notes and the IPO, uncalled capital commitments payable to the Company by the Company’s pre-IPO investors were automatically reduced to zero.
Shares issuedSenior Notes. Our annualized interest cost as of December 31, 20172021 and 2016 were 62,207,6032020, was 2.75% and 41,702,318,2.89%, excluding fees (such as fees on undrawn amounts and amortization of upfront fees). For the years ended December 31, 2021, 2020 and 2019, we incurred $28,829, $35,820 and $50,587, respectively, of interest expense and $1,161, $1,766 and $1,263, respectively, of unused commitment fees.

Equity Activity
Common stock issued and outstanding as of December 31, 2021 and 2020 was 53,142,454 and 55,320,309, respectively.
84


Table of Contents
The following table summarizes activity in the number of shares of our common stock outstanding during the years ended December 31, 2017, 20162021, 2020 and 2015:2019:
 For the years ended December 31,
 202120202019
Common stock outstanding, beginning of year55,320,309 57,763,811 62,230,251 
Repurchase of common stock(2,177,855)(2,443,502)(4,466,440)
Common stock outstanding, end of year53,142,454 55,320,309 57,763,811 
 For the years ended December 31,
 2017 2016 2015
Shares outstanding, beginning of year41,702,318
 31,524,083
 17,932,697
Common stock issued20,146,561
 10,162,898
 13,584,508
Reinvestment of dividends358,724
 15,337
 6,878
Shares outstanding, end of year62,207,603
 41,702,318
 31,524,083
Contractual Obligations
A summaryOn May 5, 2020, we issued and sold 2,000,000 shares of our significant contractual payment obligations was as followsPreferred Stock to an affiliate of Carlyle in a private placement at a price of $25 per share. Shares of Preferred Stock issued and outstanding as of both December 31, 20172021 and 2016:2020 were 2,000,000.
 SPV Credit Facility and Credit Facility 2015-1 Notes
Payment Due by PeriodDecember 31,
2017
 December 31,
2016
 December 31,
2017
 December 31,
2016
Less than 1 Year$
 $
 $
 $
1-3 Years


3-5 Years562,893
 421,885
 
 
More than 5 Years
 
 273,000
 273,000
Total$562,893
 $421,885
 $273,000
 $273,000
As of December 31, 2017 and 2016, $287,393 and $252,885, respectively, of secured borrowings were outstanding under the SPV Credit Facility, $275,500 and $169,000, respectively, were outstanding under the Credit Facility, and $273,000 of 2015-1 Notes were outstanding. For the years ended December 31, 2017, 2016 and 2015, we incurred $24,510, $16,462 and $9,582, respectively, of interest expense and $1,117, $1,253 and $847, respectively, of unused commitment fees.
OFF BALANCE SHEET ARRANGEMENTS
In the ordinary course of our business, we enter into contracts or agreements that contain indemnifications or warranties. Future events could occur which may give rise to liabilities arising from these provisions against us. We believe that the likelihood of such an event is remote; however, the maximum potential exposure is unknown. No accrual has been made in these consolidated financial statements as of December 31, 20172021 and 2016,2020, in Part II, Item 8 of this Form 10-K, for any such exposure.
We have in the past and may in the future become obligated to fund commitments such as revolving credit facilities, bridge financing commitments, or delayed draw commitments.
We had the following unfunded commitments to fund delayed draw and revolving senior secured loans as of the indicated dates:
Principal Amount as of Principal Amount as of December 31,
December 31, 2017 December 31, 2016 20212020
Unfunded delayed draw commitments$39,383
 $35,704
Unfunded delayed draw commitments$112,985 $73,292 
Unfunded revolving term loan commitments78,991
 24,063
Unfunded revolving term loan commitments67,513 76,216 
Total unfunded commitments$118,374
 $59,767
Total unfunded commitments$180,498 $149,508 
Pursuant to an undertaking by us in connection with the 2015-1 Debt Securitization, we agreed to hold on an ongoing basis the 2015-1 Issuer Preferred Interests with an aggregate dollar purchase price at least equal to 5% of the aggregate

Table of Contents

outstanding amount of all collateral obligations by the 2015-1 Issuer for so long as any securities of the 2015-1 Issuer remains outstanding. As of December 31, 20172021 and 2016,2020, we were in compliance with this undertaking.
DIVIDENDS AND DISTRIBUTIONS TO COMMON STOCKHOLDERS
Prior to July 5, 2017, we had an “opt in” dividend reinvestment plan.plan in respect of our common stock. Effective on July 5, 2017, we converted our “opt in” dividend reinvestment plan to an “opt out” dividend reinvestment plan that provides for reinvestment of our dividends and other distributions on behalf of our common stockholders, other than those common stockholders who have “opted out” of the plan. As a result of adopting the plan, if our Board of Directors authorizes, and we declare, a cash dividend or distribution on our common stock, our common stockholders who have not elected to “opt out” of our dividend reinvestment plan will have their cash dividends or distributions automatically reinvested in additional shares of our common stock, rather than receiving cash. Each registered common stockholder may elect to have such common stockholder’s dividends and distributions distributed in cash rather than participate in the plan. For any registered common stockholder that does not so elect, distributions on such common stockholder’s shares will be reinvested by State Street Bank and Trust Company, our plan administrator, in additional shares.shares of common stock. The number of shares to be issued to the common stockholder will be determined based on the total dollar amount of the cash distribution payable, net of applicable withholding taxes. We intend to use primarily newly issued shares of common stock to implement the plan so long as the market value per share is equal to or greater than the net asset value per share on the relevant valuation date. If the market value per share is less than the net asset value per share on the relevant valuation date, the plan administrator would implement the plan through the purchase of common stock on behalf of participants in the open market, unless we instruct the plan administrator otherwise.
85


Table of Contents
The following table summarizes the Company’s dividends declared per share of common stock during the twothree most recent fiscal yearsyears:
Date DeclaredRecord DatePayment DatePer Share Amount 
2019
February 22, 2019March 29, 2019April 17, 2019$0.37  
May 6, 2019June 28, 2019July 17, 20190.37  
June 17, 2019June 28, 2019July 17, 20190.08 (1)
August 5, 2019September 30, 2019October 17, 20190.37  
November 4, 2019December 31, 2019January 17, 20200.37 
December 12, 2019December 31, 2019January 17, 20200.18 (1)
Total$1.74 
2020
February 24, 2020March 31, 2020April 17, 20200.37 
May 4, 2020June 30, 2020July 17, 20200.37 
August 3, 2020September 30, 2020October 16, 20200.32 (2)
August 3, 2020September 30, 2020October 16, 20200.05 (1)
November 2, 2020December 31, 2020January 15, 20210.32 
November 2, 2020December 31, 2020January 15, 20210.04 (1)
Total$1.47 
2021
February 22, 2021March 31, 2021April 16, 2021$0.32 
February 22, 2021March 31, 2021April 16, 20210.05 (1)
May 3, 2021June 30, 2021July 15, 20210.32 
May 3, 2021June 30, 2021July 15, 20210.04 (1)
August 2, 2021September 30, 2021October 15, 20210.32 
August 2, 2021September 30, 2021October 15, 20210.06 (1)
November 1, 2021December 31, 2021January 14, 20220.32 
November 1, 2021December 31, 2021January 14, 20220.07 (1)
Total$1.50 
(1)Represents a special/supplemental dividend.
(2)The Company updated its dividend policy such that the base dividend is $0.32 per share of common stock, effective with the third quarter 2020 dividend.

Our Preferred Stock has a liquidation preference equal to $25 per share (the “Liquidation Preference) plus any accumulated but unpaid dividends up to but excluding the date of distribution. Dividends on our Preferred Stock are payable on a quarterly basis in an initial amount equal to 7.00% per annum of the Liquidation Preference per share, payable in cash, or at our option, 9.00% per annum of the Liquidation Preference payable in additional shares of Preferred Stock.
86


Table of Contents
The following table summarizes the Company’s dividends declared per share of Preferred Stock during the prior year and the current fiscal year to date:date. Unless otherwise noted, dividends declared were paid in cash.
Date Declared Record Date Payment Date Per Share Amount 
2016       
March 10, 2016 March 14, 2016 April 22, 2016 $0.40
 
June 8, 2016 June 8, 2016 July 22, 2016 $0.40
 
September 28, 2016 September 28, 2016 October 24, 2016 $0.40
 
December 29, 2016 December 29, 2016 January 24, 2017 $0.41
 
December 29, 2016 December 29, 2016 January 24, 2017 $0.07
(1)
Total     $1.68
 
2017       
March 20, 2017
 March 20, 2017
 April 24, 2017 $0.41
 
June 20, 2017 June 30, 2017 July 18, 2017 $0.37
 
August 7, 2017 September 29, 2017 October 18, 2017 $0.37
 
November 7, 2017 December 29, 2017 January 17, 2018 $0.37
 
December 13, 2017 December 29, 2017 January 17, 2018 $0.12
(1)
Total     $1.64
 
2018       
February 26, 2018 March 29, 2018 April 17, 2018 $0.37
 
(1)Date DeclaredRepresents a special dividend.Record DatePayment DatePer Share Amount
2020
June 30, 2020June 30, 2020September 30, 2020$0.277 
September 30, 2020September 30, 2020September 30, 20200.423 
December 31, 2020December 31, 2020December 31, 20200.438 
Total$1.138 
2021
March 31, 2021March 31, 2021March 31, 2021$0.438 
June 30, 2021June 30, 2021June 30, 20210.438 
September 30, 2021September 30, 2021September 30, 20210.438 
December 29, 2021December 31, 2021December 31, 20210.438 
Total$1.752 
ASSET COVERAGE
In accordance with the Investment Company Act, a BDC is only allowed to borrow amounts such that its “asset coverage,” as defined in the Investment Company Act, satisfies the minimum asset coverage ratio specified in the Investment Company Act after such borrowing. “Asset coverage” generally refers to a company’s total assets, less all liabilities and indebtedness not represented by “senior securities,” as defined in the Investment Company Act, divided by total senior securities representing indebtedness and, if applicable, preferred stock. “Senior securities” for this purpose includes borrowings from banks or other lenders, debt securities and preferred stock.
Prior to March 23, 2018, BDCs were required to maintain a minimum asset coverage ratio of 200%. On March 23, 2018, an amendment to Section 61(a) of the Investment Company Act was signed into law to permit BDCs to reduce the minimum asset coverage ratio from 200% to 150%, so long as certain approval and disclosure requirements are satisfied. Under the 200% minimum asset coverage ratio, BDCs are permitted to borrow up to one dollar for investment purposes for every one dollar of investor equity, and under the 150% minimum asset coverage ratio, BDCs are permitted to borrow up to two dollars for investment purposes for every one dollar of investor equity. In other words, Section 61(a) of the 1940 Act, as amended, permits BDCs to potentially increase their debt-to-equity ratio from a maximum of 1 to 1 to a maximum of 2 to 1.
On April 9, 2018 and June 6, 2018, the Board of Directors, including a “required majority” (as such term is defined in Section 57(o) of the Investment Company Act), and the stockholders of the Company, respectively, approved the application to the Company of the 150% minimum asset coverage ratio set forth in Section 61(a)(2) of the 1940 Act. As a result, the minimum asset coverage ratio applicable to the Company was reduced from 200% to 150%, effective as of June 7, 2018.
On April 8, 2020, the SEC issued an order (Release No. 33837) providing temporary, conditional exemptive relief from certain Investment Company Act provisions for BDCs, including relief permitting BDCs to issue additional senior securities to meet liquidity needs subject to compliance with a reduced asset coverage ratio. The relief is subject to investor protection conditions, including specific requirements for obtaining an independent evaluation of the terms of the senior securities, limits on new investments and approval by a majority of a BDC’s independent board members as well as public disclosure in the case of the issuance of senior securities pursuant to the reduced asset coverage ratio.These exemptions are in effect through the earlier of December 31, 2020 or the date by which a BDC ceases to rely on the order. The Company did not utilize this relief.
As of December 31, 2021 and 2020, the Company had total senior securities of $1,096,855 and $1,037,149, respectively, consisting of secured borrowings under the Credit Facility, the Senior Notes, the 2015-1R Notes and the Preferred Stock, and had asset coverage ratios of 181.94% and 182.09%, respectively. For a discussion of the principal risk factors associated with these senior securities, see Part I, Item 1A of this Form 10‑K. For purposes of the asset coverage ratio, the Preferred Stock is classified as a senior security.
87


Table of Contents
CRITICAL ACCOUNTING POLICIES AND ESTIMATES
The preparation of our consolidated financial statements in conformity with U.S. GAAP requires us to make estimates and assumptions that affect the reported amounts of assets, liabilities, revenues, and expenses. These estimates and judgments are based on historical information, information currently available to us and on various other assumptions management believes to be reasonable under the circumstances. Actual results could vary from those estimates and we may change our estimates and assumptions in future evaluations. Changes in the economic environment,these estimates and assumptions may have a material effect on our results of operations and financial markets, and any other parameters used in determining such estimates could cause actual results to differ. Ourcondition. We believe the critical accounting policies including those relating todiscussed below affect our more significant judgments and estimates used in the valuationpreparation of our investment portfolio, are described below. The critical accounting policiesconsolidated financial statements and should be read in connectionconjunction with our consolidated financial statements and related notes in Part II, Item 8, as well as with our “Risk Factors” in Part I, Item 1A of this Form 10-K.
Fair Value Measurements
The Company applies fair value accounting in accordance with the terms of Financial Accounting Standards Board ASC Topic 820, Fair Value Measurement (“ASC 820”). ASC 820 defines fair value as the amount that would be exchanged to sell an asset or transfer a liability in an orderly transfer between market participants at the measurement date. The Company

Table of Contents

values securities/instruments traded in active markets on the measurement date by multiplying the closing price of such traded securities/instruments by the quantity of shares or amount of the instrument held. The Company may also obtain quotes with respect to certain of its investments, such as its securities/instruments traded in active markets and its liquid securities/instruments that are not traded in active markets, from pricing services, brokers, or counterparties (i.e. “consensus pricing”). When doing so, the Company determines whether the quote obtained is sufficient according to USU.S. GAAP to determine the fair value of the security. The Company may use the quote obtained or alternative pricing sources may be utilized including valuation techniques typically utilized for illiquid securities/instruments.
Securities/instruments that are illiquid or for which the pricing source does not provide a valuation or methodology or provides a valuation or methodology that, in the judgment of the Investment Adviser or the Board of Directors, does not represent fair value shall each be valued as of the measurement date using all techniques appropriate under the circumstances and for which sufficient data is available. These valuation techniques may vary by investment and include comparable public market valuations, comparable precedent transaction valuations and/or discounted cash flow analyses. The process generally used to determine the applicable value is as follows: (i) the value of each portfolio company or investment is initially reviewed by the investment professionals responsible for such portfolio company or investment and, for non-traded investments, a standardized template designed to approximate fair market value based on observable market inputs, updated credit statistics and unobservable inputs is used to determine a preliminary value, which is also reviewed alongside consensus pricing, where available; (ii) preliminary valuation conclusions are documented and reviewed by a valuation committee comprised of members of senior management; (iii) the Board of Directors engages a third-party valuation firm to provide positive assurance on portions of the Middle Market Senior Loans and equity investments portfolio each quarter (such that each non-traded investment other than Credit Fund and Credit Fund II is reviewed by a third-party valuation firm at least once on a rolling twelve month basis) including a review of management’s preliminary valuation and conclusion on fair value; (iv) the Audit Committee of the Board of Directors (the “Audit Committee”) reviews the assessments of the Investment Adviser and the third-party valuation firm and provides the Board of Directors with any recommendations with respect to changes to the fair value of each investment in the portfolio; and (v) the Board of Directors discusses the valuation recommendations of the Audit Committee and determines the fair value of each investment in the portfolio in good faith based on the input of the Investment Adviser and, where applicable, the third-party valuation firm.
All factors that might materially impact the value of an investment are considered, including, but not limited to the assessment of the following factors, as relevant:
the nature and realizable value of any collateral;
call features, put features and other relevant terms of debt;
the portfolio company’s leverage and ability to make payments;
the portfolio company’s public or private credit rating;
the portfolio company’s actual and expected earnings and discounted cash flow;
prevailing interest rates and spreads for similar securities and expected volatility in future interest rates;
the markets in which the portfolio company does business and recent economic and/or market events; and
comparisons to comparable transactions and publicly traded securities.
88


Table of Contents
Investment performance data utilized are the most recently available financial statements and compliance certificate received from the portfolio companies as of the measurement date which in many cases may reflect a lag in information.
Due to the inherent uncertainty of determining the fair value of investments that do not have a readily available market value, the fair value of the Company’s investments may fluctuate from period to period. Because of the inherent uncertainty of valuation, these estimated values may differ significantly from the values that would have been reported had a ready market for the investments existed, and it is reasonably possible that the difference could be material.
In addition, changes in the market environment and other events that may occur over the life of the investments may cause the realized gains or losses on investments to be different from the net change in unrealized appreciation or depreciation currently reflected in the consolidated financial statements as of December 31, 20172021 and 2016.2020.
USU.S. GAAP establishes a hierarchical disclosure framework which ranks the level of observability of market price inputs used in measuring investments at fair value. The observability of inputs is impacted by a number of factors, including the type of investment and the characteristics specific to the investment and state of the marketplace, including the existence and transparency of transactions between market participants. Investments with readily available quoted prices or for which fair

Table of Contents

value can be measured from quoted prices in active markets generally have a higher degree of market price observability and a lesser degree of judgment applied in determining fair value.
Investments measured and reported at fair value are classified and disclosed basedFor further information on the observability of inputs used in determination of fair values, as follows:
Level 1—inputs to the valuation methodology are quoted prices available in active markets for identical investments as of the reporting date. The types of financial instruments included in Level 1 generally include unrestricted securities, including equities and derivatives, listed in active markets. The Company does not adjust the quoted price for these investments, even in situations where the Company holds a large position and a sale could reasonably impact the quoted price.
Level 2—inputs to the valuation methodology are either directly or indirectly observable as of the reporting date and are those other than quoted prices in active markets. The type of financial instruments in this category generally includes less liquid and restricted securities listed in active markets, securities traded in other than active markets, government and agency securities, and certain over-the-counter derivatives where the fair value is based on observable inputs.
Level 3—inputs to the valuation methodology are unobservable and significant to overallhierarchies, our framework for determining fair value, measurement. The inputs intoand the determinationcomposition of fair value require significant management judgment or estimation. Financial instruments that are included in this category generally include investments in privately-held entities, collateralized loan obligations, and certain over-the-counter derivatives where the fair value is based on unobservable inputs.
In certain cases, the inputs used to measure fair value may fall into different levels of the fair value hierarchy. In such cases, an investment’s level within the fair value hierarchy is based on the lowest level of input that is significant to the overall fair value measurement. The Investment Adviser’s assessment of the significance of a particular input to the fair value measurement in its entirety requires judgment, and considers factors specific to the investment.
Transfers between levels, if any, are recognized at the beginning of the quarter in which the transfers occur.
The Company generally uses the following framework when determining the fair value of investments that are categorized as Level 3:
Investments in debt securities are initially evaluated to determine whether the enterprise value of theour portfolio, company is greater than the applicable debt. The enterprise value of the portfolio company is estimated using a market approach and an income approach. The market approach utilizes market value (EBITDA) multiples of publicly traded comparable companies and available precedent sales transactions of comparable companies. The Company carefully considers numerous factors when selecting the appropriate companies whose multiples are used to value its portfolio companies. These factors include, but are not limited to, the type of organization, similarity to the business being valued, relevant risk factors, as well as size, profitability and growth expectations. The income approach typically uses a discounted cash flow analysis of the portfolio company.
Investments in debt securities that do not have sufficient coverage through the enterprise value analysis are valued based on an expected probability of default and discount recovery analysis.
Investments in debt securities with sufficient coverage through the enterprise value analysis are generally valued using a discounted cash flow analysis of the underlying security. Projected cash flows in the discounted cash flow typically represent the relevant security’s contractual interest, fees and principal payments plus the assumption of full principal recovery at the security’s expected maturity date. The discount rate to be used is determined using an average of two market-based methodologies. Investments in debt securities may also be valued using consensus pricing.
Investments in structured finance obligations are generally valued using a discounted cash flow and/or consensus pricing.
Investments in equities are generally valued using a market approach and/or an income approach. The market approach utilizes EBITDA multiples of publicly traded comparable companies and available precedent sales transactions of comparable companies. The income approach typically uses a discounted cash flow analysis of the portfolio company.

Table of Contents

Investments in Credit Fund’s subordinated loan and member’s interest are valued using the net asset value of the Company’s ownership interest in the funds and investments in Credit Fund’s mezzanine loans are valued using discounted cash flow analysis with expected repayment rate of principal and interest.
The significant unobservable inputs used in the fair value measurement of the Company’s investments in first and second lien debt securities are discount rates, indicative quotes and comparable EBITDA multiples. Significant increases in discount rates would result in a significantly lower fair value measurement. Significant decreases in indicative quotes or comparable EBITDA multiples in isolation may result in a significantly lower fair value measurement.

The significant unobservable inputs used in the fair value measurement of the Company’s investments in structured finance obligations are discount rates, default rates, prepayment rates, recovery rates and indicative quotes. Significant increases in discount rates, default rates or prepayment rates in isolation would result in a significantly lower fair value measurement, while a significant increase in recovery rates in isolation would result in a significantly higher fair value. Significant decreases in indicative quotes in isolation may result in a significantly lower fair value measurement.
The significant unobservable inputs used in the fair value measurement of the Company’s investments in equities are discount rates and comparable EBITDA multiples. Significant increases in discount rates would result in a significantly lower fair value measurement. Significant decreases in comparable EBITDA multiples would result in a significantly lower fair value measurement.
The carrying values of the secured borrowings and 2015-1 Notes approximate their respective fair values and are categorized as Level 3 within the hierarchy. Secured borrowings are valued generally using discounted cash flow analysis. The significant unobservable inputs used in the fair value measurement of the Company’s secured borrowings are discount rates. Significant increases in discount rates would result in a significantly lower fair value measurement. The fair value determination of the Company’s 2015-1 Notes was based on the market quotation(s) received from broker/dealer(s). These fair value measurements were based on significant inputs not observable and thus represent Level 3 measurements as defined in the accounting guidance for fair value measurement.
The carrying value of other financial assets and liabilities approximates their fair value based on the short term nature of these items.
Seesee Note 3 to the consolidated financial statements in Part II, Item 8 of this Form 10-K for further information on fair value measurements.
Use of Estimates
The preparation of consolidated financial statements in Part II, Item 8 of this Form 10-K in conformity with US GAAP requires management to make assumptions and estimates that affect the reported amounts of assets and liabilities and disclosure of contingent assets and liabilities at the date of the financial statements and the reported amounts of revenues and expenses during the reporting period. Management’s estimates are based on historical experiences and other factors, including expectations of future events that management believes to be reasonable under the circumstances. It also requires management to exercise judgment in the process of applying the Company’s accounting policies. Assumptions and estimates regarding the valuation of investments and their resulting impact on base management and incentive fees involve a higher degree of judgment and complexity and these assumptions and estimates may be significant to the consolidated financial statements in Part II, Item 8 of this Form 10-K. Actual results could differ from these estimates and such differences could be material.
Investments
Investment transactions are recorded on the trade date. Realized gains or losses are measured by the difference between the net proceeds from the repayment or sale and the amortized cost basis of the investment using the specific identification method without regard to unrealized appreciation or depreciation previously recognized, and includes investments charged off during the period, net of recoveries. Net change in unrealized appreciation or depreciation on investments as presented in the Consolidated Statements of Operations in Part II, Item 8 of this Form 10-K reflects the net change in the fair value of investments, including the reversal of previously recorded unrealized appreciation or depreciation when gains or losses are realized.


Table of Contents


Revenue Recognition
Interest from Investments and Realized Gain/Loss on Investments
Interest income is recorded on an accrual basis and includes the accretion of discounts and amortization of premiums. Discounts from and premiums to par value on debt investments purchased are accreted/amortized into interest income over the life of the respective security using the effective interest method. The amortized cost of debt investments represents the original cost, including origination fees and upfront fees received that are deemed to be an adjustment to yield, adjusted for the accretion of discounts and amortization of premiums, if any. At time of exit, the realized gain or loss on an investment is the difference between the amortized cost at time of exit and the cash received at exit using the specific identification method.
The Company may have loans in its portfolio that contain payment-in-kind (“PIK”) provisions. PIK represents interest that is accrued and recorded as interest income at the contractual rates, increases the loan principal on the respective capitalization dates, and is generally due at maturity. Such income is included in interest income in the Consolidated Statements of Operations included in Part II, Item 8 of this Form 10-K.
Dividend Income
Dividend income from the investment fund is recorded on the record date for the investment fund to the extent that such amounts are payable by the investment fund and are expected to be collected.
Other Income
Other income may include income such as consent, waiver, amendment, syndication and prepayment fees associated with the Company’s investment activities as well as any fees for managerial assistance services rendered by the Company to the portfolio companies. Such fees are recognized as income when earned or the services are rendered. The Company may receive fees for guaranteeing the outstanding debt of a portfolio company. Such fees are amortized into other income over the life of the guarantee. The unamortized amount, if any, is included in other assets in the Consolidated Statements of Assets and Liabilities included in Part II, Item 8 of this Form 10-K.
Non-Accrual Income
Loans are generally placed on non-accrual status when principal or interest payments are past due 30 days or more or when there is reasonable doubt that principal or interest will be collected in full. Accrued and unpaid interest is generally reversed when a loan is placed on non-accrual status. Interest payments received on non-accrual loans may be recognized as income or applied to principal depending upon management’s judgment regarding collectability. Non-accrual loans are restored to accrual status when past due principal and interest are paid current and, in management’s judgment, are likely to remain current. Management may determine not to place a loan on non-accrual status if the loan has sufficient collateral value and is in the process of collection.
Income Taxes
For federal income tax purposes, the Company has elected to be treated as a RIC under the Code, and intends to make the required distributions to its stockholders as specified therein. In order to qualify as a RIC, the Company must meet certain minimum distribution, source-of-income and asset diversification requirements. If such requirements are met, then the Company is generally required to pay income taxes only on the portion of its taxable income and gains it does not distribute.

The minimum distribution requirements applicable to RICs require the Company to distribute to its stockholders at least 90% of its investment company taxable income (“ICTI”), as defined by the Code, each year. Depending on the level of ICTI earned in a tax year, the Company may choose to carry forward ICTI in excess of current year distributions into the next tax year. Any such carryover ICTI must be distributed before the end of that next tax year through a dividend declared prior to filing the final tax return related to the year which generated such ICTI.
In addition, based on the excise distribution requirements, the Company is subject to a 4% nondeductible federal excise tax on undistributed income unless the Company distributes in a timely manner an amount at least equal to the sum of (1)
89


Table of Contents
98% of its ordinary income for each calendar year, (2) 98.2% of capital gain net income (both long-term and short-term) for the one-year period ending October 31 in that calendar year and (3) any income realized, but not distributed, in the preceding year. For this purpose, however, any ordinary income or capital gain net income retained by the Company that is subject to

Table of Contents

corporate income tax is considered to have been distributed. The Company intends to make sufficient distributions each taxable year to satisfy the excise distribution requirements.
The Company evaluates tax positions taken or expected to be taken in the course of preparing its consolidated financial statements to determine whether the tax positions are “more-likely than not” to be sustained by the applicable tax authority. All penalties and interest associated with income taxes, if any, are included in income tax expense.
The SPV and the 2015-1 Issuer are disregarded entities for tax purposes and are consolidated with the tax return of the Company.
Dividends and Distributions to Common Stockholders
To the extent that the Company has taxable income available, the Company intends to make quarterly distributions to its common stockholders. Dividends and distributions to common stockholders are recorded on the record date. The amount to be distributed is determined by the Board of Directors each quarter and is generally based upon the taxable earnings estimated by management and available cash. Net realized capital gains, if any, are generally distributed at least annually, although the Company may decide to retain such capital gains for investment.
RELATED PARTY TRANSACTIONS
Investment Advisory Agreement
On April 3, 2013, the Company’s Board of Directors, including a majority of the directors who are not “interested persons” as defined in Section 2(a)(19) of the Investment Company Act (the “Independent Directors”), approved an investment advisory agreement (the “Original Investment Advisory Agreement”) between the Company and the Investment Adviser in accordance with, and on the basis of an evaluation satisfactory to such directors as required by, Section 15(c) of the Investment Company Act.
The Original Investment Advisory Agreement was amended on September 15, 2017 (as amended, the “Investment“First Amended and Restated Investment Advisory Agreement”) after the approval of the Company’s Board of Directors, including a majority of the Independent Directors, at an in-person meeting of the Board of Directors held on May 30, 2017 and the approval of the Company’s stockholders at a special meeting of stockholders held on September 15, 2017. The Investment Advisory Agreement was amended, among other things, to (i) reduce the incentive fee payable by the Company to the Investment Adviser from an annual rate of 20% to an annual rate of 17.5%, (ii) delete the incentive fee payment deferral test described below, and (iii) include in the pre-incentive fee net investment income, in the case of investments with a deferred interest feature, accrued income that the Company has not yet received in cash. The initial term of the Investment Advisory Agreement is two years from September 15, 2017 and unlessAugust 6, 2018 (as amended, the “Investment Advisory Agreement”). Unless terminated earlier, the Investment Advisory Agreement will renewrenews automatically for successive annual periods, provided that such continuance is specifically approved at least annually by the vote of the Board of Directors and by the vote of a majority of the Independent Directors. On May 26, 2021, the Company's Board of Directors, including a majority of the Independent Directors, approved the continuance of the Company's Investment Advisory Agreement with the Adviser for an additional one-year term. Pursuant to relief granted by the SEC in light of the COVID-19 pandemic (the "Order") and a determination by the Board of Directors that reliance on the order was appropriate due to circumstances related to the current or potential side-effects of COVID-19, the May 26, 2021 meeting was held by video- and telephone-conference. The Investment Advisory Agreement will automatically terminate in the event of an assignment and may be terminated by either party without penalty upon at least 60 days’ written notice to the other party. Subject to the overall supervision of the Board of Directors, the Investment Adviser provides investment advisory services to the Company. For providing these services, the Investment Adviser receives fees from the Company consisting of two components—a base management fee and an incentive fee.
Effective September 15, 2017, theThe base management fee ishas been calculated and payable quarterly in arrears at an annual rate of 1.50% of the average value of the gross assets at the end of the two most recently completed fiscal quarters, except for the first quarter following the IPO, in which casequarters; provided, however, effective July 1, 2018, the base management fee ishas been calculated based onat an annual rate of 1.00% of the Company’saverage value of the gross assets as of the end of such fiscal quarter. In each case, the two most recently completed calendar quarters that exceeds the product of (A) 200% and (B) the average value of the Company’s net asset value at the end of the two most recently completed calendar quarters. The base management fee will be appropriately adjusted for any share issuances or repurchases during such fiscal quarter and the base management fees for any partial month or quarter will be pro-rated. The Company’s gross assets exclude any cash and cash equivalents and include assets acquired through the incurrence of debt from use of the SPV Credit Facility, Credit Facility and 2015-1 Notes (see Note 6,7, Borrowings, and Note 7, 2015-1 Notes)8, Notes Payable, to the consolidated financial statements in Part II, Item 8 of this Form 10-K). For purposes of this calculation, cash and cash equivalents include any temporary investments in cash-equivalents, U.S. government securities and other high quality investment grade debt investments that mature in 12 months or less from the date of investment.
Prior to September 15, 2017, under the Original Investment Advisory Agreement, the base management fee was calculated and payable quarterly in arrears at an annual rate of 1.50% of the average daily gross assets of the Company for the period adjusted for share issuances or repurchases. Prior to the IPO, the Investment Adviser waived its right to receive one-third (0.50%) of the 1.50% base management fee. Any waived base management fees are not subject to recoupment by the Investment Adviser.

Table of Contents

The fee waiver terminated when the IPO had been consummated. As previously disclosed, in connection with the IPO, the Investment Adviser has agreed to continue the fee waiver until the completion of the first full quarter after the consummation of the IPO. As a result, beginning October 1, 2017, the base management fee is calculated at an annual rate of 1.50% of the Company’s gross assets, excluding cash and cash equivalents.
The incentive fee has two parts. The first part is calculated and payable quarterly in arrears based on the pre-incentive fee net investment income for the immediately preceding calendar quarter. The second part is determined and payable in arrears based on capital gains as of the end of each calendar year.
Pre-incentive fee net investment income means interest income, dividend income and any other income (including any other fees (other than fees for providing managerial assistance), such as commitment, origination, structuring, diligence and consulting fees or other fees that the Company receives from portfolio companies) accrued during the calendar quarter, minus the operating expenses accrued for the quarter (including the base management fee, expenses payable under the administration
90


Table of Contents
agreement, and any interest expense or fees on any credit facilities or outstanding debt and dividends paid on any issued and outstanding preferred stock, but excluding the incentive fee). Pre-incentive fee net investment income includes, in the case of investments with a deferred interest feature, accrued income that the Company has not yet received in cash. Pre-incentive fee net investment income does not include any realized capital gains, realized capital losses or unrealized capital appreciation or depreciation.
Effective September 15, 2017, pre-incentivePre-incentive fee net investment income, expressed as a rate of return on the value of our net assets at the end of the immediately preceding calendar quarter, will beis compared to a “hurdle rate” of 1.50% per quarter (6% annualized) or a “catch-up rate” of 1.82% per quarter (7.28% annualized), as applicable.
Pursuant to the Investment Advisory Agreement, the Company pays its Investment Adviser an incentive fee with respect to its pre-incentive fee net investment income in each calendar quarter as follows:
 
no incentive fee based on pre-incentive fee net investment income in any calendar quarter in which its pre-incentive fee net investment income does not exceed the hurdle rate of 1.50%;
100% of pre-incentive fee net investment income with respect to that portion of such pre-incentive fee net investment income, if any, that exceeds the hurdle rate but is less than 1.82% in any calendar quarter (7.28% annualized). The Company refers to this portion of the pre-incentive fee net investment income (which exceeds the hurdle rate but is less than 1.82%) as the “catch-up.” The “catch-up” is meant to provide the Investment Adviser with approximately 17.5% of the Company’s pre-incentive fee net investment income as if a hurdle rate did not apply if this net investment income exceeds 1.82% in any calendar quarter; and
17.5% of the amount of pre-incentive fee net investment income, if any, that exceeds 1.82% in any calendar quarter (7.28% annualized) will be payable to the Investment Adviser. This reflects that once the hurdle rate is reached and the catch-up is achieved, 17.5% of all pre-incentive fee investment income thereafter is allocated to the Investment Adviser.
The second part of the incentive fee is determined and payable in arrears as of the end of each calendar year (or upon termination of the Investment Advisory Agreement, as of the termination date), and equals 17.5% of realized capital gains, if any, on a cumulative basis from inception through the date of determination, computed net of all realized capital losses on a cumulative basis and unrealized capital depreciation, less the aggregate amount of any previously paid capital gain incentive fees, provided that, the incentive fee determined at the end of the first calendar year of operations may be calculated for a period of shorter than twelve calendar months to take into account any realized capital gains computed net of all realized capital losses on a cumulative basis and unrealized capital depreciation.
Prior to the September 15, 2017, under the Original Investment Advisory Agreement, pre-incentive fee net investment income, which did not include, in the case of investments with a deferred interest feature, accrued income that the Company has not yet received in cash, and was expressed as a rate of return on the average daily Hurdle Calculation Value (as defined below) throughout the immediately preceding calendar quarter, was compared to a “hurdle rate” of 1.50% per quarter (6% annualized) or a “catch-up” of 1.875% per quarter (7.50% annualized), as applicable. “Hurdle Calculation Value” meant, on any given day, the sum of (x) the value of net assets as of the end of the calendar quarter immediately preceding such day plus (y) the aggregate amount of capital drawn from investors (or reinvested in the Company pursuant to a dividend reinvestment plan) from the beginning of the current quarter to such day minus (z) the aggregate amount of distributions (including share repurchases) made by the Company from the beginning of the current quarter to such day, but only to the extent such distributions were not declared and accounted for on the books and records in a previous quarter. In addition, under the

Table of Contents

Original Investment Advisory Agreement, the Company deferred payment of any incentive fee otherwise earned by the Investment Adviser if, during the most recent four full calendar quarter periods ending on or prior to the date such payment is to be made, the sum of (a) the aggregate distributions to stockholders and (b) the change in net assets (defined as gross assets less indebtedness and before taking into account any incentive fees payable during the period) is less than 6.0% of net assets (defined as gross assets less indebtedness) at the beginning of such period. These calculations were adjusted for any share issuances or repurchases. Any deferred incentive fees were carried over for payment in subsequent calculation periods.
As previously disclosed, in connection with the IPO, the Investment Adviser agreed to charge 17.5% instead of 20% with respect to, or effectively waive 2.5% from, the entire calculation of the incentive fee beginning on the first full quarter following the consummation of the IPO until the earlier of (i) October 1, 2017 and (ii) the date that the Company’s stockholders vote on the approval of the amendment to the Original Investment Advisory Agreement. The Company’s stockholders voted to approve the Investment Advisory Agreement on September 15, 2017.
On April 3, 2013, the Investment Adviser entered into a personnel agreement with Carlyle Employee Co., pursuant to which Carlyle Employee Co. provides the Investment Adviser with access to investment professionals.
Administration Agreement
On April 3, 2013, the Company’s Board of Directors approved an administration agreement (the “Administration Agreement”) between the Company and the Administrator. Pursuant to the Administration Agreement, the Administrator provides services and receives reimbursements equal to an amount that reimburses the Administrator for its costs and expenses and the Company’s allocable portion of overhead incurred by the Administrator in performing its obligations under the Administration Agreement, including the Company’s allocable portion of the compensation paid to or compensatory distributions received by the Company’s officers (including the Chief Compliance Officer and Chief Financial Officer) and respective staff who provide services to the Company, operations staff who provide services to the Company, and any internal audit staff, to the extent internal audit performs a role in the Company’s Sarbanes-Oxley Act internal control assessment. Reimbursement under the Administration Agreement occurs quarterly in arrears.
The initial term of the Administration Agreement was two years from April 3, 2013 and, unlessUnless terminated earlier, the Administration Agreement will renewrenews automatically for successive annual periods, provided that such continuance is specifically approved at least annually by (i) the vote of the Board of Directors or by a majority vote of the outstanding voting securities of the Company and (ii) the vote of a majority of the Company’s Independent Directors. On March 20, 2017,May 26, 2021, the Company’s Board of Directors, including a majority of the Independent Directors, approved the continuance of the Administration Agreement for a one year period. The Administration Agreement may not be assigned by a party without the consent of the other party and may be terminated by either party without penalty upon at least 60 days’ written notice to the other party.
91


Table of Contents
Sub-Administration Agreements
On April 3, 2013, the Administrator entered into a sub-administration agreementsagreement with Carlyle Employee Co. and CELF Advisors LLP (“CELF”) (the “Carlyle Sub-Administration Agreements”Agreement”). Pursuant to the Carlyle Sub-Administration Agreements,Agreement, Carlyle Employee Co. and CELF provideprovides the Administrator with access to personnel.
On April 3, 2013, the Administrator entered into a sub-administration agreement with State Street Bank and Trust Company (“State Street” and, such agreement,), which was amended on March 11, 2015 (as amended, the “State Street Sub-Administration Agreement” and, together with the Carlyle Sub-Administration Agreements,Agreement, the “Sub-Administration Agreements”). On March 11, 2015, the Company’s Board of Directors, including a majority of the Independent Directors, approved an amendment to the State Street Sub-Administration Agreement. The initial term of the State Street Sub-Administration Agreement ends on April 1, 2017 and, unlessUnless terminated earlier, the State Street Sub-Administration Agreement will renewrenews automatically for successive annual periods, provided that such continuance is specifically approved at least annually by (i) the vote of the Board of Directors or by the vote of a majority of the outstanding voting securities of the Company and (ii) the vote of a majority of the Company’s Independent Directors. On May 26, 2021, the Company’s Board of Directors, including a majority of the Independent Directors, approved the continuance of the State Street Sub-Administration Agreement for a one year period. The State Street Sub-Administration Agreement may be terminated upon at least 60 days’ written notice and without penalty by the vote of a majority of the outstanding securities of the Company, or by the vote of the Board of Directors or by either party to the State Street Sub-Administration Agreement.
Placement FeesLicense Agreement

Table of Contents

On April 3, 2013, theThe Company has entered into a placement fee arrangementroyalty free license agreement with TCG Securities,Carlyle Investment Management L.L.C. (“TCG”CIM”), which wholly owns our Adviser and is a licensed broker-dealerwholly owned subsidiary of Carlyle, pursuant to which CIM has granted the Company a non-exclusive, revocable and an affiliate ofnon-transferable license to use the Investment Adviser, which may require stockholders to pay a placement fee to TCG for TCG’s services. At the time of the IPO, the placement fee arrangement with TCG was automatically terminated.name and mark “Carlyle.”
Board of Directors
The Company’s Board of Directors currently consists of fiveseven members, threefive of whom are Independent Directors. On April 3, 2013, the Board of Directors established an Audit Committee consisting of its Independent Directors. The Board of Directors alsohas established a Pricingan Audit Committee, of the Board of Directors, a Nominating and Governance Committee of the Board of Directors and a Compensation Committee, of the Board of Directors, and may establish additional committees in the future.
Transactions with Investment Funds
During the years ended December 31, 2021, 2020 and 2019, the Company sold 8, 4 and 2 investments, respectively, to Credit Fund for proceeds of $118,204, $62,754 and $34,728, respectively, and realized gains (losses) of $1,075, $(2,289) and $208, respectively. See Note 5, Middle Market Credit Fund, LLC, to the consolidated financial statements in Part II, Item 8 of this Form 10-K.
During the year ended December 31, 2021, the Company sold 17 investments to Credit Fund II for proceeds of $84,554 and realized gains (losses) of $468. The Company did not sell any investments to Credit Fund II during the years ended December 31, 2020 and 2019. On November 3, 2020, pursuant to a contribution agreement by and between the Company and Credit Fund II, the Company contributed 45 senior secured debt investments with an aggregate principal balance of approximately $250 million to Credit Fund II in exchange for approximately 84.13% of Credit Fund II’s membership interests and gross cash proceeds of approximately $170 million. There were no subsequent transfers through December 31, 2020. See Note 6, Middle Market Credit Fund II, LLC, to the consolidated financial statements in Part II, Item 8 of this Form 10-K for further information about Credit Fund II.
Transactions with Carlyle
On May 5, 2020, the Company issued and sold 2,000,000 shares of the Preferred Stock to an affiliate of Carlyle in a private placement at a price of $25 per share. See Note 10, Net Assets, to the consolidated financial statements in Part II, Item 8 of this Form 10-K for further information about the Preferred Stock.
In December 2020, the Company paid an affiliate of Carlyle a fee of $562 for underwriting services rendered in connection with the issuance of the 2020 Notes in the amount of 0.75% of the aggregate principal amount of the 2020 Notes. See Note 8, Notes Payable, to the consolidated financial statements in Part II, Item 8 of this Form 10-K for further information about the 2020 Notes.
92


Table of Contents
Item 7A. Quantitative and Qualitative Disclosures About Market Risk
We are subject to financial market risks, including changes in the valuations of our investment portfolio and interest rates.
Valuation Risk
Our investments may not have a readily available market price, and we value these investments at fair value as determined in good faith by our Board of Directors in accordance with our valuation policy. There is no single standard for determining fair value in good faith. As a result, determining fair value requires that judgment be applied to the specific facts and circumstances of each portfolio investment while employing a consistently applied valuation process for the types of investments we make. Due to the inherent uncertainty of determining the fair value of investments that do not have a readily available market value, the fair value of our investments may fluctuate from period to period. BecauseIn addition, because of the inherent uncertainty of valuation, these estimated values may differ significantly from the values that would have been used had a ready market for the investments existed, and it is possible that the difference could be material.
Interest Rate Risk
As of December 31, 2017,2021, on a fair value basis, approximately 1%1.6% of our debt investments bear interest at a fixed rate and approximately 99%98.4% of our debt investments bear interest at a floating rate, which primarily are subject to interest rate floors. Interest rates onAdditionally, the investments held within our portfolio of investments are typically based on floating LIBOR, with many of these investments also having a LIBOR floor. Additionally, our Facilities areCredit Facility is also subject to floating interest rates and areis currently paid based on floating LIBOR rates.
Interest rate sensitivity refers to the change in earnings that may result from changes in the level of interest rates. There can be no assurance that a significant change in market interest rates will not have a material adverse effect on our income in the future.
The following table estimates the potential changes in net cash flow generated from interest income, should interest rates increase or decrease by 100, 200 or 300 basis points. Interest income is calculated as revenue from interest generated from our settled portfolio of debt investments held as of December 31, 2017 and 2016, excluding structured finance obligations and Credit Fund. These hypothetical interest income calculations are based on a model of the settled debt investments in our portfolio, excluding structured finance obligations and our investments in Credit Fund and Credit Fund II, held as of December 31, 20172021 and 2016,2020, and are only adjusted for assumed changes in the underlying base interest rates and the impact of that change on interest income. Interest expense is calculated based on outstanding secured borrowings and 2015-1 Notesnotes payable as of December 31, 20172021 and 20162020 and based on the terms of our Facilities and 2015-1 Notes.notes payable. Interest expense on our FacilitiesCredit Facility and 2015-1 Notesnotes payable is calculated using the stated interest rate as of December 31, 20172021 and 2016,2020, adjusted for the hypothetical changes in rates, as shown below. We intend to continue to finance a portion of our investments with borrowings and the interest rates paid on our borrowings may impact significantly our net interest income.

We regularly measure exposure to interest rate risk. We assess interest rate risk and manage interest rate exposure on an ongoing basis by comparing our interest rate sensitive assets to our interest rate sensitive liabilities. Based on that review, we determine whether or not any hedging transactions are necessary to mitigate exposure to changes in interest rates.
Based on our Consolidated Statements of Assets and Liabilities as of December 31, 20172021 and 2016,2020, the following table shows the annual impact on net investment income of base rate changes in interest rates for our settled debt investments

Table of Contents

(considering (considering interest rate floors for variable rate instruments), excluding structured finance obligationsour investments in Credit Fund and Credit Fund II, and outstanding secured borrowings and 2015-1 Notesnotes payable assuming no changes in our investment and borrowing structure:
 As of December 31, 2021As of December 31, 2020
Basis Point ChangeInterest
Income
Interest
Expense
Net
Investment
Income
Interest
Income
Interest
Expense
Net
Investment
Income
Up 300 basis points$34,923 $(24,832)$10,091 $35,024 $(23,164)$11,860 
Up 200 basis points$19,935 $(16,513)$3,422 $20,031 $(15,443)$4,588 
Up 100 basis points$4,954 $(8,195)$(3,241)$5,040 $(7,721)$(2,681)
Down 100 basis points$(147)$1,083 $936 $(260)$1,570 $1,310 
Down 200 basis points$(147)$1,083 $936 $(260)$1,570 $1,310 
Down 300 basis points$(147)$1,083 $936 $(260)$1,570 $1,310 
93
  As of December 31, 2017 As of December 31, 2016
Basis Point Change 
Interest
Income
 
Interest
Expense
 
Net
Investment
Income
 
Interest
Income
 
Interest
Expense
 
Net
Investment
Income
Up 300 basis points $52,780
 $(24,325) $28,455
 $40,324
 $(20,037) $20,287
Up 200 basis points $35,187
 $(16,217) $18,970
 $26,848
 $(13,358) $13,490
Up 100 basis points $17,593
 $(8,108) $9,485
 $13,372
 $(6,679) $6,693
Down 100 basis points $(9,663) $8,108
 $(1,555) $(132) $6,282
 $6,150
Down 200 basis points $(9,850) $13,380
 $3,530
 $(132) $6,282
 $6,150
Down 300 basis points $(10,038) $13,380
 $3,342
 $(132) $6,282
 $6,150


Item 8. Financial Statements and Supplementary Data
TCG BDC, INC.
INDEX TO CONSOLIDATED FINANCIAL STATEMENTS


2020

94


Table of Contents

Report of Independent Registered Public Accounting Firm

The Board of Directors and Stockholders of
TCG BDC, Inc.

Opinion on the Financial Statements

We have audited the accompanying consolidated statements of assets and liabilities of TCG BDC, Inc. (the(the “Company”), including the consolidated schedules of investments, as of December 31, 20172021 and 2016, and2020, the related consolidated statements of operations, cash flows and changes in net assets, and cash flows for each of the three years in the period ended December 31, 2017,2021, and the related notes (collectively referred to as the “consolidated financial statements”). In our opinion, the consolidated financial statements present fairly, in all material respects, the financial position of the Companyat December 31, 20172021 and 2016,2020, and the results of its operations, changes in its net assets, and its cash flows for each of the three years in the period ended December 31, 2017,2021, in conformity with U.S. generally accepted accounting principles.

We also have audited, in accordance with the standards of the Public Company Accounting Oversight Board (United States) (“PCAOB”)(PCAOB), the Company’sCompany's internal control over financial reporting as of December 31, 2017,2021, based on criteria established in Internal Control-Integrated Framework issued by the Committee of Sponsoring Organizations of the Treadway Commission (2013 framework) and our report dated February 27, 201822, 2022 expressed an unqualified opinion thereon.

Basis for Opinion

These financial statements are the responsibility of the Company’s management. Our responsibility is to express an opinion on the Company’s financial statements based on our audits. We are a public accounting firm registered with the PCAOB and are required to be independent with respect to the Company in accordance with the U.S. federal securities laws and the applicable rules and regulations of the Securities and Exchange Commission and the PCAOB.

We conducted our audits in accordance with the standards of the PCAOB. Those standards require that we plan and perform the audit to obtain reasonable assurance about whether the financial statements are free of material misstatement, whether due to error or fraud. Our audits included performing procedures to assess the risks of material misstatement of the financial statements, whether due to error or fraud, and performing procedures that respond to those risks. Such procedures included examining, on a test basis, evidence regarding the amounts and disclosures in the financial statements. Our procedures included confirmation of investments owned as of December 31, 2021 and 2020, by correspondence with the custodian, directly with counterparties and management of the portfolio companies, debt agents and brokers, as applicable, or by other appropriate auditing procedures where replies were not received. Our audits also included evaluating the accounting principles used and significant estimates made by management, as well as evaluating the overall presentation of the financial statements. We believe that our audits provide a reasonable basis for our opinion.

Critical Audit Matter

The critical audit matter communicated below is a matter arising from the current period audit of the financial statements that was communicated or required to be communicated to the audit committee and that: (1) relates to accounts or disclosures that are material to the financial statements and (2) involved our especially challenging, subjective or complex judgments. The communication of the critical audit matter does not alter in any way our opinion on the consolidated financial statements, taken as a whole, and we are not, by communicating the critical audit matter below, providing a separate opinion on the critical audit matter or on the account or disclosure to which it relates.

95


Table of Contents
Valuation of investments using significant unobservable inputs
Description of the Matter
At December 31, 2021, the fair value of the Company's investments categorized in Level III of the fair value hierarchy (Level III investments) totaled $1.835 billion. As discussed in Note 3 to the consolidated financial statements (Note 3), management determined the fair value of the Company’s Level III investments by using valuation techniques such as comparable public market valuations, comparable precedent transaction valuations and/or discounted cash flow analyses and using inputs which were significant to the valuation of these investments, such as observable market inputs, updated credit statistics, and significant unobservable inputs (significant inputs). The significant unobservable inputs used to determine fair value required significant management judgment or estimation and, as disclosed in Note 3, included discount rates, comparable multiples, recovery rates, default rates, and indicative quotes.

Auditing the fair value of the Company's Level III investments was complex and judgmental due to the valuation techniques and significant unobservable inputs used by the Company to determine fair value.
How We Addressed the Matter in our Audit
We obtained an understanding, evaluated the design and tested the operating effectiveness of controls over the Company's investment valuation process. This included controls over management’s assessment of the valuation techniques and significant inputs used by management to determine the fair value measurements.

To test the valuation of the Company’s Level III investments, our audit procedures included, among others, evaluating the valuation techniques and significant inputs used by the Company. For each Level III investment, we gained an understanding of the valuation technique(s) and significant inputs used to value the investment and reviewed the information considered by the Board of Directors relating to the valuation. Our procedures also included testing, for a sample of Level III investments, significant inputs and the mathematical accuracy of the Company's valuation models.

For example, we compared market spreads, market value (EBITDA) multiples of publicly traded comparable companies, available precedent sales transactions of comparable companies, default rates and recovery rates to information available from third-party market research providers. We also compared certain of the significant inputs to underlying sources like public and private credit ratings and the most recently available portfolio company financial statements and compliance certificates provided by management. To evaluate the reasonableness of the unobservable inputs, we assessed whether these inputs were developed in a manner consistent with the Company’s valuation policies and in some instances, with the assistance of our valuation specialists, we independently developed fair value estimates using portfolio company and market information and compared them to the Company's estimates. We searched for and evaluated information that corroborated or contradicted the Company's significant inputs. We also evaluated subsequent events and transactions and considered whether they corroborated or contradicted the Company's year-end valuations.

/s/ Ernst & Young LLP

We have served as the Company'sCompany’s auditor since 2012.

New York, NY
February 27, 201822, 2022


96


Table of Contents

Report of Independent Registered Public Accounting Firm

The Board of Directors and Stockholders of
TCG BDC, Inc.

Opinion on Internal Control over Financial Reporting

We have audited the TCG BDC, Inc.’s internal control over financial reporting as of December 31, 2017,2021, based on criteria established in Internal Control - Control—Integrated Framework issued by the Committee of Sponsoring Organizations of the Treadway Commission (2013 framework) (the “COSO criteria”)COSO criteria). In our opinion, TCG BDC, Inc. (the “Company”) maintained, in all material respects, effective internal control over financial reporting as of December 31, 2017,2021, based on the COSO criteria.

We also have audited, in accordance with the standards of the Public Company Accounting Oversight Board (United States) (“PCAOB”)(PCAOB), the consolidated statements of assets and liabilities of the Company, including the consolidated schedules of investments, as of December 31, 20172021 and 2016,2020, and the related consolidated statements of operations, cash flows and changes in net assets and cash flows for each of the three years in the period ended December 31, 2017,2021, and the related notes and our report dated February 27, 201822, 2022 expressed an unqualified opinion thereon.

Basis for Opinion

The Company’s management is responsible for maintaining effective internal control over financial reporting and for its assessment of the effectiveness of internal control over financial reporting included in the accompanying Management’s Report on Internal Control Over Financial Reporting. Our responsibility is to express an opinion on the Company’s internal control over financial reporting based on our audit. We are a public accounting firm registered with the PCAOB and are required to be independent with respect to the Company in accordance with the U.S. federal securities laws and the applicable rules and regulations of the Securities and Exchange Commission and the PCAOB.

We conducted our audit in accordance with the standards of the PCAOB. Those standards require that we plan and perform the audit to obtain reasonable assurance about whether effective internal control over financial reporting was maintained in all material respects.

Our audit included obtaining an understanding of internal control over financial reporting, assessing the risk that a material weakness exists, testing and evaluating the design and operating effectiveness of internal control based on the assessed risk, and performing such other procedures as we considered necessary in the circumstances. We believe that our audit provides a reasonable basis for our opinion.

Definition and Limitations of Internal Control Over Financial Reporting

A company’s internal control over financial reporting is a process designed to provide reasonable assurance regarding the reliability of financial reporting and the preparation of financial statements for external purposes in accordance with generally accepted accounting principles. A company’s internal control over financial reporting includes those policies and procedures that (1) pertain to the maintenance of records that, in reasonable detail, accurately and fairly reflect the transactions and dispositions of the assets of the company; (2) provide reasonable assurance that transactions are recorded as necessary to permit preparation of financial statements in accordance with generally accepted accounting principles, and that receipts and expenditures of the company are being made only in accordance with authorizations of management and directors of the company; and (3) provide reasonable assurance regarding prevention or timely detection of unauthorized acquisition, use, or disposition of the company’s assets that could have a material effect on the financial statements.

Because of its inherent limitations, internal control over financial reporting may not prevent or detect misstatements. Also, projections of any evaluation of effectiveness to future periods are subject to the risk that controls may become inadequate because of changes in conditions, or that the degree of compliance with the policies or procedures may deteriorate.


/s/ Ernst & Young LLP

New York, NY
February 27, 201822, 2022

97


Table of Contents

TCG BDC, INC.
CONSOLIDATED STATEMENTS OF ASSETS AND LIABILITIES
(dollar amounts in thousands, except per share data)

December 31,
2017
 December 31,
2016
December 31, 2021December 31, 2020
ASSETS   ASSETS
Investments, at fair value   Investments, at fair value
Investments—non-controlled/non-affiliated, at fair value (amortized cost of $1,782,488 and $1,332,596, respectively)$1,779,584
 $1,323,102
Investments—non-controlled/affiliated, at fair value (amortized cost of $16,273 and $0, respectively)15,431
 
Investments—controlled/affiliated, at fair value (amortized cost of $172,251 and $97,385, respectively)172,516
 99,657
Total investments, at fair value (amortized cost of $1,971,012 and $1,429,981, respectively)1,967,531
 1,422,759
Cash and cash equivalents32,039
 38,489
Investments—non-controlled/non-affiliated, at fair value (amortized cost of $1,631,067 and $1,574,182, respectively)Investments—non-controlled/non-affiliated, at fair value (amortized cost of $1,631,067 and $1,574,182, respectively)$1,607,731 $1,509,271 
Investments—non-controlled/affiliated, at fair value (amortized cost of $38,462 and $37,571, respectively)Investments—non-controlled/affiliated, at fair value (amortized cost of $38,462 and $37,571, respectively)30,286 26,180 
Investments—controlled/affiliated, at fair value (amortized cost of $288,024 and $311,213, respectively)Investments—controlled/affiliated, at fair value (amortized cost of $288,024 and $311,213, respectively)275,035 290,298 
Total investments, at fair value (amortized cost of $1,957,553 and $1,922,966, respectively)Total investments, at fair value (amortized cost of $1,957,553 and $1,922,966, respectively)1,913,052 1,825,749 
Cash, cash equivalents and restricted cashCash, cash equivalents and restricted cash93,074 68,419 
Receivable for investment sold7,022
 19,750
Receivable for investment sold530 4,313 
Deferred financing costs3,626
 3,308
Deferred financing costs3,066 3,633 
Interest receivable from non-controlled/non-affiliated investments5,066
 3,407
Interest receivable from non-controlled/non-affiliated investments11,011 12,634 
Interest receivable from non-controlled/affiliated investments42
 
Interest receivable from non-controlled/affiliated investments611 569 
Interest and dividend receivable from controlled/affiliated investments5,981
 2,400
Interest and dividend receivable from controlled/affiliated investments8,522 6,480 
Prepaid expenses and other assets76
 42
Prepaid expenses and other assets1,484 816 
Total assets$2,021,383
 $1,490,155
Total assets$2,031,350 $1,922,613 
LIABILITIES   LIABILITIES
Secured borrowings (Note 6)$562,893
 $421,885
2015-1 Notes payable, net of unamortized debt issuance costs of $1,947 and $2,151, respectively (Note 7)271,053
 270,849
Secured borrowings (Note 7)Secured borrowings (Note 7)$407,655 $347,949 
2015-1R Notes payable, net of unamortized debt issuance costs of $2,417 and $2,664, respectively (Note 8)2015-1R Notes payable, net of unamortized debt issuance costs of $2,417 and $2,664, respectively (Note 8)446,783 446,536 
Senior Notes, net of unamortized debt issuance costs of $416 and $562, respectively (Note 8)Senior Notes, net of unamortized debt issuance costs of $416 and $562, respectively (Note 8)189,584 189,438 
Payable for investments purchased9,469
 
Payable for investments purchased323 809 
Due to Investment Adviser69
 215
Interest and credit facility fees payable (Notes 6 and 7)5,353
 3,599
Interest and credit facility fees payable (Notes 7 and 8)Interest and credit facility fees payable (Notes 7 and 8)2,467 2,439 
Dividend payable (Note 10)Dividend payable (Note 10)20,705 19,892 
Base management and incentive fees payable (Note 4)13,098
 8,157
Base management and incentive fees payable (Note 4)11,819 11,549 
Dividend payable (Note 9)30,481
 20,018
Administrative service fees payable (Note 4)95
 137
Administrative service fees payable (Note 4)482 85 
Other accrued expenses and liabilities1,568
 1,158
Other accrued expenses and liabilities2,728 2,553 
Total liabilities894,079
 726,018
Total liabilities1,082,546 1,021,250 
Commitments and contingencies (Notes 8 and 11)   
Commitments and contingencies (Notes 9 and 12)Commitments and contingencies (Notes 9 and 12)
NET ASSETS   NET ASSETS
Common stock, $0.01 par value; 200,000,000 shares authorized; 62,207,603 shares and 41,702,318 shares, respectively, issued and outstanding622
 417
Cumulative convertible preferred stock, $0.01 par value; 2,000,000 shares issued and outstanding as of December 31, 2021 and December 31, 2020Cumulative convertible preferred stock, $0.01 par value; 2,000,000 shares issued and outstanding as of December 31, 2021 and December 31, 202050,000 50,000 
Common stock, $0.01 par value; 198,000,000 shares authorized; 53,142,454 and 55,320,309 shares issued and outstanding at December 31, 2021 and December 31, 2020, respectivelyCommon stock, $0.01 par value; 198,000,000 shares authorized; 53,142,454 and 55,320,309 shares issued and outstanding at December 31, 2021 and December 31, 2020, respectively532 553 
Paid-in capital in excess of par value1,172,807
 799,580
Paid-in capital in excess of par value1,052,427 1,081,436 
Offering costs(1,618) (74)Offering costs(1,633)(1,633)
Accumulated net investment income (loss), net of cumulative dividends of $222,254 and $129,065, respectively2,522
 (3,207)
Accumulated net realized gain (loss)(43,548) (25,357)
Accumulated net unrealized appreciation (depreciation)(3,481) (7,222)
Total distributable earnings (loss)Total distributable earnings (loss)(152,522)(228,993)
Total net assets$1,127,304
 $764,137
Total net assets$948,804 $901,363 
NET ASSETS PER SHARE$18.12
 $18.32
NET ASSETS PER COMMON SHARENET ASSETS PER COMMON SHARE$16.91 $15.39 
The accompanying notes are an integral part of these consolidated financial statements.

98


Table of Contents

TCG BDC, INC.
CONSOLIDATED STATEMENTS OF OPERATIONS
(dollar amounts in thousands, except per share data)

For the years ended December 31, For the years ended December 31,
2017 2016 2015 202120202019
Investment income:     Investment income:
From non-controlled/non-affiliated investments:     From non-controlled/non-affiliated investments:
Interest income$133,807
 $101,196
 $68,356
Interest income$134,420 $146,291 $184,529 
Other income10,526
 6,635
 834
Other income6,366 10,974 7,329 
Total investment income from non-controlled/non-affiliated investments144,333
 107,831
 69,190
Total investment income from non-controlled/non-affiliated investments140,786 157,265 191,858 
From non-controlled/affiliated investments:     From non-controlled/affiliated investments:
Interest income1,215
 
 
Interest income173 14 1,209 
Other incomeOther income10 — — 
Total investment income from non-controlled/affiliated investments1,215
 
 
Total investment income from non-controlled/affiliated investments183 14 1,209 
From controlled/affiliated investments:     From controlled/affiliated investments:
Interest income10,753
 1,465
 
Interest income185 3,611 12,481 
Dividend income8,700
 1,675
 
Dividend income30,063 21,228 15,750 
Other incomeOther income21 — — 
Total investment income from controlled/affiliated investments19,453
 3,140
 
Total investment income from controlled/affiliated investments30,269 24,839 28,231 
Total investment income165,001
 110,971
 69,190
Total investment income171,238 182,118 221,298 
Expenses:     Expenses:
Base management fees (Note 4)25,254
 18,539
 13,361
Base management fees (Note 4)28,343 28,648 31,316 
Incentive fees (Note 4)21,084
 14,905
 8,881
Incentive fees (Note 4)17,680 18,555 22,872 
Professional fees2,895
 2,103
 1,845
Professional fees3,165 3,082 2,745 
Administrative service fees (Note 4)661
 703
 595
Administrative service fees (Note 4)1,338 679 539 
Interest expense (Notes 6 and 7)24,510
 16,462
 9,582
Credit facility fees (Note 6)1,983
 2,573
 1,898
Interest expense (Notes 7 and 8)Interest expense (Notes 7 and 8)28,829 35,820 50,587 
Credit facility fees (Note 7)Credit facility fees (Note 7)1,924 3,761 3,079 
Directors’ fees and expenses443
 553
 419
Directors’ fees and expenses561 398 353 
Other general and administrative1,683
 1,616
 1,539
Other general and administrative1,765 1,795 1,738 
Total expenses78,513
 57,454
 38,120
Total expenses83,605 92,738 113,229 
Waiver of base management fees (Note 4)5,927
 6,180
 4,454
Net expenses72,586
 51,274
 33,666
Net investment income (loss) before taxes92,415
 59,697
 35,524
Net investment income (loss) before taxes87,633 89,380 108,069 
Excise tax expense264
 76
 
Excise tax expense782 573 404 
Net investment income (loss)92,151
 59,621
 35,524
Net investment income (loss)86,851 88,807 107,665 
Net realized gain (loss) and net change in unrealized appreciation (depreciation) on investments:     
Net realized gain (loss) and net change in unrealized appreciation (depreciation):Net realized gain (loss) and net change in unrealized appreciation (depreciation):
Net realized gain (loss) from:     Net realized gain (loss) from:
Non-controlled/non-affiliated investments(11,692) (9,644) 1,164
Net change in unrealized appreciation (depreciation):     
Non-controlled/non-affiliated investments6,590
 17,560
 (18,015)Non-controlled/non-affiliated investments19,035 (58,473)(29,285)
Non-controlled/affiliated investments(842) 
 
Non-controlled/affiliated investments— — 
Controlled/affiliated investments(2,007) 2,272
 
Controlled/affiliated investments— — (9,091)
Net realized gain (loss) and net change in unrealized appreciation (depreciation) on investments(7,951) 10,188
 (16,851)
Currency gains (losses) on non-investment assets and liabilitiesCurrency gains (losses) on non-investment assets and liabilities(177)497 33 
Net change in unrealized appreciation (depreciation) on investments:Net change in unrealized appreciation (depreciation) on investments:
Non-controlled/non-affiliated investmentsNon-controlled/non-affiliated investments41,541 (11,629)4,734 
Non-controlled/affiliated investmentsNon-controlled/affiliated investments3,215 (900)(4,704)
Controlled/affiliated investmentsControlled/affiliated investments7,925 (7,127)(6,083)
Net change in unrealized currency gains (losses) on non-investment assets and liabilitiesNet change in unrealized currency gains (losses) on non-investment assets and liabilities1,960 (4,346)(1,939)
Net realized gain (loss) and net change in unrealized appreciation (depreciation) on investments and non-investment assets and liabilitiesNet realized gain (loss) and net change in unrealized appreciation (depreciation) on investments and non-investment assets and liabilities73,502 (81,978)(46,335)
Net increase (decrease) in net assets resulting from operations$84,200
 $69,809
 $18,673
Net increase (decrease) in net assets resulting from operations160,353 6,829 61,330 
Basic and diluted earnings per common share (Note 9)$1.59
 $1.93
 $0.75
Weighted-average shares of common stock outstanding—Basic and Diluted (Note 9)52,997,450
 36,152,390
 24,830,200
Dividends declared per common share (Note 9)$1.64
 $1.68
 $1.74
Preferred stock dividendPreferred stock dividend3,500 2,275 — 
Net increase (decrease) in net assets resulting from operations attributable to Common StockholdersNet increase (decrease) in net assets resulting from operations attributable to Common Stockholders$156,853 $4,554 $61,330 
Basic and diluted earnings per common share (Note 10)Basic and diluted earnings per common share (Note 10)
BasicBasic$2.89 $0.08 $1.02 
DilutedDiluted$2.69 $0.08 $1.02 
Weighted-average shares of common stock outstanding (Note 10)Weighted-average shares of common stock outstanding (Note 10)
BasicBasic54,244,432 56,421,137 60,189,502 
DilutedDiluted59,531,683 56,421,137 60,189,502 
The accompanying notes are an integral part of these consolidated financial statements.

99


Table of Contents

TCG BDC, INC.
CONSOLIDATED STATEMENTS OF CHANGES IN NET ASSETS
(dollar amounts in thousands)

For the years ended December 31, For the years ended December 31,
2017 2016 2015 202120202019
Increase (decrease) in net assets resulting from operations:     Increase (decrease) in net assets resulting from operations:
Net investment income (loss)$92,151
 $59,621
 $35,524
Net investment income (loss)$86,851 $88,807 $107,665 
Net realized gain (loss) on investments(11,692) (9,644) 1,164
Net realized gain (loss)Net realized gain (loss)18,861 (57,976)(38,343)
Net change in unrealized appreciation (depreciation) on investments3,741
 19,832
 (18,015)Net change in unrealized appreciation (depreciation) on investments52,681 (19,656)(6,053)
Net change in unrealized currency gains (losses) on non-investment assets and liabilitiesNet change in unrealized currency gains (losses) on non-investment assets and liabilities1,960 (4,346)(1,939)
Net increase (decrease) in net assets resulting from operations84,200
 69,809
 18,673
Net increase (decrease) in net assets resulting from operations160,353 6,829 61,330 
Capital transactions:     Capital transactions:
Common stock issued, net of offering and underwriting costs365,475
 185,537
 262,354
Reinvestment of dividends6,681
 279
 131
Dividends declared (Note 12)(93,189) (63,214) (47,689)
Preferred stock issuedPreferred stock issued— 50,000 — 
Repurchase of common stockRepurchase of common stock(28,439)(27,254)(64,717)
Dividends declared (Note 10)Dividends declared (Note 10)(84,473)(84,683)(103,360)
Net increase (decrease) in net assets resulting from capital share transactions278,967
 122,602
 214,796
Net increase (decrease) in net assets resulting from capital share transactions(112,912)(61,937)(168,077)
Net increase (decrease) in net assets363,167
 192,411
 233,469
Net increase (decrease) in net assets47,441 (55,108)(106,747)
Net assets at beginning of year764,137
 571,726
 338,257
Net assets at beginning of year901,363 956,471 1,063,218 
Net assets at end of year$1,127,304
 $764,137
 $571,726
Net assets at end of year$948,804 $901,363 $956,471 
The accompanying notes are an integral part of these consolidated financial statements.

100


Table of Contents

TCG BDC, INC.
CONSOLIDATED STATEMENTS OF CASH FLOWS
(dollar amounts in thousands)

For the years ended December 31, For the years ended December 31,
2017 2016 2015 202120202019
Cash flows from operating activities:     Cash flows from operating activities:
Net increase (decrease) in net assets resulting from operations$84,200
 $69,809
 $18,673
Net increase (decrease) in net assets resulting from operations$160,353 $6,829 $61,330 
Adjustments to reconcile net increase (decrease) in net assets resulting from operations to net cash provided by (used in) operating activities:     Adjustments to reconcile net increase (decrease) in net assets resulting from operations to net cash provided by (used in) operating activities:
Amortization of deferred financing costs949
 1,417
 1,051
Amortization of deferred financing costs1,342 2,133 1,864 
Net accretion of discount on investments(11,747) (5,605) (3,035)Net accretion of discount on investments(9,383)(8,186)(12,955)
Paid-in-kind interest(1,057) 
 
Paid-in-kind interest(9,178)(6,145)(7,958)
Net realized (gain) loss on investments11,692
 9,644
 (1,164)
Net realized (gain) lossNet realized (gain) loss(19,038)57,976 38,343 
Net realized currency (gain) loss on non-investment assets and liabilitiesNet realized currency (gain) loss on non-investment assets and liabilities177 — — 
Net change in unrealized (appreciation) depreciation on investments(3,741) (19,832) 18,015
Net change in unrealized (appreciation) depreciation on investments(52,681)19,656 6,053 
Net change in unrealized currency (gains) losses on non-investment assets and liabilitiesNet change in unrealized currency (gains) losses on non-investment assets and liabilities(1,960)4,346 1,939 
Cost of investments purchased and change in payable for investments purchased(1,280,124) (755,654) (653,154)Cost of investments purchased and change in payable for investments purchased(842,981)(620,829)(994,374)
Proceeds from contribution of investments to Credit Fund IIProceeds from contribution of investments to Credit Fund II— 168,897 — 
Proceeds from sales and repayments of investments and change in receivable for investments sold812,576
 383,591
 228,004
Proceeds from sales and repayments of investments and change in receivable for investments sold849,039 688,798 819,084 
Changes in operating assets:     Changes in operating assets:
Interest receivable(3,767) (1,203) 1,233
Interest receivable1,581 (3,741)(3,606)
Dividend receivable(1,515) (1,325) 
Dividend receivable(2,042)365 560 
Prepaid expenses and other assets(34) 344
 (229)Prepaid expenses and other assets(668)(96)(188)
Changes in operating liabilities:     Changes in operating liabilities:
Due to Investment Adviser(146) 26
 148
Due to Investment Adviser— — (236)
Interest and credit facility fees payable1,754
 1,022
 1,384
Interest and credit facility fees payable28 (4,325)(736)
Base management and incentive fees payable4,941
 2,880
 (1,042)Base management and incentive fees payable270 (1,687)(598)
Administrative service fees payable(42) 40
 6
Administrative service fees payable397 (17)
Other accrued expenses and liabilities410
 233
 165
Other accrued expenses and liabilities175 1,160 (397)
Net cash provided by (used in) operating activities(385,651) (314,613) (389,945)Net cash provided by (used in) operating activities75,431 305,159 (91,892)
Cash flows from financing activities:     Cash flows from financing activities:
Proceeds from issuance of common stock, net of offering and underwriting costs357,429
 185,537
 262,354
Proceeds from issuance of preferred stockProceeds from issuance of preferred stock— 50,000 — 
Repurchase of common stockRepurchase of common stock(28,439)(27,254)(64,717)
Borrowings on SPV Credit Facility and Credit Facility816,216
 566,351
 402,200
Borrowings on SPV Credit Facility and Credit Facility419,205 452,833 755,179 
Repayments of SPV Credit Facility and Credit Facility(675,208) (378,779) (476,328)Repayments of SPV Credit Facility and Credit Facility(357,500)(725,469)(655,209)
Repayments of debt assumed from NFIC Acquisition(42,128) 
 
Proceeds from issuance of 2015-1 Notes
 
 273,000
Proceeds from issuance of Senior Notes, net of unamortized debt issuance costsProceeds from issuance of Senior Notes, net of unamortized debt issuance costs— 74,438 115,000 
Debt issuance costs paid(1,063) (643) (2,648)Debt issuance costs paid(382)(1,488)(1,699)
Dividends paid in cash(76,045) (61,201) (35,550)Dividends paid in cash(83,660)(96,551)(107,097)
Net cash provided by (used in) financing activities379,201
 311,265
 423,028
Net cash provided by (used in) financing activities(50,776)(273,491)41,457 
Net increase (decrease) in cash and cash equivalents(6,450) (3,348) 33,083
Net increase (decrease) in cash and cash equivalents24,655 31,668 (50,435)
Cash and cash equivalents, beginning of year38,489
 41,837
 8,754
Cash and cash equivalents, end of year$32,039
 $38,489
 $41,837
Cash, cash equivalents and restricted cash, beginning of yearCash, cash equivalents and restricted cash, beginning of year68,419 36,751 87,186 
Cash, cash equivalents and restricted cash, end of yearCash, cash equivalents and restricted cash, end of year$93,074 $68,419 $36,751 
Supplemental disclosures:     Supplemental disclosures:
Offering expenses and debt issuance costs due$
 $
 $1
Interest paid during the year$22,519
 $15,267
 $8,083
Interest paid during the year$29,355 $33,149 $49,981 
Taxes, including excise tax, paid during year$179
 $79
 $50
Taxes, including excise tax, paid during year$641 $391 $225 
Dividends declared during the year$93,189
 $63,214
 $47,689
Dividends declared during the year$84,473 $84,683 $103,360 
Reinvestment of dividends$6,681
 $279
 $131
Cost of investments received in the NFIC Acquisition from shares issued (Note 13)$(8,046) $
 $
Shares issued in consideration of NFIC Acquisition (Note 13)$8,046
 $
 $
Debt assumed from NFIC Acquisition (Note 13)$42,128
 $
 $
Credit Fund II members’ interest received in consideration of contribution of investments (Note 6)Credit Fund II members’ interest received in consideration of contribution of investments (Note 6)$— $78,096 $— 
The accompanying notes are an integral part of these consolidated financial statements.

101


TCG BDC, INC.
CONSOLIDATED SCHEDULE OF INVESTMENTS
As of December 31, 20172021
(dollar amounts in thousands)
Investments—non-controlled/non-affiliated (1)
Industry 
Interest Rate (2)
 Maturity Date Par/ Principal Amount 
Amortized Cost (6)
 
Fair Value(7)
 Percentage of Net Assets
First Lien Debt (77.04%)             
Access CIG, LLC (2)(3)(4)(13)(16)
Business Services L + 5.00% (1.00% Floor) 10/17/2021 $18,149
 $18,054
 $18,263
 1.62%
Achilles Acquisition LLC (2)(3)(4)(5)(13)(15)
Banking, Finance, Insurance & Real Estate L + 6.00% (1.00% Floor) 6/6/2023 40,910
 39,931
 40,523
 3.59
Advanced Instruments, LLC (2)(3)(4)(5)(13)(15)(16)
Healthcare & Pharmaceuticals L + 5.25% (1.00% Floor) 10/31/2022 10,421
 10,227
 10,421
 0.92
Alpha Packaging Holdings, Inc. (2)(3)(4)(13)
Containers, Packaging & Glass L + 4.25% (1.00% Floor) 5/12/2020 2,896
 2,894
 2,896
 0.26
AMS Group HoldCo, LLC (2)(3)(4)(5)(13)(15)
Transportation: Cargo L + 6.00% (1.00% Floor) 9/29/2023 29,925
 29,254
 29,925
 2.65
Anaren, Inc. (2)(3)(4)(13)
Telecommunications L + 4.50% (1.00% Floor) 2/18/2021 3,802
 3,789
 3,809
 0.34
Audax AAMP Holdings, Inc. (2)(3)(5)
Durable Consumer Goods L + 7.50% (1.00% Floor) 1/31/2018 12,487
 12,459
 12,362
 1.10
BeyondTrust Software, Inc. (2)(3)(4)(5)(13)
Software L + 6.25% (1.00% Floor) 11/21/2023 17,000
 16,758
 16,910
 1.50
Brooks Equipment Company, LLC (2)(3)(4)(13)
Construction & Building L + 5.00% (1.00% Floor) 8/29/2020 2,546
 2,535
 2,546
 0.23
Capstone Logistics Acquisition, Inc. (2)(3)(4)(13)(16)
Transportation: Cargo L + 4.50% (1.00% Floor) 10/7/2021 19,198
 19,081
 18,895
 1.68
Captive Resources Midco, LLC (2)(3)(4)(5)(13)(15)(16)
Banking, Finance, Insurance & Real Estate L + 6.00% (1.00% Floor) 12/18/2021 30,900
 30,635
 30,783
 2.73
Central Security Group, Inc. (2)(3)(4)(13)(16)
Consumer Services L + 5.63% (1.00% Floor) 10/6/2021 39,007
 38,668
 38,941
 3.45
CIP Revolution Holdings, LLC (2)(3)(4)(5)(13)(15)
Media: Advertising, Printing & Publishing L + 6.00% (1.00% Floor) 8/19/2021 19,048
 18,917
 18,993
 1.68
Colony Hardware Corporation (2)(3)(4)(13)
Construction & Building L + 6.00% (1.00% Floor) 10/23/2021 22,071
 21,838
 22,049
 1.96
Continuum Managed Services Holdco, LLC (2)(3)(4)(5)(13)(15)(16)
High Tech Industries L + 8.75% (1.00% Floor) 6/8/2023 22,885
 22,208
 23,237
 2.06
Dade Paper & Bag, LLC (2)(3)(4)(5)(16)
Forest Products & Paper L + 7.50% (1.00% Floor) 6/10/2024 49,750
 48,822
 49,884
 4.42
Datto, Inc. (2)(3)(5)(15)(16)
High Tech Industries L + 8.00% (1.00% Floor) 12/7/2022 35,622
 35,082
 35,818
 3.18
Dent Wizard International Corporation (2)(3)(4)(16)
Automotive L + 4.75% (1.00% Floor) 4/7/2020 895
 893
 894
 0.08
Derm Growth Partners III, LLC (Dermatology Associates) (2)(3)(4)(5)(13)(15)
Healthcare & Pharmaceuticals L + 6.50% (1.00% Floor) 5/31/2022 50,658
 50,104
 50,441
 4.47
DermaRite Industries, LLC (2)(3)(5)(13)(15)(16)
Healthcare & Pharmaceuticals L + 7.00% (1.00% Floor) 3/3/2022 20,003
 19,729
 19,850
 1.76
Dimensional Dental Management, LLC (2)(3)(5)(12)(15)(16)
Healthcare & Pharmaceuticals L + 6.75% (1.00% Floor) 2/12/2021 33,674
 33,038
 33,514
 2.97
Direct Travel, Inc. (2)(3)(4)(5)(13)(15)
Hotel, Gaming & Leisure L + 6.50% (1.00% Floor) 12/1/2021 29,623
 29,136
 29,708
 2.64
EIP Merger Sub, LLC (Evolve IP) (2)(3)(5)(12)(13)(16)
Telecommunications L + 6.25% (1.00% Floor) 6/7/2021 27,284
 26,618
 26,738
 2.37
Emergency Communications Network, LLC (2)(3)(4)(5)(13)(16)
Telecommunications L + 6.25% (1.00% Floor) 6/1/2023 24,875
 24,669
 24,850
 2.20
Investments—non-controlled/non-affiliated (1)
FootnotesIndustry
Reference Rate & Spread (2)
Interest Rate (2)
Acquisition DateMaturity DatePar/ Principal Amount **
Amortized Cost (4)
Fair Value(5)
% of Net
 Assets
First Lien Debt (62.1% of fair value)
Advanced Web Technologies Holding Company^*(2)(3)(14)Containers, Packaging & GlassL + 5.75%6.75%12/17/202012/17/2026$7,177 $6,970 $7,297 0.77 %
Airnov, Inc.^*(2)(3)(14)Containers, Packaging & GlassL + 5.00%6.00%12/20/201912/19/20251,862 1,833 1,862 0.20 
Allied Universal Holdco LLC^(2)(3)Business ServicesL + 4.25%4.46%2/17/20217/10/2026497 500 498 0.04 
American Physician Partners, LLC^*(2)(3)(14)Healthcare & PharmaceuticalsL + 6.75%, 1.50% PIK9.25%1/7/20192/21/202227,908 27,886 27,908 2.94 
Analogic Corporation^*(2)(3)(14)Capital EquipmentL + 5.25%6.25%6/22/20186/22/20242,434 2,412 2,408 0.25 
Applied Technical Services, LLC^(2)(3)(14)Business ServicesL + 5.75%6.75%12/29/202012/29/2026536 525 536 0.06 
Appriss Health, LLC^(2)(3)(14)Healthcare & PharmaceuticalsL + 7.25%8.25%5/6/20215/6/202743,247 42,406 43,295 4.56 
Apptio, Inc.^(2)(3)(14)SoftwareL + 7.25%8.25%1/10/20191/10/20256,131 6,044 6,130 0.65 
Ascend Buyer, LLC^(2)(3)(14)Containers, Packaging & GlassL + 5.75%6.50%9/30/20219/30/202812,838 12,569 12,618 1.33 
Associations, Inc.^(2)(3)(14)Construction & BuildingL + 4.00%, 2.50% PIK7.50%7/2/20217/2/202711,570 11,457 11,599 1.22 
Aurora Lux FinCo S.Á.R.L. (Luxembourg)^*(2)(3)(7)SoftwareL + 6.00%7.00%12/24/201912/24/202632,488 31,870 29,269 3.08 
Avenu Holdings, LLC*(2)(3)Sovereign & Public FinanceL + 5.25%6.25%9/28/20189/28/202413,545 13,451 13,545 1.43 
Barnes & Noble, Inc.^(2)(3)(11)RetailL + 6.50%7.50%8/7/201912/20/202628,932 27,926 28,146 2.97 
BlueCat Networks, Inc. (Canada)*(2)(3)(7)High Tech IndustriesL + 6.25%7.25%10/30/202010/30/202611,468 11,270 11,583 1.22 
BMS Holdings III Corp.^(2)(3)(14)Construction & BuildingL + 5.50%6.50%9/30/20199/30/2026— (180)(149)(0.02)
Bubbles Bidco S.P.A. (Italy)^(2)(3)(7)(14)Consumer Goods: Non-DurableL + 9.25% (100% PIK)9.25%10/20/202110/20/20284,700 5,312 5,167 0.54 
Bubbles Bidco S.P.A. (Italy)^(2)(3)(7)(14)Consumer Goods: Non-DurableL + 6.25%6.25%10/20/202110/20/2028— (9)(9)— 
Captive Resources Midco, LLC^*(2)(3)(14)Banking, Finance, Insurance & Real EstateL + 5.50%6.25%6/30/20155/31/202710,223 10,104 10,152 1.07 
Chartis Holding, LLC^*(2)(3)(14)Business ServicesL + 5.50%6.50%5/1/20195/1/2025694 686 694 0.07 
Chemical Computing Group ULC (Canada)^*(2)(3)(7)(14)SoftwareL + 4.50%5.50%8/30/20188/30/2024466 465 464 0.05 
Chudy Group, LLC^(2)(3)(14)Healthcare & PharmaceuticalsL + 5.75%6.75%6/30/20216/30/2027826 812 841 0.09 
CircusTrix Holdings, LLC^*(2)(3)Hotel, Gaming & LeisureL + 5.50%, 2.50% PIK9.00%2/2/20181/16/202410,544 10,523 9,415 0.99 
CircusTrix Holdings, LLC^(2)(3)Hotel, Gaming & LeisureL + 5.50%, 2.50% PIK9.00%1/8/20217/16/2023697 640 697 0.07 
Cobblestone Intermediate Holdco LLC^(2)(3)Consumer ServicesL + 5.50%6.25%1/29/20201/29/2026723 718 712 0.08 
Comar Holding Company, LLC^*(2)(3)(14)Containers, Packaging & GlassL + 5.75%6.75%6/18/20186/18/202426,443 26,152 25,855 2.73 
Cority Software Inc. (Canada)^*(2)(3)(7)(14)SoftwareL + 5.00%6.00%7/2/20197/2/202610,515 10,334 10,510 1.11 
Cority Software Inc. (Canada)^(2)(3)(7)SoftwareL + 7.00%8.00%9/3/20207/2/20261,879 1,833 1,900 0.20 
DCA Investment Holding, LLC^*(2)(3)(14)Healthcare & PharmaceuticalsL + 6.25%7.00%3/11/20213/12/202710,841 10,680 10,777 1.14 


Investments—non-controlled/non-affiliated (1)
Industry 
Interest Rate (2)
 Maturity Date Par/ Principal Amount 
Amortized Cost (6)
 
Fair Value(7)
 Percentage of Net Assets
First Lien Debt (77.04%) (continued)             
EP Minerals, LLC (2)(3)(4)(13)
Metals & Mining L + 4.50% (1.00% Floor) 8/20/2020 $7,920
 $7,901
 $7,931
 0.70%
FCX Holdings Corp. (2)(3)(4)(13)(16)
Capital Equipment L + 4.50% (1.00% Floor) 8/4/2020 3,820
 3,823
 3,824
 0.34
Frontline Technologies Holdings, LLC (2)(3)(5)(15)
Software L + 6.50% (1.00% Floor) 9/18/2023 39,197
 38,757
 39,159
 3.47
FWR Holding Corporation (2)(3)(4)(5)(13)(15)
Beverage, Food & Tobacco L + 6.00% (1.00% Floor) 8/21/2023 36,692
 35,525
 36,098
 3.20
Global Franchise Group, LLC (2)(3)(4)(5)(13)(15)
Beverage, Food & Tobacco L + 5.75% (1.00% Floor) 12/18/2019 14,468
 14,345
 14,468
 1.28
Global Software, LLC(2)(3)(4)(13)(16)
High Tech Industries L + 5.25% (1.00% Floor) 5/2/2022 20,800
 20,501
 20,774
 1.84
Green Energy Partners/Stonewall LLC(2)(3)(4)(13)
Energy: Electricity L + 5.50% (1.00% Floor) 11/13/2021 19,950
 19,621
 19,334
 1.71
Hummel Station LLC (2)(3)(5)(13)(16)
Energy: Electricity L + 6.00% (1.00% Floor) 10/27/2022 15,000
 14,375
 13,905
 1.23
Hydrofarm, LLC (2)(5)(13)(16)
Wholesale L + 7.00% 5/12/2022 18,763
 18,640
 18,241
 1.62
Indra Holdings Corp. (Totes Isotoner) (2)(3)(5)(13)
Non-durable Consumer Goods L + 4.25% (1.00% Floor) 5/1/2021 18,965
 17,224
 11,222
 1.00
Legacy.com Inc. (2)(3)(5)(12)
High Tech Industries L + 6.00% (1.00% Floor) 3/20/2023 17,000
 16,653
 17,558
 1.56
Metrogistics LLC (2)(3)(4)(13)
Transportation: Cargo L + 6.50% (1.00% Floor) 9/30/2022 17,978
 17,774
 17,921
 1.59
Moxie Liberty LLC (2)(3)(5)(13)
Energy: Electricity L + 6.50% (1.00% Floor) 8/21/2020 9,975
 9,008
 9,148
 0.81
National Technical Systems, Inc. (2)(3)(4)(5)(13)(15)(16)
Aerospace & Defense L + 6.25% (1.00% Floor) 6/12/2021 26,351
 26,072
 24,817
 2.20
NES Global Talent Finance US LLC (United Kingdom) (2)(3)(4)(8)(13)
Energy: Oil & Gas L + 5.50% (1.00% Floor) 10/3/2019 13,600
 13,439
 13,369
 1.19
NMI AcquisitionCo, Inc. (2)(3)(4)(5)(15)
High Tech Industries L + 6.75% (1.00% Floor) 9/6/2022 51,091
 50,112
 50,944
 4.52
OnCourse Learning Corporation (2)(3)(4)(5)(13)(15)
Consumer Services L + 6.50% (1.00% Floor) 9/12/2021 35,905
 35,513
 35,740
 3.17
Payment Alliance International, Inc. (2)(3)(5)(12)(16)
Business Services L + 6.05% (1.00% Floor) 9/15/2021 26,544
 25,983
 26,464
 2.35
Pelican Products, Inc. (2)(3)(4)(13)
Containers, Packaging & Glass L + 4.25% (1.00% Floor) 4/11/2020 3,585
 3,589
 3,581
 0.32
Plano Molding Company, LLC(2)(3)(4)(5)(16)
Hotel, Gaming & Leisure L + 7.50% (1.00% Floor) 5/12/2021 19,523
 19,263
 16,934
 1.50
PMG Acquisition Corporation (2)(3)(4)(5)(13)(15)
Healthcare & Pharmaceuticals L + 6.25% (1.00% Floor) 5/22/2022 27,025
 26,649
 27,161
 2.41
PPT Management Holdings, LLC(2)(3)(4)(5)(13)
Healthcare & Pharmaceuticals L + 6.00% (1.00% Floor) 12/16/2022 24,750
 24,572
 23,443
 2.08
Prime Risk Partners, Inc. (2)(3)(5)(15)
Banking, Finance, Insurance & Real Estate L + 5.75% (1.00% Floor) 8/13/2023 1,639
 1,594
 1,650
 0.15
Prime Risk Partners, Inc. (2)(3)(5)(12)(15)
Banking, Finance, Insurance & Real Estate L + 5.75% (1.00% Floor) 8/13/2023 20,521
 19,959
 21,032
 1.87
Product Quest Manufacturing, LLC(2)(3)(5)(10)(12)
Containers, Packaging & Glass L + 6.75% (1.00% Floor) 9/9/2020 33,000
 32,270
 19,487
 1.73
Product Quest Manufacturing, LLC (2)(3)(5)(15)(16)
Containers, Packaging & Glass L + 6.75% (3.25% Floor) 3/31/2019 2,729
 2,729
 2,729
 0.24


Investments—non-controlled/non-affiliated (1)
Industry 
Interest Rate (2)
 Maturity Date Par/ Principal Amount 
Amortized Cost (6)
 
Fair Value(7)
 Percentage of Net Assets
First Lien Debt (77.04%) (continued)             
Prowler Acquisition Corp. (Pipeline Supply and Service, LLC) (2)(3)(4)(13)
Wholesale L + 4.50% (1.00% Floor) 1/28/2020 $14,910
 $14,285
 $14,133
 1.25%
QW Holding Corporation (Quala) (2)(3)(4)(5)(13)
Environmental Industries L + 6.75% (1.00% Floor) 8/31/2022 36,549
 35,772
 35,715
 3.17
Reliant Pro Rehab, LLC (2)(3)(5)(12)
Healthcare & Pharmaceuticals L + 10.00% (1.00% Floor) 12/28/2018 24,563
 24,544
 24,563
 2.18
Smile Doctors, LLC (2)(3)(5)(13)(15)
Healthcare & Pharmaceuticals L + 5.75% (1.00% Floor) 10/6/2022 9,059
 8,930
 9,011
 0.80
SolAero Technologies Corp.(2)(3)(4)(5)(16)
Telecommunications L + 5.25% (1.00% Floor) 12/10/2020 24,828
 24,221
 23,416
 2.08
Superior Health Linens, LLC (2)(3)(4)(5)(13)(15)(16)
Business Services L + 6.50% (1.00% Floor) 9/30/2021 21,061
 20,788
 21,026
 1.87
Surgical Information Systems, LLC (2)(3)(4)(5)(12)(13)(16)
High Tech Industries L + 5.00% (1.00% Floor) 4/24/2023 30,000
 29,728
 30,075
 2.67
T2 Systems Canada, Inc.(2)(3)(4)(16)
Transportation: Consumer L + 6.75% (1.00% Floor) 9/28/2022 4,009
 3,926
 3,950
 0.35
T2 Systems, Inc. (2)(3)(4)(5)(13)(15)(16)
Transportation: Consumer L + 6.75% (1.00% Floor) 9/28/2022 32,649
 31,956
 32,146
 2.85
The Hilb Group, LLC (2)(3)(5)(12)(15)
Banking, Finance, Insurance & Real Estate L + 6.00% (1.00% Floor) 6/24/2021 38,622
 38,132
 38,204
 3.39
The SI Organization, Inc.(2)(3)(4)(5)(13)
Aerospace & Defense L + 4.75% (1.00% Floor) 11/23/2019 14,300
 14,310
 14,419
 1.28
The Topps Company, Inc. (2)(3)(4)(13)
Non-durable Consumer Goods L + 6.00% (1.25% Floor) 10/2/2020 23,130
 22,970
 22,991
 2.04
TruckPro, LLC (2)(3)(4)(13)
Automotive L + 5.00% (1.00% Floor) 8/6/2018 8,860
 8,850
 8,831
 0.78
Tweddle Group, Inc. (2)(3)(4)(13)
Media: Advertising, Printing & Publishing L + 6.00% (1.00% Floor) 10/24/2022 7,356
 7,266
 7,264
 0.64
Vetcor Professional Practices, LLC (2)(3)(4)(5)(13)(15)
Consumer Services L + 6.25% (1.00% Floor) 4/20/2021 38,868
 38,502
 38,725
 3.43
Vistage Worldwide, Inc. (2)(3)(4)(13)(16)
Business Services L + 5.50% (1.00% Floor) 8/19/2021 32,916
 32,753
 32,916
 2.92
VRC Companies, LLC (2)(3)(4)(5)(13)(15)(16)
Business Services L + 6.50% (1.00% Floor) 3/31/2023 38,600
 37,873
 38,541
 3.42
W/S Packaging Group Inc. (2)(3)(4)(16)
Containers, Packaging & Glass L + 5.00% (1.00% Floor) 8/9/2019 4,004
 3,887
 3,789
 0.34
Watchfire Enterprises, Inc. (2)(3)(13)
Media: Advertising, Printing & Publishing L + 4.25% (1.00% Floor) 10/2/2020 1,362
 1,351
 1,362
 0.12
Winchester Electronics Corporation (2)(3)(4)(5)(13)
Capital Equipment L + 6.50% (1.00% Floor) 6/30/2022 36,547
 36,292
 36,933
 3.28
Zenith Merger Sub, Inc. (2)(3)(4)(5)(13)(15)
Business Services L + 5.50% (1.00% Floor) 12/12/2023 15,290
 15,069
 15,198
 1.35
Zest Holdings, LLC (2)(3)(4)(13)(16)
Durable Consumer Goods L + 4.25% (1.00% Floor) 8/16/2023 3,431
 3,423
 3,453
 0.31
First Lien Debt Total        $1,526,058
 $1,515,845
 134.46%
              
Second Lien Debt (12.51%)             
AIM Group USA Inc. (2)(3)(4)(5)(13)
Aerospace & Defense L + 9.00% (1.00% Floor) 8/2/2022 $23,000
 $22,737
 $23,230
 2.06%
AmeriLife Group, LLC (2)(3)(5)(13)(16)
Banking, Finance, Insurance & Real Estate L + 8.75% (1.00% Floor) 1/10/2023 22,000
 21,647
 21,817
 1.94


Investments—non-controlled/non-affiliated (1)
Industry 
Interest Rate (2)
 Maturity Date Par/ Principal Amount 
Amortized Cost (6)
 
Fair Value(7)
 Percentage of Net Assets
Second Lien Debt (12.51%) (continued)            
Argon Medical Devices, Inc.(2)(3)(4)(5)(16)
Healthcare & Pharmaceuticals L + 9.50% (1.00% Floor) 6/23/2022 $25,000
 $24,447
 $25,000
 2.22%
Argon Medical Devices Holdings, Inc.(2)(3)(5)(16)
Healthcare & Pharmaceuticals L + 8.00% (1.00% Floor) 1/23/2026 7,500
 7,465
 7,515
 0.67
Berlin Packaging L.L.C. (2)(3)(13)(16)
Containers, Packaging & Glass L + 6.75% (1.00% Floor) 10/1/2022 1,146
 1,140
 1,153
 0.10
Confie Seguros Holding II Co.(2)(3)(5)(13)
Banking, Finance, Insurance & Real Estate L + 9.50% (1.25% Floor) 5/8/2019 9,000
 8,959
 8,715
 0.77
Drew Marine Group Inc.(2)(3)(4)(5)(13)(16)
Chemicals, Plastics & Rubber L + 7.00% (1.00% Floor) 5/19/2021 12,500
 12,484
 12,456
 1.10
Genex Holdings, Inc. (2)(3)(5)(16)
Banking, Finance, Insurance & Real Estate L + 7.75% (1.00% Floor) 5/30/2022 8,990
 8,915
 8,924
 0.79
Paradigm Acquisition Corp. (2)(3)(5)(17)
Business Services L + 8.50% (1.00% Floor) 10/12/2025 9,600
 9,507
 9,584
 0.85
Pathway Partners Vet Management Company LLC (2)(3)(5)(15)(16)
Consumer Services L + 8.00% (1.00% Floor) 10/10/2025 7,751
 7,644
 7,741
 0.69
Pexco LLC (2)(3)(5)(16)
Chemicals, Plastics & Rubber L + 8.00% (1.00% Floor) 5/8/2025 20,000
 19,818
 20,362
 1.81
Prowler Acquisition Corp. (Pipeline Supply and Service, LLC) (2)(3)(5)
Wholesale L + 8.50% (1.00% Floor) 7/28/2020 3,000
 2,967
 2,485
 0.22
Q International Courier, LLC (2)(3)(5)(16)
Transportation: Cargo L + 8.25% (1.00% Floor) 9/19/2025 18,750
 18,384
 18,621
 1.65
Reladyne, Inc. (2)(3)(4)(13)
Wholesale L + 9.50% (1.00% Floor) 1/21/2023 5,000
 4,884
 4,929
 0.44
Rough Country, LLC (2)(3)(5)(13)(16)
Durable Consumer Goods L + 8.50% (1.00% Floor) 11/25/2023 42,500
 41,311
 42,802
 3.80
Santa Cruz Holdco, Inc. (2)(3)(5)
Non-durable Consumer Goods L + 8.25% (1.00% Floor) 12/13/2024 17,138
 16,967
 17,079
 1.51
Superion, LLC (fka Ramundsen Public Sector, LLC) (2)(3)(13)
Sovereign & Public Finance L + 8.50% (1.00% Floor) 1/31/2025 1,800
 1,784
 1,820
 0.16
Watchfire Enterprises, Inc.(2)(3)(5)
Media: Advertising, Printing & Publishing L + 8.00% (1.00% Floor) 10/2/2021 7,000
 6,941
 7,000
 0.62
Zywave, Inc. (2)(3)(5)
High Tech Industries L + 9.00% (1.00% Floor) 11/17/2023 4,950
 4,886
 5,000
 0.44
Second Lien Debt Total        $242,887
 $246,233
 21.84%


TCG BDC, INC.
CONSOLIDATED SCHEDULE OF INVESTMENTS (Continued)
As of December 31, 2017
(dollar amounts in thousands)
Investments—non-controlled/non-affiliated (1)
Industry Shares/ Units Cost 
Fair Value(7)
 Percentage of Net Assets
Equity Investments (0.89%) (5)
         
CIP Revolution Holdings, LLCMedia: Advertising, Printing & Publishing 30,000
 $300
 $369
 0.03%
Dade Paper & Bag, LLCForest Products & Paper 1,500,000
 1,500
 2,140
 0.19
DecoPac, Inc.Non-durable Consumer Goods 1,500,000
 1,500
 1,500
 0.13
Derm Growth Partners III, LLC (Dermatology Associates)Healthcare & Pharmaceuticals 1,000,000
 1,000
 1,796
 0.16
GS Holdco LLC (Global Software, LLC)High Tech Industries 1,000,000
 1,001
 1,550
 0.14
Legacy.com Inc.High Tech Industries 1,500,000
 1,500
 1,739
 0.15
Power Stop Intermediate Holdings, LLCAutomotive 7,150
 369
 1,191
 0.11
Rough Country, LLCDurable Consumer Goods 754,775
 755
 873
 0.08
T2 Systems Parent CorporationTransportation: Consumer 555,556
 556
 499
 0.04
Tailwind HMT Holdings Corp.Energy: Oil & Gas 2,000,000
 2,000
 2,000
 0.18
THG Acquisition, LLC (The Hilb Group, LLC)Banking, Finance, Insurance & Real Estate 1,500,000
 1,500
 2,287
 0.20
Zenith American Holding, Inc.Business Services 1,561,644
 1,562
 1,562
 0.14
Equity Investments Total    $13,543
 $17,506
 1.55%
Total investments—non-controlled/non-affiliated    $1,782,488
 $1,779,584
 157.85%
Investments—non-controlled/affiliated (5)(18)
Industry 
Interest Rate (2)
 Maturity Date Par/ Principal Amount 
Amortized Cost (6)
 
Fair Value(7)
 Percentage of Net Assets
First Lien Debt (0.78%)             
TwentyEighty, Inc. - Revolver (2)(3)(15)
Business Services L + 8.00% (1.00% Floor) 3/21/2020 $
 $(6) $(20) %
TwentyEighty, Inc. - (Term A Loans) (2)(3)
Business Services L + 3.50% (1.00% Floor), cash, 4.50% PIK 3/21/2020 3,890
 3,871
 3,760
 0.33
TwentyEighty, Inc. - (Term B Loans)Business Services 1.00% cash, 7.00% PIK 3/21/2020 6,715
 6,494
 6,360
 0.57
TwentyEighty, Inc. - (Term C Loans)Business Services 0.25% cash, 8.75% PIK 3/21/2020 6,521
 5,914
 5,331
 0.47
First Lien Debt Total        $16,273
 $15,431
 1.37%
Investments—non-controlled/affiliated (5)(18)
Industry Shares/Units Cost 
Fair Value(7)
 
Percentage of
Net Assets
Equity Investments (0.00%)         
TwentyEighty Investors LLCBusiness Services 69,786
 $
 $
 %
Equity Investments Total    $
 $
 %
Total Investments - non-controlled/affiliated    $16,273
 $15,431
 1.37%
Investments—controlled/affiliatedIndustry 
Interest Rate(2)
 Maturity Date Par Amount/ LLC Interest Cost 
Fair Value(7)
 Percentage of Net Assets
Investment Fund (8.77%) (8)
             
Middle Market Credit Fund, LLC, Mezzanine Loan (2)(5)(9)(11)
Investment Fund L + 9.00% 6/22/2018 $85,750
 $85,750
 $85,750
 7.61%
Middle Market Credit Fund, LLC, Subordinated Loan and Member’s Interest (5)(11)
Investment Fund 0.001% 3/1/2021 86,501
 86,501
 86,766
 7.7
Investment Fund Total        $172,251
 $172,516
 15.31%
Total investments—controlled/affiliated        $172,251
 $172,516
 15.31%
Total investments        $1,971,012
 $1,967,531
 174.53%


TCG BDC, INC.
CONSOLIDATED SCHEDULE OF INVESTMENTS (Continued)
As of December 31, 2017
(dollar amounts in thousands)

(1)Unless otherwise indicated, issuers of debt and equity investments held by TCG BDC, Inc. (together with its consolidated subsidiaries, “we,” “us,” “our,” “TCG BDC” or the “Company”) are domiciled in the United States and issuers of structured finance obligations are domiciled in the Cayman Islands. Under the Investment Company Act of 1940, as amended (together with the rules and regulations promulgated thereunder, the “Investment Company Act”), the Company would be deemed to “control” a portfolio company if the Company owned more than 25% of its outstanding voting securities and/or held the power to exercise control over the management or policies of the portfolio company. As of December 31, 2017, the Company does not “control” any of these portfolio companies. Under the Investment Company Act, the Company would be deemed an “affiliated person” of a portfolio company if the Company owns 5% or more of the portfolio company’s outstanding voting securities. As of December 31, 2017, the Company is not an “affiliated person” of any of these portfolio companies.
(2)Variable rate loans to the portfolio companies bear interest at a rate that may be determined by reference to either LIBOR (“L”) or an alternate base rate (commonly based on the Federal Funds Rate or the U.S. Prime Rate), which generally resets quarterly. For each such loan, the Company has provided the interest rate in effect as of December 31, 2017. As of December 31, 2017, all of our LIBOR loans were indexed to the 90-day LIBOR rate at 1.69%, except for those loans as indicated in Notes 16 and 17 below.
(3)Loan includes interest rate floor feature.
(4)Denotes that all or a portion of the assets are owned by the Company’s wholly owned subsidiary, TCG BDC SPV LLC (the “SPV”). The SPV has entered into a senior secured revolving credit facility (as amended, the “SPV Credit Facility”). The lenders of the SPV Credit Facility have a first lien security interest in substantially all of the assets of the SPV (see Note 6, Borrowings). Accordingly, such assets are not available to creditors of the Company or Carlyle GMS Finance MM CLO 2015-1 LLC (the “2015-1 Issuer”).
(5)Denotes that all or a portion of the assets are owned by the Company. The Company has entered into a senior secured revolving credit facility (as amended, the “Credit Facility” and, together with the SPV Credit Facility, the “Facilities”). The lenders of the Credit Facility have a first lien security interest in substantially all of the portfolio investments held by the Company (see Note 6, Borrowings). Accordingly, such assets are not available to creditors of the SPV or the 2015-1 Issuer.
(6)Amortized cost represents original cost, including origination fees and upfront fees received that are deemed to be an adjustment to yield, adjusted for the accretion/amortization of discounts/premiums, as applicable, on debt investments using the effective interest method.
(7)Fair value is determined in good faith by or under the direction of the Board of Directors of the Company (see Note 2, Significant Accounting Policies, and Note 3, Fair Value Measurements), pursuant to the Company’s valuation policy. The fair value of all first lien and second lien debt investments, equity investments and the investment fund mezzanine loan was determined using significant unobservable inputs.
(8)The Company has determined the indicated investments are non-qualifying assets under Section 55(a) of the Investment Company Act. Under the Investment Company Act, the Company may not acquire any non-qualifying assets unless, at the time such acquisition is made, qualifying assets represent at least 70% of the Company’s total assets.
(9)Represents a corporate mezzanine loan, which is subordinated to senior secured term loans of the portfolio company/investment fund.
(10)Loan was on non-accrual status as of December 31, 2017.
(11)Under the Investment Company Act, the Company is deemed to be an “affiliated person” of and “control” this investment fund because the Company owns more than 25% of the investment fund’s outstanding voting securities and/or has the power to exercise control over management or policies of such investment fund. See Note 5, Middle Market Credit Fund, LLC, for more details.
(12)In addition to the interest earned based on the stated interest rate of this loan, which is the amount reflected in this schedule, the Company is entitled to receive additional interest as a result of an agreement among lenders as follows: Dimensional Dental Management, LLC (4.58%), EIP Merger Sub, LLC (Evolve IP) (3.97%), Legacy.com Inc. (4.11%), Payment Alliance International, Inc. (2.70%), Prime Risk Partners, Inc. (3.32%), Product Quest Manufacturing, LLC (3.54%), Reliant Pro Rehab (nil), Surgical Information Systems, LLC (1.01%) and The Hilb Group, LLC (3.38%). Pursuant to the agreement among lenders in respect of this loan, this investment represents a first lien/last out loan, which has a secondary priority behind the first lien/first out loan with respect to principal, interest and other payments.
(13)Denotes that all or a portion of the assets are owned by the 2015-1 Issuer and secure the notes issued in connection with a $400,000 term debt securitization completed by the Company on June 26, 2015 (the “2015-1 Debt Securitization”, see Note 7, 2015-1 Notes). Accordingly, such assets are not available to the creditors of the SPV or the Company.


TCG BDC, INC.
CONSOLIDATED SCHEDULE OF INVESTMENTS (Continued)
As of December 31, 2017
(dollar amounts in thousands)

(14)As of December 31, 2017, the Company had the following unfunded commitments to fund delayed draw and revolving senior secured loans:
First and Second Lien Debt—unfunded delayed draw and revolving term loans commitmentsType Unused Fee Par/ Principal Amount Fair Value
Achilles Acquisition LLCDelayed Draw 1.00% $2,051
 $(18)
Advanced Instruments, LLCRevolver 0.50 1,167
 
AMS Group HoldCo, LLCDelayed Draw 1.00 5,491
 
AMS Group HoldCo, LLCRevolver 0.50 2,315
 
Captive Resources Midco, LLCDelayed Draw 1.25 3,571
 (11)
Captive Resources Midco, LLCRevolver 0.50 2,143
 (7)
CIP Revolution Holdings, LLCRevolver 0.50 1,331
 (5)
Continuum Managed Services HoldCo, LLCDelayed Draw 1.00 1,917
 25
Continuum Managed Services HoldCo, LLCRevolver 0.50 2,500
 32
Datto, Inc.Revolver 0.50 726
 4
DermaRite Industries LLCRevolver 0.50 3,848
 (28)
Derm Growth Partners III, LLC (Dermatology Associates)Revolver 0.50 2,420
 (10)
Dimensional Dental Management, LLCDelayed Draw 1.00 9,584
 (35)
Direct Travel, Inc.Delayed Draw 1.00 4,118
 7
Frontline Technologies Holdings, LLCDelayed Draw 1.00 7,705
 (6)
FWR Holding CorporationDelayed Draw 1.00 9,333
 (111)
FWR Holding CorporationRevolver 0.50 3,889
 (46)
Global Franchise Group, LLCRevolver 0.50 495
 
National Technical Systems, Inc.Revolver 0.50 2,500
 (161)
NMI AcquisitionCo, Inc.Revolver 0.50 1,280
 (4)
OnCourse Learning CorporationRevolver 0.50 1,324
 (6)
Pathway Partners Vet Management Company LLCDelayed Draw 1.00 3,410
 (3)
Prime Risk Partners, Inc.Delayed Draw 0.50 768
 4
Prime Risk Partners, Inc.Delayed Draw 0.50 9,562
 163
PMG Acquisition CorporationRevolver 0.50 2,356
 9
Product Quest Manufacturing, LLCRevolver 0.50 3,229
 
Smile Doctors, LLCDelayed Draw 1.00 6,345
 (26)
Smile Doctors, LLCRevolver 0.50 827
 (3)
Superior Health Linens, LLCRevolver 0.50 2,617
 (4)
T2 Systems, Inc.Revolver 0.50 1,760
 (26)
The Hilb Group, LLCDelayed Draw 1.00 3,594
 (36)
TwentyEighty, Inc. (f/k/a Miller Heiman, Inc.)Revolver 0.50 607
 (20)
Vetcor Professional Practices, LLCDelayed Draw 1.00 8,248
 (31)
VRC Companies, LLCDelayed Draw 0.75 3,294
 (8)
VRC Companies, LLCRevolver 0.50 401
 (1)
Zenith Merger Sub, Inc.Revolver 0.50 1,648
 (9)
Total unfunded commitments    $118,374
 $(371)
(16)As of December 31, 2017, this LIBOR loan was indexed to the 30-day LIBOR rate at 1.56%.
(17)As of December 31, 2017, this LIBOR loan was indexed to the 180-day LIBOR rate at 1.84%.
(18)Under the Investment Company Act, the Company is deemed an “affiliated person” of this portfolio company because the Company owns 5% or more of the portfolio company’s outstanding voting securities.


TCG BDC, INC.
CONSOLIDATED SCHEDULE OF INVESTMENTS
As of December 31, 20172021
(dollar amounts in thousands)
Investments—non-controlled/non-affiliated (1)
FootnotesIndustry
Reference Rate & Spread (2)
Interest Rate (2)
Acquisition DateMaturity DatePar/ Principal Amount **
Amortized Cost (4)
Fair Value(5)
% of Net
 Assets
Derm Growth Partners III, LLC^(2)(3)(8)Healthcare & PharmaceuticalsL + 6.25%7.25%5/31/20165/31/2022$55,808 $50,996 $37,471 3.95 %
DermaRite Industries, LLC^*(2)(3)(14)Healthcare & PharmaceuticalsL + 7.00%8.00%3/3/20173/3/202219,558 19,546 15,961 1.68 
Designer Brands Inc.^(2)(3)(7)RetailL + 8.50%9.75%8/7/20208/7/202517,046 16,718 16,846 1.78 
Diligent Corporation^(2)(3)(14)TelecommunicationsL + 6.25%7.25%8/4/20208/4/2025603 588 615 0.06 
DTI Holdco, Inc.^(2)(3)High Tech IndustriesL + 4.75%5.75%12/18/20189/30/20231,934 1,883 1,907 0.20 
Dwyer Instruments, Inc^*(2)(3)(14)Capital EquipmentL + 5.50%6.25%7/21/20217/21/20272,463 2,383 2,452 0.26 
Ellkay, LLC^(2)(3)(14)Healthcare & PharmaceuticalsL + 5.75%6.75%9/14/20219/14/202714,249 13,943 13,923 1.47 
Emergency Communications Network, LLC^*(2)(3)TelecommunicationsL + 2.625%, 5.125% PIK8.75%6/1/20176/1/202325,261 25,201 21,814 2.30 
EPS Nass Parent, Inc.^(2)(3)(14)Utilities: ElectricL + 5.75%6.75%4/19/20214/19/2028887 869 878 0.09 
Ethos Veterinary Health LLC^(2)(3)Consumer ServicesL + 4.75%4.85%5/17/20195/15/20262,586 2,569 2,586 0.27 
EvolveIP, LLC^*(2)(3)(14)TelecommunicationsL + 5.50%6.50%11/26/20196/7/20255,468 5,461 5,436 0.57 
Frontline Technologies Holdings, LLC^*(2)(3)SoftwareL + 5.25%6.25%9/18/20179/18/20233,068 3,056 3,068 0.32 
Greenhouse Software, Inc.^(2)(3)(14)SoftwareL + 6.50%7.50%3/1/20213/1/202715,196 14,858 14,870 1.57 
Harbour Benefit Holdings, Inc.^*(2)(3)(14)Business ServicesL + 5.25%6.25%12/13/201712/13/20249,451 9,377 9,336 0.98 
Heartland Home Services, Inc^*(2)(3)(14)Consumer ServicesL + 6.00%7.00%12/15/202012/15/20267,314 7,169 7,371 0.78 
Hercules Borrower LLC^*(2)(3)(14)Environmental IndustriesL + 6.50%7.50%12/14/202012/14/202618,453 17,987 18,865 1.99 
Higginbotham Insurance Agency, Inc.^(2)(3)Banking, Finance, Insurance & Real EstateL + 5.50%6.25%11/25/202011/25/20264,978 4,916 4,978 0.52 
Hoosier Intermediate, LLC^*(2)(3)(14)Healthcare & PharmaceuticalsL + 5.50%6.50%11/15/202111/15/202816,479 16,108 16,101 1.70 
iCIMS, Inc.^(2)(3)SoftwareL + 6.50%7.50%9/12/20189/12/20241,671 1,652 1,670 0.18 
Individual FoodService Holdings, LLC^*(2)(3)(14)WholesaleL + 6.25%7.25%2/21/202011/22/20258,129 7,958 8,143 0.86 
Infront Luxembourg Finance S.À R.L. (Luxembourg)^(2)(3)(7)Hotel, Gaming & LeisureL + 9.00%9.00%5/28/20215/28/20278,250 9,777 9,134 0.96 
Integrity Marketing Acquisition, LLC*(2)(3)Banking, Finance, Insurance & Real EstateL + 5.75%6.75%1/15/20208/27/20254,920 4,864 4,896 0.52 
Integrity Marketing Acquisition, LLC^(2)(3)(14)Banking, Finance, Insurance & Real EstateL + 5.50%6.25%12/3/20218/27/2025— (75)(51)(0.01)
Jeg's Automotive, LLC^*(2)(3)(14)AutomotiveL + 5.75%6.75%12/22/202112/22/202730,000 29,203 29,200 3.08 
K2 Insurance Services, LLC^*(2)(3)(14)Banking, Finance, Insurance & Real EstateL + 5.00%6.00%7/3/20197/1/20263,364 3,305 3,357 0.35 
Kaseya, Inc.^(2)(3)(14)High Tech IndustriesL + 5.50%, 1.00% PIK7.50%5/3/20195/3/202518,972 18,716 18,848 1.99 
Lifelong Learner Holdings, LLC^(2)(3)(14)Business ServicesL + 5.75%6.75%10/18/201910/18/202626,210 25,830 24,035 2.53 
LinQuest Corporation*(2)(3)Aerospace & DefenseL + 5.75%6.50%7/28/20217/28/20289,975 9,785 9,816 1.03 
Liqui-Box Holdings, Inc.^(2)(3)(14)Containers, Packaging & GlassL + 4.50%5.50%6/3/20196/3/20241,490 1,475 1,229 0.13 
LVF Holdings, Inc.^*(2)(3)(14)Beverage, Food & TobaccoL + 6.25%7.25%6/10/20216/10/202741,227 40,356 40,056 4.22 
103

TCG BDC, INC.
CONSOLIDATED SCHEDULE OF INVESTMENTS
As of December 31, 2017,2021
(dollar amounts in thousands)
Investments—non-controlled/non-affiliated (1)
FootnotesIndustry
Reference Rate & Spread (2)
Interest Rate (2)
Acquisition DateMaturity DatePar/ Principal Amount **
Amortized Cost (4)
Fair Value(5)
% of Net
 Assets
Material Holdings, LLC^*(2)(3)(14)Business ServicesL + 5.75%6.50%8/19/20218/19/2027$6,906 $6,741 $6,800 0.72 %
Maverick Acquisition, Inc.^*(2)(3)(14)Aerospace & DefenseL + 6.00%7.00%6/1/20216/1/202735,962 35,192 35,061 3.70 
Medical Manufacturing Technologies, LLC^(2)(3)(14)Healthcare & PharmaceuticalsSOFR + 6.00%7.00%12/23/202112/23/202721,280 20,654 20,652 2.18 
MMIT Holdings, LLC^(2)(3)(14)High Tech IndustriesL + 6.25%7.25%9/15/20219/15/202711,087 10,858 10,853 1.14 
National Technical Systems, Inc.^(2)(3)(14)Aerospace & DefenseL + 5.50%6.50%10/28/20206/12/20231,167 1,151 1,167 0.12 
NES Global Talent Finance US, LLC (United Kingdom)^(2)(3)(7)Energy: Oil & GasL + 5.50%6.50%5/9/20185/11/20239,688 9,634 9,424 0.99 
NMI AcquisitionCo, Inc.^*(2)(3)(14)High Tech IndustriesL + 5.75%6.50%9/6/20179/6/202540,335 40,206 39,822 4.20 
Performance Health Holdings, Inc.*(2)(3)Healthcare & PharmaceuticalsL + 6.00%7.00%7/12/20217/12/20277,182 7,048 7,083 0.75 
PF Atlantic Holdco 2, LLC^*(2)(3)(14)Hotel, Gaming & LeisureL + 6.00%7.00%11/12/202111/12/202727,723 26,941 26,923 2.84 
PF Growth Partners, LLC^*(2)(3)Hotel, Gaming & LeisureL + 5.50%6.50%7/1/20197/11/20258,039 7,962 7,922 0.83 
PPT Management Holdings, LLC^(2)(3)Healthcare & PharmaceuticalsL + 6.00%, 2.00% PIK9.00%12/15/201612/16/202228,366 28,326 24,166 2.55 
Product Quest Manufacturing, LLC^(2)(3)(8)Containers, Packaging & GlassL + 6.75%10.00%9/21/20173/31/2021840 840 840 0.09 
Prophix Software Inc. (Canada)^(2)(3)(7)(14)SoftwareL + 6.50%7.50%2/1/20212/1/202610,963 10,735 11,093 1.17 
Quantic Electronics, LLC^*(2)(3)(14)Aerospace & DefenseL + 6.25%7.25%11/19/202011/19/202614,625 14,333 14,418 1.52 
Quantic Electronics, LLC^*(2)(3)(14)Aerospace & DefenseL + 6.25%7.25%3/1/20213/1/20278,882 8,662 8,727 0.92 
QW Holding Corporation^*(2)(3)Environmental IndustriesL + 6.25%7.25%8/31/20168/31/202442,671 42,530 41,933 4.42 
Redwood Services Group, LLC^*(2)(3)High Tech IndustriesL + 6.00%7.00%11/13/20186/6/202430,885 30,562 30,884 3.26 
Regency Entertainment, Inc.^(2)(3)Media: Diversified & ProductionL + 6.75%7.75%5/22/202010/22/202520,000 19,700 19,666 2.07 
Riveron Acquisition Holdings, Inc.*(2)(3)Banking, Finance, Insurance & Real EstateL + 5.75%6.75%5/22/20195/22/202511,401 11,262 11,401 1.20 
RSC Acquisition, Inc.^(2)(3)(14)Banking, Finance, Insurance & Real EstateL + 5.50%6.25%11/1/201911/1/20268,533 8,395 8,577 0.90 
Sapphire Convention, Inc.^*(2)(3)(14)TelecommunicationsL + 6.25%7.25%11/20/201811/20/202529,906 29,530 25,528 2.69 
SPay, Inc.^*(2)(3)(14)Hotel, Gaming & LeisureL + 2.30%, 6.95% PIK10.25%6/15/20186/17/202423,005 22,809 20,218 2.13 
Speedstar Holding, LLC^*(2)(3)(14)AutomotiveL + 7.00%8.00%1/22/20211/22/202727,225 26,686 27,535 2.90 
Superior Health Linens, LLC^*(2)(3)(14)Business ServicesL + 6.50%7.50%9/30/20163/31/202216,211 16,205 16,211 1.71 
TCFI Aevex LLC^*(2)(3)(14)Aerospace & DefenseL + 6.00%7.00%3/18/20203/18/202611,168 10,979 9,276 0.98 
The Leaders Romans Bidco Limited (United Kingdom) Term Loan B^(2)(3)(7)Banking, Finance, Insurance & Real EstateSONIA + 6.25%,
2.50% PIK
9.50%7/23/20196/30/2024£21,299 26,328 28,830 3.04 
The Leaders Romans Bidco Limited (United Kingdom) Term Loan C^(2)(3)(7)(14)Banking, Finance, Insurance & Real EstateSONIA + 6.25%,
2.50% PIK
9.50%7/23/20196/30/2024£6,164 7,855 9,847 1.04 
Trafigura Trading LLC^(2)(3)(13)(14)Metals & MiningL + 8.40%8.75%7/26/20217/18/20222,236 2,237 2,086 0.22 
104

TCG BDC, INC.
CONSOLIDATED SCHEDULE OF INVESTMENTS
As of December 31, 2021
(dollar amounts in thousands)
Investments—non-controlled/non-affiliated (1)
FootnotesIndustry
Reference Rate & Spread (2)
Interest Rate (2)
Acquisition DateMaturity DatePar/ Principal Amount **
Amortized Cost (4)
Fair Value(5)
% of Net
 Assets
Turbo Buyer, Inc.^*(2)(3)(14)AutomotiveL + 6.00%7.00%12/2/201912/2/2025$20,377 $20,002 $19,945 2.10 %
Unifrutti Financing PLC (Cyprus)^(7)Beverage, Food & Tobacco7.50%, 1.00% PIK8.50%9/15/20199/15/20264,621 4,917 5,353 0.56 
Unifrutti Financing PLC (Cyprus)^(7)Beverage, Food & Tobacco11.00% PIK11.00%10/22/20209/15/2026756 858 887 0.09 
US INFRA SVCS Buyer, LLC^*(2)(3)(14)Environmental IndustriesL + 6.50%7.50%4/13/20204/13/20269,137 8,677 8,387 0.88 
USALCO, LLC*(2)(3)Chemicals, Plastics & RubberL + 6.00%7.00%10/19/202110/19/20271,000 981 981 0.10 
USLS Acquisition, Inc.^(2)(3)(14)Business ServicesL + 5.50%6.50%11/30/201811/30/202415,279 15,101 15,098 1.59 
Westfall Technik, Inc.^*(2)(3)Chemicals, Plastics & RubberL + 5.75%6.75%9/13/20189/13/202421,477 21,313 21,277 2.24 
Westfall Technik, Inc.^(2)(3)Chemicals, Plastics & RubberL + 6.25%7.25%7/1/20219/13/20244,958 4,865 4,929 0.52 
Wineshipping.com LLC^*(2)(3)(14)Beverage, Food & TobaccoL + 5.75%6.75%10/29/202110/29/202714,459 14,111 14,111 1.49 
Yellowstone Buyer Acquisition, LLC^(2)(3)Consumer Goods: DurableL + 5.75%6.75%9/13/20219/13/2027449 440 440 0.05 
YLG Holdings, Inc.^(2)(3)Consumer ServicesL + 5.25%6.25%9/30/202011/1/20251,980 1,930 1,980 0.21 
First Lien Debt Total$1,219,219 $1,188,862 125.30 %
Second Lien Debt (17.9% of fair value)
11852604 Canada Inc. (Canada)^(2)(3)(7)Healthcare & PharmaceuticalsL+9.50% (100% PIK)10.50%9/30/20219/30/2028$6,590 $6,432 $6,425 0.68 %
AI Convoy S.A.R.L (United Kingdom)^(2)(3)(7)Aerospace & DefenseL + 8.25%9.25%1/17/20201/17/202824,814 24,359 25,744 2.71 
Aimbridge Acquisition Co., Inc.^(2)(3)Hotel, Gaming & LeisureL + 7.50%7.60%2/1/20192/1/20279,241 9,123 8,606 0.92 
AP Plastics Acquisition Holdings, LLC^(2)(3)Chemicals, Plastics & RubberL + 7.50%8.25%8/10/20218/10/202933,680 32,786 33,868 3.57 
AQA Acquisition Holdings, Inc.^*(2)(3)High Tech IndustriesL + 7.50%8.00%3/3/20213/3/202935,000 34,190 35,027 3.69 
Blackbird Purchaser, Inc.^(2)(3)(14)Capital EquipmentL + 7.50%8.25%12/14/20214/8/202713,790 13,423 13,423 1.41 
Brave Parent Holdings, Inc.^*(2)(3)SoftwareL + 7.50%7.60%10/3/20184/19/202618,197 17,916 18,197 1.92 
Drilling Info Holdings, Inc.^(2)(3)Energy: Oil & GasL + 8.25%8.35%2/11/20207/30/202618,600 18,212 18,786 1.98 
Jazz Acquisition, Inc.^*(2)(3)Aerospace & DefenseL + 8.00%8.10%6/13/20196/18/202723,450 23,188 20,828 2.20 
Outcomes Group Holdings, Inc.^*(2)(3)Business ServicesL + 7.50%7.85%10/23/201810/26/20261,731 1,728 1,731 0.18 
PAI Holdco, Inc.^(2)(3)AutomotiveL + 5.50%, 2.00% PIK8.50%10/28/202010/28/202813,806 13,446 13,806 1.46 
Peraton Corp.^*(2)(3)Aerospace & DefenseL + 7.75%8.50%2/24/20212/1/202912,300 12,126 12,345 1.30 
Quartz Holding Company^(2)(3)SoftwareL + 8.00%8.10%4/2/20194/2/20277,048 6,945 7,048 0.74 
Stonegate Pub Company Bidco Limited (United Kingdom)^(2)(3)(7)Beverage, Food & TobaccoSONIA + 8.50%8.60%3/12/20203/12/2028£20,000 24,787 22,263 2.35 
Tank Holding Corp.^*(2)(3)Capital EquipmentL + 8.25%8.35%3/26/20193/26/202735,965 35,600 36,325 3.83 
TruGreen Limited Partnership^(2)(3)Consumer ServicesL + 8.50%9.25%11/16/202011/2/202813,000 12,769 13,260 1.40 
105

TCG BDC, INC.
CONSOLIDATED SCHEDULE OF INVESTMENTS
As of December 31, 2021
(dollar amounts in thousands)
Investments—non-controlled/non-affiliated (1)
FootnotesIndustry
Reference Rate & Spread (2)
Interest Rate (2)
Acquisition DateMaturity DatePar/ Principal Amount **
Amortized Cost (4)
Fair Value(5)
% of Net
 Assets
Watchfire Enterprises, Inc.^(2)(3)Media: Advertising, Printing & PublishingL + 8.25%9.25%10/2/201310/2/20247,000 7,000 7,000 0.74 
World 50, Inc.^(9)Business Services11.50%11.50%1/10/20201/9/2027$18,552 $18,215 $18,405 1.94 %
WP CPP Holdings, LLC^(2)(3)Aerospace & DefenseL + 7.75%8.75%7/18/20194/30/202629,500 29,293 28,689 3.02 
Second Lien Debt Total$341,538 $341,776 36.02 %
Investments—non-controlled/non-affiliated (1)
FootnotesIndustryAcquisition DateShares/ UnitsCost
Fair
Value (5)

of Net Assets
Equity Investments (4.0% of fair value)
ANLG Holdings, LLC^(6)Capital Equipment6/22/2018592 $592 $821 0.09 %
Appriss Health, LLC^(6)Healthcare & Pharmaceuticals5/6/20214,457 4,662 0.49 
Atlas Ontario LP (Canada)^(6)(7)Business Services4/7/20215,114 5,114 5,114 0.54 
Avenu Holdings, LLC^(6)Sovereign & Public Finance9/28/2018172 172 491 0.05 
Blackbird Holdco, Inc.^(6)Capital Equipment12/14/202110 9,461 9,461 1.00 
Buckeye Parent, LLC^(6)Automotive12/22/2021885 885 885 0.09 
Chartis Holding, LLC^(6)Business Services5/1/2019433 430 691 0.07 
CIP Revolution Holdings, LLC^(6)Media: Advertising, Printing & Publishing8/19/2016318 318 205 0.02 
Cority Software Inc. (Canada)^(6)Software7/2/2019250 250 454 0.05 
Derm Growth Partners III, LLC^(6)Healthcare & Pharmaceuticals5/31/20161,000 1,000 — — 
Diligent Corporation^(6)Telecommunications4/5/202111 10,269 10,256 1.08 
ECP Parent, LLC^(6)Healthcare & Pharmaceuticals3/29/2018268 — 290 0.03 
GB Vino Parent, L.P.^(6)Beverage, Food & Tobacco10/29/2021351 351 0.04 
Integrity Marketing Group, LLC^(6)Banking, Finance, Insurance & Real Estate12/21/202115,039 14,739 14,738 1.55 
K2 Insurance Services, LLC^(6)Banking, Finance, Insurance & Real Estate7/3/2019433 306 652 0.07 
Legacy.com, Inc.^(6)High Tech Industries3/20/20171,500 1,500 1,178 0.12 
Mailgun Technologies, Inc.^(6)High Tech Industries3/26/2019104 — 1,328 0.14 
North Haven Goldfinch Topco, LLC^(6)Containers, Packaging & Glass6/18/20182,315 2,315 2,412 0.25 
Pascal Ultimate Holdings, L.P^(6)Capital Equipment7/21/202136 364 364 0.04 
Tailwind HMT Holdings Corp.^(6)Energy: Oil & Gas11/17/201722 1,558 1,719 0.18 
Tank Holding Corp.^(6)Capital Equipment3/26/2019850 482 1,261 0.13 
Titan DI Preferred Holdings, Inc.^(6)Energy: Oil & Gas2/11/202012,843 12,587 12,971 1.37 
Turbo Buyer, Inc.^(6)Automotive12/2/20191,925 933 2,773 0.29 
Unifrutti Financing PLC (Cyprus)^(6)Beverage, Food & Tobacco10/22/2020— 481 648 0.07 
Unifrutti Financing PLC (Cyprus)^(6)Beverage, Food & Tobacco10/22/2020133 209 0.02 
106

TCG BDC, INC.
CONSOLIDATED SCHEDULE OF INVESTMENTS
As of December 31, 2021
(dollar amounts in thousands)
Investments—non-controlled/non-affiliated (1)
FootnotesIndustryAcquisition DateShares/ UnitsCost
Fair
Value (5)

of Net Assets
USLS Acquisition, Inc.^(6)Business Services11/30/2018641 641 940 0.10 
W50 Parent LLC^(6)Business Services1/10/2020500 $190 $763 0.08 %
Zenith American Holding, Inc.^(6)Business Services12/13/20171,564 782 1,456 0.15 
Equity Investments Total$70,310 $77,093 8.13 %
Total investments—non-controlled/non-affiliated$1,631,067 $1,607,731 169.45 %
Investments—non-controlled/affiliatedFootnotesIndustry
Reference Rate & Spread (2)
Interest Rate (2)
Acquisition DateMaturity DatePar/ Principal Amount **
Amortized Cost (4)
Fair
Value (5)
% of Net 
Assets
First Lien Debt (1.6% of fair value)
Direct Travel, Inc.^*(2)(3)(8)(12)Hotel, Gaming & LeisureL + 1.00%, 7.50% PIK9.50%10/14/201610/1/2023$36,711 $35,859 $27,555 2.9 %
Direct Travel, Inc.^(2)(3)(12)(14)Hotel, Gaming & LeisureL + 6.00%7.00%10/1/202010/1/20232,731 2,603 2,731 0.29 
First Lien Debt Total$38,462 $30,286 3.19 %
Investments—non-controlled/affiliatedFootnotesIndustryAcquisition DateShares/ UnitsCost
Fair
Value 
(5)
% of Net 
Assets
Equity Investments (0.0% of fair value)
Direct Travel, Inc.^(6)(12)Hotel, Gaming & Leisure10/1/202043 $— $— — %
Equity Investments Total43$— $— — %
Total investments—non-controlled/affiliated$38,462 $30,286 3.19 %
Investments—controlled/affiliatedFootnotesIndustry
Reference Rate & Spread (2)
Interest Rate (2)
Acquisition DateMaturity DatePar/ Principal Amount **
Amortized Cost (4)
Fair
Value (5)
% of Net 
Assets
First Lien Debt (0.7% of fair value)
SolAero Technologies Corp. (A1 Term Loan)^(2)(3)(8)(10)TelecommunicationsL + 8.00% (100% PIK)9.00%4/12/201910/12/2022$3,166 $3,166 $2,850 0.30 %
SolAero Technologies Corp. (A2 Term Loan)^(2)(3)(8)(10)TelecommunicationsL + 8.00% (100% PIK)9.00%4/12/201910/12/20228,707 8,707 7,835 0.83 
SolAero Technologies Corp. (Priority Facilities)^(2)(3)(10)(14)TelecommunicationsL + 6.00%7.00%4/12/201910/12/20222,251 2,240 2,251 0.24 
First Lien Debt Total$14,113 $12,936 1.36 %
First Lien Debt Total000#DIV/0!
107

TCG BDC, INC.
CONSOLIDATED SCHEDULE OF INVESTMENTS
As of December 31, 2021
(dollar amounts in thousands)
Investments—controlled/affiliatedFootnotesIndustryAcquisition DateShares/ UnitsCost
Fair
Value 
(5)
% of Net 
Assets
Equity Investments (0.0% of fair value)
SolAero Technologies Corp.^(6)(10)Telecommunications4/12/2019$2,815 $— — %
Equity Investments Total$2,815 $— — %
Investments—controlled/affiliatedFootnotesIndustry
Reference Rate & Spread(2)
Interest Rate(2)
Acquisition DateMaturity DatePar Amount/ LLC InterestCost
Fair Value(7)
% of Net 
Assets
Investment Funds (13.7% of fair value)
Middle Market Credit Fund II, LLC, Member's Interest^(7)(10)Investment FundsN/A—%11/3/202012/31/2030$78,122 $78,096 $77,958 8.22 %
Middle Market Credit Fund, LLC, Subordinated Loan and Member's Interest^(7)(10)Investment FundsN/A—%2/29/201612/31/2024193,000 193,000 184,141 19.41 
Middle Market Credit Fund, Mezzanine Loan^(2)(7)(9)(10)Investment FundsL + 9.00%9.210%6/30/20165/21/2022— — — — 
Investment Funds Total$271,096 $262,099 27.62 %
Total investments—controlled/affiliated$288,024 $275,035 29.00 %
Total investments$1,957,553 $1,913,052 201.63 %
^ Denotes that all or a portion of the assets are owned by TCG BDC, Inc. (together with its consolidated subsidiaries, “we,” “us,” “our,” “TCG BDC” or the “Company”). The Company has entered into a senior secured revolving credit facility (as amended, the “Credit Facility”). The lenders of the Credit Facility have a first lien security interest in substantially all of the portfolio investments held by the Company (see Note 7, Borrowings). Accordingly, such assets are not available to creditors of Carlyle Direct Lending CLO 2015-1R LLC (formerly known as Carlyle GMS Finance MM CLO 2015-1 LLC) (the “2015-1 Issuer”).
* Denotes that all or a portion of the assets are owned by the Company's wholly owned subsidiary, the 2015-1 Issuer, and secure the notes issued in connection with a term debt securitization completed by the Company on June 26, 2015 (see Note 8, Notes Payable). Accordingly, such assets are not available to the creditors of the Company.
** Par amount is denominated in USD ("$") unless otherwise noted, as denominated in Euro (“€”) or British Pound (“£”)
(1)Unless otherwise indicated, issuers of debt and equity investments held by the Company are domiciled in the United States. Under the Investment Company Act of 1940, as amended (together with the rules and regulations promulgated thereunder, the “Investment Company Act”), the Company would be deemed to “control” a portfolio company if the Company owned more than 25% of its outstanding voting securities and/or held the power to exercise control over the management or policies of the portfolio company. As of December 31, 2021, the Company does not “control” any of these portfolio companies. Under the Investment Company Act, the Company would be deemed an “affiliated person” of a portfolio company if the Company owns 5% or more of the portfolio company’s outstanding voting securities. As of December 31, 2021, the Company is not an “affiliated person” of any of these portfolio companies. Certain portfolio company investments are subject to contractual restrictions on sales.
(2)Variable rate loans to the portfolio companies bear interest at a rate that is determined by reference to either LIBOR (“L”) or an alternate base rate (commonly based on the Federal Funds Rate or the U.S. Prime Rate), which generally resets quarterly. For each such loan, the Company has indicated the reference rate used and provided the spread and the interest rate in effect as of December 31, 2021. As of December 31, 2021, the reference rates for our variable rate loans were the 30-day LIBOR at 0.10%, the 90-day LIBOR at 0.22% and the 180-day LIBOR at 0.33%.
(3)Loan includes interest rate floor feature, which is generally 1.00%.
(4)Amortized cost represents original cost, including origination fees and upfront fees received that are deemed to be an adjustment to yield, adjusted for the accretion/amortization of discounts/premiums, as applicable, on debt investments using the effective interest method.
(5)Fair value is determined in good faith by or under the direction of the Board of Directors of the Company (see Note 2, Significant Accounting Policies, and Note 3, Fair Value Measurements), pursuant to the Company’s valuation policy. The fair value of all first lien and second lien debt investments, equity investments and the investment fund was determined using significant unobservable inputs.
(6)Security acquired in transaction exempt from registration under the Securities Act of 1933, as amended (the “Securities Act”), and may be deemed to be “restricted securities” under the Securities Act, unless otherwise noted. As of December 31, 2021, the aggregate fair value of these securities is $77,093, or 8.13% of the Company’s net assets.
(7)The Company has determined the indicated investments are non-qualifying assets under Section 55(a) of the Investment Company Act. Under the Investment Company Act, the Company may not acquire any non-qualifying assets unless, at the time such acquisition is made, qualifying assets represent at least 70% of the Company’s total assets.
(8)Loan was on non-accrual status as of December 31, 2021.
(9)Represents a corporate mezzanine loan, which is subordinated to senior secured term loans of the portfolio company/investment fund.
108

TCG BDC, INC.
CONSOLIDATED SCHEDULE OF INVESTMENTS
As of December 31, 2021
(dollar amounts in thousands)
(10)Under the Investment Company Act, the Company is deemed to be an “affiliated person” of and “control” this investment fund because the Company owns more than 25% of the investment fund’s outstanding voting securities and/or has the power to exercise control over management or policies of such investment fund. See Notes 5, Middle Market Credit Fund, LLC and 6. Middle Market Credit Fund II, LLC, for more details. Transactions related to investments in controlled affiliates for the year ended December 31, 2021, were as follows:
Investments—controlled/affiliatedFair Value as of December 31, 2020Additions/PurchasesReductions/Sales/ PaydownsNet Realized Gain (Loss)Net Change in Unrealized Appreciation (Depreciation)Fair Value as of December 31, 2021Dividend and Interest Income
Middle Market Credit Fund, LLC, Mezzanine Loan$— $— $— $— $— $— $— 
Middle Market Credit Fund, LLC, Subordinated Loan and Member’s Interest
205,891 — (23,000)— 1,250 184,141 20,000 
Middle Market Credit Fund II, LLC, Member’s Interest77,395 — — — 563 77,958 10,063 
Total investments—controlled/affiliated$283,286 $— $(23,000)$— $1,813 $262,099 $30,063 
Investments—controlled/affiliatedFair Value as of December 31, 2020Additions/PurchasesReductions/Sales/ PaydownsNet Realized Gain (Loss)Net Change in Unrealized Appreciation (Depreciation)Fair Value as of December 31, 2021Dividend and Interest Income
SolAero Technologies Corp. (Priority Term Loan)2,460 — (189)— (20)2,251 185 
SolAero Technologies Corp. (A1 Term Loan)1,214 — — — 1,636 2,850 — 
SolAero Technologies Corp. (A2 Term Loan)3,338 — — — 4,497 7,835 — 
Solaero Technology Corp. (Equity)— — — — — — — 
Total investments—controlled/affiliated$7,012 $— $(189)$— $6,113 $12,936 $185 
(11)In addition to the interest earned based on the stated interest rate of this loan, which is the amount reflected in this schedule, the Company is entitled to receive additional interest as a result of an agreement among lenders. Pursuant to the agreement among lenders in respect of this loan, this investment represents a first lien/last out loan, which has a secondary priority behind the first lien/first out loan with respect to principal, interest and other payments.
(12)Under the Investment Company Act, the Company is deemed an “affiliated person” of this portfolio because the Company owns 5% or more of the portfolio company’s outstanding voting securities. Transactions related the portfolio company during the year ended December 31, 2021 were as follows:
Investments—non-controlled/affiliatedFair Value as of December 31, 2020Additions/PurchasesReductions/Sales/ PaydownsNet Realized Gain (Loss)Net Change in Unrealized Appreciation (Depreciation)Fair Value as of December 31, 2021Dividend and Interest Income
Direct Travel, Inc.$24,949 $— $(484)$$3,087 $27,555 $— 
Direct Travel, Inc.1,231 1,372 — — 128 2,731 173 
Direct Travel, Inc. (Equity)— — — — — — — 
Total investments—non-controlled/affiliated$26,180 $1,372 $(484)$$3,215 $30,286 $173 
109

TCG BDC, INC.
CONSOLIDATED SCHEDULE OF INVESTMENTS
As of December 31, 2021
(dollar amounts in thousands)
(13)The investment is secured by receivables purchased from the portfolio company, with an implied discount of 8.75%. The investment was made via a tranched participation arrangement between the purchaser of such receivables and the Company. The investment has a secondary priority behind the rights of such purchaser.
(14)As of December 31, 2021, the Company had the following unfunded commitments to fund delayed draw and revolving senior secured loans:
Investments—non-controlled/non-affiliatedTypeUnused FeePar/ Principal AmountFair Value
First and Second Lien Debt—unfunded delayed draw and revolving term loans commitments
Advanced Web Technologies Holding CompanyDelayed Draw1.00%$2,723 $27 
Advanced Web Technologies Holding CompanyDelayed Draw1.00%$1,051 $11 
Advanced Web Technologies Holding CompanyRevolver0.50906 
Airnov, Inc.Revolver0.50875 — 
American Physician Partners, LLCRevolver0.50550 — 
Analogic CorporationRevolver0.5072 (1)
Applied Technical Services, LLCRevolver0.5040 — 
Appriss Health, LLCRevolver0.502,963 
Apptio, Inc.Revolver0.501,420 — 
Ascend Buyer, LLCRevolver0.501,070 (17)
Associations, Inc.Revolver0.50723 
Blackbird Purchaser, Inc.Delayed Draw1.004,597 (92)
BMS Holdings III Corp.Delayed Draw1.009,688 (149)
Bubbles Bidco S.P.A. (Italy)Delayed Draw2.80873 (30)
Bubbles Bidco S.P.A. (Italy)Delayed Draw537 (9)
Captive Resources Midco, LLCRevolver0.502,143 (12)
Chartis Holding, LLCRevolver0.50217 — 
Chemical Computing Group ULC (Canada)Revolver0.5029 — 
Chudy Group, LLCDelayed Draw1.00138 
Chudy Group, LLCRevolver0.5034 
Comar Holding Company, LLCRevolver0.502,935 (59)
Cority Software Inc. (Canada)Revolver0.503,000 (1)
DCA Investment Holding, LLCDelayed Draw1.001,495 (8)
DermaRite Industries, LLCRevolver0.50579 (103)
Diligent CorporationDelayed Draw1.00110 
Diligent CorporationRevolver0.5047 
Direct Travel, Inc.Delayed Draw0.501,657 — 
Dwyer Instruments, IncDelayed Draw1.001,003 (3)
Dwyer Instruments, IncRevolver0.50411 (1)
Ellkay, LLCRevolver0.501,786 (36)
EPS Nass Parent, Inc.Delayed Draw1.0085 (1)
EPS Nass Parent, Inc.Revolver0.5025 — 
EvolveIP, LLCRevolver0.50798 (4)
110

TCG BDC, INC.
CONSOLIDATED SCHEDULE OF INVESTMENTS
As of December 31, 2021
(dollar amounts in thousands)
Investments—non-controlled/non-affiliatedTypeUnused FeePar/ Principal AmountFair Value
Greenhouse Software, Inc.Revolver0.501,471 (29)
Harbour Benefit Holdings, Inc.Revolver0.502,120 (21)
Heartland Home Services, IncDelayed Draw1.006,902 27 
Heartland Home Services, IncRevolver0.50598 
Hercules Borrower LLCRevolver0.502,160 43 
Hoosier Intermediate, LLCRevolver0.50%$2,400 $(48)
Individual FoodService Holdings, LLCDelayed Draw1.0048 — 
Individual Foodservice Holdings, LLCDelayed Draw1.00890 
Individual FoodService Holdings, LLCDelayed Draw1.00188 — 
Individual FoodService Holdings, LLCRevolver0.50706 — 
Integrity Marketing Acquisition, LLCDelayed Draw5,000 (51)
Jeg's Automotive, LLCDelayed Draw1.006,667 (133)
Jeg's Automotive, LLCRevolver0.503,333 (67)
K2 Insurance Services, LLCRevolver0.501,120 (2)
Kaseya, Inc.Delayed Draw1.00585 (3)
Kaseya, Inc.Revolver0.501,543 (9)
Lifelong Learner Holdings, LLCRevolver0.50— 
Liqui-Box Holdings, Inc.Revolver0.501,140 (113)
LVF Holdings, Inc.Delayed Draw1.004,670 (116)
LVF Holdings, Inc.Revolver0.501,459 (36)
Material Holdings, LLCDelayed Draw1,916 (21)
Material Holdings, LLCRevolver1.00806 (9)
Maverick Acquisition, Inc.Delayed Draw1.004,679 (101)
Maverick Acquisition, Inc.Delayed Draw1.001,290 (28)
Medical Manufacturing Technologies, LLCDelayed Draw1.008,264 (165)
Medical Manufacturing Technologies, LLCRevolver0.501,859 (37)
MMIT Holdings, LLCRevolver0.50857 (17)
National Technical Systems, Inc.Revolver0.50835 — 
NMI AcquisitionCo, Inc.Revolver0.501,280 (16)
PF Atlantic HoldCo 2, LLCDelayed Draw0.759,517 (190)
PF Atlantic HoldCo 2, LLCRevolver0.502,759 (55)
Prophix Software Inc. (Canada)Revolver0.501,993 20 
Quantic Electronics, LLCRevolver0.50557 (7)
Quantic Electronics, LLCDelayed Draw1.003,164 (41)
Quantic Electronics, LLCRevolver0.50824 (11)
RSC Acquisition, Inc.Delayed Draw0.502,435 
RSC Acquisition, Inc.Revolver0.50215 
111

TCG BDC, INC.
CONSOLIDATED SCHEDULE OF INVESTMENTS
As of December 31, 2021
(dollar amounts in thousands)
Investments—non-controlled/non-affiliatedTypeUnused FeePar/ Principal AmountFair Value
Sapphire Convention, Inc.Revolver0.502,561 (345)
SolAero Technologies Corp. (Priority Facilities)Revolver0.50984 — 
SolAero Technologies Corp. (Priority Facilities)Revolver0.501,084 — 
Speedstar Holding, LLCDelayed Draw1.003,775 38 
Superior Health Linens, LLCRevolver0.50417 — 
TCFI Aevex LLCDelayed Draw1.00%$1,835 $(263)
TCFI Aevex LLCDelayed Draw1.00214 (31)
The Leaders Romans Bidco Limited (United Kingdom)Delayed Draw1.60£1,902 399 
Trafigura Trading LLCRevolver0.507,762 (133)
Turbo Buyer, Inc.Revolver0.501,217 (24)
US INFRA SVCS Buyer, LLCDelayed Draw1.0022,234 (527)
US INFRA SVCS Buyer, LLCRevolver0.50263 (6)
USLS Acquisition, Inc.Revolver0.501,135 (12)
Wineshipping.com LLCDelayed Draw1.001,986 (39)
Wineshipping.com LLCRevolver0.501,430 (28)
Total unfunded commitments$180,498 $(2,660)
112

TCG BDC, INC.
CONSOLIDATED SCHEDULE OF INVESTMENTS
As of December 31, 2021
(dollar amounts in thousands)
As of December 31, 2021, investments at fair value consisted of the following:
TypeTypeAmortized CostFair Value% of Fair Value
Type Amortized Cost Fair Value % of Fair Value
First Lien Debt (excluding First Lien/Last Out) $1,295,406
 $1,293,641
 65.75%
First Lien/Last Out Unitranche 246,925
 237,635
 12.08
First Lien DebtFirst Lien Debt$1,271,794 $1,232,084 64.4 %
Second Lien Debt 242,887
 246,233
 12.51
Second Lien Debt341,538 341,776 17.9 
Equity Investments 13,543
 17,506
 0.89
Equity Investments73,125 77,093 4.0 
Investment Fund 172,251
 172,516
 8.77
Investment FundsInvestment Funds271,096 262,099 13.7 
Total $1,971,012
 $1,967,531
 100.00%Total$1,957,553 $1,913,052 100.0 %
The rate type of debt investments at fair value as of December 31, 20172021 was as follows:
Rate TypeAmortized CostFair Value% of Fair Value of First and Second Lien Debt
Floating Rate$1,589,342 $1,549,215 98.4 %
Fixed Rate23,990 24,645 1.6 
Total$1,613,332 $1,573,860 100.0 %

113

Rate Type Amortized Cost Fair Value % of Fair Value of First and Second Lien Debt
Floating Rate $1,772,810
 $1,765,818
 99.34%
Fixed Rate 12,408
 11,691
 0.66
Total $1,785,218
 $1,777,509
 100.00%
TCG BDC, INC.
CONSOLIDATED SCHEDULE OF INVESTMENTS
As of December 31, 2021
(dollar amounts in thousands)
The industry composition of investments at fair value as of December 31, 20172021 was as follows:
Industry Amortized Cost Fair Value % of Fair ValueIndustryAmortized CostFair Value% of Fair Value
Aerospace & Defense $63,119
 $62,466
 3.17%Aerospace & Defense$169,068 $166,071 8.7 %
Automotive 10,112
 10,916
 0.55
Automotive91,155 94,144 4.9 
Banking, Finance, Insurance & Real Estate 171,272
 173,935
 8.84
Banking, Finance, Insurance & Real Estate91,999 97,377 5.1 
Beverage, Food & Tobacco 49,870
 50,566
 2.57
Beverage, Food & Tobacco85,994 83,878 4.4 
Business Services 177,862
 178,985
 9.10
Business Services102,065 102,308 5.4 
Capital Equipment 40,115
 40,757
 2.07
Capital Equipment64,717 66,515 3.5 
Chemicals, Plastics & Rubber 32,302
 32,818
 1.67
Chemicals, Plastics & Rubber59,945 61,055 3.2 
Construction & Building 24,373
 24,595
 1.25
Construction & Building11,277 11,450 0.6 
Consumer Goods: DurableConsumer Goods: Durable440 440 — 
Consumer Goods: Non-DurableConsumer Goods: Non-Durable5,303 5,158 0.3 
Consumer Services 120,327
 121,147
 6.16
Consumer Services25,155 25,909 1.4 
Containers, Packaging & Glass 46,509
 33,635
 1.71
Containers, Packaging & Glass52,154 52,113 2.7 
Durable Consumer Goods 57,948
 59,490
 3.02
Energy: Electricity 43,004
 42,387
 2.15
Energy: Oil & Gas 15,439
 15,369
 0.78
Energy: Oil & Gas41,991 42,900 2.2 
Environmental Industries 35,772
 35,715
 1.82
Environmental Industries69,194 69,185 3.6 
Forest Products & Paper 50,322
 52,024
 2.64
Healthcare & Pharmaceuticals 230,705
 232,715
 11.83
Healthcare & Pharmaceuticals250,294 229,555 12.0 
High Tech Industries 181,671
 186,695
 9.49
High Tech Industries149,185 151,430 7.9 
Hotel, Gaming & Leisure 48,399
 46,642
 2.37
Hotel, Gaming & Leisure126,237 113,201 5.9 
Investment Fund 172,251
 172,516
 8.77
Investment FundsInvestment Funds271,096 262,099 13.7 
Media: Advertising, Printing & Publishing 34,775
 34,988
 1.78
Media: Advertising, Printing & Publishing7,318 7,205 0.4 
Media: Diversified & ProductionMedia: Diversified & Production19,700 19,666 1.0 
Metals & Mining 7,901
 7,931
 0.40
Metals & Mining2,237 2,086 0.1 
Non-durable Consumer Goods 58,661
 52,792
 2.68
RetailRetail44,644 44,992 2.4 
Software 55,515
 56,069
 2.85
Software105,958 104,673 5.5 
Sovereign & Public Finance 1,784
 1,820
 0.09
Sovereign & Public Finance13,623 14,036 0.7 
Telecommunications 79,297
 78,813
 4.01
Telecommunications87,977 76,585 4.0 
Transportation: Cargo 84,493
 85,362
 4.34
Transportation: Consumer 36,438
 36,595
 1.86
Utilities: ElectricUtilities: Electric869 878 — 
Wholesale 40,776
 39,788
 2.03
Wholesale7,958 8,143 0.4 
Total $1,971,012
 $1,967,531
 100.00%Total$1,957,553 $1,913,052 100.0 %

Table of Contents114


TCG BDC, INC.
CONSOLIDATED SCHEDULE OF INVESTMENTS (Continued)
As of December 31, 20172021
(dollar amounts in thousands)
The geographical composition of investments at fair value as of December 31, 20172021 was as follows:
GeographyAmortized CostFair Value% of Fair Value
Canada$46,433 $47,543 2.5 %
Cyprus6,389 7,097 0.4 
Italy5,303 5,158 0.3 
Luxembourg41,647 38,403 2.0 
United Kingdom92,963 96,108 5.0 
United States1,764,818 1,718,743 89.8 
Total$1,957,553 $1,913,052 100.0 %
Geography Amortized Cost Fair Value % of Fair Value
United Kingdom $13,439
 $13,369
 0.68%
United States 1,957,573
 1,954,162
 99.32
Total $1,971,012
 $1,967,531
 100.00%

The accompanying notes are an integral part of these consolidated financial statements.


115


TCG BDC, INC.
CONSOLIDATED SCHEDULE OF INVESTMENTS
As of December 31, 20162020
(dollar amounts in thousands)
Investments—non-controlled/non-affiliated (1)Industry Interest Rate (2) Maturity Date Par/ Principal Amount Amortized Cost (6) Fair Value (7) Percentage of Net Assets
First Lien Debt (80.09%)             
Access CIG, LLC (2)(3)(4)(13)
Business Services L + 5.00% (1.00% Floor) 10/17/2021 $18,335
 $18,222
 $18,335
 2.40%
Advanced Instruments, LLC (2)(3)(4)(5)(13)(15)
Healthcare & Pharmaceuticals L + 5.25% (1.00% Floor) 10/31/2022 22,500
 22,019
 22,252
 2.91
AF Borrower LLC (Accuvant) (2)(3)(4)
High Tech Industries L + 5.25% (1.00% Floor) 1/28/2022 16,113
 15,923
 16,113
 2.11
Alpha Packaging Holdings, Inc. (2)(3)(4)(13)
Containers, Packaging & Glass L + 4.25% (1.00% Floor) 5/12/2020 11,322
 11,313
 11,322
 1.48
Anaren, Inc. (2)(3)(4)(13)
Telecommunications L + 4.50% (1.00% Floor) 2/18/2021 10,869
 10,800
 10,869
 1.42
Audax AAMP Holdings, Inc.(2)(3)(4)(13)
Durable Consumer Goods L + 6.00% (1.00% Floor) 6/24/2017 10,424
 10,400
 10,348
 1.35
BAART Programs, Inc. (2)(4)(16)
Healthcare & Pharmaceuticals L + 7.75% (0.00% Floor) 10/9/2021 7,406
 7,355
 7,534
 0.99
Brooks Equipment Company, LLC (2)(3)(4)(13)
Construction & Building L + 5.00% (1.00% Floor) 8/29/2020 6,694
 6,657
 6,683
 0.87
Capstone Logistics Acquisition, Inc.(2)(3)(4)(13)
Transportation: Cargo L + 4.50% (1.00% Floor) 10/7/2021 19,478
 19,337
 19,212
 2.51
Captive Resources Midco,LLC (2)(3)(4)(13)(15)
Banking, Finance, Insurance & Real Estate L + 5.75% (1.00% Floor) 6/30/2020 29,050
 28,683
 29,009
 3.80
Central Security Group, Inc. (2)(3)(4)(13)(16)
Consumer Services L + 5.63% (1.00% Floor) 10/6/2020 28,658
 28,300
 28,557
 3.74
CIP Revolution Holdings, LLC (2)(3)(5)(15)
Media: Advertising,
Printing & Publishing
 L + 6.00% (1.00% Floor) 8/19/2021 16,500
 16,325
 16,585
 2.17
Colony Hardware Corporation (2)(3)(4)(13)
Construction & Building L + 6.00% (1.00% Floor) 10/23/2021 17,038
 16,806
 17,038
 2.23
Datapipe, Inc. (2)(3)(13)(16)
Telecommunications L + 4.75% (1.00% Floor) 3/15/2019 9,750
 9,666
 9,764
 1.28
Dent Wizard International Corporation (2)(3)(4)(13)(16)
Automotive L + 4.75% (1.00% Floor) 4/7/2020 7,216
 7,190
 7,216
 0.94
Derm Growth Partners III, LLC (Dermatology Associates) (2)(3)(4)(5)(13)(15)
Healthcare & Pharmaceuticals L + 6.50% (1.00% Floor) 5/31/2022 32,929
 32,393
 32,958
 4.31
Dimensional Dental Management, LLC (2)(3)(5)(12)(15)
Healthcare & Pharmaceuticals L + 7.00% (1.00% Floor) 2/12/2021 18,000
 17,601
 17,811
 2.33
Dimora Brands, Inc. (fka TK USA Enterprises,Inc.) (2)(3)(5)(15)
Construction & Building L + 4.50% (1.00% Floor) 4/4/2022 
 (60) (30) 
Direct Travel, Inc. (2)(3)(4)(5)(13)(15)
Hotel, Gaming & Leisure L + 6.50% (1.00% Floor) 12/1/2021 12,842
 12,420
 12,712
 1.66
EIP Merger Sub, LLC (Evolve IP) (2)(3)(5)(12)
Telecommunications L + 6.25% (1.00% Floor) 6/7/2021 23,750
 23,098
 23,242
 3.04
Emerging Markets Communications, LLC (2)(3)(4)(8)(13)
Telecommunications L + 5.75% (1.00% Floor) 7/1/2021 17,730
 16,299
 17,730
 2.32
EP Minerals, LLC (2)(3)(4)(13)
Metals & Mining L + 4.50% (1.00% Floor) 8/20/2020 10,264
 10,232
 10,259
 1.34
FCX Holdings Corp. (2)(3)(4)(13)(16)
Capital Equipment L + 4.50% (1.00% Floor) 8/4/2020 9,856
 9,852
 9,856
 1.29
Genex Holdings, Inc. (2)(3)(13)(16)
Banking, Finance, Insurance & Real Estate L + 4.25% (1.00% Floor) 5/30/2021 4,200
 4,187
 4,196
 0.55
Global Software, LLC (2)(3)(4)(13)(16)
High Tech Industries L + 5.50% (1.00% Floor) 5/2/2022 16,163
 15,880
 16,163
 2.12
Green Energy Partners/Stonewall LLC (2)(3)(5)(13)
Energy: Electricity L + 5.50% (1.00% Floor) 11/13/2021 16,600
 16,475
 16,598
 2.17
Green Plains II LLC (2)(3)(4)(5)(13)(15)
Beverage, Food & Tobacco L + 7.00% (1.00% Floor) 10/3/2022 15,205
 15,059
 15,379
 2.01
Hummel Station LLC (2)(3)(5)(13)(16)
Energy: Electricity L + 6.00% (1.00% Floor) 10/27/2022 21,000
 20,308
 20,160
 2.64
Imagine! Print Solutions, LLC (2)(3)(4)(13)
Media: Advertising, Printing & Publishing L + 6.00% (1.00% Floor) 3/30/2022 18,461
 18,213
 18,603
 2.43
Imperial Bag & Paper Co. LLC (2)(3)(4)(13)(16)
Forest Products & Paper L + 6.00% (1.00% Floor) 1/7/2022 24,074
 23,752
 23,924
 3.13
Indra Holdings Corp. (Totes Isotoner) (2)(3)(5)(13)
Non-durable Consumer Goods L + 4.25% (1.00% Floor) 5/1/2021 14,224
 14,130
 10,553
 1.38
International Medical Group, Inc. (2)(3)(5)(12)
Banking, Finance, Insurance & Real Estate L + 6.50% (1.00% Floor) 10/30/2020 30,000
 29,505
 30,237
 3.96
Jackson Hewitt Inc. (2)(3)(4)(13)
Retail L + 7.00% (1.00% Floor) 7/30/2020 8,758
 8,625
 8,320
 1.09

Investments—non-controlled/non-affiliated (1)
FootnotesIndustry
Reference Rate & Spread (2)
Interest Rate (2)
Acquisition DateMaturity DatePar/ Principal Amount **
Amortized Cost (4)
Fair Value(5)
% of Net
 Assets
First Lien Debt (65.2% of fair value)
Advanced Web Technologies Holding Company^(2)(3)(13)Containers, Packaging & GlassL + 6.00%7.00%12/17/202012/17/2026$6,042 $5,859 $5,858 0.65 %
Airnov, Inc.^*(2)(3)(13)Containers, Packaging & GlassL + 5.25%6.25%12/20/201912/19/202511,216 11,057 11,221 1.24 
Alpha Packaging Holdings, Inc.*(2)(3)Containers, Packaging & GlassL + 6.00%7.00%6/26/201511/12/20212,784 2,784 2,784 0.31 
Alpine SG, LLC*(2)(3)High Tech IndustriesL + 5.75%6.75%2/2/201811/16/202210,890 10,835 10,808 1.20 
Alpine SG, LLC^(2)(3)High Tech IndustriesL + 8.50%9.50%7/24/202011/16/20221,618 1,578 1,612 0.18 
Alpine SG, LLC^*(2)(3)High Tech IndustriesL + 6.50%7.50%11/2/202011/16/202210,750 10,452 10,698 1.19 
American Physician Partners, LLC^*(2)(3)(13)Healthcare & PharmaceuticalsL + 6.75%7.75%1/7/201912/21/202128,848 28,715 27,295 3.03 
AMS Group HoldCo, LLC^(2)(3)(13)Transportation: CargoL + 6.50%7.50%9/29/20179/29/202322,252 22,004 21,945 2.43 
Analogic Corporation*(2)(3)(13)Capital EquipmentL + 5.25%6.25%6/22/20186/22/20242,361 2,332 2,361 0.26 
Anchor Hocking, LLC^(2)(3)Durable Consumer GoodsL + 11.75%12.75%1/25/20191/25/20249,758 9,547 9,358 1.04 
Applied Technical Services, LLC^(2)(3)(13)Business ServicesL + 5.75%6.75%12/29/202012/29/2026395 382 382 0.04 
Apptio, Inc.^(2)(3)(13)SoftwareL + 7.25%8.25%1/10/20191/10/20255,184 5,073 5,297 0.59 
At Home Holding III, Inc.^(2)(3)(7)RetailL + 9.00%10.00%6/12/20207/27/2022875 858 870 0.10 
Aurora Lux FinCo S.Á.R.L. (Luxembourg)^*(2)(3)(7)SoftwareL + 5.75%6.75%12/24/201912/24/202632,819 32,093 29,970 3.32 
Avenu Holdings, LLC^*(2)(3)Sovereign & Public FinanceL + 5.25%6.25%9/28/20189/28/202437,276 36,883 37,276 4.14 
Barnes & Noble, Inc.^(2)(3)(11)RetailL + 5.50%6.50%8/7/20198/7/202416,744 16,426 15,808 1.75 
BlueCat Networks, Inc. (Canada)*(2)(3)(7)High Tech IndustriesL + 6.25%7.25%10/30/202010/30/202611,468 11,243 11,239 1.25 
BMS Holdings III Corp.*(2)(3)Construction & BuildingL + 5.25%6.25%9/30/20199/30/20261,596 1,554 1,578 0.18 
Captive Resources Midco, LLC^*(2)(3)(13)Banking, Finance, Insurance & Real EstateL + 5.75%6.75%6/30/20155/31/202510,525 10,370 10,611 1.18 
Central Security Group, Inc.^*(2)(3)Consumer ServicesL + 6.00%7.00%10/16/202010/16/20259,278 9,278 7,930 0.88 
Chartis Holding, LLC^*(2)(3)(13)Business ServicesL + 5.50%6.50%5/1/20195/1/202516,266 15,969 16,275 1.81 
Chemical Computing Group ULC (Canada)^*(2)(3)(7)(13)SoftwareL + 5.00%6.00%8/30/20188/30/2023471 469 471 0.05 
CircusTrix Holdings, LLC^*(2)(3)Hotel, Gaming & LeisureL + 6.75% (100% PIK)7.75%2/2/201812/6/202110,023 9,987 8,093 0.90 
Cobblestone Intermediate Holdco LLC^(2)(3)(13)Consumer ServicesL + 4.75%5.75%1/29/20201/29/2026720 713 723 0.08 
Comar Holding Company, LLC^*(2)(3)(13)Containers, Packaging & GlassL + 5.50%6.50%6/18/20186/18/202422,037 21,636 22,147 2.46 
Cority Software Inc. (Canada)^*(2)(3)(7)(13)SoftwareL + 5.25%6.25%7/2/20197/2/202610,622 10,401 10,718 1.19 
Cority Software Inc. (Canada)^(2)(3)(7)SoftwareL + 7.25%8.25%9/3/20207/2/20261,898 1,843 1,935 0.21 
Derm Growth Partners III, LLC^(2)(3)(8)Healthcare & PharmaceuticalsL + 6.25% (100% PIK)7.25%5/31/20165/31/202256,320 56,046 28,212 3.13 
DermaRite Industries, LLC^*(2)(3)(13)Healthcare & PharmaceuticalsL + 7.00%8.00%3/3/20173/3/202218,862 18,776 18,656 2.07 
Designer Brands Inc.^(2)(3)(7)RetailL + 8.50%9.75%8/7/20208/7/202517,955 17,534 17,811 1.98 


TCG BDC, INC.
CONSOLIDATED SCHEDULE OF INVESTMENTS (Continued)
As of December 31, 20162020
(dollar amounts in thousands)
Investments—non-controlled/non-affiliated (1)Industry Interest Rate (2) Maturity Date Par/ Principal Amount Amortized Cost (6) Fair Value (7) Percentage of Net Assets
First Lien Debt (80.09%) (continued)             
Metrogistics LLC (2)(3)(4)(5)(13)
Transportation: Cargo L + 6.50% (1.00% Floor) 9/30/2022 $15,200
 $14,986
 $15,094
 1.98%
MSX International, Inc. (2)(3)(4)(13)
Automotive L + 5.00% (1.00% Floor) 8/21/2020 8,940
 8,882
 8,940
 1.17
National Technical Systems, Inc. (2)(3)(4)(13)(15)
Aerospace & Defense L + 6.25% (1.00% Floor) 6/12/2021 25,123
 24,854
 23,927
 3.13
NES Global Talent Finance US LLC (United Kingdom) (2)(3)(4)(8)(13)
Energy: Oil & Gas L + 5.50% (1.00% Floor) 10/3/2019 11,250
 11,132
 10,911
 1.43
OnCourse Learning Corporation (2)(3)(4)(5)(13)(15)(16)
Consumer Services L + 6.50% (1.00% Floor) 9/12/2021 26,141
 25,770
 26,220
 3.43
Paradigm Acquisition Corp. (2)(3)(4)(13)
Business Services L + 5.00% (1.00% Floor) 6/2/2022 23,246
 22,963
 23,223
 3.04
Pelican Products, Inc. (2)(3)(4)(13)
Containers, Packaging & Glass L + 4.25% (1.00% Floor) 4/11/2020 7,643
 7,654
 7,593
 0.99
Plano Molding Company, LLC (2)(3)(4)(5)(13)
Hotel, Gaming & Leisure L + 7.00% (1.00% Floor) 5/12/2021 18,163
 18,030
 17,302
 2.26
PPT Management Holdings, LLC (2)(3)(5)
Healthcare & Pharmaceuticals L + 6.00% (1.00% Floor) 12/16/2022 22,500
 22,288
 22,426
 2.93
Premier Senior Marketing, LLC (2)(3)(5)(16)
Banking, Finance, Insurance & Real Estate L + 5.00% (1.00% Floor) 7/1/2022 3,741
 3,690
 3,741
 0.49
Product Quest Manufacturing, LLC (2)(3)(4)(5)(12)
Containers, Packaging & Glass L + 5.75% (1.00% Floor) 9/9/2020 28,000
 27,565
 25,838
 3.38
Prowler Acquisition Corp. (Pipeline Supply and Service, LLC) (2)(3)(4)
Wholesale L + 4.50% (1.00% Floor) 1/28/2020 10,798
 10,739
 8,101
 1.06
PSC Industrial Holdings Corp (2)(3)(4)(13)
Environmental Industries L + 4.75% (1.00% Floor) 12/5/2020 11,760
 11,679
 11,290
 1.48
PSI Services LLC (2)(3)(4)(5)(12)(16)
Business Services L + 6.75% (1.00% Floor) 2/27/2021 32,705
 32,022
 34,784
 4.56
PT Intermediate Holdings III,LLC (Parts Town) (2)(3)(4)(5)(13)(15)
Wholesale L + 6.50% (1.00% Floor) 6/23/2022 17,417
 17,215
 17,563
 2.30
QW Holding Corporation (Quala) (2)(3)(4)(5)(13)
Environmental Industries L + 6.75% (1.00% Floor) 8/31/2022 29,925
 29,084
 30,009
 3.93
Reliant Pro Rehab, LLC (2)(3)(5)(12)
Healthcare & Pharmaceuticals L + 10.00% (1.00% Floor) 12/29/2017 22,331
 22,024
 22,331
 2.92
SolAero Technologies Corp.(2)(3)(4)(5)
Telecommunications L + 5.25% (1.00% Floor) 12/10/2020 19,677
 19,541
 18,901
 2.47
Superior Health Linens, LLC (2)(3)(4)(5)(13)(15)
Business Services L + 6.50% (1.00% Floor) 9/30/2021 19,206
 18,891
 19,068
 2.50
T2 Systems, Inc.(2)(3)(4)(5)(13)(15)(16)
Transportation: Consumer L + 6.75% (1.00% Floor) 9/28/2022 22,950
 22,333
 23,208
 3.04
T2 Systems Canada, Inc. (2)(3)(5)(16)
Transportation: Consumer L + 6.75% (1.00% Floor) 9/28/2022 4,050
 3,952
 4,090
 0.54
Teaching Strategies, LLC (2)(3)(4)(13)
Media: Advertising, Printing & Publishing L + 5.50% (0.50% Floor) 10/1/2019 13,369
 13,333
 13,369
 1.75
The Hilb Group, LLC (2)(3)(5)(12)(15)
Banking, Finance, Insurance & Real Estate L + 6.50% (1.00% Floor) 6/24/2021 29,682
 29,113
 29,826
 3.90
The SI Organization, Inc. (2)(3)(4)(13)
Aerospace & Defense L + 4.75% (1.00% Floor) 11/23/2019 8,574
 8,527
 8,676
 1.15
The Topps Company, Inc. (2)(3)(4)(13)
Non-durable Consumer Goods L + 6.00% (1.25% Floor) 10/2/2020 18,707
 18,629
 18,795
 2.46
TruckPro, LLC (2)(3)(4)(13)(16)
Automotive L + 5.00% (1.00% Floor) 8/6/2018 9,292
 9,267
 9,262
 1.21
Tweddle Group, Inc. (2)(3)(4)(13)
Media: Advertising, Printing & Publishing L + 6.00% (1.00% Floor) 10/24/2022 16,200
 15,885
 16,114
 2.11
TwentyEighty, Inc. (fka Miller Heiman, Inc.) (2)(3)(5)(10)(13)
Business Services L + 6.00% (1.00% Floor) 9/30/2019 18,719
 18,571
 7,628
 1.00
U.S. Farathane, LLC (2)(3)(4)(13)
Automotive L + 4.75% (1.00% Floor) 12/23/2021 1,925
 1,895
 1,925
 0.25
U.S. TelePacific Holdings Corp.(2)(3)(5)
Telecommunications L + 8.50% (1.00% Floor) 2/24/2021 30,000
 29,149
 29,853
 3.91
Vetcor Professional Practices, LLC (2)(3)(4)(5)(13)(15)
Consumer Services L + 6.25% (1.00% Floor) 4/20/2021 25,001
 24,623
 25,164
 3.29
Investments—non-controlled/non-affiliated (1)
FootnotesIndustry
Reference Rate & Spread (2)
Interest Rate (2)
Acquisition DateMaturity DatePar/ Principal Amount **
Amortized Cost (4)
Fair Value(5)
% of Net
 Assets
Diligent Corporation^(2)(3)(13)TelecommunicationsL + 6.25%7.25%8/4/20208/4/2025$579 $561 $588 0.07 %
DTI Holdco, Inc.*(2)(3)High Tech IndustriesL + 4.75%5.75%12/18/20189/30/20231,954 1,876 1,741 0.19 
Emergency Communications Network, LLC^*(2)(3)TelecommunicationsL + 2.625%, 5.125% PIK8.75%6/1/20176/1/202324,370 24,269 21,349 2.37 
Ensono, LP*(2)(3)TelecommunicationsL + 5.25%5.40%4/30/20186/27/20252,158 2,142 2,142 0.24 
Ensono, LP^*(2)(3)TelecommunicationsL + 5.75%5.90%6/25/20206/27/202518,131 18,008 17,995 2.00 
Ethos Veterinary Health LLC^(2)(3)(13)Consumer ServicesL + 4.75%4.90%5/17/20195/15/20262,612 2,570 2,540 0.28 
EvolveIP, LLC^(2)(3)(13)TelecommunicationsL + 5.75%6.75%11/26/20196/7/202325,864 25,806 25,828 2.87 
Frontline Technologies Holdings, LLC*(2)(3)SoftwareL + 5.75%6.75%9/18/20179/18/20233,099 3,081 3,037 0.34 
FWR Holding Corporation^*(2)(3)(13)Beverage, Food & TobaccoL + 5.50%, 1.50% PIK8.00%8/21/20178/21/202334,555 34,175 31,216 3.46 
Helios Buyer, Inc.^(2)(3)(13)Consumer ServicesL + 6.00%7.00%12/15/202012/15/20268,749 8,456 8,454 0.94 
Hercules Borrower LLC^(2)(3)(13)Environmental IndustriesL + 6.50%7.50%12/14/202012/14/202618,592 18,077 18,073 2.01 
Higginbotham Insurance Agency, Inc.^(2)(3)(13)Banking, Finance, Insurance & Real EstateL + 5.75%6.50%11/25/202011/25/20263,902 3,828 3,827 0.42 
iCIMS, Inc.^(2)(3)SoftwareL + 6.50%7.50%9/12/20189/12/20241,670 1,646 1,666 0.18 
Individual FoodService Holdings, LLC^(2)(3)(13)WholesaleL + 6.25%7.25%2/21/202011/22/20253,883 3,797 3,759 0.42 
Individual FoodService Holdings, LLC^(2)(3)(13)WholesaleL + 6.25%7.25%12/31/202011/22/20252,197 2,134 2,134 0.24 
Innovative Business Services, LLC^*(2)(3)High Tech IndustriesL + 5.50%6.50%4/5/20184/5/202313,779 13,523 13,484 1.50 
Integrity Marketing Acquisition, LLC^(2)(3)Banking, Finance, Insurance & Real EstateL + 5.75%6.75%1/15/20208/27/20254,970 4,907 5,011 0.56 
K2 Insurance Services, LLC^*(2)(3)(13)Banking, Finance, Insurance & Real EstateL + 5.00%6.00%7/3/20197/1/202418,651 18,323 18,653 2.07 
Kaseya, Inc.^(2)(3)(13)High Tech IndustriesL + 4.00%, 3.00% PIK8.00%5/3/20195/2/202514,871 14,610 14,940 1.66 
Legacy.com, Inc.^(2)(3)(11)High Tech IndustriesL + 6.00%7.00%3/20/20173/20/202317,066 16,886 16,055 1.78 
Lifelong Learner Holdings, LLC^*(2)(3)(13)Business ServicesL + 5.75%6.75%10/18/201910/18/202623,814 23,355 21,580 2.39 
Liqui-Box Holdings, Inc.^(2)(3)(13)Containers, Packaging & GlassL + 4.50%5.50%6/3/20196/3/20241,368 1,346 1,112 0.12 
Mailgun Technologies, Inc.^(2)(3)(13)High Tech IndustriesL + 5.00%6.00%3/26/20193/26/20253,256 3,185 3,175 0.35 
National Technical Systems, Inc.^(2)(3)(13)Aerospace & DefenseL + 5.50%6.50%10/28/20206/12/20231,175 1,150 1,160 0.13 
NES Global Talent Finance US, LLC (United Kingdom)*(2)(3)(7)Energy: Oil & GasL + 5.50%6.50%5/9/20185/11/20239,789 9,697 8,859 0.98 
NMI AcquisitionCo, Inc.^*(2)(3)(13)High Tech IndustriesL + 5.00%6.00%9/6/20179/6/202240,756 40,442 40,336 4.48 
Paramit Corporation*(2)(3)Capital EquipmentL + 4.50%5.50%5/3/20195/3/20255,213 5,174 5,109 0.57 
Paramit Corporation^(2)(3)(13)Capital EquipmentL + 5.25%6.25%11/24/20205/3/20253,029 2,912 2,909 0.32 
Park Place Technologies, LLC^(2)(3)High Tech IndustriesL + 5.00%6.00%11/19/202011/19/202720,000 19,211 19,150 2.12 


TCG BDC, INC.
CONSOLIDATED SCHEDULE OF INVESTMENTS (Continued)
As of December 31, 20162020
(dollar amounts in thousands)
Investments—non-controlled/non-affiliated (1)Industry Interest Rate (2) Maturity Date Par/ Principal Amount Amortized Cost (6) Fair Value (7) Percentage of Net Assets
First Lien Debt (80.09%) (continued)             
Violin Finco S.A.R.L. (Alexander Mann Solutions) (United Kingdom) (2)(3)(4)(8)(13)
Business Services L + 4.75% (1.00% Floor) 12/20/2019 $10,065
 $10,012
 $10,058
 1.32%
Vistage Worldwide, Inc. (2)(3)(4)(13)(16)
Business Services L + 5.50% (1.00% Floor) 8/19/2021 28,757
 28,524
 28,688
 3.75
Vitera Healthcare Solutions, LLC (2)(3)(4)(13)
Healthcare & Pharmaceuticals L + 5.00% (1.00% Floor) 11/4/2020 9,104
 9,050
 9,078
 1.19
Winchester Electronics Corporation (2)(3)(4)(5)(13)(15)
Capital Equipment L + 6.50% (1.00% Floor) 6/30/2022 27,367
 26,959
 27,460
 3.59
Zest Holdings, LLC (2)(3)(4)(13)
Durable Consumer Goods L + 4.75% (1.00% Floor) 8/16/2020 9,530
 9,530
 9,584
 1.25
First Lien Debt Total        $1,145,326
 $1,139,548
 149.13%
              
Second Lien Debt (12.08%)             
AF Borrower LLC (Accuvant) (2)(3)(5)
High Tech Industries L + 9.00% (1.00% Floor) 1/30/2023 $8,000
 $7,934
 $8,000
 1.05%
AIM Group USA Inc. (2)(3)(5)(13)
Aerospace & Defense L + 9.00% (1.00% Floor) 8/2/2022 23,000
 22,701
 23,196
 3.04
AmeriLife Group, LLC (2)(3)(5)
Banking, Finance, Insurance & Real Estate L + 8.75% (1.00% Floor) 1/10/2023 20,000
 19,656
 19,208
 2.51
Argon Medical Devices, Inc. (2)(3)(4)(5)
Healthcare & Pharmaceuticals L + 9.50% (1.00% Floor) 6/23/2022 24,000
 23,363
 24,233
 3.17
Berlin Packaging L.L.C. (2)(3)(5)(13)
Containers, Packaging & Glass L + 6.75% (1.00% Floor) 10/1/2022 2,927
 2,910
 2,953
 0.39
Charter NEX US Holdings, Inc.(2)(3)(5)(13)
Chemicals, Plastics & Rubber L + 8.25% (1.00% Floor) 2/5/2023 7,394
 7,303
 7,468
 0.98
Confie Seguros Holding II Co. (2)(3)(5)(16)
Banking, Finance, Insurance & Real Estate L + 9.00% (1.25% Floor) 5/8/2019 12,000
 11,921
 11,918
 1.56
Drew Marine Group Inc. (2)(3)(4)(5)(13)
Chemicals, Plastics & Rubber L + 7.00% (1.00% Floor) 5/19/2021 12,500
 12,481
 12,333
 1.61
Genex Holdings, Inc. (2)(3)(5)
Banking, Finance, Insurance & Real Estate L + 7.75% (1.00% Floor) 5/30/2022 7,990
 7,915
 7,978
 1.04
Institutional Shareholder Services Inc. (2)(3)(5)(13)
Banking, Finance, Insurance & Real Estate L + 8.50% (1.00% Floor) 4/29/2022 12,500
 12,408
 12,359
 1.62
Jazz Acquisition, Inc. (Wencor) (2)(3)(5)(13)
Aerospace & Defense L + 6.75% (1.00% Floor) 6/19/2022 6,700
 6,677
 5,572
 0.73
MRI Software, LLC (2)(3)(5)
Software L + 8.00% (1.00% Floor) 6/23/2022 11,250
 11,110
 11,265
 1.47
Power Stop, LLC (5)(9)
Automotive 11.00% 5/29/2022 10,000
 9,831
 9,863
 1.29
Prowler Acquisition Corp. (Pipeline Supply and Service, LLC) (2)(3)(5)
Wholesale L + 8.50% (1.00% Floor) 7/28/2020 3,000
 2,960
 1,682
 0.22
Vitera Healthcare Solutions, LLC (2)(3)(4)
Healthcare & Pharmaceuticals L + 8.25% (1.00% Floor) 11/4/2021 2,000
 1,979
 1,945
 0.26
Watchfire Enterprises, Inc. (2)(3)(5)(13)
Media: Advertising, Printing & Publishing L + 8.00% (1.00% Floor) 10/2/2021 7,000
 6,932
 6,976
 0.91
Zywave, Inc. (2)(3)(5)
High Tech Industries L + 9.00% (1.00% Floor) 11/17/2023 4,950
 4,879
 4,915
 0.64
Second Lien Debt Total        $172,960
 $171,864
 22.49%
Investments—non-controlled/non-affiliated (1)
FootnotesIndustry
Reference Rate & Spread (2)
Interest Rate (2)
Acquisition DateMaturity DatePar/ Principal Amount **
Amortized Cost (4)
Fair Value(5)
% of Net
 Assets
PF Growth Partners, LLC^*(2)(3)(13)Hotel, Gaming & LeisureL + 7.00%8.00%7/1/20197/11/2025$7,294 $7,198 $6,778 0.75 %
Plano Molding Company, LLC^(2)(3)Hotel, Gaming & LeisureL + 7.50%, 1.50% PIK10.00%5/1/20155/12/202214,693 14,664 13,001 1.44 
Plano Molding Company, LLC^(2)(3)Hotel, Gaming & LeisureL + 7.50%, 1.50% PIK10.00%8/7/20205/12/20221,081 1,073 1,081 0.12 
PPC Flexible Packaging, LLC^*(2)(3)(13)Containers, Packaging & GlassL + 6.00%7.00%11/23/201811/23/202411,338 11,234 11,300 1.25 
PPT Management Holdings, LLC^(2)(3)Healthcare & PharmaceuticalsL + 6.00%, 2.50% PIK9.50%12/15/201612/16/202227,896 27,817 22,798 2.53 
PricewaterhouseCoopers Public Sector LLP^(2)(3)(13)Aerospace & DefenseL + 3.25%3.49%5/1/20185/1/2023— (74)(32)— 
Product Quest Manufacturing, LLC^(2)(3)(8)Containers, Packaging & GlassL + 6.75%10.00%9/21/20173/31/2021840 840 423 0.05 
Propel Insurance Agency, LLC(2)(3)Banking, Finance, Insurance & Real EstateL + 5.00%6.00%6/1/20186/1/20242,339 2,327 2,316 0.26 
QW Holding Corporation^*(2)(3)(13)Environmental IndustriesL + 6.25%7.25%8/31/20168/31/202243,119 42,771 40,990 4.55 
Redwood Services Group, LLC*(2)(3)High Tech IndustriesL + 6.00%7.00%11/13/20186/6/20235,043 5,017 5,030 0.56 
Redwood Services Group, LLC*(2)(3)High Tech IndustriesL + 8.50%9.50%8/14/20206/6/20233,474 3,378 3,494 0.39 
Redwood Services Group, LLC^*(2)(3)(13)High Tech IndustriesL + 7.25%8.25%10/19/20206/6/202312,957 12,628 13,024 1.44 
Regency Entertainment, Inc.^(2)(3)Media: Diversified & ProductionL + 6.75%7.75%5/22/202010/22/202520,000 19,636 19,600 2.17 
Reladyne, Inc.*(2)(3)WholesaleL + 5.00%6.00%8/21/20207/22/202210,100 10,017 10,146 1.13 
Riveron Acquisition Holdings, Inc.*(2)(3)Banking, Finance, Insurance & Real EstateL + 5.75%6.75%5/22/20195/22/202511,517 11,341 11,595 1.29 
RSC Acquisition, Inc.^(2)(3)(13)Banking, Finance, Insurance & Real EstateL + 5.50%6.50%11/1/201911/1/202610,711 10,534 10,824 1.20 
Sapphire Convention, Inc.^*(2)(3)(13)TelecommunicationsL + 6.25%7.25%11/20/201811/20/202528,812 28,342 24,000 2.66 
Smile Doctors, LLC^*(2)(3)(13)Healthcare & PharmaceuticalsL + 6.00%7.00%10/6/201710/6/202216,930 16,872 16,577 1.84 
Southern Graphics, Inc.^(2)(3)(11)Media: Advertising, Printing & PublishingL + 6.50%7.50%10/30/202010/23/20239,959 9,769 9,849 1.09 
Sovos Brands Intermediate, Inc.*(2)(3)Beverage, Food & TobaccoL + 4.75%4.96%11/16/201811/20/202517,498 17,360 17,348 1.92 
SPay, Inc.^*(2)(3)(13)Hotel, Gaming & LeisureL + 5.75%, 2.00% PIK8.75%6/15/20186/17/202421,365 21,099 17,318 1.92 
Superior Health Linens, LLC^*(2)(3)(13)Business ServicesL + 6.50%7.50%9/30/20169/30/202113,155 13,116 13,079 1.45 
T2 Systems, Inc.^*(2)(3)(13)Transportation: ConsumerL + 6.75%7.75%9/28/20169/28/202226,605 26,356 26,605 2.95 
Tank Holding Corp.^(2)(3)(13)Capital EquipmentL + 3.50%3.74%3/26/20193/26/2024— — (1)— 
TCFI Aevex LLC^*(2)(3)(13)Aerospace & DefenseL + 6.00%7.00%3/18/20203/18/20269,693 9,503 9,650 1.07 
The Leaders Romans Bidco Limited (United Kingdom) Term Loan B^(2)(3)(7)Banking, Finance, Insurance & Real EstateL + 6.50%, 3.00% PIK10.25%7/23/20196/30/2024£20,740 25,406 28,078 3.12 

Table of Contents118


TCG BDC, INC.
CONSOLIDATED SCHEDULE OF INVESTMENTS (Continued)
As of December 31, 20162020
(dollar amounts in thousands)
Investments—non-controlled/non-affiliated (1) Industry Maturity Date Par Amount Amortized Cost (6) Fair Value (7) Percentage of Net Assets
Structured Finance Obligations (0.37%) (5)(8)(11)            
1776 CLO I, Ltd., Subordinated Notes Structured Finance 5/8/2020 $11,750
 $6,739
 $2,761
 0.36%
Clydesdale CLO 2005, Ltd., Subordinated Notes Structured Finance 12/6/2017 5,750
 
 10
 
MSIM Peconic Bay, Ltd., Subordinated Notes Structured Finance 7/20/2019 4,500
 63
 5
 
Nautique Funding Ltd., Income Notes Structured Finance 4/15/2020 5,000
 2,437
 2,440
 0.32
Structured Finance Obligations Total       $9,239
 $5,216
 0.68%
Investments—non-controlled/non-affiliated (1)
FootnotesIndustry
Reference Rate & Spread (2)
Interest Rate (2)
Acquisition DateMaturity DatePar/ Principal Amount **
Amortized Cost (4)
Fair Value(5)
% of Net
 Assets
The Leaders Romans Bidco Limited (United Kingdom) Term Loan C^(2)(3)(7)(13)Banking, Finance, Insurance & Real EstateL + 6.50%, 3.00% PIK10.25%7/23/20196/30/2024£3,816 $4,748 $5,727 0.64 %
Trump Card, LLC^*(2)(3)(13)Transportation: CargoL + 5.50%6.50%6/26/20184/21/20227,594 7,572 7,444 0.83 
TSB Purchaser, Inc.^*(2)(3)(13)Media: Advertising, Printing & PublishingL + 6.00%7.00%5/14/20185/14/202418,666 18,354 18,501 2.05 
Turbo Buyer, Inc.^*(2)(3)(13)AutomotiveL + 5.25%6.25%12/2/201912/2/202524,323 23,766 24,567 2.73 
Tweddle Group, Inc.^(2)(3)Media: Advertising, Printing & PublishingL + 4.50%5.50%9/17/20189/17/20231,825 1,808 1,678 0.19 
U.S. Acute Care Solutions, LLC*(2)(3)Healthcare & PharmaceuticalsL + 6.00%7.00%2/21/20195/15/20214,242 4,235 3,956 0.44 
Unifrutti Financing PLC (Cyprus)^(7)Beverage, Food & Tobacco7.50%, 1.00% PIK8.50%9/15/20199/15/20264,575 4,832 5,464 0.61 
Unifrutti Financing PLC (Cyprus)^(7)Beverage, Food & Tobacco11.00% PIK11.00%10/22/20209/15/2026647 724 754 0.08 
US INFRA SVCS Buyer, LLC^(2)(3)(13)Environmental IndustriesL + 6.00%7.00%4/13/20204/13/20263,248 2,688 3,175 0.35 
USLS Acquisition, Inc.^*(2)(3)(13)Business ServicesL + 5.75%6.75%11/30/201811/30/202421,447 21,124 19,981 2.22 
USLS Acquisition, Inc.^(2)(3)(13)Business ServicesL + 5.75%6.75%9/3/202011/30/2024— (22)— — 
VRC Companies, LLC^*(2)(3)(13)Business ServicesL + 6.50%7.50%3/31/20173/31/202333,286 33,048 33,286 3.69 
Westfall Technik, Inc.^*(2)(3)(13)Chemicals, Plastics & RubberL + 6.25%7.25%9/13/20189/13/202427,720 27,457 25,733 2.85 
Wheel Pros, LLC*(2)(3)AutomotiveL + 5.25%6.25%11/18/202011/6/202718,750 18,286 18,390 2.04 
YLG Holdings, Inc.^(2)(3)(13)Consumer ServicesL + 6.25%7.25%9/30/202011/1/20251,401 1,343 1,370 0.15 
Zemax Software Holdings, LLC*(2)(3)(13)SoftwareL + 5.75%6.75%6/25/20186/25/20246,285 6,216 6,119 0.68 
Zenith Merger Sub, Inc.^*(2)(3)(13)Business ServicesL + 5.25%6.25%12/13/201712/13/202314,164 14,034 14,031 1.56 
First Lien Debt Total$1,246,281 $1,190,871 132.16 %
Second Lien Debt (15.6% of fair value)
AI Convoy S.A.R.L (United Kingdom)^(2)(3)(7)Aerospace & DefenseL + 8.25%9.25%1/17/20201/17/2028$24,814 $24,305 $25,546 2.83 %
Aimbridge Acquisition Co., Inc.^(2)(3)Hotel, Gaming & LeisureL + 7.50%7.65%2/1/20192/1/20279,241 9,104 7,993 0.89 
AQA Acquisition Holding, Inc.^(2)(3)High Tech IndustriesL + 8.00%9.00%10/1/20185/24/202439,000 38,741 39,000 4.33 
Brave Parent Holdings, Inc.^*(2)(3)SoftwareL + 7.50%7.64%10/3/20184/19/202619,062 18,711 19,062 2.11 
Drilling Info Holdings, Inc.^(2)(3)Energy: Oil & GasL + 8.25%8.40%2/11/20207/30/202618,600 18,145 18,228 2.02 
Jazz Acquisition, Inc.^(2)(3)Aerospace & DefenseL + 8.00%8.15%6/13/20196/18/202723,450 23,150 18,146 2.01 
Outcomes Group Holdings, Inc.^*(2)(3)Business ServicesL + 7.50%7.75%10/23/201810/26/20263,462 3,455 3,462 0.38 
PAI Holdco, Inc.^(2)(3)AutomotiveL + 6.25%, 2.00% PIK9.25%10/28/202010/28/202813,530 13,132 13,329 1.48 
Pharmalogic Holdings Corp.^(2)(3)Healthcare & PharmaceuticalsL + 8.00%9.00%6/7/201812/11/2023800 798 783 0.09 
Quartz Holding Company^(2)(3)SoftwareL + 8.00%8.15%4/2/20194/2/20277,048 6,930 6,994 0.78 
Reladyne, Inc.^(2)(3)WholesaleL + 9.50%10.50%4/19/20181/21/202312,242 12,133 11,956 1.33 
Stonegate Pub Company Bidco Limited (United Kingdom)^(2)(3)(7)Beverage, Food & TobaccoL + 8.50%8.54%3/12/20203/12/2028£20,000 24,729 21,902 2.43 
119

Investments—non-controlled/non-affiliated (1) Industry Shares/Units Cost Fair Value (7) Percentage of Net Assets
Equity Investments (0.46%) (5)          
CIP Revolution Investments, LLC Media: Advertising, Printing & Publishing 30,000
 $300
 $352
 0.05%
Derm Growth Partners III, LLC (Dermatology Associates) Healthcare & Pharmaceuticals 1,000,000
 1,000
 976
 0.13
GS Holdco LLC (Global Software, LLC) High Tech Industries 1,000,000
 1,001
 1,126
 0.15
Power Stop Intermediate Holdings, LLC Automotive 7,150
 715
 1,208
 0.16
T2 Systems Parent Corporation Transportation: Consumer 555,556
 556
 584
 0.07
THG Acquisition, LLC (The Hilb Group, LLC) Banking, Finance, Insurance & Real Estate 1,500,000
 1,499
 2,228
 0.29
Equity Investments Total     $5,071
 $6,474
 0.85%
Total Investments—non-controlled/non-affiliated     $1,332,596
 $1,323,102
 173.15%
Investments—controlled/affiliatedIndustry Interest Rate (2) Maturity Date Par Amount/ LLC Interest Cost Fair Value (7) Percentage of Net Assets
Investment Fund (7.00%) (8)
             
Middle Market Credit Fund, LLC, Mezzanine Loan (2)(5)(9)(14)
Investment Fund L + 9.50% 6/24/2017 $62,384
 $62,384
 $62,384
 8.16%
Middle Market Credit Fund, LLC, Subordinated Loan and Member’s Interest (5)(14)
Investment Fund 0.001 3/1/2021 35,001
 35,001
 37,273
 4.88
Investment Fund Total        $97,385
 $99,657
 13.04%
Total investments—controlled/affiliated        $97,385
 $99,657
 13.04%
Total investments        $1,429,981
 $1,422,759
 186.19%

(1)Unless otherwise indicated, issuers of debt and equity investments held by the Company are domiciled in the United States and issuers of structured finance obligations are domiciled in the Cayman Islands. Under the Investment Company Act the Company would be deemed to “control” a portfolio company if the Company owned more than 25% of its outstanding voting securities and/or held the power to exercise control over the management or policies of the portfolio company. As of December 31, 2016, the Company does not “control” any of these portfolio companies. Under the Investment Company Act, the Company would be deemed an “affiliated person” of a portfolio company if the Company owns 5% or more of the portfolio company’s outstanding voting securities. As of December 31, 2016, the Company is not an “affiliated person” of any of these portfolio companies. 
(2)Variable rate loans to the portfolio companies bear interest at a rate that may be determined by reference to either LIBOR or an alternate base rate (commonly based on the Federal Funds Rate or the U.S. Prime Rate), which generally resets quarterly. For each such loan, the Company has provided the interest rate in effect as of December 31, 2016. As of December 31, 2016, all of our LIBOR loans were indexed to the 90-day LIBOR rate at 1.00%, except for those loans as indicated in Note 16 below.
(3)Loan includes interest rate floor feature.
(4)Denotes that all or a portion of the assets are owned by the SPV. The SPV has entered into the SPV Credit Facility. The lenders of the SPV Credit Facility have a first lien security interest in substantially all of the assets of the SPV. Accordingly, such assets are not available to creditors of the Company or the 2015-1 Issuer.
(5)Denotes that all or a portion of the assets are owned by the Company. The Company has entered into the Credit Facility. The lenders of the Credit Facility have a first lien security interest in substantially all of the portfolio investments held by the Company. Accordingly, such assets are not available to creditors of the SPV or the 2015-1 Issuer.
(6)Amortized cost represents original cost, including origination fees and upfront fees received that are deemed to be an adjustment to yield, adjusted for the accretion/amortization of discounts/premiums, as applicable, on debt investments using the effective interest method. Equity tranche CLO fund investments, which are referred to as “structured finance obligations”, are recorded at amortized cost using the effective interest method.

Table of Contents

TCG BDC, INC.
CONSOLIDATED SCHEDULE OF INVESTMENTS (Continued)
As of December 31, 20162020
(dollar amounts in thousands)

Investments—non-controlled/non-affiliated (1)
FootnotesIndustry
Reference Rate & Spread (2)
Interest Rate (2)
Acquisition DateMaturity DatePar/ Principal Amount **
Amortized Cost (4)
Fair Value(5)
% of Net
 Assets
Tank Holding Corp.(2)(3)Capital EquipmentL + 8.25%8.40%3/26/20193/26/2027$35,965 $35,454 $35,189 3.90 %
TruGreen Limited Partnership^(2)(3)Consumer ServicesL + 8.50%9.25%11/16/202011/2/202813,000 12,743 13,000 1.44 
Ultimate Baked Goods MIDCO, LLC^(2)(3)Beverage, Food & TobaccoL + 8.00%9.00%8/9/20188/9/20262,820 2,776 2,689 0.30 
Watchfire Enterprises, Inc.^(2)(3)Media: Advertising, Printing & PublishingL + 8.00%9.00%10/2/201310/2/20217,000 6,985 6,988 0.78 
World 50, Inc.^(9)Business Services11.50%11.50%1/10/20201/9/20277,635 7,499 7,518 0.83 
WP CPP Holdings, LLC^*(2)(3)Aerospace & DefenseL + 7.75%8.75%7/18/20194/30/202639,500 39,172 32,738 3.63 
Second Lien Debt Total$297,962 $284,523 31.56 %
(7)Fair value is determined in good faith by or under the direction of the Board of Directors of the Company (see Note 2, Significant Accounting Policies, and Note 3, Fair Value Measurements), pursuant to the Company’s valuation policy.
(8)The Company has determined the indicated investments are non-qualifying assets under Section 55(a) of the Investment Company Act. Under the Investment Company Act, the Company may not acquire any non-qualifying assets unless, at the time such acquisition is made, qualifying assets represent at least 70% of the Company’s total assets.
(9)Represents a corporate mezzanine loan, which is subordinated to senior secured term loans of the portfolio company/investment fund.
(10)Loan was on non-accrual status as of December 31, 2016.
(11)As of December 31, 2016, the Company has a greater than 25% but less than 50% equity or subordinated notes ownership interest in certain structured finance obligations. These investments have governing documents that preclude the Company from controlling management of the entity and therefore the Company has determined that the issuer of the investment is not a controlled affiliate or a non-controlled affiliate because the investments are not “voting securities”.
(12)In addition to the interest earned based on the stated interest rate of this loan, which is the amount reflected in this schedule, the Company is entitled to receive additional interest as a result of an agreement among lenders as follows: Dimensional Dental Management, LLC (4.54%), EIP Merger Sub, LLC (Evolve IP) (3.84%), International Medical Group, Inc. (4.64%), Product Quest Manufacturing, LLC (3.54%), PSI Services LLC (4.40%), Reliant Pro Rehab, LLC (nil) and The Hilb Group, LLC (3.96%). Pursuant to the agreement among lenders in respect of this loan, this investment represents a first lien/last out loan, which has a secondary priority behind the first lien/first out loan with respect to principal, interest and other payments.
(13)Denotes that all or a portion of the assets are owned by the 2015-1 Issuer and secure the notes issued in connection with the 2015-1 Debt Securitization. Accordingly, such assets are not available to the creditors of the SPV or the Company.
(14)Under the Investment Company Act, the Company is deemed to be an “affiliated person” of and “control” this investment fund because the Company owns more than 25% of the investment fund’s outstanding voting securities and/or has the power to exercise control over management or policies of such investment fund. See Note 5, Middle Market Credit Fund, LLC, for more details.
(15)As of December 31, 2016, the Company had the following unfunded commitments to fund delayed draw and revolving senior secured loans:
Investments—non-controlled/non-affiliated (1)
FootnotesIndustryAcquisition DateShares/ UnitsCost
Fair
Value (5)

of Net Assets
Equity Investments (1.9% of fair value)
Central Security Group, Inc.^*(6)Consumer Services10/16/2020443 $— $— — %
ANLG Holdings, LLC^(6)Capital Equipment6/22/2018592 592 865 0.10 
Avenu Holdings, LLC^(6)Sovereign & Public Finance9/28/2018172 172 345 0.04 
BK Intermediate Company, LLC^(6)Healthcare & Pharmaceuticals5/27/2020288 288 209 0.02 
Chartis Holding, LLC^(6)Business Services5/1/2019433 433 571 0.06 
CIP Revolution Holdings, LLC^(6)Media: Advertising, Printing & Publishing8/19/2016318 318 245 0.03 
Cority Software Inc. (Canada)^(6)Software7/2/2019250 250 295 0.03 
DecoPac, Inc.^(6)Non-durable Consumer Goods9/29/20171,500 1,500 1,664 0.18 
Derm Growth Partners III, LLC^(6)Healthcare & Pharmaceuticals5/31/20161,000 1,000 — — 
GRO Sub Holdco, LLC^(6)Healthcare & Pharmaceuticals3/29/2018500 — — — 
K2 Insurance Services, LLC^(6)Banking, Finance, Insurance & Real Estate7/3/2019433 433 676 0.07 
Legacy.com, Inc.^(6)High Tech Industries3/20/20171,500 1,500 613 0.07 
Mailgun Technologies, Inc.^(6)High Tech Industries3/26/2019424 424 784 0.09 
North Haven Goldfinch Topco, LLC^(6)Containers, Packaging & Glass6/18/20182,315 2,315 3,043 0.34 
PPC Flexible Packaging, LLC^(6)Containers, Packaging & Glass2/1/2019965 965 1,302 0.14 
Paramit Corporation^(6)Capital Equipment6/17/2019150 500 758 0.08 
Rough Country, LLC^(6)Durable Consumer Goods5/25/2017755 755 1,634 0.18 
SiteLock Group Holdings, LLC^(6)High Tech Industries4/5/2018446 446 526 0.06 
T2 Systems Parent Corporation^(6)Transportation: Consumer9/28/2016556 556 838 0.09 
Tailwind HMT Holdings Corp.^(6)Energy: Oil & Gas11/17/201720 1,334 2,001 0.22 
Tank Holding Corp.^(6)Capital Equipment3/26/2019850 482 944 0.10 
Titan DI Preferred Holdings, Inc.^(6)Energy: Oil & Gas2/11/202011,246 10,959 11,021 1.22 
120

First Lien Debt—unfunded delayed draw and revolving term loans commitmentsType Unused Fee Par/ Principal Amount Fair Value
Advanced Instruments, LLCRevolver 0.50% $2,500
 $(25)
Captive Resources Midco, LLCRevolver 0.50% 1,875
 (2)
Captive Resources Midco, LLCDelayed Draw 1.25% 3,125
 (4)
CIP Revolution Holdings, LLCRevolver 0.50% 1,331
 6
CIP Revolution Holdings, LLCDelayed Draw 0.75% 1,331
 6
Derm Growth Partners III, LLC (Dermatology Associates)Revolver 0.50% 1,672
 1
Derm Growth Partners III, LLC (Dermatology Associates)Delayed Draw 1.00% 5,247
 4
Dimensional Dental Management, LLCDelayed Draw 1.00% 2,507
 (23)
Dimora Brands, Inc. (fka TK USA Enterprises, Inc.)Revolver 0.50% 4,750
 (30)
Direct Travel, Inc.Delayed Draw 1.00% 9,658
 (56)
Green Plains II LLCRevolver 0.50% 1,352
 14
National Technical Systems, Inc.Revolver 0.50% 2,031
 (102)
National Technical Systems, Inc.Delayed Draw 1.00% 4,469
 (165)
OnCourse Learning CorporationRevolver 0.50% 859
 2
PT Intermediate Holdings III, LLC (Parts Town)Revolver 0.50% 2,025
 15
Superior Health Linens, LLCRevolver 0.50% 2,735
 (17)
T2 Systems, Inc.Revolver 0.50% 2,933
 29
The Hilb Group, LLCDelayed Draw 1.00% 3,810
 16
Vetcor Professional Practices, LLCDelayed Draw 1.00% 3,057
 18
Winchester Electronics CorporationDelayed Draw 1.00% 2,500
 8
Total unfunded commitments    $59,767
 $(305)
(16)As of December 31, 2016, this LIBOR loan was indexed to the 30-day LIBOR rate at 0.77%.

Table of Contents

TCG BDC, INC.
CONSOLIDATED SCHEDULE OF INVESTMENTS (Continued)
As of December 31, 20162020
(dollar amounts in thousands)
Investments—non-controlled/non-affiliated (1)
FootnotesIndustryAcquisition DateShares/ UnitsCost
Fair
Value (5)

of Net Assets
Turbo Buyer, Inc.^(6)Automotive12/2/20191,925 $1,925 $2,444 0.27 %
Tweddle Holdings, Inc.^*(6)Media: Advertising, Printing & Publishing9/17/201817 — — — 
Unifrutti Financing PLC (Cyprus)^(6)Beverage, Food & Tobacco10/22/2020— 556 575 0.06 
Unifrutti Financing PLC (Cyprus)^(6)Beverage, Food & Tobacco10/22/2020— — — — 
USLS Acquisition, Inc.^(6)Business Services11/30/2018641 641 565 0.06 
W50 Parent LLC^(6)Business Services1/10/2020500 500 575 0.06 
Zenith American Holding, Inc.^(6)Business Services12/13/20171,565 782 1,221 0.14 
Zillow Topco LP^(6)Software6/25/2018313 313 163 0.02 
Equity Investments Total$29,939 $33,877 3.73 %
Total investments—non-controlled/non-affiliated$1,574,182 $1,509,271 167.45 %
Investments—non-controlled/affiliatedFootnotesIndustry
Reference Rate & Spread (2)
Interest Rate (2)
Acquisition DateMaturity DatePar/ Principal Amount **
Amortized Cost (4)
Fair
Value (5)
% of Net 
Assets
First Lien Debt (1.4% of fair value)
Direct Travel, Inc.^*(2)(3)(8)(12)Hotel, Gaming & LeisureL + 1.00%, 7.50% PIK9.50%10/14/201610/1/2023$36,711 $36,340 $24,949 2.77 %
Direct Travel, Inc.^(2)(3)(12)(13)Hotel, Gaming & LeisureL + 6.00%7.00%10/1/202010/1/20231,231 1,231 1,231 0.14 
First Lien Debt Total$37,571 $26,180 2.91 %
Investments—non-controlled/affiliatedFootnotesIndustryAcquisition DateShares/ UnitsCost
Fair
Value 
(5)
% of Net 
Assets
Equity Investments (0.0% of fair value)
Direct Travel, Inc.^(6)(12)Hotel, Gaming & Leisure10/1/202043 $— $— — %
Equity Investments Total$— $— — %
Total investments—non-controlled/affiliated$37,571 $26,180 2.91 %
121

TCG BDC, INC.
CONSOLIDATED SCHEDULE OF INVESTMENTS
As of December 31, 2016,2020
(dollar amounts in thousands)
Investments—controlled/affiliatedFootnotesIndustry
Reference Rate & Spread (2)
Interest Rate (2)
Acquisition DateMaturity DatePar/ Principal Amount **
Amortized Cost (4)
Fair
Value (5)
% of Net 
Assets
First Lien Debt (0.4% of fair value)
SolAero Technologies Corp. (A1 Term Loan)^(2)(3)(8)(10)TelecommunicationsL + 8.00% (100% PIK)9.00%4/12/201910/12/2022$3,166 $3,166 $1,214 0.13 %
SolAero Technologies Corp. (A2 Term Loan)^(2)(3)(8)(10)TelecommunicationsL + 8.00% (100% PIK)9.00%4/12/201910/12/20228,707 8,707 3,338 0.37 
SolAero Technologies Corp. (Priority Facilities)^(2)(3)(10)(13)TelecommunicationsL + 6.00%7.00%4/12/201910/12/20222,460 2,429 2,460 0.27 
First Lien Debt Total$14,302 $7,012 0.77 %
Investments—controlled/affiliatedFootnotesIndustryAcquisition DateShares/ UnitsCost
Fair
Value 
(5)
% of Net 
Assets
Equity Investments (0.0% of fair value)
SolAero Technologies Corp.^(6)(10)Telecommunications4/12/2019$2,815 $— — %
Equity Investments Total$2,815 $— — %
Investments—controlled/affiliatedFootnotesIndustry
Reference Rate & Spread(2)
Interest Rate(2)
Acquisition DateMaturity DatePar Amount/ LLC InterestCost
Fair Value(7)
% of Net 
Assets
Investment Funds (15.5% of fair value)
Middle Market Credit Fund II, LLC, Member's Interest^(10)(7)Investment FundsN/AN/A11/3/202012/31/2030$78,122 $78,096 $77,395 8.59 %
Middle Market Credit Fund, LLC, Subordinated Loan and Member's Interest^(10)(7)Investment FundsN/AN/A2/29/20163/1/2021216,000 216,000 205,891 22.84 
Middle Market Credit Fund, Mezzanine Loan^(2)(10)(7)(9)Investment FundsL + 9.00%9.24%6/30/20163/22/2021— — — — 
Investment Fund Total$294,096 $283,286 31.43 %
Total investments—controlled/affiliated$311,213 $290,298 32.20 %
Total investments$1,922,966 $1,825,749 202.56 %
^ Denotes that all or a portion of the assets are owned by TCG BDC, Inc. (together with its consolidated subsidiaries, “we,” “us,” “our,” “TCG BDC” or the “Company”). The Company has entered into a senior secured revolving credit facility (as amended, the “Credit Facility”). The lenders of the Credit Facility have a first lien security interest in substantially all of the portfolio investments held by the Company (see Note 7, Borrowings). Accordingly, such assets are not available to creditors of Carlyle Direct Lending CLO 2015-1R LLC (formerly known as Carlyle GMS Finance MM CLO 2015-1 LLC) (the “2015-1 Issuer”).
* Denotes that all or a portion of the assets are owned by the Company's wholly owned subsidiary, the 2015-1 Issuer, and secure the notes issued in connection with a term debt securitization completed by the Company on June 26, 2015 (see Note 8, Notes Payable). Accordingly, such assets are not available to the creditors of the Company.
** Par amount is denominated in USD ("$") unless otherwise noted, as denominated in Euro (“€”) or British Pound (“£”)
(1)Unless otherwise indicated, issuers of debt and equity investments held by the Company are domiciled in the United States. Under the Investment Company Act of 1940, as amended (together with the rules and regulations promulgated thereunder, the “Investment Company Act”), the Company would be deemed to “control” a portfolio company if the Company owned more than 25% of its outstanding voting securities and/or held the power to exercise control over the management or policies of the portfolio company. As of December 31, 2020, the Company does not “control” any of these portfolio companies. Under the Investment Company Act, the Company would be deemed an “affiliated person” of a portfolio company if the Company owns 5% or more of the portfolio company’s outstanding voting securities. As of December 31, 2020, the Company is not an “affiliated person” of any of these portfolio companies. Certain portfolio company investments are subject to contractual restrictions on sales.
122

TCG BDC, INC.
CONSOLIDATED SCHEDULE OF INVESTMENTS
As of December 31, 2020
(dollar amounts in thousands)
(2)Variable rate loans to the portfolio companies bear interest at a rate that is determined by reference to either LIBOR (“L”) or an alternate base rate (commonly based on the Federal Funds Rate or the U.S. Prime Rate), which generally resets quarterly. For each such loan, the Company has indicated the reference rate used and provided the spread and the interest rate in effect as of December 31, 2020. As of December 31, 2020, the reference rates for our variable rate loans were the 30-day LIBOR at 0.15%, the 90-day LIBOR at 0.25% and the 180-day LIBOR at 0.26%.
(3)Loan includes interest rate floor feature, which is generally 1.00%.
(4)Amortized cost represents original cost, including origination fees and upfront fees received that are deemed to be an adjustment to yield, adjusted for the accretion/amortization of discounts/premiums, as applicable, on debt investments using the effective interest method.
(5)Fair value is determined in good faith by or under the direction of the Board of Directors of the Company (see Note 2, Significant Accounting Policies, and Note 3, Fair Value Measurements), pursuant to the Company’s valuation policy. The fair value of all first lien and second lien debt investments, equity investments and the investment fund was determined using significant unobservable inputs.
(6)Security acquired in transaction exempt from registration under the Securities Act of 1933, as amended (the “Securities Act”), and may be deemed to be “restricted securities” under the Securities Act, unless otherwise noted. As of December 31, 2020, the aggregate fair value of these securities is $33,877, or 3.73% of the Company’s net assets.
(7)The Company has determined the indicated investments are non-qualifying assets under Section 55(a) of the Investment Company Act. Under the Investment Company Act, the Company may not acquire any non-qualifying assets unless, at the time such acquisition is made, qualifying assets represent at least 70% of the Company’s total assets.
(8)Loan was on non-accrual status as of December 31, 2020.
(9)Represents a corporate mezzanine loan, which is subordinated to senior secured term loans of the portfolio company/investment fund.
(10)Under the Investment Company Act, the Company is deemed to be an “affiliated person” of and “control” this investment fund because the Company owns more than 25% of the investment fund’s outstanding voting securities and/or has the power to exercise control over management or policies of such investment fund. See Notes 5, Middle Market Credit Fund, LLC and 6. Middle Market Credit Fund II, LLC, for more details. Transactions related to investments in controlled affiliates for the year ended December 31, 2020, were as follows:
Investments—controlled/affiliatedFair Value as of December 31, 2019Additions/PurchasesReductions/Sales/ PaydownsNet Realized Gain (Loss)Net Change in Unrealized Appreciation (Depreciation)Fair Value as of December 31, 2020Dividend and Interest Income
Middle Market Credit Fund, LLC, Mezzanine Loan$93,000 $63,500 $(156,500)$— $— $— $3,049 
Middle Market Credit Fund, LLC, Subordinated Loan and Member’s Interest
111,596 92,500 — — 1,795 205,891 19,750 
Middle Market Credit Fund II, LLC, Member’s Interest— 78,096 — — (701)77,395 1,446 
Total investments—controlled/affiliated$204,596 $234,096 $(156,500)$— $1,094 $283,286 $24,245 
Investments—controlled/affiliatedFair Value as of December 31, 2019Additions/PurchasesReductions/Sales/ PaydownsNet Realized Gain (Loss)Net Change in Unrealized Appreciation (Depreciation)Fair Value as of December 31, 2020Dividend and Interest Income
SolAero Technologies Corp. (Priority Term Loan)9,612 — (7,152)— — 2,460 52 
SolAero Technologies Corp. (A1 Term Loan)3,166 — — — (1,952)1,214 — 
SolAero Technologies Corp. (A2 Term Loan)8,707 — — — (5,369)3,338 — 
Solaero Technology Corp. (Equity)826 — — — (826)— — 
Total investments—controlled/affiliated$22.311 $— $(7,152)$— $(8,147)$7,012 $52 
(11)In addition to the interest earned based on the stated interest rate of this loan, which is the amount reflected in this schedule, the Company is entitled to receive additional interest as a result of an agreement among lenders. Pursuant to the agreement among lenders in respect of this loan, this investment represents a first lien/last out loan, which has a secondary priority behind the first lien/first out loan with respect to principal, interest and other payments.
(12)Under the Investment Company Act, the Company is deemed an “affiliated person” of this portfolio because the Company owns 5% or more of the portfolio company’s outstanding voting securities. Transactions related the portfolio company during the year ended December 31, 2020 were as follows:
123

TCG BDC, INC.
CONSOLIDATED SCHEDULE OF INVESTMENTS
As of December 31, 2020
(dollar amounts in thousands)
Investments—non-controlled/affiliatedFair Value as of December 31, 2019Additions/PurchasesReductions/Sales/ PaydownsNet Realized Gain (Loss)Net Change in Unrealized Appreciation (Depreciation)Fair Value as of December 31, 2020Dividend and Interest Income
Direct Travel, Inc.$36,757 $— $(176)$$(11,633)$24,949 $— 
Direct Travel, Inc.— 1,231 — — — 1,231 18 
Direct Travel, Inc. (Equity)— — — — — — — 
Total investments—non-controlled/affiliated$36.757 $1,231 $(176)$$(11,633)$26,180 $18 
(13)As of December 31, 2020, the Company had the following unfunded commitments to fund delayed draw and revolving senior secured loans:
Investments—non-controlled/non-affiliatedTypeUnused FeePar/ Principal AmountFair Value
First and Second Lien Debt—unfunded delayed draw and revolving term loans commitments
Advanced Web Technologies Holding CompanyDelayed Draw1.00%$2,299 $(46)
Advanced Web Technologies Holding CompanyRevolver0.50854 (17)
Airnov, Inc.Revolver0.501,250 
American Physician Partners, LLCRevolver0.50550 (29)
AMS Group HoldCo, LLCRevolver0.502,315 (29)
Analogic CorporationRevolver0.50168 — 
Applied Technical ServicesDelayed Draw1.00132 (3)
Applied Technical ServicesRevolver0.5053 (1)
Apptio, Inc.Revolver0.502,367 36 
Captive Resources Midco, LLCRevolver0.502,143 15 
Chartis Holding, LLCDelayed Draw1.004,406 
Chartis Holding, LLCRevolver0.502,401 
Chemical Computing Group ULC (Canada)Revolver0.5029 — 
Cobblestone Intermediate Holdco LLCDelayed Draw1.0011 — 
Comar Holding Company, LLCRevolver0.502,935 11 
Comar Holding Company, LLCDelayed Draw1.004,655 17 
Cority Software Inc.(Canada)Revolver0.503,000 21 
DermaRite Industries, LLCRevolver0.503,103 (29)
Diligent CorporationDelayed Draw1.00141 
Diligent CorporationRevolver0.5047 
Direct Travel, Inc.Delayed Draw0.503,029 — 
Ethos Veterinary Health LLCDelayed Draw1.002,696 (37)
EvolveIP, LLCDelayed Draw1.003,333 (4)
EvolveIP, LLCRevolver0.502,941 (3)
FWR Holding CorporationRevolver0.504,444 (380)
Helios Buyer, Inc.Revolver0.501,326 (27)
Helios Buyer, Inc.Delayed Draw4,672 (93)
Hercules Borrower LLCRevolver0.502,160 (54)
124

TCG BDC, INC.
CONSOLIDATED SCHEDULE OF INVESTMENTS
As of December 31, 2020
(dollar amounts in thousands)
Investments—non-controlled/non-affiliatedTypeUnused FeePar/ Principal AmountFair Value
Higginbotham Insurance Agency, Inc.Delayed Draw1.00%$1,098 $(16)
Individual FoodService Holdings, LLCRevolver0.50436 (11)
Individual FoodService Holdings, LLCDelayed Draw1.00645 (16)
Individual FoodService Holdings, LLCDelayed Draw1.00165 (4)
Individual FoodService Holdings, LLCRevolver0.50139 (3)
Innovative Business Services, LLCRevolver0.502,232 (41)
K2 Insurance Services, LLCRevolver0.502,290 — 
K2 Insurance Services, LLCDelayed Draw1.001,571 — 
Kaseya, Inc.Delayed Draw1.001,852 
Kaseya, Inc.Revolver0.50787 
Lifelong Learner Holdings, LLCDelayed Draw1.001,690 (140)
Lifelong Learner Holdings, LLCRevolver0.501,377 (114)
Liqui-Box Holdings, Inc.Revolver0.501,262 (123)
Mailgun Technologies, Inc.Revolver0.501,342 (23)
National Technical Systems, Inc.Revolver0.50835 (6)
NMI AcquisitionCo, Inc.Revolver0.501,280 (13)
Paramit CorporationDelayed Draw2,931 (59)
PF Growth Partners, LLCDelayed Draw1.00823 (52)
PPC Flexible Packaging, LLCRevolver0.50881 (3)
PricewaterhouseCoopers Public Sector LLPRevolver0.506,250 (32)
QW Holding CorporationDelayed Draw1.00600 (29)
Redwood Services Group, LLCDelayed Draw3.634,639 18 
RSC Acquisition, Inc.Revolver0.50608 
Sapphire Convention, Inc.Revolver0.503,655 (542)
Smile Doctors, LLCRevolver0.50707 (14)
SolAero Technologies Corp. (Priority Facilities)Revolver0.502,068 — 
SPay, Inc.Revolver0.50655 (120)
Superior Health Linens, LLCRevolver0.501,667 (8)
T2 Systems, Inc.Revolver0.502,933 — 
Tank Holding Corp.Revolver0.2547 (1)
TCFI Aevex LLCDelayed Draw1.001,787 (7)
The Leaders Romans Bidco Limited (United Kingdom)Delayed Draw1.63£204 26 
Trump Card, LLCRevolver0.50635 (12)
TSB Purchaser, Inc.Revolver0.501,891 (15)
Turbo Buyer, Inc.Revolver0.502,151 20 
US INFRA SVCS Buyer, LLCRevolver0.502,275 (5)
US INFRA SVCS Buyer, LLCDelayed Draw1.0026,153 (60)
USLS Acquisition, Inc.Revolver0.501,418 (91)
USLS Acquisition, Inc.Delayed Draw0.50591 — 
125

TCG BDC, INC.
CONSOLIDATED SCHEDULE OF INVESTMENTS
As of December 31, 2020
(dollar amounts in thousands)
Investments—non-controlled/non-affiliatedTypeUnused FeePar/ Principal AmountFair Value
VRC Companies, LLCRevolver0.50%$1,646 $— 
Westfall Technik, Inc.Revolver0.50431 (30)
YLG Holdings, Inc.Delayed Draw1.00596 (9)
Zemax Software Holdings, LLCRevolver0.50642 (15)
Zenith Merger Sub, Inc.Revolver0.501,590 (12)
Zenith Merger Sub, Inc.Delayed Draw1.002,573 (19)
Total unfunded commitments$149,508 $(2,210)
126

TCG BDC, INC.
CONSOLIDATED SCHEDULE OF INVESTMENTS
As of December 31, 2020
(dollar amounts in thousands)
As of December 31, 2020, investments at fair value consisted of the following:
TypeTypeAmortized CostFair Value% of Fair Value
Type Amortized Cost Fair Value % of Fair Value
First Lien Debt (excluding First Lien/Last Out) $964,398
 $955,478
 67.15%
First Lien/Last Out Unitranche 180,928
 184,070
 12.94
First Lien DebtFirst Lien Debt$1,298,154 $1,224,063 67.0 %
Second Lien Debt 172,960
 171,864
 12.08
Second Lien Debt297,962 284,523 15.6 
Structured Finance Obligations 9,239
 5,216
 0.37
Equity Investments 5,071
 6,474
 0.46
Equity Investments32,754 33,877 1.9 
Investment Fund 97,385
 99,657
 7.00
Investment FundsInvestment Funds294,096 283,286 15.5 
Total $1,429,981
 $1,422,759
 100.00%Total$1,922,966 $1,825,749 100.0 %
The rate type of debt investments at fair value as of December 31, 20162020 was as follows:
Rate TypeAmortized CostFair Value% of Fair Value of First and Second Lien Debt
Floating Rate$1,583,061 $1,494,850 99.1 %
Fixed Rate13,055 13,736 0.9 
Total$1,596,116 $1,508,586 100.0 %

127

Rate Type Amortized Cost Fair Value % of Fair Value of First and Second Lien Debt
Floating Rate $1,308,455
 $1,301,549
 99.25%
Fixed Rate 9,831
 9,863
 0.75
Total $1,318,286
 $1,311,412
 100.00%
TCG BDC, INC.
CONSOLIDATED SCHEDULE OF INVESTMENTS
As of December 31, 2020
(dollar amounts in thousands)
The industry composition of investments at fair value as of December 31, 20162020 was as follows:
Industry Amortized Cost Fair Value % of Fair ValueIndustryAmortized CostFair Value% of Fair Value
Aerospace & Defense $62,759
 $61,371
 4.31%Aerospace & Defense$97,206 $87,208 4.8 %
Automotive 37,780
 38,414
 2.70
Automotive57,109 58,730 3.2 
Banking, Finance, Insurance & Real Estate 148,577
 150,700
 10.59
Banking, Finance, Insurance & Real Estate92,217 97,318 5.3 
Beverage, Food & Tobacco 15,059
 15,379
 1.08
Beverage, Food & Tobacco85,152 79,948 4.4 
Business Services 149,205
 141,784
 9.97
Business Services134,316 132,526 7.3 
Capital Equipment 36,811
 37,316
 2.62
Capital Equipment47,446 48,134 2.6 
Chemicals, Plastics & Rubber 19,784
 19,801
 1.39
Chemicals, Plastics & Rubber27,457 25,733 1.4 
Construction & Building 23,403
 23,691
 1.67
Construction & Building1,554 1,578 0.1 
Consumer Services 78,693
 79,941
 5.62
Consumer Services35,103 34,017 1.9 
Containers, Packaging & Glass 49,442
 47,706
 3.35
Containers, Packaging & Glass58,036 59,190 3.2 
Durable Consumer Goods 19,930
 19,932
 1.40
Durable Consumer Goods10,302 10,992 0.6 
Energy: Electricity 36,783
 36,758
 2.59
Energy: Oil & Gas 11,132
 10,911
 0.77
Energy: Oil & Gas40,135 40,109 2.2 
Environmental Industries 40,763
 41,299
 2.90
Environmental Industries63,536 62,238 3.4 
Forest Products & Paper 23,752
 23,924
 1.68
Healthcare & Pharmaceuticals 159,072
 161,544
 11.36
Healthcare & Pharmaceuticals154,547 118,486 6.5 
High Tech Industries 45,617
 46,317
 3.26
High Tech Industries205,975 205,709 11.3 
Hotel, Gaming & Leisure 30,450
 30,014
 2.11
Hotel, Gaming & Leisure100,696 80,444 4.4 
Investment Fund 97,385
 99,657
 7.00
Investment FundsInvestment Funds294,096 283,286 15.5 
Media: Advertising, Printing & Publishing 70,988
 71,999
 5.06
Media: Advertising, Printing & Publishing37,234 37,261 2.0 
Metals & Mining 10,232
 10,259
 0.72
Media: Diversified & ProductionMedia: Diversified & Production19,636 19,600 1.1 
Non-durable Consumer Goods 32,759
 29,348
 2.06
Non-durable Consumer Goods1,500 1,664 0.1 
Retail 8,625
 8,320
 0.58
Retail34,818 34,489 1.9 
Software 11,110
 11,265
 0.79
Software87,026 85,727 4.7 
Structured Finance 9,239
 5,216
 0.37
Sovereign & Public FinanceSovereign & Public Finance37,055 37,621 2.1 
Telecommunications 108,553
 110,359
 7.76
Telecommunications116,245 98,914 5.4 
Transportation: Cargo 34,323
 34,306
 2.41
Transportation: Cargo29,576 29,389 1.6 
Transportation: Consumer 26,841
 27,882
 1.96
Transportation: Consumer26,912 27,443 1.5 
Wholesale 30,914
 27,346
 1.92
Wholesale28,081 27,995 1.5 
Total $1,429,981
 $1,422,759
 100.00%Total$1,922,966 $1,825,749 100.0 %

Table of Contents128


TCG BDC, INC.
CONSOLIDATED SCHEDULE OF INVESTMENTS (Continued)
As of December 31, 20162020
(dollar amounts in thousands)
The geographical composition of investments at fair value as of December 31, 20162020 was as follows:
GeographyAmortized CostFair Value% of Fair Value
Canada$24,206 $24,658 1.4 %
Cyprus6,112 6,793 40.0 
Luxembourg32,093 29,970 1.6 
United Kingdom88,885 90,112 4.9 
United States1,771,670 1,674,216 91.7 
Total$1,922,966 $1,825,749 100.0 %
Geography Amortized Cost Fair Value % of Fair Value
Cayman Islands $9,239
 $5,216
 0.37%
United Kingdom 21,144
 20,969
 1.47
United States 1,399,598
 1,396,574
 98.16
Total $1,429,981
 $1,422,759
 100.00%

The accompanying notes are an integral part of these consolidated financial statements.


129


Table of Contents

TCG BDC, INC.
NOTES TO CONSOLIDATED FINANCIAL STATEMENTS
As of December 31, 20172021
(dollar amounts in thousands, except per share data)

1. ORGANIZATION
TCG BDC, Inc. (together with its consolidated subsidiaries, “we,” “us,” “our,” “TCG BDC” or the “Company”) is a Maryland corporation formed on February 8, 2012, and structured as an externally managed, non-diversified closed-end investment company. The Company is managed by its investment adviser, Carlyle Global Credit Investment Management L.L.C. (formerly known as Carlyle GMS Investment Management L.L.C., “CGCIM”(“CGCIM” or “Investment Adviser”), a wholly owned subsidiary of The Carlyle Group L.P.Inc. (formerly, The Carlyle Group L.P). The Company has elected to be regulated as a business development company (“BDC”) under the Investment Company Act of 1940, as amended (together with the rules and regulations promulgated thereunder, the “Investment Company Act”). In addition, the Company has elected to be treated, and intends to continue to comply with the requirements to qualify annually, as a regulated investment company (“RIC”) under Subchapter M of the Internal Revenue Code of 1986, as amended (together with the rules and regulations promulgated thereunder, the “Code”).
The Company’s investment objective is to generate current income and, to a lesser extent, capital appreciation primarily through secured debt investments in U.S. middle market companies. The Company's core investment strategy focuses on lending to U.S. middle market companies supported by financial sponsors, which the Company defines as companies with approximately $10$25 million to $100 million of earnings before interest, taxes, depreciation and amortization (“EBITDA”), which the Company believes is a useful proxy for cash flow. This core strategy is supplemented with complementary specialty lending and opportunistic investing strategies, which take advantage of the broad capabilities of Carlyle's Global Credit platform while offering risk diversifying portfolio benefits. The Company seeks to achieve its investment objective primarily through direct originationsorigination of secured debt instruments, including first lien senior secured loans (which may include stand-alone first lien loans, first lien/last out loans and “unitranche” loans) and second lien senior secured loans (collectively, “Middle Market Senior Loans”), with the balance of ourits assets invested in higher yielding investments (which may include unsecured debt, mezzanine debt and investments in equities). The Middle Market Senior Loans are generally made to private U.S. middle market companies that are, in many cases, controlled by private equity firms. Depending on market conditions, the Company expects that between 70% and 80% of the value of its assets will be invested in Middle Market Senior Loans. The Company expects that the composition of its portfolio will change over time given the Investment Adviser’s view on, among other things, the economic and credit environment (including with respect to interest rates) in which the Company is operating.
The Company invests primarily in loans to middle market companies whose debt, if rated, is rated below investment grade, and, if not rated, would likely be rated below investment grade if it were rated (that is, below BBB- or Baa3, which is often referred to as “junk”). Exposure to below investment grade instruments involves certain risks, including speculation with respect to the borrower’s capacity to pay interest and repay principal.
On May 2, 2013, the Company completed its initial closing of capital commitments (the “Initial Closing”) and subsequently commenced substantial investment operations. Effective March 15, 2017, the Company changed its name from “Carlyle GMS Finance, Inc.” to “TCG BDC, Inc.” On June 19, 2017, the Company closed its initial public offering (“IPO”), issuing 9,454,200 shares of its common stock (including shares issued pursuant to the exercise of the underwriters’ over-allotment option on July 5, 2017) at a public offering price of $18.50 per share. Net of underwriting costs, the Company received cash proceeds of $169,488. Shares of common stock of TCG BDC began trading on the NASDAQNasdaq Global Select Market under the symbol “CGBD” on June 14, 2017.
Until December 31, 2017, the Company was an “emerging growth company,” as that term is used in the Jumpstart Our Business Startups Act of 2012. As of June 30, 2017, the market value of the common stock held by non-affiliates exceeded $700,000. Accordingly, the Company ceased to be an emerging growth company as of December 31, 2017.
The Company is externally managed by the Investment Adviser, an investment adviser registered under the Investment Advisers Act of 1940 (“Advisers Act”), as amended. Carlyle Global Credit Administration L.L.C. (formerly known as Carlyle GMS Finance Administration L.L.C., “CGCA”(“CGCA” or the “Administrator”) provides the administrative services necessary for the Company to operate. Both the Investment Adviser and the Administrator are wholly owned subsidiaries of Carlyle Investment Management L.L.C. (“CIM”), a subsidiary of The Carlyle Group L.P.Inc. “Carlyle” refers to The Carlyle Group L.P.Inc. and its affiliates and its consolidated subsidiaries (other than portfolio companies of its affiliated funds), a global alternative asset manager publicly traded on NASDAQthe Nasdaq Global Select Market under the symbol “CG”. Refer to the sec.gov website for further information on Carlyle.
130


Table of Contents
TCG BDC SPV LLC (the “SPV”) is a Delaware limited liability company that was formed on January 3, 2013. ThePrior to the termination of its senior secured credit facility on December 11, 2020, the SPV investsinvested in first and second lien senior secured loans. The SPV is a wholly owned subsidiary of the Company and is

Table of Contents

consolidated in these consolidated financial statements commencing from the date of its formation, January 3, 2013. Effective March 15, 2017, the SPV changed its name from “Carlyle GMS Finance SPV LLC”LLC�� to “TCG BDC SPV LLC”.
On June 9, 2017, pursuant to the Agreement and Plan of Merger, dated May 3, 2017 (the “Agreement”), by and between the Company and NF Investment Corp. (“NFIC”), NFIC merged with and into the Company (the “NFIC Acquisition”), with the Company as the surviving entity. The NFIC Acquisition was accounted for as an asset acquisition. NFIC SPV LLC (the “NFIC SPV” and, together with the SPV, the “SPVs”) is a Delaware limited liability company that was formed on June 18, 2013. Upon the consummation of the NFIC Acquisition, the NFIC SPV became a wholly owned subsidiary of the Company and is consolidated in these consolidated financial statements commencing from the closing date of the NFIC Acquisition, June 9, 2017. Refer to Note 13, NFIC Acquisition, for details.
On June 26, 2015, the Company completed a $400,000 term debt securitization (the “2015-1 Debt Securitization”). The notes offered in the 2015-1 Debt Securitization (the “2015-1 Notes”) were issued by Carlyle Direct Lending CLO 2015-1R LLC (formerly known as Carlyle GMS Finance MM CLO 2015-1 LLCLLC) (the “2015-1 Issuer”), a wholly owned and consolidated subsidiary of the Company,Company. On August 30, 2018, the 2015-1 Issuer refinanced the 2015-1 Debt Securitization (the “2015-1 Debt Securitization Refinancing”) by redeeming in full the 2015-1 Notes and issuing new notes (the “2015-1R Notes”). The 2015-1R Notes are secured by a diversified portfolio of the 2015-1 Issuer consisting primarily of first and second lien senior secured loans. Refer to Note 78, Notes Payable, for details. The 2015-1 Issuer is consolidated in these consolidated financial statements commencing from the date of its formation, May 8, 2015.
On February 29, 2016, the Company and Credit Partners USA LLC (“Credit Partners”) entered into an amended and restated limited liability company agreement, which was subsequently amended on June 24, 2016 and February 22, 2021 (as amended, the “Limited Liability Company Agreement”) to co-manage Middle Market Credit Fund, LLC (“Credit Fund”). Credit Fund primarily invests in first lien loans of middle market companies. Credit Fund is managed by a six-member board of managers, on which the Company and Credit Partners each have equal representation. The Company and Credit Partners each have 50% economic ownership of Credit Fund and have commitments to fund, from time to time, capital of up to $400,000$250,000 each. Refer to Note 5, Middle Market Credit Fund, LLC, for details.
On May 5, 2020, the Company issued and sold 2,000,000 shares of cumulative convertible preferred stock, par value $0.01 per share (the "Preferred Stock"), to an affiliate of Carlyle in a private placement at a price of $25 per share. See Note 10, Net Assets, for further information about the Preferred Stock.
On November 3, 2020, the Company and Cliffwater Corporate Lending Fund ("CCLF"), an investment vehicle managed by Cliffwater LLC, entered into a limited liability company agreement to co-manage Middle Market Credit Fund II, LLC ("Credit Fund II"). Credit Fund II invests in senior secured loans of middle market companies. Credit Fund II is managed by a four-member board of managers, on which the Company and CCLF each have equal representation. The Company and CCLF have approximately 84.13% and 15.87% economic ownership of Credit Fund II, respectively. The Company contributed certain senior secured debt investments with an aggregate principal balance of approximately $250 million to Credit Fund II in exchange for its 84.13% economic interest and gross cash proceeds of approximately $170 million. See Note 6, Middle Market Credit Fund II, LLC, to these consolidated financial statements for details.
As a BDC, the Company is required to comply with certain regulatory requirements. As part of these requirements, the Company must not acquire any assets other than “qualifying assets” specified in the Investment Company Act unless, at the time the acquisition is made, at least 70% of its total assets are qualifying assets (with certain limited exceptions).
To qualify as a RIC, the Company must, among other things, meet certain source-of-income and asset diversification requirements and timely distribute to its stockholders generally at least 90% of its investment company taxable income, as defined by the Code, for each year. Pursuant to this election, the Company generally does not have to pay corporate level taxes on any income that it distributes to stockholders, provided that the Company satisfies those requirements.
2. SIGNIFICANT ACCOUNTING POLICIES
Basis of Presentation
The consolidated financial statements have been prepared on the accrual basis of accounting in accordance with accounting principles generally accepted in the United States (“USU.S. GAAP”). The Company is an investment company for the purposes of accounting and financial reporting in accordance with Financial Accounting Standards UpdateBoard ("FASB") Accounting Standards Codification (“ASU”ASC”) 2013-08,Topic 946, Financial Services—Investment Companies (“ASU 2013-08”ASC 946”): Amendments to the Scope, Measurement and Disclosure Requirements.. The consolidated financial statements include the accounts of the Company and its wholly owned subsidiaries, the SPVSPVs and the 2015-1 Issuer. All significant intercompany balances and transactions have been eliminated. USU.S. GAAP for an investment company requires investments to be recorded at fair value. The carrying value for all other assets and liabilities approximates their fair value.

131


Table of Contents
The annual financial statements have been prepared in accordance with USU.S. GAAP for annual financial information and pursuant to the requirements for reporting on Form 10-K and Article 6 of Regulation S-X. In the opinion of management, all adjustments considered necessary for the fair presentation of consolidated financial statements for the years presented have been included.
Use of Estimates
The preparation of consolidated financial statements in conformity with USU.S. GAAP requires management to make assumptions and estimates that affect the reported amounts of assets and liabilities and disclosure of contingent assets and liabilities at the date of the financial statements and the reported amounts of revenues and expenses during the reporting period. Management’s estimates are based on historical experiences and other factors, including expectations of future events that

Table of Contents

management believes to be reasonable under the circumstances. It also requires management to exercise judgment in the process of applying the Company’s accounting policies. Assumptions and estimates regarding the valuation of investments and their resulting impact on base management and incentive fees involve a higher degree of judgment and complexity and these assumptions and estimates may be significant to the consolidated financial statements. Actual results could differ from these estimates and such differences could be material.
Investments
Investment transactions are recorded on the trade date. Realized gains or losses are measured by the difference between the net proceeds from the repayment or sale and the amortized cost basis of the investment using the specific identification method without regard to unrealized appreciation or depreciation previously recognized, and includes investments charged off during the period, net of recoveries. Net change in unrealized appreciation or depreciation on investments as presented in the accompanying Consolidated Statements of Operations reflects the net change in the fair value of investments, including the reversal of previously recorded unrealized appreciation or depreciation when gains or losses are realized. See Note 3 for further information about fair value measurements.
Cash, Cash Equivalents and Restricted Cash
Cash, cash equivalents
Cash and restricted cash equivalents consist of demand deposits and highly liquid investments (e.g., money market funds, U.S. treasury notes) with original maturities of three months or less. Cash equivalents are carried at amortized cost, which approximates fair value. The Company’s cash, and cash equivalents and restricted cash are held with two large financial institutions and cash held in such financial institutions may, at times, exceed the Federal Deposit Insurance Corporation insured limit. As of December 31, 2021 and 2020, the Company had restricted cash balances of $70,081 and $16,184 respectively, which represent amounts that are collected by trustees who have been appointed as custodians of the assets securing certain of the Company's financing transactions, and held for payment of interest expense and principal on the outstanding borrowings, or reinvestment into new assets.
Revenue Recognition
Interest from Investments and Realized Gain/Loss on Investments
Interest income is recorded on an accrual basis and includes the accretion of discounts and amortization of premiums. Discounts from and premiums to par value on debt investments purchased are accreted/amortized into interest income over the life of the respective security using the effective interest method. The amortized cost of debt investments represents the original cost, including origination fees and upfront fees received that are deemed to be an adjustment to yield, adjusted for the accretion of discounts and amortization of premiums, if any. At time of exit, the realized gain or loss on an investment is the difference between the amortized cost at time of exit and the cash received at exit using the specific identification method.
The Company may have loans in its portfolio that contain payment-in-kind (“PIK”) provisions. PIK represents interest that is accrued and recorded as interest income at the contractual rates, increases the loan principal on the respective capitalization dates, and is generally due at maturity. Such income is included in interest income in the Consolidated Statements of Operations. As of December 31, 2017,2021 and 2020, the fair value of the loanloans in the portfolio with PIK provisions was $15,451, which represents approximately 0.8% of total investments at fair value.$243,220 and $240,861, respectively. For the yearyears ended December 31, 2017,2021, 2020 and 2019, the Company earned $1,057$9,346, $5,476, and $6,596 in PIK income included in interest income in the accompanying Consolidated Statements of Operations. As of December 31, 2016 and for the year then ended, no loans in the portfolio contained PIK provisions.
Dividend Income
Dividend income from theeach investment fund, Credit Fund and Credit Fund II, is recorded on the record date for the investment fund to the extent that such amounts are payable by the investment fund and are expected to be collected.
132


Table of Contents
Other Income
Other income may include income such as consent, waiver, amendment, syndicationunused, underwriting, arranger and prepayment fees associated with the Company’s investment activities as well as any fees for managerial assistance services rendered by the Company to the portfolio companies. Such fees are recognized as income when earned or the services are rendered. The Company may receive fees for guaranteeing the outstanding debt of a portfolio company. Such fees are amortized into other income over the life of the guarantee. The unamortized amount, if any, is included in other assets in the accompanying Consolidated Statements of Assets and Liabilities. For the years ended December 31, 2017, 20162021, 2020 and 2015,2019, the Company earned $10,526, $6,635$6,397, $10,974 and $834,$7,329, respectively, in other income, primarily from amendment, syndicationunderwriting, and prepayment fees.
Non-Accrual Income

Table of Contents

Loans are generally placed on non-accrual status when principal or interest payments are past due 30 days or more or when there is reasonable doubt that principal or interest will be collected in full. Accrued and unpaid interest is generally reversed when a loan is placed on non-accrual status. Interest payments received on non-accrual loans may be recognized as income or applied to principal depending upon management’s judgment regarding collectability. Non-accrual loans are restored to accrual status when past due principal and interest are paid current and, in management’s judgment, are likely to remain current. Management may not place a loan on non-accrual status if the loan has sufficient collateral value and is in the process of collection. As of December 31, 20172021 and 2016,2020, the fair value of the loanloans in the portfolio on non-accrual status was $19,487$76,551 and $7,628, respectively, which represents approximately 1.0% and 0.5%, respectively, of total investments at fair value.$58,136, respectively. The remaining first and second lien debt investments were performing and current on their interest payments as of December 31, 20172021 and 2016 and for the years then ended.2020.
SPV Credit Facility, Credit Facility and 2015-1The Facilities, Senior Notes, 2015-1R Notes – Related Costs, Expenses and Deferred Financing Costs (See Note 6, Borrowings,
The Company entered into a senior secured revolving credit facility (as amended, the “Credit Facility”), and Note 7, 2015-1 Notes)
the SPV entered into a senior secured credit facility (as amended, the "SPV Credit Facility", and together with the Credit Facility, the “Facilities”), which was terminated on December 11, 2020. Interest expense and unused commitment fees on the SPV Credit Facility and Credit FacilityFacilities are recorded on an accrual basis. Unused commitment fees are included in credit facility fees in the accompanying Consolidated Statements of Operations.
On December 30, 2019, the Company closed a private offering of $115.0 million in aggregate principal amount of 4.750% Senior Unsecured Notes due December 31, 2024 (the “2019 Notes”. On December 11, 2020, the Company issued $75.0 million in aggregate principal amount of 4.500% Senior Unsecured Notes due December 31, 2024 (the "2020 Notes, and together with the 2019 Notes, the “Senior Notes”). The SPV Credit Facility, the 2015-1R Notes and Credit Facilitythe Senior Notes are recorded at carrying value, which approximates fair value.
Deferred financing costs include capitalized expenses related to the closing or amendments of the SPV Credit Facility and Credit Facility.Facilities. Amortization of deferred financing costs for each credit facility is computed on the straight-line basis over the respective term of each credit facility, except for a portion that was accelerated in connection with the amendment of the SPV Credit Facility as described in Note 6.facility. The unamortized balance of such costs is included in deferred financing costs in the accompanying Consolidated Statements of Assets and Liabilities. The amortization of such costs is included in credit facility fees in the accompanying Consolidated Statements of Operations.

Debt issuance costs include capitalized expenses including structuring and arrangement fees related to the offering of the 2015-12015-1R Notes and Senior Notes. Amortization of debt issuance costs for the 2015-1 Notesnotes is computed on the effective yield method over the term of the 2015-1 Notes.notes. The unamortized balance of such costs is presented as a direct deduction to the carrying amount of the 2015-1 Notesnotes in the accompanying Consolidated Statements of Assets and Liabilities. The amortization of such costs is included in interest expense in the accompanying Consolidated Statements of Operations.
The 2015-1 Notes are recorded at carrying value, which approximates fair value.
Organization and Offering Costs
Offering costs consist primarily of fees and expenses incurred in connection with the offering of shares, including legal, underwriting, printing and other costs, as well as costs associated with the preparation and filing of applicable registration statements. Upon consummation of the IPO, the Company is no longer a closed–end fund with a continuous offering period and, thus, offering costs are charged against equity when incurred. During the year ended December 31, 2017, $3,088 of the offering costs were incurred, 50% of which were paid by the Investment Adviser.
Income Taxes
For federal income tax purposes, the Company has elected to be treated as a RIC under the Code, and intends to make the required distributions to its stockholders as specified therein. In order to qualify as a RIC, the Company must meet certain minimum distribution, source-of-income and asset diversification requirements. If such requirements are met, then the Company is generally required to pay income taxes only on the portion of its taxable income and gains it does not distribute.
The minimum distribution requirements applicable to RICs require the Company to distribute to its stockholders at least 90% of its investment company taxable income (“ICTI”), as defined by the Code, each year. Dependingyear, although depending on the level of ICTI earned in a tax year, the Company may choose to carry forward ICTI in excess of the current year distributionsdistribution into
133


Table of Contents
the next tax year. Any such carryover ICTI must be distributed before the end of that next tax year through a dividend declared prior to filing the final tax return related to the year which generated such ICTI.
In addition, based on the excise distribution requirements, the Company is subject to a 4% nondeductible federal excise tax on undistributed income unless the Company distributes in a timely manner an amount at least equal to the sum of (1) 98% of its ordinary income for each calendar year, (2) 98.2% of capital gain net income (both long-term and short-term) for

Table of Contents

the one-year period ending October 31 in that calendar year and (3) any income realized, but not distributed, in the preceding year. For this purpose, however, any ordinary income or capital gain net income retained by the Company that is subject to corporate income tax is considered to have been distributed. The Company intends to make sufficient distributions each taxable year to satisfy the excise distribution requirements.
The Company evaluates tax positions taken or expected to be taken in the course of preparing its consolidated financial statements to determine whether the tax positions are “more-likely than not” to be sustained by the applicable tax authority. The SPV and the 2015-1 Issuer are disregarded entities for tax purposes and are consolidated with the tax return of the Company. All penalties and interest associated with income taxes, if any, are included in income tax expense. For the years ended December 31, 2017, 20162021, 2020 and 2015,2019, the Company incurred $264, $76$782, $573 and $0,$404, respectively, in excise tax expense.
The SPV and the 2015-1 Issuer are disregarded entities for tax purposes and are consolidated with the tax return of the Company.

Dividends and Distributions to Common Stockholders
To the extent that the Company has taxable income available, the Company intends to make quarterly distributions to its common stockholders. Dividends and distributions to common stockholders are recorded on the record date. The amount to be distributed is determined by the Board of Directors each quarter and is generally based upon the taxable earnings estimated by management and available cash. Net realized capital gains, if any, are generally distributed at least annually, although the Company may decide to retain such capital gains for investment.

Prior to July 5, 2017, the Company had an “opt in” dividend reinvestment plan. Effective on July 5, 2017, the Company converted the “opt in” dividend reinvestment plan to an “opt out” dividend reinvestment plan that provides for reinvestment of dividends and other distributions on behalf of the common stockholders, other than those stockholders who have “opted out” of the plan. As a result of adopting the plan, if ourthe Board of Directors authorizes, and the Company declares, a cash dividend or distribution, the common stockholders who have not elected to “opt out” of the dividend reinvestment plan will have their cash dividends or distributions automatically reinvested in additional shares of the Company’s common stock, rather than receiving cash. Each registered stockholder may elect to have such stockholder’s dividends and distributions distributed in cash rather than participate in the plan. For any registered stockholder that does not so elect, distributions on such stockholder’s shares will be reinvested by State Street Bank and Trust Company, ourthe Company’s plan administrator, in additional shares. The number of shares to be issued to the stockholder will be determined based on the total dollar amount of the cash distribution payable, net of applicable withholding taxes. The Company intends to use primarily newly issued shares to implement the plan so long as the market value per share is equal to or greater than the net asset value per share on the relevant valuation date. If the market value per share is less than the net asset value per share on the relevant valuation date, the plan administrator would implement the plan through the purchase of common stock on behalf of participants in the open market, unless the Company instructs the plan administrator otherwise.
Functional CurrencyTranslations
The functional currency of the Company is the U.S. DollarDollar. Investments are generally made in the local currency of the country in which the investment is domiciled and are translated into U.S. Dollars with foreign currency translation gains or losses recorded within net change in unrealized appreciation (depreciation) on investments in the accompanying consolidated statements of operations. Foreign currency translation gains and losses on non-investment assets and liabilities are separately reflected in the accompanying consolidated statements of operations.
Earnings Per Common Share
The Company computes earnings per common share in accordance with ASC 260, Earnings Per Share (“ASC 260”). Basic earnings per common share is calculated by dividing the net increase (decrease) in net assets resulting from operations
134


Table of Contents
attributable to common stock by the weighted average number of shares of common stock outstanding. Diluted earnings per common share reflects the assumed conversion of all transactions were in U.S. Dollars.dilutive securities.
Recent Accounting Standards Updates
The Financial Accounting Standards Board ("FASB") issued ASU 2014-9, Revenue from Contracts with Customers (Topic 606) (“ASU 2014-9”) in May 2014 and subsequently issued several amendments to the standard. ASU 2014-9, and related amendments, provide comprehensive guidance for recognizing revenue from contracts with customers. Entities will be able to recognize revenue when the entity transfers promised goods or services to customers in an amount that reflects the consideration to which the entity expects to be entitled to in exchange for those goods or services. The guidance includes a five-step framework that requires an entity to: (i) identify the contract(s) with a customer, (ii) identify the performance obligations in the contract, (iii) determine the transaction price, (iv) allocate the transaction price to the performance obligations in the contract, and (v) recognize revenue when the entity satisfies a performance obligation. The guidance in ASU 2014-9, and the related amendments, is effective for the Company on January 1, 2018. The Company has elected to adopt the ASU on January 1, 2018, which did not have a material impact on the Company’s consolidated financial statements.

In November 2016,March 2020, the FASB issued ASU 2016-18, StatementNo. 2020-04, “Reference Rate Reform (Topic 848),” which provides optional expedients and exceptions for applying GAAP to contracts, hedging relationships, and other transactions affected by reference rate reform if certain criteria are met. The amendments apply only to contracts, hedging relationships, and other transactions that reference London Interbank Offered Rate (“LIBOR”) or another reference rate expected to be discontinued because of Cash Flowsreference rate reform. In January 2021, the FASB issued ASU No. 2021-01, Reference Rate Reform (Topic 230) - Restricted Cash.848), which expanded the scope of Topic 848 to include derivative instruments impacted by discounting transition. ASU 2016-18 clarifies2020-04 and ASU 2021-01 are effective for all entities through December 31, 2022. The expedients and exceptions provided by the presentationamendments do not apply to contract modifications and hedging relationships entered into or evaluated after December 31, 2022, except for hedging transactions as of restricted cash inDecember 31, 2022, that an entity has elected certain optional expedients for and that are retained through the statement of cash flows by requiring the amounts described as restricted cash be included with cash and cash equivalents when reconciling the beginning of period and end of period total amounts shown on the statement of cash flows. If cash and cash equivalents and restricted cash are presented separately onhedging relationship. The Company is currently evaluating the

Table of Contents

statement of financial position, a reconciliation of these separate line items to the total cash amount included in the statement of cash flows will be required either in the footnotes or on the face impact of the statementadoption of cash flows. This guidance is effective for annual reporting periods,ASU 2020-04 and the interim periods within those periods, beginning after December 15, 2017 and early adoption is permitted. The Company has elected to adopt the ASU2021-01 on January 1, 2018, which did not have a material impact on the Company’sits consolidated financial statements.
3. FAIR VALUE MEASUREMENTS
The Company applies fair value accounting in accordance with the terms of Financial Accounting Standards Board Accounting Standards Codification (“ASC”)FASB ASC Topic 820, Fair Value Measurement (“ASC 820”). ASC 820 defines fair value as the amount that would be exchanged to sell an asset or transfer a liability in an orderly transfer between market participants at the measurement date. The Company values securities/instruments traded in active markets on the measurement date by multiplying the closing price of such traded securities/instruments by the quantity of shares or amount of the instrument held. The Company may also obtain quotes with respect to certain of its investments, such as its securities/instruments traded in active markets and its liquid securities/instruments that are not traded in active markets, from pricing services, brokers, or counterparties (i.e., “consensus pricing”). When doing so, the Company determines whether the quote obtained is sufficient according to USU.S. GAAP to determine the fair value of the security. The Company may use the quote obtained or alternative pricing sources may be utilized including valuation techniques typically utilized for illiquid securities/instruments.
Securities/instruments that are illiquid or for which the pricing source does not provide a valuation or methodology or provides a valuation or methodology that, in the judgment of the Investment Adviser or the Company’s Board of Directors, does not represent fair value shall each be valued as of the measurement date using all techniques appropriate under the circumstances and for which sufficient data is available. These valuation techniques may vary by investment and include comparable public market valuations, comparable precedent transaction valuations and/or discounted cash flow analyses. The process generally used to determine the applicable value is as follows: (i) the value of each portfolio company or investment is initially reviewed by the investment professionals responsible for such portfolio company or investment and, for non-traded investments, a standardized template designed to approximate fair market value based on observable market inputs, updated credit statistics and unobservable inputs is used to determine a preliminary value, which is also reviewed alongside consensus pricing, where available; (ii) preliminary valuation conclusions are documented and reviewed by a valuation committee comprised of members of senior management; (iii) the Board of Directors engages a third-party valuation firm to provide positive assurance on portions of the Middle Market Senior Loans and equity investments portfolio each quarter (such that each non-traded investment other than Credit Fund is reviewed by a third-party valuation firm at least once on a rolling twelve month basis) including a review of management’s preliminary valuation and conclusion on fair value; (iv) if applicable, the Audit Committee of the Board of Directors (the “Audit Committee”) reviews the assessments of the Investment Adviser and the third-party valuation firm and provides the Board of Directors with any recommendations with respect to changes to the fair value of each investment in the portfolio; and (v) if applicable, the Board of Directors discusses the valuation recommendations of the Audit Committee and determines the fair value of each investment in the portfolio in good faith based on the input of the Investment Adviser and, where applicable, the third-party valuation firm.
All factors that might materially impact the value of an investment are considered, including, but not limited to the assessment of the following factors, as relevant:
the nature and realizable value of any collateral;
call features, put features and other relevant terms of debt;
the portfolio company’s leverage and ability to make payments;
the portfolio company’s public or private credit rating;
135


Table of Contents
the portfolio company’s actual and expected earnings and discounted cash flow;
prevailing interest rates and spreads for similar securities and expected volatility in future interest rates;
the markets in which the portfolio company does business and recent economic and/or market events; and
comparisons to comparable transactions and publicly traded securities.
Investment performance data utilized are the most recently available financial statements and compliance certificates received from the portfolio companies as of the measurement date which in many cases may reflect a lag in information.

Table of Contents

Due to the inherent uncertainty of determining the fair value of investments that do not have a readily available market value, the fair value of the Company’s investments may fluctuate from period to period. Because of the inherent uncertainty of valuation, these estimated values may differ significantly from the values that would have been reported had a ready market for the investments existed, and it is reasonably possible that the difference could be material.
In addition, changes in the market environment and other events that may occur over the life of the investments may cause the realized gains or losses on investments to be different from the net change in unrealized appreciation or depreciation currently reflected in the consolidated financial statements as of December 31, 2017, 20162021, 2020 and 2015.2019.
USU.S. GAAP establishes a hierarchical disclosure framework which ranks the level of observability of market price inputs used in measuring investments at fair value. The observability of inputs is impacted by a number of factors, including the type of investment and the characteristics specific to the investment and state of the marketplace, including the existence and transparency of transactions between market participants. Investments with readily available quoted prices or for which fair value can be measured from quoted prices in active markets generally have a higher degree of market price observability and a lesser degree of judgment applied in determining fair value.
Investments measured and reported at fair value are classified and disclosed based on the observability of inputs used in determination of fair values, as follows:
 
Level 1—inputs to the valuation methodology are quoted prices available in active markets for identical investments as of the reporting date. The types of financial instruments in Level 1 generally include unrestricted securities, including equities and derivatives, listed in active markets. The Company does not adjust the quoted price for these investments, even in situations where the Company holds a large position and a sale could reasonably impact the quoted price.
Level 2—inputs to the valuation methodology are either directly or indirectly observable as of the reporting date and are those other than quoted prices in active markets. The type of financialFinancial instruments in this category generally includes less liquid and restricted securities listed in active markets, securities traded in other than active markets, government and agency securities, and certain over-the-counter derivatives where the fair value is based on observable inputs.
Level 3—inputs to the valuation methodology are unobservable and significant to overall fair value measurement. The inputs into the determination of fair value require significant management judgment or estimation. Financial instruments that are in this category generally include investments in privately-held entities, CLOs,collateralized loan obligations, and certain over-the-counter derivatives where the fair value is based on unobservable inputs.

In certain cases, the inputs used to measure fair value may fall into different levels of the fair value hierarchy. In such cases, an investment’s level within the fair value hierarchy is based on the lowest level of input that is significant to the overall fair value measurement. The Investment Adviser’s assessment of the significance of a particular input to the fair value measurement in its entirety requires judgment, and considers factors specific to the investment. Investments in Credit Fund and Credit Fund II are valued based on the legal form of investment. For those structured through LLC membership interests, the practical expedient, or net asset value method is used. For those structured through subordinated notes, a discounted cash flow method is used.
Transfers between levels, if any, are recognized at the beginning of the year in which the transfers occur. For the years ended December 31, 20172021 and 2016, there2020, there were no transfers between levels.
136


Table of Contents

The following tables summarize the Company’s investments measured at fair value on a recurring basis by the above fair value hierarchy levels as of December 31, 20172021 and 2016:2020:
December 31, 2017 December 31, 2021
Level 1 Level 2 Level 3 Total Level 1Level 2Level 3Total
Assets       Assets
First Lien Debt$
 $
 $1,531,276
 $1,531,276
First Lien Debt$— $— $1,232,084 $1,232,084 
Second Lien Debt
 
 246,233
 246,233
Second Lien Debt— — 341,776 341,776 
Equity Investments
 
 17,506
 17,506
Equity Investments— — 77,093 77,093 
Investment Fund       Investment Fund
Mezzanine Loan
 
 85,750
 85,750
Mezzanine Loan— — — — 
Subordinated Loan and Member's InterestSubordinated Loan and Member's Interest— — 184,141 184,141 
Subtotal$
 $
 $1,880,765
 $1,880,765
Subtotal$— $— $1,835,094 $1,835,094 
Investments measured at net asset value (1)
      $86,766
Investments measured at net asset value (1)
$77,958 
Total      $1,967,531
Total$1,913,052 
December 31, 2016 December 31, 2020
Level 1 Level 2 Level 3 Total Level 1Level 2Level 3Total
Assets       Assets
First Lien Debt$
 $
 $1,139,548
 $1,139,548
First Lien Debt$— $— $1,224,063 $1,224,063 
Second Lien Debt
 
 171,864
 171,864
Second Lien Debt— — 284,523 284,523 
Structured Finance Obligations
 
 5,216
 5,216
Equity Investments
 
 6,474
 6,474
Equity Investments— — 33,877 33,877 
Investment Fund       Investment Fund
Mezzanine Loan
 
 62,384
 62,384
Mezzanine Loan— — — — 
Subordinated Loan and Member's InterestSubordinated Loan and Member's Interest— — 205,891 205,891 
Subtotal$
 $
 $1,385,486
 $1,385,486
Subtotal$— $— $1,748,354 $1,748,354 
Investments measured at net asset value (1)

      $37,273
Investments measured at net asset value (1)
$77,395 
Total      $1,422,759
Total$1,825,749 
 
(1)Amount represents the Company’s subordinated loan and member’s interest investments in Credit Fund. The fair value of these investments has been estimated using the net asset value of the Company’s ownership interests in Credit Fund.
(1)Amount represents the Company’s investment in Credit Fund II. The Company, as a practical expedient, estimates the fair value of this investment using the net asset value of the Company’s member’s interest in Credit Fund II. As such, the fair value of the Company’s investment in Credit Fund II has not been categorized within the fair value hierarchy.

137


Table of Contents

The changes in the Company’s investments at fair value for which the Company has used Level 3 inputs to determine fair value and net change in unrealized appreciation (depreciation) included in earnings for Level 3 investments still held are as follows:
Financial Assets
 For the year ended December 31, 2021
 First Lien DebtSecond Lien DebtEquity InvestmentsInvestment Fund - Mezzanine LoanInvestment Fund - Subordinated Loan and Member's InterestTotal
Balance, beginning of year$1,224,063 $284,523 $33,877 $— $205,891 $1,748,354 
Purchases669,737 134,170 47,513 — — 851,420 
Sales(322,486)(22,123)(23,338)— — (367,947)
Paydowns(383,954)(69,770)(585)— (23,000)(477,309)
Accretion of discount7,928 1,424 31 — — 9,383 
Net realized gains (losses)2,413 (125)16,750 — — 19,038 
Net change in unrealized appreciation (depreciation)34,383 13,677 2,845 — 1,250 52,155 
Balance, end of year$1,232,084 $341,776 $77,093 $— $184,141 $1,835,094 
Net change in unrealized appreciation (depreciation) included in earnings related to investments still held at the reporting date included in net change in unrealized appreciation (depreciation) on investments on the Consolidated Statements of Operations$28,184 $13,657 $4,539 $— $1,250 $47,630 
Financial AssetsFinancial Assets
For the year ended December 31, 2017 For the year ended December 31, 2020
First Lien Debt Second Lien Debt Structured Finance Obligations Equity Investments Investment Fund - Mezzanine Loan Total First Lien DebtSecond Lien DebtEquity InvestmentsInvestment Fund - Mezzanine LoanInvestment Fund - Subordinated LoanTotal
Balance, beginning of year$1,139,548
 $171,864
 $5,216
 $6,474
 $62,384
 $1,385,486
Balance, beginning of year$1,663,138 $234,532 $21,698 93,000 111,596 $2,123,964 
Purchases968,783
 175,763
 
 8,818
 135,960
 1,289,324
Purchases340,007 119,638 12,003 63,500 92,500 627,648 
Sales(201,994) (12,377) 
 
 
 (214,371)Sales(465,111)(29,776)(54)(156,500)— (651,441)
Paydowns(371,499) (94,891) (6,147) (346) (112,594) (585,477)Paydowns(253,748)(26,750)(2,003)— — (282,501)
Accretion of discount9,955
 1,792


 11,747
Accretion of discount7,100 1,072 14 — — 8,186 
Net realized gains (losses)(8,240) (360) (3,092) 
 
 (11,692)Net realized gains (losses)(58,766)(228)522 — — (58,472)
Net change in unrealized appreciation (depreciation)(5,277) 4,442
 4,023
 2,560
 
 5,748
Net change in unrealized appreciation (depreciation)(8,557)(13,965)1,697 — 1,795 (19,030)
Balance, end of year$1,531,276
 $246,233
 $
 $17,506
 $85,750
 $1,880,765
Balance, end of year$1,224,063 $284,523 $33,877 $— $205,891 $1,748,354 
Net change in unrealized appreciation (depreciation) included in earnings related to investments still held as of December 31, 2017 included in net change in unrealized appreciation (depreciation) on investments on the Consolidated Statements of Operations$(9,040) $3,672
 $
 $2,560
 
 $(2,808)
Net change in unrealized appreciation (depreciation) included in earnings related to investments still held at the reporting date included in net change in unrealized appreciation (depreciation) on investments on the Consolidated Statements of OperationsNet change in unrealized appreciation (depreciation) included in earnings related to investments still held at the reporting date included in net change in unrealized appreciation (depreciation) on investments on the Consolidated Statements of Operations$(52,388)$(13,666)$1,697 $— $1,795 $(62,562)
 Financial Assets
 For the year ended December 31, 2016
 First Lien Debt Second Lien Debt Structured Finance Obligations Equity Investments Investment Fund - Mezzanine Loan Total
Balance, beginning of year$785,459
 $210,396
 $44,812
 $2,424
 $
 $1,043,091
Purchases594,633
 38,380
 
 2,857
 84,784
 720,654
Sales(77,434) (25,398) (33,327) 
 
 (136,159)
Paydowns(167,699) (57,855) (7,041) 
 (22,400) (254,995)
Accretion of discount4,757
 850
 (31) 
 
 5,576
Net realized gains (losses)(40) 275
 (10,302) 
 
 (10,067)
Net change in unrealized appreciation (depreciation)(128) 5,216
 11,105
 1,193
 
 17,386
Balance, end of year$1,139,548
 $171,864
 $5,216
 $6,474
 $62,384
 $1,385,486
Net change in unrealized appreciation (depreciation) included in earnings related to investments still held as of December 31, 2016 included in net change in unrealized appreciation (depreciation) on investments on the Consolidated Statements of Operations$(1,000) $3,331
 $1,372
 $1,193
 $
 $4,896

The Company generally uses the following framework when determining the fair value of investments that are categorized as Level 3:
Investments in debt securities are initially evaluated to determine whether the enterprise value of the portfolio company is greater than the applicable debt. The enterprise value of the portfolio company is estimated using a market approach and an income approach. The market approach utilizes market value (EBITDA) multiples of publicly traded comparable companies and available precedent sales transactions of comparable companies. The Company carefully considers numerous factors when selecting the appropriate companies whose multiples are used to value its portfolio companies. These factors include, but are not limited to, the type of organization, similarity to the business being valued, relevant risk factors, as well as size, profitability and growth expectations. The income approach typically uses a discounted cash flow analysis of the portfolio company.
138


Table of Contents

Investments in debt securities that do not have sufficient coverage through the enterprise value analysis are valued based on an expected probability of default and discount recovery analysis.
Investments in debt securities with sufficient coverage through the enterprise value analysis are generally valued using a discounted cash flow analysis of the underlying security. Projected cash flows in the discounted cash flow typically represent the relevant security’s contractual interest, fees and principal payments plus the assumption of full principal recovery at the security’s expected maturity date. The discount rate to be used is determined using an average of two market-based methodologies. Investments in debt securities may also be valued using consensus pricing.
Investments in structured finance obligations are generally valued using a discounted cash flow and/or consensus pricing.
Investments in equities are generally valued using a market approach and/or an income approach. The market approach utilizes EBITDAmarket value (EBITDA) multiples of publicly traded comparable companies and available precedent sales transactions of comparable companies. The income approach typically uses a discounted cash flow analysis of the portfolio company.
Investments in theCredit Fund’s mezzanine loan are valued using collateral analysis with expected recovery rate of principal and interest. Investments in Credit Fund’s subordinated loan and member’s interest of the investment fund are valued using the net asset value of the Company’s ownership interest in the investment fund and investments in the mezzanine loan of the investment fund are valued using discounted cash flow analysis with expected repaymentdiscount rate, default rate and recovery rate of principal and interest.
The following tables summarize the quantitative information related to the significant unobservable inputs for Level 3 instruments which are carried at fair value as of December 31, 20172021 and 2016:2020:
 Fair Value asValuation TechniquesSignificant Unobservable InputsRangeWeighted Average
 of December 31, 2021LowHigh
Investments in First Lien Debt$981,627 Discounted Cash FlowDiscount Rate3.90 %14.21 %7.70 %
185,432 Consensus PricingIndicative Quotes90.00 100.00 97.69 
65,025 Income ApproachDiscount Rate11.55 %13.18 %12.24 %
Market ApproachComparable Multiple6.68x8.16x7.53x
Total First Lien Debt1,232,084 
Investments in Second Lien Debt299,664 Discounted Cash FlowDiscount Rate7.11 %15.83 %9.46 %
42,112 Consensus PricingIndicative Quotes97.25 98.00 97.49 
Total Second Lien Debt341,776 
Investments in Equity77,093 Income ApproachDiscount Rate7.22 %11.55 %8.38 %
Market ApproachComparable Multiple8.16x16.43x11.26x
Total Equity Investments77,093 
Investments in Credit Fund
Mezzanine Loan— Collateral AnalysisRecovery Rate— %— %— %
Subordinated Loan and Member's Interest184,141 Discounted Cash FlowDiscount Rate8.50 %8.50 %8.50 %
Discounted Cash FlowDefault Rate3.00 %3.00 %3.00 %
Discounted Cash FlowRecovery Rate65.00 %65.00 %65.00 %
Total Investments in Credit Fund184,141 
Total Level 3 Investments$1,835,094 
139

 Fair Value as Valuation Techniques Significant Unobservable Inputs Range Weighted Average
 of December 31, 2017Low High 
Investments in First Lien Debt$1,369,558
 Discounted Cash Flow Discount Rate 4.85% 17.40% 8.18%
 142,231
 Consensus Pricing Indicative Quotes 59.17
 100.83
 95.93
 19,487
 Income Approach Discount Rate 9.78% 9.78% 9.78%
   Market Approach Comparable Multiple 8.33x
 8.33x
 8.33x
Total First Lien Debt1,531,276
          
Investments in Second Lien Debt211,365
 Discounted Cash Flow Discount Rate 7.61% 18.26% 9.43%
 34,868
 Consensus Pricing Indicative Quotes 96.83
 100.58
 99.23
Total Second Lien Debt246,233
          
Investments in Equity17,506
 Income Approach Discount Rate 7.60% 10.61% 8.81%
   Market Approach Comparable Multiple 7.80x
 14.69x
 10.41x
Total Equity Investments17,506
          
Investments in Investment Fund – Mezzanine Loan85,750
 Income Approach Repayment Rate 100.00% 100.00% 100.00%
Total Investment Fund – Mezzanine Loan85,750
          
Total Level 3 Investments$1,880,765


Fair Value as Valuation Techniques Significant Unobservable Inputs Range Weighted Average Fair Value asValuation TechniquesSignificant
Unobservable
Inputs
RangeWeighted Average
of December 31,
2016
Low High  of December 31, 2020LowHigh
Investments in First Lien Debt$986,695
 Discounted Cash Flow Discount Rate 4.50% 16.33% 7.94%Investments in First Lien Debt$879,159 Discounted Cash FlowDiscount Rate3.96 %16.60 %8.80 %
152,853
 Consensus Pricing Indicative Quotes 40.75
 106.36
 97.29
287,191 Consensus PricingIndicative Quotes89.11 100.00 97.70 
57,713 Income ApproachDiscount Rate12.80 %14.70 %13.50 %
Market ApproachComparable Multiple3.17x6.99x6.43x
Total First Lien Debt1,139,548
      Total First Lien Debt1,224,063 
Investments in Second Lien Debt153,657
 Discounted Cash Flow Discount Rate 7.93% 11.05% 9.75%Investments in Second Lien Debt238,785 Discounted Cash FlowDiscount Rate7.14 %15.27 %9.67 %
16,525
 Consensus Pricing Indicative Quotes 83.17
 100.88
 94.48
45,738 Consensus PricingIndicative Quotes82.88 100.00 87.75 
Total Second Lien DebtTotal Second Lien Debt284,523 
Investments in EquitiesInvestments in Equities33,877 Income ApproachDiscount Rate7.22 %12.80 %8.84 %
Market ApproachComparable Multiple6.99x16.43x10.50x
Total Equity InvestmentsTotal Equity Investments33,877 
Investments in Investment FundInvestments in Investment Fund
Mezzanine LoanMezzanine Loan— Collateral AnalysisRecovery Rate100.00 %100.00 %100.00 %
Subordinated LoanSubordinated Loan205,891.3 Discounted Cash FlowDiscount Rate8.50 %8.50 %8.50 %
1,682
 Income Approach Discount Rate 15.32% 15.32% 15.32%Discounted Cash FlowDefault Rate3.00 %3.00 %3.00 %
  Market Approach Comparable
Multiple
 8.01x
 8.68x
 8.34x
Discounted Cash FlowRecovery Rate65.00 %65.00 %65.00 %
Total Second Lien Debt171,864
      
Investments in Structured Finance Obligations2,761
 Discounted Cash Flow Discount Rate 22.00% 22.00% 22.00%
  Default Rate 1.13
 1.13
 1.13
  Prepayment Rate 35.00
 35.00
 35.00
  Recovery Rate 65.00
 65.00
 65.00
2,455
 Consensus Pricing Indicative Quotes 0.10
 48.79
 48.50
Total Structured Finance Obligations5,216
      
Investments in Equity6,474
 Income Approach Discount Rate 8.68% 10.40% 9.41%
  Market Approach Comparable
Multiple
 7.22x
 13.71x
 11.00x
Total Equity Investments6,474
      
Investments in Investment Fund – Mezzanine Loan62,384
 Income Approach Repayment Rate 100.00% 100.00% 100.00%
Total Investment Fund – Mezzanine Loan62,384
      
Total Investment FundTotal Investment Fund205,891 
Total Level 3 Investments$1,385,486
      Total Level 3 Investments$1,748,354 
The significant unobservable inputs used in the fair value measurement of the Company’s investments in first and second lien debt securities are discount rates, indicative quotes and comparable EBITDA multiples. Significant increases in discount rates in isolation would result in a significantly lower fair value measurement. Significant decreases in indicative quotes or comparable EBITDA multiples in isolation may result in a significantly lower fair value measurement.
The significant unobservable inputs used in the fair value measurement of the Company’s investments in structured finance obligationsequities are discount rates default rates, prepayment rates, recovery rates and indicative quotes.comparable EBITDA multiples. Significant increases in discount rates, default rates or prepayment rates in isolation would result in a significantly lower fair value measurement, while a significant increasemeasurement. Significant decreases in recovery ratescomparable EBITDA multiples in isolation would result in a significantly higherlower fair value.value measurement.
The significant unobservable input used in the fair value measurement of the Company’s investments in the mezzanine loan of Credit Fund are recovery rates of principal and interest. Significant decreases in indicative quotes in isolation mayrecovery rates would result in a significantly lower fair value measurement.
The significant unobservable inputs used in the fair value measurement of the Company’s investments in equitiesthe subordinated loan and member’s interest of Credit Fund are discount rates, default rates and comparable EBITDA multiples.recovery rates. Significant increases in the discount rates or default rates in isolation would result in a significantly lower fair value measurement. SignificantA significant decreases in comparable EBITDA multiplesrecovery rates in isolation would result in a significantly lower fair value measurement.
Financial instruments disclosed but not carried at fair value
The following table presents the carrying value and fair value of the Company’s secured borrowings and senior unsecured notes disclosed but not carried at fair value as of December 31, 20172021 and 2016:2020:
December 31, 2017 December 31, 2016 December 31, 2021December 31, 2020
Carrying Value Fair Value Carrying Value Fair Value Carrying ValueFair ValueCarrying ValueFair Value
Secured borrowings$562,893
 $562,893
 $421,885
 $421,885
Secured borrowings$407,655 $407,655 $347,949 $347,949 
2019 Notes2019 Notes115,000 117,300 115,000 116,250 
2020 Notes2020 Notes75,000 75,530 75,000 75,000 
Total$562,893
 $562,893
 $421,885
 $421,885
Total$597,655 $600,485 $537,949 $539,199 
The carrying values of the secured borrowings and senior notes approximate their respective fair values and are categorized as Level 3 within the hierarchy. Secured borrowings are valued generally using discounted cash flow analysis. The significant

Table of Contents

unobservable inputs used in the fair value measurement of the Company’s secured borrowings and senior unsecured
140


Table of Contents
notes are discount rates. Significant increases in discount rates in isolation would result in a significantly lower fair value measurement.
The following table represents the carrying values (before debt issuance costs) and fair values of the Company’s 2015-12015-1R Notes disclosed but not carried at fair value as of December 31, 20172021 and 2016:2020:
 December 31, 2017 December 31, 2016
 Carrying Value Fair Value Carrying Value Fair Value
Aaa/AAA Class A-1A Notes$160,000
 $160,064
 $160,000
 $160,072
Aaa/AAA Class A-1B Notes40,000
 40,020
 40,000
 39,960
Aaa/AAA Class A-1C Notes27,000
 27,014
 27,000
 26,951
Aa2 Class A-2 Notes46,000
 46,027
 46,000
 45,784
Total$273,000
 $273,125
 $273,000
 $272,767
 December 31, 2021December 31, 2020
2015-1R NotesCarrying ValueFair ValueCarrying ValueFair Value
Aaa/AAA Class A-1-1-R Notes$234,800 $234,941 $234,800 $230,996 
Aaa/AAA Class A-1-2-R Notes50,000 50,075 50,000 49,645 
Aaa/AAA Class A-1-3-R Notes25,000 24,680 25,000 25,017 
AA Class A-2-R Notes66,000 66,003 66,000 64,895 
A Class B Notes46,400 46,430 46,400 45,291 
BBB- Class C Notes27,000 26,714 27,000 24,592 
Total$449,200 $448,843 $449,200 $440,436 
The fair value determination of the Company’s 2015-1 Notesnotes payable was based on the market quotation(s) received from broker/dealer(s). These fair value measurements were based on significant inputs not observable and thus represent Level 3 measurements as defined in the accounting guidance for fair value measurement.
The carrying value of other financial assets and liabilities approximates their fair value based on the short term nature of these items.
4. RELATED PARTY TRANSACTIONS
Investment Advisory Agreement
On April 3, 2013, the Company’s Board of Directors, including a majority of the directors who are not “interested persons” as defined in Section 2(a)(19) of the Investment Company Act (the “Independent Directors”), approved an investment advisory agreement (the “Original Investment Advisory Agreement”) between the Company and the Investment Adviser in accordance with, and on the basis of an evaluation satisfactory to such directors as required by, Section 15(c) of the Investment Company Act. The Original Investment Advisory Agreement was amended on September 15, 2017 and August 6, 2018 after receipt of requisite Board and stockholders' approvals, as applicable (as amended, the “Investment Advisory Agreement”) after the approval of the Company’s Board of Directors, including a majority of the Independent Directors, at an in-person meeting of the Board of Directors held on May 30, 2017 and the approval of the Company’s stockholders at a special meeting of stockholders held on September 15, 2017. The Investment Advisory Agreement was amended, among other things, to (i) reduce the incentive fee payable by the Company to the Investment Adviser from an annual rate of 20% to an annual rate of 17.5%, (ii) delete the incentive fee payment deferral test described below, and (iii) include in the pre-incentive fee net investment income, in the case of investments with a deferred interest feature, accrued income that the Company has not yet received in cash. The initial term of the Investment Advisory Agreement is two years from September 15, 2017 and, unless. Unless terminated earlier, the Investment Advisory Agreement will renewrenews automatically for successive annual periods, provided that such continuance is specifically approved at least annually by the vote of the Board of Directors and by the vote of a majority of the Independent Directors. On May 26, 2021, the Company's Board of Directors, including a majority of the Independent Directors, approved the continuance of the Company's Investment Advisory Agreement with the Adviser for an additional one-year term. Pursuant to relief granted by the SEC in light of the COVID-19 pandemic (the "Order") and a determination by the Board of Directors that reliance on the order was appropriate due to circumstances related to the current or potential side-effects of COVID-19, the May 26 meeting was held by video- and telephone-conference. The Investment Advisory Agreement will automatically terminate in the event of an assignment and may be terminated by either party without penalty upon at least 60 days’ written notice to the other party. Subject to the overall supervision of the Board of Directors, the Investment Adviser provides investment advisory services to the Company. For providing these services, the Investment Adviser receives fees from the Company consisting of two components—a base management fee and an incentive fee.
Effective September 15, 2017, theThe base management fee ishas been calculated and payable quarterly in arrears at an annual rate of 1.50% of the average value of the gross assets at the end of the two most recently completed fiscal quarters, except for the first quarter following the IPO, in which casequarters; provided, however, effective July 1, 2018, the base management fee is calculated based onat an annual rate of 1.00% of the Company’saverage value of the gross assets as of the end of such fiscal quarter. In each case, the two most recently completed calendar quarters that exceeds the product of (A) 200% and (B) the average value of the Company’s net asset value at the end of the two most recently completed calendar quarters. The base management fee will be appropriately adjusted for any share issuances or repurchases during such fiscal quarter and the base management fees for any partial month or quarter will be pro-rated. The Company’s gross assets exclude any cash and cash equivalents and include assets acquired through the incurrence of debt from the use of the SPV Credit Facility, Credit Facility and 2015-1 Notes (see Note 6, Borrowings, and Note 7, 2015-1 Notes). Forleverage.For purposes of this calculation, cash and cash equivalents include any temporary investments in cash-equivalents, U.S. government securities and other high quality investment grade debt investments that mature in 12 months or less from the date of investment.
Prior to September 15, 2017, under the Original Investment Advisory Agreement, the base management fee was calculated and payable quarterly in arrears at an annual rate of 1.50% of the average daily gross assets of the Company for the
141


period adjusted for share issuances or repurchases. Prior to the IPO, the Investment Adviser waived its right to receive one-third (0.50%) of the 1.50% base management fee. Any waived base management fees are not subject to recoupment by the Investment Adviser. The fee waiver terminated when the IPO had been consummated. As previously disclosed, in connection with the IPO, the Investment Adviser agreed to continue the fee waiver until the completion of the first full quarter after the consummation of the IPO. As a result, beginning October 1, 2017, the base management fee is calculated at an annual rate of 1.50% of the Company’s gross assets.
The incentive fee has two parts. The first part is calculated and payable quarterly in arrears based on the pre-incentive fee net investment income for the immediately preceding calendar quarter. The second part is determined and payable in arrears based on capital gains as of the end of each calendar year.
Pre-incentive fee net investment income means interest income, dividend income and any other income (including any other fees (other than fees for providing managerial assistance), such as commitment, origination, structuring, diligence and consulting fees or other fees that the Company receives from portfolio companies) accrued during the calendar quarter, minus the operating expenses accrued for the quarter (including the base management fee, expenses payable under the administration agreement, and any interest expense or fees on any credit facilities or outstanding debt and dividends paid on any issued and outstanding preferred stock, but excluding the incentive fee). Pre-incentive fee net investment income includes, in the case of investments with a deferred interest feature, accrued income that the Company has not yet received in cash. Pre-incentive fee net investment income does not include any realized capital gains, realized capital losses or unrealized capital appreciation or depreciation.
Effective September 15, 2017, pre-incentivePre-incentive fee net investment income, expressed as a rate of return on the value of ourthe Company’s net assets at the end of the immediately preceding calendar quarter, will behas been compared to a “hurdle rate” of 1.50% per quarter (6% annualized) or a “catch-up rate” of 1.82% per quarter (7.28% annualized), as applicable.
Pursuant to the Investment Advisory Agreement, the Company pays its Investment Adviser an incentive fee with respect to its pre-incentive fee net investment income in each calendar quarter as follows:
 
no incentive fee based on pre-incentive fee net investment income in any calendar quarter in which its pre-incentive fee net investment income does not exceed the hurdle rate of 1.50%;
100% of pre-incentive fee net investment income with respect to that portion of such pre-incentive fee net investment income, if any, that exceeds the hurdle rate but is less than 1.82% in any calendar quarter (7.28% annualized). The Company refers to this portion of the pre-incentive fee net investment income (which exceeds the hurdle rate but is less than 1.82%) as the “catch-up.” The “catch-up” is meant to provide the Investment Adviser with approximately 17.5% of the Company’s pre-incentive fee net investment income as if a hurdle rate did not apply if this net investment income exceeds 1.82% in any calendar quarter; and
17.5% of the amount of pre-incentive fee net investment income, if any, that exceeds 1.82% in any calendar quarter (7.28% annualized) will be payable to the Investment Adviser. This reflects that once the hurdle rate is reached and the catch-up is achieved, 17.5% of all pre-incentive fee investment income thereafter is allocated to the Investment Adviser.
The second part of the incentive fee is determined and payable in arrears as of the end of each calendar year (or upon termination of the Investment Advisory Agreement, as of the termination date), and equals 17.5% of realized capital gains, if any, on a cumulative basis from inception through the date of determination, computed net of all realized capital losses on a cumulative basis and unrealized capital depreciation, less the aggregate amount of any previously paid capital gain incentive fees, provided that, the incentive fee determined at the end of the first calendar year of operations may be calculated for a period of shorter than twelve calendar months to take into account any realized capital gains computed net of all realized capital losses on a cumulative basis and unrealized capital depreciation.
Prior to September 15, 2017, under the Original Investment Advisory Agreement, pre-incentive fee net investment income, which did not include, in the case of investments withBelow is a deferred interest feature, accrued income that the Company has not yet received in cash, and was expressed as a rate of return on the average daily Hurdle Calculation Value (as defined below) throughout the immediately preceding calendar quarter, was compared to a “hurdle rate” of 1.50% per quarter (6% annualized) or a “catch-up” of 1.875% per quarter (7.50% annualized), as applicable. “Hurdle Calculation Value” meant, on any given day, the sum of (x) the value of net assets assummary of the end of the calendar quarter immediately preceding such day plus (y) the aggregate amount of capital drawn from investors (or reinvested in the Company pursuant to a dividend reinvestment plan) from the beginning of the current quarter to such day minus (z) the aggregate amount of distributions (including share


repurchases) made by the Company from the beginning of the current quarter to such day, but only to the extent such distributions were not declaredbase management fees and accounted for on the books and records in a previous quarter. In addition, under the Original Investment Advisory Agreement, the Company deferred payment of any incentive fee otherwise earned by the Investment Adviser if, during the most recent four full calendar quarter periods ending on or prior to the date such payment is to be made, the sum of (a) the aggregate distributions to stockholders and (b) the change in net assets (defined as gross assets less indebtedness and before taking into account any incentive fees payableincurred during the period) is less than 6.0% of net assets (defined as gross assets less indebtedness) at the beginning of such period. These calculations were adjusted for any share issuances or repurchases. Any deferred incentive fees were carried over for payment in subsequent calculation periods.
As previously disclosed, in connection with the IPO, the Investment Adviser agreed to charge 17.5% instead of 20% with respect to, or effectively waive 2.5% from, the entire calculation of the incentive fee beginning on the first full quarter following the consummation of the IPO until the earlier of (i) October 1, 2017 and (ii) the date that the Company’s stockholders vote on the approval of the amendment to the Original Investment Advisory Agreement. The Company’s stockholders voted to approve the Investment Advisory Agreement on September 15, 2017.
For the years ended December 31, 2017, 20162021, 2020 and 2015, base management fees were $19,327, $12,359 and $8,907, respectively (net2019.
For the years ended December 31,
202120202019
Base management fees$28,343 $28,648 $31,316 
Incentive fees on pre-incentive fee net investment income17,680 18,555 22,872 
Realized capital gains incentive fees— — — 
Accrued capital gains incentive fees— — — 
Total capital gains incentive fees— — — 
Total incentive fees17,680 18,555 22,872 
Total base management fees and incentive fees$46,023 $47,203 $54,188 
142


Table of waiver of $5,927, $6,180 and $4,454, respectively), incentive fees related to pre-incentive fee net investment income were $21,084, $14,905 and $8,881, respectively, and there were no incentive fees related to realized capital gains. For the years ended December 31, 2017, 2016 and 2015, there were no accruedContents
Accrued capital gains incentive fees are based upon the cumulative net realized and unrealized appreciation (depreciation). The from inception. Accordingly, the accrual for any capital gains incentive fee under USU.S. GAAP in a given period may result in an additional expense if such cumulative amount is greater than in the prior period or a reduction of previously recorded expense if such cumulative amount is less than in the prior period. If such cumulative amount is negative, then there is no accrual.

As of December 31, 20172021 and 2016, $13,0982020, $11,819 and $8,157,$11,549, respectively, was included in base management and incentive fees payable in the accompanying Consolidated Statements of Assets and Liabilities.

On April 3, 2013, the Investment Adviser entered into a personnel agreement with The Carlyle Group Employee Co., L.L.C. (“Carlyle Employee Co.”), an affiliate of the Investment Adviser, pursuant to which Carlyle Employee Co. provides the Investment Adviser with access to investment professionals.
Administration Agreement
On April 3, 2013, the Company’s Board of Directors approved an administration agreement (the “Administration Agreement”) between the Company and the Administrator.Administration Agreement. Pursuant to the Administration Agreement, the Administrator provides services and receives reimbursements equal to an amount that reimburses the Administrator for its costs and expenses and the Company’s allocable portion of overhead incurred by the Administrator in performing its obligations under the Administration Agreement, including the Company’s allocable portion of the compensation paid to or compensatory distributions received by the Company’s officers (including the Chief Financial Officer, Chief Compliance Officer and Chief Financial Officer)Treasurer) and respective staff who provide services to the Company, operations staff who provide services to the Company, and any internal audit staff, to the extent internal audit performs a role in the Company’s Sarbanes-Oxley Act of 2002, as amended (the “Sarbanes-Oxley Act”), internal control assessment. Reimbursement under the Administration Agreement occurs quarterly in arrears.
The initial term of the Administration Agreement is two years from April 3, 2013 and, unlessUnless terminated earlier, the Administration Agreement will renewrenews automatically for successive annual periods, provided that such continuance is specifically approved at least annually by (i) the vote of the Board of Directors or by a majority vote of the outstanding voting securities of the Company and (ii) the vote of a majority of the Company’s Independent Directors. On March 20, 2017,May 26, 2021, the Company’s Board of Directors, including a majority of the Independent Directors, approved the continuance of the Administration Agreement for a one year period. The Administration Agreement may not be assigned by a party without the consent of the other party and may be terminated by either party without penalty upon at least 60 days’ written notice to the other party.
For the years ended December 31, 2017, 20162021, 2020 and 2015,2019, the Company incurred $661, $703$1,338, $679 and $595,$539, respectively, in fees under the Administrative Agreement, which were included in administrative service fees in the accompanying Consolidated Statements of Operations. As of December 31, 20172021 and 2016, $952020, $482 and $137,$85, respectively, was unpaid and included in administrative service fees payable in the accompanying Consolidated Statements of Assets and Liabilities.


Sub-Administration Agreements
On April 3, 2013, the Administrator entered into a sub-administration agreementsagreement with Carlyle Employee Co. and CELF Advisors LLP (“CELF”) (the “Carlyle Sub-Administration Agreements”Agreement”). Pursuant to the Carlyle Sub-Administration Agreements,Agreement, Carlyle Employee Co. and CELF provideprovides the Administrator with access to personnel.
On April 3, 2013, the Administrator entered into a sub-administration agreement with State Street Bank and Trust Company (“State Street”Street and, such agreement, the “State"State Street Sub-Administration Agreement” and, together with the Carlyle Sub-Administration Agreements,Agreement, the “Sub-Administration Agreements”). On March 11, 2015, the Company’s Board of Directors, including a majority of the Independent Directors, approved an amendment to the State Street Sub-Administration Agreement. The initial term of the State Street Sub-Administration Agreement ends on April 1, 2017 and, unlessUnless terminated earlier, the State Street Sub-Administration Agreement will renew automatically for successive annual periods, provided that such continuance is specifically approved at least annually by (i) the vote of the Board of Directors or by the vote of a majority of the outstanding voting securities of the Company and (ii) the vote of a majority of the Company’s Independent Directors. On May 26, 2021, the Company’s Board of Directors, including a majority of the Independent Directors, approved the continuance of the State Street Sub-Administration Agreement for a one year period. The State Street Sub-Administration Agreement may be terminated upon at least 60 days’ written notice and without penalty by the vote of a majority of the outstanding securities of the Company, or by the vote of the Board of Directors or by either party to the State Street Sub-Administration Agreement.
For the years ended December 31, 2017, 20162021, 2020 and 2015,2019, fees incurred in connection with the State Street Sub-Administration Agreement, which amounted to $725, $602$684, $659 and $486,$755, respectively, were included in other general and administrative in the accompanying Consolidated Statements of Operations. As of December 31, 20172021 and 2016, $1962020, $682 and $159,
143


Table of Contents
$334, respectively, was unpaid and included in other accrued expenses and liabilities in the accompanying Consolidated Statements of Assets and Liabilities.
Placement FeesLicense Agreement
On April 3, 2013, theThe Company has entered into a placement fee arrangementroyalty free license agreement with TCG Securities, L.L.C. (“TCG”),CIM, which wholly owns our Adviser and is a licensed broker-dealerwholly owned subsidiary of Carlyle, pursuant to which CIM has granted the Company a non-exclusive, revocable and an affiliate ofnon-transferable license to use the Investment Adviser, which may require stockholders to pay a placement fee to TCG for TCG’s services. At the time of the IPO, the placement fee arrangement with TCG was automatically terminated.
For the years ended December 31, 2017, 2016name and 2015, TCG earned placement fees of $19, $12 and $6, respectively, from the Company’s stockholders in connection with the issuance or sale of the Company’s common stock prior to the IPO.mark “Carlyle.”
Board of Directors
The Company’s Board of Directors currently consists of fiveseven members, threefive of whom are Independent Directors. On April 3, 2013, the Board of Directors established an Audit Committee consisting of its Independent Directors. The Board of Directors alsohas established an Audit Committee, a Pricing Committee, of the Board of Directors, a Nominating and Governance Committee of the Board of Directors and a Compensation Committee, the members of each of which consist entirely of the Company’s Independent Directors. The Board of Directors and may establish additional committees in the future. For the years ended December 31, 2017, 20162021, 2020 and 2015,2019, the Company incurred $443, $553$561, $398 and $419,$353, respectively, in fees and expenses associated with its Independent Directors' services on the Company's Board of Directors and Audit Committee.the it’s committees. As of December 31, 20172021 and 2016, $252020, $142 and $0,$96, respectively, was unpaidin fees or expenses associated with its Independent Directors were payable, and included in other accrued expenses and liabilities in the accompanying Consolidated Statements of Assets and Liabilities.
Transactions with Credit FundInvestment Funds
During the years ended December 31, 20172021, 2020 and 2016,2019, the Company sold 178, 4 and 2 investments, respectively, to Credit Fund for proceeds of $135,466$118,204, $62,754 and $39,838,$34,728, respectively, and realized gains of $190$1,075, $(2,289) and $0,$208, respectively. See Note 5, Middle Market Credit Fund, LLC, to these consolidated financial statements.
During the year ended December 31, 2021, the Company sold 17 investments to Credit Fund II for proceeds of $84,554 and realized gains (losses) of $468. The Company did not sell any investments to Credit Fund II during the years ended December 31, 2020 and 2019. On November 3, 2020, pursuant to a contribution agreement by and between the Company and Credit Fund II, the Company contributed 45 senior secured debt investments with an aggregate principal balance of approximately $250 million to Credit Fund II in exchange for approximately 84.13% of Credit Fund II’s membership interests and gross cash proceeds of approximately $170 million. There were no subsequent transfers through December 31, 2020. See Note 6, Middle Market Credit Fund II, LLC, for further information about Credit Fund.Fund II.
Transactions with Carlyle
On May 5, 2020, the Company issued and sold 2,000,000 shares of the Preferred Stock to an affiliate of Carlyle in a private placement at a price of $25 per share. See Note 10, Net Assets, for further information about the Preferred Stock.
In December 2020, the Company paid an affiliate of Carlyle a fee for underwriting services rendered in connection with the issuance of the 2020 Notes in the amount of 0.75% of the aggregate principal amount of the 2020 Notes. See Note 8, Notes Payable, for further information about the 2020 Notes.
5. MIDDLE MARKET CREDIT FUND, LLC
Overview
On February 29, 2016, the Company and Credit Partners entered into an amended and restated limited liability company agreement, which was subsequently amended and restated on June 24, 2016 and February 22, 2021 (as amended, the Limited"Limited Liability Company AgreementAgreement") to co-manage Credit Fund, an unconsolidateda Delaware limited liability company.company that is not consolidated in the Company’s consolidated financial statements. Credit Fund primarily invests in first lien loans of middle market companies. Credit Fund is managed by a six-member board of managers, on which the Company and Credit Partners each have equal representation. Establishing a quorum for Credit Fund’s board of managers requires at least four members to be present at a meeting, including at least two of the Company’s representatives and two of Credit Partners’


representatives. The Company and Credit Partners each have 50% economic ownership of Credit Fund and have commitments to fund, from time to time, capital of up to $400,000$250,000 each. Funding of such commitments generally requires the approval of the board of Credit Fund, including the board members appointed by the Company. By virtue of its membership interest, the Company and Credit Partners each indirectly bear an allocable share of all expenses and other obligations of Credit Fund.
144


Table of Contents
Together with Credit Partners, the Company co-invests through Credit Fund. Investment opportunities for Credit Fund are sourced primarily by the Company and its affiliates. Portfolio and investment decisions with respect to Credit Fund must be unanimously approved by a quorum of Credit Fund’s investment committee consisting of an equal number of representatives of the Company and Credit Partners. Therefore, although the Company owns more than 25% of the voting securities of Credit Fund, the Company does not believe that it has control over Credit Fund (other than for purposes of the Investment Company Act). Middle Market Credit Fund SPV, LLC (the “Credit(“Credit Fund Sub”) and, MMCF CLO 2017-1 LLC (the “2017-1 Issuer”), MMCF CLO 2019-2, LLC (the “2019-2 Issuer”) and MMCF Warehouse II, LLC (“Credit Fund Warehouse II”), each a Delaware limited liability company, were formed on April 5, 2016, and October 6, 2017, November 26, 2018 and August 16, 2019, respectively. Credit Fund Sub, the 2019-2 Issuer, and the 2017-1 IssuerCredit Fund Warehouse II are wholly owned subsidiaries of Credit Fund and are consolidated in Credit Fund’s consolidated financial statements commencing from the date of their respective formations. In December 2020, the 2017-1 Notes, as defined below, were redeemed in full and notes outstanding were repaid in full. In August 2021, the 2019-2 Notes, as defined below, were redeemed in full and notes outstanding were repaid in full. Credit Fund Sub and the 2017-1 IssuerCredit Fund Warehouse II primarily invest in first lien loans of middle market companies. Credit Fund and its wholly owned subsidiaries follow the same Internal Risk Rating System as the Company.
Refer to “Debt” below in this Note 5 for discussion regarding the credit facilities entered into and the notes issued by such wholly-owned subsidiaries.
Credit Fund, the Company and Credit Partners entered into an administration agreement with CGCA,Carlyle Global Credit Administration L.L.C., the administrative agent of Credit Fund (in such capacity, the “Administrative“Credit Fund Administrative Agent”), pursuant to which the Credit Fund Administrative Agent is delegated certain administrative and non-discretionary functions, is authorized to enter into sub-administration agreements at ourthe expense of Credit Fund with the approval of the board of managers of Credit Fund, and is reimbursed by Credit Fund for its costs and expenses and Credit Fund’s allocable portion of overhead incurred by the Credit Fund Administrative Agent in performing its obligations thereunder.
Selected Financial Data
Since inception of Credit Fund and through December 31, 20172021 and 2016,2020, the Company and Credit Partners each made capital contributions of $1 and $1 in members’ equity, respectively, and $86,500$216,000 and $35,000, respectively,$216,000 in subordinated loans, respectively, to Credit Fund. On May 25, 2021, the Company and Credit Partners received an aggregate return of capital on the subordinated loans of $46,000, of which the Company received $23,000. Below is certain summarized consolidated information for Credit Fund as of December 31, 2021 and 2020.
As of December 31,
20212020
ASSETS
Investments, at fair value (amortized cost of $940,092 and $1,080,538, respectively)$926,959 $1,056,381 
Cash and cash equivalents(1)
54,041 119,796 
Other assets7,698 7,553 
Total assets$988,698 $1,183,730 
LIABILITIES AND MEMBERS’ EQUITY
Secured borrowings$600,651 $514,261 
Notes payable, net of unamortized debt issuance costs of $0 and $1,559, respectively)— 253,933 
Other liabilities19,828 15,543 
Subordinated loans and members’ equity (2)
368,219 399,993 
Total liabilities and members’ equity$988,698 $1,183,730 
(1) As of December 31, 20172021 and 2016,2020, $10,816 and $83,574, respectively, of Credit Fund had net borrowings of $85,750Fund’s cash and $62,384, respectively, in mezzanine loans under a revolving credit facility with the Company (the “Credit Fund Facility”).cash equivalents was restricted.
(2) As of December 31, 20172021 and 2016, Credit Fund had2020, the fair value of the Company's ownership interest in the subordinated loans and members’ capitalmembers' equity was $184,141 and $205,891, respectively.
145


Table of $173,532 and $74,547, respectively. As of December 31, 2017 and 2016, the Company’s ownership interest in such subordinated loans and members’ capital was $86,766 and $37,273, respectively, and in such mezzanine loans was $85,750 and $62,384, respectively.Contents
As of December 31, 2017 and 2016, Credit Fund held cash and cash equivalents totaling $19,502 and $6,103, respectively.
As of December 31, 2017 and 2016, Credit Fund had total investments at fair value of $984,773 and $437,829, respectively, which was comprised of first lien senior secured loans and second lien senior secured loans to 51 and 28 portfolio companies, respectively. As of December 31, 2017 and 2016, no loans in Credit Fund’s portfolio were on non-accrual status or contained PIK provisions. All investments in the portfolio were floating rate debt investments with an interest rate floor. The portfolio companies in Credit Fund are U.S. middle market companies in industries similar to those in which the Company may invest directly. Additionally, as of December 31, 2017 and 2016, Credit Fund had commitments to fund various undrawn revolvers and delayed draw investments to its portfolio companies totaling $72,458 and $30,361, respectively.
For the Years Ended December 31,
20212020
Total investment income$68,397 $83,476 
Expenses
Interest and credit facility expenses21,763 40,238 
Other expenses1,992 2,034 
Total expenses23,755 42,272 
Net investment income (loss)44,642 41,204 
Net realized gain (loss) on investments(1,440)— 
Net change in unrealized appreciation (depreciation) on investments11,024 (12,839)
Net increase in members’ equity resulting from operations$54,226 $28,365 
Below is a summary of Credit Fund’s portfolio, followed by a listing of the loans in Credit Fund’s portfolio as of December 31, 20172021 and 2016:2020:
As of December 31,
 20212020
Senior secured loans (1)
$942,930 $1,084,491 
Weighted average yields of senior secured loans based on amortized cost (2)
6.04 %6.03 %
Weighted average yields of senior secured loans based on fair value (2)
6.09 %6.15 %
Number of portfolio companies in Credit Fund45 54 
Average amount per portfolio company (1)
$20,954 $20,083 
Number of loans on non-accrual status— — 
Fair value of loans on non-accrual status$— $— 
Percentage of portfolio at floating interest rates (3) (4)
100.0 %97.7 %
Percentage of portfolio at fixed interest rates (4)
— %2.3 %
Fair value of loans with PIK provisions$— $24,113 
Percentage of portfolio with PIK provisions (4)
— %2.3 %
 As of December 31,
2017
As of December 31,
2016
Senior secured loans (1)
$993,380
$439,086
Weighted average yields of senior secured loans based on amortized cost (2)
6.80%6.47%
Weighted average yields of senior secured loans based on fair value (2)
6.79%6.41%
Number of portfolio companies in Credit Fund51
28
Average amount per portfolio company (1)
$19,478
$15,682
(1)At par/principal amount.
(2)Weighted average yields include the effect of accretion of discounts and amortization of premiums and are based on interest rates as of December 31, 2017 and 2016. Weighted average yield on debt and income producing securities at

(1)At par/principal amount.

accretion of discounts and amortization of premiums and are based on interest rates as of December 31, 2021 and 2020. Weighted average yield on debt and income producing securities at fair value is computed as (a) the annual stated interest rate or yield earned plus the net annual amortization of OID and market discount earned on accruing debt included in such securities, divided by (b) total first lien and second lien debt at fair value included in such securities. Weighted average yield on debt and income producing securities at amortized cost is computed as (a) the annual stated interest rate or yield earned plus the net annual amortization of OID and market discount earned on accruing debt included in such securities, divided by (b) total first lien and second lien debt at amortized cost included in such securities. Actual yields earned over the life of each investment could differ materially from the yields presented above.
(3)Floating rate debt investments are generally subject to interest rate floors.
(4)Percentages based on fair value.
146


Table of Contents

Consolidated Schedule of Investments as of December 31, 2021
Investments (1)
FootnotesIndustry
Reference Rate & Spread (2)
Interest Rate (2)
Maturity DatePar/ Principal Amount
Amortized Cost (4)
Fair Value (5)
First Lien Debt (100.% of fair value)
ACR Group Borrower, LLC^+(2)(3)(6)Aerospace & DefenseL + 4.25%5.50%3/31/2028$34,477 $33,913 $34,477 
Acrisure, LLC+#(2)(3)Banking, Finance, Insurance & Real EstateL + 3.50%3.78%2/13/202725,376 25,353 25,203 
Acrisure, LLC+(2)(3)Banking, Finance, Insurance & Real EstateL + 4.25%4.75%2/13/20276,700 6,650 6,687 
Analogic Corporation^+(2)(3)(6)Capital EquipmentL + 5.25%6.25%6/22/202419,796 19,781 19,587 
Anchor Packaging, Inc.+#(2)(3)Containers, Packaging & GlassL + 4.00%4.10%7/18/202624,472 24,385 24,215 
API Technologies Corp.+#(2)(3)Aerospace & DefenseL + 4.25%4.35%5/9/202614,625 14,575 14,251 
Aptean, Inc.+#(2)(3)SoftwareL + 4.25%4.35%4/23/202612,157 12,113 12,087 
Avalign Technologies, Inc.+#(2)(3)Healthcare & PharmaceuticalsL + 4.50%4.63%12/22/202514,443 14,354 14,320 
Avenu Holdings, LLC+(2)(3)Sovereign & Public FinanceL + 5.25%6.25%9/28/202423,350 23,350 23,350 
BMS Holdings III Corp.+(2)(3)Construction & BuildingL + 5.50%6.50%9/30/202611,244 11,143 11,071 
Chartis Holding, LLC+(2)(3)(6)Business ServicesL + 5.50%6.50%5/1/20256,964 6,964 6,964 
Chemical Computing Group ULC (Canada)^+(2)(3)(6)SoftwareL + 4.50%5.50%8/30/202413,912 13,480 13,845 
Chudy Group, LLC^+(2)(3)(6)Healthcare & PharmaceuticalsL + 5.75%6.75%6/30/202733,021 32,465 33,657 
Diligent Corporation^+(2)(3)(6)TelecommunicationsL + 6.25%7.25%8/4/20259,049 8,816 9,228 
Divisions Holding Corporation+#(2)(3)Business ServicesL + 4.75%5.50%5/27/202824,938 24,706 24,953 
DTI Holdco, Inc.+(2)(3)High Tech IndustriesL + 4.75%5.75%9/30/202318,495 18,442 18,237 
Eliassen Group, LLC+(2)(3)Business ServicesL + 4.50%4.60%11/5/202415,159 15,103 15,152 
EPS Nass Parent, Inc.^+(2)(3)(6)Utilities: ElectricL + 5.75%6.75%4/19/202832,846 32,169 32,507 
EvolveIP, LLC^+(2)(3)(6)TelecommunicationsL + 5.50%6.50%6/7/202540,196 40,126 39,973 
Exactech, Inc.+#(2)(3)Healthcare & PharmaceuticalsL + 3.75%4.75%2/14/202521,307 21,221 21,073 
Excel Fitness Holdings, Inc.+#(2)(3)Hotel, Gaming & LeisureL + 5.25%6.25%10/7/202524,500 24,336 24,500 
Frontline Technologies Holdings, LLC+(2)(3)SoftwareL + 5.25%6.25%9/18/202314,736 14,269 14,736 
GSM Acquisition Corp.^+(2)(3)(6)Hotel, Gaming & LeisureL + 5.00%6.00%11/16/202625,623 25,331 25,396 
Heartland Home Services, Inc+(2)(3)(6)Consumer ServicesL + 6.00%7.00%12/15/202617,664 17,664 17,735 
HMT Holding Inc.^+(2)(3)(6)Energy: Oil & GasL + 5.75%6.75%11/17/202332,484 32,245 31,086 
Integrity Marketing Acquisition, LLC^+(2)(3)(6)Banking, Finance, Insurance & Real EstateL + 5.50%6.25%8/27/202532,853 32,309 32,403 
Jensen Hughes, Inc.+(2)(3)(6)Utilities: ElectricL + 4.50%5.50%3/22/202434,392 34,347 33,395 
K2 Insurance Services, LLC+(2)(3)(6)Banking, Finance, Insurance & Real EstateL + 5.00%6.00%7/1/202612,929 12,929 12,906 
KAMC Holdings, Inc.+#(2)(3)Energy: ElectricityL + 4.00%4.18%8/14/202613,685 13,638 11,450 
KBP Investments, LLC+(2)(3)(6)Beverage, Food & TobaccoL + 5.00%5.75%5/25/202736,973 36,599 36,570 
Odyssey Logistics & Technology Corp.+#(2)(3)Transportation: CargoL + 4.00%5.00%10/12/20249,605 9,580 9,509 
Output Services Group^+(2)(3)Media: Advertising, Printing & PublishingL + 4.50%5.50%3/27/202419,222 19,194 16,467 
Premise Health Holding Corp.+#(2)(3)Healthcare & PharmaceuticalsL + 3.50%3.72%7/10/202513,445 13,409 13,419 
147

Consolidated Schedule of Investments as of December 31, 2017
Investments (1)
Industry Interest Rate  Maturity Date Par/ Principal Amount 
Amortized Cost (5)
 
Fair Value (6)
First Lien Debt (99.39% of fair value)           
Acrisure, LLC (2)(3)(4)(11)
Banking, Finance, Insurance & Real Estate L + 4.25% (1.00% Floor) 11/22/2023 $21,097
 $21,055
 $21,291
Advanced Instruments, LLC (2)(3)(4)(7)(10)(11)(13)
Healthcare & Pharmaceuticals L + 5.25% (1.00% Floor) 10/31/2022 11,910
 11,793
 11,910
Alpha Packaging Holdings, Inc. (2)(3)(4)(13)
Containers, Packaging & Glass L + 4.25% (1.00% Floor) 5/12/2020 16,860
 16,812
 16,860
AM Conservation Holding Corporation (2)(3)(4)(13)
Energy: Electricity L + 4.50% (1.00% Floor) 10/31/2022 38,700
 38,433
 38,553
AMS Finco, S.A.R.L. (Alexander Mann Solutions) (United Kingdom) (2)(3)(4)(11)(13)
Business Services L + 5.50% (1.00% Floor) 5/26/2024 24,875
 24,646
 24,875
Anaren, Inc. (2)(3)(4)
Telecommunications L + 4.50% (1.00% Floor) 2/18/2021 9,993
 9,971
 9,993
AQA Acquisition Holding, Inc. (2)(3)(4)(7)(10)(13)
High Tech Industries L + 4.50% (1.00% Floor) 5/24/2023 27,403
 27,288
 27,403
Big Ass Fans, LLC (2)(3)(4)(13)
Capital Equipment L + 4.25% (1.00% Floor) 5/21/2024 8,000
 7,964
 8,010
Borchers, Inc. (2)(3)(4)(7)(10)(13)
Chemicals, Plastics & Rubber L + 4.50% (1.00% Floor) 11/1/2024 15,748
 15,694
 15,665
Brooks Equipment Company, LLC (2)(3)(4)(13)
Construction & Building L + 5.00% (1.00% Floor) 8/29/2020 7,061
 7,045
 7,061
DBI Holding LLC (2)(3)(4)(11)(13)
Transportation: Cargo L + 5.25% (1.00% Floor) 8/1/2021 19,800
 19,659
 19,833
DecoPac, Inc. (2)(3)(4)(7)(10)(13)
Non-durable Consumer Goods L + 4.25% (1.00% Floor) 9/29/2024 13,414
 13,270
 13,415
Dent Wizard International Corporation (2)(3)(4)(11)
Automotive L + 4.75% (1.00% Floor) 4/7/2020 24,502
 24,382
 24,475
DTI Holdco, Inc. (2)(3)(4)(11)(13)
High Tech Industries L + 5.25% (1.00% Floor) 9/30/2023 19,750
 19,575
 19,663
EIP Merger Sub, LLC (Evolve IP) (2)(3)(4)(8)(11)(13)
Telecommunications L + 6.25% (1.00% Floor) 6/7/2022 22,663
 22,127
 22,153
EIP Merger Sub, LLC (Evolve IP) (2)(3)(9)(11)(13)
Telecommunications L + 6.25% (1.00% Floor) 6/7/2022 1,500
 1,462
 1,470
Empower Payments Acquisitions, Inc. (2)(3)(4)(13)
Media: Advertising, Printing & Publishing L + 5.50% (1.00% Floor) 11/30/2023 17,325
 17,018
 17,325
FCX Holdings Corp. (2)(3)(4)(11)
Capital Equipment L + 4.50% (1.00% Floor) 8/4/2020 18,491
 18,438
 18,512
Golden West Packaging Group LLC (2)(3)(4)(11)(13)
Containers, Packaging & Glass L + 5.25% (1.00% Floor) 6/20/2023 20,895
 20,709
 20,895
HMT Holding Inc. (2)(3)(4)(7)(10)(13)
Energy: Oil & Gas L + 4.50% (1.00% Floor) 11/17/2023 35,062
 34,387
 34,709
J.S. Held LLC (2)(3)(4)(7)(10)(13)
Banking, Finance, Insurance & Real Estate L + 5.50% (1.00% Floor) 9/27/2023 18,204
 18,018
 18,144
Jensen Hughes, Inc. (2)(3)(4)(7)(10)(11)(13)
Utilities: Electric L + 5.00% (1.00% Floor) 12/4/2021 20,963
 20,784
 20,963
Kestra Financial, Inc. (2)(3)(4)(13)
Banking, Finance, Insurance & Real Estate L + 5.25% (1.00% Floor) 6/24/2022 17,206
 17,009
 17,203
Mold-Rite Plastics, LLC (2)(3)(4)(11)
Chemicals, Plastics & Rubber L + 4.50% (1.00% Floor) 12/14/2021 15,000
 14,946
 14,993
MSHC, Inc. (2)(3)(4)(13)
Construction & Building L + 4.25% (1.00% Floor) 7/31/2023 10,000
 9,957
 10,032
North American Dental Management, LLC (2)(3)(4)(7)(10)(11)(13)
Healthcare & Pharmaceuticals L + 5.00% (1.00% Floor) 7/7/2023 23,978
 23,157
 23,577
North Haven CA Holdings, Inc. (CoAdvantage) (2)(3)(4)(7)(10)(13)
Business Services L + 4.50% (1.00% Floor) 10/2/2023 31,565
 31,237
 31,436
Odyssey Logistics & Technology Corporation (2)(3)(4)(11)(13)
Transportation: Cargo L + 4.25% (1.00% Floor) 10/12/2024 20,000
 19,906
 19,998
PAI Holdco, Inc. (Parts Authority) (2)(3)(4)(7)(10)(11)(13)
Automotive L + 4.75% (1.00% Floor) 12/30/2022 16,564
 16,459
 16,515
Paradigm Acquisition Corp. (2)(3)(4)(13)
Business Services L + 4.25% (1.00% Floor) 10/12/2024 23,500
 23,445
 23,554
Pasternack Enterprises, Inc. (Infinite RF) (2)(3)(4)(11)
Capital Equipment L + 5.00% (1.00% Floor) 5/27/2022 20,228
 20,134
 20,174
Premier Senior Marketing, LLC (2)(3)(4)(11)(13)
Banking, Finance, Insurance & Real Estate L + 5.00% (1.00% Floor) 7/1/2022 11,675
 11,606
 11,628
PSI Services LLC (2)(3)(4)(7)(10)(11)(13)
Business Services L + 5.00% (1.00% Floor) 1/20/2023 30,676
 30,171
 30,082
Q Holding Company (2)(3)(4)(13)
Automotive L + 5.00% (1.00% Floor) 12/18/2021 17,277
 17,227
 17,277
QW Holding Corporation (Quala) (2)(3)(4)(7)(10)(11)(13)
Environmental Industries L + 6.75% (1.00% Floor) 8/31/2022 11,453
 10,879
 10,933
Radiology Partners, Inc. (2)(3)(4)(7)(10)(12)
Healthcare & Pharmaceuticals L + 5.75% (1.00% Floor) 12/4/2023 25,793
 25,494
 25,642
Restaurant Technologies, Inc. (2)(3)(4)(11)(13)
Retail L + 4.75% (1.00% Floor) 11/23/2022 17,369
 17,241
 17,219
Sovos Brands Intermediate, Inc. (2)(3)(4)(7)(10)(13)
Beverage, Food & Tobacco L + 4.50% (1.00% Floor) 7/18/2024 21,568
 21,419
 21,633
Superion (fka Ramundsen Public Sector, LLC) (2)(3)(4)(13)
Sovereign & Public Finance L + 4.25% (1.00% Floor) 2/1/2024 3,970
 3,955
 4,000
Surgical Information Systems, LLC (2)(3)(4)(9)(11)(13)
High Tech Industries L + 5.00% (1.00% Floor) 4/24/2023 30,000
 29,728
 30,075


Consolidated Schedule of Investments as of December 31, 2021
Investments (1)
FootnotesIndustry
Reference Rate & Spread (2)
Interest Rate (2)
Maturity DatePar/ Principal Amount
Amortized Cost (4)
Fair Value (5)
Q Holding Company+#(2)(3)AutomotiveL + 5.00%6.00%12/31/2023$21,515 $21,421 $21,098 
QW Holding Corporation^+(2)(3)(6)Environmental IndustriesL + 6.25%7.25%8/31/202414,116 13,887 13,645 
Radiology Partners, Inc.+#(2)(3)Healthcare & PharmaceuticalsL + 4.25%4.36%7/9/202527,686 27,603 27,245 
RevSpring Inc.+#(2)(3)Media: Advertising, Printing & PublishingL + 4.25%4.47%10/11/202529,149 29,001 29,067 
Striper Buyer, LLC+(2)(3)Containers, Packaging & GlassL + 5.50%6.25%12/30/202614,850 14,720 14,850 
Turbo Buyer, Inc.+(2)(3)(6)AutomotiveL + 6.00%7.00%12/2/202513,960 13,960 13,661 
U.S. TelePacific Holdings Corp.+(2)(3)TelecommunicationsL + 5.50%6.50%5/2/20236,660 6,643 4,995 
USALCO, LLC+(2)(3)Chemicals, Plastics & RubberL + 6.00%7.00%10/19/202714,995 14,704 14,704 
VRC Companies, LLC^+(2)(3)(6)Business ServicesL + 5.50%6.25%6/29/202726,520 26,103 26,162 
Welocalize, Inc.+(2)(3)(6)Business ServicesL + 4.75%5.75%12/23/202434,201 33,868 33,444 
WRE Holding Corp.^+(2)(3)(6)Environmental IndustriesSOFR + 5.50%6.50%1/3/20258,740 8,724 8,584 
Yellowstone Buyer Acquisition, LLC+(2)(3)Consumer Goods: DurableL + 5.75%6.75%9/13/202739,900 39,135 39,095 
First Lien Debt Total$934,728 $926,959 
Equity Investments (0.00% of fair value)
DBI Holding, LLC^Transportation: Cargo2,961 $— $— 
DBI Holding, LLC^Transportation: Cargo13,996 5,364 — 
Equity Investments Total$5,364 $— 
Total Investments$940,092 $926,959 
^ Denotes that all or a portion of the assets are owned by Credit Fund. Credit Fund has entered into a revolving credit facility (the "Credit Fund Facility"). Accordingly, such assets are not available to creditors of Credit Fund Sub or Credit Fund Warehouse II.
Consolidated Schedule of Investments as of December 31, 2017
Investments (1)Industry Interest Rate  Maturity Date Par/ Principal Amount Amortized Cost (5) Fair Value (6)
First Lien Debt (99.39% of fair value)           
Systems Maintenance Services Holding, Inc. (2)(3)(4)(11)(13)
High Tech Industries L + 5.00% (1.00% Floor) 10/28/2023 $24,255
 $24,126
 $20,617
T2 Systems Canada, Inc. (2)(3)(4)
Transportation: Consumer L + 6.75% (1.00% Floor) 9/28/2022 2,673
 2,617
 2,634
T2 Systems, Inc. (2)(3)(4)(7)(10)(13)
Transportation: Consumer L + 6.75% (1.00% Floor) 9/28/2022 15,929
 15,577
 15,679
Teaching Strategies, LLC (2)(3)(4)(7)(10)(11)(13)
Media: Advertising, Printing & Publishing L + 4.75% (1.00% Floor) 2/27/2023 17,964
 17,803
 17,952
The Original Cakerie, Ltd. (Canada) (2)(3)(4)(7)(10)(11)
Beverage, Food & Tobacco L + 5.00% (1.00% Floor) 7/20/2021 6,939
 6,879
 6,922
The Original Cakerie, Co. (Canada) (2)(3)(11)(13)
Beverage, Food & Tobacco L + 5.50% (1.00% Floor) 7/20/2021 3,585
 3,572
 3,579
ThoughtWorks, Inc. (2)(3)(11)(13)
Business Services L + 4.50% (1.00% Floor) 10/12/2024 8,000
 7,980
 8,032
U.S. Acute Care Solutions, LLC (2)(3)(4)(13)
Healthcare & Pharmaceuticals L + 5.00% (1.00% Floor) 5/15/2021 32,030
 31,808
 31,537
U.S. TelePacific Holdings Corp. (2)(3)(4)(13)
Telecommunications L + 5.00% (1.00% Floor) 5/2/2023 29,850
 29,566
 28,581
Valicor Environmental Services, LLC (2)(3)(4)(7)(10)(11)(13)
Environmental Industries L + 5.00% (1.00% Floor) 6/1/2023 27,047
 26,576
 26,984
WIRB - Copernicus Group, Inc. (2)(3)(4)(13)
Healthcare & Pharmaceuticals L + 5.00% (1.00% Floor) 8/12/2022 14,838
 14,780
 14,838
WRE Holding Corp. (2)(3)(4)(7)(10)(11)(13)
Environmental Industries L + 4.75% (1.00% Floor) 1/3/2023 5,367
 5,283
 5,279
Zest Holdings, LLC (2)(3)(4)(11)
Durable Consumer Goods L + 4.25% (1.00% Floor) 8/16/2023 19,152
 19,107
 19,272
Zywave, Inc. (2)(3)(4)(7)(10)(13)
High Tech Industries L + 5.00% (1.00% Floor) 11/17/2022 17,663
 17,508
 17,663
First Lien Debt Total        $977,682
 $978,718
Second Lien Debt (0.61% of fair value)           
Paradigm Acquisition Corp. (2)(3)(12)(13)
Business Services L + 8.50% (1.00% Floor) 10/12/2025 $4,800
 $4,753
 $4,792
Superion, LLC (fka Ramundsen Public Sector, LLC) (2)(3)(13)
Sovereign & Public Finance L + 8.50% (1.00% Floor) 2/1/2025 200
 198
 202
Zywave, Inc. (2)(3)(13)
High Tech Industries L + 9.00% (1.00% Floor) 11/17/2023 1,050
 1,036
 1,061
Second Lien Debt Total        $5,987
 $6,055
Total Investments        $983,669
 $984,773
+ Denotes that all or a portion of the assets are owned by Credit Fund Sub. Credit Fund Sub has entered into a revolving credit facility (the “Credit Fund Sub Facility”). The lenders of the Credit Fund Sub Facility have a first lien security interest in substantially all of the assets of Credit Fund Sub. Accordingly, such assets are not available to creditors of Credit Fund or Credit Fund Warehouse II.
(1)Unless otherwise indicated, issuers of investments held by Credit Fund are domiciled in the United States. As of December 31, 2017, the geographical composition of investments as a percentage of fair value was 1.07% in Canada, 2.52% in the United Kingdom,
# Denotes that all or a portion of the assets are owned by the Credit Fund Warehouse II. Credit Fund Warehouse II has entered into a revolving credit facility (the "Credit Fund Warehouse II"). The lenders of the Credit Fund Warehouse II Facility have a first lien security interest in substantially all of the assets of the Credit Fund Warehouse II. Accordingly, such assets are not available to creditors of Credit Fund or Credit Fund Sub.

(1)    Unless otherwise indicated, issuers of investments held by Credit Fund are domiciled in the United States. As of December 31, 2021, the geographical composition of investments as a percentage of fair value was 1.5% in Canada and 98.5% in the United States. Certain portfolio company investments are subject to contractual restrictions on sales.
(2)Variable rate loans to the portfolio companies bear interest at a rate that is determined by reference to either LIBOR or an alternate base rate (commonly based on the Federal Funds Rate or the U.S. Prime Rate), which generally resets quarterly. For each such loan, Credit Fund has indicated the reference rate used and provided the spread and 96.41% in the United States.
(2)Variable rate loans to the portfolio companies bear interest at a rate that may be determined by reference to either LIBOR or an alternate base rate (commonly based on the Federal Funds Rate or the U.S. Prime Rate (“P”)), which generally resets quarterly. For each such loan, Credit Fund has provided the interest rate in effect as of December 31, 2017. As of December 31, 2017, all of Credit Fund’s LIBOR loans were indexed to the 90-day LIBOR rate at 1.69%, except for those loans as indicated in Notes 11 and 12 below.
(3)Loan includes interest rate floor feature.
(4)Denotes that all or a portion of the assets are owned by Credit Fund Sub. Credit Fund Sub has entered into a revolving credit facility (the “Credit Fund Sub Facility”). The lenders of the Credit Fund Sub Facility have a first lien security interest in substantially all of the assets of Credit Fund Sub. Accordingly, such assets are not available to creditors of Credit Fund or the 2017-1 Issuer.
(5)Amortized cost represents original cost, including origination fees and upfront fees received that are deemed to be an adjustment to yield, adjusted for the accretion/amortization of discounts/premiums, as applicable, on debt investments using the effective interest method.
(6)Fair value is determined in good faith by or under the direction of the board of managers of Credit Fund, pursuant to Credit Fund’s valuation policy, with the fair value of all investments determined using significant unobservable inputs, which is substantially similar to the valuation policy of the Company provided in Note 3, Fair Value Measurements.
(7)Denotes that all or a portion of the assets are owned by Credit Fund. Credit Fund has entered into the Credit Fund Facility. The lenders of the Credit Fund Facility have a first lien security interest in substantially all of the assets of Credit Fund. Accordingly, such assets are not available to creditors of Credit Fund Sub or the 2017-1 Issuer.
(8)Credit Fund receives less than the stated interest rate of this loan as a result of an agreement among lenders. The interest rate reduction is 1.25% on EIP Merger Sub, LLC (Evolve IP). Pursuant to the agreement among lenders in respect of this loan, this investment represents a first lien/first out loan, which has first priority ahead of the first lien/last out loan with respect to principal, interest and other payments.
(9)In addition to the interest earned based on the stated interest rate of this loan, which is the amount reflected in this schedule, the Company is entitled to receive additional interest as a result of an agreement among lenders as follows: EIP Merger Sub, LLC (Evolve IP) (3.97%) and Surgical Information Systems, LLC (1.01%). Pursuant to the agreement among lenders in respect of this loan, this investment represents a first lien/last out loan, which has a secondary priority behind the first lien/first out loan with respect to principal, interest and other payments.


(10)As of December 31, 2017, Credit Fund had the following unfunded commitments to fund delayed draw and revolving senior secured loans:
First Lien Debt – unfunded delayed draw and revolving term loans commitments Type Unused Fee Par/ Principal Amount Fair Value
Advanced Instruments, LLC Revolver 0.50% $1,333
 $
AQA Acquisition Holding, Inc. Revolver 0.50% 2,459
 
Borchers, Inc. Revolver 0.50% 1,935
 (9)
DecoPac, Inc. Revolver 0.50% 1,457
 
HMT Holding Inc. Revolver 0.50% 4,938
 (43)
Jensen Hughes, Inc. Delayed Draw 1.00% 1,180
 
Jensen Hughes, Inc. Revolver 0.50% 2,000
 
J.S. Held LLC Delayed Draw 1.00% 2,253
 (7)
North American Dental Management, LLC Delayed Draw 1.00% 13,354
 (134)
North American Dental Management, LLC Revolver 0.50% 2,727
 (27)
North Haven CA Holdings, Inc. (CoAdvantage) Revolver 0.50% 3,362
 (12)
PAI Holdco, Inc. (Parts Authority) Delayed Draw 1.00% 3,286
 (8)
PSI Services LLC Revolver 0.50% 302
 (6)
QW Holding Corporation (Quala) Delayed Draw 1.00% 7,515
 (171)
QW Holding Corporation (Quala) Revolver 0.50% 3,849
 (88)
Radiology Partners, Inc. Delayed Draw 1.00% 2,483
 (12)
Radiology Partners, Inc. Revolver 0.50% 1,725
 (9)
Sovos Brands Intermediate, Inc. Revolver 0.50% 3,378
 9
T2 Systems, Inc. Revolver 0.50% 1,173
 (17)
Teaching Strategies, LLC Revolver 0.50% 1,900
 (1)
The Original Cakerie, Ltd. (Canada) Revolver 0.50% 1,665
 (3)
Valicor Environmental Services, LLC Revolver 0.50% 2,838
 (6)
WRE Holding Corp. Delayed Draw 1.04% 3,435
 (32)
WRE Holding Corp. Revolver 0.50% 748
 (7)
Zywave, Inc. Revolver 0.50% 1,163
 
Total unfunded commitments     $72,458
 $(583)
(11)As of December 31, 2017, this LIBOR loan was indexed to the 30-day LIBOR rate at 1.56%.
(12)As of December 31, 2017, this LIBOR loan was indexed to the 180-day LIBOR rate at 1.84%.
(13)Denotes that all or a portion of the assets are owned by the 2017-1 Issuer and secure the notes issued in connection with a $399,900 term debt securitization completed by Credit Fund on December 19, 2017 (the “2017-1 Debt Securitization”). Accordingly, such assets are not available to creditors of Credit Fund or Credit Fund Sub.


Consolidated Schedule of Investments as of December 31, 2016
Investments (1)
Industry (2)
 Interest Rate Maturity Date Par/ Principal Amount 
Amortized Cost (5)
 
Fair Value (6)
First Lien Debt (99.31% of fair value)           
AM Conservation Holding Corporation (2) (3) (4)
Energy: Electricity L + 4.75% (1.00% Floor) 10/31/2022 $30,000
 $29,721
 $29,925
Datapipe, Inc. (2) (3) (4) (11)
Telecommunications L + 4.75% (1.00% Floor) 3/15/2019 9,750
 9,654
 9,764
Dimora Brands, Inc. (fka TK USA Enterprises, Inc.) (2) (3) (4) (11)
Construction & Building L + 4.50% (1.00% Floor) 4/4/2023 19,850
 19,580
 19,723
Diversitech Corporation (2) (4) (10) (11)
Capital Equipment P + 3.50% 11/19/2021 14,803
 14,617
 14,803
DTI Holdco, Inc. (2) (3) (4) (7)
High Tech Industries L + 5.25% (1.00% Floor) 9/30/2023 19,950
 19,751
 19,651
DYK Prime Acquisition LLC (2) (3) (4)
Chemicals, Plastics & Rubber L + 4.75% (1.00% Floor) 4/1/2022 5,775
 5,735
 5,775
EAG, Inc. (2) (3) (4) (11)
Business Services L + 4.25% (1.00% Floor) 7/28/2018 8,713
 8,686
 8,720
EIP Merger Sub, LLC (Evolve IP) (2) (3) (4) (8)
Telecommunications L + 6.25% (1.00% Floor) 6/7/2021 22,971
 22,323
 22,509
EIP Merger Sub, LLC (Evolve IP) (2) (3) (4) (9)
Telecommunications L + 6.25% (1.00% Floor) 6/7/2021 1,500
 1,455
 1,468
Empower Payments Acquisitions, Inc. (2) (3) (7)
Media: Advertising, Printing & Publishing L + 5.50% (1.00% Floor) 11/30/2023 17,500
 17,154
 17,279
Generation Brands Holdings, Inc. (2) (3) (4)
Durable Consumer Goods L + 5.00% (1.00% Floor) 6/10/2022 19,900
 19,712
 20,099
Jensen Hughes, Inc. (2) (3) (4) (10)
Utilities: Electric L + 5.00% (1.00% Floor) 12/4/2021 20,409
 20,188
 20,327
Kestra Financial, Inc. (2) (3) (4)
Banking, Finance, Insurance & Real Estate L + 5.25% (1.00% Floor) 6/24/2022 19,900
 19,632
 19,814
MSHC, Inc. (2) (3) (4) (10)
Construction & Building L + 5.00% (1.00% Floor) 7/19/2021 13,177
 13,062
 13,003
PAI Holdco, Inc. (Parts Authority) (2) (3) (4)
Automotive L + 4.75% (1.00% Floor) 12/30/2022 9,950
 9,886
 9,950
Pasternack Enterprises, Inc. (Infinite RF) (2) (3) (4)
Capital Equipment L + 5.00% (1.00% Floor) 5/27/2022 11,941
 11,844
 11,941
Q Holding Company (2) (3) (4)
Automotive L + 5.00% (1.00% Floor) 12/18/2021 13,964
 13,828
 13,941
QW Holding Corporation (Quala) (2) (3) (4) (7) (10)
Environmental Industries L + 6.75% (1.00% Floor) 8/31/2022 8,975
 8,413
 9,030
RelaDyne Inc. (2) (3) (4) (10)
Wholesale L + 5.25% (1.00% Floor) 7/22/2022 23,514
 23,117
 23,443
Restaurant Technologies, Inc. (2) (3) (4)
Retail L + 4.75% (1.00% Floor) 11/23/2022 14,000
 13,871
 13,969
Systems Maintenance Services Holding, Inc. (2) (3) (4)
High Tech Industries L + 5.00% (1.00% Floor) 10/30/2023 12,000
 11,885
 12,001
T2 Systems Canada, Inc. (2) (3) (4) (11)
Transportation: Consumer L + 6.75% (1.00% Floor) 9/28/2022 2,700
 2,635
 2,727
T2 Systems, Inc. (2) (3) (4) (10) (11)
Transportation: Consumer L + 6.75% (1.00% Floor) 9/28/2022 15,300
 14,888
 15,473
The Original Cakerie, Ltd. (Canada) (2) (3) (4) (10)
Beverage, Food & Tobacco L + 5.00% (1.00% Floor) 7/20/2021 7,009
 6,946
 7,009
The Original Cakerie, Co. (Canada) (2) (3) (4)
Beverage, Food & Tobacco L + 5.50% (1.00% Floor) 7/20/2021 3,621
 3,591
 3,621
U.S. Acute Care Solutions, LLC (2) (3) (4)
Health & Pharmaceuticals L + 5.00% (1.00% Floor) 5/15/2021 26,400
 26,154
 26,336
U.S. Anesthesia Partners, Inc. (2) (3) (4)
Health & Pharmaceuticals L + 5.00% (1.00% Floor) 12/31/2019 10,374
 10,275
 10,362
Vantage Specialty Chemicals, Inc. (2) (3) (4) (11)
Chemicals, Plastics & Rubber L + 4.50% (1.00% Floor) 2/5/2021 17,910
 17,786
 17,903
WIRB – Copernicus Group, Inc. (2) (3) (4)
Health & Pharmaceuticals L + 5.00% (1.00% Floor) 8/12/2022 $7,980
 $7,916
 $8,050
Zest Holdings, LLC (2) (3) (4)
Durable Consumer Goods L + 4.75% (1.00% Floor) 8/16/2020 8,700
 8,658
 8,749
Zywave, Inc. (2) (3) (4) (7) (10)
High Tech Industries L + 5.00% (1.00% Floor) 11/17/2022 17,500
 17,315
 17,434
First Lien Debt Total        $430,278
 $434,799
Second Lien Debt (0.69% of fair value)           
Vantage Specialty Chemicals, Inc. (2) (3) (4) (11)
Chemicals, Plastics & Rubber L + 8.75% (1.00% Floor) 2/5/2022 $2,000
 $1,960
 $1,987
Zywave, Inc. (2) (3) (4)
High Tech Industries L + 9.00% (1.00% Floor) 11/17/2023 1,050
 1,034
 1,043
Second Lien Debt Total        $2,994
 $3,030
Total Investments        $433,272
 $437,829
(1)Unless otherwise indicated, issuers of investments held by Credit Fund are domiciled in the United States. As of December 31, 2016, the geographical composition of investments as a percentage of fair value was 2.43% in Canada and 97.57% in the United States.
(2)Variable rate loans to the portfolio companies bear interest at a rate that may be determined by reference to either LIBOR or an alternate base rate (commonly based on the Federal Funds Rate or the U.S. Prime Rate), which generally resets quarterly. For each such loan, Credit Fund has provided the interest rate in effect as of December 31, 2016. As of December 31, 2016, all of Credit Fund’s LIBOR loans were indexed to the 90-day LIBOR rate at 1.00%, except for those loans as indicated in Note 11 below, and the U.S. Prime Rate loan was indexed at 3.75%.
(3)Loan includes interest rate floor feature.
(4)Denotes that all or a portion of the assets are owned by Credit Fund Sub. Credit Fund Sub has entered into a revolving credit facility (the “Credit Fund Sub Facility”). The lenders of the Credit Fund Sub Facility have a first lien security interest in substantially all of the assets of Credit Fund Sub. Accordingly, such assets are not available to creditors of Credit Fund.


(5)Amortized cost represents original cost, including origination fees and upfront fees received that are deemed to be an adjustment to yield, adjusted for the accretion/amortization of discounts/premiums, as applicable, on debt investments using the effective interest method.
(6)
Fair value is determined in good faith by or under the direction of the board of managers of Credit Fund, pursuant to Credit Fund’s valuation policy, which is substantially similar to the valuation policy of the Company provided in “—Critical Accounting Policies—Fair Value Measurements.
(7)Denotes that all or a portion of the assets are owned by Credit Fund. Credit Fund has entered into the Credit Fund Facility. The lenders of the Credit Fund Facility have a first lien security interest in substantially all of the assets of Credit Fund. Accordingly, such assets are not available to creditors of Credit Fund Sub.
(8)Credit Fund receives less than the stated interest rate of this loan as a result of an agreement among lenders. The interest rate reduction is 1.25% on EIP Merger Sub, LLC (Evolve IP). Pursuant to the agreement among lenders in respect of this loan, this investment represents a first lien/first out loan, which has first priority ahead of the first lien/last out loan with respect to principal, interest and other payments.
(9)In addition to the interest earned based on the stated interest rate of this loan, which is the amount reflected in this schedule, Credit Fund is entitled to receive additional interest as a result of an agreement among lenders as follows: EIP Merger Sub, LLC (Evolve IP) (3.84%). Pursuant to the agreement among lenders in respect of this loan, this investment represents a first lien/last out loan, which has a secondary priority behind the first lien/first out loan with respect to principal, interest and other payments.
(10)As of December 31, 2016, Credit Fund had the following unfunded commitments to fund delayed draw and revolving senior secured loans:
First Lien Debt – unfunded delayed draw and revolving term loans commitments Type Unused Fee Par/ Principal Amount Fair Value
Diversitech Corporation Delayed Draw 1.00% $5,000
 $
Jensen Hughes, Inc. Revolver 0.50% 2,000
 (7)
Jensen Hughes, Inc. Delayed Draw 0.50% 1,461
 (5)
MSHC, Inc. Delayed Draw 1.50% 1,790
 (21)
QW Holding Corporation (Quala) Revolver 1.00% 5,086
 14
QW Holding Corporation (Quala) Delayed Draw 1.00% 5,918
 17
RelaDyne Inc. Revolver 0.50% 2,162
 (6)
RelaDyne Inc. Delayed Draw 0.50% 1,824
 (5)
T2 Systems, Inc. Revolver 1.00% 1,955
 20
The Original Cakerie, Ltd. (Canada) Revolver 0.50% 1,665
 
Zywave, Inc. Revolver 0.50% 1,500
 (5)
Total unfunded commitments     $30,361
 $2
(11)As of December 31, 2016, this LIBOR loan was indexed to the 30-day LIBOR rate at 0.77%.


Below is certain summarized consolidated financial information for Credit Fund as of December 31, 20172021. As of December 31, 2021, the reference rates for Credit Fund's variable rate loans were the 30-day LIBOR at 0.10%, the 90-day LIBOR at 0.22% and 2016, respectively.the 180-day LIBOR at 0.33%.
(3)Loan includes interest rate floor feature, which is generally 1.00%.
(4)Amortized cost represents original cost, including origination fees and upfront fees received that are deemed to be an adjustment to yield, adjusted for the accretion/amortization of discounts/premiums, as applicable, on debt investments using the effective interest method.
(5)Fair value is determined in good faith by or under the direction of the board of managers of Credit Fund, commenced operationspursuant to Credit Fund’s valuation policy, with the fair value of all investments determined using significant unobservable inputs, which is substantially similar to the valuation policy of the Company provided in May 2016.Note 3, Fair Value Measurements, to these consolidated financial statements.
148

 December 31, 2017December 31, 2016
Selected Consolidated Balance Sheet Information  
ASSETS  
Investments, at fair value (amortized cost of $983,669 and $433,272, respectively)$984,773
$437,829
Cash and other assets26,441
11,326
Total assets$1,011,214
$449,155
LIABILITIES AND MEMBERS’ EQUITY  
Secured borrowings$377,686
$248,540
2017-1 Notes payable, net of unamortized debt issuance costs of $2,051348,938

Mezzanine loans85,750
62,384
Other liabilities25,308
63,684
Subordinated loans and members’ equity173,532
74,547
Liabilities and members’ equity$1,011,214
$449,155
   
 For the years ended
 December 31, 2017December 31, 2016
Selected Consolidated Statement of Operations Information:  
Total investment income$49,504
$9,973
Expenses  
Interest and credit facility expenses29,191
5,410
Other expenses3,493
1,266
Total expenses32,684
6,676
Net investment income (loss)16,820
3,297
Net realized gain (loss) on investments17
41
Net change in unrealized appreciation (depreciation) on investments(3,453)4,557
Net increase (decrease) resulting from operations$13,384
$7,895
(6)As of December 31, 2021, Credit Fund and Credit Fund Sub had the following unfunded commitments to fund delayed draw and revolving senior secured loans:
First Lien Debt – unfunded delayed draw and revolving term loans commitmentsTypeUnused FeePar/ Principal AmountFair Value
ACR Group Borrower, LLCRevolver0.38 %$7,350 $— 
Analogic CorporationRevolver0.50847 (9)
Chartis Holding, LLCRevolver0.502,183 — 
Chemical Computing Group ULC (Canada)Revolver0.50873 (4)
Chudy Group, LLCDelayed Draw1.005,517 88 
Chudy Group, LLCRevolver0.501,379 22 
Diligent CorporationDelayed Draw1.001,653 26 
Diligent CorporationRevolver0.50703 11 
EPS Nass Parent, Inc.Delayed Draw1.003,136 (29)
EPS Nass Parent, Inc.Revolver0.50941 (9)
EvolveIP, LLCRevolver0.503,360 (17)
GSM Acquisition Corp.Delayed Draw1.004,313 (33)
Heartland Home Services, IncRevolver0.50746 
HMT Holding Inc.Revolver0.506,173 (223)
Integrity Marketing Acquisition, LLCDelayed Draw0.007,000 (71)
Integrity Marketing Acquisition, LLCDelayed Draw1.004,453 (45)
Jensen Hughes, Inc.Revolver0.502,000 (55)
K2 Insurance Services, LLCRevolver0.501,170 (2)
KBP Investments, LLCDelayed Draw1.00503 (5)
KBP Investments, LLCDelayed Draw1.002,415 (24)
QW Holding CorporationDelayed Draw1.009,338 (162)
QW Holding CorporationRevolver0.503,794 (66)
Turbo Buyer, Inc.Revolver0.50933 (19)
VRC Companies, LLCDelayed Draw0.752,521 (30)
VRC Companies, LLCRevolver0.50833 (10)
Welocalize, Inc.Revolver0.503,375 (64)
Welocalize, Inc.Revolver0.502,250 (43)
WRE Holding Corp.Revolver0.50624 (10)
Total unfunded commitments$80,383 $(780)
149


Consolidated Schedule of Investments as of December 31, 2020
Investments (1)
FootnotesIndustry
Reference Rate & Spread (2)
Interest 
Rate
 (2)
Maturity
Date
Par/
Principal
Amount
Amortized
Cost (4)
Fair
Value (5)
First Lien Debt (97.5% of fair value)
Acrisure, LLC\#(2)(3)Banking, Finance, Insurance & Real EstateL + 3.50%3.65%2/15/2027$25,634 $25,606 $25,104 
Alku, LLC+#(2)(3)Business ServicesL + 5.50%5.75%7/29/202623,666 23,466 23,512 
Alpha Packaging Holdings, Inc.+\(2)(3)Containers, Packaging & GlassL + 6.00%7.00%11/12/202116,378 16,378 16,378 
AmeriLife Holdings LLC#(2)(3)Banking, Finance, Insurance & Real EstateL + 4.00%4.15%3/18/20279,951 9,929 9,802 
Analogic Corporation^+(2)(3)(6)Capital EquipmentL + 5.25%6.25%6/22/202418,857 18,837 18,857 
Anchor Packaging, Inc.+#(2)(3)Containers, Packaging & GlassL + 4.00%4.15%7/18/202624,723 24,617 24,656 
API Technologies Corp.+\(2)(3)Aerospace & DefenseL + 4.25%4.49%5/9/202614,775 14,713 13,999 
Aptean, Inc.+\(2)(3)SoftwareL + 4.25%4.40%4/23/202612,281 12,227 12,077 
AQA Acquisition Holding, Inc.+\(2)(3)(6)High Tech IndustriesL + 4.25%5.25%5/24/202318,759 18,752 18,757 
Astra Acquisition Corp.+#(2)(3)SoftwareL + 5.50%6.50%3/1/202728,783 28,392 28,783 
Avalign Technologies, Inc.+\(2)(3)Healthcare & PharmaceuticalsL + 4.50%4.73%12/22/202514,592 14,481 14,334 
Big Ass Fans, LLC+\#(2)(3)Capital EquipmentL + 3.75%4.75%5/21/202413,766 13,714 13,766 
BK Medical Holding Company, Inc.^+(2)(3)(6)Healthcare & PharmaceuticalsL + 5.25%6.25%6/22/202424,165 23,951 22,363 
Chemical Computing Group ULC (Canada)^+(2)(3)(6)SoftwareL + 5.00%6.00%8/30/202314,055 13,378 14,055 
Clarity Telecom LLC.+(2)(3)Media: Broadcasting & SubscriptionL + 4.25%4.40%8/30/202614,813 14,773 14,813 
Clearent Newco, LLC^(2)(3)(6)High Tech IndustriesL + 6.50%7.50%3/20/20254,079 4,079 3,907 
Clearent Newco, LLC^+\(2)(3)High Tech IndustriesL + 5.50%7.50%3/20/202529,486 29,236 28,722 
DecoPac, Inc.^+\(2)(3)(6)Non-durable Consumer GoodsL + 4.25%5.25%9/29/202412,336 12,253 12,318 
Diligent Corporation^+(2)(3)(6)TelecommunicationsL + 6.25%7.25%8/4/20258,683 8,411 8,819 
DTI Holdco, Inc.^+\(2)(3)High Tech IndustriesL + 4.75%5.75%9/30/202318,690 18,642 16,655 
Eliassen Group, LLC+\(2)(3)Business ServicesL + 4.25%4.40%11/5/20247,543 7,516 7,483 
EvolveIP, LLC^+(2)(3)(6)TelecommunicationsL + 5.75%6.75%6/7/202319,800 19,759 19,775 
Exactech, Inc.+\#(2)(3)Healthcare & PharmaceuticalsL + 3.75%4.75%2/14/202521,528 21,416 20,422 
Excel Fitness Holdings, Inc.+#(2)(3)Hotel, Gaming & LeisureL + 5.25%6.25%10/7/202524,750 24,546 22,780 
Frontline Technologies Holdings, LLC+(2)(3)SoftwareL + 5.75%6.75%9/18/202314,886 14,198 14,589 
Golden West Packaging Group LLC+\(2)(3)Containers, Packaging & GlassL + 5.25%6.25%6/20/202329,012 28,896 28,974 
HMT Holding Inc.+\(2)(3)(6)Energy: Oil & GasL + 5.00%6.00%11/17/202332,821 32,458 30,984 
Integrity Marketing Acquisition, LLC^+(2)(3)(6)Banking, Finance, Insurance & Real EstateL + 6.25%7.25%8/27/20257,836 7,701 7,956 
Jensen Hughes, Inc.+\(2)(3)(6)Utilities: ElectricL + 4.50%5.50%3/22/202434,584 34,489 33,424 
KAMC Holdings, Inc.+#(2)(3)Energy: ElectricityL + 4.00%4.23%8/14/202613,825 13,768 12,531 
KBP Investments, LLC^+(2)(3)(6)Beverage, Food & TobaccoL + 5.00%6.00%5/15/20239,292 9,059 9,350 
Marco Technologies, LLC^+\(2)(3)(6)Media: Advertising, Printing & PublishingL + 4.00%5.00%10/30/20237,332 7,293 7,332 
Mold-Rite Plastics, LLC+\(2)(3)Chemicals, Plastics & RubberL + 4.25%5.25%12/14/202114,520 14,501 14,520 
150

Consolidated Schedule of Investments as of December 31, 2020
Investments (1)
FootnotesIndustry
Reference Rate & Spread (2)
Interest 
Rate
 (2)
Maturity
Date
Par/
Principal
Amount
Amortized
Cost (4)
Fair
Value (5)
Newport Group Holdings II, Inc.+\#(2)(3)Banking, Finance, Insurance & Real EstateL + 3.50%3.75%9/13/202523,475 23,285 23,405 
Odyssey Logistics & Technology Corp.+\#(2)(3)Transportation: CargoL + 4.00%5.00%10/12/2024$38,897 $38,773 $37,766 
Output Services Group^+\(2)(3)Media: Advertising, Printing & PublishingL + 4.50%5.50%3/27/202419,421 19,382 14,178 
Pasternack Enterprises, Inc.+\(2)(3)Capital EquipmentL + 4.00%5.00%7/2/202522,524 22,513 22,218 
Pharmalogic Holdings Corp.+\(2)(3)Healthcare & PharmaceuticalsL + 4.00%5.00%6/11/202311,205 11,189 11,158 
Premise Health Holding Corp.+\#(2)(3)Healthcare & PharmaceuticalsL + 3.50%3.75%7/10/202513,584 13,538 13,503 
Propel Insurance Agency, LLC^+\(2)(3)(6)Banking, Finance, Insurance & Real EstateL + 5.00%6.00%6/1/202438,134 37,662 37,716 
Q Holding Company+\#(2)(3)AutomotiveL + 5.00%6.00%12/31/202321,735 21,604 20,229 
QW Holding Corporation+(2)(3)(6)Environmental IndustriesL + 6.25%7.25%8/31/202211,566 11,465 10,727 
Radiology Partners, Inc.+\#(2)(3)Healthcare & PharmaceuticalsL + 4.25%4.81%7/9/202527,686 27,581 27,193 
RevSpring Inc.+\#(2)(3)Media: Advertising, Printing & PublishingL + 4.25%4.40%10/11/202529,449 29,265 29,199 
Situs Group Holdings Corporation+\(2)(3)Banking, Finance, Insurance & Real EstateL + 4.75%5.75%6/28/202514,781 14,689 14,636 
T2 Systems, Inc.^+(2)(3)(6)Transportation: ConsumerL + 6.75%7.75%9/28/202229,119 28,743 29,118 
The Original Cakerie, Ltd. (Canada)+\(2)(3)(6)Beverage, Food & TobaccoL + 4.50%5.50%7/20/20226,295 6,281 6,289 
The Original Cakerie, Ltd. (Canada)+(2)(3)Beverage, Food & TobaccoL + 5.00%6.00%7/20/20228,837 8,815 8,829 
Thoughtworks, Inc.\#(2)(3)Business ServicesL + 3.75%4.75%10/11/202411,704 11,683 11,704 
U.S. Acute Care Solutions, LLC+\(2)(3)Healthcare & PharmaceuticalsL + 6.00%7.00%5/15/202131,211 31,184 29,104 
U.S. TelePacific Holdings Corp.+\(2)(3)TelecommunicationsL + 5.50%6.50%5/2/202326,660 26,585 23,984 
VRC Companies, LLC+(2)(3)(6)Business ServicesL + 6.50%7.50%3/31/202330,582 29,464 30,582 
Water Holdings Acquisition LLC^+(2)(3)(6)Utilities: WaterL + 5.25%6.25%12/18/202626,316 25,520 25,516 
Welocalize, Inc.+(2)(3)(6)Business ServicesL + 4.50%5.50%12/23/202322,629 22,414 22,584 
WRE Holding Corp.^+(2)(3)(6)Environmental IndustriesL + 5.25%6.25%1/3/20238,367 8,336 8,252 
First Lien Debt Total$1,051,406 $1,029,687 
Second Lien Debt (2.3% of fair value)
DBI Holding, LLC^(2)Transportation: Cargo9.00% PIK9.00%2/1/2026$24,113 $23,768 $24,113 
Second Lien Debt Total$23,768 $24,113 
Equity Investments (0.2% of fair value)
DBI Holding, LLC^Transportation: Cargo2,961 $— $— 
DBI Holding, LLC^Transportation: Cargo13,996 5,364 2,581 
Equity Investments Total$5,364 $2,581 
Total Investments$1,080,538 $1,056,381 
^ Denotes that all or a portion of the assets are owned by Credit Fund. Credit Fund has entered into a revolving credit facility (the "Credit Fund Facility"). Accordingly, such assets are not available to creditors of Credit Fund Sub, the 2019-2 Issuer or Credit Fund Warehouse II.
+ Denotes that all or a portion of the assets are owned by Credit Fund Sub. Credit Fund Sub has entered into a revolving credit facility (the “Credit Fund Sub Facility”). The lenders of the Credit Fund Sub Facility have a first lien security interest in substantially all of the assets of Credit Fund Sub. Accordingly, such assets are not available to creditors of Credit Fund, the 2019-2 Issuer or Credit Fund Warehouse II.
\ Denotes that all or a portion of the assets are owned by the 2019-2 Issuer and secure the notes issued in connection with a $399,900 term debt securitization completed by Credit Fund on May 21, 2019 (the “2019-2 Debt Securitization”). Accordingly, such assets are not available to creditors of Credit Fund, Credit Fund Sub, or Credit Fund Warehouse II.
151

# Denotes that all or a portion of the assets are owned by the Credit Fund Warehouse II. Credit Fund Warehouse II has entered into a revolving credit facility (the "Credit Fund Warehouse II"). The lenders of the Credit Fund Warehouse II Facility have a first lien security interest in substantially all of the assets of the Credit Fund Warehouse II. Accordingly, such assets are not available to creditors of Credit Fund, Credit Fund Sub, or 2019-2 Issuer.
(1)Unless otherwise indicated, issuers of investments held by Credit Fund are domiciled in the United States. As of December 31, 2020, the geographical composition of investments as a percentage of fair value was 2.76% in Canada and 97.24% in the United States. Certain portfolio company investments are subject to contractual restrictions on sales.
(2)Variable rate loans to the portfolio companies bear interest at a rate that is determined by reference to either LIBOR or an alternate base rate (commonly based on the Federal Funds Rate or the U.S. Prime Rate), which generally resets quarterly. For each such loan, Credit Fund has indicated the reference rate used and provided the spread and the interest rate in effect as of December 31, 2020. As of December 31, 2020, the reference rates for Credit Fund's variable rate loans were the 30-day LIBOR at 0.15%, the 90-day LIBOR at 0.25% and the 180-day LIBOR at 0.26%.
(3)Loan includes interest rate floor feature, which is generally 1.00%.
(4)Amortized cost represents original cost, including origination fees and upfront fees received that are deemed to be an adjustment to yield, adjusted for the accretion/amortization of discounts/premiums, as applicable, on debt investments using the effective interest method.
(5)Fair value is determined in good faith by or under the direction of the board of managers of Credit Fund, pursuant to Credit Fund’s valuation policy, with the fair value of all investments determined using significant unobservable inputs, which is substantially similar to the valuation policy of the Company provided in Note 3, Fair Value Measurements, to these consolidated financial statements.
(6)As of December 31, 2020, Credit Fund and Credit Fund Sub had the following unfunded commitments to fund delayed draw and revolving senior secured loans:
First Lien Debt – unfunded delayed draw and revolving term loans commitmentsTypeUnused FeePar/ Principal AmountFair Value
Analogic CorporationRevolver0.50 %$1,975 $— 
AQA Acquisition Holding, Inc.Revolver0.50 2,459 — 
BK Medical Holding Company, Inc.Revolver0.50 2,609 (176)
Chemical Computing Group ULC (Canada)Revolver0.50 873 — 
Clearent Newco, LLCDelayed Draw1.00 2,549 (66)
DecoPac, Inc.Revolver0.50 2,143 (3)
Diligent CorporationDelayed Draw1.00 2,109 25 
Diligent CorporationRevolver0.50 703 
EvolveIP, LLCDelayed Draw1.00 1,904 (2)
EvolveIP, LLCRevolver0.50 1,680 (2)
HMT Holding Inc.Revolver0.50 6,173 (291)
Integrity Marketing Acquistion, LLCDelayed Draw1.00 4,144 41 
Jensen Hughes, Inc.Delayed Draw1.00 1,127 (35)
Jensen Hughes, Inc.Revolver0.50 1,364 (43)
KBP Investments, LLCDelayed Draw1.00 503 
KBP Investments, LLCDelayed Draw1.00 10,190 30 
Marco Technologies, LLCDelayed Draw1.00 7,500 — 
Propel Insurance Agency, LLCRevolver0.50 1,905 (19)
Propel Insurance Agency, LLCDelayed Draw1.00 1,733 (17)
QW Holding CorporationRevolver0.50 5,498 (268)
QW Holding CorporationDelayed Draw1.00 161 (8)
T2 Systems, Inc.Revolver0.50 1,955 — 
The Original Cakerie, Ltd. (Canada)Revolver0.50 1,665 (1)
VRC Companies, LLCRevolver0.50 858 — 
Water Holdings Acquisition LLCDelayed Draw1.00 8,421 (168)
Water Holdings Acquisition LLCRevolver0.50 5,263 (105)
Welocalize, Inc.Revolver0.50 2,250 (4)
WRE Holding Corp.Revolver0.50 852 (10)
WRE Holding Corp.Delayed Draw1.00 563 (7)
Total unfunded commitments$81,129 $(1,120)

Debt
The Credit Fund, FacilityCredit Fund Sub and Credit Fund Warehouse II are party to separate credit facilities as described below. As of December 31, 2021 and 2020, Credit Fund, Credit Fund Sub, and Credit Fund Warehouse II were in compliance with all covenants and other requirements of their respective credit facility agreements. Below is a summary of the borrowings and repayments under the credit facilities for the respective periods.
152

Credit Fund
Facility
Credit Fund Sub
Facility
Credit Fund Warehouse II Facility
Outstanding balance as of December 31, 2019$93,000 $343,506 $97,571 
Borrowings63,500 269,313 54,373 
Repayments(156,500)(191,960)(58,542)
Outstanding balance as of December 31, 2020— 420,859 93,402 
Borrowings— 444,000 52,250 
Repayments— (350,238)(59,622)
Outstanding balance as of December 31, 2021$— $514,621 $86,030 
Credit Fund Facility.On June 24, 2016, Credit Fund entered into the Credit Fund Facility with the Company, which was subsequently amended on June 5, 2017, October 2, 2017, November 3, 2017, June 22, 2018, June 29, 2018, February 21, 2019, March 20, 2020 and February 22, 2021, pursuant to which Credit Fund may from time to time request mezzanine loans from the Company, which was subsequently amended on June 5, 2017, October 2, 2017 and November 3, 2017.Company. The maximum principal amount of the Credit Fund Facility is $175,000. The maturity date of the Credit Fund Facility is June 22, 2018.May 21, 2022. Amounts borrowed under the Credit Fund Facility bear interest at a rate of LIBOR plus 9.00%.
During the year ended December 31, 2017 and 2016, there were mezzanine loan borrowings of $135,960 and $84,784, respectively, and repayments of $112,594 and $22,400 under the Credit Fund Facility. As of December 31, 2017 and 2016, there were $85,750 and $62,384 in mezzanine loans outstanding.
As of December 31, 2017 and 2016, Credit Fund was in compliance with all covenants and other requirements of the Credit Fund Facility.
Credit Fund Sub Facility
Facility.On June 24, 2016, Credit Fund Sub closed on the Credit Fund Sub Facility with lenders, which was subsequently
amended on May 31, 2017, and October 27, 2017.2017, August 24, 2018, December 12, 2019, March 11, 2020, and May 3, 2021. The Credit Fund Sub Facility provides for secured borrowings during the applicable revolving period up to an amount equal to $640,000. The facility is secured by a first lien security interest in substantially all of the portfolio investments held by Credit Fund Sub. The maturity date of the Credit Fund Sub Facility is May 22, 2023.2024. Amounts borrowed under the Credit Fund Sub Facility bear interest at a rate of LIBOR plus 2.50%2.25%.

During the year ended December 31, 2017 and 2016, there wereCredit Fund Warehouse II Facility. On August 16, 2019, Credit Fund Warehouse II closed on a revolving credit facility (the "Credit Fund Warehouse II Facility") with lenders. The Credit Fund Warehouse II Facility provides for secured borrowings during the applicable revolving period up to an amount equal to $150,000. The Credit Fund Warehouse II Facility is secured by a first lien security interest in substantially all of $466,605 and $248,540, respectively, and repaymentsthe portfolio investments held by the Credit Fund Warehouse II Facility. The maturity date of $337,459 and $0, respectively,the Credit Fund Warehouse II Facility is August 16, 2022. Amounts borrowed under the Credit Fund Sub Facility. AsWarehouse II Facility bear interest at a rate of December 31, 2017 and 2016, there was $377,686 and $248,540 in secured borrowings outstanding respectively.
As of December 31, 2017 and 2016, Credit Fund Sub was in compliance with all covenants and other requirements ofLIBOR plus 1.50%. Amounts borrowed under the Credit Fund Sub Facility.Warehouse II Facility during the first 12 months bore interest at a rate of LIBOR plus 1.05%, and amounts borrowed in the second 12 months bore interest at LIBOR plus 1.15%.
2017-1 Notes
On December 19, 2017, Credit Fund completed the 2017-1 Debt Securitization. The notes offered in the 2017-1 Debt Securitization (the “2017-1 Notes”) were issued by the 2017-1 Issuer, a wholly owned and consolidated subsidiary of Credit Fund, and are secured by a diversified portfolio of the 2017-1 Issuer consisting primarily of first and second lien senior secured loans. The 2017-1 Debt Securitization was executed through a private placement of the 2017-1 Notes, consisting of $231,700of:
$231,700 of Aaa/AAA Class A-1 Notes, which bearbore interest at the three-month LIBOR plus 1.17%; $48,300
$48,300 of Aa2/AA Class A-2 Notes, which bearbore interest at the three-month LIBOR plus 1.50%; $15,000
$15,000 of A2/A Class B-1 Notes, which bearbore interest at the three-month LIBOR plus 2.25%; $9,000
$9,000 of A2/A Class B-2 Notes which bearbore interest at 4.30%; $22,900
$22,900 of Baa2/BBB Class C Notes which bearbore interest at the three-month LIBOR plus 3.20%; and $25,100
$25,100 of Ba2/BB Class D Notes which bearbore interest at the three-month LIBOR plus 6.38%.
    The 2017-1 Notes are scheduled to mature on January 15, 2028. Credit Fund received 100% of the preferred interests issued by the 2017-1 Issuer (the “2017-1 Issuer Preferred Interests”) on the closing date of the 2017-1 Debt Securitization in exchange for Credit Fund's contribution to the 2017-1 Issuer of the initial closing date loan portfolio. The 2017-1 Issuer Preferred Interests dodid not bear interest and had a nominal value of $47,900 at closing.
The 2017-1 Notes were fully redeemed during the year ended December 31, 2020. As of the redemption date, the 2017-1 Issuer was in compliance with all covenants and other requirements of the indenture.
153

2019-2 Notes
On May 21, 2019, Credit Fund completed the 2019-2 Debt Securitization. The notes offered in the 2019-2 Debt Securitization (the “2019-2 Notes”) were issued by the 2019-2 Issuer, a wholly owned and consolidated subsidiary of Credit Fund, and are secured by a diversified portfolio of the 2019-2 Issuer consisting primarily of first and second lien senior secured loans. The 2019-2 Debt Securitization was executed through a private placement of the 2019-2 Notes, consisting of:
$233,000 of Aaa/AAA Class A-1 Notes, which bore interest at the three-month LIBOR plus 1.50%;
$48,000 of Aa2/AA Class A-2 Notes, which bore interest at the three-month LIBOR plus 2.40%;
$23,000 of A2/A Class B Notes, which bore interest at the three-month LIBOR plus 3.45%;
$27,000 of Baa2/BBB- Class C Notes which bore interest at the three-month LIBOR plus 4.55%; and
$21,000 of Ba2/BB- Class D Notes which bore interest at the three-month LIBOR plus 8.03%.
    The 2019-2 Notes were scheduled to mature on April 15, 2029. Credit Fund received 100% of the preferred interests issued by the 2019-2 Issuer (the “2019-2 Issuer Preferred Interests”) on the closing date of the 2019-2 Debt Securitization in exchange for Credit Fund’s contribution to the 2019-2 Issuer of the initial closing date loan portfolio. The 2019-2 Issuer Preferred Interests did not bear interest and had a nominal value of $48,300 at closing.
The 2019-2 Notes were fully redeemed during the year ended December 31, 2021. As of the redemption date and December 31, 2020, the 2019-2 Issuer was in compliance with all covenants and other requirements of the indenture.

6. MIDDLE MARKET CREDIT FUND II, LLC
Overview
On November 3, 2020, the Company and CCLF entered into a limited liability company agreement to co-manage Credit Fund II, a Delaware limited liability company that is not consolidated in the Company's consolidated financial statements. Credit Fund II primarily invests in senior secured loans of middle market companies. Credit Fund II is managed by a four-member board, on which the Company and CCLF have equal representation. Establishing a quorum for Credit Fund II's board requires at least one of the Company's representatives and one of CCLF's representatives. The Company and CCLF have 84.13% and 15.87% economic ownership of Credit Fund II, respectively. By virtue of its membership interest, each of the Company and CCLF indirectly bears an allocable share of all expenses and other obligations of Credit Fund II.
Credit Fund II's initial portfolio consists of 45 senior secured loans of middle market companies with an aggregate principal balance of approximately $250 million. Credit Fund II's initial portfolio was funded on November 3, 2020 with existing senior secured debt investments contributed by the Company and as part of the transaction, the Company determined that the contribution met the requirements under ASC 860, Transfers and Servicing.
Credit Fund II is expected to make only limited new investments in senior secured loans of middle market companies. Portfolio and investment decisions with respect to Credit Fund II must be unanimously approved by a quorum of Credit Fund II’s board members consisting of at least one of the Company's representatives and one of CCLF's representatives. Therefore, although the Company owns more than 25% of the voting securities of Credit Fund II, the Company does not believe that it has control over Credit Fund (other than for purposes of the Investment Company Act).
Middle Market Credit Fund II SPV, LLC (“Credit Fund II Sub”), a Delaware limited liability company, was formed on September 4, 2020. Credit Fund II Sub is a wholly owned subsidiary of Credit Fund II and is consolidated in Credit Fund II’s consolidated financial statements commencing from the date of its formation. Credit Fund II Sub primarily holds investments in first lien loans of middle market companies, which are pledged as security for the Credit Fund II Senior Notes (see below).
Credit Fund II, the Company and CCLF entered into an administration agreement with Carlyle Global Credit Administration L.L.C., the administrative agent of Credit Fund II (in such capacity, the “Credit Fund II Administrative Agent”), pursuant to which the Credit Fund II Administrative Agent is delegated certain administrative and non-discretionary functions, is authorized to enter into sub-administration agreements at the expense of Credit Fund II with the approval of the board of managers of Credit Fund II, and is reimbursed by Credit Fund II for its costs and expenses and Credit Fund II’s allocable portion of overhead incurred by the Credit Fund II Administrative Agent in performing its obligations thereunder.
154

Credit Fund II Senior Notes
On November 3, 2020 and as amended on December 29, 2021, Credit Fund II Sub closed on the Credit Fund II Senior Notes (the “Credit Fund II Senior Notes”) with lenders. The Credit Fund II Senior Notes provides for secured borrowings totaling $157,500 with two tranches, A-1 and A-2 outstanding. The facility is secured by a first lien security interest in substantially all of the portfolio investments held by Credit Fund II Sub. The maturity date of the Credit Fund II Senior Notes Sub Facility is November 3, 2030. Amounts issued for the Class A-1 notes totaled $147,500 and bear interest at a rate of LIBOR plus 2.70%, and amounts issued for the Class A-2 notes totaled $10,000 and bear interest at LIBOR plus 3.20%. The A-1 Notes were rated AAA, and the A-2 Notes were rated AA by DBRS Morningstar. The terms of the Credit Fund II Senior Notes provide that as loans pay down, up to $50,000 is available from principal proceeds for reinvestment, and then the investment principal proceeds are used to directly pay down the principal balance on the Credit Fund II Senior Notes. As of December 31, 2021 and 2020, Credit Fund II Sub was in compliance with all covenants and other requirements of its respective credit agreements.
Selected Financial Data
Since inception of Credit Fund II and through December 31, 2021, the Company and CCLF each made capital contributions of $78,096 and $12,709 in members’ equity, respectively, to Credit Fund II. Below is certain summarized consolidated information for Credit Fund II as of December 31, 2021 and 2020.
As of December 31,
20212020
ASSETS
Investments, at fair value (amortized cost of $238,615 and $245,312, respectively)$239,289 $246,421 
Cash and cash equivalents (1)
10,092 1,385 
Other assets5,606 3,436 
Total assets$254,987 $251,242 
LIABILITIES AND MEMBERS’ EQUITY
Notes payable, net of unamortized debt issuance costs of $802 and $875, respectively$156,698 $156,625 
Other liabilities5,557 2,675 
Total members' equity (2)
92,732 91,942 
Total liabilities and members’ equity$254,987 $251,242 
(1) As of December 31, 2021 and 2020, all of Credit Fund II’s cash and cash equivalents was restricted.
(2) As of December 31, 2021 and 2020, the fair value of Company's ownership interest in the members' equity was $77,958 and $77,395, respectively.
For the Year Ended December 31,
20212020
Total investment income$18,822 $3,005 
Expenses
Interest and credit facility expenses4,695 766 
Other expenses897 498 
Total expenses5,592 1,264 
Net investment income (loss)13,230 1,741 
Net change in unrealized appreciation (depreciation) on investments(440)1,114 
Net increase in members’ equity resulting from operations$12,790 $2,855 
155

Below is a summary of Credit Fund II’s portfolio, followed by a listing of the loans in Credit Fund II’s portfolio as of December 31, 2021 and 2020:
As of December 31,
 20212020
Senior secured loans (1)
$240,878 $248,172 
Weighted average yields of senior secured loans based on amortized cost (2)
7.26 %7.32 %
Weighted average yields of senior secured loans based on fair value (2)
7.24 %7.29 %
Number of portfolio companies in Credit Fund II36 44 
Average amount per portfolio company (1)
$6,691 $5,640 
Percentage of portfolio at floating interest rates (3) (4)
97.7 %99.1 %
Percentage of portfolio at fixed interest rates (4)
2.3 %0.9 %
Fair value of loans with PIK provisions$17,453 $8,856 
Percentage of portfolio with PIK provisions (4)
7.3 %3.6 %
(1)At par/principal amount.
(2)Weighted average yields include the effect of accretion of discounts and amortization of premiums and are based on interest rates as of December 31, 2021 and 2020. Weighted average yield on debt and income producing securities at fair value is computed as (a) the annual stated interest rate or yield earned plus the net annual amortization of OID and market discount earned on accruing debt included in such securities, divided by (b) total first lien and second lien debt at fair value included in such securities. Weighted average yield on debt and income producing securities at amortized cost is computed as (a) the annual stated interest rate or yield earned plus the net annual amortization of OID and market discount earned on accruing debt included in such securities, divided by (b) total first lien and second lien debt at amortized cost included in such securities. Actual yields earned over the life of each investment could differ materially from the yields presented above.
(3)Floating rate debt investments are generally subject to interest rate floors.
(4)Percentages based on fair value.

156


Consolidated Schedule of Investments as of December 31, 2021
Investments (1)
FootnotesIndustry
Reference Rate & Spread (2)
Interest Rate (2)
Maturity DatePar/ Principal Amount
Amortized Cost (4)
Fair Value (5)
First Lien Debt (87.0%) of fair value)
Airnov, Inc.^(2)(3)Containers, Packaging & GlassL + 5.00%6.00%12/19/2025$9,946 $9,930 $9,946 
American Physician Partners, LLC^(2)(3)Healthcare & PharmaceuticalsL + 6.75%, 1.50% PIK9.25%2/21/20228,415 8,415 8,415 
Appriss Health, LLC^(2)(3)Healthcare & PharmaceuticalsL + 7.25%8.25%5/6/20271,197 1,178 1,198 
Apptio, Inc.^(2)(3)SoftwareL + 7.25%8.25%1/10/20255,357 5,295 5,357 
Aurora Lux FinCo S.Á.R.L. (Luxembourg)^(2)(3)SoftwareL + 6.00%7.00%12/24/20264,355 4,273 3,924 
Avenu Holdings, LLC^(2)(3)Sovereign & Public FinanceL + 5.25%6.25%9/28/2024987 980 987 
BMS Holdings III Corp.^(2)(3)Construction & BuildingL + 5.50%6.50%9/30/20263,275 3,216 3,224 
Captive Resources Midco, LLC^(2)(3)Banking, Finance, Insurance & Real EstateL + 5.50%6.25%5/31/20278,193 8,108 8,147 
Chartis Holding, LLC^(2)(3)Business ServicesL + 5.50%6.50%5/1/20259,924 9,907 9,924 
Comar Holding Company, LLC^(2)(3)Containers, Packaging & GlassL + 5.75%6.75%6/18/20248,710 8,632 8,536 
Cority Software Inc. (Canada)^(2)(3)SoftwareL + 5.00%6.00%7/2/20268,712 8,591 8,707 
Dwyer Instruments, Inc^(2)(3)Capital EquipmentL + 5.50%6.25%7/21/202710,000 9,939 9,974 
Ethos Veterinary Health LLC^(2)(3)Consumer ServicesL + 4.75%4.85%5/15/20268,134 8,080 8,134 
EvolveIP, LLC^(2)(3)TelecommunicationsL + 5.50%6.50%6/7/20258,710 8,701 8,666 
Harbour Benefit Holdings, Inc.^(2)(3)Business ServicesL + 5.25%6.25%12/13/20244,717 4,707 4,669 
K2 Insurance Services, LLC^(2)(3)Banking, Finance, Insurance & Real EstateL + 5.00%6.00%7/1/20269,012 8,914 8,998 
Kaseya, Inc.^(2)(3)High Tech IndustriesL + 5.50%, 1.00% PIK7.50%5/3/20259,092 8,987 9,038 
Material Holdings, LLC^(2)(3)Business ServicesL + 5.75%6.50%8/19/20277,980 7,896 7,891 
Maverick Acquisition, Inc.^(2)(3)Aerospace & DefenseL + 6.00%7.00%6/1/20277,980 7,814 7,808 
National Technical Systems, Inc.^(2)(3)Aerospace & DefenseL + 5.50%6.50%6/12/20238,733 8,720 8,733 
NMI AcquisitionCo, Inc.^(2)(3)High Tech IndustriesL + 5.75%6.50%9/6/20258,708 8,680 8,601 
Redwood Services Group, LLC^(2)(3)High Tech IndustriesL + 6.00%7.00%6/6/20248,736 8,724 8,737 
Riveron Acquisition Holdings, Inc.^(2)(3)Banking, Finance, Insurance & Real EstateL + 5.75%6.75%5/22/20258,173 8,074 8,173 
RSC Acquisition, Inc.^(2)(3)Banking, Finance, Insurance & Real EstateL + 5.50%6.25%11/1/20268,401 8,277 8,434 
Superior Health Linens, LLC^(2)(3)Business ServicesL + 6.50%7.50%3/31/20226,875 6,875 6,875 
TCFI Aevex LLC^(2)(3)Aerospace & DefenseL + 6.00%7.00%3/18/20261,701 1,676 1,458 
Turbo Buyer, Inc.^(2)(3)AutomotiveL + 6.00%7.00%12/2/20258,091 7,950 7,929 
US INFRA SVCS Buyer, LLC^(2)(3)Environmental IndustriesL + 6.50%7.50%4/13/20263,267 3,217 3,189 
USLS Acquisition, Inc.^(2)(3)Business ServicesL + 5.50%6.50%11/30/20246,234 6,223 6,165 
Westfall Technik, Inc.^(2)(3)Chemicals, Plastics & RubberL + 5.75%6.75%9/13/20246,418 6,337 6,359 
First Lien Debt Total$208,316 $208,196 
Second Lien Debt (13.0%) of fair value
AI Convoy S.A.R.L (United Kingdom)^(2)(3)Aerospace & DefenseL + 8.25%9.25%1/17/2028$5,514 $5,413 $5,720 
AP Plastics Acquisition Holdings, LLC^(2)(3)Chemicals, Plastics & RubberL + 7.50%8.25%8/10/20294,500 4,410 4,526 
157

Consolidated Schedule of Investments as of December 31, 2021
Investments (1)
FootnotesIndustry
Reference Rate & Spread (2)
Interest Rate (2)
Maturity DatePar/ Principal Amount
Amortized Cost (4)
Fair Value (5)
AQA Acquisition Holdings, Inc.^(2)(3)High Tech IndustriesL + 7.50%8.00%3/3/2029$5,000 $4,881 $5,004 
Quartz Holding Company^(2)(3)SoftwareL + 8.00%8.10%4/2/20274,852 4,781 4,852 
Tank Holding Corp.^(2)(3)Capital EquipmentL + 8.25%8.35%3/26/20275,514 5,446 5,569 
World 50, Inc.^(6)Business Services11.50%11.50%1/9/20275,465 5,368 5,422 
Second Lien Debt Total$30,299 $31,093 
Total Investments$238,615 $239,289 
^ Denotes that all or a portion of the assets are owned by Credit Fund II Sub. Credit Fund II Sub has entered into the Credit Fund II Sub Notes. The lenders of the Credit Fund II Sub Notes have a first lien security interest in substantially all of the assets of Credit Fund II Sub. Accordingly, such assets are not available to creditors of Credit Fund II.
(1)    Unless otherwise indicated, issuers of investments held by Credit Fund are domiciled in the United States. As of December 31, 2021, the geographical composition of investments as a percentage of fair value was 3.6% in Canada, 1.6% in Luxembourg, 2.4% in the United Kingdom and 92.4% in the United States. Certain portfolio company investments are subject to contractual restrictions on sales.
(2)Variable rate loans to the portfolio companies bear interest at a rate that is determined by reference to either LIBOR or an alternate base rate (commonly based on the Federal Funds Rate or the U.S. Prime Rate), which generally resets quarterly. For each such loan, Credit Fund II has indicated the reference rate used and provided the spread and the interest rate in effect as of December 31, 2021. As of December 31, 2021, the reference rates for Credit Fund II's variable rate loans were the 30-day LIBOR at 0.10%, the 90-day LIBOR at 0.22% and the 180-day LIBOR at 0.33%.
(3)Loan includes interest rate floor feature, which is generally 1.00%.
(4)Amortized cost represents original cost, including origination fees and upfront fees received that are deemed to be an adjustment to yield, adjusted for the accretion/amortization of discounts/premiums, as applicable, on debt investments using the effective interest method.
(5)Fair value is determined in good faith by or under the direction of the board of managers of Credit Fund II, pursuant to Credit Fund II’s valuation policy, with the fair value of all investments determined using significant unobservable inputs, which is substantially similar to the valuation policy of the Company provided in Note 3, Fair Value Measurements, to the consolidated financial statements.
(6)Represents a corporate mezzanine loan, which is subordinated to senior secured term loans of the portfolio company.

7. BORROWINGS
The Company is party to the Credit Facility and, until its termination on December 11, 2020, the SPV was party to the SPV Credit Facility as described below. In accordance with the Investment Company Act, the Company is currently only allowed to borrow amounts such that its asset coverage, as defined in the Investment Company Act, is at least 200%150% after such borrowing. For the purposes of the asset coverage ratio under the Investment Company Act, the Preferred Stock, as defined in Note 1, is considered a senior security and is included in the denominator of the calculation. As of December 31, 2017 and 2016,2021, asset coverage was 234.86%181.94% and 209.97%, respectively. During the years ended December 31, 2017, 2016Company was in compliance with all covenants and 2015, there were secured borrowingsother requirements of $816,216, $566,351 and $402,200, respectively, under the SPV Credit Facility and Credit Facility and repayments of $675,208, $378,779 and $476,328, respectively, under the SPV Credit Facility and Credit Facility. As of December 31, 20172020, asset coverage was 182.09%, and 2016, therethe Company and the SPV were $562,893in compliance with all covenants and $421,885, respectively, in securedother requirements of their respective credit facility agreements.
Below is a summary of the borrowings outstanding.and repayments under the credit facilities for the years ended December 31, 2021, 2020 and 2019, and the outstanding balances under the credit facilities for the respective periods.
For the Year Ended and as of December 31,
202120202019
Outstanding borrowing, beginning of period$347,949 $616,543 $514,635 
Borrowings419,205 452,833 755,179 
Repayments(357,500)(725,469)(655,209)
Foreign currency translation(1,999)4,042 1,938 
Outstanding borrowing, end of period$407,655 $347,949 $616,543 
SPV Credit Facility
The SPV closed onOn May 24, 2013, the SPV closed on the SPV Credit Facility, which was subsequently amended on June 30, 2014, June 19, 2015, June 9, 2016, and May 26, 2017.2017 and August 9, 2018. On December 11, 2020, the SPV repaid all outstanding amounts under the SPV Credit Facility and the facility was terminated. The SPV Credit Facility providesprovided for secured borrowings during the applicable revolving period up to an amount equal to the lesser of $400,000 (the borrowing base as calculated pursuant to the terms of the SPV Credit Facility) and the amount of net cash proceeds and unpledged capital commitments the Company has received, with an accordion feature that can, subject to certain conditions, increase the aggregate maximum credit commitment up to an amount not to exceed $750,000,$275,000, subject to restrictions imposed on borrowings under the Investment Company Act and certain restrictions and conditions set forth in the SPV Credit
158

Facility, including adequate collateral to support such borrowings. The SPV Credit Facility hashad a revolving period through May 22, 202021, 2021 and a maturity date of May 23, 2022.2023. Borrowings under the SPV Credit Facility bearbore interest initially at the applicable commercial paper rate (if the lender is a conduit lender) or LIBOR (or, if applicable, a rate based on the prime rate or federal funds rate) plus 2.00% per year through May 23, 2018, with a pre-determined future interest rate increase of 0.50% during the final two years of the revolving period and pre-determined future interest rate increases of 0.875%-1.75% over the two years following the end of the revolving period.year. The SPV iswas also required to pay an undrawn commitment fee of between 0.50% and 0.75% per year depending on the drawings under the SPV Credit Facility. Payments under the SPV Credit Facility arewere made quarterly. The lenders havehad a first lien security interest on substantially all of the assets of the SPV.
As part of the SPV Credit Facility, the SPV is subject to limitations as to how borrowed funds may be used and the types of loans that are eligible to be acquired by the SPV including, but not limited to, restrictions on sector and geographic concentrations, loan size, payment frequency, tenor and minimum investment ratings (or estimated ratings). In addition, borrowed funds are intended to be used primarily to purchase first lien loan assets, and the SPV is limited in its ability to purchase certain other assets (including, but not limited to, second lien loans, covenant-lite loans, revolving and delayed draw loans and discount loans) and other assets are not permitted to be purchased (including, but not limited to paid-in-kind loans and structured finance obligations). The SPV Credit Facility has certain requirements relating to interest coverage, collateral quality and portfolio performance, including limitations on delinquencies and charge offs, certain violations of which could result in the immediate acceleration of the amounts due under the SPV Credit Facility. The SPV Credit Facility is also subject to a borrowing base that applies different advance rates to assets held by the SPV based generally on the fair market value of


such assets. Under certain circumstances as set forth in the SPV Credit Facility, the Company could be obliged to repurchase loans from the SPV.
As of December 31, 2017 and 2016, the SPV was in compliance with all covenants and other requirements of the SPV Credit Facility.
Credit Facility
The Company closed on the Credit Facility on March 21, 2014, on the Credit Facility, which was subsequently amended on January 8, 2015, May 25, 2016, and March 22, 2017.2017, September 25, 2018, June 14, 2019 and October 28, 2020. The maximum principal amount of the Credit Facility is $413,000,$688,000, subject to availability under the Credit Facility, which is based on certain advance rates multiplied by the value of the Company’s portfolio investments (subject to certain concentration limitations) net of certain other indebtedness that the Company may incur in accordance with the terms of the Credit Facility. Proceeds of the Credit Facility may be used for general corporate purposes, including the funding of portfolio investments. Maximum capacity under the Credit Facility may be increased to $550,000$900,000 through the exercise by the Company of an uncommitted accordion feature through which existing and new lenders may, at their option, agree to provide additional financing. The Credit Facility includes a $20,000$50,000 limit for swingline loans and a $5,000$20,000 limit for letters of credit. The Company may borrow amounts in U.S. dollars or certain other permitted currencies. Amounts drawn under the Credit Facility, including amounts drawn in respect of letters of credit, bear interest at either LIBOR plus an applicable spread of 2.25%, or an “alternative base rate” (which is the highest of a prime rate, the federal funds effective rate plus 0.50%, or one month LIBOR plus 1.00%) plus an applicable spread of 1.25%. The Company may elect either the LIBOR or the “alternative base rate” at the time of drawdown, and loans may be converted from one rate to another at any time, subject to certain conditions. The Company also pays a fee of 0.375% on undrawn amounts under the Credit Facility and, in respect of each undrawn letter of credit, a fee and interest rate equal to the then-applicable margin under the Credit Facility while the letter of credit is outstanding. The availability period under the Credit Facility will terminate on March 21, 2021October 28, 2024 and the Credit Facility will mature on March 21, 2022.October 28, 2025. During the period from March 21, 2021October 29, 2024 to March 21, 2022,October 28, 2025, the Company will be obligated to make mandatory prepayments under the Credit Facility out of the proceeds of certain asset sales, other recovery events and equity and debt issuances.
Subject to certain exceptions, the Credit Facility is secured by a first lien security interest in substantially all of the portfolio investments held by the Company. The Credit Facility includes customary covenants, including certain financial covenants related to asset coverage, shareholders’ equity and liquidity, certain limitations on the incurrence of additional indebtedness and liens, and other maintenance covenants, as well as usual and customary events of default for senior secured revolving credit facilities of this nature.
As of December 31, 20172021 and 2016,December 31, 2020, the Company was in compliance with all covenants and other requirements of the Credit Facility.
Summary of Facilitiesthe Credit Facility
The FacilitiesCredit Facility consisted of the following as of December 31, 20172021 and 2016:2020:
 December 31, 2021
 Total
Facility
Borrowings
Outstanding
Unused 
Portion (1)
Amount Available (2)
Credit Facility$688,000 $407,655 $280,345 $280,706 
Total$688,000 $407,655 $280,345 $280,706 
 December 31, 2020
 Total
Facility
Borrowings
Outstanding
Unused 
Portion
 (1)
Amount Available (2)
Credit Facility$688,000 $347,949 $340,051 $207,365 
Total$688,000 $347,949 $340,051 $207,365 
(1)The unused portion is the amount upon which commitment fees are based.
(2)Available for borrowing based on the computation of collateral to support the borrowings and subject to compliance with applicable covenants and financial ratios.
159

 December 31, 2017
 
Total
Facility
 
Borrowings
Outstanding
 Unused Portion (1) 
Amount
Available (2)
SPV Credit Facility$400,000
 $287,393
 $112,607
 $27,147
Credit Facility413,000
 275,500
 137,500
 137,500
Total$813,000
 $562,893
 $250,107
 $164,647

 December 31, 2016
 
Total
Facility
 
Borrowings
Outstanding
 Unused Portion (1) 
Amount
Available (2)
SPV Credit Facility$400,000
 $252,885
 $147,115
 $5,988
Credit Facility220,000
 169,000
 51,000
 51,000
Total$620,000
 $421,885
 $198,115
 $56,988
(1)The unused portion is the amount upon which commitment fees are based.
(2)Available for borrowing based on the computation of collateral to support the borrowings and subject to compliance with applicable covenants and financial ratios.


As of December 31, 2017 and 2016, $3,140 and $1,667, respectively, of interest expense, $186 and $203, respectively, of unused commitment fees and $23 and $23, respectively, of other fees were included in interest and credit facility fees payable. For the years ended December 31, 2017 and 2016 and 2015, the weighted average interest rate was 3.31%, 2.73% and 2.23%, respectively, and average principal debt outstanding was $455,144, $307,734 and $265,277, respectively. As of December 31, 2017 and 2016, the weighted average interest rate was 3.56% and 2.92%, respectively, based on floating LIBOR rates.
For the years ended December 31, 2017, 20162021, 2020 and 2015,2019, the components of interest expense and credit facility fees were as follows:
 For the years ended December 31,
 202120202019
Interest expense$9,219 $16,127 $30,221 
Facility unused commitment fee1,161 1,766 1,263 
Amortization of deferred financing costs763 1,886 1,618 
Other fees— 109 198 
Total interest expense and credit facility fees$11,143 $19,888 $33,300 
Cash paid for interest expense$9,890 $17,759 $30,312 
Average principal debt outstanding$382,126 $543,099 $676,347 
Weighted average interest rate2.38 %2.92 %4.41 %
    As of December 31, 2021 and 2020, the components of interest and credit facility fees payable were as follows:
As of December 31,
20212020
Interest expense payable$264 $119 
Unused commitment fees payable
Other credit facility fees payable— 14 
Interest and credit facility fees payable$267 $137 
Weighted average interest rate
(based on floating LIBOR rates)
2.39 %2.59 %
8. NOTES PAYABLE
    Senior Notes
    On December 30, 2019, the Company closed a private offering of $115.0 million in aggregate principal amount of 4.750% Senior Unsecured Notes due December 31, 2024. Interest is payable quarterly, beginning March 31, 2020. On December 11, 2020, the Company issued an additional $75.0 million aggregate principal amount of senior unsecured notes due December 31, 2024. The 2020 Notes bear interest an interest rate of 4.500% and interest is payable quarterly, beginning December 31, 2020.
The interest rate on the Senior Notes is subject to increase (up to an additional 1.00% over the stated rate of such notes) in the event that, subject to certain exceptions, the Senior Notes cease to have an investment grade rating. The Company is obligated to offer to repay the notes at par if certain change in control events occur. The Senior Notes are general unsecured obligations of the Company that rank pari passu with all outstanding and future unsecured unsubordinated indebtedness issued by the Company. Interest expense on the Senior Notes during the years ended December 31, 2021 and 2020 was $8,837 and $5,644 respectively.
    The note purchase agreement, as supplemented by the first supplement, for the Senior Notes contains customary terms and conditions for senior unsecured notes issued in a private placement, including, without limitation, affirmative and negative covenants such as information reporting, maintenance of the Company’s status as a business development company within the meaning of the Investment Company Act and a regulated investment company under the Code, minimum asset coverage ratio and interest coverage ratio, and prohibitions on certain fundamental changes at the Company or any subsidiary guarantor, as well as customary events of default with customary cure and notice, including, without limitation, nonpayment, breach of covenant, material breach of representation or warranty under the note purchase agreement, cross-acceleration under other indebtedness of the Company or certain significant subsidiaries, certain judgments and orders, and certain events of bankruptcy. As of December 31, 2021 and 2020, the Company was in compliance with these terms and conditions.
160

 For the years ended December 31,
 2017 2016 2015
Interest expense$15,296
 $8,559
 $6,008
Facility unused commitment fee1,117
 1,253
 847
Amortization of deferred financing costs745
 1,213
 945
Other fees121
 107
 106
Total interest expense and credit facility fees$17,279
 $11,132
 $7,906
Cash paid for interest expense$13,806
 $7,828
 $6,062
7. 2015-1    2015-1R Notes
On June 26, 2015, the Company completed the 2015-1 Debt Securitization. The 2015-1 Notes were issued by the 2015-1 Issuer, a wholly ownedwholly-owned and consolidated subsidiary of the Company, and are secured by a diversified portfolio of the 2015-1 Issuer consisting primarily of first and second lien senior secured loans.Company. The 2015-1 Debt Securitization was executed through a private placement of the 2015-1 Notes, consisting of $160,000of:
$160,000 of Aaa/AAA Class A-1A Notes which bear interest at the three-month London Interbank Offered Rate (“LIBOR”) plus 1.85%; $40,000Notes;
$40,000 of Aaa/AAA Class A-1B Notes which bear interest at the three-month LIBOR plus 1.75% for the first 24 months and the three-month LIBOR plus 2.05% thereafter; $27,000Notes;
$27,000 of Aaa/AAA Class A-1C Notes which bear interest at 3.75%;Notes; and $46,000
$46,000 of Aa2 Class A-2 Notes which bear interest at the three month LIBOR plus 2.70%.Notes.
    The 2015-1 Notes were issued at par and arewere scheduled to mature on July 15, 2027. The Company received 100% of the preferred interests issued by the 2015-1 Issuer (the “2015-1 Issuer Preferred Interests”) on the closing date of the 2015-1 Debt Securitization in exchange for the Company’s contribution to the 2015-1 Issuer of the initial closing date loan portfolio. The 2015-1 Issuer Preferred Interests do not bear interest and had a nominal value of $125,900 at closing. In connection with the contribution, the Company made customary representations, warranties and covenants to the 2015-1 Issuer in the purchase agreement. The Class A-1A, Class A-1B and Class A-1C and Class A-2 Notes are included in these consolidated financial statements. The 2015-1 Issuer Preferred Interests were eliminated in consolidation.
On the closing date of the 2015-1 Debt Securitization, the 2015-1 Issuer effected a one-time distribution to the Company of a substantial portion of the proceeds of the private placement of the 2015-1 Notes, net of expenses, which distribution was used to repay a portion of certain amounts outstanding under the SPV Credit Facility and the Credit Facility. As part of the 2015-1 Debt Securitization, certain first and second lien senior secured loans were distributed by the SPV to the Company pursuant to a distribution and contribution agreement.
On August 30, 2018, the Company and the 2015-1 Issuer closed the 2015-1 Debt Securitization Refinancing. On the closing date of the 2015-1 Debt Securitization Refinancing, the 2015-1 Issuer, among other things:
(a) refinanced the issued Class A-1A Notes by redeeming in full the Class A-1A Notes and issuing new AAA Class A-1-1-R Notes in an aggregate principal amount of $234,800 which bear interest at the three-month LIBOR plus 1.55%;
(b) refinanced the issued Class A-1B Notes by redeeming in full the Class A-1B Notes and issuing new AAA Class A-1-2-R Notes in an aggregate principal amount of $50,000 which bear interest at the three-month LIBOR plus 1.48% for the first 24 months and the three-month LIBOR plus 1.78% thereafter;
(c) refinanced the issued Class A-1C Notes by redeeming in full the Class A-1C Notes and issuing new AAA Class A-1-3-R Notes in an aggregate principal amount of $25,000 which bear interest at 4.56%;
(d) refinanced the issued Class A-2 Notes by redeeming in full the Class A-2 Notes and issuing new Class A-2-R Notes in an aggregate principal amount of $66,000 which bear interest at the three-month LIBOR plus 2.20%;
(e) issued new single-A Class B Notes and BBB- Class C Notes in aggregate principal amounts of $46,400 and $27,000, respectively, which bear interest at the three-month LIBOR plus 3.15% and the three-month LIBOR plus 4.00%, respectively;
(f) reduced the 2015-1 Issuer Preferred Interests by approximately $21,375 from a nominal value of $125,900 to approximately $104,525 at close; and
(g) extended the reinvestment period end date and maturity date applicable to the 2015-1 Issuer to October 15, 2023 and October 15, 2031, respectively.
Following the 2015-1 Debt Securitization Refinancing, the Company retained the 2015-1 Issuer Preferred Interests. The 2015-1R Notes in the 2015-1 Debt Securitization Refinancing were issued by the 2015-1 Issuer and are secured by a diversified portfolio of the 2015-1 Issuer consisting primarily of first and second lien senior secured loans.
On the closing date of the 2015-1 Debt Securitization Refinancing, the 2015-1 Issuer effected a one-time distribution to the Company of a substantial portion of the proceeds of the private placement of the 2015-1R Notes, net of expenses, which distribution was used to repay a portion of certain amounts outstanding under the SPV Credit Facility and the Credit Facility. As part of the 2015-1 Debt Securitization Refinancing, certain first and second lien senior secured loans were distributed by the SPV to the Company pursuant to a distribution and contribution agreement. The Company contributed the loans that comprised the initial closing date loan portfolio (including the loans distributed to the Company from the SPV) to the 2015-1 Issuer pursuant to a contribution agreement. Future loan transfers from the Company to the 2015-1 Issuer will be made pursuant to a sale agreement and are subject to the approval of the Company’s Board of Directors. Assets of the 2015-1 Issuer are not
161

available to the creditors of the SPV or the Company. In connection with the issuance and sale of the 2015-12015-1R Notes, the Company made customary representations, warranties and covenants in the purchase agreement.
During the reinvestment period, pursuant to the indenture governing the 2015-12015-1R Notes, all principal collections received on the underlying collateral may be used by the 2015-1 Issuer to purchase new collateral under the direction of Investment Adviser in its capacity as collateral manager of the 2015-1 Issuer and in accordance with the Company’s investment strategy.
The Investment Adviser serves as collateral manager to the 2015-1 Issuer under a collateral management agreement (the “Collateral Management Agreement”). Pursuant to the Collateral Management Agreement, the 2015-1 Issuer pays management fees (comprised of base management fees, subordinated management fees and incentive management fees) to the Investment Adviser for rendering collateral management services. As per the Collateral Management Agreement, for the period the Company retains all of the 2015-1 Issuer Preferred Interests, the Investment Adviser does not earn management fees for


providing such collateral management services. The Company currently retains all of the 2015-1 Issuer Preferred Interests, thus the Investment Adviser did not earn any management fees from the 2015-1 Issuer for the year ended December 31, 2017.2021 and 2020. Any such waived fees may not be recaptured by the Investment Adviser.
Pursuant to an undertaking by the Company in connection with the 2015-1 Debt Securitization Refinancing, the Company has agreed to hold on an ongoing basis the 2015-1 Issuer Preferred Interests with an aggregate dollar purchase price at least equal to 5% of the aggregate outstanding amount of all collateral obligations by the 2015-1 Issuer for so long as any securities of the 2015-1 Issuer remain outstanding. As of December 31, 2017,2021, the Company was in compliance with its undertaking.
The 2015-1 Issuer pays ongoing administrative expenses to the trustee, independent accountants, legal counsel, rating agencies and independent managers in connection with developing and maintaining reports, and providing required services in connection with the administration of the 2015-1 Issuer.    
As of December 31, 2017,2021, there were 6160 first lien and second lien senior secured loans with a total fair value of approximately $394,162$473,930 and cash of $1,291$70,081 securing the 2015-12015-1R Notes. The pool of loans in the securitization must meet certain requirements, including asset mix and concentration, term, agency rating, collateral coverage, minimum coupon, minimum spread and sector diversity requirements in the indenture governing the 2015-12015-1R Notes.
For the years ended December 31, 20172021 and 2016,2020, the effective annualized weighted average interest rate,rates, which includesinclude amortization of debt issuance costs, were 2.37% and 2.42%, respectively based on floating LIBOR rates, excluding the one-time impact of the 2015-1 Notes, was 3.33%Debt Securitization Refinancing. As of December 31, 2021 and 2.89%2020, the weighted average interest rates were 2.27% and 2.37%, respectively, based on floating LIBOR rates.
As of December 31, 20172021 and 2016, $2,0032020, $2,200 and $1,706,$2,302, respectively, of interest expense was included in interest and credit facility fees payable. For the years ended December 31, 2017, 20162021, 2020 and 2015,2019, the components of interest expense on the 2015-12015-1R Notes were as follows:
 For the years ended December 31,
 202120202019
Interest expense$10,526 $13,802 $20,104 
Amortization of deferred financing costs247 247 247 
Total interest expense$10,773 $14,049 $20,351 
Cash paid for interest expense$10,628 $15,390 $19,669 
162
 For the years ended December 31,
 2017 2016 2015
Interest expense$9,010
 $7,698
 $3,468
Amortization of deferred financing costs204
 205
 106
Total interest expense and credit facility fees$9,214
 $7,903
 $3,574
Cash paid for interest expense$8,713
 $7,439
 $2,021

8. COMMITMENTS9. COMMMITMENTS AND CONTINGENCIES
A summary of significant contractual payment obligations was as follows as of December 31, 20172021 and 2016:2020:
SPV Credit Facility and Credit Facility 2015-1 NotesAs of December 31,
Payment Due by PeriodDecember 31,
2017
 December 31,
2016
 December 31, 2017 December 31,
2016
Payment Due by Period20212020
Less than 1 Year$
 $
 $
 $
Less than 1 Year$— $— 
1-3 Years


1-3 Years190,000 — 
3-5 Years562,893
 421,885
 
 
3-5 Years407,655 537,949 
More than 5 Years
 
 273,000
 273,000
More than 5 Years449,200 449,200 
Total$562,893
 $421,885
 $273,000
 $273,000
Total$1,046,855 $987,149 
In the ordinary course of its business, the Company enters into contracts or agreements that contain indemnification or warranties. Future events could occur that lead to the execution of these provisions against the Company. The Company believes that the likelihood of such an event is remote; however, the maximum potential exposure is unknown. No accrual has been made in the consolidated financial statements as of December 31, 20172021 and 20162020 for any such exposure.
Upon the completion of the IPO, uncalled capital commitments payable to the Company by the Company’s pre-IPO investors were automatically reduced to zero.


The Company had the following unfunded commitments to fund delayed draw and revolving senior secured loans as of the indicated dates:
 Par Value as of December 31,
 20212020
Unfunded delayed draw commitments$112,985 $73,292 
Unfunded revolving term loan commitments67,513 76,216 
Total unfunded commitments$180,498 $149,508 
 Par Value as of
 December 31, 2017 December 31, 2016
Unfunded delayed draw commitments$39,383
 $35,704
Unfunded revolving term loan commitments78,991
 24,063
Total unfunded commitments$118,374
 $59,767
9.10. NET ASSETS
The Company has the authority to issue 200,000,000198,000,000 shares of common stock, $0.01 per share par value.
During the year ended December 31, 2017,Cumulative Convertible Preferred Stock
On May 5, 2020, the Company issued 20,505,285and sold 2,000,000 shares for $373,700 includingof Preferred Stock to an affiliate of Carlyle in a private placement at a price of $25 per share. The Preferred Stock has a liquidation preference equal to $25 per share (the “Liquidation Preference”) plus any accumulated but unpaid dividends up to but excluding the reinvestmentdate of dividends. In connection withdistribution. Dividends are payable on a quarterly basis in an initial amount equal to 7.00% per annum of the NFIC Acquisition,Liquidation Preference per share, payable in cash, or at the Company issued 434,233Company’s option, 9.00% per annum of the Liquidation Preference payable in additional shares of Preferred Stock. After May 5, 2027, the dividend rate will increase annually, in each case by 1.00% per annum.
    The Preferred Stock is convertible, in whole or in part, at the option of the holder of the Preferred Stock into the number of shares of common stock valued at approximately $8,046. See Note 14 for additional information regardingequal to the NFIC Acquisition. In connectionLiquidation Preference plus any accumulated but unpaid dividends, divided by an initial conversion price of $9.50, subject to certain adjustments to prevent dilution as set forth in the Company's Articles Supplementary. The conversion price as of December 31, 2021 was $9.46. At any time after May 5, 2023, the Company, with the Company’s IPO,approval of the Board of Directors, including a majority of the Independent Directors, will have the option to redeem all of the Preferred Stock for cash consideration equal to the Liquidation Preference plus any accumulated but unpaid dividends. The holders of the Preferred Stock will have the right to convert all or a portion of their shares of Preferred Stock prior to the date fixed for such redemption. At any time after May 5, 2027, the holders of the Preferred Stock will have the option to require the Company issued 9,454,200to redeem any or all of the then-outstanding Preferred Stock upon 90 days’ notice. The form of consideration used in any such redemption is at the option of the Board of Directors, including a majority of the Independent Directors, and may be cash consideration equal to the Liquidation Preference plus any accumulated but unpaid dividends, or shares of common stock. Holders also have the right to redeem the Preferred Stock upon a Change in Control (as defined in the Article Supplementary).
163

The following table summarizes the Company’s dividends declared on its preferred stock (including shares issued pursuant tofrom issuance through December 31, 2021. Unless otherwise noted, dividends were declared and paid, or are payable, in cash.
Date DeclaredRecord DatePayment DatePer Share Amount
June 30, 2020June 30, 2020June 30, 2020$0.277 
September 30, 2020September 30, 2020September 30, 20200.423 
December 31, 2020December 31, 2020December 31, 20200.438 
Total$1.138 
March 31, 2021March 31, 2021March 31, 2021$0.438 
June 30, 2021June 30, 2021June 30, 20210.438 
September 30, 2021September 30, 2021September 30, 20210.438 
December 29, 2021December 31, 2021December 31, 20210.438 
Total$1.752 

Company Stock Repurchase Plan
On November 1, 2021, the exerciseCompany's Board of Directors approved the continuation of the underwriters’ over-allotment option) at a public offering priceCompany's $150 million stock repurchase program (the “Company Stock Repurchase Program”) until November 5, 2022, or until the approved dollar amount has been used to repurchase shares of $18.50 per share. Net of underwriting costs,common stock. This program may be suspended, extended, modified or discontinued by the Company received cash proceedsat any time, subject to applicable law. The Company's Stock Repurchase Program was originally approved by the Company's Board of $169,488. Directors on November 5, 2018 and announced on November 6, 2018. Since the inception of the Company Stock Repurchase Program through December 31, 2021, the Company has repurchased 9,426,205 shares of the Company's common stock at an average cost of $13.29 per share, or $125,287 in the aggregate, resulting in accretion to net assets per share of $0.51.
The following table summarizes capital activity during the year ended December 31, 2017:2021:
 Preferred Stock
 
Common Stock
Capital in Excess of Par ValueOffering CostsAccumulated Net Investment Income (Loss)Accumulated Net Realized Gain (Loss)Accumulated Net Unrealized Appreciation (Depreciation)Total Net Assets
 SharesAmountSharesAmount
Balance, January 1, 20212,000,000 $50,000 55,320,309 $553 $1,081,436 $(1,633)$14,568 $(140,133)$(103,428)$901,363 
Repurchase of common stock— — (2,177,855)(21)(28,418)— — — — (28,439)
Net investment income (loss)— — — — — — 86,851 — — 86,851 
Net realized gain (loss)— — — — — — — 18,861 — 18,861 
Net change in unrealized appreciation (depreciation)— — — — — — — — 54,641 54,641 
Dividends declared on common stock and preferred stock— — — — — — (84,473)— — (84,473)
Tax reclassification of stockholders’ equity in accordance with U.S. GAAP— — — — (591)— 2,616 (2,025)— — 
Balance, December 31, 20212,000,000 $50,000 53,142,454 $532 $1,052,427 $(1,633)$19,562 $(123,297)$(48,787)$948,804 
164

 Common Stock Capital in Excess of Par Value Offering Costs Accumulated Net Investment Income (Loss) Accumulated Net Realized Gain (Loss) on Investments Accumulated Net Unrealized Appreciation (Depreciation) on Investments Total Net Assets
Shares Amount 
Balance, beginning of year41,702,318
 $417
 $799,580
 $(74) $(3,207) $(25,357) $(7,222) $764,137
Common stock issued20,146,561
 201
 366,818


 367,019
Reinvestment of dividends358,724
 4
 6,677


 6,681
Offering costs
 
 
 (1,544) 
 
 
 (1,544)
Net investment income (loss)


 92,151
 
 
 92,151
Net realized gain (loss) on investments


 (11,692) 
 (11,692)
Net change in unrealized appreciation (depreciation) on investments


 3,741
 3,741
Dividends declared


 (93,189) 
 
 (93,189)
Tax reclassification of stockholders’ equity in accordance with US GAAP
 
 (268) 
 6,767
 (6,499) 
 
Balance, end of year62,207,603
 $622
 $1,172,807
 $(1,618) $2,522
 $(43,548) $(3,481) $1,127,304

During the year ended December 31, 2016, the Company issued 10,178,235 shares for $185,816 including reinvestment of dividends. The following table summarizes capital activity during the year ended December 31, 2016:2020:
 Preferred Stock
 
Common Stock
Capital in Excess of Par ValueOffering CostsAccumulated Net Investment Income (Loss)Accumulated Net Realized Gain (Loss)Accumulated Net Unrealized Appreciation (Depreciation)Total Net Assets
 SharesAmountSharesAmount
Balance, beginning of year— $— 57,763,811 $578 $1,109,238 $(1,633)$10,368 $(82,654)$(79,426)$956,471 
Issuance of Preferred Stock2,000,000 50,000 — — — — — — — 50,000 
Net investment income (loss)— — — — — — 88,807 — — 88,807 
Net realized gain (loss)— — — — — — — (57,976)— (57,976)
Net change in unrealized appreciation (depreciation)— — — — — — — — (24,002)(24,002)
Dividends declared on common stock and preferred stock— — — — — — (84,683)— — (84,683)
Repurchase of common stock— — (2,443,502)(25)(27,229)— — — — (27,254)
Tax reclassification of stockholders’ equity in accordance with U.S. GAAP— — — — (573)— 76 497 — — 
Balance, end of year2,000,000 $50,000 55,320,309 $553 $1,081,436 $(1,633)$14,568 $(140,133)$(103,428)$901,363 
 Common Stock Capital in Excess of Par Value Offering Costs Accumulated Net Investment Income (Loss) Accumulated Net Realized Gain (Loss) on Investments Accumulated Net Unrealized Appreciation (Depreciation) on Investments Total Net Assets
Shares Amount 
Balance, beginning of year31,524,083
 $315
 $613,944
 $(74) $(12,994) $(2,411) $(27,054) $571,726
Common stock issued10,162,898
 102
 185,435


 185,537
Reinvestment of dividends15,337
 
 279


 279
Net investment income (loss)


 59,621
 
 
 59,621
Net realized gain (loss) on investments


 (9,644) 
 (9,644)
Net change in unrealized appreciation (depreciation) on investments


 19,832
 19,832
Dividends declared


 (63,214) 
 
 (63,214)
Tax reclassification of stockholders’ equity in accordance with US GAAP
 
 (78) 
 13,380
 (13,302) 
 
Balance, end of year41,702,318
 $417
 $799,580
 $(74) $(3,207) $(25,357) $(7,222) $764,137


During the year ended December 31, 2015, the Company issued 13,591,386 shares for $262,485 including reinvestment of dividends. The following table summarizes capital activity during the year ended December 31, 2015:2019:
Common Stock Capital in Excess of Par Value Offering Costs Accumulated Net Investment Income (Loss) Accumulated Net Realized Gain (Loss) on Investments Accumulated Net Unrealized Appreciation (Depreciation) on Investments Total Net Assets Common StockCapital in Excess of Par ValueOffering CostsAccumulated Net Investment Income (Loss)Accumulated Net Realized Gain (Loss)Accumulated Net Unrealized Appreciation (Depreciation)Total Net Assets
Shares Amount SharesAmount
Balance, beginning of year17,932,697
 $179
 $351,636
 $(74) $(4,388) $(57) $(9,039) $338,257
Balance, beginning of year62,230,251 $622 $1,174,334 $(1,633)$5,901 $(44,572)$(71,434)$1,063,218 
Common stock issued13,584,508
 136
 262,218


 262,354
Reinvestment of dividends6,878
 
 131


 131
Net investment income (loss)


 35,524
 
 
 35,524
Net investment income (loss)— — — — 107,665 — — 107,665 
Net realized gain (loss) on investments


 1,164
 
 1,164
Net change in unrealized appreciation (depreciation) on investments


 (18,015) (18,015)
Net realized gain (loss)Net realized gain (loss)— — — — — (38,343)— (38,343)
Net change in unrealized appreciation (depreciation)Net change in unrealized appreciation (depreciation)— — — — — — (7,992)(7,992)
Dividends declared


 (47,689) 
 
 (47,689)Dividends declared— — — — (103,360)— — (103,360)
Tax reclassification of stockholders’ equity in accordance with US GAAP
 
 (41) 
 3,559
 (3,518) 
 
Repurchase of common stockRepurchase of common stock(4,466,440)(44)(64,673)— — — — (64,717)
Tax reclassification of stockholders’ equity in accordance with U.S. GAAPTax reclassification of stockholders’ equity in accordance with U.S. GAAP— — (423)— 162 261 — — 
Balance, end of year31,524,083
 $315
 $613,944
 $(74) $(12,994) $(2,411) $(27,054) $571,726
Balance, end of year57,763,811 $578 $1,109,238 $(1,633)$10,368 $(82,654)$(79,426)$956,471 
The following table summarizes total
There were no shares of common stock issued and proceeds received related to capital activity during the year ended December 31, 2017:
 Shares Issued Proceeds Received
January 24, 2017*5,837
 $108
April 24, 2017*5,133
 94
May 19, 20172,141,417
 39,488
June 9, 20178,116,711
 149,997
June 9, 2017**434,233
 8,046
June 19, 20179,000,000
 161,505
July 5, 2017454,200
 7,983
October 18, 2017*347,754
 6,479
Total20,505,285
 $373,700
* Represents shares issued upon the reinvestment of dividends.
** Represents shares issued in accordance with the elections of the NFIC stockholders pursuant to the NFIC Acquisition (see Note 14, NFIC Acquisition)
The following table summarizes total shares issued and proceeds received related to capital activity during the year ended December 31, 2016:
 Shares Issued Proceeds Received
January 22, 2016*3,885
 $74
March 11, 20161,815,181
 33,000
April 22, 2016*2,988
 54
May 6, 20161,510,859
 26,999
June 24, 20161,660,333
 30,102
July 22, 2016*3,756
 66
August 26, 20161,909,449
 35,000
September 16, 20161,360,948
 25,001
October 24, 2016*4,708
 85
November 18, 20161,906,128
 35,435
Total10,178,235
 $185,816


* Represents shares issued upon the reinvestment of dividends.
The following table summarizes total shares issued and proceeds received related to capital activity during the year ended December 31, 2015:
 Shares Issued Proceeds Received
January 16, 2015924,977
 $18,000
January 26, 2015*1,051
 20
February 26, 20152,312,659
 45,005
April 21, 2015*1,351
 25
May 1, 20151,462,746
 28,085
May 22, 20151,708,068
 33,000
June 25, 20152,412,386
 46,992
July 22, 2015*2,018
 38
August 21, 20151,032,504
 20,002
September 30, 2015104,954
 2,009
October 9, 20151,255,914
 24,038
October 22, 2015*2,458
 47
December 21, 20152,370,300
 45,224
Total13,591,386
 $262,485
* Represents shares issued upon the reinvestment of dividends.
Subscription transactions during the years ended December 31, 2017, 20162021, 2020 and 2015 were executed at an offering price that represented a premium to net asset value due to the requirement to use prior quarter net asset value as the offering price unless it would result in the Company selling shares of its common stock at a price below the current net asset value and also in order to effect a reallocation of organizational costs to subsequent investors. Additionally, on June 19, 2017, the Company closed its IPO, issuing 9,454,200 shares of its common stock (including the exercise of the underwriters’ over-allotment option on July 5, 2017) at a public offering price of $18.50 per share. Net of underwriting costs, the common stock issued in the IPO and net asset value experienced dilution during the period, and such subscription and IPO transactions increased/(decreased) net asset value by $(0.11) per share, $0.01 per share, and $0.11 per share, respectively, for the years ended December 31, 2017, 2016 and 2015, respectively.2019.
The Company computes earnings per common share in accordance with ASC 260, Earnings Per Share. Basic earnings per common share were calculated by dividing net increase (decrease) in net assets resulting from operations, attributable to the Companyless preferred dividends, by the weighted-average number of shares of common sharesstock outstanding for the year. Diluted earnings per share gives effect to all dilutive potential shares of common stock outstanding using the if-converted method for the convertible Preferred Stock. Diluted earnings per share excludes all dilutive potential shares of common stock if their effect is anti-dilutive. The convertible Preferred Stock was not included in the calculation of diluted earnings per share for the year ended December 31, 2021 or for the year ended December 31, 2020 because it would have had an anti-dilutive effect.
165

Basic and diluted earnings per common share were as follows:
 For the years ended December 31,
 2017 2016 2015
Net increase (decrease) in net assets resulting from operations$84,200
 $69,809
 $18,673
Weighted-average common shares outstanding52,997,450
 36,152,390
 24,830,200
Basic and diluted earnings per common share$1.59
 $1.93
 $0.75


For the years ended December 31,
202120202019
BasicDilutedBasicDilutedBasicDiluted
Net increase (decrease) in net assets resulting from operations attributable to Common Stockholders$156,853 $160,353 $4,554 $4,554 $61,330 $61,330 
Weighted-average shares of common stock outstanding54,244,432 59,531,683 56,421,137 56,421,137 60,189,502 60,189,502 
Basic and diluted earnings per share$2.89 $2.69 $0.08 $0.08 $1.02 $1.02 
The following table summarizes the Company’s dividends declared during the three most recent fiscal years:
Date DeclaredRecord DatePayment DatePer Share Amount 
February 22, 2019March 29, 2019April 17, 2019$0.37 
May 6, 2019June 28, 2019July 17, 2019$0.37 
June 17, 2019June 28, 2019July 17, 2019$0.08 (1)
August 5, 2019September 30, 2019October 17, 2019$0.37 
November 4, 2019December 31, 2019January 17, 2020$0.37 
December 12, 2019December 31, 2019January 17, 2020$0.18 (1)
February 24, 2020March 31, 2020April 17, 2020$0.37 
May 4, 2020June 30, 2020July 17, 2020$0.37 
August 3, 2020September 30, 2020October 16, 2020$0.32 (2)
August 3, 2020September 30, 2020October 16, 2020$0.05 (1)
November 2, 2020December 31, 2020January 15, 2021$0.32 
November 2, 2020December 31, 2020January 15, 2021$0.04 (1)
February 22, 2021March 31, 2021April 16, 2021$0.32 
February 22, 2021March 31, 2021April 16, 2021$0.05 (1)
May 3, 2021June 30, 2021July 15, 2021$0.32 
May 3, 2021June 30, 2021July 15, 2021$0.04 (1)
August 2, 2021September 30, 2021October 15, 2021$0.32 
August 2, 2021September 30, 2021October 15, 2021$0.06 (1)
November 1, 2021December 31, 2021January 14, 2022$0.32 
November 1, 2021December 31, 2021January 14, 2022$0.07 (1)
(1)Represents a special/supplemental dividend.
(2)The Company updated its dividend policy such that the base dividend is $0.32 per share of common stock, effective with the third quarter 2020 dividend. The Company's dividend policy is subject to change by the Board of Directors in its sole discretion at any time.
166
Date Declared Record Date Payment Date Per Share Amount 
March 11, 2015 March 13, 2015 April 17, 2015 $0.37
 
June 24, 2015 June 30, 2015 July 22, 2015 $0.37
 
September 24, 2015 September 24, 2015 October 22, 2015 $0.42
 
December 29, 2015 December 29, 2015 January 22, 2016 $0.40
 
December 29, 2015 December 29, 2015 January 22, 2016 $0.18
(1) 
March 10, 2016 March 14, 2016 April 22, 2016 $0.40
 
June 8, 2016 June 8, 2016 July 22, 2016 $0.40
 
September 28, 2016 September 28, 2016 October 24, 2016 $0.40
 
December 29, 2016 December 29, 2016 January 24, 2017 $0.41
 
December 29, 2016 December 29, 2016 January 24, 2017 $0.07
(1) 
March 20, 2017
 March 20, 2017
 April 24, 2017 $0.41
 
June 20, 2017 June 30, 2017 July 18, 2017 $0.37
 
August 7, 2017 September 29, 2017 October 18, 2017 $0.37
 
November 7, 2017 December 29, 2017 January 17, 2018 $0.37
 
December 13, 2017 December 29, 2017 January 17, 2018 $0.12
(1) 
(1)Represents a special dividend.


10.11. CONSOLIDATED FINANCIAL HIGHLIGHTS
The following is a schedule of consolidated financial highlights for the years ended December 31, 2017, 2016, 2015, 20142021, 2020, 2019, 2018 and 2013:2017:
 For the years ended December 31,
 20212020201920182017
Per Common Share Data:
Net asset value per common share, beginning of year$15.39 $16.56 $17.09 $18.12 $18.32 
Net investment income (loss) (1)
1.53 1.54 1.79 1.73 1.74 
Net realized gain (loss) and net change in unrealized appreciation (depreciation) on investments and non-investment assets and liabilities1.36 (1.46)(0.75)(1.10)(0.19)
Net increase (decrease) in net assets resulting from operations2.89 0.08 1.04 0.63 1.55 
Dividends declared (2)
(1.50)(1.47)(1.74)(1.68)(1.64)
Other0.03 — — — — 
Accretion due to share repurchases0.10 0.22 0.17 0.02 — 
Effect of offering price of subscriptions and the offering price of common stock in the IPO, net of underwriting and offering costs (3)
— — — — (0.11)
Net asset value per common share, end of year$16.91 $15.39 $16.56 $17.09 $18.12 
Market price per common share, end of year$13.73 $10.26 $13.38 $12.40 $20.04 
Number of shares of common stock outstanding, end of year53,142,454 55,320,309 57,763,811 62,230,251 62,207,603 
Total return based on net asset value (4)
19.62 %1.81 %7.08 %3.59 %7.86 %
Total return based on market price (5)
48.44 %(12.33)%21.94 %(29.74)%14.97 %
Net assets attributable to Common Stockholders, end of year$898,804 $851,363 $956,471 $1,063,218 $1,127,304 
Ratio to average net assets attributable to Common Stockholders:
Expenses net of waiver, before incentive fees7.62 %8.48 %8.79 %6.77 %5.25 %
Expenses net of waiver, after incentive fees9.63 %10.59 %11.05 %8.81 %7.39 %
Expenses gross of waiver, after incentive fees9.63 %10.59 %11.05 %8.81 %7.97 %
Net investment income (loss) (6)
9.91 %10.08 %10.47 %9.64 %9.35 %
Interest expense and credit facility fees3.51 %4.49 %5.22 %3.57 %2.69 %
Ratios/Supplemental Data:
Asset coverage, end of period181.94 %182.09 %181.01 %210.31 %234.86 %
Portfolio turnover45.44 %33.06 %38.97 %45.88 %49.18 %
Weighted-average shares of common shares outstanding54,244,432 56,421,137 60,189,502 62,533,614 52,997,450 
 For the years ended December 31,
 2017 2016 2015 2014 2013
Per Share Data:         
Net asset value per share, beginning of year$18.32
 $18.14
 $18.86
 $19.42
 $20.00
Net investment income (loss) (1)
1.74
 1.65
 1.43
 1.09
 (0.55)
Net realized gain (loss) and net change in unrealized appreciation (depreciation) on investments(0.19) 0.20
 (0.52) (0.49) (0.34)
Net increase (decrease) in net assets resulting from operations1.55
 1.85
 0.91
 0.60
 (0.89)
Dividends declared (2)
(1.64) (1.68) (1.74) (1.25) 
Effect of offering price of subscriptions and the offering price of common stock in the IPO, net of underwriting and offering costs (3)
(0.11) 0.01
 0.11
 0.09
 0.31
Net asset value per share, end of year$18.12
 $18.32
 $18.14
 $18.86
 $19.42
Market price per share, end of year$20.04
 n/a
 n/a
 n/a
 n/a
Number of shares outstanding, end of year62,207,603
 41,702,318
 31,524,083
 17,932,697
 9,575,990
Total return based on net asset value (4)
7.86% 10.25% 5.41% 3.55% (2.90)%
Total return based on market price (5)
14.97% n/a
 n/a
 n/a
 n/a
Net assets, end of year$1,127,304
 $764,137
 $571,726
 $338,257
 $186,002
Ratio to average net assets (6):
         
Expenses net of waiver, before incentive fees5.25% 5.46% 5.11% 5.78% 9.75 %
Expenses net of waiver, after incentive fees7.39% 7.69% 6.94% 7.15% 9.75 %
Expenses gross of waiver, after incentive fees7.97% 8.62% 7.86% 7.98% 10.21 %
Net investment income (loss) (7)
9.35% 8.93% 7.33% 5.45% (2.45)%
Interest expense and credit facility fees2.69% 2.85% 2.37% 2.56% 2.23 %
Ratios/Supplemental Data:         
Asset coverage, end of period234.86% 209.97% 212.70% 209.67% 378.35 %
Portfolio turnover49.18% 32.39% 26.04% 28.06% 6.43 %
Weighted-average shares outstanding52,997,450
 36,152,390
 24,830,200
 13,091,544
 3,016,298
(1)Net investment income (loss) per share was calculated as net investment income (loss) less the preferred dividend for the year divided by the weighted-average number of shares of common stock outstanding for the year.
(1)For the years ended December 31, 2017, 2016, 2015, 2014 and 2013, net investment income (loss) per share was calculated as net investment income (loss) for the year divided by the weighted-average number of shares outstanding for the year. For the year ended December 31, 2013, net investment income (loss) per share was calculated as net investment income (loss) for the period divided by the weighted average number of shares outstanding for the period June 5, 2013 (date of issuance of shares related to the first capital drawdown) through December 31, 2013.
(2)For the years ended December 31, 2017, 2016, 2015, 2014 and 2013, dividends declared per share was calculated as the sum of dividends declared during the year divided by the number of shares outstanding at each respective quarter-end date (refer to Notes 9 and 12).
(3)Increase (decrease) is due to the offering price of subscriptions and the issuance of common stock in the IPO, net of underwriting and offering costs during the period (refer to Note 9).
(4)
(2)Dividends declared per common share was calculated as the sum of dividends on common stock declared during the year divided by the number of shares of common stock outstanding at each respective quarter-end date (refer to Note 10 to these consolidated financial statements).
(3)Increase (decrease) is due to the offering price of subscriptions and the issuance of common stock in the IPO, net of underwriting and offering costs during the period.
(4)Total return is based on the change in net asset value per common share during the year plus the declared dividends on common stock, assuming reinvestment of dividends in accordance with the dividend reinvestment plan, divided by the beginning net asset value for the year. Total return for the year ended December 31, 2017 was inclusive of $(0.11) per common share increase (decrease) in net asset value for the years related to the offering price of subscriptions and the offering price of common stock in the IPO, net of underwriting and offering costs during the year. Excluding the effects of these common stock issuances, total return would have been 8.46%.
(5)Total return based on market value (not annualized) is calculated as the change in market value per common share during the period plus the declared dividends on common stock, assuming reinvestment of dividends in accordance with the dividend reinvestment plan, divided by the beginning net asset value for the year. Total return for the year ended December 31, 2013 was calculated for the period from commencement of operations through December 31, 2013. Total return for the years ended December 31, 2017, 2016, 2015, 2014 and 2013 was inclusive of $(0.11), $0.01, $0.11, $0.09, and $0.32 respectively, per share increase (decrease) in net asset value for the years related to the offering price of subscriptions and the offering price of common stock in the IPO, net of underwriting and offering costs during the year. Excluding the effects of these common stock issuances, total return would have been 8.46%, 10.20%, 4.83%, 3.09% and (4.50%), respectively (refer to Note 9).
(5)Total return based on market value (not annualized) is calculated as the change in market value per share during the period plus the declared dividends, assuming reinvestment of dividends in accordance with the dividend reinvestment


plan, divided by the beginning market price for the period.
(6)The beginning marketnet investment income ratio is net of the waiver of base management fees.

167

Senior Securities
Information about our senior securities is shown in the following table as of the end of each fiscal year ended December 31 since we commenced operations on May 2, 2013.
Class and Year/Period
Total Amount Outstanding
Exclusive of Treasury
Securities(1) ($ in millions)
Asset Coverage
Per Unit(2)
Involuntary
Liquidating
Preference Per Unit(3)
Average
Market Value
Per Unit(4)
Total Senior Securities
December 31, 2021$1,096.9 $1,819.0 — N/A
December 31, 2020$1,037.1 $1,821.0 — N/A
December 31, 2019$1,180.8 $1,810.0 — N/A
December 31, 2018$963.8 $2,103.0 — N/A
December 31, 2017$835.9 $2,349.0 — N/A
December 31, 2016$694.9 $2,100.0 — N/A
December 31, 2015$507.3 $2,127.0 — N/A
December 31, 2014$308.4 $2,097.0 — N/A
December 31, 2013$66.8 $3,784.0 — N/A
SPV Credit Facility(5)
December 31, 2020$— $— — N/A
December 31, 2019$232.5 $356.0 — N/A
December 31, 2018$224.1 $489.0 — N/A
December 31, 2017$287.4 $808.0 — N/A
December 31, 2016$252.9 $764.0 — N/A
December 31, 2015$170.3 $714.0 — N/A
December 31, 2014$246.4 $1,675.0 — N/A
December 31, 2013$66.8 $3,784.0 — N/A
Credit Facility(6)
December 31, 2021$407.7 $676.0 — N/A
December 31, 2020$347.9 $611.0 — N/A
December 31, 2019$384.1 $589.0 — N/A
December 31, 2018$290.5 $634.0 — N/A
December 31, 2017$275.5 $774.0 — N/A
December 31, 2016$169.0 $511.0 — N/A
December 31, 2015$64.0 $268.0 — N/A
December 31, 2014$62.0 $421.0 — N/A
2015-1 Notes(7)
December 31, 2017$273.0 $767.0 — N/A
December 31, 2016$273.0 $825.0 — N/A
December 31, 2015$273.0 $1,145.0 — N/A
2015-1R Notes(7)
December 31, 2021$449.2 $745.0 — N/A
December 31, 2020$449.2 $789.0 — N/A
December 31, 2019$449.2 $689.0 — N/A
December 31, 2018$449.2 $980.0 — N/A
2019 Notes(8)
December 31, 2021$115.0 $191.0 — N/A
December 31, 2020$115.0 $202.0 — N/A
December 31, 2019$115.0 $176.0 — N/A
2020 Notes(9)
December 31, 2021$75.0 $124.0 — N/A
December 31, 2020$75.0 $132.0 — N/A
Preferred Stock(10)
December 31, 2021$50.0 $83.0 — N/A
December 31, 2020$50.0 $88.0 — N/A
(1)    Total amount of each class of senior securities outstanding at the end of the period presented.
168

(2)    Asset coverage per unit is the ratio of the carrying value of our total assets, less all liabilities excluding indebtedness represented by senior securities in this table, to the aggregate amount of senior securities representing indebtedness. Asset coverage per shareunit is basedexpressed in terms of dollar amounts per $1,000 of indebtedness and is calculated on a consolidated basis.
(3)    The amount to which such class of senior security would be entitled upon our involuntary liquidation in preference to any security junior to it. The “—” in this column indicates information that the SEC expressly does not require to be disclosed for certain types of senior securities.
(4)    Not applicable because the senior securities are not registered for public trading.
(5)    On May 24, 2013, the SPV closed on a senior secured credit facility (the “SPV Credit Facility”). On December 11, 2020, the SPV repaid all outstanding amounts under the SPV Credit Facility and the facility was terminated.
(6)    On March 21, 2014, we closed on the IPOCredit Facility.
(7)    On June 26, 2015, we completed a $400 million term debt securitization (the “2015-1 Debt Securitization”). The notes offered in the 2015-1 Debt Securitization (the “2015-1 Notes”) were issued by the 2015-1 Issuer. On August 30, 2018, the 2015-1 Issuer refinanced the 2015-1 Debt Securitization (the “2015-1 Debt Securitization Refinancing”) by redeeming in full the 2015-1 Notes and issuing the 2015-1R Notes.
(8)    On December 30, 2019, we closed a private offering price of $18.50 per share.
(6)The Company commenced operations on May 2, 2013; therefore, ratios to average net assets and portfolio turnover for the year ended December 31, 2013 may have been different had there been a full year of operations.
(7)The net investment income ratio is net of the waiver of base management fees.
the 2019 Notes.
11.(9)    On December 11, 2020, we closed a private offering of the 2020 Notes.
(10)    On May 5, 2020, we issued the Preferred Stock.
12. LITIGATION
The Company may become party to certain lawsuits in the ordinary course of business. The Company does not believe that the outcome of current matters, if any, will materially impact the Company or its consolidated financial statements. As of December 31, 20172021 and 2016,2020, the Company was not subject to any material legal proceedings, nor, to the Company’s knowledge, is any material legal proceeding threatened against the Company.
In addition, portfolio investments of the Company could be the subject of litigation or regulatory investigations in the ordinary course of business. The Company does not believe that the outcome of any current contingent liabilities of its portfolio investments, if any, will materially affect the Company or these consolidated financial statements.
12.13. TAX
The Company has not recorded a liability for any uncertain tax positions pursuant to the provisions of ASC 740, Income Taxes, as of December 31, 20172021 and 2016.2020.
In the normal course of business, the Company is subject to examination by federal and certain state, local and foreign tax regulators. As of December 31, 20172021 and 2016,2020, the Company had filed tax returns and therefore is subject to examination.
Book and tax basis differences relating to stockholder dividends and distributions and other permanent book and tax differences are reclassified among the Company’s capital accounts. In addition, the character of income and gains to be distributed is determined in accordance with income tax regulations that may differ from USU.S. GAAP. As of December 31, 20172021 and 2016 ,2020, permanent differences primarily due to non-deductible excise tax and the tax treatment of passive foreign investment companies and non- deductible excise taxpartnership investments resulted in a net decreaseincrease in accumulated net investment lossdistributable earnings (loss) by $6,767$591 and $13,380, respectively, net decrease in accumulated net realized gain by $6,499 and $13,302,$573, respectively, and net decrease in additional paid-in capital in excess of par by $268$591 and $78,$573, respectively, on the Consolidated Statements of Assets and Liabilities. Total earnings and NAV were not affected.
The tax character of the distributions paid for the fiscal years ended December 31, 2017, 20162021, 2020 and 20152019 was as follows:
 For the years ended
December 31,
 202120202019
Ordinary income$84,473 $84,683 $103,360 
Tax return of capital$— $— $— 
169

 
For the years ended
December 31,
 2017 2016 2015
Ordinary income$93,189
 $63,214
 $47,689
Tax return of capital$
 $
 $


Table of Contents
Income Tax Information and Distributions to Stockholders
As of December 31, 20172021 and 2016,2020, the components of accumulated earnings (deficit) on a tax basis were as follows:
2017 201620212020
Undistributed ordinary income$4,291
 $5,365
Undistributed ordinary income$21,197 $16,475 
Other book/tax temporary differences(1)(1,770) (2,108)
Other book/tax temporary differences(1)
(641)(539)
Capital loss carryforwards(43,967) (25,414)Capital loss carryforwards(121,046)(141,850)
Net unrealized appreciation (depreciation) on investments (2)(3,063) (13,629)
Net unrealized appreciation (depreciation) on investments and currency unrealized appreciation (depreciation) on non-investment assets and liabilities(2)
(52,032)(103,078)
Total accumulated earnings (deficit)$(44,509) $(35,786)Total accumulated earnings (deficit)$(152,522)$(228,992)
 
(1)Consists of the unamortized portion of organization costs as of December 31, 2017 and 2016, respectively.
(2)The difference between the book-basis and tax-basis unrealized appreciation (depreciation) on investments is attributable primarily to the tax treatment of passive foreign investment companies, which include the structured finance obligations.

(1)Consists of the unamortized portion of organization costs as of December 31, 2021 and 2020, respectively.

Also, consistspartnership investments and material modifications of book to tax difference on interest income on CLO equity investments recognized using the effective yield method for financial statement purposes.investments.
As of December 31, 20172021 and 2016,2020, the cost of investments for federal income tax purposes and gross unrealized
appreciation and depreciation on investments and currency unrealized appreciation (depreciation) on non-investment
assets and liabilities were as follows:
20212020
Cost of investments$1,960,798 $1,922,617 
Gross unrealized appreciation26,534 21,522 
Gross unrealized depreciation(78,566)(124,600)
Net unrealized appreciation (depreciation)$(52,032)$(103,078)
 2017 2016
Cost of investments$1,970,594
 $1,436,387
Gross unrealized appreciation on investments25,041
 22,390
Gross unrealized depreciation on investments(28,104) (36,019)
Net unrealized appreciation (depreciation) on investments$(3,063) $(13,629)
On December 22, 2010, the Regulated Investment Company Modernization Act of 2010 (the “RIC Modernization Act”) was enacted which changed various technical rules governing theFor tax treatment of RICs. The changespurposes, net realized capital losses may be carried over to offset future capital gains, if any. Funds are generally effective for taxable years beginning after the date of enactment. Under the RIC Modernization Act, the fund will be permitted to carry forward capital losses incurred in taxable years beginning after the date of enactment for an unlimited period. However, anyindefinite period, and such losses incurred during those future taxable years will be required to be utilized prior to the losses incurred in pre-enactment taxable years, which carry an expiration date. As a result of this ordering rule, pre-enactment capital loss carryforwards may be more likely to expire unused. Additionally, post-enactment capital losses that are carried forward will retain their character as either short-term or long-term losses rather than being considered all short-term as under previous law.capital losses. As of December 31, 20172021 and 2016,2020, the Company did not have any pre-enactmenthad $121,046 and $141,850, of capital loss carryforwards, and had $43,967 and $25,414, respectively, of post enactment capital loss carryforwards, $4,107which $19,470 and $614 of which$21,448 were post-enactment short-term capital loss carryforwards, respectively, and $39,860$101,576 and $24,800, of which$120,402 were post-enactment long-term capital loss carryforwards, respectively.

13. SELECTED QUARTERLY FINANCIAL DATA (UNAUDITED)
 2017
 Q4 Q3 Q2 Q1
Total investment income$49,510
 $42,648
 $38,744
 $34,099
Net expenses22,994
 17,568
 17,296
 14,992
Net investment income (loss)26,516
 25,080
 21,448
 19,107
Net realized gain (loss) and net change in unrealized appreciation (depreciation) on investments467
 463
 (5,947) (2,934)
Net increase (decrease) in net assets resulting from operations26,983
 25,543
 15,501
 16,173
NAV per share18.12
 18.18
 18.14
 18.30
Basic and diluted earnings per common share$0.44
 $0.41
 $0.34
 $0.39
 2016
 Q4 Q3 Q2 Q1
Total investment income$33,156
 $28,957
 $25,748
 $23,110
Net expenses14,807
 13,111
 12,282
 11,150
Net investment income (loss)18,349
 15,846
 13,466
 11,960
Net realized gain (loss) and net change in unrealized appreciation (depreciation) on investments(953) 13,324
 12,485
 (14,668)
Net increase (decrease) in net assets resulting from operations17,396
 29,170
 25,951
 (2,708)
NAV per share18.32
 18.38
 18.02
 17.66
Basic and diluted earnings per common share$0.48
 $0.78
 $0.75
 $(0.08)


 2015
 Q4 Q3 Q2 Q1
Total investment income$20,685
 $19,601
 $15,925
 $12,979
Net expenses9,920
 9,267
 7,980
 6,499
Net investment income (loss)10,765
 10,334
 7,945
 6,480
Net realized gain (loss) and net change in unrealized appreciation (depreciation) on investments(20,748) (681) 1,270
 3,308
Net increase (decrease) in net assets resulting from operations(9,983) 9,653
 9,215
 9,788
NAV per share18.14
 19.02
 19.09
 19.05
Basic and diluted earnings per common share$(0.34) $0.35
 $0.40
 $0.50
14. NFIC ACQUISITION
On June 9, 2017 (the “Acquisition Date”), the Company closed the NFIC Acquisition, with the Company as the surviving entity. As of the effective time of the NFIC Acquisition, each share of common stock of NFIC was converted into the right to receive a mixture of cash and shares of common stock of the Company, in accordance with the elections of the NFIC stockholders (the “Elections”). Based on the results of the Elections, the NFIC stockholders received in the aggregate 434,233 shares of common stock of the Company and approximately $145,602 in cash.

The NFIC Acquisition was accounted for under the asset acquisition method of accounting in accordance with ASC Topic 805, Business Combinations. As the acquirer for accounting purposes, the Company allocated the purchase price based on the estimated fair value of NFIC’s assets acquired and liabilities assumed as of the Acquisition Date. There was no goodwill created because the NFIC Acquisition was accounted for as an asset acquisition.

The Company used the fair market value of NFIC’s assets and liabilities as of the Acquisition Date to account for the NFIC Acquisition. The following table summarizes the assets and liabilities of NFIC as of the Acquisition Date:
ASSETS 
Total investments, at fair value$190,672
Cash and other assets12,464
Total assets$203,136
LIABILITIES 
Secured borrowings$42,128
Other accrued expenses and liabilities7,360
Total liabilities49,488
NET ASSETS 
Total net assets$153,648
On June 9, 2017, the debt assumed as part of the NFIC Acquisition was fully repaid.
ForDuring the year ended December 31, 2017,2021, the Company incurred $322 in professional fees and other costs relatedutilized $19,088 of capital loss carryforwards to offset current year net realized gains. During the NFIC Acquisition. The Company determined that the fair value of the net assets acquired equaled the purchase price excluding these costs. Accordingly, these costs related to the NFIC Acquisition were expensed.year ended 2020, there was no capital loss carryforward utilized.
15.14. SUBSEQUENT EVENTS
Subsequent events have been evaluated through the date the consolidated financial statements were issued. There have been no subsequent events that require recognition or disclosure through the date the consolidated financial statements were issued, except as disclosed below.
Subsequent to December 31, 2017, the Company borrowed $194,250 under the Credit Facilitybelow and SPV Credit Facility to fund investment acquisitions. The Company also voluntarily repaid $227,420 under the Credit Facility and SPV Credit Facility.


elsewhere in these consolidated financial statements.
On February 26, 2018,18, 2022, the Company’s Board of Directors declared a base quarterly common dividend of $0.37 per share,$0.32 plus a supplemental common dividend of $0.08, which isare payable on or about April 17, 201815, 2022 to holderscommon stockholders of record of the Company’s common stock at the close of business on March 29, 2018.31, 2022.

170


Table of Contents

Item 9. Changes and Disagreements with Accountants on Accounting and Financial Disclosure
None.
Item 9A. Controls and Procedures.
Evaluation of Disclosure Controls and Procedures
As of the end of the period covered by this report, we carried out an evaluation, under the supervision and with the participation of our management, including our Chief Executive Officer (Principal Executive Officer) and our Chief Financial Officer and Treasurer (Principal Financial Officer), of the effectiveness of the design and operation of our disclosure controls and procedures (as defined in Rule 13a-15 of the Exchange Act). Based on that evaluation, our Chief Executive Officer and our Chief Financial Officer and Treasurer have concluded that our current disclosure controls and procedures are effective in timely alerting them of material information relating to the Company that is required to be disclosed by us in the reports we file or submit under the Exchange Act.
Management’s Report on Internal Control Over Financial Reporting
Our management is responsible for establishing and maintaining adequate internal control over financial reporting (as defined in Rules 13a-15(f) and 15d-15(f) of the Exchange Act). The Company’s internal control over financial reporting is a process designed under the supervision of its Chief Executive Officer (Principal Executive Officer) and Chief Financial Officer and Treasurer (Principal Financial Officer) and effected by the Company’s Board of Directors, management and other personnel, to provide reasonable assurance regarding the reliability of financial reporting and the preparation of its consolidated financial statements for external reporting purposes in accordance with U.S. generally accepted accounting principles.
The Company’s internal control over financial reporting includes policies and procedures that pertain to the maintenance of records that, in reasonable detail, accurately and fairly reflect transactions and dispositions of the Company’s assets; provide reasonable assurance that transactions are recorded as necessary to permit preparation of consolidated financial statements in accordance with U.S. generally accepted accounting principles, and that receipts and expenditures of the Company are being made only in accordance with authorizations of management and the directors; and provide reasonable assurance regarding prevention or timely detection of unauthorized acquisition, use or disposition of the Company’s assets that could have a material effect on its consolidated financial statements.
Because of its inherent limitations, internal control over financial reporting may not prevent or detect misstatements. In addition, projections of any evaluation of effectiveness to future periods are subject to the risk that controls may become inadequate because of changes in conditions, or that the degree of compliance with the policies or procedures may deteriorate.
Management conducted an evaluation of the effectiveness of the Company’s internal control over financial reporting as of December 31, 20172021 based on the framework established in Internal Control—Integrated Framework (2013) issued by the Committee of Sponsoring Organizations of the Treadway Commission. Based on this assessment, management concluded that the Company’s internal control over financial reporting as of December 31, 20172021 was effective.
Attestation Report of the Registered Public Accounting Firm

Our independent registered public accounting firm, Ernst & Young LLP, has issued an audit report on the effectiveness of the Company’s internal control over financial reporting, which is contained in Part II, Item 8 of this Form 10-K, “Financial Statements and Supplementary Data.”
Changes in Internal Controls Over Financial Reporting
There have been no changes in our internal control over financial reporting during the fiscal quarter ended December 31, 20172021 that have materially affected, or are reasonably likely to materially affect, our internal control over financial reporting.
Item 9B. Other Information
On February 13, 2018, the Company delivered a written notice to its pre-IPO investors to offer such investors the opportunity to participate in a registered underwritten secondary offering (the "Proposed Secondary Offering") pursuant to the terms of the subscription agreements entered into by the Company and its pre-IPO investors (the "Subscription Agreements").None.

171


Table of Contents

Item 9C. Disclosure Regarding Foreign Jurisdictions That Prevent Inspections.
Because the aggregate commitments to sell in the Proposed Secondary Offering did not meet the minimum offering size required under the Subscription Agreements, the Company canceled the Proposed Secondary Offering on February 21, 2018.Not applicable.

172


Table of Contents

PART III
Item 10. Directors, Executive Officers and Corporate Governance
Information in response to this item is incorporated by reference from our Proxy Statement relating to our 20182022 annual meeting of stockholders. The Proxy Statement will be filed with the SEC within 120 days after the end of the fiscal year covered by this Form 10-K pursuant to Regulation 14A under the Exchange Act.
We have adopted a CodeInformation relating to our codes of Ethics for Principal Executive and Senior Financial Officers under the Sarbanes-Oxley Act of 2002 (the “SOX Code of Ethics”),ethics, which appliesapply to, among others, our principal executive officer and principal financial officer. There have been no material changes to our SOX Code of Ethics or material waivers of the code that apply to our Chief Executive Officer orand Chief Financial Officer. We hereby undertake to provide a copyOfficer, is included in Part I, Item 1 of this code to any person, without charge, upon request. Requests for a copyForm 10-K “Business-Regulation-Code of this code may be made in writing addressed to the Secretary of the Company, Erik Barrios, TCG BDC, Inc., 520 Madison Avenue, 40th Floor, New York, NY.Ethics.”
Item 11. Executive Compensation
Information in response to this item is incorporated by reference from our Proxy Statement relating to our 20182022 annual meeting of stockholders.
Item 12. Security Ownership of Certain Beneficial Owners and Management and Related Stockholder Matters
Information in response to this item is incorporated by reference from our Proxy Statement relating to our 20182022 annual meeting of stockholders.
Item 13. Certain Relationships and Related Transactions, and Director Independence
Information in response to this item is incorporated by reference from our Proxy Statement relating to our 20182022 annual meeting of stockholders.
Item 14. Principal Accountant Fees and Services
Information in response to this item is incorporated by reference from our Proxy Statement relating to our 20182022 annual meeting of stockholders.

173


Table of Contents

PART IV
Item 15. Exhibits and Financial Statement Schedules
(a) Documents filed as part of this annual report
The following reports and consolidated financial statements are set forth in Part II, Item 8 of this Form 10-K:


(b) Exhibits
The following exhibits are filed as part of this report or hereby incorporated by reference to exhibits previously field with the SEC:
2.1
3.1
3.2
3.3
3.4
3.43.5
4.1
4.2
4.3
10.1
10.2
10.3
10.4
10.5
10.6
174


10.7
10.8


10.9
10.10
10.11
10.12
10.1310.11
10.1410.12
10.1510.13
10.1610.14
10.17
10.1810.15
10.1910.16
10.17
10.18
10.19
10.20
14.1
10.2114.2
11.1
21.1
31.1
175


31.2
32.1
32.2


99.1

*Filed herewith.
(1)Incorporated by reference to Exhibit 3.1 to the Company’s Form 10-12G/A filed by the Company on April 11, 2013 (File No. 000-54899)
(2)Incorporated by reference to Exhibit 3.2 to the Company’s Form 10-K filed by the Company on March 22, 2017 (File No. 000-54899)
(3)Incorporated by reference to Exhibit 3.2 to the Company’s Form 10-12G/A filed by the Company on April 11, 2013 (File No. 000-54899)
(4)Incorporated by reference to Exhibit 3.4 to the Company’s Form 10-K filed by the Company on March 22, 2017 (File No. 000-54899)
(5)Incorporated by reference to Exhibit 4.1 to the Company’s Form 10-12G/A filed by the Company on April 11, 2013 (File No. 000-54899)
(6)Incorporated by reference to Exhibit 10.2 to the Company’s Form 10-Q filed by the Company on August 12, 2015 (File No. 814-00995)
(7)Incorporated by reference to Exhibit (e)(1) to the Company’s Form N-2 filed by the Company on June 5, 2017 (File No. 333-218114)
(7)Incorporated by reference to Exhibit (e)(2) to the Company’s Form N-2 filed by the Company on June 5, 2017 (File No. 333-218114)
(8)Incorporated by reference to Exhibit 10.1 to the Company’s Form 8-K filed by the Company on September 20, 2017 (File No. 814-00995)
(9)Incorporated by reference to Exhibit (j) to the Company’s Registration Statement on Form N-2 filed by the Company on May 19, 2017 (File No. 333-218114)
(10)Incorporated by reference to Exhibit 10.2 to the Company’s Form 10-12G/A filed by the Company on April 11, 2013 (File No. 000-54899)
(11)Incorporated by reference to Exhibit 10.3 to the Company’s Form 10-12G/A filed by the Company on April 11, 2013 (File No. 000-54899)
(12)Incorporated by reference to Exhibit 10.1 to the Company’s Form 10-Q filed by the Company on July 31, 2013 (File No. 814-00995)
(13)Incorporated by reference to Exhibit 10.1 to the Company’s Form 10-Q filed by the Company on May 9, 2014 (File No. 814-00995)
(14)Incorporated by reference to Exhibit 10.1 to the Company’s Form 10-Q filed by the Company on August 13, 2014 (File No. 814-00995)
(15)Incorporated by reference to Exhibit 10.7 to the Company’s Form 10-K filed by the Company on March 27, 2015 (File No. 814-00995)
(16)Incorporated by reference to Exhibit 10.1 to the Company’s Form 10-Q filed by the Company on August 8, 2016 (File No. 814-00995)
(17)Incorporated by reference to Exhibit 10.1 to the Company’s Form 10-Q filed by the Company on August 12, 2015 (File No. 814-00995)
(18)Incorporated by reference to Exhibit 10.3 to the Company’s Form 10-Q filed by the Company on August 12, 2015 (File No. 814-00995)
(19)Incorporated by reference to Exhibit 10.4 to the Company’s Form 10-Q filed by the Company on August 12, 2015 (File No. 814-00995)
(20)Incorporated by reference to Exhibit 10.2 to the Company’s Form 10-Q filed by the Company on August 8, 2016 (File No. 814-00995)
(21)Incorporated by reference to Exhibit 10.1 to the Company’s Form 10-Q filed by the Company on May 10, 2017 (File No. 814-00995)
(22)Incorporated by reference to Exhibit (k)(13) to the Company’s Form N-2 filed by the Company on June 5, 2017 (File No. 333-218114)
(23)Incorporated by reference to Exhibit 10.1 to the Company’s Form 10-Q filed by the Company on November 10, 2016 (File No. 814-00995)
(24)Incorporated by reference to Exhibit 2.1 to the Company’s Form 8-K filed by the Company on May 9, 2017 (File No. 814-00995)
(25)Incorporated by reference to Exhibit (r)(1) to the Company’s Form N-2 filed by the Company on June 8, 2017 (File No. 333-218114)
(26)Incorporated by reference to Exhibit (r)(2) to the Company’s Form N-2 filed by the Company on June 8, 2017 (File No. 333-218114)
*    Filed herewith.
(1)    Incorporated by reference to Exhibit 3.1 to the Company’s Form 10-12G/A filed by the Company on April 11, 2013 (File No. 000-54899)
(2)    Incorporated by reference to Exhibit 3.2 to the Company’s Form 10-K filed by the Company on March 22, 2017 (File No. 000-54899)
(3)    Incorporated by reference to Exhibit 3.2 to the Company’s Form 10-12G/A filed by the Company on April 11, 2013 (File No. 000-54899)
(4)    Incorporated by reference to Exhibit 3.4 to the Company’s Form 10-K filed by the Company on March 22, 2017 (File No. 000-54899)
(5)    Incorporated by reference to Exhibit 4.1 to the Company’s Form 10-12G/A filed by the Company on April 11, 2013 (File No. 000-54899)
(6)    Incorporated by reference to Exhibit 10.2 to the Company’s Form 10-Q filed by the Company on August 12, 2015 (File No. 814-00995)
(7)    Incorporated by reference to Exhibit (e)(1) to the Company’s Form N-2 filed by the Company on June 5, 2017 (File No. 333-218114)
(7)    Incorporated by reference to Exhibit (e)(2) to the Company’s Form N-2 filed by the Company on June 5, 2017 (File No. 333-218114)
(8)    Incorporated by reference to Exhibit 10.1 to the Company’s Form 10-Q filed by the Company on November 6, 2018 (File No. 814-00995)
(9)    Incorporated by reference to Exhibit (j) to the Company’s Registration Statement on Form N-2 filed by the Company on May 19, 2017 (File No. 333-218114)
(10)    Incorporated by reference to Exhibit 10.2 to the Company’s Form 10-12G/A filed by the Company on April 11, 2013 (File No. 000-54899)
(11)    Incorporated by reference to Exhibit 10.3 to the Company’s Form 10-12G/A filed by the Company on April 11, 2013 (File No. 000-54899)
(12)    Incorporated by reference to Exhibit 10.1 to the Company’s Form 10-Q filed by the Company on July 31, 2013 (File No. 814-00995)
(13)    Incorporated by reference to Exhibit 10.2 to the Company’s Form 10-Q filed by the Company on August 6, 2019 (File No. 814-00995)
(14)    Incorporated by reference to Exhibit 10.1 to the Company’s Form 10-Q filed by the Company on August 13, 2014 (File No. 814-00995)
(15)    Incorporated by reference to Exhibit 10.1 to the Company’s Form 10-Q filed by the Company on August 12, 2015 (File No. 814-00995)
(16)    Incorporated by reference to Exhibit 10.3 to the Company’s Form 10-Q filed by the Company on August 12, 2015 (File No. 814-00995)
(17)    Incorporated by reference to Exhibit 10.4 to the Company’s Form 10-Q filed by the Company on August 12, 2015 (File No. 814-00995)
(18)    Incorporated by reference to Exhibit 10.2 to the Company’s Form 10-Q filed by the Company on August 8, 2016 (File No. 814-00995)
(19)    Incorporated by reference to Exhibit (k)(13) to the Company’s Form N-2 filed by the Company on June 5, 2017 (File No. 333-218114)
(20)    Incorporated by reference to Exhibit 2.1 to the Company’s Form 8-K filed by the Company on May 9, 2017 (File No. 814-00995)
(21)    Incorporated by reference to Exhibit 10.2 to the Company’s Form 10-Q filed by the Company on November 6, 2018 (File No. 814-00995)
(22)    Incorporated by reference to Exhibit 10.3 to the Company’s Form 10-Q filed by the Company on November 6, 2018 (File No. 814-00995)
176


Table of Contents

(23)    Incorporated by reference to Exhibit 10.1 to the Company’s Form 8-K filed by the Company on December 30, 2019 (File No. 814-00995)
(27)Incorporated by reference to Exhibit 21.1 to the Company's Form 10-12G filed by the Company on February 11, 2013 (File No. 000-54899)
(24)    Incorporated by reference to Exhibit 14.1 to the Company’s Form 10-K filed by the Company on February 26, 2019 (File No. 814-00995)
(25)     Incorporated by reference to Exhibit 14.2 to the Company’s Form 10-K filed by the Company on February 26, 2019 (File No. 814-00995)
(26)     Incorporated by reference to Exhibit 2.1 to the Company’s Form 8-K filed by the Company on November 4, 2020 (File No. 814-00995)
(27)     Incorporated by reference to Exhibit 3.1 to the Company’s Form 10-Q filed by the Company on May 5, 2020 (File No. 814-00995)
(28)     Incorporated by reference to Exhibit 4.1 to the Company’s Form 10-Q filed by the Company on May 5, 2020 (File No. 814-00995)
(29)     Incorporated by reference to Exhibit 10.1 to the Company’s Form 8-K filed by the Company on December 11, 2020 (File No. 814-00995)
(30)     Incorporated by reference to Exhibit 10.1 to the Company’s Form 10-Q filed by the Company on May 4, 2021 (File No. 814-00995)
(c) Consolidated Financial Statement Schedules
Separate financial statements of subsidiaries not consolidated:
Consolidated Financial Statements of Middle Market Credit Fund, LLC for the yearyears ended December 31, 20172021 and the period from May 11, 2016 (commencement of operations) to December 31, 20162020 are filed as Exhibit 99.1 hereto.
Item 16. Form 10-K Summary
None.

177


Table of Contents

SIGNATURES
Pursuant to the requirements of the Securities Exchange Act of 1934, the registrant has duly caused this report to be signed on its behalf by the undersigned thereunto duly authorized.
TCG BDC, INC.
Dated: February 22, 2022By/s/ Linda Pace
Linda Pace
Director and Chief Executive Officer
(principal executive officer)
Pursuant to the requirements of the Securities Exchange Act of 1934, this report has been signed below by the following persons on behalf of the registrant and in the capacities and on the dates indicated.
Dated: February 22, 2022By/s/ Linda Pace
Linda Pace
Director and Chief Executive Officer
(principal executive officer)
Dated: February 22, 2022By/s/ Thomas M. Hennigan
Thomas M. Hennigan
Chief Financial Officer
(principal financial officer)
Dated: February 22, 2022TCG BDC, INC.By/s/ Peter Gaunt
Peter Gaunt
Treasurer
(principal accounting officer)
Dated: February 27, 2018By/s/ Michael A. Hart
Michael A. Hart
Director and Chief Executive Officer (principal executive officer)
Dated: February 27, 2018By/s/ Venugopal Rathi
Venugopal Rathi
Chief Financial Officer
(principal financial and accounting officer)
Dated: February 27, 201822, 2022 By /s/ Nigel D.T. Andrews
  Nigel D.T. Andrews
  Director
Dated: February 27, 201822, 2022 By /s/ Leslie E. Bradford
  Leslie E. Bradford
  Director
Dated: February 27, 201822, 2022By/s/ Aren C. LeeKong
Aren C. LeeKong
Director
Dated: February 22, 2022 By /s/ Eliot P.S. MerrillMark Jenkins
  Eliot P.S. MerrillMark Jenkins
  Director
Dated: February 27, 201822, 2022 By /s/ John G. Nestor
  John G. Nestor
  Director
Dated: February 22, 2022By/s/ William H. Wright II
William H. Wright II
Director


146178