UNITED STATES
SECURITIES AND EXCHANGE COMMISSION
Washington, D.C. 20549
FORM 10-K
| | | | | | | | | | | |
| (Mark One) | | | |
| ☒ | ANNUAL REPORT PURSUANT TO SECTION 13 OR 15(d) OF THE SECURITIES EXCHANGE ACT OF 1934 |
| | For the fiscal year ended | December 26, 202131, 2023 | |
| or |
| ☐ | TRANSITION REPORT PURSUANT TO SECTION 13 OR 15(d) OF THE SECURITIES EXCHANGE ACT OF 1934 |
| | For the transition period from ______ to ______ |
Commission File Number: 001-35625
BLOOMIN’ BRANDS, INC.
(Exact name of registrant as specified in its charter)
| | | | | | | | | | | | | | |
| Delaware | | | | 20-8023465 |
| (State or other jurisdiction of incorporation or organization) | | | | (I.R.S. Employer
Identification No.) |
2202 North West Shore Boulevard, Suite 500, Tampa, FL 33607
(Address of principal executive offices) (Zip Code)
(813) 282-1225
(Registrant’s telephone number, including area code)
Securities registered pursuant to Section 12(b) of the Act:
| | | | | | | | | | | | | | | | | |
| Title of each class | | Trading Symbol(s) | | Name of each exchange on which registered |
| Common Stock | $0.01 par value | | BLMN | | The Nasdaq Stock Market LLC (Nasdaq Global Select Market) |
Securities registered pursuant to Section 12(g) of the Act: None
Indicate by check mark if the registrant is a well-known seasoned issuer, as defined in Rule 405 of the Securities Act. Yes ☒ No ☐
Indicate by check mark if the registrant is not required to file reports pursuant to Section 13 or Section 15(d) of the Act. Yes ☐ No ☒
Indicate by check mark whether the registrant (1) has filed all reports required to be filed by Section 13 or 15(d) of the Securities Exchange Act of 1934 during the preceding 12 months (or for such shorter period that the registrant was required to file such reports), and (2) has been subject to such filing requirements for the past 90 days. Yes ☒ No ☐
Indicate by check mark whether the registrant has submitted electronically every Interactive Data File required to be submitted pursuant to Rule 405 of Regulation S-T (§232.405 of this chapter) during the preceding 12 months (or for such shorter period that the registrant was required to submit such files). Yes ☒ No ☐
Indicate by check mark whether the registrant is a large accelerated filer, an accelerated filer, a non-accelerated filer, a smaller reporting company or an emerging growth company. See the definitions of “large accelerated filer,” “accelerated filer,” “smaller reporting company” and “emerging growth company” in Rule 12b-2 of the Exchange Act.
Large Accelerated Filer ☒ Accelerated Filer ☐ Non-accelerated Filer ☐
Smaller Reporting Company ☐ Emerging Growth Company ☐
If an emerging growth company, indicate by check mark if the registrant has elected not to use the extended transition period for complying with any new or revised financial accounting standards provided pursuant to Section 13(a) of the Exchange Act. ☐
Indicate by check mark whether the registrant has filed a report on and attestation to its management’s assessment of the effectiveness of its internal control over financial reporting under Section 404(b) of the Sarbanes-Oxley Act (15 U.S.C. 7262(b)) by the registered public accounting firm that prepared or issued its audit report. ☒
If securities are registered pursuant to Section 12(b) of the Act, indicate by check mark whether the financial statements of the registrant included in the filing reflect the correction of an error to previously issued financial statements. ☐
Indicate by check mark whether any of those error corrections are restatements that required a recovery analysis of incentive-based compensation received by any of the registrant’s executive officers during the relevant recovery period pursuant to §240.10D-1(b). ☐
Indicate by check mark whether the registrant is a shell company (as defined in Rule 12b-2 of the Act). Yes ☐ No ☒
The aggregate market value of common stock held by non-affiliates (based on the closing price on the last business day of the registrant’s most recently completed second fiscal quarter as reported on the Nasdaq Global Select Market) was $2.4$2.2 billion.
As of February 18, 2022, 89,425,68023, 2024, 87,058,234 shares of common stock of the registrant were outstanding.
DOCUMENTS INCORPORATED BY REFERENCE
Portions of the registrant’s definitive Proxy Statement for its 20222024 Annual Meeting of Stockholders are incorporated by reference into Part III, Items 10-14 of this Annual Report on Form 10-K.
INDEX TO ANNUAL REPORT ON FORM 10-K
For Fiscal Year 20212023
TABLE OF CONTENTS
| | | | | |
| PAGE NO. |
| PART I |
| |
| |
| |
| |
| |
| |
| |
| PART II |
| |
| |
| |
| |
| |
| |
| |
| |
| |
| PART III |
| |
| |
| |
| |
| |
| PART IV |
| |
| |
| |
PART I
Cautionary Statement
This Annual Report on Form 10-K (the “Report”) includes statements that express our opinions, expectations, beliefs, plans, objectives, assumptions or projections regarding future events or future results and therefore are, or may be deemed to be, “forward-looking statements” within the meaning of Section 27A of the Securities Act of 1933, as amended (the “Securities Act”), and Section 21E of the Securities Exchange Act of 1934, as amended (the “Exchange Act”). These forward-looking statements can generally be identified by the use of forward-looking terminology, including the terms “believes,” “estimates,” “anticipates,” “expects,” “feels,” “seeks,” “forecasts,” “projects,” “intends,” “plans,” “may,” “will,” “should,” “could” or “would” or, in each case, their negative or other variations or comparable terminology, although not all forward-looking statements are accompanied by such terms. These forward-looking statements include all matters that are not historical facts. They appear in a number of places throughout this Report and include statements regarding our intentions, beliefs or current expectations concerning, among other things, our results of operations, financial condition, liquidity, prospects, growth, strategies and the industry in which we operate.
By their nature, forward-looking statements involve risks and uncertainties because they relate to events and depend on circumstances that may or may not occur in the future. Although we base these forward-looking statements on assumptions that we believe are reasonable when made, we caution you that forward-looking statements are not guarantees of future performance and that our actual results of operations, financial condition and liquidity, and industry developments may differ materially from statements made in or suggested by the forward-looking statements contained in this Report. In addition, even if our results of operations, financial condition and liquidity, and industry developments are consistent with the forward-looking statements contained in this Report, those results or developments may not be indicative of results or developments in subsequent periods. Important factors that could cause actual results to differ materially from statements made or suggested by forward-looking statements include, but are not limited to, those described in the “Risk Factors” section of this Report and the following:
(i)Consumer reactions to public health and food safety issues;
(ii)The severity, extent and duration of the COVID-19 pandemic, its impacts on our business and results of operations, financial condition and liquidity, including any adverse impact on our stock price and on the other factors listed below, and the responses of domestic and foreign federal, state and local governments to the pandemic;
(iii)Minimum wage increases, additional mandated employee benefits and fluctuations in the cost and availability of employees;
(iii)Our ability to recruit and retain high-quality leadership, restaurant-level management and team members;
(iv)Fluctuations inEconomic and geopolitical conditions and their effects on consumer confidence and discretionary spending, consumer traffic, the pricecost and availability of commodities;credit and interest rates;
(v)Our ability to compete in the highly competitive restaurant industry with many well-established competitors and new market entrants;
(vi)Economic conditionsOur ability to protect our information technology systems from interruption or security breach, including cybersecurity threats, and their effects onto protect consumer confidencedata and discretionary spending, consumer traffic, the cost and availability of credit and interest rates;personal employee information;
(vii)Our abilityFluctuations in the price and availability of commodities, including supplier freight charges and restaurant distribution expenses, and other impacts of inflation and our dependence on a limited number of suppliers and distributors to recruitmeet our beef, pork, chicken and retain high-quality leadership, restaurant-level management and team members;other major product supply needs;
(viii)Our ability to preserve and grow the reputation and value of our brands, particularly in light of changes in consumer engagement with social media platforms and limited control with respect to the operations of our franchisees;
(ix)Our ability to protect our information technology systems from interruption or security breach, including cyber security threats, and to protect consumer data and personal employee information;
(x)Dependence on a limited number of suppliers and distributors to meet our beef and other major product supply needs;
(xi)The effects of international economic, political and social conditions and legal systems on our foreign operations and on foreign currency exchange rates;
(x)Our ability to comply with new corporate citizenship and sustainability reporting requirements and investor expectations or our failure to achieve any goals, targets or objectives that we establish with respect to corporate citizenship and sustainability matters;
(xi)Our ability to effectively respond to changes in patterns of consumer traffic, including by maintaining relationships with third party delivery apps and services, consumer tastes and dietary habits;
(xii)Our ability to comply with governmental laws and regulations, the costs of compliance with such laws and regulations and the effects of changes to applicable laws and regulations, including tax laws and unanticipated liabilities, and the impact of any litigation;
(xiii)Our ability to effectively respond to changes in patterns of consumer traffic, consumer tastes and dietary habits, including by maintaining relationships with third party delivery apps and services;
(xiv)Our ability to implement our remodeling, relocation and expansion plans, due to uncertainty in locating and acquiring attractive sites on acceptable terms, obtaining required permits and approvals, recruiting and training necessary personnel, obtaining adequate financing and estimating the performance of newly opened, remodeled or relocated restaurants;restaurants, and our cost savings plans to enable reinvestment in our business, due to uncertainty with respect to macroeconomic conditions and the efficiency that may be added by the actions we take;
(xv)(xiv)Seasonal and periodic fluctuations in our results and the effects of significant adverse weather conditions and other disasters or unforeseen events;
(xvi)(xv)The effects of our leverage and restrictive covenants in our various credit facilities on our ability to raise additional capital to fund our operations, to make capital expenditures to invest in new or renovate restaurants and to react to changes in the economy or our industry; and
(xvii)(xvi)Any impairment in the carrying value of our goodwill or other intangible or long-lived assets and its effect on our financial condition and results of operations.
Given these risks and uncertainties, we caution you not to place undue reliance on these forward-looking statements. Any forward-looking statement that we make in this Report speaks only as of the date of such statement, and we undertake no obligation to update any forward-looking statement or to publicly announce the results of any revision to any of those statements to reflect future events or developments. Comparisons of results for current and any prior periods are not intended to express any future trends or indications of future performance, unless specifically expressed as such, and should only be viewed as historical data.
Item 1. Business
Bloomin’ Brands, Inc. (“Bloomin’ Brands,” the “Company,” “we,” “us,” and “our” and similar terms mean Bloomin’ Brands, Inc. and its subsidiaries except where the context otherwise requires) is one of the largest casual dining restaurant companies in the world, with a portfolio of leading, differentiated restaurant concepts. We have four founder-inspired concepts: Outback Steakhouse, Carrabba’s Italian Grill, Bonefish Grill and Fleming’s Prime Steakhouse & Wine Bar. Our restaurant concepts range in price point and degree of formality from casual (Outback Steakhouse and Carrabba’s Italian Grill) to upscale casual (Bonefish Grill) and fine dining (Fleming’s Prime Steakhouse & Wine Bar). OSI Restaurant Partners, LLC (“OSI”), a wholly-owned subsidiary of Bloomin’ Brands, is our primary operating entity.
COVID-19 Pandemic Impact on Our Business
In March 2020, we temporarily closed all restaurant dining rooms to comply with state and local regulations in response to the COVID-19 pandemic (“COVID-19”). In early May 2020, we began to reopen our restaurant dining rooms with limited seating capacity in compliance with state and local regulations. The temporary closure of our dining rooms and the limitations on seating capacity due to the COVID-19 pandemic resulted in significantly reduced traffic in our restaurants which negatively impacted our operating results during 2020.
During 2021, the recovery of in-restaurant dining continued as COVID-19 capacity restrictions were eased or eliminated. Though concerns over variants of COVID-19 impacted recovery, we continued to retain a significant portion of the incremental off-premises volume achieved while our dining rooms were closed last year.
MARKETS
As of December 26, 2021,31, 2023, we owned and operated 1,169 full-service1,189 restaurants and off-premises only kitchens and franchised 329 full-service291 restaurants and off-premises only kitchens across 47 states, Guam and 1713 countries.
Our Segments
We consider each of our restaurant concepts and international markets to be operating segments, which reflects how we manage our business, review operating performance and allocate resources. We aggregate our operating segments into two reportable segments, U.S. and international. The U.S. segment includes all restaurants operating in the U.S. while restaurants operating outside the U.S. are included in the international segment. Following is a summary of reportable segments as of December 26, 2021:31, 2023:
| | | | | | | | | | | | | | |
| REPORTABLE SEGMENT (1) | | CONCEPT | | GEOGRAPHIC LOCATION |
| U.S. | | Outback Steakhouse | | United States of America |
| Carrabba’s Italian Grill | |
| Bonefish Grill | |
| Fleming’s Prime Steakhouse & Wine Bar | |
| International | | Outback Steakhouse | | Brazil, Hong Kong/China |
| Carrabba’s Italian Grill (Abbraccio) | | Brazil |
_________________
(1)Includes franchise locations. See Item 2. Properties for disclosure of our restaurant count by country and territory.
U.S. Segment
As of December 26, 2021,31, 2023, in our U.S. segment, we owned and operated 1,013 full-service998 restaurants and off-premises only kitchens and franchised 157 full-service152 restaurants across 47 states.
Outback Steakhouse - Outback Steakhouse is a casual steakhouse restaurant concept focused on steaks, bold flavors and Australian decor. The Outback Steakhouse menu offers seasoned and seared or wood-fire grilled steaks, chops,
chicken, seafood, pasta, salads and seasonal specials. The menu also offers a selection of specialty appetizers, including our signature Bloomin’ Onion®, and desserts, together with full bar service.
Carrabba’s Italian Grill - Offering authentic Italian cuisine passed down from its founders’ family recipes, Carrabba’s Italian Grill uses high qualityhigh-quality ingredients to prepare fresh and handmade dishes cooked to order in a lively exhibition kitchen. Featuring a wood-burning grill inspired by the many tastes of Italy, guests can enjoy signature dishes such as Chicken Bryan and Pollo Rosa Maria, wood-fire grilled steaks and chops, small plates and classic Italian pasta dishes in a welcoming, contemporary atmosphere.
Bonefish Grill - Bonefish Grill specializes in market-fresh fish from around the world, hand-cut in-house every day, savory wood-grilled specialties, and locally created, seasonal Partner Selection dishes featuring high-quality and fresh ingredients. Offering a selection of classic and signature hand-crafted cocktails, using just-squeezedfresh juices, edible garnishes and house infusions, Bonefish Grill also features a distinct list of wines, which are the perfect match for any food pairing.
Fleming’s Prime Steakhouse & Wine Bar - Fleming’s Prime Steakhouse & Wine Bar is a contemporary interpretation of the classic American steakhouse, concept featuring prime cutsboasting culinary mastery, signature style and unrivaled attentive service to create memorable dining experiences for guests. Fleming’s Prime Steakhouse & Wine Bar offers an impressive range of beef, fresh fish, seafood and poultry, salads and side dishes. Guests will find a passion for steak and wine, reflected in an exceptional menu of hand-cut steaks and an award-winning list of wines by the glass. The steak selection features USDA Prime corn-fed beef, both wet-steaks, premium seafood entrées, storied wines and dry-aged for flavor and texture, in a variety of sizes and cuts.fresh hand-crafted cocktails.
International Segment
We have local management to support and grow restaurants in each of the countries where we have Company-owned operations. Our international operations are integrated with our corporate headquarters to leverage enterprise-wide capabilities, including marketing, finance, real estate, information technology, legal, human resources, supply chain management and productivity.
As of December 26, 2021,31, 2023, in our international segment, we owned and operated 156 full-service191 restaurants and off-premises only kitchens and franchised 172 full-service139 restaurants and off-premises only kitchens across 1713 countries and Guam. See Item 2. Properties for disclosure of our international restaurant count by country and territory.
Outback Steakhouse - Our international Outback Steakhouse restaurants have a menu similar to our U.S. menu with additional variety to meet local taste preferences. In addition to the traditional Outback Special sirloin, a typical international menu may feature local beef cuts such as the Aussie Grilled Picanha in Brazil.of beef.
Carrabba’s Italian Grill (Abbraccio Cucina Italiana) - Abbraccio Cucina Italiana, our international Carrabba’s Italian Grill restaurant concept, offers a blend of traditional and modern Italian dishes. The menu varies, with additional pasta and pizza offerings, to account for local tastes and customs. Abbraccio Cucina Italiana also has a range of beverage options, including classically inspired cocktails and local favorites with an Italian twist.
Restaurant Development
We utilize the ownership structure and market entry strategy that best fits the needs for a particular market, including Company-owned units and franchises, as determined by demand, cost structure and economic conditions.
U.S. Development - We opportunistically pursue unit growth across our concepts through existing geography fill-in and market expansion opportunities.
During 2021, we opened our first U.S. Outback Steakhouse utilizing a smaller-scaled “Joey” prototype.design. The Joey prototype was designed to increase return on investment through a reduced restaurant footprint with a more efficient layout. Our current Joey design consists of a freestanding building with approximately 5,000 square feet and seating for approximately 190 guests. We plan to open additional Joeyopened six Outback Steakhouse restaurants during 2022.
During 2021, we continued2023 and plan to test and develop our first fast-casual concept, Aussie Grill by Outback (“Aussie Grill”). Originally created for our international franchisees, Aussie Grill offers steak, burgers, chicken and salad with fast-casual convenience. After successfully launching Aussie Grill internationally, we added Company-owned locations in the U.S. and in May 2020 opened the first free standing restaurant. We opened two additional U.S. Aussie Grill restaurants during 2021 andopen approximately 15 additional locations are planned to open in 2022.throughout 2024.
International Development - We continue to pursue international expansion opportunities, leveraging established equity and franchise markets in South America and Asia, and in strategically selected emerging and high-growth developed markets, with a focus on Brazil. All Outback Steakhouse restaurants opened in Brazil since the beginning of 2021 were built utilizing the Joey design. Our current Joey design in Brazil consists of an in-line strip mall space with approximately 4,800 square feet and seating for approximately 190 guests.
Off-Premises Only ExpansionRemodeling - Since 2019, our franchisee in South Korea has rolled out delivery-only kitchens, which are food preparation and cooking facilities that are not located in a traditional retail space and are limited to delivery-only. These kitchens allow for the expansion We regularly remodel restaurants across all of our concepts to maintain the relevance of our restaurants’ ambience, focused on driving additional traffic to our restaurants. During 2023, we completed more than 100 restaurant concepts into areas where traditional retail space is not available or cost prohibitive. As of December 26, 2021, there were 40 delivery-only kitchens operating in South Korea and 24 additional locations are planned to open in 2022.remodels.
Beginning in 2022, the remodel of our Outback Steakhouse restaurants included the installation of advanced grills and ovens. We completed the rollout of this equipment to substantially all Outback Steakhouse restaurants during 2023. These investments have improved our cooking consistency, meal pacing and guest satisfaction while also providing a cost-saving opportunity for our Company.
System-wide Restaurant Summary - Following is a system-wide rollforward of our full-service restaurants in operation during 2021:2023:
| | DECEMBER 27,
2020 | | 2021 ACTIVITY | | | DECEMBER 26,
2021 | | U.S. STATE |
| DECEMBER 25,
2022 | |
| DECEMBER 25,
2022 | |
| DECEMBER 25,
2022 | | | 2023 ACTIVITY | | | | DECEMBER 31,
2023 | | U.S. STATE |
| Number of restaurants: | Number of restaurants: | DECEMBER 27,
2020 | | OPENINGS | | CLOSURES | | | DECEMBER 26,
2021 | | COUNT | Number of restaurants: | | OPENINGS | | CLOSURES | | | | | COUNT |
| U.S.: | | | | | | | | |
| U.S. | |
| Outback Steakhouse | |
| Outback Steakhouse | |
| Outback Steakhouse | Outback Steakhouse | | | |
| Company-owned | Company-owned | 568 | | 3 | | | (7) | | | | 564 | |
| Company-owned | |
| Company-owned | |
| Franchised | Franchised | 138 | | — | | | (8) | | | | 130 | |
| Franchised | |
| Franchised | |
| Total | |
| Total | |
| Total | Total | 706 | | 3 | | | (15) | | | | 694 | | 46 | 693 | | | 6 | | 6 | | | (11) | | (11) | | | | | 688 | | | | 688 | | | 46 | | 46 |
| Carrabba’s Italian Grill | Carrabba’s Italian Grill | | | | | | | | | | |
| Company-owned | Company-owned | 199 | | — | | | — | | | | 199 | |
| Company-owned | |
| Company-owned | |
| Franchised | Franchised | 21 | | — | | | (1) | | | | 20 | |
| Franchised | |
| Franchised | |
| Total | |
| Total | |
| Total | Total | 220 | | — | | | (1) | | | | 219 | | 29 | 218 | | | — | | — | | | (1) | | (1) | | | | | 217 | | | | 217 | | | 29 | | 29 |
| Bonefish Grill | Bonefish Grill | | | | | | | | | | |
| Company-owned | Company-owned | 180 | | — | | | (2) | | | | 178 | |
| Company-owned | |
| Company-owned | |
| Franchised | Franchised | 7 | | — | | | — | | | | 7 | |
| Franchised | |
| Franchised | |
| Total | |
| Total | |
| Total | Total | 187 | | — | | | (2) | | | | 185 | | 30 | 180 | | | 1 | | 1 | | | (5) | | (5) | | | | | 176 | | | | 176 | | | 30 | | 30 |
| Fleming’s Prime Steakhouse & Wine Bar | Fleming’s Prime Steakhouse & Wine Bar | | | | | | | | | | |
| Company-owned | Company-owned | 63 | | 1 | | | — | | | | 64 | | 25 |
| Company-owned | |
| Company-owned | | 65 | | | — | | | (1) | | | | | 64 | | | 25 |
| Aussie Grill | Aussie Grill | | | | | | | | | | |
| Company-owned (1) | 3 | | | 2 | | | — | | | | 5 | | 1 |
| U.S. total | 1,179 | | | 6 | | | (18) | | | | 1,167 | | | |
| International: | | | | | | | | | |
| Company-owned | Company-owned | | | |
| Company-owned | |
| Company-owned | |
| Franchised | |
| Franchised | |
| Franchised | |
| Total | |
| Total | |
| Total | | 7 | | | 1 | | | (3) | | | | | 5 | | | 1 |
| U.S. total (1) | |
| International | |
| International | |
| International | |
| Company-owned | |
| Company-owned | |
| Company-owned | |
| Outback Steakhouse - Brazil (2) | |
| Outback Steakhouse - Brazil (2) | |
| Outback Steakhouse - Brazil (2) | Outback Steakhouse - Brazil (2) | 109 | | | 13 | | | — | | | | 122 | | |
| | Other (1)(3) | 32 | | | 1 | | | — | | | | 33 | | |
| Other (2)(3) | |
| | Other (2)(3) | |
| | Other (2)(3) | |
| Franchised | |
| Franchised | |
| Franchised | Franchised | | | |
| Outback Steakhouse - South Korea (1) | Outback Steakhouse - South Korea (1) | 76 | | | 5 | | | (3) | | | | 78 | | |
| Outback Steakhouse - South Korea (1) | |
| Outback Steakhouse - South Korea (1) | |
| Other (3) | |
| Other (3) | |
| Other (3) | Other (3) | 56 | | | 4 | | | (6) | | | | 54 | | |
| International total | International total | 273 | | | 23 | | | (9) | | | | 287 | | |
| International total | |
| International total | |
| System-wide total | |
| System-wide total | |
| System-wide total | System-wide total | 1,452 | | | 29 | | | (27) | | | | 1,454 | | |
| System-wide total - Company-owned | System-wide total - Company-owned | 1,154 | | 20 | | | (9) | | | | 1,165 | |
| System-wide total - Company-owned | |
| System-wide total - Company-owned | |
| System-wide total - Franchised | System-wide total - Franchised | 298 | | 9 | | | (18) | | | | 289 | |
| System-wide total - Franchised | |
| System-wide total - Franchised | |
____________________
(1)Restaurant countsExcludes 36 and five off-premises only kitchens as of December 27, 2020 have been adjusted to exclude off-premises only kitchens included25, 2022 and December 31, 2023, respectively. One location was Company-owned in the table below.U.S and all others were franchised in South Korea as of December 25, 2022 and December 31, 2023.
(2)The restaurant counts for Brazil, including Abbraccio and Aussie Grill restaurants within International Company-owned Other, are reported as of November 30, 20202022 and 2021,2023, respectively, to correspond with the balance sheet dates of this subsidiary.
(3)International Company-owned Other included onefour and two Aussie Grill locations as of December 27, 202025, 2022 and December 26, 2021,31, 2023, respectively. International Franchised Other included threefour Aussie Grill locations as of December 27, 202025, 2022 and December 26, 2021.
Following is a system-wide rollforward of our off-premises only kitchens in operation during 2021:
| | | | | | | | | | | | | | | | | | | | | | | | | |
| DECEMBER 27,
2020 | | 2021 ACTIVITY | | | | DECEMBER 26,
2021 |
| Number of kitchens (1): | | OPENINGS | | CLOSURES | | | |
| U.S: | | | | | | | | | |
| Company-owned | 2 | | | 2 | | | (1) | | | | | 3 | |
| | | | | | | | | |
| | | | | | | | | |
| International: | | | | | | | | | |
| Company-owned | 1 | | | — | | | — | | | | | 1 | |
| Franchised - South Korea | 19 | | | 21 | | | — | | | | | 40 | |
| | | | | | | | | |
| | | | | | | | | |
| System-wide total | 22 | | | 23 | | | (1) | | | | | 44 | |
____________________
(1)Excludes virtual concepts that operate out of existing restaurants and sports venue locations.31, 2023.
Competition
The restaurant industry is highly competitive with a substantial number of restaurant operators that compete directly and indirectly with us in respect to price, service, location and food quality, and there are other well-established competitors with significant financial and other resources. There is also active competition for management personnel, attractive suitable real estate sites, supplies and restaurant employees. In addition, competition is influenced strongly by marketing and brand reputation. At an aggregate level, all major casual dining restaurants in markets in which we operate would be considered competitors of our concepts. We also face growing competition from the supermarket industry which offers expanded selections of prepared meals. In addition,Further, improving product offerings and convenience options from quick servicequick-service and fast-casual restaurants, and the expansion of home delivery services, together with negative economic conditions, could cause consumers to choose less expensive
alternatives than our restaurants. Internationally, we face increasing competition due to an increase in the number of casual dining restaurant options in the markets in which we operate.
REVENUE GENERATING ACTIVITIES
We generate our revenues from our Company-owned restaurants and through sales of franchise rights and ongoing royalties and other fees from our franchised restaurants.
Company-owned Restaurants - Company-owned restaurants are restaurants wholly-owned by us or in which we have a majority ownership. The results of operations of Company-owned restaurants are included in our consolidated operating results and the portion of income or loss attributable to the noncontrolling interests is eliminated in our Consolidated Statements of Operations and Comprehensive Income (Loss).Income.
Historically, we paid royalties that ranged from 0.5% to 1.5% of U.S. sales on the majority of our Carrabba’s Italian Grill restaurants, pursuant to agreements we entered into with the Carrabba’s Italian Grill founders (“Carrabba’s Founders”). Each Carrabba’s Italian Grill restaurant located outside the U.S. paid a one-time lump sum fee to the Carrabba’s Founders in place of a continuing royalty fee. In August 2021, we entered into the Purchase and Sale of Royalty Payment Stream and Termination of Royalty Agreement (the “Royalty Termination Agreement”) with the Carrabba’s Founders, pursuant to which our obligation to pay future royalties and lump sum royalty fees on Carrabba’s Italian Grill (and Abbraccio) restaurants was terminated.
Following areis a summary of sales by occasion, sales mix by product type and average check per person for Company-owned restaurants during 2021:2023:
| | | | | | | | | | | | | | | | | | | | | | | | | | | | | |
| U.S. | | INTERNATIONAL |
| Occasion: | Outback
Steakhouse | | Carrabba’s
Italian Grill | | Bonefish Grill | | Fleming’s
Prime Steakhouse
& Wine Bar | | Outback
Steakhouse
Brazil |
| In-restaurant sales | 68 | % | | 63 | % | | 81 | % | | 91 | % | | 75 | % |
| Off-premises sales | 32 | % | | 37 | % | | 19 | % | | 9 | % | | 25 | % |
| | | | | | | | | |
| | | | | | | | | |
| Sales mix by product type: | | | | | | | | | |
| Food & non-alcoholic beverage | 92 | % | | 90 | % | | 82 | % | | 79 | % | | 92 | % |
| Alcoholic beverage | 8 | % | | 10 | % | | 18 | % | | 21 | % | | 8 | % |
| | | | | | | | | |
| | | | | | | | | |
| Average check per person ($USD) | $ | 24 | | | $ | 23 | | | $ | 30 | | | $ | 90 | | | $ | 9 | |
| Average check per person (R$) | | | | | | | | | R$ | 50 | |
Delivery - During 2019, we completed the rollout of in-house delivery for substantially all Outback Steakhouse and the majority of Carrabba’s Italian Grill Company-owned restaurants and expanded our delivery platform through partnerships with leading national delivery services for our Outback Steakhouse, Carrabba’s Italian Grill and certain Bonefish Grill restaurants.
In March 2020, we pivoted to an off-premises only model in response to the COVID-19 pandemic. While our dining rooms were closed in the U.S. we tripled our off-premises sales per restaurant, and since reopening our restaurant dining rooms in May 2020, have maintained strong retention of off-premises sales. | | | | | | | | | | | | | | | | | | | | | | | | | | | | | |
| U.S. | | INTERNATIONAL |
| Occasion: | Outback
Steakhouse | | Carrabba’s
Italian Grill | | Bonefish Grill | | Fleming’s
Prime Steakhouse
& Wine Bar | | Outback
Steakhouse
Brazil |
| In-restaurant sales | 74 | % | | 67 | % | | 84 | % | | 95 | % | | 86 | % |
| Off-premises sales | 26 | % | | 33 | % | | 16 | % | | 5 | % | | 14 | % |
| 100 | % | | 100 | % | | 100 | % | | 100 | % | | 100 | % |
| | | | | | | | | |
| Sales mix by product type: | | | | | | | | | |
| Food & non-alcoholic beverage | 92 | % | | 90 | % | | 81 | % | | 79 | % | | 92 | % |
| Alcoholic beverage | 8 | % | | 10 | % | | 19 | % | | 21 | % | | 8 | % |
| 100 | % | | 100 | % | | 100 | % | | 100 | % | | 100 | % |
| | | | | | | | | |
| Average check per person ($USD) | $ | 28 | | | $ | 25 | | | $ | 34 | | | $ | 100 | | | $ | 13 | |
| Average check per person (R$) | | | | | | | | | R$ | 64 | |
Unaffiliated Franchise Program - Our unaffiliated franchise agreements grant third parties rightsthe right to establish and operate a restaurant using one of our concepts. Franchised restaurants are required to be operated in accordance with the franchise agreement and in compliance with their respective concept’s standards and specifications.
Under our franchise agreements, each franchisee is required to pay an initial franchise fee and monthly royalties based on a percentage of gross restaurant sales. Initial franchise fees for full-service restaurants are generally $40,000 for U.S. franchisees and range between $30,000 and $75,000 for international franchisees, depending on the market. Initial franchise fees for international delivery-only kitchens are generally $10,000. Some franchisees may also pay advertising and administration fees based on a percentage of gross restaurant sales. Following is a summary of royalty fee percentages based on our existing unaffiliated franchise agreements:
| | | | | | | |
| (as a % of gross Restaurant sales) | MONTHLY ROYALTY FEE PERCENTAGE | | |
| U.S. franchisees (1) | 3.50% - 5.75% | | |
| International franchisees (2) | 2.00%2.75% - 5.00% | | |
| | | |
| | | |
| | | |
| | | |
_________________
(1)U.S. franchisees must also contribute a percentage of gross sales for national marketing programs and spend a certain percentage of gross sales on local advertising. For most U.S. franchisees, there is a maximum of 8.0% of gross restaurant sales for combined national marketing and local advertising.
(2)International franchisees must spend a certain percentage of gross sales on local advertising, which varies depending on the market.
OnEffective December 27, 2020,31, 2023, we entered into an agreementAmended & Restated Holistic Agreement (the “Resolution“2023 Resolution Agreement”) with Cerca Trova Southwest Restaurant Group, LLC (d/b/a Out West Restaurant Group) and certain of its affiliates (collectively, “Out West”), a franchisee of approximately 8078 Outback Steakhouse restaurants in the western United States as of December 26, 2021.States. Under the terms of the agreement,2023 Resolution Agreement, advertising fees wereare reduced to 2.25% of gross sales
until December 31, 202327, 2026 or upon the earlier occurrence of certain specified events, including the sale of all or substantially all of the assets or equity of Out West, bankruptcy or a liquidation event.
Out West also entered into a forbearance agreement with its lenders that, in conjunction with the 2023 Resolution Agreement, which,provides, among other things, provides for a pre-determined calculation of available monthly cash (“Available Cash”)(after payment of operating expenses, including rents, royalties, national advertising fees and local marketing expenditures) that Out West may use for capital expenditures and to settle its obligations due to us and its lenders. Under the Resolution Agreement, if Out West is unable to satisfy monthly royalty or advertising fees with Available Cash, such amounts will be automatically deferred under the Resolution Agreement.
See Note 43 - Revenue Recognition of the Notes to Consolidated Financial Statements for further details regarding the 2023Resolution Agreement.
RESOURCES
Sourcing and Supply - We take a global approach to procurement and supply chain management, with our corporate team serving all U.S. and international concepts. In addition, we have dedicated supply chain management personnel for our Company-owned international operations in South America and Asia. The global supply chain management organization is responsible for all food and operating supply purchases as well as a large percentage of purchases of field and corporate services.
We address the end-to-end costs associated with the products and goods we purchase by utilizing a combination of global, regional and local suppliers to capture efficiencies and economies of scale. This “total cost of ownership” (“TCO”) approach focuses on the initial purchase price, coupled with the cost structure underlying the procurement and order fulfillment process. The TCO approach includes monitoringWe also regularly monitor commodity markets and trends to execute product purchases at the most advantageous times.
We have a distribution program that includes food, non-alcoholic beverage, smallwares and packaging goods in all major markets. Where applicable, this program is managed by a custom distribution companycompanies that only providesprovide products approved for our system. ThisThese customized relationship also enablesrelationships enable our staff to effectively manage and prioritize our supply chain.
Beef representsand pork represent the majority of purchased proteins.proteins in the U.S. and Brazil, respectively. In 2021, we primarily purchased2023, our U.S. restaurants purchased beef raw materials primarily from four U.S. beef suppliers and our restaurants in Brazil beefpurchased pork raw materials primarily from three beef suppliers.four pork suppliers in Brazil. Due to the nature of our industry, we expect to continue purchasing a substantial amount of beef and pork from a small number of suppliers. Other major commodity categories purchased include seafood, poultry, produce, dairy, bread, oils and pasta and energy sources to operate our restaurants, such as natural gas and electricity. The cost of such commodities may fluctuate widely due to government policy and regulation, changing weather patterns and conditions, climate change and other supply and/or demand impacting events such as the COVID-19 pandemic,pandemics, macroeconomic conditions, geopolitical events or other unforeseen circumstances.
Serving safe and high qualityhigh-quality food has always been our priority. We utilize both an internal food safety team responsible for supplier evaluations and external third parties who inspect supplier adherence and restaurant practices to monitor quality, food safety and product specifications. All of our restaurants implement best practices for food handling, monitoring and innovating to improve procedures. Our restaurant teams have many touch points to seek to ensure food safety, quality and freshness through all phases of preparation.
We are committed to building long-term partnerships with suppliers who are dedicated to delivering safe, high qualityhigh-quality ingredients in a sustainable way. All suppliers are required to comply with our Supplier Code of Ethics and we strive to source only products that are raised in a sustainable, ethical and humane manner.
Information Systems - We leverage technology to support areas such as digital marketing and customer engagement, business analytics and decision support, restaurant operations and productivity initiatives related to optimizing our staffing, food waste management and supply chain efficiency.
To drive customer engagement, we continue to invest in data and technology infrastructure, including brand websites, digital marketing, online ordering and mobile apps. To increase customer convenience, we are leveraging
leverage our online ordering infrastructure to facilitate expanded off-premises dining systems. Additionally, we developed systems to support our customer loyalty program with a focus on increasing traffic to our restaurants. In recentpast years, we have made investments in a global supply chain management system to improve inventory forecasting and replenishment in our restaurants, which helps us manage food quality and cost. We also continue to invest in a range of toolscost, and infrastructure to support risk management and cyber security.reduce food waste.
Our integrated point-of-sale system allows us to transact business in our U.S. restaurants and communicate sales data through a secure corporate network to our enterprise resource planning system and data warehouse. Our Company-owned restaurants, and most of our franchised restaurants, are connected through a portal that provides our employees and franchise partners with access to business information and tools that allow them to collaborate, communicate, train and share information.
We maintain a robust system to ensure network security and safeguard against data loss. See Item 1C. Cybersecurity and Item 1A. Risk Factorsfor additional discussion of our cyber securitycybersecurity measures.
Advertising and Marketing - We advertise through a diverse set of media channels including, but not limited to, national/spot television, radio, social media, search engines and other digital tactics. Our concepts have active public relations programs and also rely on national promotions, site visibility, local marketing, digital marketing, direct mail, billboards and point-of-sale materials to promote our restaurants. Recently, we increased ourWe focus on data segmentation and personalization, customer relationship management and digital advertising to be more efficient and relevant with our advertising expenditures. Internationally,Additionally, in our company-owned international markets, we have teams in our developed markets that engage local agencies to tailor advertising to each market and develop relevant and timely promotions based on local consumer demand.
During 2023, Outback brought back the “No Rules, Just Right” platform, which includes highlighting our great menu and everyday value that we offer to our guests. “No Rules, Just Right” is more than a marketing platform, it is an attitude, aimed at re-energizing our restaurants with new food offerings, exceptional service and most importantly, ties back to our past.
Our multi-branded U.S. loyalty program, Dine Rewards, is designed to drive incremental traffic and provide data for customer segmentation and personalization opportunities.
Restaurant Management - The Restaurant Managing Partner has primary responsibility for the day-to-day operation of the restaurant and is required to follow Company-established operating standards. Area Operating Partners for our casual dining concepts oversee restaurant operations and Restaurant Managing Partners within a specific region. For our Outback Steakhouse and Carrabba’s Italian Grill brands, Market Vice Presidents oversee multiple Area Operating Partner regions.
In addition to base salary, Area Operating Partners, Restaurant Managing Partners and Chef Partners (“Restaurant Partners”), Area Operating Partners, and Market Vice Presidents generally receive performance-based bonuses for providing management and supervisory services to their restaurants, certain of which may be based on a percentage of their restaurants’ monthly operating results or cash flows and/or total controllable income.
Restaurant Managing Partners and Chef Partners in the U.S. may also participate in deferred compensation and other performance-based compensation programs. To fund deferred compensation arrangements, we may invest in corporate-owned life insurance policies, which are held within an irrevocable grantor or “rabbi” trust account for settlement of certain of our obligations under the deferred compensation plans.
Many of our international Restaurant Managing Partners are given the option to purchase participation interests in the cash distributions of the restaurants they manage. The amount, terms and availability vary by country.
Trademarks - We regard our Outback®, Outback Steakhouse®, Carrabba’s Italian Grill®, Bonefish Grill® and Fleming’s Prime Steakhouse & Wine Bar® service marks and our Bloomin’ Onion® trademark as having significant value and as being important factors in the marketing of our restaurants. We have also obtained trademarks and service marks for these and several of our other menu items and various advertising slogans both in the U.S. and in other countries where we operate. We are aware of names and marks similar to the service marks of ours used by other persons in certain geographic areas in which we have restaurants. However, we believe such uses will not
adversely affect us. Our policy is to, whenever possible, pursue registration of our marks in countries where we
operate and to vigorously oppose any infringement of our marks. We also have registered domain names for each of our concepts.
We license the use of our registered trademarks to franchisees and third parties through franchise and license arrangements. The franchise and license arrangements restrict franchisees’ and licensees’ activities with respect to the use of our trademarks and impose quality control standards in connection with goods and services offered in connection with the trademarks.
SEASONALITY
Our business is subject to seasonal fluctuations. Historically, customer traffic patterns for our established U.S. restaurants are generally highest in the first quarter of the year and lowest in the third quarter of the year. International customer traffic patterns vary by market with Brazil historically experiencing minimal seasonal traffic fluctuations. Holidays may affect sales volumes seasonally in some of our markets. However, the COVID-19 pandemic has had and may continue to have an impact on consumer behaviors and customer traffic that may resultresulted in temporary changes in the seasonal fluctuations of our business. Additionally, severe storms, extended periods of inclement weather or climate extremes resulting from climate change may also affect the seasonal operating results of the areas impacted.
See Item 1A. Risk Factors for discussion of risks related to seasonal and periodic fluctuations.
GOVERNMENT REGULATION
We are subject to various federal, state, local and international laws affecting our business. Each of our restaurants is subject to licensing and regulation by a number of governmental authorities, which may include, among others, alcoholic beverage control, health and safety agencies and environmental and fire agencies in the state, municipality or country in which the restaurant is located.
U.S. - During 2020, several governmental bodies in the U.S. addressed the spread of COVID-19 by imposing limitations on business operations or recommending that residents and/or employers adopt “social distancing”, vaccination and/or testing measures. Since the onset of the COVID-19 pandemic, formal and informal restraints, as well as consumer behavior, have materially affected the way we operate our business and serve our guests.
Alcoholic beverage sales represent 11% of our U.S. restaurant sales. Alcoholic beverage control regulations require each of our restaurants to apply to a state authority and, in certain locations, county or municipal authorities for a license or permit to sell alcoholic beverages on the premises and, where applicable, a permit to provide service for extended hours, for carry-out or delivery and on Sundays. At the onset of the COVID-19 pandemic, many state governors entered executive orders allowing restaurants to sell alcohol for carry-out or delivery. In most jurisdictions, alcohol licenses for restaurants did not previously allow for off-premises sales. Many of these executive orders remain in effect, with some states passing permanent legislation. We are currently offeringalso offer alcohol to-go from certain locations from each of our restaurant concepts.
Our restaurant operations are also subject to federal and state laws for such matters as:
•immigration, employment, minimum wage, overtime, tip credits, paid leave, safety standards, worker conditions and health care;
•menu labeling and food safety;
•the Americans with Disabilities Act, which, among other things, requires our restaurants to meet federally mandated requirements for the disabled; and
•information security, data privacy, anti-corruption/anti-bribery, cashless payments and gift cards.
International - Our restaurants outside of the U.S. are subject to similar regional and local laws and regulations as our U.S. restaurants, including COVID-19-related mandates, labor, food safety, data privacy, anti-corruption/anti-bribery and information security.
See Item 1A1A. - Risk Factors for a discussion of risks relating to federal, state, local and international regulation of our business.
HUMAN CAPITAL RESOURCES
Employees - As of December 26, 2021,31, 2023, we employed approximately 82,00087,000 Team Members, (our employees), of which approximately 700750 are corporate personnel, including more than 200250 in international markets.
We are committed to nurturing an inclusive, service-focused culture, founded on respecting and valuing every person, regardless of gender, race, ethnic origin, religion, sexual orientation, ability or age. We track a variety ofseveral workforce statistics to help us understand the gender, racial and ethnic diversity of our U.S. Team Members, including the following as of the period indicated:
| | DECEMBER 26, 2021 |
| | DECEMBER 31, 2023 | |
| | DECEMBER 31, 2023 | |
| | DECEMBER 31, 2023 | |
| KEY STATISTICS | KEY STATISTICS | | WOMEN | | | PEOPLE OF COLOR (1) | KEY STATISTICS | | WOMEN | | | | PEOPLE OF COLOR (1) |
| | Restaurant Support Center | Restaurant Support Center | | 64% | | | 21% | |
| Operations Leadership | | 36% | | | 30% | |
| Restaurant Support Center | |
| Restaurant Support Center | |
| Operations Leadership (2) | |
| Operations Leadership (2) | |
| Operations Leadership (2) | |
| Hourly Team Members | Hourly Team Members | | 51% | | | 48% | |
| Hourly Team Members | |
| Hourly Team Members | |
_________________
(1)Denotes U.S. Team Members that identify as Black/African American, Hispanic/Latinx, Asian, Native American, Pacific Islander or two or more races.
(2)Includes restaurant management, Chef Partners, Restaurant Managing Partners, Area Operating Partners, Regional Vice Presidents and Market Vice Presidents.
In addition to gender, racial and ethnic diversity, our U.S Team Members are also diverse in age, comprised of five generations: Traditionalists, Baby Boomers, Generation X, Millennials and Generation Z.
Various jurisdictional mandated industry-wide labor agreements, which are renewed annually, apply to certain of our employees in Brazil.
Celebrating Our People – Team Members, guests, suppliers and neighbors have always been at the heart of our Company’s culture, driven each day by our founding Principles & Beliefs, which include treating each individual as we would want to be treated. We believe that creating exceptional guest experiences begins with providing a positive, supportive work environment that welcomes individual differences and allows employees to grow and have fun. We focus on developing genuine, emotional guest connections through friendly service and high-quality food. We embrace the communities we serve, from feeding first responders to supporting worthy causes,non-profit organizations, especially in the Tampa Bay area of Florida, home to our Restaurant Support Center.
Diversity, Equity & Inclusion - We aim to cultivate a welcoming, safe, and inclusive environment that celebrates diverse backgrounds and provides equitable access to opportunities. We deliver on this by ensuring everyone is trained, understands their role in inclusivity, and is held accountable in making our restaurants a place where everyone is valued for who they are and what they bring to the table.
We are constantly working to improve how we support our Team Members. As a part of these efforts, we continually assess our overall racial diversity at Bloomin’ Brands as we strive to reflect the diversity of the communities we serve. We actively engage and listen to our Team Members as they share personal perspectives that could serve as insight for others. We have a Diversity & Inclusion Council comprising individuals across the Company, at all levels, to help guide, monitor, and reinforce short- and long-term diversity and inclusion goals.
Together we drive diversity, equity and inclusion through:
•Leadership & Talent: attracting, retaining, developing and promoting diverse employees who reflect our communities at all levels of leadership. During 2021, we introduced updated leadership competencies, with inclusive leadership as a core behavior at every level of the organization. We launched new leadership development programs including Company-sponsored executive coaching, the Women of Color LeadHERship Development Program and the McKinsey Black Leaders Academy.
•Training & Education: strengthening our training and education programs to include listening, sharing and storytelling. Putting learning into action to inspire change and lead a culture of authenticity.
•Employee Resource Groups: connecting Team Members through dedicated networks focused on relationship building, professional growth and development, and purposeful community involvement, providing direct impact and value to the business. During 2021, we actively inspired a sense of community through three Employee Resource Groups:
◦Women’s Interests Network (WIN): To accelerate the advancement of women working at Bloomin’ Brands by sharing information, best practices, education and experience, and in so doing helping one another develop leadership skills and career advancement opportunities.
◦Black Interests Group (BIG): To elevate Black talent at Bloomin’ Brands by building strong networks that champion professional growth, mentoring and leadership opportunities across the entire organization.
◦BELONG: To celebrate understanding, acceptance and involvement of the LGBTQ+ community, fostering an environment where our people belong and thrive.
•Meaningful Partnerships: being good stewards of our communities and engaging with organizations dedicated to cultivating more diverse and inclusive communities, including:
◦Harvest Food Donation
◦National Urban League
◦Woman’s Foodservice Forum
◦Multicultural Foodservice & Hospitality Alliance
◦National Diversity Council
◦Autism Speaks
◦Habitat for Humanity
◦Big Brothers, Big Sisters of America
◦Boys & Girls ClubsCenter (“RSC”).
We use surveys to seek feedback from our Team Members on a variety of topics that include, but are not limited to, confidence in leadership, our company culture and overall satisfaction with the Company. We regularly monitor and evaluate turnover and attrition metrics throughoututilize a comprehensive total rewards survey, the insights from which we are using to define our management teams.Value of Employment strategy. Annual strategic talent reviews and succession planning for executive-level roles, senior management and key restaurant leadership positions help ensure consistency in management talent quality. During 2023, approximately 91% of promotions to our Manager in Training program and to Restaurant Managing Partner were internal, which consisted of 42% women and 29% people of color.
We regularly monitor and evaluate turnover and attrition metrics throughout our management teams. During 2023, our turnover rates for U.S. hourly restaurant Team Members and U.S. restaurant management were 91% and 22%, respectively.
We are committed to high standards of ethical, moral and legal business conduct and strive to be an open and honest workplace, providing a positive work environment and fostering a culture of integrity and ethical decision-making. To support this commitment, we have a Code of Conduct that provides clear direction for behavioral expectations. Every employee, officerWe provide annual training to our Restaurant Partners, Area Operating Partners, Market Vice Presidents and director completes situational training annually.RSC Team Members on our Code of Conduct, Preventing Discrimination and Harassment and Anti-Bribery and Anti-Corruption. All field-level employees are also provided Preventing Discrimination and Harassment training. In addition, we maintain an Ethics and Compliance Hotline (the “Hotline”), which includes an 800 number and an online form where violations and other workplace concerns can be reported.our Team Members can confidentially, and if desired, anonymously, usereport any workplace concerns, with the option to report anonymously. The Hotline to make a report online or to a live third-party operator inis accessible via several languages, 24 hours a day, seven days a week. Annually,We also developed an informational poster for our U.S. restaurants, in English and Spanish, which provides the phone number, the web address for the reporting form and a QR code to make it easy for our Team Members to report concerns.
Finally, we continue to support a hybrid work environment in the RSC. We are investing in a cultural refresh in response to employees returning to the office and have renewed our RSC Principles & Beliefs to invigorate connection and inclusivity between the corporate and field teams.
Diversity, Equity & Inclusion - We aim to cultivate a welcoming, safe and inclusive environment that celebrates diverse backgrounds and provides equitable access to opportunities. We deliver on this by ensuring Team Members are trained, understand their role in inclusivity and are held accountable in making our restaurants a place where everyone is valued for who they are and what they bring to the table.
We continually assess our overall racial and gender diversity at Bloomin’ Brands as we strive to reflect the diversity of the communities we serve. Year over year, we have seen improvements in diverse representation among our restaurant management teams and RSC, including an increase of approximately 2% in representation of women within our Operational Leadership and people of color at the RSC, respectively, while recognizing there is more work to be done.
During 2023, our Executive Leadership Team (“ELT”) continued engaging in sessions curated and facilitated by a diversity consulting firm in partnership with our internal Inclusive Leadership Team. In these sessions, ELT members participated in deep, enriching dialogue around potential gaps in our organization and industry and their individual and collective responsibility for sustaining change.
While engaged in deep work with our executive team, we also continued listening, sharing and storytelling to inspire awareness, understanding and change across the organization. Each concept held monthly Courageous Conversations and we hosted virtual calls open to the entire company bimonthly to learn about and discuss important topics aligned to the mission and objectives of our five Employee Resource Groups:
•Women’s Interests Network (WIN): Committed to accelerating the advancement of women at Bloomin’ Brands through mentorship, education, experience and information sharing;
•Black Interests Group (BIG): Focused on elevating and amplifying Black talent through strong networks and mentorship;
•BELONG: Fostering an environment for Our People to thrive while celebrating understanding, acceptance and involvement of the LGBTQ+ community and their allies;
•¡Adelante!: Aimed at accelerating and celebrating the Hispanic and Latin Community at Bloomin’ Brands; and
•Bloomin’ Balance: Inspiring our Team Members to lead happy, healthy and fulfilled lives through total and balanced wellness.
From our participation at the Women’s Foodservice Forum annual conference to memorable heritage month programs and active community involvement (for example, Juneteenth service activities, Pride sponsorships and engagement, walks and runs for special health-focused causes), our Employee Resource Groups have been instrumental in providing support, a sense of community and both personal and professional development for our Team Members.
As we aim to attract and cultivate relationships with the next generation of talent in our workforce, we have been intentional about being visible and building brand awareness at a number of Florida colleges and universities, including Florida A&M University (a historically Black university), Florida International University (minority/Hispanic serving institution), the University of Central Florida and the University of South Florida. Among the support, we provide trainingfuture industry leaders with financial support through endowed scholarships to help offset students’ costs of higher education as they pursue degrees and educationcertifications that align with the work we do in hospitality.
We support words with actions by being good stewards of our communities and engaging with organizations dedicated to our salaried employeescultivating more diverse and most hourly employees with respect to our Code of Conduct, including our anti-corruption and anti-bribery policies.inclusive communities, including:
| | | | | | | | |
•National Urban League | | •Big Brothers, Big Sisters |
•Woman’s Foodservice Forum | | •Boys & Girls Clubs |
•Multicultural Foodservice & Hospitality Alliance | | •Feeding America (Tampa Bay) |
•National Diversity Council | | •Meals on Wheels |
•Autism Speaks | | •Harvest Food Donation |
•Habitat for Humanity | | |
Workplace Safety - Employee health and safety in the workplace is of utmost importance to our Company. We believe that all employees, regardless of job role or title, have a shared responsibility in the promotion of health and safety in the workplace. We are committed to providing and following safety laws and rules, including internal policies and procedures. This commitment means carrying out company activities in ways that preserve and promote a clean, safe and healthy environment.
Total Rewards - Our total rewards philosophy is to motivate and retain our Team Members by offering, what we believe to be, competitive salary packages. To align Team Member objectives with theour Company and ultimately our stockholders, Bloomin’ Brands offers programs that reward long-term performance. Additionally, we offer a well-rounded benefit package that includes the following, along with other benefits:
•Comprehensive health insurance coverage for Team Members working an average of 30 or more hours each week. This program includes wellness programs intended to proactively support healthcare and access to a health savings account that is eligible for employer contributions and is fully portable.
•Virtual therapy that takes place via mobile device or computer, allowingAn employee assistance program provided at no cost to all Team Members regardless of insurance enrollment with our Company,and their family members which includes virtual therapy sessions, free counseling and tools and resources in order to access help whenimprove mental health and where they need it, along with guided meditation options. The mentalthe well-being of our Team Members is important to us.Members.
•Our non-executiveAll salaried Team Members are eligible to receive matching contributionsparticipate in our 401(k) plan and havecompany sponsored retirement plans with access to financial wellness resources. Eligible Team Members participating in the 401(k) receive matching contributions.
Company Response to COVID-19• - During 2021, as the COVID-19 pandemic continued to impact the livesEmployee discounts when dining at any one of our brands.
•All levels of the organization, including hourly Team Members we offered educational resources to inform their vaccination decision. We also providedthat meet certain service criteria, can qualify for paid time off for hourly Team Members who elected to be vaccinated.
In 2020, in response to the COVID-19 global crisis, we did not furlough any Team Memberspurpose of rest, relaxation and provided $44.9 million of relief pay, excluding employee retention tax credits earned, for our field hourly Team Members who were impacted by closed dining rooms. We also paidplanned time away from the employee portion of benefits premiums for Team Members who received relief pay. In addition, Team Members who were quarantined or who had a personal illness related to COVID-19 received pay.workplace.
Employee Support and Community Engagement - Our commitment to our Team Members does not stop with competitive salaries, development and benefits. In 1999, we created a trust (the “Trust”) to support our Team Members in times of personal hardship. All contributions to the Trust are voluntary, employee-funded and are not solicited from suppliers, customers or friends. Due to the incredible generosity and caring nature of our Team Members, the Trust is able to make meaningful monetary support to our Team Members who experience very difficult, often unexpected and catastrophic issues, in their lives. Since 2017, the Trust has paid approximately $1.6$2.2 million to the benefit of over 1,1001,500 Team Members who applied for support.support, including Team Members impacted by hurricanes and other natural disasters.
We are inspired by the generosity of our Team Members and encourage them to give back to their communities. To facilitate this community engagement, field Team Members volunteer within their communities and RSC Team Members participate in an annual Community Service Day. In 2023, its 15th year, Team Members volunteered over 800 hours of service at 16 non-profit organizations in the Restaurant Support Center are given paid time offTampa Bay area.
In addition, during 2022 we implemented an annual matching gift and volunteer grant program for approved community service activitieseligible 501(c)(3) non-profit organizations and provided a limited dollar-for-dollar match or grant for full-time RSC Team Members who made a personal charitable donation or volunteered for a minimum of ten hours during scheduled worknon-working hours.
Information About Our Executive Officers - Below is a list of the names, ages, positions and a brief description of the business experience of each of our executive officers as of February 18, 2022:23, 2024:
| | | | | | | | | | | | | | |
| NAME | | AGE | | POSITION |
David J. Deno | | 6466 | | Chief Executive Officer |
| Christopher Meyer | | 5052 | | Executive Vice President, Chief Financial Officer |
| Lissette Gonzalez | | 50 | | Executive Vice President, Chief Supply Chain and Operations Excellence Officer |
| Mark Graff | | 44 | | Executive Vice President, President of Bonefish Grill and Fine Dining |
| W. Michael Healy | | 49 | | Executive Vice President, Global Business Development and Strategy |
| Kelly Lefferts | | 5557 | | Executive Vice President, Chief Legal Officer and Secretary |
| Brett Patterson | | 55 | | Executive Vice President, President of Outback Steakhouse |
| Gregg Scarlett | | 6062 | | Executive Vice President, Chief Operating Officer, Casual Dining Restaurants |
Patrick MurthaAstrid Isaacs | | 6347 | | ExecutiveSenior Vice President, Fleming’s, International &Chief Technology Officer |
| Philip Pace | | 49 | | Senior Vice President, Chief Accounting Officer |
| Suzann Trevisan | | 52 | | Senior Vice President, Chief Human Resources Officer |
David J. Deno has served as Chief Executive Officer and as a member of our Board of Directors since April 2019. Mr. Deno previously served as our Executive Vice President and Chief Financial and Administrative Officer from October 2013 to April 2019 and as Executive Vice President and Chief Financial Officer from May 2012 to October 2013. Prior to joining the Company, Mr. Deno was Chief Financial Officer of the international division of Best Buy Co., Inc. from December 2009 to May 2012. Mr. Deno has also previously served as Chief Financial Officer and later Chief Operating Officer of Yum! Brands, Inc.
Christopher Meyer has served as Executive Vice President, Chief Financial Officer since April 2019. Mr. Meyer previously served as Group Vice President, Finance, Treasury and Accounting from November 2017 to April 2019 and Group Vice President, Financial Planning & Analysis and Investor Relations from September 2014 to November 2017. In February 2024, Mr. Meyer notified the Company of his intention to retire from the Company in 2024, as disclosed in the Form 8-K filed with the Securities and Exchange Commission (“SEC”) on February 23, 2024.
Lissette Gonzalez has served as Executive Vice President, Chief Supply Chain and Operations Excellence Officer since October 2023. Ms. Gonzalez served as Senior Vice President, Global Supply Chain Officer from April 2021 to October 2023; Vice President, Global Supply Planning and Forecasting from April 2019 to April 2021; and Vice President, Supply Planning and Forecasting from September 2014 to April 2019.
Mark Graff has served as Executive Vice President, President of Bonefish Grill and Fine Dining since November 2023. Mr. Graff served as Senior Vice President, Development from April 2023 to November 2023; Senior Vice President, Development, Financial Planning & Analysis and Investor Relations from May 2021 to April 2023; Group Vice President, Corporate Finance and Investor Relations from February 2019 to May 2021; and Vice President, Corporate Finance and Investor Relations from February 2016 to February 2019. He also served as Treasurer from February 2019 to November 2020. Mr. Graff joined the Company in 2012 and has held roles as Senior Director of Corporate Planning and Director of International Business Development.
W. Michael Healy has served as Executive Vice President, Global Business Development and Strategy since November 2023. Mr. Healy served as Senior Vice President, President of Bonefish Grill from November 2021 to November 2023; Senior Vice President, Field Operations and Innovation from April 2021 to November 2021; Senior Vice President, Global Supply Chain Officer from February 2019 to April 2021; Group Vice President, Finance for Outback Steakhouse from May 2015 to February 2019; and Vice President, Development and Strategic Analytics from April 2012 to May 2015. Mr. Healy joined the Company in 2009 as Director of Sales Forecasting and Analysis.
Kelly Lefferts has served as Executive Vice President, Chief Legal Officer since July 2019. Ms. Lefferts served as Group Vice President and U.S. General Counsel of Bloomin’ Brands from September 2015 to July 2019 and Vice President and Assistant General Counsel of Bloomin’ Brands from January 2008 to September 2015. She has also served as Secretary of Bloomin’ Brands since February 2016.
Brett Patterson has served as Executive Vice President, President of Outback Steakhouse since November 2023. Mr. Patterson served as Senior Vice President, President of Outback Steakhouse from February 2020 to November 2023 and Group Vice President, Outback Operations from August 2017 to February 2020.
Gregg Scarlett has served as Executive Vice President, Chief Operating Officer, Casual Dining Restaurants since February 2020. Mr. Scarlett previously served as Executive Vice President, President of Outback Steakhouse from July 2016 to February 2020; Executive Vice President, President of Bonefish Grill from March 2015 to July 2016; Senior Vice President, Casual Dining Restaurant Operations from January 2013 to April 2015; and Senior Vice President of Operations for Outback Steakhouse from March 2010 to January 2013. Mr. Scarlett will be leaving the Company on March 15, 2024, as disclosed in the Form 8-K filed with the SEC on October 3, 2023.
Patrick MurthaAstrid Isaacs has served asSenior Vice President, Chief Technology Officer since November 2021. From July 2020 to November 2021, she was Vice President, Digital and Consumer Technology for Subway. Prior to that, she served as our Vice President, Restaurant Technology from February 2020 to July 2020 and Director, International Information Technology from June 2015 to February 2020.
Philip Pace has served as Senior Vice President, Chief Accounting Officer since July 2022. Mr. Pace previously served as Group Vice President and Controller from October 2015 to July 2022 and Vice President, Corporate Controller from July 2013 to October 2015.
Suzann Trevisan has served as Executive Vice President, Fleming’s, International & Human Resources since April 2021. Mr. Murtha previously served as Executive Vice President and President, International from November 2013 to January 2018 and ExecutiveSenior Vice President, Chief Human Resources Officer from February 2021 to April 2021. He also served as Interim Chief Human Resources Officer fromsince September 2020 to February 2021.2022. Prior to joining Bloomin’ Brands, Ms. Trevisan held a number of leadership positions with Owens Corning, including Vice President of Human Resources for the Company, Mr. Murtha was the Principal Consultant of Murtha Consultingcomposites business from JanuaryMarch 2018 to December 2020. Mr. Murtha also previously served as ChairmanAugust 2022 and Vice President of the Board and Managing DirectorHuman Resources, Centers of KFC, Japan, Ltd., Chief Operating Officer of Pizza Hut and Chief People Officer of Yum! Restaurants International.Excellence from June 2015 to March 2018.
Additional Information - We make available, free of charge, through our internet website www.bloominbrands.com, our Annual Report on Form 10-K, Quarterly Reports on Form 10-Q, Current Reports on Form 8-K, Proxy Statements and amendments to those reports filed or furnished pursuant to Section 13(a) or 15(d) of the Exchange Act, as soon as reasonably practicable after electronically filing such material with the Securities and Exchange Commission (“SEC”).SEC. Our reports and other materials filed with the SEC are also available at www.sec.gov. The reference to these website addresses in this Report does not constitute incorporation by reference of the information contained on the websites and should not be considered part of this Report.
Item 1A. Risk Factors
The risk factors set forth below should be carefully considered. The risks described below are those that we believe could materially and adversely affect our business, financial condition or results of operations, however, they are not the only risks facing us. Additional risks and uncertainties not currently known to us or those we currently view to be immaterial may also materially and adversely affect our business, financial condition or results of operations.
Risks Related to Our Business and Industry
Food safety and food-borne illness concerns in our restaurants or throughout the industry or supply chain may have an adverse effect on our business by reducing demand and increasing costs.
Regardless of the source or cause, any report of food-borne illnesses and other food safety issues, whether at one of our restaurants or in the industry or supply chain, generally could have a negative impact on our traffic and sales and adversely affect the reputation of our brands. Food safety issues could be caused by suppliers or distributors and, as a result, be out of our control and this risk may be exacerbated by current supply chain issues, which could delay deliveries and necessitate alternative sourcing on short notice. Health concerns or outbreaks of disease in a food product could also reduce demand for particular menu offerings. Even instances of food-borne illness, food tampering or food contamination occurring solely at restaurants of other companies could result in negative publicity about the food service industry generally and adversely impact our sales. There is also the risk of allergen cross contamination in our restaurants despite precautionary measures to minimize the risk. Social media has dramatically increased the rate at which negative publicity, including as it relates to food-borne illnesses, can be disseminated
before there is any meaningful opportunity to respond or address an issue. The occurrence of food-borne illnesses or food safety issues could also adversely affect the price and availability of affected ingredients, resulting in higher costs and lower margins.
The COVID-19 pandemic has disrupted and is expected to continue to disrupt our business, and could continue to materially and adversely affect our business, revenues, financial condition and results of operations for an extended period of time.
The COVID-19 pandemic and related preventative and protective measures have negatively impacted, and are expected to continue to impact, our business globally. In the United States and in foreign countries in which we operate, individuals are encouraged to practice social distancing, and numerous jurisdictions have imposed on a temporary or on-going basis, and others in the future may impose or reinstate, restrictions from gathering in groups, shelter-in-place orders and similar governmental orders and restrictions for residents to control the spread of COVID-19, all of which impacts our ability to operate our business. These preventative and protective measures, which vary significantly across the jurisdictions where our restaurants are located, create a rapidly changing and complicated system for ensuring compliance and predicting our revenues and cost structure.
In response to the COVID-19 pandemic and these changing conditions, we modified work hours for our team members, identified and implemented cost savings measures throughout our operations, shifted the majority of our corporate employees to remote working and temporarily limited our services in the U.S. to carry-out and delivery only from March 2020 through early May 2020. Depending on the future course of the COVID-19 pandemic and future outbreaks and variants of the virus, we could face additional closures or limitations on our services or capacity for our restaurant dining rooms. If we revert to solely or primarily off-premises sales, there can be no assurance that our off-premises sales will grow or remain at levels experienced while our dining rooms were previously closed.
Further, if the business interruptions caused by COVID-19 worsen and we were again required to suspend operations or limit capacity in our restaurant dining rooms or our assumptions regarding liquidity needs prove inaccurate, we could face liquidity challenges and would need to seek additional sources of liquidity. There can be no guarantee that additional liquidity will be readily available or available on favorable terms, especially the longer the COVID-19 pandemic lasts.
Our restaurant operations could be further disrupted if any of our employees are diagnosed with COVID-19, since this could require restaurant closures or require some or all of a restaurant’s employees to self-quarantine. If our customers become ill, a significant percentage of our or our suppliers’ or distributors’ workforce is unable to work, or if there are similar disruptions in the supply chain generally for certain products, whether because of illness, quarantine, limitations on travel or other government restrictions in connection with COVID-19, we could face disruptions to restaurant operations, cost increases and shortages of food or other supplies, or reputational harm or negative publicity directed at our brands that causes customers to avoid our restaurants, potentially materially adversely affecting our operations and sales.
In addition, the operations of our franchisees are subject to the same risks discussed above with respect to our business, and the COVID-19 pandemic has and may continue to cause financial distress to our franchisees. We have deferred or permanently waived certain of our franchisees’ payment obligations as a result, which deferments or waived payments may not be sufficient if financial distress continues. In some cases, we are contingently liable for franchisee lease obligations, and a failure by a franchisee to perform its obligations under such lease could result in direct payment obligations for us.
We have and could continue to experience other material impacts as a result of COVID-19, including, but not limited to, impairment charges. We cannot accurately predict the amount and timing of any further impairment of assets. A significant amount of judgment is involved in determining if an indication of impairment exists and the COVID-19 pandemic has made developing forecasts for, and the accounting of, valuation of goodwill and certain other assets slower and more difficult. Should the value of goodwill or other intangible or long-lived assets become
further impaired, there could be an adverse effect on our financial condition and consolidated results of operations. To the extent the COVID-19 pandemic adversely affects our business and financial results, it may also have the effect of heightening many of the other risks described in this Report.
We are subject to various federal and state employment and labor laws and regulations.
VariousWe and our vendors are subject to various employment and labor laws and regulations govern ourgoverning relationships with our employees throughout the world and changes to laws and regulations may affect operating costs. These laws and regulations relate to matters including employment discrimination, pay transparency, minimum wage requirements, scheduling, overtime, tip credits, unemployment tax rates, workers’ compensation rates, working conditions, immigration status, tax reporting and other wage and benefit requirements. Any significant additional government regulations and new laws governing our relationships with employees, including minimum wage increases, regulations relating to union organizing rights and activities, the employment status of third-party delivery drivers, mandated benefits or other requirements that impose additional obligations on us, including any temporary or permanent measures implemented in response to COVID-19, could increase our costs and adversely affect our business and results of operations.
As a significant number of our food service and preparation personnel are paid at rates related to the applicable minimum wage, federal, state and local proposals related to minimum wage requirements or similar matters could, to the extent implemented, materially increase our labor and other costs. As minimum wage increases continue to be implemented in states in which we operate, we expect our labor costs will continue to increase. In addition, President Biden has called for anthere have been in the past, and may be in the future, legislative efforts to significantly increase in the federal minimum wage, from $7.25 per hour to $15.00 per hour, which, if implemented, would materially increase our labor and other costs. Our distributors and suppliers could also be affected by higher minimum wage, benefit standards and compliance costs, which could result in higher costs for goods and services supplied to us. In addition, weseveral U.S. jurisdictions have implemented fair workweek or “secure scheduling” legislation, which impose complex requirements related to scheduling for certain restaurant and retail employees, and additional jurisdictions are considering similar legislation. Several jurisdictions also have implemented sick pay/paid time off legislation, which requires employers to provide paid time off to employees, and “just cause” termination legislation, which restricts companies’ abilities to terminate employees unless they can prove “just cause” or a “bona fide economic reason” for the termination. We also rely on our employees to accurately disclose the full amount of their tip income, and we base our FICA tax reporting on the disclosures provided to us by such tipped employees. Inaccurate employee FICA tax reporting could subject us to monetary liabilities, which could harm our business, results of operations and financial condition.
Increased commodity, energy and other costs could decrease our profit margins or cause us to limit or otherwise modify our menus or increase prices, which could adversely affect our business. Further, if our suppliers or custom distributors are unable to fulfill their obligations under their contracts or we are unable to develop or maintain relationships with these or new suppliers or distributors, if needed, we could encounter supply shortages and incur higher costs.
The performance of our restaurants depends on our ability to anticipate and react to changes in the price and availability of food commodities. Our business also incurs significant costs for energy, insurance, labor, marketing and real estate. Prices may be affected by supply, market changes, increased competition, the general risk of inflation, changes in laws, shortages or interruptions in supply due to weather, disease or other conditions beyond our control, labor shortages or other reasons. We are anticipating commodity inflation of approximately 11.0% to 13.0% and mid-single digit labor cost inflation during 2022, but there can be no assurance it will not be greater than that or that we will be able to pass through increased costs in our prices. Increased prices or shortages could affect the cost and quality of the items we buy or require us to raise prices, limit our menu options or implement alternative processes or products. As a result, these events, combined with other more general economic and demographic conditions, could impact our pricing and negatively affect our sales and profit margins.
We depend on frequent deliveries of fresh food products that meet our specifications, and we have a limited number of suppliers and distributors for our major products, such as beef. These factors subject us to the risk that shortages or interruptions in products could adversely affect the availability, quality or cost of products or require us to incur more costs to obtain adequate products if we are unable to manage supply chain risk. During 2021, we purchased: (i) more than 90% of our U.S. beef raw materials from four beef suppliers that represent more than 80% of the total beef marketplace in the U.S. and (ii) more than 95% of our Brazil beef raw materials from three beef suppliers that represent approximately 50% of the total beef marketplace in Brazil. Due to the nature of our industry, we expect to continue to purchase a substantial amount of our beef from a small number of suppliers. Global economic factors continue to place significant pressure on suppliers, making the supply environment more expensive and causing
supply chain issues. Supply shortages or disruptions caused by inclement weather, climate change, natural disasters, pandemics (including COVID-19),Failure to recruit, train and retain high-quality leadership, restaurant-level management and hourly team members may inhibit our ability to operate and grow successfully.
Our success will continue to depend, to a significant extent, on our leadership team and other key management personnel. The tight labor market in the United States has further strained and could continue to strain our ability to keep our restaurants fully staffed. If we are unable to attract and retain sufficiently experienced and capable management personnel, our business and financial or solvency issuesresults may suffer.
Our restaurant-level management and team members are largely responsible for the quality of our suppliersservice. Our guests may be dissatisfied and our sales may decline if we fail to recruit, train and retain managers and team members that effectively implement our business strategy and provide high-quality guest service. There is active competition for quality management personnel and hourly team members, and such competition could require us to pay higher wages or distributors, fuel increases or other conditions beyondincur higher costs for retaining and incentivizing our controlmanagement personnel and hourly team members. If we experience high turnover, we may experience higher labor costs and have a shortage of adequate management personnel required for future growth. A shortage of team members also could cause our restaurants to operate with reduced staff, which could adversely affect our operationsability to provide high-quality guest service.
Challenging economic, political and operatingsocial conditions may have a negative effect on our business and financial results.
Challenging economic, political and social conditions may negatively impact consumer spending and thus cause a challenging sales environment in the casual dining sector and a decline in our financial results. For example, international, domestic and regional economic conditions, continued economic downturn or recession, or slowing or stalled recovery therefrom, unemployment levels, consumer income levels, financial market volatility, credit conditions and availability, consumer debt levels, inflation, increased energy prices, weakness in the housing market, stock market performance, rising interests rates, tariffs and trade barriers, pandemics or public health concerns, population growth, changes in government and central bank monetary policies, social unrest and governmental, political and budget matters may have a negative effect on consumer confidence and discretionary spending, which the restaurant industry depends upon. Further, it is difficult to predict what impact, if any, the U.S. presidential and congressional elections and their outcomes could have on consumer confidence and discretionary spending. In addition, the effects on the global economy from the ongoing conflicts in Israel and Ukraine, particularly if they escalate or broaden, are uncertain. Terrorist attacks, heightened security requirements, attacks of critical infrastructure, protests, demonstrations, riots, civil disturbance, disobedience, insurrection, customer intimidation, mass shootings or social and other political unrest, such as those seen in recent years, have and may continue to result in restrictions, curfews or other actions and give rise to significant changes in regional and global economic conditions. If such events or disruptions persist for a prolonged period of time, our overall business and results of operations may be adversely affected.
In addition, it is difficult to predict what impact, if any, changes in federal policy, including tax, economic and monetary policies, will have on our industry, the economy as a whole, consumer confidence and discretionary spending. As a result, the nature, timing and impact on our business of potential changes to the current legal and regulatory frameworks are uncertain.
A decline in economic, political or social conditions or negative developments with respect to any of the other factors mentioned above, or a perception that such decline or negative developments are imminent, generally or in particular markets in which we operate, and our consumers’ reactions to these trends could result in increased pressure with respect to our pricing, traffic levels, commodity and other costs and the continuation of our suppliers or distributors were unableinnovation and productivity initiatives, which could negatively impact our business and results of operations. Further, poor economic conditions may force nearby businesses to fulfill their responsibilities or we were unable to maintain current purchasing terms or ensure service availability and we were unable to locate substitutes in a timely manner, especially given the prolonged effects of COVID-19, we may encounter supply shortages, lose consumers and experience an increase in costs in seeking alternative supplier or distribution services. The failure to develop and maintain supplier and distributor relationships and any resulting disruptions to the provision of food and other supplies toshut down, which could cause our restaurant locations could adversely affect our operating results.to be less attractive.
The restaurant industry is highly competitive and consumer options for other prepared food offerings continue to expand. Our inability to compete effectively could adversely affect our business, financial condition and results of operations.
A substantial number of restaurant operators compete directly and indirectly with us with respect to price, service, location and food quality, some of which are well-established with significant resources. There is also active competition for management, team members and other personnel, and attractive suitable real estate sites. Consumer tastes, nutritional and dietary trends, traffic patterns and the type, number and location of competing restaurants often affect the restaurant business, and our competitors may react more efficiently, creatively and effectively to those conditions. In addition, our competitors may generate or better implement business strategies that improve the value and relevance of their brands and reputation, relative to ours. For example, our competitors may more successfully implement menu or technology initiatives, such as remote ordering, social media or mobile technology platforms that expedite or enhance the customer experience. In addition, our competitors may more successfully implement delivery and off-site initiativesexperience, or implement other measuresartificial intelligence to better address COVID-related business risks.develop new customer insights. Further, we face growing competition from quick service and fast-casual restaurants, the supermarket industry and meal kit and food delivery providers, with the improvement of prepared food offerings, “ghost” or “dark” kitchens where meals are prepared at a separate takeaway premises rather than a restaurant, and the trend towards convergence in grocery, deli, delivery, retail and restaurant services. Further, if this competitive environment and the breadth of alternatives results in a decline in casual dining customer traffic, it could make our financial operations dependent on our ability to increase our market share within the hyper-competitive casual dining segment. We believe all of the above factors have increased competitive pressures in the casual dining sector in recent periods and we believe they will continue to present a challenging competitive environment in future periods. If we are unable to continue to compete effectively, our traffic, sales and margins could decline and our business, financial condition and results of operations would be adversely affected.
Failure to recruit, train and retain high-quality leadership, restaurant-level management and team members may inhibit our ability to operate and grow successfully.
Our success will continue to depend, to a significant extent, on our leadership team and other key management personnel. If we are unable to attract and retain sufficiently experienced and capable management personnel, our business and financial results may suffer.
Our restaurant-level management and team members are largely responsible for the quality of our service. Our guests may be dissatisfied and our sales may decline if we fail to recruit, train and retain managers and team members that effectively implement our business strategy and provide high quality guest service. There is active competition for quality management personnel and hourly team members, and such competition could require us to pay higher wages or incur higher costs for retaining and incentivizing our management personnel and hourly team members. If we experience high turnover, we may experience higher labor costs and have a shortage of adequate management personnel required for future growth. A shortage of team members also could cause our restaurants to operate with reduced staff, which could adversely affect our ability to provide high quality guest service.
Challenging economic, political and social conditions may have a negative effect on our business and financial results.
Challenging economic, political and social conditions may negatively impact consumer spending and thus cause a challenging sales environment in the casual dining sector and a decline in our financial results. For example,
international, domestic and regional economic conditions, consumer income levels, financial market volatility, inflation, social unrest and governmental, political and budget matters may have a negative effect on consumer confidence and discretionary spending, which the restaurant industry depends upon. Protests, demonstrations, riots, civil disturbance, disobedience, insurrection, or social and other political unrest, such as those seen in recent years, have and may continue to result in restrictions, curfews, or other actions and give rise to significant changes in regional and global economic conditions. If such events or disruptions persist for a prolonged period of time, our overall business and results of operations may be adversely affected.
In addition, it is difficult to predict what impact, if any, changes in federal policy, including tax policies, will have on our industry, the economy as a whole, consumer confidence and discretionary spending. As a result, the nature, timing and impact on our business of potential changes to the current legal and regulatory frameworks are uncertain. It is also difficult to predict what the long-term economic impacts of the ongoing COVID-19 pandemic may be.
A decline in economic, political or social conditions or negative developments with respect to any of the other factors mentioned above, or a perception that such decline or negative developments are imminent, generally or in particular markets in which we operate, and our consumers’ reactions to these trends could result in increased pressure with respect to our pricing, traffic levels, commodity and other costs and the continuation of our innovation and productivity initiatives, which could negatively impact our business and results of operations. Further, poor economic conditions may force nearby businesses to shut down, which could cause our restaurant locations to be less attractive.
Cyber securityCybersecurity breaches of confidential consumer, personal employee and other material information and other threats to our technological systems may adversely affect our business.
A cyber incident that compromises the information of our consumers or employees, whether affecting our technological systems or those of third-party service providers that we rely on, could result in widespread negative publicity, damage to the reputation of our brands, a loss of consumers, an interruption of our business and legal liabilities.
The majority of our restaurant sales are by credit or debit cards, and we maintain certain personal information regarding our employees and confidential information about our customers, franchisees and suppliers. Although we segment our card data environment and employ a cyber securitycybersecurity protection program based upon industry frameworks, as well as scan and improve our environment for any vulnerabilities, perform penetration testing and engage third parties to assess effectiveness of our security measures with oversight by our Audit Committee, there are no assurances that such programs will prevent or detect all potential cyber securitycybersecurity breaches or technological failures.
Our operations and corporate functions rely heavily on information systems, including point-of-sale processing in our restaurants, management of our supply chain, payment of obligations, collection of cash, data warehousing to support analytics, finance and accounting systems, payroll and human resource systems, mobile technologies to enhance the customer experience and other various processes and procedures, some of which are handled by third parties. Our ability to efficiently and effectively manage our business depends significantly on the reliability and capacity of these systems. The failure of these systems to operate effectively, system maintenance problems, upgrading or transitioning to new platforms, or any cyber incident relating to these systems could expose our systems or information to cyber threats, result in delays in consumer service, reduced efficiency in our operations or result in negative publicity. Despite our security measures, our technology systems may be vulnerable to damage, disability or failures due to physical theft, fire, power loss, telecommunications failure or other catastrophic events, as well as from internal and external security breaches, employee error or malfeasance, denial of service, andhacking, “phishing” attacks, social engineering, malware, ransomware, attacks, viruses, worms and other attacks or disruptive problems.problems, which have increased in sophistication, frequency and duration in recent years. In addition, the rapid
From timeBLOOMIN’ BRANDS, INC.
evolution and increased adoption of artificial intelligence technologies may increase our cybersecurity risks, including generative artificial intelligence augmenting threat actors’ technological sophistication to time weenhance existing or create new malware. We have been, and likely will continue to be, the target of attempted cyber and other security threats, including those common to most industries and those targeting us due to the confidential consumer information we obtain through our electronic processing of credit and debit card transactions. Like other restaurants and retailers, we are also susceptible to claims for purportedly fraudulent transactions arising out of actual or alleged theft of credit or debit card information. A security breach or
even a perceived security breach or failure to appropriately respond to a cyber incident could result in litigation or governmental investigation, as well as damage to our reputation and brands.
A claim or investigation resulting from a cyber or other security threat to our systems and data may have a material adverse effect on our business and distract management from running the business. Responses to cybersecurity also have the potential of incurring significant remediation costs, to the extent such costs are not covered by our applicable insurance policies. As cybersecurity risks and applicable laws and regulations evolve, we may incur significant additional costs in technology, third-party services and personnel to maintain systems designed to anticipate and prevent cyber-attacks.
We are subject to a variety of continuously evolving laws and regulations regarding privacy, data protection and data security at federal, state and international levels. The California Consumer Privacy Act, for example, became effective January 1, 2020 and provides a new private right of action to California residents related to data breaches and imposes new disclosure and other requirements on companies with respect to their data collection, use and sharing practices as they relate to California residents. A claimOther states and countries in which we operate have enacted, or investigation resulting from a cyberare proposing to enact, similar laws or other security threatthe laws expanding existing privacy rights. New areas of litigation related to our systems and data may have a material adverse effect on our business and the potential of incurring significant remediation costs,privacy rights continue to the extent such costs are not covered by our applicable insurance policies. As cyber security risk and applicableemerge. Compliance with newly developed laws and regulations, evolve,which are subject to change and uncertain interpretations, may cause us to incur substantial costs.
Increased commodity, energy and other costs could decrease our profit margins or cause us to limit or otherwise modify our menus or increase prices, which could adversely affect our business. Further, if our suppliers or distributors are unable to fulfill their obligations under their contracts or we mayare unable to develop or maintain relationships with these or new suppliers or distributors, if needed, we could encounter supply shortages and incur significant additional costs in technology, third-party services and personnel to maintain systems designedhigher costs.
The performance of our restaurants depends on our ability to anticipate and prevent cyber-attacks.react to changes in the price and availability of food commodities. Our business also incurs significant costs for energy, utilities, insurance, health care, labor, marketing and real estate over which we have little control. We have experienced and continue to experience the impact of inflation and fluctuations in costs on our operating expenses and anticipate the inflationary conditions will continue in the near future. We are anticipating 3% to 4% commodity inflation for 2024, but there can be no assurance that our expectations will be accurate or that we will be able to efficiently pass through any increased costs in our prices. Increased prices or shortages could affect the cost and quality of the items we buy or require us to raise prices, limit our menu options or implement alternative processes or products. In response, customers may be less willing to patronize our restaurants in favor of our competitors or lower-priced alternatives. Prices may also be affected by supply, market changes, increased competition, changes in laws, shortages or interruptions in supply due to weather, disease or other conditions beyond our control, labor shortages or other reasons. As a result, these events, combined with other more general economic and demographic conditions, could impact our pricing and negatively affect our sales and profit margins.
We depend on frequent deliveries of fresh food products that meet our specifications, and we have a limited number of suppliers and distributors for our major products, such as beef and pork. These factors subject us to the risk that shortages or interruptions in products could adversely affect the availability, quality or cost of products or require us to incur more costs to obtain adequate products if we are unable to manage supply chain risk. During 2023, we purchased: (i) more than 95% of our U.S. beef raw materials from four beef suppliers that represent a significant portion of the total beef marketplace in the U.S. and (ii) more than 80% of our Brazil pork raw materials from four pork suppliers that represent more than 45% of the total pork marketplace in Brazil. Our dependence on a small number of suppliers subjects us to the risks of ingredient shortage, supply interruption, animal disease outbreak, and price volatility. An external disruption or an internal dispute could force us to sever ties with our suppliers, and we
may not be able to find a suitable replacement in a timely or cost-efficient manner. Beef and pork are a significant cost to us, and we may also incur higher costs to secure adequate suppliers or make substantial changes to our menu offerings, at the risk of material adverse harm to our business. Due to the nature of our industry, we expect to continue to purchase a substantial amount of our beef and pork from a small number of suppliers. Global economic factors continue to place significant pressure on suppliers, making the supply environment more expensive and causing supply chain issues. Supply shortages or disruptions caused by inclement weather, climate change, natural disasters, pandemics, armed conflict, sanctions, financial or solvency issues of our suppliers or distributors, fuel increases or other conditions beyond our control could adversely affect our operations and operating results. In recent years, climate-related issues, including drought and flooding in our key supplier region, have led to volatility in the prices of our ingredients, such as produce and meats. In addition, if any of our suppliers or distributors were unable to fulfill their responsibilities or we were unable to maintain current purchasing terms or ensure service availability and we were unable to locate substitutes in a timely manner, we may encounter supply shortages, lose consumers and experience an increase in costs in seeking alternative supplier or distribution services. The failure to develop and maintain supplier and distributor relationships and any resulting disruptions to the provision of food and other supplies to our restaurant locations could adversely affect our operating results.
Our inability or failure to recognize, respond to and effectively manage the accelerated impact of social media could have a material adverse impact on our business.
Social media allows individuals to access a broad audience of consumers and other interested persons. The availability of information on social media platforms is virtually immediate as is its impact, and users can post information often without filters or checks on the accuracy of the content posted. Adverse or inaccurate information concerning our Company or concepts may be posted at any time, and such information can quickly reach a wide audience. Social media has also been utilized to target specific companies or brands as a result of a variety of actions or inactions, or perceived actions or inactions, and such campaigns can rapidly accelerate and impact consumer behavior. The harm may be immediate without affording us an opportunity for redress or correction, and it is challenging to monitor, anticipate and promptly respond to such developments. These factors could have a material adverse effect on our business. Regardless of its basis or validity, any unfavorable publicity could adversely affect public perception of our brands.
Our failure to use social media responsibly in our marketing efforts may further expose us to these risks. As part of our marketing efforts, we rely on search engine marketing and social media platforms to attract and retain guests. We need to continuously innovate and develop our social media strategies in order to maintain broad appeal with guests and brand relevance. We also continue to invest in other digital marketing initiatives that allow us to reach our guests across multiple digital channels and build their awareness of, engagement with, and loyalty to our brands. These initiatives may not be successful, resulting in expenses incurred without the benefit of higher revenues, increased employee engagement or brand recognition. In addition, a variety of risks are associated with the use of social media, including the improper disclosure of proprietary or personal information and negative publicity. The inappropriate use of social media vehicles by our guests or employees could increase our costs, lead to litigation or result in negative publicity that could damage our reputation.
We face a variety of risks associated with doing business in foreign markets that could have a negative impact on our financial performance.
We have a significant number of restaurants outside of the United States, and we intend to continue our efforts to grow internationally. There is no assurance that international operations will be profitable or international growth will continue. In addition, if we have a significant concentration of restaurants in a foreign market, the impact of any negative local conditions can have a sizable impact on our results.
Our foreign operations are subject to all of the same risks as our U.S. restaurants, as well as additional risks including, among others, international economic, political, social and legal conditions and the possibility of instability and unrest, differing cultures and consumer preferences, diverse government regulations and tax systems, cybersecurity threats, corruption, anti-American sentiment, the ability to source high qualityhigh-quality ingredients and other commodities in a cost-effective manner, uncertain or differing interpretations of rights and obligations in connection
with international franchise agreements and the collection of ongoing royalties from international franchisees, the availability and costs of land, construction and financing, and the availability of experienced management, appropriate franchisees and area operating partners.
Local or regional events or conditions in our international markets could disrupt our business operations and affect our results. For example, during 2019, Hong Kong political protests led to violence and disrupted business operations. In recent years, there were protests in cities throughout the U.S.United States as well as globally, including in Hong Kong and Brazil, in connection with civil rights, liberties, and social and governmental reform.
Currency regulations and fluctuations in exchange rates could also affect our performance. We have operations in many foreign countries, including direct investments in restaurants in Brazil, Hong Kong and Hong Kong/China, as well as international franchises. As a result, we may experience losses from fluctuations in foreign currency exchange rates or any hedging arrangements that we enter into to offset such fluctuations, and such losses could adversely affect our overall sales and earnings.
We are subject to governmental regulation of our foreign operations, including antitrust and tax requirements, anti-boycott regulations, import/export/customs regulations and other international trade regulations, the USA Patriot Act and the Foreign Corrupt Practices Act. Any new regulatory or trade initiatives could impact our operations in certain countries. Failure to comply with any such legal requirements could subject us to monetary liabilities and other sanctions, which could harm our business, results of operations and financial condition.
If we fail to adequately address corporate citizenship and sustainability matters, it could have an adverse effect on our business, financial condition, and operating results and may damage our reputation.
In recent years, there has been an increasing focus from certain investors, customers, consumers, employees, state, federal and international governments and agencies, and other stakeholders concerning corporate citizenship and sustainability matters, including practices and disclosures related to environmental stewardship; social responsibility; diversity, equity and inclusion; and workplace rights. Companies across all industries are facing increasing scrutiny relating to their corporate citizenship and sustainability practices. We are also subject to corporate citizenship and sustainability disclosure rules and regulations and institutional investor voting policies that seek this information, making it more accessible for scrutiny. Changing consumer preferences may result in increased demands regarding our products and supply chain and their respective environmental and social impact, including on sustainability. These demands could require additional transparency, due diligence, and reporting and could cause us to incur additional costs or to make changes to our operations to comply with such demands. We may also determine that certain changes are required in anticipation of further evolution of consumer preferences and demands. Increased focus and activism related to corporate citizenship and sustainability may also result in investors reconsidering their investment decisions as a result of their assessment of a company’s corporate citizenship and sustainability practices. Any failure or perceived failure by us to adequately address stakeholder expectations regarding corporate citizenship, including diversity, equity and inclusion, employee health, safety and welfare, and workplace rights, among others, may damage our reputation and adversely affect our business and results of operations. Further, concern over climate change and other environmental sustainability matters, has and may in the future result in new or increased legal and federal and state regulatory requirements to provide extensive disclosure regarding and to reduce or mitigate impacts to the environment, including greenhouse gas emissions, alternative energy policies, water consumption, packaging and waste management, responsible sourcing and other sustainability initiatives. For example, state, federal and international regulations on sustainability matters, including the recently enacted Climate Corporate Data Accountability Act and the Climate-Related Financial Risk Act in California and the SEC’s climate change rule proposals, have been or are expected to be implemented that will require reporting and third-party assurance on greenhouse gas emissions and other environmental matters.
If we fail to achieve goals, targets, or objectives we may set with respect to corporate citizenship and sustainability matters, if we do not meet or comply with new regulations or evolving consumer, investor, industry, or stakeholder expectations and standards, including those related to reporting, or if we are perceived to have not responded appropriately to the growing concern for corporate citizenship and sustainability matters, we may face legal or regulatory actions, the imposition of fines, penalties, or other sanctions, adverse publicity, and decreased demand
from consumers, or the price of our common stock could decline, any of which could materially harm our reputation or have a material adverse effect on our business, financial condition, or operating results.
The food service industry is affected by consumer preferences and perceptions. Changes in these preferences and perceptions may lessen the demand for our products, which would reduce sales and harm our business.
Food service businesses are affected by changes in consumer tastes and demographic trends. For instance, if prevailing health or dietary preferences cause consumers to avoid steak and other products we offer in any of our concepts in favor of foods or ingredients that are perceived as healthier or otherwise reflect popular demand, our business and operating results would be harmed. Various factors such as menu labeling rules, nutritional guidelines and academic studies, whether issued by government agencies, research institutions, or advocacy organizations, may impact consumer choice and cause consumers to select foods other than those that are offered by our restaurants. Consumer preference on sourcing, or in response to environmental and animal welfare concerns may also cause some groups of consumers to select foods other than those that are offered by our restaurants. Our business may be negatively impacted by customer preferences regarding third-party delivery apps and services with which we engage, particularly if the availability, performance and reliability of the apps or services adversely impact customer satisfaction. If we are unable to anticipate or successfully respond to changes in consumer preferences, our results of operations could be adversely affected, generally or in particular concepts or markets.
Our relationships with third party delivery services and ability to grow sales through delivery orders are subject to risks.
We maintain relationships with various third-party delivery apps and services. Our sales may be negatively affected if these platforms are damaged or interrupted through technological failures or otherwise. This could cause reputational harm or adversely impact sales and customer satisfaction. Our sales through these services may also depend on the availability of delivery drivers, who are generally independent contractors.
Changes in tax laws, uncertainty in the judicial interpretation of those laws and unanticipated tax liabilities could adversely affect the taxes we pay and our profitability.
We are subject to income and other taxes in the United States and numerous foreign jurisdictions. Our effective income tax rate and other taxes in the future could be adversely affected by a number of factors, including changes in the mix of earnings in countries with different statutory tax rates, changes in the valuation of deferred tax assets and liabilities, an “ownership change” as defined under Section 382 of the Internal Revenue Code, changes in U.S. or foreign tax laws, including the proposed 15% global minimum tax under the Organization for Economic Co-operation and Development (“OECD”) Pillar Two (“Pillar Two”), Global Anti-Base Erosion rules, uncertainty in the interpretation of tax laws, comprehensive tax reform measures or other legislative changes, and the outcome of income tax audits. For example, the U.S.audits and Brazil have recently proposed significant changestax litigation, such as in Brazil. Further, differences in interpretations of Pillar Two and other rules by multiple jurisdictions may cause increased complexities as to their respectivecompliance and increased audit controversy with tax laws. Althoughauthorities in jurisdictions where we cannot predict whether or in what form these proposals may pass, several of the proposals considered, if enacted into law, could have a material impact on our effective income tax rate, income tax expense and cash flows.operate. Although we believe our tax estimates are reasonable, the final determination of tax audits and tax litigation could be materially different from our historical income tax provisions and accruals. TheThese results of a tax audit could have a material effect on our results of operations or cash flows in the period or periods for which that determination isthese determinations are made. In addition, our effective income tax rate and our results may be impacted by our ability to realize deferred tax benefits, including our FICA tip credit carryforwards, and by any increases or decreases of our valuation allowances applied to our existing deferred tax assets.
Our failure to comply with government regulation related to our restaurant operations, and the costs of compliance or non-compliance, could adversely affect our business.
We are subject to various federal, state, local and foreign laws affecting our business. Each of our restaurants is subject to licensing and regulation by a number of governmental authorities, which may include, among others, alcoholic beverage control, food safety, nutritional menu labeling, health care, sanitation, hazardous material, building, zoning, land use, traffic, environmental and fire agencies in the state, municipality or country in which the restaurant is located. Our suppliers are also subject to regulation in some of these areas. Any difficulties or inabilities to retain or renew licenses, or increased compliance costs due to changed regulations, could adversely affect operations at existing restaurants. Additionally, difficulties in obtaining or failing to obtain the required licenses or approvals could delay or prevent the development of new restaurants. We are subject to various U.S. federal, state and international laws and regulations related to the offer and sale of franchises. Failure to comply with these laws could adversely affect the results we generate from franchises or otherwise impose costs on us. Alcoholic beverage sales represent ten percent11% of our consolidated restaurant sales and are subject to extensive state and local licensing and other regulations. The failure of a restaurant to obtain or retain a liquor license would adversely affect that restaurant’s operations. In addition, we are subject to “dram shop” statutes in certain states. These statutes generally provide a person injured by an intoxicated person the right to recover damages from an establishment that wrongfully served alcoholic beverages to the intoxicated person. We may also incur costs of and challenges in
ensuring compliance with measures implemented in response to COVID-19,a widespread illness or a pandemic, such as requirements for physical barriers or other preventative measures in restaurants or vaccination or testing requirements for our employees, which can vary by the location of the restaurant and may continue to change.
Failure We are subject to achieve projected cost savings fromlaws relating to information security, cashless payments and consumer credit, protection and fraud. Compliance with these laws and regulations can be costly, and any failure or perceived failure to comply with these laws or any breach of our efficiency initiativessystems could harm our reputation or lead to litigation, which could adversely affect our results of operations and eliminate potential funding for growth opportunities.financial condition.
In recent years, we have identified strategies and taken steps to reduce operating costs and free up resources to reinvest in our business. These strategies include improved supply chain management, implementing labor scheduling tools and integrating restaurant information systems across our brands. In addition, during 2020, we implemented certain measures to reduce costs and preserve liquidity in response to the impacts of COVID-19. If we were required to implement similar measures in the future, they may not be sustainable or may be detrimental to continued operations. We continue to evaluate and implement further cost-saving initiatives. However, the ability to reduce our operating costs through these initiatives is subject to risks and uncertainties, such as our ability to obtain improved supply pricing and the reliability of any new suppliers or technology, and we cannot assure that these activities, or any other activities that we may undertake in the future, will achieve the desired cost savings and efficiencies. Failure to achieve such desired savings could adversely affect our results of operations and financial condition and curtail investment in growth opportunities.
There are risks and uncertainties associated with initiatives that we may implement.
From time to time, we consider various initiatives in order to grow and evolve our business and brands and improve our operating results. These initiatives could include, among other things, acquisitions, development or dispositions of restaurants or brands, new joint ventures, new franchise arrangements, restaurant closures and changes to our operating model. There can be no assurance that any such actions or initiatives will be successful or deliver their anticipated benefits. We may be exposed to new and unforeseen risks and challenges, particularly if we enter into markets or engage in activities with which we have no or limited prior experience, and it may be difficult to predict the success of such endeavors. If we incur significant expenses or divert management, financial and other resources to any initiative that is unsuccessful or does not meet our expectations, our results of operations and financial condition would be adversely affected. We may also incur significant asset impairment and other charges in connection with any such initiative. Regardless of the ultimate success of any initiative, the implementation and integration of new business or operational processes could be disruptive to our current operations. Even if we test and evaluate an initiative on a limited basis, the diversion of management time and resources could have an adverse effect on our business.
Our success depends substantially on the value of our brands and our ability to execute innovative marketing and consumer relationship initiatives to maintain brand relevance and drive profitable sales growth.
Our success depends on our ability to preserve and grow our brands. Our brand value and reputation are especially important to differentiate our concepts in the highly competitive casual dining sector to achieve sustainable same-restaurant sales growth and warrant new unit growth. Brand value and reputation is based in large part on consumer perceptions, which are driven by both our actions and by actions beyond our control, such as new brand strategies or their implementation, business incidents, ineffective advertising or marketing efforts, or unfavorable mainstream or social media publicity involving us, our industry, our franchisees, or our suppliers. A failure to innovate and extend our brands in ways that are relevant to consumers and occasions in order to generate sustainable same-restaurant traffic growth, and produce non-traditional sales and earnings growth opportunities, could have an adverse effect on our results of operations. Additionally, insufficient focus on our competition or failure to adequately address declines in the casual dining industry, could adversely impact results of operations.
If our competitors increase their spending on advertising, promotions and loyalty programs, if our advertising, media or marketing expenses increase, or if our advertising, promotions and loyalty programs become less effective than those of our competitors, or if we do not adequately leverage technology and data analytic capabilities needed to generate concise competitive insight, our results of operations could be materially and adversely affected.
Risks associated with our remodeling, relocation and expansion plans may have adverse effects on our operating results.
As part of our business strategy, we intend to continue to remodel, relocate and expand our current portfolio of restaurants. Our 20222024 development schedule calls for the construction of approximately 3040 to 45 new system-wide locations, with approximately half in Brazil. A variety of factors could cause the actual results and outcome of those plans to differ from the anticipated results, including among other things, the selection of suitable locations for new or relocated restaurants, the availability and terms on which we can lease attractive sites for new or relocated restaurants, availability and terms of funding, recruiting, training and retaining skilled management and restaurant employees, construction or other delays, the availability of construction materials or restaurant equipment, construction and renovation costs and consumer tastes and acceptance of our restaurant concepts and awareness of our brands in new regions. Governmental regulations or other health guidelines concerning the operations of restaurants, including due to public health emergencies, may also cause disruptions in our plans.
It is difficult to estimate the performance of newly opened restaurants and whether they may attract customers away from other restaurants we own. If new or existing restaurants do not meet targeted performance, it could have a material adverse effect on our operating results, including any impairment losses that we may be required to recognize.
Some of the challenges described above could be more significant in international markets in which we have more limited experience, either generally or with a particular brand. Those markets are likely to have different competitive conditions, consumer tastes, discretionary spending patterns and brand awareness, which may cause our new restaurants to be less successful than restaurants in our existing markets or make it more difficult to estimate the performance of new restaurants.
In addition, in an effort to increase same-restaurant sales and improve our operating performance, we continue to make improvements to our facilities through remodels and relocations and close underperforming restaurants. We incur significant lease termination or continuation expenses and asset impairment and other charges when we close or relocate a restaurant. If the expenses associated with remodels, relocations or closures are higher than anticipated, we cannot find suitable locations or remodeled or relocated restaurants do not perform as expected, these initiatives may not yield the desired return on investment, which could have a negative effect on our operating results.
Failure to achieve projected cost savings from our efficiency initiatives could adversely affect our results of operations and eliminate potential funding for growth opportunities.
In recent years, we have identified strategies and taken steps to reduce operating costs and free up resources to reinvest in our business. These strategies include improved supply chain management, implementing labor scheduling tools, improvements in kitchen equipment and integrating restaurant information systems across our brands. We continue to evaluate and implement further cost-saving initiatives. However, the ability to reduce our operating costs through these initiatives is subject to risks and uncertainties, such as our ability to obtain improved supply pricing and the reliability of any new suppliers or technology, and we cannot assure that these activities, or any other activities that we may undertake in the future, will achieve the desired cost savings and efficiencies. In addition, these measures may not be sustainable or may be detrimental to continued operations. Failure to achieve such desired savings or other negative effects from cost-saving measures could adversely affect our results of operations and financial condition and curtail investment in growth opportunities.
Our success depends substantially on the value of our brands and our ability to execute innovative marketing and consumer relationship initiatives to maintain brand relevance and drive profitable sales growth.
Our success depends on our ability to preserve and grow our brands. Our brand value and reputation are especially important to differentiate our concepts in the highly competitive casual dining sector to achieve sustainable same-restaurant sales growth and warrant new unit growth. Brand value and reputation are based in large part on consumer perceptions, which are driven by both our actions and by actions beyond our control, such as new brand strategies or their implementation, business incidents, ineffective advertising or marketing efforts, or unfavorable mainstream or social media publicity involving us, our industry, our franchisees, or our suppliers. A failure to innovate and extend our brands in ways that are relevant to consumers and occasions in order to generate sustainable same-restaurant traffic growth, and produce non-traditional sales and earnings growth opportunities, could have an adverse effect on our results of operations. Additionally, insufficient focus on our competition or failure to adequately address declines in the casual dining industry, could adversely impact results of operations.
If our competitors increase their spending on advertising, promotions and loyalty programs, if our advertising, media or marketing expenses increase, or if our advertising, promotions and loyalty programs become less effective than those of our competitors, or if we do not adequately leverage technology and data analytic capabilities needed to generate concise competitive insight, our results of operations could be materially and adversely affected.
We have limited control with respect to the operations of our franchisees, which could have a negative impact on our business.
Our franchisees are contractually obligated to operate their restaurants in accordance with our standards and we provide training and support to franchisees. However, franchisees are independent third parties that we do not control, and these franchisees own, operate and oversee the daily operations of their restaurants. As a result, the ultimate success and quality of any franchise restaurant rests with the franchisee. If franchisees do not successfully operate restaurants in a manner consistent with our product and service quality standards and contractual requirements, our image and reputation could be harmed, which in turn could adversely affect our business and operating results.
A significant portion of our financial results are dependent upon the operational and financial success of our franchisees. If sales trends or economic conditions worsen for franchisees, their financial results may worsen and our royalty, rent and other fee revenues may decline. In addition, we may also incur expenses in connection with supporting franchise restaurants that are underperforming. As small businesses, some of our franchise operators may be negatively and disproportionately impacted by strategic initiatives, capital requirements, inflation, increased interest rates, labor costs, employee relations issues, or other causes. When Company-owned restaurants are sold to a franchisee, one of our subsidiaries is often required to remain responsible for lease payments for the sold restaurants to the extent the purchasing franchisees default on their leases. During periods of declining sales and profitability of franchisees, the incidence of franchisee defaults for these lease payments may increase and we may be required to make lease payments and seek recourse against the franchisee or agree to repayment terms.
Our business is subject to seasonal and periodic fluctuations, and past results are not indicative of future results.
Historically, consumer traffic patterns for our established restaurants are generally highest in the first quarter of the year and lowest in the third quarter of the year. Holidays may also affect sales volumes seasonally in some of the markets in which we operate. The COVID-19 pandemic may also have an impact on consumer behaviors and customer traffic that may result in temporary changes in the seasonal fluctuations of our business. In addition, our quarterly results have been and will continue to be affected by the timing of new restaurant openings and their associated pre-opening costs, as well as restaurant closures and exit-related costs, debt extinguishment and modification costs and impairments of goodwill, intangible assets and property, fixtures and equipment. As a result of these and other factors, our financial results for any quarter may not be indicative of the results that may be achieved for a full year.
Significant adverse weather conditions and other disasters or unforeseen events and our ability to execute, or success in executing, a comprehensive business recovery plan at our restaurant support center for these events could negatively impact our results of operations.operations and have a material adverse impact on our business.
Adverse weather conditions and natural disasters and other unforeseen events, such as winter storms, severe temperatures, thunderstorms, floods, drought, fires, hurricanes and earthquakes, terrorist attacks, war and widespread/pandemic illness, and the effects of such events on economic conditions and consumer spending patterns, could disrupt our operations or supply chain and negatively impact our results of operations. TemporaryThese events may result in lost restaurant sales, as well as property damage, lost products, interruptions in supply, and increased costs, temporary and prolonged restaurant closures may occur and consumer traffic may decline due to the actual or perceived effects from these events. For example, the COVID-19 pandemic, severe winter weather conditions and hurricanes have impacted our traffic, and that of our franchises, and results of operations in recent years. Although
we cannot predict when or where we will be negatively impacted by widespread illnesses or pandemics, adverse weather events, to the extent that climate change or other factors result in more frequent, widespread or severe events, it could adversely impact our results. U.S. and foreign governmental officials also have placed an increasing focus on environmental matters, including climate change, reduction of greenhouse gases and water consumption. This increased focus could lead to legislative, regulatory or other efforts to combat these environmental concerns. These efforts could result in further increases in taxes, cost of supplies, transportation and utilities, which could increase our operating costs and those of our franchisees and require future investments in facilities and equipment. There may also be increased pressure for us to make commitments, set targets or establish goals to take actions to meet them, which could expose us and our franchisees to market, operational, execution and reputational costs or risks.
Many of our corporate systems and processes and corporate support for our restaurant operations are centralized at one location in Tampa, Florida. We have disaster recovery procedures and business continuity plans in place to address crisis-level events, including hurricanes and other natural disasters, and back up and off-site locations for recovery of electronic and other forms of data and information, and the ability to manage our business remotely. However, if we are unable to fully implement our disaster recovery plans, we may experience delays in recovery of data, inability to perform vital corporate functions, tardiness in required reporting and compliance, failures to adequately support field operations and other breakdowns in normal communication and operating procedures that could have a material adverse effect on our financial condition, results of operations and exposure to administrative and other legal claims. In addition, these threats are constantly evolving, which increases the difficulty of accurately and timely predicting, planning for and protecting against the threat. As a result, our disaster recovery procedures and business continuity plans may not adequately address all threats we face or protect us from loss.
The United States and other countries have experienced, or may experience in the future, outbreaks of viruses or other diseases, including the COVID-19 pandemic. If a regional or global health pandemic occurs, depending upon its location, duration and severity, our business could be severely affected. In the event a health pandemic occurs, customers might avoid public places, and local, regional or national governments might limit or ban public gatherings to halt or delay the spread of disease. Jurisdictions in which we have restaurants may impose mandatory closures or impose restrictions on operations. If a virus is transmitted by human contact or respiratory transmission, our employees or guests could become infected, or could choose, or be advised, to avoid gathering in public places, any of which would adversely affect our restaurant guest traffic or our ability to perform functions at the corporate level. A regional or global health pandemic might also adversely affect our business by disrupting or delaying production and delivery of materials and products in our supply chain and by causing staffing shortages in our stores.
There are risks and uncertainties associated with initiatives that we may implement.
From time to time, we consider various initiatives in order to grow and evolve our business and brands and improve our operating results. These initiatives could include, among other things, acquisitions, development or dispositions of restaurants or brands, new joint ventures, new franchise arrangements, restaurant closures and changes to our operating model. There can be no assurance that any such actions or initiatives will be successful or deliver their anticipated benefits. We may be exposed to new and unforeseen risks and challenges, particularly if we enter into markets or engage in activities with which we have no or limited prior experience, and it may be difficult to predict the success of such endeavors. If we incur significant expenses or divert management, financial and other resources to any initiative that is unsuccessful or does not meet our expectations, our results of operations and financial condition would be adversely affected. We may also incur significant asset impairment and other charges in connection with any such initiative. Regardless of the ultimate success of any initiative, the implementation and integration of new business or operational processes could be disruptive to our current operations. Even if we test and evaluate an initiative on a limited basis, the diversion of management time and resources could have an adverse effect on our business.
Our failure or inability to enforce our trademarks or other proprietary rights could adversely affect our competitive position or the value of our brand.
Our trademarks, including Outback Steakhouse, Carrabba’s Italian Grill, Bonefish Grill, Fleming’s Prime Steakhouse & Wine Bar and Bloomin’ Onion, and other proprietary rights are important to our success and our competitive position. The protective actions that we take may not be sufficient to prevent unauthorized usage or imitation by others, which could harm our image, brand or competitive position. Furthermore, our ability to protect trademarks and other proprietary rights may be more limited in certain international markets where we operate.
Litigation could have a material adverse impact on our business and our financial performance.
We are subject to lawsuits, administrative proceedings and claims that arise in the regular course of business. These matters typically involve claims by consumers and others regarding issues such as food borne illness, food safety, premises liability, personal injury, discrimination, “dram shop” statute liability, promotional advertising and other operational issues common to the food service industry, as well as environmental, data privacy, contract disputes and intellectual property infringement matters. We are also subject to employee claims against us based on, among other things, discrimination, harassment, wrongful termination, disability, or violation of wage and labor laws. We are also subject to the risk of being named a joint employer of workers of our franchisees for alleged violations of labor and wage laws. These claims may divert our financial and management resources that would otherwise be used to benefit our operations. The ongoing expense of or diversion of management attention due to any resulting lawsuits, and any substantial settlement payment or damage award against us and any damage to our reputation could adversely affect our business and results of operations. Significant legal fees and costs in complex class action litigation or an adverse judgment or settlement that is not insured or is in excess of insurance coverage could have a material adverse effect on our financial position and results of operations.
Risks Related to Our Indebtedness
We may not be able to generate sufficient cash to service all of our indebtedness and operating lease obligations, and we may be forced to take other actions to satisfy our obligations under our indebtedness and operating lease obligations, which may not be successful. If we fail to meet these obligations, we would be in default under our debt agreements and the lenders could elect to declare all amounts outstanding under them to be immediately due and payable and terminate all commitments to extend further credit.
Our ability to make scheduled payments on our debt obligations and to satisfy our operating lease obligations depends upon our financial condition and operating performance, which is subject to prevailing economic and competitive conditions and to financial, business and other factors, many of which are beyond our control. We cannot be certain that we will maintain a level of cash flow from operating activities sufficient to permit us to pay the principal, premium, if any, and interest on our indebtedness, or to pay our operating lease obligations. For example, if COVID-19 conditions worsen, inflation persists, or our financial position deteriorates, our revenues and liquidity position may decline. If our cash flow and capital resources are insufficient to fund our debt service obligations and operating lease obligations, we may be forced to reduce or delay capital expenditures, sell assets, seek additional capital or restructure or refinance our indebtedness. These alternative measures may not be successful and may not permit us to meet our scheduled debt service obligations. In the absence of sufficient operating results and resources, we could face substantial liquidity problems and might be required to dispose of material assets or operations or take other actions to meet our debt service and other obligations. Our debt agreements restrict our ability to dispose of assets and how we may use the proceeds from the disposition. We may not be able to consummate those dispositions or to obtain the proceeds that we could otherwise realize from such dispositions and any such proceeds that are realized may not be adequate to meet any debt service obligations then due. The failure to meet our debt service obligations or the failure to remain in compliance with the financial covenants under our debt agreements would constitute an event of default under those agreements and the lenders could elect to declare all amounts outstanding under them to be immediately due and payable and terminate all commitments to extend further credit.
Our leverage could adversely affect our ability to raise additional capital to fund our operations or limit our ability to react to changes in the economy or our industry.
As of December 26, 2021,31, 2023, our total net indebtedness was $793.1$780.7 million and we had $699.3$599.2 million in available unused borrowing capacity under our revolving credit facility, net of undrawn letters of credit of $20.7$19.8 million. In May 2020, we issued $230.0 million of 5.00% convertible senior notes due in 2025 (the “2025 Notes”) and in April 2021 we issued $300.0 million of 5.125% senior notes due in 2029 (the “2029 Notes”).
Based on the daily closing prices of our stock during the quarter ended December 26, 2021, holders of the 2025 Notes are eligible to convert their 2025 Notes during the first quarter of 2022.
Our leverage could have important consequences, including:
•making it more difficult for us to make payments on indebtedness;
•increasing our vulnerability to general economic, industry and competitive conditions and the various risks we face in our business;
•increasing our cost of borrowing or limiting our ability to obtain additional financing if needed;
•reducing our ability to use our cash flow to fund our operations, capital expenditures, dividend payments, and future business and strategic opportunities; and
•limiting our ability to adjust to changing market conditions and placing us at a competitive disadvantage compared to our competitors who may not be as highly leveraged.
We may incur substantial additional indebtedness in the future, subject to the restrictions contained in our credit agreement. If new indebtedness is added to our current debt levels, the related risks that we now face could increase.
We cannot be certain that our financial condition or credit and other market conditions will be favorable when our credit agreement matures in 2026, or at any earlier time we may seek to refinance our debt. Further, turmoil in global credit markets could adversely impact the availability and cost of credit. If we are unable to refinance our indebtedness on favorable terms, our financial condition and results of operations would be adversely affected.
Our debt agreements contain restrictions that limit our flexibility in operating our business.
Certain of our debt agreements limit our and our subsidiaries’ abilities to, among other things, incur or guarantee additional indebtedness, pay dividends on,above certain thresholds, redeem or repurchase our capital stock, make certain acquisitions or investments, incur or permit to exist certain liens, enter into transactions with affiliates or sell our assets to, merge or consolidate with or into, another company. Our debt agreements require us to satisfy certain financial tests and ratios. Our ability to satisfy such tests and ratios may be affected by events outside of our control.
If we breach the covenants under our debt agreements, the lenders could elect to declare all amounts outstanding under the agreements to be immediately due and payable and terminate all commitments to extend further credit. If we are unable to repay those amounts, the lenders could proceed against the collateral granted to them to secure that indebtedness. We have pledged substantially all of our assets as collateral under our credit agreement. If our lenders accelerate the repayment of borrowings, we cannot be certain that we will have sufficient assets to repay them.
Risks Related to Our Common Stock
Our ability to raise capital in the future may be limited, which could make us unable to fund our capital requirements.
Our business and operations may consume resources faster than we anticipate. In the future, we may need to raise additional funds through the issuance of new equity securities, debt or a combination of both. Additional financing may not be available on favorable terms or at all. If adequate funds are not available on acceptable terms, we may be unable to fund our capital requirements. If we issue new debt securities, the debt holders would have rights
senior to common stockholders to make claims on our assets, and the terms of any debt could restrict our operations, including our ability to pay dividends above certain thresholds on our common stock. If we issue additional equity securities, existing stockholders may experience dilution, and the new equity securities could have rights senior to those of our common stock. Because our decision to issue securities in any future offering will depend on market
conditions and other factors beyond our control, we cannot predict or estimate the amount, timing or nature of our future offerings.
Thus, our stockholders bear the risk of our future securities offerings reducing the market price of our common stock and diluting their interest.
Our stock price is subject to volatility.
The stock market in general is highly volatile. As a result, the market price of our common stock is similarly volatile. The price of our common stock could be subject to wide fluctuations in response to a number of factors, some of which may be beyond our control. These factors include actual or anticipated fluctuations in our operating results, changes in or our ability to achieve estimates of our operating results by analysts, investors or management, analysts’ recommendations regarding our stock or our competitors’ stock, sales of substantial amounts of our common stock by our stockholders, actions or announcements by us or our competitors, the maintenance and growth of the value of our brands, litigation, legislation or other regulatory developments affecting us or our industry, widespread/pandemic illness, natural disasters, cyber-attacks, terrorist acts, war or other calamities and changes in general market and economic conditions.
Provisions in our certificate of incorporation and bylaws and Delaware law may discourage, delay or prevent a change of control of our companyCompany or changes in our management and, therefore, may depress the trading price of our stock.
Our certificate of incorporation and bylaws include certain provisions (including provisions related to our classified board structure through 2024 and supermajority voting requirements) that could have the effect of discouraging, delaying or preventing a change of control of our companyCompany or changes in our management. These provisions may discourage, delay or prevent a transaction involving a change in control of the Company that is in the best interests of our stockholders. Even in the absence of a takeover attempt, the existence of these provisions may adversely affect the prevailing market price of our common stock if they are viewed as discouraging future takeover attempts.
Section 203 of the Delaware General Corporation Law may affect the ability of an “interested stockholder” to engage in certain business combinations, including mergers, consolidations or acquisitions of additional shares, for a period of three years following the time that the stockholder becomes an “interested stockholder.” An “interested stockholder” is defined to include persons owning directly or indirectly 15% or more of the outstanding voting stock of a corporation. Although we have elected in our certificate of incorporation not to be subject to Section 203 of the Delaware General Corporation Law, our certificate of incorporation contains provisions that have the same effect as Section 203, except that they provide that our former private equity sponsors will not be deemed to be “interested stockholders,” regardless of the percentage of our voting stock owned by them, and accordingly will not be subject to such restrictions.203.
General Risk Factors
An impairment in the carrying value of our goodwill or other intangible or long-lived assets could adversely affect our financial condition and results of operations.
Along with other intangible assets, we test goodwill for impairment annually and whenever events or changes in circumstances indicate that its carrying value may not be recoverable. We also evaluate long-lived assets on a quarterly basis or whenever events or changes in circumstances indicate that the carrying value may not be recoverable. We cannot accurately predict the amount and timing of any impairment of assets. A significant amount of judgment is involved in determining if an indication of impairment exists. Unforeseen events could make developing forecasts for, and the accounting of, valuation of goodwill and certain other assets slower and more difficult. Should the value of goodwill or other
intangible or long-lived assets become impaired, there could be an adverse effect on our financial condition and consolidated results of operations.
Failure to maintain effective systems of internal control over financial reporting and disclosure controls and procedures could adversely affect our business and financial results.
Effective internal control over financial reporting is necessary for us to provide accurate financial information. If we are unable to adequately maintain effective internal control over financial reporting, we may not be able to accurately report our financial results. Furthermore, we cannot be certain that our internal control over financial reporting and disclosure controls and procedures will prevent all possible errorerrors and fraud, including through cyber-attacks. Because of inherent limitations in all control systems, no evaluation of controls can provide absolute assurance that all control issues and instances of error or fraud, if any, in our companyCompany have been detected. These inherent limitations include the realities that judgments in decision-making can be faulty and that breakdowns can occur because of a simple error or mistake, which could have an adverse impact on our business. A significant financial reporting failure or a lack of sufficient internal control over financial reporting could cause a loss of investor confidence and decline in the market price of our common stock, increase our costs, lead to litigation or result in negative publicity that could damage our reputation.
Future changes to existing accounting rules, accounting standards, new pronouncements and varying interpretations of pronouncements, or the questioning of current accounting practices may adversely affect our reported financial results. Additionally, our assumptions, estimates and judgments related to complex accounting matters could significantly affect our financial results. Generally accepted accounting principles and related accounting pronouncements, implementation guidelines and interpretations with regard to a wide range of matters that are relevant to our business, including but not limited to, revenue recognition, impairment of long-lived assets, leases and related economic transactions, derivatives, intangibles, self-insurance, income taxes, property and equipment, unclaimed property laws and litigation, and stock-based compensation are highly complex and involve many subjective assumptions, estimates and judgments by us. Changes in these rules or their interpretationinterpretations or changes in underlying assumptions, estimates or judgments by us could significantly change our reported or expected financial performance.
Our insurance policies may not provide adequate levels of coverage against all claims, and fluctuating insurance requirements and costs could negatively impact our profitability.
We carry insurance programs with specific retention levels or high per-claim deductibles for a significant portion of our risks and associated liabilities with respect to workers’ compensation, general liability, liquor liability, employment practices liability, property, health benefits, cyber securitycybersecurity and other insurable risks. However, there are types of losses we may incur that cannot be insured against or that we believe are not commercially reasonable to insure. These losses, if they occur, could have a material and adverse effect on our business and results of operations. Additionally, if our insurance costs increase, there can be no assurance that we will be able to successfully offset the effect of such increases and our results of operations may be adversely affected.
Item 1B. Unresolved Staff Comments
Not applicable.
Item 1C. Cybersecurity
Risk Management and Strategy
We maintain a risk-based, defense-in-depth approach to cybersecurity and data protection. We assess industry best practices and standards and endeavor to leverage them in our efforts to manage cybersecurity risk. We dedicate resources and apply security controls where we believe they would be most effective to predict, prevent, detect and respond to potential security threats to our highest value information assets, which we consider to be point-of-sale systems, financial systems and confidential, personal and private customer and employee information. We use multiple safeguards to protect our internal networks and systems, including, among others, firewalls, email protection and web filtering, endpoint detection and response software, controlled access to our data and systems,
segmenting our card data environment, vulnerability management and patching, and performing regular penetration testing. A risk assessment, based on the National Institute of Standards and Technology Framework, is conducted and maintained throughout the system development lifecycle and is reviewed at least annually.
We have implemented controls designed to identify and mitigate cybersecurity threats associated with our use of third-party service providers. Such providers are subject to security risk assessments at the time of onboarding, contract renewal and upon detection of an increase in risk profile. We use a variety of inputs in such risk assessments, including information supplied by providers and third parties. In addition, we require our providers to meet appropriate security requirements, controls and responsibilities, and we investigate security incidents that have impacted our third-party providers, as appropriate.
As part of our information security training program, employees and contractors participate in various cybersecurity awareness activities, including formal training exercises and simulated phishing events. We also contract with third-party cybersecurity firms to conduct simulated cyberattacks and perform regular penetration testing to assess the effectiveness of our security measures. We have also engaged with external subject matter experts to assess access management, information technology asset management and our cybersecurity policies.
We have company-wide business continuity and disaster recovery plans used to prepare for multiple events, including a potential disruption in the technology on which we rely. We maintain incident response plans and playbooks to prepare for various contingencies and types of incidents. The cybersecurity incident response plan (“IRP”) includes immediate actions to mitigate and contain the short-term impact of an incident, and long-term strategies for remediation and prevention of future incidents. The IRP also includes policies that dictate escalation procedures and remediation plans based on the severity level of an incident. As part of our IRP, we consider engaging third-party cybersecurity firms to assist in the event of a significant incident. We also conduct tabletop exercises to enhance incident response preparedness.
We, like others in our industry, experience cybersecurity incidents and attempts to access our systems. In the event we experience an incident, we classify it based on its significance and track remediation actions and outcomes. Although we do not believe we have been materially affected by cybersecurity incidents or threats in the past, we cannot provide any assurance that we will not experience a material incident in the future. As described above, we utilize a risk-based approach to manage cybersecurity risk and it is possible we may not implement appropriate controls if we do not recognize or underestimate a particular risk. In addition, security controls, no matter how well designed or implemented, may only mitigate and not fully eliminate risks. See Item 1A. Risk Factors for additional discussion of our cybersecurity risks.
Governance
Our Board of Directors (our “Board”) has charged the Audit Committee with oversight of the Company’s identification, assessment and management of cybersecurity and data privacy risks. As part of its oversight of our enterprise risk management program, the Audit Committee periodically reviews and prioritizes key risks facing our Company, including cybersecurity risk. The Audit Committee receives quarterly updates from our head of information security and our Chief Technology Officer (“CTO”) regarding our cybersecurity program and actions taken to manage cybersecurity risk, which include risk identification and management strategies, consumer data protection, security programs, ongoing risk mitigation activities and results of third-party assessments and testing.
We maintain a dedicated cybersecurity department, which consists exclusively of Company employees, within our broader information technology department. Functions within this department range from new information technology solution design and implementation, vulnerability management, phishing awareness, threat detection, Payment Card Industry compliance and incident response. Primary responsibility for assessing, monitoring and managing our cybersecurity risks rests with the head of information security, who has over 25 years of experience in the field of cybersecurity, including prior service in the military in cybersecurity roles, and relevant industry certifications commensurate with his role. Our head of information security reports directly to the CTO who has over 20 years of restaurant technology experience.
Our CTO receives status reports from our cybersecurity department regularly and reports to our Chief Executive Officer, who receives updates on incidents, trends, projects and other relevant information regularly. In addition, as part of our incident response planning, we maintain cross-functional response teams to be prepared to respond to an incident.
Item 2. Properties
We had 1,498 system wide full-service1,480 system-wide restaurants and off-premises only kitchens located across 47 states, Guam and 1713 countries as of December 26, 2021.31, 2023. The following is a summary of our restaurant and kitchen locations by country and territory as of December 26, 2021:31, 2023:
| | COMPANY-OWNED | COMPANY-OWNED | | | FRANCHISED |
| United States | 1,013 | | | | United States | 157 | |
| COMPANY-OWNED | |
| COMPANY-OWNED | | | | | | FRANCHISED |
| United States (1) | |
| | International: | International: | | | International: | |
| Brazil (1) | 135 | | | | Argentina | 2 | | | Japan | 10 | |
| International: | |
| International: | |
| Brazil (2) | |
| Brazil (2) | |
| Brazil (2) | |
| China (Mainland) | China (Mainland) | 1 | | | | Australia | 8 | | | Mexico | 5 | |
| Hong Kong | Hong Kong | 20 | | | | Bahamas | 1 | | | Philippines | 3 | |
| Total international Company-owned | Total international Company-owned | 156 | | | | Canada | 3 | | | Qatar | 4 | |
| | | | Costa Rica | 1 | | | Saudi Arabia | 11 | |
| | Dominican Republic | 1 | | | South Korea | 118 | |
| | Guam | 1 | | | Turks and Caicos | 1 | |
| | Indonesia | 3 | | | | |
| | Total international franchised | 172 | |
| | | | | | Dominican Republic | |
| | | | | | Guam | |
| | | | | | Total international franchised | |
| | | | | | Total international franchised | |
| | | | | | Total international franchised | |
| Total Company-owned | Total Company-owned | 1,169 | | | | Total franchised | 329 | |
|
____________________
(1)Restaurant property counts exclude one and four off-premises only kitchens from Company-owned United States and franchised South Korea totals, respectively.
(2)The count for Brazil is reported as of November 30, 20212023 to correspond with the balance sheet date of this subsidiary.
We lease substantially all of our restaurant properties from third parties. As of December 26, 2021,31, 2023, our Company-owned restaurants were located on the following sites by segment:
| | U.S. | | INTERNATIONAL | | TOTAL | | PERCENTAGE OF TOTAL |
| U.S. | | | U.S. | | INTERNATIONAL | | TOTAL | | PERCENTAGE OF TOTAL |
| Company-owned sites | Company-owned sites | 26 | | | — | | | 26 | | | 2 | % | Company-owned sites | 25 | | | — | | — | | | 25 | | 25 | | | 2 | | 2 | % |
| Leased sites: | Leased sites: | |
| Land, ground and building leases | Land, ground and building leases | 682 | | | — | | | 682 | | | 58 | % |
| Land, ground and building leases | |
| Land, ground and building leases | | 692 | | | 1 | | | 693 | | | 58 | % |
| Space and in-line leases | Space and in-line leases | 305 | | | 156 | | | 461 | | | 40 | % | Space and in-line leases | 281 | | | 190 | | 190 | | | 471 | | 471 | | | 40 | | 40 | % |
| Total Company-owned restaurant sites | Total Company-owned restaurant sites | 1,013 | | | 156 | | | 1,169 | | | 100 | % | Total Company-owned restaurant sites | 998 | | | 191 | | 191 | | | 1,189 | | 1,189 | | | 100 | | 100 | % |
We also lease corporate offices in Tampa, Florida and São Paulo, Brazil.
Item 3. Legal Proceedings
For a description of our legal proceedings, see Note 2221 - Commitments and Contingencies of the Notes to Consolidated Financial Statements of this Report.
Item 4. Mine Safety Disclosures
Not applicable.
PART II
Item 5. Market for Registrant’s Common Equity, Related Stockholder Matters and Issuer Purchases of Equity Securities
Market Information - Our common stock is listed on the Nasdaq Global Select Market under the symbol “BLMN”.
Dividends - We began paying quarterly cash dividends on shares of our common stock in 2015 but suspended dividends in early 2020 at the onset of the COVID-19 pandemic. Under our Second Amended and Restated Credit Agreement (the “Credit Agreement”), we were restricted from paying dividends until after September 26, 2021 and we were compliant with our financial covenants. We were compliant with our financial covenants as of December 26, 2021 and inIn February 2022, our Board of Directors (our “Board”) declaredreinstated quarterly dividends after a quarterly cash dividend.temporary suspension during the COVID-19 pandemic. Future dividend payments will depend on continued compliance with our financial covenants, as well as our earnings, financial condition, capital expenditure requirements, surplus and other factors that our Board considers relevant.
Holders - As of February 18, 2022,23, 2024, there were 104113 holders of record of our common stock. The number of registered holders does not include holders who are beneficial owners whose shares are held in street name by brokers and other nominees.
Securities Authorized for Issuance Under Equity Compensation Plans - The following table presents the securities authorized for issuance under our equity compensation plans as of December 26, 2021:31, 2023:
| | (shares in thousands) | (shares in thousands) | | (a) | | (b) | | (c) | (shares in thousands) | | (a) | | (b) | | (c) |
| PLAN CATEGORY | PLAN CATEGORY | | NUMBER OF SECURITIES TO BE ISSUED UPON EXERCISE OF OUTSTANDING OPTIONS, WARRANTS AND RIGHTS (1) | | WEIGHTED AVERAGE EXERCISE PRICE OF OUTSTANDING OPTIONS, WARRANTS AND RIGHTS (2) | | NUMBER OF SECURITIES REMAINING AVAILABLE FOR FUTURE ISSUANCE UNDER EQUITY COMPENSATION PLANS (EXCLUDING SECURITIES REFLECTED IN COLUMN (a)) (3) | PLAN CATEGORY | | NUMBER OF SECURITIES TO BE ISSUED UPON EXERCISE OF OUTSTANDING OPTIONS, WARRANTS AND RIGHTS (1) | | WEIGHTED AVERAGE EXERCISE PRICE OF OUTSTANDING OPTIONS, WARRANTS AND RIGHTS (2) | | NUMBER OF SECURITIES REMAINING AVAILABLE FOR FUTURE ISSUANCE UNDER EQUITY COMPENSATION PLANS (EXCLUDING SECURITIES REFLECTED IN COLUMN (a)) (3) |
| Equity compensation plans approved by security holders | Equity compensation plans approved by security holders | | 5,765 | | | $ | 20.42 | | | 8,911 | |
____________________
(1)Includes 1,4891,449 shares issuable in respect to restricted stock units and performance-based share units (assuming target achievement of applicable performance metrics).
(2)Amounts in this column relate only to options exercisable for common shares.
(3)The shares remaining available for issuance may be issued in the form of stock options, restricted stock units or other stock awards under the 2020 Omnibus Incentive Compensation Plan. See Note 6 - Stock-based and Deferred Compensation Plans of the Notes to Consolidated Financial Statements for details regarding the plan.
Unregistered Sales of Equity Securities - Convertible Senior Notes and Warrants - In May 2020, we issued $230.0 million of 5.00% senior notes that are convertible into approximately 19.348 million shares of our common stock, at the initial conversion rate, and mature on May 1, 2025, unless earlier converted, redeemed or purchased by us (the “2025 Notes”). In connection with the offering of the 2025 Notes, we also sold warrants for approximately 19.348 million shares of our common stock with an initial strike price of $16.64.
Purchases of Equity Securities by the Issuer and Affiliated Purchasers - We did not repurchase any sharesThe following table provides information regarding our purchases of our outstanding common stock during the thirteenfourteen weeks ended December 26, 2021. 31, 2023:
| | | | | | | | | | | | | | | | | | | | | | | | | | | |
| REPORTING PERIOD | | TOTAL NUMBER OF SHARES PURCHASED | | AVERAGE PRICE PAID PER SHARE | | TOTAL NUMBER OF SHARES PURCHASED AS PART OF PUBLICLY ANNOUNCED PLANS OR PROGRAMS | | | APPROXIMATE DOLLAR VALUE OF SHARES THAT MAY YET BE PURCHASED UNDER THE PLANS OR PROGRAMS (1) |
| September 25, 2023 through October 22, 2023 | | 269,131 | | | $ | 23.78 | | | 269,131 | | | | $ | 81,461,316 | |
| October 23, 2023 through November 19, 2023 | | 137,044 | | | $ | 23.35 | | | 137,044 | | | | $ | 78,261,379 | |
| November 20, 2023 through December 31, 2023 | | 329,103 | | | $ | 25.10 | | | 329,103 | | | | $ | 70,000,707 | |
| Total | | 735,278 | | | | | 735,278 | | | | |
| | | | | | | | | |
| | | | | | | | | |
| | | | | | | | | |
____________________(1)On February 8, 2022,7, 2023, our Board approved a share repurchase programauthorization of up to $125.0 million of our outstanding common stock as announced in our press release issued February 16, 2023 (the “2022“2023 Share Repurchase Program”). Subsequent to December 31, 2023, we repurchased $12.5 million of our common stock authorized under the 2023 Share Repurchase Program under a Rule 10b5-1 plan. In February 2024, our Board canceled the remaining $57.5 million of authorization under the 2023 Share Repurchase Program and approved a new $350.0 million authorization (the “2024 Share Repurchase Program”), as announced in our press release issued on February 18, 2022, under which we are authorized to repurchase up to $125.0 million of our outstanding common stock.23, 2024. The 20222024 Share Repurchase Program will expire on August 9, 2023.13, 2025.
Stock Performance Graph - The following graph depicts total return to stockholders from December 23, 201628, 2018 through December 26, 2021,31, 2023, relative to the performance of the Standard & Poor’s 500 Indexindex and the Standard & Poor’s 500 Consumer Discretionary Sector,index, a peer group. The graph assumes an investment of $100 in our common stock and in each index on December 23, 201628, 2018 (the last business day of the fiscal year of investment), and the reinvestment of dividends paid since that date. The stock price performance shown in the graph is not necessarily indicative of future price performance.
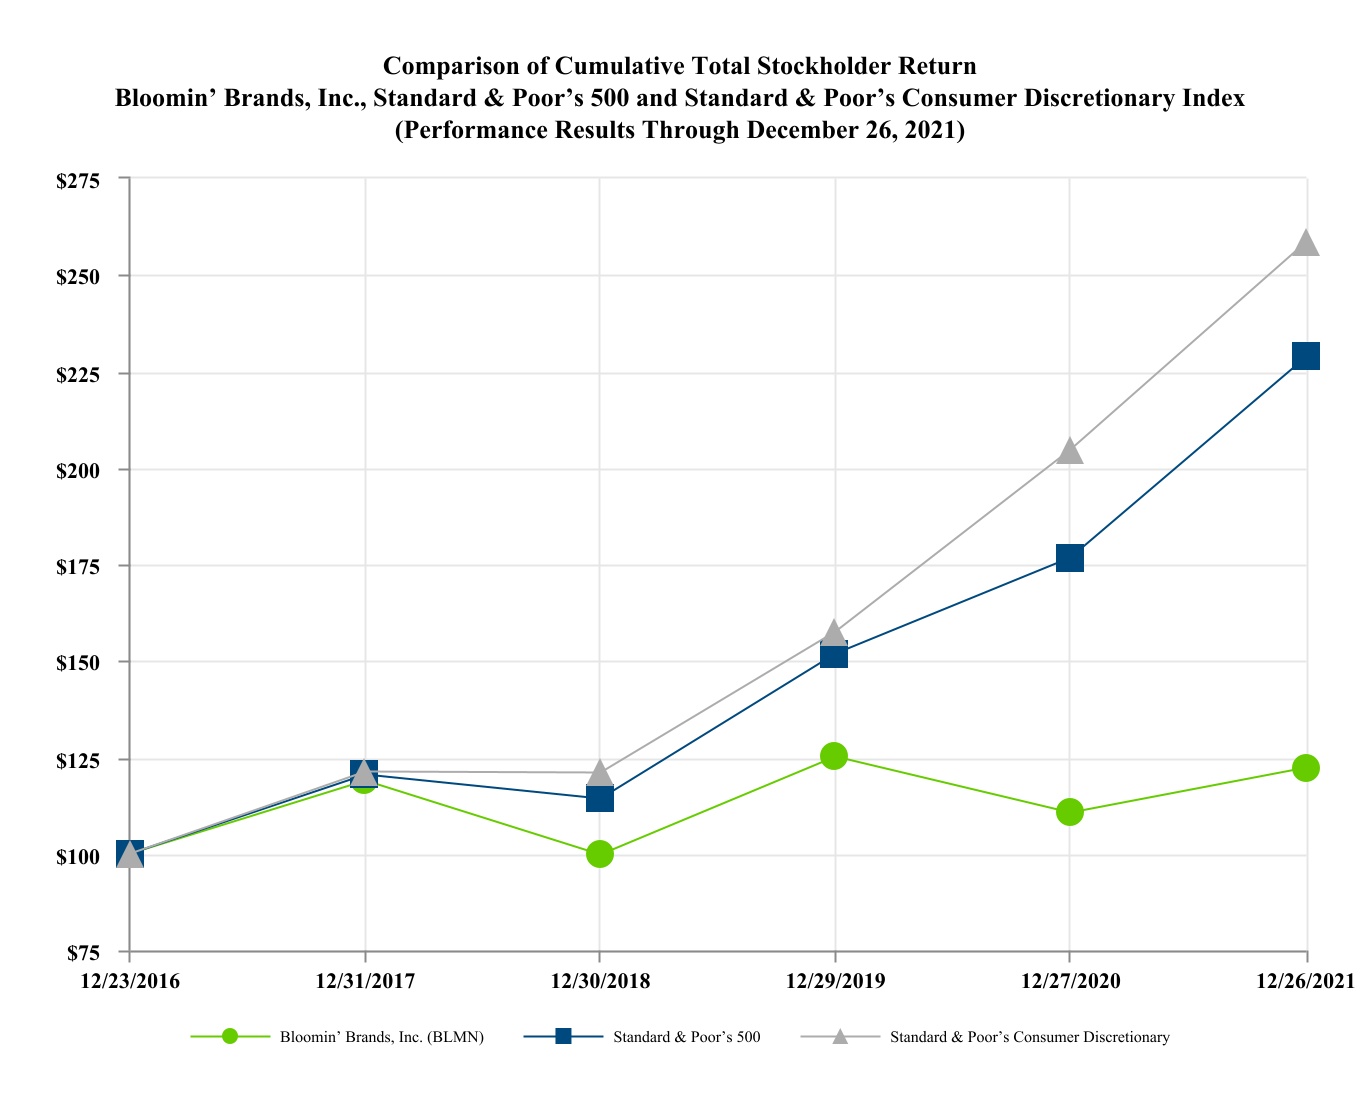
| | | | | | | | | | | | | | | | | | | | | | | | | | | | | | | | | | | |
| DECEMBER 23,
2016 | | DECEMBER 31,
2017 | | DECEMBER 30,
2018 | | DECEMBER 29,
2019 | | DECEMBER 27,
2020 | | DECEMBER 26,
2021 |
| Bloomin’ Brands, Inc. (BLMN) | $ | 100.00 | | | $ | 118.89 | | | $ | 99.68 | | | $ | 125.24 | | | $ | 110.66 | | | $ | 122.33 | |
| Standard & Poor’s 500 | $ | 100.00 | | | $ | 120.51 | | | $ | 114.23 | | | $ | 151.89 | | | $ | 176.78 | | | $ | 228.79 | |
| Standard & Poor’s Consumer Discretionary | $ | 100.00 | | | $ | 121.35 | | | $ | 121.01 | | | $ | 157.41 | | | $ | 204.58 | | | $ | 258.53 | |

| | | | | | | | | | | | | | | | | | | | | | | | | | | | | | | | | | | |
| DECEMBER 28,
2018 | | DECEMBER 29,
2019 | | DECEMBER 27,
2020 | | DECEMBER 26,
2021 | | DECEMBER 25,
2022 | | DECEMBER 31,
2023 |
| Bloomin’ Brands, Inc. (BLMN) | $ | 100.00 | | | $ | 125.64 | | | $ | 111.01 | | | $ | 122.72 | | | $ | 125.90 | | | $ | 175.91 | |
| Standard & Poor’s 500 | $ | 100.00 | | | $ | 132.96 | | | $ | 154.75 | | | $ | 200.27 | | | $ | 165.59 | | | $ | 208.83 | |
| Standard & Poor’s 500 Consumer Discretionary | $ | 100.00 | | | $ | 130.08 | | | $ | 169.06 | | | $ | 213.64 | | | $ | 135.43 | | | $ | 192.23 | |
Item 6. [Reserved]
BLOOMIN’ BRANDS, INC.
MANAGEMENT’S DISCUSSION AND ANALYSIS OF
FINANCIAL CONDITION AND RESULTS OF OPERATIONS
Item 7. Management’s Discussion and Analysis of Financial Condition and Results of Operations
Management’s discussion and analysis of financial condition and results of operations should be read in conjunction with our consolidated financial statements and the related notes. For discussion of our consolidated and segment-level results of operations, non-GAAP measures, and liquidity and capital resources for fiscal year 2019,2021, see our Annual Report on Form 10-K for the year ended December 27, 2020,25, 2022, filed with the SEC on February 24, 2021.22, 2023.
Overview
We are one of the largest casual dining restaurant companies in the world with a portfolio of leading, differentiated restaurant concepts. As of December 26, 2021,31, 2023, we owned and operated 1,169 full-service1,189 restaurants and off-premises only kitchens and franchised 329 full-service291 restaurants and off-premises only kitchens across 47 states, Guam and 1713 countries. We have four founder-inspired concepts: Outback Steakhouse, Carrabba’s Italian Grill, Bonefish Grill and Fleming’s Prime Steakhouse & Wine Bar.
Financial Highlights
Our financial highlightsoverview for 2021 include2023 includes the following:
•U.S. combined and Outback Steakhouse comparable restaurant sales of 30.5%1.4% and 24.2%1.1%, respectively, relative to 2020 and 4.5% and 3.2%, respectively, relative to 2019;respectively;
•An increaseIncrease in Total revenues of 30.0%,5.8% as compared to 2020,2022;
•Operating income and a decrease in Total revenuesrestaurant-level operating margins of 0.4%7.0% and 16.2%, respectively, as compared to 2019;7.5% and 15.6%, respectively for 2022;
•Restaurant-level operating marginOperating income of 16.5% for 2021, as compared to 9.9% and 14.9% for 2020 and 2019, respectively;
•Decrease in General and administrative expense of $8.7 million and $29.6$325.1 million as compared to 2020 and 2019, respectively;
•Income from operations of $309.0$330.4 million in 2021, as compared to Loss from operations of $(175.0) million in 2020 and Income from operations of $191.1 million in 2019;2022; and
•Diluted earnings (loss) per share attributable to common stockholders of $2.00 in 2021$2.56 as compared to $(1.85) and $1.45$1.03 in 2020 and 2019, respectively.2022.
Business Strategies
In 2022,2024, our key business strategies include:
•Enhance the 360-Degree Customer Experience to Drive Sustainable Healthy Sales Growth. We plan to continue to make investments to enhance our core guest experience, upgrade kitchen equipment and technology, increase off-premises dining occasions, remodel and relocate restaurants, invest in digital marketing and data personalization and utilize the Dine Rewards loyalty program and multimedia marketing campaigns to drive sales.
•Drive Long-Term Shareholder Value. We plan to drive long-term shareholder value by reinvesting operational cash flow into our business, improving our credit profile and returning excess cash to shareholders through dividends and share repurchases and dividends.repurchases.
•Enrich Engagement Among Stakeholders. We take the responsibility to our people, customers and communities seriously and continue to invest in programs that support the well-being of those engaged with us.
•Accelerate Growth Opportunities. We believe a substantial development opportunity remains for our concepts in the U.S. and internationally through existing geography fill-in and market expansion. We will
BLOOMIN’ BRANDS, INC.
MANAGEMENT’S DISCUSSION AND ANALYSIS OF
FINANCIAL CONDITION AND RESULTS OF OPERATIONS - Continued
continue to pursue U.S. fill-in opportunities infor Outback Steakhouse, Fleming’s Prime Steakhouse & Wine Bar and Carrabba’s Italian Grill across key southern states such as North Carolina, Florida and Texas with Outback, and California and Florida with Fleming’s.as well as California. We will also focus on geographic regions in South America, with strategic expansion in Brazil and pursue global franchise opportunities.
We intend to fund our business strategies, drive revenue growth and margin improvement, in part by reinvesting savings generated by cost savings and productivity initiatives across our businesses.
BLOOMIN’ BRANDS, INC.
MANAGEMENT’S DISCUSSION AND ANALYSIS OF
FINANCIAL CONDITION AND RESULTS OF OPERATIONS - Continued
Macroeconomic Conditions - The combination of macroeconomic and other factors have put considerable pressure on the casual dining industry. The ongoing impacts of inflation, rising interest rates, reduced disposable consumer income, access to credit, other national, regional and local regulatory and economic conditions and consumer confidence have had a negative effect on discretionary consumer spending.
Should the macroeconomic and other conditions persist, we will continue to face increased pressure with respect to our pricing, traffic levels and commodity costs. We believe that in this environment, we need to maintain our focus on value and innovation as well as refreshing our restaurant base through remodels and new restaurant development to continue to drive sales.
Key Financial Performance Indicators
- Key measures that we use in evaluating our restaurants and assessing our business include the following:
•Average restaurant unit volumes—average sales (excluding gift card breakage)breakage and the benefit of value added tax exemptions in Brazil) per restaurant to measure changes in customer traffic, pricing and development of the brand;brand.
•Comparable restaurant sales—year-over-year comparison of the change in sales volumes (excluding gift card breakage)breakage and the benefit of value added tax exemptions in Brazil) for Company-owned restaurants that are open 18 months or more in order to remove the impact of new restaurant openings in comparing the operations of existing restaurants;restaurants.
•System-wide sales—total restaurant sales volume for all Company-owned and franchise restaurants, regardless of ownership, to interpret the overall health of our brands;brands.
•Restaurant-level operating margin, Income (loss) from operations, Net income (loss) and Diluted earnings (loss) per share—financial measures utilized to evaluate our operating performance.
Restaurant-level operating margin is a non-GAAP financial measure widely regarded in the industry as a useful metric to evaluate restaurant-level operating efficiency and performance of ongoing restaurant-level operations, and we use it for these purposes, overall and particularly within our two segments. Our restaurant-level operating margin is expressed as the percentage of our Restaurant sales that Food and beverage costs, Labor and other related expensesexpense and Other restaurant operating expensesexpense (including advertising expenses) represent, in each case as such items are reflected in our Consolidated Statements of Operations and Comprehensive Income (Loss).Income. The following categories of our revenue and operating expenses are not included in restaurant-level operating income and the corresponding margin because we do not consider them reflective of operating performance at the restaurant-level within a period:
(i)Franchise and other revenues, which are earned primarily from franchise royalties and other non-food and beverage revenue streams, such as rental and sublease income.income;
(ii)Depreciation and amortization, which, although substantially all of which is related to restaurant-level assets, represent historical sunk costs rather than cash outlays for the restaurants.restaurants;
(iii)General and administrative expense, which includes primarily non-restaurant-level costs associated with support of the restaurants and other activities at our corporate offices.offices; and
(iv)Asset impairment charges and restaurant closing costs, which are not reflective of ongoing restaurant performance in a period.
Restaurant-level operating margin excludes various expenses, as discussed above, that are essential to support the operations of our restaurants and may materially impact our Consolidated Statements of Operations and Comprehensive Income (Loss).Income. As a result, restaurant-level operating margin is not indicative of our consolidated results of operations and is presented exclusively as a supplement to, and not a substitute for, Net income (loss) or Income (loss) from operations. In addition, our presentation of restaurant operating margin may not be comparable to similarly titled measures used by other companies in our industry; and
BLOOMIN’ BRANDS, INC.
MANAGEMENT’S DISCUSSION AND ANALYSIS OF
FINANCIAL CONDITION AND RESULTS OF OPERATIONS - Continued
•Adjusted restaurant-level operating margin, Adjusted income (loss) from operations, Adjusted net income (loss) and Adjusted diluted earnings (loss) per share—non-GAAP financial measures utilized to evaluate our operating performance, which definitions, usefulness and reconciliations are described in more detail in the “Non-GAAP Financial Measures” section below.
Selected Operating Data
The table below presents the number of our full-service restaurants in operation as of the periods indicated:
| | | | | | | | | | | | | |
| Number of restaurants (at end of the period): | DECEMBER 26, 2021 | | DECEMBER 27, 2020 | | |
| U.S.: | | | | | |
| Outback Steakhouse | | | | | |
| Company-owned | 564 | | 568 | | |
| Franchised | 130 | | 138 | | |
| Total | 694 | | 706 | | |
| Carrabba’s Italian Grill | | | | | |
| Company-owned | 199 | | 199 | | |
| Franchised | 20 | | 21 | | |
| Total | 219 | | 220 | | |
| Bonefish Grill | | | | | |
| Company-owned | 178 | | 180 | | |
| Franchised | 7 | | 7 | | |
| Total | 185 | | 187 | | |
| Fleming’s Prime Steakhouse & Wine Bar | | | | | |
| Company-owned | 64 | | 63 | | |
| Aussie Grill | | | | | |
| Company-owned (1) | 5 | | | 3 | | | |
| U.S. total | 1,167 | | | 1,179 | | | |
| International: | | | | | |
| Company-owned | | | | | |
| Outback Steakhouse - Brazil (2) | 122 | | | 109 | | | |
| | | | | |
| | | | | |
| Other (1)(3) | 33 | | | 32 | | | |
| Franchised | | | | | |
| Outback Steakhouse - South Korea (1) | 78 | | | 76 | | | |
| Other (3) | 54 | | | 56 | | | |
| International total | 287 | | | 273 | | | |
| | | | | |
| | | | | |
| System-wide total | 1,454 | | 1,452 | | |
| System-wide total - Company-owned | 1,165 | | 1,154 | | |
| System-wide total - Franchised | 289 | | 298 | | |
| | | | | |
| | | | | |
| | | | | |
| | | | | |
| | | | | |
| | | | | |
| | | | | |
| | | | | |
____________________
(1)Restaurant counts as of December 27, 2020 have been adjusted to exclude off-premises only locations included in the table below.
(2)The restaurant counts for Brazil are reported as of November 30, 2021 and 2020, respectively, to correspond with the balance sheet dates of this subsidiary.
(3)International Company-owned Other included two and one Aussie Grill locations as of December 26, 2021 and December 27, 2020, respectively. International Franchised Other included three Aussie Grill locations as of December 26, 2021 and December 27, 2020.
BLOOMIN’ BRANDS, INC.
MANAGEMENT’S DISCUSSION AND ANALYSIS OF
FINANCIAL CONDITION AND RESULTS OF OPERATIONS - Continued
The table below presents the number of our off-premises only kitchens in operation as of the periods indicated:
| | | | | | | | | | | |
| Number of kitchens (at end of the period) (1): | DECEMBER 26, 2021 | | DECEMBER 27, 2020 |
| U.S: | | | |
| Company-owned | 3 | | | 2 | |
| | | |
| | | |
| International: | | | |
| Company-owned | 1 | | | 1 | |
| Franchised - South Korea | 40 | | | 19 | |
| | | |
| | | |
| System-wide total | 44 | | | 22 | |
____________________
(1)Excludes virtual concepts that operate out of existing restaurants and sports venue locations.
Results of Operations
The following table sets forth the percentages of certain items in our Consolidated Statements of Operations in relation to Total revenues or Restaurant sales for the periods indicated:
| | | | | | | | | | | | | |
| FISCAL YEAR |
| 2021 | | 2020 | | |
| Revenues | | | | | |
| Restaurant sales | 98.5 | % | | 99.2 | % | | |
| Franchise and other revenues | 1.5 | | | 0.8 | | | |
| Total revenues | 100.0 | | | 100.0 | | | |
| Costs and expenses | | | | | |
| Food and beverage costs (1) | 30.3 | | | 31.3 | | | |
| Labor and other related (1) | 28.4 | | | 32.0 | | | |
| Other restaurant operating (1) | 24.8 | | | 26.9 | | | |
| Depreciation and amortization | 4.0 | | | 5.7 | | | |
| General and administrative | 6.0 | | | 8.0 | | | |
| | | | | |
| | | | | |
| | | | | |
| Provision for impaired assets and restaurant closings | 0.3 | | | 2.4 | | | |
| | | | | |
| Total costs and expenses | 92.5 | | | 105.5 | | | |
| Income (loss) from operations | 7.5 | | | (5.5) | | | |
| Loss on extinguishment and modification of debt | (0.1) | | | (*) | | |
| | | | | |
| Other income, net | * | | * | | |
| Interest expense, net | (1.4) | | | (2.1) | | | |
| Income (loss) before provision (benefit) for income taxes | 6.0 | | | (7.6) | | | |
| Provision (benefit) for income taxes | 0.6 | | | (2.6) | | | |
| Net income (loss) | 5.4 | | | (5.0) | | | |
| Less: net income (loss) attributable to noncontrolling interests | 0.2 | | | (*) | | |
| Net income (loss) attributable to Bloomin’ Brands | 5.2 | % | | (5.0) | % | | |
____________________
(1)As a percentage of Restaurant sales.
*Less than 1/10th of one percent of Total revenues.
BLOOMIN’ BRANDS, INC.
MANAGEMENT’S DISCUSSION AND ANALYSIS OF
FINANCIAL CONDITION AND RESULTS OF OPERATIONS - Continued
for, Net income or Income from operations. In addition, our presentation of restaurant-level operating margin may not be comparable to similarly titled measures used by other companies in our industry.
•Adjusted restaurant-level operating margin, Adjusted income from operations, Adjusted net income and Adjusted diluted earnings per share—non-GAAP financial measures utilized to evaluate our operating performance, which definitions, usefulness and reconciliations are described in more detail in the “Non-GAAP Financial Measures” section below.
Selected Operating Data - The table below presents the number of our restaurants in operation as of the periods indicated:
| | | | | | | | | | | | | |
| Number of restaurants (at end of the period): | DECEMBER 31, 2023 | | DECEMBER 25, 2022 | | |
| U.S. | | | | | |
| Outback Steakhouse | | | | | |
| Company-owned | 562 | | | 566 | | | |
| Franchised | 126 | | | 127 | | | |
| Total | 688 | | | 693 | | | |
| Carrabba’s Italian Grill | | | | | |
| Company-owned | 198 | | | 199 | | | |
| Franchised | 19 | | | 19 | | | |
| Total | 217 | | | 218 | | | |
| Bonefish Grill | | | | | |
| Company-owned | 170 | | | 173 | | | |
| Franchised | 6 | | | 7 | | | |
| Total | 176 | | | 180 | | | |
| Fleming’s Prime Steakhouse & Wine Bar | | | | | |
| Company-owned | 64 | | | 65 | | | |
| Aussie Grill | | | | | |
| Company-owned | 4 | | | 7 | | | |
| Franchised | 1 | | | — | | | |
| Total | 5 | | | 7 | | | |
| U.S. total (1) | 1,150 | | | 1,163 | | | |
| International | | | | | |
| Company-owned | | | | | |
| Outback Steakhouse - Brazil (2) | 155 | | | 139 | | | |
| | | | | |
| | | | | |
| Other (2)(3) | 36 | | | 36 | | | |
| Franchised | | | | | |
| Outback Steakhouse - South Korea (1) | 92 | | | 86 | | | |
| Other (3) | 47 | | | 47 | | | |
| International total | 330 | | | 308 | | | |
| | | | | |
| | | | | |
| System-wide total | 1,480 | | | 1,471 | | | |
| System-wide total - Company-owned | 1,189 | | | 1,185 | | | |
| System-wide total - Franchised | 291 | | | 286 | | | |
| | | | | |
| | | | | |
| | | | | |
| | | | | |
| | | | | |
| | | | | |
| | | | | |
| | | | | |
____________________
(1)Excludes five and 36 off-premises only kitchens as of December 31, 2023 and December 25, 2022, respectively. One location was Company-owned in the U.S and all others were franchised in South Korea as of December 31, 2023 and December 25, 2022.
(2)The restaurant counts for Brazil, including Abbraccio and Aussie Grill restaurants within International Company-owned Other, are reported as of November 30, 2023 and 2022, respectively, to correspond with the balance sheet dates of this subsidiary.
(3)International Company-owned Other included two and four Aussie Grill locations as of December 31, 2023 and December 25, 2022, respectively. International Franchised Other included four Aussie Grill locations as of December 31, 2023 and December 25, 2022.
BLOOMIN’ BRANDS, INC.
MANAGEMENT’S DISCUSSION AND ANALYSIS OF
FINANCIAL CONDITION AND RESULTS OF OPERATIONS - Continued
Results of Operations
REVENUES
Restaurant Sales
-
Following is a summary of the change in Restaurant sales for the period indicated:
| | | | | | | |
| FISCAL YEAR |
| (dollars in millions) | 20212023 | | |
For fiscal year 20202022 | $ | 3,144.64,352.7 | | | |
| Change from: | | | |
Comparable restaurant sales (1) | 912.781.8 | | | |
Restaurant openings (1) | 54.464.9 | | | |
Restaurant closures | (35.3) | | | |
| | | |
| Effect of foreign currency translation | (15.3)34.3 | | | |
| Brazil value added tax exemptions (1) | 22.5 | | | |
| | | |
| Restaurant closures | (31.5) | | | |
| | | |
For fiscal year 20212023 (comparable 52-week presentation) (2) | 4,524.7 | | | |
| 53rd week restaurant sales (3) | 82.7 | | | |
| For fiscal year 2023 (as reported) | $ | 4,061.14,607.4 | | | |
| | | |
| | | |
| | | |
____________________
(1)SummationFiscal years 2023 and 2022, include $30.2 million and $7.7 million, respectively, of quarterly changesvalue added tax exemptions resulting from the Brazil tax legislation. Beginning in the fourth quarter of 2023, we are once again subject to the value added taxes for restaurant openings and comparablewhich we were previously exempt. See Note 20 - Income Taxes of the Notes to Consolidated Financial Statements for details regarding value added tax exemptions in connection with Brazil tax legislation.
(2)Includes $101.9 million of restaurant sales will not totalgenerated by restaurants closed, primarily in February 2024, in connection with the 2023 Closure Initiative, as defined below. See Note 4 - Impairments and Exit Costs of the Notes to annual amounts asConsolidated Financial Statements for additional details regarding the restaurants that meet2023 Closure Initiative.
(3)Includes restaurant sales from December 25, 2023 through December 31, 2023, which represents the definition53rd week of a comparable restaurant will differ each period based on when the restaurant opened.fiscal year 2023.
The increase in Restaurant sales in 20212023 as compared to 20202022 was primarily due to: (i) restaurant sales during the 53rd week of 2023, (ii) higher comparable restaurant sales, from recovery of in-restaurant dining from the significantly reduced levels in 2020 after the onset of the pandemic and strong retention of off-premises sales and (ii)(iii) the opening of 4866 new restaurants not included in our comparable restaurant sales base. The increase in Restaurant sales was partially offset by the closure of 46 restaurants since December 29, 2019 andbase, (iv) the effect of foreign currency translation of the Brazilian Real relative to the U.S. dollar.dollar and (v) value added tax exemptions in Brazil. The increase in Restaurant sales was partially offset by the closure of 35 restaurants since December 26, 2021.
Average Restaurant Unit Volumes and Operating WeeksFollowing is a summary of the average restaurant unit volumes and operating weeks for the periods indicated:
| | | | | | | | | | | | | |
| FISCAL YEAR |
| (dollars in thousands) | 2021 | | 2020 | | |
| Average restaurant unit volumes: | | | | | |
| U.S. | | | | | |
| Outback Steakhouse | $ | 3,822 | | | $ | 3,062 | | | |
| Carrabba’s Italian Grill | $ | 3,283 | | | $ | 2,468 | | | |
| Bonefish Grill | $ | 3,036 | | | $ | 2,135 | | | |
| Fleming’s Prime Steakhouse & Wine Bar | $ | 5,208 | | | $ | 3,189 | | | |
| International | | | | | |
| Outback Steakhouse - Brazil (1) | $ | 2,286 | | | $ | 1,996 | | | |
| | | | | |
| Operating weeks: | | | | | |
| U.S. | | | | | |
| Outback Steakhouse | 29,415 | | | 29,714 | | | |
| Carrabba’s Italian Grill | 10,348 | | | 10,474 | | | |
| Bonefish Grill | 9,318 | | | 9,651 | | | |
| Fleming’s Prime Steakhouse & Wine Bar | 3,321 | | | 3,418 | | | |
| International | | | | | |
| Outback Steakhouse - Brazil | 5,907 | | | 5,389 | | | |
____________________
(1)Translated at average exchange rates of 5.33 and 4.85 for 2021 and 2020, respectively.
BLOOMIN’ BRANDS, INC.
MANAGEMENT’S DISCUSSION AND ANALYSIS OF
FINANCIAL CONDITION AND RESULTS OF OPERATIONS - Continued
Average Restaurant Unit Volumes and Operating Weeks
Following is a summary of the average restaurant unit volumes and operating weeks for the periods indicated:
| | | | | | | | | | | | | |
| FISCAL YEAR |
| (dollars in thousands) | 2023 | | 2022 | | |
| Average restaurant unit volumes: | | | | | |
| U.S. | | | | | |
| Outback Steakhouse | $ | 4,094 | | | $ | 3,949 | | | |
| Carrabba’s Italian Grill | $ | 3,631 | | | $ | 3,406 | | | |
| Bonefish Grill | $ | 3,339 | | | $ | 3,213 | | | |
| Fleming’s Prime Steakhouse & Wine Bar | $ | 5,935 | | | $ | 5,845 | | | |
| International | | | | | |
| Outback Steakhouse - Brazil (1) | $ | 3,213 | | | $ | 3,067 | | | |
| | | | | |
| Operating weeks: | | | | | |
| U.S. | | | | | |
| Outback Steakhouse | 29,771 | | | 29,308 | | | |
| Carrabba’s Italian Grill | 10,537 | | | 10,328 | | | |
| Bonefish Grill | 9,056 | | | 9,056 | | | |
| Fleming’s Prime Steakhouse & Wine Bar | 3,418 | | | 3,331 | | | |
| International | | | | | |
| Outback Steakhouse - Brazil | 7,670 | | | 6,775 | | | |
____________________
(1)Translated at average exchange rates of 5.02 and 5.19 for 2023 and 2022, respectively. Excludes the benefit of the Brazil value added tax exemptions discussed in Note 20 - Income Taxes of the Notes to Consolidated Financial Statements.
BLOOMIN’ BRANDS, INC.
MANAGEMENT’S DISCUSSION AND ANALYSIS OF
FINANCIAL CONDITION AND RESULTS OF OPERATIONS - Continued
Comparable Restaurant Sales, Traffic and Average Check Per Person Increases (Decreases)
Following is a summary of comparable restaurant sales, traffic and average check per person increases (decreases) for the periods indicated:
| | FISCAL YEAR |
| 2021 | | 2020 | |
| | | FISCAL YEAR | |
| | | FISCAL YEAR | |
| | | FISCAL YEAR | |
| | | 2023 (1) | |
| | | 2023 (1) | |
| | | 2023 (1) | |
| | COMPARABLE TO 2019 (1) | | COMPARABLE TO 2020 | | COMPARABLE TO 2019 | |
| Year over year percentage change: | Year over year percentage change: | | | | | | |
| Comparable restaurant sales (stores open 18 months or more): | | |
| | Year over year percentage change: | |
| | Year over year percentage change: | |
| Comparable restaurant sales (restaurants open 18 months or more): | |
| Comparable restaurant sales (restaurants open 18 months or more): | |
| Comparable restaurant sales (restaurants open 18 months or more): | |
| U.S. (2) | |
| U.S. (2) | |
| U.S. (2) | U.S. (2) | | |
| Outback Steakhouse | Outback Steakhouse | 3.2 | % | | 24.2 | % | | (16.9) | % | |
| Outback Steakhouse | |
| Outback Steakhouse | |
| Carrabba’s Italian Grill | |
| Carrabba’s Italian Grill | |
| Carrabba’s Italian Grill | Carrabba’s Italian Grill | 10.5 | % | | 32.2 | % | | (16.4) | % | |
| Bonefish Grill | Bonefish Grill | (1.7) | % | | 40.6 | % | | (30.1) | % | |
| Bonefish Grill | |
| Bonefish Grill | |
| Fleming’s Prime Steakhouse & Wine Bar | |
| Fleming’s Prime Steakhouse & Wine Bar | |
| Fleming’s Prime Steakhouse & Wine Bar | Fleming’s Prime Steakhouse & Wine Bar | 13.4 | % | | 60.9 | % | | (29.5) | % | |
| Combined U.S. | Combined U.S. | 4.5 | % | | 30.5 | % | | (19.9) | % | |
| Combined U.S. | |
| Combined U.S. | |
| International | International | | |
| International | |
| International | |
| Outback Steakhouse - Brazil (3) | |
| Outback Steakhouse - Brazil (3) | |
| Outback Steakhouse - Brazil (3) | Outback Steakhouse - Brazil (3) | (12.0) | % | | 28.7 | % | | (31.4) | % | |
| | Traffic: | Traffic: | | |
| | Traffic: | |
| | Traffic: | |
| U.S. | |
| U.S. | |
| U.S. | U.S. | | |
| Outback Steakhouse | Outback Steakhouse | (2.6) | % | | 18.1 | % | | (17.6) | % | |
| Outback Steakhouse | |
| Outback Steakhouse | |
| Carrabba’s Italian Grill | |
| Carrabba’s Italian Grill | |
| Carrabba’s Italian Grill | Carrabba’s Italian Grill | 6.4 | % | | 24.6 | % | | (14.6) | % | |
| Bonefish Grill | Bonefish Grill | (2.0) | % | | 24.3 | % | | (20.0) | % | |
| Bonefish Grill | |
| Bonefish Grill | |
| Fleming’s Prime Steakhouse & Wine Bar | |
| Fleming’s Prime Steakhouse & Wine Bar | |
| Fleming’s Prime Steakhouse & Wine Bar | Fleming’s Prime Steakhouse & Wine Bar | 3.8 | % | | 41.7 | % | | (26.7) | % | |
| Combined U.S. | Combined U.S. | (0.6) | % | | 20.7 | % | | (17.6) | % | |
| Combined U.S. | |
| Combined U.S. | |
| International | International | | |
| Outback Steakhouse - Brazil | (3.6) | % | | 23.5 | % | | (21.5) | % | |
| International | |
| International | |
| Outback Steakhouse - Brazil (3) | |
| Outback Steakhouse - Brazil (3) | |
| Outback Steakhouse - Brazil (3) | |
| | Average check per person (4): | |
| | Average check per person (4): | |
| | Average check per person (4): | Average check per person (4): | | | | |
| U.S. | U.S. | | |
| U.S. | |
| U.S. | |
| Outback Steakhouse | |
| Outback Steakhouse | |
| Outback Steakhouse | Outback Steakhouse | 5.8 | % | | 6.1 | % | | 0.7 | % | |
| Carrabba’s Italian Grill | Carrabba’s Italian Grill | 4.1 | % | | 7.6 | % | | (1.8) | % | |
| Carrabba’s Italian Grill | |
| Carrabba’s Italian Grill | |
| Bonefish Grill | |
| Bonefish Grill | |
| Bonefish Grill | Bonefish Grill | 0.3 | % | | 16.3 | % | | (10.1) | % | |
| Fleming’s Prime Steakhouse & Wine Bar | Fleming’s Prime Steakhouse & Wine Bar | 9.6 | % | | 19.2 | % | | (2.8) | % | |
| Fleming’s Prime Steakhouse & Wine Bar | |
| Fleming’s Prime Steakhouse & Wine Bar | |
| Combined U.S. | |
| Combined U.S. | |
| Combined U.S. | Combined U.S. | 5.1 | % | | 9.8 | % | | (2.3) | % | |
| International | International | | |
| Outback Steakhouse - Brazil | (8.2) | % | | 5.6 | % | | (9.9) | % | |
| International | |
| International | |
| Outback Steakhouse - Brazil (3) | |
| Outback Steakhouse - Brazil (3) | |
| Outback Steakhouse - Brazil (3) | |
____________________
(1)RepresentsFor 2023, comparable restaurant sales, traffic and average check per person increases (decreases) relative to fiscal year 2019 for improved comparability duecompare the 53 weeks from December 26, 2022 through December 31, 2023 to the impact of COVID-19 on fiscal year 2020 restaurant sales.53 weeks from December 27, 2021 through January 1, 2023.
(2)Relocated restaurants closed more than 60 days are excluded from comparable restaurant sales until at least 18 months after reopening.
(3)Excludes the effect of fluctuations in foreign currency rates.rates and the benefit of the Brazil value added tax exemptions discussed in Note 20 - Income Taxes of the Notes to Consolidated Financial Statements. Includes trading day impact from calendar period reporting.
(4)Average check per person includesIncludes the impact of menu pricing changes, product mix and discounts.
BLOOMIN’ BRANDS, INC.
MANAGEMENT’S DISCUSSION AND ANALYSIS OF
FINANCIAL CONDITION AND RESULTS OF OPERATIONS - Continued
Franchise and other revenues
| | | | | | | | | | | | | |
| FISCAL YEAR |
| (dollars in millions) | 2021 | | 2020 | | |
| Franchise revenues (1) | $ | 45.5 | | | $ | 21.2 | | | |
| Other revenues (2) | 15.8 | | | 4.7 | | | |
| Franchise and other revenues | $ | 61.3 | | | $ | 25.9 | | | |
____________________
(1)Represents franchise royalties, advertising fees and initial franchise fees. Franchise revenues increased during 2021 primarily due to higher franchise sales as a result of the impact of COVID-19 on 2020 franchise sales.
(2)Includes a $3.1 million benefit in 2021 from the recognition of recoverable Program of Social Integration (“PIS”) and Contribution for the Financing of Social Security (“COFINS”) taxes in connection with favorable court rulings in Brazil regarding the calculation methodology and taxable base. The amount recognized as a result of the favorable court rulings primarily represents refundable PIS and COFINS taxes for prior years, including accrued interest, and will be recovered by offsetting future PIS and COFINS taxes due.
Franchisee Deferred Payment Agreement - On December 27, 2020, we entered into the Resolution Agreement with Out West, who currently franchises approximately 80 Outback Steakhouse restaurants in the western United States, primarily in California. Under the terms of the Resolution Agreement, we agreed to permanently waive all past due royalties and advertising fees for the period of February 24, 2020 to July 26, 2020 and defer, among other items, all past due royalties and advertising fees for the period of July 27, 2020 to November 22, 2020 due to the significant impact of the COVID-19 pandemic on Out West’s business. See Note 4 - Revenue Recognition of the Notes to Consolidated Financial Statements for further details regarding the Resolution Agreement.
During 2021, Out West franchise revenues recovered, approaching historical levels. Following is a summary of franchise and other revenues and comparable restaurant sales for Out West franchised locations for the periods indicated:
| | | | | | | | | | | | | |
| FISCAL YEAR |
| (dollars in millions) | 2021 | | 2020 | | |
| Franchise revenues | $ | 22.4 | | | $ | 4.4 | | | |
| Other revenues | 5.3 | | | 1.0 | | | |
| Franchise and other revenues (1) | $ | 27.7 | | | $ | 5.4 | | | |
| | | | | |
| Out West comparable restaurant sales (stores open 18 months or more) | 50.7 | % | | (32.9) | % | | |
____________________
(1)Franchise and other revenues during 2020 were significantly impacted by the COVID-19 pandemic. During 2021, we collected Out West monthly royalty and advertising fees, and $5.1 million of past due amounts deferred under the Resolution Agreement.
COSTS AND EXPENSES
Food and beverage costsThe following table sets forth the percentages of certain items in our Consolidated Statements of Operations in relation to Restaurant sales or Total revenues for the periods indicated:
| | | | | | | | | | | | | | | | | | | | | | | |
| FISCAL YEAR | | | | | | |
| (dollars in millions) | 2021 | | 2020 | | CHANGE | | | | | | |
| Food and beverage costs | $ | 1,229.7 | | | $ | 982.7 | | | | | | | | | |
| % of Restaurant sales | 30.3 | % | | 31.3 | % | | (1.0) | % | | | | | | |
| | | | | | | | | | | |
| | | | | | | | | | | |
| | | | | | | | | | | |
| | | | | | | | | | | |
| | | | | | | | | | | |
| | | | | | | | | | | | | |
| FISCAL YEAR |
| 2023 | | 2022 | | |
| Revenues | | | | | |
| Restaurant sales | 98.6 | % | | 98.6 | % | | |
| Franchise and other revenues | 1.4 | | | 1.4 | | | |
| Total revenues | 100.0 | | | 100.0 | | | |
| Costs and expenses | | | | | |
| Food and beverage (1) | 30.6 | | | 31.8 | | | |
| Labor and other related (1) | 28.8 | | | 28.2 | | | |
| Other restaurant operating (1) | 24.4 | | | 24.5 | | | |
| Depreciation and amortization | 4.1 | | | 3.8 | | | |
| General and administrative | 5.6 | | | 5.3 | | | |
| | | | | |
| | | | | |
| | | | | |
| Provision for impaired assets and restaurant closings | 0.7 | | | 0.1 | | | |
| | | | | |
| Total costs and expenses | 93.0 | | | 92.5 | | | |
| Income from operations | 7.0 | | | 7.5 | | | |
| Loss on extinguishment and modification of debt | — | | | (2.5) | | | |
| | | | | |
| Loss on fair value adjustment of derivatives, net | — | | | (0.4) | | | |
| | | | | |
| Interest expense, net | (1.2) | | | (1.2) | | | |
| Income before provision for income taxes | 5.8 | | | 3.4 | | | |
| Provision for income taxes | 0.4 | | | 0.9 | | | |
| Net income | 5.4 | | | 2.5 | | | |
| Less: net income attributable to noncontrolling interests | 0.1 | | | 0.2 | | | |
| Net income attributable to Bloomin’ Brands | 5.3 | % | | 2.3 | % | | |
____________________
(1)As a percentage of Restaurant sales.
Fiscal year 2023 as compared to fiscal year 2022
Food and beverage costscost decreased as a percentage of Restaurant sales in 2021 as compareddue to 2020 primarily due to: (i) 0.9%2.0% from increases in average check per person, primarily driven by reduced discounting and an increase in menu pricing, (ii) 0.4%and 0.6% from the impact of certain cost savingssaving and productivity initiatives, and (iii) 0.3% from inventory obsolescence and spoilage costs during 2020 associated with the COVID-19 pandemic. These decreases were partially offset by an increase of 1.3% from commodity inflation. See Item 7A. Quantitative and Qualitative Disclosures about Market Risk for discussion of our commodity inflation expectations for 2024.
Labor and other related expense increased as a percentage of Restaurant sales primarily due to 1.6% from higher hourly and field management labor costs, primarily due to wage rate inflation, partially offset by decreases of 0.6%0.9% from commodity inflation.an increase in average check per person and 0.2% from certain cost saving and productivity initiatives.
BLOOMIN’ BRANDS, INC.
MANAGEMENT’S DISCUSSION AND ANALYSIS OF
FINANCIAL CONDITION AND RESULTS OF OPERATIONS - Continued
In 2022, we anticipate approximately 11.0% to 13.0% commodity inflation, with approximately 70% of our estimated annual food purchases currently covered by fixed contracts and the remainder subject to floating market prices.
Labor and other related expenses
| | | | | | | | | | | | | | | | | | | | | | | |
| FISCAL YEAR | | | | | | |
| (dollars in millions) | 2021 | | 2020 | | CHANGE | | | | | | |
| Labor and other related | $ | 1,154.6 | | | $ | 1,005.3 | | | | | | | | | |
| % of Restaurant sales | 28.4 | % | | 32.0 | % | | (3.6) | % | | | | | | |
| | | | | | | | | | | |
| | | | | | | | | | | |
| | | | | | | | | | | |
| | | | | | | | | | | |
| | | | | | | | | | | |
Labor and other related expenses include all direct and indirect labor costs incurred in operations, including distribution expense to Restaurant Managing Partners and other field incentive compensation expenses. Labor and other related expenses decreased as a percentage of Restaurant sales in 2021 as compared to 2020 primarily due to 4.1%to: (i) 0.7% from leveraging increased restaurant salesan increase in average check per person, (ii) 0.3% from certain cost saving and 0.8%productivity initiatives and (iii) 0.2% from the 2020 impactfavorable settlement of net relief pay.certain collective action wage and hour lawsuits. These decreases were partially offset by increases as a percentage of Restaurant sales of 0.8%0.9% from wage rate increaseshigher operating expenses, including utilities, primarily due to inflation, and 0.4% from higher management bonus.
In 2022, we anticipate high-single digit labor cost inflation.
Other restaurant operating expenses
| | | | | | | | | | | | | | | | | | | | | | | |
| FISCAL YEAR | | | | | | |
| (dollars in millions) | 2021 | | 2020 | | CHANGE | | | | | | |
| Other restaurant operating | $ | 1,006.4 | | | $ | 846.6 | | | | | | | | | |
| % of Restaurant sales | 24.8 | % | | 26.9 | % | | (2.1) | % | | | | | | |
| | | | | | | | | | | |
| | | | | | | | | | | |
| | | | | | | | | | | |
| | | | | | | | | | | |
| | | | | | | | | | | |
In August 2021, we entered into the Royalty Termination Agreement with the Carrabba’s Founders for $61.9 million in cash. See Note 22 -Depreciation and amortization expense Commitmentsincreased primarily due to technology projects and Contingencies for additional details. We recorded Carrabba’s Italian Grill royalty expense of $3.0 million and $3.8 million during fiscal years 2021 and 2020, respectively.restaurant development.
Other restaurant operating expenses include certain unit-level operating costs such as operating supplies, rent, repairs and maintenance, advertising expenses, utilities, pre-opening costs and other occupancy costs. A substantial portion of these expenses is fixed or indirectly variable. Other restaurant operating expenses decreased as a percentage of Restaurant sales in 2021 as compared to 2020 primarily due to: (i) 3.2% from leveraging increased restaurant sales, (ii) 1.0% from lower advertising expense and (iii) 0.3% from a decrease in off-premises related costs. These decreases were partially offset by increases as a percentage of Restaurant sales of 1.5% from the Carrabba’s Italian Grill royalty termination payment and 0.8% from higher utilities, operating and rent expense.
Depreciation and amortization
| | | | | | | | | | | | | | | | | | | | | | | |
| FISCAL YEAR | | | | | | |
| (dollars in millions) | 2021 | | 2020 | | CHANGE | | | | | | |
| Depreciation and amortization | $ | 163.4 | | | $ | 180.3 | | | $ | (16.9) | | | | | | | |
| | | | | | | | | | | |
Depreciation and amortization decreased in 2021 as compared to 2020 primarily due to a decreased level of capital expenditures since 2018, as compared to historical levels, and asset impairments during 2020.
BLOOMIN’ BRANDS, INC.
MANAGEMENT’S DISCUSSION AND ANALYSIS OF
FINANCIAL CONDITION AND RESULTS OF OPERATIONS - Continued
General and administrative
General and administrative expense includes salaries and benefits, management incentive programs, related payroll tax and benefits, other employee-related costs and professional services. Following is a summary of the change in General and administrative expense for the period indicated:
| | | | | | | |
| FISCAL YEAR |
(dollars in millions) | 2021 | | |
For fiscal year 2020 | $ | 254.4 | | | |
Change from: | | | |
| | | |
Transformational costs | (12.7) | | | |
Severance | (7.0) | | | |
Expected credit losses and contingent lease liabilities | (6.9) | | | |
Travel and entertainment | (2.3) | | | |
| | | |
Employee stock-based compensation | 9.7 | | | |
| | | |
Incentive compensation | 7.6 | | | |
| | | |
| | | |
Other | 2.8 | | | |
| | | |
For fiscal year 2021 | $ | 245.6 | | | |
| | | |
| | | |
| | | |
Provision for impaired assets and restaurant closings
| | | | | | | | | | | | | | | | | | | | | | | |
| FISCAL YEAR | | | | | | |
| (dollars in millions) | 2021 | | 2020 | | CHANGE | | | | | | |
| Provision for impaired assets and restaurant closings | $ | 13.7 | | | $ | 76.4 | | | $ | (62.7) | | | | | | | |
During 2020, we recognized asset impairment and closure charges of $66.5 million and $3.6 million within the U.S. and international segments, respectively, primarily related to the COVID-19 pandemic. COVID-19-related pre-tax asset impairments and closure costs include $23.8 million in connection with the closure of 22 U.S. restaurants and from the update of certain cash flow assumptions, including lease renewal considerations. During 2020, we also recognized asset impairment charges related to transformational initiatives of $6.3 million, which were not allocated to our operating segments. See Note 5 - Impairments, Exit Costs and Disposals of the Notes to Consolidated Financial Statements for further information.
The impairment and closure charges during 2021 resulted primarily from locations identified for closure or relocation.
Income (loss) from operations
| | | | | | | | | | | | | | | | | | | | | | | |
| FISCAL YEAR | | | | | | |
| (dollars in millions) | 2021 | | 2020 | | CHANGE | | | | | | |
| Income (loss) from operations | $ | 309.0 | | | $ | (175.0) | | | | | | | | | |
| % of Total revenues | 7.5 | % | | (5.5) | % | | 13.0 | % | | | | | | |
| | | | | | | | | | | |
| | | | | | | | | | | |
| | | | | | | | | | | |
| | | | | | | | | | | |
| | | | | | | | | | | |
Income from operations during 2021 as compared to Loss from operations during 2020 was primarily due to: (i) higher comparable restaurant sales and franchise revenues, (ii) COVID-19 pandemic related charges and the impact of transformational and restructuring initiatives during 2020, (iii) lower advertising expense, (iv) the 2020 impact of net relief pay, (v) lower depreciation and amortization expense and (vi) the impact of certain cost savings initiatives. These increases were partially offset by: (i) the Carrabba’s Italian Grill royalty termination payment, (ii) higher labor costs and commodity inflation, (iii) an increase in incentive compensation and management bonus and (iv) higher utilities and operating expense.
BLOOMIN’ BRANDS, INC.
MANAGEMENT’S DISCUSSION AND ANALYSIS OF
FINANCIAL CONDITION AND RESULTS OF OPERATIONS - Continued
InterestGeneral and administrative expense net
| | | | | | | | | | | | | | | | | | | | | | | |
| FISCAL YEAR | | | | | | |
| (dollars in millions) | 2021 | | 2020 | | CHANGE | | | | | | |
| Interest expense, net | $ | 57.6 | | | $ | 64.4 | | | $ | (6.8) | | | | | | | |
| | | | | | | | | | | |
| | | | | | | | | | | |
| | | | | | | | | | | |
| | | | | | | | | | | |
| | | | | | | | | | | |
The decrease in Interest expense, net during 2021 as compared to 2020 was increased primarily due to: (i) lower revolverlegal and term loan borrowings,professional fees, (ii) compensation and related expenses, (iii) travel expenses and (iv) incentive compensation, partially offset by a decrease in employee stock-based compensation.
Provision for impaired assets and restaurant closings increased primarily due to asset impairment and closure charges during the fourteen weeks ended December 31, 2023 of $33.3 million and $0.9 million within the U.S. and international segments, respectively, in connection with the closure of three U.S. and two international Aussie Grill restaurants and the decision to close 36 predominantly older, underperforming U.S. restaurants (the “2023 Closure Initiative”). See Note 4 - Impairments and Exit Costs for additional details regarding the 2023 Closure Initiative. We expect to incur an additional $8 million to $11 million of severance and closure costs in connection with the 2023 Closure Initiative during the thirteen weeks ended March 31, 2024.
Income from operations during 2023 includes a net operating margin increase of approximately 0.2% attributable to Brazil value added tax exemptions (PIS and COFINS) provided by Brazil tax legislation. See Note 20 - Income Taxes of the Notes to Consolidated Financial Statements for further discussion regarding Brazil tax legislation.
Loss on extinguishment and modification of debt and Loss on fair value adjustment of derivatives, net during 2022 were in connection with the repurchase of $125.0 million of the outstanding convertible senior notes due in 2025 (the “2025 Notes”) (the “2025 Notes Partial Repurchase”), which is described in further detail within Note 13 - Convertible Senior Notes of the Notes to Consolidated Financial Statements.
Interest expense, net was flat primarily due to: (i) the lapping of terminated interest rate swap amortization during 2022, (ii) the discontinuance of debt discount amortization related to our 2025 Notes resulting from the modified retrospective adoption of a new accounting standard during 2021Partial Repurchase in May 2022 and (iii) lowerthe repayment of Term Loan A in April 2022. These decreases were offset by an increase in interest expense from higher balances and interest rates on our unhedged variable rate debt. These decreases were partially offset by increases in interest expense from our 2029 Notes issued in April 2021 and our 2025 Notes issued in May 2020.revolving credit facility.
Provision (benefit) for income taxes
| | | | | | | | | | | | | | | | | | | | | | | |
| FISCAL YEAR | | | | | | |
| (dollars in millions) | 2021 | | 2020 | | CHANGE | | | | | | |
| Income (loss) before provision (benefit) for income taxes | $ | 249.3 | | | $ | (239.5) | | | $ | 488.8 | | | | | | | |
| Provision (benefit) for income taxes | $ | 26.4 | | | $ | (80.7) | | | $ | 107.1 | | | | | | | |
| Effective income tax rate | 10.6 | % | | 33.7 | % | | (23.1) | % | | | | | | |
| | | | | | | | | | | |
| | | | | | | | | | | |
| | | | | | | | | | | |
| | | | | | | | | | | |
| | | | | | | | | | | |
The netincludes a decrease in the effective income tax rate in 2021 as compared to 2020 was primarily due to the benefitnon-deductible losses associated with the 2025 Notes Partial Repurchase recorded during 2022 and the 2023 benefits of FICABrazil tax credits on certain employees’ tips reducinglegislation, which includes a temporary reduction in the effectiveBrazilian income tax rate in 2021 as a result of pre-tax book income as comparedfrom 34% to increasing the effective income tax rate in 2020 as a result of pre-tax book loss.0%.
We have a blended federal and state statutory rate of approximately 26%. The effective income tax rate in 2023 was lower in 2021 and higher in 2020 than the blended federal and state statutory rate primarily due to the benefit of FICA tax credits on certain tipped wages and benefits of Brazil tax legislation, which includes a temporary reduction in the Brazilian income tax rate from 34% to 0%. The effective income tax rate in 2022 was higher than the blended federal and state statutory rate primarily due to the non-deductible losses associated with the 2025 Notes Partial Repurchase recorded during 2022, partially offset by the benefit of FICA tax credits on certain tipped wages.
In the U.S., a restaurant company employer may claim a credit against its federal income taxes for FICA taxes paid on certain employees’ tips.tipped wages (the “FICA tax credit”). The level of FICA tax credits is primarily driven by U.S. Restaurant sales and is not impacted by costs incurred that may reduce Income before provision for income taxes.
See Note 20 - Income Taxes of the Notes to Consolidated Financial Statements for further discussion regarding Brazil tax legislation.
Segments
We consider each of our restaurant concepts and international markets as operating segments, which reflects how we manage our business, review operating performance and allocate resources. Resources are allocated and performance is assessed by our Chief Executive Officer, whom we have determined to be our Chief Operating Decision Maker (“CODM”).Maker. We aggregate our operating segments into two reportable segments, U.S. and international. The
BLOOMIN’ BRANDS, INC.
MANAGEMENT’S DISCUSSION AND ANALYSIS OF
FINANCIAL CONDITION AND RESULTS OF OPERATIONS - Continued
U.S. segment includes all restaurants operating in the U.S. while restaurants operating outside the U.S. are included in the international segment.
Revenues for both segments include only transactions with customers and exclude intersegment revenues. Excluded from Income (loss) from operations for U.S. and international are certain legal and corporate costs not directly related to the performance of the segments, most stock-based compensation expenses, a portion of insurance expenses and certain bonus expenses.
During 2020, we recorded $32.4 million of pre-tax charges as a part of transformational initiatives. These costs were primarily recorded within General and administrative expense and Provision for impaired assets and restaurant closings and were not allocated to our segments since our CODM does not consider the impact of transformational initiatives when assessing segment performance.
Refer to Note 2322 - Segment Reporting of the Notes to Consolidated Financial Statements for reconciliations of segment income (loss) from operations to the consolidated operating results.
BLOOMIN’ BRANDS, INC.
MANAGEMENT’S DISCUSSION AND ANALYSIS OF
FINANCIAL CONDITION AND RESULTS OF OPERATIONS - Continued
U.S. Segment
| | FISCAL YEAR |
| U.S. | |
| U.S. | |
| U.S. | |
| FISCAL YEAR | |
| FISCAL YEAR | |
| FISCAL YEAR | |
| (dollars in thousands) | |
| (dollars in thousands) | |
| (dollars in thousands) | (dollars in thousands) | 2021 | | 2020 | |
| Revenues | Revenues | | | | |
| Revenues | |
| Revenues | |
| Restaurant sales | |
| Restaurant sales | |
| Restaurant sales | Restaurant sales | $ | 3,714,848 | | | $ | 2,869,547 | | |
| Franchise and other revenues | Franchise and other revenues | 45,133 | | | 15,995 | | |
| Franchise and other revenues | |
| Franchise and other revenues | |
| Total revenues | |
| Total revenues | |
| Total revenues | Total revenues | $ | 3,759,981 | | | $ | 2,885,542 | | |
| | Restaurant-level operating margin | 17.1 | % | | 9.8 | % | |
| Income (loss) from operations | $ | 443,887 | | | $ | (1,630) | | |
| Operating income (loss) margin | 11.8 | % | | (0.1) | % | |
| Income from operations | |
| | | Income from operations | |
| | Income from operations | |
| Operating income margin | |
| Operating income margin | |
| Operating income margin | |
| Restaurant-level operating income | |
| Restaurant-level operating income | |
| Restaurant-level operating income | |
| Restaurant-level operating margin | |
| Restaurant-level operating margin | |
| Restaurant-level operating margin | |
|
Restaurant sales
-
Following is a summary of the change in U.S. segment Restaurant sales for the period indicated:
| | | | | | | |
| FISCAL YEAR |
(dollars in millions) | 2021 | | |
For fiscal year 2020 | $ | 2,869.5 | | | |
Change from: | | | |
Comparable restaurant sales (1) | 854.9 | | | |
Restaurant openings (1) | 25.2 | | | |
| | | |
Restaurant closures | (34.7) | | | |
For fiscal year 2021 | $ | 3,714.9 | | | |
| | | |
| | | |
| | | |
| | | | | | | | | | | | | | | | |
| U.S. | | INTERNATIONAL | | |
| FISCAL YEAR | | | FISCAL YEAR | | |
| (dollars in millions) | 2023 | | (dollars in millions) | 2023 | | |
| For fiscal year 2022 | $ | 3,863.0 | | | For fiscal year 2022 | $ | 489.7 | | | |
| Change from: | | | Change from: | | | |
| Comparable restaurant sales | 63.1 | | | Restaurant openings (1) | 37.7 | | | |
| Restaurant openings (1) | 27.2 | | | Effect of foreign currency translation | 34.3 | | | |
| | | | | | |
| Restaurant closures (2) | (31.0) | | | Brazil value added tax exemptions (3) | 22.5 | | | |
| For fiscal year 2023 (comparable 52-week presentation) (4) | 3,922.3 | | | Comparable restaurant sales | 18.7 | | | |
| 53rd week restaurant sales (5) | 82.7 | | | Restaurant closures (2) | (0.5) | | | |
| For fiscal year 2023 (as reported) | $ | 4,005.0 | | | For fiscal year 2023 | $ | 602.4 | | | |
| | | | | | |
| | | | | | |
| | | | | | |
____________________
(1)Summation of quarterly changes for restaurant openings and comparable restaurant sales will not total to annual amounts as the restaurants that meet the definition of a comparable restaurant will differ each period based on when the restaurant opened.
The increase in U.S. Restaurant sales in 2021 as compared to 2020 was primarily due to: (i) higher comparableIncludes restaurant sales from recovery of in-restaurant dining from the significantly reduced levels in 2020 after the onset of the pandemic19 and strong retention of off-premises sales47 new U.S. and (ii) the opening of 15 newinternational restaurants, respectively, not included in our comparable restaurant sales base. These increases were partially offset by
(2)Includes the restaurant sales impact from the closure of 4532 and three U.S. and international restaurants, respectively, since December 29, 2019.26, 2021.
Income (loss) from operations
U.S. Income from operations generated during 2021 as compared to Loss from operations during 2020 was primarily due to: (i) higher comparableIncludes $99.2 million of restaurant sales generated by restaurants closed, primarily in February 2024, in connection with the 2023 Closure Initiative. See Note 4 - Impairments and franchise revenues, (ii) COVID-19 pandemic related charges during 2020, (iii)Exit Costs of the 2020 impact of net relief pay, (iv) lower advertising expense, (v) lower delivery-related costs and (vi)Notes to Consolidated Financial Statements for additional details regarding the impact of certain cost savings initiatives. These increases were partially offset by: (i) the Carrabba’s Italian Grill royalty termination payment, (ii) higher labor costs and commodity inflation, (iii) higher utilities and operating expense and (iv) higher management bonus.2023 Closure Initiative.
BLOOMIN’ BRANDS, INC.
MANAGEMENT’S DISCUSSION AND ANALYSIS OF
FINANCIAL CONDITION AND RESULTS OF OPERATIONS - Continued
International Segment
| | | | | | | | | | | | | |
| FISCAL YEAR |
| (dollars in thousands) | 2021 | | 2020 | | |
| Revenues | | | | | |
| Restaurant sales | $ | 346,245 | | | $ | 275,089 | | | |
| Franchise and other revenues | 16,159 | | | 9,930 | | | |
| Total revenues | $ | 362,404 | | | $ | 285,019 | | | |
| | | | | |
| | | | | |
| | | | | |
| | | | | |
| | | | | |
| | | | | |
| | | | | |
| | | | | |
| Restaurant-level operating margin | 12.7 | % | | 8.3 | % | | |
| Income (loss) from operations | $ | 16,657 | | | $ | (13,479) | | | |
| Operating income (loss) margin | 4.6 | % | | (4.7) | % | | |
| | | | | |
| | | | | |
| | | | | |
Restaurant sales
Following is a summary of the change- The decrease in international segment Restaurant sales for the period indicated:
| | | | | | | |
| FISCAL YEAR |
(dollars in millions) | 2021 | | |
For fiscal year 2020 | $ | 275.1 | | | |
Change from: | | | |
Comparable restaurant sales (1) | 57.8 | | | |
Restaurant openings (1) | 29.2 | | | |
Effect of foreign currency translation | (15.3) | | | |
Restaurant closures | (0.6) | | | |
| | | |
For fiscal year 2021 | $ | 346.2 | | | |
| | | |
| | | |
| | | |
____________________
(1)Summation of quarterly changes for restaurant openings and comparable restaurant sales will not total to annual amounts as the restaurants that meet the definition of a comparable restaurant will differ each period based on when the restaurant opened.
The increase in international Restaurant sales in 2021U.S. Income from operations generated during 2023 as compared to 20202022 was primarily due to: (i) higher comparablelabor costs, primarily due to wage rate inflation, (ii) commodity inflation, (iii) higher operating expenses, including utilities, primarily due to inflation, (iv) higher impairment charges and restaurant closure costs and (v) higher depreciation and advertising expense. These decreases were partially offset by an increase in average check per person and certain cost saving and productivity initiatives.
International - The increase in international Income from operations generated during 2023 as compared to 2022 was primarily due to value added tax exemptions in Brazil and an increase in restaurant sales, principally attributable toprimarily driven by an increase in average check per person and the impactrecovery of the COVID-19 pandemic on fiscal year 2020 international Restaurant sales and (ii) the opening of 33 new restaurants not included in our comparable restaurant sales base.in-restaurant dining. These increases were partially offset by the effect of foreign currency translation of the Brazil Real relative to the U.S. dollar.
Income (loss) from operations
International Income from operations generated during 2021 as compared to Loss from operations during 2020 wasdecreases primarily due to higher restaurant salesoperating and labor costs, primarily due to the reopening of restaurant dining rooms and increases in average check per person. These increases were partially offset by: (i) additional utilities, rent and operating expense, (ii) commodity inflation, and (iii) higher labor costs.advertising expense.
Non-GAAP Financial Measures
In addition to the results provided in accordance with generally accepted accounting principles (“U.S. GAAP,GAAP”), we provide certain non-GAAP measures, which present operating results on an adjusted basis. These are supplemental measures of performance that are not required by or presented in accordance with U.S. GAAP and include the following: (i) system-wide sales,Restaurant-level operating income, adjusted restaurant-level operating income and their corresponding margins, (ii) Adjusted restaurant-level operating margins, (iii) Adjusted income (loss) from operations and the corresponding margins, (iv)margin, (iii) Adjusted net income, (loss) and (v)(iv) Adjusted diluted earnings (loss) per share.share and (v) system-wide sales.
BLOOMIN’ BRANDS, INC.
MANAGEMENT’S DISCUSSION AND ANALYSIS OF
FINANCIAL CONDITION AND RESULTS OF OPERATIONS - Continued
We believe that our use of non-GAAP financial measures permits investors to assess the operating performance of our business relative to our performance based on U.S. GAAP results and relative to other companies within the restaurant industry by isolating the effects of certain items that may vary from period to period without correlation to core operating performance or that vary widely among similar companies. However, our inclusion of these adjusted measures should not be construed as an indication that our future results will be unaffected by unusual or infrequent items or that the items for which we have made adjustments are unusual or infrequent or will not recur. We believe that the disclosure of these non-GAAP measures is useful to investors as they form part of the basis for how our management team and our Board evaluate our operating performance, allocate resources and establish employee incentive plans.
These non-GAAP financial measures are not intended to replace U.S. GAAP financial measures, and they are not necessarily standardized or comparable to similarly titled measures used by other companies. We maintain internal guidelines with respect to the types of adjustments we include in our non-GAAP measures. These guidelines endeavor to differentiate between types of gains and expenses that are reflective of our core operations in a period, and those that may vary from period to period without correlation to our core performance in that period. However, implementation of these guidelines necessarily involves the application of judgment, and the treatment of any items not directly addressed by, or changes to, our guidelines will be considered by our disclosure committee. Refer to the reconciliations of non-GAAP measures for descriptions of the actual adjustments made in the current period and the corresponding prior period.
BLOOMIN’ BRANDS, INC.
MANAGEMENT’S DISCUSSION AND ANALYSIS OF
FINANCIAL CONDITION AND RESULTS OF OPERATIONS - Continued
Consolidated Restaurant-level Operating Income and Adjusted Restaurant-level Operating Income and Corresponding Margins Non-GAAP Reconciliations - Restaurant-level operating margin is calculated as Restaurant sales after deduction of the main restaurant-level operating costs, which includes Food and beverage cost, Labor and other related expense and Other restaurant operating expense. Adjusted restaurant-level operating margin is Restaurant-level operating margin adjusted for certain items. The following table reconciles consolidated Income from operations and the corresponding margin to restaurant-level operating income and adjusted restaurant-level operating income and the corresponding margins for the periods indicated:
| | | | | | | | | | | |
| Consolidated | FISCAL YEAR |
| (dollars in thousands) | 2023 | | 2022 |
| Income from operations | $ | 325,144 | | | $ | 330,421 | |
| Operating income margin | 7.0 | % | | 7.5 | % |
| Less: | | | |
| Franchise and other revenues | 64,062 | | | 63,813 | |
| Plus: | | | |
| Depreciation and amortization | 191,171 | | | 169,617 | |
| General and administrative | 260,470 | | | 234,752 | |
| Provision for impaired assets and restaurant closings | 33,574 | | | 5,964 | |
| Restaurant-level operating income | $ | 746,297 | | | $ | 676,941 | |
| Restaurant-level operating margin | 16.2 | % | | 15.6 | % |
| Adjustments: | | | |
| | | |
| Legal and other matters (1) | (3,650) | | | 5,900 | |
| Asset impairments and closing costs (2) | (2,450) | | | — | |
| Partner compensation (3) | 1,894 | | | — | |
| Total restaurant-level operating income adjustments | (4,206) | | | 5,900 | |
| Adjusted restaurant-level operating income | $ | 742,091 | | | $ | 682,841 | |
| Adjusted restaurant-level operating margin | 16.1 | % | | 15.7 | % |
_________________(1)Reflects changes in legal reserves in connection with certain collective action wage and hour lawsuits.
(2)Lease remeasurement gains in connection with the 2023 Closure Initiative. See Note 4 - Impairments and Exit Costs of the Notes to Consolidated Financial Statements for additional details regarding the 2023 Closure Initiative.
(3)Costs incurred in connection with the transition to a new partner compensation program.
BLOOMIN’ BRANDS, INC.
MANAGEMENT’S DISCUSSION AND ANALYSIS OF
FINANCIAL CONDITION AND RESULTS OF OPERATIONS - Continued
Segment Restaurant-level and Adjusted Restaurant-level Operating Income and Corresponding Margins Non-GAAP Reconciliations - The following tables reconcile segment Income from operations and the corresponding margin to segment restaurant-level operating income and adjusted restaurant-level operating income and the corresponding margins for the periods indicated:
| | | | | | | | | | | |
| U.S. | FISCAL YEAR |
| (dollars in thousands) | 2023 | | 2022 |
| Income from operations | $ | 377,534 | | | $ | 407,860 | |
| Operating income margin | 9.3 | % | | 10.4 | % |
| Less: | | | |
| Franchise and other revenues | 48,546 | | | 48,854 | |
| Plus: | | | |
| Depreciation and amortization | 157,878 | | | 139,170 | |
| General and administrative | 98,899 | | | 93,401 | |
| Provision for impaired assets and restaurant closings | 32,669 | | | 4,420 | |
| Restaurant-level operating income | $ | 618,434 | | | $ | 595,997 | |
| Restaurant-level operating margin | 15.4 | % | | 15.4 | % |
| Adjustments: | | | |
| Asset impairments and closing costs (1) | (2,450) | | | — | |
| Partner compensation (2) | 1,894 | | | — | |
| | | |
| | | |
| Total restaurant-level operating income adjustments | (556) | | | — | |
| Adjusted restaurant-level operating income | $ | 617,878 | | | $ | 595,997 | |
| Adjusted restaurant-level operating margin | 15.4 | % | | 15.4 | % |
_________________(1)Lease remeasurement gains in connection with the 2023 Closure Initiative.
(2)Costs incurred in connection with the transition to a new partner compensation program.
| | | | | | | | | | | |
| International | FISCAL YEAR |
| (dollars in thousands) | 2023 | | 2022 |
| Income from operations | $ | 83,948 | | | $ | 57,333 | |
| Operating income margin | 13.6 | % | | 11.4 | % |
| Less: | | | |
| Franchise and other revenues | 15,516 | | | 14,959 | |
| Plus: | | | |
| Depreciation and amortization | 25,430 | | | 23,397 | |
| General and administrative | 28,816 | | | 23,355 | |
| Provision for impaired assets and restaurant closings | 905 | | | 1,537 | |
| Restaurant-level operating income | $ | 123,583 | | | $ | 90,663 | |
| Restaurant-level operating margin | 20.5 | % | | 18.5 | % |
| | | |
| | | |
| | | |
| Total restaurant-level operating income adjustments | — | | | — | |
| Adjusted restaurant-level operating income | $ | 123,583 | | | $ | 90,663 | |
| Adjusted restaurant-level operating margin | 20.5 | % | | 18.5 | % |
BLOOMIN’ BRANDS, INC.
MANAGEMENT’S DISCUSSION AND ANALYSIS OF
FINANCIAL CONDITION AND RESULTS OF OPERATIONS - Continued
Adjusted Restaurant-level Operating Margin Non-GAAP Reconciliations (continued) -The following table presents the percentages of certain operating cost financial statement line items in relation to Restaurant sales for the periods indicated:
| | | | | | | | | | | | | | | | | | | | | | | | | | | |
| FISCAL YEAR |
| 2023 | | 2022 | | |
| REPORTED | | ADJUSTED (1) | | REPORTED | | ADJUSTED (1) | | | | |
| Restaurant sales | 100.0 | % | | 100.0 | % | | 100.0 | % | | 100.0 | % | | | | |
| | | | | | | | | | | |
| Food and beverage | 30.6 | % | | 30.6 | % | | 31.8 | % | | 31.8 | % | | | | |
| Labor and other related | 28.8 | % | | 28.7 | % | | 28.2 | % | | 28.2 | % | | | | |
| Other restaurant operating | 24.4 | % | | 24.6 | % | | 24.5 | % | | 24.3 | % | | | | |
| | | | | | | | | | | |
| Restaurant-level operating margin | 16.2 | % | | 16.1 | % | | 15.6 | % | | 15.7 | % | | | | |
_________________
(1)See the Consolidated Restaurant-level Operating Income and Adjusted Restaurant-level Operating Income and Corresponding Margins Non-GAAP Reconciliations table above for details regarding restaurant-level operating margin adjustments. For 2023, restaurant-level operating margin adjustments of $1.9 million and ($6.1) million were recorded within Labor and other related expense and Other restaurant operating expense, respectively. For 2022, all restaurant-level operating margin adjustments were recorded within Other restaurant operating expense.
Adjusted Income from Operations Non-GAAP Reconciliations - The following table reconciles Income from operations and the corresponding margin to adjusted income from operations and the corresponding margin for the periods indicated:
| | | | | | | | | | | |
| FISCAL YEAR |
| (dollars in thousands) | 2023 | | 2022 |
| Income from operations | $ | 325,144 | | | $ | 330,421 | |
| Operating income margin | 7.0 | % | | 7.5 | % |
| Adjustments: | | | |
| Total restaurant-level operating income adjustments (1) | (4,206) | | | 5,900 | |
| Asset impairments and closing costs (2) | 28,236 | | | — | |
| Other (3) | 7,546 | | | — | |
| Total income from operations adjustments | 31,576 | | | 5,900 | |
| Adjusted income from operations | $ | 356,720 | | | $ | 336,321 | |
| Adjusted operating income margin | 7.6 | % | | 7.6 | % |
_________________
(1)See the Consolidated Restaurant-level Operating Income and Adjusted Restaurant-level Operating Income and Corresponding Margins Non-GAAP Reconciliations table above for details regarding restaurant-level operating income adjustments.
(2)Includes asset impairment, closure costs and severance in connection with the 2023 Closure Initiative. Also includes a lease termination gain, net of related asset impairment charges, of $6.7 million related to the closure of one restaurant.
(3)Primarily includes professional fees, severance and other costs not correlated to our core operating performance during the period.
BLOOMIN’ BRANDS, INC.
MANAGEMENT’S DISCUSSION AND ANALYSIS OF
FINANCIAL CONDITION AND RESULTS OF OPERATIONS - Continued
Adjusted Net Income and Adjusted Diluted Earnings Per Share Non-GAAP Reconciliations - The following table reconciles Net income attributable to Bloomin’ Brands to adjusted net income and adjusted diluted earnings per share for the periods indicated:
| | | | | | | | | | | |
| FISCAL YEAR |
| (in thousands, except per share data) | 2023 | | 2022 |
| | | |
| | | |
| Net income attributable to Bloomin’ Brands | $ | 247,386 | | | $ | 101,907 | |
| Adjustments: | | | |
| Income from operations adjustments (1) | 31,576 | | | 5,900 | |
| Loss on extinguishment and modification of debt (2) | — | | | 107,630 | |
| Loss on fair value adjustment of derivatives, net (2) | — | | | 17,685 | |
| Total adjustments, before income taxes | 31,576 | | | 131,215 | |
| Adjustment to provision for income taxes (3) | (10,801) | | | (263) | |
| Net adjustments | 20,775 | | | 130,952 | |
| Adjusted net income | $ | 268,161 | | | $ | 232,859 | |
| | | |
| Diluted earnings per share | $ | 2.56 | | | $ | 1.03 | |
| Adjusted diluted earnings per share (4) | $ | 2.93 | | | $ | 2.52 | |
| | | |
| Diluted weighted average common shares outstanding | 96,453 | | | 98,512 | |
| Adjusted diluted weighted average common shares outstanding (4) | 91,386 | | | 92,423 | |
_________________
(1)See the Adjusted Income from Operations Non-GAAP Reconciliations table above for details regarding Income from operations adjustments.
(2)Includes losses primarily in connection with the 2025 Notes Partial Repurchase, including settlements of the related convertible senior note hedges and warrants. See Note 13 - Convertible Senior Notes of the Notes to Consolidated Financial Statements for additional details.
(3)Includes the tax effects of non-GAAP adjustments determined based on the nature of the underlying non-GAAP adjustments and their relevant jurisdictional tax rates for all periods presented. For 2023, also includes a $2.9 million adjustment related to a Brazil federal income tax exemption on certain state value added tax benefits. For 2022, the primary difference between GAAP and adjusted effective income tax rates relates to certain non-deductible losses and other tax costs associated with the 2025 Notes Partial Repurchase.
(4)Adjusted diluted weighted average common shares outstanding was calculated excluding the dilutive effect of 5,067 and 6,089 shares for 2023 and 2022, respectively, to be issued upon conversion of the 2025 Notes to satisfy the amount in excess of the principal since our convertible note hedge offsets the dilutive impact of the shares underlying the 2025 Notes.
System-Wide Sales - System-wide sales is a non-GAAP financial measure that includes sales of all restaurants operating under our brand names, whether we own them or not. Management uses this information to make decisions about future plans for the development of additional restaurants and new concepts, as well as evaluation of current operations. System-wide sales comprise sales of Company-owned and franchised restaurants. For a summary of sales of Company-owned restaurants, refer to Note 43 - Revenue Recognition of the Notes to Consolidated Financial Statements.
The following table provides a summary of sales of franchised restaurants for the periods indicated, which are not included in our consolidated financial results. Franchise sales within this table do not represent our sales and are
BLOOMIN’ BRANDS, INC.
MANAGEMENT’S DISCUSSION AND ANALYSIS OF
FINANCIAL CONDITION AND RESULTS OF OPERATIONS - Continued
presented only as an indicator of changes in the restaurant system, which management believes is important information regarding the health of our restaurant concepts and in determining our royalties and/or service fees.
| | FISCAL YEAR |
| FISCAL YEAR | |
| FISCAL YEAR | |
| FISCAL YEAR | |
| (dollars in millions) | (dollars in millions) | 2021 | | 2020 | |
| U.S. | U.S. | | | | |
| U.S. | |
| U.S. | |
| Outback Steakhouse | |
| Outback Steakhouse | |
| Outback Steakhouse | Outback Steakhouse | $ | 445 | | | $ | 327 | | |
| Carrabba’s Italian Grill | Carrabba’s Italian Grill | 44 | | | 32 | | |
| Carrabba’s Italian Grill | |
| Carrabba’s Italian Grill | |
| Bonefish Grill | |
| Bonefish Grill | |
| Bonefish Grill | Bonefish Grill | 11 | | | 8 | | |
| U.S. total | U.S. total | 500 | | | 367 | | |
| U.S. total | |
| U.S. total | |
| International | |
| International | |
| International | International | | |
| Outback Steakhouse - South Korea | Outback Steakhouse - South Korea | 305 | | | 253 | | |
| Other | 112 | | | 66 | | |
| Outback Steakhouse - South Korea | |
| Outback Steakhouse - South Korea | |
| Other (1) | |
| Other (1) | |
| Other (1) | |
| International total | International total | 417 | | | 319 | | |
| Total franchise sales (1) | $ | 917 | | | $ | 686 | | |
| International total | |
| International total | |
| Total franchise sales | |
| Total franchise sales | |
| Total franchise sales | |
|
____________________
(1)Franchise sales are not included in Total revenues in the Consolidated Statements of Operations and Comprehensive Income (Loss).
BLOOMIN’ BRANDS, INC.
MANAGEMENT’S DISCUSSION AND ANALYSIS OF
FINANCIAL CONDITION AND RESULTS OF OPERATIONS - Continued
Restaurant-level operating margin - The following tables reconcile consolidated and segment Income (loss) from operations and the corresponding margins to Restaurant-level operating income and the corresponding margins for the periods indicated:
| | | | | | | | | | | |
| Consolidated | FISCAL YEAR |
| (dollars in thousands) | 2021 | | 2020 |
| | | |
| Income (loss) from operations | $ | 308,958 | | | $ | (174,973) | |
| Operating income (loss) margin | 7.5 | % | | (5.5) | % |
| Less: | | | |
| Franchise and other revenues | 61,292 | | | 25,925 | |
| Plus: | | | |
| Depreciation and amortization | 163,391 | | | 180,261 | |
| General and administrative | 245,616 | | | 254,356 | |
| Provision for impaired assets and restaurant closings | 13,737 | | | 76,354 | |
| Restaurant-level operating income | $ | 670,410 | | | $ | 310,073 | |
| Restaurant-level operating margin | 16.5 | % | | 9.9 | % |
| | | |
| U.S. | FISCAL YEAR |
| (dollars in thousands) | 2021 | | 2020 |
| | | |
| Income (loss) from operations | $ | 443,887 | | | $ | (1,630) | |
| Operating income (loss) margin | 11.8 | % | | (0.1) | % |
| Less: | | | |
| Franchise and other revenues | 45,133 | | | 15,995 | |
| Plus: | | | |
| Depreciation and amortization | 134,244 | | | 144,298 | |
| General and administrative | 89,314 | | | 88,536 | |
| Provision for impaired assets and restaurant closings | 12,368 | | | 66,487 | |
| Restaurant-level operating income | $ | 634,680 | | | $ | 281,696 | |
| Restaurant-level operating margin | 17.1 | % | | 9.8 | % |
| | | |
| International | FISCAL YEAR |
| (dollars in thousands) | 2021 | | 2020 |
| | | |
| Income (loss) from operations | $ | 16,657 | | | $ | (13,479) | |
| Operating income (loss) margin | 4.6 | % | | (4.7) | % |
| Less: | | | |
| Franchise and other revenues | 16,159 | | | 9,930 | |
| Plus: | | | |
| Depreciation and amortization | 22,650 | | | 23,722 | |
| General and administrative | 19,679 | | | 18,916 | |
| Provision for impaired assets and restaurant closings | 1,100 | | | 3,640 | |
| Restaurant-level operating income | $ | 43,927 | | | $ | 22,869 | |
| Restaurant-level operating margin | 12.7 | % | | 8.3 | % |
BLOOMIN’ BRANDS, INC.
MANAGEMENT’S DISCUSSION AND ANALYSIS OF
FINANCIAL CONDITION AND RESULTS OF OPERATIONS - Continued
Adjusted restaurant-level operating margin - Restaurant-level operating margin is calculated as Restaurant sales after deduction of the main restaurant-level operating costs, which includes Food and beverage costs, Labor and other related and Other restaurant operating expense. Adjusted restaurant-level operating margin is Restaurant-level operating margin adjusted for certain items, as noted below. The following table presents the percentages of certain operating cost financial statement line items in relation to RestaurantIncludes franchise sales for the periods indicated:off-premises only kitch
| | | | | | | | | | | | | | | | | | | | | | | | | | | |
| FISCAL YEAR |
| 2021 | | 2020 | | |
| U.S. GAAP | | ADJUSTED (1) | | U.S. GAAP | | ADJUSTED (1) | | | | |
| Restaurant sales | 100.0 | % | | 100.0 | % | | 100.0 | % | | 100.0 | % | | | | |
| | | | | | | | | | | |
| Food and beverage costs | 30.3 | % | | 30.3 | % | | 31.3 | % | | 30.9 | % | | | | |
| Labor and other related | 28.4 | % | | 28.4 | % | | 32.0 | % | | 32.0 | % | | | | |
| Other restaurant operating | 24.8 | % | | 23.2 | % | | 26.9 | % | | 26.9 | % | | | | |
| | | | | | | | | | | |
| Restaurant-level operating margin | 16.5 | % | | 18.1 | % | | 9.9 | % | | 10.2 | % | | | | |
_________________
(1)Includes (favorable) unfavorable adjustments recordedens in Other restaurant operating expense (unless otherwise noted below) for the following activities, as described in the Adjusted income (loss) from operations, Adjusted net income (loss) and Adjusted diluted earnings (loss) per share table below for the periods indicated:
| | | | | | | | | | | | | |
| FISCAL YEAR | | |
| (dollars in millions) | 2021 | | 2020 | | |
| Royalty termination expense | $ | (61.9) | | | $ | — | | | |
| Legal and other matters | (2.7) | | | — | | | |
| | | | | |
| COVID-19-related costs (i) | — | | | (14.3) | | | |
| Asset impairments and closing costs | — | | | 2.7 | | | |
| $ | (64.6) | | | $ | (11.6) | | | |
_________________
(i)Includes $11.0 million of adjustments recorded in Food and beverage costs.
BLOOMIN’ BRANDS, INC.
MANAGEMENT’S DISCUSSION AND ANALYSIS OF
FINANCIAL CONDITION AND RESULTS OF OPERATIONS - Continued
Adjusted income (loss) from operations, Adjusted net income (loss) and Adjusted diluted earnings (loss) per share - The following table reconciles Adjusted income (loss) from operations and the corresponding margins, Adjusted net income (loss) and Adjusted diluted earnings (loss) per share to their respective most comparable U.S. GAAP measures for the periods indicated:
| | | | | | | | | | | | | |
| FISCAL YEAR |
| (in thousands, except share and per share data) | 2021 | | 2020 | | |
| Income (loss) from operations | $ | 308,958 | | | $ | (174,973) | | | |
| Operating income (loss) margin | 7.5 | % | | (5.5) | % | | |
| Adjustments: | | | | | |
| Royalty termination expense (1) | 61,880 | | | — | | | |
| Severance and other transformational costs (2) | 2,764 | | | 32,404 | | | |
| Legal and other matters (3) | (372) | | | 178 | | | |
| COVID-19-related costs (4) | — | | | 93,811 | | | |
| | | | | |
| | | | | |
| Asset impairments and closure costs (5) | — | | | (2,205) | | | |
| | | | | |
| | | | | |
| | | | | |
| | | | | |
| Total income (loss) from operations adjustments | 64,272 | | | 124,188 | | | |
| Adjusted income (loss) from operations | $ | 373,230 | | | $ | (50,785) | | | |
| Adjusted operating income (loss) margin | 9.1 | % | | (1.6) | % | | |
| | | | | |
| Diluted net income (loss) attributable to common stockholders | $ | 215,900 | | | $ | (162,211) | | | |
| Convertible senior notes if-converted method interest adjustment, net of tax (6) | 345 | | | — | | | |
| Net income (loss) attributable to common stockholders | 215,555 | | | (162,211) | | | |
| Adjustments: | | | | | |
| Income (loss) from operations adjustments | 64,272 | | | 124,188 | | | |
| Loss on extinguishment and modification of debt | 2,073 | | | — | | | |
| Amortization of debt discount (7) | — | | | 6,275 | | | |
| | | | | |
| | | | | |
| | | | | |
| | | | | |
| | | | | |
| | | | | |
| Total adjustments, before income taxes | 66,345 | | | 130,463 | | | |
| Adjustment to provision for income taxes (8) | (21,222) | | | (32,526) | | | |
| Redemption of preferred stock in excess of carrying value (9) | — | | | 3,496 | | | |
| Net adjustments | 45,123 | | | 101,433 | | | |
| Adjusted net income (loss) | $ | 260,678 | | | $ | (60,778) | | | |
| | | | | |
| Diluted earnings (loss) per share attributable to common stockholders (10) | $ | 2.00 | | | $ | (1.85) | | | |
| Adjusted diluted earnings (loss) per share (11) | $ | 2.70 | | | $ | (0.69) | | | |
| | | | | |
| | | | | |
| Diluted weighted average common shares outstanding (10) | 107,803 | | | 87,468 | | | |
| Adjusted diluted weighted average common shares outstanding (11) | 96,426 | | | 87,468 | | | |
| | | | | |
| | | | | |
| | | | | |
| | | | | |
| | | | | |
| | | | | |
| | | | | |
| | | | | |
_________________
(1)Payment made to the Carrabba’s Founders in connection with the Royalty Termination Agreement. See Note 22 - Commitments and Contingencies of the Notes to Consolidated Financial Statements for additional details regarding the Royalty Termination Agreement.
(2)Severance, professional fees and other costs incurred as a result of transformational and restructuring activities.
(3)For 2021, includes: (i) a $3.1 million benefit from the recognition of recoverable PIS and COFINS taxes, including accrued interest, within other revenues as a result of favorable court rulings and (ii) an accrual of $2.7 million for Imposto sobre Serviços (“ISS”), a Brazilian municipal service tax, in connection with royalties from our Brazilian subsidiary over the past five years, including related penalties and interest, recorded within Other restaurant operating expense as a result of an unfavorable Brazilian Supreme Court ruling.
(4)Costs incurred in connection with the COVID-19 pandemic, primarily consisting of fixed asset and right-of-use asset impairments, restructuring charges, inventory obsolescence and spoilage, contingent lease liabilities and current expected credit losses. See Note 3 - 2020 COVID-19 Charges of the Notes to Consolidated Financial Statements for additional details regarding the impact of certain COVID-19 pandemic-related charges on our financial results.
BLOOMIN’ BRANDS, INC.
MANAGEMENT’S DISCUSSION AND ANALYSIS OF
FINANCIAL CONDITION AND RESULTS OF OPERATIONS - Continued
(5)Primarily includes a lease termination gain of $2.8 million.
(6)Adjustment for interest expense related to the 2025 Notes weighted for the portion of the period prior to our election under the 2025 Notes indenture to settle the principal portion of our 2025 Notes in cash. The calculation of adjusted diluted earnings per share excludes 2025 Notes interest adjustment.
(7)Amortization of debt discount related to the issuance of the 2025 Notes. See Note 14 - Convertible Senior Notes of the Notes to Consolidated Financial Statements for details.
(8)Income tax effect of the adjustments for the periods presented. Also includes a $4.2 million adjustment during 2021 for the reduction of certain unrecognized tax benefits related to tax positions taken during a prior period.
(9)Consideration paid in excess of the carrying value for the redemption of preferred stock of our Abbraccio concept.
(10)Due to the GAAP net loss, the effect of dilutive securities was excluded from the calculation of GAAP diluted loss per share for 2020.
(11)For fiscal year 2021, adjusted diluted weighted average common shares outstanding was calculated: (i) assuming our February 2021 election to settle the principal portion of the 2025 Notes in cash was in effect for the entire fiscal year and (ii) excluding the dilutive effect of 9,992 shares to be issued upon conversion of the 2025 Notes to satisfy the amount in excess of the principal since our convertible notes hedge offsets the dilutive impact of the shares underlying the 2025 Notes.South Korea.
Liquidity and Capital Resources
Cash and Cash Equivalents
As of December 26, 2021,31, 2023, we had $87.6$111.5 million in cash and cash equivalents, of which $26.6$36.3 million was held by foreign affiliates. The international jurisdictions in which we have significant cash do not have any known restrictions that would prohibit repatriation.
As of December 26, 2021,31, 2023, we had aggregate accumulatedundistributed foreign earnings of approximately $28.8 million. This amount consisted primarily of historical earnings from 2017 and prior$42.6 million that were previously taxed in the U.S. under the 2017 Tax Cuts and Jobs Act and post-2017 foreign earnings, which we may repatriatebe repatriated to the U.S. without additional material U.S. federal income tax.tax. These amounts are no longernot considered indefinitely reinvested in our foreign subsidiaries. See Note 21 - Income Taxes of the Notes to Consolidated Financial Statements for further information regarding our indefinite reinvestment assertion.
Borrowing Capacity and Debt Service
Credit Facilities - Following is a summary of our outstanding credit facilities as of the dates indicated and principal payments and debt issuance during the periods indicated:
| | | | | | | | | | | | | | | | | | | | | | | | | | | | | | | | | | | | | | | | | |
| SENIOR SECURED CREDIT FACILITY | | FORMER CREDIT FACILITY | | | | | | TOTAL CREDIT FACILITIES |
| TERM LOAN A | | REVOLVING FACILITY | | TERM LOAN A | | REVOLVING FACILITY | | 2025 NOTES | | 2029 NOTES | |
| (dollars in thousands) | | | | | | |
| Balance as of December 29, 2019 | $ | — | | | $ | — | | | $ | 450,000 | | | $ | 599,000 | | | $ | — | | | $ | — | | | $ | 1,049,000 | |
| 2020 new debt | — | | | — | | | — | | | 505,000 | | | 230,000 | | | — | | | 735,000 | |
| 2020 payments | — | | | — | | | (25,000) | | | (657,000) | | | — | | | — | | | (682,000) | |
| Balance as of December 27, 2020 | — | | | — | | | 425,000 | | | 447,000 | | | 230,000 | | | — | | | 1,102,000 | |
| 2021 new debt | 200,000 | | | 455,000 | | | — | | | 15,000 | | | — | | | 300,000 | | | 970,000 | |
| 2021 payments | (5,000) | | | (375,000) | | | (425,000) | | | (462,000) | | | — | | | — | | | (1,267,000) | |
| Balance as of December 26, 2021 (1) | $ | 195,000 | | | $ | 80,000 | | | $ | — | | | $ | — | | | $ | 230,000 | | | $ | 300,000 | | | $ | 805,000 | |
| | | | | | | | | | | | | |
| Interest rates, as of December 26, 2021 (2) | 1.60 | % | | 3.75 | % | | | | | | 5.00 | % | | 5.13 | % | | |
| Principal maturity date | April 2026 | | April 2026 | | | | | | May 2025 | | April 2029 | | |
| | | | | | | | | | | | | | | | | | | | | | | | | | | | | | | | | |
| SENIOR SECURED CREDIT FACILITY | | | | | | | | TOTAL CREDIT FACILITIES |
| TERM LOAN A | | REVOLVING FACILITY | | | | | | 2025 NOTES | | 2029 NOTES | |
| (dollars in thousands) | | | | | | |
| Balance as of December 26, 2021 | $ | 195,000 | | | $ | 80,000 | | | | | | | $ | 230,000 | | | $ | 300,000 | | | $ | 805,000 | |
| 2022 new debt | — | | | 1,239,500 | | | | | | | — | | | — | | | 1,239,500 | |
| 2022 payments | (195,000) | | | (889,500) | | | | | | | (125,000) | | | — | | | (1,209,500) | |
| Balance as of December 25, 2022 | — | | | 430,000 | | | | | | | 105,000 | | | 300,000 | | | 835,000 | |
| 2023 new debt | — | | | 1,079,000 | | | | | | | — | | | — | | | 1,079,000 | |
| 2023 payments | — | | | (1,128,000) | | | | | | | (214) | | | — | | | (1,128,214) | |
| Balance as of December 31, 2023 | $ | — | | | $ | 381,000 | | | | | | | $ | 104,786 | | | $ | 300,000 | | | $ | 785,786 | |
| | | | | | | | | | | | | |
| Interest rates, as of December 31, 2023 (1) | | | 6.96 | % | | | | | | 5.00 | % | | 5.13 | % | | |
| Principal maturity date | | | April 2026 | | | | | | May 2025 | | April 2029 | | |
____________________
(1)Subsequent to December 26, 2021, we repaid the remaining $80.0 million balance on our revolving credit facility.
(2)Interest rate for Term loan Arevolving credit facility represents the weighted average interest rate. Interest rate for the revolving credit facility represents the base rate option elected in anticipationas of impending repayment.December 31, 2023.
BLOOMIN’ BRANDS, INC.
MANAGEMENT’S DISCUSSION AND ANALYSIS OF
FINANCIAL CONDITION AND RESULTS OF OPERATIONS - Continued
As of December 26, 2021,31, 2023, we had $699.3$599.2 million in available unused borrowing capacity under our revolving credit facility, net of letters of credit of $20.7$19.8 million.
2029 Notes - On April 16, 2021, we issued $300.0 million aggregate principal amount of senior unsecured notes due 2029. The 2029 Notes mature on April 15, 2029, unless earlier redeemed or purchased by us. The 2029 Notes bear cash interest at an annual rate of 5.125% payable semi-annually in arrears on April 15 and October 15 of each year.
The net proceeds from the 2029 Notes were approximately $294.5 million, after deducting the initial purchaser’s discount and our offering expenses. The net proceeds were used to repay a portion of our outstanding Term loan A and revolving credit facility in conjunction with the refinancing of our Former Credit Facility.
Credit Agreement - On April 16, 2021,26, 2022, we and OSI as co-borrowers, entered into the First Amendment to the Second Amended and Restated Credit Agreement and Incremental Amendment (the “Amended Credit Agreement”), which provides for senior secured financingincluded an increase of upour existing revolving credit facility from $800.0 million to $1.0 billion consistingand a transition from the one-month London Inter-Bank Offered Rate (“LIBOR”) rate to the Secured Overnight Financing Rate (“SOFR”) as the benchmark rate for purposes of a $200.0calculating interest under the Senior Secured Credit Facility. At closing, an incremental $192.5 million Term loan A and an $800.0 millionwas drawn on the revolving credit facility (the “Senior Securedto fully repay the outstanding balance of Term loan A. Our total indebtedness remained unchanged as a result of the Amended Credit Facility”).Agreement. The Senior Secured Credit Facility matures on April 16, 2026 and replacedtransition to SOFR did not materially impact the interest rate applied to our prior senior secured financing of up to $1.5 billion (the “Former Credit Facility”).borrowings.
Our Senior Secured Credit Facility contains mandatory prepayment requirements for Term loan A, including the requirement that we prepay outstanding amounts under these loans with 50% of our annual excess cash flow, as defined in theAmended Credit Agreement commencing withcontains various financial and non-financial covenants. A violation of these covenants could negatively impact our liquidity by restricting our ability to borrow under the fiscal year ending December 25, 2022. The amountrevolving credit facility and cause an acceleration of outstanding loans required to be prepaid in accordance with the debt covenants may vary based on our Consolidated Senior Secured Net Leverage Ratio and year end results. Other thanamounts due under the annual required minimum amortization premiums of $10.0 million, we do not anticipate any other payments will be required through December 25, 2022.credit facilities.
See Note 1312 - Long-term Debt, Netof the notes to Consolidated Financial Statements for additional details regarding the 2029 Notes andAmended Credit Agreement.
As of December 26, 202131, 2023 and December 27, 2020,25, 2022, we were in compliance with our debt covenants. We believe that we will remain in compliance with our debt covenants during the next 12 months.months and beyond.
2025 Notes Partial Repurchase - On May 25, 2022, we and certain holders (the “Noteholders”) entered into exchange agreements in which the Noteholders agreed to exchange $125.0 million in aggregate principal amount of the 2025 Notes for $196.9 million in cash, plus accrued interest, and approximately 2.3 million shares of our common stock. In connection with the 2025 Notes Partial Repurchase, we entered into partial unwind agreements with certain financial institutions relating to a portion of the convertible note hedge transactions (the “Note Hedge Early Termination Agreements”) and a portion of the Warrant Transactions (the “Warrant Early Termination Agreements”) that were previously entered into by the Company in connection with the issuance of the 2025 Notes. Upon settlement, we received $131.9 million for the Note Hedge Early Termination Agreements and paid $114.8 million for the Warrant Early Termination Agreements.
Cash Flow Hedges of Interest Rate RiskSee Note 13 - In October 2018, we entered into variable-to-fixed interest rate swap agreements with 12 counterparties to hedge a portion of the cash flows of our variable rate debt. The swap agreements have an aggregate notional amount of $550.0 millionConvertible Senior Notes and mature on November 30, 2022. We pay a weighted average fixed rate of 3.04% on the notional amount and receive payments from the counterparties based on the one-month London Inter-Bank Offered Rate (“LIBOR”) rate. See Note 17 - Derivative Instruments and Hedging Activities of the Notes to Consolidated Financial Statements for further information.additional details regarding the 2025 Notes Partial Repurchase and related Note Hedge Early Termination Agreements and Warrant Early Termination Agreements.
In connection with the refinancing of the Former Credit Facility, on April 16, 2021 we terminated our variable-to-fixed interest rate swap agreements with seven counterparties having an aggregate notional amount of $275.0 million for a payment of approximately $13.3 million, including accrued interest. Following these terminations, $13.4 million of unrealized losses related to the terminated swap agreements included in Accumulated Other Comprehensive Loss (“AOCL”) will be amortized on a straight-line basis to Interest expense, net over the remaining original term of the terminated swaps.
As a result of our anticipated decrease in variable rate debt balances due to significant voluntary debt payments, on December 9, 2021 we terminated our variable-to-fixed interest rate swap agreements with three counterparties having an aggregate notional amount of $150.0 million for a payment of approximately $4.1 million, including accrued interest. Following these terminations, $4.1 million of unrealized losses related to the terminated swap agreements included in AOCL will be amortized to Interest expense, net during 2022.
BLOOMIN’ BRANDS, INC.
MANAGEMENT’S DISCUSSION AND ANALYSIS OF
FINANCIAL CONDITION AND RESULTS OF OPERATIONS - Continued
Use of Cash
Cash flows generated from operating activities and availability under our revolving credit facility are our principal sources of liquidity, which we use for operating expenses, debt payments, share repurchases and dividend payments, development of new restaurants, remodelingrelocating or relocatingremodeling older restaurants, investments in technology, dividend payments and investment in technology.share repurchases.
We believe that our expected liquidity sources are adequate to fund debt service requirements, lease obligations, capital expenditures and working capital obligations during the 12 months following this filing. However, our ability to continue to meet these requirements and obligations will depend on, among other things, our ability to achieve anticipated levels of revenue and cash flow and our ability to manage costs and working capital successfully.
Capital Expenditures - We estimate that our capital expenditures will total approximately $225$270 million to $240$290 million in 2022.2024. The amount of actual capital expenditures may be affected by general economic, financial, competitive, legislative and regulatory factors, among other things, including raw material constraints.
Material Cash Requirements - The following table presents current and long-term material cash requirements as of December 26, 2021:
| | | | | | | | | | | | | | | | | | | | | | | | | | | | | |
| PAYMENTS DUE BY PERIOD |
| | | LESS THAN | | 1-3 | | 3-5 | | MORE THAN |
| (dollars in thousands) | TOTAL | | 1 YEAR | | YEARS | | YEARS | | 5 YEARS |
| Operating leases (1) | $ | 2,383,335 | | | $ | 185,093 | | | $ | 372,180 | | | $ | 335,428 | | | $ | 1,490,634 | |
| Long-term debt: | | | | | | | | | |
| Principal (2) | 807,376 | | | 10,976 | | | 23,683 | | | 472,717 | | | 300,000 | |
| Interest (3) | 187,845 | | | 38,524 | | | 69,711 | | | 44,376 | | | 35,234 | |
| Purchase obligations (4) | 206,634 | | | 167,753 | | | 37,100 | | | 1,781 | | | — | |
| Other obligations (5) | 58,963 | | | 20,939 | | | 10,842 | | | 3,247 | | | 23,935 | |
| Total | $ | 3,644,153 | | | $ | 423,285 | | | $ | 513,516 | | | $ | 857,549 | | | $ | 1,849,803 | |
| | | | | | | | | |
| | | | | | | | | |
| | | | | | | | | |
____________________
(1)Amounts represent undiscounted future minimum rental commitments under non-cancelable operating leases. Includes $1.0 billion related to lease renewal options that are reasonably certain of exercise.
(2)Includes Senior Secured Credit Facility, 2029 Notes, 2025 Notes and finance lease obligations. Amount is not reduced by unamortized debt issuance costs and finance lease interest totaling $14.3 million.
(3)Projected future interest payments on long-term debt are based on interest rates in effect as of December 26, 2021 and assume only scheduled principal payments. Estimated interest expense includes the impact of remaining variable-to-fixed interest rate swap agreements.
(4)Purchase obligations include agreements to purchase goods or services that are enforceable, legally binding and specify all significant terms, including fixed or minimum quantities to be purchased; fixed, minimum or variable price provisions; and the approximate timing of the transaction. We have purchase obligations with various vendors that consist primarily of inventory, technology, restaurant-level service contracts and advertising.
(5)Includes other long-term liabilities, primarily consisting of deferred compensation obligations, deposits and other accrued obligations. Unrecognized tax benefits are excluded from this table since it is not possible to estimate when these future payments will occur.
Dividends and Share Repurchases - In April 2021, we entered into our Credit Agreement, the terms of which contained certain restrictions on cash dividends and share repurchases until after September 26, 2021 and we were compliant with our financial covenants. We were compliant with our financial covenants as of December 26, 2021 and we believe that we will remain in compliance with our debt covenants during the next 12 months. As such, absent unanticipated circumstances, we do not believe that compliance with our financial covenants will materially limit our ability to pay dividends in the near term and future dividend payments will depend on various other factors considered by our Board as noted below.
BLOOMIN’ BRANDS, INC.
MANAGEMENT’S DISCUSSION AND ANALYSIS OF
FINANCIAL CONDITION AND RESULTS OF OPERATIONS - Continued
Brazil Judicial Deposit - During the first quarterhalf of 2020,2024, we anticipate making a judicial deposit of approximately $45.0 million to $50.0 million in connection with our appeal of an unfavorable court ruling related to our ongoing litigation regarding our eligibility for tax exemptions under the Brazil tax legislation. The judicial deposit includes the disputed amounts through December 31, 2023 and will be recorded in Other assets, net, on our Consolidated Balance Sheet. We believe that we will more likely than not prevail in this appeal and accordingly, have not recorded any expense or liability for the disputed amounts.
See Note 20 - Income Taxes of the Notes to Consolidated Financial Statements for further information regarding the Brazil tax legislation and related litigation.
Dividends and Share Repurchases - During 2023 and 2022, we declared and paid quarterly cash dividends of $0.20$0.24 and $0.14 per share. We did not pay dividends during 2021. share, respectively.
In February 2022,2024, our Board declared a quarterly cash dividend of $0.14$0.24 per share, payable on March 16, 2022 to shareholders of record at the close of business20, 2024. Future dividend payments are dependent on March 2, 2022.
We did not repurchase any shares of our outstanding common stock during 2021. On February 8, 2022,earnings, financial condition, capital expenditure requirements, surplus and other factors that our Board approvedconsiders relevant, as well as continued compliance with the 2022 Share Repurchase Program under which we are authorized to repurchase up to $125.0 million offinancial covenants in our outstanding common stock. The 2022 Share Repurchase Program will expire on August 9, 2023.debt agreements.
Following is a summary of our former share repurchase programs active during the periods presented as of December 26, 202131, 2023 (dollars in thousands):
| | | | | | | | | | | | | | | | | | | | | | | | | | | | | | | | |
| SHARE REPURCHASE PROGRAM | | BOARD APPROVAL DATE | | AUTHORIZED | | REPURCHASED | | CANCELLED OR EXPIRED | | REMAINING |
| 2014 | | December 12, 2014 | | $ | 100,000 | | | $ | 100,000 | | | $ | — | | | $ | — | |
| 2015 | | August 3, 2015 | | $ | 100,000 | | | 69,999 | | | $ | 30,001 | | | $ | — | |
| 2016 | | February 12, 2016 | | $ | 250,000 | | | 139,892 | | | $ | 110,108 | | | $ | — | |
| July 2016 | | July 26, 2016 | | $ | 300,000 | | | 247,731 | | | $ | 52,269 | | | $ | — | |
| 2017 | | April 21, 2017 | | $ | 250,000 | | | 195,000 | | | $ | 55,000 | | | $ | — | |
| 2018 | | February 16, 2018 | | $ | 150,000 | | | 113,967 | | | $ | 36,033 | | | $ | — | |
| 2019 | | February 12, 2019 | | $ | 150,000 | | | 106,992 | | | $ | 43,008 | | | $ | — | |
| Total share repurchase programs | | | | $ | 973,581 | | | | | |
| | | | | | | | | | | | | | | | | | | | | | | | | | | | | | | | |
| SHARE REPURCHASE PROGRAM | | BOARD APPROVAL DATE | | AUTHORIZED | | REPURCHASED | | CANCELLED OR EXPIRED | | REMAINING |
| | | | | | | | | | |
| | | | | | | | | | |
| | | | | | | | | | |
| | | | | | | | | | |
| | | | | | | | | | |
| | | | | | | | | | |
| | | | | | | | | | |
| 2022 | | February 8, 2022 | | $ | 125,000 | | | $ | 125,000 | | | $ | — | | | $ | — | |
| 2023 (1) | | February 7, 2023 | | $ | 125,000 | | | 54,999 | | | $ | — | | | $ | 70,001 | |
| Total share repurchase programs | | | | $ | 179,999 | | | | | |
________________(1)Subsequent to December 31, 2023, we repurchased $12.5 million of our common stock authorized under the 2023 Share Repurchase Program under a Rule 10b5-1 plan.
In February 2024, our Board canceled the remaining $57.5 million of authorization under the 2023 Share Repurchase Program and approved a new $350.0 million authorization. The 2024 Share Repurchase Program includes capacity above our normal share repurchases activity to provide flexibility in retiring our 2025 Notes at or prior to their May 2025 maturity. The 2024 Share Repurchase Program will expire on August 13, 2025.
The following table presents our dividends and share repurchases for the periods indicated:
| | | | | | | | | | | | | | | | | | | |
| (dollars in thousands) | DIVIDENDS PAID | | SHARE REPURCHASES | | | | TOTAL |
| Fiscal year 2021 | $ | — | | | $ | — | | | | | $ | — | |
| Fiscal year 2020 | 17,480 | | | — | | | | | 17,480 | |
| Fiscal year 2019 | 35,734 | | | 106,992 | | | | | 142,726 | |
| Fiscal year 2018 | 33,312 | | | 113,967 | | | | | 147,279 | |
| Fiscal year 2017 | 30,988 | | | 272,736 | | | | | 303,724 | |
| Fiscal year 2016 | 31,379 | | | 309,887 | | | | | 341,266 | |
| Fiscal year 2015 | 29,332 | | | 169,999 | | | | | 199,331 | |
| Total | $ | 178,225 | | | $ | 973,581 | | | | | $ | 1,151,806 | |
| | | | | | | | | | | | | | | | | |
| (dollars in thousands) | DIVIDENDS PAID | | SHARE REPURCHASES (1) | | TOTAL |
| Fiscal year 2023 | $ | 83,742 | | | $ | 70,000 | | | $ | 153,742 | |
| Fiscal year 2022 | 49,736 | | | 109,999 | | | 159,735 | |
| | | | | |
| | | | | |
| | | | | |
| | | | | |
| | | | | |
| | | | | |
| | | | | |
| Total | $ | 133,478 | | | $ | 179,999 | | | $ | 313,477 | |
________________
(1)Excludes $0.1 million of excise tax on share repurchases for fiscal year 2023.
Our ability to pay dividends and make share repurchases is dependent on our ability to obtain funds from our subsidiaries, continued compliance with the financial covenants in our debt agreements and the existence of surplus, as well as our earnings, financial condition, capital expenditure requirements and other factors that our Board deems relevant.
Lease Guarantees - We guarantee certain lease agreements primarily related to divested restaurant properties in circumstances where we have assigned our lease interest. In the event of non-payment by the primary lessees, we may be required to satisfy these lease agreements with cash. See Note 22 - Commitments and Contingencies for additional details regarding our lease guarantees.
Deferred Compensation Programs - Certain Restaurant Managing Partners and Chef Partners in the U.S. (“U.S. Partners”) participate in deferred compensation programs that are subject to the rules of Section 409A of the Internal Revenue Code. The deferred compensation obligations due under these plans was $15.5 million and $28.1 million as of December 26, 2021 and December 27, 2020, respectively. We invest in various corporate-owned life insurance policies, which are held within an irrevocable grantor or rabbi trust account for settlement of our obligations under the deferred compensation plans. The obligation for U.S. Partners’ deferred compensation was fully funded as of December 26, 2021.
BLOOMIN’ BRANDS, INC.
MANAGEMENT’S DISCUSSION AND ANALYSIS OF
FINANCIAL CONDITION AND RESULTS OF OPERATIONS - Continued
Material Cash Requirements - The following table presents current and long-term material cash requirements as of December 31, 2023:
| | | | | | | | | | | | | | | | | | | | | | | | | | | | | |
| PAYMENTS DUE BY PERIOD |
| | | LESS THAN | | 1-3 | | 3-5 | | MORE THAN |
| (dollars in thousands) | TOTAL | | 1 YEAR | | YEARS | | YEARS | | 5 YEARS |
| Operating leases (1) | $ | 1,343,420 | | | $ | 183,370 | | | $ | 341,252 | | | $ | 259,118 | | | $ | 559,680 | |
| Long-term debt: | | | | | | | | | |
| Principal (2) | 785,786 | | | — | | | 485,786 | | | — | | | 300,000 | |
| Interest (3) | 151,624 | | | 47,735 | | | 68,655 | | | 30,750 | | | 4,484 | |
| Purchase obligations (4) | 196,809 | | | 186,992 | | | 9,488 | | | 329 | | | — | |
| Other obligations (5) | 57,111 | | | 9,595 | | | 7,091 | | | 3,611 | | | 36,814 | |
| Total | $ | 2,534,750 | | | $ | 427,692 | | | $ | 912,272 | | | $ | 293,808 | | | $ | 900,978 | |
| | | | | | | | | |
| | | | | | | | | |
| | | | | | | | | |
____________________
(1)Amounts represent undiscounted future minimum rental commitments under non-cancelable operating leases. Excludes $945.4 million related to operating lease renewal options that are reasonably certain of exercise.
(2)Includes Senior Secured Credit Facility, 2029 Notes and 2025 Notes. Amounts are not reduced by unamortized debt issuance costs totaling $5.1 million.
(3)Projected future interest payments on long-term debt are based on interest rates in effect as of December 31, 2023.
(4)Purchase obligations include agreements to purchase goods or services that are enforceable, legally binding and specify all significant terms, including fixed or minimum quantities to be purchased; fixed, minimum or variable price provisions; and the approximate timing of the transaction. We have purchase obligations with various vendors that consist primarily of inventory, fixtures and equipment and technology.
(5)Includes other long-term liabilities, primarily consisting of deferred compensation obligations, deposits, undiscounted finance leases and other accrued obligations. Unrecognized tax benefits are excluded from this table since it is not possible to estimate when these future payments may occur.
Summary of Cash Flows and Financial Condition
Cash Flows -The- The following table presents a summary of our cash flows provided by (used in) operating, investing and financing activities for the periods indicated:
| | FISCAL YEAR |
| FISCAL YEAR | |
| FISCAL YEAR | |
| FISCAL YEAR | |
| (dollars in thousands) | (dollars in thousands) | 2021 | | 2020 | |
| Net cash provided by operating activities | Net cash provided by operating activities | $ | 402,455 | | | $ | 138,849 | | |
| Net cash provided by operating activities | |
| Net cash provided by operating activities | |
| Net cash used in investing activities | |
| Net cash used in investing activities | |
| Net cash used in investing activities | Net cash used in investing activities | (104,745) | | | (76,639) | | |
| Net cash used in financing activities | Net cash used in financing activities | (317,419) | | | (16,773) | | |
| Net cash used in financing activities | |
| Net cash used in financing activities | |
| Effect of exchange rate changes on cash and cash equivalents | Effect of exchange rate changes on cash and cash equivalents | (1,642) | | | (2,174) | | |
| Net (decrease) increase in cash, cash equivalents and restricted cash | $ | (21,351) | | | $ | 43,263 | | |
| Effect of exchange rate changes on cash and cash equivalents | |
| Effect of exchange rate changes on cash and cash equivalents | |
| Net increase (decrease) in cash, cash equivalents and restricted cash | |
| Net increase (decrease) in cash, cash equivalents and restricted cash | |
| Net increase (decrease) in cash, cash equivalents and restricted cash | |
|
Operating activities - NetThe increase in net cash provided by operating activities increased during 20212023 as compared to 20202022 was primarily due to a significant improvement in revenuesto: (i) higher operational receipts, net of payments, (ii) decreased employee compensation payments and operating results,(iii) lower tax payments. These increases were partially offset by: (i) cash paid in connection with the Carrabba’s Italian Grill royalty termination, (ii) timing of collections of gift card receivables, (iii)by higher inventory purchases, (iv) payment of payroll taxes deferred in 2020 as a result of the Coronavirus, Aid, Reliefrent and Economic Security Act, (v) cash paid to terminate interest rate swap agreements and (vi) timing of operational payments and receipts.payments.
Investing activities - The increase in net cash used in investing activities during 20212023 as compared to 20202022 was primarily due to higher capital expenditures partially offset by higher proceedsand a decrease in cash withdrawn from the disposal of property, fixtures and equipment.Company-owned life insurance policies.
Financing activities - The increasedecrease in net cash used in financing activities during 20212023 as compared to 20202022 was primarily due toto: (i) a decrease in repurchases of common stock, (ii) higher net proceeds from share-based compensation and (iii) partner equity plan payments during 2022. These decreases were partially offset by higher payments of cash dividends on our capital restructuringcommon stock and debt payments throughout the fiscal year that lowered bank debt and unsecured notes by an aggregate of $297.0 million.increased repayments on our debt.
BLOOMIN’ BRANDS, INC.
MANAGEMENT’S DISCUSSION AND ANALYSIS OF
FINANCIAL CONDITION AND RESULTS OF OPERATIONS - Continued
Financial Condition - Following is a summary of our current assets, current liabilities and working capital (deficit) as of the periods indicated:
| | (dollars in thousands) | (dollars in thousands) | DECEMBER 26, 2021 | | DECEMBER 27, 2020 | (dollars in thousands) | DECEMBER 31, 2023 | | DECEMBER 25, 2022 |
| Current assets | Current assets | $ | 352,792 | | | $ | 323,854 | |
| Current liabilities | Current liabilities | 984,625 | | | 950,104 | |
| Working capital (deficit) | Working capital (deficit) | $ | (631,833) | | | $ | (626,250) | |
|
Working capital (deficit) includes: (i) Unearned revenue primarily from unredeemed gift cards of $398.8$381.9 million and $381.6$394.2 million as of December 26, 202131, 2023 and December 27, 2020,25, 2022, respectively, and (ii) current operating lease liabilities of $177.0$175.4 million and $176.8$183.5 million as of December 26, 202131, 2023 and December 27, 2020,25, 2022, respectively, with the corresponding operating right-of-use assets recorded as non-current on our Consolidated Balance Sheets. We have, and in the future may continue to have, negative working capital balances (as is common for many restaurant companies). We operate successfully with negative working capital because cash collected on restaurant sales areis typically received before payment is due on our current liabilities, and our inventory turnover rates require relatively low investment in inventories. Additionally, ongoing cash flows from restaurant operations and gift card sales are typically used to service debt obligationsobligations and to make capital expenditures.
BLOOMIN’ BRANDS, INC.
MANAGEMENT’S DISCUSSION AND ANALYSIS OF
FINANCIAL CONDITION AND RESULTS OF OPERATIONS - Continued
Critical Accounting Policies and Estimates
Our discussion and analysis of our financial condition and results of operations are based upon our consolidated financial statements, which have been prepared in accordance with U.S. GAAP. The preparation of these accompanying consolidated financial statements requires us to make estimates and judgments that affect the reported amounts of assets, liabilities, revenues and expenses, and related disclosure of contingent assets and liabilities during the reporting period. We base our estimates on historical experience and on various other assumptions that are believed to be reasonable under the circumstances, the results of which form the basis for making judgments about the carrying value of assets and liabilities that are not readily apparent from other sources. Actual results may differ from these estimates under different assumptions or conditions. We consider an accounting estimate to be critical if it requires assumptions to be made and changes in these assumptions could have a material impact on our consolidated financial condition or results of operations.
Impairment or Disposal of Long-Lived Assets - Long-lived assets are reviewed for impairment whenever events or changes in circumstances indicate that the carrying value may not be recoverable. The evaluation is performed at the lowest level of identifiable cash flows independent of other assets. For long-lived assets deployed at our restaurants, we review for impairment at the individual restaurant level.
When evaluating for impairment, the total future undiscounted cash flows expected to be generated by the assets are compared to the carrying amount. If the total future undiscounted cash flows expected to be generated by the assets are less than the carrying amount, this may be an indicator of impairment. An impairment loss is recognized in earnings when the asset’s carrying value exceeds its estimated fair value. Fair value is generally estimated using a discounted cash flow model. The key estimates and assumptions used in this model are future cash flow estimates, with material changes generally driven by changes in expected use, and the discount rate. These estimates are subjective and our ability to realize future cash flows and asset fair values is affected by factors such as ongoing maintenance and improvement of the assets, changes in economic conditions and changes in our operating performance. Historically, the change in useful lives of our assets as a result of planned closures or the decision not to renew leases has been a key factor in the impairment we have recognized.
Based on a review of operating results for each of our restaurants, given the current operating environment, the amount of net book value associated with lower performing restaurants that would be deemed at risk for impairment is not material to our consolidated financial statements.
BLOOMIN’ BRANDS, INC.
MANAGEMENT’S DISCUSSION AND ANALYSIS OF
FINANCIAL CONDITION AND RESULTS OF OPERATIONS - Continued
Goodwill and Indefinite-Lived Intangible Assets - Goodwill and indefinite-lived intangible assets are not subject to amortization and are tested for impairment annually in the second fiscal quarter, or whenever events or changes in circumstances indicate that the carrying amount may not be recoverable.
We may elect to perform a qualitative assessment to determine whether it is more likely than not that a reporting unit is impaired. In considering the qualitative approach, we evaluate factors including, but not limited to, macro-economicmacroeconomic conditions, market and industry conditions, commodity cost fluctuations, competitive environment, share price performance, results of prior impairment tests, operational stability and the overall financial performance of the reporting units. Any adverse change in these factors could have a significant impact on the recoverability of assets and could have a material impact on our consolidated financial statements.
If the qualitative assessment is not performed or if we determine that it is not more likely than not that the fair value of the reporting unit exceeds the carrying value, a quantitative approach, using the fair value of the reporting unit, is calculated. Fair value of a reporting unit is the price a willing buyer would pay for the reporting unit and is estimated by utilizing a weighted average of the income approach, using a discounted cash flow model, and, when appropriate, the market approach including the guideline public company method and guideline transaction method. The key estimates and assumptions used in these modelsthis assessment are future cash flow estimates, which are heavily influenced by revenue growth rates, operating margins and capital expenditures. These estimates are subjective, and our ability to achieve the forecasted cash flows used in our fair value calculations is affected by factors such as the success of strategic initiatives, changes in economic conditions and discount rates, changes in our operating performance and changes in our business strategies. The
We estimate the fair value of trade names using the relief-from-royalty method, which requires assumptions related to projected sales for each reporting unit, assumed market royalty rates applicable to the trade names, is determined through a relief from royalty method.and discount rates.
BLOOMIN’ BRANDS, INC.
MANAGEMENT’S DISCUSSION AND ANALYSIS OF
FINANCIAL CONDITION AND RESULTS OF OPERATIONS - Continued
The carrying value of the reporting unit or trade name is compared to its estimated fair value, with any excess of carrying value over fair value deemed to be an indicator of impairment.
The carrying value of goodwill and trade names as of December 26, 202131, 2023 was $268.4 million.$276.3 million and $414.7 million, respectively. We performed our annual impairment test in the second quarter of 20212023 by utilizing the qualitativequantitative approach and determined that there were no events or circumstances to indicate that it was more likely than not that the excess of fair value over carrying value of our reporting units was less than their carrying values.substantial.
Sales declines at our restaurants, unplanned increases in commodity or labor costs, deterioration in overall economic conditions and challenges in the restaurant industry may result in future impairment charges. It is possible that changes in circumstances or changes in our judgments, assumptions and estimates could result in an impairment charge of a portion or all of our goodwill or other intangible assets.
Leases - We use judgment at lease inception to determine the reasonably certain lease term, which in turn, impacts the applicable incremental borrowing rate (“IBR”) used to calculate the initial lease liability for each portfolio of leases. Other assumptions used in determining our incremental borrowing rate include our implied credit rating and an estimate of secured borrowing rates based on comparable market data. We determined the present value of the lease liabilities by using a country specific IBR and applying a single rate to the respective portfolio of leases based on term, regardless of the underlying asset type.
The reasonably certain lease term used in the evaluation of existing leases at transition and new leases after adoption of the new lease standard includes renewal option periods only in instances in which the exercise of the renewal option is reasonably certain because failure to exercise such an option would result in an economic penalty. Such an economic penalty would typically result from having to abandon a building or equipment with remaining economic value upon vacating a property.
We use our estimated IBR, which is derived from information available at the lease commencement date, in determining the present value of lease payments. We give consideration to market data as well as publicly available data for instruments with similar characteristics when calculating our IBR.BLOOMIN’ BRANDS, INC.
MANAGEMENT’S DISCUSSION AND ANALYSIS OF
FINANCIAL CONDITION AND RESULTS OF OPERATIONS - Continued
At the inception of each lease, we evaluate the property and the lease to determine whether the lease is an operating lease or a financingfinance lease. This lease accounting evaluation may require significant judgment in determining the fair value and useful life of the leased property and the appropriate reasonably certain lease term. Determination of the reasonably certain lease term impacts the period in which buildings are depreciated. These judgments may produce materially different amounts of rent and depreciation expense in a given reporting period than would be reported if different assumed lease terms were used.
Insurance Reserves - We carry insurance programs with specific retention levels or high per-claim deductibles for a significant portion of expected losses under our workers’ compensation, general or liquor liability, health, property and management liability insurance programs. For some programs, we maintain stop-loss coverage to limit the exposure relating to certain risks.
We record a liability for all unresolved claims and for an estimate of incurred but not reported claims at the anticipated cost that falls below our specified retention levels or per-claim deductible amounts. Our liability for insurance claims was $53.5$45.9 million and $52.8$49.1 million as of December 26, 202131, 2023 and December 27, 2020,25, 2022, respectively. In establishing our reserves, we consider certain actuarial assumptions and judgments regarding economic conditions, and the frequency and severity of claims. The establishment of the reserves utilizing such estimates and assumptions is in part based on the premise that historical claims experience is indicative of current or future expected activity, which could differ significantly. Reserves recorded for workers’ compensation and general or liquor liability claims are discounted using the average of the one-year and five-year risk-free rate of monetary assets that have comparable maturities.
BLOOMIN’ BRANDS, INC.
MANAGEMENT’S DISCUSSION AND ANALYSIS OF
FINANCIAL CONDITION AND RESULTS OF OPERATIONS - Continued
If actual results are not consistent with our estimates or assumptions, we may be exposed to losses or gains that could be material. A 50 basis point change in the discount rate in our insurance claim liabilities as of December 26, 2021,31, 2023, would have affected net earnings by $0.8$0.5 million in 2021.2023.
Income Taxes - Deferred tax assets and liabilities are recognized based on the differences between the financial statement carrying amounts of assets and liabilities and their respective tax basis. Deferred tax assets and liabilities are measured using the tax rates, based on certain judgments regarding enacted tax laws and published guidance, in effect in the years in which we expect those temporary differences to reverse. As of December 26, 2021,31, 2023, tax loss carryforwards and credit carryforwards that do not have a valuation allowance are expected to be recoverable within the applicable statutory expiration periods. We currently expect to utilize general business tax credit carryforwards within a 10-year period. However, our ability to utilize these tax credits could be adversely impacted by, among other items, a future “ownership change” as defined under Section 382 of the Internal Revenue Code. A valuation allowance is established against the deferred tax assets when it is more likely than not that some portion or all of the deferred taxes may not be realized. Changes in assumptions regarding our level and composition of earnings, tax laws or the deferred tax valuation allowance and the results of tax audits and litigation, may materially impact the effective income tax rate.
While we consider all of our tax positions to be fully supportable, our income tax returns, like those of most companies, are periodically audited by U.S. and foreign tax authorities. In determining taxable income, income or loss before taxes is adjusted for differences between local tax laws and generally accepted accounting principles. A tax benefit from an uncertain position is recognized only if it is more likely than not that the position is sustainable based on its technical merits. For uncertain tax positions that do not meet this threshold, we recognize a liability. The liability for unrecognized tax benefits requires significant management judgment regarding exposures about our various tax positions. These assumptions and probabilities are reviewed and updated based upon new information. An unfavorable tax settlement could require the use of cash and an increase in the amount of income tax expense we recognize. As of December 26, 2021,31, 2023, we had $18.8$16.7 million of unrecognized tax benefits, including accrued interest and penalties, that if recognized, would impact our effective income tax rate.
BLOOMIN’ BRANDS, INC.
MANAGEMENT’S DISCUSSION AND ANALYSIS OF
FINANCIAL CONDITION AND RESULTS OF OPERATIONS - Continued
Recently Issued Financial Accounting Standards
For a description of recently issued Financial Accounting Standards that we adopted in 20212023 and, that are applicable to us and likely to have material effect on our consolidated financial statements, but have not yet been adopted, see Note 2 - Summary of Significant Accounting Policies of the Notes to Consolidated Financial Statements.
Item 7A. Quantitative and Qualitative Disclosures about Market Risk
We are exposed to market risk from changes in commodity prices, labor inflation, interest rates and foreign currency exchange rates. During 2021, we substantially reduced our variable rate debt borrowings and terminated a significant portion of our interest rate swap agreements, which significantly reduced our market risk exposure related to interest rate risk.
Commodity Pricing Risk
Many of the ingredients used in the products sold in our restaurants are commodities that are subject to unpredictable price volatility. Although we attempt to minimize the effect of price volatility by negotiating fixed price contracts for the supply of key ingredients, there are no established fixed price markets for certain commodities such as produce and wild fish, and we are subject to prevailing market conditions when purchasing those types of commodities. Other commodities are purchased based upon negotiated price ranges established with vendors with reference to the fluctuating market prices. The related agreements may contain contractual features that limit the price paid by establishing certain price floors and caps. As of December 26, 2021,31, 2023, approximately 70% of our estimated 20222024 annual food purchases wereare covered by fixed contracts, most of which are scheduled to expire during 2022.2024.
During 2021, commodity markets began experiencing elevated levels of inflation across all proteins given strong consumer demand and product shortages due to supply chain disruptions. In addition, higher input costs across labor, fuel, freight and packaging contributed to increases as well. We anticipate2023, we experienced 4.3% commodity inflation in the U.S. and anticipate 3% to be approximately 11.0% to 13.0%4% commodity inflation for 2022.2024. Extreme changes in commodity prices or long-term changes could affect our financial results adversely. We expect that in most cases increased commodity prices could be passed through to our customers through increases in menu prices. However, if there is a time lag between the increasing commodity prices and our ability to increase menu prices, or if we believe the commodity price increase to be short in duration and we choose not to pass on the cost increases, our short-term financial results could be negatively affected. Additionally, from time to time, competitive circumstances could limit menu price flexibility, and in those cases, margins would be negatively impacted by increased commodity prices. Currently we do not use financial instruments to hedge our commodity risk.
In addition to the market risks identified above, we are subject to business risk as our U.S. beef supply isand Brazil pork supplies are highly dependent upon a limited number of vendors. If these vendors were unable to fulfill their obligations under their contracts, we could encounter supply shortages and incur higher costs to secure adequate supplies. See Note 2221 - Commitments and Contingencies of the Notes to Consolidated Financial Statements for further details.
Labor Inflation
Our restaurant operations are subject to federal and state minimum wage and other laws governing such matters as working conditions, overtime and tip credits. A significant number of our restaurant team members are paid at rates related to the federal and/or state minimum wage and, accordingly, increases in the minimum wage increase our labor costs. To the extent permitted by competition and the economy,During 2023, we have mitigated increased costs by increasing menu prices and may continue to do so if deemed necessary in future years. Substantial increases in costs and expenses could impact our operating results to the extent such increases cannot be passed through to our guests. We anticipate high-single digitexperienced 5.3% labor cost inflation in the U.S.
Interest Rate Risk
Our interest rate risk management objective is to limit the impact of interest rate changes on earnings and cash flows by targeting an appropriate mix of variable and fixed-rate debt. We manage our exposure to market risk through regular operating and financing activities, using a combination of fixed-rate and variable-rate debt, and when deemed appropriate, through the use of derivative financial instruments. The amount of variable-rate debt fluctuates during 2022.the year based on our working capital requirements. As of December 31, 2023, our interest rate risk was primarily from variable interest rate changes on our revolving credit facility, which had an outstanding balance of $381.0 million.
We periodically evaluate financial instruments to hedge our exposure to variable interest rates. We use derivative financial instruments as risk management tools and not for speculative purposes. To manage the risk of fluctuations in variable interest rate debt, we have interest rate swaps with an aggregate notional amount of $200.0 million, with $100.0 million maturing on December 31, 2024 and $100.0 million maturing on December 31, 2025.See Note 16 - Derivative Instruments and Hedging Activities of the Notes to Consolidated Financial Statements for further information.
We utilize valuation models to estimate the effects of changing interest rates. The following table summarizes the changes to fair value and interest expense under a shock scenario. This analysis assumes that interest rates change suddenly, as an interest rate “shock”, and continue to increase or decrease at a consistent level above or below the SOFR curve.
| | | | | | | | | | | |
| DECEMBER 31, 2023 |
| (dollars in thousands) | INCREASE | | DECREASE |
| Change in fair value (1): | | | |
| Interest rate swap | $ | 5,230 | | | $ | (5,427) | |
| | | |
| Change in annual interest expense (1): | | | |
| Variable rate debt | $ | 3,620 | | | $ | (3,620) | |
________________(1)The potential change from a hypothetical 200 basis point increase (decrease) in short-term interest rates.
Foreign Currency Exchange Rate Risk
We are subject to foreign currency exchange risk for our restaurants operating in foreign countries. Our exposure to foreign currency exchange risk is primarily related to fluctuations in the Brazilian Real relative to the U.S. dollar. Our operations in other markets consist of Company-owned restaurants on a smaller scale than Brazil. If foreign currency exchange rates depreciate in the countries in which we operate, we may experience declines in our operating results. Currently, we do not use financial instruments to hedge foreign currency exchange rate changes.
For 2021, 8.8%2023, 13.2% of our revenue was generated in foreign currencies. A 10% change in average foreign currency rates against the U.S. dollar would have increased or decreased our Total revenues and Net income for our foreign entities by $38.9 million. The 10% change would not have had a material effect on Net income.
Interest Rate Risk
We are exposed to market risk from fluctuations in interest rates, which could affect our consolidated balance sheet, earnings$67.0 million and cash flows. As of December 26, 2021, our interest rate risk was primarily from variable interest rate changes on our Senior Secured Credit Facility. We manage our exposure to market risk through regular operating and financing activities and when deemed appropriate, through the use of derivative financial instruments. We use derivative financial instruments as risk management tools and not for speculative purposes. To manage the risk of fluctuations in variable interest rate debt, we have interest rate swaps. As of December 26, 2021, we had interest rate swaps with an aggregate notional amount of $125.0$8.5 million, that mature on November 30, 2022. See Note 17 - Derivative Instruments and Hedging Activities of the Notes to Consolidated Financial Statements for further information.
We utilize valuation models to estimate the effects of changing interest rates. As of December 26, 2021, a potential change from a hypothetical 100 basis point increase/decrease in short-term interest rates would not materially impact the fair value of our interest rate swaps or our annual interest expense.respectively.
This market risk discussion contains forward-looking statements. Actual results may differ materially from the discussion based upon general market conditions and changes in U.S. and global financial markets.
Item 8. Financial Statements and Supplementary Data
INDEX TO FINANCIAL INFORMATION
Management’s Annual Report on Internal Control over Financial Reporting
Management is responsible for establishing and maintaining adequate internal control over financial reporting, as such term is defined in Exchange Act Rule 13a-15(f). The Company’s internal control over financial reporting includes those policies and procedures that (i) pertain to the maintenance of records that in reasonable detail accurately and fairly reflect the transactions and dispositions of the assets of the Company; (ii) provide reasonable assurance that transactions are recorded as necessary to permit preparation of financial statements in accordance with generally accepted accounting principles, and that receipts and expenditures of the Company are being made only in accordance with authorizations of management and directors of the Company; and (iii) provide reasonable assurance regarding prevention or timely detection of unauthorized acquisition, use or disposition of the Company’s assets that could have a material effect on the financial statements.
Internal control over financial reporting is designed to provide reasonable assurance regarding the reliability of financial reporting and the preparation of financial statements prepared for external purposes in accordance with generally accepted accounting principles. Because of its inherent limitations, internal control over financial reporting may not prevent or detect misstatements. Also, projections of any evaluation of effectiveness to future periods are subject to the risk that controls may become inadequate because of changes in conditions, or that the degree of compliance with the policies or procedures may deteriorate.
Under the supervision and with the participation of management, including our Chief Executive Officer and Chief Financial Officer, we carried out an evaluation of the effectiveness of our internal control over financial reporting as of December 26, 202131, 2023 using the criteria described in Internal Control—Integrated Framework issued by the Committee of Sponsoring Organizations of the Treadway Commission (2013 Framework) (“COSO”). Based upon our evaluation, management concluded that our internal control over financial reporting was effective as of December 26, 2021.31, 2023.
The effectiveness of our internal control over financial reporting as of December 26, 202131, 2023 has been audited by PricewaterhouseCoopers LLP, an independent registered public accounting firm, as stated in their report which is included herein.
Report of Independent Registered Public Accounting Firm
To the Board of Directors and Stockholders of Bloomin’ Brands, Inc.
Opinions on the Financial Statements and Internal Control over Financial Reporting
We have audited the accompanying consolidated balance sheets of Bloomin’ Brands, Inc. and its subsidiaries (the “Company”) as of December 26, 202131, 2023 and December 27, 2020,25, 2022, and the related consolidated statements of operations and comprehensive income, (loss), of changes in stockholders’ equity and of cash flows for each of the three years in the period ended December 26, 2021,31, 2023, including the related notes (collectively referred to as the “consolidated financial statements”). We also have audited the Company’s internal control over financial reporting as of December 26, 2021,31, 2023, based on criteria established in Internal Control - Integrated Framework (2013) issued by the Committee of Sponsoring Organizations of the Treadway Commission (COSO).
In our opinion, the consolidated financial statements referred to above present fairly, in all material respects, the financial position of the Company as of December 26, 202131, 2023 and December 27, 2020,25, 2022, and the results of its operations and its cash flows for each of the three years in the period ended December 26, 202131, 2023 in conformity with accounting principles generally accepted in the United States of America. Also in our opinion, the Company maintained, in all material respects, effective internal control over financial reporting as of December 26, 2021,31, 2023, based on criteria established in Internal Control - Integrated Framework (2013) issued by the COSO.
ChangesChange in Accounting PrinciplesPrinciple
As discussed in Note 2 to the consolidated financial statements, the Company changed the manner in which it accounts for convertible instruments and contracts in an entity’s own equity in 2021 and the manner in which it accounts for leases in 2019.2021.
Basis for Opinions
The Company’s management is responsible for these consolidated financial statements, for maintaining effective internal control over financial reporting, and for its assessment of the effectiveness of internal control over financial reporting, included in the accompanying Management’s Annual Report on Internal Control over Financial Reporting. Our responsibility is to express opinions on the Company’s consolidated financial statements and on the Company’s internal control over financial reporting based on our audits. We are a public accounting firm registered with the Public Company Accounting Oversight Board (United States) (PCAOB) and are required to be independent with respect to the Company in accordance with the U.S. federal securities laws and the applicable rules and regulations of the Securities and Exchange Commission and the PCAOB.
We conducted our audits in accordance with the standards of the PCAOB. Those standards require that we plan and perform the audits to obtain reasonable assurance about whether the consolidated financial statements are free of material misstatement, whether due to error or fraud, and whether effective internal control over financial reporting was maintained in all material respects.
Our audits of the consolidated financial statements included performing procedures to assess the risks of material misstatement of the consolidated financial statements, whether due to error or fraud, and performing procedures that respond to those risks. Such procedures included examining, on a test basis, evidence regarding the amounts and disclosures in the consolidated financial statements. Our audits also included evaluating the accounting principles used and significant estimates made by management, as well as evaluating the overall presentation of the consolidated financial statements. Our audit of internal control over financial reporting included obtaining an understanding of internal control over financial reporting, assessing the risk that a material weakness exists, and testing and evaluating the design and operating effectiveness of internal control based on the assessed risk. Our audits also included performing such other procedures as we considered necessary in the circumstances. We believe that our audits provide a reasonable basis for our opinions.
Definition and Limitations of Internal Control over Financial Reporting
A company’s internal control over financial reporting is a process designed to provide reasonable assurance regarding the reliability of financial reporting and the preparation of financial statements for external purposes in accordance with generally accepted accounting principles. A company’s internal control over financial reporting includes those policies and procedures that (i) pertain to the maintenance of records that, in reasonable detail, accurately and fairly reflect the transactions and dispositions of the assets of the company; (ii) provide reasonable assurance that transactions are recorded as necessary to permit preparation of financial statements in accordance with generally accepted accounting principles, and that receipts and expenditures of the company are being made only in accordance with authorizations of management and directors of the company; and (iii) provide reasonable assurance regarding prevention or timely detection of unauthorized acquisition, use, or disposition of the company’s assets that could have a material effect on the financial statements.
Because of its inherent limitations, internal control over financial reporting may not prevent or detect misstatements. Also, projections of any evaluation of effectiveness to future periods are subject to the risk that controls may become inadequate because of changes in conditions, or that the degree of compliance with the policies or procedures may deteriorate.
Critical Audit Matters
The critical audit matter communicated below is a matter arising from the current period audit of the consolidated financial statements that was communicated or required to be communicated to the audit committee and that (i) relates to accounts or disclosures that are material to the consolidated financial statements and (ii) involved our especially challenging, subjective, or complex judgments. The communication of critical audit matters does not alter in any way our opinion on the consolidated financial statements, taken as a whole, and we are not, by communicating the critical audit matter below, providing a separate opinion on the critical audit matter or on the accounts or disclosures to which it relates.
Valuation of Insurance Reserves
As described in Notes 2 and 2221 to the consolidated financial statements, the Company’s consolidated discounted insurance reserves balance was $53.5$45.9 million as of December 26, 2021.31, 2023. The Company carries insurance programs with specific retention levels or high per-claim deductibles for a significant portion of expected losses under its workers’ compensation, general or liquor liability, health, property and management liability insurance programs. The Company records a liability for all unresolved claims and for an estimate of incurred but not reported claims at the anticipated cost that falls below its specified retention levels or per-claim deductible amounts. In establishing reserves, management considers certain actuarial assumptions and judgments regarding economic conditions and the frequency and severity of claims. Reserves recorded for workers’ compensation and general liability claims are discounted using the average of the one-year and five-year risk-free rate of monetary assets that have comparable maturities.
The principal considerations for our determination that performing procedures relating to the valuation of insurance reserves is a critical audit matter are (i) the significant judgment by management when developing the estimated reserves, which in turn led to (ii) a high degree of auditor judgment, subjectivity, and effort in performing procedures and evaluating the actuarial assumptions related to economic conditions and the frequency and severity of claims, and (iii) the audit effort included the involvement of professionals with specialized skill and knowledge.
Addressing the matter involved performing procedures and evaluating audit evidence in connection with forming our overall opinion on the consolidated financial statements. These procedures included testing the effectiveness of controls relating to the valuation of insurance reserves. These procedures also included, among others, (i) evaluating management’s process for developing the insurance reserves, (ii) evaluating the appropriateness of management’s actuarial methods used, (iii) evaluating the reasonableness of the actuarial assumptions related to economic conditions and the frequency and severity of claims, and (iv) testing the completeness and accuracy of underlying
data used in the valuation. Evaluating the actuarial assumptions related to economic conditions and the frequency and severity of claims involved evaluating whether the assumptions were reasonable considering inflation and the environment, and whether these assumptions were consistent with evidence obtained in other areas of the audit. Professionals with specialized skill and knowledge were used to assist in evaluating the appropriateness of management’s actuarial methods used in determining the insurance reserves and evaluating the reasonableness of assumptions related to economic conditions.conditions.
/s/ PricewaterhouseCoopers LLP
Tampa, Florida
February 23, 202228, 2024
We have served as the Company’s auditorauditor since 1998.
BLOOMIN’ BRANDS, INC.
CONSOLIDATED BALANCE SHEETS
(IN THOUSANDS, EXCEPT SHARE AND PER SHARE DATA)
| | DECEMBER 26, 2021 | | DECEMBER 27, 2020 |
| DECEMBER 31, 2023 | | | DECEMBER 31, 2023 | | DECEMBER 25, 2022 |
| ASSETS | ASSETS | | | |
| Current assets | Current assets | |
| Current assets | |
| Current assets | |
| Cash and cash equivalents | |
| Cash and cash equivalents | |
| Cash and cash equivalents | Cash and cash equivalents | $ | 87,585 | | | $ | 109,980 | |
| Restricted cash and cash equivalents | Restricted cash and cash equivalents | 1,472 | | | 428 | |
| Inventories | Inventories | 79,112 | | | 61,928 | |
| | Other current assets, net | Other current assets, net | 184,623 | | | 151,518 | |
| Other current assets, net | |
| Other current assets, net | |
| Total current assets | Total current assets | 352,792 | | | 323,854 | |
| | Property, fixtures and equipment, net | |
| Property, fixtures and equipment, net | |
| Property, fixtures and equipment, net | Property, fixtures and equipment, net | 842,012 | | | 887,687 | |
| Operating lease right-of-use assets | Operating lease right-of-use assets | 1,130,873 | | | 1,172,910 | |
| Goodwill | Goodwill | 268,444 | | | 271,164 | |
| Intangible assets, net | Intangible assets, net | 453,412 | | | 459,983 | |
| Deferred income tax assets, net | Deferred income tax assets, net | 168,068 | | | 153,883 | |
| Other assets, net | Other assets, net | 78,670 | | | 92,626 | |
| Total assets | Total assets | $ | 3,294,271 | | | $ | 3,362,107 | |
| LIABILITIES AND STOCKHOLDERS’ EQUITY | LIABILITIES AND STOCKHOLDERS’ EQUITY | | | |
| Current liabilities | Current liabilities | |
| Current liabilities | |
| Current liabilities | |
| Accounts payable | Accounts payable | $ | 167,978 | | | $ | 141,457 | |
| Accounts payable | |
| Accounts payable | |
| Current operating lease liabilities | |
| Accrued and other current liabilities | Accrued and other current liabilities | 406,894 | | | 388,321 | |
| Unearned revenue | Unearned revenue | 398,795 | | | 381,616 | |
| Current portion of long-term debt | 10,958 | | | 38,710 | |
| | Total current liabilities | |
| Total current liabilities | |
| Total current liabilities | Total current liabilities | 984,625 | | | 950,104 | |
| Non-current operating lease liabilities | Non-current operating lease liabilities | 1,179,447 | | | 1,217,921 | |
| | Long-term debt, net | Long-term debt, net | 782,107 | | | 997,770 | |
| Long-term debt, net | |
| Long-term debt, net | |
| Other long-term liabilities, net | Other long-term liabilities, net | 125,242 | | | 185,355 | |
| Total liabilities | Total liabilities | 3,071,421 | | | 3,351,150 | |
| Commitments and contingencies (Note 22) | 0 | | 0 |
| Commitments and contingencies (Note 21) | | Commitments and contingencies (Note 21) | | | |
| | Stockholders’ equity | Stockholders’ equity | |
| | Stockholders’ equity | |
| | Stockholders’ equity | |
| Bloomin’ Brands stockholders’ equity | Bloomin’ Brands stockholders’ equity | |
| Preferred stock, $0.01 par value, 25,000,000 shares authorized; no shares issued and outstanding as of December 26, 2021 and December 27, 2020 | — | | | — | |
| Common stock, $0.01 par value, 475,000,000 shares authorized; 89,252,823 and 87,855,571 shares issued and outstanding as of December 26, 2021 and December 27, 2020, respectively | 893 | | | 879 | |
| Bloomin’ Brands stockholders’ equity | |
| Bloomin’ Brands stockholders’ equity | |
| Preferred stock, $0.01 par value, 25,000,000 shares authorized; no shares issued and outstanding as of December 31, 2023 and December 25, 2022 | |
| Preferred stock, $0.01 par value, 25,000,000 shares authorized; no shares issued and outstanding as of December 31, 2023 and December 25, 2022 | |
| Preferred stock, $0.01 par value, 25,000,000 shares authorized; no shares issued and outstanding as of December 31, 2023 and December 25, 2022 | |
| Common stock, $0.01 par value, 475,000,000 shares authorized; 86,968,536 and 87,696,200 shares issued and outstanding as of December 31, 2023 and December 25, 2022, respectively | |
| Additional paid-in capital | Additional paid-in capital | 1,119,728 | | | 1,132,808 | |
| Accumulated deficit | Accumulated deficit | (698,171) | | | (918,096) | |
| Accumulated other comprehensive loss | Accumulated other comprehensive loss | (205,989) | | | (211,446) | |
| Total Bloomin’ Brands stockholders’ equity | Total Bloomin’ Brands stockholders’ equity | 216,461 | | | 4,145 | |
| Noncontrolling interests | Noncontrolling interests | 6,389 | | | 6,812 | |
| Total stockholders’ equity | Total stockholders’ equity | 222,850 | | | 10,957 | |
| Total liabilities and stockholders’ equity | Total liabilities and stockholders’ equity | $ | 3,294,271 | | | $ | 3,362,107 | |
| The accompanying notes are an integral part of these consolidated financial statements. | | The accompanying notes are an integral part of these consolidated financial statements. | |
| The accompanying notes are an integral part of these consolidated financial statements. | |
BLOOMIN’ BRANDS, INC.
CONSOLIDATED STATEMENTS OF OPERATIONS AND COMPREHENSIVE INCOME (LOSS)
(IN THOUSANDS, EXCEPT PER SHARE DATA)
| | FISCAL YEAR |
| 2021 | | 2020 | | 2019 |
| FISCAL YEAR | | | FISCAL YEAR |
| 2023 | | | 2023 | | 2022 | | 2021 |
| Revenues | Revenues | | | | | |
| Restaurant sales | |
| Restaurant sales | |
| Restaurant sales | Restaurant sales | $ | 4,061,093 | | | $ | 3,144,636 | | | $ | 4,075,014 | |
| Franchise and other revenues | Franchise and other revenues | 61,292 | | | 25,925 | | | 64,375 | |
| Total revenues | Total revenues | 4,122,385 | | | 3,170,561 | | | 4,139,389 | |
| Costs and expenses | Costs and expenses | | | | | |
| Food and beverage costs | 1,229,689 | | | 982,702 | | | 1,277,824 | |
| Food and beverage | |
| Food and beverage | |
| Food and beverage | |
| Labor and other related | Labor and other related | 1,154,623 | | | 1,005,295 | | | 1,207,289 | |
| Other restaurant operating | Other restaurant operating | 1,006,371 | | | 846,566 | | | 982,051 | |
| Depreciation and amortization | Depreciation and amortization | 163,391 | | | 180,261 | | | 196,811 | |
| General and administrative | General and administrative | 245,616 | | | 254,356 | | | 275,239 | |
| | Provision for impaired assets and restaurant closings | Provision for impaired assets and restaurant closings | 13,737 | | | 76,354 | | | 9,085 | |
| Provision for impaired assets and restaurant closings | |
| Provision for impaired assets and restaurant closings | |
| Total costs and expenses | Total costs and expenses | 3,813,427 | | | 3,345,534 | | | 3,948,299 | |
| Income (loss) from operations | 308,958 | | | (174,973) | | | 191,090 | |
| Income from operations | |
| Loss on extinguishment and modification of debt | Loss on extinguishment and modification of debt | (2,073) | | | (237) | | | — | |
| Other income (expense), net | 26 | | | 131 | | | (143) | |
| Loss on fair value adjustment of derivatives, net | |
| | Interest expense, net | Interest expense, net | (57,614) | | | (64,442) | | | (49,257) | |
| Income (loss) before provision (benefit) for income taxes | 249,297 | | | (239,521) | | | 141,690 | |
| Provision (benefit) for income taxes | 26,384 | | | (80,726) | | | 7,573 | |
| Net income (loss) | 222,913 | | | (158,795) | | | 134,117 | |
| Less: net income (loss) attributable to noncontrolling interests | 7,358 | | | (80) | | | 3,544 | |
| Net income (loss) attributable to Bloomin’ Brands | 215,555 | | | (158,715) | | | 130,573 | |
| Redemption of preferred stock in excess of carrying value | — | | | (3,496) | | | — | |
| Net income (loss) attributable to common stockholders | $ | 215,555 | | | $ | (162,211) | | | $ | 130,573 | |
| Interest expense, net | |
| Interest expense, net | |
| Income before provision for income taxes | |
| Provision for income taxes | |
| Net income | |
| Less: net income attributable to noncontrolling interests | |
| Net income attributable to Bloomin’ Brands | |
| | Net income (loss) | $ | 222,913 | | | $ | (158,795) | | | $ | 134,117 | |
| Other comprehensive income (loss): | |
| | Net income | |
| | Net income | |
| | Net income | |
| Other comprehensive income: | |
| Foreign currency translation adjustment | Foreign currency translation adjustment | (6,597) | | | (37,516) | | | (16,625) | |
| Unrealized gain (loss) on derivatives, net of tax | 86 | | | (14,741) | | | (11,944) | |
| Reclassification of adjustments for loss on derivatives included in Net income (loss), net of tax | 7,392 | | | 9,923 | | | 1,805 | |
| Amortization of terminated interest rate swaps, net of tax | 4,576 | | | — | | | — | |
| Comprehensive income (loss) | 228,370 | | | (201,129) | | | 107,353 | |
| Less: comprehensive income (loss) attributable to noncontrolling interests | 7,358 | | | (744) | | | 3,801 | |
| Comprehensive income (loss) attributable to Bloomin’ Brands | $ | 221,012 | | | $ | (200,385) | | | $ | 103,552 | |
| Foreign currency translation adjustment | |
| Foreign currency translation adjustment | |
| | Earnings (loss) per share attributable to common stockholders: | |
| | Net (loss) gain on derivatives, including the impact of terminated swap agreements, net of tax | |
| | Net (loss) gain on derivatives, including the impact of terminated swap agreements, net of tax | |
| | Net (loss) gain on derivatives, including the impact of terminated swap agreements, net of tax | |
| Comprehensive income | |
| Less: comprehensive income attributable to noncontrolling interests | |
| Comprehensive income attributable to Bloomin’ Brands | |
| | Earnings per share: | |
| Earnings per share: | |
| Earnings per share: | |
| Basic | |
| Basic | |
| Basic | Basic | $ | 2.42 | | | $ | (1.85) | | | $ | 1.47 | |
| Diluted | Diluted | $ | 2.00 | | | $ | (1.85) | | | $ | 1.45 | |
| Weighted average common shares outstanding: | Weighted average common shares outstanding: | | | | | |
| Basic | Basic | 88,981 | | | 87,468 | | | 88,839 | |
| Basic | |
| Basic | |
| Diluted | Diluted | 107,803 | | | 87,468 | | | 89,777 | |
| | Cash dividends declared per common share | Cash dividends declared per common share | $ | — | | | $ | 0.20 | | | $ | 0.40 | |
| Cash dividends declared per common share | |
| Cash dividends declared per common share | |
The accompanying notes are an integral part of these consolidated financial statements.
BLOOMIN’ BRANDS, INC.
CONSOLIDATED STATEMENTS OF CHANGES IN STOCKHOLDERS’ EQUITY
(IN THOUSANDS, EXCEPT PER SHARE DATA)
| | BLOOMIN’ BRANDS | | | BLOOMIN’ BRANDS | | |
| COMMON STOCK | | | COMMON STOCK | | ADDITIONAL PAID-IN CAPITAL | | ACCUM-
ULATED DEFICIT | | ACCUMULATED OTHER
COMPREHENSIVE LOSS | | NON-CONTROLLING INTERESTS | | TOTAL |
| SHARES | |
| Balance,
December 27, 2020 | |
| Balance,
December 27, 2020 | |
| Balance,
December 27, 2020 | |
| Cumulative-effect from a change in accounting principle, net of tax | |
| Net income | |
| Other comprehensive income, net of tax | |
| | | BLOOMIN’ BRANDS | | | | |
| Stock-based compensation | |
| | Stock-based compensation | |
| | Stock-based compensation | |
| | COMMON STOCK | | ADDITIONAL PAID-IN CAPITAL | | ACCUM-
ULATED DEFICIT | | ACCUMULATED OTHER
COMPREHENSIVE LOSS | | NON-CONTROLLING INTERESTS | | TOTAL |
| | SHARES | | AMOUNT | |
| Common stock issued under stock plans (1) | |
| | Balance, December 30, 2018 | 91,272 | | | $ | 913 | | | $ | 1,107,582 | | | $ | (920,010) | | | $ | (142,755) | | | $ | 9,087 | | | $ | 54,817 | |
| Cumulative-effect from a change in accounting principle, net of tax | — | | | — | | | — | | | 141,285 | | | — | | | — | | | 141,285 | |
| Net income | — | | | — | | | — | | | 130,573 | | | — | | | 3,544 | | | 134,117 | |
| Other comprehensive (loss) income, net of tax | — | | | — | | | — | | | — | | | (27,055) | | | 291 | | | (26,764) | |
| Cash dividends declared, $0.40 per common share | — | | | — | | | (35,734) | | | — | | | — | | | — | | | (35,734) | |
| Repurchase and retirement of common stock | (5,469) | | | (55) | | | — | | | (106,937) | | | — | | | — | | | (106,992) | |
| Stock-based compensation | — | | | — | | | 19,951 | | | — | | | — | | | — | | | 19,951 | |
| Common stock issued under stock plans (1) | |
| | Common stock issued under stock plans (1) | Common stock issued under stock plans (1) | 1,143 | | | 11 | | | 2,696 | | | — | | | — | | | — | | | 2,707 | |
| Purchase of noncontrolling interests | Purchase of noncontrolling interests | — | | | — | | | (157) | | | — | | | 34 | | | 82 | | | (41) | |
| | Distributions to noncontrolling interests | Distributions to noncontrolling interests | — | | | — | | | — | | | — | | | — | | | (7,214) | | | (7,214) | |
| Distributions to noncontrolling interests | |
| Distributions to noncontrolling interests | |
| Contributions from noncontrolling interests | Contributions from noncontrolling interests | — | | | — | | | — | | | — | | | — | | | 1,349 | | | 1,349 | |
| Balance,
December 29, 2019 | 86,946 | | | $ | 869 | | | $ | 1,094,338 | | | $ | (755,089) | | | $ | (169,776) | | | $ | 7,139 | | | $ | 177,481 | |
| | Cumulative-effect from a change in accounting principle, net of tax | — | | | — | | | — | | | (4,292) | | | — | | | — | | | (4,292) | |
| Net loss | — | | | — | | | — | | | (158,715) | | | — | | | (80) | | | (158,795) | |
| Other comprehensive loss, net of tax | — | | | — | | | — | | | — | | | (42,187) | | | (147) | | | (42,334) | |
| Cash dividends declared, $0.20 per common share | — | | | — | | | (17,480) | | | — | | | — | | | — | | | (17,480) | |
| | Balance,
December 26, 2021 | |
| Balance,
December 26, 2021 | |
| Balance,
December 26, 2021 | |
| | Net income | |
| | Net income | |
| | Net income | |
| Other comprehensive income, net of tax | |
| Cash dividends declared, $0.56 per common share | |
| Repurchase and retirement of common stock | |
| Stock-based compensation | Stock-based compensation | — | | | — | | | 14,802 | | | — | | | — | | | — | | | 14,802 | |
| Consideration for preferred stock in excess of carrying value, net of tax | — | | | — | | | (3,496) | | | — | | | 517 | | | 1,261 | | | (1,718) | |
| | | Common stock issued under stock plans (1) | Common stock issued under stock plans (1) | 910 | | | 10 | | | (17) | | | — | | | — | | | — | | | (7) | |
| Purchase of noncontrolling interests | — | | | — | | | (156) | | | — | | | — | | | 96 | | | (60) | |
| | Common stock issued under stock plans (1) | |
| | Common stock issued under stock plans (1) | |
| Purchase of noncontrolling interests, net of tax of $489 | |
| | Distributions to noncontrolling interests | Distributions to noncontrolling interests | — | | | — | | | — | | | — | | | — | | | (1,908) | | | (1,908) | |
| Distributions to noncontrolling interests | |
| Distributions to noncontrolling interests | |
| Contributions from noncontrolling interests | Contributions from noncontrolling interests | — | | | — | | | — | | | — | | | — | | | 451 | | | 451 | |
| Equity component value of convertible note issuance, net of tax of $650 | — | | | — | | | 64,367 | | | — | | | — | | | — | | | 64,367 | |
| Sale of common stock warrant | — | | | — | | | 46,690 | | | — | | | — | | | — | | | 46,690 | |
| Purchase of convertible note hedge | — | | | — | | | (66,240) | | | — | | | — | | | — | | | (66,240) | |
| Balance,
December 27, 2020 | 87,856 | | | $ | 879 | | | $ | 1,132,808 | | | $ | (918,096) | | | $ | (211,446) | | | $ | 6,812 | | | $ | 10,957 | |
| Retirement of convertible senior note hedges | |
| Retirement of warrants | |
| Issuance of common stock from repurchase of convertible senior notes | |
| | | (CONTINUED...) |
| Balance,
December 25, 2022 | |
| Balance,
December 25, 2022 | |
| Balance,
December 25, 2022 | |
| | | | | | | | | | | | (CONTINUED...) | |
| | | | | | | | | | | (CONTINUED...) | |
| | | | | | | | | | | (CONTINUED...) | |
BLOOMIN’ BRANDS, INC.
CONSOLIDATED STATEMENTS OF CHANGES IN STOCKHOLDERS’ EQUITY
(IN THOUSANDS, EXCEPT PER SHARE DATA)
| | BLOOMIN’ BRANDS | | | BLOOMIN’ BRANDS | | |
| COMMON STOCK | | | COMMON STOCK | | ADDITIONAL PAID-IN CAPITAL | | ACCUM-
ULATED DEFICIT | | ACCUMULATED OTHER
COMPREHENSIVE LOSS | | NON-CONTROLLING INTERESTS | | TOTAL |
| SHARES | |
| | BLOOMIN’ BRANDS | | | | |
Balance,
December 25, 2022 | |
| | COMMON STOCK | | ADDITIONAL PAID-IN CAPITAL | | ACCUM-
ULATED DEFICIT | | ACCUMULATED OTHER
COMPREHENSIVE LOSS | | NON-CONTROLLING INTERESTS | | TOTAL |
Balance,
December 25, 2022 | |
| | SHARES | | AMOUNT | | ADDITIONAL PAID-IN CAPITAL | | ACCUM-
ULATED DEFICIT | | ACCUMULATED OTHER
COMPREHENSIVE LOSS | | NON-CONTROLLING INTERESTS | | TOTAL |
Balance,
December 25, 2022 | |
| Balance,
December 27, 2020 | 87,856 | | | $ | 879 | | | $ | 1,132,808 | | | $ | (918,096) | | | $ | (211,446) | | | $ | 6,812 | | | $ | 10,957 | |
| Cumulative-effect from a change in accounting principle, net of tax | — | | | — | | | (47,323) | | | 4,370 | | | — | | | — | | | (42,953) | |
| Net income | |
| Net income | |
| Net income | Net income | — | | | — | | | — | | | 215,555 | | | — | | | 7,358 | | | 222,913 | |
| Other comprehensive income, net of tax | Other comprehensive income, net of tax | — | | | — | | | — | | | — | | | 5,457 | | | — | | | 5,457 | |
| | Cash dividends declared, $0.96 per common share | |
| Repurchase and retirement of common stock, including excise tax of $136 | |
| Stock-based compensation | Stock-based compensation | — | | | — | | | 24,405 | | | — | | | — | | | — | | | 24,405 | |
| | Common stock issued under stock plans (1) | Common stock issued under stock plans (1) | 1,397 | | | 14 | | | 9,836 | | | — | | | — | | | — | | | 9,850 | |
| Purchase of noncontrolling interests | — | | | — | | | 2 | | | — | | | — | | | (5) | | | (3) | |
| | Common stock issued under stock plans (1) | |
| | Common stock issued under stock plans (1) | |
| | Distributions to noncontrolling interests | |
| | Distributions to noncontrolling interests | |
| | Distributions to noncontrolling interests | Distributions to noncontrolling interests | — | | | — | | | — | | | — | | | — | | | (9,123) | | | (9,123) | |
| Contributions from noncontrolling interests | Contributions from noncontrolling interests | — | | | — | | | — | | | — | | | — | | | 1,347 | | | 1,347 | |
| | Balance, December 26, 2021 | 89,253 | | | $ | 893 | | | $ | 1,119,728 | | | $ | (698,171) | | | $ | (205,989) | | | $ | 6,389 | | | $ | 222,850 | |
| Balance,
December 31, 2023 | |
| Balance,
December 31, 2023 | |
| Balance,
December 31, 2023 | |
|
(1)Net of forfeitures and shares withheld for employee taxes.
The accompanying notes are an integral part of these consolidated financial statements.
BLOOMIN’ BRANDS, INC.
CONSOLIDATED STATEMENTS OF CASH FLOWS
(DOLLARS IN THOUSANDS)
| | FISCAL YEAR |
| 2021 | | 2020 | | 2019 |
| FISCAL YEAR | | | FISCAL YEAR |
| 2023 | | | 2023 | | 2022 | | 2021 |
| | Cash flows provided by operating activities: | Cash flows provided by operating activities: | |
| Net income (loss) | $ | 222,913 | | | $ | (158,795) | | | $ | 134,117 | |
| Adjustments to reconcile Net income (loss) to cash provided by operating activities: | | | | |
| Cash flows provided by operating activities: | |
| Cash flows provided by operating activities: | |
| Net income | |
| Net income | |
| Net income | |
| Adjustments to reconcile Net income to cash provided by operating activities: | |
| Depreciation and amortization | |
| Depreciation and amortization | |
| Depreciation and amortization | Depreciation and amortization | 163,391 | | | 180,261 | | | 196,811 | |
| Amortization of debt discounts and issuance costs | Amortization of debt discounts and issuance costs | 4,494 | | | 10,142 | | | 2,517 | |
| Amortization of deferred gift card sales commissions | Amortization of deferred gift card sales commissions | 26,012 | | | 20,927 | | | 26,094 | |
| | Provision for impaired assets and restaurant closings | Provision for impaired assets and restaurant closings | 13,737 | | | 76,354 | | | 9,085 | |
| Amortization of unrealized loss on terminated interest rate swaps | 6,160 | | | — | | | — | |
| Provision for impaired assets and restaurant closings | |
| Provision for impaired assets and restaurant closings | |
| Non-cash interest expense from terminated interest rate swaps | |
| Non-cash operating lease costs | Non-cash operating lease costs | 78,272 | | | 74,436 | | | 73,357 | |
| Provision for expected credit losses and contingent lease liabilities | 946 | | | 7,225 | | | — | |
| Inventory obsolescence and spoilage | — | | | 10,169 | | | — | |
| Stock-based and other non-cash compensation expense | 24,405 | | | 14,802 | | | 24,651 | |
| Deferred income tax benefit | (3,346) | | | (88,256) | | | (25,890) | |
| (Benefit) provision for expected credit losses and contingent lease liabilities | |
| | Stock-based compensation expense | |
| Stock-based compensation expense | |
| Stock-based compensation expense | |
| Deferred income tax (benefit) expense | |
| | Loss on extinguishment and modification of debt | |
| | (Gain) loss on disposal of property, fixtures and equipment | (1,322) | | | 1,261 | | | (2,984) | |
| Loss on extinguishment and modification of debt | |
| | Loss on extinguishment and modification of debt | |
| | Loss on fair value adjustment of derivatives, net | |
| | Loss on fair value adjustment of derivatives, net | |
| | Loss on fair value adjustment of derivatives, net | |
| Other, net | Other, net | 1,516 | | | (4,956) | | | (10,265) | |
| Change in assets and liabilities: | Change in assets and liabilities: | | | |
| (Increase) decrease in inventories | (18,210) | | | 19,857 | | | (15,388) | |
| (Increase) decrease in other current assets | (58,397) | | | 14,392 | | | (40,519) | |
| (Increase) decrease in other assets | (2,073) | | | 3,688 | | | (890) | |
| Decrease (increase) in inventories | |
| Decrease (increase) in inventories | |
| Decrease (increase) in inventories | |
| Decrease (increase) in other current assets | |
| Increase in other assets | |
| Decrease in operating right-of-use assets, net | Decrease in operating right-of-use assets, net | 160 | | | 412 | | | 391 | |
| Increase (decrease) in accounts payable and accrued and other current liabilities | Increase (decrease) in accounts payable and accrued and other current liabilities | 25,619 | | | (61,638) | | | (23,497) | |
| | Increase in unearned revenue | 17,225 | | | 10,569 | | | 26,676 | |
| (Decrease) increase in unearned revenue | |
| (Decrease) increase in unearned revenue | |
| (Decrease) increase in unearned revenue | |
| Decrease in operating lease liabilities | Decrease in operating lease liabilities | (90,387) | | | (50,626) | | | (69,886) | |
| (Decrease) increase in other long-term liabilities | (8,660) | | | 58,625 | | | 13,223 | |
| Increase (decrease) in other long-term liabilities | |
| Net cash provided by operating activities | Net cash provided by operating activities | 402,455 | | | 138,849 | | | 317,603 | |
| Cash flows used in investing activities: | Cash flows used in investing activities: | | | | | |
| | Proceeds from disposal of property, fixtures and equipment | Proceeds from disposal of property, fixtures and equipment | 9,322 | | | 2,178 | | | 18,291 | |
| Proceeds from sale-leaseback transactions, net | — | | | — | | | 7,085 | |
| | Proceeds from disposal of property, fixtures and equipment | |
| | Proceeds from disposal of property, fixtures and equipment | |
| | | Proceeds received from company-owned life insurance | |
| | Proceeds received from company-owned life insurance | |
| | Proceeds received from company-owned life insurance | |
| Capital expenditures | Capital expenditures | (122,830) | | | (87,842) | | | (161,926) | |
| Other investments, net | Other investments, net | 8,763 | | | 9,025 | | | 5,259 | |
| Net cash used in investing activities | Net cash used in investing activities | $ | (104,745) | | | $ | (76,639) | | | $ | (131,291) | |
| | | (CONTINUED...) |
| | | (CONTINUED...) | |
| | | (CONTINUED...) | |
| | | (CONTINUED...) | |
BLOOMIN’ BRANDS, INC.
CONSOLIDATED STATEMENTS OF CASH FLOWS
(DOLLARS IN THOUSANDS)
| | FISCAL YEAR |
| 2021 | | 2020 | | 2019 |
| FISCAL YEAR | | | FISCAL YEAR |
| 2023 | | | 2023 | | 2022 | | 2021 |
| | Cash flows used in financing activities: | Cash flows used in financing activities: | |
| Cash flows used in financing activities: | |
| Cash flows used in financing activities: | |
| Proceeds from issuance of long-term debt | |
| Proceeds from issuance of long-term debt | |
| Proceeds from issuance of long-term debt | Proceeds from issuance of long-term debt | $ | 200,000 | | | $ | — | | | $ | — | |
| | Repayments of long-term debt and finance lease obligations | |
| Repayments of long-term debt and finance lease obligations | |
| Repayments of long-term debt and finance lease obligations | Repayments of long-term debt and finance lease obligations | (431,166) | | | (26,326) | | | (27,259) | |
| Proceeds from borrowings on revolving credit facilities | Proceeds from borrowings on revolving credit facilities | 470,000 | | | 505,000 | | | 670,800 | |
| Repayments of borrowings on revolving credit facilities | Repayments of borrowings on revolving credit facilities | (837,000) | | | (657,000) | | | (671,300) | |
| Financing fees | Financing fees | (5,868) | | | (3,096) | | | — | |
| Proceeds from issuance of senior notes | Proceeds from issuance of senior notes | 300,000 | | | — | | | — | |
| Proceeds from issuance of convertible senior notes | — | | | 230,000 | | | — | |
| Proceeds from issuance of warrants | — | | | 46,690 | | | — | |
| Purchase of convertible note hedge | — | | | (66,240) | | | — | |
| Issuance costs related to senior notes | Issuance costs related to senior notes | (5,546) | | | (8,416) | | | — | |
| Proceeds (payments of taxes) from share-based compensation, net | 9,850 | | | (7) | | | 2,707 | |
| | Principal settlements and repurchase of convertible senior notes | |
| Principal settlements and repurchase of convertible senior notes | |
| Principal settlements and repurchase of convertible senior notes | |
| | Proceeds from retirement of convertible senior note hedges | |
| Proceeds from retirement of convertible senior note hedges | |
| Proceeds from retirement of convertible senior note hedges | |
| | Payments for retirement of warrants | |
| Payments for retirement of warrants | |
| Payments for retirement of warrants | |
| Proceeds from share-based compensation, net | |
| Distributions to noncontrolling interests | Distributions to noncontrolling interests | (9,123) | | | (1,908) | | | (7,214) | |
| Contributions from noncontrolling interests | Contributions from noncontrolling interests | 1,347 | | | 451 | | | 1,349 | |
| Purchase of limited partnership and noncontrolling interests | (3) | | | (60) | | | (41) | |
| Purchase of noncontrolling interests | |
| Payments for partner equity plan | Payments for partner equity plan | (9,910) | | | (16,906) | | | (15,675) | |
| Repurchase of common stock | Repurchase of common stock | — | | | — | | | (106,992) | |
| | Cash dividends paid on common stock | Cash dividends paid on common stock | — | | | (17,480) | | | (35,734) | |
| Redemption of subsidiary preferred stock | — | | | (1,475) | | | — | |
| Cash dividends paid on common stock | |
| Cash dividends paid on common stock | |
| | Net cash used in financing activities | |
| Net cash used in financing activities | |
| Net cash used in financing activities | Net cash used in financing activities | (317,419) | | | (16,773) | | | (189,359) | |
| Effect of exchange rate changes on cash and cash equivalents | Effect of exchange rate changes on cash and cash equivalents | (1,642) | | | (2,174) | | | (1,631) | |
| Net (decrease) increase in cash, cash equivalents and restricted cash | (21,351) | | | 43,263 | | | (4,678) | |
| Net increase (decrease) in cash, cash equivalents and restricted cash | |
| Cash, cash equivalents and restricted cash as of the beginning of the period | Cash, cash equivalents and restricted cash as of the beginning of the period | 110,408 | | | 67,145 | | | 71,823 | |
| Cash, cash equivalents and restricted cash as of the end of the period | Cash, cash equivalents and restricted cash as of the end of the period | $ | 89,057 | | | $ | 110,408 | | | $ | 67,145 | |
| Supplemental disclosures of cash flow information: | Supplemental disclosures of cash flow information: | | | | | |
| Cash paid for interest | Cash paid for interest | $ | 47,036 | | | $ | 52,630 | | | $ | 47,893 | |
| Cash paid for interest | |
| Cash paid for interest | |
| Cash paid for income taxes, net of refunds | Cash paid for income taxes, net of refunds | $ | 36,336 | | | $ | 8,415 | | | $ | 23,995 | |
| Supplemental disclosures of non-cash investing and financing activities: | Supplemental disclosures of non-cash investing and financing activities: | | |
| Leased assets obtained in exchange for new operating lease liabilities | Leased assets obtained in exchange for new operating lease liabilities | $ | 43,363 | | | $ | 19,451 | | | $ | 67,955 | |
| Leased assets obtained in exchange for new operating lease liabilities | |
| Leased assets obtained in exchange for new operating lease liabilities | |
| Leased assets obtained in exchange for new finance lease liabilities | Leased assets obtained in exchange for new finance lease liabilities | $ | 1,238 | | | $ | 1,367 | | | $ | 208 | |
| | Increase (decrease) in liabilities from the acquisition of property, fixtures and equipment | $ | 2,344 | | | $ | 1,152 | | | $ | (2,899) | |
| Increase in liabilities from the acquisition of property, fixtures and equipment | |
| Increase in liabilities from the acquisition of property, fixtures and equipment | |
| Increase in liabilities from the acquisition of property, fixtures and equipment | |
|
The accompanying notes are an integral part of these consolidated financial statements.
BLOOMIN’ BRANDS, INC.
NOTES TO CONSOLIDATED FINANCIAL STATEMENTS
1. Description of the Business
Bloomin’ Brands, Inc. (“Bloomin’ Brands” or the “Company”), a holding company that conducts its operations through its subsidiaries, is one of the largest casual dining restaurant companies in the world, with a portfolio of leading, differentiated restaurant concepts. OSI Restaurant Partners, LLC (“OSI”) is the Company’s primary operating entity.
The Company owns and operates casual, upscale casual and fine dining restaurants. The Company’s restaurant portfolio has 4four concepts: Outback Steakhouse, Carrabba’s Italian Grill, Bonefish Grill and Fleming’s Prime Steakhouse & Wine Bar. Additional Outback Steakhouse, Carrabba’s Italian Grill and Bonefish Grill restaurants in which the Company has no direct investment are operated under franchise agreements.
2. Summary of Significant Accounting Policies
Basis of Presentation - The Company’s consolidated financial statements include the accounts and operations of Bloomin’ Brands and its subsidiaries.
To ensure timely reporting, the Company consolidates the results of its Brazil operations on a one-month calendar lag. There were no intervening events that would materially affect the Company’s consolidated financial position, results of operations or cash flows as of and for the year ended December 26, 2021.
COVID-19 Pandemic - In March 2020, the Company temporarily closed all restaurant dining rooms to comply with state and local regulations in response to the COVID-19 pandemic (“COVID-19”). In early May 2020, the Company began to reopen its restaurant dining rooms with limited seating capacity in compliance with state and local regulations. The temporary closure of the Company’s dining rooms and the limitations on seating capacity due to the COVID-19 pandemic resulted in significantly reduced traffic in its restaurants which negatively impacted its operating results during 2020. See Note 3 - 2020 COVID-19 Charges for details regarding certain charges resulting from the COVID-19 pandemic.31, 2023.
During 2021, the recovery of in-restaurant dining from the COVID-19 pandemic (“COVID-19”) continued as COVID-19 capacity restrictions were eased or eliminated. Concerns over the variants of COVID-19 impacted this recovery, however,while the Company continued to retainretained a significant portion of the incremental off-premises volume it achieved while itsduring 2020. Internationally, COVID-19-related capacity constraints continued in 2021 during periods of increased case counts and new variants until the middle of 2022 when in-restaurant dining rooms were closed last year.was operating without COVID-19-related capacity constraints.
Principles of Consolidation - All intercompany accounts and transactions have been eliminated in consolidation.
The Company consolidates variable interest entities where it has been determined that the Company is the primary beneficiary of those entities’ operations. The Company is a franchisor of 329 full-service291 restaurants and off-premises kitchens as of December 26, 2021,31, 2023, but does not possess any ownership interests in its franchisees and does not provide material direct financial support to its franchisees. These franchise relationships are not deemed variable interest entities and are not consolidated.
Investments in entities the Company does not control, but where the Company’s interest is generally between 20% and 50% and the Company has the ability to exercise significant influence over the entity, are accounted for under the equity method.
Fiscal Year - The Company utilizes a 52-53-week year ending on the last Sunday in December. In a 52-week fiscal year, each quarterly period is comprised of 13 weeks. The additional week in a 53-week fiscal year is added to the fourth quarter. All periods presentedFiscal year 2023 consisted of 53 weeks and fiscal years 2022 and 2021 consisted of 52 weeks. The additional operating week of 2023 resulted in increases of $83.5 million of Total revenues and $0.15 of GAAP diluted earnings per share in the Consolidated Statements of Operations and Comprehensive Income.
Use of Estimates - The preparation of the accompanying consolidated financial statements in conformity with generally accepted accounting principles requires management to make estimates and assumptions that affect the
BLOOMIN’ BRANDS, INC.
NOTES TO CONSOLIDATED FINANCIAL STATEMENTS - Continued
reported amounts of assets and liabilities and disclosure of contingent assets and liabilities at the date of the financial statements and the reported amounts of revenues and expenses during the reporting period. Actual results could differ from those estimated.
Cash and Cash Equivalents - Cash equivalents consist of investments that are readily convertible to cash with an original maturity date of three months or less. Cash and cash equivalents include $41.3$56.2 million and $37.1$41.5 million, as
BLOOMIN’ BRANDS, INC.
NOTES TO CONSOLIDATED FINANCIAL STATEMENTS - Continued
of December 26, 202131, 2023 and December 27, 2020,25, 2022, respectively, for amounts in transit from credit card companies since settlement is reasonably assured.
Restricted Cash - From time to time, the Company may have short-term restricted cash balances consisting of amounts pledged for settlement of deferred compensation plan obligations.
Concentrations of Credit and Counterparty Risk - Financial instruments that potentially subject the Company to a concentration of credit risk and credit losses are through credit card and trade receivables consisting primarily of amounts due for gift card, vendor, franchise and other receivables. Gift card, vendor and other receivables consist primarily of amounts due from gift card resellers and vendor rebates. The Company considers the concentration of credit risk for gift card, vendor and other receivables to be minimal due to the payment histories and general financial condition of its gift card resellers and vendors. Amounts due from franchisees consist of initial franchise fees, royalty income and advertising fees. See Note 87 - Other Current Assets, Net for disclosure of trade receivables by category as of December 26, 202131, 2023 and December 27, 2020.25, 2022.
Financial instruments that potentially subject the Company to concentrations of counterparty risk are cash and cash equivalents restricted cash and derivatives. The Company attempts to limit its counterparty risk by investing in certificates of deposit, money market funds, noninterest-bearing accounts and other highly rated investments. Whenever possible, the Company selects investment grade counterparties and rated money market funds in order to mitigate its counterparty risk. At times, cash balances may be in excess of FDIC insurance limits. See Note 1716 - Derivative Instruments and Hedging Activities for a discussion of the Company’s use of derivative instruments and management of credit risk inherent in derivative instruments.
Allowance for Expected Credit Losses - The Company evaluates the collectability of credit card and trade receivables based on historical loss experience by risk pool and records periodic adjustments for factors such as deterioration of economic conditions, specific customer circumstances and changes in the aging of accounts receivable balances. Losses are charged off in the period in which they are determined to be uncollectible. See Note 2019 - Allowance for Expected Credit Losses for a discussion of the Company’s allowance for expected credit losses.
In instances where there is no established loss history, S&P speculative-grade default rates are utilized as an estimated expected credit loss rate.
The Company assigned its interest, and is contingently liable, under certain real estate leases, primarily related to divested restaurant properties. Contingent lease liabilities related to these guarantees are calculated based on management’s estimate of exposure to losses which includes historical analysis of credit losses, including known instances of default, and existing economic conditions. See Note 2221 - Commitments and Contingencies for a discussion of the Company’s contingent lease liabilities.
In instances where there is no established loss history, S&P speculative-grade default rates are utilized as an estimated expected credit loss rate.
Fair Value - Fair value is the price that would be received for an asset or paid to transfer a liability, or the exit price, in an orderly transaction between market participants on the measurement date. Fair value is categorized into one of the following three levels based on the lowest level of significant input:
| | | | | |
| Level 1 | Unadjusted quoted market prices in active markets for identical assets or liabilities |
| Level 2 | Observable inputs available at measurement date other than quoted prices included in Level 1 |
| Level 3 | Unobservable inputs that cannot be corroborated by observable market data |
Inventories - Inventories consist of food and beverages and are stated at the lower of cost (first-in, first-out) or net realizable value.
BLOOMIN’ BRANDS, INC.
NOTES TO CONSOLIDATED FINANCIAL STATEMENTS - Continued
Restricted Cash - From time to time, the Company may have short-term restricted cash balances consisting of amounts pledged for settlement of deferred compensation plan obligations.
Property, Fixtures and Equipment - Property, fixtures and equipment are stated at cost, net of accumulated depreciation. Depreciation is computed on the straight-line method over the estimated useful life of the assets. Estimated useful lives by major asset category are generally as follows:
| | | | | |
| Buildings (1) | 5 to 30 years |
| Furniture and fixtures | 5 to 7 years |
| Equipment | 2 to 7 years |
| |
| Computer equipment and software | 32 to 7 years |
____________________
(1)Includes improvements to leased properties which are depreciated over the shorter of their useful life or the reasonably certain lease term, including renewal periods that are reasonably certain.
Repair and maintenance costs that maintain the appearance and functionality of the restaurant, but do not extend the useful life of any restaurant asset, are expensed as incurred. The Company suspends depreciation and amortization for assets held for sale. The cost and related accumulated depreciation of assets sold or disposed of are removed from the Company’s Consolidated Balance Sheets, and any resulting gain or loss is generally recognized in Other restaurant operating expense in its Consolidated Statements of Operations and Comprehensive Income (Loss).Income.
The Company capitalizes direct and indirect internal costs associated with the acquisition, development, design and construction of Company-owned restaurant locations as these costs have a future benefit to the Company. Upon restaurant opening, these costs are depreciated and charged to depreciationDepreciation and amortization expense.expense over the reasonably certain lease term. Internal costs of $3.7$5.4 million, $2.7$4.1 million and $6.4$3.7 million were capitalized during 2021, 20202023, 2022 and 2019,2021, respectively.
For 20212023 and 2020,2022, computer equipment and software costs of $3.4$12.4 million and $1.4$9.2 million, respectively, were capitalized. As of December 26, 202131, 2023 and December 27, 2020,25, 2022, there was $6.4$14.3 million and $8.8$10.1 million, respectively, of unamortized computer equipment and software included in Property, fixtures and equipment, net on the Company’s Consolidated Balance Sheets.
Goodwill and Intangible Assets - Goodwill represents the excess of the purchase price over the fair value of net assets acquired in business combinations and is assigned to the reporting unit in which the acquired business will operate. The Company’s indefinite-lived intangible assets consist of trade names and are recorded at fair value as of the date of acquisition. Goodwill and indefinite-lived intangible assets are tested for impairment annually, as of the first day of the second fiscal quarter, or whenever events or changes in circumstances indicate that the carrying amount may not be recoverable.
The Company may elect to perform a qualitative assessment to determine whether it is more likely than not that a reporting unit is impaired. If the qualitative assessment is not performed or if the Company determines that it is not more likely than not that the fair value of the reporting unit exceeds the carrying value, the fair value of the reporting unit is calculated. The carrying value of the reporting unit is compared to its estimatedcalculated fair value, with any excess of carrying value over fair value deemed to be an indicator of impairment.
Definite-lived intangible assets, which consist primarily of trademarks and reacquired franchise rights, are recorded at fair value as of the date of acquisition, amortized over their estimated useful lives and tested for impairment, using the relief from royalty method and discounted cash flows model, respectively, whenever events or changes in circumstances indicate that the carrying value may not be recoverable.
Derivatives - The Company records all derivatives on the balance sheet at fair value. The accounting for changes in the fair value of derivatives depends on the intended use of the derivative, whether the Company has elected to designate a derivative in a hedging relationship and apply hedge accounting and whether the hedging relationship has satisfied the criteria necessary to apply hedge accounting.
BLOOMIN’ BRANDS, INC.
NOTES TO CONSOLIDATED FINANCIAL STATEMENTS - Continued
designate a derivative in a hedging relationship and apply hedge accounting and whether the hedging relationship has satisfied the criteria necessary to apply hedge accounting.
Derivatives designated and qualifying as a hedge of the exposure to variability in expected future cash flows, or other types of forecasted transactions, are considered cash flow hedges. If the derivative qualifies for hedge accounting treatment, any gain or loss on the derivative instrument is recognized in equity as a change to Accumulated other comprehensive loss and reclassified into earnings in the same period or periods during which the hedged transaction affects earnings.
Unrealized gains or losses on the Company’s interest rate swaps are reclassified to Interest expense, net as interest payments are made on the hedged portion of the Company’s revolving credit facility. The Company has elected to record cash flows from interest rate swaps within operating activities, the same category as the items being hedged, in its Consolidated Statements of Cash Flows.
The Company may enter into derivative contracts that are intended to economically hedge certain of its risk,risks, even though hedge accounting does not apply or the Company elects not to apply hedge accounting. Derivatives not designated as hedges are not speculative and are used to manage the Company’s exposure to interest rate movements, foreign currency exchange rate movements, changes in energy prices and other identified risks. Changes in the fair value of derivatives not designated in hedging relationships are recorded directly in earnings. The Company has elected not to offset derivative positions in the balance sheet with the same counterparty under the same agreement.
Deferred Debt Issuance Costs - For its revolving credit facility, the Company records deferred debt issuance costs related to the issuance of debt obligations in Other assets, net on its Consolidated Balance Sheets. For fees associated with all other debt obligations, the Company records deferred debt issuance costs as a reduction of Long-term debt, net.
The Company amortizes deferred debt issuance costs to interest expense over the term of the respective financing arrangement, primarily using the effective interest method. The Company amortized deferred debt issuance costs of $4.5$3.1 million, $3.9$3.5 million and $2.5$4.5 million to Interest expense, net for 2021, 20202023, 2022 and 2019,2021, respectively.
Liquor Licenses - The fees from obtaining non-transferable liquor licenses directly issued by local government agencies for nominal fees are expensed as incurred. The costs of purchasing transferable liquor licenses through open markets in jurisdictions with a limited number of authorized liquor licenses are capitalized as indefinite-lived intangible assets and included in Other assets, net on the Company’s Consolidated Balance Sheets. Liquor licenses are reviewed for impairment annually or more frequently if events or changes in circumstances indicate that the carrying amount may not be recoverable.
Insurance Reserves - The Company carries insurance programs with specific retention levels or high per-claim deductibles for a significant portion of expected losses under its workers’ compensation, general or liquor liability, health, property and management liability insurance programs. The Company records a liability for all unresolved claims and for an estimate of incurred but not reported claims at the anticipated cost that falls below its specified retention levels or per-claim deductible amounts. In establishing reserves, the Company considers actuarial assumptions and judgments regarding economic conditions, and the frequency and severity of claims. Reserves recorded for workers’ compensation and general liability claims are discounted using the average of the one-year and five-year risk-free rate of monetary assets that have comparable maturities.
Share Repurchase -Shares repurchased are retired. The par value of the repurchased shares is deducted from common stock and the excess of the purchase price over the par value of the shares, including broker commissions and excises taxes, is recorded to Accumulated deficit. All shares of common stock acquired through share repurchase programs are retired and restored to authorized but unissued shares of common stock. The Company has elected to record excise taxes in connection with share repurchases within operating activities in its Consolidated Statements of Cash Flows.
Revenue Recognition - The Company records food and beverage revenues, net of discounts and taxes, upon delivery to the customer. Franchise-related revenues are included in Franchise and other revenues in the Company’s
BLOOMIN’ BRANDS, INC.
NOTES TO CONSOLIDATED FINANCIAL STATEMENTS - Continued
Consolidated Statements of Operations and Comprehensive Income (Loss).Income. Royalties, which are generally a percentage of net sales of the franchisee, are recognized as revenue in the period in which the sales are reported to have occurred provided collectability is reasonably assured.
Proceeds from the sale of gift cards, which do not have expiration dates, are recorded as deferred revenue and recognized as revenue upon redemption by the customer. The Company applies the portfolio approach practical
BLOOMIN’ BRANDS, INC.
NOTES TO CONSOLIDATED FINANCIAL STATEMENTS - Continued
expedient to account for gift card contracts and performance obligations. Gift card breakage, the amount of gift cards which will not be redeemed, is recognized using estimates based on historical redemption patterns. If actual redemptions vary from assumptions used to estimate breakage, gift card breakage income may differ from the amount recorded. The Company periodically updates its estimates used for breakage. Breakage revenue is recorded as a component of Restaurant sales in the Company’s Consolidated Statements of Operations and Comprehensive Income (Loss).Income. Approximately 84% of deferred gift card revenue is expected to be recognized within 12 months of inception.
Gift card sales commissions paid to third-party providers are capitalized and subsequently amortized to Other restaurant operating expense based on historical gift card redemption patterns. See Note 43 - Revenue Recognition for rollforwards of deferred gift card sales commissions and unearned gift card revenue.
Advertising fees charged to franchisees are recognized in Franchise and other revenues in the Company’s Consolidated Statements of Operations and Comprehensive Income (Loss) provided collectability is reasonably assured. Initial franchise and renewal fees are recognized over the term of the franchise agreement and renewal period, respectively. The weighted average remaining term of franchise agreements and renewal periods was approximately 1211 years as of December 26, 2021.31, 2023.
The Company maintains a customer loyalty program, Dine Rewards, in the U.S., where customers earn a reward after attaining qualified spend amounts. The Company’s estimate of the fair value of the reward is recorded as deferred revenue. Each reward must be redeemed within specified time limits of earning such reward. The revenue associated with the fair value of the rewardRevenue is recognizedrecorded upon the earlier of redemption or expiration of the reward.and breakage for unredeemed rewards is recorded proportional to historical redemption patterns. The Company applies the practical expedient to exclude disclosures regarding loyalty program remaining performance obligations, which have original expected durations of less than one year.
The Company collects and remits sales, food and beverage, alcoholic beverage and hospitality taxes on transactions with customers and reports revenue net of taxes in its Consolidated Statements of Operations and Comprehensive Income (Loss).Income.
Leases - The Company’s determination of whether an arrangement contains a lease is based on an evaluation of whether the arrangement conveys the right to use and control specific property or equipment. The Company leases restaurant and office facilities and certain equipment under operating leases primarily having initial terms between one and 20 years. Restaurant facility leases generally have renewal periods totaling five to 30 years, exercisable at the option of the Company. Contingent rentals represent payment of variable lease obligations based on a percentage of gross revenues, as defined by the terms of the applicable lease agreement for certain restaurant facility leases. The Company also has certain leases which reset periodically based on a specified index. Such leases are recorded using the index that existed at lease commencement. Subsequent changes in the index are recorded as variable rental payments. Variable rental payments are expensed as incurred in the Company’s Consolidated Statements of Operations and Comprehensive Income (Loss) and future variable rent obligations are not included within the lease liabilities on the Consolidated Balance Sheets. The depreciable life of lease assets and leasehold improvements are limited by the expected lease term. None of the Company’s leases contain any material residual value guarantees or restrictive covenants.
TheUpon the 2019 adoption of ASC Topic 842 - Leases, the Company accounts for fixedelected the practical expedient to not separate U.S. lease and non-lease components of a restaurant facility lease as a single lease component.for real estate leases entered into after adoption. Additionally, for certain equipment leases, the Company applies a portfolio approach to account for the lease assets and liabilities. Leases
BLOOMIN’ BRANDS, INC.
NOTES TO CONSOLIDATED FINANCIAL STATEMENTS - Continued
with an initial term of 12 months or less are not recorded on its Consolidated Balance Sheets and are recognized on a straight-line basis over the lease term within Other restaurant operating expense in the Company’s Consolidated Statements of Operations and Comprehensive Income (Loss).Income.
Rent expense for the Company’s operating leases, which generally have escalating rentals over the term of the lease and may include rent holidays, is recorded on a straight-line basis over the initial lease term and those renewal periods that are reasonably certain. RentOperating lease rent expense for open Company-owned restaurants is recorded in Other restaurant operating expense in the Company’s
BLOOMIN’ BRANDS, INC.
NOTES TO CONSOLIDATED FINANCIAL STATEMENTS - Continued
Consolidated Statements of Operations and Comprehensive Income (Loss).Income. Payments received from landlords as incentives for leasehold improvements are recorded as a reduction of the right-of-use asset and amortized on a straight-line basis over the term of the lease as a reduction of rent expense.
In April 2020, the FASB issued a question-and-answer document focused on the application of lease accounting guidance to lease concessions provided as a result of COVID-19 (the “Lease Modification Q&A”). The Lease Modification Q&A provides entities with the option to elect to account for lease concessions as though the enforceable rights and obligations existed in the original lease when the total cash flows resulting from the modified lease are substantially similar to the cash flows in the original lease. The Company elected this practical expedient for COVID-19-related rent concessions, primarily rent deferrals or rent abatements, and has elected not to remeasure the related lease liability and right-of-use asset for those leases. Rent deferrals are accrued with no impact to straight-line rent expense. Rent abatements are recognized as a reduction of variable rent expense in the month they occur. This election will continue while these concessions are in effect.
Pre-Opening Expenses - Non-capital expenditures associated with opening new restaurants are expensed as incurred and are included in Other restaurant operating expense in the Company’s Consolidated Statements of Operations and Comprehensive Income (Loss).Income.
Consideration Received from Vendors - The Company receives consideration for a variety of vendor-sponsored programs, such as volume rebates, promotions and advertising allowances. Advertising allowances are intended to offset the Company’s costs of promoting and selling menu items in its restaurants. Vendor consideration is recorded as a reduction of Food and beverage costscost or Other restaurant operating expense when recognized in the Company’s Consolidated Statements of Operations and Comprehensive Income (Loss).Income.
Impairment of Long-Lived Assets and Costs Associated with Exit Activities - Long-lived assets are reviewed for impairment whenever events or changes in circumstances indicate that the carrying value may not be recoverable. The evaluation is performed at the lowest level of identifiable cash flows independent of other assets. For long-lived assets deployed at its restaurants, the Company reviews for impairment at the individual restaurant level. When evaluating for impairment, the total future undiscounted cash flows expected to be generated by the asset are compared to the carrying amount. If the total future undiscounted cash flows of the asset are less than its carrying amount, recoverability is measured by comparing the fair value of the assets to the carrying amount. An impairment loss is recognized in earnings when the asset’s carrying value exceeds its estimated fair value. Fair value is generally estimated using a discounted cash flow model.
Restaurant closure costs, including lease termination fees, are expensed as incurred. When the Company ceases using the property rights under a non-cancelable operating lease, it records a liability for the net present value of any remaining non-rent lease-related obligations, less the estimated subtenant cost recovery that can reasonably be obtained for the property. Any subsequent adjustment to that liability as a result of lease termination or changes in estimates of cost recovery is recorded in the period incurred. The associated expense is recorded in Provision for impaired assets and restaurant closings in the Company’s Consolidated Statements of Operations and Comprehensive Income (Loss).Income.
Restaurant sites and certain other assets to be sold are included in assets held for sale when certain criteria are met, including the requirement that the likelihood of selling the assets within one year is probable.
Advertising Costs - Advertising production costs are expensed in the period when the advertising first occurs. All other advertising costs are expensed in the period in which the costs are incurred. Advertising expense of $115.6 million, $94.0 million and $59.7 million $67.3 millionfor 2023, 2022 and $146.1 million for 2021, 2020 and 2019, respectively, was recorded in Other restaurant operating expense in the Company’s Consolidated Statements of Operations and Comprehensive Income (Loss).Income.
BLOOMIN’ BRANDS, INC.
NOTES TO CONSOLIDATED FINANCIAL STATEMENTS - Continued
Legal Costs - Settlement costs for employment litigation are accruedrecorded to Other restaurant operating expense when they are deemed probable and reasonably estimable. Legal fees are recognized as incurred and are reported in General and administrative expense in the Company’s Consolidated Statements of Operations and Comprehensive Income (Loss).Income.
BLOOMIN’ BRANDS, INC.
NOTES TO CONSOLIDATED FINANCIAL STATEMENTS - Continued
Research and Development Expenses (“R&D”) - R&D is expensed as incurred in General and administrative expense in the Company’s Consolidated Statements of Operations and Comprehensive Income (Loss).Income. R&D primarily consists of payroll and benefit costs. R&D was $2.6$3.5 million, $2.4$2.7 million and $3.4$2.6 million for 2021, 20202023, 2022 and 2019,2021, respectively.
Partner Compensation - In addition to base salary, Area Operating Partners, Restaurant Managing Partnersfield-level operators and Chef Partners generallymulti-unit supervisors receive performance-based bonuses for providing management and supervisory services to their restaurants, certain of which may be based on a percentage of their restaurants’ monthly operating results or cash flows and/or total controllable income (“Monthly Payments”).
Certain Restaurant Managing Partnersflows. The Company accrues for these obligations using current and Chef Partnershistorical restaurant performance information. Most field-level compensation is recorded in Labor and other related expense, with compensation for multi-unit supervisors recorded in General and administrative expense in the U.S. (“U.S. Partners”) may also participate in deferred compensation programsCompany’s Consolidated Statements of Operations and other performance-based compensation programs. The Company may invest in corporate-owned life insurance policies, which are held within an irrevocable grantor or “rabbi” trust account for settlement of certain of the Company’s obligations under the deferred compensation plans.Comprehensive Income.
Many of the Company’s international Restaurant Managing Partnersoperators are given the option to purchase participation interests in the cash distributions of the restaurants they manage. The amount, terms and availability vary by country.
The Company estimates future bonuses and deferred compensation obligations to U.S. Partners and Area Operating Partners, using current and historical information on restaurant performance and records the long-term portion of partner obligations in Other long-term liabilities, net on its Consolidated Balance Sheets. Monthly Payments and deferred compensation expenses for U.S. Partners are included in Labor and other related expenses and Monthly Payments and bonus expense for Area Operating Partners are included in General and administrative expense in the Company’s Consolidated Statements of Operations and Comprehensive Income (Loss).
Stock-based Compensation - Stock-based compensation awards are measured at fair value at the date of grant and expensed over their vesting or service periods. Stock-based compensation expense is recognized only for those awards expected to vest. The expense, net of forfeitures, is recognized using the straight-line method. Forfeitures of share-based compensation awards are recognized as they occur.
During 2021, the Company issued performance-basedPerformance-based share units (“PSUs”) that includedissued by the Company include a relative total shareholder return (“Relative TSR”) modifier to the final payout outcome, which can adjust the payout percentage based on the achieved performance metric. The Relative TSR is measured by comparing the Company’s Relative TSR to that of the constituents of the S&P 1500 Restaurants index.
Basic and Diluted Earnings (Loss) per Share - The Company computes basic earnings (loss) per share based on the weighted average number of common shares that were outstanding during the period. Except where the result would be antidilutive, diluted earnings per share includes the dilutive effect of common stock equivalents, consisting of stock options, restricted stock units, PSUs and performance-based share units,warrants, measured using the treasury stock method, and the Company’s convertible senior notes, and related warrants, measured using the if-converted method. Performance-based share unitsPSUs are considered dilutive when the related performance criterion has been met.
The Company has provided the trustee of the Company’s convertible senior notes due 2025 Notes(the “2025 Notes”) notice of its irrevocable election under the 2025 Notes indenture to settle the principal portion of the 2025 Notes upon conversion in cash and any excess in shares. As a result, only the amounts in excess of the principal amount, if applicable, are considered in diluted earnings per share.
BLOOMIN’ BRANDS, INC.
NOTES TO CONSOLIDATED FINANCIAL STATEMENTS - Continued
Foreign Currency Translation and Transactions - For non-U.S. operations, the functional currency is the local currency. Foreign currency denominated assets and liabilities are translated into U.S. dollars using the exchange rates in effect at the balance sheet date with the translation adjustments recorded in Accumulated other comprehensive loss in the Company’s Consolidated Statements of Changes in Stockholders’ Equity. Results of operations are translated using the average exchange rates for the reporting period. Foreign currency exchange transaction losses are recorded in General and administrative expense in the Company’s Consolidated Statements of Operations and Comprehensive Income (Loss).Income.
Income Taxes - Deferred income tax assets and liabilities are recognized for the future tax consequences attributable to differences between the financial statement carrying amounts of existing assets and liabilities and their respective tax basis. Deferred income tax assets and liabilities are measured using enacted tax rates expected to apply to taxable income in the years in which those temporary differences are expected to be recovered or settled. The effect on deferred income tax assets and liabilities of a change in the tax rate is recognized inwithin income in the period that includes the enactment date of the rate change. A valuation allowance may reduce deferred income tax assets to the amount that is more likely than not to be realized.
BLOOMIN’ BRANDS, INC.
NOTES TO CONSOLIDATED FINANCIAL STATEMENTS - Continued
The Company records a tax benefit for an uncertain tax position using the highest cumulative tax benefit that is more likely than not to be realized. The Company adjusts its liability for unrecognized tax benefits in the period in which it determines the issue is effectively settled, the statute of limitations expires or when more information becomes available. Liabilities for unrecognized tax benefits including penalties and interest, are recorded in Accruedas a reduction of Deferred income tax assets, net and other currentwithin Other long-term liabilities, net, with related interest and penalties recorded in Other long-term liabilities, net, on the Company’s Consolidated Balance Sheets. Interest and penalties recognized on liabilities for unrecognized tax benefits are included in Provision for income taxes.
Recently Adopted Financial Accounting Standards - On December 28, 2020, the Company adopted Accounting Standards Update (“ASU”) No. 2020-06, “Debt - Debt with Conversion and Other Options (Subtopic 470-20) and Derivatives and Hedging - Contracts in Entity’s Own Equity (Subtopic 815-40): Accounting for Convertible Instruments and Contracts in an Entity’s Own Equity,” (“ASU No. 2020-06”) which removes the separation models for convertible debt with a cash conversion feature or convertible instruments with a beneficial conversion feature. ASU No. 2020-06 also requires the application of the if-converted method for calculating the diluted earnings per share andimpact of the treasury stock method is no longer available.2025 Notes. The Company adopted ASU No. 2020-06 using the modified retrospective approach which resulted in a cumulative-effect adjustment that increased (decreased) the following Consolidated Balance Sheet accounts during the first quarter of 2021:
| | | | | | | | | | | | | | |
| ADJUSTMENT | | CONSOLIDATED BALANCE SHEET CLASSIFICATION | | AMOUNT
(dollars in millions) |
| Deferred tax impact of cumulative-effect adjustment | | Deferred income tax assets, net | | $ | 14.9 | |
| Debt discount reclassification | | Long-term debt, net | | $ | 59.9 | |
| Equity issuance costs reclassification | | Long-term debt, net | | $ | (2.1) | |
| Debt discount amortization reclassification, net of tax | | Accumulated deficit | | $ | 4.4 | |
| Reversal of separated equity component, net of tax | | Additional paid-in capital | | $ | (47.3) | |
After adopting ASU No. 2020-06, the Company’s convertible senior notes due 2025 (the “2025 Notes”)Notes are reflected entirely as a liability since the embedded conversion feature is no longer separately presented within stockholders’ equity. During 2020, the Company recognized debt discount amortization of $6.3 million within Interest expense, net related to its 2025 Notes.
On December 31, 2018,Recently Issued Financial Accounting Standards Not Yet Adopted - In November 2023, the Company adoptedFinancial Accounting Standards Board (“FASB”) issued ASU No. 2016-02: Leases2023-07, “Segment Reporting (Topic 842) (“ASU No. 2016-02”), ASU No. 2018-01, “Leases (Topic 842)280): Land Easement Practical Expedient for TransitioningImprovements to Topic 842,Reportable Segment Disclosures,” (“ASU No. 2018-01”2023-07”) and ASU No. 2018-11: Leases (Topic 842): Targeted Improvementswhich requires disclosure of significant segment expenses regularly provided to the Company’s chief operating decision-maker (“ASU No. 2018-11”CODM”). ASU No. 2016-02 requires2023-07 also allows for multiple measures of segment profit (loss) if the lease rights and obligations arising from lease contracts, including existing and new arrangements,CODM utilizes such measures to be recognized as assets and liabilities on the balance sheet.allocate resources or assess performance. ASU No. 2018-01 allows an entity to elect an optional transition practical expedient to not evaluate land easements that exist or expired before2023-07 is effective for the
BLOOMIN’ BRANDS, INC.
NOTES TO CONSOLIDATED FINANCIAL STATEMENTS - Continued
Company’s Company beginning with the 2024 Form 10-K, with early adoption ofpermitted. The Company is currently evaluating the impact ASU No. 2016-02. ASU No. 2018-11 allows for an additional transition method, which permits use of the effective date of adoption as the date of initial application of ASU No. 2016-02 without restating comparative period financial statements and provides entities with a practical expedient that allows entities to elect not to separate lease and non-lease components when certain conditions are met.2023-07 will have on its disclosures.
In December 2023, the FASB issued ASU No. 2023-09, “Income Taxes (Topic 740): Improvements to Income Tax Disclosures,” (“ASU No. 2023-09”) which expands existing income tax disclosures, including disaggregation of the Company’s effective income tax rate reconciliation table and income taxes paid disclosures. ASU No. 2023-09 is effective for the Company beginning with the 2025 Form 10-K, with early adoption permitted. The Company adoptedis currently evaluating the impact ASU No. 2016-02 using December 31, 2018 as the date of initial application and recorded2023-09 will have on its disclosures.
Recent accounting guidance not discussed herein is not applicable, did not have, or is not expected to have a reduction in Accumulated deficit of $141.3 million primarily relatedmaterial impact to the derecognition of deferred gains on sale-leaseback transactions, net of related deferred tax assets. Consequently, financial information and the disclosures required under the new standard were not provided for dates and periods before December 31, 2018. The Company also elected a transition package including practical expedients that permitted it not to reassess the classification and initial direct costs of expired or existing contracts and leases, to not separate lease and non-lease components of restaurant facility leases executed subsequent to adoption, and to not evaluate land easements that exist or expired before the adoption. In preparation for adoption, the Company implemented a new lease accounting system.Company.
Reclassifications - The Company reclassified certain items in the accompanying consolidated financial statements for prior periods to be comparable with the classification for the current period. These reclassifications had no effectperiod, including, but not limited to: (i) finance lease liabilities presented within other liabilities that were formerly presented within long-term debt, (ii) the separate presentation of current operating lease liabilities on the face of the Consolidated Balance Sheets, (iii) amounts previously reported in Other (expense) income, net, income.
3. 2020 COVID-19 Charges
Following is a summaryon the face the Consolidated Statements of Operations and Comprehensive Income were combined with Interest expense, net and (iv) the combined presentation of the charges recorded in connection with the COVID-19 pandemic for the period indicated (dollars in thousands):
| | | | | | | | | | | | | | | | |
CHARGES | | CONSOLIDATED STATEMENTS OF OPERATIONS AND COMPREHENSIVE INCOME (LOSS) CLASSIFICATION | | | | FISCAL YEAR |
| | | | 2020 |
Inventory obsolescence and spoilage | | Food and beverage costs | | | | $ | 10,450 | |
| | | | | | |
Compensation for idle employees (1) | | Labor and other related | | | | 29,993 | |
Other operating charges | | Other restaurant operating | | | | 3,219 | |
Lease guarantee contingent liabilities (2) | | General and administrative | | | | 4,188 | |
Allowance for expected credit losses (3) | | General and administrative | | | | 3,334 | |
Other charges | | General and administrative | | | | 2,719 | |
Right-of-use asset impairment (4) | | Provision for impaired assets and restaurant closings | | | | 32,992 | |
Fixed asset impairment (4) | | Provision for impaired assets and restaurant closings | | | | 34,423 | |
Goodwill and other impairment (5) | | Provision for impaired assets and restaurant closings | | | | 3,190 | |
| | | | | | |
| | | | | | $ | 124,508 | |
________________
(1)Represents relief pay for hourly employees impacted by the closure of dining rooms, net of $14.9 million of employee retention tax credits earned.
(2)Represents additional contingent liabilities recorded for lease guarantees related to certain former restaurant locations now operated by franchisees or other third parties.
(3)Includes additional reserves to reflect an increase in expected credit losses, primarily related to franchise receivables.
(4)Includes impairments resulting from the remeasurement of assets utilizing projected future cash flows revised for then-current economic conditions, restructuring charges, the closure of certain restaurants and in connection with the Out West Resolution Agreement. See Note 5 - Impairments, Exit Costs and Disposals and Note 4 - Revenue Recognition, for details regarding COVID-19 Restructuring costs and the Out West Resolution Agreement, respectively.
(5)Includes impairment of goodwill for the Company’s Hong Kong subsidiary. See Note 10 - Goodwill and Intangible Assets, Net for details regarding impairment of goodwill.
BLOOMIN’ BRANDS, INC.
NOTES TO CONSOLIDATED FINANCIAL STATEMENTS - Continued
4. Revenue Recognition
The following table includesOther comprehensive income impact of interest rate swaps on the categoriesface of revenue included in the Company’s Consolidated Statements of Operations and Comprehensive Income (Loss) for the periods indicated:
| | | | | | | | | | | | | | | | | | | | | | | | | |
| FISCAL YEAR | | | | | | |
| (dollars in thousands) | 2021 | | 2020 | | 2019 | | | | | | | | |
| Revenues | | | | | | | | | | | | | |
| Restaurant sales | $ | 4,061,093 | | | $ | 3,144,636 | | | $ | 4,075,014 | | | | | | | | | |
| Franchise and other revenues | | | | | | | | | | | | | |
| Franchise revenues | 45,520 | | | 21,195 | | | 52,147 | | | | | | | | | |
| Other revenues (1) | 15,772 | | | 4,730 | | | 12,228 | | | | | | | | | |
| Total Franchise and other revenues | 61,292 | | | 25,925 | | | 64,375 | | | | | | | | | |
| Total revenues | $ | 4,122,385 | | | $ | 3,170,561 | | | $ | 4,139,389 | | | | | | | | | |
________________d net income.(1)
For 2021, includes a $3.1 million benefit from the recognition of recoverable Program of Social Integration (“PIS”) and Contribution for the Financing of Social Security (“COFINS”) taxes within other revenues in connection with favorable court rulings in Brazil regarding the calculation methodology and taxable base. The amount recognized primarily represents refundable PIS and COFINS taxes for prior years, including accrued interest, and will be recovered by offsetting future PIS and COFINS taxes due.
3. Revenue Recognition
The following table includes the disaggregation of Restaurant sales and franchise revenues by restaurant concept and major international market for the periods indicated:
| | FISCAL YEAR |
| 2021 | | 2020 | | 2019 |
| FISCAL YEAR | | | FISCAL YEAR |
| 2023 | | | 2023 | | 2022 | | 2021 |
| (dollars in thousands) | (dollars in thousands) | RESTAURANT SALES | | FRANCHISE REVENUES | | RESTAURANT SALES | | FRANCHISE REVENUES | | RESTAURANT SALES | | FRANCHISE REVENUES | (dollars in thousands) | RESTAURANT SALES | | FRANCHISE REVENUES | | RESTAURANT SALES | | FRANCHISE REVENUES | | RESTAURANT SALES | | FRANCHISE REVENUES |
| U.S. | U.S. | | | | | | | | | | | |
| Outback Steakhouse | |
| Outback Steakhouse | |
| Outback Steakhouse | Outback Steakhouse | $ | 2,175,909 | | | $ | 29,725 | | | $ | 1,760,071 | | | $ | 9,898 | | | $ | 2,135,776 | | | $ | 38,614 | |
| Carrabba’s Italian Grill | Carrabba’s Italian Grill | 653,231 | | | 2,439 | | | 497,212 | | | 1,309 | | | 613,031 | | | 2,112 | |
| Bonefish Grill | Bonefish Grill | 544,068 | | | 641 | | | 396,193 | | | 346 | | | 574,004 | | | 787 | |
| Fleming’s Prime Steakhouse & Wine Bar | Fleming’s Prime Steakhouse & Wine Bar | 332,607 | | | — | | | 209,564 | | | — | | | 307,199 | | | — | |
| Other | Other | 9,033 | | | 9 | | | 6,507 | | | — | | | 4,658 | | | — | |
| U.S. total | U.S. total | 3,714,848 | | | 32,814 | | | 2,869,547 | | | 11,553 | | | 3,634,668 | | | 41,513 | |
| International | International | |
| Outback Steakhouse Brazil | 258,997 | | | — | | | 206,280 | | | — | | | 355,837 | | | — | |
| Other (1) | 87,248 | | | 12,706 | | | 68,809 | | | 9,642 | | | 84,509 | | | 10,634 | |
| Outback Steakhouse - Brazil (1) | |
| Outback Steakhouse - Brazil (1) | |
| Outback Steakhouse - Brazil (1) | |
| Other (1)(2) | |
| International total | International total | 346,245 | | | 12,706 | | | 275,089 | | | 9,642 | | | 440,346 | | | 10,634 | |
| Total | Total | $ | 4,061,093 | | | $ | 45,520 | | | $ | 3,144,636 | | | $ | 21,195 | | | $ | 4,075,014 | | | $ | 52,147 | |
____________________
(1)Restaurant sales in Brazil includes $30.2 million and $7.7 million during 2023 and 2022, respectively, in connection with value added tax exemptions resulting from tax legislation. See Note 20 - Income Taxes for details regarding the Brazil tax legislation.
(2)Includes Restaurant sales for the Company’sCompany-owned Outback Steakhouse restaurants outside of Brazil and Abbraccio conceptrestaurants in Brazil. Franchise revenues primarily include revenues from franchised Outback Steakhouse restaurants.
BLOOMIN’ BRANDS, INC.
NOTES TO CONSOLIDATED FINANCIAL STATEMENTS - Continued
The following table includes a detail of assets and liabilities from contracts with customers included on the Company’s Consolidated Balance Sheets as of the periods indicated:
| | (dollars in thousands) | (dollars in thousands) | DECEMBER 26, 2021 | | DECEMBER 27, 2020 | |
| (dollars in thousands) | |
| (dollars in thousands) | |
| Other current assets, net | Other current assets, net | | | | |
| Other current assets, net | |
| Other current assets, net | |
| Deferred gift card sales commissions | |
| Deferred gift card sales commissions | |
| Deferred gift card sales commissions | Deferred gift card sales commissions | $ | 17,793 | | | $ | 19,300 | | |
| | Unearned revenue | Unearned revenue | | |
| | Unearned revenue | |
| | Unearned revenue | |
| Deferred gift card revenue | |
| Deferred gift card revenue | |
| Deferred gift card revenue | Deferred gift card revenue | $ | 387,945 | | | $ | 373,048 | | |
| Deferred loyalty revenue | Deferred loyalty revenue | 9,386 | | | 8,026 | | |
| Deferred loyalty revenue | |
| Deferred loyalty revenue | |
| Deferred franchise fees - current | |
| Deferred franchise fees - current | |
| Deferred franchise fees - current | Deferred franchise fees - current | 443 | | | 469 | | |
| Other | Other | 1,021 | | | 73 | | |
| Other | |
| Other | |
| Total Unearned revenue | |
| Total Unearned revenue | |
| Total Unearned revenue | Total Unearned revenue | $ | 398,795 | | | $ | 381,616 | | |
| | Other long-term liabilities, net | Other long-term liabilities, net | | |
| | Other long-term liabilities, net | |
| | Other long-term liabilities, net | |
| Deferred franchise fees - non-current | Deferred franchise fees - non-current | $ | 4,280 | | | $ | 4,301 | | |
| Deferred franchise fees - non-current | |
| Deferred franchise fees - non-current | |
BLOOMIN’ BRANDS, INC.
NOTES TO CONSOLIDATED FINANCIAL STATEMENTS - Continued
The following table is a rollforward of deferred gift card sales commissions for the periods indicated:
| | FISCAL YEAR |
| FISCAL YEAR | |
| FISCAL YEAR | |
| FISCAL YEAR | |
| (dollars in thousands) | (dollars in thousands) | 2021 | | 2020 | | 2019 | |
| Balance, beginning of period | $ | 19,300 | | | $ | 18,554 | | | $ | 16,431 | | |
| Balance, beginning of the period | |
| Balance, beginning of the period | |
| Balance, beginning of the period | |
| Deferred gift card sales commissions amortization | |
| Deferred gift card sales commissions amortization | |
| Deferred gift card sales commissions amortization | Deferred gift card sales commissions amortization | (26,012) | | | (20,927) | | | (26,094) | | |
| Deferred gift card sales commissions capitalization | Deferred gift card sales commissions capitalization | 26,625 | | | 22,923 | | | 29,894 | | |
| Deferred gift card sales commissions capitalization | |
| Deferred gift card sales commissions capitalization | |
| Other | Other | (2,120) | | | (1,250) | | | (1,677) | | |
| Balance, end of period | $ | 17,793 | | | $ | 19,300 | | | $ | 18,554 | | |
| Other | |
| Other | |
| Balance, end of the period | |
| Balance, end of the period | |
| Balance, end of the period | |
The following table is a rollforward of unearned gift card revenue for the periods indicated:
| | FISCAL YEAR |
| FISCAL YEAR | |
| FISCAL YEAR | |
| FISCAL YEAR | |
| (dollars in thousands) | (dollars in thousands) | 2021 | | 2020 | | 2019 | |
| Balance, beginning of period | $ | 373,048 | | | $ | 358,757 | | | $ | 333,794 | | |
| Balance, beginning of the period | |
| Balance, beginning of the period | |
| Balance, beginning of the period | |
| Gift card sales | |
| Gift card sales | |
| Gift card sales | Gift card sales | 330,841 | | | 306,016 | | | 420,229 | | |
| Gift card redemptions | Gift card redemptions | (298,397) | | | (277,675) | | | (376,477) | | |
| Gift card redemptions | |
| Gift card redemptions | |
| Gift card breakage | Gift card breakage | (17,547) | | | (14,050) | | | (18,789) | | |
| Balance, end of period | $ | 387,945 | | | $ | 373,048 | | | $ | 358,757 | | |
| Gift card breakage | |
| Gift card breakage | |
| Balance, end of the period | |
| Balance, end of the period | |
| Balance, end of the period | |
Franchisee Deferred Payment Agreement - OnEffective December 27, 2020,31, 2023, the Company entered into an agreementAmended & Restated Holistic Resolution Agreement (the “Resolution“2023 Resolution Agreement”) with Cerca Trova Southwest Restaurant Group, LLC (d/b/a Out West Restaurant Group) and certain of its affiliates (collectively, “Out West”), who currently franchises approximately 80operate 78 franchised Outback Steakhouse restaurants in the western United States, primarily in California. The 2023 Resolution Agreement ends on December 31, 202327, 2026 or upon the earlier occurrence of certain specified events, including the sale of all or substantially all of the assets or equity of Out West, bankruptcy or a liquidation event (“Qualifying Event”) (the “Forbearance Period”). Prior to theevent. The 2023 Resolution Agreement amends and supersedes the original Holistic Resolution Agreement dated December 27, 2020 (the “Original Resolution Agreement”). The terms of the 2023 Resolution Agreement are materially consistent with the Original Resolution Agreement and include similar agreements between Out West was in default ofand its franchise agreements for nonpayment of certain amounts due,lenders prioritizing rents, royalties, national advertising fees and simultaneously in default oflocal marketing expenditures, and provides a mechanism to settle its credit agreementobligations with its lenders primarily due to the significant impact of the COVID-19 pandemic. Under the terms of the Resolution Agreement, the Company agreed to:and provide for capital expenditures, within certain limitations.
•4. not call upon any previous default under the existing franchise agreements during the Forbearance Period;Impairments and Exit Costs
•
reduce future advertising fees to 2.25%
The components of gross sales during the Forbearance Period;
•permanently waive unpaid royaltyProvision for impaired assets and advertising feesrestaurant closings are as follows for the period of February 24, 2020 to July 26, 2020;periods indicated:
| | | | | | | | | | | | | | | | | |
| FISCAL YEAR |
| (dollars in thousands) | 2023 | | 2022 | | 2021 |
| Impairment losses | | | | | |
| U.S. | $ | 39,812 | | | $ | 3,942 | | | $ | 11,945 | |
| International | 600 | | | 1,537 | | | 1,186 | |
| Corporate | — | | | 7 | | | 270 | |
| Total impairment losses | 40,412 | | | 5,486 | | | 13,401 | |
| Restaurant closure (benefit) charges | | | | | |
| U.S. | (7,143) | | | 478 | | | 422 | |
| International | 305 | | | — | | | (86) | |
| Total restaurant closure (benefit) charges | (6,838) | | | 478 | | | 336 | |
| Provision for impaired assets and restaurant closings | $ | 33,574 | | | $ | 5,964 | | | $ | 13,737 | |
| | | | | |
| | | | | |
| | | | | |
| | | | | |
| | | | | |
| | | | | |
BLOOMIN’ BRANDS, INC.
NOTES TO CONSOLIDATED FINANCIAL STATEMENTS - Continued
•allow for closure of 4 restaurants and certain sublease modifications (the “Property Concessions”);
•allow for closure of up to 10 additional restaurants during the first 12 months of the Resolution Agreement, without imposition of any penalties or accelerated royalties;
•defer all non-waived past due royalties and advertising fees through November 22, 2020, and for certain permitted restaurant closings in connection with the Property Concessions, defer accelerated rent and royalties that otherwise would have been due under the terms and conditions of the respective franchise agreements and leases or subleases (the “Initial Deferred Balance”); and
•defer all past due rents through December 27, 2020 on subleased properties totaling $3.6 million until April 2021 when the balance will be repaid over an 18-month period.
In connection with the Property Concessions, the Company recognized $4.7 million of lease right-of-use asset impairment during the thirteen weeks ended December 27, 2020, within the U.S. segment.
At the time of the Resolution Agreement, no deferred or previously waived amounts had been recorded as revenue, with the exception of a $3.1 million receivable balance that had been previously fully reserved. Collections of deferred amounts, and any future amounts due under the Resolution Agreement or the Company’s franchise agreements after November 22, 2020, will be recognized when collectability is reasonably assured.
Out West also entered into a Forbearance Agreement and Second Amendment to Credit and Guaranty Agreement (“Forbearance Agreement”) with its lenders that, in conjunction with the Resolution Agreement, provides, among other things, for a pre-determined calculation of available monthly cash (“Available Cash”) that Out West may use to settle its obligations due to the Company and its lenders. Available Cash is calculated net of operating expenses, including local marketing expenditures required under the Resolution Agreement. Under the Resolution Agreement, if Out West is unable to satisfy monthly royalty or advertising fees with Available Cash, such amounts will automatically increase the Initial Deferred Balance. The entire deferred balance will become collectible upon any Qualifying Event. If the Qualifying Event is the sale of all or substantially all of the assets or equity of Out West, the sale proceeds will be applied, between the Company and Out West’s lenders, in accordance with the payment priority established in the Resolution Agreement and Forbearance Agreement; if the sales proceeds are insufficient to satisfy the deferred balance due to the Company, then the Company agreed to permanently waive any remaining deferred balance due to the Company.
BLOOMIN’ BRANDS, INC.
NOTES TO CONSOLIDATED FINANCIAL STATEMENTS - Continued
5. Impairments, Exit Costs and Disposals
The components of Provision for impaired assets and restaurant closings are as follows for the periods indicated:
| | | | | | | | | | | | | | | | | |
| FISCAL YEAR |
| (dollars in thousands) | 2021 | | 2020 | | 2019 |
| Impairment losses | | | | | |
| U.S. (1) | $ | 11,945 | | | $ | 65,129 | | | $ | 6,381 | |
| International (1)(2) | 1,186 | | | 3,468 | | | 2,026 | |
| Corporate (3) | 270 | | | 6,226 | | | 727 | |
| Total impairment losses | 13,401 | | | 74,823 | | | 9,134 | |
| Restaurant closure charges (benefits) | | | | | |
| U.S. (1) | 422 | | | 1,358 | | | (105) | |
| International (1) | (86) | | | 173 | | | 56 | |
| Total restaurant closure charges (benefits) | 336 | | | 1,531 | | | (49) | |
| Provision for impaired assets and restaurant closings | $ | 13,737 | | | $ | 76,354 | | | $ | 9,085 | |
| | | | | |
| | | | | |
| | | | | |
| | | | | |
| | | | | |
| | | | | |
____________________
(1)U.S. and international impairment and closure charges during 2020 primarily relate to the COVID-19 pandemic, including charges related to the COVID-19 Restructuring discussed below and the Out West Resolution Agreement. See Note 3 - 2020 COVID-19 Charges for details regarding the impact of the COVID-19 pandemic on the Company’s financial results.
(2)Includes goodwill impairment charges of $2.0 million during 2020. See Note 10 - Goodwill and Intangible Assets, Net for details regarding impairment of goodwill.
(3)Corporate impairment charges during 2020 primarily relate to transformational initiatives.
COVID-19 Restructuring2023 Closure Initiative - During 2020,the fourteen weeks ended December 31, 2023, the Company recognized pre-tax asset impairments and closure charges in connection with the closure of 22three U.S. and two international Aussie Grill restaurants and the decision to close 36 predominantly older, underperforming U.S. restaurants (the “2023 Closure Initiative”). All remaining restaurant closures under the 2023 Closure Initiative were completed in February 2024, with an estimated $8 million to $11 million of related severance and fromclosure charges to be recorded during the update of certain cash flow assumptions, including lease renewal considerations (the “COVID-19 Restructuring”).thirteen weeks ended March 31, 2024. Following is a summary of the COVID-19 Restructuring2023 Closure Initiative charges recognized in the Consolidated Statements of Operations and Comprehensive Income (Loss) for the periodperiods indicated (dollars in thousands):
| | | | | | | | | | | | | | | | | | | | |
| DESCRIPTION | | CONSOLIDATED STATEMENTS OF OPERATIONS AND COMPREHENSIVE INCOME (LOSS) CLASSIFICATION | | | | FOURTEEN WEEKS AND FISCAL YEAR ENDED | | | | |
| | | | DESCRIPTIONDECEMBER 31, 2023 | | | | | 2020 | | | | |
| Property, fixtures and equipment impairments | | Provision for impaired assets and restaurant closings | | | | $ | 18,76623,934 | | | | | |
| Lease right-of-use asset impairments and closure charges | | Provision for impaired assets and restaurant closings | | | | 5,00310,266 | | | | | |
| Severance and other expenses | | General and administrative | | | | 1,097622 | | | | | |
| Lease remeasurement gains | | Other restaurant operating | | | | (2,450) | | | | | |
| | | | | | $ | 24,86632,372 | | | | | |
| | | | | | | | | | |
During 2023, the Company recognized a lease termination gain of $6.7 million, net of related asset impairments, in connection with the closure of one U.S. restaurant.
The remaining impairment and closure charges during the periods presented resulted primarily from locations identified for closure or relocation.
BLOOMIN’ BRANDS, INC.
NOTES TO CONSOLIDATED FINANCIAL STATEMENTS - Continued
Accrued Closed Facility Closure and Other CostsLiabilities Rollforward - The following table is a rollforward of the Company’s closed facility leaselease-related liabilities and other accrued costs associated with closure and restructuring initiatives for the period indicated:
| | | | | | | |
| FISCAL YEAR |
| (dollars in thousands) | 20212023 | | |
BeginningBalance, beginning of the yearperiod | $ | 12,8795,476 | | | |
| Additions | 3,340 | | |
| Cash payments | (4,739)(1,142) | | | |
| Accretion | 906317 | | | |
| Adjustments | (561)(1,737) | | | |
EndBalance, end of the year (1)period | $ | 8,4856,254 | | | |
| | | |
| | | |
| | | |
________________
(1)As of December 26, 2021, the Company had exit-related accruals associated with closure and restructuring initiatives of $2.9 million recorded in Accrued and other current liabilities and $5.6 million recorded in Non-current operating lease liabilities on its Consolidated Balance Sheet.
Surplus Property Disposals - During 2019, the Company completed the sale of 5 of its U.S. surplus properties to a franchisee for cash proceeds of $12.7 million, net of certain purchase price adjustments. The transaction resulted in a net gain of $3.6 million, recorded within Other restaurant operating expense in the Company’s Consolidated Statements of Operations and Comprehensive Income (Loss).
Refranchising - During 2019, the Company completed the sale of 18 of its existing U.S. Company-owned Carrabba’s Italian Grill restaurants to an existing franchisee for cash proceeds of $3.6 million, net of certain purchase price adjustments.The Company remains contingently liable on certain real estate lease agreements assigned to the buyer.
6.5. Earnings (Loss) Per Share
The dilutive effect of the 2025 Notes is calculated using the if-converted method. To the extent the Company has ability to settle its 2025 Notes in shares of its common stock, the principal and conversion spread on the 2025 Notes will have a dilutive impact on diluted earnings per share when the average market price of the Company’s common stock for a given period exceeds the conversion price of $11.89 per share of common stock. In February 2021, the Company provided the trustee of its 2025 Notes notice of the Company’s irrevocable election to settle the principal portion of the 2025 Notes in cash and any excess of average market price of the Company’s common stock exceeding conversion price is to be settled in shares. As a result, subsequent to the election, only the amounts in excess of the principal amount are considered in diluted earnings per share under the if-converted method.share.
In connection with the offering of the 2025 Notes, the Company entered into the Convertible Note Hedge Transactions and Warrant Transactions described in Note 1413 - Convertible Senior Notes. However, the Convertible Note Hedge Transactions are not considered when calculating dilutive shares given their anti-dilutiveantidilutive impact as an offset to dilution of shares underlying the 2025 Notes. The Warrant Transactions have a dilutive effect on the Company’s common stock to the extent the price of its common stock exceeds the $16.64 strike price of the Warrant Transactions. See Note 1413 - Convertible Senior Notes for additional information regarding the 2025 Notes, Convertible Note Hedge Transactions and Warrant TransactionsTransactions.
.
BLOOMIN’ BRANDS, INC.
NOTES TO CONSOLIDATED FINANCIAL STATEMENTS - Continued
The following table presents the computation of basic and diluted earnings (loss) per share attributable to common stockholders for the periods indicated:
| | | | | | | | | | | | | | | | | |
| | FISCAL YEAR |
| (in thousands, except per share data) | 2021 | | 2020 | | 2019 |
| Net income (loss) attributable to Bloomin’ Brands | $ | 215,555 | | | $ | (158,715) | | | $ | 130,573 | |
| Redemption of preferred stock in excess of carrying value (1) | — | | | (3,496) | | | — | |
| Net income (loss) attributable to common stockholders | 215,555 | | | (162,211) | | | 130,573 | |
| Convertible senior notes if-converted method interest adjustment, net of tax (2) | 345 | | | — | | | — | |
| Diluted net income (loss) attributable to common stockholders | $ | 215,900 | | | $ | (162,211) | | | $ | 130,573 | |
| | | | | |
| Basic weighted average common shares outstanding | 88,981 | | | 87,468 | | | 88,839 | |
| | | | | |
| Effect of dilutive securities: | | | | | |
| Stock options | 779 | | | — | | | 571 | |
| Nonvested restricted stock units | 355 | | | — | | | 295 | |
| Nonvested performance-based share units | 61 | | | — | | | 72 | |
| Convertible senior notes (2)(3) | 11,377 | | | — | | | — | |
| Warrants (3) | 6,250 | | | — | | | — | |
| Diluted weighted average common shares outstanding | 107,803 | | | 87,468 | | | 89,777 | |
| | | | | |
| Basic earnings (loss) per share attributable to common stockholders | $ | 2.42 | | | $ | (1.85) | | | $ | 1.47 | |
| Diluted earnings (loss) per share attributable to common stockholders | $ | 2.00 | | | $ | (1.85) | | | $ | 1.45 | |
| | | | | |
| | | | | |
| | | | | |
| | | | | | | | | | | | | | | | | |
| | FISCAL YEAR |
| (in thousands, except per share data) | 2023 | | 2022 | | 2021 |
| Net income attributable to Bloomin’ Brands | $ | 247,386 | | | $ | 101,907 | | | $ | 215,555 | |
| | | | | |
| | | | | |
| Convertible senior notes if-converted method interest adjustment, net of tax (1) | — | | | — | | | 345 | |
| Diluted net income attributable to Bloomin’ Brands | $ | 247,386 | | | $ | 101,907 | | | $ | 215,900 | |
| | | | | |
| Basic weighted average common shares outstanding | 87,230 | | | 88,846 | | | 88,981 | |
| | | | | |
| Effect of dilutive securities: | | | | | |
| Stock options | 381 | | | 261 | | | 779 | |
| Nonvested restricted stock units | 203 | | | 182 | | | 355 | |
| Nonvested performance-based share units | 183 | | | 180 | | | 61 | |
| Convertible senior notes (1)(2) | 5,067 | | | 6,089 | | | 11,377 | |
| Warrants (2) | 3,389 | | | 2,954 | | | 6,250 | |
| Diluted weighted average common shares outstanding | 96,453 | | | 98,512 | | | 107,803 | |
| | | | | |
| Basic earnings per share | $ | 2.84 | | | $ | 1.15 | | | $ | 2.42 | |
| Diluted earnings per share | $ | 2.56 | | | $ | 1.03 | | | $ | 2.00 | |
| | | | | |
| | | | | |
| | | | | |
________________
(1)Consideration paid in excess of carrying value for the redemption of its Abbraccio preferred stock is considered a deemed dividend and, for purposes of calculating earnings per share, reduces net income attributable to common stockholders. See Note 16 - Stockholders’ Equity for additional details.
(2)Adjustment for interest related to the 2025 Notes weighted for the portion of the period prior to the Company’s election under the 2025 Notes indenture to settle the principal portion of itsthe 2025 Notes in cash. Effective with the Company’s election, there will be no further numerator adjustments for interest or denominator adjustments for shares required to settle the principal portion.
(3)(2)Due toDuring 2022, the Company’s net loss during 2020, dilutive excess shares, if applicable,Company repurchased $125.0 million of the 2025 Notes and warrants were excluded fromsettled the computationcorresponding portion of diluted earnings per share as their effect would be antidilutive.the related warrants. See Note 13 - Convertible Senior Notes for additional details.
Share-based compensation-related weighted average securities outstanding not included in the computation of net earnings (loss) per share attributable to common stockholders because their effect was antidilutive were as follows for the periods indicated:
| | FISCAL YEAR | |
| FISCAL YEAR | |
| FISCAL YEAR | |
| FISCAL YEAR | |
| (shares in thousands) | |
| (shares in thousands) | |
| (shares in thousands) | (shares in thousands) | 2021 | | 2020 | | 2019 | |
| Stock options | Stock options | 751 | | | 5,155 | | | 4,003 | | |
| Stock options | |
| Stock options | |
| Nonvested restricted stock units | |
| Nonvested restricted stock units | |
| Nonvested restricted stock units | Nonvested restricted stock units | 128 | | | 682 | | | 158 | | |
| Nonvested performance-based share units | Nonvested performance-based share units | 377 | | | 514 | | | 277 | | |
| Nonvested performance-based share units | |
| Nonvested performance-based share units | |
|
BLOOMIN’ BRANDS, INC.
NOTES TO CONSOLIDATED FINANCIAL STATEMENTS - Continued
7.6. Stock-based and Deferred Compensation Plans
Stock-based Compensation Plans
The Company recognized stock-based compensation expense, net of capitalized expense, as follows for the periods indicated:
| | FISCAL YEAR |
| FISCAL YEAR | | | FISCAL YEAR |
| (dollars in thousands) | (dollars in thousands) | 2021 | | 2020 | | 2019 | (dollars in thousands) | 2023 | | 2022 | | 2021 |
| Performance-based share units (1) | |
| Restricted stock units | |
| Stock options | Stock options | $ | 2,286 | | | $ | 3,743 | | | $ | 5,270 | |
| Restricted stock units | 8,184 | | | 8,559 | | | 8,949 | |
| Performance-based share units (1) | 13,821 | | | 2,414 | | | 5,471 | |
| Total stock-based compensation expense, net of capitalized expense | |
| | $ | 24,291 | | | $ | 14,716 | | | $ | 19,690 | |
|
________________
(1)For 2023 and 2022, includes a cumulative life-to-date adjustment to decrease expense for PSUs granted in fiscal years 2022 and 2020, respectively, based on revised Company projections of performance criteria set forth in the award agreements. For 2021, includes a cumulative life-to-date adjustment to increase expense for PSUs granted in fiscal years 2019, 2020 and 2021 based on revisedCompany performance against criteria set forth in the award agreements.
BLOOMIN’ BRANDS, INC.
NOTES TO CONSOLIDATED FINANCIAL STATEMENTS - Continued
Performance-based Share Units - The number of PSUs that vest is determined for each year based on the achievement of certain performance criteria as set forth in the award agreement and may range from zero to 200% of the annual target grant. The PSUs are settled in shares of common stock, with holders receiving one share of common stock for each performance-based share unit that vests. Compensation expense for PSUs is recognized over the vesting period when it is probable the performance criteria will be achieved.
The following table presents a summary of the Company’s PSU activity:
| | | | | | | | | | | | | | | | | |
| (in thousands, except per unit data) | PERFORMANCE-BASED SHARE UNITS | | WEIGHTED AVERAGE GRANT DATE FAIR VALUE PER UNIT | | AGGREGATE
INTRINSIC VALUE (1) |
| Outstanding as of December 25, 2022 | 874 | | | $ | 24.83 | | | $ | 18,323 | |
| Granted | 301 | | | $ | 29.01 | | | |
| Performance adjustment (2) | 154 | | | $ | 19.84 | | | |
| Vested | (470) | | | $ | 19.84 | | | |
| Forfeited | (41) | | | $ | 26.48 | | | |
| Outstanding as of December 31, 2023 | 818 | | | $ | 26.92 | | | $ | 23,026 | |
| Expected to vest as of December 31, 2023 (3) | 765 | | | | | $ | 21,410 | |
________________
(1)Based on the $20.96 and $28.15 share price of the Company’s common stock on December 23, 2022 and December 29, 2023, the last trading day of 2022 and 2023, respectively.
(2)Represents adjustment to 148% payout for PSUs granted during 2020.
(3)Estimated number of units to be issued upon the vesting of outstanding PSUs based on Company performance projections of performance criteria set forth in the 2021, 2022 and 2023 PSU award agreements.
The Company grants PSUs subject to final payout modification by a Relative TSR modifier. This Relative TSR modifier can adjust the final payout outcome by 75%, 100% or 125% of the achieved performance metric, with the overall payout capped at 200% of the annual target grant. These PSUs have a three-year cliff vesting period and their fair value was estimated using the Monte Carlo simulation model. The Monte Carlo simulation model utilizes multiple input variables to estimate the probability that the market conditions will be achieved and is applied to the closing price of the Company’s common stock on the date of the grant.
Assumptions used in the Monte Carlo simulation model and the grant date fair value of PSUs granted were as follows for the periods indicated:
| | | | | | | | | | | | | | | | |
| FISCAL YEAR |
| 2023 | | 2022 | 2021 | | |
| Assumptions: | | | | | | |
| Risk-free interest rate (1) | 4.26 | % | | 1.64 | % | 0.20 | % | | |
| Dividend yield (2) | 3.47 | % | | 2.31 | % | — | % | | |
| | | | | | |
| Volatility (3) | 51.02 | % | | 49.11 | % | 48.45 | % | | |
| | | | | | |
| Grant date fair value per unit (4) | $ | 29.01 | | | $ | 26.10 | | $ | 29.73 | | | |
| | | | | | |
| | | | | | |
________________
(1)Risk-free interest rate is the U.S. Treasury yield curve in effect as of the grant date for the performance period of the unit.
(2)Dividend yield is the level of dividends expected to be paid on the Company’s common stock over the expected term.
(3)Based on the historical volatility of the Company’s stock over the last seven years.
(4)Represents a premium above the grant date per share value of the Company’s common stock for the Relative TSR modifier of 2.7%, 7.9% and 14.3% for grants during 2023, 2022 and 2021, respectively.
BLOOMIN’ BRANDS, INC.
NOTES TO CONSOLIDATED FINANCIAL STATEMENTS - Continued
The following represents PSU compensation information for the periods indicated:
| | | | | | | | | | | | | | | | | |
| FISCAL YEAR |
| (dollars in thousands) | 2023 | | 2022 | | 2021 |
| | | | | |
| | | | | |
| Intrinsic value for PSUs vested | $ | 12,908 | | | $ | 7,626 | | | $ | 3,768 | |
| Grant date fair value of PSUs vested | $ | 9,332 | | | $ | 6,646 | | | $ | 3,401 | |
| Tax benefits for PSU compensation expense | $ | 745 | | | $ | 348 | | | $ | 134 | |
| | | | | |
| Unrecognized PSU expense | $ | 6,520 | | | | | |
| Remaining weighted average vesting period | 1.2 years | | | | |
Restricted Stock Units (“RSUs”) - RSUs generally vest over a period of three years in an equal number of shares each year. Following is a summary of the Company’s RSU activity:
| | | | | | | | | | | | | | | | | |
| (in thousands, except per unit data) | RESTRICTED STOCK UNITS | | WEIGHTED AVERAGE GRANT DATE FAIR VALUE PER UNIT | | AGGREGATE INTRINSIC VALUE (1) |
| Outstanding as of December 25, 2022 | 657 | | | $ | 21.72 | | | $ | 13,776 | |
| Granted | 406 | | | $ | 24.18 | | | |
| Vested | (393) | | | $ | 21.02 | | | |
| Forfeited | (39) | | | $ | 24.15 | | | |
| Outstanding as of December 31, 2023 (2) | 631 | | | $ | 23.58 | | | $ | 17,757 | |
| | | | | |
| | | | | |
| | | | | |
________________
(1)Based on the $20.96 and $28.15 share price of the Company’s common stock on December 23, 2022 and December 29, 2023, the last trading day of 2022 and 2023, respectively.
(2)All RSUs outstanding as of December 31, 2023 are expected to vest.
The following represents RSU compensation information for the periods indicated:
| | | | | | | | | | | | | | | | | |
| FISCAL YEAR |
| (dollars in thousands, except grant date fair value data) | 2023 | | 2022 | | 2021 |
| Weighted average grant date fair value for RSUs granted (1) | $ | 24.18 | | | $ | 21.59 | | | $ | 25.93 | |
| | | | | |
| Intrinsic value of RSUs vested | $ | 10,275 | | | $ | 9,070 | | | $ | 13,482 | |
| Grant date fair value of RSUs vested | $ | 8,257 | | | $ | 8,025 | | | $ | 9,434 | |
| Tax benefits for RSU compensation expense | $ | 1,528 | | | $ | 1,113 | | | $ | 1,592 | |
| | | | | |
| Unrecognized RSU expense | $ | 9,315 | | | | | |
| Remaining weighted average vesting period | 1.9 years | | | | |
________________(1)The weighted average dividend yield was 3.63% and 2.43% for 2023 and 2022, respectively. There were no dividends in 2021.
Stock Options - Stock options generally vest and become exercisable over a period of four years in an equal number of shares each year. Stock options have an exercisable life of no more than ten years from the date of grant. The Company settles stock option exercises with authorized but unissued shares of the Company’s common stock.
The following table presents a summary of the Company’s stock option activity:
| | | | | | | | | | | | | | | | | | | | | | | |
| (in thousands, except exercise price and contractual life) | OPTIONS | | WEIGHTED
AVERAGE
EXERCISE
PRICE | | WEIGHTED
AVERAGE
REMAINING
CONTRACTUAL
LIFE (YEARS) | | AGGREGATE
INTRINSIC
VALUE |
| Outstanding as of December 27, 2020 | 5,422 | | | $ | 19.76 | | | 5.1 | | $ | 6,575 | |
| | | | | | | |
| Exercised | (936) | | | $ | 15.98 | | | | | |
| Forfeited or expired | (210) | | | $ | 23.34 | | | | | |
| Outstanding as of December 26, 2021 | 4,276 | | | $ | 20.42 | | | 4.7 | | $ | 7,304 | |
| Exercisable as of December 26, 2021 | 3,905 | | | $ | 20.36 | | | 4.4 | | $ | 7,032 | |
| | | | | | | |
| | | | | | | |
| | | | | | | |
| | | | | | | |
Assumptions used in the Black-Scholes option pricing model and the weighted average fair value of option awards granted were as follows for the period indicated:
| | | | | | | | | |
| | | | | FISCAL YEAR |
| | | | | 2019 |
Assumptions: | | | | | |
Risk-free interest rate (1) | | | | | 2.34 | % |
Dividend yield (2) | | | | | 1.94 | % |
Expected term (3) | | | | | 4.8 years |
Weighted average volatility (4) | | | | | 31.05 | % |
| | | | | |
Weighted average grant date fair value per option | | | | | $ | 5.07 | |
________________
(1)Risk-free interest rate is the U.S. Treasury yield curve in effect as of the grant date for periods within the expected term of the option.
(2)Dividend yield is the level of dividends expected to be paid on the Company’s common stock over the expected term of the option.
(3)Expected term represents the period of time that the options are expected to be outstanding. The Company estimates the expected term based on historical exercise experience for its stock options.
(4)Based on the historical volatility of the Company’s stock.
BLOOMIN’ BRANDS, INC.
NOTES TO CONSOLIDATED FINANCIAL STATEMENTS - Continued
The following represents stock option compensation information for the periods indicated:
| | | | | | | | | | | | | | | | | |
| FISCAL YEAR |
| (dollars in thousands) | 2021 | | 2020 | | 2019 |
| Intrinsic value of options exercised | $ | 8,419 | | | $ | 2,201 | | | $ | 7,929 | |
| | | | | |
| Cash received from option exercises, net of tax withholding | $ | 14,951 | | | $ | 4,609 | | | $ | 6,501 | |
| Fair value of stock options vested | $ | 19,246 | | | $ | 16,468 | | | $ | 18,136 | |
| Tax benefits for stock option compensation expense | $ | 1,942 | | | $ | 535 | | | $ | 1,932 | |
| | | | | |
| Unrecognized stock option expense | $ | 525 | | | | | |
| Remaining weighted average vesting period | 0.6 years | | | | |
Restricted Stock Units - Beginning in 2019, restricted stock units granted generally vest over a period of three years and restricted stock units granted prior to 2019 generally vest over a period of four years, in an equal number of shares each year. Following is a summary of the Company’s restricted stock unit activity:
| | | | | | | | | | | |
| (shares in thousands) | NUMBER OF RESTRICTED STOCK UNIT AWARDS | | WEIGHTED AVERAGE
GRANT DATE
FAIR VALUE PER AWARD |
| Outstanding as of December 27, 2020 | 1,034 | | | $ | 18.12 | |
| Granted | 319 | | | $ | 25.93 | |
| Vested | (508) | | | $ | 18.57 | |
| Forfeited | (115) | | | $ | 18.47 | |
| Outstanding as of December 26, 2021 | 730 | | | $ | 21.16 | |
| | | |
| | | |
The following represents restricted stock unit compensation information for the periods indicated:
| | | | | | | | | | | | | | | | | |
| FISCAL YEAR |
| (dollars in thousands) | 2021 | | 2020 | | 2019 |
| Fair value of restricted stock vested | $ | 9,434 | | | $ | 8,973 | | | $ | 8,200 | |
| Tax benefits for restricted stock compensation expense | $ | 1,592 | | | $ | 1,614 | | | $ | 1,672 | |
| | | | | |
| Unrecognized restricted stock expense | $ | 9,315 | | | | | |
| Remaining weighted average vesting period | 1.8 years | | | | |
Performance-based Share Units - The number of PSUs that vest is determined for each year based on the achievement of certain performance criteria as set forth in the award agreement and may range from zero to 200% of the annual target grant. The PSUs are settled in shares of common stock, with holders receiving 1 share of common stock for each performance-based share unit that vests. The fair value of PSUs is based on the closing price of the Company’s common stock on the grant date. Compensation expense for PSUs is recognized over the vesting period when it is probable the performance criteria will be achieved.
BLOOMIN’ BRANDS, INC.
NOTES TO CONSOLIDATED FINANCIAL STATEMENTS - Continued
The following table presents a summary of the Company’s PSUstock option activity:
| | | | | | | | | | | |
| (shares in thousands) | PERFORMANCE-BASED SHARE UNITS | | WEIGHTED AVERAGE
GRANT DATE
FAIR VALUE PER AWARD |
| Outstanding as of December 27, 2020 | 673 | | | $ | 20.37 | |
| Granted | 328 | | | $ | 28.98 | |
| Vested | (147) | | | $ | 23.05 | |
| Forfeited | (95) | | | $ | 24.11 | |
| Outstanding as of December 26, 2021 | 759 | | | $ | 23.11 | |
| | | |
| | | |
In February 2021, the Company granted 0.3 million PSUs with a three-year cliff vesting period and adjusted diluted earnings per share performance metric. These grants include a Relative TSR modifier to the final payout outcome, which can adjust the payout by 75%, 100% or 125% of the achieved performance metric, with the overall payout capped at 200% of the annual target grant. The fair value of PSUs granted was estimated using the Monte Carlo simulation model. The Monte Carlo simulation model utilizes multiple input variables to estimate the probability that the market conditions will be achieved and is applied to the trading price of the Company’s common stock on the date of the grant.
Assumptions used in the Monte Carlo simulation model and the grant date fair value of PSUs granted were as follows for the period indicated:
| | | | | | | |
| FISCAL YEAR |
| 2021 | | |
Assumptions: | | | |
Risk-free interest rate (1) | 0.20 | % | | |
| | | |
| | | |
Volatility (2) | 48.45 | % | | |
| | | |
Grant date fair value per unit (3) | $ | 29.73 | | | |
| | | | | | | | | | | | | | | | | | | | | | | |
| (in thousands, except exercise price and contractual life data) | OPTIONS | | WEIGHTED
AVERAGE
EXERCISE
PRICE | | WEIGHTED
AVERAGE
REMAINING
CONTRACTUAL
LIFE (YEARS) | | AGGREGATE
INTRINSIC
VALUE |
| Outstanding as of December 25, 2022 | 3,188 | | | $ | 21.43 | | | 4.0 | | $ | 3,337 | |
| | | | | | | |
| Exercised | (1,455) | | | $ | 21.86 | | | | | |
| Forfeited or expired | (8) | | | $ | 25.35 | | | | | |
| Outstanding and exercisable as of December 31, 2023 (1) | 1,725 | | | $ | 21.04 | | | 3.2 | | $ | 12,263 | |
| | | | | | | |
| | | | | | | |
| | | | | | | |
| | | | | | | |
| | | | | | | |
________________
(1)Risk-free interest rate is the U.S. Treasury yield curve in effect as of the grant date for the performance period of the unit.
(2)No stock options were granted during Based on the historical volatility of the Company’s stock over the last seven years.
(3)Represents a 14.3% premium above the per share value of the Company’s common stock as of the grant date.2023.
The following represents PSUstock option compensation information for the periods indicated:
| | | | | | | | | | | | | | | | | |
| FISCAL YEAR |
| (dollars in thousands) | 2021 | | 2020 | | 2019 |
| Tax benefits for PSU compensation expense | $ | 134 | | | $ | 1,570 | | | $ | 857 | |
| | | | | |
| Unrecognized PSU expense | $ | 16,522 | | | | | |
| Remaining weighted average vesting period (1) | 1.4 years | | | | |
________________
(1)PSUs typically vest after three years. | | | | | | | | | | | | | | | | | |
| FISCAL YEAR |
| (dollars in thousands) | 2023 | | 2022 | | 2021 |
| Intrinsic value of options exercised | $ | 6,200 | | | $ | 6,367 | | | $ | 8,419 | |
| | | | | |
| Cash received from option exercises, net of tax withholding | $ | 31,778 | | | $ | 17,888 | | | $ | 14,951 | |
| Grant date fair value of stock options vested | $ | 1,037 | | | $ | 7,645 | | | $ | 19,246 | |
| Tax benefits for stock option compensation expense | $ | 757 | | | $ | 1,495 | | | $ | 1,942 | |
| | | | | |
| | | | | |
| | | | | |
As of December 26, 2021,31, 2023, the maximum number of shares of common stock available for issuance for equity instruments pursuant to the 2020 Omnibus Incentive Compensation Plan was 8,910,835.
BLOOMIN’ BRANDS, INC.
NOTES TO CONSOLIDATED FINANCIAL STATEMENTS - Continued6,925,256.
Deferred Compensation Plans
U.S. Partner Deferred Compensations Plans - Certain U.S. Partners may participate in deferred compensation programs that are subject to the rules of Section 409A of the Internal Revenue Code. The Company may invest in corporate-owned life insurance policies, which are held within an irrevocable grantor or rabbi trust account for settlement of certain of the obligations under the deferred compensation plans. The deferred compensation obligation due to U.S. Partners under these plans was $15.5 million and $28.1 million as of December 26, 2021 and December 27, 2020, respectively. The rabbi trust is funded through the Company’s voluntary contributions and was fully funded as of December 26, 2021.
401(k) Plan - The Company has a qualified defined contribution plan that qualifies under Section 401(k) of the Internal Revenue Code of 1986, as amended. The Company incurred contribution costs of $6.1$5.6 million, $5.5$5.6 million and $5.4$6.1 million for the 401(k) Plan for 2021, 20202023, 2022 and 2019,2021, respectively.
Highly Compensated Employee Plan - The Company provides a deferred compensation plan for its highly compensated employees who are not eligible to participate in the 401(k) Plan. The deferred compensation plan allows these employees to contribute a percentage of their base salary and cash bonus on a pre-tax basis. The deferred compensation plan is unsecured and funded through the Company’s voluntary contributions.
8.7. Other Current Assets, Net
Other current assets, net, consisted of the following as of the periods indicated:
| | (dollars in thousands) | (dollars in thousands) | DECEMBER 26, 2021 | | DECEMBER 27, 2020 | (dollars in thousands) | DECEMBER 31, 2023 | | DECEMBER 25, 2022 |
| Prepaid expenses | Prepaid expenses | $ | 21,194 | | | $ | 12,148 | |
| Accounts receivable - gift cards, net (1) | Accounts receivable - gift cards, net (1) | 91,248 | | | 76,808 | |
| Accounts receivable - vendors, net (1) | Accounts receivable - vendors, net (1) | 11,793 | | | 8,886 | |
| Accounts receivable - franchisees, net (1) | Accounts receivable - franchisees, net (1) | 1,701 | | | 1,007 | |
| Accounts receivable - other, net (1) | Accounts receivable - other, net (1) | 18,353 | | | 16,782 | |
| Deferred gift card sales commissions | Deferred gift card sales commissions | 17,793 | | | 19,300 | |
| Assets held for sale | 100 | | | 3,831 | |
| | Other current assets, net | Other current assets, net | 22,441 | | | 12,756 | |
| $ | 184,623 | | | $ | 151,518 | |
| Other current assets, net | |
| Other current assets, net | |
| $ | |
________________
(1)See Note 2019 - Allowance for Expected Credit Lossesfor a rollforward of the related allowance for expected credit losses.
9.
BLOOMIN’ BRANDS, INC.
NOTES TO CONSOLIDATED FINANCIAL STATEMENTS - Continued
8. Property, Fixtures and Equipment, Net
Property, fixtures and equipment, net, consisted of the following as of the periods indicated:
| | | | | | | | | | | |
| (dollars in thousands) | DECEMBER 26, 2021 | | DECEMBER 27, 2020 |
| Land | $ | 38,417 | | | $ | 40,498 | |
| Buildings | 1,167,811 | | | 1,158,257 | |
| Furniture and fixtures | 460,768 | | | 450,508 | |
| Equipment | 641,715 | | | 623,982 | |
| Construction in progress | 47,822 | | | 27,102 | |
| Less: accumulated depreciation | (1,514,521) | | | (1,412,660) | |
| $ | 842,012 | | | $ | 887,687 | |
| | | |
| | | |
| | | |
Surplus Properties - The Company owns certain U.S. restaurant properties and assets that are no longer utilized to operate its restaurants (“surplus properties”). Surplus properties primarily consist of closed properties, which include land and a building, and liquor licenses no longer needed for operations. Surplus properties may be
BLOOMIN’ BRANDS, INC.
NOTES TO CONSOLIDATED FINANCIAL STATEMENTS - Continued
classified on the Consolidated Balance Sheets as assets held for sale or as assets held and used when the Company does not expect to sell these assets within the next 12 months. Following is a summary of the carrying value and number of surplus properties as of the periods indicated:
| | | | | | | | | | | | | | | | | |
| (dollars in thousands) | CONSOLIDATED BALANCE SHEET CLASSIFICATION | | DECEMBER 26, 2021 | | DECEMBER 27, 2020 |
| Surplus properties - assets held for sale | Other current assets, net | | $ | 100 | | | $ | 3,831 | |
| Surplus properties - assets held and used | Property, fixtures and equipment, net | | 4,505 | | | 7,955 | |
| Total surplus properties | | | $ | 4,605 | | | $ | 11,786 | |
| | | | | |
| Number of surplus properties owned | | | 6 | | | 12 | |
| | | | | | | | | | | |
| (dollars in thousands) | DECEMBER 31, 2023 | | DECEMBER 25, 2022 |
| Land | $ | 34,654 | | | $ | 37,596 | |
| Buildings | 1,269,214 | | | 1,223,403 | |
| Furniture and fixtures | 526,192 | | | 489,895 | |
| Equipment | 830,644 | | | 739,136 | |
| Construction in progress | 78,949 | | | 41,723 | |
| Less: accumulated depreciation | (1,707,731) | | | (1,617,611) | |
| $ | 1,031,922 | | | $ | 914,142 | |
| | | |
| | | |
| | | |
Depreciation and repair and maintenance expense are as follows for the periods indicated:
| | FISCAL YEAR |
| FISCAL YEAR | | | FISCAL YEAR |
| (dollars in thousands) | (dollars in thousands) | 2021 | | 2020 | | 2019 | (dollars in thousands) | 2023 | | 2022 | | 2021 |
| Depreciation expense | Depreciation expense | $ | 157,386 | | | $ | 173,342 | | | $ | 188,190 | |
| Repair and maintenance expense | Repair and maintenance expense | $ | 104,209 | | | $ | 88,829 | | | $ | 106,943 | |
10. 9. Goodwill and Intangible Assets, Net
Goodwill - The following table is a rollforward of goodwill:goodwill for the periods indicated:
| | (dollars in thousands) | (dollars in thousands) | U.S. | | INTERNATIONAL | | CONSOLIDATED | (dollars in thousands) | U.S. | | INTERNATIONAL | | CONSOLIDATED |
| Balance as of December 29, 2019 | $ | 170,657 | | | $ | 117,782 | | | $ | 288,439 | |
| Balance as of December 26, 2021 | |
| | Translation adjustments | Translation adjustments | — | | | (15,302) | | | (15,302) | |
| Translation adjustments | |
| Translation adjustments | |
| | Impairment charges | — | | | (1,973) | | | (1,973) | |
| Balance as of December 27, 2020 | 170,657 | | | 100,507 | | | 271,164 | |
| | Balance as of December 25, 2022 | |
| | Balance as of December 25, 2022 | |
| | Balance as of December 25, 2022 | |
| | Translation adjustments | |
| Translation adjustments | |
| Translation adjustments | Translation adjustments | — | | | (2,720) | | | (2,720) | |
| | Balance as of December 26, 2021 | $ | 170,657 | | | $ | 97,787 | | | $ | 268,444 | |
| Balance as of December 31, 2023 | |
| | Balance as of December 31, 2023 | |
| | Balance as of December 31, 2023 | |
|
The following table is a summary of the Company’s gross goodwill balances and accumulated impairments as of the periods indicated:
| | | | | | | | | | | | | | | | | | | | | | | | | | | | | | | | | | | |
| DECEMBER 26, 2021 | | DECEMBER 27, 2020 | | DECEMBER 29, 2019 |
| (dollars in thousands) | GROSS CARRYING AMOUNT | | ACCUMULATED IMPAIRMENTS | | GROSS CARRYING AMOUNT | | ACCUMULATED IMPAIRMENTS | | GROSS CARRYING AMOUNT | | ACCUMULATED IMPAIRMENTS |
| U.S. | $ | 838,827 | | | $ | (668,170) | | | $ | 838,827 | | | $ | (668,170) | | | $ | 838,827 | | | $ | (668,170) | |
| International | 217,670 | | | (119,883) | | | 220,390 | | | (119,883) | | | 235,692 | | | (117,910) | |
| Total goodwill | $ | 1,056,497 | | | $ | (788,053) | | | $ | 1,059,217 | | | $ | (788,053) | | | $ | 1,074,519 | | | $ | (786,080) | |
| | | | | | | | | | | |
| | | | | | | | | | | |
| | | | | | | | | | | |
The COVID-19 outbreak was considered a triggering event during the first quarter of 2020, indicating that the carrying amount of goodwill may not be recoverable. As a result, the Company performed a quantitative assessment for its 4 U.S. and 3 international reporting units to determine whether a reporting unit was impaired. Based on this assessment, which utilized a discounted cash flow analysis, the Company recorded full impairment of goodwill related to its Hong Kong reporting unit of $2.0 million, within the international segment, during the first quarter of 2020. Impairment was not recorded for any of the Company’s other reporting units as a result of the quantitative assessment. | | | | | | | | | | | | | | | | | | | | | | | | | | | | | | | | | | | |
| DECEMBER 31, 2023 | | DECEMBER 25, 2022 | | DECEMBER 26, 2021 |
| (dollars in thousands) | GROSS CARRYING AMOUNT | | ACCUMULATED IMPAIRMENTS | | GROSS CARRYING AMOUNT | | ACCUMULATED IMPAIRMENTS | | GROSS CARRYING AMOUNT | | ACCUMULATED IMPAIRMENTS |
| U.S. | $ | 838,827 | | | $ | (668,170) | | | $ | 838,827 | | | $ | (668,170) | | | $ | 838,827 | | | $ | (668,170) | |
| International | 225,543 | | | (119,883) | | | 222,258 | | | (119,883) | | | 217,670 | | | (119,883) | |
| Total goodwill | $ | 1,064,370 | | | $ | (788,053) | | | $ | 1,061,085 | | | $ | (788,053) | | | $ | 1,056,497 | | | $ | (788,053) | |
| | | | | | | | | | | |
| | | | | | | | | | | |
| | | | | | | | | | | |
The Company performs its annual assessment for impairment of goodwill and other indefinite-lived intangible assets each year during the second quarter. The Company’s 2023 assessment was quantitative and the 2022 and 2021 and 2019 assessments utilizedwere qualitative. As a qualitativeresult of these assessments, the Company did not record any goodwill asset impairment charges during 2023, 2022 or 2021.
BLOOMIN’ BRANDS, INC.
NOTES TO CONSOLIDATED FINANCIAL STATEMENTS - Continued
approach. As a result of these assessments, the Company did 0t record any goodwill asset impairment charges during 2021 or 2019. Since the Company performed a quantitative assessment on the last day of the first quarter of 2020, as described above, the Company utilized the same assumptions and analysis in performing a quantitative annual assessment in its second quarter and concluded that 0 additional impairment was required.
Intangible Assets, net - Intangible assets, net, consisted of the following as of the periods indicated:
| | WEIGHTED AVERAGE REMAINING AMORTIZATION PERIOD
(IN YEARS) | | DECEMBER 26, 2021 | | DECEMBER 27, 2020 |
| WEIGHTED AVERAGE REMAINING AMORTIZATION PERIOD
(in years) | | | WEIGHTED AVERAGE REMAINING AMORTIZATION PERIOD
(in years) | | DECEMBER 31, 2023 | | DECEMBER 25, 2022 |
| (dollars in thousands) | (dollars in thousands) | WEIGHTED AVERAGE REMAINING AMORTIZATION PERIOD
(IN YEARS) | | GROSS CARRYING VALUE | | ACCUMULATED AMORTIZATION | | NET CARRYING VALUE | | GROSS CARRYING VALUE | | ACCUMULATED AMORTIZATION | | NET CARRYING VALUE | (dollars in thousands) | | GROSS CARRYING VALUE | | ACCUMULATED AMORTIZATION | | NET CARRYING VALUE | | GROSS CARRYING VALUE | | ACCUMULATED AMORTIZATION | | NET CARRYING VALUE |
| Trade names | Trade names | | $ | 414,716 | | | | | $ | 414,716 | | | $ | 414,716 | | | | | $ | 414,716 | |
| Trademarks | Trademarks | 7 | | 81,951 | | | $ | (55,736) | | | 26,215 | | | 81,951 | | | $ | (51,797) | | | 30,154 | |
| | Franchise agreements | 0 | | — | | | — | | | — | | | 14,881 | | | (14,881) | | | — | |
| Reacquired franchise rights | 9 | | 31,944 | | | (19,463) | | | 12,481 | | | 33,520 | | | (18,407) | | | 15,113 | |
| | Reacquired franchise rights (1) | |
| | Reacquired franchise rights (1) | |
| | Reacquired franchise rights (1) | |
| | Total intangible assets | |
| Total intangible assets | |
| Total intangible assets | Total intangible assets | 8 | | $ | 528,611 | | | $ | (75,199) | | | $ | 453,412 | | | $ | 545,068 | | | $ | (85,085) | | | $ | 459,983 | |
|
________________
(1)Included within Outback Steakhouse - Brazil.
The Company did 0tnot record any indefinite-lived intangible asset impairment charges during the periods presented.
The following table presents goodwill, trade names and trademarks balances by reporting unit as of the periods indicated:
| | | | | | | | | | | | | | | | | | | | | | | | | | | | | | | | | | | |
| DECEMBER 31, 2023 | | DECEMBER 25, 2022 |
| (dollars in thousands) | GOODWILL | | TRADE NAMES | | TRADEMARKS | | GOODWILL | | TRADE NAMES | | TRADEMARKS |
| Outback Steakhouse | $ | 123,188 | | | $ | 287,000 | | | $ | — | | | $ | 123,188 | | | $ | 287,000 | | | $ | — | |
| Carrabba’s Italian Grill | 18,826 | | | 69,000 | | | — | | | 18,826 | | | 69,000 | | | — | |
| Bonefish Grill | 28,188 | | | — | | | 9,788 | | | 28,188 | | | — | | | 12,618 | |
| Fleming’s Prime Steakhouse & Wine Bar | 455 | | | — | | | 8,412 | | | 455 | | | — | | | 9,407 | |
| U.S. total | 170,657 | | | 356,000 | | | 18,200 | | | 170,657 | | | 356,000 | | | 22,025 | |
| Outback Steakhouse - Brazil | 62,994 | | | — | | | — | | | 59,709 | | | — | | | 252 | |
| International - Franchise | 42,666 | | | 58,716 | | | — | | | 42,666 | | | 58,716 | | | — | |
| International total | 105,660 | | | 58,716 | | | — | | | 102,375 | | | 58,716 | | | 252 | |
| Total | $ | 276,317 | | | $ | 414,716 | | | $ | 18,200 | | | $ | 273,032 | | | $ | 414,716 | | | $ | 22,277 | |
Definite-lived intangible assets are amortized on a straight-line basis. The following table presents the aggregate expense related to the amortization of the Company’s trademarks franchise agreements and reacquired franchise rights for the periods indicated:
| | FISCAL YEAR |
| FISCAL YEAR | | | FISCAL YEAR |
| (dollars in thousands) | (dollars in thousands) | 2021 | | 2020 | | 2019 | (dollars in thousands) | 2023 | | 2022 | | 2021 |
| Amortization expense | Amortization expense | $ | 6,005 | | | $ | 6,919 | | | $ | 8,621 | |
The following table presents expected annual amortization of intangible assets as of December 26, 2021:
| | | | | |
| (dollars in thousands) | |
| 2022 | $ | 5,807 | |
| 2023 | $ | 5,741 | |
| 2024 | $ | 5,613 | |
| 2025 | $ | 5,378 | |
| 2026 | $ | 5,294 | |
11. Other Assets, Net
Other assets, net, consisted of the following as of the periods indicated:
| | | | | | | | | | | |
| (dollars in thousands) | DECEMBER 26, 2021 | | DECEMBER 27, 2020 |
| Company-owned life insurance (1) | $ | 30,970 | | | $ | 44,814 | |
| Deferred debt issuance costs (2) | 5,861 | | | 4,694 | |
| Liquor licenses | 23,266 | | | 24,250 | |
| Other assets | 18,573 | | | 18,868 | |
| $ | 78,670 | | | $ | 92,626 | |
| | | |
| | | |
| | | |
________________
(1)During 2021, the Company withdrew $9.1 million from its Company-owned life insurance policies to pay deferred compensation obligations.
(2)Net of accumulated amortization of $8.5 million and $9.0 million as of December 26, 2021 and December 27, 2020, respectively. | | | | | |
| (dollars in thousands) | |
| 2024 | $ | 5,738 | |
| 2025 | $ | 5,470 | |
| 2026 | $ | 5,374 | |
| 2027 | $ | 3,624 | |
| 2028 | $ | 2,076 | |
BLOOMIN’ BRANDS, INC.
NOTES TO CONSOLIDATED FINANCIAL STATEMENTS - Continued
12.10. Other Assets, Net
Other assets, net, consisted of the following as of the periods indicated:
| | | | | | | | | | | |
| (dollars in thousands) | DECEMBER 31, 2023 | | DECEMBER 25, 2022 |
| Company-owned life insurance | $ | 28,018 | | | $ | 27,789 | |
| Deferred debt issuance costs - revolving credit facility (1) | 3,813 | | | 5,505 | |
| Liquor licenses | 23,125 | | | 23,454 | |
| Other assets | 30,231 | | | 25,399 | |
| $ | 85,187 | | | $ | 82,147 | |
| | | |
| | | |
| | | |
________________
(1)Net of accumulated amortization of $11.7 million and $10.1 million as of December 31, 2023 and December 25, 2022, respectively.
11. Accrued and Other Current Liabilities
Accrued and other current liabilities consisted of the following as of the periods indicated:
| | | | | | | | | | | |
| (dollars in thousands) | DECEMBER 26, 2021 | | DECEMBER 27, 2020 |
| Accrued rent and current operating lease liabilities | $ | 181,636 | | | $ | 192,369 | |
| Accrued payroll and other compensation (1) | 105,095 | | | 79,291 | |
| Accrued insurance | 22,017 | | | 20,648 | |
| Other current liabilities | 98,146 | | | 96,013 | |
| $ | 406,894 | | | $ | 388,321 | |
| | | |
| | | |
| | | |
| | | | | | | | | | | |
| (dollars in thousands) | DECEMBER 31, 2023 | | DECEMBER 25, 2022 |
| | | |
| Accrued payroll and other compensation | $ | 98,903 | | | $ | 84,075 | |
| Accrued insurance | 19,310 | | | 20,932 | |
| Other current liabilities (1) | 137,601 | | | 112,420 | |
| $ | 255,814 | | | $ | 217,427 | |
________________
(1)During 2021, accrued payroll and2023, other compensationcurrent liabilities increased primarily due to an increase in incentive compensation as a result of increased restaurant sales in 2021 due to the impact of COVID-19 during 2020.accrued advertising expense.
13.12. Long-term Debt, Net
Following is a summary of outstanding long-term debt, net, as of the periods indicated:
| | | | | | | | | | | | | | | | | | | | | | | |
| DECEMBER 26, 2021 | | DECEMBER 27, 2020 |
| (dollars in thousands) | OUTSTANDING BALANCE | | INTEREST RATE | | OUTSTANDING BALANCE | | INTEREST RATE |
| Senior Secured Credit Facility: | | | | | | | |
| Term loan A (1) | $ | 195,000 | | | 1.60 | % | | $ | — | | | |
| Revolving credit facility (2) | 80,000 | | | 3.75 | % | | — | | | |
| Total Senior Secured Credit Facility | 275,000 | | | | | — | | | |
| Former Credit Facility: | | | | | | | |
| Term loan A (1) | — | | | | | 425,000 | | | 2.88 | % |
| Revolving credit facility (1) | — | | | | | 447,000 | | | 2.88 | % |
| Total Former Credit Facility | — | | | | | 872,000 | | | |
| 2025 Notes (3) | 230,000 | | | 5.00 | % | | 230,000 | | | 5.00 | % |
| 2029 Notes | 300,000 | | | 5.13 | % | | — | | | |
| Finance lease liabilities | 2,376 | | | | | 2,405 | | | |
| | | | | | | |
| | | | | | | |
| Less: unamortized debt discount and issuance costs (4) | (14,157) | | | | | (67,704) | | | |
| Less: finance lease interest | (154) | | | | | (221) | | | |
| Total debt, net | 793,065 | | | | | 1,036,480 | | | |
| Less: current portion of long-term debt | (10,958) | | | | | (38,710) | | | |
| Long-term debt, net | $ | 782,107 | | | | | $ | 997,770 | | | |
| | | | | | | |
| | | | | | | |
| | | | | | | |
| | | | | | | |
| | | | | | | |
| | | | | | | |
| | | | | | | | | | | | | | | | | | | | | | | |
| DECEMBER 31, 2023 | | DECEMBER 25, 2022 |
| (dollars in thousands) | OUTSTANDING BALANCE | | INTEREST RATE | | OUTSTANDING BALANCE | | INTEREST RATE |
| | | | | | | |
| | | | | | | |
| Senior secured credit facility - revolving credit facility (1) | $ | 381,000 | | | 6.96 | % | | $ | 430,000 | | | 5.79 | % |
| | | | | | | |
| | | | | | | |
| | | | | | | |
| | | | | | | |
| | | | | | | |
| 2025 Notes | 104,786 | | | 5.00 | % | | 105,000 | | | 5.00 | % |
| 2029 Notes | 300,000 | | | 5.13 | % | | 300,000 | | | 5.13 | % |
| | | | | | | |
| | | | | | | |
| | | | | | | |
| Less: unamortized debt discount and issuance costs | (5,067) | | | | | (6,493) | | | |
| | | | | | | |
| | | | | | | |
| | | | | | | |
| Long-term debt, net | $ | 780,719 | | | | | $ | 828,507 | | | |
| | | | | | | |
| | | | | | | |
| | | | | | | |
| | | | | | | |
| | | | | | | |
| | | | | | | |
________________(1)Interest rate represents the weighted average interest rate as of the respective periods.
(2)Interest rate represents the Base Rate option elected in anticipation of impending repayment. Subsequent to December 26, 2021, the Company repaid the remaining $80.0 million balance on its revolving credit facility.
(3)See Note 14 - Convertible Senior Notes for details regarding the 2025 Notes and related hedge and warrant transactions.
(4)In connection with the adoption of ASU No. 2020-06, debt discount of $59.9 million related to the 2025 Notes was derecognized and $2.1 million of equity issuance costs were reclassified as debt issuance costs during 2021.
Bloomin’ Brands, Inc. is a holding company and conducts its operations through its subsidiaries, certain of which have incurred indebtedness as described below.
Credit Agreement - On April 16, 2021, the Company and OSI, as co-borrowers, entered into the Second Amended and Restated Credit Agreement (the “Credit Agreement”), which provides for senior secured financing of up to $1.0 billion consisting of a $200.0 million Term loan A and an $800.0 million revolving credit facility (the “Senior Secured Credit Facility”). The Senior Secured Credit Facility matures on April 16, 2026.
On April 26, 2022, the Company and OSI entered into the First Amendment to the Second Amended and Restated Credit Agreement and Incremental Amendment (the “Amended Credit Agreement”), which included an increase of the Company’s existing revolving credit facility from $800.0 million to $1.0 billion and a transition from the London Inter-Bank Offered Rate (“LIBOR”) to the Secured Overnight Financing Rate (“SOFR”) as the benchmark rate for purposes of calculating interest under the Senior Secured Credit Facility. At closing, an incremental
BLOOMIN’ BRANDS, INC.
NOTES TO CONSOLIDATED FINANCIAL STATEMENTS - Continued
$192.5 million was drawn on the revolving credit facility to fully repay the outstanding balance of Term loan A. The total indebtedness of the Company remained unchanged as a result of the Amended Credit Agreement.
Under the Amended Credit Agreement, the Company may elect an interest rate at each reset period based on the Base Rate or Adjusted Term SOFR, plus an applicable spread. The Base Rate option is the highest of: (i) the prime rate of Wells Fargo Bank, National Association, (ii) the federal funds effective rate plus 0.5 of 1.0% or (iii) the Adjusted Term SOFR with a one-month interest period plus 1.0% (the “Base Rate”). The Adjusted Term SOFR option is the 30, 90 or 180-day SOFR, plus a term SOFR adjustment of 0.10%, subject to a 0% floor (the “Adjusted Term SOFR”). The interest rate spreads are as follows:
| | | | | | | | | | | |
| BASE RATE ELECTION | | ADJUSTED TERM SOFR ELECTION |
| Revolving credit facility | 50 to 150 basis points over the Base Rate | | 150 to 250 basis points over the Adjusted Term SOFR |
| | | |
The transition to SOFR did not materially impact the interest rate applied to the Company’s borrowings. No other material changes were made to the terms of the Company’s Credit Agreement as a result of the Amended Credit Agreement.
Fees on letters of credit and daily unused availability under the revolving credit facility are 150 to 250 basis points and 25 to 40 basis points, respectively.
The commitments under the Senior Secured Credit Facility may be increased in an aggregate principal amount of up to: (i) $225.0 million or (ii) at the Company’s option, up to an unlimited amount of incremental facilities, so long as the Consolidated Senior Secured Net Leverage Ratio, as defined in the Amended Credit Agreement, is no more than 3.00 to 1.00 as of the last day of the most recent period of four consecutive fiscal quarters ended.
The Amended Credit Agreement limits, subject to certain exceptions, the Company’s ability and the ability of its subsidiaries to incur additional indebtedness; make significant payments; sell assets; pay dividends above certain thresholds and other restricted payments; make certain investments; acquire certain assets; effect mergers and similar transactions; and effect certain other transactions with affiliates.
The Amended Credit Agreement requires a Total Net Leverage Ratio (“TNLR”) not to exceed 4.50 to 1.00. TNLR is the ratio of Consolidated Total Debt (Current portion of long-term debt and Long-term debt, net of cash, excluding the 2025 Notes) to Consolidated EBITDA (earnings before interest, taxes, depreciation and amortization and certain other adjustments as defined in the Amended Credit Agreement).
As of December 31, 2023 and December 25, 2022, the Company was in compliance with its debt covenants.
2029 Notes - On April 16, 2021, the Company and its wholly-owned subsidiary OSI, as co-issuers, issued $300.0 million aggregate principal amount of senior unsecured notes due 2029 (the “2029 Notes”).
The 2029 Notes were issued pursuant to an Indenture, dated April 16, 2021 (the “Indenture”), by and among the Company, the guarantors named therein, and Wells Fargo Bank, National Association, as trustee. The 2029 Notes
BLOOMIN’ BRANDS, INC.
NOTES TO CONSOLIDATED FINANCIAL STATEMENTS - Continued
are guaranteed by each of the Company’s existing and future domestic restricted subsidiaries (other than OSI) that are guarantors or borrowers under its Senior Secured Credit Facility (as defined below) or certain other indebtedness. The 2029 Notes mature on April 15, 2029, unless earlier redeemed or purchased by the Company. The 2029 Notes bear cash interest at an annual rate of 5.125% payable semi-annually in arrears on April 15 and October 15 of each year.
The Company may redeem some or all of the 2029 Notes at any time on or after April 15, 2024, at the redemption prices set forth in the Indenture, plus accrued and unpaid interest. The Company may also redeem up to 40% of the 2029 Notes in an amount not greater than the proceeds of certain equity offerings completed before April 15, 2024, at a redemption price equal to 105.125% of the principal amount thereof, plus accrued and unpaid interest. In
BLOOMIN’ BRANDS, INC.
NOTES TO CONSOLIDATED FINANCIAL STATEMENTS - Continued
addition, at any time prior to April 15, 2024, the Company may redeem some or all of the 2029 Notes at a price equal to 100% of the principal amount, plus a make-whole premium, plus accrued and unpaid interest.
The Indenture contains restrictive covenants that limit the ability of the Company and its restricted subsidiaries to, among other things, incur additional indebtedness or issue certain preferred stock; pay dividends above certain thresholds, redeem stock or make other distributions; make certain investments; create restrictions on the ability of the Company’s restricted subsidiaries to pay dividends or make other payments to the Company; create certain liens; transfer or sell certain assets; merge or consolidate; enter into certain transactions with the Company’s affiliates; and designate subsidiaries as unrestricted subsidiaries. These covenants are subject to a number of exceptions and qualifications as set forth in the Indenture.
The Indenture contains customary events of default, including, without limitation, failure to make required payments, failure to comply with certain agreements or covenants, cross-acceleration to certain other indebtedness in excess of specified amounts, certain events of bankruptcy and insolvency, and failure to pay certain judgments.
The net proceeds from the 2029 Notes offering were approximately $294.5 million, after deducting the initial purchaser’s discount and the Company’s offering expenses. The net proceeds were used to repay a portion of the Company’s outstanding Term loan A and revolving credit facility in conjunction with the refinancing of its Former Credit Facility.former credit facility.
Credit Agreement - On April 16, 2021, the Company and OSI, as co-borrowers, entered into the Second Amended and Restated Credit Agreement (the “Credit Agreement”), which provides for senior secured financing of up to $1.0 billion consisting of a $200.0 million Term loan A and an $800.0 million revolving credit facility (the “Senior Secured Credit Facility”). The Senior Secured Credit Facility matures on April 16, 2026 and replaced the Company’s prior senior secured financing of up to $1.5 billion (the “Former Credit Facility”).
The commitments under the Senior Secured Credit Facility may be increased in an aggregate principal amount of up to: (i) $425.0 million or (ii) at the Company’s option, up to an unlimited amount of incremental facilities, so long as the Consolidated Senior Secured Net Leverage Ratio (“CSSNLR”), as defined in the Credit Agreement, is no more than 3.00 to 1.00 as of the last day of the most recent period of four consecutive fiscal quarters ended.
The Company may elect an interest rate at each reset period based on the Base Rate or the Eurocurrency Rate, plus an applicable spread. The Base Rate option is the highest of: (i) the prime rate of Wells Fargo Bank, National Association, (ii) the federal funds effective rate plus 0.5 of 1.0% or (iii) the Eurocurrency rate with a one-month interest period plus 1.0% (the “Base Rate”). The Eurocurrency Rate option is the seven, 30, 60, 90 or 180-day Eurocurrency rate, subject to a 0% floor (the “Eurocurrency Rate”). The interest rates are as follows:
| | | | | | | | | | | |
| BASE RATE ELECTION | | EUROCURRENCY RATE ELECTION |
Term loan A and revolving credit facility | 50 to 150 basis points over the Base Rate | | 150 to 250 basis points over the Eurocurrency Rate |
| | | |
Fees on letters of credit and daily unused availability under the revolving credit facility are 150 to 250 basis points and 25 to 40 basis points, respectively.
BLOOMIN’ BRANDS, INC.
NOTES TO CONSOLIDATED FINANCIAL STATEMENTS - Continued
The following is a summary of required quarterly amortization payments for the Term loan A (dollars in thousands):
| | | | | | | | |
SCHEDULED QUARTERLY PAYMENT DATES | | TERM LOAN A |
March 27, 2022 through June 30, 2024 | | $ | 2,500 | |
September 29, 2024 through June 29, 2025 | | $ | 3,750 | |
September 28, 2025 and December 28, 2025 | | $ | 5,000 | |
The Senior Secured Credit Facility contains mandatory prepayment requirements for the Term loan A, including the requirement that the Company prepay outstanding amounts under these loans with 50% of its annual excess cash flow, as defined in the Credit Agreement, commencing with the fiscal year ending December 25, 2022. The amount of outstanding loans required to be prepaid in accordance with the debt covenants may vary based on the Company’s CSSNLR and year end results.
Total Net Leverage Ratio (“TNLR”) is the ratio of Consolidated Total Debt (Current portion of long-term debt and Long-term debt, net of cash, excluding the 2025 Notes) to Consolidated EBITDA (earnings before interest, taxes, depreciation and amortization and certain other adjustments as defined in the Credit Agreement). The Credit Agreement requires a TNLR not to exceed 4.50 to 1.00.
The Credit Agreement limits, subject to certain exceptions, the Company’s ability and the ability of its subsidiaries to: incur additional indebtedness; make significant payments; sell assets; pay dividends and other restricted payments; make certain investments; acquire certain assets; effect mergers and similar transactions; and effect certain other transactions with affiliates. The Company was also limited to $200.0 million of aggregate capital expenditures during the year ended December 26, 2021.
As of December 26, 2021 and December 27, 2020, the Company was in compliance with its debt covenants.
Maturities - Following is a summary of principal payments of the Company’s total consolidated debt outstanding as of the period indicated:
| | | | | |
| (dollars in thousands) | DECEMBER 26, 2021 |
| 2022 | $ | 10,976 | |
| 2023 | 10,739 | |
| 2024 | 12,944 | |
| 2025 | 247,674 | |
| 2026 | 225,043 | |
| Thereafter | 300,000 | |
| Total payments | 807,376 | |
| Less: unamortized debt discount and issuance costs | (14,157) | |
| Less: finance lease interest | (154) | |
| Total principal payments | $ | 793,065 | |
| |
| |
Debt Issuance Costs - During 2021, the Company deferred $5.5 million and $5.9 million of financing costs incurred in connection with the 2029 Notes and Credit Agreement, respectively. Debt issuance costs of $3.7 million associated with the revolving credit facility portion of the Credit Agreement were recorded in Other assets, net and all other debt issuance costs were recorded in Long-term debt, net. | | | | | |
| (dollars in thousands) | DECEMBER 31, 2023 |
| 2024 | $ | — | |
| 2025 | 104,786 | |
| 2026 | 381,000 | |
| 2027 | — | |
| 2028 | — | |
| Thereafter | 300,000 | |
| Total payments | 785,786 | |
| Less: unamortized debt discount and issuance costs | (5,067) | |
| Total principal payments | $ | 780,719 | |
| |
| |
14.13. Convertible Senior Notes
2025 Notes - In May 2020, the Company completed a $230.0 million principal amount private offering of 5.00% convertible senior unsecured notes due in 2025. The 2025 Notes are governed by the terms of an indenture between the Company and Wells Fargo Bank, National Association, as the Trustee. The 2025 Notes mature on May 1, 2025,
BLOOMIN’ BRANDS, INC.
NOTES TO CONSOLIDATED FINANCIAL STATEMENTS - Continued
unless earlier converted, redeemed or purchased by the Company. The 2025 Notes bear cash interest at an annual rate of 5.00%, payable semi-annually in arrears on May 1 and November 1 of each year. Net proceeds from the 2025 Notes offering were approximately $221.6 million, after deducting the initial purchaser’s discounts and commissions and the Company’s offering expenses.
The initial conversion rate applicable to the 2025 Notes iswas 84.122 shares of common stock per $1,000 principal amount of 2025 Notes, or a total of approximately 19.348 million shares for the total $230.0 million principal amount. This initial conversion rate iswas equivalent to an initial conversion price of approximately $11.89 per share. The conversion rate is subject to adjustment upon the occurrence of certain specified events.
Prior to the close of business on the business day immediately preceding November 1, 2024, holders may convert all or a portion of their 2025 Notes under the following circumstances: (i) during any calendar quarter commencing after the calendar quarter ending on June 30, 2020, if the last reported sale price per share of the Company’s common stock exceeds 130% of the conversion price for each of at least 20 trading days during the 30 consecutive trading days ending on, and including, the last trading day of the immediately preceding calendar quarter; (ii) during the 5five consecutive business days immediately after any 5five consecutive trading day period (the “measurement period”) in which the trading price per $1,000 principal amount
BLOOMIN’ BRANDS, INC.
NOTES TO CONSOLIDATED FINANCIAL STATEMENTS - Continued
of 2025 Notes for each trading day of the measurement period was less than 98% of the product of the last reported sale price per share of the Company’s common stock and the conversion rate on each such trading day; (iii) upon the occurrence of specified corporate events or distributions on the Company’s common stock; (iv) if the Company calls the 2025 Notes for redemption and (v) at any time from, and including November 1, 2024 until the close of business on the second scheduled trading day immediately before the maturity date.
The 2025 Notes will beare redeemable by the Company, in whole or in part, at the Company’s option at any time, and from time to time, on or after May 1, 2023 and on or before the 40th scheduled trading day immediately before the maturity date, at a cash redemption price equal to the principal amount of the 2025 Notes to be redeemed, plus accrued and unpaid interest, but only if the last reported sale price per share of the Company’s common stock exceeds 130% of the conversion price on: (i) each of at least 20 trading days, whether or not consecutive, during the 30 consecutive trading days ending on, and including, the trading day immediately before the date the Company sends the related redemption notice; and (ii) the trading day immediately before the date the Company sends such notice. In addition, calling any of the 2025 Notes for redemption will constitute a make-whole fundamental change with respect to that note, in which case the conversion rate applicable to the conversion of the 2025 Notes will be increased in certain circumstances if it is converted after it is called for redemption.
If a fundamental change occurs prior to the maturity date, holders may require the Company to repurchase all or a portion of their 2025 Notes for cash at a price equal to 100% of the principal amount of the 2025 Notes to be repurchased, plus accrued and unpaid interest. Holders of 2025 Notes who convert their 2025 Notes in connection with a notice of a redemption or a make-whole fundamental change may be entitled to a premium in the form of an increase in the conversion rate of the 2025 Notes.Notes.
Based on the daily closing prices of the Company’s stock during the quarter ended December 26, 2021,31, 2023, holders of the 2025 Notes are eligible to convert their 2025 Notes during the first quarter of 2022.2024. The Company has provided the trustee of the 2025 Notes notice of its irrevocable election under the 2025 Notes indenture to settle the principal portion of the 2025 Notes upon conversion in cash and any excess in shares.
On May 25, 2022, the Company entered into exchange agreements (the “Exchange Agreements”) with certain holders (the “Noteholders”) of the 2025 Notes. The Noteholders agreed to exchange $125.0 million in aggregate principal amount of the Company’s outstanding 2025 Notes for $196.9 million in cash, plus accrued interest, and approximately 2.3 million shares of the Company’s common stock (the “2025 Notes Partial Repurchase”). Under the Exchange Agreements, the total amount of cash paid and number of shares of common stock issued by the Company were based upon the volume-weighted average price per share of the Company’s common stock during a ten-trading day averaging period ending on June 14, 2022. Upon entering into the Exchange Agreements, the conversion feature related to the 2025 Notes repurchased, as well as the settlements of the related convertible senior note hedges and warrants, were subject to derivative accounting. In connection with the 2025 Notes Partial Repurchase, the Company recognized a loss on extinguishment of debt of $104.7 million and a loss on fair value adjustment of derivatives, net of $17.7 million, and recorded a $48.5 million increase to Additional paid-in capital during 2022.
In connection with dividends paid during 2023, the conversion rate for the remaining 2025 Notes decreased to approximately $11.14 per share, which represents 89.730 shares of common stock per $1,000 principal amount of the 2025 Notes, or a total of approximately 9.402 million shares.
BLOOMIN’ BRANDS, INC.
NOTES TO CONSOLIDATED FINANCIAL STATEMENTS - Continued
The following table includes the outstanding principal amount and carrying value of the 2025 Notes as of the periods indicated:
| | | | | | | | | | | |
| (dollars in thousands) | DECEMBER 26, 2021 | | DECEMBER 27, 2020 |
| Long-term debt, net | | | |
| Principal | $ | 230,000 | | | $ | 230,000 | |
| Less: debt discount (1) | — | | | (59,862) | |
| Less: debt issuance costs (1)(2) | (5,898) | | | (5,427) | |
| Net carrying amount | $ | 224,102 | | | $ | 164,711 | |
| Equity component (1) | $ | — | | | $ | 64,367 | |
________________
(1)In connection with the adoption of ASU No. 2020-06, debt discount and the equity component of the 2025 Notes were derecognized and $2.1 million of issuance costs that were previously allocated to the equity component were reclassified as debt issuance costs during 2021.
(2)Debt issuance costs are amortized to Interest expense, net using the effective interest method over the 2025 Notes’ expected life. | | | | | | | | | | | |
| (dollars in thousands) | DECEMBER 31, 2023 | | DECEMBER 25, 2022 |
| Principal | $ | 104,786 | | | $ | 105,000 | |
| | | |
| Less: unamortized debt issuance costs | (1,138) | | | (1,939) | |
| Net carrying amount | $ | 103,648 | | | $ | 103,061 | |
| | | |
Following is a summary of interest expense for the 2025 Notes, by component for the periods indicated:
| | FISCAL YEAR |
| FISCAL YEAR | | | FISCAL YEAR |
| (dollars in thousands) | (dollars in thousands) | 2021 | | 2020 | (dollars in thousands) | 2023 | | 2022 | | 2021 |
| Coupon interest | Coupon interest | $ | 11,500 | | | $ | 7,443 | |
| Deferred discount amortization | — | | | 6,275 | |
| Deferred issuance cost amortization | 1,557 | | | 569 | |
| | Debt issuance cost amortization | |
| Debt issuance cost amortization | |
| Debt issuance cost amortization | |
| Total interest expense (1) | Total interest expense (1) | $ | 13,057 | | | $ | 14,287 | |
________________
(1)The effective rate of the 2025 Notes over their expected life wasis 5.85% and 13.73% for 2021 and 2020, respectively.
Convertible Note Hedge and Warrant Transactions - In connection with the offering of the 2025 Notes,, the Company entered into convertible note hedge transactions (the “Convertible Note Hedge Transactions”) with certain of the initial purchasers of the 2025 Notes and/or their respective affiliates and other financial institutions (in this capacity, the “Hedge Counterparties”). Concurrently with the Company’s entry into the Convertible Note Hedge Transactions, the Company also entered into separate, warrant transactions with the Hedge Counterparties collectively relating to the same number of shares of the Company’s common stock, subject to customary anti-dilution adjustments, and for which the Company received proceeds that partially offset the cost of entering into the Convertible Note Hedge Transactions (the “Warrant Transactions”).
The Convertible Note Hedge Transactions cover, subject to customary anti-dilution adjustments, the number of shares of the Company’s common stock that initially underlie the 2025 Notes,, and are expected generally to reduce the potential equity dilution in excess of the principal amount due upon conversion of the 2025 Notes.Notes. The Warrant Transactions have a dilutive effect on the Company’s common stock to the extent that the price of its common stock exceeds the strike price of the Warrant Transactions. The strike price iswas initially $16.64 per share and is subject to certain adjustments under the terms of the Warrant Transactions.
The portion of the net proceeds to the Company from the offering of the 2025 Notes that was used to pay the premium on the Convertible Note Hedge Transactions, net of the proceeds to the Company from the Warrant Transactions, was approximately $19.6 million. The net costs incurred in connection with the Convertible Note Hedge Transactions and Warrant Transactions were recorded as a reduction to Additional paid-in capital on the Company’s Consolidated Balance Sheet during 2020.
The Convertible Note Hedge Transactions are exercisable upon conversion of the 2025 Notes. The Convertible Note Hedge Transactions expire upon maturity of the 2025 Notes. The Warrant Transactions are exercisable on the expiration dates included in the related forms of confirmation.
In connection with the 2025 Notes Partial Repurchase, the Company entered into partial unwind agreements with certain financial institutions relating to a portion of the convertible note hedge transactions (the “Note Hedge Early Termination Agreements”) and a portion of the Warrant Transactions (the “Warrant Early Termination Agreements”) that were previously entered into by the Company in connection with the issuance of the 2025 Notes. Upon settlement, the Company received $131.9 million for the Note Hedge Early Termination Agreements and paid $114.8 million for the Warrant Early Termination Agreements. In connection with the Note Hedge Early Termination Agreements and the Warrant Early Termination Agreements the Company recorded a $113.0 million increase and a $97.6 million decrease, respectively, to Additional paid-in capital during 2022.
The remaining Warrant Transactions have a dilutive effect on the Company’s common stock to the extent that the price of its common stock exceeds the strike price of the Warrant Transactions. In connection with dividends paid during 2023, the strike price for the remaining Warrant Transactions decreased to $15.60.
BLOOMIN’ BRANDS, INC.
NOTES TO CONSOLIDATED FINANCIAL STATEMENTS - Continued
15.14. Other Long-term Liabilities, Net
Other long-term liabilities, net, consisted of the following as of the periods indicated:
| | | | | | | | | | | |
| (dollars in thousands) | DECEMBER 26, 2021 | | DECEMBER 27, 2020 |
| Accrued insurance liability | $ | 31,517 | | | $ | 32,128 | |
| Chef and Restaurant Managing Partner deferred compensation obligations | 13,971 | | | 32,306 | |
| Deferred payroll tax liabilities (1) | 27,302 | | | 55,204 | |
| | | |
| Other long-term liabilities (2) | 52,452 | | | 65,717 | |
| $ | 125,242 | | | $ | 185,355 | |
_______________
(1)During 2021, the Company made a payment of $27.3 million related to payroll taxes deferred under the Coronavirus, Aid, Relief and Economic Security Act.
(2)The Company’s hedge liability decreased by $15.6 million during 2021 primarily from the termination of certain interest rate swaps. See Note 17 - Derivative Instruments and Hedging Activities for additional details. | | | | | | | | | | | |
| (dollars in thousands) | DECEMBER 31, 2023 | | DECEMBER 25, 2022 |
| Accrued insurance liability | $ | 26,616 | | | $ | 28,133 | |
| | | |
| Deferred compensation obligations | 34,800 | | | 31,608 | |
| | | |
| Other long-term liabilities | 35,969 | | | 30,794 | |
| $ | 97,385 | | | $ | 90,535 | |
16.15. Stockholders’ Equity
Share Repurchases - On February 8, 2022,7, 2023, the Company’s Board of Directors (the “Board”) approved a share repurchase program (the “2022“2023 Share Repurchase Program”) under which the Company wasis authorized to repurchase up to $125.0 million of its outstanding common stock. The 20222023 Share Repurchase Program will expire on August 9, 2023.7, 2024. As of December 31, 2023, $70.0 million remained available for repurchase under the 2023 Share Repurchase Program.
Following is a summary of the shares repurchased during fiscal year 2023:
| | | | | | | | | | | | | | | | | | | | | | | | | | | | | |
| (in thousands, except per share data) | NUMBER OF SHARES | | AVERAGE REPURCHASE PRICE PER SHARE | | AMOUNT |
| | | | | |
| | | | | | | | | | | | | | | | | |
| First fiscal quarter | 863 | | | | | | | $ | 23.92 | | | | | | | $ | 20,645 | | | | | |
| Second fiscal quarter | 619 | | | | | | | $ | 25.11 | | | | | | | 15,539 | | | | | |
| Third fiscal quarter | 590 | | | | | | | $ | 27.03 | | | | | | | 15,956 | | | | | |
| Fourth fiscal quarter | 735 | | | | | | | $ | 24.29 | | | | | | | 17,860 | | | | | |
| Total common stock repurchases (1) | 2,807 | | | | | | | $ | 24.93 | | | | | | | $ | 70,000 | | | | | |
________________
(1)Excludes $0.1 million of excise tax on share repurchases. Subsequent to December 31, 2023, the Company repurchased 473 thousand shares of its common stock for $12.5 million under the 2023 Share Repurchase Program under a Rule 10b5-1 plan.
In February 2024, the Company’s Board canceled the remaining $57.5 million of authorization under the 2023 Share Repurchase Program and approved a new $350.0 million authorization (the “2024 Share Repurchase Program”). The 2024 Share Repurchase Program includes capacity above the Company’s normal repurchase activity to provide flexibility in retiring the 2025 Notes at or prior to their May 2025 maturity. The 2024 Share Repurchase Program will expire on August 13, 2025.
Dividends - The Company declared and paid dividends per share during the periodperiods presented as follows:
| | | FISCAL YEAR |
| | 2020 |
| DIVIDENDS PER SHARE | |
| DIVIDENDS PER SHARE | |
| DIVIDENDS PER SHARE | | | AMOUNT |
| FISCAL YEAR | | | FISCAL YEAR |
| (dollars in thousands, except per share data) | (dollars in thousands, except per share data) | | DIVIDENDS PER SHARE | | | AMOUNT | (dollars in thousands, except per share data) | 2023 | | | | 2022 | | 2023 | | | | 2022 |
| First fiscal quarter | First fiscal quarter | | $ | 0.20 | | | | $ | 17,480 | |
| | Second fiscal quarter | |
| Third fiscal quarter | |
| Fourth fiscal quarter | |
| Total cash dividends declared and paid | |
In February 2022,2024, the Board declared a quarterly cash dividend of $0.14$0.24 per share, payable on March 16, 202220, 2024 to shareholders of record at the close of business on March 2, 2022.
Redeemable Preferred Stock - In connection with the development of its Abbraccio Cucina Italiana (“Abbraccio”) concept in 2015, the Company sold preferred shares of its Abbraccio concept (“Abbraccio Shares”) to certain investors. During 2020, the Company exercised a call option to purchase all outstanding Abbraccio Shares for $1.0 million and recorded a reduction to Accumulated deficit and an increase in Net loss applicable to common stockholders of $3.5 million for the consideration paid in excess of the Abbraccio Shares’ carrying value.
Accumulated Other Comprehensive Loss (“AOCL”) - Following are the components of AOCL as of the periods indicated:
| | | | | | | | | | | |
| (dollars in thousands) | DECEMBER 26, 2021 | | DECEMBER 27, 2020 |
| Foreign currency translation adjustment | $ | (195,480) | | | $ | (188,883) | |
| Unrealized loss on derivatives, net of tax | (10,509) | | | (22,563) | |
| Accumulated other comprehensive loss | $ | (205,989) | | | $ | (211,446) | |
| | | |
| | | |
| | | |
BLOOMIN’ BRANDS, INC.
NOTES TO CONSOLIDATED FINANCIAL STATEMENTS - Continued
Accumulated Other Comprehensive Loss (“AOCL”) - Following are the components of AOCL as of the periods indicated:
| | | | | | | | | | | |
| (dollars in thousands) | DECEMBER 31, 2023 | | DECEMBER 25, 2022 |
| Foreign currency translation adjustment | $ | (177,689) | | | $ | (185,311) | |
| Unrealized loss on derivatives, net of tax | (615) | | | — | |
| Accumulated other comprehensive loss | $ | (178,304) | | | $ | (185,311) | |
Following are the components of Other comprehensive income (loss) attributable to Bloomin’ Brands for the periods indicated:
| | | | | | | | | | | | | | | | | |
| FISCAL YEAR |
| (dollars in thousands) | 2021 | | 2020 | | 2019 |
| Bloomin’ Brands: | | | | | |
| Foreign currency translation adjustment | $ | (6,597) | | | $ | (36,852) | | | $ | (16,882) | |
| | | | | |
| | | | | |
| Unrealized gain (loss) on derivatives, net of tax (1) | 86 | | | (14,741) | | | (11,944) | |
| Reclassification of adjustments for loss on derivatives included in Net income (loss), net of tax (2) | 7,392 | | | 9,923 | | | 1,805 | |
| Amortization of terminated interest rate swaps, net of tax | 4,576 | | | — | | | — | |
| Total unrealized gain (loss) on derivatives, net of tax | 12,054 | | | (4,818) | | | (10,139) | |
| Other comprehensive income (loss) attributable to Bloomin’ Brands | $ | 5,457 | | | $ | (41,670) | | | $ | (27,021) | |
| | | | | |
| | | | | |
| | | | | |
| | | | | |
| | | | | |
| | | | | |
| | | | | |
| | | | | |
| | | | | |
| | | | | |
| | | | | |
| | | | | |
| | | | | |
| | | | | |
| | | | | |
| | | | | |
| | | | | |
| | | | | |
| | | | | |
| | | | | |
| | | | | |
| | | | | |
| | | | | |
| | | | | |
| | | | | |
| | | | | |
| | | | | |
| | | | | |
| | | | | |
| | | | | |
| | | | | |
| | | | | |
| | | | | |
| | | | | |
| | | | | |
| | | | | | | | | | | | | | | | | |
| FISCAL YEAR |
| (dollars in thousands) | 2023 | | 2022 | | 2021 |
| | | | | |
| Foreign currency translation adjustment | $ | 7,622 | | | $ | 10,169 | | | $ | (6,597) | |
| | | | | |
| | | | | |
| Change in fair value of derivatives, net of tax | (606) | | | 573 | | | 86 | |
| Reclassification realized in Net income, net of tax (1) | (9) | | | 954 | | | 7,392 | |
| Impact of terminated interest rate swaps included in Net income, net of tax (1) | — | | | 8,982 | | | 4,576 | |
| (Loss) gain on derivatives, net of tax | (615) | | | 10,509 | | | 12,054 | |
| Other comprehensive income attributable to Bloomin’ Brands | $ | 7,007 | | | $ | 20,678 | | | $ | 5,457 | |
| | | | | |
| | | | | |
| | | | | |
| | | | | |
| | | | | |
| | | | | |
| | | | | |
| | | | | |
| | | | | |
| | | | | |
| | | | | |
| | | | | |
| | | | | |
| | | | | |
| | | | | |
| | | | | |
| | | | | |
| | | | | |
| | | | | |
| | | | | |
| | | | | |
| | | | | |
| | | | | |
| | | | | |
| | | | | |
| | | | | |
| | | | | |
| | | | | |
| | | | | |
| | | | | |
| | | | | |
| | | | | |
| | | | | |
| | | | | |
| | | | | |
________________
(1)Unrealized loss on derivatives is net of tax of $5.1 million and $4.1 million for 2020 and 2019, respectively.
(2)Reclassifications of adjustments for loss on derivatives are net of tax. See Note 1716 - Derivative Instruments and Hedging Activities for the tax impact of reclassifications.reclassifications and the terminated swaps.
17.16. Derivative Instruments and Hedging Activities
Interest Rate Risk - The Company manages economic risks, including interest rate variability, primarily by managing the amount, sources and duration of its debt funding and through the use of derivative financial instruments. The Company’s objectives in using interest rate derivatives are to manage its exposure to interest rate movements. To accomplish this objective, the Company uses interest rate swaps.
Designated Hedges
Cash Flow Hedges of Interest Rate Risk - In October 2018, the Company entered into variable-to-fixed interest rate swap agreements with 12counterparties to hedge a portion of the cash flows of the Company’s variable rate debt (the “2018 Swap Agreements”). The 2018 Swap Agreements havehad an aggregate notional amount of $550.0 million and maturematured on November 30, 2022. Under the terms of the 2018 Swap Agreements, the Company payspaid a weighted average fixed rate of 3.04% on the notional amount and receivesreceived payments from the counterparties based on the one-month London Inter-Bank Offered Rate (“LIBOR”)LIBOR rate.
In connection with the refinancing of its Former Credit Facility, on April 16,During 2021 theand 2022, Company terminated its variable-to-fixed interest rate swap agreements with 7 counterparties having an2018 Swap Agreements for aggregate notional amount of $275.0 million for a paymentpayments of approximately $13.3$18.3 million, includingexcluding accrued interest. Following these terminations, $13.4 million of unrealized losses related to the terminated swap agreements included in AOCL will bewere amortized on a straight-line basis to Interest expense, net over the remaining original term of the terminated swaps.
As a result of the Company’s anticipated decrease in variable rate debt balances due to significant voluntary debt payments, on On December 9, 2021 the Company terminated its variable-to-fixed5, 2023, OSI entered into six interest rate swap agreements with 3five counterparties having(the “2023 Swap Transactions”) to manage its exposure to fluctuations in variable interest rates. The 2023 Swap Transactions have an aggregate notional amount of $150.0$200.0 million for a payment of approximately $4.1 million, including accrued interest. Following these terminations, $4.1 million of unrealized losses related toand include one and two-year tenors with the terminated swap agreements included in AOCL will be amortized to Interest expense, net during 2022.following terms:
| | | | | | | | | | | | | | | | | | | | |
| NOTIONAL AMOUNT | | WEIGHTED AVERAGE FIXED INTEREST RATE (1) | | EFFECTIVE DATE | | TERMINATION DATE |
| $ | 100,000,000 | | | 4.92% | | December 29, 2023 | | December 31, 2024 |
| $ | 100,000,000 | | | 4.34% | | December 29, 2023 | | December 31, 2025 |
| | | | | | |
____________________
(1)The weighted averaged fixed interest rate excludes the term SOFR adjustment and interest rate spread described below.
The Company’s swap agreements have been designated and qualify as cash flow hedges, are recognized on its Consolidated Balance Sheets at fair value and are classified based on the instruments’maturity dates. As of December 26, 2021, the Company estimated $14.4 million will be reclassified to Interest expense, net through the November 2022 maturity date of the swaps, including interest expense related to the terminated swap agreements discussed above.
BLOOMIN’ BRANDS, INC.
NOTES TO CONSOLIDATED FINANCIAL STATEMENTS - Continued
In connection with the 2023 Swap Transactions, the Company effectively converted $200 million of its outstanding indebtedness from the SOFR, plus a term SOFR adjustment of 0.10% and a spread of 150 to 250 basis points to the weighted average fixed interest rates within the table above, plus a term SOFR adjustment of 0.10% and a spread of 150 to 250 basis points. The 2023 Swap Transactions have an embedded floor of minus 0.10%.
The 2023 Swap Transactions were designated and qualified as cash flow hedges, recognized on the Company’s Consolidated Balance Sheet at fair value as of December 31, 2023 and classified based on the instruments’maturity dates. As of December 31, 2023, the Company estimated $0.1 million of interest income will be reclassified to Interest expense, net over the next 12 months related to the 2023 Swap Transactions.
The following table presents the fair value and classification of the Company’s swap agreements as of the periodsperiod indicated:
| | | | | | | | | | | | | | | | | |
| (dollars in thousands) | DECEMBER 26, 2021 | | DECEMBER 27, 2020 | | CONSOLIDATED BALANCE SHEET CLASSIFICATION |
| | | | | |
| | | | | |
| | | | | |
| | | | | |
| Interest rate swaps - liability | $ | 3,056 | | | $ | 14,855 | | | Accrued and other current liabilities |
| Interest rate swaps - liability | — | | | 15,640 | | | Other long-term liabilities, net |
| Total fair value of derivative instruments - liabilities (1) | $ | 3,056 | | | $ | 30,495 | | | |
| | | | | |
| | | | | |
| Accrued interest | $ | 276 | | | $ | 1,237 | | | Accrued and other current liabilities |
| | | | | |
| | | | | |
| | | | | |
| | | | | | | | | | | |
| (dollars in thousands) | DECEMBER 31, 2023 | | CONSOLIDATED BALANCE SHEET CLASSIFICATION |
| Interest rate swaps - asset (1) | $ | 320 | | | Other current assets, net |
| | | |
| | | |
| | | |
| Interest rate swaps - liability | $ | 253 | | | Accrued and other current liabilities |
| Interest rate swaps - liability | 893 | | | Other long-term liabilities, net |
| Total fair value of derivative instruments - liability (1) | $ | 1,146 | | | |
| | | |
____________________
(1) See Note 1918 - Fair Value Measurements for fair value discussion of the interest rate swaps.
The following table summarizes the effects of the swap agreements on Net income (loss) for the periods indicated:
| | | | | | | | | | | | | | | | | |
| FISCAL YEAR |
| (dollars in thousands) | 2021 | | 2020 | | 2019 |
| Interest rate swap expense recognized in Interest expense, net | $ | (9,951) | | | $ | (13,370) | | | $ | (2,436) | |
| Income tax benefit recognized in Provision (benefit) for income taxes | 2,559 | | | 3,447 | | | 631 | |
| Total effects on Net income (loss) | $ | (7,392) | | | $ | (9,923) | | | $ | (1,805) | |
| | | | | |
| | | | | |
| | | | | |
The Company records its derivatives on its Consolidated Balance Sheets on a gross balance basis. The Company’s interest rate swaps are subject to master netting arrangements. As of December 26, 2021,31, 2023, the Company didelected not have more than 1to offset derivative betweenpositions in the balance sheet with the same counterparties and as such, there was no netting.counterparty under the same agreement.
The following table summarizes the effects of the swap agreements on Net income for the periods indicated:
| | | | | | | | | | | | | | | |
| | | | | FISCAL YEAR |
| (dollars in thousands) | | | | | 2022 | | 2021 |
| Interest rate swap agreements: | | | | | | | |
| Interest rate swap expense recognized in Interest expense, net | | | | | $ | (1,284) | | | $ | (9,951) | |
| Income tax benefit recognized in Provision for income taxes | | | | | 330 | | | 2,559 | |
| Net effects of interest rate swap agreements | | | | | $ | (954) | | | $ | (7,392) | |
| Terminated interest rate swap agreements: | | | | | | | |
Terminated interest rate swap expense recognized in Interest expense, net | | | | | $ | (12,115) | | | $ | (6,160) | |
| Income tax benefit recognized in Provision for income taxes | | | | | 3,133 | | | 1,584 | |
| Net effects of terminated interest rate swap agreements | | | | | $ | (8,982) | | | $ | (4,576) | |
| Total net effects on Net income | | | | | $ | (9,936) | | | $ | (11,968) | |
| | | | | | | |
| | | | | | | |
| | | | | | | |
By utilizing the interest rate swaps, the Company iswas exposed to credit-related losses in the event that the counterparty failsfailed to perform under the terms of the derivative contract. To mitigate this risk, the Company entersentered into derivative contracts with major financial institutions based upon credit ratings and other factors. The Company continually assessesassessed the creditworthiness of its counterparties. As of December 26, 2021 and December 27, 2020,31, 2023, all counterparties to the interest rate swaps had performed in accordance with their contractual obligations.
The Company has agreements with each of its derivative counterparties that contain a provision where the Company could be declared in default on its derivative obligations if the repayment of the underlying indebtedness is accelerated by the lender due to the Company’s default on indebtedness.
BLOOMIN’ BRANDS, INC.
NOTES TO CONSOLIDATED FINANCIAL STATEMENTS - Continued
As of December 26, 2021 and December 27, 2020,31, 2023, the fair value of the Company’s interest rate swaps was in a net liability position, including accrued interest but excluding any adjustment for nonperformance risk, of $3.3 million and $32.2 million, respectively.$0.8 million. As of December 26, 2021 and December 27, 2020,31, 2023, the Company has not posted any collateral related to these agreements. If the Company had breached any of these provisions as of December 26, 2021 and December 27, 2020,31, 2023, it could have been required to settle its obligations under the agreements at their termination valuevalue of $3.3 million and $32.2 million, respectively.$0.8 million.
BLOOMIN’ BRANDS, INC.
NOTES TO CONSOLIDATED FINANCIAL STATEMENTS - Continued
18.17. Leases
The following table includes a detail of lease assets and liabilities included on the Company’s Consolidated Balance Sheets as of the periods indicated:
| | (dollars in thousands) | (dollars in thousands) | CONSOLIDATED BALANCE SHEET CLASSIFICATION | | DECEMBER 26, 2021 | | DECEMBER 27, 2020 | |
| (dollars in thousands) | |
| (dollars in thousands) | |
| Operating lease right-of-use assets | Operating lease right-of-use assets | Operating lease right-of-use assets | | $ | 1,130,873 | | | $ | 1,172,910 | | |
| Operating lease right-of-use assets | |
| Operating lease right-of-use assets | |
| Finance lease right-of-use assets (1) | |
| Finance lease right-of-use assets (1) | |
| Finance lease right-of-use assets (1) | Finance lease right-of-use assets (1) | Property, fixtures and equipment, net | | 2,074 | | | 1,947 | | |
| | Total lease assets, net | Total lease assets, net | | $ | 1,132,947 | | | $ | 1,174,857 | | |
| | Current operating lease liabilities (2) | Accrued and other current liabilities | | $ | 177,028 | | | $ | 176,791 | | |
| | Total lease assets, net | |
| | Total lease assets, net | |
| | Current operating lease liabilities | |
| | Current operating lease liabilities | |
| | Current operating lease liabilities | |
| Current finance lease liabilities | Current finance lease liabilities | Current portion of long-term debt | | 958 | | | 1,210 | | |
| Non-current operating lease liabilities (3) | Non-current operating lease liabilities | | 1,178,998 | | | 1,216,666 | | |
| Current finance lease liabilities | |
| Current finance lease liabilities | |
| Non-current operating lease liabilities (2) | |
| Non-current operating lease liabilities (2) | |
| Non-current operating lease liabilities (2) | |
| Non-current finance lease liabilities | |
| Non-current finance lease liabilities | |
| Non-current finance lease liabilities | Non-current finance lease liabilities | Long-term debt, net | | 1,264 | | | 974 | | |
| Total lease liabilities | Total lease liabilities | | $ | 1,358,248 | | | $ | 1,395,641 | | |
| Total lease liabilities | |
| Total lease liabilities | |
________________
(1)Net of accumulated amortization of $3.3$4.7 million and $2.3$3.6 million as December 26, 202131, 2023 and December 27, 2020,25, 2022, respectively.
(2)ExcludesFor 2022, excludes immaterial COVID-19-related deferred rent accruals of $1.1 million and $12.8 million as of December 26, 2021 and December 27, 2020, respectively, and accrued contingent percentage rent of $3.5 million and $2.7 million, as of December 26, 2021 and December 27, 2020, respectively.
(3)Excludes COVID-19-related non-current deferred rent accruals of $0.4 million and $1.2 million as of December 26, 2021 and December 27, 2020, respectively.accruals.
Following is a summary of expenses and income related to leases recognized in the Company’s Consolidated Statements of Operations and Comprehensive Income (Loss) for the periods indicated:
| | CONSOLIDATED STATEMENTS OF OPERATIONS AND COMPREHENSIVE INCOME (LOSS) CLASSIFICATION | | | FISCAL YEAR |
| CONSOLIDATED STATEMENTS OF OPERATIONS AND COMPREHENSIVE INCOME CLASSIFICATION | |
| CONSOLIDATED STATEMENTS OF OPERATIONS AND COMPREHENSIVE INCOME CLASSIFICATION | |
| CONSOLIDATED STATEMENTS OF OPERATIONS AND COMPREHENSIVE INCOME CLASSIFICATION | | | | | | | FISCAL YEAR |
| (dollars in thousands) | (dollars in thousands) | CONSOLIDATED STATEMENTS OF OPERATIONS AND COMPREHENSIVE INCOME (LOSS) CLASSIFICATION | | | 2021 | | 2020 | | 2019 | |
| Operating leases (1) | | | $ | 178,733 | | | $ | 178,740 | | | $ | 181,397 | | |
| Operating lease cost (1) | |
| Operating lease cost (1) | |
| Operating lease cost (1) | |
| Variable lease cost (2) | Variable lease cost (2) | Other restaurant operating | | | 4,350 | | | (2,326) | | | 3,504 | | |
| Finance leases: | | | | |
| Variable lease cost (2) | |
| Variable lease cost (2) | |
| Finance lease costs: | |
| Finance lease costs: | |
| Finance lease costs: | |
| Amortization of leased assets | |
| Amortization of leased assets | |
| Amortization of leased assets | Amortization of leased assets | Depreciation and amortization | | | 1,079 | | | 1,248 | | | 1,400 | | |
| Interest on lease liabilities | Interest on lease liabilities | Interest expense, net | | | 129 | | | 160 | | | 264 | | |
| Interest on lease liabilities | |
| Interest on lease liabilities | |
| Sublease revenue | |
| Sublease revenue | |
| Sublease revenue | Sublease revenue | Franchise and other revenues | | | (9,396) | | | (3,121) | | | (6,542) | | |
| Lease costs, net | Lease costs, net | | | $ | 174,895 | | | $ | 174,701 | | | $ | 180,023 | | |
| Lease costs, net | |
| Lease costs, net | |
________________
(1)Excludes rent expense for office facilities and Company-owned closed or subleased properties of $12.3 million, $12.2 million and $12.9 million $13.8 millionfor 2023, 2022 and $14.6 million for 2021, 2020 and 2019, respectively, which is included in General and administrative expense. Also excludes certain immaterial supply chain related rent expense included in Food and beverage costs.costs for 2021.
(2)Includes COVID-19-related rent abatements for 2021 and 2020.in 2021.
BLOOMIN’ BRANDS, INC.
NOTES TO CONSOLIDATED FINANCIAL STATEMENTS - Continued
As of December 26, 2021,31, 2023, future minimum lease payments and sublease revenues under non-cancelable leases are as follows:
| | (dollars in thousands) | (dollars in thousands) | OPERATING LEASES (1) | | FINANCE LEASES | | SUBLEASE REVENUES | (dollars in thousands) | OPERATING LEASES | | FINANCE LEASES | | SUBLEASE REVENUES |
| 2022 (2) | $ | 185,093 | | | $ | 976 | | | $ | (5,130) | |
| 2023 | 189,010 | | | 739 | | | (5,212) | |
| 2024 | 183,170 | | | 444 | | | (5,182) | |
| 2024 (1) | |
| 2025 | 2025 | 171,317 | | | 174 | | | (4,983) | |
| 2026 | 2026 | 164,111 | | | 43 | | | (4,971) | |
| 2027 | |
| 2028 | |
| Thereafter | Thereafter | 1,490,634 | | | — | | | (42,823) | |
| Total minimum lease payments (receipts) (3) | 2,383,335 | | | 2,376 | | | $ | (68,301) | |
| Total minimum lease payments (receipts) (2) | |
| Less: Interest | Less: Interest | (1,025,773) | | | (154) | | | |
| Present value of future lease payments | Present value of future lease payments | $ | 1,357,562 | | | $ | 2,222 | | |
| Present value of future lease payments | |
| Present value of future lease payments | |
____________________
(1)Includes COVID-19-related current and non-current deferred rent accruals of $1.1 million and $0.4 million, respectively, as of December 26, 2021.
(2)Net of operating lease prepaid rent of $5.6$15.2 million.
(3)(2)Includes $1.0 billion$945.4 million related to operating lease renewal options that are reasonably certain of exercise and excludes $80.9$216.7 million of signed operating leases that have not yet commenced.
The following table is a summary of the weighted average remaining lease terms and weighted average discount rates of the Company’s leases as of the periods indicated:
| | DECEMBER 26, 2021 | | DECEMBER 27, 2020 | |
| DECEMBER 31, 2023 | |
| DECEMBER 31, 2023 | |
| DECEMBER 31, 2023 | |
| Weighted average remaining lease term (1): | |
| Weighted average remaining lease term (1): | |
| Weighted average remaining lease term (1): | Weighted average remaining lease term (1): | | | | |
| Operating leases | Operating leases | 13.7 years | | 14.0 years | |
| Operating leases | |
| Operating leases | |
| Finance leases | |
| Finance leases | |
| Finance leases | Finance leases | 2.8 years | | 2.7 years | |
| Weighted average discount rate (2): | Weighted average discount rate (2): | | |
| Weighted average discount rate (2): | |
| Weighted average discount rate (2): | |
| Operating leases | |
| Operating leases | |
| Operating leases | Operating leases | 8.42 | % | | 8.54 | % | |
| Finance leases | Finance leases | 5.01 | % | | 7.21 | % | |
| Finance leases | |
| Finance leases | |
____________________
(1)Includes lease renewal options that are reasonably certain of exercise.
(2)Based on the Company’s incremental borrowing rate at lease commencement.commencement or lease remeasurement.
The following table is a summary of othercash flow impacts to the Company’s Consolidated Financial Statements related to its leases for the periods indicated:
| | | | | | | | | | | | | | | | | | | |
| FISCAL YEAR |
| (dollars in thousands) | 2021 | | 2020 | | 2019 | | |
| | | | | | | |
| Cash flows from operating activities: | | | | | | | |
| Cash paid for amounts included in the measurement of operating lease liabilities | $ | 205,253 | | | $ | 177,961 | | | $ | 191,855 | | | |
| | | | | | | |
| | | | | | | |
| | | | | | | |
| | | | | | | |
| | | | | | | |
Properties Leased to Third Parties - The Company leases certain owned land and buildings to third parties, generally related to closed or refranchised restaurants. The following table is a summary of assets leased to third parties as of the periods indicated:
| | | | | | | | | | | |
| (dollars in thousands) | DECEMBER 26, 2021 | | DECEMBER 27, 2020 |
| Land | $ | 5,021 | | | $ | 9,341 | |
| | | |
| Buildings | $ | 4,987 | | | $ | 10,172 | |
| Less: accumulated depreciation | (3,746) | | | (6,181) | |
| Buildings, net | $ | 1,241 | | | $ | 3,991 | |
| | | | | | | | | | | | | | | | | | | |
| FISCAL YEAR |
| (dollars in thousands) | 2023 | | 2022 | | 2021 | | |
| | | | | | | |
| Cash flows from operating activities: | | | | | | | |
| Cash paid for amounts included in the measurement of operating lease liabilities | $ | 197,394 | | | $ | 193,822 | | | $ | 205,253 | | | |
| | | | | | | |
| | | | | | | |
| | | | | | | |
| | | | | | | |
| | | | | | | |
BLOOMIN’ BRANDS, INC.
NOTES TO CONSOLIDATED FINANCIAL STATEMENTS - Continued
19.18. Fair Value Measurements
Fair Value Measurements on a Recurring Basis - The following table summarizes the Company’s financial assets and liabilities measured at fair value by hierarchy level on a recurring basis as of the periods indicated:
| | DECEMBER 26, 2021 | | DECEMBER 27, 2020 |
| DECEMBER 31, 2023 | |
| DECEMBER 31, 2023 | |
| DECEMBER 31, 2023 | |
| (dollars in thousands) | |
| (dollars in thousands) | |
| (dollars in thousands) | (dollars in thousands) | TOTAL | | LEVEL 1 | | LEVEL 2 | | TOTAL | | LEVEL 1 | | LEVEL 2 |
| Assets: | Assets: | | | | | | | | | | | |
| Assets: | |
| Assets: | |
| Cash equivalents: | |
| Cash equivalents: | |
| Cash equivalents: | Cash equivalents: | |
| Fixed income funds | Fixed income funds | $ | 6,714 | | | $ | 6,714 | | | $ | — | | | $ | 15,404 | | | $ | 15,404 | | | $ | — | |
| Fixed income funds | |
| Fixed income funds | |
| Money market funds | Money market funds | 9,039 | | | 9,039 | | | — | | | 16,494 | | | 16,494 | | | — | |
| Money market funds | |
| Money market funds | |
| Restricted cash equivalents: | |
| Restricted cash equivalents: | |
| Restricted cash equivalents: | Restricted cash equivalents: | |
| | Money market funds | Money market funds | 1,472 | | | 1,472 | | | — | | | 428 | | | 428 | | | — | |
| | Money market funds | |
| | Money market funds | |
| Other current assets, net: | |
| Other current assets, net: | |
| Other current assets, net: | |
| Derivative instruments - interest rate swaps | |
| Derivative instruments - interest rate swaps | |
| Derivative instruments - interest rate swaps | |
| | Total asset recurring fair value measurements | |
| | Total asset recurring fair value measurements | |
| | Total asset recurring fair value measurements | Total asset recurring fair value measurements | $ | 17,225 | | | $ | 17,225 | | | $ | — | | | $ | 32,326 | | | $ | 32,326 | | | $ | — | |
| | Liabilities: | Liabilities: | |
| | Liabilities: | |
| | Liabilities: | |
| Accrued and other current liabilities: | Accrued and other current liabilities: | |
| Accrued and other current liabilities: | |
| Accrued and other current liabilities: | |
| Derivative instruments - interest rate swaps | |
| Derivative instruments - interest rate swaps | |
| Derivative instruments - interest rate swaps | Derivative instruments - interest rate swaps | $ | 3,056 | | | $ | — | | | $ | 3,056 | | | $ | 14,855 | | | $ | — | | | $ | 14,855 | |
| | Other long-term liabilities: | Other long-term liabilities: | |
| | Other long-term liabilities: | |
| | Other long-term liabilities: | |
| Derivative instruments - interest rate swaps | |
| Derivative instruments - interest rate swaps | |
| Derivative instruments - interest rate swaps | Derivative instruments - interest rate swaps | — | | | — | | | — | | | 15,640 | | | — | | | 15,640 | |
| Total liability recurring fair value measurements | Total liability recurring fair value measurements | $ | 3,056 | | | $ | — | | | $ | 3,056 | | | $ | 30,495 | | | $ | — | | | $ | 30,495 | |
| | Total liability recurring fair value measurements | |
| Total liability recurring fair value measurements | |
Fair value of each class of financial instrumentinstruments is determined based on the following:
| | | | | | | | |
| FINANCIAL INSTRUMENT | | METHODS AND ASSUMPTIONS |
Fixed income funds and Money market funds | | Carrying value approximates fair value because maturities are less than three months. |
| Derivative instruments | | The Company’s derivative instruments include interest rate swaps. Fair value measurements are based on the contractual terms of the derivatives and use observable market-based inputs. The interest rate swaps are valued using a discounted cash flow analysis on the expected cash flows of each derivative using observable inputs including interest rate curves and credit spreads. The Company also considersconsidered its own nonperformance risk and the respective counterparty’s nonperformance risk in the fair value measurements. As of December 26, 2021 and December 27, 2020,31, 2023, the Company has determined that the credit valuation adjustments arewere not significant to the overall valuation of its derivatives. |
BLOOMIN’ BRANDS, INC.
NOTES TO CONSOLIDATED FINANCIAL STATEMENTS - Continued
Fair Value Measurements on a Nonrecurring Basis - Assets and liabilities that are measured at fair value on a nonrecurring basis relate primarily to property, fixtures and equipment, operating lease right-of-use assets, goodwill and other intangible assets, which are remeasured when carrying value exceeds fair value. Carrying value after impairment approximates fair value. The following table summarizes the Company’s assets measured at fair value by hierarchy level on a nonrecurring basis for the periods indicated:
| | | | | | | | | | | | | | | | | | | | | | | | | | | | | | | | | | | |
| 2021 | | 2020 | | 2019 |
| (dollars in thousands) | REMAINING CARRYING VALUE | | TOTAL IMPAIRMENT | | REMAINING CARRYING VALUE | | TOTAL IMPAIRMENT | | REMAINING CARRYING VALUE | | TOTAL IMPAIRMENT |
| Assets held for sale (1) | $ | — | | | $ | — | | | $ | 1,934 | | | $ | 123 | | | $ | 2,049 | | | $ | 315 | |
| Operating lease right-of-use assets (2) | 8,647 | | | 3,950 | | | 72,615 | | | 30,940 | | | 6,597 | | | 4,284 | |
| Property, fixtures and equipment (3) | 11,647 | | | 8,445 | | | 26,311 | | | 41,077 | | | 3,915 | | | 4,535 | |
| Goodwill and other assets (4) | — | | | 1,006 | | | 748 | | | 2,683 | | | — | | | — | |
| $ | 20,294 | | | $ | 13,401 | | | $ | 101,608 | | | $ | 74,823 | | | $ | 12,561 | | | $ | 9,134 | |
| | | | | | | | | | | | | | | | | | | | | | | | | | | | | | | | | | | |
| 2023 | | 2022 | | 2021 |
| (dollars in thousands) | REMAINING CARRYING VALUE | | TOTAL IMPAIRMENT | | REMAINING CARRYING VALUE | | TOTAL IMPAIRMENT | | REMAINING CARRYING VALUE | | TOTAL IMPAIRMENT |
| | | | | | | | | | | |
| Operating lease right-of-use assets (1) | $ | 4,057 | | | $ | 10,210 | | | $ | 2,219 | | | $ | 1,233 | | | $ | 8,647 | | | $ | 3,950 | |
| Property, fixtures and equipment (2) | 4,623 | | | 30,202 | | | 2,807 | | | 4,253 | | | 11,647 | | | 8,445 | |
| Goodwill and other assets (3) | — | | | — | | | — | | | — | | | — | | | 1,006 | |
| $ | 8,680 | | | $ | 40,412 | | | $ | 5,026 | | | $ | 5,486 | | | $ | 20,294 | | | $ | 13,401 | |
________________
(1)Carrying values measured using Level 3 inputs to estimate fair value totaled $1.2 million during 2020. All other assets were valued using Level 2 inputs. Third-party market appraisals or executed sales contracts (Level 2) and discounted cash flow models (Level 3) were used. Refer to estimate fair value.Note 4 - Impairments and Exit Costs for a more detailed discussion of impairments.
(2)Carrying values measured using Level 2 inputs to estimate fair value totaled $0.2$1.2 million during 2019. All other assets were valued using Level 3 inputs. Third-party market appraisals (Level 2) and discounted cash flow models (Level 3) were used to estimate fair value. Refer to Note 5 - Impairments, Exit Costs and Disposals for a more detailed discussion of impairments.
(3)Carrying values measured using Level 2 inputs to estimate fair value totaled $1.4 million $2.2 millionfor 2023 and $2.3 million for 2021, 2020 and 2019, respectively. All other assets were valued using Level 3 inputs. Third-party market appraisals (Level 2) and discounted cash flow models (Level 3) were used to estimate the fair value. Refer to Note 54 - Impairments and Exit Costs and Disposals for a more detailed discussion of impairments.
(4)(3)Other assets were generally measured using the quoted market value of comparable assets (Level 2).
SeeNote 5 - Impairments, Exit Costs and Disposals for information regarding impairment charges resulting from the fair value measurement performed on a nonrecurring basis during 2020. Projected future cash flows, including discount rate and growth rate assumptions, are derived from then-current economic conditions, expectations of management and projected trends of current operating results. As a result, the Company has determined that the majority of the inputs used to value its long-lived assets held and used are unobservable inputs that fall within Level 3 of the fair value hierarchy.
In assessment of impairment for operating locations, the Company determined the fair values of individual operating locations using an income approach, which required discounting projected future cash flows. When determining the stream of projected future cash flows associated with an individual operating location, management made assumptions, including highest and best use and inputs from restaurant operations, where necessary, and about key variables including the following unobservable inputs: revenue growth rates, controllable and uncontrollable expenses, and asset residual values. In order to calculate the present value of those future cash flows, the Company discounted cash flow estimates at its weighted average cost of capital applicable to the country in which the measured assets reside.
The following table presents quantitative information related to certain unobservable inputs used in the Company’s Level 3 fair value measurements of Operating lease right-of-use assets and Property, fixtures and equipment for the impairment losses incurred during the period indicated:
| | | | | | | | | | | | | | | | | | |
| | | | | | FISCAL YEAR |
| UNOBSERVABLE INPUTS | | | | 2020 |
| Weighted average cost of capital | | | | 10.4% | to | 11.3% |
| Long-term growth rate | | | | | | 1.5% | to | 2.0% |
| | | | | | | | |
| | | | | | | | |
| | | | | | | | |
Fair Value of Financial Instruments - The Company’s non-derivative financial instruments as of December 26, 2021 and December 27, 2020 consist of cash equivalents, accounts receivable, accounts payable and current and
BLOOMIN’ BRANDS, INC.
NOTES TO CONSOLIDATED FINANCIAL STATEMENTS - Continued
long-term debt. The fair values of cash equivalents, accounts receivable and accounts payable approximate their carrying amounts reported on its Consolidated Balance Sheets due to their short duration.
Debt is carried at amortized cost; however, the Company estimates the fair value of debt for disclosure purposes. The following table includes the carrying value and fair value of the Company’s debt by hierarchy level as of the periods indicated:
| | | | | | | | | | | | | | | | | | | | | | | | | | | |
| DECEMBER 26, 2021 | | DECEMBER 27, 2020 |
| CARRYING VALUE | | FAIR VALUE LEVEL 2 | | | | CARRYING VALUE | | FAIR VALUE LEVEL 2 | | |
| (dollars in thousands) | | | |
| Senior Secured Credit Facility: | | | | | | | | | | | |
| Term loan A | $ | 195,000 | | | $ | 190,125 | | | | | $ | — | | | $ | — | | | |
| Revolving credit facility | $ | 80,000 | | | $ | 76,926 | | | | | $ | — | | | $ | — | | | |
| Former Credit Facility: | | | | | | | | | | | |
| Term loan A | $ | — | | | $ | — | | | | | $ | 425,000 | | | $ | 412,250 | | | |
| Revolving credit facility | $ | — | | | $ | — | | | | | $ | 447,000 | | | $ | 419,612 | | | |
| 2025 Notes | $ | 230,000 | | | $ | 447,615 | | | | | $ | 230,000 | | | $ | 413,818 | | | |
| 2029 Notes | $ | 300,000 | | | $ | 304,395 | | | | | $ | — | | | $ | — | | | |
| | | | | | | | | | | | | | | | | | | | | | | | | | | |
| DECEMBER 31, 2023 | | DECEMBER 25, 2022 |
| CARRYING VALUE | | FAIR VALUE LEVEL 2 | | | | CARRYING VALUE | | FAIR VALUE LEVEL 2 | | |
| (dollars in thousands) | | | |
| | | | | | | | | | | |
| Senior secured credit facility - revolving credit facility | $ | 381,000 | | | $ | 381,000 | | | | | $ | 430,000 | | | $ | 430,000 | | | |
| | | | | | | | | | | |
| | | | | | | | | | | |
| | | | | | | | | | | |
| 2025 Notes | $ | 104,786 | | | $ | 265,896 | | | | | $ | 105,000 | | | $ | 198,843 | | | |
| 2029 Notes | $ | 300,000 | | | $ | 277,809 | | | | | $ | 300,000 | | | $ | 260,265 | | | |
20.19. Allowance for Expected Credit Losses
The following table is a rollforward of the Company’s trade receivables allowance for expected credit losses for the periods indicated:
| | | | | | | | | | | | | | |
| | FISCAL YEAR | | |
| (dollars in thousands) | | 2021 | | 2020 | | |
| Allowance for expected credit losses, beginning of period | | $ | 4,095 | | | $ | 199 | | | |
| Adjustment for adoption of ASU No. 2016-13 | | — | | | 1,018 | | | |
| Provision for expected credit losses (1) | | 64 | | | 3,472 | | | |
| Charge-off of accounts | | (109) | | | (594) | | | |
| | | | | | |
| | | | | | |
| Allowance for expected credit losses, end of period | | $ | 4,050 | | | $ | 4,095 | | | |
________________
(1)In March 2020, the Company fully reserved substantially all of its outstanding franchise receivables in response to the economic impact of the COVID-19 pandemic. See Note 3 - 2020 COVID-19 Charges for details regarding the impact of the COVID-19 pandemic on the Company’s financial results. | | | | | | | | | | | | | | | | | |
| FISCAL YEAR |
| (dollars in thousands) | 2023 | | 2022 | | 2021 |
| Allowance for expected credit losses, beginning of the period | $ | 5,451 | | | $ | 4,050 | | | $ | 4,095 | |
| | | | | |
| Provision for expected credit losses | — | | | 1,547 | | | 64 | |
| Charge-off of accounts | (147) | | | (146) | | | (109) | |
| | | | | |
| | | | | |
| Allowance for expected credit losses, end of the period | $ | 5,304 | | | $ | 5,451 | | | $ | 4,050 | |
The Company is also exposed to credit losses from off-balance sheet lease guarantees primarily related to the divestiture of certain formerly Company-owned restaurant sites. See Note 2221 - Commitments and Contingencies for details regarding these lease guarantees.
21. Income Taxes
The following table presents the domestic and foreign components of Income (loss) before provision (benefit) for income taxes for the periods indicated:
| | | | | | | | | | | | | | | | | |
| | FISCAL YEAR |
| (dollars in thousands) | 2021 | | 2020 | | 2019 |
| Domestic | $ | 258,202 | | | $ | (206,941) | | | $ | 129,826 | |
| Foreign | (8,905) | | | (32,580) | | | 11,864 | |
| $ | 249,297 | | | $ | (239,521) | | | $ | 141,690 | |
| | | | | |
| | | | | |
| | | | | |
BLOOMIN’ BRANDS, INC.
NOTES TO CONSOLIDATED FINANCIAL STATEMENTS - Continued
20. Income Taxes
The following table presents the domestic and foreign components of Income before provision for income taxes for the periods indicated:
| | | | | | | | | | | | | | | | | |
| | FISCAL YEAR |
| (dollars in thousands) | 2023 | | 2022 | | 2021 |
| Domestic | $ | 235,357 | | | $ | 134,465 | | | $ | 258,202 | |
| Foreign | 37,618 | | | 17,442 | | | (8,905) | |
| Income before provision for income taxes | $ | 272,975 | | | $ | 151,907 | | | $ | 249,297 | |
| | | | | |
| | | | | |
| | | | | |
Provision (benefit) for income taxes consisted of the following for the periods indicated:
| | | | FISCAL YEAR | | FISCAL YEAR |
| (dollars in thousands) | (dollars in thousands) | 2021 | | 2020 | | 2019 | (dollars in thousands) | 2023 | | 2022 | | 2021 |
| Current provision: | | | | | |
| Current provision (benefit): | |
| Federal | |
| Federal | |
| Federal | Federal | $ | 16,951 | | | $ | 2,606 | | | $ | 13,265 | |
| State | State | 10,917 | | | 2,301 | | | 9,696 | |
| Foreign | Foreign | 1,862 | | | 2,623 | | | 10,502 | |
| | | 29,730 | | | 7,530 | | | 33,463 | |
| Deferred (benefit) provision: | Deferred (benefit) provision: | | | | | | Deferred (benefit) provision: | | | |
| Federal | Federal | (2,057) | | | (66,498) | | | (21,407) | |
| State | State | 1,194 | | | (12,527) | | | (1,986) | |
| Foreign | Foreign | (2,483) | | | (9,231) | | | (2,497) | |
| | | (3,346) | | | (88,256) | | | (25,890) | |
| Provision (benefit) for income taxes | $ | 26,384 | | | $ | (80,726) | | | $ | 7,573 | |
| Provision for income taxes | |
|
Effective Income Tax Rate - The reconciliation of income taxes calculated at the United States federal tax statutory rate to the Company’s effective income tax rate is as follows for the periods indicated:
| | | | | | | | | | | | | | | | | |
| | FISCAL YEAR |
| | 2021 | | 2020 (1) | | 2019 |
| Income taxes at federal statutory rate | 21.0 | % | | 21.0 | % | | 21.0 | % |
| State and local income taxes, net of federal benefit | 3.8 | | | 3.3 | | | 4.4 | |
| Employment-related credits, net | (13.2) | | | 9.9 | | | (24.7) | |
| | | | | |
| Tax settlements and related adjustments | (1.7) | | | 0.1 | | | — | |
| Net changes in deferred tax valuation allowances | (0.7) | | | (0.6) | | | (1.6) | |
| | | | | |
| | | | | |
| | | | | |
| | | | | |
| | | | | |
| | | | | |
| Foreign tax rate differential | (0.2) | | | 1.1 | | | 3.2 | |
| | | | | |
| Nondeductible expenses | 2.3 | | | (1.4) | | | 3.9 | |
| Other, net | (0.7) | | | 0.3 | | | (0.9) | |
| Total | 10.6 | % | | 33.7 | % | | 5.3 | % |
________________
(1)Due to the pre-tax book loss, a positive percentage change in the effective income tax rate table reflects a favorable income tax benefit, whereas a negative percentage change in the effective income tax rate table reflects an unfavorable income tax expense. | | | | | | | | | | | | | | | | | | |
| | FISCAL YEAR | |
| | 2023 | | 2022 | | 2021 | |
| Income taxes at federal statutory rate | 21.0 | % | | 21.0 | % | | 21.0 | % | |
| State and local income taxes, net of federal benefit | 3.4 | | | 7.3 | | | 3.8 | | |
| Employment-related credits, net | (13.5) | | | (22.4) | | | (13.2) | | |
| Brazil tax legislation | (7.7) | | | 0.2 | | | — | | |
| Income tax exemption on certain Brazil state value added tax benefits | (1.8) | | | — | | | — | | |
| Net changes in deferred tax valuation allowances | (0.8) | | | (2.8) | | | (0.7) | | |
| Non-deductible loss on 2025 Notes Partial Repurchase | — | | | 18.0 | | | — | | |
| Non-deductible expenses | 2.7 | | | 2.8 | | | 2.3 | | |
| Foreign tax rate differential | 2.1 | | | 2.3 | | | (0.2) | | |
| U.S. tax on foreign earnings - GILTI | 1.8 | | | 1.6 | | | — | | |
| Tax settlements and related adjustments | 0.1 | | | (0.1) | | | (1.7) | | |
| Other, net | (0.5) | | | 0.2 | | | (0.7) | | |
| | | | | | |
| | | | | | |
| | | | | | |
| | | | | | |
| | | | | | |
| | | | | | |
| | | | | | |
| | | | | | |
| Total | 6.8 | % | | 28.1 | % | | 10.6 | % | |
The net decrease in the effective income tax rate in 20212023 as compared to 20202022 was primarily due toa result of the benefit2022 non-deductible losses associated with the 2025 Notes Partial Repurchase and the 2023 benefits of FICABrazil tax credits on certain employees’ tips reducinglegislation, which includes a temporary reduction in the effectiveBrazilian income tax rate in 2021 as a result of pre-tax book income as comparedfrom 34% to increasing the effective income tax rate in 2020 as a result of pre-tax book loss.0%.
BLOOMIN’ BRANDS, INC.
NOTES TO CONSOLIDATED FINANCIAL STATEMENTS - Continued
The net increase in the effective income tax rate in 20202022 as compared to 20192021 was primarily due to the benefit ofnon-deductible losses associated with the tax credits2025 Notes Partial Repurchase recorded during 2022.
In the U.S., a restaurant company employer may claim a credit against its federal income taxes for FICA taxes paid on certain employees’ tips in 2020tipped wages (the “FICA tax credit”). The level of FICA tax credits is primarily driven by U.S. Restaurant sales and the 2020 pre-tax book loss.is not impacted by costs incurred that may reduce Income before provision for income taxes.
The Company has a blended federal and state statutory rate of approximately 26%. The effective income tax rate for 20212023 was lower than the blended federal and state statutory rate primarily due to the benefit of FICA tax credits for FICA taxes on certain employees’ tips. The effectivetipped wages and benefits of Brazil tax legislation, which includes a temporary reduction in the Brazilian income tax rate for 2020 was higher than the blended federal and state statutory rate primarily duefrom 34% to the benefit of tax credits for FICA taxes on certain employees’ tips.0%.
On December 28, 2021, the U.S. Treasury and the Internal Revenue Service released final regulations that, among other things, provide guidance on several aspects of the foreign tax credit rules. These regulations are applicable for years beginning on or after December 28, 2021 and were issued after the Company’s 52-53 week year end. The impact, if any, of these highly technical regulations is being evaluated and will be reflected in the Company’s 2022 tax provision.
BLOOMIN’ BRANDS, INC.
NOTES TO CONSOLIDATED FINANCIAL STATEMENTS - Continued
Deferred Tax Assets and Liabilities - The income tax effects of temporary differences that give rise to significant portions of deferred income tax assets and liabilities are as follows as of the periods indicated:
| | (dollars in thousands) | (dollars in thousands) | DECEMBER 26, 2021 | | DECEMBER 27, 2020 | (dollars in thousands) | DECEMBER 31, 2023 | | DECEMBER 25, 2022 |
| Deferred income tax assets: | Deferred income tax assets: | | | |
| Operating lease liabilities | Operating lease liabilities | $ | 352,041 | | | $ | 360,690 | |
| Operating lease liabilities | |
| Operating lease liabilities | |
| | Insurance reserves | |
| Insurance reserves | |
| Insurance reserves | Insurance reserves | 14,329 | | | 13,695 | |
| Unearned revenue | Unearned revenue | 50,284 | | | 44,039 | |
| Deferred compensation | Deferred compensation | 25,164 | | | 32,779 | |
| | Net operating loss carryforwards | Net operating loss carryforwards | 18,227 | | | 19,285 | |
| Net operating loss carryforwards | |
| Net operating loss carryforwards | |
| Federal tax credit carryforwards | Federal tax credit carryforwards | 146,734 | | | 142,055 | |
| | Other, net (1) | |
| Other, net (1) | |
| Other, net (1) | Other, net (1) | 21,222 | | | 28,241 | |
| Gross deferred income tax assets | Gross deferred income tax assets | 628,001 | | | 640,784 | |
| Less: valuation allowance | Less: valuation allowance | (16,998) | | | (18,509) | |
| Deferred income tax assets, net of valuation allowance | Deferred income tax assets, net of valuation allowance | 611,003 | | | 622,275 | |
| Deferred income tax liabilities: | Deferred income tax liabilities: | | | | Deferred income tax liabilities: | | | |
| Less: operating lease right-of-use asset basis differences | Less: operating lease right-of-use asset basis differences | (290,697) | | | (300,387) | |
| Less: property, fixtures and equipment basis differences | Less: property, fixtures and equipment basis differences | (48,284) | | | (54,725) | |
| Less: intangible asset basis differences | Less: intangible asset basis differences | (103,954) | | | (113,280) | |
| | Deferred income tax assets, net | Deferred income tax assets, net | $ | 168,068 | | | $ | 153,883 | |
| Deferred income tax assets, net | |
| Deferred income tax assets, net | |
| | Reported as: | |
| Reported as: | |
| Reported as: | |
| Deferred income tax assets | |
| Deferred income tax assets | |
| Deferred income tax assets | |
| Deferred income tax liabilities (included in Other long-term liabilities, net) | |
| Net deferred tax assets | |
________________
(1)As of December 26, 202131, 2023 and December 27, 2020,25, 2022, the Company maintained deferred tax liabilities for state income taxes on historical foreign earnings of $0.2 million.of $0.5 million and $0.3 million, respectively.
As of December 26, 2021,31, 2023, valuation allowances against deferred tax assets in the U.S. and in certain foreign jurisdictions totaled $3.2$0.4 million and $13.8$10.2 million, respectively. The Company will maintain the valuation allowances in each applicable tax jurisdiction until it determines it is more likely than not the deferred tax assets will be realized. The net change in the deferred tax valuation allowance in 20212023 is primarily attributable to net operating loss carryforwards in certain foreign jurisdictions with full valuation allowances recorded that expired or are no longer available to the Company.
In September 2022, the Company’s Brazilian subsidiary received a preliminary injunction authorizing it to benefit from the exemptions enacted by Law 14,148/2021 which provides for emergency and temporary actions that grant certain industries a 100% exemption from income tax (IRPJ and CSLL) and federal value added taxes (PIS and COFINS) for a five-year period. The injunction was issued as part of an ongoing lawsuit initiated by the Company’s
BLOOMIN’ BRANDS, INC.
NOTES TO CONSOLIDATED FINANCIAL STATEMENTS - Continued
Brazilian subsidiary due to the uncertainty regarding the restaurant industry’s eligibility for the exemptions under this legislation.
The benefits of the Brazil tax legislation include an increase in revenues as a result of not being required to remit certain PIS and COFINS during the exemption period. The increase in revenues is partially offset by higher costs in several financial statement line items that were previously reduced by PIS and COFINS tax credits that were generated during the exemption period. Benefits of this legislation also initially included a reduction in the Brazilian income tax rate from 34% to 0% for a period of five years on certain income earned in Brazil. Benefits began in the thirteen weeks ended December 25, 2022. The tax benefit attributable to the Brazil tax legislation, including both income tax and PIS and COFINS, was approximately $23.6 million for the year ended December 31, 2023. The benefit of the Brazil tax legislation on GAAP diluted earnings per share was approximately $0.25 for the year ended December 31, 2023.
In May 2023, Brazil enacted tax legislation that prospectively limits the Company’s ability to benefit from the 100% exemption from income tax (IRPJ and CSLL) and federal value added taxes (PIS and COFINS) for the full five-year period (the “May 2023 Brazil tax legislation”). As a result of this legislation, the Company is subject to PIS and COFINS and CSLL beginning in the fourth quarter of 2023 and IRPJ beginning in 2024.
On January 24, 2024, the Company’s Brazilian subsidiary received an unfavorable second level court ruling related to its ongoing litigation regarding its eligibility for tax exemptions under the Brazil tax legislation. The Company has consideredwill appeal this ruling and in connection with the impactappeal anticipates making a cash judicial deposit of approximately $45.0 million to $50.0 million during the COVID-19 pandemicfirst half of 2024, which includes the disputed amounts through December 31, 2023. The judicial deposit will be recorded in Other assets, net, on the Company’s Brazilian operating subsidiary, including assessingConsolidated Balance Sheet. The Company believes that it will more likely than not prevail in this appeal and accordingly has not recorded any expense or liability for the realizability of Brazilian deferred tax assets. As part of the Company’s evaluation of positive and negative evidence, management considered whether there has been cumulative income or loss in the past three years, the impact of non-deductible amounts, the scheduled reversal of deferred tax assets and liabilities, projected future taxable income and the state of the Company’s business in Brazil. As of December 26, 2021, the Company has concluded that 0 valuation allowance is required against the deferred tax assets of its Brazilian operating subsidiary. Although management uses the best information available, it is reasonably possible that the estimates used by the Company could be materially different from the actual results. These differences could result in a material adjustment to the Company’s valuation allowance in a future reporting period.disputed amounts.
Undistributed Earnings - As of December 26, 2021,31, 2023, the Company had aggregate accumulatedundistributed foreign earnings of approximately $28.8$42.6 million. This amount consisted primarily of historicalThese earnings from 2017 and prior that were previously taxed in the U.S. under the Tax Cuts and Jobs Act and post-2017 foreign earnings, which the Company may repatriatebe repatriated to the U.S. without additional material U.S. federal income taxes.tax. These amounts are no longernot considered indefinitely reinvested in the Company’s foreign subsidiaries.
The Company has not recorded a deferred tax liability on the financial statement carrying amount over the tax basis of its investments in foreign subsidiaries because the Company continues to assert that it is indefinitely reinvested in its underlying investments in foreign subsidiaries. The determination of any unrecorded deferred tax liability on this amount is not practicable due to the uncertainty of how these investments would be recovered.
BLOOMIN’ BRANDS, INC.
NOTES TO CONSOLIDATED FINANCIAL STATEMENTS - Continued
Tax Carryforwards - The amount and expiration dates of tax loss carryforwards and credit carryforwards as of December 26, 202131, 2023 are as follows:
| | (dollars in thousands) | (dollars in thousands) | EXPIRATION DATE | | AMOUNT | (dollars in thousands) | EXPIRATION DATE | | AMOUNT |
| Federal tax credit carryforwards | Federal tax credit carryforwards | 2026 | - | 2041 | | $ | 158,878 | |
| Foreign loss carryforwards | Foreign loss carryforwards | 2022 | - | Indefinite | | $ | 71,724 | |
| Foreign credit carryforwards | Foreign credit carryforwards | Indefinite | | $ | 864 | |
As of December 26, 2021,31, 2023, the Company had $155.7$188.3 million in general business tax credit carryforwards, which have a 20-year carryforward period and are utilized on a first-in, first-out basis. The Company currently expects to utilize these tax credit carryforwards within a 10-year 10-year period. However, the Company’s ability to utilize these tax credits could be adversely impacted by, among other items, a future “ownership change” as defined under Section 382 of the Internal Revenue Code.
Unrecognized Tax Benefits - As of December 26, 202131, 2023 and December 27, 2020,25, 2022, the liability for unrecognized tax benefits was $19.2$17.2 million and $25.5$18.3 million, respectively. Of the total amount of unrecognized tax benefits, including accrued interest and penalties, $18.8$16.7 million and $25.5$17.9 million, respectively, if recognized, would impact the Company’s effective income tax rate.
BLOOMIN’ BRANDS, INC.
NOTES TO CONSOLIDATED FINANCIAL STATEMENTS - Continued
The following table summarizes the activity related to the Company’s unrecognized tax benefits for the periods indicated:
| | FISCAL YEAR |
| FISCAL YEAR | | | FISCAL YEAR |
| (dollars in thousands) | (dollars in thousands) | 2021 | | 2020 | | 2019 | (dollars in thousands) | 2023 | | 2022 | | 2021 |
| Balance as of beginning of year | $ | 25,524 | | | $ | 27,201 | | | $ | 25,190 | |
| Balance, beginning of the period | |
| Additions for tax positions taken during a prior period | Additions for tax positions taken during a prior period | 166 | | | 1,061 | | | 869 | |
| Reductions for tax positions taken during a prior period | Reductions for tax positions taken during a prior period | (4,209) | | | (324) | | | (255) | |
| Additions for tax positions taken during the current period | Additions for tax positions taken during the current period | 1,292 | | | 762 | | | 2,237 | |
| | Settlements with taxing authorities | Settlements with taxing authorities | (2,674) | | | (1,290) | | | (44) | |
| Settlements with taxing authorities | |
| Settlements with taxing authorities | |
| Lapses in the applicable statutes of limitations | Lapses in the applicable statutes of limitations | (854) | | | (1,857) | | | (749) | |
| Translation adjustments | Translation adjustments | (7) | | | (29) | | | (47) | |
| Balance as of end of year | $ | 19,238 | | | $ | 25,524 | | | $ | 27,201 | |
| Balance, end of the period | |
|
The Company had approximately $0.9$0.5 million and $1.9$0.8 million accrued for the payment of interest and penalties as of December 26, 202131, 2023 and December 27, 2020,25, 2022, respectively. The Company recognized immaterial interest and penalties related to uncertain tax positions in the Provision (benefit) for income taxes, for all periods presented.
In many cases, the Company’s uncertain tax positions are related to tax years that remain subject to examination by relevant taxable authorities. Based on the outcome of these examinations, or a result of the expiration of the statute of limitations for specific jurisdictions, it is reasonably possible that the related recorded unrecognized tax benefits for tax positions taken on previously filed tax returns will change by approximately $1.0$0.5 million to $2.0$1.0 million within the next 12 months.
Open Tax Years - Following is a summarysummary of the open audit years by jurisdiction as of December 26, 2021:31, 2023:
| | OPEN AUDIT YEARS |
| OPEN AUDIT YEARS | | | OPEN AUDIT YEARS |
| United States - federal | United States - federal | 2007 | - | 2020 | United States - federal | 2007 | - | 2022 |
| United States - state | United States - state | 2009 | - | 2020 | United States - state | 2009 | - | 2022 |
| Foreign | Foreign | 2015 | - | 2020 | Foreign | 2015 | - | 2022 |
BLOOMIN’ BRANDS, INC.
NOTES TO CONSOLIDATED FINANCIAL STATEMENTS - ContinuedContingencies
22. Commitments and Contingencies
Lease Guarantees - The Company assigned its interest, and is contingently liable, under certain real estate leases. These leases have varying terms, the latest of which expires in 2032. As of December 26, 2021,31, 2023, the undiscounted payments the Company could be required to make in the event of non-payment by the primary lessees was approximately $25.1$19.7 million. The present value of these potential payments discounted at the Company’s incremental borrowing rate as of December 26, 202131, 2023 was approximately $21.2$15.0 million. In the event of default, the indemnity clauses in the Company’s purchase and sale agreements govern its ability to pursue and recover damages incurred. As of December 26, 202131, 2023 and December 27, 2020,25, 2022, the Company’s recorded contingent lease liability was $8.7$5.3 million and $9.6$6.2 million, respectively,respectively.
Purchase Obligations - Purchase obligations were $206.6$196.8 million and $230.6$226.6 million as of December 26, 202131, 2023 and December 27, 2020,25, 2022, respectively. These purchase obligations are primarily due within fivethree years, however commitments with various vendors extend through December 2030. Outstanding commitments consist primarily of foodinventory, fixtures and beverage products related to normal business operations, technology, restaurant-level service contractsequipment and advertising.technology. In 2021,2023, the Company purchasedpurchased: (i) more than 90%95% of its U.S. beef raw materials from 4four beef suppliers that represent more than 80%a significant portion of the total beef marketplace in the U.S.U.S and (ii) more than 80% of its Brazil pork raw materials from four pork suppliers that represent more than 45% of the total pork marketplace in Brazil.
BLOOMIN’ BRANDS, INC.
NOTES TO CONSOLIDATED FINANCIAL STATEMENTS - Continued
Litigation and Other Matters - The Company is subject to legal proceedings, claims and liabilities, such as liquor liability, slip and fall cases, wage-and-hourwage and hour and other employment-related litigation, which arise in the ordinary course of business. A reserve is recorded when it is both: (i) probable that a loss has occurred and (ii) the amount of loss can be reasonably estimated. There may be instances in which an exposure to loss exceeds the recorded reserve. The Company evaluates, on a quarterly basis, developments in legal proceedings that could cause an increase or decrease in the amount of the reserve that has been previously recorded, or a revision to the disclosed estimated range of possible losses, as applicable.
The Company’s legal proceedings range from cases brought by a single plaintiff to threatened class actions with many putative class members. While some matters pending against the Company specify the damages claimed by the plaintiff or class, many seek unspecified amounts or are at very early stages of the legal process. Even when the amount of damages claimed against the Company are stated, the claimed amount may be exaggerated, unsupported or unrelated to possible outcomes, and as such, are not meaningful indicators of the Company’s potential liability or financial exposure. As a result, some matters have not yet progressed sufficiently through discovery or development of important factual information and legal issues to enable the Company to estimate an amount of loss or a range of possible loss.
The Company recorded reserves of $7.1 million and $4.6 million for certain of its outstanding legal proceedings as of December 26, 2021 and December 27, 2020, respectively, within Accrued and other current liabilities and Other long-term liabilities on its Consolidated Balance Sheets. While the Company believes that additional losses beyond these accruals are reasonably possible, it cannot estimate a possible loss contingency or range of reasonably possible loss contingencies beyond these accruals. During 2021, 2020 and 2019, the Company recognized $5.4 million, $2.3 million and $1.3 million, respectively, in Other restaurant operating expense in the Company’s Consolidated Statements of Operations and Comprehensive Income (Loss) for certain legal settlements.
The Company intends to defend itself in legal matters. Some of these matters may be covered, at least in part, by insurance if they exceed specified retention or deductible amounts. However, it is possible that claims may be denied by the Company’s insurance carriers, the Company may be required by its insurance carriers to contribute to the payment of claims, or the Company’s insurance coverage may not continue to be available on acceptable terms or in sufficient amounts. The Company records receivables from third party insurers when recovery has been determined to be probable. The Company believes that the ultimate determination of liability in connection with legal claims pending against the Company, if any, in excess of amounts already provided for such matters in the consolidated financial statements, will not have a material adverse effect on its business, annual results of operations, liquidity or financial position. However, it is possible that the Company’s business, results of operations,
BLOOMIN’ BRANDS, INC.
NOTES TO CONSOLIDATED FINANCIAL STATEMENTS - Continued
liquidity or financial condition could be materially affected in a particular future reporting period by the unfavorable resolution of one or more matters or contingencies during such period.
In recent years, certain subsidiaries of the Company were named in collective actions alleging violations of the Fair Labor Standards Act and state wage and hour laws. For these and other matters, the Company recorded reserves of $13.3 million and $15.1 million for certain of its outstanding legal proceedings as of December 31, 2023 and December 25, 2022, respectively, within Accrued and other current liabilities on its Consolidated Balance Sheets. While the Company believes that additional losses beyond these accruals are reasonably possible, it cannot estimate a possible loss contingency or range of reasonably possible loss contingencies beyond these accruals. During 2023, 2022 and 2021, the Company recognized ($0.2) million, $9.4 million and $5.4 million, respectively, in Other restaurant operating expense in the Company’s Consolidated Statements of Operations and Comprehensive Income for certain legal reserves and settlements.
Royalty Termination - On August 2, 2021, wholly-owned subsidiaries of the Company entered into the Purchase and Sale of Royalty Payment Stream and Termination of Royalty Agreement (the “Royalty Termination Agreement”) with the Carrabba’s Italian Grill founders (the “Carrabba’s Founders”), pursuant to which the Company’s obligation to pay future royalties on U.S. Carrabba’s Italian Grill restaurant sales and lump sum royalty fees on Carrabba’s Italian Grill (and Abbraccio) restaurants opened outside the U.S. was terminated. Upon execution of the Royalty Termination Agreement, the Company made a cash payment of $61.9 million to the Carrabba’s Founders, which was recorded in Other restaurant operating expense in its Consolidated Statements of Operations and Comprehensive Income (Loss) during 2021.
BLOOMIN’ BRANDS, INC.
NOTES TO CONSOLIDATED FINANCIAL STATEMENTS - Continued
Insurance - As of December 26, 2021,31, 2023, the future undiscounted payments the Company expects for workers’ compensation, general liability and health insurance claims are as follows:
| | (dollars in thousands) | (dollars in thousands) | |
| 2022 | $ | 22,071 | |
| 2023 | 10,819 | |
| 2024 | |
| 2024 | |
| 2024 | 2024 | 6,759 | |
| 2025 | 2025 | 3,486 | |
| 2026 | 2026 | 1,838 | |
| 2027 | |
| 2028 | |
| Thereafter | Thereafter | 9,691 | |
| $ | |
| | $ | 54,664 | |
|
The following is a reconciliation of the expected aggregate undiscounted reserves to the discounted reserves for insurance claims recognized on the Company’s Consolidated Balance Sheets as of the periods indicated:
| | (dollars in thousands) | (dollars in thousands) | DECEMBER 26, 2021 | | DECEMBER 27, 2020 | (dollars in thousands) | DECEMBER 31, 2023 | | DECEMBER 25, 2022 |
| Undiscounted reserves | Undiscounted reserves | $ | 54,664 | | | $ | 53,217 | |
| Discount (1) | Discount (1) | (1,130) | | | (441) | |
| Discounted reserves | Discounted reserves | $ | 53,534 | | | $ | 52,776 | |
| | Discounted reserves recognized on the Company’s Consolidated Balance Sheets: | Discounted reserves recognized on the Company’s Consolidated Balance Sheets: | |
| Discounted reserves recognized on the Company’s Consolidated Balance Sheets: | |
| Discounted reserves recognized on the Company’s Consolidated Balance Sheets: | |
| Accrued and other current liabilities | |
| Accrued and other current liabilities | |
| Accrued and other current liabilities | Accrued and other current liabilities | $ | 22,017 | | | $ | 20,648 | |
| Other long-term liabilities, net | Other long-term liabilities, net | 31,517 | | | 32,128 | |
| $ | 53,534 | | | $ | 52,776 | |
| $ | |
____________________
(1) Discount rates of 0.69%5.13% and 0.26%4.47% were used for December 26, 202131, 2023 and December 27, 2020,25, 2022, respectively.
23.22. Segment Reporting
The Company considers each of its restaurant concepts and international markets as operating segments, which reflects how the Company manages its business, reviews operating performance and allocates resources. Resources are allocated and performance is assessed by the Company’s Chief Executive Officer, whom the Company has determined to be its Chief Operating Decision Maker.CODM. The Company aggregates its operating segments into 2two reportable segments, U.S. and international. The U.S. segment includes all restaurants operating in the U.S. while restaurants operating outside the U.S. are included in the international segment.
BLOOMIN’ BRANDS, INC.
NOTES TO CONSOLIDATED FINANCIAL STATEMENTS - Continued
The following is a summary of reporting segments as of December 26, 2021:segments:
| | | | | | | | | | | | | | |
| REPORTABLE SEGMENT (1) | | CONCEPT | | GEOGRAPHIC LOCATION |
| U.S. | | Outback Steakhouse | | United States of America |
| Carrabba’s Italian Grill | |
| Bonefish Grill | |
| Fleming’s Prime Steakhouse & Wine Bar | |
| International | | Outback Steakhouse | | Brazil, Hong Kong/China |
| Carrabba’s Italian Grill (Abbraccio) | | Brazil |
_________________
(1)Includes franchise locations.
Segment accounting policies are the same as those described in Note 2 - Summary of Significant Accounting Policies. Revenues for all segments include only transactions with customers and exclude intersegment revenues. Excluded from Income (loss) from operations for U.S. and international are certain legal and corporate costs not directly
BLOOMIN’ BRANDS, INC.
NOTES TO CONSOLIDATED FINANCIAL STATEMENTS - Continued
related to the performance of the segments, most stock-based compensation expenses, a portion of insurance expenses and certain bonus expenses.
The following table details Total revenues by segment and major geographic area for the periods indicated:
| | | | | | | | | | | | | | | | | |
| FISCAL YEAR |
| (dollars in thousands) | 2023 | | 2022 | | 2021 |
| U.S. | $ | 4,053,599 | | | $ | 3,911,870 | | | $ | 3,759,981 | |
| International (1) | | | | | |
| Brazil | 529,670 | | | 448,411 | | | 297,167 | |
| Other | 88,201 | | | 56,227 | | | 65,237 | |
| Total revenues | $ | 4,671,470 | | | $ | 4,416,508 | | | $ | 4,122,385 | |
_________________
(1)International revenues are defined as revenues generated from restaurant sales originating in a country other than the U.S.
The following table is a summary of Total revenuesDepreciation and amortization expense by segment for the periods indicated:
| | FISCAL YEAR |
| FISCAL YEAR | | | FISCAL YEAR |
| (dollars in thousands) | (dollars in thousands) | 2021 | | 2020 | | 2019 | (dollars in thousands) | 2023 | | 2022 | | 2021 |
| Total revenues | | | | | |
| Depreciation and amortization | |
| U.S. | |
| U.S. | |
| U.S. | U.S. | $ | 3,759,981 | | | $ | 2,885,542 | | | $ | 3,687,918 | |
| International | International | 362,404 | | | 285,019 | | | 451,471 | |
| Total revenues | $ | 4,122,385 | | | $ | 3,170,561 | | | $ | 4,139,389 | |
| Corporate | |
| Total depreciation and amortization | |
|
The following table is a reconciliation of segment income (loss) from operations to Income (loss) before provision (benefit) for income taxes for the periods indicated:
| | | | | | | | | | | | | | | | | |
| FISCAL YEAR |
| (dollars in thousands) | 2021 | | 2020 | | 2019 |
| Segment income (loss) from operations | | | | | |
| U.S. | $ | 443,887 | | | $ | (1,630) | | | $ | 311,666 | |
| International | 16,657 | | | (13,479) | | | 44,428 | |
| Total segment income (loss) from operations | 460,544 | | | (15,109) | | | 356,094 | |
| Unallocated corporate operating expense (1) | (151,586) | | | (159,864) | | | (165,004) | |
| Total income (loss) from operations | 308,958 | | | (174,973) | | | 191,090 | |
| Loss on extinguishment and modification of debt | (2,073) | | | (237) | | | — | |
| Other income (expense), net | 26 | | | 131 | | | (143) | |
| Interest expense, net | (57,614) | | | (64,442) | | | (49,257) | |
| Income (loss) before provision (benefit) for income taxes | $ | 249,297 | | | $ | (239,521) | | | $ | 141,690 | |
____________________(1)Includes $32.4 million of charges for 2020 that were not allocated to the Company’s segments related to its transformational initiatives, primarily recorded within General and administrative expense and Provision for impaired assets and restaurant closings. | | | | | | | | | | | | | | | | | |
| FISCAL YEAR |
| (dollars in thousands) | 2023 | | 2022 | | 2021 |
| Segment income from operations | | | | | |
| U.S. | $ | 377,534 | | | $ | 407,860 | | | $ | 443,887 | |
| International | 83,948 | | | 57,333 | | | 16,657 | |
| Total segment income from operations | 461,482 | | | 465,193 | | | 460,544 | |
| Unallocated corporate operating expense | (136,338) | | | (134,772) | | | (151,586) | |
| Total income from operations | 325,144 | | | 330,421 | | | 308,958 | |
| Loss on extinguishment and modification of debt | — | | | (107,630) | | | (2,073) | |
| Loss on fair value adjustment of derivatives, net | — | | | (17,685) | | | — | |
| | | | | |
| Interest expense, net | (52,169) | | | (53,199) | | | (57,588) | |
| Income before provision for income taxes | $ | 272,975 | | | $ | 151,907 | | | $ | 249,297 | |
The following table is a summary of capital expenditures by segment for the periods indicated:
| | | | | | | | | | | | | | | | | |
| FISCAL YEAR |
| (dollars in thousands) | 2023 | | 2022 | | 2021 |
| Capital expenditures | | | | | |
| U.S. | $ | 276,660 | | | $ | 196,163 | | | $ | 103,303 | |
| International | 45,542 | | | 28,647 | | | 14,074 | |
| Corporate | 11,961 | | | 11,709 | | | 9,035 | |
| Total capital expenditures | $ | 334,163 | | | $ | 236,519 | | | $ | 126,412 | |
BLOOMIN’ BRANDS, INC.
NOTES TO CONSOLIDATED FINANCIAL STATEMENTS - Continued
The following table is a summary of Depreciation and amortization expense by segment for the periods indicated:
| | | | | | | | | | | | | | | | | |
| FISCAL YEAR |
| (dollars in thousands) | 2021 | | 2020 | | 2019 |
| Depreciation and amortization | | | | | |
| U.S. | $ | 134,243 | | | $ | 144,298 | | | $ | 152,881 | |
| International | 22,649 | | | 23,723 | | | 27,491 | |
| Corporate | 6,499 | | | 12,240 | | | 16,439 | |
| Total depreciation and amortization | $ | 163,391 | | | $ | 180,261 | | | $ | 196,811 | |
| | | | | |
| | | | | |
| | | | | |
The following table is a summary of capital expenditures by segment for the periods indicated:
| | | | | | | | | | | | | | | | | |
| FISCAL YEAR |
| (dollars in thousands) | 2021 | | 2020 | | 2019 |
| Capital expenditures | | | | | |
| U.S. | $ | 103,303 | | | $ | 64,516 | | | $ | 121,646 | |
| International | 14,074 | | | 18,542 | | | 28,496 | |
| Corporate | 9,035 | | | 5,936 | | | 8,885 | |
| Total capital expenditures | $ | 126,412 | | | $ | 88,994 | | | $ | 159,027 | |
The following table sets forth Total assets by segment as of the periods indicated:
| | (dollars in thousands) | (dollars in thousands) | DECEMBER 26, 2021 | | DECEMBER 27, 2020 | (dollars in thousands) | DECEMBER 31, 2023 | | DECEMBER 25, 2022 |
| Assets | Assets | | | |
| U.S. | U.S. | $ | 2,626,808 | | | $ | 2,672,778 | |
| U.S. | |
| U.S. | |
| International | International | 383,075 | | | 410,322 | |
| Corporate | Corporate | 284,388 | | | 279,007 | |
| Total assets | Total assets | $ | 3,294,271 | | | $ | 3,362,107 | |
Geographic areas — International assets are defined as assets residing in a country other than the U.S. The following table details long-lived assets, excluding goodwill, operating lease right-of-use assets, intangible assets and deferred tax assets, by major geographic area as of the periods indicated:
| | (dollars in thousands) | (dollars in thousands) | DECEMBER 26, 2021 | | DECEMBER 27, 2020 | (dollars in thousands) | DECEMBER 31, 2023 | | DECEMBER 25, 2022 |
| U.S. | U.S. | $ | 831,634 | | | $ | 879,392 | |
| International | International | |
| Brazil | Brazil | 73,706 | | | 83,041 | |
| Brazil | |
| Brazil | |
| Other | Other | 15,342 | | | 17,880 | |
| Total assets | $ | 920,682 | | | $ | 980,313 | |
| Total long-lived assets | |
International revenues are defined as revenues generated from restaurant sales originating in a country other than the U.S. The following table details Total revenues by major geographic area for the periods indicated:
| | | | | | | | | | | | | | | | | |
| FISCAL YEAR |
| (dollars in thousands) | 2021 | | 2020 | | 2019 |
| U.S. | $ | 3,759,981 | | | $ | 2,885,542 | | | $ | 3,687,918 | |
| International | | | | | |
| Brazil | 297,167 | | | 222,283 | | | 393,700 | |
| Other | 65,237 | | | 62,736 | | | 57,771 | |
| Total revenues | $ | 4,122,385 | | | $ | 3,170,561 | | | $ | 4,139,389 | |
Item 9. Changes in and Disagreements with Accountants on Accounting and Financial Disclosure
None.
Item 9A. Controls and Procedures
Evaluation of Disclosure Controls and Procedures
We have established and maintain disclosure controls and procedures that are designed to ensure that information required to be disclosed by us in the reports that we file or submit under the Securities Exchange Act of 1934, as amended, is recorded, processed, summarized and reported within the time periods specified in the Securities and Exchange Commission’s rules and forms, and that such information is accumulated and communicated to our management, including our Chief Executive Officer and Chief Financial Officer, as appropriate to allow timely decisions regarding required disclosure. We carried out an evaluation, under the supervision and with the participation of our management, including our Chief Executive Officer and Chief Financial Officer, of the effectiveness of our disclosure controls and procedures (as defined in Rule 13a-15(e) under the Exchange Act) as of the end of the period covered by this report.Report. Based on that evaluation, the Chief Executive Officer and Chief Financial Officer concluded that our disclosure controls and procedures were effective as of December 26, 2021.31, 2023.
Management’s Annual Report on Internal Control over Financial Reporting
Management’s report on our internal control over financial reporting and the attestation report of PricewaterhouseCoopers LLP, our independent registered certified public accounting firm, on our internal control over financial reporting are included in Item 8, Financial Statements and Supplementary Data, of this Annual Report on Form 10-K.
Changes in Internal Control over Financial Reporting
There have been no changes in our internal control over financial reporting (as defined in Rule 13a-15(f) under the Exchange Act) during our most recent quarter ended December 26, 202131, 2023 that have materially affected, or are reasonably likely to materially affect, our internal control over financial reporting.
Item 9B. Other Information
Amendment to CEO Employment Agreement
On February 21, 2022,During the Company entered into the Second Amendment to Amended and Restated Officer Employment Agreement (the “Second Amendment”) with David J. Deno,fourteen weeks ended December 31, 2023, none of the Company’s Chief Executive Officer. Pursuantdirectors or executive officers adopted or terminated any contract, instruction or written plan for the purchase or sale of Company securities that was intended to satisfy the Second Amendment, effective February 21, 2022, Mr. Deno’s annual base salary was increased to One Million Dollars ($1,000,000) and his long-term incentive award target was increased to 4.35 times his annual base salary (collectively, the “Market Adjustment”). The increase to Mr. Deno’s annual base salary and related annual incentive compensation target will be pro-rated for 2022.
The Market Adjustment was reviewed and approved by the Company’s Compensation Committee after consultation with Frederic W. Cook & Co., Inc., the Compensation Committee’s independent compensation consultant and brings Mr. Deno’s total target compensation level more in-line with the Company’s peer group benchmark.
The foregoing summaryaffirmative defense conditions of the Second Amendment does not purport to be complete and is qualified in its entirety by the full text of the Second Amendment, a copy of which is filed as Exhibit 10.48 to this Annual Report on Form 10-K and incorporated herein by reference.Rule 10b5-1(c) or any “non-Rule 10b5-1 trading arrangement.”
Item 9C. Disclosure Regarding Foreign Jurisdictions that Prevent Inspections
None.
PART III
Item 10. Directors, Executive Officers and Corporate Governance
The information required by this item relating to our directors and nominees will be included under the captions “Proposal No.1:No. 1: Election of Directors—Nominees for Election at this Annual Meeting” and “—Directors Continuing in Office” in our definitive Proxy Statement for the 20222024 Annual Meeting of Stockholders (“Definitive Proxy Statement”) and is incorporated herein by reference.
The information required by this item relating to our executive officers is included under the caption “Information About Our Executive Officers” in Part I of this Report on Form 10-K.
The information required by this item regarding compliance with Section 16(a) of the SecuritiesExchange Act of 1934 will be included under the caption “Executive Compensation and Related Information—“Ownership of Securities—Delinquent Section 16(a) Reports” in our Definitive Proxy Statement and is incorporated herein by reference.
We have adopted a Code of Conduct that applies to all employees. A copy of our Code of Conduct is available on our website, free of charge. The Internet address for our website is www.bloominbrands.com, and the Code of Conduct may be found on our main webpage by clicking first on “Investors” and then on “Governance—Governance Documents” and next on “Code of Conduct.”
We intend to satisfy any disclosure requirement under Item 5.05 of Form 8-K regarding an amendment to, or waiver from, a provision of this code of ethics by posting such information on our website, on the Governance Documents webpage, as specified above.
The information required by this item regarding our Audit Committee and Audit Committee Financial Expert will be included under the caption “Proposal No.1:No. 1: Election of Directors—Board Committees and Meetings” in our Definitive Proxy Statement and is incorporated herein by reference.
Item 11. Executive Compensation
The information required by this item will be included under the captions “Proposal No.1:No. 1: Election of Directors—Director Compensation” and “Executive Compensation and Related Information” in our Definitive Proxy Statement and, except for the information under the caption “Pay vs. Performance”, is incorporated herein by reference.
Item 12. Security Ownership of Certain Beneficial Owners and Management and Related Stockholder Matters
The information required by this item will be included under the caption “Ownership of Securities” in our Definitive Proxy Statement and is incorporated herein by reference.
The information relating to securities authorized for issuance under equity compensation plans is included under the caption “Securities Authorized for Issuance Under Equity Compensation Plans” in Item 5 of this Report on Form 10-K.
Item 13. Certain Relationships and Related Transactions, and Director Independence
The information required by this item relating to transactions with related persons will be included under the caption “Certain Relationships and Related Party Transactions,” and the information required by this item relating to director independence will be included under the caption “Proposal No.1:No. 1: Election of Directors—Independent Directors,” in each case in our Definitive Proxy Statement, and is incorporated herein by reference.
Item 14. Principal Accounting Fees and Services
The information required by this item will be included under the captions “Proposal No.2:No. 2: Ratification of Independent Registered Certified Public Accounting Firm—Principal Accountant Fees and Services” and “—Policy on Audit Committee Pre-Approval of Audit and Permissible Non-Audit Services of Independent Auditor” in our Definitive Proxy Statement and is incorporated herein by reference.
PART IV
Item 15. Exhibits and Financial Statement Schedules
(a)(1) LISTING OF FINANCIAL STATEMENTS
The following consolidated financial statements of the Company and subsidiaries are included in Item 8 of this Report:
•Consolidated Balance Sheets – December 26, 202131, 2023 and December 27, 202025, 2022
•Consolidated Statements of Operations and Comprehensive Income (Loss) – Fiscal years 2021, 20202023, 2022 and 20192021
•Consolidated Statements of Changes in Stockholders’ Equity – Fiscal years 2021, 20202023, 2022 and 20192021
•Consolidated Statements of Cash Flows – Fiscal years 2021, 20202023, 2022 and 20192021
•Notes to Consolidated Financial Statements
(a)(2) FINANCIAL STATEMENT SCHEDULES
All financial statement schedules have been omitted, since the required information is not applicable or is not present in amounts sufficient to require submission of the schedule, or because the information required is included in the consolidated financial statements and notes thereto included in this Report.
(a)(3) EXHIBITS
| | | | | | | | | | | | | | |
EXHIBIT
NUMBER | | DESCRIPTION OF EXHIBITS | | FILINGS REFERENCED FOR
INCORPORATION BY REFERENCE |
| | | | |
| 3.1 | | | | MayApril 19, 20212023, Form 8-K, Exhibit 3.1 |
| | | | |
| 3.2 | | | | December 7, 2018April 19, 2023, Form 8-K, Exhibit 3.13.2 |
| | | | |
| 4.1 | | | | Amendment No. 4 to Registration Statement on Form S-1, File No. 333-180615, filed on July 18, 2012, Exhibit 4.1 |
| | | | |
| 4.2 | | | | December 29, 2019March 26, 2023, Form 10-K,10-Q, Exhibit 4.24.1 |
| | | | |
| 4.3 | | | | May 11, 2020, Form 8-K, Exhibit 4.1 |
| | | | |
| 4.4 | | | | May 11, 2020, Form 8-K, Included as Exhibit A to Exhibit 4.1 |
| | | | |
| 4.5 | | Indenture, dated as of April 16, 2021, by and among Bloomin’ Brands, Inc., OSI Restaurant Partners, LLC, the guarantors party thereto, and Wells Fargo Bank, National Association, as trustee | | April 20, 2021, Form 8-K, Exhibit 4.1 |
| | | | |
| 4.6 | | | | April 20, 2021, Form 8-K, Included as Exhibit A to Exhibit 4.1 |
| | | | |
| 10.1 | | Second Amended and Restated Credit Agreement, dated April 16, 2021, by and among Bloomin’ Brands, Inc., OSI Restaurant Partners, LLC, the guarantors party thereto, the lenders party thereto, and Wells Fargo Bank, National Association, as administrative Agent | | April 20, 2021, Form 8-K, Exhibit 10.1 |
| | | | | | | | | | | | | | |
EXHIBIT
NUMBER | | DESCRIPTION OF EXHIBITS | | FILINGS REFERENCED FOR
INCORPORATION BY REFERENCE |
| | | | |
| 10.2 | | Royalty Agreement dated April 1995 among Carrabba’s Italian Grill, Inc., Outback Steakhouse, Inc., Mangia Beve, Inc., Carrabba, Inc., Carrabba Woodway, Inc., John C. Carrabba, III, Damian C. Mandola, and John C. Carrabba, Jr., as amended by First Amendment to Royaltythe Second Amended and Restated Credit Agreement and Incremental Amendment, dated January 1997 and Second Amendment to Royalty Agreement made and entered into effective April 7, 201026, 2022, by and among Carrabba’s Italian Grill, LLC,Bloomin’ Brands, Inc., OSI Restaurant Partners, LLC, Mangia Beve, Inc., Mangia Beve II, Inc., Original, Inc., Voss, Inc., John C. Carrabba, III, Damian C. Mandola,the guarantors party thereto, the lenders party thereto, and John C. Carrabba, Jr.Wells Fargo Bank, National Association, as administrative Agent | | Registration Statement onApril 29, 2022, Form S-1, File No. 333-180615, filed on April 6, 2012,8-K, Exhibit 10.610.1 |
| | | | |
| 10.3 | | Third Amendment to Royalty Agreement made and entered into effective June 1, 2014, by and among Carrabba’s Italian Grill, LLC, OSI Restaurant Partners, LLC, Mangia Beve, Inc., Mangia Beve II, Inc., Original, Inc., Voss, Inc., John C. Carrabba, III, Damian C. Mandola, and John C. Carrabba, Jr. | | June 29, 2014 Form 10-Q, Exhibit 10.6 |
| | | | |
10.4 | | Fourth Amendment to Royalty Agreement made and entered into effective May 1, 2017, by and among Carrabba’s Italian Grill, LLC, OSI Restaurant Partners, LLC, Mangia Beve, Inc., Mangia Beve II, Inc., Original, Inc., Voss, Inc., John C. Carrabba, III, Damian C. Mandola, and John C. Carrabba, Jr. | | June 25, 2017 Form 10-Q, Exhibit 10.1 |
| | | | |
10.5 | | Purchase and Sale of Royalty Payment Stream and Termination of Royalty Agreement dated August 2, 2021 by and among Carrabba’s Italian Grill, LLC, OSI Restaurant Partners, LLC Mangia Beve, Inc., Mangia Beve II, Inc., Original, Inc., Voss, Inc., John C. Carrabba, III, Damian C. Mandola and John C. Carrabba, Jr. | | August 5,June 27, 2021, Form 10-Q, Exhibit 10.2 |
| | | | |
10.610.4 | | | | Registration Statement on Form S-1, File No. 333-180615, filed on April 6, 2012, Exhibit 10.8 |
| | | | |
10.7*10.5* | | | | Registration Statement on Form S-1, File No. 333-180615, filed on April 6, 2012, Exhibit 10.46Filed herewith |
| | | | |
10.8*10.6* | | | | Registration Statement on Form S-1, File No. 333-180615, filed on April 6, 2012, Exhibit 10.1 |
| | | | |
10.9* | | | | Registration Statement on Form S-1, File No. 333-180615, filed on April 6, 2012, Exhibit 10.42 |
| | | | |
10.10* | | | | Amendment No. 4 to Registration Statement on Form S-1, File No. 333-180615, filed on July 18, 2012, Exhibit 10.2 |
| | | | |
10.11*10.7* | | | | December 7, 2012, Form 8-K, Exhibit 10.2 |
| | | | |
10.12*10.8* | | | | December 7, 2012 Form 8-K, Exhibit 10.3 |
| | | | | | | | | | | | | | |
EXHIBIT
NUMBER | | DESCRIPTION OF EXHIBITS | | FILINGS REFERENCED FOR
INCORPORATION BY REFERENCE |
| | | | |
10.13* | | | | December 7, 2012 Form 8-K, Exhibit 10.4 |
| | | | |
10.14* | | | | September 30, 2013 Form 10-Q, Exhibit 10.1 |
| | | | |
10.15* | | | | September 30, 2013 Form 10-Q, Exhibit 10.2 |
| | | | |
10.16* | | | | December 7, 2012 Form 8-K, Exhibit 10.5 |
| | | | |
10.17* | | | | Amendment No. 4 to Registration Statement on Form S-1, File No. 333-180615, filed on July 18, 2012, Exhibit 10.39 |
| | | | |
10.18*10.9* | | | | March 11, 2016, Definitive Proxy Statement |
| | | | |
10.19*10.10* | | | | June 26, 2016, Form 10-Q, Exhibit 10.2 |
| | | | |
10.20*10.11* | | | | June 26, 2016, Form 10-Q, Exhibit 10.3 |
| | | | |
10.21*10.12* | | | | June 26, 2016, Form 10-Q, Exhibit 10.4 |
| | | | |
10.22*10.13* | | | | June 26, 2016, Form 10-Q, Exhibit 10.5 |
| | | | |
10.23*10.14* | | | | March 26, 2017, Form 10-Q, Exhibit 10.1 |
| | | | |
10.24*10.15* | | | | April 9, 2020, Definitive Proxy Statement |
| | | | | | | | | | | | | | |
EXHIBIT
NUMBER | | DESCRIPTION OF EXHIBITS | | | FILINGS REFERENCED FOR
INCORPORATION BY REFERENCE |
| | | | |
10.25*10.16* | | | | May 29, 2020, Form 8-K, Exhibit 10.2 |
| | | | |
10.26*10.17* | | | | May 29, 2020, Form 8-K, Exhibit 10.3 |
| | | | |
10.27*10.18* | | | | May 29, 2020, Form 8-K, Exhibit 10.4 |
| | | | |
10.28*10.19* | | | | May 29, 2020, Form 8-K, Exhibit 10.5 |
| | | | | | | | | | | | | | |
EXHIBIT
NUMBER10.20* | | DESCRIPTION OF EXHIBITS | | FILINGS REFERENCED FOR
INCORPORATION BY REFERENCE |
| | | | |
10.29* | | | | May 29, 2020, Form 8-K, Exhibit 10.6 |
| | | | |
10.30*10.21* | | | | December 27, 2020, Form 10-K, Exhibit 10.48 |
| | | | |
10.31*10.22* | | | | December 27, 2020, Form 10-K, Exhibit 10.49 |
| | | | |
10.32*10.23* | | | | December 27, 2020, Form 10-K, Exhibit 10.50 |
| | | | |
10.33*10.24* | | | | December 7, 2012, Form 8-K, Exhibit 10.1 |
| | | | |
10.34*10.25* | | | | March 31, 2019 Form 10-Q, Exhibit 10.2 |
| | | | |
10.35* | | | | March 31, 2019, Form 10-Q, Exhibit 10.3 |
| | | | |
10.36*10.26* | | | | September 25, 2016 Form 10-Q, Exhibit 10.2 |
| | | | |
10.37* | | | | March 31, 2019, Form 10-Q, Exhibit 10.4 |
| | | | |
10.38*10.27* | | | | June 30, 2019 Form 10-Q, Exhibit 10.3 |
| | | | |
10.39* | | | | June 30, 2019, Form 10-Q, Exhibit 10.4 |
| | | | |
10.40*10.28* | | | | December 29, 2019 Form 10-K, Exhibit 10.39 |
| | | | |
10.41* | | | | December 29, 2019, Form 10-K, Exhibit 10.40 |
| | | | |
10.42*10.29* | | | | March 29, 2020, Form 10-Q, Exhibit 10.4 |
| | | | |
| 10.30* | | | | | December 26, 2021, Form 10-K, Exhibit 10.48 |
| | | | |
10.4310.31* | | | | December 26, 2021, Form 10-K, Exhibit 10.47 |
| | | | |
| 10.32 | | | | May 11, 2020, Form 8-K, Exhibit 10.1 |
| | | | |
10.44 | | | | May 11, 2020 Form 8-K, Exhibit 10.2 |
| | | | |
10.45* | | | | Filed herewith |
| | | | |
10.46* | | | | Filed herewith |
| | | | |
10.47* | | | | Filed herewith |
| | | | | | | | | | | | | | |
EXHIBIT
NUMBER | | DESCRIPTION OF EXHIBITS | | FILINGS REFERENCED FOR
INCORPORATION BY REFERENCE |
| | | | |
| 10.33 | | | | | May 11, 2020, Form 8-K, Exhibit 10.2 |
| 10.48* | | | |
| 10.34 | | | | January 2, 2024, Form 8-K, Exhibit 10.1 |
| | | | |
| 10.35* | | | | Filed herewith |
| | | | |
| 10.36* | | | | Filed herewith |
| | | | |
| 21.1 | | | | Filed herewith |
| | | | |
| 23.1 | | | | Filed herewith |
| | | | |
| 31.1 | | | | Filed herewith |
| | | | |
| 31.2 | | | | Filed herewith |
| | | | |
| 32.1 | | | | FiledFurnished herewith |
| | | | |
| 32.2 | | | | Furnished herewith |
| | | | |
| 97.1 | | | | Filed herewith |
| | | | |
| 101.INS | | Inline XBRL Instance Document | | Filed herewith |
| | | | |
| 101.SCH | | Inline XBRL Taxonomy Extension Schema Document | | Filed herewith |
| | | | |
| 101.CAL | | Inline XBRL Taxonomy Extension Calculation Linkbase Document | | Filed herewith |
| | | | |
| 101.DEF | | Inline XBRL Taxonomy Extension Definition Linkbase Document | | Filed herewith |
| | | | |
| 101.LAB | | Inline XBRL Taxonomy Extension Label Linkbase Document | | Filed herewith |
| | | | |
| 101.PRE | | Inline XBRL Taxonomy Extension Presentation Linkbase Document | | Filed herewith |
| | | | |
| 104 | | Cover Page Interactive Data File (formatted as inline XBRL and contained in Exhibit 101) | | Filed herewith |
| | | | |
| *Management contract or compensatory plan or arrangement required to be filed as an exhibit. |
| | | | |
| (1) These certifications are not deemed to be “filed” for purposes of Section 18 of the Exchange Act, or otherwise subject to the liability of that section. These certifications will not be deemed to be incorporated by reference into any filing under the Exchange Act or the Exchange Act, except to the extent that the registrant specifically incorporates them by reference. |
*Management contract or compensatory plan or arrangement required to be filed as an exhibit.
1These certifications are not deemed to be “filed” for purposes of Section 18 of the Exchange Act, or otherwise subject to the liability of that section. These certifications will not be deemed to be incorporated by reference into any filing under the Securities Act or the Exchange Act, except to the extent that the registrant specifically incorporates them by reference.
Item 16. Form 10-K Summary
None.
SIGNATURES
Pursuant to the requirements of Section 13 or 15(d) of the Securities Exchange Act of 1934, the registrant has duly caused this report to be signed on its behalf by the undersigned, thereunto duly authorized.
| | | | | | | | | | | |
| Date: | February 23, 202228, 2024 | Bloomin’ Brands, Inc. |
| | | |
| | | By: /s/ David J. Deno |
| | | David J. Deno Chief Executive Officer (Principal Executive Officer) |
Pursuant to the requirements of the Securities Exchange Act of 1934, this report has been signed below by the following persons on behalf of the registrant and in the capacities and on the dates indicated.
| | | | | | | | | | | | | | |
| Signature | | Title | | Date |
| | | | |
| /s/ David J. Deno | | Chief Executive Officer and Director
(Principal Executive Officer) | | |
| David J. Deno | | | February 23, 202228, 2024 |
| | | | |
| /s/ Christopher Meyer | | Executive Vice President and Chief Financial Officer
(Principal Financial and Accounting Officer) | | |
| Christopher Meyer | | | February 23, 202228, 2024 |
| | | | |
/s/ James R. CraigiePhilip Pace | | Senior Vice President, Chief Accounting Officer (Principal Accounting Officer) | | |
| Philip Pace | | | February 28, 2024 |
| | | | |
James/s/ R. CraigieMichael Mohan | | Chairman of the Board and Director | | |
| R. Michael Mohan | | | | February 23, 202228, 2024 |
| | | | |
/s/ Wendy A. Beck | | | | |
Wendy A. Beck | | Director | | February 23, 2022 |
| | | | |
| /s/ David R. Fitzjohn | | Director | | |
| David R. Fitzjohn | | | Director | February 23, 202228, 2024 |
| | | | |
/s/ John GainorDavid George | | | | |
John Gainor | | Director | | |
| David George | | | | February 23, 202228, 2024 |
| | | | |
| /s/ Lawrence Jackson | | Director | | | |
| Lawrence Jackson | | | | February 28, 2024 |
| | | | |
| /s/ Julie Kunkel | | Director | | |
| Julie Kunkel | | | | February 23, 202228, 2024 |
| | | | |
| /s/ Rohit Lal | | Director | | |
| Rohit Lal | | | | February 28, 2024 |
| | | | |
| /s/ Tara Walpert Levy | | Director | | | |
| Tara Walpert Levy | | | Director | February 23, 202228, 2024 |
| | | | |
| /s/ John J. Mahoney | | Director | | | |
| John J. Mahoney | | | Director | February 23, 202228, 2024 |
| | | | |
/s/ R. Michael MohanMelanie Marein-Efron | | | | |
R. Michael Mohan | | Director | | |
| Melanie Marein-Efron | | | | February 23, 202228, 2024 |
| | | | |
/s/ Elizabeth A. SmithJonathan Sagal | | | | |
Elizabeth A. Smith | | Director | | |
| Jonathan Sagal | | | | February 23, 202228, 2024 |
