UNITED STATES
SECURITIES AND EXCHANGE COMMISSION
Washington, D.C. 20549
FORM 10-K
(Mark One) | |
☒ | ANNUAL REPORT PURSUANT TO SECTION 13 OR 15(d) OF THE SECURITIES EXCHANGE ACT OF 1934 |
For the fiscal year ended December 31, 20152017 |
OR |
☐ | TRANSITION REPORT PURSUANT TO SECTION 13 OR 15(d) OF THE SECURITIES EXCHANGE ACT OF 1934 |
For the transition period from to |
Commission file number: 001-13122
RELIANCE STEEL & ALUMINUM CO.
(Exact name of registrant as specified in its charter)
Delaware
incorporation or organization) | 95-1142616
Identification No.) |
350 South Grand Avenue, Suite 5100
Los Angeles, California 90071
(213) 687-7700
(Address and telephone number, including area code, of principal executive offices and telephone number)offices)
Securities registered pursuant to Section 12(b) of the Act:
Title of each class | | Name of each exchange on which registered |
Common Stock, $0.001 par value | | New York Stock Exchange |
Securities registered pursuant to Section 12(g) of the Act: None
Indicate by check mark if the registrant is a well-known seasoned issuer, as defined in Rule 405 of the Securities Act. Yes ☒ No ☐
Indicate by check mark if the registrant is not required to file reports pursuant to Section 13 or Section 15(d) of the Act. Yes ☐ No ☒
Indicate by check mark whether the registrant (1) has filed all reports required to be filed by Section 13 or 15(d) of the Securities Exchange Act of 1934 during the preceding 12 months (or for such shorter period that the registrant was required to file such reports), and (2) has been subject to such filing requirements for the past 90 days. Yes ☒ No ☐
Indicate by check mark whether the registrant has submitted electronically and posted on its corporate Website,Web site, if any, every Interactive Data File required to be submitted and posted pursuant to Rule 405 of Regulation S-T (§232.405 of this chapter) during the preceding 12 months (or for such shorter period that the registrant was required to submit and post such files). Yes ☒ No ☐
Indicate by check mark if disclosure of delinquent filers pursuant to Item 405 of Regulation S-K (§229.405 of this chapter) is not contained herein and will not be contained, to the best of the registrant’s knowledge, in definitive proxy or information statements incorporated by reference in Part III of this Form 10-K or any amendment to this Form 10-K. ☐
Indicate by check mark whether the registrant is a large accelerated filer, an accelerated filer, a non-accelerated filer, or a smaller reporting company, or emerging growth company. See the definitions of “large accelerated filer,” “accelerated filer”filer,” “smaller reporting company,” and “smaller reporting“emerging growth company” in Rule 12b-2 of the Exchange Act. (Check one):
Large accelerated filer ☒
| Accelerated filer ☐
| Non-accelerated filer ☐
| Smaller reporting company ☐
|
Large accelerated filer ☒ Accelerated filer ☐ Non-accelerated filer ☐ Smaller reporting company ☐ Emerging growth company ☐
If an emerging growth company, indicate by check mark if the registrant has elected not to use the extended transition period for complying with any new or revised financial accounting standards provided pursuant to Section 13(a) of the Exchange Act. ☐
Indicate by check mark whether the registrant is a shell company (as defined in Rule 12b-2 of the Act). Yes ☐ No ☒
The aggregate market value of the voting stock held by non-affiliates of the registrant, based on the closing price on the New York Stock Exchange on June 30, 20152017 was approximately $4,320,000,000.$5,140,000,000. For purposes of this computation, it is assumed that the shares of voting stock held by Directors and Officers would be deemed to be stock held by affiliates. As of January 31, 2016, 71,865,155February 23, 2018, 72,830,040 shares of the registrant’s common stock, $0.001 par value, were outstanding.
DOCUMENTS INCORPORATED BY REFERENCE
Portions of the registrant’s definitive Proxy Statement for the 20162018 Annual Meeting of Stockholders (the “Proxy Statement”) are incorporated by reference into Part III of this report.
FORWARD-LOOKING STATEMENTS
Unless otherwise indicated or required by the context, as used in this Annual Report on Form 10‑K, the terms “Company,” “Reliance,” “we,” “our,” and “us” refer to Reliance Steel & Aluminum Co. and all of its subsidiaries that are consolidated in conformityaccordance with U.S. generally accepted accounting principles. This Annual Report on Form 10‑K and the documentsinformation incorporated by reference contain forward‑looking statements within the meaning of the Private Securities Litigation Reform Act of 1995. We may also provide oral or written forward-looking information in other materials we release to the public. Our forward‑looking statements may include, but are not limited to, discussions of our industry and end markets, our business strategies and our expectations concerning future demand and metals pricing and our results of operations, margins, profitability, impairment charges, taxes, liquidity, litigation matters and capital resources. In some cases, you can identify forward‑looking statements by terminology such as “may,” “will,” “should,” “expects,“could,” “intends,“would,” “plans,“expect,” “anticipates,“plan,” “believes,“anticipate,” “thinks,“believe,” “estimates,“estimate,” “seeks,” “predicts,“predict,” “potential” and “continue,” the negative of these terms, and similar expressions. These statements relate to future events or our future financial performance and involve known and unknown risks, uncertainties and other factors that may cause our actual results, levels of activity, performance or achievements to differ materially from those in the future that are implied by these forward‑looking statements. These risks and other factors include those described in “Risk Factors” (Part I, Item 1A of this Form 10‑K) and “Quantitative and Qualitative Disclosures about Market Risk” (Part II, Item 7A). In addition, other factors may affect the accuracy of our forward-looking information. These factors, among others, could cause our actualforward-looking statements are not guarantees of future performance and are subject to risks and uncertainties. Actual events and results and performance to differ materially from the results and performance projected in, or implied by, the forward‑looking statements.of operations may vary materially.
Among theWe do not assume any responsibility to publicly update any of our forward-looking statements regardless of whether factors that could cause our results to differ are the following:
| ·
| | Our future operating results depend on a number of factors beyond our control, such as the prices for and the availability of metals, which could cause our results to fluctuate significantly over time. During periods of low customer demand it could be more difficult for us to pass through price increases to our customers, which could reduce our gross profit and net income. A significant or rapid increase or decrease our costs from current levels could have a severe impact on our profitability.
|
| ·
| | We service industries that are highly cyclical, and downturns in our customers’ industries could reduce our revenue and profitability. We are currently experiencing a significant downturn in the energy industry, which represented about 8% to 10% of our consolidated sales before the downturn. We expect this to continue to negatively impact our earnings in the near term. We recorded impairment and closure-related charges related to certain of our energy-related businesses in 2015 that reduced our earnings. If the energy market continues to decline, we could incur additional impairment and closure-related charges. We do not know how long the downturn will last or if it will worsen.
|
| ·
| | The success of our business is affected by general economic and political conditions both in the U.S. and globally. Our business is subject to volatility of both metals pricing and demand, which fluctuate due to many factors outside of our control. A deterioration in regions and countries experiencing economic growth and investment could have an adverse effect on our business.
|
| ·
| | Global economic factors may cause increased imports of metal products into the U.S., which may cause the cost of the metals we purchase to decline and could also cause our selling prices and profitability to decline. Imports of metals into the U.S. market are at historically high levels, which has had a negative impact on metals pricing which, along with a more competitive market due to excess metal, has also negatively impacted our selling prices and profitability in 2015. The high levels of imports are somewhat due to economies outside of the U.S. being weaker than ours and a strengthened U.S. dollar, which has negatively impacted prices for raw materials.
|
| ·
| | We operate in a highly competitive industry and increased competition could reduce our profitability.
|
| ·
| | If the producers increase production levels without offsetting increases in end demand, metal costs could decline, which may cause our selling prices and profitability to decline.
|
| ·
| | We are a decentralized company, which presents certain operational risks and challenges.
|
| ·
| | As a decentralized business, we depend on both senior management and our operating employees; if we are unable to attract and retain well‑qualified individuals, our results of operations may decline.
|
| ·
| | We may not be able to consummate future acquisitions, and those acquisitions that we do complete may be difficult to integrate into our business, or may fail to successfully adopt our operating strategies.
|
| ·
| | Our acquisitions might fail to perform as we anticipate or there could be significant negative events in our industry or the general economy that fundamentally alter our business model and outlook. This could result in a significant impairment charge to goodwill and/or other intangible assets. Acquisitions may also result in our becoming responsible for unforeseen liabilities that may adversely affect our financial condition and liquidity. If our acquisitions do not perform as anticipated, our operating results also may be adversely affected.
|
| ·
| | Various environmental and other governmental regulations may require us to expend significant capital and incur substantial costs or may impact the customers we serve, which may have a negative impact on our financial results.
|
| ·
| | We operate internationally and are subject to exchange rate fluctuations, exchange controls, political risks and other risks relating to international operations.
|
| ·
| | We may discover internal control deficiencies related to internal control over financial reporting in our decentralized operations or in an acquisition.
|
| ·
| | We rely on information technology systems and networks; any failure or breach of these systems and networks could adversely impact our business and operations.
|
| ·
| | We may pursue growth opportunities or activities that return value to stockholders that require us to increase our leverage ratios. This may cause our stock price to decline or impact our public debt ratings.
|
| ·
| | The Company may be subject to risks relating to changes in its tax rates or exposure to additional income tax liabilities.
|
| ·
| | Our indebtedness could impair our financial condition and reduce the funds available to us for other purposes and our failure to comply with the covenants contained in our debt instruments could result in an event of default that could adversely affect our operating results.
|
The foregoing factors are not exhaustive, and new factors may emerge or changes to the foregoing factors may occur that could impact our business. Although we believe the expectations reflected in the forward‑looking statements are reasonable, we cannot guarantee future performance or results. We are not obligated to update or revise any forward‑looking statements, whetherchange as a result of new information, future events, or otherwise,for any other reason, except as may be required by law. You should review any additional disclosures we make in our press releases and Forms 10-K, 10-Q and 8-K filed with or furnished to the federal securities laws.SEC. We also suggest that you listen to our quarterly earnings release conference calls with financial analysts.
This Annual Report on Form 10‑K includes registered trademarks, trade names and service marks of the Company and its subsidiaries.
PART I
Item 1. BusinessBusiness
We are the largest metals service center company in North America (U.S. and Canada). Our network of metals service centers operates more than 300 locations in 3940 states in the U.S. and in 1213 other countries (Australia, Belgium, Canada, China, France, India, Malaysia, Mexico, Singapore, South Korea, Turkey, the U.A.E.United Arab Emirates and the United Kingdom). Through this network, we provide metals processing services, or first-stage processing, and distribute a full line of more than 100,000 metal products, including alloy, aluminum, brass, copper, carbon steel, stainless steel, titanium and specialty steel products, to more than 125,000 customers in a broad range of industries. We focus on small orders with quick turnaround and increasing levels of value-added processing. In 2017, our average order size was $1,740, approximately 48% of our orders included value-added processing and approximately 40% of our orders were delivered within 24 hours from receipt of the order. Many of our metals service centers process and distribute only specialty metals. We deliver a variety of products from facilities located across the United States and Canada, and have grown our international presence selectively to support the globalization of our customers, giving us broad product, customercustomers. We generated net sales of $9.72 billion in 2017 and geographic diversification.net income attributable to Reliance of $613.4 million.
Our primary business strategy is to provide the highest levels of quality and service to our customers in the most efficient operational manner, allowing us to maximize our financial results. Our growth strategy is based on increasing our operating results through organic growth activities and strategic acquisitions tothat enhance our product, customer and geographic diversification.diversification with a focus on higher margin specialty products and value-added processing services. We focus on improving the operating performance at acquired locations by integrating them into our operational model and providing them access to capital and other resources to promote growth and efficiencies. We believe our focused growth strategy of diversifying our products, customers and geographic locations makes us less vulnerable to regional or industry specific economic volatility and somewhat lessens the negative impact of volatility experienced in commodity pricing and cyclicality of our customer end markets, as well as general economic trends. We also believe that our focus on servicing customers with small order sizes and quick turnaround, along with our growth and diversification strategy have been instrumental in our ability to produce industry‑leading operating results among publicly traded metals service center companies in North America. During 2015, we handled approximately 5,647,000 transactions in total or an average of 22,350 transactions per business day, with an average price of approximately $1,660 per transaction. We generated net sales of $9.35 billion in 2015 and net income attributable to Reliance of $311.5 million.
Currently weWe have one operating segment and one reportable segment, metals service centers. Further information about our reportable segments,segment, including geographic information, appears in Note 16 — “Segment information” of Part II, Item 8 "Financial“Financial Statements and Supplementary Data."”
Industry Overview
Metals service centers acquire carbon steel, aluminum, stainless and alloy steel and other metal products from primary metals producers and then process these materials to meet customer specifications using techniques such as beam, bar, pipe and tube cutting; bending, forming and shaping; coil and flat roll processing; plate and sheet cutting; machining and various other specialized services such as laser cutting, fabricating, and mechanical polishing, among others. Customers purchase from service centers for a variety of reasons, including the ability to obtain value‑added metals processing, readily available inventory, reliable and timely delivery, flexible minimum order size, and quality control. Many customers deal exclusively with service centers because the quantities of metal products that they purchase are smaller than the minimum order sizes specified by mills or because those customers require intermittent deliveries over long or irregular periods. Metals service centers respond to a niche market created because of the focus on just-in-time inventory management and materials management outsourcing in the capital goods and related industries. In general, metals service center customers have placed increased emphasis on carrying lower amounts of inventory, especially during declining price environments. We believe that many customers have also reduced their in-house processing capabilities, opting to source processed metal from service centers like us, which has been supportive of our recent capital expenditures and improved gross profit margins. There have been significant advancements in processing equipment in our industry in recent years that have enabled us to provide higher quality products and increase the efficiency of our customers’ manufacturing operations, which has contributed to our improved our gross profit margins.
These processing services save our customers time, labor, and expense, reducing their overall manufacturing costs. Specialized metals processing equipment requires high‑volume production to be cost effective. Many manufacturers and their suppliers are not able or willing to invest in the necessary technology, equipment, and warehousing of inventory to process the metalsefficiently and effectively perform metal processing for their own manufacturing or processing operations. Accordingly, we believe industry dynamics
have created a niche in the market.market for metals service centers. Metals service centers purchase, process, and deliver metals to end‑users in a more efficient and cost‑effective manner than the end‑user could achieve by dealing directly with the primary producer. Service centers comprise the largest customer group for North American mills, buying and reselling almost 50% of all the carbon, alloy, stainless and specialty steels, aluminum, copper, brass, bronze and superalloys produced in the United States according to a January 2016May 2017 report issued by IBISWorld Inc., a global intelligence publication.
MetalsWe believe that metals service centers are generally less susceptible to market cycles than metals producers because service centers are generally able to pass on all or a portion of increases in metal costs to their customers, unless they are selling to their customers on a fixed‑price contractual basis. We believe that service center companies, like Reliance, that emphasize rapid inventory turnover and minimal contract sales, are generally less vulnerable to changing metals prices than the metals producers. However, fluctuations in metalmetals pricing have a significant impact on our revenue and profit.
In recent years, imports of metal into the U.S., especially of carbon steel products, have reached historical highs, putting significant downward pressure on metal prices and taking market share from the domestic mill producers, with many of the domestic producers reducing capacity.
Customers purchase from service centers for a variety of reasons, including the ability to obtain value‑added metals processing, readily available inventory, reliable and timely delivery, flexible minimum order size, and quality control. Many customers deal exclusively with service centers because the quantities of metal products that they purchase are smaller than the minimum orders specified by mills or because those customers require intermittent deliveries over long or irregular periods. Metals service centers respond to a niche market created because of the focus on just‑in‑time inventory management and materials management outsourcing in the capital goods and related industries, and because the larger metal producers have reduced in‑house direct sales efforts to small sporadic purchasers to enhance their production efficiency. In general, metal service center customers have placed increased emphasis on carrying lower amounts of inventory, especially during declining price environments. Many customers have also reduced their in-house processing, sourcing processed metal from service centers like us, which has spurred some of our recent capital expenditures and also contributed to improved gross profit margins.
The metals service center industry is highly fragmented and competitive within localized areas or regions. Many of our competitors operate single, stand‑alone service centers. According to IBISWorld Inc., the number ofthere are approximately 10,100 metal wholesale centers in the United States decreased from approximately 11,000wholesaling locations operated by more than 8,3007,100 companies in 2002 to approximately 10,100 locations operated by more than 7,400 companiesthe United States in 2015. This2017. The significant number of metals service centers that exist in this fragmented market, along with the consolidation trend continues to create opportunities for us to expand by making acquisitions.
According to IBISWorld Inc., the United States metals wholesale industry generated(which includes metals service centers) is expected to generate revenues of approximately $202.2$182.7 billion in 2015,2017, a 13% decrease10% increase over 20142016 revenues of $232.0 billion.$165.9 billion mainly due to higher metals prices. The fourfive largest U.S. metals service center companies are expected by IBISWorld Inc. to represent less thanjust over 10% of the estimated $212.8$182.7 billion industry total in 2016.2017. While we remain the largest metals service center company in the United States on a revenue basis, IBISWorld Inc. estimates our 20152017 U.S. revenues of $8.62 billion accountedto account for only about 4.3%4.8% of the entire U.S. market, in 2015 according to IBISWorld Inc.leaving significant opportunity for further strategic growth.
History and Overview of Reliance
Reliance Steel & Aluminum Co. was organized as a California corporation on February 3, 1939, and commenced business in Los Angeles, California fabricating steel reinforcing bar. Within ten years of our founding, we had become a full‑line distributor of steel and aluminum, operating a single metals service center in Los Angeles. In the early 1950’s, we automated our materials handling operations and began to provide processing services to meet our customers’ requirements. In the 1960’s, we began to acquire other companies to establish additional service centers, expanding into other geographic areas.
In the mid‑1970’s, we began to establish specialty metals centers stocked with inventories of selected metals such as aluminum, stainless steel or brass and copper, and equipped with automated materials handling and precision cutting equipment specific to the selected metals. In the mid‑1990’s, we began to expand nationally and focused on acquiring well‑run, profitable metals service center companies, and we continue to expand our network, with a focus on providing increased levels of value-added services and specialty products to our customers as opposed to merely distributing metal.
We reincorporated in the State of Delaware in 2015. Our common stock is listed on the New York Stock Exchange (“NYSE”) under the symbol “RS” and was first traded on September 16, 1994.
We continue to execute our growth strategy and have become the largest North American (U.S. and Canada) metals service center company based on revenues, with over 300 locations and 20152017 net sales of $9.35$9.72 billion. Although we continue to expand the types of metals that we sell and the processing services that we perform, we have not diversified outside of our core business and we strive to consistently perform as the best in our industry. We focus on smaller customers and order sizes with quick turnarounds.turnarounds and have steadily increased the percentage of our orders with processing performed, which reached 48% in 2017, up from our historical level of 40%. We currently operate metals service centers under the following trade names:
| | |
Trade Name | | No. of
Locations |
Reliance Divisions | | |
Bralco Metals | | |
Bralco Metals | | 6 |
Aerotech | | 1 |
Affiliated Metals | | 1 |
Airport Metals (Australia) | | 1 |
Aerotech
| | 1 |
Olympic Metals | | 1 |
Central Plains Steel Co. | | 1 |
MetalCenter | | 1 |
Reliance Metalcenter | | 8 |
Reliance Steel Company | | 2 |
Tube Service Co. | | 6 |
All Metal Services | | |
All Metal Services Ltd. (China) | | 1 |
All Metal Services France | | 1 |
All Metal Services Limited (United Kingdom) | | 5 |
All Metal Services (Malaysia) Sdn. Bhd. | | 1 |
Allegheny Steel Distributors, Inc. | | 1 |
Aluminum and Stainless, Inc.
| | 2 |
American Metals Corporation | | |
American Metals | | 2 |
American Steel | | 2 |
Alaska Steel Company | | 3 |
Haskins Steel Co., Inc. | | 1 |
Lampros Steel | | 3 |
AMI Metals, Inc. | | |
AMI Metals | | 6 |
AMI Metals UK, Limited | | 12 |
AMI Metals Europe (Belgium) | | 1 |
AMI Metals France | | 1 |
AMI Metals Aero Services Ankara Havacılık Anonim Şirketi (Turkey) | | 1 |
Best Manufacturing, Inc. | | 1 |
CCC Steel, Inc. | | |
CCC Steel | | 1 |
IMS Steel Co. | | 1 |
Chapel Steel Corp. | | |
Chapel Steel Corp. | | 5 |
Chapel Steel Canada, Ltd. | | 1 |
Chatham Steel Corporation | | 5 |
Clayton Metals, Inc. | | 3 |
Continental Alloys & Services Inc. | | |
Continental Alloys & Services | | 4 |
Continental Alloys & Services, Inc. (Canada) | | 1 |
Continental Alloys & Services Middle East FZE (Dubai) | | 1 |
Continental Alloys & Services (Malaysia) Sdn. Bhd. | | 1 |
Continental Alloys & Services Pte. Ltd. (Singapore) | | 1 |
1 | | |
Trade Name | | No. of
Locations |
Crest Steel Corporation | | 1 |
Delta Steel, Inc. | | |
Delta Steel | | 76 |
Smith Pipe & Steel Company | | 1 |
Diamond Manufacturing Company | | |
Diamond Manufacturing | | 3 |
Ferguson Perforating Company | | 2 |
McKey Perforating Co. | | 1 |
McKey Perforated Products Co. | | 1 |
Perforated Metals Plus | | 1 |
Durrett Sheppard Steel Co., Inc. | | 1 |
Earle M. Jorgensen Company | | |
Earle M. Jorgensen | | 31 |
Earle M. Jorgensen (Malaysia) Sdn. Bhd. | | 1 |
Encore Metals USA | | 32 |
Steel Bar | | 1 |
Everest Metals (Suzhou) Co., Ltd.
| | 1 |
Feralloy Corporation | | |
Feralloy | | 3 |
Acero Prime S. de R.L. de C.V. (60%-owned) | | 34 |
Feralloy Processing Company (51%-owned) | | 1 |
FP Structural Solutions (70%-owned)
| | 1 |
GH Metal Solutions, Inc. | | 34 |
Indiana Pickling and Processing Company (56%-owned) | | 1 |
Oregon Feralloy Partners (40%-owned) | | 1 |
Fox Metals and Alloys, Inc. | | 1 |
Infra-Metals Co. | | |
Infra-Metals | | 6 |
Athens Steel | | 1 |
Infra-Metals / IMS Steel | | 2 |
Liebovich Bros., Inc. | | |
Liebovich Steel & Aluminum Company | | 35 |
Custom Fab Company | | 1 |
Good Metals | | 1 |
Hagerty Steel & Aluminum Company | | 2 |
Metalweb Limited | | 5 |
Metals USA, Inc. | | |
Eagle Steel Products, Inc. (45%-owned) | | 1 |
Gregor Technologies | | 1 |
Lynch Metals | | 2 |
Metals USA | | 3124 |
Ohio River Metal Services | | 1 |
Port City Metal Services | | 1 |
The Richardson Trident Company, LLC | | 53 |
National Specialty Alloys, Inc. | | |
National Specialty Alloys | | 3 |
Aleaciones Especiales de Mexico, S. de R.L. de C.V. | | 1 |
Northern Illinois Steel Supply Co. | | 1 |
Pacific Metal Company | | 6 |
PDM Steel Service Centers, Inc. | | |
PDM Steel Service Centers | | 98 |
Feralloy PDM Steel Service | | 1 |
Phoenix Corporation | | |
Phoenix Metals Company | | 1312 |
Aluminum and Stainless | | 2 |
| | |
Trade Name | | No. of
Locations |
Precision Flamecutting and Steel, Inc. | | 1 |
Precision Strip, Inc. | | 1213 |
Reliance Metalcenter Asia Pacific Pte. Ltd. (Singapore) | | 1 |
Reliance Metals Canada Limited | | |
Earle M. Jorgensen (Canada) | | 5 |
Encore Metals | | 45 |
Team Tube | | 5 |
Service Steel Aerospace Corp. | | |
Service Steel Aerospace | | 23 |
Dynamic Metals International | | 1 |
United Alloys Aircraft Metals | | 1 |
Siskin Steel & Supply Company, Inc. | | |
Siskin Steel | | 54 |
East Tennessee Steel Supply Company | | 1 |
Sunbelt Steel Texas, Inc. | | 2 |
Sugar Steel Corporation | | 2 |
Toma Metals, Inc.
| | 1 |
Tubular Steel, Inc. | | |
Tubular Steel | | 76 |
Metalcraft Enterprises, Inc. | | 1 |
Valex Corp. | | |
Valex | | 1 |
Valex China Co., Ltd. | | 1 |
Valex Korea Co., Ltd. (95%-owned) | | 1 |
Viking Materials, Inc. | | 2 |
Yarde Metals, Inc. | | 8 |
Operational Strategy
Our executive officers maintain a control environment that is focused on integrity and ethical behavior, establish general policies and operating guidelines and monitor adherence to proper financial controls, while our division managers and subsidiary officers have autonomy with respect to day‑to‑day operations. This balanced yet entrepreneurial management style has enabled us to improve our safety performance and the productivity and profitability of both our acquired businesses and of our existing operations. Key management personnel are eligible for incentive compensation based, in part, on the profitability of their particular division or subsidiary and, in part, on the Company’s overall profitability.
Safety is our top priority and an important element of our day-to-day operational focus. We serveseek to increase profitability through improvements in our customers primarily by providing quick delivery, metals processingcustomer service, operational efficiencies, pricing discipline, and inventory management services. We purchase a variety of metals from primary producers and sell these products in small quantities based on our customers’ needs. We performed metals processing services, or first‑stage processing, on approximately 47% of our sales orders in 2015 before delivering the products to our customers. Over the past few years we have steadilyas well as by providing increased our percentage of orders with processing performed from a more traditional level of 40% because of increased demand for processing services by our customers in addition to acquisitions of companies that provide a higher levellevels of value-added processing. For approximately 40% ofWe continue to adjust our 2015 orders, we delivered the metalbusiness practices to leverage our size and gain efficiencies which contribute to our customer within 24 hours from receipt of the order. These services save our customers time, labor, and expense and reduce their overall manufacturing costs. During 2015, we handled approximately 5,647,000 transactions in total or an average of 22,350 transactions per business day, with an average price of approximately $1,660 per transaction. Our 2015 net sales were $9.35 billion.profitability. We believe that we have an excellent reputation in the industry and are known for our focus on small orders with quick turnaround differentiates us from manyintegrity and the quality and timeliness of the other large metals service center companies and allows us to better service our customers, resulting in higher profits than those generated by the other large metals service center companies.service.
Historically, we have expanded through both acquisitions and internal growth. Since our initial public offering in September 1994, we have successfully purchased 6063 businesses, including our recentthe acquisition of Tubular Steel, Inc. (“TSI”)Ferguson Perforating Company in January 2016.2017. Our internal growth activities during the last few years, which are supported by our capital expenditures, have been at historically high levels for us and have included the opening of new facilities, adding to our processing capabilities and relocating existing operations to larger, more efficient facilities. Our investments in processing equipment have allowed us to increase the percentagerange of value-added services that we provide to our customers and increase our efficiency, which supports increasedwe believe has contributed to our recent gross profit margins andmargin improvements. These investments also differentiate us from our competitors allowingand have allowed us to increase our market share. We will continue to evaluate acquisition opportunities and we expect to continue to grow our business through acquisitions and internal growth initiatives, particularly those that will diversify our products, customer base and geographic locations.locations and increase our sales of specialty products and high margin, value-added processing.
Customers and Markets
Our customers purchase from us and other metals service centers to obtain value‑added metals processing, readily available inventory, reliable and timely delivery, flexible minimum order size and quality control. Many of our customers deal exclusively with service centers because the quantities of metal products that they purchase are smaller than the minimum order sizes specified by mills, because those customers require intermittent deliveries over long or irregular time periods, or because those customers require specialized processing services. We believe that metals service centers have also enjoyed an increase in services requested by their customers due to the focus of the capital goods and other manufacturing industries on just‑in‑time inventory management and outsourcing of materials management and metals processing. Due to technology advancements in metals processing equipment, metals service centers that have invested in new processing equipment are able to provide higher quality levels to their customers.
We have more than 125,000 customers in a variety of industries, including general manufacturing, non‑residential construction (including infrastructure), transportation (rail, truck trailer and shipbuilding), aerospace and defense, energy (oil and gas), electronics and semiconductor fabrication, and heavy industry (agricultural, construction and mining equipment). We also service the auto industry, primarily through our toll processing operations where we do not take ownership of the metal.
Although we sell directly to many large original equipment manufacturer (“OEM”) customers, the majority of our sales are to small machine shops and fabricators, in small quantities with frequent deliveries, helping them manage their working capital and credit needs more efficiently. Our metals service centers wrote and delivered over 5,567,000 orders during 2017 or an average of 22,150 per day, with an average price of approximately $1,740 per order. Most of our metals service center customers are located within a 200‑mile radius of the Reliance metals service center serving them. The proximity of our service centers to our customers helps us provide just‑in‑time delivery and increases the likelihood of repeat business. In 2017, approximately 97% of our orders were from repeat customers. With our fleet of approximately 1,700 trucks (some of which are leased), we are able to service many smaller customers and provide quick turnaround deliveries. We believe that maintaining our own fleet of trucks and drivers provides a competitive advantage in the current environment where it is becoming increasingly more difficult to contract with third party carriers. Moreover, our computerized order entry systems and flexible production scheduling enable us to meet customer requirements for short lead times and just‑in‑time delivery. We believe that our long‑term relationships with many of our customers significantly contribute to the success of our business. Providing prompt and efficient services and quality products at reasonable prices are important factors in maintaining and expanding these relationships.
Our acquisitions in recent years have increased our international exposure from both a customer and physical location perspective. In addition, we have built and opened international locations in recent years to service specific industries, typically to support existing key customers that are operating in those international markets. Net sales of our international locations (based on where the shipments originated) accounted for approximately 9% of our consolidated 2017 net sales, or $873.7 million. However, our net sales to international customers (based on the shipping destination) were approximately 11% of our consolidated 2017 net sales or $1.1 billion, with approximately 23% of these sales, or $258.2 million, to Canadian customers.
Customer demand may change from time to time based on, among other things, general economic conditions and industry capacity. Many of the industries in which our customers compete are cyclical in nature. Because we sell to a wide variety of customers in a wide variety of industries, we believe that we are able to somewhat mitigate earnings volatility. In addition, many of our customers are small job shops and fabricators who also have a diverse customer base and the versatility to service different end markets when an existing market slows. Given our business model and focus on small, quick turnaround orders, we primarily operate in the spot market for both the purchase and sale of our products. As we have limited contractual business, this enables us to better pass on higher metal prices to our customers and maintain consistency in our gross profit margin.
Due to our focus on small orders, decentralized operating structure and the diversity of the markets we serve, customer concentrations are not significant. Our largest customer represented only 1.1% of our net sales in 2017. In 2017, we had only 23 customers with sales greater than $25 million.
The geographic breakout of our sales based on the location of our metals service center facilities in each of the three years ended December 31 was as follows:
| | | | | | | | |
| 2017 | | | 2016 | | | 2015 | |
Midwest | 32 | % | | 32 | % | | 31 | % |
West/Southwest | 22 | % | | 22 | % | | 23 | % |
Southeast | 18 | % | | 17 | % | | 18 | % |
International | 9 | % | | 9 | % | | 8 | % |
Mid-Atlantic | 6 | % | | 7 | % | | 7 | % |
Northeast | 6 | % | | 6 | % | | 6 | % |
Pacific Northwest | 4 | % | | 4 | % | | 4 | % |
Mountain | 3 | % | | 3 | % | | 3 | % |
Total | 100 | % | | 100 | % | | 100 | % |
See Note 16 — “Segment information” of Part II, Item 8 “Financial Statements and Supplementary Data” for further information on U.S. and foreign revenues and assets.
Suppliers
We primarily purchase our inventory from the major domestic metals producers, which we also refer to as mills. We do, however, also purchase limited amounts of certain products from foreign producers. We have multiple suppliers for all of our products. Our major suppliers of domestic carbon steel products include AK Steel; ArcelorMittal; California Steel Industries, Inc.; Commercial Metals Company; Evraz NA; Gerdau; NLMK USA; Nucor Corporation; Steel Dynamics, Inc.; SSAB; United States Steel Corporation; and Zekelman Industries. AK Steel, Allegheny Technologies Incorporated, North American Stainless, Outokumpu and Universal Stainless are our major suppliers of stainless steel products. We are a recognized distributor for various major aluminum companies, including Aleris International, Inc.; Arconic Inc.; Constellium N.V.; Hydro; and Kaiser Aluminum Corp. Our major suppliers of alloy products include ArcelorMittal; Carpenter Technologies; Gerdau; Nucor Corporation; and TimkenSteel Corporation.
Because of our total volume of purchases and our long‑term relationships with our suppliers, we believe that we are generally able to purchase inventory at the best prices offered by our suppliers. We believe that these relationships provide us an advantage in our ability to source product and have it available for our customers in accelerated timeframes when needed, and also allows us to more efficiently manage our inventory. We believe that we are not dependent on any one supplier for our metal inventory. We believe both our size and our long-term relationships with our suppliers continue to be important because mill consolidation has reduced the number of suppliers.
Backlog
Because of the just‑in‑time delivery and the short lead‑time nature of our business, we do not believe information on our backlog of orders is meaningful to an understanding of our business.
Capital Expenditures
We maintained our focus on internal growth in 20152017 by opening new facilities, building or expanding existing facilities and adding processing equipment with total capital expenditures of $172.2 million.$161.6 million, with the majority growth-related. Our 20162018 capital expenditure budget is our largest ever at approximately $180$225 million, much of which is again related to internal growth activities comprised of purchases of equipment and new facilities along with expansions of existing facilities.facilities and also includes about $40 million of projects that were included in our 2017 budget, but not completed. This reflects our confidence in our long‑term prospects; however, we will continue to evaluate and execute each growth project and consider the economic conditions and outlook at the time of investment. We estimate our maintenance capital expenditures at approximately $60$80 to $80$90 million annually, which allows us to significantly reduce our capital expenditures if and when necessary.
Operational Strategy
Our executive officers maintaineconomic conditions warrant a control environment that is focused on integrity and ethical behavior, establish general policies and operating guidelines and monitor adherencemore conservative approach to proper financial controls, while our division managers and subsidiary officers have autonomy with respect to day‑to‑day operations. This balanced yet entrepreneurial management style has enabled us to improve the productivity and profitability both of acquired businesses and of our own expanded operations. Key management personnel are eligible for incentive compensation based, in part, on the profitability of their particular division or subsidiary and, in part, on the Company’s overall profitability.strategic allocation.
We seek to increase profitability through improvements in our customer service and operational efficiencies, as well as through profitable growth by expanding our existing operations and acquiring businesses that diversify or enhance our customer base, product range, processing services and geographic coverage. We also continue to adjust our business practices to leverage our size and gain efficiencies which contribute to our profitability. We believe that we have an excellent reputation in the industry and are known for our integrity and the quality and timeliness of our service to customers.
Customers and Markets
Our customers purchase from us and other metals service centers to obtain value‑added metals processing, readily available inventory, reliable and timely delivery, flexible minimum order size and quality control. Many of our customers deal exclusively with service centers because the quantities of metal products that they purchase are smaller than the minimum orders specified by mills, because those customers require intermittent deliveries over long or irregular time periods, or because those customers require specialized processing services. We believe that metals service centers have also enjoyed an increasing share of total metal shipments due to the focus of the capital goods and other manufacturing industries on just‑in‑time inventory management and outsourcing of materials management and metals processing.
We have more than 125,000 customers in a variety of industries, including general manufacturing, non‑residential construction, transportation (rail, truck trailer and shipbuilding), aerospace, energy, electronics and semiconductor fabrication, and heavy industry (agricultural, construction and mining equipment). We also service the auto industry, primarily through our toll processing operations where we do not take ownership of the metal.
Although we sell directly to many large original equipment manufacturers (“OEM”s) customers, the majority of our sales are to small machine shops and fabricators, in small quantities with frequent deliveries, helping them manage their working capital and credit needs more efficiently. Our metals service centers wrote and delivered over 5,647,000 orders during 2015 at an average price of approximately $1,660 per order. Most of our metals service center customers are located within a 200‑mile radius of the Reliance metals service center serving them. The proximity of our service centers to our customers helps us provide just‑in‑time delivery and increases the likelihood of repeat business. In 2015, approximately 97% of our orders were from repeat customers. With our fleet of approximately 1,750 trucks (some of which are leased), we are able to service many smaller customers and provide quick turnaround deliveries. Many of our competitors have struggled recently due to shortages in the availability of both trucks and qualified drivers to deliver products. Moreover, our computerized order entry systems and flexible production scheduling enable us to meet customer requirements for short lead times and just‑in‑time delivery. We believe that our long‑term relationships with many of our customers significantly contribute to the success of our business. Providing prompt and efficient services and quality products at reasonable prices are important factors in maintaining and expanding these relationships.
Our acquisitions in recent years have increased our international exposure both from a customer and physical location perspective. In addition, we have built and opened international locations in recent years to service specific industries, typically to support existing key customers that are operating in those international markets. Net sales of our international locations (based on where the shipments originated) accounted for approximately 8% of our consolidated 2015 net sales, or $732.8 million. However, our net sales to international customers (based on the shipping destination) were approximately 11% of our consolidated 2015 net sales or $985.3 million, with approximately 31% of these sales, or $308.5 million, to Canadian customers. See Note 16 — “Segment information” of Part II, Item 8 "Financial Statements and Supplementary Data" for further information on U.S. and foreign revenues and assets.
Customer demand may change from time to time based on, among other things, general economic conditions and industry capacity. Many of the industries in which our customers compete are cyclical in nature. Because we sell to a wide variety of customers in a variety of industries, we believe that the effect of such changes on us is significantly reduced. In addition, many of our customers are small job shops and fabricators who also have a diverse customer base and have the versatility to service different end markets when an existing market slows.
The diversity of our customer base somewhat reduces the impact of any single customer, as our largest customer represented only 1.1% of our net sales in 2015. We had only 24 customers to whom our 2015 annual sales were greater than $25 million.
The geographic breakout of our sales based on the location of our metals service center facilities in each of the three years ended December 31 was as follows:
| | | | | | | | |
| 2015 | | | 2014 | | | 2013 | |
Midwest | 31 | % | | 30 | % | | 28 | % |
Southeast | 18 | % | | 18 | % | | 18 | % |
West/Southwest | 14 | % | | 17 | % | | 18 | % |
California | 9 | % | | 9 | % | | 10 | % |
International | 8 | % | | 6 | % | | 6 | % |
Mid-Atlantic | 7 | % | | 7 | % | | 6 | % |
Northeast | 6 | % | | 6 | % | | 7 | % |
Pacific Northwest | 4 | % | | 4 | % | | 4 | % |
Mountain | 3 | % | | 3 | % | | 3 | % |
Total | 100 | % | | 100 | % | | 100 | % |
Suppliers
We primarily purchase our inventory from the major domestic metals producers. We do, however, also purchase certain products from foreign producers. We have multiple suppliers for all of our products. Our major suppliers of domestic carbon steel products include ArcelorMittal; California Steel Industries, Inc.; Evraz NA; Gerdau; Nucor Corporation; Steel Dynamics, Inc.; SSAB; and United States Steel Corporation. AK Steel, Allegheny Technologies Incorporated, North American Stainless and Outokumpu are our major suppliers of stainless steel products. We are a recognized distributor for various major aluminum companies, including Alcoa Inc.; Aleris International, Inc.; Constellium N.V. ; Kaiser Aluminum Corp.; Novelis Inc.; and Sapa Group. Our major suppliers of alloy products include The Timken Company, Gerdau, and Nucor Corporation.
Because of our total volume of purchases and our long‑term relationships with our suppliers, we believe that we are generally able to purchase inventory at the best prices offered by our suppliers. We believe that these relationships provided us an advantage in our ability to source product and have it available for our customers in accelerated timeframes when needed, and also allows us to more efficiently manage our inventory. We believe that we are not dependent on any one supplier for our metal inventory. We believe both our size and our long-term relationships with our suppliers continue to be important because mill consolidation has reduced the number of suppliers.
In 2014 and 2015 the domestic mills have lost market share to import material as historically high levels of metal are being imported into the U.S. Because of this, mill prices are at low levels and many mills have reduced capacity and as a group operated at a capacity of about 70% in 2015. Trade actions on many carbon steel products were filed in 2015 and a stainless steel action was filed in early 2016. We view these actions as helpful to the market, but believe that we will continue to see high levels of imports and pressure on metals pricing given the strength of the U.S. dollar and weak global markets.
Backlog
Because of the just‑in‑time delivery and the short lead‑time nature of our business, we do not believe information on our backlog of orders is material to an understanding of our business.
Products and Processing Services
We provide a wide variety of processing services to meet our customers’ specifications and deliver products to fabricators, manufacturers and other end users. We maintain a wide variety of products in inventory, and believe this differentiates us from all other North American service centers. A substantial portionApproximately half of our orders do not require extensive or specialized processing allowing delivery to the customer within 24 hours of receiving the order. This provides a competitive advantage to us, and, for the remainder of our orders we typically have shorter lead times than our competitors given our decentralized structure and investments in processing equipment. Our product mix has changedbecome more diverse mainly as a
result of our targeted growth strategy to acquire companies with specialized inventory and provide increased levels of value-added processing services. In addition, we have invested over $1 billion in capital expenditures in the six-year period ended December 31, 2017, with approximately 50% spent on processing equipment. We have increased our investments in processing equipment due to our existing and potential customers requesting higher levels of value-added processing, which has contributed to increases in our profitability. We currently perform processing services for 48% of our orders compared to our historical level of 40%. We believe our investments in state-of-the-art processing equipment and focus on maintaining pricing discipline related to our processing services were significant contributors to our substantial increases in gross profit margin over the past few years. We also believe our enhanced processing capabilities have allowed us to increase our market share, especially for higher-margin products and services. Flat‑rolled carbon steel products (i.e., hot‑rolled, cold‑rolled and galvanized steel sheet and coil), which generally have the most volatile and competitive pricing, accounted for only 15% of our 20152017 sales.
Our sales dollars by product type as a percentage of total sales in each of the three years ended December 31 were as follows:
| | | | | | | | | | | | | | |
| 2015 | | 2014 | | 2013 | | | 2017 | | 2016 | | 2015 | | |
| 12 | % | 13 | % | 12 | % | carbon steel plate | 11 | % | 10 | % | 12 | % | carbon steel plate |
| 10 | % | 10 | % | 10 | % | carbon steel structurals | 10 | % | 10 | % | 10 | % | carbon steel structurals |
| 8 | % | 8 | % | 9 | % | carbon steel tubing | 10 | % | 10 | % | 8 | % | carbon steel tubing |
| 7 | % | 9 | % | 8 | % | carbon steel bar | 7 | % | 6 | % | 6 | % | hot-rolled steel sheet and coil |
| 6 | % | 7 | % | 7 | % | hot-rolled steel sheet and coil | 6 | % | 7 | % | 7 | % | carbon steel bar |
| 5 | % | 4 | % | 4 | % | galvanized steel sheet and coil | 5 | % | 6 | % | 5 | % | galvanized steel sheet and coil |
| 4 | % | 3 | % | 3 | % | cold-rolled steel sheet and coil | 3 | % | 3 | % | 4 | % | cold-rolled steel sheet and coil |
Carbon Steel | 52 | % | 54 | % | 53 | % | | 52 | % | 52 | % | 52 | % | |
| | | | | | | | | | | | | | |
| 6 | % | 5 | % | 5 | % | aluminum bar and tube | 7 | % | 7 | % | 6 | % | heat-treated aluminum plate |
| 6 | % | 4 | % | 4 | % | heat-treated aluminum plate | 6 | % | 6 | % | 6 | % | aluminum bar and tube |
| 5 | % | 4 | % | 4 | % | common alloy aluminum sheet and coil | 4 | % | 5 | % | 5 | % | common alloy aluminum sheet and coil |
| 1 | % | 1 | % | 1 | % | common alloy aluminum plate | 1 | % | 1 | % | 1 | % | common alloy aluminum plate |
| 1 | % | 1 | % | 1 | % | heat-treated aluminum sheet and coil | 1 | % | 1 | % | 1 | % | heat-treated aluminum sheet and coil |
Aluminum | 19 | % | 15 | % | 15 | % | | 19 | % | 20 | % | 19 | % | |
| | | | | | | | | | | | | | |
| 6 | % | 6 | % | 7 | % | stainless steel bar and tube | 6 | % | 6 | % | 6 | % | stainless steel bar and tube |
| 6 | % | 6 | % | 5 | % | stainless steel sheet and coil | 6 | % | 6 | % | 6 | % | stainless steel sheet and coil |
| 2 | % | 2 | % | 2 | % | stainless steel plate | 2 | % | 2 | % | 2 | % | stainless steel plate |
Stainless Steel | 14 | % | 14 | % | 14 | % | | 14 | % | 14 | % | 14 | % | |
| | | | | | | | | | | | | | |
| 4 | % | 5 | % | 6 | % | alloy bar and rod | 4 | % | 3 | % | 4 | % | alloy bar and rod |
| 2 | % | 3 | % | 3 | % | alloy tube | 1 | % | 1 | % | 2 | % | alloy tube |
| 1 | % | 1 | % | 1 | % | alloy plate, sheet and coil | 1 | % | 1 | % | 1 | % | alloy plate, sheet and coil |
Alloy | 7 | % | 9 | % | 10 | % | | 6 | % | 5 | % | 7 | % | |
| | | | | | | | | | | | | | |
| 3 | % | 2 | % | 2 | % | toll processing of aluminum, carbon steel and stainless steel | 4 | % | 4 | % | 3 | % | toll processing — aluminum, carbon steel and stainless steel (1) |
| 5 | % | 6 | % | 6 | % | miscellaneous, including brass, copper and titanium | 5 | % | 5 | % | 5 | % | miscellaneous, including brass, copper, titanium, manufactured parts and scrap |
Other | 8 | % | 8 | % | 8 | % | | 9 | % | 9 | % | 8 | % | |
| | | | | | | | | | | | | | |
Total | 100 | % | 100 | % | 100 | % | | 100 | % | 100 | % | 100 | % | |
(1) Includes revenues for logistics services provided by our toll processing companies.
We are not dependent on any particular customer group or industry because we process and distribute a variety of metals. This diversity of product type and material reduces our exposure to fluctuations or other weaknesses in the financial or economic stability of particular customers or industries. We are also less dependent on any particular suppliers as a result of our product diversification.
For sheet and coil products, we purchase coiled metal from primary producers in the form of a continuous sheet, typically 36 to 60 inches wide, between 0.015 and 0.25 inches thick, and rolled into 3‑to-20 ton coils. The size and weight of these coils require specialized equipment to move and process the material into smaller sizes and various products. Many of the other products that we carry also require specialized equipment for material handling and processing. FewWe believe few of our customers have the capability to process the metal into the desired sizes or the capital available to acquire the necessary equipment.
We believe that few metals service centers offer the broad range of processing services and metals that we provide. In addition to a focus on growing our revenues from specialty products, we have also enhanced the level of value‑added
processing services we provide through recent acquisitions and significant investments in new equipment over the past few years. For example, we have made significant investments in facilities and equipment due to the increased demand for our products sold to the aerospace market and toll processing aluminum for the automotive industry.
After receiving an order, we enter it into one of our computerized order entry systems, select appropriate inventory and schedule processing to meet the specified delivery date. In 2015,2017, we delivered approximately 40% of our orders within 24 hours of the customer placing the order with us. We attempt to maximize the yield from the various metals that we process by combining customer orders to use each product that we purchase to the fullest extent practicable.
We believe that few metals service centers offer the broad range of processing services and metals that we provide. In addition to a focus on growing in specialty products, we have also enhanced the level of value‑added services with recent acquisitions and significantly upgraded and expanded our processing capabilities with significant investments in new equipment over the past few years, in particular for our businesses servicing the aerospace market and toll processing aluminum for the automotive industry.
In 2015,2017, we performed processing services for approximately 47%48% of our sales orders. Our primary processing services range from cutting, leveling or sawing to completemore complex processes such as machining or electropolishing. Throughout our service centers we perform most processes provided in the industry, without encroaching upon the services performed by our customers. As part of our growth strategy, we have been expanding into higher value‑added services, including certain fabrication processes in markets whereas requested by our customers are requesting that service centers provide these services.customers.
We generally only process specific metals to non‑standard sizes pursuant to customer purchase order specification. In addition, we typically acquire standard size and grade products that can be processed into many different sizes to meet the needs of many different customers. We do not maintain a significant inventory of finished products, but we carry a wide range of metals to meet our customers’ short lead time and just‑in‑time delivery requirements. Our metals service centers maintain inventory and equipment selected to meet the needs of that facility’s customers. We work with our customers to understand their needs and identify areas where we can provide additional value, increasing our importance to them.
Sales and Marketing
As of December 31, 2015,2017, we had approximately 2,0802,090 sales personnel located in 44 states in the U.S. and 13 other countries providing sales and marketing services throughout each of those areas, as well as nearby locations. Theareas. Our sales personnel market and sell our products and services and we believe that our sales force has extensive product, service, market and customer knowledge. Sales personnel are organized by division or subsidiary among our profit centers and are divided into two groups. Our outsideOutside sales personnel travel throughout a specified geographic territory and maintain relationships with our existing customers and develop new customers. Inside sales personnel remain at the facilities to price and write orders. In addition to base salary, insideOutside sales personnel generally receive incentive compensation based on the gross profit from their particular geographic territories. Inside sales personnel generally receive incentive compensation based on the gross profit and/or pre‑tax profit of their particular profit center. Outside sales personnel generally receive incentive compensation based on the gross profit from their particular geographic territories.location.
Our business is very relationship based and because of that, we operate under many different trade names. We acquire well-run businesses with strong customer relationships and solid reputations within the marketplace. Because of this, we find value in the acquired trade name and continue to use the business name and maintain the customer relationships.
Competition
The metals distributionservice center industry is highly fragmented and competitive. We have numerous competitors in each of our product lines and geographic locations, and competition is most frequently local or regional. Our domestic service center competitors are generally smaller than we are, but we also face strong competition from national, regional and local independent metals distributors and the producers themselves, some of which have greater resources than we do. In their January 2016May 2017 report on the metals wholesaling industry, IBISWorld Inc. estimated that in 20152017 there were approximately 10,100 metal wholesale locations in the United States operated by approximately 7,4007,100 companies. Nevertheless, the fourfive largest U.S. metals service center companies are expected to represent less thanjust over 10% of the estimated industry revenue in 2016. Based on the estimated 2015 metals wholesaling industry revenue of $202.2 billion,2017. IBISWorld Inc. estimates our 2017 U.S. revenues of $8.62 billion in 2015 accountedto account for approximately 4.3%only about 4.8% of the entire U.S. market. We believe we are the largest North American (U.S. and Canada) metals service center company on a revenue basis.
We compete with other companies on price, service, quality, processing capability and availability of products.products and services. We maintain relationships with our major suppliers at the executive and local levels. We believe that this division of responsibility has increased our ability to obtain competitive prices of metals by leveraging our total size and to provide more responsive service to our customers by allowing our local management teams to make the purchasing decisions. In addition, we believe that the size of our inventory, the diversity of metals and products we have available, and the wide variety
of processing services we can provide distinguish us from our competition. We believe that our competitors are generally unable to offer the same high quality products and services we provide using state-of-the-art processing equipment as they do not have the financial ability or risk tolerance to grow their businesses and it is difficult for them to compete with our state-of-the-art processing equipment.at the same rate as Reliance. We believe that we have increased our market share during recent years due to our strong financial condition, ourthe high quality of products and services fromwe are able to offer as a result of our significant investments in our equipment andacquired businesses, facilities and our acquisitions,equipment, as well as our continued focus on small order sizes with quick turnaround.
Quality Control
Procuring high quality metal from suppliers on a consistent basis is critical to our business. We have instituted strict quality control measures to assure that the quality of purchased raw materials will enable us to meet our customers’ specifications and to reduce the costs of production interruptions. In certain instances, we perform physical and chemical analyses on selected raw materials, typically through a third party testing lab, to verify that mechanical and dimensional properties, cleanliness and surface characteristics meet our requirements and our customers’ specifications. We also conduct certain analyses of surface characteristics on selected processed metal before delivery to the customer. We believe that maintaining high standards for accepting metals ultimately results in reduced return rates from our customers.
We maintain various quality certifications throughout our operations. Approximately 60%55% of our operating locations are ISO 9001:2008 or ISO 9001:2015 certified. Many of our locations maintain additional certifications specific to the industries they serve, such as aerospace, auto, nuclear, and others, including certain international certifications.
Systems
A common financial reporting system, as well as certain other accounting, tax and HRIShuman resources systems are used company‑wide. However, we maintain various transactional software applications across our operations that meet the individual needs of those operations. Generally, these localized systems provide information in real time, such as inventory availability, location and cost and may be customized with features to accommodate the products the respective operations carry and services they provide, automated equipment interfaces, or other specialized requirements. With this information, our marketing and sales personnel can respond to our customers’ needs more efficiently and more effectively.
We have initiated efforts Many of our companies also provide online access to customizeour existing customers to allow them to interact with us more efficiently, and implement a common ERP platform across our operating companies, in orderalso provide the ability for potential customers to maximize functionalitymake inquiries and efficiencies across the organization, while also reducing risk. We are also evaluating tools to assist us in efforts to consolidate data more efficiently. These are multi‑phased, multi‑year projects that will be pursued and implemented in a manner to limit both operational and financial risk.place orders.
Government Regulation
Our metals service centers are subject to many foreign, federal, state and local requirements to protect the environment, including hazardous waste disposal and underground storage tank regulations. The only hazardous substances that we generally use in our operations are lubricants, cleaning solvents and petroleum for fueling our trucks. We pay state‑certified private companies to haul and dispose of our hazardous waste.
Our operations are also subject to laws and regulations relating to workplace safety and worker health, principally the Occupational Safety and Health Act and related regulations, which, among other requirements, establish noise, dust and safety standards. We maintain comprehensive health and safety policies and encourage our employees to follow established safety practices. Safety of our employees and others is critical to our success. We continue to expand and improve our internal safety resources, which has contributed positively to our safety metrics and financial results. We encourage social well‑being by instituting these high quality labor, health and safety standards. We do not anticipate that continued compliance with such laws and regulations will have a material adverse effect on our results of operations or financial condition.
We are subject to the conflict mineral provisions of the Dodd‑Frank Wall Street Reform and Consumer Protection Act of 2010. We are required to undertake due diligence, disclose and report whether the products we sell originate from the Democratic Republic of Congo and adjoining countries. We verify with our suppliers the origins of all metals used in our products.
We sell metals to foreign customers and otherwise operate abroad, subjecting us to various countries’ trade regulations concerning the import and export of materials and finished products. Our operations are subject to the laws and regulations of the jurisdictions in which we conduct our business that seek to prevent corruption and bribery in the marketplace, including the United States’ Foreign Corrupt Practices Act (the “FCPA”) and the United Kingdom’s Bribery Act 2010. We have developed and implemented company‑wide export and anti‑corruption policies designed to provide our employees clear statements of our compliance requirements and to ensure compliance with applicable export and anti‑corruption regulations. For information about risks related to government regulation, please see the risk factors set forth under the caption “Item 1A. Risk“Risk Factors” including the Risk Factors captioned “We are subject to various environmental, employee safety and health and customs and export laws and regulations, which could subject us to significant liabilities and compliance expenditures;” “We operate internationally and are subject to exchange rate fluctuations, exchange controls, political risks and other risks relating to international operations;” and “Our international operations continue to expand, exposing us to additional risks.”
Environmental
Some of the properties we own or lease are located in industrial areas with histories of heavy industrial use. We may incur some environmental liabilities because of the location of these properties. In addition, we are currently involved with a certain environmental remediation projectsproject related to activities at former manufacturing operations of Earle M. Jorgensen Company (“EMJ”), our wholly owned subsidiary, that were sold many years prior to Reliance’s 2006 acquisition of EMJ. Although the potential cleanup costs could be significant, EMJ maintained insurance policies during the time they owned the manufacturing operations that have covered substantially all of our expenditures related to this matter to date, and are expected to continue to cover the majority of the related costs. We do not expect that these obligations will have a material adverse impact on our financial position, results of operations or cash flows.
We believe that all scrap metal produced by our operations is recycled by the independent scrap metal companies and producers to whom we sell our scrap metal. We continue to evaluate and implement energy conservation and other initiatives to reduce pollution and improve our environmental impact. Enactment of more stringent environmental regulations could have an adverse impact on our financial results.
Although we have implemented policies and procedures to comply with these regulations, we cannot guarantee that we will not incur any violations and resulting penalties from such activity.
Corporate Responsibility
Sustainability
We are committed to mitigating the impact our products and operations have on the environment. As an operator of metals service centers, our day-to-day business consists of the sale, distribution and processing of a broad variety of metal products sourced from numerous primary metal producers. The majority of our orders are basic distribution with no processing services performed. For the remainder of our sales orders, we perform “first‑stage” processing, which does not require significant amounts of energy or toxic or hazardous materials as we are simply cutting the metal to size. Our operations, by their nature, do not emit significant amounts of carbon dioxide or other greenhouse gases or have a significant impact on the environment.
As part of our commitment to environmental sustainability, we:
| · | | purchase significant volumes of metal produced in electric arc furnaces that consume recycled material; |
| · | | sell scrap material generated in our operations to recyclers; |
| · | | use propane fuel to operate forklifts and have installed natural and energy efficient lighting in many of our operations; and |
| · | | utilize energy efficient diesel tractors that consume less fuel and reduce emissions for the majority of our trucking fleet. |
Community Programs
Reliance is committed to investing in and enriching the communities in which we live and work. We support a variety of organizations and community programs including:
| · | | Veterans support— We are supporters of a non-profit organization that provides veterans and transitioning services members with advanced manufacturing training and industry-recognized certification for careers in welding, machining, and fabrication at no cost to them. Since 2013, Reliance has partnered with this organization through financial sponsorship, donations of metals for their training courses, and hiring this organization’s graduates. For the past four years, we have also participated in a national program focused on supporting enlisted members of the Armed Forces and their families. |
| · | | Reliance Cares— In 2017, we launched an employee relief fund to support our workforce of approximately 14,900 individuals across 40 states and 13 countries outside of the U.S. (“Reliance Cares”). Reliance Cares is available to any of our employees impacted by a natural disaster. In the wake of Hurricanes Harvey and Irma, in August and September 2017, we provided financial assistance to 135 employees through our Immediate Response Program. We further funded 27 grants to help our employees’ rebuilding efforts. |
| · | | Local Community Organizations— Reliance encourages our subsidiaries and divisions to engage in and initiate events serving their communities and their employees. To commend our companies for their civic contributions, Reliance matches the fundraising efforts of our subsidiaries and divisions and supports volunteer efforts by our employees. |
Employees
As of December 31, 2015,2017, we had approximately 14,00014,900 employees. Approximately 11%12% of our employees are covered by collective bargaining agreements whichthat expire at various times over the next fiveeight years. Approximately 500600 employees are covered by 23 different collective bargaining agreements that expire in 2016.2018. We have entered into collective bargaining agreements with 41 union locals at 5153 of our locations. These collective bargaining agreements have not had a material impact either favorably or unfavorably on our revenues or profitability at our various locations. We haveaim to always maintainedmaintain excellent relations with our employees.employees and have never experienced a significant work stoppage. Over the years we have experienced minor work stoppages by our employees at certain of our locations, but due to the small number of employees and the short time periods involved, these stoppages have not had a material impact on our operations. We have never experienced a significant work stoppage.
Seasonality
Some of our customers are in seasonal businesses, especially customers in the construction industry and related businesses. AsOur overall operations have not shown any material seasonal trends as a result of our geographic, product and customer diversity our overall operations have not shown any material seasonal trends.diversity. Typically, revenues in the months of July, November and December have been lower than in
other months because of a reduced number of working days for shipments of our products, resulting from vacation and extended holiday closures at some of our customers. Reduced shipping days also have a significant impact on our profitability in any particular period. We cannot assure you that period‑to‑periodpredict whether period-to-period fluctuations will be consistent with historical patterns. Results of any one or more quarters are therefore not necessarily indicative of annual results.
Available Information
We file annual, quarterly and current reports, proxy statements and other documents with the Securities and Exchange Commission (“SEC”) under the Securities Exchange Act of 1934, as amended (the “Exchange Act”).Act. The SEC maintains a website that contains reports, proxy statements and other information regarding issuers, including our Company, that file reports electronically with the SEC. The public can obtain any reports that we file with the SEC at http://www.sec.gov. You may also read and copy any document we file at
the SEC’s Public Reference Room located at 100 F Street, N.E., Washington, DC 20549. Call the SEC at 1-800-SEC-0330 for further information on the public reference room.
We also make available free of charge at ourOur Investor Relations website (is located at http://investor.rsac.com). Our annual report on Form 10-K, quarterly reports on Form 10-Q, current reports on Form 8-K and any amendments to those reports filed or furnished pursuant to Section 13(a) of the following information:Securities Exchange Act of 1934 are made available through our website as soon as reasonably practical after we electronically file or furnish the reports to the SEC. We encourage investors to visit our website.
| ·
| | Annual Report on Form 10‑K, Quarterly Reports on Form 10‑Q, Current Reports on Form 8‑K and, if applicable, amendments to those reports filed or furnished pursuant to Section 13(a) of the Exchange Act as soon as reasonably practicable after we electronically file such material with, or furnish it to, the SEC;
|
| ·
| | press releases on quarterly earnings;
|
| ·
| | announcements of investor conferences, speeches and events with archives of these events also available;
|
| ·
| | corporate governance information including our corporate governance principles, committee charters, codes of conduct and other governance‑related policies; and
|
| ·
| | other news and announcements that we may post from time to time that investors might find useful or interesting.
|
Item 1A. Risk FactorsFactors
Set forth below are the risks that we believe are material to our investors. Our business, results of operations and financial condition may be materially adversely affected due to any of the following risks. The risks described below are not the only ones we face. Additional risks of which we are not presently aware or that we currently believe are immaterial may also harm our business. This section contains forward‑looking statements. You should refer to the explanation of the qualifications and limitations on forward‑looking statements set forth at the beginning of this report.
Risks Related to Our Business and Industry
The costs that we pay for metals fluctuate due to a number of factors beyond our control, and such fluctuations could adversely affect our operating results, particularly if we cannot pass on higher metal prices to our customers.
We purchase large quantities of aluminum, carbon, alloy and stainless steel and other metals, which we sell to a variety of customers. The costs to us for these metals and the prices that we charge customers for our products may change depending on many factors outside of our control, including general economic conditions (both domestic and international), competition, production levels, raw material costs, customer demand levels, import duties and other trade restrictions, currency fluctuations and surcharges imposed by our suppliers. We attempt to pass cost increases on to our customers with higher selling prices but we may not always be able to do so, particularly when the cost increases are not demand driven. When metal prices decrease, we may not be able to replace our higher cost inventory with the lower cost metal at a rate that would allow us to maintain a consistent gross profit margin, which would reduce our profitability during that interim period.
Metal prices are volatile due to, among other things, fluctuations in foreign and domestic production capacity, raw material availability and related pricing, metals consumption, import levels into the U.S., and the strength of the U.S.
dollar relative to other currencies. Future changes in global general economic conditions or in production, consumption or export of metals could cause fluctuations in metal prices globally, which could adversely affect our profitability and cash flows. We generally do not enter into long‑term agreements with our suppliers or hedging arrangements that could lessen the impact of metal price fluctuations.
We maintain substantial inventories of metal to accommodate the short lead times and delivery requirements of our customers. Our customers typically purchase products from us pursuant to purchase orders and typically do not enter into long‑term purchase agreements or arrangements with us. Accordingly, we purchase metal in quantities we believe to be appropriate to satisfy the anticipated needs of our customers based on information derived from customers, market conditions, historic usage and industry research. Commitments for metal purchases are generally at prevailing market prices in effect at the time orders are placed or at the time of shipment. During periods of rising prices for metal, we may be negatively impacted by delays between the time of increases in the cost of metals to us and increases in the prices that we charge for our products if we are unable to pass these increased costs on to our customers. In addition, when metal prices decline, this could result in lower selling prices for our products and, as we use existing inventory that we purchased at higher metal prices, lower gross profit margins. Consequently, during periods in which we sell this existing inventory, the effects of changing metal prices could adversely affect our operating results.
Our business could be adversely affected by declines in economic activity.
Demand for our products and services is affected by a number of general economic factors. A decline in economic activity in the U.S. and international markets in which we operate could materially affect our financial condition and results of operations. During the most recent U.S. economic recession, both demand for our products and pricing levels declined
rapidly and significantly. In addition to reducing our direct business activity, many of our customers were not able to pay us amounts when they became due, further affecting our financial condition and results of operations. An economic downturn in the markets we serve may result in reductions in sales and pricing of our products, which could have a material adverse effect on our potential earnings and future results of operations. Although we have experienced a slow economic recovery since the most recent U.S. economic recession, overall demand for our products continues to be at lower levels than we believe to be more normal levels, particularly for non‑residential construction activity. In addition, the sudden and significant decline in oil prices in late 2014 has significantly impacted our energy-related businesses due to reduced drilling activity with our 2015 volumes for these businesses down 41% from 2014 levels. This resulted in significantly reduced profits from these businesses as well as impairment and closure-related charges for certain of these businesses that further reduced our 2015 profits. In 2015, the Chinese economy slowed, impacting both metals pricing and demand on a global basis.
Currency fluctuations and changes in the worldwide balance of supply and demand could negatively impact our profitability and cash flows.
Significant currency fluctuations in the United States or abroad could negatively impact our cost of metals and the pricing of our products. A decline in the U.S. dollar relative to foreign currencies may result in increased prices for metals and metal products in the United States and reduce the amount of metal imported into the U.S. as imported metals become relatively more expensive. We may not be able to pass these increased costs on to our customers. If the value of the U.S. dollar improves relative to foreign currencies, this may result in increased metal being imported into the U.S., which in turn may pressure existing domestic prices for metal. This could also occur if global economies are weaker than the U.S. economy, creating a significant price spread between the U.S. and foreign markets. These factors have existed for some time, with imports into the U.S. reaching historical highs in 2014 and continuing through 2015 resulting in significant declines in the prices of metals. The slowing of the Chinese economy in 2015 has further impacted the import and pricing situation, as Chinese metal production rates have slowed at a lesser rate than their consumption, resulting in increased exports of metal from China throughout the world, including to the U.S. In addition, when prices for metal products in the U.S. are lower than in foreign markets, metals may be sold in the foreign markets rather than in the U.S., reducing the availability of metal products in the U.S., which may allow the domestic mills to increase their prices which may adversely affect our results if we are not able to pass these increases through to our customers.
We operate in an industry that is subject to cyclical fluctuations and any downturn in general economic conditions or in our customers’ specific industries could negatively impact our profitability and cash flows.
The metals service center industry is cyclical and impacted by both market demand and metals supply. Periods of economic slowdown or recession in the United States or other countries, or the public perception that these may occur, could decrease the demand for our products and adversely affect our pricing. If either demand or pricing were to decline from the current levels, this could reduce our profitability and cash flows.
We sell many products to industries that are cyclical, such as the non‑residential construction, semiconductor, energy, aerospace and heavy equipment industries. Although many of our direct sales are to sub‑contractors or job shops that may serve many customers and industries, the demand for our products is directly related to, and quickly impacted by, demand for the finished goods manufactured by customers in these industries, which may change as a result of changes in the general U.S. or worldwide economy, domestic exchange rates, energy prices or other factors beyond our control. As ana recent example, the continuedsignificant decline in oil prices experienced late in 2014 that continued to fall through 2015 has2016 negatively impacted our sales to the energy market, which is estimated at about 8‑10% of our sales prior to the decline. Furthermore, the continued strength of the U.S. dollar has led to increased levels of imported material in the U.S., putting pressure on our selling prices and profit margins.market.
We compete with a large number of companies in the metals service center industry, and, if we are unable to compete effectively, our profitability and cash flows may decline.
We compete with a large number of other general‑linegeneral-line distributors and processors, and specialty distributors in the metals service center industry. Competition is based principally on price, inventory availability, timely delivery, customer service, quality and processing capabilities. Competition in the various markets in which we participate comes from companies of various sizes, some of which have more established brand names in the local markets that we serve. These competitors may be better able to withstand adverse changes in conditions within our customers’ industries and may have greater operating and financial flexibility than we have. To compete for customer sales, we may lower prices or offer increased services at a higher cost, which could reduce our profitability and cash flows. Rapidly declining prices and/or demand levels may escalate competitive pressures, with service centers selling at substantially reduced prices, and sometimes at a loss, in an effort to reduce their high cost inventory and generate cash. Service centers may also be more competitive in times where supply exceeds capacity, which currently exists due to the historically highCurrently elevated levels of import material into the U.S. has increased competition between metals service centers as supply exceeds demand. These competitive pressures could further intensify if demand and particularly pricing decline significantly from current levels. Any increased and/or sustained competitive pressure could cause our share of industry sales to decline along with our profitability and cash flows to decline.flows.
If we were to lose any of our primary suppliers or otherwise be unable to obtain sufficient amounts of necessary metals on a timely basis, we may not be able to meet our customers’ needs and may suffer reduced sales.
We have few long‑term contracts to purchase metals. Therefore, our primary suppliers of carbon steel, alloy steel, stainless steel, aluminum or other metals could curtail or discontinue their delivery of these metals to us in the quantities
we need with little or no notice. Our ability to meet our customers’ needs and provide value‑added inventory management services depends on our ability to maintain an uninterrupted supply of high quality metal products from our suppliers. If our suppliers experience production problems, lack of capacity or transportation disruptions, the lead times for receiving our supply of metal products could be extended and the cost of our inventory may increase. If, in the future, we are unable to obtain sufficient amounts of the necessary metals at competitive prices and on a timely basis from our customary suppliers, we may not be able to obtain these metals from acceptable alternative sources at competitive prices to meet our delivery schedules. Even if we do find acceptable alternative suppliers, the process of locating and securing these alternatives may be disruptive to our business, which could have an adverse impact on our ability to meet our customers’ needs and reduce our profitability and cash flows. In addition, if a significant domestic supply source is discontinued and we cannot find acceptable domestic alternatives, we may need to find foreign sources of supply. Using foreign sources of supply could result in longer lead times, increased price volatility, less favorable payment terms, increased exposure to foreign currency movements and certain tariffs and duties and require greater levels of working capital. Alternative sources of supply may not maintain the quality standards that are in place with our current suppliers that could impact our ability to provide the same quality of products to our customers that we have provided in the past, which could cause our customers
to move their business to our competitors or to file claims against us, and such claims may be more difficult to pass through to foreign suppliers.
There has been significant consolidation at the metal producer level both globally and within the U.S. This consolidation has reduced the number of suppliers available to us, which could result in increased metals costs to us that we may not be able to pass on to our customers and may limit our ability to obtain the necessary metals to service our customers. The number of available suppliers may be further reduced if the general economy enters into another recession. Lower metal prices and lower demand levels may cause certain mills to reduce their production capacity and, in that case, the mill may operate at a loss, which could cause one or more mills to discontinue operations if the losses continue over an extended period of time or if the mill cannot obtain the necessary financing to fund its operating costs.
We rely upon our suppliers as to the specifications of the metals we purchase from them.
We rely on mill certifications that attest to the physical and chemical specifications of the metal received from our suppliers for resale and generally, consistent with industry practice, we do not undertake independent testing of such metals unless independent tests are required by customers. We rely on customers to notify us of any metal that does not conform to the specifications certified by the supplying mill. Although our primary sources of products have been domestic mills, we have and will continue to purchase product from foreign suppliers when we believe it is appropriate. In the event that metal purchased from domestic suppliers is deemed to not meet quality specifications as set forth in the mill certifications or customer specifications, we generally have recourse against these suppliers for both the cost of the products purchased and possible claims from our customers. However, such recourse will not compensate us for the damage to our reputation that may arise from sub‑standard products and possible losses of customers. Moreover, there is a greater level of risk that similar recourse will not be available to us in the event of claims by our customers related to products from foreign suppliers that do not meet the specifications set forth in the mill certifications. In such circumstances, we may be at greater risk of loss for claims for which we do not carry, or carry insufficient, insurance.
Our insurance coverage, customer indemnifications or other liability protections may be unavailable or inadequate to cover all of our significant risks or our insurers may deny coverage of or be unable to pay for material losses we incur, which could adversely affect our profitability and overall financial position.
We endeavor to obtain insurance agreements from financially solid, highly rated counterparties in established markets to cover significant risks and liabilities. Not every risk or liability can be insured, and for risks that are insurable, the policy limits and terms of coverage reasonably obtainable in the market may not be sufficient to cover all actual losses or liabilities incurred. Even if insurance coverage is available, we may not be able to obtain it at a price or on terms acceptable to us. Disputes with insurance carriers, including over policy terms, reservation of rights, the applicability of coverage (including exclusions), compliance with provisions (including notice) and/or the insolvency of one or more of our insurers may significantly affect the amount or timing of recovery.
In some circumstances we may be entitled to certain legal protections or indemnifications from our customers through contractual provisions, laws, regulations or otherwise. However, these protections are not always available, are typically
subject to certain terms or limitations, including the availability of funds, and may not be sufficient to cover all losses or liabilities incurred.
If insurance coverage, customer indemnifications and/or other legal protections are not available or are not sufficient to cover our risks or losses, it could have a material adverse effect on our financial position, results of operations and/or cash flows.
An increase in delinquencies or net losses of customers could adversely affect our results.
Inherent in the operation of our business is the credit risk associated with our customers. The creditworthiness of each customer and the rate of delinquencies and net losses on customer obligations are directly impacted by several factors, including relevant industry and economic conditions, the availability of capital, the experience and expertise of the customer's management team, commodity prices and political events. Any increase in delinquencies and net losses on customer obligations could have a material adverse effect on our earnings and cash flows. In addition, although we evaluate and adjust allowances for credit losses related to past due and non-performing receivables on a regular basis, adverse economic conditions or other factors that might cause deterioration of the financial health of our customers could change the timing and level of payments received and thus necessitate an increase in our estimated losses, which could also have a material adverse effect on our earnings and cash flows.
If we do not successfully implement our growth strategy, our ability to grow our business could be impaired.
We may not be able to identify suitable acquisition candidates or successfully complete any acquisitions or integrate any other businesses into our operations. If we cannot identify suitable acquisition candidates or are otherwise unable to complete acquisitions, we may not be able to continue to grow our business as expected and, if we cannot successfully integrate these businesses, we may incur increased or redundant expenses. Moreover, any additional indebtedness we incur to pay for these acquisitions could adversely affect our liquidity and financial condition.
We have invested a significant amount of capital in new locations and new processing capabilities. We may not continue to identify sufficient opportunities for internal growth to be able to sustain growth at similar levels. In addition, we may not realize the expected returns from these investments.
Acquisitions present many risks, and we may not realize the financial and strategic goals that were contemplated at the time of each transaction.
Since our initial public offering in September 1994, we have successfully purchased 6063 businesses. We continue to evaluate acquisition opportunities and expect to continue to grow our business through acquisitions in the future. Risks we may encounter in acquisitions include:
| · | | the acquired company may not perform as anticipated, which could result in an impairment charge or otherwise impact our results of operations; |
| · | | we may not realize the anticipated increase in our revenues if a larger than predicted number of customers decline to continue purchasing products from us; |
| · | | we may have to delay or not proceed with a substantial acquisition if we cannot obtain the necessary funding to complete the acquisition in a timely manner; |
| · | | we may significantly increase our interest expense, leverage and debt service requirements if we incur additional debt to pay for an acquisition or assume existing debt of an acquired company, which, among other things, may result in a downgrade of our credit ratings; |
| · | | we may have multiple and overlapping product lines that may be offered, priced and supported differently, which could cause our gross profit margin to decline; |
| · | | we may have increased inventory exposure for a short time period if the acquired company has significant amounts of material on order; |
| · | | our relationship with current and new employees, customers and suppliers could be impaired; |
| · | | our due diligence process may fail to identify risks that could negatively impact our financial condition; |
| · | | we may lose anticipated tax benefits or have additional legal or tax exposures if we have prematurely or improperly combined entities; |
| · | | we may face contingencies related to product liability, intellectual property, financial disclosures, environmental issues, violations of regulations/policies, tax positions and accounting practices or internal controls; |
| · | | the acquisition may result in litigation from terminated employees or third parties; |
| · | | our management’s attention may be diverted by transition or integration issues; |
| · | | higher than expected investments may be required to implement necessary compliance processes and related systems, including IT systems, accounting systems and internal controls over financial reporting; |
| · | | we may pay more than the acquired company is worth; |
| · | | we may be unable to obtain timely approvals from governmental authorities under competition and antitrust laws; and |
| · | | we may undertake acquisitions financed in part through public offerings or private placements of debt or equity securities, or other arrangements. Such acquisition financing could result in a decrease in our earnings and adversely affect other leverage measures. If we issue equity securities or equity-linked securities, the issued securities may have a dilutive effect on the interests of the holders of our common stock. |
These factors could have a material adverse effect on our business, results of operations, financial condition or cash flows, particularly in the case of a larger acquisition or a number of acquisitions in any short period of time.
In addition, most of the acquisition agreements we have entered into require the former owners to indemnify us against certain liabilities related to the operation of those companies before we acquired them. In most of these agreements, however, the liability of the former owners is limited and certain former owners may be unable to meet their indemnification responsibilities. Similarly, the purchasers of our non-core businesses may from time to time agree to indemnify us for operations of such businesses after the closing. We cannot be assured that any of these indemnification provisions will fully protect us, and as a result we may face unexpected liabilities that adversely affect our consolidated results of operations, financial condition and cash flows.
We are a decentralized company, which presents certain risks.
We areWith a decentralized company. Whilediverse geographic footprint in both North America and internationally, we believe our decentralized structure has catalyzed our growth and enabled us to remain responsive to opportunities and to our customers’ needs, it necessarily places significant control and decision‑making authority and accountability in the hands of local management. Because we are decentralized, we may be slower to detect compliance relatedcompliance-related problems (e.g., a rogue employee undertaking activities that are prohibited by applicable law or by our internal policies) and “company‑wide” business initiatives, such as the integration of disparate information technology systems, are often more challenging and costly to implement and their risk of failure higher, than they would be in a more centralized environment. Depending on the nature of the problem or initiative in question, such failure could materially adversely affect our business, financial condition or results of operations.
As a decentralized business, we depend on both senior management and our key operating employees. If we are unable to attract and retain these individuals, our ability to operate and grow our business may be adversely affected.
Because of our decentralized operating style, we depend on the efforts of our senior management, including our President and Chief Executive Officer, Gregg J. Mollins, and our Senior Executive Vice President and Chief Financial Officer, Karla Lewis, our executive vice presidents of operationsExecutive Vice President and Chief Operating Officer, James Hoffman and other senior management, as well as our key operating employees. We may not be able to retain these individuals or attract and retain additional qualified personnel when needed. We do not have employment agreements with any of our corporate officers or most of our key employees, so they may have less of an incentive to stay with us when presented with alternative employment opportunities. The compensation of our officers and key employees is heavily dependent on our financial performance and in times of reduced financial performance this may cause our employees to seek employment opportunities that provide a more stable compensation structure. The loss of any key officer or employee will require remaining officers and employees to direct immediate and substantial attention to seeking and training a replacement. Our inability to retain members of our senior management or key operating employees or to find adequate replacements for any departing key officer or employee on a timely basis could adversely affect our ability to operate and grow our business.
We could fail to maintain effective internal control over financial reporting.
The accuracy of our financial reporting depends on the effectiveness of our internal control over financial reporting. Internal control over financial reporting can provide only reasonable assurance with respect to the preparation and fair presentation of financial statements and may not prevent or detect misstatements because of its inherent limitations. These limitations include, among others, the possibility of human error, inadequacy or circumvention of controls and fraud. If we do not maintain effective internal control over financial reporting or design and implement controls sufficient to provide reasonable assurance with respect to the preparation and fair presentation of our financial statements, we might fail to timely detect any misappropriation of corporate assets or inappropriate allocation or use of funds and could be unable to file accurate financial reports on a timely basis. As a result, our reputation, results of operations and stock price could be materially adversely affected.
We are subject to various environmental, employee safety and health and customs and export laws and regulations, which could subject us to significant liabilities and compliance expenditures.
We are subject to various foreign, federal, state and local environmental laws and regulations concerning air emissions, wastewater discharges, underground storage tanks and solid and hazardous waste disposal at or from our facilities. Our operations are also subject to various employee safety and health laws and regulations, including those concerning occupational injury and illness, employee exposure to hazardous materials and employee complaints. We are also subject to customs and export laws and regulations for international shipment of our products. Environmental, employee safety and health and customs and export laws and regulations are comprehensive, complex and frequently changing. Some of these laws and regulations are subject to varying and conflicting interpretations. We may be subject from time to time to administrative and/or judicial proceedings or investigations brought by private parties or governmental agencies with respect to environmental matters, employee safety and health issues or customs and export issues. Proceedings and investigations with respect to environmental matters, any employee safety and health issues or customs and export issues could result in substantial costs to us, divert our management’s attention and result in significant liabilities, fines or the suspension or interruption of our service center activities. Some of our current properties are located in industrial areas with histories of heavy industrial use. The location of these properties may require us to incur environmental expenditures and to establish accruals for environmental liabilities that arise from causes other than our operations. In addition, we are currently investigating and remediating contamination in connection with a certain propertiesproperty related to activities at former manufacturing operations of a subsidiary we have acquired. Future events, such as changes in existing laws and regulations or their enforcement, new laws and regulations or the discovery of conditions not currently known to us, could result in material environmental or export compliance or remedial liabilities and costs, constrain our operations or make such operations more costly.
We operate internationally and are subject to exchange rate fluctuations, exchange controls, political risks and other risks relating to international operations.
EightEleven percent of our 20152017 sales were to international customers, subjecting us to the risks of doing business on a global level. These risks include fluctuations in currency exchange rates, economic instability and disruptions, restrictions on the transfer of funds and the imposition of duties and tariffs. Additional risks from our multinational business include transportation delays and interruptions, war, terrorist activities, epidemics, pandemics, political instability, import and export controls, local regulation, changes in governmental policies, labor unrest and current and changing regulatory environments. In addition, government policies on international trade and investment such as import quotas, tariffs, and capital controls, whether adopted by individual governments or addressed by regional trade blocs, can affect the demand for our customers’ products and services. The implementation of more restrictive trade policies, such as higher tariffs or new barriers to entry, in countries in which our customers sell large quantities of products and services could negatively impact our business, results of operations and financial condition.
Our operating results could be negatively affected by the global laws, rules and regulations, as well as political environments in the jurisdictions in which we operate. There could be reduced demand for our products, decreases in the prices at which we can sell our products and disruptions of production or other operations. Additionally, there may be substantial capital and other costs to comply with regulations and/or increased security costs or insurance premiums, any of which could negatively impact our operating results.
Our international operations continue to expand, exposing us to additional risks.
Our international presence has grown, so the risk of incurring liabilities or fines resulting from non‑compliance with various U.S. or international laws and regulations has increased. For example, we are subject to the FCPA, and similar worldwide anti‑bribery laws in non‑U.S. jurisdictions such as the United Kingdom’s Bribery Act 2010, which generally prohibit companies and their intermediaries from corruptly paying, offering to pay, or authorizing the payment of money, a gift, or anything of value, to a foreign official or foreign political party, for purposes of obtaining or retaining business. A company can be held liable under these anti‑bribery laws not just for its own direct actions, but also for the actions of its foreign subsidiaries or other third parties, such as agents or distributors. In addition, we could be held liable for actions taken by employees or third parties on behalf of a company that we acquire. If we fail to comply with the requirements under these laws and other laws we are subject to due to our international operations, we may face possible civil and/or criminal penalties, which could have a material adverse effect on our business or financial results.
We may be subject to risks relating to changes in our tax rates or exposure to additional income tax liabilities.
We are subject to income taxes in the United States and various non‑U.S. jurisdictions. Domestic and international tax liabilities are subject to the allocation of income among various tax jurisdictions. Our effective income tax rate could be affected by changes in the mix of earnings among countries with differing statutory tax rates, changes in the valuation allowance of deferred tax assets or changes in tax rates or tax laws or regulations. TheIn particular, although the passage of the Tax Cut and Jobs Act of 2017 reduced the U.S. tax rate to 21%, our future earnings could be negatively impacted by changes in tax legislation including changing tax rates and tax base such as limiting, phasing-out or eliminating deductions or tax credits, changing rules for earnings repatriations and changing other tax laws in the U.S. or other countries. In addition, it is uncertain if, and to what extent, various states will conform to the new tax law and foreign countries will react by adopting tax legislation or taking other actions that could adversely affect our business.
In addition, the amount of income taxes paidwe pay is subject to regular audits by United StatesU.S. federal, state and local tax authorities and by non‑U.S. tax authorities. If these audits result in assessments different from amounts reserved, future financial results may include unfavorable adjustments to our income tax liabilities, which could have an adverse effect on our results of operations and liquidity.
We rely on information management systems and any damage, interruption or compromise of our information management systems or data could disrupt and harm our business.
We rely upon information technology systems and networks, some of which are managed by third parties, to process, transmit, and store electronic information in connection with the operation of our business. Additionally, we collect and store data that is sensitive to our company. Operating these information technology systems and networks and processing and maintaining this data, in a secure manner, are critical to our business operations and strategy. Our information management systems and the data contained therein may be vulnerable to damage, including interruption due to power loss, system and network failures, operator negligence and similar causes.
In addition, our systems and data may be subject to security breaches, viruses, malware, and other cyber‑cybersecurity attacks. Cybersecurity attacks are increasing in frequency and sophistication. Cybersecurity attacks may range from random attempts to coordinated and targeted attacks, including sophisticated computer crime and advanced threats. These threats pose a risk to the security of our information technology systems and networks and the confidentiality, availability and integrity of our data. We have experienced cybersecurity events on the Company’s and certain of our affiliates’ networks
and/or systems. To date, none of these events has had a material impact on our or our affiliates’ operations or financial results. We may experience similar or more sophisticated events in the future. We believe that we have adopted appropriate measures to mitigate potential risks to our technology and our operations from these information technology‑related and other potential disruptions. However, given the unpredictability of the timing, nature and scope of such disruptions, we could potentially be subject to production downtimes, operational delays, other detrimental impacts on our operations or ability to provide products and services to our customers, the compromising of confidential or otherwise protected information, misappropriation, destruction or corruption of data, security breaches, other manipulation or improper use of our systems or networks, financial losses from remedial actions, loss of business or potential liability, and/or damage to our reputation, any of which could have a material adverse effect on our competitive position, results of operations, cash flows or financial condition. Any significant compromise of our information management systems or data could impede or interrupt our business operations and may result in negative consequences including loss of revenue, fines, penalties, litigation, reputational damage, inability to accurately and/or timely complete required filings with government entities including the SEC and IRS,the Internal Revenue Service, unavailability or disclosure of confidential information (including personal information) and negative impact on our stock price.
An inability to successfully develop and manage the implementation of our new enterprise resource planning (“ERP”) system could adversely affect our operations and operating results.
We are in the process of customizing a third party ERP system to be deployed at certain of our operating locations over the next few years, on a subsidiary by subsidiary basis. The Company has committed significant resources to this new ERP system, which, when implemented, will replace certain of our legacy systems. The Company plans to implement this system, when available, on a subsidiary by subsidiary, or location by location, basis to minimize risks of disruption to the business. A project of this size may result in cost overruns, project delays, or business interruptions. Any business disruption could adversely affect our ability to process orders, ship products, provide services and customer support, send invoices and track payments, fulfill contractual obligations or otherwise operate our business at those locations where deployed.
Our financial results may be affected by various legal and regulatory proceedings, including those involving antitrust, tax, environmental, or other matters.
We are subject to a variety of litigation and legal compliance risks. These risks include, among other things, possible liability relating to product liability, personal injuries, intellectual property rights, contract‑related claims, government contracts, taxes, environmental matters and compliance with U.S. and foreign laws, including competition laws and laws governing improper business practices. We or one of our subsidiaries could be charged with wrongdoing as a result of such matters. If convicted or found liable, we could be subject to significant fines, penalties, repayments, or other damages (in certain cases, treble damages). As a global business, we are subject to complex laws and regulations in the U.S. and other countries in which we operate. Those laws and regulations may be interpreted in different ways. They may also change from time to time and so may their related interpretations. Changes in laws or regulations could result in higher
expenses and payments, and uncertainty relating to laws or regulations may also affect how we conduct our operations and structure our investments and could limit our ability to enforce our rights.
The volatility of the market could result in a material impairment of goodwill or indefinite‑lived intangible assets.
We review the recoverability of goodwill and indefinite‑lived intangible assets annually or whenever significant events or changes in circumstances occur that might impair the recovery of recorded costs. Factors that may be considered a change in circumstances, indicating that the carrying value of our goodwill or indefinite‑lived intangible assets may not be recoverable, include a decline in stock price and market capitalization, declines in the market conditions of our products, viability of end markets (such as the energy market due to lower oil prices - see discussion of impairment charges taken in 2016 and 2015 in Note 18 –17 — “Impairment and Restructuring Charges”of Long-Lived Assets” of Part II, Item 8 "Financial“Financial Statements and Supplementary Data”), loss of customers, reduced future cash flow estimates, and slower growth rates in our industry. An impairment charge, if incurred, could be material.
Our business operations and financial performance could be adversely affected by changes in our relationship with our employees or changes to U.S. or foreign employment regulations.
We had approximately 14,900 employees worldwide as of December 31, 2017. This means we have a significant exposure to changes in domestic and foreign laws governing our relationships with our employees, including wage and hour laws and regulations, fair labor standards, minimum wage requirements, overtime pay, unemployment tax rates, workers’ compensation rates, citizenship requirements and payroll taxes, which likely would have a direct impact on our operating costs. A significant increase in minimum wage or overtime rates in jurisdictions where we have employees could have a significant impact on our operating costs and may require that we relocate those operations or take other steps to mitigate such increases, all of which may cause us to incur additional costs, expend resources responding to such increases and lower our profitability.
We face certain risks associated with potential labor disruptions.
Approximately 11%12% of our employees are covered by collective bargaining agreements and/or are represented by unions or workers’ councils. Approximately 500600 employees are covered by 23 different collective bargaining agreements that expire in 2016.2018. While we believe that our relations with our employees are generally good, we cannot provide assurances that we will be completely free of labor disruptions such as work stoppages, work slowdowns, union organizing campaigns, strikes, lockouts or that any existing labor disruption will be favorably resolved. We could incur additional costs and/or experience work stoppages that could adversely affect our business operations through a loss of revenue and strained relationships with customers.
Quarterly cash dividends and share repurchases may be discontinued or modified, are subject to a number of uncertainties, and may affect the price of our common stock.
Quarterly cash dividends and share repurchases under our share repurchase program constitute components of our capital allocation strategy, which we fund with free operating cash flow and borrowings. However, we are not required to declare dividends or make any share repurchases under our share repurchase program. Dividends and share repurchases may be discontinued, accelerated, suspended or delayed at any time without prior notice. Even if not discontinued, the amount of such dividends and repurchases may be changed, and the amount, timing and frequency of such dividends and repurchases may vary from historical practice or from the company’s stated expectations. Decisions with respect to dividends and share repurchases are subject to the discretion of our Board of Directors and will be based on a variety of factors. Important factors that could cause us to discontinue, limit, suspend, increase or delay our quarterly cash dividends or share repurchases include market conditions, the price of our common stock, the nature and timing of other investment opportunities, changes in our business strategy, the terms of our financing arrangements, our outlook as to the ability to obtain financing at attractive rates, the impact on our credit ratings and the availability of domestic cash.
The reduction or elimination of our cash dividend or share repurchase program could adversely affect the market price of our common stock. Additionally, repurchases of our shares will reduce the number of outstanding shares of our common stock. There can be no assurance that any share repurchases will enhance stockholder value because the market price of our common stock may decline below the levels at which we repurchased shares of common stock. Although our share repurchase program is intended to enhance long-term stockholder value, short-term stock price fluctuations could reduce the program's effectiveness.
Risks Related to our Indebtedness
Our indebtedness could impair our financial condition or cause a downgrade of our credit rating and reduce the funds available to us for other purposes and our failure to comply with the covenants contained in our debt instruments could result in an event of default that could adversely affect our operating results.
We have substantial debt service obligations. As of December 31, 2015,2017, we had aggregate outstanding indebtedness of approximately $1.94$1.91 billion. This indebtedness could adversely affect us in the following ways:
| · | | additional financing may not be available to us in the future for working capital, capital expenditures, acquisitions, general corporate purposes or other purposes and, if available, may be considerably more costly than our current debt costs; |
| · | | a significant portion of our cash flow from operations must be dedicated to the payment of interest and principal on our debt, which reduces the funds available to us for our operations, dividends or other purposes; |
| · | | some of the interest on our debt is, and will continue to be, accrued at variable rates, which maycould result in higher interest expense in the event of increases in interest rates, which mayis expected to occur in future periods; |
| · | | our leverage may increase our vulnerability to economic downturns and limit our ability to withstand adverse events in our business by limiting our financial alternatives; and |
| · | | our ability to capitalize on significant business opportunities, including potential acquisitions, and to plan for, or respond to, competition and changes in our business may be limited due to our indebtedness. |
Our existing debt agreements contain financial and restrictive covenants that limit the total amount of debt that we may incur, and may limit our ability to engage in other activities that we may believe are in our long‑term best interests. Our failure to comply with these covenants may result in an event of default, which, if not cured or waived, could accelerate the maturity of our indebtedness or prevent us from accessing additional funds under our revolving credit facility. If the maturity of our indebtedness is accelerated, we may not have sufficient cash resources to satisfy our debt obligations and we may not be able to continue our operations as planned. See discussion regarding our financial covenants in the “Liquidity and Capital Resources” section of Item 7.7 “Management’s Discussion and Analysis of Financial Condition and Results of Operations.”
We may not be able to generate sufficient cash flow to meet our existing debt service obligations.
Our ability to generate sufficient cash flow from operations, draw on our revolving credit facility or access the capital markets to make scheduled payments on our debt obligations including our $350 million of senior notes that mature in 2016, will depend on our future financial performance, which will be affected by a range of economic, competitive and business factors, many of which are outside of our control. For example, we may not generate sufficient cash flow from our operations or new acquisitions to repay amounts drawn under our revolving credit facility when it matures in 2018,2021, amortization payments on our term loan, or our debt securities when they mature in 2016, 2023 and 2036. If we do not generate sufficient cash flow from operations or have availability to borrow on our revolving credit facility to satisfy our debt obligations, we would expect to undertake alternative financing plans, such as refinancing or restructuring our debt, selling assets, reducing or delaying capital investments or seeking to raise additional capital. We may not be able to consummate any such transactions at all or on a timely basis or on terms, and for proceeds, that are acceptable to us. These transactions may not be permitted under the terms of our various debt instruments then in effect. Our inability to generate sufficient cash flow to satisfy our debt obligations or to timely refinance our obligations on acceptable terms could adversely affect our ability to serve our customers or we may not be able to continue our operations as planned.
Changes in the Company’s credit ratings could increase cost of funding.
Our credit ratings are important to our cost of capital. The major rating agencies routinely evaluate our credit profile and assign debt ratings to Reliance. This evaluation is based on a number of factors, which include financial strength, business and financial risk, as well as transparency with rating agencies and timeliness of financial reporting. Any downgrade in our credit rating could increase our cost of capital and have a material adverse effect on our business, financial condition, results of operations or cash flows.
We are permitted to incur more debt, which may intensify the risks associated with our current leverage, including the risk that we will be unable to service our debt or that our credit rating may be downgraded.
We may be able to incur substantial additional indebtedness in the future. Although the terms governing our indebtedness contain restrictions on our ability to incur additional indebtedness, these restrictions are subject to numerous qualifications and exceptions, and the indebtedness we may incur in compliance with these restrictions could be substantial. If we incur additional debt, the risks associated with our leverage, including the risk that we will be unable to service our debt or that we may be subject to a credit rating downgrade, may increase.
Our acquisition strategy and growth capital expenditures may require access to external capital, and.and limitations on our access to external financing sources could impair our ability to grow.
We may have to rely on external financing sources, including commercial borrowings and issuances of debt and equity securities, to fund our acquisitions and growth capital expenditures. Limitations on our access to external financing sources, whether due to tightened capital markets, more expensive capital or otherwise, could impair our ability to execute our growth strategy.
Because a substantial portion of our indebtedness bears interest at rates that fluctuate with changes in certain prevailing short‑term interest rates, we are vulnerable to interest rate increases.
A substantial portion of our indebtedness bears interest at rates that fluctuate with changes in certain short‑term prevailing interest rates. At December 31, 2015,2017, we had $801.7 million$1.16 billion in total variable interest rate debt outstanding with $1.1 billion$908.7 million available for borrowing under our revolving credit facility. Assuming a consistent level of debt, a 100 basis point increase in the interest rate on our floating rate debt would result in approximately $8.0$11.6 million of additional interest expense on an annual basis. We currently do not use derivative financial instruments to manage the potential impact of interest rate risk. If interest rates continue to increase, dramatically, we could be unable to service our debtexperience increased interest expense which could have a material adverse effect on our business, financial condition, results of operations or cash flows.
Item 1B. Unresolved Staff CommentsComments
None.
Item 2. PropertiesProperties
As of December 31, 2015,2017, we maintained more than 300 metals service center processing and distribution facilities in 3940 states in the U.S. and in 1213 other countries, and our corporate headquarters. In the opinion of management, all of our service center facilities are in good or excellent condition and are adequate for our existing operations. These facilities currently operate at about 50‑60% of capacity based upon a 24‑hour seven‑day week, with each location averaging approximately two shifts operating at full capacity for a five‑day work week. We have the ability to increase our operating capacity significantly without further investment in facilities or equipment if demand levels increase.
We lease 148 of ourOf the more than 300 processing and distribution facilities that we maintained, we leased 94 of those facilities as of December 31, 2017. In addition, we have ground leases and other leased spaces, such as depots, sales offices and storage, for a total of approximately 7.06.5 million square feet. Total square footage on all company‑owned properties is approximately 26.026.9 million and represents approximately 80% of the total square footage of our operating facilities. In addition, we lease our corporate headquarters in Los Angeles, CaliforniaCalifornia. Our leases of facilities and several of our subsidiaries lease other sales offices. These property leasesspaces expire at various times through 2028 and theour ground leases expire at various times through 2041. The aggregate monthly rent amount for these properties is approximately $2.7 million.
Item 3. Legal ProceedingsProceedings
From time to time, we are named as a defendant in legal actions. Generally, these actions arise out of our normal course of business. We are not currently a party to any pending legal proceedings other than routine litigation incidental to the business which webusiness. We expect that these matters will be resolved without having a material adverse effect on our results of operations or financial condition. We maintain liability insurance against risks arising out of our normal course of business.
Item 4. Mine Safety DisclosuresDisclosures
Not applicable.
PART IIII
Item 5. Market for Registrant’s Common Equity,, Related Stockholder Matters and Issuer Purchases of Equity Securities
Our common stock is listed on the New York Stock Exchange (“NYSE”) under the symbol “RS” and was first traded on September 16, 1994. The following table sets forth the highesthigh and lowest intradaylow sales prices of our common stock for the stated calendar quarters.
| | | | | | | | | | | | | | | | | | | |
| 2015 | | 2014 | 2017 | | 2016 |
| High | | Low | | High | | Low | High | | Low | | High | | Low |
First Quarter | $ | 62.19 | | $ | 50.63 | | $ | 76.77 | | $ | 66.28 | $ | 88.58 | | $ | 76.18 | | $ | 71.34 | | $ | 50.08 |
Second Quarter | $ | 66.86 | | $ | 56.29 | | $ | 74.69 | | $ | 67.88 | $ | 82.28 | | $ | 69.31 | | $ | 78.38 | | $ | 67.57 |
Third Quarter | $ | 62.84 | | $ | 53.24 | | $ | 75.38 | | $ | 66.76 | $ | 76.98 | | $ | 68.46 | | $ | 84.25 | | $ | 67.66 |
Fourth Quarter | $ | 61.75 | | $ | 53.99 | | $ | 68.45 | | $ | 56.10 | $ | 87.33 | | $ | 72.69 | | $ | 87.58 | | $ | 65.10 |
As of January 31, 2016,February 23, 2018, there were 219203 record holders of our common stock, excludingstock. Our record holders exclude holders whose shares were held for them in street name through bank, brokers or other nominee accounts. We have paid quarterly cash dividends on our common stock for 56 years.58 consecutive years and have never reduced or suspended our dividend. In February 2015,2018, our Board of Directors increased the regular quarterly dividend amount 14%11.1% to $0.40$0.50 per share. Our Board of Directors has increased the quarterly dividend rate on a periodic basis with the most recent being our 2225ndth increase since our IPO in 1994. Further increases in the quarterly dividend rate will be evaluated by the Board based on conditions then existing, including our earnings, cash flows, financial condition and capital requirements, or other factors the Board may deem relevant. We expect to continue to declare and pay dividends in the future, if earnings are available to pay dividends, but we also intend to continue to retain a portion of earnings for reinvestment in our operations and expansion of our businesses. We cannot assure you that any dividends will be paid in the future or that, if paid, the dividends will be at the same amount or frequency as paid in the past. Our payment of dividends in the future will depend on business conditions, our financial condition, earnings, liquidity and capital requirements and other factors.
Our credit facilityagreement contains covenants, which, among other things, restricts our ability to pay dividends if we cannot satisfy certain financial tests. See discussion regarding our financial covenants in the “Liquidity and Capital Resources” section of Item 7 “Management’s Discussion and Analysis of Financial Condition and Results of Operations.” For 20132015 through 2015,2017, we have paid between 30%21% and 38%39% of earnings to our stockholders as dividends.
The following table contains certain information with respect to our cash dividends declared during the past two fiscal years:
| | | | | | | |
Date of Declaration | | Record Date | | Payment Date | | Dividends |
10/20/201524/2017 | | 11/20/201517/2017 | | 12/18/20158/2017 | | $ | 0.400.45 per share
|
7/21/201525/2017 | | 8/14/201518/2017 | | 9/11/20158/2017 | | $ | 0.400.45 per share
|
4/21/201525/2017 | | 5/29/201526/2017 | | 6/16/2017 | | $ | 0.45 per share |
2/14/2017 | | 3/10/2017 | | 3/24/2017 | | $ | 0.45 per share |
10/19/20152016 | | 11/18/2016 | | 12/16/2016 | | $ | 0.425 per share |
7/20/2016 | | 8/12/2016 | | 9/9/2016 | | $ | 0.425 per share |
4/19/2016 | | 5/27/2016 | | 6/17/2016 | | $ | 0.40 per share |
2/17/201516/2016 | | 3/13/201511/2016 | | 3/27/201531/2016 | | $ | 0.40 per share |
10/21/2014
| | 11/11/2014
| | 12/18/2014
| | $
| 0.35 per share
|
7/22/2014
| | 8/15/2014
| | 9/12/2014
| | $
| 0.35 per share
|
4/22/2014
| | 5/30/2014
| | 6/20/2014
| | $
| 0.35 per share
|
2/18/2014
| | 3/6/2014
| | 3/21/2014
| | $
| 0.35 per share
|
Share repurchase activity during the three months ended December 31, 2015 was as follows:
| | | | | | | | | |
Period | | Total Number of
Shares Purchased | | | Average Price Paid
Per Share | | Total Number of Shares Purchased as Part of Publicly Announced Plan | | Maximum Number of Shares That May Yet Be Purchased Under the Plan(1) |
October 1 - October 31, 2015 | | 241,511 | | $ | 54.63 | | 241,511 | | 8,428,668 |
November 1 - November 30, 2015 | | - | | | - | | - | | 8,428,668 |
December 1 - December 31, 2015 | | 76 | | | 55.00 | | 76 | | 8,428,592 |
Total | | 241,587 | | | | | 241,587 | | |
On October 21, 2014, our Board of Directors extended our share
Share repurchase plan toactivity during the three months ended December 31, 2017. 2017 was as follows:
| | | | | | | | |
Period | | Total Number of
Shares Purchased | | Average Price Paid
Per Share ($) | | Total Number of Shares Purchased as Part of Publicly Announced Plan | | Maximum Number of Shares That May Yet Be Purchased Under the Plan(1) |
October 1 - October 31, 2017 | | — | | — | | — | | 8,428,592 |
November 1 - November 30, 2017 | | 336,616 | | 74.27 | | 336,616 | | 8,091,976 |
December 1 - December 31, 2017 | | — | | — | | — | | 8,091,976 |
Total | | 336,616 | | | | 336,616 | | |
| (1) | | On October 20, 2015, our Board of Directors again amended our share repurchase plan increasing by 7,500,000 shares the total number of shares authorized for repurchase under the plan and extending the plan to be repurchased and extending the program through December 31, 2018. Our share repurchase plan does not obligate us to acquire any specific number of shares. Under the share repurchase plan, shares may be repurchased in the open market or privately negotiated transactions, including plans complying with Rule 10b5-1 under the Exchange Act. |
Additional information regarding securities authorized for issuance under all stock‑based compensation plans will be included under the caption “EXECUTIVE COMPENSATION”COMPENSATION — Equity Compensation Plan Information” in our definitive Proxy Statement for the Annual Meeting of Stockholders to be held May 18, 2016.16, 2018.
Stock Performance Graph
The following graph compares the performance of our common stock with that of the S&P 500, the Russell 2000 and an industry peer group consisting of publicly-traded metals service center companies (the “industry peer group”) for the five‑year period from December 31, 20102012 through December 31, 2015.2017. The comparison of total return assumes that a fixed investment of $100 was invested on December 31, 20102012 in all common stock and assumes the reinvestment of dividends. Since there is no nationally‑recognized industry index consisting of metals service center companies to be used as a peer group index, Reliance constructed its ownthe industry peer group. As of December 31, 2015,2017, the industry peer group consisted of Olympic Steel Inc., which has securities listed for trading on NASDAQ; A.M. Castle & Co., Ryerson Holding Corporation and Worthington Industries, Inc., each of which has securities listed for trading on the NYSE; and Russel Metals Inc., which has securities listed for trading on the Toronto Stock Exchange. The returns of each member of the industry peer group are weighted according to that member’s stock market capitalization.
The stock price performance shown on the graph below is not necessarily indicative of future price performance.
Comparison of 5 Year Cumulative Total Return Among Reliance Steel & Aluminum Co.,
the S&P 500 Index, the Russell 2000 Index and an Industry Peer Group
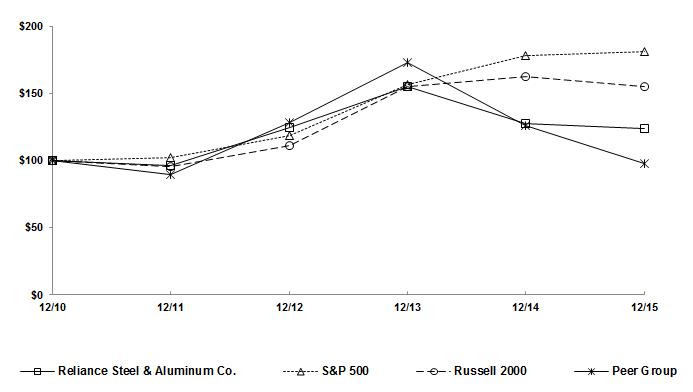
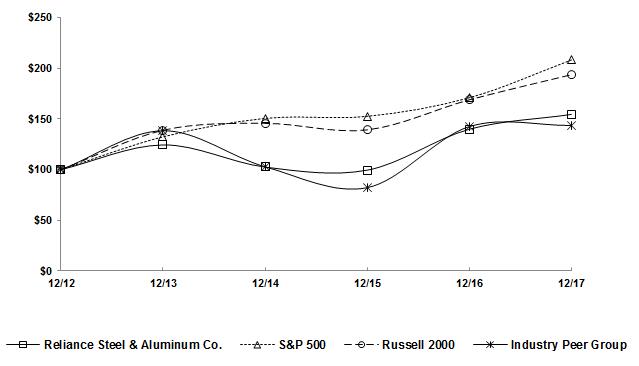
| | | | | | | | | | | | | | | | | |
| 2012 | | 2013 | | 2014 | | 2015 | | 2016 | | 2017 |
Reliance Steel & Aluminum Co. | $ | 100.00 | | $ | 124.35 | | $ | 102.51 | | $ | 99.51 | | $ | 139.80 | | $ | 154.44 |
S&P 500 | | 100.00 | | | 132.39 | | | 150.51 | | | 152.59 | | | 170.84 | | | 208.14 |
Russell 2000 | | 100.00 | | | 138.82 | | | 145.62 | | | 139.19 | | | 168.85 | | | 193.58 |
Industry Peer Group | | 100.00 | | | 138.36 | | | 102.80 | | | 82.23 | | | 142.43 | | | 143.55 |
| | | | | | | | | | | | | | | | | |
| 2010 | | 2011 | | 2012 | | 2013 | | 2014 | | 2015 |
Reliance Steel & Aluminum Co. | $ | 100.00 | | $ | 96.29 | | $ | 124.68 | | $ | 155.04 | | $ | 127.81 | | $ | 124.07 |
S&P 500 | | 100.00 | | | 102.11 | | | 118.45 | | | 156.82 | | | 178.29 | | | 180.75 |
Russell 2000 | | 100.00 | | | 95.82 | | | 111.49 | | | 154.78 | | | 162.35 | | | 155.18 |
Industry Peer Group | | 100.00 | | | 89.20 | | | 127.95 | | | 172.94 | | | 126.25 | | | 97.54 |
Item 6. Selected Financial DataData
We have derived the following selected summary consolidated financial and operating data for each of the five years ended December 31, 20152017 from our audited consolidated financial statements. You should read the information below with Part II, Item 8. 8"“Financial Statements and Supplementary Data” and Part II, Item 7. Management’s7 “Management’s Discussion and Analysis of Financial Condition and Results of Operations.”
SELECTED CONSOLIDATED FINANCIAL DATA
| | | | | | | | | | | |
| Year Ended December 31, | | | | | | | | | | |
| 2015 | | 2014 | | 2013 | | 2012 | | 2011 | Year Ended December 31, |
| (in millions, except share and per share data) | 2017 | | 2016 | | 2015 | | 2014 | | 2013 |
| | | | | | | | | | | (in millions, except share and per share data) |
Income Statement Data: | | | | | | | | | | | | | | | | | | | | | | | | | | | | |
Net sales | $ | 9,350.5 | | $ | 10,451.6 | | $ | 9,223.8 | | $ | 8,442.3 | | $ | 8,134.7 | $ | 9,721.0 | | $ | 8,613.4 | | $ | 9,350.5 | | $ | 10,451.6 | | $ | 9,223.8 |
Cost of sales (exclusive of depreciation and amortization expenses included in operating expenses) | | 6,803.6 | | | 7,830.6 | | | 6,826.2 | | | 6,235.4 | | | 6,148.7 | |
Cost of sales (exclusive of depreciation and amortization expense) | | | 6,933.2 | | | 6,023.1 | | | 6,803.6 | | | 7,830.6 | | | 6,826.2 |
Gross profit (1) | | 2,546.9 | | 2,621.0 | | 2,397.6 | | 2,206.9 | | 1,986.0 | | 2,787.8 | | 2,590.3 | | 2,546.9 | | 2,621.0 | | 2,397.6 |
Operating expenses (2) | | 2,000.3 | | | 2,003.6 | | | 1,845.7 | | 1,547.7 | | 1,413.2 | |
Warehouse, delivery, selling, general and administrative expense ("S,G&A") | | | 1,902.8 | | 1,798.1 | | 1,725.3 | | 1,789.8 | | 1,636.0 |
Depreciation and amortization expense | | | 218.4 | | 222.0 | | 218.5 | | 213.8 | | 192.4 |
Impairment of long-lived assets | | | 4.2 | | | 52.4 | | | 53.3 | | | — | | | 14.9 |
Operating income | | 546.6 | | 617.4 | | 551.9 | | 659.2 | | 572.8 | | 662.4 | | 517.8 | | 549.8 | | 617.4 | | 554.3 |
Other income (expense): | | | | | | | | | | | |
Other (income) expense: | | | | | | | | | | | |
Interest expense | | (84.3) | | (81.9) | | (77.5) | | (58.4) | | (59.8) | | 73.9 | | 84.6 | | 84.3 | | 81.9 | | 77.5 |
Other (expense) income, net | | (3.6) | | | 10.8 | | | 3.9 | | | 8.6 | | | (1.4) | |
Other expense (income), net | | | 4.7 | | | 4.0 | | | 6.8 | | | (10.8) | | | (1.5) |
Income before income taxes | | 458.7 | | 546.3 | | 478.3 | | 609.4 | | 511.6 | | 583.8 | | 429.2 | | 458.7 | | 546.3 | | 478.3 |
Provision for income taxes | | 142.5 | | | 170.0 | | | 153.6 | | | 201.1 | | | 162.4 | |
Income tax (benefit) provision (3) | | | (37.2) | | | 120.1 | | | 142.5 | | | 170.0 | | | 153.6 |
Net income | | 316.2 | | 376.3 | | 324.7 | | 408.3 | | 349.2 | | 621.0 | | 309.1 | | 316.2 | | 376.3 | | 324.7 |
Less: Net income attributable to noncontrolling interests | | 4.7 | | | 4.8 | | | 3.1 | | | 4.8 | | | 5.4 | | 7.6 | | | 4.8 | | | 4.7 | | | 4.8 | | | 3.1 |
Net income attributable to Reliance | $ | 311.5 | | $ | 371.5 | | $ | 321.6 | | $ | 403.5 | | $ | 343.8 | $ | 613.4 | | $ | 304.3 | | $ | 311.5 | | $ | 371.5 | | $ | 321.6 |
Earnings per share attributable to Reliance stockholders: | | | | | | | | | | | | | | | | | | | | |
Diluted | $ | 4.16 | | $ | 4.73 | | $ | 4.14 | | $ | 5.33 | | $ | 4.58 | $ | 8.34 | | $ | 4.16 | | $ | 4.16 | | $ | 4.73 | | $ | 4.14 |
Basic | $ | 4.20 | | $ | 4.78 | | $ | 4.19 | | $ | 5.36 | | $ | 4.60 | $ | 8.42 | | $ | 4.21 | | $ | 4.20 | | $ | 4.78 | | $ | 4.19 |
Shares used in computing earnings per share: | | | | | | | | | | | | | | | | | | | | |
Diluted | | 74,902,064 | | 78,615,939 | | 77,646,192 | | 75,694,212 | | 75,041,753 | | 73,539,424 | | 73,120,918 | | 74,902,064 | | 78,615,939 | | 77,646,192 |
Basic | | 74,096,349 | | 77,682,943 | | 76,844,912 | | 75,216,955 | | 74,767,988 | | 72,851,021 | | 72,362,513 | | 74,096,349 | | 77,682,943 | | 76,844,912 |
| | | | | | | | | | | | | | | | | | | | |
Other Data: | | | | | | | | | | | | | | | | | | | | |
Cash flow provided by operations | $ | 1,025.0 | | $ | 356.0 | | $ | 633.3 | | $ | 601.9 | | $ | 234.8 | $ | 399.0 | | $ | 626.5 | | $ | 1,025.0 | | $ | 356.0 | | $ | 633.3 |
Capital expenditures | | 172.2 | | 190.4 | | 168.0 | | 214.0 | | 156.4 | | 161.6 | | 154.9 | | 172.2 | | 190.4 | | 168.0 |
Cash dividends per share | | 1.60 | | 1.40 | | 1.26 | | 0.80 | | 0.48 | | 1.80 | | 1.65 | | 1.60 | | 1.40 | | 1.26 |
| | | | | | | | | | | | | | | | | | | | |
Balance Sheet Data (December 31): | | | | | | | | | | | | | | | | | | | | |
Working capital | $ | 1,564.5 | | $ | 2,458.3 | | $ | 2,165.5 | | $ | 1,699.2 | | $ | 1,698.3 | $ | 2,347.6 | | $ | 2,032.5 | | $ | 1,564.5 | | $ | 2,458.3 | | $ | 2,165.5 |
Total assets | | 7,121.6 | | 7,822.4 | | 7,323.6 | | 5,846.7 | | 5,592.3 | | 7,751.0 | | 7,411.3 | | 7,121.6 | | 7,822.4 | | 7,323.6 |
Short-term debt | | 500.8 | | 93.9 | | 36.5 | | 83.6 | | 12.2 | | 92.0 | | 82.5 | | 500.8 | | 93.9 | | 36.5 |
Long-term debt (3) | | 1,428.9 | | 2,209.6 | | 2,055.1 | | 1,113.0 | | 1,306.9 | |
Long-term debt (2) | | | 1,809.6 | | 1,847.2 | | 1,428.9 | | 2,209.6 | | 2,055.1 |
Reliance stockholders’ equity | | 3,914.1 | | 4,099.0 | | 3,874.6 | | 3,558.4 | | 3,143.9 | | 4,667.1 | | 4,148.8 | | 3,914.1 | | 4,099.0 | | 3,874.6 |
| (1) | | Gross profit, calculated as net sales less cost of sales, is a non‑GAAP financial measure as it excludes depreciation and amortization expense associated with the corresponding sales. The majority of our orders are basic distribution with no processing services performed. For the remainder of our sales orders, we perform “first‑stage” processing, which is generally not labor intensive as we are simply cutting the metal to size. Because of this, the amount of related labor and overhead, including depreciation and amortization, is not significant and is excluded from our cost of sales. Therefore, our cost of sales is primarilysubstantially comprised of the cost of the material we sell. We use gross profit as shown above as a measure of operating performance. Gross profit is an important operating and financial measure, as fluctuations in our gross profit can have a significant impact on our earnings. Gross profit, as presented, is not necessarily comparable with similarly titled measures for other companies. |
| (2) | | Operating expenses include warehouse, delivery, selling, general and administrative expenses, depreciation and amortization expense, and impairment of long-lived assets. In 2015, 2014, 2013 and 2012, operating expenses include various non‑recurring charges, including impairment charges in 2015, 2013 and 2012.
|
| (3)
| | Long‑term debt includes the long‑term portion of capital lease obligations. |
| (3) | | Income tax (benefit) provision includes a provisional $207.3 million net tax benefit in 2017 relating to the Tax Cuts and Jobs Act of 2017. See Note 9 — “Income Taxes” of Part II, Item 8 “Financial Statements and Supplementary Data” for further information on the impact of the tax legislation. |
Item 7. Management’s Discussion and Analysis of Financial Condition and Results of Operations
MANAGEMENT’S DISCUSSION AND ANALYSIS OF
FINANCIAL CONDITION AND RESULTS OF OPERATIONS
This Management’s Discussion and Analysis of Financial Condition and Results of Operations should be read in conjunction with ourthe other sections of this Annual Report on Form 10-K, including the consolidated financial statements and related notes contained in Item 8, and the discussion of cautionary statements and significant risks to the Company’s business under Item 1A. “Risk1A “Risk Factors” of this Annual Report on Form 10-K.
Overview
We demonstrated strong operationalhad excellent execution throughout 2015 despite a very challenging economic environment that continued2017 resulting in record gross profit. Our sales increased $1.11 billion, or 12.9%, from $8.61 billion in 2016 to pressure metals pricing. Our 2015$9.72 billion in 2017, the second highest annual sales in our history. Both pricing and demand levels improved from 2016. Pricing levels were $9.35 billion, down 10.5% from our 2014 sales of $10.45 billion. Demand declined somewhathigher in 2015 as2017 compared to 2014, but was still relatively healthy outsidethe same period in 2016 for substantially all of the energy end market. Pricing levels declined significantly, especially for carbon (52% of our sales) and stainless steel (14% of our sales) products we sell, which had a materialfavorable impact on our revenues and profits. Despite the challenges of declining pricing, weearnings. We achieved several operational successes in 2015:2017:
| · | | We generated record cash flow from operations of $1.03 billion;Gross profit was $2.79 billion in 2017, the highest in our history;
|
| · | | We increased our FIFOOur gross profit margin in each successive quarter of 2015;2017 was within or above our target range of 27% to 29%;
|
| · | | Pre-tax income increased by $154.6 million, or 36.0%, from $429.2 million in 2016 to $583.8 million in 2017; and |
| · | | We reducedOur earnings per diluted share were $8.34 per share. Excluding the impact of tax reform, our FIFO inventory by $433.1 million.earnings per share were $5.52 per share, the second highest in our history, trailing only 2008.
|
These operational successes fueled our strong cash from operations which we used to (i) further the growth of our Company with $172.1 million of capital expenditures; (ii) improve our leverage position by paying down $376.6 million of debt; and (iii) enhance our stockholder returns with $120.1 million of dividends to stockholders and $355.5 million of share repurchases.
Our same-store tons decreased 3.2%sold increased 3.6% in 20152017 compared to 2014, well ahead of the industry decline of 7.5% reported by the Metals Service Center Institute (“MSCI”). We believe our outperformance is attributable to our focus on small orders requiring high levels of quality and service on a just-in-time basis, as well as an increase in market share2016, due to our industry-leading investmentsimproved demand levels in our facilitiesmost end markets we serve, including the energy end market, which had experienced significant declines in 2016 and processing capabilities.2015.
Our same-store average selling price per ton sold declined sequentiallyincreased 9.1% in each month from September 2014 through December 2015. Mill prices for many of our products ended 2015 down 30% to 40%2017 compared to the beginning of the year due to continued high levels of import material coming into the U.S. market as a result of the strong U.S. Dollar and weak global economies. However, our2016. Our same-store average selling price declined only 10.3% in 2015 compared to 2014 due to our disciplined sales strategy; focus on small, quick-turn orders; value-added processing; and effective inventory management. We would normally expect to experience declines in our gross profit margin in an environment marked by significant declines in metal prices; however, despite metals pricing decliningper ton sold has increased sequentially in each successive quarter in 2015, execution of our disciplined operating strategy in 2015 allowed us to increase our gross profit margin in each successive quarter of 2015.
Effective January 1, 2016, we acquired TSI, a distributor and processor ofthe past seven quarters, mainly for certain carbon alloy and stainless steel pipe, tubingproducts. Metal prices fluctuated throughout 2017 but generally trended higher, especially in the second half of 2017, which we believe was primarily due to improved demand and bar products. TSI brings additional high-margin, specialty products to our mix and fits our growth strategy of investing in higher returning businesses, while expanding our product breadth and end-market diversification. TSI’s 2014 net sales were approximately $200.0 million.increased raw material costs.
Our same-store S,G&A expense as a percent of sales of 19.5% in 2017 decreased from 20.8% in 2016 mainly due to higher metals pricing that increased our sales levels. In addition, we exercised effective working capital management in 2015, including a $433.1 million reduction of our FIFO inventory, resulted in recordexpense control.
We generated cash flow from operations of $1.03 billion. We ended 2015 with a strong balance sheet$399.0 million in 2017, down from $626.5 million in 2016, primarily due to increased working capital requirements from higher metal prices and ample liquidity for continued growth through organic investments and acquisitions, continued returns to shareholders through dividends and opportunistic share repurchases, and further improvementan improved demand environment in 2017. As of December 31, 2017, our balance sheet through debt reductions.
net debt-to-total capital ratio was 27.2%, down from 30.3% as of December 31, 2016. We believe we have significantly higher earnings capacitysufficient liquidity as of December 31, 2017, with $908.7 million available for borrowing on our revolving credit facility.
We used cash generated from operations to further grow the Company in 2017 by completing one acquisition and investing $161.6 million in capital expenditures, while also returning value to our stockholders with $132.0 million of cash dividends and $25.0 million of share repurchases. In addition, during the first quarter of 2018 we increased our quarterly dividend by 11.1%.
The recently enacted tax reform legislation will have a favorable impact on our profitability and cash flows through a reduction in our effective income tax rate. In 2017, we recognized a provisional $207.3 million net tax benefit relating to the remeasurement of deferred tax assets and liabilities at the lowered income tax rate, which will be realized when metals pricing increases from current levels and whenwas partially offset by tax liabilities relating to the non‑residential construction market shows meaningful improvement.deemed repatriation of accumulated foreign profits. Earnings per diluted share, excluding the impact of tax reform, is not a performance measure under U.S. GAAP. We believe that our it is appropriate to disclose this performance measure as it helps investors analyze business performance and trends. Earnings per diluted share, excluding the impact of tax reform, should be considered neither in isolation nor as a substitute for reported earnings per diluted share prepared in accordance with U.S. GAAP.
We believe that our exposure to diverse end markets, broad product base and wide geographic footprint will continue to mitigate earnings volatility compared to many of our competitors.
We will continue to focus on working capital management and maximizing profitability of our existing businesses. Our operating andbusinesses, as well as executing our proven growth strategies have helped us achieve industry‑leading operating results on a consistent basis, and we remain confident in our ability to maintain our track record of success going forward.stockholder return activities.
Effect of Demand and Pricing Changes on our Operating Results
Customer demand can have a significant impact on our results of operations. When volume increases our revenue dollars generally increase, which contributes to increased gross profit dollars. Variable costs also increase with volume, including increases inprimarily our warehouse, delivery, selling, general and administrative expenses. Conversely, when volume declines, we typically produce fewer revenue dollars, which can reduce our gross profit dollars. We can reduce certain variable expenses when volumes decline, but we cannot easily reduce our fixed costs.
Pricing for our products can have a much more significant impact on our results of operations than customer demand levels. As pricing increases, so do our revenue dollars. Our pricing usually increases when the cost of our materials increase. We are typically able to pass higher prices on to our customers. If prices increase and we maintain the same gross profit percentage, we generate higher levels of gross profit and pre‑tax income dollars for the same operational efforts. Conversely, if pricing declines, we will typically generate lower levels of gross profit and pre‑tax income dollars. Because changes in pricing do not require us to adjust our expense structure other than for profit‑based compensation, the impact on our results of operations from changes in pricing is typically much greater than the effect of volume changes.
In addition, when volume or pricing increases, our working capital (primarily accounts receivable and inventories) requirements typically increase, resulting in lower levels of cash flow from operations, which may also require us to increase our outstanding debt and incur higher interest expense. Conversely, when our customer demand falls, weour operations typically generate stronger levels of cash flow from operations as our working capital needs decrease.
Acquisitions
2017 Acquisition
On October 2, 2017, through our wholly owned subsidiary Diamond Manufacturing Company, we acquired Ferguson Perforating Company (“Ferguson”). Ferguson, headquartered in Providence, Rhode Island, specializes in manufacturing highly engineered and complex perforated metal parts that have application in diverse end markets including industrial machinery, automotive, aerospace, sugar products and consumer electronics manufacturers. Ferguson’s net sales during the period from October 2, 2017 to December 31, 2017 were $7.8 million.
2016 AcquisitionAcquisitions
On August 1, 2016, through our wholly owned subsidiary American Metals Corporation, we acquired Alaska Steel Company (“Alaska Steel”), a full-line metal distributor headquartered in Anchorage, Alaska. Our acquisition of Alaska Steel was our first entry into the Alaska market. Alaska Steel provides steel, aluminum, stainless and specialty metals and related processing services to a variety of customers in diverse industries including infrastructure and energy throughout Alaska. Alaska Steel’s net sales in 2017 were $22.0 million.
On April 1, 2016, we acquired Best Manufacturing, Inc. (“Best Manufacturing”), a custom sheet metal fabricator of steel and aluminum products on both a direct and toll basis. Best Manufacturing, headquartered in Jonesboro, Arkansas, provides various precision fabrication services including laser cutting, shearing, computer numerated control (“CNC”) punching, CNC forming and rolling, as well as welding, assembly, painting, inventory management and engineering expertise. Best Manufacturing’s net sales in 2017 were $21.6 million.
On January 1, 2016, we acquired Tubular Steel, Inc. (“TSI”Tubular Steel”), a distributor and processor of carbon, alloy and stainless steel pipe, tubing and bar products. TSI,Tubular Steel, headquartered in St. Louis, Missouri, has sevensix locations and a fabrication business that supports its diverse customer base. For the year ended December 31, 2014, TSI’sTubular Steel’s net sales in 2017 were approximately $200.0$135.5 million.
2014 Acquisitions
On December 1, 2014, we acquired Fox Metals and Alloys, Inc. ("Fox"), a Houston, Texas-based steel distributor specializing in alloy, carbon and stainless steel bar and plate products, primarily servicing OEMs and machine shops that manufacture or support the manufacturing of equipment for the oil, gas and petrochemical industries. Fox's in-house processing services include saw cutting, plate burning and testing. Net sales of Fox in 2015 were $21.6 million.
On August 1, 2014, we acquired Aluminium Services UK Limited, the parent holding company of All Metal Services (“AMS”). AMS provides comprehensive materials management solutions to aerospace and defense OEMs and their subcontractors on a global basis, supporting customers in more than 40 countries worldwide. AMS offers a broad range of aerospace metals including aluminum, steel, titanium, nickel alloys and aluminum bronze, offering full or cut to size materials. AMS also offers in-house machining and water-jet cutting for more complex requirements. AMS has eight locations in four countries including China, France, Malaysia, and the United Kingdom. Net sales of AMS in 2015 were $257.6 million.
On August 1, 2014, we acquired Northern Illinois Steel Supply Co. ("NIS"), a value-added distributor and fabricator of a variety of steel and non-ferrous metal products, primarily structural steel components and parts, located in Channahon, Illinois. Net sales of NIS in 2015 were $19.9 million.
2013 Acquisitions
On November 1, 2013, through our wholly owned subsidiary American Metals Corporation, we acquired Haskins Steel Co., Inc. (“Haskins Steel”), located in Spokane, Washington. Founded in 1955, Haskins Steel processes and distributes primarily carbon steel and aluminum products of various shapes and sizes to a diverse customer base in the Pacific Northwest. Their in‑house processing capabilities include shearing, sawing, burning and forming. Net sales of Haskins Steel in 2015 were $26.0 million.
On April 30, 2013, we acquired Travel Main Holdings, LLC (“Travel Main”), a real estate holding company with a portfolio of 18 real estate properties, all of which are leased by certain of our subsidiaries. The transaction value of $78.9 million included the assumption of $43.8 million of indebtedness. The cash portion of the purchase price was funded with borrowings on our revolving credit facility.
On April 12, 2013, we acquired Metals USA Holdings Corp. (“Metals USA”). Metals USA is one of the largest metals service center businesses in the United States and a leading provider of value‑added processed aluminum, brass, copper, carbon steel, stainless steel, manufactured metal components and inventory management services. Metals USA sells its products and services to a diverse customer base and broad range of end markets, including the aerospace, auto, defense, heavy equipment, marine transportation, commercial construction, office furniture manufacturing, energy and oilfield service industries, among several others. This acquisition added a total of 41 service centers strategically located throughout the United States to our existing operations and complements our existing customer base, product mix and geographic footprint. Net sales of Metals USA in 2015 were $1.54 billion.
On May 16, 2014, we sold Metals USA’s non-core roofing business for net proceeds of approximately $26.2 million and recorded a pre-tax loss of approximately $1.1 million, which is included in Other (expense) income, net. Net sales of Metals USA’s non-core roofing business for 2014 and during the period from April 13, 2013 through December 31, 2013 were $9.6 million and $25.4 million, respectively.
Internal Growth Activities
We continued to maintain our focus on internal growth by opening new facilities, building or expanding existing facilities and adding processing equipment with total capital expenditures of $172.2$161.6 million in 2015,2017, with the majority spent on growth activities. We addedalso continued to add and upgradedupgrade processing equipment to enablethat enables us to provide higher quality and additional services to our existing and potential customers, resulting in increased market share and higher gross profit margins. We believe that our ability to finance our investments in processing equipment and facilities provides a competitive advantage for us, as we can provide our customers with a higher quality product and expand our services to them, which many of our competitors do not have the ability to provide.
Results of Operations
The following table sets forth certain income statement data for each of the last three years ended December 31, 2015 (dollars are shown in millions and certain amountspercentages may not calculate due to rounding):
| | | | | | | | | | | | | | | | | | | | | | | | | | | | | | | | | | |
| 2015 | | | 2014 | | | 2013 | | 2017 | | | 2016 | | | 2015 | |
| | | | % of | | | | | | % of | | | | | | % of | | | | | % of | | | | | | % of | | | | | | % of | |
| $ | | Net Sales | | | $ | | Net Sales | | | $ | | Net Sales | | $ | | Net Sales | | | $ | | Net Sales | | | $ | | Net Sales | |
| | | | | | | | | | | | | | | | | | | | | | | | | | | | | | | | | | |
Net sales | $ | 9,350.5 | | 100.0 | % | | $ | 10,451.6 | | 100.0 | % | | $ | 9,223.8 | | 100.0 | % | $ | 9,721.0 | | 100.0 | % | | $ | 8,613.4 | | 100.0 | % | | $ | 9,350.5 | | 100.0 | % |
Cost of sales (exclusive of depreciation and amortization expense shown below) | | 6,803.6 | | 72.8 | | | | 7,830.6 | | 74.9 | | | | 6,826.2 | | 74.0 | | | 6,933.2 | | 71.3 | | | | 6,023.1 | | 69.9 | | | | 6,803.6 | | 72.8 | |
Gross profit (1) | | 2,546.9 | | 27.2 | | | | 2,621.0 | | 25.1 | | | | 2,397.6 | | 26.0 | | |
Gross profit (2) | | | 2,787.8 | | 28.7 | | | | 2,590.3 | | 30.1 | | | | 2,546.9 | | 27.2 | |
Warehouse, delivery, selling, general and administrative expense ("S,G&A") (2)(3) | | 1,728.5 | | 18.5 | | | | 1,789.8 | | 17.1 | | | | 1,638.4 | | 17.8 | | | 1,902.8 | | 19.6 | | | | 1,798.1 | | 20.9 | | | | 1,725.3 | | 18.5 | |
Depreciation expense | | 164.8 | | 1.8 | | | | 157.1 | | 1.5 | | | | 137.5 | | 1.5 | | | 167.8 | | 1.7 | | | | 167.9 | | 1.9 | | | | 164.8 | | 1.8 | |
Amortization expense | | 53.7 | | 0.6 | | | | 56.7 | | 0.5 | | | | 54.9 | | 0.6 | | | 50.6 | | 0.5 | | | | 54.1 | | 0.6 | | | | 53.7 | | 0.6 | |
Impairment of long-lived assets | | 53.3 | | 0.6 | | | | — | | — | | | | 14.9 | | 0.2 | | | 4.2 | | — | | | | 52.4 | | 0.6 | | | | 53.3 | | 0.6 | |
| | | | | | | | | | | | | | | | | | | | | | | | | | | | | | | | | | |
Operating income | $ | 546.6 | | 5.8 | % | | $ | 617.4 | | 5.9 | % | | $ | 551.9 | | 6.0 | % | |
Operating income (3) | | $ | 662.4 | | 6.8 | % | | $ | 517.8 | | 6.0 | % | | $ | 549.8 | | 5.9 | % |
| (1) | | Cost of sales included $12.8 million of inventory-related restructuring charges relating to the planned closure or sale of certain locations in 2016. |
| (2) | | Gross profit, calculated as net sales less cost of sales, and gross profit margin, calculated as gross profit divided by net sales, are non‑GAAP financial measures as they exclude depreciation and amortization expense associated with the corresponding sales. The majority of our orders are basic distribution with no processing services performed. For the remainder of our sales orders, we perform “first‑stage” processing, which is generally not labor intensive as we are simply cutting the metal to size. Because of this, the amount of related labor and overhead, including depreciation and amortization, is not significant and is excluded from our cost of sales. Therefore, our cost of sales is primarilysubstantially comprised of the cost of the material we sell. We use gross profit and gross profit margin as shown above as measures of operating performance. Gross profit and gross profit margin are important operating and financial measures as their fluctuations can have a significant impact on our earnings. Gross profit and gross profit margin, as presented, are not necessarily comparable with similarly titled measures for other companies. |
| (2)(3)
| | S,G&A includes a non‑recurring $8.6 million litigation settlement gain inThe 2016 and 2015 and $23.2 millionamounts have been retrospectively adjusted pursuant to our adoption of charges related to settled litigation offset by $11.2 million gainsaccounting changes related to the salepresentation of non-core real estatenet periodic pension cost and other assets in 2014.net periodic postretirement benefit cost. See Note 1 to the Consolidated Financial Statements for further information.
|
Year Ended December 31, 2015 Compared to Year Ended December 31, 2014
Net Sales
| | | | | | | | | | | |
| Year Ended December 31, | | Dollar | | Percentage | |
| 2015 | | 2014 | | Change | | Change | |
| (in millions) | | | | | | |
Net sales | $ | 9,350.5 | | $ | 10,451.6 | | $ | (1,101.1) | | (10.5) | % |
Net sales, same-store | $ | 9,022.8 | | $ | 10,325.8 | | $ | (1,303.0) | | (12.6) | % |
| (4) | | See “Expenses” below for discussion of our impairment charges. |
| | | | | | | | | | | |
| Year Ended December 31, | | Tons | | Percentage | |
| 2015 | | 2014 | | Change | | Change | |
| | | | | | | | | | | |
| (in thousands) | | | | | |
Tons sold | 5,918.9 | | 6,086.9 | | (168.0) | | (2.8) | % |
Tons sold, same-store | 5,871.5 | | 6,067.9 | | (196.4) | | (3.2) | % |
Year Ended December 31, 2017 Compared to Year Ended December 31, 2016
Net Sales
| | | | | | | | | | | |
| Year Ended December 31, | | Price | | Percentage | |
| 2015 | | 2014 | | Change | | Change | |
Average selling price per ton sold | $ | 1,572 | | $ | 1,719 | | $ | (147) | | (8.6) | % |
Average selling price per ton sold, same-store | $ | 1,529 | | $ | 1,704 | | $ | (175) | | (10.3) | % |
| | | | | | | | | | | |
| Year Ended December 31, | | Dollar | | Percentage | |
| 2017 | | 2016 | | Change | | Change | |
| (in millions) | | | | | | |
Net sales | $ | 9,721.0 | | $ | 8,613.4 | | $ | 1,107.6 | | 12.9 | % |
Net sales, same-store | $ | 9,534.1 | | $ | 8,475.0 | | $ | 1,059.1 | | 12.5 | % |
| | | | | | | | | | | |
| Year Ended December 31, | | Tons | | Percentage | |
| 2017 | | 2016 | | Change | | Change | |
| (in thousands) | | | | | | |
Tons sold | | 6,053.4 | | | 5,832.9 | | | 220.5 | | 3.8 | % |
Tons sold, same-store | | 5,967.3 | | | 5,761.9 | | | 205.4 | | 3.6 | % |
| | | | | | | | | | | |
| Year Ended December 31, | | Price | | Percentage | |
| 2017 | | 2016 | | Change | | Change | |
Average selling price per ton sold | $ | 1,599 | | $ | 1,465 | | $ | 134 | | 9.1 | % |
Average selling price per ton sold, same-store | $ | 1,590 | | $ | 1,458 | | $ | 132 | | 9.1 | % |
Tons sold and average selling price per ton sold amounts exclude our toll processing sales (as we process the metal for a fee, without taking ownership of the metal). Same‑store amounts exclude the results of our 20142017 and 2016 acquisitions.
Our consolidated net sales andin 2017 were our second highest ever. Our sales in 2017 were higher compared to 2016 due to both higher tons sold are lowerand higher metals prices. Prices for most products we sell improved in 20152017 compared to 2014, mainly due to lower metals pricing due to continued high levels2016. Our same-store average selling price per ton sold has increased sequentially in each of imported metal products intothe past seven quarters. U.S. mill price increases have been supported by increases in raw material costs, including scrap.
The automotive (primarily through our toll processing operations in the U.S. because of the strength of the U.S. dollar coupled with weak global economies, and the significant decline in volume sold to the energy (oilMexico) and gas) market. In general, business activity in almost all of ouraerospace end markets other than the energy market was relatively stable in 2015 compared to 2014 as our tons sold, excluding the impact of our businesses exclusively servicing the energy market, declined only 0.7%. Our 2015 same-store tons sold decreased 3.2%, which outpaced the industry data reported by the MSCI, which was down 7.5% in 2015 compared to 2014. We believe our better than industry average performance reflects an increase in market share for Reliance.
End markets that continued to perform well for us during 2015 compared to 2014 were auto, primarily through our toll processing businesses in 2017. Heavy industry demand remained relatively steady at the U.S. and Mexico, and aerospace. Manufacturing and heavy industry performed fairly welllow levels we experienced in the markets we service. Our tons sold to the energy market declined approximately 41% in 2015 compared to 2014. Non‑residential2016. Non-residential construction our largest end market,demand, including infrastructure, continued to improve modestly during 2015, albeitits slow improvement, although it remains at significantly reduced demand levels from its peak levels experienced in 2006. Demand for the products we sell to the energy (oil and gas) end market improved in 2017 compared to 2016, but remains significantly lower than the recent peak in 2014.
Since we primarily purchase and sell our inventories in the “spot” market, the changes in our average selling prices generally fluctuate in accordance with the changes in the costs of the various metals we purchase. The mix of products sold can also have an impact on our average selling prices.
Our same-store average selling price per ton sold in 2015 was down 8.6% compared to 20142017 increased 9.1% from 2016 given decreasedincreased mill pricing for most products throughout the year, most notably carbon and stainless steel. Our same-store average selling price declined sequentially in each month beginning in September 2014 through December 2015. Mill prices for many of the products we sell are down 30%-40% due to continued high levels of imports into the U.S. because of a strong U.S. dollar and weak global economy, with a significant global macroeconomic impact in the second half of 2015 from the economic slowdown in China.
Our major commodity selling prices changed in 2015 from 2014 levels as follows:
| | | | | | | |
| | | | | | | |
| | | | Same-store | | |
| | Average Selling | | | Average Selling | | |
| | Price per Ton Sold | | | Price per Ton Sold | | |
| | (percentage change) | |
Carbon steel | | (10.3) | % | | (10.4) | % | |
Aluminum | | 1.8 | % | | (0.9) | % | |
Stainless steel | | (9.1) | % | | (9.4) | % | |
Alloy | | (5.4) | % | | (5.8) | % | |
sell. As carbon steel sales represent approximately 52% of our sales dollars, changes in carbon steel prices have the most significant impact on changes in our overall average selling price per ton sold.
Our major commodity selling prices changed year-over-year from 2016 to 2017 as follows:
| | | | | |
| | Same-store | |
| Average Selling | | | Average Selling | |
| Price per Ton Sold | | | Price per Ton Sold | |
| (percentage change) | |
Carbon steel | 10.2 | % | | 10.0 | % |
Aluminum | 4.3 | % | | 4.2 | % |
Stainless steel | 13.0 | % | | 12.9 | % |
Alloy | 2.6 | % | | 2.4 | % |
Cost of Sales
| | | | | | | | | | | | | | | |
| Year Ended December 31, | | | | | | |
| 2015 | | 2014 | | | | | | |
| | | | % of | | | | | % of | | Dollar | | Percentage | |
| $ | | Net Sales | | $ | | Net Sales | | Change | | Change | |
| (dollars in millions) | | | | | |
Cost of sales | $ | 6,803.6 | | 72.8 | % | $ | 7,830.6 | | 74.9 | % | $ | (1,027.0) | | (13.1) | % |
| | | | | | | | | | | | | | | | | |
| | | | | | | | | | | | | | | | | |
| Year Ended December 31, | | | | | | | |
| 2017 | | | 2016 | | | | | | | |
| | | | % of | | | | | | % of | | | Dollar | | Percentage | |
| $ | | Net Sales | | | $ | | Net Sales | | | Change | | Change | |
| (dollars in millions) | | | | | | |
Cost of sales | $ | 6,933.2 | | 71.3 | % | | $ | 6,023.1 | | 69.9 | % | | $ | 910.1 | | 15.1 | % |
The decreaseincrease in cost of sales in 20152017 compared to 20142016 is mainly due to decreases in ourhigher tons sold and a lowerhigher average selling pricecost per ton sold. See “Net Sales” above for trends in both demand and costs of our products.
OurCost of sales in 2016 included $12.8 million of inventory-related restructuring charges relating to the planned closure or sale of certain locations.
Also, our last‑in, first‑out (“LIFO”) method inventory valuation reserve adjustment, which is included in cost of sales and, in effect, reflects cost of sales at current replacement costs, resulted in credits,a charge, or income,expense, of $186.1$30.7 million which was offset by a $69.1 million chargein 2017 compared to record LIFO inventories at the lower of cost or market. The net LIFO inventory valuation adjustment was a credit, or income, of $117.0$35.0 million in 2015 compared to a charge, or expense of $54.5 million in 2014. 2016.
Our LIFO inventory valuation reserve was a credit of $21.8 million as of December 31, 20152017 and 2014 was $26.1a debit, net of lower of cost or market adjustments, of $8.9 million and $143.1 million, respectively. Loweras of December 31, 2016. Higher metal costs in our inventory as of December 31, 20152017 as compared to December 31, 20142016 resulted in LIFO incomeexpense in 2015.2017.
Gross Profit
| | | | | | | | | | | | | | | |
| Year Ended December 31, | | | | | | |
| 2015 | | 2014 | | | | | | |
| | | | % of | | | | | % of | | Dollar | | Percentage | |
| $ | | Net Sales | | $ | | Net Sales | | Change | | Change | |
| (dollars in millions) | | | | | |
Gross profit | $ | 2,546.9 | | 27.2 | % | $ | 2,621.0 | | 25.1 | % | $ | (74.1) | | (2.8) | % |
| | | | | | | | | | | | | | | | | |
| | | | | | | | | | | | | | | | | |
| Year Ended December 31, | | | | | | | |
| 2017 | | | 2016 | | | | | | | |
| | | | % of | | | | | | % of | | | Dollar | | Percentage | |
| $ | | Net Sales | | | $ | | Net Sales | | | Change | | Change | |
| (dollars in millions) | | | | | | |
Gross profit | $ | 2,787.8 | | 28.7 | % | | $ | 2,590.3 | | 30.1 | % | | $ | 197.5 | | 7.6 | % |
DecreasedOur gross profit increased in 2017 compared to 2016 due to higher tons sold and a lower average selling price per ton sold negatively impactedhigher metals prices. Our gross profit dollars. However, gross profit margins increased in each sequential quarter of 2015 mainly due to2017 was the highest in our disciplined operational execution that focuses on small, quick-turn orders and value-added processing along with improved inventory management.history. See “Net Sales” and “Cost of Sales” for further discussion on product pricing trends and our LIFO inventory valuation reserve adjustments, respectively.
Expenses
| | | | | | | | | | | | | | | |
| Year Ended December 31, | | | | | | |
| 2015 | | 2014 | | | | | | |
| | | | % of | | | | | % of | | Dollar | | Percentage | |
| $ | | Net Sales | | $ | | Net Sales | | Change | | Change | |
| (dollars in millions) | | | | | |
S,G&A expense | $ | 1,728.5 | | 18.5 | % | $ | 1,789.8 | | 17.1 | % | $ | (61.3) | | (3.4) | % |
S,G&A expense, same-store | $ | 1,678.0 | | 18.6 | % | $ | 1,770.1 | | 17.1 | % | $ | (92.1) | | (5.2) | % |
Depreciation & amortization expense | $ | 218.5 | | 2.3 | % | $ | 213.8 | | 2.0 | % | $ | 4.7 | | 2.2 | % |
Impairment of long-lived assets | $ | 53.3 | | 0.6 | % | $ | — | | — | % | $ | 53.3 | | ** | |
** Percentage data not meaningful | | | | | | | | | | | | | | | |
Same‑store amounts excludeOur gross profit margin in 2016 benefited from a rising metals price environment during which we were able to pass higher prices on to our customers before we received the resultshigher cost metal in our inventory. The pricing environment in 2017 was more competitive than in 2016 given the mid-year market reaction to potential tariffs on certain metals products under Section 232 of the Trade Expansion Act of 1962, which contributed to the slight decrease in our gross profit margin. Our gross profit margin in 2017 was near the high end of our 2014 acquisitions.target range of 27% to 29%.
Our S,G&A expense decreased mainly due to our cost cutting efforts and decreased tons sold, especially at our energy-related businesses, typically through reductions in workforce with a 5.8% reduction in workforce as of December 31, 2015 as compared to January 1, 2015, on a 2.8% decrease in tons sold. In addition, our S,G&A expense includes a non‑recurring $8.6 million litigation settlement gain in 2015 and $23.2 million of charges related to settled litigation offset
by $11.2 million gains related
Expenses
| | | | | | | | | | | | | | | | | |
| Year Ended December 31, | | | | | | | |
| 2017 | | | 2016 | | | | | | | |
| | | | % of | | | | | | % of | | | Dollar | | Percentage | |
| $ | | Net Sales | | | $ | | Net Sales | | | Change | | Change | |
| (dollars in millions) | | | | | | |
S,G&A expense | $ | 1,902.8 | | 19.6 | % | | $ | 1,798.1 | | 20.9 | % | | $ | 104.7 | | 5.8 | % |
S,G&A expense, same-store | $ | 1,856.0 | | 19.5 | % | | $ | 1,759.2 | | 20.8 | % | | $ | 96.8 | | 5.5 | % |
Depreciation & amortization expense | $ | 218.4 | | 2.2 | % | | $ | 222.0 | | 2.6 | % | | $ | (3.6) | | (1.6) | % |
Impairment of long-lived assets | $ | 4.2 | | — | % | | $ | 52.4 | | 0.6 | % | | $ | (48.2) | | (92.0) | % |
Same‑store amounts exclude the results of our 2017 and 2016 acquisitions.
The increase in our S,G&A expense in 2017 compared to the sale2016 is primarily due to increases in certain warehouse and delivery expenses due to higher shipment levels and increased transportation costs from rising fuel prices, and increases in profit-based incentive compensation, as a result of non-core assets and other assetshigher levels of profitability, as well as general inflationary factors including annual wage increases. The decrease in 2014. Ourour S,G&A expense as a percentpercentage of net sales increased due to the decline in average selling prices.
The increase in depreciation and amortization expense was mainlyis due to our 2014 acquisitions and depreciation expense from our recent capital expenditures.higher sales levels, as a result of higher metals pricing.
We recorded a $53.3$4.2 million charge for the impairment of long-lived assets primarilyin 2017 compared to a $52.4 million charge in 2016. The 2016 charge mainly related to certain of our energy-related businesses as a result of low crude oil prices resulting in a significant decline in the demand for the products we sell to the energy (oil and gas) end market. This includes charges directly related to closures of certain of our energy-related businesses where we anticipate losses on the recovery of certain assets and intangible asset write-downs due to the loss of customers and lowered expectations of future profitability. Please refer to Note 1817 — “Impairment and Restructuring Charges”of Long-Lived Assets” of Part II, Item 8 "Financial Statements and Supplementary Data" for further information on our 20152017 and 2016 impairment charge.charges.
Operating Income
| | | | | | | | | | | | | | | |
| | | | | | | | | | | | | | | |
| Year Ended December 31, | | | | | |
| 2015 | | 2014 | | | | | |
| | | | % of | | | | | % of | | Dollar | | Percentage | |
| $ | | Net Sales | | $ | | Net Sales | | Change | | Change | |
| (dollars in millions) | | | | | |
Operating income | $ | 546.6 | | 5.8 | % | $ | 617.4 | | 5.9 | % | $ | (70.8) | | (11.5) | % |
| | | | | | | | | | | | | | | | | |
| Year Ended December 31, | | | | | | | |
| 2017 | | | 2016 | | | | | | | |
| | | | % of | | | | | | % of | | | Dollar | | Percentage | |
| $ | | Net Sales | | | $ | | Net Sales | | | Change | | Change | |
| (dollars in millions) | | | | | | |
Operating income | $ | 662.4 | | 6.8 | % | | $ | 517.8 | | 6.0 | % | | $ | 144.6 | | 27.9 | % |
Our operating income was lowerhigher in 20152017 compared to 20142016 primarily due mainly to a decline in net sales that led to decreasedhigher gross profit dollars from both higher tons sold and anhigher average selling prices and lower impairment charge.and restructuring charges. Our operating income margin was relatively stableincreased due to the decline in 2015 as compared to 2014 as our higher gross profit margins were offset by an increase in operating expensesS,G&A expense and impairment and restructuring charges as a percentage of our net sales resulting from declinesoutweighing the decline in our average selling prices and an impairment charge.gross profit margin. See “Net Sales” above for trends in both demand and costs of our products and “Expenses” for trends in our operating expenses.
Other Income (Expense)
| | | | | | | | | | | | | | | |
| | | | | | | | | | | | | | | |
| Year Ended December 31, | | | | | |
| 2015 | | 2014 | | | | | |
| | | | % of | | | | | % of | | Dollar | | Percentage | |
| $ | | Net Sales | | $ | | Net Sales | | Change | | Change | |
| (dollars in millions) | | | | | |
Interest | $ | (84.3) | | (0.9) | % | $ | (81.9) | | (0.8) | % | $ | (2.4) | | 2.9 | % |
Other income (expense), net | $ | (3.6) | | — | % | $ | 10.8 | | 0.1 | % | $ | (14.4) | | (133.3) | % |
The change in other (expense) income, net in 2015 compared to 2014 was primarily due to an $11.4 million gain relating to our 2014 acquisition of Acero Prime S. de R.L. de C.V. (“Acero Prime”) achieved in stages. For further discussion of our acquisition of Acero Prime, see Note 3 — “Joint Ventures and Noncontrolling Interests” of Part II, Item 8 "Financial Statements and Supplementary Data”.Expense
Income Tax Rate
Our effective income tax rate in 2015 and 2014 was 31.1%.
| | | | | | | | | | | | | | | | | |
| Year Ended December 31, | | | | | | | |
| 2017 | | | 2016 | | | | | | | |
| | | | % of | | | | | | % of | | | Dollar | | Percentage | |
| $ | | Net Sales | | | $ | | Net Sales | | | Change | | Change | |
| (dollars in millions) | | | | | | |
Interest expense | $ | 73.9 | | 0.8 | % | | $ | 84.6 | | 1.0 | % | | $ | (10.7) | | (12.6) | % |
Other expense, net | $ | 4.7 | | — | % | | $ | 4.0 | | — | % | | $ | 0.7 | | 17.5 | % |
Interest expense was lower in 2017 compared to 2016 due to the repayment in November 2016 of $350.0 million in aggregate principal amount of senior unsecured notes bearing interest at the rate of 6.20% per annum with borrowings under our credit agreement that have lower weighted average interest rates.
Income Tax Rate
Our effective income tax rate in 2017 was (6.4)% compared to our 2016 rate of 28.0%. Our 2017 income tax rate was favorably impacted by the “Tax Cuts and Jobs Act of 2017” (“Tax Reform”). Our 2016 tax rate was favorably impacted by the settlement of a tax position that was previously uncertain. We recognized a provisional net tax benefit of $207.3 million in 2017 relating to Tax Reform. Excluding the impact of Tax Reform and the tax settlement, our effective tax rates for 2017 and 2016 were 29.1% and 32.1%, respectively. Other permanent items that lowered our effective income tax rates from the U.S. federal statutory rate were not materially different during both years and relate mainly to company-owned life insurance policies, domestic production activities deductions and foreign income levels that are taxed at rates lower than the U.S. statutory rate of 35%. Please refer to Note 9 — “Income Taxes” of Part II, Item 8 "Financial Statements and Supplementary Data" for further information on the impact of Tax Reform.
Net Income
| | | | | | | | | | | | | | | |
| | | | | | | | | | | | | | | |
| Year Ended December 31, | | | | | |
| 2015 | | 2014 | | | | | |
| | | | % of | | | | | % of | | Dollar | | Percentage | |
| $ | | Net Sales | | $ | | Net Sales | | Change | | Change | |
| (dollars in millions) | | | | | |
Net income attributable to Reliance | $ | 311.5 | | 3.3 | % | $ | 371.5 | | 3.6 | % | $ | (60.0) | | (16.2) | % |
The decrease in our net income and net income as a percentage of net sales was primarily the result of lower operating income due to the $53.3 million impairment of long-lived assets charge.
Year Ended December 31, 2014 Compared to Year Ended December 31, 2013
Net Sales
| | | | | | | | | | | |
| Year Ended December 31, | | Dollar | | Percentage | |
| 2014 | | 2013 | | Change | | Change | |
| (in millions) | | | | | | |
Net sales | $ | 10,451.6 | | $ | 9,223.8 | | $ | 1,227.8 | | 13.3 | % |
Net sales, same-store | $ | 8,513.6 | | $ | 7,981.7 | | $ | 531.9 | | 6.7 | % |
| | | | | | | | | | | |
| Year Ended December 31, | | Tons | | Percentage | |
| 2014 | | 2013 | | Change | | Change | |
| | | | | | | | | | | |
| (in thousands) | | | | | |
Tons sold | | 6,086.9 | | | 5,388.8 | | | 698.1 | | 13.0 | % |
Tons sold, same-store | | 4,789.1 | | | 4,513.8 | | | 275.3 | | 6.1 | % |
| | | | | | | | | | | |
| Year Ended December 31, | | Price | | Percentage | |
| 2014 | | 2013 | | Change | | Change | |
Average selling price per ton sold | $ | 1,719 | | $ | 1,712 | | $ | 7 | | 0.4 | % |
Average selling price per ton sold, same-store | $ | 1,780 | | $ | 1,769 | | $ | 11 | | 0.6 | % |
Tons sold and average selling price per ton sold amounts exclude our toll processing sales (as we process the metal for a fee, without taking ownership of the metal). Same‑store amounts exclude the results of our 2014 and 2013 acquisitions.
We achieved record sales of $10.45 billion in 2014. Our consolidated sales and tons sold were higher in 2014 compared to 2013, mainly due to our acquisition of Metals USA in April of 2013. Metals USA contributed $1.78 billion of sales in 2014 compared to $1.24 billion of sales in 2013. In general, business activity in almost all of our end markets was improved somewhat in 2014 compared to 2013 as our same‑store tons sold increased by 6.1%, which outpaced the industry data reported by the MSCI, which was up 4.2% in 2014. We believe our better than industry average performance reflected an increase in market share for Reliance.
End markets that continued to perform well for us during 2014 compared to 2013 were auto, primarily through our toll processing businesses in the U.S. and Mexico, and aerospace. Manufacturing also performed reasonably well. Our sales to the energy (oil and gas) market improved from 2013 levels through the nine months ended September 30, 2014, but began to decline in the 2014 fourth quarter as oil prices declined rapidly and our customers reduced spending. Non‑residential construction, our largest end market, continued to improve modestly during 2014, albeit at significantly reduced demand levels from its peak in 2006.
Since we primarily purchase and sell our inventories in the “spot” market, the changes in our average selling prices generally fluctuate in accordance with the changes in the costs of the various metals we purchase. The mix of products sold can also have an impact on our average selling prices.
Our average selling price in 2014 was up 0.4% compared to 2013 given increased mill pricing for most products throughout the year, most notably carbon and stainless steel. Carbon steel prices were higher throughout most of the year because of strong demand for carbon steel products, mainly for those sold to the auto market, as well as an improvement in demand for non‑residential construction products, especially for those projects sold directly by the mill (rather than through service centers). However, as we entered the fourth quarter of 2014, the normal seasonal slowdown, along with lower raw material prices, increased imports and a strong U.S. dollar put significant downward pressure on pricing for many steel products that has continued into 2015.
Cost of Sales
| | | | | | | | | | | | | | | |
| Year Ended December 31, | | | | | | |
| 2014 | | 2013 | | | | | | |
| | | | % of | | | | | % of | | Dollar | | Percentage | |
| $ | | Net Sales | | $ | | Net Sales | | Change | | Change | |
| (dollars in millions) | | | | | |
Cost of sales | $ | 7,830.6 | | 74.9 | % | $ | 6,826.2 | | 74.0 | % | $ | 1,004.4 | | 14.7 | % |
The increase in cost of sales in 2014 compared to 2013 was mainly due to increases in our tons sold resulting from our 2014 and 2013 acquisitions and higher mill pricing for most of our products. See “Net Sales” above for trends in both demand and costs of our products.
Our LIFO method inventory valuation reserve adjustment, which was included in cost of sales and, in effect, reflected cost of sales at current replacement costs, resulted in a charge, or expense, of $54.5 million in 2014 compared to a credit, or income, of $50.2 million in 2013. Our LIFO inventory valuation reserve as of December 31, 2014 and 2013 was $143.1 million and $88.6 million, respectively. Higher metal costs in our inventory as of December 31, 2014 as compared to December 31, 2013 resulted in LIFO expense in 2014.
Gross Profit
| | | | | | | | | | | | | | | |
| Year Ended December 31, | | | | | | |
| 2014 | | 2013 | | | | | | |
| | | | % of | | | | | % of | | Dollar | | Percentage | |
| $ | | Net Sales | | $ | | Net Sales | | Change | | Change | |
| (dollars in millions) | | | | | |
Gross profit | $ | 2,621.0 | | 25.1 | % | $ | 2,397.6 | | 26.0 | % | $ | 223.4 | | 9.3 | % |
The increase in our gross profit was primarily due to the contribution from our 2014 and 2013 acquisitions. See “Net Sales” and “Cost of Sales” for discussion on product pricing trends and our LIFO valuation reserve adjustments, respectively.
The high levels of import material in the U.S. along with uncertainty due to metal price volatility resulted in a competitive pricing environment in 2014, and negatively impacted our gross profit margins.
Expenses
| | | | | | | | | | | | | | | |
| Year Ended December 31, | | | | | | |
| 2014 | | 2013 | | | | | | |
| | | | % of | | | | | % of | | Dollar | | Percentage | |
| $ | | Net Sales | | $ | | Net Sales | | Change | | Change | |
| (dollars in millions) | | | | | |
S,G&A expense | $ | 1,789.8 | | 17.1 | % | $ | 1,638.4 | | 17.8 | % | $ | 151.4 | | 9.2 | % |
S,G&A expense, same-store | $ | 1,479.3 | | 17.4 | % | $ | 1,428.1 | | 17.9 | % | $ | 51.2 | | 3.6 | % |
Depreciation & amortization expense | $ | 213.8 | | 2.0 | % | $ | 192.4 | | 2.1 | % | $ | 21.4 | | 11.1 | % |
Impairment of long-lived asset | $ | — | | — | % | $ | 14.9 | | 0.2 | % | $ | (14.9) | | (100.0) | % |
Same‑store amounts exclude the results of our 2014 and 2013 acquisitions.
Our expenses increased mainly due to the additional expenses relating to our 2013 acquisition of Metals USA. Our S,G&A expense as a percent of net sales decreased mainly due to higher volume and pricing in 2014. Our 2014 same‑store S,G&A expenses increased at a lower rate than our increases in tons sold, as we leverage our existing cost structure to support higher volume.
The increase in depreciation and amortization expense was mainly due to our 2013 acquisition of Metals USA and depreciation expense from our recent capital expenditures.
We recorded an impairment charge of $14.9 million related to one of our trade name intangibles in 2013. The 2013 impairment charge resulted from combining two of our operations to more efficiently service our customers in their markets, with the trade name associated with one of the operations no longer being used.
Operating Income
| | | | | | | | | | | | | | | |
| | | | | | | | | | | | | | | |
| Year Ended December 31, | | | | | |
| 2014 | | 2013 | | | | | |
| | | | % of | | | | | % of | | Dollar | | Percentage | |
| $ | | Net Sales | | $ | | Net Sales | | Change | | Change | |
| (dollars in millions) | | | | | |
Operating income | $ | 617.4 | | 5.9 | % | $ | 551.9 | | 6.0 | % | $ | 65.5 | | 11.9 | % |
Our operating income was higher in 2014 compared to 2013 due primarily to the contributions of our 2014 and 2013 acquisitions and gross profit contributions from improved same‑store sales in 2014.
Other Income (Expense)
| | | | | | | | | | | | | | | |
| | | | | | | | | | | | | | | |
| Year Ended December 31, | | | | | |
| 2014 | | 2013 | | | | | |
| | | | % of | | | | | % of | | Dollar | | Percentage | |
| $ | | Net Sales | | $ | | Net Sales | | Change | | Change | |
| (dollars in millions) | | | | | |
Interest | $ | (81.9) | | (0.8) | % | $ | (77.5) | | (0.8) | % | $ | (4.4) | | 5.7 | % |
Other income, net | $ | 10.8 | | 0.1 | % | $ | 3.9 | | — | % | $ | 6.9 | | 176.9 | % |
Interest expense increased in 2014 compared to 2013 primarily due to our $500.0 million senior notes offering to fund our $1.25 billion acquisition of Metals USA in April 2013. See discussion in the “Liquidity and Capital Resources” section of “Management’s Discussion and Analysis of Financial Condition and Results of Operations.”
The change in other income, net in 2014 compared to 2013 was primarily due to an $11.4 million gain relating to our acquisition of Acero Prime achieved in stages offset by fewer redemptions of life insurance policies in 2014. For
further discussion of our acquisition of Acero Prime, see Note 3 — “Joint Ventures and Noncontrolling Interests” of Part II, Item 8 "Financial Statements and Supplementary Data”.
Income Tax Rate
Our effective income tax rate in 2014 was 31.1% compared to our 2013 rate of 32.1%. The decrease in our income tax rate was mainly due to higher foreign income levels that are taxed at rates lower than the U.S. statutory rate of 35% and increased domestic production activities deductions in 2014 as compared to 2013.
Net Income
| | | | | | | | | | | | | | | | | |
| Year Ended December 31, | | | | | | | |
| 2017 | | | 2016 | | | | | | | |
| | | | % of | | | | | | % of | | | Dollar | | Percentage | |
| $ | | Net Sales | | | $ | | Net Sales | | | Change | | Change | |
| (dollars in millions) | | | | | | |
Net income attributable to Reliance | $ | 613.4 | | 6.3 | % | | $ | 304.3 | | 3.5 | % | | $ | 309.1 | | 101.6 | % |
The increases in our net income and net income as a percentage of net sales were primarily due to the favorable impact of Tax Reform. However, increases in operating income and operating income margin, resulting from record gross profit dollars, lower impairment and restructuring charges, and lower interest expense also contributed to increases in our net income and net income as a percentage of net sales.
Year Ended December 31, 2016 Compared to Year Ended December 31, 2015
Net Sales
| | | | | | | | | | | |
| Year Ended December 31, | | Dollar | | Percentage | |
| 2016 | | 2015 | | Change | | Change | |
| (in millions) | | | | | | |
Net sales | $ | 8,613.4 | | $ | 9,350.5 | | $ | (737.1) | | (7.9) | % |
Net sales, same-store | $ | 8,475.0 | | $ | 9,350.5 | | $ | (875.5) | | (9.4) | % |
| | | | | | | | | | | |
| Year Ended December 31, | | Tons | | Percentage | |
| 2016 | | 2015 | | Change | | Change | |
| (in thousands) | | | | | | |
Tons sold | | 5,832.9 | | | 5,918.9 | | | (86.0) | | (1.5) | % |
Tons sold, same-store | | 5,761.9 | | | 5,918.9 | | | (157.0) | | (2.7) | % |
| | | | | | | | | | | |
| Year Ended December 31, | | Price | | Percentage | |
| 2016 | | 2015 | | Change | | Change | |
Average selling price per ton sold | $ | 1,465 | | $ | 1,572 | | $ | (107) | | (6.8) | % |
Average selling price per ton sold, same-store | $ | 1,458 | | $ | 1,572 | | $ | (114) | | (7.3) | % |
Tons sold and average selling price per ton sold amounts exclude our toll processing sales (as we process the metal for a fee, without taking ownership of the metal). Same‑store amounts exclude the results of our 2016 acquisitions.
Our consolidated net sales declined in 2016 compared to 2015 due to both lower metals prices and lower tons sold. Our same-store average selling price per ton sold, which had declined sequentially in each quarter from the 2014 third quarter through the 2016 first quarter due in part to historically high levels of imports of metal into the U.S., improved sequentially during the final three quarters of 2016 with the 2016 fourth quarter same-store average selling price 2.4% higher than the comparable period in 2015. Compared to 2015, our 2016 same-store tons sold decreased 2.7%, which outperformed the industry decline of 6.2% reported by the Metals Service Center Institute (“MSCI”). We believe our better than industry average performance reflected an increase in market share for our Company.
The significant decline in our volume sold to the energy (oil and gas) market that began in 2014 and continued throughout 2016 contributed to the decline in our same-store tons in 2016 compared to 2015. In general, business activity in almost all of our end markets other than the energy and heavy industry end markets was relatively stable in 2016 compared to 2015 as our tons sold, excluding the impact of our businesses exclusively servicing the energy market, declined only 0.5%.
End markets that continued to perform well for us in 2016 compared to 2015 were automotive, primarily through our toll processing businesses in the U.S. and Mexico, and aerospace. Heavy industry declined further from the low levels we experienced throughout 2015. Our tons sold to the energy market declined approximately 32% in 2016 compared to 2015. Non-residential construction, our largest end market, continued its slow but steady improvement, albeit at significantly reduced demand levels from its peak levels experienced in 2006.
Our same-store average selling price per ton sold in 2016 decreased 7.3% from 2015 given decreased mill pricing for most products we sell.
Our major commodity selling prices changed year-over-year from 2015 to 2016 as follows:
| | | | | | |
| | | | Same-store | |
| | Average Selling | | | Average Selling | |
| | Price per Ton Sold | | | Price per Ton Sold | |
| | (percentage change) | |
Carbon steel | | (6.6) | % | | (7.6) | % |
Aluminum | | (3.4) | % | | (3.4) | % |
Stainless steel | | (11.2) | % | | (11.2) | % |
Alloy | | (4.8) | % | | (5.1) | % |
Cost of Sales
| | | | | | | | | | | | | | | |
| Year Ended December 31, | | | | | | |
| 2016 | | 2015 | | | | | | |
| | | | % of | | | | | % of | | Dollar | | Percentage | |
| $ | | Net Sales | | $ | | Net Sales | | Change | | Change | |
| (dollars in millions) | | | | | |
Cost of sales | $ | 6,023.1 | | 69.9 | % | $ | 6,803.6 | | 72.8 | % | $ | (780.5) | | (11.5) | % |
The decrease in cost of sales in 2016 compared to 2015 was mainly due to lower tons sold and a lower average cost per ton sold. See “Net Sales” above for trends in both demand and costs of our products.
Cost of sales in 2016 included $12.8 million of restructuring charges relating to the planned closure or sale of certain locations compared to $1.6 million in 2015.
Our LIFO method inventory valuation reserve adjustment is included in cost of sales and, in effect, reflects cost of sales at current replacement costs. Any adjustments to our LIFO inventory values to reflect them at the lower of cost or market are also included in our overall LIFO inventory valuation adjustments, which resulted in credits, or income, of $35.0 million and $117.0 million in 2016 and 2015, respectively.
Our LIFO inventory valuation reserve, net of lower of cost or market adjustments, was a debit of $8.9 million as of December 31, 2016 and a credit of $26.1 million as of December 31, 2015. Lower metal costs in our inventory as of December 31, 2016 as compared to December 31, 2015 resulted in LIFO income in 2016.
Gross Profit
| | | | | | | | | | | | | | | |
| Year Ended December 31, | | | | | | |
| 2016 | | 2015 | | | | | | |
| | | | % of | | | | | % of | | Dollar | | Percentage | |
| $ | | Net Sales | | $ | | Net Sales | | Change | | Change | |
| (dollars in millions) | | | | | |
Gross profit | $ | 2,590.3 | | 30.1 | % | $ | 2,546.9 | | 27.2 | % | $ | 43.4 | | 1.7 | % |
In 2016, we set a new record with annual gross profit margin above 30% for the first time in our history. The increase in our gross profit margin was mainly due to our disciplined operational execution that focuses on small, quick-turn orders and increased value-added processing along with improved inventory management. See “Net Sales” and “Cost of Sales” for further discussion on product pricing trends and our LIFO inventory valuation reserve adjustments, respectively.
Expenses
| | | | | | | | | | | | | | | |
| Year Ended December 31, | | | | | | |
| 2016 | | 2015 | | | | | | |
| | | | % of | | | | | % of | | Dollar | | Percentage | |
| $ | | Net Sales | | $ | | Net Sales | | Change | | Change | |
| (dollars in millions) | | | | | |
S,G&A expense | $ | 1,798.1 | | 20.9 | % | $ | 1,725.3 | | 18.5 | % | $ | 72.8 | | 4.2 | % |
S,G&A expense, same-store | $ | 1,759.2 | | 20.8 | % | $ | 1,725.3 | | 18.5 | % | $ | 33.9 | | 2.0 | % |
Depreciation & amortization expense | $ | 222.0 | | 2.6 | % | $ | 218.5 | | 2.3 | % | $ | 3.5 | | 1.6 | % |
Impairment of long-lived assets | $ | 52.4 | | 0.6 | % | $ | 53.3 | | 0.6 | % | $ | (0.9) | | (1.7) | % |
Same‑store amounts exclude the results of our 2016 acquisitions.
Our S,G&A expense as a percent of sales increased mainly due to our lower sales amount, as a result of reduced metals pricing.
The increase in depreciation and amortization expense was mainly due to depreciation expense from our recent capital expenditures and our 2016 acquisitions.
We recorded a $52.4 million charge for impairment of long-lived assets in 2016 compared to $53.3 million in 2015. These charges mainly related to the significant decline in the demand for the products we sell to the energy market (oil and gas) for certain of our energy-related businesses as a result of the downturn in oil prices and drilling activity that began near the end of 2014 along with our updated long-term outlook of the future demand levels and profitability of these businesses. Please refer to Note 17 — “Impairment and Restructuring Charges” of Part II, Item 8 "Financial Statements and Supplementary Data" for further information on our 2016 and 2015 impairment charges.
Operating Income
Operating Income | | | | | | | | | | | | | | | | | |
| | | | | | | | | | | | | | | | | |
| Year Ended December 31, | | | | | | | |
| 2016 | | | 2015 | | | | | | | |
| | | | % of | | | | | | % of | | | Dollar | | Percentage | |
| $ | | Net Sales | | | $ | | Net Sales | | | Change | | Change | |
| (dollars in millions) | | | | | | |
Operating income | $ | 517.8 | | 6.0 | % | | $ | 549.8 | | 5.9 | % | | $ | (32.0) | | (5.8) | % |
Our operating income was lower in 2016 compared to 2015 due to lower net sales as a result of lower metals pricing and restructuring charges relating to the planned closure or sale of certain locations, offset by a higher gross profit margin. We maintained a comparable operating income margin in 2016 with that in 2015 due to the increase in our gross profit margin. See “Net Sales” above for trends in both demand and costs of our products and “Expenses” for trends in our operating expenses.
Income Tax Rate
Our effective income tax rate in 2016 was 28.0% compared to our 2015 rate of 31.1%. Our 2016 income tax rate was favorably impacted by the settlement of a tax position that was previously uncertain. Other permanent items that lowered our effective income tax rates from the U.S. federal statutory rate were not materially different during both years and relate mainly to company-owned life insurance policies, domestic production activities deductions and foreign income levels that are taxed at rates lower than the U.S. statutory rate of 35%.
Net Income
| | | | | | | | | | | | | | | |
| | | | | | | | | | | | | | | |
| Year Ended December 31, | | | | | |
| 2014 | | 2013 | | | | | |
| | | | % of | | | | | % of | | Dollar | | Percentage | |
| $ | | Net Sales | | $ | | Net Sales | | Change | | Change | |
| (dollars in millions) | | | | | |
Net income attributable to Reliance | $ | 371.5 | | 3.6 | % | $ | 321.6 | | 3.5 | % | $ | 49.9 | | 15.5 | % |
| | | | | | | | | | | | | | | | | | |
| | | | | | | | | | | | | | | | | |
| | | | | | | | | | | | | | | | | |
| Year Ended December 31, | | | | | | | |
| 2016 | | | 2015 | | | | | | | |
| | | | % of | | | | | | % of | | | Dollar | | Percentage | |
| $ | | Net Sales | | | $ | | Net Sales | | | Change | | Change | |
| (dollars in millions) | | | | | | |
Net income attributable to Reliance | $ | 304.3 | | 3.5 | % | | $ | 311.5 | | 3.3 | % | | $ | (7.2) | | (2.3) | % |
The increase in our net income as a percentage of net sales was primarily the result of a higher operating income levels in 2014. The slightlymargin and lower effective income tax rate in 2014 further contributed to the increase in our net income from 2013.rate.
Liquidity and Capital Resources
Operating Activities
Net cash providedgenerated by operating activities was a record $1.03 billion$399.0 million in 20152017 compared to $356.0$626.5 million in 2014. The increase of $669.0 million2016. Our decreased operating cash flow in 2017 compared to 2016 was mainly due to lowerincreased working capital investmentrequirements (primarily accounts receivable and inventory) levels in 2015 dueinventory less accounts payable) to continued declines in metalsupport higher metals prices throughout the year coupled withand our internal inventory management efforts. We focused on lowering our inventory levels in 2015 in response to prevailing market conditions and adjusted our inventory balances for current activity levels.increased shipping volumes. To manage our working capital, we consistently focus on our accounts receivable days sales outstanding and on our inventory turnover rate, as receivables and inventory are the two most significant elements of our working capital. At December 31, 2015,2017, our days sales outstanding rate was approximately 42.442.1 days compared to 41.442.2 days at December 31, 2014. Because of our significant inventory reduction efforts in 2015, our2016. Our inventory turn rate (based on tons) basedfor 2017 and 2016 was 4.5 times (2.7 months on December 31,hand).
Income taxes paid were $171.1 million in 2017, a significant increase from $95.1 million paid in 2016. The increase is mainly due to higher taxable income for 2017 compared to 2016, along with the timing of our actual tax payments, with an extension of time to file payment for the 2016 tax year paid in 2017 and the utilization of tax overpayments for the 2015 tax year that lowered taxes paid in 2016.
Net cash generated by operating activities was $626.5 million in 2016 compared to $1.03 billion in 2015. The decrease of $398.5 million was mainly due to lower working capital (primarily accounts receivable and inventory) requirements in 2015 compared to 2016 due to our increased focus on lowering inventory levels andin 2015, shipments was 5.2 timeswhich we reduced by $306.8 million.
Income taxes paid were $95.1 million in 2016, a significant decrease from $204.9 million paid in 2015. The decrease is mainly due to higher taxable income for 2015 compared to 4.4 times based on December 31,2016, along with the timing of our actual tax payments, with an extension of time to file payment for the 2014 inventory levelstax year paid in 2015 and 2014 shipments.the utilization of tax overpayments for the 2015 tax year that lowered taxes paid in 2016.
Investing Activities
Net cash used in investing activities of $169.9$179.4 million was mainly comprised of our capital expenditures.in 2017 decreased significantly from $505.1 million used in 2016 due to $348.7 million used to fund acquisitions in 2016, compared to $37.8 million in 2017. Capital expenditures were $161.6 million in 2017 compared to $154.9 million in 2016.
Net cash used in investing activities of $505.1 million in 2016 increased significantly from $169.9 million used in 2015 due to the funding of our three acquisitions in 2016. Capital expenditures were $154.9 million in 2016 compared to $172.2 million in 2015 compared to $190.4 million in 2014. 2015.
The majority of our 2017, 2016, and 2015 capital expenditures related to growth initiatives. During 2014, we spent $208.2 million, net of cash acquired on acquisitions and received $26.2 million of net proceeds from the sale of certain non-core assets acquired as part of the Metals USA acquisition.
Financing Activities
Our netNet cash used in financing activities of $848.5$198.1 million in 2015 was2017 increased from $100.2 million used in 2016 mainly comprised of share repurchases, dividend paymentsdue to our stockholders andincreased net debt repayments. We used cash to repurchase $355.5 millionrepayments, decreased proceeds from the exercise of stock options and our common stock in 2015, compared to $50.0 million repurchased in 2014.2017 share repurchases. We paid dividends and dividend equivalents of $120.1$132.0 million in 2015,2017, an increase of $11.4$11.6 million from 20142016 due to increases in our quarterly dividend rate in July 2016 and February 2017. Proceeds received from exercises of stock options in 2017 were $5.2 million, a significant decrease from $37.5 million in 2016. Net debt repayments in 2017 were $31.9 million compared to $1.0 million in 2016. Share repurchases were $25.0 million in 2017.
Net cash used in financing activities of $100.2 million in 2016 decreased significantly from $848.5 million used in 2015 mainly due to lower net debt repayments and decreased share repurchase activity offset by increased proceeds received from the exercise of stock options. We paid dividends and dividend equivalents of $120.4 million in 2016, an increase of only $0.3 million from 2015 despite an increase in our regular quarterly dividend rate offset by our 2015 repurchased shares.in the 2016 third quarter, due to a lower number of outstanding shares resulting from the repurchase of approximately 6.2 million shares at $57.39 per share, for a total of $355.5 million, in 2015. Proceeds received from exercises of stock options in 2016 were $37.5 million, a significant increase from $15.1 million in 2015. Net debt repayments in 20152016 were $376.6$1.0 million compared to net borrowingsdebt repayments of $168.5$376.6 million in 2014. 2015.
In February 2015,2017, our Board of Directors increased theour regular quarterly cash dividend to $0.40$0.45 per share of common stock from $0.425 per share. On February 13, 2018, our Board of Directors declared the 2018 first quarter regular cash dividend of $0.50 per share of common stock, an increase of 14%11.1% from the prior dividend of $0.35$0.45 per share. We have increased our dividend 2225 times since our 1994 IPO and have never reduced or suspended our dividend. We have paid regular quarterly dividends to our stockholders for 5658 consecutive years.
On October 20, 2015, our Board of Directors amended our share repurchase plan increasing by 7.5 million sharesincreased the total number of shares authorized to be repurchased under our share repurchase plan by 7.5 million shares and extendingextended the duration of the plan tothrough December 31, 2018. InDuring 2017, we repurchased approximately 0.3 million shares of our common stock at an average cost of $74.27 per share, for a total of $25.0 million. We did not repurchase any shares in 2016. During 2015, we repurchased approximately 6.2 million shares of our common stock at an average cost of $57.39 per share, for approximatelya total of $355.5 million. In 2014, we repurchased approximately 0.8 million shares at an average cost of $65.80 per share for approximately $50.0 million. Since initiating ourthe share repurchase plan in 1994, we have repurchased approximately 22.122.5 million shares at an average cost of $30.93$31.58 per share. As of December 31, 2015,2017, we had authorization under the plan to purchase approximately 8.48.1 million shares, or 12%about 11% of our current outstanding shares. We expect to continue opportunistically repurchasing shares remain available for repurchase under the plan.of our common stock going forward.
Liquidity
Our primary sources of liquidity are our internallyfunds generated funds from operations and our $1.5 billion revolving credit facility. Our total outstanding debt at December 31, 20152017 was $1.94$1.91 billion, down slightly from $2.32$1.95 billion at December 31, 2014.2016. At December 31, 2015,2017, we had $332.0$538.0 million of outstanding borrowings, $57.4$53.3 million of letters of credit issued and $1.11 billion$908.7 million available for borrowing on our revolving credit facility.
As of December 31, 2015,2017, our net debt‑to‑total‑debt-to-total capital ratio was 31.8%, down from 34.9% as of December 31, 2014 (net debt‑to‑totaldebt-to-total capital is calculated as total debt, net of cash, divided by Reliance stockholders’ equity plus total debt, net of cash). On January 1, 2016, we acquired TSI, a distributor and processor was 27.2%, down from 30.3% as of carbon, alloy and stainless steel pipe, tubing and bar products. We funded our purchase of TSI with borrowings on our revolving credit facility, resulting in a pro forma net debt-to-total capital ratio of 35.1% and leaving significant liquidity, with over $800.0 million available for borrowings after funding the acquisition.December 31, 2016.
On April 4, 2013,September 30, 2016, we entered into a syndicated Third Amended and Restated $2.1 billion unsecured five-year credit agreement (“Credit Agreement (the “Credit Agreement”) with 26 banks as lenders. The Credit Agreement amended and extended our existingcomprised of a $1.5 billion unsecured revolving credit facility and provided for a $500.0$600.0 million unsecured term loan, andwith an option to increase the revolving credit facility for up to an additional $500.0 million at our request, subject to approval of the lenders and certain other customary conditions. We intend to use the revolving credit facility for working capital and general corporate purposes, including, but not limited to, capital expenditures, dividend payments, repayment of debt, stockshare repurchases, internal growth initiatives and acquisitions. The $500.0$600.0 million term loan due April 4, 2018September 30, 2021 amortizes in quarterly installments, with an annual amortization of 5% through September 2018 and 10% thereafter until March 2018,June 2021, with the balance to be paid at maturity. All borrowings under the Credit Agreement may be repaidprepaid without penalty.
Other revolvingRevolving credit facilities with a combined credit limit of approximately $76.2$70.3 million are in place for operations in Asia and Europe with combined outstanding balances of $59.9$53.9 million and $48.3$44.4 million as of December 31, 20152017 and December 31, 2014,2016, respectively.
We believe our existing sources of liquidity are sufficient to satisfy our working capital needs and financial commitments, as well as continued stockholder return activities.
Tax Cuts and Jobs Act of 2017
Tax Reform enacted in December 2017 will have a favorable impact on our profitability and cash flows through a reduction in our effective income tax rate. In 2017, we recognized a one-time, provisional net tax benefit of $207.3 million primarily relating to the remeasurement of deferred tax assets and liabilities at the lowered tax rate, which was partially offset by repatriation liabilities.
Capital Resources
On November 20, 2006, we entered into an indenture (the “2006 Indenture”), for the issuance of $600.0 million of unsecured debt securities. The notes weretotal debt issued inwas comprised of two tranches:tranches, (a) $350.0 million aggregate principal amount of senior unsecured notes bearing interest at the rate of 6.20% per annum, maturingwhich matured and were repaid on November 15, 2016; and (b) $250.0 million aggregate principal amount of senior unsecured notes bearing interest at the rate of 6.85% per annum, maturing on November 15, 2036.
On April 12, 2013, we entered into an indenture (the “2013 Indenture” and, together with the 2006 Indenture, the “Indentures”), for the issuance of $500.0 million aggregate principal amount of senior unsecured notes at the rate of 4.50% per annum, maturing on April 15, 2023. The net proceeds from the issuance were used to partially fund the acquisition of Metals USA.
Under the Indentures, the notes are senior unsecured obligations and rank equally in right of payment with all of our existing and future unsecured and unsubordinated obligations. The notes are guaranteed by certain of our 100%‑owned domestic subsidiaries that guarantee our Credit Agreement.
The senior unsecured notes include provisions that require us
to make an offer to repurchase the notes at a price equal to 101% of their principal amount plus accrued and unpaid interest in the event of both a change in control and a downgrade of our credit rating.
In connection with our acquisition of Metals USA, we assumedVarious industrial revenue bonds withhad combined outstanding balances of $11.0$10.1 million and $10.6 million as of December 31, 20152017 and December 31, 2016, respectively, and maturities through 2027. We also assumed mortgage obligations pursuant to our acquisition of a portfolio of 18 real estate properties used in the operations of the PNA Group of companies that we acquired in 2008, which have outstanding balances of $40.4 million as of December 31, 2015. The mortgages, which are secured by the underlying properties, have a fixed interest rate of 6.40% and scheduled amortization payments with a lump sum payment of $39.2 million due October 2016.
Our net debt‑to‑total capital ratio was 31.8% at December 31, 2015, down from 34.9% at December 31, 2014.
As of December 31, 2015,2017, we had $551.3$243.5 million in principal amount of debt obligations coming due before our $1.5 billion revolving credit facility expires on April 4, 2018.September 30, 2021. We believe that we will continue to have sufficient liquidity to fund our future operating flexibility, cash resources, and funding sources to maintain adequate amounts of liquidityneeds and to meet future operating needs.repay our debt obligations as they become due. In addition to funds generated from operations and funds available under our revolving credit facility, we expect to be able to access the capital markets to raise funds, if desired. We believe our investment grade credit rating enhances our ability to effectively raise funding,capital, if needed. We expect
to continue our acquisition and other growth activities in the future and anticipate that we will be able to fund such activities as they arise.
Covenants
OurThe Credit Agreement including our term loan, requiresand the Indentures include customary representations, warranties, covenants, acceleration, indemnity and events of default provisions. The covenants under the Credit Agreement include, among other things, two financial statement covenants that require us to maintain a minimum interest coverage ratio and a maximum leverage ratio, among other things.ratio. Our interest coverage ratio for the twelve‑monthtwelve-month period ended December 31, 20152017 was approximately 7.09.3 times compared to the debt covenant minimum requirement of 3.0 times (interest(interest coverage ratio is calculated underas earnings before interest and taxes (“EBIT”), as defined in the Credit Agreement, as net income attributable to Reliance plus interest expense and provision for income taxes and plus or minus any non‑operating non‑recurring loss or gain, respectively, divided by interest expense). Our leverage ratio as of December 31, 20152017, calculated in accordance with the terms of the Credit Agreement, was 33.6%29.7% compared to the debt covenant maximum amount of 60% (leverage ratio is calculated under the Credit Agreement as total debt, inclusive of capital lease obligations and outstanding letters of credit, divided by the sum of Reliance stockholders’ equity plus total debt).
Our obligations under the Credit Agreement and Indentures are required to be guaranteed by certain of our 100%‑owned domestic subsidiaries. The subsidiary guarantors, together with Reliance, are required collectively to account for at least 80% of our consolidated EBITDA and 80% of consolidated tangible assets. Reliance and the subsidiary guarantors accounted for approximately 91% of our total consolidated EBITDA for the last twelve months and approximately 83% of total consolidated tangible assets as of December 31, 2015.
We were in compliance with all material debtfinancial covenants in our Credit Agreement at December 31, 2015.2017.
Off‑Balance Sheet Arrangements
We do not have any off‑balance sheet arrangements or relationships with unconsolidated entities or financial partnerships, such as entities often referred to as structured finance or variable interest entities, which are typically established for the purpose of facilitating off‑balance sheet arrangements or other contractually narrow or limited purposes.
As of December 31, 20152017 and 2014,2016, we were contingently liable under standby letters of credit in the aggregate amounts of $57.4$43.1 million and $59.2$51.9 million, respectively. The letters of credit are related to insurance policies and construction projects, and outstanding bonds.projects.
Contractual Obligations and Other Commitments
The following table summarizes our contractual obligations as of December 31, 2015.2017. Certain of these contractual obligations are reflected on our balance sheet, while others are disclosed as future obligations under U.S. generally accepted accounting principles.
| | | | | | | | | | | | | | | | | | | | | | | | | | | | | | | |
| | | | | | | | | | | | | | | | | | | | | | | | | | | | | | | |
| | Payments Due by Period | | | Payments Due by Period |
| | | | | | Less than | | | | | | | | More than | | | | | | | Less than | | | | | | | | More than |
Contractual Obligations | | Total | | 1 year | | 1-3 years | | 3-5 years | | 5 years | | | Total | | | 1 year | | 1-3 years | | 3-5 years | | 5 years |
| | (in millions) | | | (in millions) |
Long-Term Debt Obligations | | $ | 1,942.1 | | $ | 500.8 | | $ | 681.8 | | $ | 1.2 | | $ | 758.3 | | | $ | 1,914.5 | | $ | 92.0 | | $ | 121.2 | | $ | 943.9 | | $ | 757.4 |
Estimated Interest on Long-Term | | | | | | | | | | | | | | | | |
Debt (1) | | | 561.2 | | | 69.4 | | | 88.5 | | | 79.1 | | | 324.2 | |
Estimated Interest on Long-Term Debt (1) | | Estimated Interest on Long-Term Debt (1) | | 519.1 | | | 61.5 | | | 118.9 | | | 93.7 | | | 245.0 |
Operating Lease Obligations | | | 217.4 | | | 61.6 | | | 85.5 | | | 45.3 | | | 25.0 | | | | 201.1 | | | 62.7 | | | 85.2 | | | 35.5 | | | 17.7 |
Purchase Obligations – Other (2) | | | 85.4 | | | 68.1 | | | 14.0 | | | 2.5 | | | 0.8 | | | | 157.7 | | | 62.3 | | | 63.5 | | | 31.5 | | | 0.4 |
Other Long-Term Liabilities | | | | | | | | | | | | | | | | | | | | | | | | | | | | | | | |
Reflected on the Balance Sheet | | | | | | | | | | | | | | | | | | | | | | | | | | | | | | | |
under GAAP (3) | | | 65.3 | | | 8.5 | | | 17.4 | | | 16.2 | | | 23.2 | | | | 49.9 | | | 5.7 | | | 18.2 | | | 12.3 | | | 13.7 |
Total | | $ | 2,871.4 | | $ | 708.4 | | $ | 887.2 | | $ | 144.3 | | $ | 1,131.5 | | | $ | 2,842.3 | | $ | 284.2 | | $ | 407.0 | | $ | 1,116.9 | | $ | 1,034.2 |
| (1) | | Interest is estimated using applicable rates as of December 31, 20152017 for our outstanding fixed and variable rate debt based on their respective scheduled maturities. Also, the entire outstanding balance on the revolving credit facility of $332.0$538.0 million is assumed to remain unchanged until its maturity date in April 2018.September 2021. |
| (2) | | The majority of our inventory purchases are completed within 30 to 120 days and therefore are not included in this table except for certain purchases where we have significant lead times or corresponding long‑term sales commitments. |
| (3) | | Includes the estimated benefit payments for the next ten years for various long‑term retirement plans. For qualified defined benefit plans we have only included the estimated employer contribution amounts for 20162018 as funding projections beyond 20162018 are not practical to estimate. We have excluded deferred income taxes of $627.1$440.8 million, long‑term tax contingencies of $22.9$4.1 million and other long‑term liabilities of $7.5$7.7 million from the amounts presented, as the amounts that will be settled in cash are not known and the timing of any payments is uncertain. |
Contractual obligations for purchases of goods or services are defined as agreements that are enforceable and legally binding on our company and that specify all significant terms, including fixed or minimum quantities to be purchased; fixed, minimum or variable price provisions; and the approximate timing of the transaction. Our purchase orders are based on our current needs and are typically fulfilled by our vendors within short time periods. In addition, some of our purchase orders represent authorizations to purchase rather than binding agreements. We do not have significant agreements for the purchase of goods specifying minimum quantities and set prices that exceed our expected requirements for three months. Therefore, agreements for the purchase of goods and services are not included in the table above except for certain purchases where we have significant lead times or corresponding long‑term sales commitments.
The expected timing of payments of the obligations above is estimated based on current information. Timing of payments and actual amounts paid may be different, depending on the time of receipt of goods or services, pricing in effect at that time for inventory purchase commitments, or due to changes to agreed‑upon amounts for some obligations.
Inflation
Our operations have not been, and we do not expect them to be, materially affected by general inflation. Historically, we have been successful in adjusting prices to our customers to reflect changes in metal prices.
Seasonality
Some of our customers are in seasonal businesses, especially customers in the construction industry and related businesses. As a result of our geographic, product and customer diversity ourOur overall operations have not shown any material seasonal trends.trends as a result of our geographic, product and
customer diversity. Typically, revenues in the months of July, November and December have been lower than in other months because of a reduced number of working days for shipments of our products, resulting from vacation and extended holiday closures at some of our customers. Reduced shipping days also have a significant impact on our profitability in any particular period. We cannot assure you that period‑to‑periodpredict whether period-to-period fluctuations will be consistent with historical patterns. Results of any one or more quarters are therefore not necessarily indicative of annual results.
Goodwill and Other Intangible Assets
We have one operating segment and also one reporting unit for goodwill impairment purposes. There was no change in our reportable segments; we have one reportable segment, metals service centers.
Goodwill, which represents the excess of cost over the fair value of net assets acquired, amounted to $1.72$1.84 billion as of December 31, 2015,2017, or approximately 24% of total assets or 44%39% of Reliance stockholders’ equity. Additionally, other intangible assets, net amounted to $1.13$1.11 billion at December 31, 2015,2017, or approximately 16%14% of total assets or 29%24% of Reliance stockholders’ equity. Goodwill and other intangible assets deemed to have indefinite lives are not amortized but are subject to annual impairment tests. Other intangible assets with finite useful lives are amortized over their useful lives. We review the recoverability of our long‑lived assets whenever events or changes in circumstances indicate that the carrying amount of such assets may not be recoverable. Refer to Critical Accounting Policies and Estimates for further information regarding our 2016 and 2015 impairment chargecharges and discussion regarding judgments involved in testing for recoverability of our goodwill and other intangible assets.
Critical Accounting Policies and Estimates
Management’s Discussion and Analysis of Financial Condition and Results of Operations discusses our Consolidated Financial Statements, whichOur consolidated financial statements have been prepared in accordance with U.S. generally accepted accounting principles. When we prepare these consolidated financial statements, we are required to make estimates and assumptions that affect the reported amounts of assets and liabilities and the disclosure of contingent assets and liabilities at the date of the financial statements and the reported amounts of revenues and expenses during the reporting period. Some of our accounting policies require that we make subjective judgments, including estimates that involve matters that are inherently uncertain. Our most critical accounting estimates include those related to accounts receivable, inventories, income taxes, goodwill and intangible assets and long‑lived assets. We base our estimates and judgments on historical experience and on various other factors that we believe to be reasonable under the circumstances, the results of which form the basis for our judgments about the carrying values of assets and liabilities that are not readily apparent from other sources. Our actual results may differ from these estimates under different assumptions or conditions.
We believe the following critical accounting estimates, as discussed with our Audit Committee, affect our more significant judgments and estimates used in preparing our consolidated financial statements. (See Note 1 — “Summary“Summary of Significant Accounting Policies” of Part II, Item 8 "Financial Statements and Supplementary Data".) There have been no material changes made to the critical accounting estimates during the periods presented in the Consolidated Financial Statements. We also have other policies that we consider key accounting policies, such as for revenue recognition, however these policies do not require us to make subjective estimates or judgments.
Accounts Receivable
We maintain an allowance for doubtful accounts to reflect our estimate of the uncollectability of accounts receivable based on an evaluation of specific potential customer risks. Assessments are based on legal issues (such as bankruptcy status), our past collection history, and current financial and credit agency reports along with current economic pressures impacting that customer or industry. Accounts that we determine to be uncollectible are reserved for or written off in the period in which the determination is made. Additional reserves are maintained based on our historical and probable future bad debt experience. If the financial condition of our customers were
to deteriorate beyond our estimates, resulting in an impairment of their ability to make payments, we might be required to increase our allowance for doubtful accounts.
Inventories
A significant portion of our inventory is valued using LIFO. Under this method, older costs are included in inventory, which may be higher or lower than current costs. This method of valuation is subject to year‑to‑year fluctuations in our cost of material sold, which is influenced by the inflation or deflation existing within the metals industry as well as fluctuations in our product mix and on‑hand inventory levels. At December 31, 2015, cost on the first‑in, first‑out (“FIFO”) method exceeded our LIFO value of inventories by $26.1 million. The calculation of LIFO does not require us to make subjective estimates or judgments, except at interim reporting periods. The valuation of our inventories at the lower of cost or market could be subject to certain estimates; however the measurement is primarily based on historical purchasing and sales information rather than forecasted metals pricing.
We also maintain allowances for estimated obsolescence or unmarketable inventory to reflect the difference between the cost of inventory and the estimated market value based on an evaluation of slow moving products and current replacement costs. If actual market conditions are less favorable than those anticipated by management, additional allowances may be required.
Income Taxes
We currently have significant deferred tax assets, which are subject to periodic recoverability assessments. Realizing our deferred tax assets principally depends upon our achieving projected future taxable income. We may change our judgments regarding future profitability due to future market conditions and other factors. We may adjust our deferred tax asset balances if our judgments change.
For information regarding our deferred tax assets and liabilities, provision for income taxes as well as information regarding differences between our effective income tax rate and statutory rates, see Note 9 – “Income Taxes” of Part II, Item 8 "Financial Statements and Supplementary Data”. Our income tax rate may be affected by future acquisitions, changes in the geographic composition of our income from operations, changes in our estimates of credits or deductions, changes in our assessment of tax exposure items, and the resolution of issues arising from tax audits with various tax authorities, among others.
Long‑Lived Assets—Goodwill and Indefinite‑Lived Intangible Assets
We review the recoverability of goodwill and intangible assets deemed to have indefinite lives annually or whenever significant events or changes occur, which might impair the recovery of recorded costs. Factors that may be considered a change in circumstances, indicating that the carrying value of our goodwill and intangible assets may not be recoverable, include a decline in our stock price and market capitalization, declines in the market conditions of our products or end markets, reductions in our future cash flow estimates, and slower growth rates in our industry, among others. We review the recoverability of our intangible assets deemed to have indefinite lives by making assumptions regarding estimated future cash flows and other factors to determine the fair value of the respective assets, as necessary. We test for impairment of goodwill by assessing various qualitative factors with respect to developments in our business and the overall economy and calculating the fair value of a reporting unit using the discounted cash flow method, as necessary. We perform the required annual goodwill and intangible asset impairment evaluation as of November 1 of each year. No impairment of goodwill
was determined to exist in 2015, 20142017, 2016 or 2013.2015. We recorded impairment losses of long-livedon our intangible assets with indefinite lives in the amount of $36.4 million and $21.2 million in 2016 and $14.9 million in 2015, and 2013, respectively. No impairment of intangible assets with indefinite lives was recognized for 2014.in 2017. See Note 18 –17 — “Impairment and Restructuring Charges”of Long-Lived Assets” of Part II, Item 8 "Financial Statements and Supplementary Data” for further information on our impairment charges.
Impairment assessment inherently involves judgment as to assumptions about expected future cash flows and the impact of market conditions on those assumptions. Additionally, considerable declines in the market
conditions for our products from current levels as well as in the price of our common stock could also significantly impact our impairment analysis. An impairment charge, if incurred, could be material.
Long‑Lived Assets—Other
We review the recoverability of our other long‑lived assets, primarily property, plant and equipment and intangible assets subject to amortization, and must make assumptions regarding estimated future cash flows and other factors to determine the fair value of the respective assets. If these estimates or their related assumptions change in the future, we may be required to record impairment charges for these assets not previously recorded. We recorded impairment lossescharges on property, plant, and equipment of $4.2 million, $16.0 million and $17.7 million in 2017, 2016 and 2015, respectively. We recorded impairment charges of $14.4 million on our intangible assets subject to amortization and $17.7 million for property, plant, and equipment in 2015. No impairment of other long-livedintangible assets subject to amortization was recognized for 2014in 2017 and 2013.2016. See Note 18 –17 — “Impairment of Long-Lived Assets” of Part II, Item 8 "Financial Statements and Supplementary Data” for further information on our impairment charges.
Impact of Recently Issued Accounting Standards
Please refer to Note 1 –— “Summary of Significant Accounting Policies” of Part II, Item 8 "Financial Statements and Supplementary Data” for discussion of the impact of recently issued accounting standards.
Item 7A. Quantitative and Qualitative Disclosures About Market RiskRisk
In the ordinary course of business, we are exposed to various market risk factors, including changes in general economic conditions, domestic and foreign competition, foreign currency exchange rates, and metals pricing, demand and availability.
Commodity price risk
Metal prices are volatile due to, among other things, fluctuations in foreign and domestic production capacity, raw material availability, metals consumption, import levels into the U.S., global economic factors and foreign currency rates. We do not currently use financial derivatives to hedge against metal price volatility. Decreases in metal prices could adversely affect our revenues, gross profit and net income. Because we primarily purchase and sell in the “spot” market we are able to react quickly to changes in metals pricing. This strategy also limits our exposure to commodity prices to our inventories on hand. In an environment of increasing material costs our pricing usually increases as we try to maintain the same gross profit percentage and typically generate higher levels of gross profit and pre‑tax income dollars for the same operational efforts. Conversely, if pricing declines, we will typically generate lower levels of gross profit and pre‑tax income dollars. In periods where demand deteriorates rapidly and metal prices are declining significantly in a compressed period of time, a portion of our inventory on hand may be at higher costs than our selling prices, causing a significant adverse effect on our gross profit and pre‑tax income margins. However, when prices stabilize and our inventories on hand reflect more current prices, our gross profit margins tend to return to more normalized levels, which historically have been in the 25% to 27% range.levels.
Foreign exchange rate risk
Because we have foreign operations, we are exposed to foreign currency exchange gains and losses. The currency effects of translating the financial statements of our foreign subsidiaries, which operate in local currency environments, are included in accumulated other comprehensive loss and do not impact earnings unless there is a liquidation or sale of
those foreign subsidiaries. We do not currently hedge our net investments in foreign subsidiaries due to the long‑term nature of those investments.
Total foreign currency transaction gains and losses impacting earnings were as follows: losses of $4.9 million in 2017, gains of $1.8 million in 2016, and insignificant in 2015, gains of $3.1 million in 2014, and losses of $2.6 million in 2013.2015.
Interest rate risk
We are exposed to market risk related to our fixed‑rate and variable‑rate long‑term debt. Market risk is the potential loss arising from adverse changes in market rates and prices, such as interest rates. Changes in interest rates may affect the market value of our fixed‑rate debt. Under our current policies, we do not use interest rate derivative instruments to manage exposure to interest rate changes and we do not currently anticipate repayment of our fixed‑rate long‑term debt prior to scheduled maturities.
Market risk related to our variable‑rate debt is estimated as the potential decrease in pre‑tax earnings resulting from an increase in interest rates. As of December 31, 2015,2017, our total variable interest rate debt outstanding amounted to approximately $801.7 million,$1.16 billion, which was primarily comprised of the borrowings on our revolving credit facility of $332.0$538.0 million and term loan of $398.8$562.5 million. For example, aA 100 basis point increase in interest rates on $801.7 millionour $1.16 billion of outstanding variable interest rate debt would result in approximately $8.0$11.6 million of additional interest expense on an annual basis.
Item 8. Financial Statements and Supplementary DataData
RELIANCE STEEL & ALUMINUM CO.
AUDITED CONSOLIDATED FINANCIAL STATEMENTS
INDEX TO CONSOLIDATED FINANCIAL STATEMENTS AND SUPPLEMENTARY DATA
All other schedules are omitted because either they are not applicable, not required or the information required is included in the Consolidated Financial Statements, including the notes thereto.
REPORT OF INDEPENDENT REGISTERED PUBLIC ACCOUNTING FIRReport of Independent Registered Public Accounting FirmM
The Board of Directors and Stockholders
Reliance Steel & Aluminum Co.:
Opinion on the Consolidated Financial Statements
We have audited the accompanying consolidated balance sheets of Reliance Steel & Aluminum Co. and subsidiaries (the “Company”) as of December 31, 20152017 and 2014, and2016, the related consolidated statements of income, comprehensive income, equity, and cash flows for each of the years in the three‑year period ended December 31, 2015. In connection with our audits of2017, and the consolidated financial statements, we also have audited therelated notes and financial statement schedule of valuation and qualifying accounts. accounts (collectively, the “consolidated financial statements”). In our opinion, the consolidated financial statements present fairly, in all material respects, the financial position of the Company as of December 31, 2017 and 2016, and the results of its operations and its cash flows for each of the years in the three‑year period ended December 31, 2017, in conformity with U.S. generally accepted accounting principles.
We also have audited, in accordance with the standards of the Public Company Accounting Oversight Board (United States) (“PCAOB”), the Company’s internal control over financial reporting as of December 31, 2017, based on criteria established in Internal Control – Integrated Framework (2013) issued by the Committee of Sponsoring Organizations of the Treadway Commission, and our report dated February 28, 2018 expressed an unqualified opinion on the effectiveness of the Company’s internal control over financial reporting.
Basis for Opinion
These consolidated financial statements and financial statement schedule are the responsibility of the Company’s management. Our responsibility is to express an opinion on these consolidated financial statements and financial statement schedule based on our audits.
We are a public accounting firm registered with the PCAOB and are required to be independent with respect to the Company in accordance with the U.S. federal securities laws and the applicable rules and regulations of the Securities and Exchange Commission and the PCAOB.
We conducted our audits in accordance with the standards of the Public Company Accounting Oversight Board (United States).PCAOB. Those standards require that we plan and perform the audit to obtain reasonable assurance about whether the consolidated financial statements are free of material misstatement. An audit includesmisstatement, whether due to error or fraud. Our audits included performing procedures to assess the risks of material misstatement of the consolidated financial statements, whether due to error or fraud, and performing procedures that respond to those risks. Such procedures included examining, on a test basis, evidence supportingregarding the amounts and disclosures in the consolidated financial statements. An auditOur audits also includes assessingincluded evaluating the accounting principles used and significant estimates made by management, as well as evaluating the overall presentation of the consolidated financial statement presentation.statements. We believe that our audits provide a reasonable basis for our opinion.
In our opinion, the consolidated financial statements referred to above present fairly, in all material respects, the financial position of Reliance Steel & Aluminum Co. and subsidiaries as of December 31, 2015 and 2014, and the results of their operations and their cash flows for each of the years in the three‑year period ended December 31, 2015, in conformity with U.S. generally accepted accounting principles. Also in our opinion, the related financial statement schedule, when considered in relation to the basic consolidated financial statements taken as a whole, presents fairly, in all material respects, the information set forth therein.
We also have audited, in accordance with the standards of the Public Company Accounting Oversight Board (United States), Reliance Steel & Aluminum Co.’s internal control over financial reporting as of December 31, 2015, based on criteria established in Internal Control—Integrated Framework (2013) issued by the Committee of Sponsoring Organizations of the Treadway Commission (COSO), and our report dated February 25, 2016, expressed an unqualified opinion on the effectiveness of Reliance Steel & Aluminum Co.’s internal control over financial reporting.
We have served as the Company’s auditor since 2008.
Los Angeles, California
February 25, 201628, 2018
RELIANCE STEEL & ALUMINUM CO.
CONSOLIDATED BALANCE SHEETSSHEETS
(in millions, except share amounts)
| | | | | | | | |
| December 31, | | December 31, | December 31, | | December 31, |
| 2015 | | 2014 | 2017 | | 2016 |
ASSETS | ASSETS | ASSETS |
Current assets: | | | | | | | | |
Cash and cash equivalents | $ | 104.3 | | $ | 106.2 | $ | 154.4 | | $ | 122.8 |
Accounts receivable, less allowance for doubtful accounts of $16.3 at December 31, 2015 and $18.3 at December 31, 2014 | | 916.6 | | 1,144.6 | |
Accounts receivable, less allowance for doubtful accounts of $15.5 at December 31, 2017 and $15.3 at December 31, 2016 | | | 1,087.3 | | 960.2 |
Inventories | | 1,436.0 | | 1,752.1 | | 1,726.0 | | 1,532.6 |
Prepaid expenses and other current assets | | 60.8 | | 71.8 | | 80.7 | | 72.9 |
Income taxes receivable | | 36.5 | | — | | 2.9 | | | — |
Deferred income taxes | | — | | | 46.4 | |
Total current assets | | 2,554.2 | | 3,121.1 | | 3,051.3 | | 2,688.5 |
Property, plant and equipment: | | | | | | | | |
Land | | 196.2 | | 197.5 | | 229.7 | | 228.2 |
Buildings | | 1,006.3 | | 983.2 | | 1,095.3 | | 1,059.2 |
Machinery and equipment | | 1,569.8 | | 1,479.8 | | 1,738.6 | | 1,647.3 |
Accumulated depreciation | | (1,136.8) | | | (1,004.1) | | (1,407.3) | | | (1,272.5) |
| | 1,635.5 | | 1,656.4 | |
Property, plant and equipment, net | | | 1,656.3 | | 1,662.2 |
| | | | | | | | |
Goodwill | | 1,724.8 | | 1,736.4 | | 1,842.6 | | 1,827.4 |
Intangible assets, net | | 1,125.4 | | 1,227.4 | | 1,112.1 | | 1,151.3 |
Cash surrender value of life insurance policies, net | | 45.8 | | 46.4 | | 47.8 | | 46.9 |
Other assets | | 35.9 | | | 34.7 | | 40.9 | | | 35.0 |
Total assets | $ | 7,121.6 | | $ | 7,822.4 | $ | 7,751.0 | | $ | 7,411.3 |
| | | | | | | | |
LIABILITIES AND EQUITY | LIABILITIES AND EQUITY | LIABILITIES AND EQUITY |
| | | | | | | | |
Current liabilities: | | | | | | | | |
Accounts payable | $ | 247.0 | | $ | 286.5 | $ | 346.7 | | $ | 302.2 |
Accrued expenses | | 83.0 | | 98.2 | | 83.6 | | 83.7 |
Accrued compensation and retirement costs | | 118.7 | | 128.4 | | 139.3 | | 140.8 |
Accrued insurance costs | | 40.2 | | 46.6 | | 42.1 | | 40.6 |
Current maturities of long-term debt and short-term borrowings | | 500.8 | | 93.9 | | 92.0 | | 82.5 |
Income taxes payable | | — | | | 9.2 | | — | | | 6.2 |
Total current liabilities | | 989.7 | | 662.8 | | 703.7 | | 656.0 |
Long-term debt | | 1,427.9 | | 2,208.1 | | 1,809.4 | | 1,846.7 |
Long-term retirement costs | | 103.8 | | 102.2 | | 85.4 | | 89.6 |
Other long-term liabilities | | 30.4 | | 28.5 | | 11.8 | | 13.0 |
Deferred income taxes | | 627.1 | | 692.9 | | 440.8 | | 626.9 |
Commitments and contingencies | | | | | | | | |
Equity: | | | | | | | | |
Preferred stock, $0.001 par value: | | | | | | | | |
Authorized shares — 5,000,000 | | | | | | | | |
None issued or outstanding | | — | | — | | — | | — |
Common stock and additional paid-in capital, $0.001 par value: | | | | | | | | |
Authorized shares — 200,000,000 | | | | | | | | |
Issued and outstanding shares – 71,739,072 at December 31, 2015 and 77,337,251 at December 31, 2014 | | 533.8 | | 819.4 | |
Issued and outstanding shares – 72,609,540 at December 31, 2017 and 72,682,793 at December 31, 2016 | | | 594.6 | | 590.3 |
Retained earnings | | 3,480.0 | | 3,328.5 | | 4,144.1 | | 3,663.2 |
Accumulated other comprehensive loss | | (99.7) | | | (48.9) | | (71.6) | | | (104.7) |
Total Reliance stockholders’ equity | | 3,914.1 | | 4,099.0 | | 4,667.1 | | 4,148.8 |
Noncontrolling interests | | 28.6 | | | 28.9 | | 32.8 | | | 30.3 |
Total equity | | 3,942.7 | | | 4,127.9 | | 4,699.9 | | | 4,179.1 |
Total liabilities and equity | $ | 7,121.6 | | $ | 7,822.4 | $ | 7,751.0 | | $ | 7,411.3 |
See accompanying notes to consolidated financial statements.
RELIANCE STEEL & ALUMINUM CO.
CONSOLIDATED STATEMENTS OF INCOMEINCOME
(in millions, except per share amounts)
| | | | | | | |
| Year Ended December 31, | | | | | | | | |
| 2015 | | 2014 | | 2013 | Year Ended December 31, |
| | | | | | | 2017 | | 2016 | | 2015 |
Net sales | $ | 9,350.5 | | $ | 10,451.6 | | $ | 9,223.8 | $ | 9,721.0 | | $ | 8,613.4 | | $ | 9,350.5 |
Costs and expenses: | | | | | | | | | | | | |
Cost of sales (exclusive of depreciation and amortization shown below) | | 6,803.6 | | 7,830.6 | | 6,826.2 | | 6,933.2 | | 6,023.1 | | 6,803.6 |
Warehouse, delivery, selling, general and administrative | | 1,728.5 | | 1,789.8 | | 1,638.4 | | 1,902.8 | | 1,798.1 | | 1,725.3 |
Depreciation and amortization | | 218.5 | | 213.8 | | 192.4 | | 218.4 | | 222.0 | | 218.5 |
Impairment of long-lived assets | | 53.3 | | | — | | | 14.9 | | 4.2 | | | 52.4 | | | 53.3 |
| | 8,803.9 | | 9,834.2 | | 8,671.9 | | 9,058.6 | | 8,095.6 | | 8,800.7 |
| | | | | | | | | | | | |
Operating income | | 546.6 | | 617.4 | | 551.9 | | 662.4 | | 517.8 | | 549.8 |
Other income (expense): | | | | | | | |
| | | | | | | |
Other expense: | | | | | | | |
Interest | | (84.3) | | (81.9) | | (77.5) | | 73.9 | | 84.6 | | 84.3 |
Other (expense) income, net | | (3.6) | | | 10.8 | | | 3.9 | |
Other expense, net | | | 4.7 | | | 4.0 | | | 6.8 |
Income before income taxes | | 458.7 | | 546.3 | | 478.3 | | 583.8 | | 429.2 | | 458.7 |
Income tax provision | | 142.5 | | | 170.0 | | | 153.6 | |
Income tax (benefit) provision | | | (37.2) | | | 120.1 | | | 142.5 |
Net income | | 316.2 | | 376.3 | | 324.7 | | 621.0 | | 309.1 | | 316.2 |
Less: Net income attributable to noncontrolling interests | | 4.7 | | | 4.8 | | | 3.1 | | 7.6 | | | 4.8 | | | 4.7 |
Net income attributable to Reliance | $ | 311.5 | | $ | 371.5 | | $ | 321.6 | $ | 613.4 | | $ | 304.3 | | $ | 311.5 |
| | | | | | | | | |
Earnings per share attributable to Reliance stockholders: | | | | | | | | | | | | |
Diluted | $ | 4.16 | | $ | 4.73 | | $ | 4.14 | $ | 8.34 | | $ | 4.16 | | $ | 4.16 |
Basic | $ | 4.20 | | $ | 4.78 | | $ | 4.19 | $ | 8.42 | | $ | 4.21 | | $ | 4.20 |
| | | | | | | | | |
Cash dividends per share | $ | 1.60 | | $ | 1.40 | | $ | 1.26 | $ | 1.80 | | $ | 1.65 | | $ | 1.60 |
See accompanying notes to consolidated financial statements.
RELIANCE STEEL & ALUMINUM CO.
CONSOLIDATED STATEMENTS OF COMPREHENSIVE INCOMEINCOME
(in millions)
| | | | | | | |
| Year Ended December 31, | | | | | | |
| 2015 | | 2014 | | 2013 | Year Ended December 31, |
| | | | | | | 2017 | | 2016 | | 2015 |
Net income | $ | 316.2 | | $ | 376.3 | | $ | 324.7 | $ | 621.0 | | $ | 309.1 | | $ | 316.2 |
Other comprehensive income (loss) : | | | | | | | | | | | | |
Foreign currency translation loss | | (51.0) | | (26.4) | | (17.8) | |
Unrealized (loss) gain on investments, net of tax | | (0.4) | | 0.2 | | 0.4 | |
Foreign currency translation gain (loss) | | | 28.8 | | (5.7) | | (51.0) |
Unrealized loss on investments, net of tax | | | — | | — | | (0.4) |
Pension and postretirement benefit adjustments, net of tax | | 0.6 | | | (16.0) | | | 12.2 | | 4.3 | | | 0.7 | | | 0.6 |
Total other comprehensive loss | | (50.8) | | | (42.2) | | | (5.2) | |
Total other comprehensive income (loss) | | | 33.1 | | | (5.0) | | | (50.8) |
Comprehensive income | | 265.4 | | 334.1 | | 319.5 | | 654.1 | | 304.1 | | 265.4 |
Less: comprehensive income attributable to noncontrolling interests | | 4.7 | | | 4.8 | | | 3.1 | |
Less: Comprehensive income attributable to noncontrolling interests | | | 7.6 | | | 4.8 | | | 4.7 |
Comprehensive income attributable to Reliance | $ | 260.7 | | $ | 329.3 | | $ | 316.4 | $ | 646.5 | | $ | 299.3 | | $ | 260.7 |
See accompanying notes to consolidated financial statements.
RELIANCE STEEL & ALUMINUM CO.
CONSOLIDATED STATEMENTS OF EQUITYEQUITY
(in millions, except share and per share amounts)
| | | | | | | | | | | | | | | | | | | | | | | | | | | |
| Reliance Stockholders’ Equity | | | | | Reliance Stockholders’ Equity | | | | | | |
| Common Stock | | | | Accumulated | | | | | Common Stock | | | | | Accumulated | | | | | | |
| and Additional | | | | Other | | Non- | | | and Additional | | | | | Other | | Non- | | | |
| Paid-In Capital | | Retained | | Comprehensive | | controlling | | | Paid-In Capital | | Retained | | Comprehensive | | controlling | | | |
| Shares | | Amount | | Earnings | | Loss | | Interests | | Total | Shares | | Amount | | Earnings | | (Loss) Income | | Interests | | Total |
Balance at January 1, 2013 | 76,042,546 | | $ | 722.2 | | $ | 2,837.7 | | $ | (1.5) | | $ | 9.0 | | $ | 3,567.4 | |
Net income | — | | — | | 321.6 | | — | | 3.1 | | 324.7 | |
Other comprehensive income | — | | — | | — | | (5.2) | | — | | (5.2) | |
Payments to noncontrolling interest holder | — | | — | | — | | — | | (2.3) | | (2.3) | |
Stock-based compensation | 12,418 | | 26.0 | | — | | — | | — | | 26.0 | |
Stock options exercised | 1,437,053 | | 70.1 | | — | | — | | — | | 70.1 | |
Stock-based compensation tax benefit | — | | — | | 0.6 | | — | | — | | 0.6 | |
Cash dividends — $1.26 per share | — | | | — | | | (96.9) | | | — | | | — | | | (96.9) | |
Balance at December 31, 2013 | 77,492,017 | | 818.3 | | 3,063.0 | | (6.7) | | 9.8 | | 3,884.4 | |
Net income | — | | — | | 371.5 | | — | | 4.8 | | 376.3 | |
Other comprehensive loss | — | | — | | — | | (42.2) | | — | | (42.2) | |
Consolidation of joint venture | — | | — | | — | | — | | 22.6 | | 22.6 | |
Noncontrolling interest purchased | — | | — | | | | | | (4.2) | | (4.2) | |
Payments to noncontrolling interest holders | — | | — | | — | | — | | (4.1) | | (4.1) | |
Stock-based compensation | 11,830 | | 22.3 | | — | | — | | — | | 22.3 | |
Stock options exercised | 593,204 | | 28.8 | | — | | — | | — | | 28.8 | |
Repurchase of common shares | (759,800) | | (50.0) | | | | | | | | (50.0) | |
Stock-based compensation tax benefit | — | | — | | 2.7 | | — | | — | | 2.7 | |
Cash dividends — $1.40 per share | — | | | — | | | (108.7) | | | — | | | — | | | (108.7) | |
Balance at December 31, 2014 | 77,337,251 | | 819.4 | | 3,328.5 | | (48.9) | | 28.9 | | 4,127.9 | |
Balance at January 1, 2015 | | 77,337,251 | | $ | 819.4 | | $ | 3,328.5 | | $ | (48.9) | | $ | 28.9 | | $ | 4,127.9 |
Net income | — | | — | | 311.5 | | — | | 4.7 | | 316.2 | — | | | — | | | 311.5 | | | — | | | 4.7 | | | 316.2 |
Other comprehensive loss | — | | — | | — | | (50.8) | | — | | (50.8) | — | | | — | | | — | | | (50.8) | | | — | | | (50.8) |
Noncontrolling interest purchased | — | | (0.6) | | — | | — | | (2.0) | | (2.6) | — | | | (0.6) | | | — | | | — | | | (2.0) | | | (2.6) |
Payments to noncontrolling interest holders | — | | — | | — | | — | | (3.0) | | (3.0) | — | | | — | | | — | | | — | | | (3.0) | | | (3.0) |
Stock-based compensation | 271,438 | | 16.8 | | — | | — | | — | | 16.8 | 271,438 | | | 16.8 | | | — | | | — | | | — | | | 16.8 |
Stock options exercised | 325,024 | | 15.1 | | — | | — | | — | | 15.1 | 325,024 | | | 15.1 | | | — | | | — | | | — | | | 15.1 |
Repurchase of common shares | (6,194,641) | | (355.5) | | | | | | | | (355.5) | (6,194,641) | | | (355.5) | | | — | | | — | | | — | | | (355.5) |
Stock-based compensation tax deficit | — | | — | | (1.3) | | — | | — | | (1.3) | — | | | — | | | (1.3) | | | — | | | — | | | (1.3) |
Delaware reincorporation | — | | 38.6 | | (38.6) | | — | | — | | — | — | | | 38.6 | | | (38.6) | | | — | | | — | | | — |
Cash dividends — $1.60 per share and dividend equivalents | — | | | — | | | (120.1) | | | — | | | — | | | (120.1) | — | | | — | | | (120.1) | | | — | | | — | | | (120.1) |
Balance at December 31, 2015 | 71,739,072 | | $ | 533.8 | | $ | 3,480.0 | | $ | (99.7) | | $ | 28.6 | | $ | 3,942.7 | 71,739,072 | | | 533.8 | | | 3,480.0 | | | (99.7) | | | 28.6 | | | 3,942.7 |
Net income | | — | | | — | | | 304.3 | | | — | | | 4.8 | | | 309.1 |
Other comprehensive loss | | — | | | — | | | — | | | (5.0) | | | — | | | (5.0) |
Payments to noncontrolling interest holders | | — | | | — | | | — | | | — | | | (3.1) | | | (3.1) |
Stock-based compensation | | 188,576 | | | 18.0 | | | — | | | — | | | — | | | 18.0 |
Stock options exercised | | 755,145 | | | 37.5 | | | — | | | — | | | — | | | 37.5 |
Cumulative effect of change in accounting for stock-based compensation | | — | | | 1.0 | | | (0.6) | | | — | | | — | | | 0.4 |
Cash dividends — $1.65 per share and dividend equivalents | | — | | | — | | | (120.5) | | | — | | | — | | | (120.5) |
Balance at December 31, 2016 | | 72,682,793 | | | 590.3 | | | 3,663.2 | | | (104.7) | | | 30.3 | | | 4,179.1 |
Net income | | — | | | — | | | 613.4 | | | — | | | 7.6 | | | 621.0 |
Other comprehensive income | | — | | | — | | | — | | | 33.1 | | | — | | | 33.1 |
Payments to noncontrolling interest holders | | — | | | — | | | — | | | — | | | (5.1) | | | (5.1) |
Stock-based compensation | | 164,958 | | | 24.1 | | | — | | | — | | | — | | | 24.1 |
Stock options exercised | | 98,405 | | | 5.2 | | | — | | | — | | | — | | | 5.2 |
Repurchase of common shares | | (336,616) | | | (25.0) | | | — | | | — | | | — | | | (25.0) |
Cash dividends — $1.80 per share and dividend equivalents | | — | | | — | | | (132.5) | | | — | | | — | | | (132.5) |
Balance at December 31, 2017 | | 72,609,540 | | $ | 594.6 | | $ | 4,144.1 | | $ | (71.6) | | $ | 32.8 | | $ | 4,699.9 |
See accompanying notes to consolidated financial statements.
RELIANCE STEEL & ALUMINUM CO.
CONSOLIDATED STATEMENTS OF CASH FLOWSFLOWS
(in millions)
| | | | | | | | | | | | |
| Year Ended December 31, | Year Ended December 31, |
| 2015 | | 2014 | | 2013 | 2017 | | 2016 | | 2015 |
Operating activities: | | | | | | | | | | | | | | |
Net income | $ | 316.2 | | $ | 376.3 | | $ | 324.7 | $ | 621.0 | | $ | 309.1 | | $ | 316.2 |
Adjustments to reconcile net income to net cash provided by operating activities: | | | | | | | | | | | | |
Depreciation and amortization expense | | 218.5 | | 213.8 | | 192.4 | | 218.4 | | 222.0 | | 218.5 |
Impairment of long-lived assets | | 53.3 | | — | | 14.9 | | 4.2 | | 52.4 | | 53.3 |
Deferred income tax (benefit) provision | | (17.1) | | | (18.2) | | | 3.1 | |
(Gain) loss on sales of property, plant and equipment | | (2.2) | | | (12.9) | | | 0.7 | |
Deferred income tax benefit | | | (192.6) | | | (0.5) | | | (17.1) |
Gain on sales of property, plant and equipment | | | (9.5) | | | (1.2) | | | (2.2) |
Stock-based compensation expense | | 21.3 | | | 22.8 | | | 26.0 | | 33.4 | | | 24.4 | | | 21.3 |
Other | | 9.8 | | | (4.9) | | | 1.2 | | 7.7 | | | 7.7 | | | 9.8 |
Changes in operating assets and liabilities (excluding effect of businesses acquired): | | | | | | | | | | | | |
Accounts receivable | | 222.5 | | | (97.2) | | | 25.4 | | (119.7) | | | (31.2) | | | 222.5 |
Inventories | | 306.8 | | | (131.0) | | | 111.9 | | (186.6) | | | (30.4) | | | 306.8 |
Prepaid expenses and other assets | | (25.2) | | | 31.5 | | | (17.3) | | (11.5) | | | 26.7 | | | (25.2) |
Accounts payable and other liabilities | | (78.9) | | | (24.2) | | | (49.7) | | 34.2 | | | 47.5 | | | (78.9) |
Net cash provided by operating activities | | 1,025.0 | | | 356.0 | | | 633.3 | | 399.0 | | | 626.5 | | | 1,025.0 |
| | | | | | | | | | | | | | | | |
Investing activities: | | | | | | | | | | | | | | | | |
Purchases of property, plant and equipment | | (172.2) | | | (190.4) | | | (168.0) | | (161.6) | | | (154.9) | | | (172.2) |
Acquisitions, net of cash acquired | | (0.4) | | | (208.2) | | | (821.1) | | (37.8) | | | (348.7) | | | (0.4) |
Proceeds from sale of businesses, net | | — | | | 26.2 | | | 11.9 | |
Proceeds from sales of property, plant and equipment | | | 27.6 | | | 8.9 | | | 7.4 |
Other | | 2.7 | | | 7.4 | | | (1.8) | | (7.6) | | | (10.4) | | | (4.7) |
Net cash used in investing activities | | (169.9) | | | (365.0) | | | (979.0) | | (179.4) | | | (505.1) | | | (169.9) |
| | | | | | | | | | | | | | | | |
Financing activities: | | | | | | | | | | | | | | | | |
Net short-term debt borrowings (repayments) | | 12.7 | | | 1.7 | | | (473.0) | | 8.4 | | | (12.6) | | | 12.7 |
Proceeds from long-term debt borrowings | | 573.0 | | | 719.0 | | | 2,297.9 | | 875.0 | | | 2,073.0 | | | 573.0 |
Principal payments on long-term debt | | (962.3) | | | (552.2) | | | (1,454.5) | | (915.3) | | | (2,061.4) | | | (962.3) |
Debt issuance costs | | — | | | — | | | (10.3) | | — | | | (6.8) | | | — |
Dividends and dividend equivalents paid | | (120.1) | | | (108.7) | | | (96.9) | | (132.0) | | | (120.4) | | | (120.1) |
Exercise of stock options | | 15.1 | | | 28.8 | | | 70.1 | | 5.2 | | | 37.5 | | | 15.1 |
Share repurchases | | (355.5) | | | (50.0) | | | — | | (25.0) | | | — | | | (355.5) |
Other | | (11.4) | | | (5.6) | | | (1.2) | | (14.4) | | | (9.5) | | | (11.4) |
Net cash (used in) provided by financing activities | | (848.5) | | | 33.0 | | | 332.1 | |
Effect of exchange rate changes on cash | | (8.5) | | | (1.4) | | | (0.4) | |
(Decrease) increase in cash and cash equivalents | | (1.9) | | 22.6 | | (14.0) | |
Net cash used in financing activities | | | (198.1) | | | (100.2) | | | (848.5) |
Effect of exchange rate changes on cash and cash equivalents | | | 10.1 | | | (2.7) | | | (8.5) |
Increase (decrease) in cash and cash equivalents | | | 31.6 | | 18.5 | | (1.9) |
Cash and cash equivalents at beginning of year | | 106.2 | | | 83.6 | | | 97.6 | | 122.8 | | | 104.3 | | | 106.2 |
Cash and cash equivalents at end of year | $ | 104.3 | | $ | 106.2 | | $ | 83.6 | $ | 154.4 | | $ | 122.8 | | $ | 104.3 |
| | | | | | | | | | | | | | | | |
Supplemental cash flow information: | | | | | | | | | | | | |
Interest paid during the year | $ | 82.0 | | $ | 82.4 | | $ | 74.2 | $ | 72.5 | | $ | 81.4 | | $ | 82.0 |
Income taxes paid during the year, net | $ | 204.9 | | $ | 134.2 | | $ | 161.4 | $ | 171.1 | | $ | 95.1 | | $ | 204.9 |
| | | | | | | | | | | | | | | | |
Non-cash investing and financing activities: | | | | | | | | | | | | |
Debt assumed in connection with acquisitions | $ | — | | $ | 39.2 | | $ | 529.9 | $ | — | | $ | 6.1 | | $ | — |
See accompanying notes to consolidated financial statements.
Table of Contents
RELIANCE STEEL & ALUMINUM CO.
NOTES TO CONSOLIDATED FINANCIAL STATEMENTS
December 31, 20152017
Note 1. Summary of Significant Accounting PoliciesPolicies
Principles of Consolidation
The accompanying consolidated financial statements include the accounts of Reliance Steel & Aluminum Co. and its subsidiaries (collectively referred to as “Reliance”, “the Company”, “we”, “our” or “us”). Our consolidated financial statements include the assets, liabilities and operating results of majority‑owned subsidiaries. The ownership of the other interest holders of consolidated subsidiaries is reflected as noncontrolling interests. Our investments in unconsolidated subsidiaries are recorded under the equity method of accounting. All significant intercompany accounts and transactions have been eliminated.
Business
We operate a metals service center network of more than 300 locations in 3940 states in the U.S. and in 1213 other countries (Australia, Belgium, Canada, China, France, India, Malaysia, Mexico, Singapore, South Korea, Turkey, the U.A.E.United Arab Emirates and the United Kingdom) that provides value‑added metals processing services and distributes a full line of more than 100,000 metal products. Since our inception in 1939, we have not diversified outside our core business as a metals service center operator.
Accounting Estimates
The preparation of financial statements in conformity with U.S. generally accepted accounting principles (“GAAP”) requires management to make estimates and assumptions that affect the reported amounts of assets and liabilities, such as accounts receivable collectability, valuation of inventories, goodwill, long‑lived assets, income tax and other contingencies, and disclosure of contingent assets and liabilities at the date of the financial statements and the reported amounts of revenue and expenses during the reporting period. Actual results could differ from those estimates.
Accounts Receivable and Concentrations of Credit Risk
Concentrations of credit risk with respect to trade receivables are limited due to the geographically diverse customer base, with limited exposure to any single customer account, and various industries into which our products are sold. Trade receivables are typically non‑interest bearing and are initially recorded at cost. Sales to our recurring customers are generally made on open account terms while sales to occasional customers may be made on a C.O.D. basis when collectability is not assured. Past due status of customer accounts is determined based on how recently payments have been received in relation to payment terms granted. Credit is generally extended based upon an evaluation of each customer’s financial condition, with terms consistent in the industry and no collateral is required. Losses from credit sales are provided for in the financial statements and consistently have been within the allowance provided. The allowance is an estimate of the uncollectability of accounts receivable based on an evaluation of specific customer risks along with additional reserves based on historical and probable bad debt experience. Amounts are written offwritten-off against the allowance in the period we determine that the receivable is uncollectible. As a result of the above factors, we do not consider ourselves to have any significant concentrations of credit risk.
Inventories
The majority of our inventory is valued using the last‑in, first‑out (“LIFO”) method, which is not in excess of market. Under this method, older costs are included in inventory, which may be higher or lower than current costs. This method of valuation is subject to year‑to‑year fluctuations in cost of material sold, which is influenced by the inflation or deflation existing within the metals industry as well as fluctuations in our product mix and on‑hand inventory levels.
Table of Contents
RELIANCE STEEL & ALUMINUM CO.
NOTES TO CONSOLIDATED FINANCIAL STATEMENTS (Continued)
December 31, 20152017
Fair Values of Financial Instruments
Fair values of cash and cash equivalents, accounts receivable, accounts payable, accrued expenses and other current liabilities, and the current portion of long‑term debt approximate carrying values due to the short period of time to maturity. Fair values of long‑term debt, which have been determined based on borrowing rates currently available to us or to other companies with comparable credit ratings, for loans with similar terms or maturity, approximate the carrying amounts in the consolidated financial statements, with the exception of our $1.1 billion publicly traded senior unsecured notes.notes of $750.0 million as of December 31, 2017 and 2016. The fair values of these senior unsecured notes based on quoted market prices as of December 31, 20152017 and 2014,2016, were approximately $1.08 billion$831.7 million and $1.16 billion,$773.2 million, respectively, compared to their carrying valuevalues of approximately $1.09 billion$744.0 million and $743.2 million as of the end of each period.respective fiscal year. These estimated fair values are based on Level 2 inputs. Fair values are generally based on quoted market prices for identical or similar instruments.
Cash Equivalents
We consider all highly liquid instruments with an original maturity of three months or less when purchased to be cash equivalents. We maintain cash and cash equivalents with high‑credit, quality financial institutions. The Company, by policy, limits the amount of credit exposure to any one financial institution.
Goodwill
Goodwill is the excess of cost over the fair value of net assets of businesses acquired. Goodwill is not amortized but is tested for impairment at least annually. We have one operating segment and one reporting unit for goodwill impairment purposes.
We test for impairment of goodwill by assessing qualitative factors to determine if the fair value of the reporting unit is more likely than not below the carrying value of the reporting unit. We also calculate the fair value of the reporting unit using our market capitalization or the discounted cash flow method, as necessary, and compare the fair value to the carrying value of the reporting unit to determine if impairment exists. We perform the required annual goodwill impairment evaluation on November 1 of each year. No impairment of goodwill was determined to exist in any of the years presented.
Long‑Lived Assets
Property, plant and equipment is recorded at cost (or at fair value for assets acquired in connection with business combinations) and the provision for depreciation of these assets is generally computed on the straight‑line method at rates designed to distribute the cost of assets over the useful lives, estimated as follows: buildings, including leasehold improvements, over five to 50 years and machinery and equipment over three to 20 years.
Other intangible assets with finite useful lives are amortized over their useful lives. Other intangible assets deemed to have indefinite lives are not amortized but are subject to annual impairment tests. We review the recoverability of our long‑lived assets whenever events or changes in circumstances indicate that the carrying amount of such assets may not be recoverable. We recognized impairment losses of $14.4 million on our other intangible assets with finite lives in 2015 and $21.2$36.4 million and $14.9$21.2 million related to our other intangible assets with indefinite lives in 20152016 and 2013,2015, respectively. We recognized impairment losses of $4.2 million, $16.0 million and $17.7 million for property, plant, and equipment in 2015.2017, 2016 and 2015, respectively. See “Note 18 – Impairment of Long-Lived Assets”Note 17 — “Impairment and Restructuring Charges” for further discussion of our impairment losses. No long-lived asset impairment losses were recognized during the year ended December 31, 2014.
Table of Contents
RELIANCE STEEL & ALUMINUM CO.
NOTES TO CONSOLIDATED FINANCIAL STATEMENTS (Continued)
December 31, 20152017
Revenue Recognition
We recognize revenue from product or processing sales upon concluding that all of the fundamental criteria for product revenue recognition have been met, such as a fixed or determinable sales price; reasonable assurance of collectability; and passage of title and risks of ownership to the buyer. Such criteria are usually met upon delivery to the customer for orders with FOB destination terms or upon shipment for orders with FOB shipping point terms, or after toll processing services are performed. Considering the close proximity of our customers to our metals service center locations, shipment and delivery of our orders generally occur on the same day. Billings for orders where the revenue recognition criteria are not met, which primarily include certain bill and hold transactions (in which our customers request to be billed for the material but request delivery at a later date), are recorded as deferred revenue.
Shipping and handling charges to our customers are included in Net sales. Costs incurred in connection with shipping and handling our products that are performed by third-party carriers and costs incurred by our personnel are typically included in operating expenses. In 2015, 20142017, 2016 and 2013,2015, shipping and handling costs included in Warehouse, delivery, selling, general and administrative expenses were approximately $319.1$372.3 million, $312.6$346.2 million, and $284.8$319.1 million, respectively.
Stock‑Based Compensation
All of our stock‑based compensation plans are considered equity plans. We calculate the fair value of stock option awardsoptions on the grant date of the grant based on the closing market price of our common stock, using a Black‑Scholes option‑pricing model. The fair value of restricted stock grantsawards and restricted stock units is determined based on the fair value of our common stock on the day of the grant.grant date. The fair value of stock optionoptions, restricted stock awards, and restricted stock awardsunits is expensed on a straight‑line basis over their respective vesting periods, net of estimated forfeitures.forfeitures when they occur. The stock-based compensation expense recorded was $33.4 million, $24.4 million, and $21.3 million $22.8 million,in 2017, 2016 and $26.0 million in 2015, 2014 and 2013, respectively, and is included in the Warehouse, delivery, selling, general and administrative expense caption of our consolidated statements of income.
Environmental Remediation Costs
We accrue for losses associated with environmental remediation obligations when such losses are probable and reasonably estimable. Accruals for estimated losses from environmental remediation obligations generally are recognized no later than completion of the remediation feasibility study. Such accruals are adjusted as further information develops or circumstances change. Recoveries of environmental remediation costs from other parties are recorded as assets when their receipt is deemed probable. We are not aware of any environmental remediation obligations that would materially affect our operations, financial position or cash flows. See “NoteNote 14 – Commitments— “Commitments and Contingencies” for further discussion on our environmental remediation matters.
Income Taxes
We file a consolidated U.S. federal income tax return with our wholly owned domestic subsidiaries. The deferredDeferred tax assets and/orand liabilities are determined by multiplyingrecognized for the expected future tax consequences of temporary differences between the financial reporting and tax reporting bases forof assets and liabilities byusing the enacted tax rates expected to be in effect when such differences are recoveredrealized or settled. The effect on deferred taxes from a change in tax rates is recognized in income in the period that includes the enactment date of the change. The provision for income taxes reflects the taxes to be paid for the period and the change during the period in the deferred tax assets and liabilities. We evaluate on a quarterly basis whether, based on all available evidence, it is probable that the deferred income tax assets are realizable. Valuation allowances are established when it is estimated that it is more likely than not that the tax benefit of the deferred tax asset will not be realized.
Table of Contents
RELIANCE STEEL & ALUMINUM CO.
NOTES TO CONSOLIDATED FINANCIAL STATEMENTS (Continued)
December 31, 20152017
We make a comprehensive review of our uncertain tax positions on a quarterly basis. Tax benefits are recognized when it is more‑likely‑than‑not that a tax position will be sustained upon examination by the authorities. The benefit from a position that has surpassed the more‑likely‑than‑not threshold is the largest amount of benefit that is more than 50% likely to be realized upon settlement. We recognize interest and penalties accrued related to unrecognized tax benefits as a component of income tax expense.
On December 22, 2017, the Tax Cuts and Jobs Act of 2017 (“Tax Reform”) was enacted, which included significant changes to the taxation of U.S. corporations. These changes include, among other things, a reduction of the U.S. federal statutory rate from 35% to 21% effective in 2018, the implementation of a territorial tax system, a one-time tax in 2017 on accumulated foreign profits that have not been previously subject to U.S. tax law (deemed repatriation), the repeal of the corporate alternative minimum tax and changes to business deductions, including the repeal of the deduction for domestic production activities. For further discussion of the impact of the tax legislation, see Note 9 — “Income Taxes”.
Foreign Currencies
The currency effects of translating the financial statements of our foreign subsidiaries, which operate in local currency environments, are included in other comprehensive income.income (loss). Gains and losses resulting from foreign currency transactions are included in the results of operations in the Other (expense) income,expense, net caption and amounted to an insignificant amount in 2015, a net gainlosses of $3.1$4.9 million in 2014,2017 and a net lossgains of $2.6$1.8 million in 2013.2016. Gains and losses resulting from foreign currency transactions were insignificant in 2015.
Impact of Recently Issued Accounting Standards—Adopted
Balance Sheet ClassificationImproving the Presentation of Deferred TaxesNet Periodic Pension Cost and Net Periodic Postretirement Benefit Cost—In November 2015,March 2017, the Financial Accounting Standards Board (“FASB”) issued accounting changes requiring all deferred tax assetsto improve the presentation of net periodic pension cost and liabilities,net periodic postretirement benefit cost in the income statement, and any related valuation allowance, to narrow the amounts eligible for capitalization in assets. The amendments require the service cost component of net periodic benefit cost be reported in the same line as other compensation costs and the other components of net periodic benefit cost be presented asin the income statement outside of operating income. We adopted these changes in 2017 on a single noncurrent amount onretrospective basis. As a result of the balance sheet.adoption, we retrospectively adjusted the presentation of our income statement, decreasing Warehouse, delivery, selling, general and administrative expense by $5.2 million and $3.2 million and increasing Other expense, net by $5.2 million and $3.2 million in 2016 and 2015, respectively. The accounting guidance reducesadjustments to the income statement presentation for 2016 and 2015 were estimated using the components of net periodic benefit cost and complexity of recording deferred taxes as current and noncurrent. The guidance may be either adopted prospectivelyother than service cost included in Note 11 — “Employee Benefits” to all deferred tax liabilities and assets or retrospectively to all periods presented. We elected to prospectively adopt the accounting changes on October 1, 2015. The deferred tax amounts presented in our consolidated financial statements as ofincluded in our Annual Report on Form 10-K for the year ended December 31, 2014 were not retrospectively adjusted.
Simplifying2016. We include the Measurementcomponents of Inventory—In July 2015,net periodic benefit cost other than service cost in Other expense, net in all periods presented. The amendment requiring only the FASB issued accounting changes requiring that inventory that is measured using first-in, first-out (FIFO) or averageservice cost component of net periodic benefit cost to be measured at the lower of cost and net realizable value. The accounting guidance reduces the cost and complexity of measuring inventory at the lower of cost or marketeligible for which market could be replacement cost, net realizable value, or net realizable value less an appropriate normal profit margin. Our adoption of these accounting changes on October 1, 2015capitalization in assets did not have a material impact on our consolidated financial statements. This guidance did not apply to LIFO inventories, which comprise approximately 80% of our inventories.
Simplifying the Presentation of Debt Issuance Costs—In April 2015, the FASB issued accounting changes, which simplify the presentation of debt issuance costs. The guidance requires debt issuance costs related to a recognized debt liability to be presented in the balance sheet as a direct deduction from the carrying amount of the related debt liability, consistent with the presentation of debt discounts. The guidance is to be applied retrospectively to all prior periods presented in the financial statements. We adopted these accounting changes on April 1, 2015, which resulted in a $14.2 million reduction of our Intangible assets, net and Long-term debt at December 31, 2014.
Reporting Discontinued Operations and Disclosures of Disposals of Components of an Entity—In April 2014, the FASB issued accounting guidance for reporting discontinued operations and disposals of components of an entity. The guidance limits discontinued operations reporting to those disposals which represent a strategic shift that has (or will have) a major effect on an entity’s operations and financial results. The updated guidance also expands the disclosure requirements for discontinued operations and adds new disclosures for individually significant dispositions that do not qualify as discontinued operations. We adopted and applied the new guidance to our sale of Metals USA’s non-core roofing business in May 2014.asset capitalization policies. The adoption of these changes did not have a material impact on our consolidated financial statements.
Clarifying the Definition of a Business—In January 2017, the FASB issued accounting changes to clarify the definition of a business with the objective of adding guidance to assist entities with evaluating whether transactions should be accounted for as acquisitions (or disposals) of assets or businesses. The accounting changes provide a framework to determine when a set of assets and activities is not a business. Our adoption of these accounting changes in 2017 did not have a material impact on our consolidated financial statements.
Improvements to Employee Share-Based Payment Accounting—In March 2016, the FASB issued accounting changes intended to improve various aspects of the accounting for share-based payment transactions as part of its simplification
Table of Contents
RELIANCE STEEL & ALUMINUM CO.
NOTES TO CONSOLIDATED FINANCIAL STATEMENTS (Continued)
December 31, 20152017
Comprehensive Income Reporting and Disclosures—Oninitiative. We adopted these changes as of January 1, 2013, we adopted changes issued by the FASB, which require additional disclosures for the reclassification of significant amounts from accumulated other comprehensive income (loss) to net income. This guidance requires that the effect of certain significant amounts be presented either on the face of the consolidated statements of comprehensive income or in a single note. For other amounts, we are required to cross‑reference disclosures that provide additional detail about those amounts.2016. The adoption of these changes did not have a material impact on our consolidated financial statements. For further discussion of our adoption of these accounting changes, see Note 12 — “Equity”.
Impact of Recently Issued Accounting Standards—Not Yet Adopted
Classification of Certain Cash Receipts and Cash Payments—In August 2016, the FASB issued accounting changes that clarifies the presentation and classification of certain cash receipts and payments in the statement of cash flows with the objective of reducing the existing diversity in practice with respect to eight types of cash flows. The guidance will be effective for fiscal years and interim periods beginning after December 15, 2017, or January 1, 2018 for the Company. Early adoption is permitted. The adoption of this standard will not have a material impact on our consolidated financial statements.
Leases—In February 2016, the FASB issued accounting changes which will require lessees to recognize most long-term leases on-balance sheet through the recognition of a right-of-use asset and a lease liability. The guidance will be effective for fiscal years and interim periods beginning after December 15, 2018, or January 1, 2019 for the Company. Early adoption is permitted. We have implemented a lease management system and are developing processes necessary to implement these accounting changes. We expect the adoption of these accounting changes will materially increase our assets and liabilities, but will not have a material impact on our net income or equity. We anticipate adopting this new standard on January 1, 2019 with modified retrospective application, using the available practical expedients. Full retrospective application is prohibited.
Revenue from Contracts with CustomersCustomers——In May 2014, the FASB issued accounting changes, which replace most of the detailed guidance on revenue recognition that currently exists under U.S. GAAP. Under the new guidancestandard, an entity should recognize revenue when goods or services are transferred to the customer in an amount that reflects the consideration to which the entity expects to be entitled in exchange for those goods or services. The guidance will be effective for fiscal years beginning after December 15, 2016. Early adoption is not permitted. standard also requires enhanced disclosures regarding the nature, amount, timing and uncertainty of revenue and cash flows arising from an entity’s contracts with customers.
We are evaluatingcompleted our evaluation of the new standard but do not expect this standard to have a material impactand its potential impacts on our consolidated financial statements.statements and will adopt the new standard on January 1, 2018 using the modified retrospective approach. We will not record a cumulative-effect adjustment to retained earnings upon adoption. The adoption of the new standard will have an insignificant impact on our revenue recognition practices. This is mainly due to our businesses having minimal contract sales, as we primarily sell our inventories in the “spot market” under fixed price sales orders, the toll processing and logistics services we provide being short-term in nature and our contracts with customers generally having only one performance obligation. However, our future revenue recognition disclosures in the notes to our consolidated financial statements will be significantly expanded due to the disaggregation of revenue disclosure requirements.
Note 2. Acquisitions
2014 Acquisitions2017 Acquisition
On December 1, 2014,October 2, 2017, through our wholly owned subsidiary Diamond Manufacturing Company, we acquired Fox MetalsFerguson Perforating Company (“Ferguson”). Ferguson, headquartered in Providence, Rhode Island, specializes in manufacturing highly engineered and Alloys, Inc. ("Fox"), a Houston, Texas-based steel distributor specializingcomplex perforated metal parts that have application in alloy, carbondiverse end markets including industrial machinery, automotive, aerospace, sugar products and stainless steel bar and plate products, primarily servicing OEMs and machine shops that manufacture or supportconsumer electronics manufacturers. Ferguson’s net sales during the manufacturing of equipment for the oil, gas and petrochemical industries. Fox's in-house processing services include saw cutting, plate burning and testing. Net sales of Fox in 2015period from October 2, 2017 to December 31, 2017 were $21.6$7.8 million.
On August 1, 2014, we acquired Aluminium Services UK Limited, the parent holding company of All Metal Services (“AMS”). AMS provides comprehensive materials management solutions to aerospace and defense OEMs and their subcontractors on a global basis, supporting customers in more than 40 countries worldwide. AMS offers a broad range of aerospace metals including aluminum, steel, titanium, nickel alloys and aluminum bronze, offering full or cut to size materials. AMS also offers in-house machining and water-jet cutting for more complex requirements. AMS has eight locations in four countries including China, France, Malaysia, and the United Kingdom. Net sales of AMS in 2015 were $257.6 million.
On August 1, 2014, we acquired Northern Illinois Steel Supply Co. ("NIS"), a value-added distributor and fabricator of a variety of steel and non-ferrous metal products, primarily structural steel components and parts, located in Channahon, Illinois. Net sales of NIS in 2015 were $19.9 million.
We funded these acquisitions with borrowings on our revolving credit facility and cash on hand.
Table of Contents
RELIANCE STEEL & ALUMINUM CO.
NOTES TO CONSOLIDATED FINANCIAL STATEMENTS (Continued)
December 31, 20152017
We funded our acquisition of Ferguson with borrowings on our revolving credit facility and cash on hand.
2016 Acquisitions
On August 1, 2016, through our wholly owned subsidiary American Metals Corporation, we acquired Alaska Steel Company (“Alaska Steel”), a full-line metal distributor headquartered in Anchorage, Alaska. Our acquisition of Alaska Steel was our first entry into the Alaska market. Alaska Steel provides steel, aluminum, stainless and specialty metals and related processing services to a variety of customers in diverse industries including infrastructure and energy throughout Alaska. Alaska Steel’s net sales in 2017 were $22.0 million.
On April 1, 2016, we acquired Best Manufacturing, Inc. (“Best Manufacturing”), a custom sheet metal fabricator of steel and aluminum products on both a direct and toll basis. Best Manufacturing, headquartered in Jonesboro, Arkansas, provides various precision fabrication services including laser cutting, shearing, computer numerated control (“CNC”) punching, CNC forming and rolling, as well as welding, assembly, painting, inventory management and engineering expertise. Best Manufacturing’s net sales in 2017 were $21.6 million.
On January 1, 2016, we acquired Tubular Steel, Inc. (“Tubular Steel”), a distributor and processor of carbon, alloy and stainless steel pipe, tubing and bar products. Tubular Steel, headquartered in St. Louis, Missouri, has six locations and a fabrication business that supports its diverse customer base. Tubular Steel’s net sales in 2017 were $135.5 million.
We funded our 2016 acquisitions with borrowings on our revolving credit facility and cash on hand.
The allocation of the total purchase price of our 2016 acquisitions completed in 2014 to the fair values of the assets acquired and liabilities assumed was as follows:
| | |
| (in millions)
|
Cash
| $
| 1.6 |
Accounts receivable
| | 67.1 |
Inventories
| | 89.2 |
Property, plant and equipment
| | 23.4 |
Goodwill
| | 51.3 |
Intangible assets subject to amortization
| | 37.5 |
Intangible assets not subject to amortization
| | 39.0 |
Other current and long-term assets
| | 1.5 |
Total assets acquired
| | 310.6 |
Current and long-term debt
| | 39.2 |
Deferred taxes
| | 9.0 |
Other current and long-term liabilities
| | 53.1 |
Total liabilities assumed
| | 101.3 |
Net assets acquired
| $
| 209.3 |
2013 Acquisitions
On November 1, 2013, through our wholly owned subsidiary American Metals Corporation, we acquired Haskins Steel Co., Inc. (“Haskins Steel”), located in Spokane, Washington. Founded in 1955, Haskins Steel processes and distributes primarily carbon steel and aluminum products of various shapes and sizes to a diverse customer base in the Pacific Northwest. Their in‑house processing capabilities include shearing, sawing, burning and forming. Net sales of Haskins Steel in 2015 were $26.0 million.
On April 30, 2013, we acquired Travel Main Holdings, LLC (“Travel Main”), a real estate holding company with a portfolio of 18 real estate properties, all of which are leased by certain of our subsidiaries. The transaction value of $78.9 million included the assumption of $43.8 million of indebtedness. The cash portion of the purchase price was funded with borrowings on our revolving credit facility.
On April 12, 2013, we acquired Metals USA Holdings Corp. (“Metals USA”). Metals USA is one of the largest metals service center businesses in the United States and a leading provider of value‑added processed aluminum, brass, copper, carbon steel, stainless steel, manufactured metal components and inventory management services. Metals USA sells its products and services to a diverse customer base and broad range of end markets, including the aerospace, auto, defense, heavy equipment, marine transportation, commercial construction, office furniture manufacturing, energy and oilfield service industries, among several others. This acquisition added a total of 41 service centers strategically located throughout the United States to our existing operations and complements our existing customer base, product mix and geographic footprint. Net sales of Metals USA in 2015 were $1.54 billion.
On May 16, 2014, we sold Metals USA’s non-core roofing business for net proceeds of approximately $26.2 million and recorded a pre-tax loss of approximately $1.1 million, which is included in Other (expense) income, net. Net sales of Metals USA’s non-core roofing business for 2014 and during the period from April 13, 2013 through December 31, 2013 were $9.6 million and $25.4 million, respectively.
The purchase price for Metals USA of $766.8 million along with assumed debt of $486.1 million represents a total transaction value of approximately $1.25 billion. We funded the transaction and refinanced all but $12.3 million of
Table of Contents
RELIANCE STEEL & ALUMINUM CO.
NOTES TO CONSOLIDATED FINANCIAL STATEMENTS (Continued)
December 31, 2015
Metals USA’s debt with proceeds from our $500.0 million term loan, which we entered into in April 2013, and our April 2013 $500.0 million senior notes offering, with the balance drawn on our existing $1.5 billion revolving credit facility (see Note 8). For 2013, we incurred approximately $11.4 million in transaction related costs, which are included in Warehouse, delivery, selling, general and administrative expenses.
The allocation of the total purchase price of Metals USA to the fair values of assets acquired and liabilities assumed was as follows:
| | |
| (in millions)
|
Cash
| $
| 3.2 |
Accounts receivable
| | 206.0 |
Inventories
| | 379.5 |
Property, plant and equipment
| | 242.6 |
Goodwill
| | 382.7 |
Intangible assets subject to amortization
| | 137.6 |
Intangible assets not subject to amortization
| | 203.0 |
Other current and long-term assets
| | 9.1 |
Total assets acquired
| | 1,563.7 |
Current and long-term debt
| | 486.1 |
Deferred taxes
| | 184.4 |
Other current and long-term liabilities
| | 126.4 |
Total liabilities assumed
| | 796.9 |
Net assets acquired
| $
| 766.8 |
| | |
| (in millions) |
Cash | $ | 1.5 |
Accounts receivable | | 14.1 |
Inventories | | 66.6 |
Property, plant and equipment | | 62.2 |
Goodwill | | 104.7 |
Intangible assets subject to amortization | | 77.1 |
Intangible assets not subject to amortization | | 38.2 |
Other current and long-term assets | | 0.5 |
Total assets acquired | | 364.9 |
Current and long-term debt | | 6.1 |
Other current and long-term liabilities | | 7.3 |
Total liabilities assumed | | 13.4 |
Net assets acquired | $ | 351.5 |
Summary purchase price allocation information for all acquisitions
All of the acquisitions discussed in this note have been accounted for under the acquisition method of accounting and, accordingly, each purchase price has been allocated to the assets acquired and liabilities assumed based on the estimated fair values at the date of each acquisition. The accompanying consolidated statements of income include the revenues and expenses of each acquisition since its respective acquisition date. The consolidated balance sheets reflect the allocations of each acquisition’s purchase price as of December 31, 20152017 or 2014,2016, as applicable. The purchase price allocation for
Table of Contents
RELIANCE STEEL & ALUMINUM CO.
NOTES TO CONSOLIDATED FINANCIAL STATEMENTS (Continued)
December 31, 2017
Ferguson is preliminary and is pending the completion of pre-acquisition income tax returns. The measurement periods for purchase price allocations do not exceed 12 months from the acquisition date.
As part of the purchase price allocations of the acquisitions completed in 20142017 and 2013, $39.02016, $3.7 million and $206.8$38.2 million, respectively, were allocated to the trade names acquired. We determined that substantially all of the trade names acquired in connection with these acquisitions had indefinite lives since their economic lives are expected to approximate the life of each company acquired. Additionally, we recorded other identifiable intangible assets related to customer relationships for the 20142017 and 20132016 acquisitions of $37.3$3.7 million and $135.3$76.8 million, respectively, with weighted average lives of 13.610.0 and 12.515.5 years, respectively. The goodwill arising from our 20142017 and 20132016 acquisitions consists largely of expected strategic benefits, including enhanced financial and operational scale, as well as expansion of acquired product and processing know howknow-how across our enterprise. Tax deductible goodwill from our 2014 and 20132016 acquisitions amounted to $20.3 million and $107.7 million, respectively. Tax deductible goodwill related to our sale of Metals USA’s non-core roofing business was $17.2$104.7 million. Total tax deductible goodwill amounted to approximately $558.7$664.0 million as of December 31, 2015.2017.
Table of Contents
RELIANCE STEEL & ALUMINUM CO.
NOTES TO CONSOLIDATED FINANCIAL STATEMENTS (Continued)
December 31, 2015
Note 3. Joint Ventures and Noncontrolling Interests
The equity method of accounting is used where our investment in voting stock gives us the ability to exercise significant influence over the investee, generally 20% to 50%. The financial results of investees are generally consolidated when the ownership interest is greater than 50%.
We have two joint venture arrangements with noncontrolling interests: Oregon Feralloy Partners LLC (40%‑owned)-owned) and Eagle Steel Products, Inc. (45%‑owned)-owned). These investments are accounted for using the equity method. The corresponding investments in these entities are reflected in the Investments in unconsolidated entitiesOther assets caption of the consolidated balance sheet.sheets. Equity in earnings of these entities and related distribution of earnings have not been material to our results of operations or cash flows.
Operations that are majority owned by us are as follows: Acero Prime S. de R.L. de C.V. (60%-owned), Feralloy Processing Company (51%‑owned), FP Structural Solutions (70%‑owned)-owned), Indiana Pickling and Processing Company (56%-owned), and Valex Corp.’s operations in South Korea, in which Valex Corp. has 95% ownership. The results of these majority‑owned operations are consolidated in our financial results. The portion of the earnings related to the noncontrolling shareholder interests has been reflected in the Net income attributable to noncontrolling interests caption in the accompanying consolidated statements of income.
On December 15, 2015, we purchased the noncontrolling interest of Valex Corp., which increased our ownership from 97% to 100%, and on September 11, 2015 Valex Corp. purchased the noncontrolling interest in its operation in the People’s Republic of China, which increased its ownership interest from 92% to 100%.
On October 1, 2014, we acquired a controlling interest in our joint venture partnership Acero Prime S. de R.L. de C.V. (“Acero Prime”), a toll processor in Mexico, and subsequently purchased additional interests on November 3, 2014, which, together, increased our ownership from 40% to 60%. Concurrent with this acquisition achieved in stages, we recognized an $11.4 million gain on our previously held equity interest remeasured at fair value. The allocation of the total purchase price to the fair values of the assets acquired and liabilities assumed included $57.6 million of total assets and noncontrolling interest of $22.6 million.
Note 4. Inventories
Our inventories are primarily stated on the last‑in, first‑out (“LIFO”)LIFO method, which is not in excess of market. We use the LIFO method of inventory valuation because it results in a better matching of costs and revenues. AsThe cost of December 31, 2015 cost on the first‑in, first‑out (“FIFO”) method was lower than the LIFO value of inventories by $26.1 million. As of December 31, 2014, cost on the FIFO method exceeded the LIFO value of inventories by $143.1 million. Inventories of $304.6 million and $305.9 million as of December 31, 2015 and 2014, respectively, were stated on the FIFOfirst-in, first-out (“FIFO”) method which is not in excess of net realizable value. Due to a significant decline in metals pricing that resulted in our LIFO inventory valuation exceeding current replacement cost, we recorded a lower of cost or market charge of $69.1 million related to our inventories measured using the LIFO method in 2015.
Cost decreases in 2015 and 2013 for the majority of our products were the primary cause of the $186.1 million and $50.2 million reductions in the LIFO valuation reserve, respectively, which decreased cost of sales. The 2015 amount, however, was net of the impact of inventory quantity reductions, which resulted in a liquidation of LIFO inventory quantities carried at higher costs prevailing in prior years as compared with the cost of 2015 purchases, the effect of which increased cost of sales by approximately $38.7 million in 2015. Cost increases in 2014 for the majority of our products were the primary cause of the $54.5 million increase in the LIFO valuation reserve, which increased cost of sales. There were insignificant liquidations of LIFO inventory quantities in 2014 and 2013.
Table of Contents
RELIANCE STEEL & ALUMINUM CO.
NOTES TO CONSOLIDATED FINANCIAL STATEMENTS (Continued)
December 31, 20152017
Inventories consisted of the following:
| | | | | |
| December 31, | | December 31, |
| 2017 | | 2016 |
| (in millions) |
LIFO inventories - cost on the FIFO method | $ | 1,390.0 | | $ | 1,219.0 |
| | | | | |
LIFO inventory valuation reserve adjustment | | (21.8) | | | 51.5 |
Lower of cost or market adjustment | | — | | | (42.6) |
Cost on FIFO method (higher) lower than LIFO value | | (21.8) | | | 8.9 |
| | | | | |
Inventories - stated on LIFO method | | 1,368.2 | | | 1,227.9 |
Inventories - stated on FIFO method | | 357.8 | | | 304.7 |
| $ | 1,726.0 | | $ | 1,532.6 |
Note 5. Goodwill
The lower of cost or market charge in 2016 was due to a significant decline in metals pricing that resulted in our LIFO inventory valuation exceeding current replacement cost. In 2016, we also recorded a lower of cost or market charge of $7.6 million relating to certain inventories of a foreign subsidiary that are remeasured into the U.S. dollar.
The changes in the carrying amountLIFO valuation reserve and impact of goodwill areLIFO liquidations were as follows:
| | |
| (in millions)
|
| | |
Balance at January 1, 2013
| $
| 1,314.6 |
Acquisitions
| | 382.4 |
Effect of foreign currency translation
| | (5.4) |
Balance at December 31, 2013
| | 1,691.6 |
Acquisitions
| | 51.3 |
Consolidation of a joint venture entity
| | 15.2 |
Purchase price allocation adjustments
| | 2.1 |
Sale of business
| | (17.1) |
Effect of foreign currency translation
| | (6.7) |
Balance at December 31, 2014
| | 1,736.4 |
Acquisitions
| | 0.4 |
Purchase price allocation adjustments
| | (0.4) |
Effect of foreign currency translation
| | (11.6) |
Balance at December 31, 2015
| $
| 1,724.8 |
| | | | | | | | |
| Year Ended December 31, |
| 2017 | | 2016 | | 2015 |
| (in millions) |
LIFO inventory valuation reserve adjustment charge (income) | $ | 73.3 | | $ | (8.5) | | $ | (186.1) |
Liquidation of LIFO inventory quantities that increased cost of sales | | ** | | | ** | | $ | 38.7 |
We had no accumulated impairment losses related to goodwill at December 31, 2015.** Insignificant liquidations of LIFO inventory quantities.
Note 6. Intangible Assets, netCost increases for the majority of our products were the primary cause of the 2017 increase in the LIFO valuation reserve. Cost decreases for the majority of our products were the primary cause of the 2016 and 2015 reductions in the LIFO valuation reserve.
Intangible assets, net, consisted of the following:
| | | | | | | | | | | | | |
| | | December 31, 2015 | | December 31, 2014 |
| Weighted Average | | Gross | | | | | Gross | | | |
| Amortizable | | Carrying | | Accumulated | | Carrying | | Accumulated |
| Life in Years | | Amount | | Amortization | | Amount | | Amortization |
| | | (in millions) |
Intangible assets subject to amortization: | | | | | | | | | | | | | |
Covenants not to compete | 4.4 | | $ | 1.3 | | $ | (1.0) | | $ | 2.3 | | $ | (1.7) |
Customer lists/relationships | 14.7 | | | 659.0 | | | (285.7) | | | 694.7 | | | (249.3) |
Software – internal use | 10.0 | | | 8.1 | | | (7.9) | | | 8.1 | | | (7.1) |
Other | 5.3 | | | 6.3 | | | (5.0) | | | 7.2 | | | (4.5) |
| | | | 674.7 | | | (299.6) | | | 712.3 | | | (262.6) |
Intangible assets not subject to amortization: | | | | | | | | | | | | | |
Trade names | | | | 750.3 | | | — | | | 777.7 | | | — |
| | | $ | 1,425.0 | | $ | (299.6) | | $ | 1,490.0 | | $ | (262.6) |
Foreign currency translation losses related to intangible assets, net in 2015 were approximately $13.5 million. Impairment losses of $21.2 million related to five of our trade names and $14.4 million related to two of our customer relationships were recognized during the year ended December 31, 2015. See “Note 18 - Impairment of Long-Lived Assets” for further discussion of our impairment losses. No impairment losses were recognized during the year ended December 31, 2014.
Table of Contents
RELIANCE STEEL & ALUMINUM CO.
NOTES TO CONSOLIDATED FINANCIAL STATEMENTS (Continued)
December 31, 20152017
Note 5. Goodwill
The changes in the carrying amount of goodwill are as follows:
| | |
| (in millions) |
| | |
Balance at January 1, 2015 | $ | 1,736.4 |
Acquisitions | | 0.4 |
Purchase price allocation adjustments | | (0.4) |
Effect of foreign currency translation | | (11.6) |
Balance at December 31, 2015 | | 1,724.8 |
Acquisitions | | 103.4 |
Disposal of businesses | | (1.0) |
Effect of foreign currency translation | | 0.2 |
Balance at December 31, 2016 | | 1,827.4 |
Acquisitions | | 10.3 |
Effect of foreign currency translation | | 4.9 |
Balance at December 31, 2017 | $ | 1,842.6 |
All of the goodwill recorded from our 2016 acquisitions is tax deductible.
We had no accumulated impairment losses related to goodwill at December 31, 2017.
Note 6. Intangible Assets, net
Intangible assets, net, consisted of the following:
| | | | | | | | | | | | | |
| | | December 31, 2017 | | December 31, 2016 |
| Weighted Average | | Gross | | | | | Gross | | | |
| Amortizable | | Carrying | | Accumulated | | Carrying | | Accumulated |
| Life in Years | | Amount | | Amortization | | Amount | | Amortization |
| | | (in millions) |
Intangible assets subject to amortization: | | | | | | | | | | | | | |
Covenants not to compete | 4.7 | | $ | 0.8 | | $ | (0.4) | | $ | 1.1 | | $ | (0.6) |
Customer lists/relationships | 14.6 | | | 745.0 | | | (391.3) | | | 736.7 | | | (338.9) |
Software | 10.0 | | | 8.1 | | | (8.1) | | | 8.1 | | | (8.1) |
Other | 5.4 | | | 6.3 | | | (5.9) | | | 6.3 | | | (5.5) |
| | | | 760.2 | | | (405.7) | | | 752.2 | | | (353.1) |
Intangible assets not subject to amortization: | | | | | | | | | | | | | |
Trade names | | | | 757.6 | | | — | | | 752.2 | | | — |
| | | $ | 1,517.8 | | $ | (405.7) | | $ | 1,504.4 | | $ | (353.1) |
Intangible assets recorded in connection with our 2017 acquisition was $7.4 million (see Note 2 — “Acquisitions”). A total of $3.7 million was allocated to the trade name acquired, which is not subject to amortization.
Impairment losses of $36.4 million related to eight of our trade name intangible assets were recognized in 2016. Impairment losses of $21.2 million related to five of our trade name intangible assets and $14.4 million related to two of
Table of Contents
RELIANCE STEEL & ALUMINUM CO.
NOTES TO CONSOLIDATED FINANCIAL STATEMENTS (Continued)
December 31, 2017
our customer relationship intangible assets were recognized in 2015. See Note 17 — “Impairment and Restructuring Charges” for further discussion of our impairment losses.
Amortization expense for intangible assets amounted to $50.6 million, $54.1 million and $53.7 million $56.7 millionin 2017, 2016 and $54.9 million2015, respectively. Foreign currency translation gains related to intangible assets, net in 2015, 2014 and 2013, respectively.2017 were $4.0 million.
The following is a summary of estimated aggregate amortization expense for each of the next five years:
| | | | |
| (in millions) | (in millions) |
2016 | $ | 49.3 | |
2017 | | 45.1 | |
2018 | | 40.8 | $ | 46.7 |
2019 | | 40.6 | | 46.6 |
2020 | | 40.7 | | 46.6 |
2021 | | | 42.6 |
2022 | | | 34.3 |
Note 7. Cash Surrender Value of Life Insurance Policies, net
The cash surrender value of all life insurance policies held by us, net of loans and related accrued interest, was $45.8$47.8 million and $46.4$46.9 million as of December 31, 20152017 and 2014,2016, respectively.
Our wholly owned subsidiary, Earle M. Jorgensen Company (“EMJ”), is the owner and beneficiary of life insurance policies on all former nonunion employees of a predecessor company, including certain current employees of EMJ. These policies, by providing payments to EMJ upon the death of covered individuals, were designed to provide cash to EMJ in order to repurchase shares held by employees in EMJ’s former employee stock ownership plan and shares held individually by employees upon the termination of their employment. We are also the owner and beneficiary of key man life insurance policies on certain current and former executives of the Company, its subsidiaries and predecessor companies.
Cash surrender value of the life insurance policies increases by a portion of the amount of premiums paid and by investment income earned under the policies and decreases by the amount of cost of insurance charges, investment losses and interest on policy loans, as applicable.
Income earned on all of our life insurance policies is recorded in the Other (expense) income,expense, net caption in the accompanying consolidated statements of income (see “NoteNote 13 – Other (Expense) Income,— “Other Expense, net”).
Annually, we expect to borrow against the cash surrender value of policies to pay a portion of the premiums and accrued interest on loans against those policies. In 2015, weWe borrowed $49.9 million, $51.3 million and $47.9 million against the cash surrender value of certain policies, which was used to partially pay premiums and accrued interest owed of $64.0 million, $64.7 million and $60.4 million. In 2014, we borrowed $44.5 million against the cash surrender value of certain policies, which was used to partially pay premiumsin 2017, 2016 and accrued interest owed of $56.0 million.2015, respectively. Interest rates on borrowings under some of the EMJ life insurance policies are fixed at 11.76% and the portion of the policy cash surrender value that the borrowings relate to earns interest and dividend income at 11.26%. The unborrowed portion of the policy cash surrender value earns income at rates commensurate with certain risk‑free U.S. Treasury bond yields but not less than 4.0%. All other life insurance policies earn investment income or incur losses based on the performance of the underlying investments held by the policies.
As of December 31, 20152017 and 2014,2016, loans and accrued interest outstanding on EMJ’s life insurance policies were approximately $535.2$612.0 million and $493.2$577.6 million, respectively. There were no borrowings available as of December 31, 20152017 and December 31, 2014.2016. Interest expense on borrowings against cash surrender values is included in the Other (expense) income,expense, net caption in the accompanying consolidated statements of income (see “NoteNote 13 – Other (Expense) Income,— “Other Expense, net”).
Table of Contents
RELIANCE STEEL & ALUMINUM CO.
NOTES TO CONSOLIDATED FINANCIAL STATEMENTS (Continued)
December 31, 20152017
Note 8. Debt
Debt consisted of the following:
| | | | | | | | | |
| December 31, | | December 31, | December 31, | | December 31, |
| 2015 | | 2014 | 2017 | | 2016 |
| (in millions) | | | | | |
Unsecured revolving credit facility due April 4, 2018 | $ | 332.0 | | $ | 675.0 | |
Unsecured term loan due from March 31, 2016 to April 4, 2018 | | 398.8 | | 442.5 | |
Senior unsecured notes due November 15, 2016 | | 350.0 | | 350.0 | |
| | (in millions) |
Unsecured revolving credit facility due September 30, 2021 | | $ | 538.0 | | $ | 540.0 |
Unsecured term loan due from March 30, 2018 to September 30, 2021 | | | 562.5 | | | 600.0 |
Senior unsecured notes due April 15, 2023 | | 500.0 | | 500.0 | | 500.0 | | | 500.0 |
Senior unsecured notes due November 15, 2036 | | 250.0 | | 250.0 | | 250.0 | | | 250.0 |
Other notes and revolving credit facilities | | 111.3 | | | 101.6 | | 64.0 | | | 55.0 |
Total | | 1,942.1 | | 2,319.1 | | 1,914.5 | | | 1,945.0 |
Less: unamortized discount and debt issuance costs | | (13.4) | | (17.1) | | (13.1) | | | (15.8) |
Less: amounts due within one year and short-term borrowings | | (500.8) | | | (93.9) | | (92.0) | | | (82.5) |
Total long-term debt | $ | 1,427.9 | | $ | 2,208.1 | $ | 1,809.4 | | $ | 1,846.7 |
Unsecured Credit Facility
On April 4, 2013,September 30, 2016, we entered into a syndicated Third Amended and Restated Credit Agreement$2.1 billion unsecured five-year credit agreement (“Credit Agreement”) with 26 banks as lenders. The Credit Agreement amended and extended our existingcomprised of a $1.5 billion unsecured revolving credit facility and provided for a $500.0$600.0 million unsecured term loan, andwith an option to increase the revolving credit facility for up to $500.0 million at our request, subject to approval of the lenders and certain other customary conditions. The term loan due April 4, 2018September 30, 2021 amortizes in quarterly installments, with an annual amortization of 5% through September 2018 and 10% thereafter until March 2018,June 2021, with the balance to be paid at maturity. Interest on borrowings from the revolving credit facility and term loan during the year endedat December 31, 20152017 was at variable rates based on LIBOR plus 1.25% or the bank prime rate plus 0.25% and included a commitment fee at an annual rate of 0.20%0.15% on the unused portion of the revolving credit facility. The applicable margins over LIBOR rate and base rate borrowings, along with commitment fees, are subject to adjustment every quarter based on our leverage ratio, as defined in the Credit Agreement. All borrowings under the Credit Agreement may be repaid without penalty.
Weighted average interest rates on borrowings outstanding on the revolving credit facility were 1.81%2.96% and 1.42%2.16% as of December 31, 20152017 and 2014,December 31, 2016, respectively. Weighted average interest rates on borrowings outstanding on the term loan were 1.67%2.82% and 1.42%2.02% as of December 31, 20152017 and 2014,December 31, 2016, respectively. As of December 31, 2015,2017, we had $332.0$538.0 million of outstanding borrowings, $57.4$53.3 million of letters of credit issued and $1.11 billion$908.7 million available for borrowing on the revolving credit facility.
Senior Unsecured Notes
On November 20, 2006, we entered into an indenture (the “2006 Indenture”), for the issuance of $600.0 million of unsecured debt securities. The total debt issued was comprised of two tranches, (a) $350.0 million aggregate principal amount of senior unsecured notes bearing interest at the rate of 6.20% per annum, maturingwhich matured and were repaid on November 15, 2016 and (b) $250.0 million aggregate principal amount of senior unsecured notes bearing interest at the rate of 6.85% per annum, maturing on November 15, 2036.
On April 12, 2013, we entered into an indenture (the “2013 Indenture” and, together with the 2006 Indenture, the “Indentures”), for the issuance of $500.0 million aggregate principal amount of senior unsecured notes at the rate of 4.50% per annum, maturing on April 15, 2023. The net proceeds from the issuance of these notes were used to partially fund the acquisition of Metals USA.
Table of Contents
RELIANCE STEEL & ALUMINUM CO.
NOTES TO CONSOLIDATED FINANCIAL STATEMENTS (Continued)
December 31, 20152017
Under the Indentures, the notes are senior unsecured obligations and rank equally in right of payment with all of our existing and future unsecured and unsubordinated obligations. The notes are guaranteed by certain of our 100%‑owned domestic subsidiaries that guarantee our revolving credit facility.
The senior unsecured notes include provisions that require us to make an offer to repurchase the notes at a price equal to 101% of their principal amount plus accrued and unpaid interest in the event of both a change in control and a downgrade of our credit rating.
Other Notes and Revolving Credit Facilities
Other revolvingRevolving credit facilities with a combined credit limit of approximately $76.2$70.3 million are in place for operations in Asia and Europe with combined outstanding balances of $59.9$53.9 million and $48.3$44.4 million as of December 31, 20152017 and December 31, 2014,2016, respectively.
In connection with our acquisition of Metals USA, we assumedVarious industrial revenue bonds withhad combined outstanding balances of $11.0$10.1 million and $11.5$10.6 million as of December 31, 20152017 and December 31, 2014,2016, respectively, and maturities through 2027. Additionally, we assumed mortgage obligations pursuant to our acquisition of a portfolio of real estate properties that we were leasing, which have outstanding balances of $40.4 million and $41.8 million as of December 31, 2015 and December 31, 2014, respectively. The mortgages, which are secured by the underlying properties, have a fixed interest rate of 6.40% and scheduled amortization payments with a lump sum payment of $39.2 million due October 1, 2016.
Covenants
The Credit Agreement requiresand the Indentures include customary representations, warranties, covenants, acceleration, indemnity and events of default provisions. The covenants under the Credit Agreement include, among other things, two financial covenants that require us to maintaincomply with an interest coverage ratio and a maximum leverage ratio, among other things. Our interest coverage ratioratio.
Debt Maturities
The following is a summary of aggregate maturities of long‑term debt for the twelve‑month period ended December 31, 2015 was approximately 7.0 times compared to the debt covenant minimum requirement of 3.0 times (interest coverage ratio is calculated as net income attributable to Reliance plus interest expense and provision for income taxes and plus or minus any non‑operating non‑recurring loss or gain, respectively, divided by interest expense). Our leverage ratio as of December 31, 2015 calculated in accordance with the termseach of the Credit Agreement was 33.6% compared to the debt covenant maximum amount of 60% (leverage ratio is calculated as total debt, inclusive of capital lease obligationsnext five years and outstanding letters of credit, divided by the sum of Reliance stockholders’ equity plus total debt).thereafter:
| | |
2018 | $ | 92.0 |
2019 | | 60.6 |
2020 | | 60.6 |
2021 | | 943.6 |
2022 | | 0.3 |
Thereafter | | 757.4 |
| $ | 1,914.5 |
Our obligations under the Credit Agreement and Indentures are required to be guaranteed by certain of our 100%‑owned domestic subsidiaries. The subsidiary guarantors, together with Reliance, are required to collectively account for at least 80% of our consolidated EBITDA and 80% of consolidated tangible assets. Reliance and the subsidiary guarantors accounted for approximately 91% of our total consolidated EBITDA for the last twelve months and approximately 83% of total consolidated tangible assets as of December 31, 2015.
We were in compliance with all material covenants in our debt agreements at December 31, 2015.
Table of Contents
RELIANCE STEEL & ALUMINUM CO.
NOTES TO CONSOLIDATED FINANCIAL STATEMENTS (Continued)
December 31, 20152017
Debt Maturities
The following is a summary of aggregate maturities of long‑term debt for each of the next five years and thereafter:
| | |
2016 | $ | 500.8 |
2017 | | 50.5 |
2018 | | 631.3 |
2019 | | 0.6 |
2020 | | 0.6 |
Thereafter | | 758.3 |
| $ | 1,942.1 |
Note 9. Income Taxes
Reliance and its subsidiaries file numerous consolidated and separate income tax returns in the United States federal jurisdiction and in many state and foreign jurisdictions. We are no longer subject to U.S. federal tax examinations for years before 2011 or2014 and state and local tax examinations before 2009.
2013. Significant components of the provision for income taxes attributable to continuing operations arewere as follows:
| | | | | | | |
Reliance and its subsidiaries file numerous consolidated and separate income tax returns in the United States federal jurisdiction and in many state and foreign jurisdictions. We are no longer subject to U.S. federal tax examinations for years before 2014 and state and local tax examinations before 2013. Significant components of the provision for income taxes attributable to continuing operations were as follows:Reliance and its subsidiaries file numerous consolidated and separate income tax returns in the United States federal jurisdiction and in many state and foreign jurisdictions. We are no longer subject to U.S. federal tax examinations for years before 2014 and state and local tax examinations before 2013. Significant components of the provision for income taxes attributable to continuing operations were as follows: | | | | | | | | | |
| Year Ended December 31, | Year Ended December 31, |
| 2015 | | 2014 | | 2013 | 2017 | | 2016 | | 2015 |
| (in millions) | (in millions) |
Current: | | | | | | | | | | | | | | |
Federal | $ | 129.5 | | $ | 153.2 | | $ | 121.4 | $ | 117.8 | | $ | 91.1 | | $ | 129.5 |
State | | 21.3 | | 25.2 | | 19.1 | | 21.5 | | | 18.9 | | | 21.3 |
Foreign | | 8.8 | | | 9.8 | | | 10.0 | | 16.1 | | | 10.6 | | | 8.8 |
| | 159.6 | | 188.2 | | 150.5 | | 155.4 | | | 120.6 | | | 159.6 |
Deferred: | | | | | | | | | | | | | | |
Federal | | (11.7) | | (18.7) | | 1.5 | | (202.8) | | | 3.0 | | | (11.7) |
State | | (4.5) | | (2.2) | | 1.5 | | 11.1 | | | 1.0 | | | (4.5) |
Foreign | | (0.9) | | | 2.7 | | | 0.1 | | (0.9) | | | (4.5) | | | (0.9) |
| | (17.1) | | | (18.2) | | | 3.1 | | (192.6) | | | (0.5) | | | (17.1) |
| $ | 142.5 | | $ | 170.0 | | $ | 153.6 | $ | (37.2) | | $ | 120.1 | | $ | 142.5 |
Components of U.S. and international income before income taxes were as follows:
| | | | | | | | | | | | | | |
| Year Ended December 31, | Year Ended December 31, |
| 2015 | | 2014 | | 2013 | 2017 | | 2016 | | 2015 |
| (in millions) | (in millions) |
| | | | | | | | | | | | | | |
U.S. | $ | 427.3 | | $ | 488.5 | | $ | 438.4 | $ | 524.6 | | $ | 411.0 | | $ | 427.3 |
International | | 31.4 | | | 57.8 | | | 39.9 | | 59.2 | | | 18.2 | | | 31.4 |
Income before income taxes | $ | 458.7 | | $ | 546.3 | | $ | 478.3 | $ | 583.8 | | $ | 429.2 | | $ | 458.7 |
The reconciliation of income tax at the U.S. federal statutory tax rate to income tax expense is as follows:
| | | | | | |
| Year Ended December 31, | |
| 2017 | | 2016 | | 2015 | |
Income tax at U.S. federal statutory tax rate | 35.0 | % | 35.0 | % | 35.0 | % |
Tax reform | (35.5) | | — | | — | |
State income tax, net of federal tax effect | 3.8 | | 3.1 | | 2.0 | |
Foreign earnings taxed at lower rates | (0.7) | | (0.8) | | (0.8) | |
Net effect of life insurance policies | (3.6) | | (4.2) | | (3.6) | |
Net effect of changes in unrecognized tax benefits | (0.2) | | (4.3) | | 0.7 | |
Domestic production activity deduction | (1.6) | | (1.7) | | (2.0) | |
Loss on sale of assets | (0.8) | | — | | — | |
Other, net | (2.8) | | 0.9 | | (0.2) | |
Effective tax rate | (6.4) | % | 28.0 | % | 31.1 | % |
Table of Contents
RELIANCE STEEL & ALUMINUM CO.
NOTES TO CONSOLIDATED FINANCIAL STATEMENTS (Continued)
December 31, 20152017
The reconciliation of income tax at the U.S. federal statutory tax rates to income tax expense is as follows:
| | | | | | |
| Year Ended December 31, | |
| 2015 | | 2014 | | 2013 | |
| | | | | | |
Income tax at U.S. federal statutory tax rate | 35.0 | % | 35.0 | % | 35.0 | % |
State income tax, net of federal tax effect | 2.0 | | 2.6 | | 2.9 | |
Foreign earnings taxed at lower rates | (0.8) | | (1.9) | | (1.3) | |
Net effect of life insurance policies | (3.6) | | (2.6) | | (3.2) | |
Net effect of changes in unrecognized tax benefits | 0.7 | | 0.2 | | (0.5) | |
Domestic production activity deduction | (2.0) | | (1.7) | | (1.1) | |
Other, net | (0.2) | | (0.5) | | 0.3 | |
Effective tax rate | 31.1 | % | 31.1 | % | 32.1 | % |
Significant components of our deferred tax assets and liabilities are as follows:
| | | | | | | | | | |
| December 31, | December 31, |
| 2015 | | 2014 | 2017 | | 2016 |
| (in millions) | (in millions) |
Deferred tax assets: | | | | | | | | | | |
Accrued expenses not currently deductible for tax | $ | 75.0 | | $ | 85.0 | $ | 34.8 | | $ | 77.6 |
Inventory costs capitalized for tax purposes | | 27.1 | | | 32.3 | | 23.1 | | | 29.2 |
Stock-based compensation | | 17.1 | | | 18.5 | | 10.5 | | | 12.0 |
Allowance for doubtful accounts | | 5.5 | | | 6.6 | | 3.4 | | | 5.3 |
Tax credits carryforwards | | 1.1 | | | 1.1 | | 1.3 | | | 1.3 |
Net operating loss carryforwards | | 5.4 | | | 2.4 | | 5.6 | | | 4.7 |
Total deferred tax assets | | 131.2 | | | 145.9 | | 78.7 | | | 130.1 |
Deferred tax liabilities: | | | | | | | | | | |
Property, plant and equipment, net | | (245.5) | | | (258.0) | | (159.7) | | | (238.6) |
Goodwill and other intangible assets | | (458.2) | | | (474.6) | | (307.3) | | | (451.2) |
LIFO inventories | | (34.0) | | | (36.3) | | (39.5) | | | (54.1) |
Deferred income | | (13.4) | | | (19.6) | | (0.8) | | | (7.1) |
Other | | (7.2) | | | (3.9) | | (12.2) | | | (6.0) |
Total deferred tax liabilities | | (758.3) | | | (792.4) | | (519.5) | | | (757.0) |
Net deferred tax liabilities | $ | (627.1) | | $ | (646.5) | $ | (440.8) | | $ | (626.9) |
As of December 31, 2015,2017, we had available state net operating loss carryforwards (“NOL”) of $7.4$6.3 million to offset future income taxes expiring in years 20162018 through 2035.2037. We believe that it is more likely than not that we will be able to realize these NOL’sNOLs within their respective carryforward periods.
The Company believes it is more likely than not that it will generate sufficient future taxable income to realize theits deferred tax assets.
Taxes on Foreign IncomeTax Cuts and Jobs Act of 2017
AsOn December 22, 2017, the Tax Cuts and Jobs Act of December 31, 2015, unremitted earnings2017 (“Tax Reform”) was enacted, which included significant changes to the taxation of subsidiaries outsideU.S. corporations. These changes include, among other things, a reduction of the United StatesU.S. federal statutory rate from 35% to 21% effective in 2018, the implementation of a territorial tax system, a one-time tax in 2017 on accumulated foreign profits that have not been previously subject to U.S. tax (deemed repatriation), the repeal of the corporate alternative minimum tax and changes to business deductions, including the repeal of the deduction for domestic production activities.
We recognized a provisional net tax benefit in 2017 relating to Tax Reform of $207.3 million. The components of our preliminary assessment of the impact of Tax Reform on our 2017 provision for income taxes were approximately $187.7 millionas follows:
| | |
| (in millions) |
Effect of tax rate changes on deferred tax assets and liabilities | $ | 216.7 |
Repatriation and related liabilities | | (9.4) |
Tax benefit, net | $ | 207.3 |
Our accounting of the repatriation and related liabilities included in our preliminary assessment of the impact of Tax Reform is incomplete; however we were able to record a provisional amount based on which no United States taxes had been provided. Our intention is to indefinitely reinvest these earnings outside the United States. It is not practicable to estimate the amount of additional taxes that might be payable upon repatriation of foreign earnings.
our estimates. Furthermore, Tax
Table of Contents
RELIANCE STEEL & ALUMINUM CO.
NOTES TO CONSOLIDATED FINANCIAL STATEMENTS (Continued)
December 31, 20152017
Reform created a minimum tax on global intangible low-taxed income (“GILTI”) that is earned by certain foreign affiliates owned by a U.S. shareholder. Due to the complexity of the new GILTI tax rules, we are not yet able to reasonably estimate its effects and therefore have not included any amount relating to GILTI in our preliminary assessment of the impact of Tax Reform. We are continuing to gather additional information to enable us to more precisely compute our repatriation and related liabilities and determine the impact, if any, of GILTI and will update our provisional amounts during 2018. Given the substantial changes to the Internal Revenue Code as a result of Tax Reform, our estimated financial impacts from Tax Reform are subject to further analysis, interpretation and clarification of the new tax law, which could result in changes to our estimates in 2018.
Unrecognized Tax Benefits
We are under audit by various state jurisdictions but do not anticipate any material adjustments from these examinations. Reconciliation of the beginning and ending balances of the total amounts of unrecognized tax benefits is as follows:
| | | | | | | | | |
| Year Ended December 31, | | | | | | | | |
| 2015 | | 2014 | | 2013 | Year Ended December 31, |
| (in millions) | 2017 | | 2016 | | 2015 |
| | | | | | | | | (in millions) |
Unrecognized tax benefits at January 1 | $ | 20.2 | | $ | 19.4 | | $ | 15.9 | $ | 5.2 | | $ | 22.9 | | $ | 20.2 |
Assumed in acquisition | | — | | | — | | | 5.0 | |
Increases in tax positions for prior years | | 0.3 | | | 0.3 | | | 1.1 | | — | | | 0.4 | | | 0.3 |
Decreases in tax positions for prior years | | (1.7) | | | (0.4) | | | (2.1) | | (0.1) | | | (0.6) | | | (1.7) |
Increases in tax positions for current year | | 4.2 | | | 3.8 | | | 3.6 | | — | | | 0.1 | | | 4.2 |
Settlements | | (0.1) | | | (0.1) | | | (3.5) | | (0.2) | | | (17.6) | | | (0.1) |
Lapses in statutes-of-limitation periods | | — | | | (2.8) | | | (0.6) | | (0.8) | | | — | | | — |
Unrecognized tax benefits at December 31 | $ | 22.9 | | $ | 20.2 | | $ | 19.4 | $ | 4.1 | | $ | 5.2 | | $ | 22.9 |
As of December 31, 2015, $22.92017, $4.1 million of unrecognized tax benefits would impact the effective tax rate if recognized. Accrued interest and penalties, net of applicable tax effect, related to uncertain tax positions were approximately $1.3$0.5 million and $1.2$0.7 million as of December 31, 20152017 and 2014,2016, respectively. The Company is currently under U.S. federal tax audits for various years. It is difficult to predict the timing of resolution for tax positions since such timing is not entirely within the control of the Company. Some audits may conclude within the next 12 months and it is reasonably possible that there could be a significant change in the total amount of unrecognized tax benefits in the next 12 months; however, the amount is not practical to estimate at this time.
Note 10. Stock‑Based Compensation Plans
We grant stock‑based compensation to our employees and directors. At December 31, 2015,2017, an aggregate of 2,251,5071,745,716 shares were authorized for future grant under our various stock‑based compensation plans, including stock options, restricted stock units, and restricted stock awards. Awards that expire or are canceled without delivery of shares generally become available for issuance under the plans. Upon exercises ofAs stock options vesting ofare exercised, restricted stock units and vesting of restricted shares under all of our stock plans,awards vest, we issue new shares of Reliance common stock.
Table of Contents
RELIANCE STEEL & ALUMINUM CO.
NOTES TO CONSOLIDATED FINANCIAL STATEMENTS (Continued)
December 31, 20152017
Stock Options
Stock option activity under all the plans is as follows:
| | | | | | | | | | | | | | | | |
| | | | | | Weighted Average | | | | | | | | Weighted Average | | |
| | | | | | Remaining | | Aggregate | | | | | | Remaining | | Aggregate |
| | Option | | Weighted Average | | Contractual Term | | Intrinsic Value | | Option | | Weighted Average | | Contractual Term | | Intrinsic Value |
Stock Options | | Shares | | Exercise Price | | (In years) | | (In millions) | | Shares | | Exercise Price | | (in years) | | (in millions) |
| | | | | | | | | |
Outstanding at January 1, 2013 | | 3,405,500 | | $ | 49.12 | | | | | |
Exercised | | (1,437,053) | | 48.78 | | | | | |
Expired or forfeited | | (31,206) | | | 51.37 | | | | | |
Outstanding at December 31, 2013 | | 1,937,241 | | 49.35 | | | | | |
Exercised | | (593,204) | | 48.58 | | | | | |
Expired or forfeited | | (16,625) | | | 52.13 | | | | | |
Outstanding at December 31, 2014 | | 1,327,412 | | 49.66 | | | | | |
Outstanding at January 1, 2015 | | | 1,327,412 | | $ | 49.66 | | | | |
Exercised | | (390,606) | | 48.19 | | | | | | (390,606) | | 48.19 | | | | |
Expired or forfeited | | (2,481) | | | 51.96 | | | | | | (2,481) | | | 51.96 | | | | |
Outstanding at December 31, 2015 | | 934,325 | | $ | 50.26 | | 1.8 | | $ | 7.4 | | 934,325 | | 50.26 | | | | |
Exercisable at December 31, 2015 | | 934,325 | | $ | 50.26 | | 1.8 | | $ | 7.4 | |
Exercised | | | (753,645) | | | 49.70 | | | | |
Outstanding at December 31, 2016 | | | 180,680 | | 52.61 | | | | |
Exercised | | | (98,405) | | 52.41 | | | | |
Expired or forfeited | | | (7,000) | | | 58.68 | | | | |
Outstanding at December 31, 2017 | | | 75,275 | | $ | 52.30 | | 0.9 | | $ | 2.5 |
Exercisable at December 31, 2017 | | | 75,275 | | $ | 52.30 | | 0.9 | | $ | 2.5 |
All stock options outstanding at December 31, 20152017 had four-year vesting periods and seven-year terms, with the exception of 102,00040,000 options granted to our non‑employee directors that had one-year vesting periods and ten-year terms.
A summary of the status of ourThere were no unvested stock options as ofat December 31, 20152017 and changes during the year then ended is as follows:2016.
| | | | |
| | | Weighted |
| | | Average Grant |
Unvested Options | Shares | | Date Fair Value |
| | | | |
Unvested at January 1, 2015 | 222,413 | | $ | 26.98 |
Forfeited | (625) | | | 26.98 |
Vested | (221,788) | | | 26.98 |
Unvested at December 31, 2015 | — | | $ | — |
Proceeds from stock options exercised under all stock option plans in 2017, 2016 and 2015 2014 and 2013 were $15.1$5.2 million, $28.8$37.5 million and $70.1$15.1 million, respectively. The total intrinsic values of all options exercised during the years ended December 31,in 2017, 2016 and 2015 2014 and 2013 were $4.8$2.8 million, $13.5$16.3 million and $29.0$4.8 million, respectively.
The tax benefit realized from option exercises during the years endedin 2017, 2016 and 2015 were $8.4 million, $14.3 million and $7.6 million, respectively.
The following tabulation summarizes certain information concerning outstanding and exercisable options as of December 31, 2017:
| | | | | | | |
| | | | Options Outstanding and Exercisable |
| | | | Weighted Average | | | |
| | | | Remaining | | Weighted |
Range of | | Outstanding at | | Contractual Life | | Average |
Exercise Price | | December 31, 2017 | | in Years | | Exercise Price |
$38 | | 12,000 | | 1.4 | | $ | 38.00 |
$44 - $45 | | 16,000 | | 2.4 | | | 44.99 |
$55 - $56 | | 35,275 | | 0.1 | | | 55.73 |
$66 - $67 | | 12,000 | | 0.4 | | | 66.28 |
$38 - $67 | | 75,275 | | 0.9 | | $ | 52.30 |
Restricted Stock
In 2017, 2016 and 2015, 2014we granted 446,525, 512,895 and 2013 were $7.6 million, $10.7 million507,760, respectively, restricted stock units (“RSUs”) to key employees pursuant to the Amended and $11.5 million, respectively.
Restated Stock Option and Restricted Stock Plan. Each RSU consists of the
Table of Contents
RELIANCE STEEL & ALUMINUM CO.
NOTES TO CONSOLIDATED FINANCIAL STATEMENTS (Continued)
December 31, 20152017
The following tabulation summarizes certain information concerning outstanding and exercisable options as of December 31, 2015:
| | | | | | | | | | | | |
| | | | Options Outstanding | | Options Exercisable |
| | | | Weighted Average | | | | | | | Weighted Average |
| | | | Remaining | | Weighted | | | | Exercise |
Range of | | Outstanding at | | Contractual Life | | Average | | Exercisable at | | Price of Options |
Exercise Price | | December 31, 2015 | | in Years | | Exercise Price | | December 31, 2015 | | Exercisable |
| | | | | | | | | | | | |
$33 - $38 | | 71,000 | | 1.1 | | $ | 34.79 | | 71,000 | | $ | 34.79 |
$42 - $45 | | 312,425 | | 1.4 | | | 43.01 | | 312,425 | | | 43.01 |
$55 - $56 | | 508,900 | | 2.1 | | | 55.73 | | 508,900 | | | 55.73 |
$61 - $67 | | 42,000 | | 2.0 | | | 64.16 | | 42,000 | | | 64.16 |
$33 - $67 | | 934,325 | | 1.8 | | $ | 50.26 | | 934,325 | | $ | 50.26 |
Restricted Stock
In 2015, 2014 and 2013, we granted 507,760, 349,380 and 327,780, respectively, restricted stock units (“RSUs”) to key employees pursuant to the Amended and Restated Stock Option and Restricted Stock Plan. Each RSU consists of the right to receive one share of our common stock and dividend equivalent rights, subject to forfeiture, equal to the accrued cash or stock dividends where the record date for such dividends is after the grant date but before the shares vest. Additionally, each 2015, 20142017, 2016 and 20132015 RSU granted has a time-basedservice-based condition and cliff vests at December 31, 2017,1, 2019, December 31, 20162018 and December 31, 2015,2017, respectively, if the recipient is an employee on those dates. In addition to the time-basedservice-based condition, 185,450, 136,162,169,009, 190,175, and 136,225185,450 of the RSUs granted in 2015, 20142017, 2016 and 2013,2015, respectively, also have performance goals and vest only upon the satisfaction of the time-basedservice-based condition and certain three-year performance targets. In addition to the 2015 RSUs described above, we also granted 10,000 time-basedservice-based and 40,000 performance-based RSUs to our former CEO as a result of his expectedplanned retirement in July 2016 that havehad a time-basedservice-based condition and eighteen-month performance targets endingended June 30, 2016. The fair value of the 2015, 20142017, 2016 and 20132015 RSUs granted was $59.27$79.60 per share, $71.15$69.16 per share and $65.75$59.27 per share, respectively, determined based on the closing price of our common stock on the grant date.
In 2011 and 2010, we granted 86,000 and 61,000 shares, respectively, of restricted stock to certain officers of the Company. The awards include dividend rights and vest over five years. The fair value of the 2011 and 2010 restricted stock grants was $37.29 per share and $41.24 per share, respectively, determined based on the closing price of our common stock on the grant date. As of December 31, 2015, 17,200 of these shares remain unvested and outstanding.
In 2017, 2016 and 2015, 201418,120, 11,851, and 2013, 12,719 11,830, and 12,418 shares of restricted stock, respectively, were granted to the non‑employee members of the Board of Directors pursuant to the Directors Equity Plan. The fair value of the restricted stock granted in 2017, 2016, and 2015, 2014,was $71.73 per share, $70.88 per share, and 2013, was $66.03 per share, $70.99 per share, and $67.63 per share, respectively, determined based on the closing price of our common stock on the grant date. The awards include dividend rights and vest immediately upon grant. The recipients are restricted from trading the restricted stock for one year from date of grant.
Table of Contents
RELIANCE STEEL & ALUMINUM CO.
NOTES TO CONSOLIDATED FINANCIAL STATEMENTS (Continued)In 2017, 2016 and 2015, we made payments of $9.3 million, $6.4 million and $4.5 million, respectively, to tax authorities on our employees’ behalf for shares withheld related to net share settlements. These payments are reflected in the Stock-based compensation caption of the statement of equity.
December 31, 2015
A summary of the status of our unvested restricted stock grantsservice-based and service and performance basedperformance-based RSUs as of December 31, 20152017 and changes during the year then ended is as follows:
| | | | | | |
| | | | | | | | | | |
| | | Weighted | | | | | Weighted |
| | | Average Grant | | | | | Average Grant |
Unvested Shares | Shares | | Date Fair Value | | | Shares | | Date Fair Value |
| | | | | | |
Unvested at January 1, 2015 | 846,760 | | $ | 65.10 | | |
Unvested at January 1, 2017 | | | 985,540 | | $ | 64.34 |
Granted | 570,479 | | | 59.42 | | | 446,525 | | | 79.60 |
Forfeited | (106,205) | | | 60.03 | | |
Vested | (410,624) | | | 62.56 | | | (467,968) | | | 59.33 |
Unvested at December 31, 2015 | 900,410 | | $ | 63.26 | | |
Canceled or forfeited | | | (39,522) | | | 67.99 |
Unvested at December 31, 2017 | | | 924,575 | | $ | 74.09 |
Unrecognized Compensation Cost
As of December 31, 2015,2017, there was approximately $27.3$39.5 million of total unrecognized compensation cost related to unvested stock‑based compensation awards granted under all stock‑based compensation plans. That cost is expected to be recognized over a weighted average period of 1.361.33 years.
Note 11. Employee Benefits
Employee Stock Ownership Plan
We have ana tax-qualified employee stock ownership plan (the “ESOP”) and trust that has been approved by the Internal Revenue Service as a qualified plan. The ESOP is a noncontributory plan that covers certain salaried and hourly employees of the Company. The amount of the annual contribution is at the discretion of the Board, except that the minimum amount must be sufficient to enable the ESOP trust to meet its current obligations. The Company will cease making annual contributions to the ESOP after the 2018 plan year.
Table of Contents
RELIANCE STEEL & ALUMINUM CO.
NOTES TO CONSOLIDATED FINANCIAL STATEMENTS (Continued)
December 31, 2017
Defined Contribution Plans
Effective in 1998, the Reliance Steel & Aluminum Co. Master 401(k) Plan (the “Master Plan”) was established, which combined several of the various 401(k) and profit‑sharing plans of the Company and its subsidiaries into one plan. Salaried and certain hourly employees of the Company and its participating subsidiaries are covered under the Master Plan. The Master Plan allows each subsidiary’s Board to determine independently the annual matching percentage and maximum compensation limits or annual profit‑sharing contribution. Eligibility occurs after three months of service, and the Company contribution vests at 25% per year, commencing one year after the employee enters the Master Plan.year. Other 401(k) and profit‑sharing plans exist as certain subsidiaries have not combined their plans into the Master Plan as of December 31, 2015.2017.
Supplemental Executive Retirement Plans
Effective January 1996, we adopted a Supplemental Executive Retirement Plan (“SERP”), which is a nonqualified pension plan that provides postretirement pension benefits to certain key officers of the Company. The SERP is administered by the Compensation Committee of the Board. Benefits are based upon the employees’ earnings. Life insurance policies were purchased for most individuals covered by the SERP. Separate SERP’sSupplemental Executive Retirement Plans (“SERPs”) exist for certain wholly owned subsidiaries of the Company, each of which provides postretirement pension benefits to certain current and former key employees. All of the plansSERPs have been frozen to include only existingnew participants.
Table of Contents
RELIANCE STEEL & ALUMINUM CO.
NOTES TO CONSOLIDATED FINANCIAL STATEMENTS (Continued)
December 31, 2015
Deferred Compensation Plan
In December 2008, a deferred compensation planthe Reliance Deferred Compensation Plan was put in placeestablished for certain officers and key employees of the Company. Account balances from various compensation plans of subsidiaries were transferred and consolidated into this new deferred compensation plan. The balance in the Reliance Deferred Compensation Plan as of December 31, 20152017 and 20142016 was approximately $16.0$21.2 million and $13.5$16.6 million, respectively. The balance of the assets set aside for funding future payouts under the deferred compensation plan amounted to $15.3$20.2 million as of December 31, 2015.2017.
Multiemployer Plans
Certain of our union employees participate in plans collectively bargained and maintained by multiple employers and a labor union. We do not recognize on our balance sheet any amounts relating to these plans. For the years ended December 31, 2017, 2016, and 2015 our contributions to these plans were $5.4 million, $5.3 million and $5.2 million, respectively. Some of the plans we participate in are in endangered, critical, or declining status and have adopted rehabilitation plans. If we were to withdraw our participation from these plans, we would be required to recognize a liability on our balance sheet and the amount could be significant.
Defined Benefit Plans
We, through certain subsidiaries, maintain qualified defined benefit pension plans for certain of our union employees. These plans generally provide benefits of stated amounts for each year of service or provide benefits based on the participant's hourly wage rate and years of service. The plans permit the sponsor, at any time, to amend or terminate the plans subject to union approval, if applicable. Certain of these plans are frozen as of December 31, 2015.2017.
We use a December 31 measurement date for our plans. The following is a summary of the status of the funding of the various SERP’s and Defined Benefit Plans:
| | | | | | | | | | | |
| SERP’s | | Defined Benefit Plans |
| 2015 | | 2014 | | 2015 | | 2014 |
| (in millions) | | (in millions) |
Change in benefit obligation | | | | | | | | | | | |
Benefit obligation at beginning of year | $ | 45.9 | | $ | 38.7 | | $ | 100.5 | | $ | 82.0 |
Service cost | | 1.0 | | | 0.9 | | | 1.7 | | | 1.3 |
Interest cost | | 1.3 | | | 1.5 | | | 3.7 | | | 3.8 |
Actuarial loss (gain) | | 2.5 | | | 6.1 | | | (7.4) | | | 17.5 |
Benefits paid | | (1.3) | | | (1.3) | | | (3.4) | | | (4.5) |
Plan amendments | | — | | | — | | | 1.2 | | | 0.4 |
Benefit obligation at end of year | $ | 49.4 | | $ | 45.9 | | $ | 96.3 | | $ | 100.5 |
| | | | | | | | | | | |
Change in plan assets | | | | | | | | | | | |
Fair value of plan assets at beginning of year | | N/A | | | N/A | | | 72.4 | | | 70.2 |
Actual return on plan assets | | N/A | | | N/A | | | (0.6) | | | 3.3 |
Employer contributions | | N/A | | | N/A | | | 1.8 | | | 3.3 |
Benefits paid | | N/A | | | N/A | | | (3.4) | | | (4.4) |
Fair value of plan assets at end of year | | N/A | | | N/A | | $ | 70.2 | | $ | 72.4 |
| | | | | | | | | | | |
Funded status | | | | | | | | | | | |
Funded status of the plans | $ | (49.4) | | $ | (45.9) | | $ | (26.1) | | $ | (28.1) |
| | | | | | | | | | | |
Items not yet recognized as component of net | | | | | | | | | | | |
periodic pension expense | | | | | | | | | | | |
Unrecognized net actuarial losses | $ | 15.3 | | $ | 14.3 | | $ | 25.8 | | $ | 29.5 |
Unamortized prior service (credit) cost | | — | | | (0.3) | | | 2.7 | | | 1.7 |
| $ | 15.3 | | $ | 14.0 | | $ | 28.5 | | $ | 31.2 |
Table of Contents
RELIANCE STEEL & ALUMINUM CO.
NOTES TO CONSOLIDATED FINANCIAL STATEMENTS (Continued)
December 31, 20152017
As of
We use a December 31 2015 and 2014,measurement date for our plans. The following is a summary of the following amounts were recognized instatus of the balance sheet:
| | | | | | | | | | | |
| SERP’s | | Defined Benefit Plans |
| 2015 | | 2014 | | 2015 | | 2014 |
| (in millions) | | (in millions) |
Amounts recognized in the statement of financial position | | | | | | | | | | | |
Current liabilities | $ | (4.4) | | $ | (4.0) | | $ | — | | $ | — |
Noncurrent liabilities | | (45.0) | | | (41.9) | | | (26.1) | | | (28.1) |
Accumulated other comprehensive loss | | 15.3 | | | 14.0 | | | 28.5 | | | 31.2 |
Net amount recognized | $ | (34.1) | | $ | (31.9) | | $ | 2.4 | | $ | 3.1 |
The accumulated benefit obligation for all SERP’s was $44.7 million and $44.6 million asfunding of December 31, 2015 and 2014, respectively. The accumulated benefit obligation for all defined benefit pension plans was $96.3 million and $100.5 million as of December 31, 2015 and 2014, respectively.
| | | | | |
| Year Ended December 31, |
| 2015 | | 2014 |
| (in millions) |
Information for defined benefit plans with an accumulated benefit obligation and projected benefit obligation in excess of plan assets | | | | | |
Accumulated benefit obligation | $ | 96.3 | | $ | 100.5 |
Projected benefit obligation | | 96.3 | | | 100.5 |
Fair value of plan assets | | 70.2 | | | 72.4 |
Following are the details of net periodic benefit cost related to the SERP’svarious SERPs and Defined Benefit Plans:
| | | | | | | | | | | | | | | | | |
| SERP’s | | Defined Benefit Plans |
| Year Ended December 31, | | Year Ended December 31, |
| 2015 | | 2014 | | 2013 | | 2015 | | 2014 | | 2013 |
| (in millions) | | (in millions) |
Service cost | $ | 1.0 | | $ | 0.9 | | $ | 0.9 | | $ | 1.7 | | $ | 1.3 | | $ | 1.4 |
Interest cost | | 1.3 | | | 1.5 | | | 1.5 | | | 3.7 | | | 3.8 | | | 3.4 |
Expected return on plan assets | | — | | | — | | | — | | | (5.0) | | | (5.1) | | | (4.4) |
Prior service (credit) cost | | (0.3) | | | (0.5) | | | (0.5) | | | 0.2 | | | 0.2 | | | 0.2 |
Amortization of net loss | | 1.5 | | | 0.7 | | | 1.3 | | | 1.8 | | | 0.4 | | | 1.8 |
| $ | 3.5 | | $ | 2.6 | | $ | 3.2 | | $ | 2.4 | | $ | 0.6 | | $ | 2.4 |
| | | | | | | | | | | |
| SERPs | | Defined Benefit Plans |
| 2017 | | 2016 | | 2017 | | 2016 |
| (in millions) | | (in millions) |
Change in benefit obligation | | | | | | | | | | | |
Benefit obligation at beginning of year | $ | 48.5 | | $ | 49.4 | | $ | 95.9 | | $ | 96.3 |
Service cost | | 0.8 | | | 1.1 | | | 1.5 | | | 1.6 |
Interest cost | | 1.1 | | | 1.6 | | | 3.7 | | | 3.9 |
Actuarial loss | | 1.0 | | | 1.1 | | | 6.2 | | | 0.6 |
Benefits paid | | (1.2) | | | (1.3) | | | (3.8) | | | (6.1) |
Plan amendments | | — | | | — | | | 0.2 | | | — |
Plan settlements | | (13.6) | | | (3.4) | | | (0.2) | | | (0.4) |
Benefit obligation at end of year | $ | 36.6 | | $ | 48.5 | | $ | 103.5 | | $ | 95.9 |
| | | | | | | | | | | |
Change in plan assets | | | | | | | | | | | |
Fair value of plan assets at beginning of year | | N/A | | | N/A | | $ | 73.3 | | $ | 70.2 |
Actual return on plan assets | | N/A | | | N/A | | | 9.9 | | | 3.9 |
Employer contributions | | N/A | | | N/A | | | 9.8 | | | 5.5 |
Benefits paid | | N/A | | | N/A | | | (4.0) | | | (6.3) |
Fair value of plan assets at end of year | | N/A | | | N/A | | $ | 89.0 | | $ | 73.3 |
| | | | | | | | | | | |
Funded status | | | | | | | | | | | |
Funded status of the plans | $ | (36.6) | | $ | (48.5) | | $ | (14.5) | | $ | (22.6) |
| | | | | | | | | | | |
Items not yet recognized as component of net | | | | | | | | | | | |
periodic pension expense | | | | | | | | | | | |
Unrecognized net actuarial losses | $ | 10.3 | | $ | 14.1 | | $ | 24.5 | | $ | 25.4 |
Unamortized prior service cost | | — | | | — | | | 2.1 | | | 2.3 |
| $ | 10.3 | | $ | 14.1 | | $ | 26.6 | | $ | 27.7 |
Assumptions used to determine net periodic benefit cost are detailed below:As of December 31, 2017 and 2016, the following amounts were recognized on the balance sheet:
| | | | | | | | | | | | |
| SERP’s | | Defined Benefit Plans | |
| Year Ended December 31, | | Year Ended December 31, | |
| 2015 | | 2014 | | 2013 | | 2015 | | 2014 | | 2013 | |
Weighted average assumptions to determine net cost | | | | | | | | | | | | |
Discount rate | 3.02 | % | 4.07 | % | 3.73 | % | 3.87 | % | 4.70 | % | 4.00 | % |
Expected long-term rate of return on plan assets | N/A | | N/A | | N/A | | 6.59 | % | 7.22 | % | 7.30 | % |
Rate of compensation increase | 6.00 | % | 6.00 | % | 6.00 | % | N/A | | N/A | | N/A | |
| | | | | | | | | | | |
| SERPs | | Defined Benefit Plans |
| 2017 | | 2016 | | 2017 | | 2016 |
| (in millions) | | (in millions) |
Amounts recognized in the statement of financial position | | | | | | | | | | | |
Current liabilities | $ | (1.2) | | $ | (14.8) | | $ | — | | $ | — |
Noncurrent liabilities | | (35.4) | | | (33.7) | | | (14.5) | | | (22.6) |
Accumulated other comprehensive loss | | 10.3 | | | 14.1 | | | 26.6 | | | 27.7 |
Net amount recognized | $ | (26.3) | | $ | (34.4) | | $ | 12.1 | | $ | 5.1 |
Table of Contents
RELIANCE STEEL & ALUMINUM CO.
NOTES TO CONSOLIDATED FINANCIAL STATEMENTS (Continued)
December 31, 20152017
The accumulated benefit obligation for all SERPs was $32.6 million and $44.2 million as of December 31, 2017 and 2016, respectively. The accumulated benefit obligation for all defined benefit pension plans was $103.5 million and $95.9 million as of December 31, 2017 and 2016, respectively.
| | | | | |
| Year Ended December 31, |
| 2017 | | 2016 |
| (in millions) |
Information for defined benefit plans with an accumulated benefit obligation and projected benefit obligation in excess of plan assets | | | | | |
Accumulated benefit obligation | $ | 75.5 | | $ | 95.9 |
Projected benefit obligation | | 75.5 | | | 95.9 |
Fair value of plan assets | | 60.3 | | | 73.3 |
Following are the details of net periodic benefit cost related to the SERPs and Defined Benefit Plans:
| | | | | | | | | | | | | | | | | |
| SERPs | | Defined Benefit Plans |
| Year Ended December 31, | | Year Ended December 31, |
| 2017 | | 2016 | | 2015 | | 2017 | | 2016 | | 2015 |
| (in millions) | | (in millions) |
Service cost | $ | 0.8 | | $ | 1.1 | | $ | 1.0 | | $ | 1.5 | | $ | 1.6 | | $ | 1.7 |
Interest cost | | 1.1 | | | 1.6 | | | 1.3 | | | 3.7 | | | 3.9 | | | 3.7 |
Expected return on plan assets | | — | | | — | | | — | | | (4.4) | | | (4.6) | | | (5.0) |
Settlement loss | | 3.7 | | | 1.0 | | | — | | | 0.1 | | | 0.1 | | | — |
Prior service (credit) cost | | — | | | — | | | (0.3) | | | 0.3 | | | 0.3 | | | 0.2 |
Amortization of net loss | | 0.9 | | | 1.4 | | | 1.5 | | | 1.5 | | | 1.5 | | | 1.8 |
| $ | 6.5 | | $ | 5.1 | | $ | 3.5 | | $ | 2.7 | | $ | 2.8 | | $ | 2.4 |
Net periodic benefit cost related to the SERPs and Defined Benefit Plans is presented in our statements of income as summarized below:
| | | | | | | | | | | | | | | | | |
| SERPs | | Defined Benefit Plans |
| Year Ended December 31, | | Year Ended December 31, |
| 2017 | | 2016 | | 2015 | | 2017 | | 2016 | | 2015 |
| (in millions) | | (in millions) |
Amounts recognized in the statement of income | | | | | | | | | | | | | | | | | |
Warehouse, delivery, selling, general and administrative expense | $ | 0.8 | | $ | 1.1 | | $ | 1.0 | | $ | 1.5 | | $ | 1.6 | | $ | 1.7 |
Other expense, net | | 5.7 | | | 4.0 | | | 2.5 | | | 1.2 | | | 1.2 | | | 0.7 |
| $ | 6.5 | | $ | 5.1 | | $ | 3.5 | | $ | 2.7 | | $ | 2.8 | | $ | 2.4 |
Table of Contents
RELIANCE STEEL & ALUMINUM CO.
NOTES TO CONSOLIDATED FINANCIAL STATEMENTS (Continued)
December 31, 2017
Assumptions used to determine net periodic benefit cost are detailed below:
| | | | | | | | | | | | |
| SERPs | | Defined Benefit Plans | |
| Year Ended December 31, | | Year Ended December 31, | |
| 2017 | | 2016 | | 2015 | | 2017 | | 2016 | | 2015 | |
Weighted average assumptions to determine net cost | | | | | | | | | | | | |
Discount rate | 3.36 | % | 3.45 | % | 3.02 | % | 3.93 | % | 4.13 | % | 3.87 | % |
Expected long-term rate of return on plan assets | N/A | | N/A | | N/A | | 6.17 | % | 6.57 | % | 6.59 | % |
Rate of compensation increase | 6.00 | % | 6.00 | % | 6.00 | % | N/A | | N/A | | N/A | |
Assumptions used to determine the benefit obligation are detailed below:
| | | | | | | | | | | | | | | | |
| SERP’s | | Defined Benefit Plans | | SERPs | | Defined Benefit Plans | |
| December 31, | | December 31, | | December 31, | | December 31, | |
| 2015 | | 2014 | | 2015 | | 2014 | | 2017 | | 2016 | | 2017 | | 2016 | |
Weighted average assumptions to determine benefit obligations | | | | | | | | | | | | | | | | |
Discount rate | 3.42 | % | 2.94 | % | 4.13 | % | 3.78 | % | 3.04 | % | 3.34 | % | 3.47 | % | 3.93 | % |
Expected long-term rate of return on plan assets | N/A | | N/A | | 6.59 | % | 7.22 | % | N/A | | N/A | | 6.17 | % | 6.57 | % |
Rate of compensation increase | 6.00 | % | 6.00 | % | N/A | | N/A | | 6.00 | % | 6.00 | % | N/A | | N/A | |
Employer contributions to the SERP’sSERPs and Defined Benefit Plans during 20162018 are expected to be $4.4$1.2 million and $2.1$1.6 million, respectively.
Plan Assets and Investment Policy
The weighted‑average asset allocations of our Defined Benefit Plans by asset category are as follows:
| | | | | | | | |
| December 31, | | December 31, | |
| 2015 | | 2014 | | 2017 | | 2016 | |
Plan Assets | | | | | | | | |
Equity securities | 56 | % | 58 | % | 55 | % | 58 | % |
Debt securities | 38 | % | 37 | % | 38 | % | 38 | % |
Other | 6 | % | 5 | % | 7 | % | 4 | % |
Total | 100 | % | 100 | % | 100 | % | 100 | % |
Plan assets are invested in various asset classes that are expected to produce a sufficient level of diversification and investment return over the long term. The investment goal is a return on assets that is at least equal to the assumed actuarial rate of return over the long termlong-term within reasonable and prudent levels of risk. Investment policies reflect the unique circumstances of the respective plans and include requirements designed to mitigate risk including quality and diversification standards. Asset allocation targets are reviewed periodically with investment advisors to determine the appropriate investment strategies for acceptable risk levels. Our target allocation ranges are as follows: equity securities 50%35% to 80%65%, debt securities 20%15% to 60%45% and other assets of 0% to 10%15%. We establish our estimated long‑term return on plan assets considering various factors including the targeted asset allocation percentages, historic returns and expected future returns.
Table of Contents
RELIANCE STEEL & ALUMINUM CO.
NOTES TO CONSOLIDATED FINANCIAL STATEMENTS (Continued)
December 31, 20152017
The fair value measurements of our Defined Benefit Plan assets fall within the following levels of the fair value hierarchy as of December 31, 20152017 and 2014:2016:
| | | | | | | | | | | | | | | | | | | |
| Level 1 | | Level 2 | | Level 3 | | Total | Level 1 | | Level 2 | | Level 3 | | Total |
| (in millions) | (in millions) |
December 31, 2015: | | | | | | | | | |
December 31, 2017: | | | | | | | | | | | | |
Common stock (1) | $ | 24.8 | | $ | — | | $ | — | | $ | 24.8 | $ | 26.7 | | $ | — | | $ | — | | $ | 26.7 |
U.S. government, state, and agency | | — | | 7.9 | | — | | 7.9 | | — | | | 4.7 | | | — | | | 4.7 |
Corporate debt securities (2) | | — | | 9.7 | | — | | 9.7 | | — | | | 17.4 | | | — | | | 17.4 |
Mutual funds (3) | | 21.1 | | 2.3 | | — | | 23.4 | | 30.8 | | | 3.5 | | | — | | | 34.3 |
Interest and non-interest bearing cash | | 4.4 | | | — | | | — | | | 4.4 | | 5.9 | | | — | | | — | | | 5.9 |
| $ | 50.3 | | $ | 19.9 | | $ | — | | $ | 70.2 | $ | 63.4 | | $ | 25.6 | | $ | — | | $ | 89.0 |
| | | | | | | | | | | | | | | | | | | |
December 31, 2014: | | | | | | | | | |
December 31, 2016: | | | | | | | | | | | | |
Common stock (1) | $ | 26.6 | | $ | — | | $ | — | | $ | 26.6 | $ | 23.5 | | $ | — | | $ | — | | $ | 23.5 |
U.S. government, state, and agency | | — | | 7.1 | | — | | 7.1 | | — | | | 7.3 | | | — | | | 7.3 |
Corporate debt securities (2) | | — | | 10.0 | | — | | 10.0 | | — | | | 10.3 | | | — | | | 10.3 |
Mutual funds (3) | | 22.6 | | 2.7 | | — | | 25.3 | | 26.3 | | | 3.0 | | | — | | | 29.3 |
Interest and non-interest bearing cash | | 3.4 | | | — | | | — | | | 3.4 | | 2.9 | | | — | | | — | | | 2.9 |
| $ | 52.6 | | $ | 19.8 | | $ | — | | $ | 72.4 | $ | 52.7 | | $ | 20.6 | | $ | — | | $ | 73.3 |
| (1) | | Comprised primarily of securities of large domestic and foreign companies. Valued at the closing price reported on the active market on which the individual securities are traded. |
| (2) | | Valued using a combination of inputs including: benchmark yields, reported trades, broker/dealer quotes, issuer spreads, two‑sided markets, benchmark securities, bids, offers, and reference data. |
| (3) | | Level 1 assets are comprised of exchange traded funds, money market funds, and stock and bond funds. These assets are valued at closing price for exchange traded funds and Net Asset Value (NAV) for open‑end and closed‑end mutual funds. Level 2 assets are comprised of fixed income funds and pooled separate accounts and are valued at the net asset value per unit based on either the observable net asset value of the underlying investment or the net asset value of the underlying pool of securities. |
Summary Disclosures for All Defined Benefit Plans
The following is a summary of benefit payments under our various defined benefit plans, which reflect expected future employee service, as appropriate, expected to be paid in the periods indicated:
| | | | | | | | | |
| | | | Defined | | | | Defined |
| SERP’s | | Benefit Plans | SERPs | | Benefit Plans |
| | (in millions) | | (in millions) |
2016 | $ | 4.4 | | $ | 3.8 | |
2017 | | 14.0 | | | 4.0 | |
2018 | | 1.2 | | | 4.2 | $ | 1.2 | | $ | 4.2 |
2019 | | 1.2 | | | 4.5 | | 1.1 | | | 4.4 |
2020 | | 12.5 | | | 4.7 | | 13.5 | | | 4.5 |
2021 – 2025 | | 12.2 | | | 26.7 | |
2021 | | | 1.1 | | | 4.7 |
2022 | | | 8.3 | | | 4.9 |
2023 – 2027 | | | 4.6 | | | 27.4 |
Table of Contents
RELIANCE STEEL & ALUMINUM CO.
NOTES TO CONSOLIDATED FINANCIAL STATEMENTS (Continued)
December 31, 20152017
The amounts in accumulated other comprehensive loss that are expected to be recognized as components of net periodic benefit cost during 20162018 are as follows:
| | | | | | | | | |
| | | | Defined | | | | Defined |
| SERP’s | | Benefit Plans | SERPs | | Benefit Plans |
| (in millions) | (in millions) |
Actuarial loss | $ | 1.4 | | $ | 1.5 | $ | 1.0 | | $ | 1.4 |
Prior service cost | | — | | | 0.3 | | — | | | 0.3 |
Total | $ | 1.4 | | $ | 1.8 | $ | 1.0 | | $ | 1.7 |
Supplemental Bonus Plan
In connection with the acquisition of Earle M. Jorgensen Company (“EMJ”)EMJ in April 2006, Reliance assumed the obligation resulting from EMJ’s settlement with the U.S. Department of Labor to contribute 258,006 shares of Reliance common stock to EMJ’s Supplemental Bonus Plan, a phantom stock bonus plan supplementing the EMJ Retirement Savings Plan. In 2005, EMJ had reached a settlement with the U.S. Department of Labor regarding a change in its methodology for annual valuations of its stock while it was a private company, for the purpose of making contributions in stock to its retirement plan. As of December 31, 2015,2017, the remaining obligation to the EMJ Supplemental Bonus Plan consisted of the cash equivalent of 90,72575,379 shares of Reliance common stock totaling approximately $5.3$6.5 million. The adjustments to reflect this obligation at fair value based on the closing price of our common stock at the end of each reporting period are included in Warehouse, delivery, selling, general and administrative expense. The expense (income) expense from mark to market adjustments to this obligation in each of the years ended December 31, 2015, 20142017, 2016 and 20132015 amounted to approximately $(0.2)$0.6 million, $(1.3)$2.1 million and $1.5($0.2) million, respectively. This obligation will be satisfied by future cash payments to participants upon their termination of employment.
Contributions to Reliance Sponsored Retirement Plans
Our expense for Reliance‑sponsored retirement plans was as follows:
| | | | | | | | | | | | | | |
| Year Ended December 31, | Year Ended December 31, |
| 2015 | | 2014 | | 2013 | 2017 | | 2016 | | 2015 |
| (in millions) | (in millions) |
Master Plan | $ | 21.4 | | $ | 21.5 | | $ | 18.4 | $ | 25.0 | | $ | 22.3 | | $ | 21.4 |
Other Defined Contribution Plans | | 7.9 | | 7.0 | | 7.8 | | 9.0 | | | 8.5 | | | 7.9 |
Employee Stock Ownership Plan | | 1.5 | | 1.8 | | 1.4 | | 1.8 | | | 1.8 | | | 1.5 |
Deferred Compensation Plan | | 0.6 | | 0.6 | | 0.6 | | 0.9 | | | 0.7 | | | 0.6 |
Supplemental Executive Retirement Plans | | 3.5 | | 2.6 | | 3.2 | | 6.5 | | | 5.1 | | | 3.5 |
Defined Benefit Plans | | 2.4 | | | 0.6 | | | 2.4 | | 2.7 | | | 2.8 | | | 2.4 |
| $ | 37.3 | | $ | 34.1 | | $ | 33.8 | $ | 45.9 | | $ | 41.2 | | $ | 37.3 |
Note 12. Equity
Reincorporation
During the second quarter of 2015, the Company’s shareholders approved the reincorporation of the Company from California to Delaware by means of a merger with and into a wholly owned Delaware subsidiary. The reincorporation did not result in any change in the Company’s business, physical location, management, assets, liabilities, net worth or number of authorized shares. In the reincorporation, the Company’s Restated Certificate of Incorporation established par value of the Company’s common stock and unissued preferred stock of $0.001 per share.
Table of Contents
RELIANCE STEEL & ALUMINUM CO.
NOTES TO CONSOLIDATED FINANCIAL STATEMENTS (Continued)
December 31, 20152017
Common Stock
We have paid regular quarterly cash dividends on our common stock in 2015.for 58 consecutive years. Our Board of Directors increased the quarterly dividend to $0.30$0.425 per share from $0.25 per share of common stock in February 2013, increased it to $0.33$0.40 per share in July 2013,2016, increased it to $0.35$0.45 per share in February 2014,2017 and increased it again in February 20152018 to $0.40$0.50 per share. The holders of Reliance common stock are entitled to one vote per share on each matter submitted to a vote of stockholders.
Share Repurchase Plan
On October 21, 2014, our Board of Directors extended our share repurchase plan to December 31, 2017. On October 20, 2015, our Board of Directors again amended our share repurchase plan increasing by 7,500,000 sharesincreased the total number of shares authorized to be repurchased under our share repurchase plan by 7.5 million shares and extendingextended the programduration of the plan through December 31, 2018. We repurchase shares through open market purchases under plans complying with Rule 10b5-1 under the Securities Act of 1934, as amended (the “Exchange Act”). During the year ended December 31,2017, we repurchased approximately 0.3 million shares of our common stock at an average cost of $74.27 per share, for a total of $25.0 million. We did not repurchase any shares in 2016. During 2015, we repurchased 6,194,641approximately 6.2 million shares of our common stock at an average cost of $57.39 for approximately $355.5 million through open market purchases under a plan complying with Rule10b5-1 under the Securities Exchange Act of 1934, as amended (the “Exchange Act”). We repurchased 759,800 shares of our common stock at an average cost of $65.80 per share, for approximately $50.0 million through open market purchases in 2014. We did not repurchase anya total of our common stock in 2013.$355.5 million. Since initiating the share repurchase plan in 1994, we have purchasedrepurchased approximately 22.122.5 million shares at an average cost of $30.93$31.58 per share. As of December 31, 2015,2017, we had authorization under the plan to purchase an additional 8,428,592approximately 8.1 million shares, underor about 11% of our existing share repurchase plan. current outstanding shares.
Preferred Stock
We are authorized to issue 5,000,000 shares of preferred stock, $0.001 per share. No shares of our preferred stock are issued and outstanding. Our restated articles of incorporation provide that shares of preferred stock may be issued from time to time in one or more series by the Board. The Board can fix the preferences, conversion and other rights, voting powers, restrictions, limitations as to dividends, qualifications and terms and conditions of redemption of each series of preferred stock. The rights of preferred stockholders may supersede the rights of common stockholders.
Stock-Based Compensation
Effective January 1, 2016, we adopted accounting changes issued by the FASB for stock-based compensation that allow us to account for forfeitures of RSUs as they occur rather than estimating the number of forfeitures. As a result of the adoption, we recorded a cumulative-effect adjustment that reduced beginning retained earnings by $0.6 million, net of tax.
Accumulated Other Comprehensive Loss
Accumulated other comprehensive loss included the following:
| | | | | | | | | | | |
| | | | Unrealized | | Pension and | | Accumulated |
| Foreign Currency | | Gain (Loss) on | | Postretirement | | Other |
| Translation | | Investments, | | Benefit Adjustments, | | Comprehensive |
| Loss | | Net of Tax | | Net of Tax | | Loss |
| (in millions) |
| | | | | | | | | | | |
Balance as of January 1, 2015 | $ | (23.2) | | $ | 0.4 | | $ | (26.1) | | $ | (48.9) |
Current-period change | | (51.0) | | | (0.4) | | | 0.6 | | | (50.8) |
Balance as of December 31, 2015 | $ | (74.2) | | $ | — | | $ | (25.5) | | $ | (99.7) |
Foreign currency translation adjustments are not generally adjusted for income taxes as they relate to indefinite investments in foreign subsidiaries. Pension and postretirement benefit adjustments are net of taxes of $15.6 million as of December 31, 2015 and December 31, 2014.
See “Note 11 – Employee Benefits” for information regarding reclassification of amounts from accumulated comprehensive loss to net income.
| | | | | | | | |
| | | | Pension and | | Accumulated |
| Foreign Currency | | Postretirement | | Other |
| Translation | | Benefit Adjustments, | | Comprehensive |
| (Loss) Gain | | Net of Tax | | (Loss) Income |
| (in millions) |
Balance as of January 1, 2017 | $ | (79.9) | | $ | (24.8) | | $ | (104.7) |
Current-year change | | 28.8 | | | 4.3 | | | 33.1 |
Balance as of December 31, 2017 | $ | (51.1) | | $ | (20.5) | | $ | (71.6) |
Table of Contents
RELIANCE STEEL & ALUMINUM CO.
NOTES TO CONSOLIDATED FINANCIAL STATEMENTS (Continued)
December 31, 20152017
Foreign currency translation adjustments have not been adjusted for income taxes. Pension and postretirement benefit adjustments are net of taxes of $13.6 million and $14.9 million as of December 31, 2017 and December 31, 2016, respectively.
See Note 11 — “Employee Benefits” for information regarding reclassification of amounts from accumulated comprehensive loss to net income.
Note 13. Other (Expense) Income,Expense, net
Significant components of Other income,expense, net are as follows:
| | | | | | | |
| Year Ended December 31, | | | | | | | | |
| 2015 | | 2014 | | 2013 | Year Ended December 31, |
| (in millions) | 2017 | | 2016 | | 2015 |
| | | | | | | (in millions) |
Investment income from life insurance policies | $ | 55.3 | | $ | 51.3 | | $ | 48.8 | $ | (66.4) | | $ | (60.8) | | $ | (55.3) |
Interest expense on life insurance policy loans | | (57.4) | | (52.5) | | (47.8) | | 66.5 | | | 62.1 | | | 57.4 |
Gain on acquisition achieved in stages | | — | | 11.4 | | — | |
Life insurance policy cost of insurance | | (10.1) | | (9.2) | | (8.5) | | 11.5 | | | 10.9 | | | 10.1 |
Income from life insurance policy redemptions | | 4.2 | | — | | 5.0 | | (8.5) | | | (4.4) | | | (4.2) |
Foreign currency transaction gains (losses) | | — | | 3.1 | | (2.6) | |
Rental income | | 1.9 | | 1.9 | | 2.9 | |
Interest income | | 1.0 | | 1.4 | | 1.0 | |
Equity in earnings of unconsolidated entities | | — | | 2.2 | | 2.3 | |
Foreign currency transaction losses (gains) | | | 4.9 | | | (1.8) | | | — |
Net periodic benefit cost — components other than service cost | | | 6.9 | | | 5.2 | | | 3.2 |
All other, net | | 1.5 | | | 1.2 | | | 2.8 | | (10.2) | | | (7.2) | | | (4.4) |
| $ | (3.6) | | $ | 10.8 | | $ | 3.9 | $ | 4.7 | | $ | 4.0 | | $ | 6.8 |
Note 14. Commitments and Contingencies
Lease Commitments
We lease land, buildings and equipment under non‑cancelable operating leases expiring in various years through 2028.2041. Rent expense for leases that contain scheduled rent increases are recorded on a straight‑line basis. Several of the leases have renewal options providing for additional lease periods. Future minimum payments, by year and in the aggregate, under the non‑cancelable leases with initial or remaining terms of one year or more, consisted of the following as of December 31, 2015:2017:
| | | | |
| Operating | Operating |
| Leases | Leases |
| (in millions) | (in millions) |
2016 | $ | 61.6 | |
2017 | | 48.2 | |
2018 | | 37.3 | $ | 62.7 |
2019 | | 27.5 | | 50.1 |
2020 | | 17.8 | | 35.1 |
2021 | | | 21.9 |
2022 | | | 13.6 |
Thereafter | | 25.0 | | 17.7 |
| $ | 217.4 | $ | 201.1 |
Total rental expense amounted to $77.9 million, $78.9 million and $80.0 million $79.3 millionin 2017, 2016 and $79.9 million in 2015, 2014 and 2013, respectively.
Included in the amounts for operating leases are lease payments to various related parties, who are not executive officers of the Company, in the amounts of $3.4 million, $3.6 million and $5.2 million $5.5 millionin 2017, 2016 and $4.8 million in 2015, 2014 and 2013, respectively. These related party leases are for buildings leased to certain of the companies we have acquired and expire in various years through 2021.
Table of Contents
RELIANCE STEEL & ALUMINUM CO.
NOTES TO CONSOLIDATED FINANCIAL STATEMENTS (Continued)
December 31, 20152017
respectively. These related party leases are for buildings leased to certain of the companies we have acquired and expire in various years through 2022.
Purchase Commitments
As of December 31, 2015,2017, we had commitments to purchase minimum quantities of certain metal products, which we entered into to secure material for corresponding long‑term sales commitments we have entered into with our customers. The total amount of the minimum commitments based on current pricing is estimated at approximately $53.9$126.2 million, with amounts in 2016, 20172018, 2019 and thereafter being $47.5$38.9 million, $4.2$28.1 million, and $2.2$59.2 million, respectively.
Collective Bargaining Agreements
As of December 31, 2015,2017, approximately 11%12%, or 1,580,1,770, of our total employees are covered by 41 collective bargaining agreements at 5153 of our different locations, which expire at various times over the next fiveeight years. Approximately 500600 of our employees are covered by 2123 different collective bargaining agreements that will expire during 2016.2018.
Environmental Contingencies
We are subject to extensive and changing federal, state, local and foreign laws and regulations designed to protect the environment, including those relating to the use, handling, storage, discharge and disposal of hazardous substances and the remediation of environmental contamination. Our operations use minimal amounts of such substances.
We believe we are in material compliance with environmental laws and regulations; however, we are from time to time involved in administrative and judicial proceedings and inquiries relating to environmental matters. Some of our owned or leased properties are located in industrial areas with histories of heavy industrial use. We may incur some environmental liabilities because of the location of these properties. In addition, we are currently involved with a certain environmental remediation projectsproject related to activities at former manufacturing operations of EMJ, our wholly owned subsidiary, that were sold many years prior to Reliance’s 2006 acquisition of EMJ.EMJ in 2006. Although the potential cleanup costs could be significant, EMJ had maintained insurance policies during the time it owned the manufacturing operations that have covered costs incurred to date, and are expected to continue to cover the majority of the related costs. We do not expect that these obligations will have a material adverse impact on our consolidated financial position, results of operations or cash flows.
Legal Matters
In 2014, Reliance and Chapel Steel Corp. (“Chapel”) were defendants in an antitrust lawsuit filed in the United States District Court for the Southern District of Texas brought by two former employees who claimed that Reliance, Chapel and the co-defendants engaged in anticompetitive activities. Following a judgment against all the defendants, Reliance and Chapel settled all claims against them relating to this matter for $23.0 million.
From time to time, we are named as a defendant in legal actions. Generally, these actions arise out of our normal course of business. We are not currently a party to any pending legal proceedings other than routine litigation incidental to the business. We expect that these matters will be resolved without having a material adverse effect on our results of operations or financial condition. We maintain liability insurance against risks arising out of our normal course of business.
Table of Contents
RELIANCE STEEL & ALUMINUM CO.
NOTES TO CONSOLIDATED FINANCIAL STATEMENTS (Continued)
December 31, 20152017
Note 15. Earnings Per Share
The following table sets forth the computation of basic and diluted earnings per share:
| | | | | | | | | | | | | | |
| Year Ended December 31, | Year Ended December 31, |
| 2015 | | 2014 | | 2013 | 2017 | | 2016 | | 2015 |
| (in millions, except share and per share amounts) | (in millions, except share and per share amounts) |
Numerator: | | | | | | | | | | | | | | |
Net income attributable to Reliance | $ | 311.5 | | $ | 371.5 | | $ | 321.6 | $ | 613.4 | | $ | 304.3 | | $ | 311.5 |
Denominator: | | | | | | | | | | | | | | |
Weighted average shares outstanding | | 74,096,349 | | 77,682,943 | | 76,844,912 | | 72,851,021 | | | 72,362,513 | | | 74,096,349 |
Dilutive effect of stock-based awards | | 805,715 | | | 932,996 | | | 801,280 | | 688,403 | | | 758,405 | | | 805,715 |
Weighted average diluted shares outstanding | | 74,902,064 | | | 78,615,939 | | | 77,646,192 | | 73,539,424 | | | 73,120,918 | | | 74,902,064 |
| | | | | | | | | | | | | | |
Earnings per share attributable to Reliance stockholders: | | | | | | | | | | | | | | |
Diluted | $ | 4.16 | | $ | 4.73 | | $ | 4.14 | $ | 8.34 | | $ | 4.16 | | $ | 4.16 |
Basic | $ | 4.20 | | $ | 4.78 | | $ | 4.19 | $ | 8.42 | | $ | 4.21 | | $ | 4.20 |
Potentially dilutive securities whose effect would have been antidilutive were not significant for 2015, 2014,2017, 2016, and 2013.
2015.
Note 16. Segment Information
We have one reportable segment, metals service centers. All of our recent acquisitions were metals service centers and did not result in new reportable segments. Although a variety of products or services are sold at our various locations, in total, sales were comprised of the following in each of the three years ended December 31:
| | | | | | | | | | | | |
| 2015 | | 2014 | | 2013 | | 2017 | | 2016 | | 2015 | |
Carbon steel | 52 | % | 54 | % | 53 | % | 52 | % | 52 | % | 52 | % |
Aluminum | 19 | % | 15 | % | 15 | % | 19 | % | 20 | % | 19 | % |
Stainless steel | 14 | % | 14 | % | 14 | % | 14 | % | 14 | % | 14 | % |
Alloy steel | 7 | % | 9 | % | 10 | % | |
Toll processing | 3 | % | 2 | % | 2 | % | |
Alloy | | 6 | % | 5 | % | 7 | % |
Toll processing and logistics | | 4 | % | 4 | % | 3 | % |
Other | 5 | % | 6 | % | 6 | % | 5 | % | 5 | % | 5 | % |
Total | 100 | % | 100 | % | 100 | % | 100 | % | 100 | % | 100 | % |
Table of Contents
RELIANCE STEEL & ALUMINUM CO.
NOTES TO CONSOLIDATED FINANCIAL STATEMENTS (Continued)
December 31, 20152017
The following table summarizes consolidated financial information of our operations by geographic location based on where sales originated from:
| | | | | | | | | | | | | | | | |
| United States | | Foreign
Countries | | Total | United States | | Foreign Countries | | Total |
| (in millions) | (in millions) |
Year Ended December 31, 2017 | | | | | | | | | |
Net sales | | $ | 8,847.3 | | $ | 873.7 | | $ | 9,721.0 |
Long-lived assets | | | 4,353.7 | | | 346.0 | | | 4,699.7 |
Year Ended December 31, 2016 | | | | | | | | | |
Net sales | | | 7,867.3 | | | 746.1 | | | 8,613.4 |
Long-lived assets | | | 4,385.2 | | | 337.6 | | | 4,722.8 |
Year Ended December 31, 2015 | | | | | | | | | | | | | | | | |
Net sales | $ | 8,617.7 | | $ | 732.8 | | $ | 9,350.5 | | 8,617.7 | | | 732.8 | | | 9,350.5 |
Long-lived assets | | 4,211.5 | | | 355.9 | | | 4,567.4 | | 4,211.5 | | | 355.9 | | | 4,567.4 |
Year Ended December 31, 2014 | | | | | | | | | |
Net sales | | 9,801.0 | | | 650.6 | | | 10,451.6 | |
Long-lived assets | | 4,327.2 | | | 388.3 | | | 4,715.5 | |
Year Ended December 31, 2013 | | | | | | | | | |
Net sales | | 8,682.2 | | | 541.6 | | | 9,223.8 | |
Long-lived assets | | 4,296.6 | | | 305.5 | | | 4,602.1 | |
| | | | | | | | | |
Note 17. Subsequent EventImpairment and Restructuring Charges
On January 1,We recorded impairment and restructuring charges of $4.1 million, $69.1 million and $56.3 million in 2017, 2016 we acquired Tubular Steel, Inc. (“TSI”), a distributor and processor of carbon, alloy2015, respectively. The 2016 and stainless steel pipe, tubing and bar products. TSI, headquartered in St. Louis, Missouri, has seven locations and a fabrication business that supports its diverse customer base. This acquisition was funded with borrowings on our revolving credit facility. For the year ended December 31, 2014, TSI’s net sales were approximately $200.0 million.
Note 18. Impairment of Long-Lived Assets
In 2015 we recorded a $53.3 million impairment charge of long-lived assets primarilycharges mainly related to certain of our energy-related businesses as a result of the impact to our businesses from continued low crude oil prices that reduced drilling activity and the resulting decline in the demand for the products we sell to the energy market (oil and gas) market. This included a charge of $17.7 million for property, plant, and equipment directly related to the closure of certain of our energy-related businesses where we anticipate losses on the disposition of certain assets and an impairment charge of $35.6 million related to our intangible assets, net due to the loss of customers and lowered expectations of future profitability. The measurement of these assets at fair value was determined using a combination of discounted cash flow techniques for intangible assets and the market approach for property, plant, and equipment. We recognized an impairment loss of $14.9 million related to one of our trade name intangible assets in 2013. No impairment of long-lived assets was recognized in 2014..
Note 19. Condensed Consolidating Financial StatementsThe impairment and restructuring charges consisted of the following:
| | | | | | | | |
| | | | |
| Year Ended December 31, |
| 2017 | | 2016 | | 2015 |
| (in millions) |
Property, plant and equipment | $ | 4.2 | | $ | 16.0 | | $ | 17.7 |
Intangible assets, net | | — | | | 36.4 | | | 35.6 |
Total impairment charges | | 4.2 | | | 52.4 | | | 53.3 |
Restructuring––cost of sales | | (0.2) | | | 12.8 | | | 1.6 |
Restructuring––warehouse, delivery, selling, general and administrative expense | | 0.1 | | | 2.9 | | | 1.0 |
Restructuring––depreciation expense | | — | | | — | | | 0.4 |
Restructuring––non-operating expense | | — | | | 1.0 | | | — |
Total impairment and restructuring charges | $ | 4.1 | | $ | 69.1 | | $ | 56.3 |
In November 2006 and April 2013, we issued senior unsecured notes in the aggregate principal amount of $1.1 billion, at fixed interest rates that are guaranteed by certain of our 100%-owned domestic subsidiaries that also guarantee borrowings under the Credit Agreement. The accompanying consolidating financial information has been prepared and presented pursuant to Rule 3‑10 of SEC Regulation S‑X “Financial Statements of Guarantors and Issuers of Guaranteed Securities Registered or Being Registered.” The guarantees are full and unconditional and joint and several obligations of each of the guarantor subsidiaries. There are no significant restrictions on our ability to obtain funds from any of the guarantor subsidiaries by dividends or loans. The supplemental consolidating financial information has been presented in lieu of separate financial statements of the guarantors as such separate financial statements are not considered meaningful.
Table of Contents
RELIANCE STEEL & ALUMINUM CO.
NOTES TO CONSOLIDATED FINANCIAL STATEMENTS (Continued)
December 31, 20152017
Condensed Consolidating Balance Sheet
As of December 31, 2015
(in millions)
| | | | | | | | | | | | | | |
| | | | | | | Non- | | | | | | |
| | | | Guarantor | | Guarantor | | Consolidating | | | |
| Parent | | Subsidiaries | | Subsidiaries | | Adjustments | | Consolidated |
| | | | | | | | | | | | | | |
Assets | | | | | | | | | | | | | | |
Cash and cash equivalents | $ | 10.7 | | $ | (1.0) | | $ | 94.6 | | $ | — | | $ | 104.3 |
Accounts receivable, net | | 66.5 | | | 701.8 | | | 152.3 | | | (4.0) | | | 916.6 |
Inventories | | 56.0 | | | 1,145.1 | | | 234.9 | | | — | | | 1,436.0 |
Income taxes receivable | | 38.2 | | | — | | | (1.7) | | | — | | | 36.5 |
Other current assets | | 36.4 | | | 15.1 | | | 12.6 | | | (3.3) | | | 60.8 |
Total current assets | | 207.8 | | | 1,861.0 | | | 492.7 | | | (7.3) | | | 2,554.2 |
| | | | | | | | | | | | | | |
Investments in subsidiaries | | 5,046.2 | | | 328.0 | | | — | | | (5,374.2) | | | — |
Property, plant and equipment, net | | 115.5 | | | 1,311.3 | | | 208.7 | | | — | | | 1,635.5 |
Goodwill | | 23.8 | | | 1,571.1 | | | 129.9 | | | — | | | 1,724.8 |
Intangible assets, net | | 14.0 | | | 977.5 | | | 133.9 | | | — | | | 1,125.4 |
Intercompany receivables | | 614.2 | | | 45.4 | | | 30.5 | | | (690.1) | | | — |
Other assets | | 24.6 | | | 50.9 | | | 6.2 | | | — | | | 81.7 |
Total assets | $ | 6,046.1 | | $ | 6,145.2 | | $ | 1,001.9 | | $ | (6,071.6) | | $ | 7,121.6 |
| | | | | | | | | | | | | | |
Liabilities & Equity | | | | | | | | | | | | | | |
Accounts payable | $ | 25.3 | | $ | 160.0 | | $ | 65.7 | | $ | (4.0) | | $ | 247.0 |
Accrued compensation and retirement costs | | 29.5 | | | 79.1 | | | 10.1 | | | — | | | 118.7 |
Other current liabilities | | 54.0 | | | 15.3 | | | 57.2 | | | (3.3) | | | 123.2 |
Current maturities of long-term debt and short-term borrowings | | 400.0 | | | — | | | 100.8 | | | — | | | 500.8 |
Total current liabilities | | 508.8 | | | 254.4 | | | 233.8 | | | (7.3) | | | 989.7 |
Long-term debt | | 1,417.3 | | | 5.7 | | | 4.9 | | | — | | | 1,427.9 |
Intercompany borrowings | | — | | | 547.6 | | | 142.5 | | | (690.1) | | | — |
Other long-term liabilities | | 205.9 | | | 505.0 | | | 50.4 | | | — | | | 761.3 |
Total Reliance stockholders’ equity | | 3,914.1 | | | 4,824.5 | | | 549.7 | | | (5,374.2) | | | 3,914.1 |
Noncontrolling interests | | ��— | | | 8.0 | | | 20.6 | | | — | | | 28.6 |
Total equity | | 3,914.1 | | | 4,832.5 | | | 570.3 | | | (5,374.2) | | | 3,942.7 |
Total liabilities and equity | $ | 6,046.1 | | $ | 6,145.2 | | $ | 1,001.9 | | $ | (6,071.6) | | $ | 7,121.6 |
Table of Contents
RELIANCE STEEL & ALUMINUM CO.
NOTES TO CONSOLIDATED FINANCIAL STATEMENTS (Continued)
December 31, 2015
Condensed Consolidating Balance Sheet
As of December 31, 2014
(in millions)
| | | | | | | | | | | | | | |
| | | | | | | Non- | | | | | | |
| | | | Guarantor | | Guarantor | | Consolidating | | | |
| Parent | | Subsidiaries | | Subsidiaries | | Adjustments | | Consolidated |
| | | | | | | | | | | | | | |
Assets | | | | | | | | | | | | | | |
Cash and cash equivalents | $ | 41.9 | | $ | (8.3) | | $ | 72.6 | | $ | — | | $ | 106.2 |
Accounts receivable, net | | 72.7 | | | 923.1 | | | 164.8 | | | (16.0) | | | 1,144.6 |
Inventories | | 57.6 | | | 1,454.2 | | | 240.3 | | | — | | | 1,752.1 |
Other current assets | | 139.3 | | | 38.5 | | | 16.1 | | | (75.7) | | | 118.2 |
Total current assets | | 311.5 | | | 2,407.5 | | | 493.8 | | | (91.7) | | | 3,121.1 |
| | | | | | | | | | | | | | |
Investments in subsidiaries | | 4,891.8 | | | 299.9 | | | — | | | (5,191.7) | | | — |
Property, plant and equipment, net | | 103.8 | | | 1,333.7 | | | 218.9 | | | — | | | 1,656.4 |
Goodwill | | 23.8 | | | 1,571.0 | | | 141.6 | | | — | | | 1,736.4 |
Intangible assets, net | | 16.1 | | | 1,056.7 | | | 154.6 | | | — | | | 1,227.4 |
Intercompany receivables | | 1,361.7 | | | 26.1 | | | 18.2 | | | (1,406.0) | | | — |
Other assets | | 22.7 | | | 52.5 | | | 5.9 | | | — | | | 81.1 |
Total assets | $ | 6,731.4 | | $ | 6,747.4 | | $ | 1,033.0 | | $ | (6,689.4) | | $ | 7,822.4 |
| | | | | | | | | | | | | | |
Liabilities & Equity | | | | | | | | | | | | | | |
Accounts payable | $ | 29.2 | | $ | 212.3 | | $ | 60.6 | | $ | (15.6) | | $ | 286.5 |
Accrued compensation and retirement costs | | 23.9 | | | 89.9 | | | 14.6 | | | — | | | 128.4 |
Other current liabilities | | 65.2 | | | 26.1 | | | 62.6 | | | 0.1 | | | 154.0 |
Deferred income taxes | | — | | | 75.1 | | | 0.6 | | | (75.7) | | | — |
Current maturities of long-term debt and short-term borrowings | | 43.8 | | | — | | | 50.1 | | | — | | | 93.9 |
Total current liabilities | | 162.1 | | | 403.4 | | | 188.5 | | | (91.2) | | | 662.8 |
Long-term debt | | 2,156.6 | | | 5.7 | | | 45.8 | | | — | | | 2,208.1 |
Intercompany borrowings | | — | | | 1,242.5 | | | 163.5 | | | (1,406.0) | | | — |
Other long-term liabilities | | 313.7 | | | 456.2 | | | 54.1 | | | (0.4) | | | 823.6 |
Total Reliance stockholders’ equity | | 4,099.0 | | | 4,633.4 | | | 558.4 | | | (5,191.8) | | | 4,099.0 |
Noncontrolling interests | | — | | | 6.2 | | | 22.7 | | | — | | | 28.9 |
Total equity | | 4,099.0 | | | 4,639.6 | | | 581.1 | | | (5,191.8) | | | 4,127.9 |
Total liabilities and equity | $ | 6,731.4 | | $ | 6,747.4 | | $ | 1,033.0 | | $ | (6,689.4) | | $ | 7,822.4 |
Table of Contents
RELIANCE STEEL & ALUMINUM CO.
NOTES TO CONSOLIDATED FINANCIAL STATEMENTS (Continued)
December 31, 2015
Condensed Consolidating Statement of Comprehensive Income
For the year ended December 31, 2015
(in millions)
| | | | | | | | | | | | | | |
| | | | | | | Non- | | | | | | |
| | | | Guarantor | | Guarantor | | Consolidating | | | |
| Parent | | Subsidiaries | | Subsidiaries | | Adjustments | | Consolidated |
| | | | | | | | | | | | | | |
Net sales | $ | 710.9 | | $ | 7,978.3 | | $ | 864.6 | | $ | (203.3) | | $ | 9,350.5 |
| | | | | | | | | | | | | | |
Costs and expenses: | | | | | | | | | | | | | | |
Cost of sales (exclusive of depreciation and amortization shown below) | | 503.1 | | | 5,833.9 | | | 670.0 | | | (203.4) | | | 6,803.6 |
Warehouse, delivery, selling, general and administrative | | 168.1 | | | 1,435.8 | | | 140.0 | | | (15.4) | | | 1,728.5 |
Depreciation and amortization | | 16.8 | | | 179.1 | | | 22.6 | | | — | | | 218.5 |
Impairment of long-lived assets | | — | | | 51.8 | | | 1.5 | | | — | | | 53.3 |
| | 688.0 | | | 7,500.6 | | | 834.1 | | | (218.8) | | | 8,803.9 |
| | | | | | | | | | | | | | |
Operating income | | 22.9 | | | 477.7 | | | 30.5 | | | 15.5 | | | 546.6 |
| | | | | | | | | | | | | | |
Other income (expense): | | | | | | | | | | | | | | |
Interest | | (80.3) | | | (19.2) | | | (6.7) | | | 21.9 | | | (84.3) |
Other income (expense), net | | 17.2 | | | (0.7) | | | 17.3 | | | (37.4) | | | (3.6) |
(Loss) income before equity in earnings of subsidiaries and income taxes | | (40.2) | | | 457.8 | | | 41.1 | | | — | | | 458.7 |
Equity in earnings of subsidiaries | | 297.8 | | | 13.1 | | | — | | | (310.9) | | | — |
Income before income taxes | | 257.6 | | | 470.9 | | | 41.1 | | | (310.9) | | | 458.7 |
Income tax (benefit) provision | | (53.9) | | | 182.5 | | | 13.9 | | | — | | | 142.5 |
Net income | | 311.5 | | | 288.4 | | | 27.2 | | | (310.9) | | | 316.2 |
Less: Net income attributable to noncontrolling interests | | — | | | 4.7 | | | — | | | — | | | 4.7 |
Net income attributable to Reliance | $ | 311.5 | | $ | 283.7 | | $ | 27.2 | | $ | (310.9) | | $ | 311.5 |
Comprehensive income (loss) attributable to Reliance | $ | 260.7 | | $ | 250.1 | | $ | (18.9) | | $ | (231.2) | | $ | 260.7 |
Table of Contents
RELIANCE STEEL & ALUMINUM CO.
NOTES TO CONSOLIDATED FINANCIAL STATEMENTS (Continued)
December 31, 2015
Condensed Consolidating Statement of Comprehensive Income
For the year ended December 31, 2014
(in millions)
| | | | | | | | | | | | | | |
| | | | | | | Non- | | | | | | |
| | | | Guarantor | | Guarantor | | Consolidating | | | |
| Parent | | Subsidiaries | | Subsidiaries | | Adjustments | | Consolidated |
| | | | | | | | | | | | | | |
Net sales | $ | 750.2 | | $ | 9,110.2 | | $ | 825.9 | | $ | (234.7) | | $ | 10,451.6 |
| | | | | | | | | | | | | | |
Costs and expenses: | | | | | | | | | | | | | | |
Cost of sales (exclusive of depreciation and amortization shown below) | | 557.0 | | | 6,885.4 | | | 623.0 | | | (234.8) | | | 7,830.6 |
Warehouse, delivery, selling, general and administrative | | 157.3 | | | 1,545.9 | | | 140.9 | | | (54.3) | | | 1,789.8 |
Depreciation and amortization | | 19.8 | | | 174.0 | | | 20.0 | | | — | | | 213.8 |
| | 734.1 | | | 8,605.3 | | | 783.9 | | | (289.1) | | | 9,834.2 |
| | | | | | | | | | | | | | |
Operating income | | 16.1 | | | 504.9 | | | 42.0 | | | 54.4 | | | 617.4 |
| | | | | | | | | | | | | | |
Other income (expense): | | | | | | | | | | | | | | |
Interest | | (78.1) | | | (28.3) | | | (5.7) | | | 30.2 | | | (81.9) |
Other income (expense), net | | 67.7 | | | (2.7) | | | 30.4 | | | (84.6) | | | 10.8 |
Income before equity in earnings of subsidiaries and income taxes | | 5.7 | | | 473.9 | | | 66.7 | | | — | | | 546.3 |
Equity in earnings of subsidiaries | | 325.1 | | | 21.2 | | | — | | | (346.3) | | | — |
Income before income taxes | | 330.8 | | | 495.1 | | | 66.7 | | | (346.3) | | | 546.3 |
Income tax (benefit) provision | | (40.7) | | | 190.1 | | | 20.6 | | | — | | | 170.0 |
Net income | | 371.5 | | | 305.0 | | | 46.1 | | | (346.3) | | | 376.3 |
Less: Net income attributable to noncontrolling interests | | — | | | 4.4 | | | 0.4 | | | — | | | 4.8 |
Net income attributable to Reliance | $ | 371.5 | | $ | 300.6 | | $ | 45.7 | | $ | (346.3) | | $ | 371.5 |
Comprehensive income attributable to Reliance | $ | 367.5 | | $ | 280.4 | | $ | 27.7 | | $ | (346.3) | | $ | 329.3 |
Table of Contents
RELIANCE STEEL & ALUMINUM CO.
NOTES TO CONSOLIDATED FINANCIAL STATEMENTS (Continued)
December 31, 2015
Condensed Consolidating Statement of Comprehensive Income
For the year ended December 31, 2013
(in millions)
| | | | | | | | | | | | | | |
| | | | | | | Non- | | | | | | |
| | | | Guarantor | | Guarantor | | Consolidating | | | |
| Parent | | Subsidiaries | | Subsidiaries | | Adjustments | | Consolidated |
| | | | | | | | | | | | | | |
Net sales | $ | 704.5 | | $ | 8,021.6 | | $ | 710.1 | | $ | (212.4) | | $ | 9,223.8 |
| | | | | | | | | | | | | | |
Costs and expenses: | | | | | | | | | | | | | | |
Cost of sales (exclusive of depreciation and amortization shown below) | | 509.7 | | | 5,999.2 | | | 529.7 | | | (212.4) | | | 6,826.2 |
Warehouse, delivery, selling, general and administrative | | 200.7 | | | 1,385.5 | | | 117.8 | | | (65.6) | | | 1,638.4 |
Depreciation and amortization | | 17.5 | | | 158.6 | | | 16.3 | | | — | | | 192.4 |
Impairment of long-lived assets | | — | | | 14.9 | | | — | | | — | | | 14.9 |
| | 727.9 | | | 7,558.2 | | | 663.8 | | | (278.0) | | | 8,671.9 |
| | | | | | | | | | | | | | |
Operating (loss) income | | (23.4) | | | 463.4 | | | 46.3 | | | 65.6 | | | 551.9 |
| | | | | | | | | | | | | | |
Other income (expense): | | | | | | | | | | | | | | |
Interest | | (74.7) | | | (19.9) | | | (4.2) | | | 21.3 | | | (77.5) |
Other income, net | | 75.7 | | | 5.5 | | | 9.6 | | | (86.9) | | | 3.9 |
(Loss) income before equity in earnings of subsidiaries and income taxes | | (22.4) | | | 449.0 | | | 51.7 | | | — | | | 478.3 |
Equity in earnings of subsidiaries | | 300.3 | | | 12.4 | | | — | | | (312.7) | | | — |
Income before income taxes | | 277.9 | | | 461.4 | | | 51.7 | | | (312.7) | | | 478.3 |
Income tax (benefit) provision | | (43.7) | | | 181.0 | | | 16.3 | | | — | | | 153.6 |
Net income | | 321.6 | | | 280.4 | | | 35.4 | | | (312.7) | | | 324.7 |
Less: Net income attributable to noncontrolling interests | | — | | | 2.8 | | | 0.3 | | | — | | | 3.1 |
Net income attributable to Reliance | $ | 321.6 | | $ | 277.6 | | $ | 35.1 | | $ | (312.7) | | $ | 321.6 |
Comprehensive income attributable to Reliance | $ | 318.9 | | $ | 293.5 | | $ | 16.7 | | $ | (312.7) | | $ | 316.4 |
Table of Contents
RELIANCE STEEL & ALUMINUM CO.
NOTES TO CONSOLIDATED FINANCIAL STATEMENTS (Continued)
December 31, 2015
Condensed Consolidating Cash Flow Statement
For the year ended December 31, 2015
(in millions)
| | | | | | | | | | | | | | |
| | | | | | | Non- | | | | | | |
| | | | Guarantor | | Guarantor | | Consolidating | | | |
| Parent | | Subsidiaries | | Subsidiaries | | Adjustments | | Consolidated |
| | | | | | | | | | | | | | |
Net cash provided by operating activities | $ | 148.8 | | $ | 805.0 | | $ | 71.2 | | $ | — | | $ | 1,025.0 |
| | | | | | | | | | | | | | |
Investing activities: | | | | | | | | | | | | | | |
Purchases of property, plant and equipment | | (21.5) | | | (136.1) | | | (14.6) | | | — | | | (172.2) |
Net repayments from subsidiaries | | 697.2 | | | — | | | — | | | (697.2) | | | — |
Other investing activities, net | | (2.6) | | | 4.8 | | | 0.1 | | | — | | | 2.3 |
Net cash provided by (used in) investing activities | | 673.1 | | | (131.3) | | | (14.5) | | | (697.2) | | | (169.9) |
| | | | | | | | | | | | | | |
Financing activities: | | | | | | | | | | | | | | |
Net short-term debt borrowings | | — | | | — | | | 12.7 | | | — | | | 12.7 |
Proceeds from long-term debt borrowings | | 573.0 | | | — | | | — | | | — | | | 573.0 |
Principal payments on long-term debt | | (959.8) | | | (2.5) | | | — | | | — | | | (962.3) |
Dividends and dividend equivalents paid | | (120.1) | | | — | | | — | | | — | | | (120.1) |
Share repurchases | | (355.5) | | | — | | | — | | | — | | | (355.5) |
Net intercompany repayments | | — | | | (663.9) | | | (33.3) | | | 697.2 | | | — |
Other financing activities, net | | 9.3 | | | — | | | (5.6) | | | — | | | 3.7 |
Net cash used in financing activities | | (853.1) | | | (666.4) | | | (26.2) | | | 697.2 | | | (848.5) |
Effect of exchange rate changes on cash and cash equivalents | | — | | | — | | | (8.5) | | | — | | | (8.5) |
(Decrease) increase in cash and cash equivalents | | (31.2) | | | 7.3 | | | 22.0 | | | — | | | (1.9) |
Cash and cash equivalents at beginning of year | | 41.9 | | | (8.3) | | | 72.6 | | | — | | | 106.2 |
Cash and cash equivalents at end of year | $ | 10.7 | | $ | (1.0) | | $ | 94.6 | | $ | — | | $ | 104.3 |
Table of Contents
RELIANCE STEEL & ALUMINUM CO.
NOTES TO CONSOLIDATED FINANCIAL STATEMENTS (Continued)
December 31, 2015
Condensed Consolidating Cash Flow Statement
For the year ended December 31, 2014
(in millions)
| | | | | | | | | | | | | | |
| | | | | | | Non- | | | | | | |
| | | | Guarantor | | Guarantor | | Consolidating | | | |
| Parent | | Subsidiaries | | Subsidiaries | | Adjustments | | Consolidated |
| | | | | | | | | | | | | | |
Net cash provided by operating activities | $ | 118.4 | | $ | 193.2 | | $ | 44.4 | | $ | — | | $ | 356.0 |
| | | | | | | | | | | | | | |
Investing activities: | | | | | | | | | | | | | | |
Purchases of property, plant and equipment | | (18.2) | | | (159.2) | | | (13.0) | | | — | | | (190.4) |
Acquisitions, net of cash acquired | | - | | | (92.0) | | | (116.2) | | | — | | | (208.2) |
Net advances to subsidiaries | | (119.7) | | | — | | | — | | | 119.7 | | | — |
Other investing activities, net | | (0.8) | | | (3.6) | | | 38.0 | | | — | | | 33.6 |
Net cash used in investing activities | | (138.7) | | | (254.8) | | | (91.2) | | | 119.7 | | | (365.0) |
| | | | | | | | | | | | | | |
Financing activities: | | | | | | | | | | | | | | |
Net short-term debt borrowings | | — | | | — | | | 1.7 | | | — | | | 1.7 |
Proceeds from long-term debt borrowings | | 719.0 | | | — | | | - | | | — | | | 719.0 |
Principal payments on long-term debt | | (549.3) | | | (2.0) | | | (0.9) | | | — | | | (552.2) |
Dividends paid | | (108.7) | | | — | | | — | | | — | | | (108.7) |
Net intercompany borrowings | | — | | | 64.4 | | | 55.3 | | | (119.7) | | | — |
Other financing activities, net | | (18.5) | | | (8.3) | | | — | | | - | | | (26.8) |
Net cash provided by financing activities | | 42.5 | | | 54.1 | | | 56.1 | | | (119.7) | | | 33.0 |
Effect of exchange rate changes on cash and cash equivalents | | — | | | — | | | (1.4) | | | — | | | (1.4) |
Increase (decrease) in cash and cash equivalents | | 22.2 | | | (7.5) | | | 7.9 | | | — | | | 22.6 |
Cash and cash equivalents at beginning of year | | 19.7 | | | (0.8) | | | 64.7 | | | — | | | 83.6 |
Cash and cash equivalents at end of year | $ | 41.9 | | $ | (8.3) | | $ | 72.6 | | $ | — | | $ | 106.2 |
Table of Contents
RELIANCE STEEL & ALUMINUM CO.
NOTES TO CONSOLIDATED FINANCIAL STATEMENTS (Continued)
December 31, 2015
Condensed Consolidating Cash Flow Statement
For the year ended December 31, 2013
(in millions)
| | | | | | | | | | | | | | |
| | | | | | | Non- | | | | | | |
| | | | Guarantor | | Guarantor | | Consolidating | | | |
| Parent | | Subsidiaries | | Subsidiaries | | Adjustments | | Consolidated |
| | | | | | | | | | | | | | |
Net cash provided by operating activities | $ | 102.8 | | $ | 458.5 | | $ | 72.0 | | $ | — | | $ | 633.3 |
| | | | | | | | | | | | | | |
Investing activities: | | | | | | | | | | | | | | |
Purchases of property, plant and equipment | | (14.0) | | | (139.9) | | | (14.1) | | | — | | | (168.0) |
Acquisition, net of cash acquired | | (821.1) | | | — | | | — | | | — | | | (821.1) |
Net advances to subsidiaries | | (85.3) | | | — | | | — | | | 85.3 | | | — |
Other investing activities, net | | 0.1 | | | 2.8 | | | 7.2 | | | — | | | 10.1 |
Net cash used in investing activities | | (920.3) | | | (137.1) | | | (6.9) | | | 85.3 | | | (979.0) |
| | | | | | | | | | | | | | |
Financing activities: | | | | | | | | | | | | | | |
Net short-term debt (repayments) borrowings | | — | | | (473.8) | | | 0.8 | | | — | | | (473.0) |
Proceeds from long-term debt borrowings | | 2,297.9 | | | — | | | — | | | — | | | 2,297.9 |
Principal payments on long-term debt | | (1,452.8) | | | (0.6) | | | (1.1) | | | — | | | (1,454.5) |
Dividends paid | | (96.9) | | | — | | | — | | | — | | | (96.9) |
Net intercompany (repayments) borrowings | | — | | | 141.4 | | | (56.1) | | | (85.3) | | | — |
Other financing activities, net | | 60.9 | | | (2.3) | | | — | | | — | | | 58.6 |
Net cash provided by (used in) financing activities | | 809.1 | | | (335.3) | | | (56.4) | | | (85.3) | | | 332.1 |
Effect of exchange rate changes on cash and cash equivalents | | — | | | — | | | (0.4) | | | — | | | (0.4) |
(Decrease) increase in cash and cash equivalents | | (8.4) | | | (13.9) | | | 8.3 | | | — | | | (14.0) |
Cash and cash equivalents at beginning of year | | 28.1 | | | 13.1 | | | 56.4 | | | — | | | 97.6 |
Cash and cash equivalents at end of year | $ | 19.7 | | $ | (0.8) | | $ | 64.7 | | $ | — | | $ | 83.6 |
Table of Contents
RELIANCE STEEL & ALUMINUM CO.
NOTES TO CONSOLIDATED FINANCIAL STATEMENTS (Continued)
December 31, 2015
Note 20.18. Quarterly Financial Information (Unaudited)
The following is a summary of the unaudited quarterly results of operations for 20152017 and 2014:2016:
| | | | | | | | | | | | | | | | |
| March 31, | | June 30, | | September 30, | | December 31, | March 31, | | June 30, | | September 30, | | December 31, |
| (in millions, except per share amounts) | (in millions, except per share amounts) |
2015: | | | | | | | | | |
2017: | | | | | | | | | |
Net sales | $ | 2,614.4 | | $ | 2,423.7 | | $ | 2,286.2 | | $ | 2,026.2 | $ | 2,419.3 | | $ | 2,475.2 | | $ | 2,450.1 | | $ | 2,376.4 |
Cost of sales | | 1,943.7 | | 1,767.8 | | 1,647.9 | | 1,444.2 | | 1,697.7 | | 1,773.1 | | 1,764.6 | | 1,697.8 |
Gross profit (1) | | 670.7 | | 655.9 | | 638.3 | | 582.0 | | 721.6 | | 702.1 | | 685.5 | | 678.6 |
Net income | | 102.9 | | 91.6 | | 52.8 | | 68.9 | | 113.4 | | 104.8 | | 99.0 | | 303.8 |
Net income attributable to Reliance | | 101.3 | | 90.2 | | 51.4 | | 68.6 | | 111.7 | | 103.0 | | 97.3 | | 301.4 |
Earnings per share attributable to Reliance stockholders | | | | | | | | | |
Earnings per share attributable to Reliance stockholders: | | | | | | | | | |
Diluted | | 1.30 | | 1.20 | | 0.69 | | 0.94 | | 1.52 | | 1.40 | | 1.32 | | 4.09 |
Basic | | 1.31 | | 1.21 | | 0.70 | | 0.96 | | 1.53 | | 1.41 | | 1.33 | | 4.14 |
| | | | | | | | | | | | | | | | |
2014: | | | | | | | | | |
2016: | | | | | | | | | |
Net sales | $ | 2,553.0 | | $ | 2,616.8 | | $ | 2,705.1 | | $ | 2,576.7 | $ | 2,162.7 | | $ | 2,203.9 | | $ | 2,185.2 | | $ | 2,061.6 |
Cost of sales | | 1,905.8 | | 1,943.5 | | 2,026.9 | | 1,954.4 | | 1,526.0 | | 1,518.8 | | 1,530.6 | | 1,447.7 |
Gross profit (1) | | 647.2 | | 673.3 | | 678.2 | | 622.3 | | 636.7 | | 685.1 | | 654.6 | | 613.9 |
Net income | | 87.9 | | 97.8 | | 96.9 | | 93.7 | | 93.5 | | 102.1 | | 50.6 | | 62.9 |
Net income attributable to Reliance | | 87.2 | | 96.5 | | 95.5 | | 92.3 | | 92.2 | | 100.9 | | 49.5 | | 61.7 |
Earnings per common share attributable to Reliance stockholders | | | | | | | | | |
Earnings per share attributable to Reliance stockholders: | | | | | | | | | |
Diluted | | 1.11 | | 1.22 | | 1.21 | | 1.18 | | 1.27 | | 1.38 | | 0.68 | | 0.84 |
Basic | | 1.13 | | 1.24 | | 1.23 | | 1.19 | | 1.28 | | 1.39 | | 0.68 | | 0.85 |
| (1) | | Gross profit, calculated as net sales less cost of sales, is a non‑GAAP financial measure as it excludes depreciation and amortization expense associated with the corresponding sales. The majority of our orders are basic distribution with no processing services performed. For the remainder of our sales orders, we perform “first‑stage” processing, which is generally not labor intensive as we are simply cutting the metal to size. Because of this, the amount of related labor and overhead, including depreciation and amortization, areis not significant and areis excluded from our cost of sales. Therefore, our cost of sales is primarilysubstantially comprised of the cost of the material we sell. We use gross profit as shown above as a measure of operating performance. Gross profit is an important operating and financial measure, as fluctuations in gross profit can have a significant impact on our earnings. Gross profit, as presented, is not necessarily comparable with similarly titled measures for other companies. |
Quarterly and year‑to‑date computations of per share amounts are made independently. Therefore, the sum of per share amounts for the quarters may not agree with per share amounts for the years shown elsewhere in this Annual Report on Form 10‑K.
RELIANCE STEEL & ALUMINUM CO.
SCHEDULE II—VALUATION AND QUALIFYING ACCOUNTSACCOUNTS
(in millions)
| | | | | | | | | | | | | | | | | | | | | | |
| | | | Additions | | | | Amounts | | | | | | Additions | | | | Amounts | | |
| | Balance at | | Charged to | | | | Charged to | | Balance at | | Balance at | | Charged to | | | | Charged to | | Balance at |
| | Beginning | | Costs and | | | | Other | | End of | | Beginning | | Costs and | | | | Other | | End of |
Description | | of Period | | Expenses | | Deductions | | Accounts | | Period | | of Period | | Expenses | | Deductions | | Accounts | | Period |
Year Ended December 31, 2013 | | | | | | | | | | | | |
Allowance for doubtful accounts | | $ | 20.5 | | $ | 4.0 | | $ | 10.4 | (1) | $ | 4.8 | | $ | 18.9 | |
Year Ended December 31, 2014 | | | | | | | | | | | | |
Allowance for doubtful accounts | | $ | 18.9 | | $ | 4.6 | | $ | 5.2 | (1) | $ | — | | $ | 18.3 | |
Year Ended December 31, 2015 | | | | | | | | | | | | | | | | | | | | | | |
Allowance for doubtful accounts | | $ | 18.3 | | $ | 4.7 | | $ | 6.7 | (1) | $ | — | | $ | 16.3 | | $ | 18.3 | | $ | 4.7 | | $ | 6.7 | (1) | $ | — | | $ | 16.3 |
Year Ended December 31, 2016 | | | | | | | | | | | | |
Allowance for doubtful accounts | | | $ | 16.3 | | $ | 5.2 | | $ | 6.5 | (1) | $ | 0.3 | | $ | 15.3 |
Year Ended December 31, 2017 | | | | | | | | | | | | |
Allowance for doubtful accounts | | | $ | 15.3 | | $ | 6.7 | | $ | 6.5 | (1) | $ | — | | $ | 15.5 |
| (1) | | Uncollectible accounts written off. |
See accompanying report of independent registered public accounting firm.
Item 9. Changes in and Disagreements with Accountants on Accounting and Financial Disclosure
None.
Item 9A. Controls and ProceduresProcedures
Disclosure Controls and Procedures
We maintain disclosure controls and procedures, which are designed to ensure that information required to be disclosed in the reports we file or submit under the Securities Exchange Act of 1934, as amended, is recorded, processed, summarized and reported within time periods specified in the Securities and Exchange Commission’s rules and forms, and that such information is accumulated and communicated to our management, including our chief executive officer, or CEO, and chief financial officer, or CFO, as appropriate to allow timely decisions regarding required disclosure. In designing and evaluating the disclosure controls and procedures, management recognizes that any controls and procedures, no matter how well designed and operated, can provide only reasonable assurance of achieving the desired control objectives, and management is required to apply its judgment in evaluating the cost‑benefit relationship of possible controls and procedures.
Under the supervision and with the participation of the Company’s management, including our CEO and CFO, an evaluation was performed on the effectiveness of the design and operation of our disclosure controls and procedures as of the end of the period covered by this annual report. Based on that evaluation, our management, including our CEO and CFO, concluded that our disclosure controls and procedures were effective as of December 31, 20152017 at a reasonable assurance level.
Changes in Internal Control Over Financial Reporting
An evaluation was also performed under the supervision and with the participation of our management, including our CEO and CFO, of any change in our internal control over financial reporting that occurred during our last fiscal quarter and that has materially affected, or is reasonably likely to materially affect, our internal control over financial reporting. That evaluation did not identify any change in our internal control over financial reporting that occurred during our last fiscal quarter and that has materially affected, or is reasonably likely to materially affect, our internal control over financial reporting.
Management’s Report on Internal Control Over Financial Reporting
Our management is responsible for establishing and maintaining adequate internal control over financial reporting. All internal control systems, no matter how well designed, have inherent limitations. Therefore, even those systems determined to be effective can provide only reasonable assurance with respect to financial statement preparation and presentation.
Under the supervision and with the participation of our management, including our CEO and CFO, we conducted an evaluation of the effectiveness of our internal control over financial reporting based on the framework in Internal Control—Integrated Framework (2013) issued by the Committee of Sponsoring Organizations of the Treadway Commission. Based on our evaluation under the framework in Internal Control—Integrated Framework (2013), our management concluded that our internal control over financial reporting was effective as of December 31, 2015.2017.
The effectiveness of our internal control over financial reporting as of December 31, 20152017 has been audited by KPMG LLP, an independent registered public accounting firm, as stated in their audit report, which is included herein.
Item 9B. Other InformationInformation
None.
REPORT OF INDEPENDENT REGISTERED PUBLIC ACCOUNTING FIRM
Report of Independent Registered Public Accounting Firm
The Board of Directors and Stockholders
Reliance Steel & Aluminum Co.:
Opinion on Internal Control Over Financial Reporting
We have audited Reliance Steel & Aluminum Co.’s (the “Company”) internal control over financial reporting as of December 31, 2015,2017, based on criteria established in Internal Control—Control – Integrated Framework (2013) issued by the Committee of Sponsoring Organizations of the Treadway Commission (COSO). Reliance Steel & Aluminum Co.’sCommission. In our opinion, the Company maintained, in all material respects, effective internal control over financial reporting as of December 31, 2017, based on criteria established in Internal Control – Integrated Framework (2013) issued by the Committee of Sponsoring Organizations of the Treadway Commission.
We also have audited, in accordance with the standards of the Public Company Accounting Oversight Board (United States) (“PCAOB”), the consolidated balance sheets of the Company as of December 31, 2017 and 2016, the related consolidated statements of income, comprehensive income, equity, and cash flows for each of the years in the three-year period ended December 31, 2017, and the related notes and financial statement schedule of valuation and qualifying accounts (collectively, the “consolidated financial statements”), and our report dated February 28, 2018 expressed an unqualified opinion on those consolidated financial statements.
Basis for Opinion
The Company’s management is responsible for maintaining effective internal control over financial reporting and for its assessment of the effectiveness of internal control over financial reporting, included in the accompanying Management’s Report on Internal Control Over Financial Reporting. Our responsibility is to express an opinion on the Company’s internal control over financial reporting based on our audit.
We are a public accounting firm registered with the PCAOB and are required to be independent with respect to the Company in accordance with the U.S. federal securities laws and the applicable rules and regulations of the Securities and Exchange Commission and the PCAOB.
We conducted our audit in accordance with the standards of the Public Company Accounting Oversight Board (United States).PCAOB. Those standards require that we plan and perform the audit to obtain reasonable assurance about whether effective internal control over financial reporting was maintained in all material respects. Our audit of internal control over financial reporting included obtaining an understanding of internal control over financial reporting, assessing the risk that a material weakness exists, and testing and evaluating the design and operating effectiveness of internal control based on the assessed risk. Our audit also included performing such other procedures as we considered necessary in the circumstances. We believe that our audit provides a reasonable basis for our opinion.
Definition and Limitations of Internal Control Over Financial Reporting
A company’s internal control over financial reporting is a process designed to provide reasonable assurance regarding the reliability of financial reporting and the preparation of financial statements for external purposes in accordance with generally accepted accounting principles. A company’s internal control over financial reporting includes those policies and procedures that (1) pertain to the maintenance of records that, in reasonable detail, accurately and fairly reflect the transactions and dispositions of the assets of the company; (2) provide reasonable assurance that transactions are recorded as necessary to permit preparation of financial statements in accordance with generally accepted accounting principles, and that receipts and expenditures of the company are being made only in accordance with authorizations of management and directors of the company; and (3) provide reasonable assurance regarding prevention or timely detection of unauthorized acquisition, use, or disposition of the company’s assets that could have a material effect on the financial statements.
Because of its inherent limitations, internal control over financial reporting may not prevent or detect misstatements. Also, projections of any evaluation of effectiveness to future periods are subject to the risk that controls may become inadequate because of changes in conditions, or that the degree of compliance with the policies or procedures may deteriorate.
In our opinion, Reliance Steel & Aluminum Co. maintained, in all material respects, effective internal control over financial reporting as of December 31, 2015, based on criteria established in Internal Control—Integrated Framework (2013) issued by the Committee of Sponsoring Organizations of the Treadway Commission (COSO).
We also have audited, in accordance with the standards of the Public Company Accounting Oversight Board (United States), the consolidated balance sheets of Reliance Steel & Aluminum Co. and subsidiaries as of December 31, 2015 and 2014, and the related consolidated statements of income, comprehensive income, equity, and cash flows for each of the years in the three‑year period ended December 31, 2015 and the schedule of valuation and qualifying accounts, and our report dated February 25, 2016, expressed an unqualified opinion on those consolidated financial statements and the financial statement schedule.
Los Angeles, California
February 25, 2016
28, 2018
PART III
Item 10. Directors, Executive Officers and Corporate Governance
The narrative and tabular information included under the caption “Management” and under the caption “Compliance with Section 16(a)” of the Proxy Statement for the Annual Meeting of Stockholders to be held on May 18, 201616, 2018 (the “Proxy Statement”) are incorporated herein by reference.
Item 11. Executive CompensationCompensation
The narrative and tabular information, including footnotes thereto, included under the caption “Executive Compensation” of the Proxy Statement are incorporated herein by reference.
Item 12. Security Ownership of Certain Beneficial Owners and Management and Related Stockholder Matters
The narrative and tabular information, including footnotes thereto, included under the caption “Securities Ownership of Certain Beneficial Owners and Management” of the Proxy Statement are incorporated herein by reference.
Item 13. Certain Relationships and Related Transactions,, and Director Independence
The narrative information included under the caption “Certain Transactions” of the Proxy Statement is incorporated herein by reference.
Item 14. Principal Accounting Fees and ServicesServices
The narrative and tabular information included under the caption “Independent Registered Public Accounting Firm” of the Proxy Statement is incorporated herein by reference.
PART IV
Item 15. Exhibits, Financial Statement SchedulesSchedules
| (a) | | The following documents are filed as part of this report: |
| (1) | | Financial Statements (included in Item 8). |
Report of Independent Registered Public Accounting Firm
Consolidated Balance Sheets
Consolidated Statements of Income
Consolidated Statements of Comprehensive Income
Consolidated Statements of Equity
Consolidated Statements of Cash Flows
Notes to the Consolidated Financial Statements
Quarterly Results of Operations (Unaudited)
| (2) | | Financial Statement Schedules |
Schedule II—Valuation and Qualifying Accounts
All other schedules have been omitted since the required information is not significant or is included in the Consolidated Financial Statements or notes thereto or is not applicable.
| | | | | | | | |
| | | | Incorporated by Reference |
Exhibit
Number | | Description | | Form | | Exhibit | | Filing Date/ Period End Date |
3.01 | | Registrant’s Restated Certificate of Incorporation. | | 8-K | | 3.1 | | 6/1/2015 |
3.02 | | Registrant’s Amended and Restated Bylaws. | | 8-K | | 3.2 | | 6/1/2015 |
3.03 | | First Amendment, dated February 16, 2016 to Registrant’s Amended and Restated Bylaws. | | 8-K | | 3.1 | | 2/16/2016 |
4.01 | | Indenture dated November 20, 2006 by and among Registrant, the Subsidiary Guarantors party thereto, and Wells Fargo Bank, National Association, as Trustee. | | 8-K | | 10.01 | | 11/20/2006 |
4.02 | | Forms of the Notes and the Exchange Notes under the Indenture. | | 8-K | | 10.02 | | 11/20/2006 |
4.03 | | Indenture dated April 12, 2013 by and among Registrant, the Subsidiary Guarantors party thereto, and Wells Fargo Bank, National Association, as Trustee. | | 8-K | | 4.1 | | 4/12/2013 |
4.04 | | First Supplemental Indenture dated April 12, 2013 by and among Registrant, the Subsidiary Guarantors party thereto, and Wells Fargo Bank, National Association, as Trustee. | | 8-K | | 4.2 | | 4/12/2013 |
10.01 | | Registrant’s Form of Indemnification Agreement for officers and directors. | | 8-K | | 10.1 | | 2/16/2016 |
10.02 | | Registrant’s Supplemental Executive Retirement Plan dated January 1, 1996. | | 10-K | | 10.06 | | 12/31/1996 |
See the Exhibit Index immediately following the signature page
| | | | | | | | |
| | | | Incorporated by Reference |
Exhibit
Number | | Description | | Form | | Exhibit | | Filing Date/ Period End Date |
10.03 | | Registrant’s Amended and Restated Directors Stock Option Plan. | | DEF 14A | | Appendix A | | 5/18/2005 |
10.04 | | Registrant’s Amended and Restated Stock Option and Restricted Stock Plan. | | S-8 | | 4.1 | | 8/4/2006 |
10.05 | | Form of Incentive/Non-Qualified Stock Option Agreement. | | S-8 | | 4.2 | | 8/4/2006 |
10.06 | | Form of Restricted Stock Agreement. | | S-8 | | 4.3 | | 8/4/2006 |
10.07 | | Registrant’s Amendment No. 1 to Amended and Restated Stock Option and Restricted Stock Plan. | | 8-K | | 4.1 | | 5/15/2013 |
10.08 | | Registrant’s Amended and Restated Deferred Compensation Plan effective January 1, 2013. | | 10-K | | 10.09 | | 12/31/2012 |
10.09 | | Registrant’s Supplemental Executive Retirement Plan (Amended and Restated effective as of January 1, 2009). | | 10-K | | 10.15 | | 12/31/2008 |
10.10 | | Registrant’s Directors Equity Plan. | | DEF 14A | | Appendix A | | 5/18/2011 |
10.11 | | Form of Restricted Stock Unit Award Agreement – ROA Performance. | | 10-Q | | 10.3 | | 3/31/2016 |
10.12 | | Form of Restricted Stock Unit Award Agreement – Service. | | 10-Q | | 10.4 | | 3/31/2016 |
10.13 | | Credit Agreement dated as of September 30, 2016 by and among Registrant, Bank of America N.A., as Administrative Agent, Issuing Lender and Swing Line Lender, and the other lenders party thereto. | | 8-K | | 10.1 | | 10/4/2016 |
10.14 | | Form of Third Amended and Restated Credit Agreement dated as of April 4, 2013 by and among Registrant, Bank of America, N.A., as Administrative Agent, Issuing Lender and Swing Line Lender, and the other lenders party thereto. | | 8-K | | 4.1 | | 4/4/2013 |
10.15 | | Registrant’s Amended and Restated 2015 Incentive Award Plan. | | 8-K | | 10.1 | | 5/27/2015 |
21 | | Subsidiaries of Registrant. | | | | | | |
23.1 | | Consent of Independent Registered Public Accounting Firm—KPMG LLP. | | | | | | |
24 | | Power of Attorney. | | | | | | |
31.1* | | Certification of Chief Executive Officer pursuant to Rule 13a‑14(a) and Rule 15d‑14(a) of the Securities Exchange Act, as amended. | | | | | | |
31.2* | | Certification of Chief Financial Officer pursuant to Rule 13a‑14(a) and Rule 15d‑14(a) of the Securities Exchange Act, as amended. | | | | | | |
32** | | Certification of Chief Executive Officer and Chief Financial Officer Pursuant to 18 U.S.C. 1350, as adopted pursuant to Section 906 of the Sarbanes‑Oxley Act of 2002. | | | | | | |
101.INS* | | XBRL Instance Document. | | | | | | |
101.SCH* | | XBRL Taxonomy Extension Schema Document. | | | | | | |
101.CAL* | | XBRL Taxonomy Calculation Linkbase Document. | | | | | | |
101.DEF* | | XBRL Taxonomy Extension Definition Linkbase. | | | | | | |
101.LAB* | | XBRL Taxonomy Label Linkbase Document. | | | | | | |
101.PRE* | | XBRL Taxonomy Presentation Linkbase Document. | | | | | | |
| | | | | | |
* Filed herewith | | | | | | |
** Furnished herewith. | | | | | | |
Item 16. Form 10‑K.10-K Summary
None.
SIGNATURES
Pursuant to the requirements of Section 13 or 15(d) of the Securities Exchange Act of 1934, the Registrant has duly caused this Annual Report on Form 10‑K to be signed on its behalf by the undersigned, thereunto duly authorized, in the City of Los Angeles, State of California, on this 25th day of February 2016.28, 2018.
| RELIANCE STEEL & ALUMINUM CO. |
| By: | /s/ Gregg J. Mollins |
| | Gregg J. Mollins |
| | President and Chief Executive Officer |
POWER OF ATTORNEY
The officers and directors of Reliance Steel & Aluminum Co. whose signatures appear below hereby constitute and appoint David H. Hannah and Gregg J. Mollins and Karla R. Lewis, or either of them, to act severally as attorneys‑in‑fact and agents, with power of substitution and resubstitution, for each of them in any and all capacities, to sign any amendments to this report and to file the same, with exhibits thereto, and other documents in connection therewith, with the Securities and Exchange Commission, hereby ratifying and confirming all that said attorneys‑in‑fact, or substitute or substitutes, may do or cause to be done by virtue hereof.
Pursuant to the requirements of the Securities Exchange Act of 1934, as amended, this report has been signed below by the following persons in the capacities and on the dates indicated.
Signatures | | Title | | Date |
| | | | |
/s/ David H. HannahMark V. Kaminski | | Executive Chairman of the Board; Director
| | February 25, 201628, 2018 |
David H. HannahMark V. Kaminski
|
| | | | |
/s/ Gregg J. Mollins | | President and Chief Executive Officer; Director (Principal Executive Officer) | | February 25, 201628, 2018 |
Gregg J. Mollins |
| | | | |
/s/ Karla R. Lewis | | Senior Executive Vice President and Chief Financial Officer (Principal Financial Officer; Principal Accounting Officer) | | February 25, 201628, 2018 |
Karla R. Lewis |
| | | | |
/s/ Sarah J. Anderson | | Director | | February 25, 201628, 2018 |
Sarah J. Anderson |
| | | | |
/s/ Karen W. Colonias | | Director | | February 28, 2018 |
Karen W. Colonias |
| | | | |
/s/ John G. Figueroa | | Director | | February 25, 201628, 2018 |
John G. Figueroa |
| | | | |
/s/ Thomas W. Gimbel | | Director | | February 25, 201628, 2018 |
Thomas W. Gimbel |
| | | | |
/s/ David H. Hannah | | Director | | February 28, 2018 |
David H. Hannah |
| | | | |
/s/ Douglas M. Hayes | | Director | | February 25, 201628, 2018 |
Douglas M. Hayes |
| | | | |
/s/ Mark V. KaminskiRobert A. McEvoy | | Director | | February 25, 2016 |
Mark V. Kaminski
|
| | | | |
/s/ Robert A. Mcevoy
| | Director
| | February 25, 201628, 2018
|
Robert A. McEvoy |
| | | | |
/s/ Andrew G. Sharkey III | | Director | | February 25, 201628, 2018 |
Andrew G. Sharkey III |
| | | | |
/s/ Leslie a. WaiteDouglas W. Stotlar | | Director | | February 25, 201628, 2018 |
Leslie A. WaiteDouglas W. Stotlar
|
EXHIBIT INDEX
Exhibit
Number
| | Description
| | Sequentially
Numbered
Page
|
2.02 | | Agreement and Plan of Merger, dated as of February 6, 2013, by and among Registrant, RSAC Acquisition Corp. and Metals USA Holdings Corp.(1)
| | |
3.01 | | Registrant’s Restated Certificate of Incorporation.(2)
| | |
3.02 | | Registrant’s Amended and Restated Bylaws.(3)
| | |
3.03 | | First Amendment, dated February 16, 2016 to Registrant’s Amended and Restated Bylaws.(4)
| | |
4.01 | | Indenture dated November 20, 2006 by and among Registrant, the Subsidiary Guarantors named therein and Wells Fargo Bank, a National Association and Forms of the Notes and the Exchange Notes under the Indenture.(5)
| | |
4.02 | | Indenture dated April 12, 2013 by and among Registrant, the Subsidiary Guarantors party thereto, and Wells Fargo Bank, National Association, as trustee.(6)
| | |
4.03 | | First Supplemental Indenture, dated April 12, 2013, by and among Registrant, the Subsidiary Guarantors party thereto, and Wells Fargo Bank, National Association, as trustee.(7)
| | |
10.01 | | Registrant’s Form of Indemnification Agreement for officers and directors.(8)
| | |
10.02 | | Registrant’s Supplemental Executive Retirement Plan dated January 1, 1996.(9)
| | |
10.03 | | Registrant’s Amended and Restated Directors Stock Option Plan.(10)
| | |
10.04 | | Registrant’s Amended and Restated Stock Option and Restricted Stock Plan and the Forms of agreements related thereto.(11)
| | |
10.05 | | Registrant’s Amendment No. 1 to Amended and Restated Stock Option and Restricted Stock Plan.(12)
| | |
10.06 | | Corporate Officers Bonus Plan effective January 1, 2008.(13)
| | |
10.07 | | Registrant’s Amended and Restated Deferred Compensation Plan effective January 1, 2013.(14)
| | |
10.08 | | Registrant’s Supplemental Executive Retirement Plan (Amended and Restated effective as of January 1, 2009).(15)
| | |
10.09 | | Registrant’s Directors Equity Plan.(16)
| | |
10.10 | | Forms of Restricted Stock Unit Agreements.(17)
| | |
10.11 | | Earle M. Jorgensen Company 2004 Stock Incentive Plan, First Amendment, Assumption and Amendment Agreement, and the Forms of agreements related thereto.(18)
| | |
10.12 | | Form of Third Amended and Restated Credit Agreement dated as of April 4, 2013 by and among the Registrant, Bank of America, N.A., as Administrative Agent, Issuing Lender and Swing Line Lender, and the lenders identified therein.(19)
| | |
10.13 | | Registrant’s Amended and Restated 2015 Incentive Award Plan (20)
| | |
21 | | Subsidiaries of Registrant.
| | |
23.1 | | Consent of Independent Registered Public Accounting Firm—KPMG LLP.
| | |
24 | | Power of Attorney.(21)
| | |
31.1 | | Certification of Chief Executive Officer pursuant to Rule 13a‑14(a) and Rule 15d‑14(a) of the Securities Exchange Act, as amended.
| | |
31.2 | | Certification of Chief Financial Officer pursuant to Rule 13a‑14(a) and Rule 15d‑14(a) of the Securities Exchange Act, as amended.
| | |
32 | | Certification of Chief Executive Officer and Chief Financial Officer Pursuant to 18 U.S.C. 1350, as adopted pursuant to Section 906 of the Sarbanes‑Oxley Act of 2002.
| | |
101.INS
| | XBRL Instance Document.
| | |
101.SCH
| | XBRL Taxonomy Extension Schema Document.
| | |
101.CAL
| | XBRL Taxonomy Calculation Linkbase Document.
| | |
101.DEF
| | XBRL Taxonomy Extension Definition Linkbase.
| | |
101.LAB
| | XBRL Taxonomy Label Linkbase Document.
| | |
101.PRE
| | XBRL Taxonomy Presentation Linkbase Document.
| | |
| (1)
| | Incorporated by reference from Exhibit 2.1 to Registrant’s Current Report on Form 8‑K dated February 6, 2013.
|
| (2)
| | Incorporated by reference from Exhibit 3.1 to Registrant’s Current Report on Form 8-K dated June 1, 2015.
|
| (3)
| | Incorporated by reference from Exhibit 3.2 to Registrant’s Current Report on Form 8‑K dated June 1, 2015.
|
| (4)
| | Incorporated by reference from Exhibit 3.1 to Registrant’s Current Report on Form 8‑K dated February 16, 2016.
|
| (5)
| | Incorporated by reference from Exhibits 10.01 and 10.02 to Registrant’s Current Report on Form 8‑K dated November 20, 2006.
|
| (6)
| | Incorporated by reference from Exhibit 4.1 to Registrant’s Current Report on Form 8‑K dated April 12, 2013.
|
| (7)
| | Incorporated by reference from Exhibit 4.2 to Registrant’s Current Report on Form 8‑K dated April 12, 2013.
|
| (8)
| | Incorporated by reference from Exhibit 10.1 to Registrant’s Current Report on Form 8‑K dated February 16, 2016.
|
| (9)
| | Incorporated by reference from Exhibit 10.06 to Registrant’s Annual Report on Form 10-K for the year ended December 31, 1996.
|
| (10)
| | Incorporated by reference from Appendix A to Registrant’s Proxy Statement for Annual Meeting of Shareholders held May 18, 2005.
|
| (11)
| | Incorporated by reference from Exhibits 4.1, 4.2 and 4.3 to Registrant’s Registration Statement on Form S‑8 filed on August 4, 2006 as Commission File No. 333‑136290.
|
| (12)
| | Incorporated by reference from Exhibit 4.1 to Registrant’s Current Report on Form 8‑K dated May 15, 2013.
|
| (13)
| | Incorporated by reference from Appendix A to Registrant’s Proxy Statement for Annual Meeting of Shareholders held May 21, 2008.
|
| (14)
| | Incorporated by reference from Exhibit 10.09 to Registrant’s Annual Report on Form 10-K for the year ended December 31, 2012.
|
| (15)
| | Incorporated by reference from Exhibit 10.15 to Registrant’s Annual Report on Form 10-K for the year ended December 31, 2008.
|
| (16)
| | Incorporated by reference from Appendix A to Registrant’s Proxy Statement for Annual Meeting of Shareholders held May 18, 2011.
|
| (17)
| | Incorporated by reference from Exhibit 10.01 to Registrant’s Quarterly Report on Form 10‑Q for the quarter ended March 31, 2012.
|
| (18)
| | Incorporated by reference from Exhibits 4.1 through 4.7 to Registrant’s Registration Statement on Form S‑8 filed on April 11, 2006 as Commission File No. 333‑133204.
|
| (19)
| | Incorporated by reference from Exhibit 4.1 to Registrant’s Current Report on Form 8‑K dated April 4, 2013.
|
| (20)
| | Incorporated by reference from Exhibit 10.1 to Registrant’s Current Report on Form 8‑K dated May 27, 2015.
|
| (21)
| | Set forth on page 94 of this report.
|