Washington,
| ||
| ANNUAL REPORT PURSUANT TO SECTION 13 OR 15(d) OF THE SECURITIES EXCHANGE ACT OF 1934 | |
| |
| |
| TRANSITION REPORT PURSUANT TO SECTION 13 OR 15(d) OF THE SECURITIES EXCHANGE ACT OF 1934 |
| |
Number: 001-32622
|
| ||
Delaware | 20‑0723270 | ||
(State or other jurisdiction of | (I.R.S. Employer Identification No.) | ||
7250 S. Tenaya Way, Suite 100, Las Vegas, Nevada | 89113 | ||
(Address of principal executive offices) | (Zip Code) | ||
| Title of each class | Name of each exchange on which registered | |||
Common Stock, $0.001 par value per share | New York Stock Exchange | |||
| Large accelerated filer | ¨ | Accelerated filer |
| x | |||||
| Non-accelerated filer | ¨ | Smaller reporting company | ¨ | ||||||
| Emerging growth company | ¨ | ||||||||
2019.
2018
2
3
consider the specific risk factors described herein and in “Item 1A. Risk Factors” of this Annual Report on Form 10-K and not to place undue reliance on the forward-looking statements contained herein, which are based only on information currently available to us and speak only as of the date hereof.
The Company undertakes
4
On December 19, 2014, Holdings completed the acquisition of
Holdings was formed as a Delaware limited liability company on February 4, 2004 and was converted to a Delaware corporation on May 14, 2004. Our principal executive offices are located at 7250 South Tenaya Way, Suite 100, Las Vegas, Nevada 89113. Our telephone number is (800) 833-7110. Our website address is www.everi.com. The information on our website is not part of this Annual Report on Form 10-K or our other filings with the SEC.
Our operating segments were previously organized and managed under five business segments: (a) Cash Advance, (b) ATM, (c) Check Services, (d) Games, and (e) Other. During the first quarter of 2015, we changed our organizational structure as part of our transformation to a Games and Payments company providing solutions to the gaming industry. Accordingly, since the first quarter of 2015, we have reported
A summaryAnalysis of our segment financial information is contained inFinancial Condition and Results of Operations — Results of Operations” and “Note 19.18 — Segment Information” of our notes to consolidated financial statements included elsewhere in this Annual Report on Form 10-K. Prior to the Merger, Everi Games operated in a single segment.
5
percentage of the net win per day generated by the leased gaming equipment or a fixed daily fee based on the number of player terminals installed at the facility.fee. We also make direct sales of player terminals, licenses, back office systems and other related equipmentcontinue to customers. The majority of these direct sales contracts are for some combination of gaming equipment, player terminals, content, system software, license fees, ancillary equipment and maintenance.
With respect toexpand our Games business, we have expanded our licensinggame placements into new jurisdictions, increasedincrease investment in research and development, and introducedintroduce premium game products (which typically include high definition (“HD”) dual-screens, liquid crystal display (“LCD”) panels,hardware and red green blue (“RGB”) top box lighting).theme content. From itsour historical focus on placement of standard games into the Oklahoma and Washington tribal markets, Everi Games has diversified its installed base in recent years with entry into new commercial and tribal markets as well as the development and placement of premium products.markets. Everi Games has grown premium game installations with approximately 1,7502,859 units installed (representing more than 13%approximately 20.4% of our installed base)base as of December 31, 2018) since entering the category threeapproximately six years ago. Development
Everi Games provides the New York LotteryState Gaming Commission with an accounting and central determinant system for the VLTs in operation at licensed State of New York racetracks.gaming facilities. In January 2018, an amendment to the agreement between Everi Games and the New York State Gaming Commission was approved and became effective. Under this amendment, Everi Games will continue to provide and maintain the central determinant system for the New York Lottery through December 2019. As of December 31, 2015,2018, this central determinant system is connected to approximately 18,00018,500 VLTs and electronic table games (“ETGs”) provided by third-party providers and has the ability to interface with, provide outcomes to, and manage the VLTs as well as interface with and manage the 1,750 ETGs.VLTs. Pursuant to itsour agreement with the New York Lottery, Everi Games receivesState Gaming Commission, we receive a portion of the network-wide net win (generally, cash-in less prizes paid) per day in exchange for provision and maintenance of the central determinant system. In February 2009, the New York Lottery awarded Everi Games a contract extension through December 2017 and provided Everi Games an opportunity to expand its network as the New York Lottery licenses additional race track gaming facilities or the expansion of existing facilities in the state. Everi GamesWe also providesprovide central determinant system technology to Native American tribes in the State of Washingtonother licensed jurisdictions for which it receiveswe receive a portion of the revenue generated from the VLTs connected to the system.
6
High Rise Games. Our current premium participation slot game series features one of the industry’s largest top boxes, a vertically oriented 37-inch LCD screen that eliminates overhead signage, creates new possibilities for gaming action, offers LED lights around the perimeter of the top box screen, as well as unique bonus features. Four themes are being unveiled on the High Rise Games series, including Queen of Diamonds, Pirates Skull & Bones, The Money Man Big Cash Spin, and Smokin’ Hot Diamonds. Queen of Diamonds is a 9-Reel, 32-Line theme featuring our new Jackpot Jump feature. Once any jackpot trigger is hit, players pick from one of four cards to find a diamond-suited Jackpot Jump card or a Queen of Diamonds card, which will “jump” the progressive prize by one or two tiers, respectively.
PlatinumEmpire MPX and The Texan HDX(E43). The award-winning PlatinumEmpire MPX represents adebuted in April 2017with the launch of the Company’s first premium participation cabinet on its WAP, and game series that offersthen launched its for-sale category Empire MPX products in December 2017.The new cabinet features a 40-inchsingle-screen 43-inch monitor, full 1080p HD graphics capabilities, and a fully-customizable touchscreen button panel, game-controlled runway lighting and six custom speakers, including two speakerspanel. Its efficient design allows for tighter bank configuration. Empire MPX licensed video content includes Casablanca™, Penn & Teller®, Buffy the Vampire Slayer™, Singin’ in the fully integrated interactive sound chair with RainEarthquake Shakers™, and technology. Willie Nelson™.
Payments Products and Services
The We conduct our FinTech segment business based on results generated from the following is a description of the markets we addressmajor revenue streams: (a) Cash Access; (b) Equipment; and (c) Information Services and Other.
Cash Access services, we offer the following:
7
pay a percentage of the service feethat we receive from the patron and, in some circumstances, a portion of the reverse interchange fees we receive, as a commission to our gaming establishment customers for the right to operate on their premises.
8
Our principal Payments products and services consist of the following:
Casino Cash Plus 3-in-1 ATMsare unmanned, cash-dispensing machines that enable ATM cash withdrawals, POS debit card cash access transactions, and credit card cash access transactions directly or using our patented 3-in-1 Rollover functionality. Most financial institutions that issue debit cards impose daily ATM withdrawal limits, and, in manysome instances, aggregate and count Friday, Saturday, and Sunday as a single day in calculating such limits. If a patron has reached his or her daily ATM limit, our patented 3-in-1 Rollover functionality automatically enables the patron to obtain funds via a POS debit card cash access transaction or a credit card cash access transaction instead.
our Equipment, we offer the following:
Jackpot kioskscash handling and transaction processing. These products are multi-function employee kiosks that allow casino personneldesigned to immediatelybe integrated with our cash access products and cage compliance software ensuring compliance with anti-money laundering regulations, and provide an automated way to process and dispense taxable jackpotscommon tax forms, such as the Internal Revenue Service Form W-2G or Form 1042-S. In addition, we offer equipment in the form of standalone, non-ATM terminals that perform authorizations for credit card cash tickets oraccess and POS debit card cash access transactions. Our kiosk solutions include the following products:
Everi Compliance
We also offer:
|
|
|
|
|
|
9
Manufacturing
We utilize contract manufacturers to produce the cabinets that make up our electronic gaming machines (“EGMs”) and our, kiosk products, as well asand other sub-assemblies. We have assembly facilities in Austin, Texas and Las Vegas, Nevada, where we assemble the EGMs and our kiosk products, which include the cabinets, computer assemblies, LCD screens, printers, bill validators and acceptors, and other wiring and harnesses. We believe that our sources of supply of component parts and raw materials for our products are generally adequate and we have few sole-sourced parts.
We
Our sales and marketing efforts are directed by a team of customer service executives, each of whom has business development responsibility for gaming establishments in specified geographic regions.
In
10
the volume of play generated by a product and, accordingly, the revenues generated for our customers. To drive customer demand and improve product attractiveness, to end users, we are continually workingwork to develop new game themes, gaminggame engines, hardware platforms, and systems that appeal to gaming patrons, all while working to release these new products to the marketplace in a timely manner.
In
Proprietary Rights
In addition to competing with various providers of cash access services, FinTech has experienced competition from either those same providers or stand-alone providers of anti-money laundering compliance products and self-service kiosks for ticket redemption and jackpot redemption.
11
Available Information
REGULATION
nature of any noncompliance, our failure to comply with such laws, regulations, and ordinances may result in the suspension or revocation of any license, registration, or other approval, a partial or complete cessation of our business, seizure of our assets, as well as the imposition of civil fines and criminal penalties.
In general,
Moreover, ouronly.
We believe Moreover, there are no guarantees that we arewill be successful in substantial compliance withobtaining and maintaining all materialnecessary licenses, permits, and approvals and to continue to hold other necessary gaming licenses, permits, and financial institution laws applicableapprovals to conduct our business. We can give no assurance, however, that our business activities or the activities of our customers in the gaming industry will not be subject to any regulatory or legal enforcement proceedings in the future and a violation of applicable gaming lawsbusinesses either as currently being conducted by us or any ofto expand our subsidiaries could have a material adverse effect on our financial condition, prospects and results of operations. Depending on the nature of any noncompliance, our failure to comply with such laws, regulations, and ordinances may result in the suspension or revocation of any license, registration, or other approval, a partial or complete cessation of our business, seizure of our assets, as well as the imposition of civil fines and criminal penalties.
12
A description of the material regulations to which we are subject is set forth below.
Federal Regulation. At the federal level, we are subject to two key pieces of legislation. Our Native American customers are regulated by the National Indian Gaming Commission (“NIGC”), which was established by the Indian Gaming Regulatory Act of 1988 (the “IGRA”(“IGRA”). The NIGC has regulatory authority over certain aspects of Native American gaming and defines the boundaries of our dealings with the Native American marketplace and the level of regulatory authority to which these games are subject. IGRA establishes three classes of gaming, each with a different regulatory framework:
| ||||||||
| Class | Type of Games | Regulatory Oversight | ||||||
I | Social gaming for minimal prizes and traditional Indian gaming. | Exclusive regulation and oversight by tribal governments. | ||||||
II | Bingo (both in traditional and electronic form). | Regulation by tribal governments with NIGC oversight. | ||||||
III | Casino style games (including slot machines, blackjack, craps, and roulette). | Must be permitted by the state in which the tribe is located. The state and the tribe must have negotiated a compact approved by NIGC, and the tribe must have adopted a gaming ordinance approved by the NIGC. | ||||||
State and Tribal Gaming Commissions. We are regulated by gaming commissions or similar authorities at the state or tribal level as either a (i) manufacturer of gaming devices, in those jurisdictions where we manufacture gaming devices and systems, (ii) supplier of “associated equipment,” in those jurisdictions where we sell and service fully integrated kiosks and jackpot kiosks, and/or (ii) non-gaming supplier or vendor, in those jurisdictions where we provide cash access and Central Credit services only.
The process of obtaining necessary licenses, registrations, or other approvals often involves substantial disclosure of confidential or proprietary information about us and our officers, directors, key personnel and, in certain instances, beneficial owners of our debt and/or equity securities, and requires a determination by the regulators as to our suitability as a manufacturer, supplier, or vendor to gaming establishments. Such suitability examinations may also generally include the following:
|
|
|
|
|
|
|
|
|
|
13
These regulatory obligations are imposed upon gaming-related manufacturers, suppliers, or vendors on an ongoing basis, and there are no guaranties that we will be successful in obtaining and maintaining all necessary licenses, permits, and approvals and to continue to hold other necessary gaming licenses, permits, and approvals to conduct our businesses as currently being conducted by us. The expansion of our businesses, the introduction of new games, systems, products or services, or changes to applicable rules and regulations may result in additional regulatory or licensing requirements being imposed upon us. Many Gaming Authorities will require us to submit software and other key technology components of our gaming devices and systems, as well as our fully integrated kiosks and jackpot kiosks, to government or third-party gaming laboratories for testing and certification prior to deploying such games, systems, and devices in a particular gaming jurisdiction.
Gaming regulatory authorities have broad discretion and may require any beneficial holder of our securities, regardless of the number of shares of common stock and/or amount of debt securities owned, to file an application, make personal or confidential disclosures, be investigated, and be subject to a determination of suitability. Many jurisdictions require any person who acquires beneficial ownership of more than a certain percentage of voting securities of a gaming company and, in some jurisdictions, non-voting securities, typically 5%, to report the acquisition to Gaming Authorities, and Gaming Authorities may require such holders to apply for qualification or a finding of suitability, subject to limited exceptions for “institutional investors” that hold a company’s voting securities for investment purposes only. If a beneficial holder of our securities is a corporation, partnership, or trust, such entity must submit detailed business and financial information, which may include information regarding its officers, directors, partners, key personnel, and beneficial owners. Further disclosure by those officers, directors, partners, key personnel, and beneficial owners may also be required. Under some circumstances and in some jurisdictions, an institutional investor, as defined in the applicable gaming regulations, that acquires and holds a specified amount of our securities in the ordinary course of its business may apply to the regulatory authority for a waiver of these licensure, qualification, or finding of suitability requirements, provided that the institutional investor holds the voting securities for investment purposes only, meets certain thresholds relating to the number of securities held, and certifies as to its intentions not to directly or indirectly exert control or influence over the management, policies, and operations of the licensed entity or to change its corporate governance documents.
Tribal-State Compacts and Tribal Regulation. Native American gaming is subject to the review of the NIGC and other applicable laws. Native American tribes must adopt and submit for NIGC approval the ordinances that regulate their gaming activities. Pursuant to the requirements of IGRA, our tribal customers require the tribe to have the sole proprietary interest in their gaming activities. Because federally recognized Native American tribes are independent governments with sovereign rights, Native American tribes can enact their own laws and regulate gaming operations and contracts, and, with some exceptions, generally enjoy sovereign immunity from lawsuits similar to that of the individual states and the United States.
Class III gaming on Native American tribal lands is subject to the negotiation of a compact between the tribe and the state in which they plan to operate a gaming facility. These tribal-state compacts typically include provisions entitling the state to receive a portion of the tribe’s gaming revenues. While tribal-state compacts are intended to document the agreement between the state and a tribe, these tribal-state compacts can be subject to disputes relative to permitted Class III gaming operations. Currently, we operate in three states where compacts materially affect our business: Oklahoma, Washington and, California.
14
|
|
|
|
|
|
Charity Regulation. We have historically supplied bingo games and systems to nonprofit organizations that operate these games for charitable, educational and other lawful purposes. Bingo for charity is not subject to a nationwide regulatory system, such as the system created by IGRA to regulate Native American gaming, and, as a result, regulation for this market is generally on a state-by-state basis, although in some cases it is regulated by county commissions or other local government authorities.
Lottery Commissions. Most States and the District of Columbia have lotteries. The operation of lotteries is subject to extensive regulation. Many aspects of lottery operations are determined by state or local legislation, but lottery regulatory authorities exercise significant discretion to ensure the integrity of contract awards and lottery operations, including in the process of selecting suppliers of equipment, technology and services and retailers of lottery products. Lottery regulatory commissions typically require detailed background disclosure by and investigations of vendors and their subsidiaries, affiliates, principal stockholders, officers, directors, and employees who will be directly responsible for the operation of lottery systems. These regulators may have authority to order removal of employees who they deem to be unsuitable or whose presence they believe may adversely affect the operational security or integrity of the lottery. Some lottery commissions mandate extensive personal and financial disclosure and background checks from persons and entities beneficially owning a specified percentage (typically 5% or more) of a vendor's securities. The failure of such beneficial owners of our securities to cooperate with the regulators could result in penalties, jeopardize the award of a lottery contract to us, or provide grounds for termination of an existing lottery contract.
Internet and Online Gaming Regulation. Several states have passed implementing legislation and/orand regulations to allow certain intra-state, wager-based, online casino, and/or lottery games, such as online poker, online lottery, lottery ticket purchases, or lottery ticket subscriptions. This is due, in part, to (a) a rule of construction contained within the Unlawful Internet gaming Enforcement Act (“UIGEA”) that limits and prevents UIGEA application from altering, limiting or extending any federal, state or tribal laws regulating gambling, (b) a definition within UIGEA that excludes certain intra-state, intra-tribal and interstate horseracing transactions from the phrase “unlawful Internet gambling,” provided certain threshold requirements are met, and (c) a memorandum dated September 20, 2011 and published by the United States Department of Justice, Criminal Division, in which the Department concludes, among other things, that the Federal Wire Act of 1961 (the “Wire Act”) does not apply to interstate transmissions of wire communications that do not relate to a sporting event or contest. To date, several states such as Delaware, Georgia, Illinois, Michigan, Minnesota, Nevada, New Jersey, North Carolina and North Dakota have authorized some form of internetInternet or online gaming or lottery activities.
However, the legislative and regulatory environment surrounding online, wager-based games in the United States remains uncertain and complex, and it is unclear how the legislative and regulatory framework governing these activities will
15
may continue to evolve in the future. Many states have yet to introduce or finalize regulations regarding the licensing and operational requirements regarding online, wager-based activity, including the licensing and technological requirements relating to the funding and processing of payments relating to online, wager-based casino and lottery games. In addition, the funding of online casino gaming activity is subject to the requirement of the UIGEA, which may prohibit or significantly impede the funding of online, wager-based gaming activity. There is also a possibility that the Wire Act may be amended in the future to prevent or prohibit the use of Internet or mobile-based platforms regardless of the involvement of a sporting event or contest.
16
to implement policies and procedures as well as adapt our business practices in order to comply with these laws and regulations. In addition to federal regulations, our Central Credit gaming patron credit bureau services are subject to the state credit reporting regulations that impose similar requirements to the Fair Credit Reporting ActFCRA and the Fair and Accurate Credit Transactions Act of 2003.
FACTA.
In addition, Europay, MasterCard and Visa jointly developed new card security features (“EMV”),
17
connection with our cash access transactions processed through MasterCard, Visa, Discover, and Visa, we must upgrade or replaceAmerican Express, all who have adopted the EMV standard, and as an operator of ATMs, our existing fleet of U.S.-basedPOS, fully integrated kiosk, and ATM devices are subject to accept the EMV standard. This requires us to upgrade the software on a significant portion ofmaintain our currently deployed fleet of U.S.-based POS, fully integrated kiosk, and ATM devices. Additionally, we may have to replace a portion of our devices with newer devices equipped with the minimum hardware requirements to support EMV.
the EMV standard.
federal regulations impacting our business.
generate profits in the future.
|
|
|
|
|
|
|
|
|
|
|
|
|
|
|
|
|
|
18
sell our products and services into new markets and to new customers in existing markets and retain our existing customers;
| requiring a substantial portion of cash flow from operations to be dedicated to the payment of principal and interest on our indebtedness, therefore, reducing our ability to use our cash flow to fund our operations, capital expenditures, and future business opportunities; |
|
|
| increasing our vulnerability to adverse economic, industry, or competitive developments; |
| restricting us from making strategic acquisitions or causing us to make non-strategic divestitures; |
| limiting our ability to obtain additional financing for working capital, capital expenditures, product development, debt service requirements, acquisitions, and general corporate or other purposes; and |
|
|
19
declare all outstanding principal and interest to be due and payable,payable; the lenders under the New Credit Facilities could declare all outstanding amounts under such facilities due and payable and terminate their commitments to loan money,money; and, in each case, could foreclose against the assets securing the borrowings under the New Credit Facilities, and weFacilities. Such actions could be forcedforce us into bankruptcy or liquidation.
| incur additional indebtedness; |
| sell assets or consolidate or merge with or into other companies; |
| pay dividends or repurchase or redeem capital stock; |
| make certain investments; |
| issue capital stock of our subsidiaries; |
| incur liens; |
| prepay, redeem, or repurchase subordinated debt; and |
| enter into certain types of transactions with our affiliates. |
20
Our net operating losslosses and other tax credit carry forwardscarry-forwards are subject to limitations that could potentially reduce these tax assets.
In addition, a portion of our NOL’s include amortization of goodwill for tax purposes associated with a restructuring that occurred in 2004, which could be subject to audit by the IRS and thus may have an adverse effect on our NOL carry-forwards.
21
Most of our gaming device contracts with our customers are on a month-to-month basis, and if we are unable to maintain our current customers on terms that are favorable to us, our business, financial condition, operations or cash flows may suffer a material adverse effect.
Most of our gaming device contracts with our customers are generally on a month-to-month basis, except for customers with whom we have entered into development and placement fee agreements. We do not rely upon the stated term of our gaming device contracts to retain the business of our customers. We rely instead upon providing competitive player terminals, games and systems to give our customers the incentive to continue doing business with us. At any point in time, a significant portion of our gaming device business is subject to nonrenewal, which may materially and adversely affect our earnings, financial condition and cash flows. To renew or extend any of our customer contracts generally, we may be required to accept financial and other terms that are less favorable to us than the terms of the expired contracts. In addition, we may not succeed in renewing customer contracts when they expire. If we are required to agree to other less favorable terms to retain our customers or we are not able to renew our relationships with our customers upon the expiration of our contracts, our business, financial condition, operations or cash flows could suffer a material adverse effect.
Consolidation among our customers could have a material adverse effect on our revenues and profitability.
We often execute contracts with customers pursuant to which we provide products and services at multiple gaming establishments. Accordingly, the expiration or termination of a single key contract can mean the loss of multiple gaming facilities at which our products and services are used. In addition, consolidation among operators of gaming establishments may also result in the loss of customers if one of our customers is acquired by a business that utilizes one of our competitors.
We derive a significant portion of our revenue from Native American tribal customers, and our ability to effectively operate in Native American gaming markets is vulnerable to legal and regulatory uncertainties, including the ability to enforce contractual rights on Native American land.
We derive a significant percentage of our revenue from the provision of cash access and gaming-related products and services to gaming facilities operated on Native American lands.
Native American tribes are independent governments with sovereign powers and, in the absence of a specific grant of authority by Congress to a state or a specific compact or agreement between a tribal entity and a state that would allow the state to regulate activities taking place on Native American lands, they can enact their own laws and regulate gaming operations and contracts. In this capacity, Native American tribes generally enjoy sovereign immunity from lawsuits similar to that of the individual states and the United States. Accordingly, before we can seek to enforce contract rights with a Native American tribe, or an agency or instrumentality of a Native American tribe, we must obtain from the Native American tribe a waiver of its sovereign immunity with respect to the matter in dispute, which we are not always able to do. Without a limited waiver of sovereign immunity, or if such waiver is held to be ineffective, we could be precluded from judicially enforcing any rights or remedies against a Native American tribe, including the right to enter Native American lands to retrieve our property in the event of a breach of contract by the tribal party to that contract. Even if the waiver of sovereign immunity by a Native American tribe is deemed effective, there could be an issue as to the forum in which a lawsuit may be brought against the Native American tribe. Federal courts are courts of limited jurisdiction and generally do not have jurisdiction to hear civil cases relating to Native American tribes, and we may be unable to enforce any arbitration decision effectively. Although we attempt to agree upon governing law and venue provisions in our contracts with Native American tribal customers, these provisions vary widely and may not be enforceable.
Certain of our agreements with Native American tribes are subject to review by regulatory authorities. For example, our development agreements are subject to review by the NIGC, and any such review could require substantial modifications to our agreements or result in the determination that we have a proprietary interest in a Native American tribe’s gaming activity, which could materially and adversely affect the terms on which we conduct our business. The NIGC has previously expressed the view that some of our development agreements could be in violation of the requirements of the IGRA and Native American tribal gaming regulations, which state that the Native American tribes must hold “sole proprietary interest” in the Native American tribes’ gaming operations, which presents additional risk for our business. The NIGC may also reinterpret applicable laws and regulations, which could affect our agreements with Native American
22
tribes. We could also be affected by alternative interpretations of the Johnson Act as the Native American tribes, who are the customers for our Class II games, could be subject to significant fines and penalties if it is ultimately determined they are offering an illegal game, and an adverse regulatory or judicial determination regarding the legal status of our products could have material adverse consequences for our business, financial condition, operations, cash flows or prospects.
Government enforcement, regulatory action, judicial decisions and proposed legislative action have in the past, and will likely continue to affect our business, financial condition, operations, cash flows and prospects in Native American tribal lands. The legal and regulatory uncertainties surrounding our Native American tribal agreements could result in a significant and immediate material adverse effect on our business, financial condition, operations or cash flows. Additionally, such uncertainties could increase our cost of doing business and could take management’s attention away from operations. Regulatory action against our customers or equipment in these or other markets could result in machine seizures and significant revenue disruptions, among other adverse consequences. Moreover, Native American tribal policies and procedures, as well as tribal selection of gaming vendors, are subject to the political and governance environment within each Native American tribe. Changes in tribal leadership or tribal political pressure can affect our business relationships within Native American markets.
Certain Native American tribes require us to contract with entities that are owned, controlled or managed by tribal members to provide a portion of our services. In some instances, these entities are subcontractors of ours in connection with providing our services, while in other instances we are a subcontractor to these entities who contract with the applicable tribal gaming casino or tribe directly to provide cash access services. Our ability to provide our services is dependent upon our relationship with these third parties and their ability to provide services in accordance with the terms of our contractual arrangement with these third parties and, in some instances, the third parties’ relationship or contractual arrangement with the applicable tribal gaming casino or tribe.
Our business depends on our ability to introduce new, commercially viable games, products and services in a timely manner.
Our success is dependent on our ability to develop and sell new games, products and services that are attractive not only to our customers but also to their customers, the gaming patrons. If our games, products, and services do not appeal to gaming operators and patrons, or do not meet or sustain revenue and profitability of contractual obligations and expectations, we may lose business to our competitors. Additionally, we may be unable to enhance existing games, products and services in a timely manner in response to changing regulatory, legal or market conditions or customer requirements, or new games, products and services may not achieve market acceptance in new or existing markets. Delay in regulatory approvals of new gaming devices and equipment may adversely impact new product deployment. Furthermore, as we attempt to generate new streams of revenue by selling our games, products and services to new customers in new jurisdictions, we will face licensing and approval requirements of Gaming Authorities influencing the timing of our market entry and we may have difficulty implementing an effective sales strategy for these new jurisdictions. If we are unable to keep pace with rapid innovations in new technologies or product design and deployment or if we are unable to quickly adapt our development, manufacturing or sales processes to compete, our business, financial condition, operations or cash flows could suffer a material adverse effect.
We may not successfully enter new markets and potential new markets may not develop quickly, or at all.
23
faced by businesses that operate only in the United States. The legal and regulatory regimes of foreign markets and their ramifications on our business aremay be less certain. Our international operations aremay be subject to a variety of risks, including different regulatory requirements and interpretations, trade barriers, difficulties in staffing and managing foreign operations, higher rates of fraud, compliance with anti-corruption and export control laws, fluctuations in currency exchange rates, difficulty in enforcing or interpreting contracts or legislation, political and economic instability, and potentially adverse tax consequences. Difficulties in obtaining approvals, licenses, or waivers from the monetary and gaming authoritiesGaming Authorities of other jurisdictions, in addition to other potential regulatory and quasi-regulatory issues that we have not yet ascertained, may arise in international jurisdictions into which we attempt to enter. In these new markets, our operations will rely on an infrastructure of, among other things, financial services and telecommunications facilities that may not be sufficient to support our business needs, such as the authorization and settlement services that are required to implement electronic payment transactions and the telecommunications facilities that would enable us to reliably connect our networks to our products at gaming establishments in these new markets.needs. In these new markets, we may additionally provide services based upon interpretations of applicable law, which interpretation may be subject to regulatory or judicial review. These risks, among others, could materially and adversely affect our business, financial condition, and operations. In connection with our expansion into new international markets, we may forge strategic relationships with business partners to assist us. The success of our expansion into these markets therefore may depend in part upon the success of the business partners with whom we forge these strategic relationships. If we do not successfully form strategic relationships with the right business partners or if we are not able to overcome cultural or business practice differences, our ability to penetrate these new international markets could suffer.
24
We typically rely on a single third-party processor to process substantially all of our cash access transactions that are processed through various card associations and payment networks, and the failure of our third-party processor to adequately provide such processing services could have a material adverse effect on our business, financial condition, operations or cash flows.
We typically rely on a single third party to provide processing services for the substantial majority of our cash access transactions by obtaining authorizations for ATM cash withdrawal, POS debit card and credit card cash access transactions and to provide settlement transaction files to card associations and payment networks for some of these transactions. If our third-party processor fails to adequately provide these services, it could result in our systems being unable to process our cash access transactions intermittently or for extended periods of time, which could have a material adverse effect on our business, financial condition, operations or cash flows.
We depend on third-party transaction processors, telecommunication networks and other third-party technology providers to provide our cash access and related services, and if we, or any of these third parties, experience system or service failures, the products and services we provide could be delayed or interrupted, which could harm our business and reputation.
Our ability to provide uninterrupted and high levels of services depends upon the performance of the third-party processors, telecommunication networks and other third-party technology providers that we use. Any significant interruptions in or degradation of the quality of the services that these third parties provide to us could severely harm our business and reputation and lead to the loss of customers and revenue. Our third-party providers and their systems are potentially vulnerable to computer viruses, physical or electronic security breaches, natural disasters and similar disruptions, which could lead to interruptions or outages of our services, delays, loss of data or public release of confidential data, all of which could have a material adverse effect on our business, financial condition, operations or cash flows. In some instances, such failures could cause us to fail to meet contractual deadlines or specifications and force us to renegotiate contracts on less favorable terms, pay penalties or liquidated damages or suffer major losses if the customer exercises its right to terminate. We are parties to certain agreements that could require us to pay damages resulting from loss of revenues if our systems are not properly functioning or as a result of a system malfunction. For example, our agreement with the New York Lottery permits termination of the contract at any time for failure by us or our system to perform properly, and any such unforeseen downtime could subject us to liquidated damages. In addition, if we fail to meet the terms specified in our contracts, we may not realize their full benefits. Failure to perform under any contract could result in substantial monetary damages, as well as contract termination. Our results of operations are dependent on our ability to maximize our earnings from our contracts.
An unexpectedly high level of chargebacks, as the result of fraud or otherwise, including in connection with new technology standards being implemented in the United States regarding chip-based cards, could materially and adversely affect our cash access business.
In 1994, Europay, MasterCard and Visa jointly developed EMV, designed to deter fraudulent card transactions related to identity theft, counterfeit cards and the misuse of lost or stolen cards via enhanced card authentication, transaction authorization and cardholder verification using chip-based smart-cards. EMV has been adopted in many regions of the world as the global standard for fraud deterrence in chip based smart-card payments. Historically, the U.S. payments industry has relied on magnetic stripe cards instead of EMV compliant chip-based cards. Recently, however, U.S. card issuers have begun to offer EMV-capable chip-based smart-cards, and as of October 1, 2015, the U.S. payment card industry shifted the liability for fraudulent transactions generated through EMV-enabled cards onto merchants whose devices are not capable of processing chip-based smart-card EMV transactions. This shifted the responsibility for chargebacks due to fraudulent transactions on such cards from the card issuer onto the merchant. We bear the risk and are subject to trailing chargeback risk for fraudulent transactions generated through EMV-enabled cards from October 1, 2015 until such time that our customer base is fully converted to the EMV standards.
When patrons use our cash access services, we either dispense cash or produce a negotiable instrument that can be exchanged for cash. If a completed cash access transaction is subsequently disputed, and if we are unsuccessful in establishing the validity of the transaction, we may not be able to collect payment for such transaction and such transaction
25
becomes a chargeback. In the event that we incur chargebacks in excess of specified levels, we could lose our sponsorship into the card associations or be censured by the card associations by way of fines or otherwise. Our failure to adequately manage our chargebacks could have a material adverse effect on our business, financial condition, operations or cash flows.
Changes in consumer willingness to pay a fee to access their funds could reduce the demand for our cash access products and services.
Our cash access business depends upon the willingness of patrons to pay a service fee to access their own funds on the premises of a gaming establishment. In most retail environments, consumers typically do not pay an additional fee for using non-cash payment methods such as credit cards, POS debit cards or checks. Gaming patrons could bring more cash with them to gaming establishments or access cash outside of gaming establishments without paying a fee for the convenience of not having to leave the gaming establishment. To the extent that gaming patrons become unwilling to pay these fees for convenience or lower cost cash access alternatives become available, the demand for cash access services within gaming establishments will decline and our business could suffer.
If we are unable to develop and protect our intellectual property adequately or obtain intellectual property rights and agreements, we may lose valuable competitive advantages, be forced to incur costly litigation to protect our rights, or be restricted in our ability to provide various products in our markets
markets.
26
products or to develop or manufacture these components ourselves, which would result in increased costs and could result in delays in the deployment of our gaming systems and player terminals. Furthermore, we might be forced to limit the features available in our current or future offerings.
|
|
|
|
|
|
|
|
|
|
|
|
27
|
|
|
|
|
|
|
|
|
|
|
|
|
|
|
|
|
|
|
|
|
|
Changes by M&C International and First Data Corporation toDuring 2018, the impact of weather-related natural disasters resulted in business disruption at certain of their tax returns may have an impactour customers’ facilities.
In connection with a recapitalization and private equity restructuring that occurred in 2004 involving our former owners, First Data Corporation (“First Data”), M&C International (“M&C”) and entities affiliated with Bank of America, N.A., we recorded a deferred tax asset of $247.0 million. In connection with this deferred tax asset, we expect to pay a significantly lower amount in United States federal income taxes than we provide for in our Consolidated Statements of (Loss) Income and Comprehensive (Loss) Income. Our calculation of the starting balance of the deferred tax asset is based upon information we received from First Data and M&C about the gains they recordedproposed legislative action have in the transaction. If First Datapast, and will likely continue to affect our business, financial condition, operations, cash flows, and prospects in Native American tribal lands. The legal and regulatory uncertainties surrounding our Native American tribal agreements could result in a significant and immediate material adverse effect on our business, financial condition, operations, or M&C change their calculationcash flows. For example, certain of our agreements with Native American tribes are subject to review by regulatory authorities. Additionally, such uncertainties could increase our cost of doing business and could take management’s attention away from operations. Regulatory action against our customers or equipment in these or other markets could result in machine seizures and significant revenue disruptions, among other adverse consequences. Moreover, Native American tribal policies and procedures, as well as tribal selection of gaming vendors, are subject to the gainspolitical and file amended tax returns,governance environment within each Native American tribe. Changes in tribal leadership or tribal political pressure can affect our business relationships within Native American markets.
28
balanceterms of the deferred tax assetexpired contracts. In addition, we may not succeed in renewing customer contracts when they expire. If we are required to agree to other less favorable terms to retain our customers or we are not able to renew our relationships with our customers upon the expiration of our contracts, our business, financial condition, operations, or cash flows could suffer a material adverse effect.
We may be subject to fines, penalties, liabilities and legal claims resulting from unauthorized
data could subject us to costly fines, penalties, and legal claims.
Our operation of gaming activities, including the sale and manufacturing of gaming devices, fully integrated kiosks, the provision of cash access services at gaming establishments and the operation of central determinant systems, is subject to extensive regulation by the jurisdictions where we operate. The gaming laws, regulations and ordinances vary from jurisdiction to jurisdiction, but generally concern the antecedents, acumen, financial stability and character of our owners, officers and directors, as well as those persons financially interested or involved in our companies. Our violation of these gaming laws, regulations and ordinances could result in the imposition of substantial fines, or in the conditioning, limitation, suspension or revocation of a required license, registration or other approval, either of which could have a
29
material adverse impact on our business depending on the specific circumstances. In addition, we are subject to the possible increase at any time by various state and federal legislatures and officials of gaming taxes or fees, which could adversely affect our results. For a summary of gaming regulations that could affect our business, see “Item 1. Business—Regulation.”
Our ability to conduct both our gaming and cash access businesses, expand operations, develop and distribute new games, products and systems, and expand into new gaming markets is also subject to significant federal, state, local, Native American and foreign regulations.regulations which vary from jurisdiction to jurisdiction. In the United States and many other countries, gaming must be expressly authorized by law. Once authorized, such activities are subject to extensive and evolving governmental regulation. While we seek to comply withThe gaming laws, regulations and ordinances generally concern the antecedents, acumen, financial stability and character of our owners, officers and directors, as well as those persons financially interested or involved in our companies; dictate the technical standards and regulations set forth by each jurisdiction, a governmental agency or court could disagree with our interpretation of these standards and regulations or determine that the manufacturing and use of certain of our electronic player terminals, and perhaps other key components of our gaming systems that rely to some extent upon electronic equipment to run a game, is impermissible under applicable law. An adverse regulatory or judicial determination regardingand certain other products; set forth the legal status of our products could have material adverse consequences for us in other jurisdictions, including with gaming regulators,process and our business, operating results and prospects could suffer and we and our officers and directors could be subject to significant fines and penalties. Furthermore,manner by which the failure to become licensed, or the loss or conditioning of a license, in one market may have the adverse effect of preventing licensing in other markets or the revocation of licenses we already maintain.
As we expand into new markets, we expect to encounter business, legal, operational and regulatory uncertainties as well as additional responsibilities. As we enter new jurisdictions, we are subject to increasing legal, regulatory and reporting requirements that will require substantial additional resources,Gaming Authorities issue such as new licenses, permits and approvals, including third-party certifications that our games comply with a particular jurisdiction’s stated regulations, in order to meet our expectations for new market entry, and such licenses, permits or approvals may not be timely granted to us, or granted to us at all, which could have a material effect on our business in general and new market entry specifically. Obtaining and maintaining all required licenses, findings of suitability registrations, permits or approvals is time consuming, expensive and potentially distracting to management. As we enter new jurisdictions, our reporting systems will need to be developed and/or updated, and we may fail to provide timely or adequate notifications or reporting requirements within these new jurisdictions, which could have adverse regulatory consequences for us in that, or in other, jurisdictions, which could affect our business. In addition, entry into new markets may require us to make changes to our gaming systems to ensure that they comply with applicable regulatory requirements. We may also encounter additional legal and regulatory challenges that are difficult or impossible to foresee and which could result in an unforeseen adverse impact on planned revenues or costs associated with the new market opportunity. If we are unable to effectively develop and operate within these new markets, then our business, operating results and financial condition would be impaired.
Generally, our placement of systems, games and technology into new market segments involves a number of business uncertainties, including whether:
|
|
|
|
|
|
|
|
|
|
|
|
30
|
|
|
|
product approvals. In addition, the suspension, revocation, nonrenewal or limitation of any of our licenses or product approvals, or the inability to obtain or maintain requisite
For a summary of gaming regulations that could affect our business, see “Item 1. Business — Regulation.”
31
We are subject to extensive rules and regulations of card associations, including VISA, MasterCard, and electronic paymentEFT networks that are always subject to change, which may harm our business.
In addition, proposed changes to the Dodd-Frank Act, such as the repeal of the Durbin Amendment, if adopted, or other regulation that could be implemented to limit the amount of surcharge or service fees charged for our cash access transactions could have a negative impact on revenue and gross margins (exclusive of depreciation and amortization) as a result of reduced service fee revenue and potential increases in interchange rates merchants pay for debit card transactions.
32
The provision of our credit card access, POS debit, and ATM services are dependent upon our continued sponsorship into the VISA and MasterCard card associations, and the suspension or termination of our sponsorship would result in a material adverse effect on our business, financial condition, operations, or cash flows.
33
marketing and database services.
|
|
|
|
|
|
|
|
|
|
|
|
|
|
|
|
|
|
|
|
|
|
|
|
|
|
|
|
|
|
|
|
|
|
34
|
|
|
|
|
|
|
|
|
|
|
|
|
|
|
|
|
|
|
|
|
|
|
|
|
|
35
provide for an advance notice procedure with regard to business to be brought before a meeting of stockholders which may delay or preclude stockholders from bringing matters before a meeting of stockholders or from making nominations for directors at a meeting of stockholders, which could delay or deter takeover attempts or changes in management;
under lease agreements. We believe that these facilities are adequate for our business needs as presently conducted.
| Location | Sq. Ft | Purpose | Segment |
| Austin, Texas | 204,256 | Games Headquarters and Operations | Games |
| Las Vegas, Nevada | 106,873 | Corporate Headquarters; FinTech Headquarters and Operations | FinTech; Games |
| Reno, Nevada | 17,138 | Game Design Studio | Games |
| Chicago, Illinois | 17,124 | Game Design Studio | Games |
The parties agreed to settle all claims asserted in the Texas Federal Action. Everi Games Holding agreed to make certain additional disclosures in its proxy statement related to the Merger, and made those disclosures in a Current Report on Form 8-K filed on November 21, 2014. In addition, the defendants agreed not to oppose plaintiffs’ application for an attorneys’ fee award of up to $310,000. The court in the Texas Federal Action approved the settlement, awarded attorneys’ fees of $310,000, and entered judgment. The deadline to file any appeal from the judgment has expired and no appeal has been filed.
The judgment in the Texas Federal Action includes a release of the claims asserted in the Texas State Court Action. The Texas State Court Action has been dismissed with prejudice.
Alabama Litigation
The Company is currently involved in one lawsuit related to Everi Games’ former charity bingo operations in the State of Alabama, which we believe is not material from a damages perspective. The lawsuit is currently pending in federal court and includes claims related to the alleged illegality of electronic charity bingo in the State of Alabama.
Ozetta Hardy v. Whitehall Gaming Center, LLC, et al., a civil action, was filed against Whitehall Gaming Center, LLC (an entity that does not exist), Cornerstone Community Outreach, Inc., and Freedom Trail Ventures, Ltd., in the Circuit Court of Lowndes County, Alabama. On June 3, 2010, Everi Games Holding and other manufacturers were added as defendants. The plaintiffs, who claim to have been patrons of White Hall, allege that Everi Games Holding participated in gambling operations that violated Alabama state law by supplying to White Hall purportedly unlawful electronic bingo machines played by the plaintiffs, and the plaintiffs seek recovery of the monies lost on all electronic bingo games played by the plaintiffs in the six months prior to the filing of the complaint under Ala. Code, Sec 8-1-150(A). The plaintiffs requested that the court certify the action as a class action. On July 2, 2010, the defendants removed the case to the United States District Court for the Middle District of Alabama, Northern Division. The court has not ruled on the plaintiffs'
motion for class certification. The Company continues to vigorously defend this matter. Given the inherent uncertainties in this litigation, however, the Company is unable to make any prediction as to the ultimate outcome.
Item 4. Mine Safety Disclosures.
Disclosures.
37
The following table sets forth for the indicated periods, the high and low sale prices per share of our common stock:
|
|
|
|
|
|
|
|
|
| Price Range |
| ||||
|
| High |
| Low |
| ||
2015 |
|
|
|
|
|
|
|
First Quarter |
| $ | 8.53 |
| $ | 6.41 |
|
Second Quarter |
|
| 8.50 |
|
| 7.16 |
|
Third Quarter |
|
| 7.87 |
|
| 4.39 |
|
Fourth Quarter |
|
| 5.35 |
|
| 3.27 |
|
2014 |
|
|
|
|
|
|
|
First Quarter |
| $ | 9.93 |
| $ | 6.37 |
|
Second Quarter |
|
| 9.29 |
|
| 6.38 |
|
Third Quarter |
|
| 9.13 |
|
| 6.56 |
|
Fourth Quarter |
|
| 7.75 |
|
| 6.04 |
|
On March 1, 2016, the closing sale price of our common stock on the New York Stock Exchange was $3.02.
Dividend Policy
We have never declared or paid any cash dividends on our capital stock. We currently intend to retain all our earnings for the repayment of our outstanding debt and to finance the growth and development of our business. Any future change in our dividend policy will be made at the discretion of our Board of Directors and will depend on contractual restrictions, our results of operations, earnings, capital requirements and other factors considered relevant by our Board of Directors. In addition, the Credit Facilities, the purchase agreement governing the Refinanced Secured Notes and indenture governing the Unsecured Notes limit our ability to declare and pay cash dividends.
Sales of Unregistered Securities
On April 15, 2015, in connection with the Refinanced Secured Notes and pursuant to the terms of the Note Purchase Agreement (defined below), Holdings issued to CPPIB Credit Investments III Inc. (the “Purchaser”) a warrant to purchase 700,000 shares of Holdings’ common stock, with an exercise price equal to $9.88 per share, representing a 30% premium to the volume-weighted average price of Holdings’ common stock for the ten trading days prior to the issuance of the warrant (the “Warrant”). The Warrant expires on the sixth anniversary of the date of issuance. The number of shares issuable pursuant to the Warrant and the warrant exercise price are subject to adjustment for stock splits, reverse stock splits, stock dividends, mergers and certain other events. The Warrant was issued in a private placement under Section 4(a)(2) of the Securities Act.
Common Stock Repurchases
38
Issuer Purchases and Withholding of Equity Securities
|
|
|
|
|
|
|
|
| Total Number of |
| Average Price |
| |
|
| Shares |
| per Share |
| |
|
| Purchased or |
| Purchased or |
| |
|
| Withheld |
| Withheld |
| |
|
| (000’s) |
|
|
| |
Tax Withholdings |
|
|
|
|
|
|
10/1/15 - 10/31/15 |
| 23.2 | (1) | $ | 4.69 | (2) |
11/1/15 - 11/30/15 |
| 0.7 | (1) |
| 4.45 | (2) |
12/1/15 - 12/31/15 |
| 0.8 | (1) |
| 3.42 | (2) |
|
|
|
|
|
|
|
Sub-Total |
| 24.7 | (1) |
| 4.65 | (2) |
|
|
|
|
|
|
|
Total |
| 24.7 |
| $ | 4.65 |
|
Total Number of Shares Purchased (1) (in thousands) | Average Price per Share (2) | ||||||
| Tax Withholdings | |||||||
| 10/1/18 - 10/31/18 | 6.4 | $ | 7.04 | ||||
| 11/1/18 - 11/30/18 | 0.6 | $ | 7.41 | ||||
| 12/1/18 - 12/31/18 | 3.1 | $ | 5.26 | ||||
| Total | 10.1 | $ | 6.52 | ||||
| (1) | Represents the shares of common stock that were withheld from restricted stock awards to satisfy the minimum applicable tax withholding obligations incident to the vesting of such restricted stock awards. There are no limitations on the number of shares of common stock that may be withheld from restricted stock awards to satisfy the minimum tax withholding obligations incident to the vesting of restricted stock awards. |
| (2) | Represents the average price per share of common stock withheld from restricted stock awards on the date of withholding. |
2018.
39
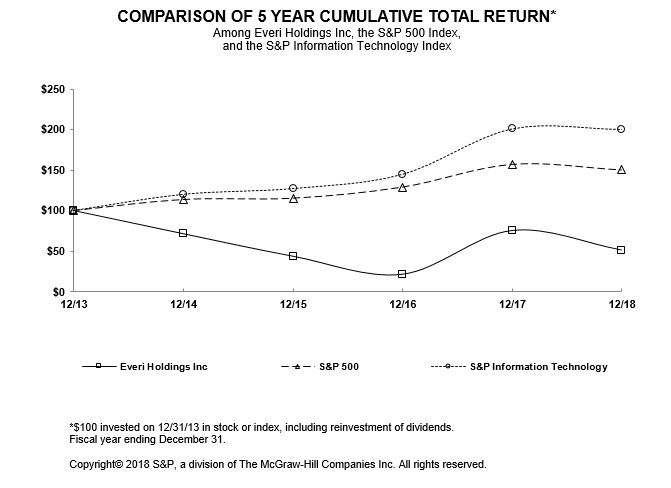
![]()
This graph isRegulation S-K, and are not “soliciting material,” is not deemedbeing filed withfor purposes of Section 18 of the SECExchange Act and isare not to be incorporated by reference in any filing by us under the Securities Act or the Exchange Act, whether made before or after the date hereof and irrespective of any general incorporation language in any such filing.
|
|
|
|
|
|
|
|
|
|
|
|
|
|
|
|
|
|
| Year Ended December 31, |
| |||||||||||||
|
| 2015(1) |
| 2014(2) |
| 2013 |
| 2012 |
| 2011 |
| |||||
Income Statement Data |
|
|
|
|
|
|
|
|
|
|
|
|
|
|
|
|
Revenues |
| $ | 826,999 |
| $ | 593,053 |
| $ | 582,444 |
| $ | 584,486 |
| $ | 544,063 |
|
Operating (loss) income |
|
| (9,730) |
|
| 33,782 |
|
| 49,150 |
|
| 55,982 |
|
| 38,296 |
|
Net (loss) income |
|
| (104,972) |
|
| 12,140 |
|
| 24,398 |
|
| 25,689 |
|
| 9,129 |
|
|
|
|
|
|
|
|
|
|
|
|
|
|
|
|
|
|
Net (loss) income |
| $ | (1.59) |
| $ | 0.18 |
| $ | 0.37 |
| $ | 0.39 |
| $ | 0.14 |
|
|
|
|
|
|
|
|
|
|
|
|
|
|
|
|
|
|
Net (loss) income |
| $ | (1.59) |
| $ | 0.18 |
| $ | 0.36 |
| $ | 0.38 |
| $ | 0.14 |
|
|
|
|
|
|
|
|
|
|
|
|
|
|
|
|
|
|
Basic |
|
| 65,854 |
|
| 65,780 |
|
| 66,014 |
|
| 65,933 |
|
| 64,673 |
|
Diluted |
|
| 65,854 |
|
| 66,863 |
|
| 67,205 |
|
| 67,337 |
|
| 64,859 |
|
|
|
|
|
|
|
|
|
|
|
|
|
|
|
|
|
|
|
| At and For the Year Ended December 31, |
| |||||||||||||
|
| 2015(1) |
| 2014(2) |
| 2013 |
| 2012 |
| 2011 |
| |||||
Balance sheet data |
|
|
|
|
|
|
|
|
|
|
|
|
|
|
|
|
Cash and cash equivalents |
| $ | 102,030 |
| $ | 89,095 |
| $ | 114,254 |
| $ | 153,020 |
| $ | 55,535 |
|
Working capital(3) |
|
| 2,452 |
|
| 12,550 |
|
| (1,682) |
|
| — |
|
| — |
|
Total assets |
|
| 1,574,065 |
|
| 1,707,285 |
|
| 527,327 |
|
| 553,895 |
|
| 529,067 |
|
Total borrowings |
|
| 1,163,579 |
|
| 1,188,787 |
|
| 103,000 |
|
| 121,500 |
|
| 174,000 |
|
Stockholders’ equity |
|
| 137,420 |
|
| 231,473 |
|
| 218,604 |
|
| 198,759 |
|
| 159,858 |
|
Cash flow data |
|
|
|
|
|
|
|
|
|
|
|
|
|
|
|
|
Net cash provided by operating activities |
| $ | 124,416 |
| $ | 24,531 |
| $ | 4,334 |
| $ | 157,488 |
| $ | 54,252 |
|
Net cash used in investing activities |
|
| (85,045) |
|
| (1,085,847) |
|
| (13,990) |
|
| (12,531) |
|
| (18,183) |
|
Net cash (used in) provided by financing activities |
|
| (24,884) |
|
| 1,037,423 |
|
| (29,183) |
|
| (46,783) |
|
| (41,227) |
|
| Year Ended December 31, | ||||||||||||||||||||
2018(1) | 2017(2) | 2016(3) | 2015(4)(5) | 2014(6) | ||||||||||||||||
| Income Statement Data | ||||||||||||||||||||
| Revenues | $ | 469,515 | $ | 974,948 | $ | 859,456 | $ | 826,999 | $ | 593,053 | ||||||||||
| Operating income (loss) | 85,813 | 81,819 | (118,555 | ) | (9,730 | ) | 33,782 | |||||||||||||
| Net income (loss) | 12,356 | (51,903 | ) | (249,479 | ) | (104,972 | ) | 12,140 | ||||||||||||
| Basic earnings (loss) per share | 0.18 | (0.78 | ) | (3.78 | ) | (1.59 | ) | 0.18 | ||||||||||||
| Diluted earnings (loss) per share | 0.17 | (0.78 | ) | (3.78 | ) | (1.59 | ) | 0.18 | ||||||||||||
| Weighted average common shares outstanding | ||||||||||||||||||||
| Basic | 69,464 | 66,816 | 66,050 | 65,854 | 65,780 | |||||||||||||||
| Diluted | 73,796 | 66,816 | 66,050 | 65,854 | 66,863 | |||||||||||||||
| At and For the Year Ended December 31, | ||||||||||||||||||||
2018(1) | 2017(2) | 2016(3) | 2015(4)(5)(6) | 2014(7) | ||||||||||||||||
| Balance sheet data | ||||||||||||||||||||
| Cash and cash equivalents | $ | 297,532 | $ | 128,586 | $ | 119,051 | $ | 102,030 | $ | 89,095 | ||||||||||
| Working capital | 17,304 | (12,040 | ) | (1,875 | ) | 2,452 | 12,550 | |||||||||||||
| Total assets | 1,548,261 | 1,537,074 | 1,408,163 | 1,550,385 | 1,707,285 | |||||||||||||||
| Total borrowings | 1,163,216 | 1,167,843 | 1,121,880 | 1,139,899 | 1,188,787 | |||||||||||||||
| Stockholders’ (deficit) equity | (108,895 | ) | (140,633 | ) | (107,793 | ) | 137,420 | 231,473 | ||||||||||||
| Cash flow data | ||||||||||||||||||||
| Net cash provided by operating activities | $ | 294,286 | $ | 95,828 | $ | 131,711 | $ | 124,587 | $ | 24,531 | ||||||||||
| Net cash used in investing activities | (123,350 | ) | (109,979 | ) | (88,054 | ) | (85,549 | ) | (1,085,847 | ) | ||||||||||
Net cash provided by (used in) financing activities | 11 | 22,394 | (24,922 | ) | (24,551 | ) | 1,037,423 | |||||||||||||
| (1) | On January 1, 2018, we adopted ASC 606 using the modified retrospective method, which resulted in the recording of an immaterial cumulative adjustment in the amount of approximately $4.4 million to accumulated deficit as of the adoption date. Our prior period results were not recast to reflect the new revenue recognition standard under the modified retrospective method. |
| (2) | During 2017, we refinanced our senior secured term loan, senior secured notes and senior unsecured notes, which resulted in approximately $51.8 million of loss on extinguishment of debt. |
| (3) | During 2016, the Games reporting unit had a goodwill impairment of $146.3 million. |
| (4) | 2015 amounts include a full year of financial results for Everi Games. |
| (5) | During 2015, the Games reporting unit had a goodwill impairment of $75.0 million. |
| |
| (6) | We reclassified $23.7 million of debt issuance costs related to our outstanding debt from the non-current portion of other assets to contra-liabilities included in long-term debt as of December 31, 2015 in connection with our retrospective adoption of Accounting Standards Update (“ASU”) No. 2015-03 in 2016. This reclassification decreased the December 31, 2015 balance of both total assets and total borrowings. |
| (7) | 2014 amounts affected by the Merger for which |
|
|
41
Item 7. Management’s Discussion and Analysis of Financial Condition and Results of Operations.
Operations.
and “Item 1A. Risk Factors” included elsewhere in this Annual Report on Form 10-K.
Significant Trends and Developments Impacting Results of Operations
Merger with Everi Games
In December 2014, Holdings completed its acquisition of Everi Games Holding Inc. (formerly known as Multimedia Games Holding Company, Inc.) (“Everi Games Holding”). Pursuant to the terms of the Merger Agreement, Merger Sub merged with and into Everi Games Holding, with Everi Games Holding continuing as the surviving corporation. In the Merger, Everi Games Holding became a wholly owned subsidiary of Holdings. Also, as a result of the Merger, each outstanding share of common stock, par value $0.01 per share, of Everi Games Holding, other than shares held by Holdings, Everi Games Holding, Merger Sub or their respective subsidiaries, was cancelled and converted into the right to receive $36.50 in cash, without interest, together with consideration paid in connection with the acceleration and full vesting of certain Everi Games Holding equity awards. We completed the Merger and paid the Total Merger Consideration of approximately $1.1 billion in cash. To fund the Merger, we entered into a credit facility consisting of a $500.0 million, six year senior secured term loan facility that matures in 2020 (the “Term Loan”), and a $50.0 million, five year senior secured revolving credit facility that matures in 2019 (“Revolving Credit Facility,” and together with the Term Loan, the “Credit Facilities”) and issued $350.0 million aggregate principal amount of 7.75% Senior Secured Notes due 2021 (the “Secured Notes”), and $350.0 million aggregate principal amount of 10.00% Senior Unsecured Notes due 2022 (the “Unsecured Notes,” and, together with the Secured Notes or the Refinanced Secured Notes (defined below), as applicable, the “Notes”). The Secured Notes were subsequently refinanced, as discussed below. The Revolving Credit Facility remained undrawn at the closing of the Merger. In relation to the Merger, we incurred expenses of approximately $52.6 million associated with debt issuance costs and original issue discounts. These amounts were capitalized and are being amortized to interest expense based upon the related debt agreements using the straight-line method.
We expensed approximately $2.7 million and $10.7 million of costs incurred related to the acquisition of Everi Games Holding for financial advisory services, financing related fees, accounting and legal fees and other transaction-related expenses for the years ended December 31, 2015 and 2014, respectively. These expenses are included in the ConsolidatedFinancial Statements of (Loss) Income and Comprehensive (Loss) Income within operating expenses. These expenses do not include any costs related to additional site consolidation or rationalization that we might consider in the future.
Gain Contingency Settlement
In January 2014, we filed a complaint against certain third party defendants alleging conspiracy in restraint of competition regarding interchange fees, monopolization by defendants in the relevant market, and attempted monopolization of the
42
defendants in the relevant market. We demanded a trial by jury of all issues so triable. The defendants filed a motion to dismiss on March 13, 2014. A settlement agreement was made as of January 16, 2015, and, on January 22, 2015, the settlement agreement was executed and delivered in connection with respect to which we received $14.4 million in cash and recorded the settlement proceeds in the first quarter of 2015. This settlement is included as a reduction of operating expenses in our Consolidated Statements of (Loss) Income and Comprehensive (Loss) Income for the year ended December 30, 2015. The Company utilized the proceeds along with cash on hand to make a $15.0 million principal reduction payment on the Secured Notes in the first quarter of 2015.
Refinance of Secured Notes
The terms of the Secured Notes purchase agreement stipulated that the Company was required to use commercially reasonable efforts to aid the initial purchasers in the resale of the Secured Notes. Alternatively, we had the ability to redeem the Secured Notes from the initial purchasers without penalty. On April 15, 2015, the Company entered into a note purchase agreement (the “Note Purchase Agreement”), among Everi Payments, CPPIB Credit Investments III Inc. (the “Purchaser”) and Deutsche Bank Trust Company Americas, as collateral agent (the “Collateral Agent”) and issued $335.0 million in aggregate principal amount of its 7.25% Senior Secured Notes due 2021 (the “Refinanced Secured Notes”) in a private offering to the Purchaser. With the proceeds from the issuance of the Refinanced Secured Notes, we redeemed, in full, the Company’s outstanding Secured Notes from the note holders thereof in accordance with the terms of the indenture governing the Secured Notes. In connection with this transaction during the second quarter of 2015, we expensed approximately $13.0 million of related debt issuance costs and fees to “Loss on extinguishment of debt” associated with the redeemed Senior Secured Notes that were outstanding prior to the refinance transaction.
In connection with the Refinanced Secured Notes and pursuant to the terms of the Note Purchase Agreement, the Company issued to the Purchaser a warrant to purchase 700,000 shares of Holdings’ common stock, with an exercise price equal to $9.88 per share, representing a 30% premium to the volume-weighted average price of Holdings’ common stock for the ten trading days prior to the issuance of the warrant. The warrant expires on the sixth anniversary of the date of issuance. The number of shares issuable pursuant to the warrant and the warrant exercise price are subject to adjustment for stock splits, reverse stock splits, stock dividends, mergers and certain other events. The warrants were valued at $2.2 million using a modified Black-Scholes model and were accounted for as a debt discount.
Unsecured Notes Syndication
In connection with the terms of the Unsecured Notes purchase agreement for which we were required to use commercially reasonable efforts to aid the initial purchasers in the resale of the Unsecured Notes, the Company prepared an updated offering memorandum and participated in reasonable marketing efforts including road shows, to the extent required therein. The Unsecured Notes were resold by the initial purchasers to third parties in the second quarter of 2015.
Unsecured Notes Registration
In connection with the issuance of the Unsecured Notes, the Company entered into a registration rights agreement pursuant to which the Company agreed, for the benefit of the initial holders of the Unsecured Notes, to file with the SEC, and use its commercially reasonable efforts to cause to become effective, a registration statement relating to an offer to exchange the Unsecured Notes for an issue of SEC-registered notes with terms identical to the Unsecured Notes. On October 23, 2015, we filed a registration statement on Form S-4 with the SEC in accordance with the registration rights agreement outlining our offer to exchange the Unsecured Notes for substantially identical notes without transfer restrictions. The registration statement was declared effective on November 3, 2015, and the exchange offer for the Unsecured Notes was completed on December 4, 2015 with 100% percent participation.
43
Other Trends and Developments
Our strategic planning and forecasting processes include the consideration of economic and industry wide trends that may impact our Games and Payments businesses. We have identified the more material positive and negative trends affecting our business as the following:
|
|
|
|
|
|
|
|
|
|
|
|
|
|
|
|
|
|
Factors Affecting Comparability
Our consolidated financial statements included in this report that present our financial condition and results of operations reflect the following transactions and events:
|
|
|
|
44
|
|
|
|
|
|
|
|
|
|
|
|
|
|
As a result of the above transactions and events, the results of operations and earnings per share in the periods covered by the consolidated financial statementsour Financial Statements may not be directly comparable.
Operating Segments
Operating segments are components
Since the most recent filing of our Annual Report on Form 10-K for the year ended December 31, 2014, and in connection with the Merger, our chief operating decision-making group has determined the followingexpected to be within a range of approximately 1% to 2% of total assets. We elected the operating segments for which we conduct business: (a) Games, and (b) Payments. Therefore, beginningpractical expedients offered in the first quarter of 2015, we are reportingguidance, including the transition package.
|
|
|
|
Corporate overhead expenses have been allocated to the segments either through specific identification or based on a reasonable methodology. In addition, we allocate depreciation and amortization expenses to the business segments.
Our business is predominantly domestic, with no specific regional concentrations and no significant assets in foreign locations.
Results of Operations
2017
|
|
|
|
|
|
|
|
|
|
|
|
|
|
|
|
| December 31, |
| December 31, |
| December 31, |
| |||||||||
| 2015 |
| 2014 |
| 2015 Vs 2014 |
| |||||||||
| $ |
| % |
| $ |
| % |
| $ Variance |
| % Variance |
| |||
Revenues |
|
|
|
|
|
|
|
|
|
|
|
|
|
|
|
Games | $ | 214,424 |
| 26 | % | $ | 7,406 |
| 1 | % | $ | 207,018 |
| 2,795 | % |
Payments |
| 612,575 |
| 74 | % |
| 585,647 |
| 99 | % |
| 26,928 |
| 5 | % |
Total revenues |
| 826,999 |
| 100 | % |
| 593,053 |
| 100 | % |
| 233,946 |
| 39 | % |
Costs and expenses |
|
|
|
|
|
|
|
|
|
|
|
|
|
|
|
Games cost of revenue (exclusive of depreciation and amortization) |
| 47,017 |
| 6 | % |
| 1,753 |
| — | % |
| 45,264 |
| 2,582 | % |
Payments cost of revenue (exclusive of depreciation and amortization) |
| 463,380 |
| 56 | % |
| 438,318 |
| 74 | % |
| 25,062 |
| 6 | % |
Operating expenses |
| 101,202 |
| 12 | % |
| 95,452 |
| 16 | % |
| 5,750 |
| 6 | % |
Research and development |
| 19,098 |
| 2 | % |
| 804 |
| — | % |
| 18,294 |
| 2,275 | % |
Goodwill impairment |
| 75,008 |
| 9 | % |
| — |
| — | % |
| 75,008 |
| — | % |
Depreciation |
| 45,551 |
| 6 | % |
| 8,745 |
| 1 | % |
| 36,806 |
| 421 | % |
Amortization |
| 85,473 |
| 10 | % |
| 14,199 |
| 3 | % |
| 71,274 |
| 502 | % |
Total costs and expenses |
| 836,729 |
| 101 | % |
| 559,271 |
| 94 | % |
| 277,458 |
| 50 | % |
Operating (loss) income |
| (9,730) |
| (1) | % |
| 33,782 |
| 6 | % |
| (43,512) |
| (129) | % |
Other expenses |
|
|
|
|
|
|
|
|
|
|
|
|
|
|
|
Interest expense, net of interest income |
| 100,290 |
| 12 | % |
| 10,756 |
| 2 | % |
| 89,534 |
| 832 | % |
Loss on extinguishment of debt |
| 13,063 |
| 2 | % |
| 2,725 |
| — | % |
| 10,338 |
| 379 | % |
Total other expenses |
| 113,353 |
| 14 | % |
| 13,481 |
| 2 | % |
| 99,872 |
| 741 | % |
(Loss) income from operations before tax |
| (123,083) |
| (15) | % |
| 20,301 |
| 4 | % |
| (143,384) |
| (706) | % |
Income tax (benefit) provision |
| (18,111) |
| (2) | % |
| 8,161 |
| 2 | % |
| (26,272) |
| (322) | % |
Net (loss) income | $ | (104,972) |
| (13) | % | $ | 12,140 |
| 2 | % | $ | (117,112) |
| (965) | % |
| Year Ended | 2018 As Reported vs | |||||||||||||||||||||||||||||||
| December 31, 2018 | December 31, 2017 | 2017 As Adjusted | ||||||||||||||||||||||||||||||
| $ | % | $ | % | $ | $ | % | $ | % | ||||||||||||||||||||||||
| As Reported | As Reported | Adjustments | As Adjusted | |||||||||||||||||||||||||||||
| Revenues | ||||||||||||||||||||||||||||||||
| Games revenues | ||||||||||||||||||||||||||||||||
| Gaming operations | $ | 168,146 | 36 | % | $ | 148,654 | 15 | % | $ | (565 | ) | $ | 148,089 | 36 | % | $ | 20,057 | 14 | % | |||||||||||||
| Gaming equipment and systems | 87,038 | 18 | % | 70,118 | 7 | % | — | 70,118 | 17 | % | 16,920 | 24 | % | |||||||||||||||||||
| Gaming other | 3,794 | 1 | % | 4,005 | 1 | % | — | 4,005 | 1 | % | (211 | ) | (5 | )% | ||||||||||||||||||
| Games total revenues | 258,978 | 55 | % | 222,777 | 23 | % | (565 | ) | 222,212 | 54 | % | 36,766 | 17 | % | ||||||||||||||||||
| FinTech revenues | ||||||||||||||||||||||||||||||||
| Cash access services | 156,806 | 34 | % | 707,222 | 73 | % | (563,637 | ) | 143,585 | 35 | % | 13,221 | 9 | % | ||||||||||||||||||
| Equipment | 20,977 | 4 | % | 13,258 | 1 | % | — | 13,258 | 3 | % | 7,719 | 58 | % | |||||||||||||||||||
| Information services and other | 32,754 | 7 | % | 31,691 | 3 | % | — | 31,691 | 8 | % | 1,063 | 3 | % | |||||||||||||||||||
| FinTech total revenues | 210,537 | 45 | % | 752,171 | 77 | % | (563,637 | ) | 188,534 | 46 | % | 22,003 | 12 | % | ||||||||||||||||||
| Total revenues | 469,515 | 100 | % | 974,948 | 100 | % | (564,202 | ) | 410,746 | 100 | % | 58,769 | 14 | % | ||||||||||||||||||
| Costs and expenses | ||||||||||||||||||||||||||||||||
Games cost of revenues(1) | ||||||||||||||||||||||||||||||||
| Gaming operations | 17,603 | 4 | % | 15,741 | 2 | % | (565 | ) | 15,176 | 4 | % | 2,427 | 16 | % | ||||||||||||||||||
| Gaming equipment and systems | 47,121 | 9 | % | 35,707 | 3 | % | — | 35,707 | 8 | % | 11,414 | 32 | % | |||||||||||||||||||
| Gaming other | 3,285 | 1 | % | 3,247 | 1 | % | — | 3,247 | 1 | % | 38 | 1 | % | |||||||||||||||||||
| Games total cost of revenues | 68,009 | 14 | % | 54,695 | 6 | % | (565 | ) | 54,130 | 13 | % | 13,879 | 26 | % | ||||||||||||||||||
FinTech cost of revenues(1) | ||||||||||||||||||||||||||||||||
| Cash access services | 9,717 | 2 | % | 572,880 | 59 | % | (563,637 | ) | 9,243 | 2 | % | 474 | 5 | % | ||||||||||||||||||
| Equipment | 12,601 | 3 | % | 7,717 | 1 | % | — | 7,717 | 2 | % | 4,884 | 63 | % | |||||||||||||||||||
| Information services and other | 4,110 | 1 | % | 3,253 | — | % | — | 3,253 | 1 | % | 857 | 26 | % | |||||||||||||||||||
| FinTech total cost of revenues | 26,428 | 6 | % | 583,850 | 60 | % | (563,637 | ) | 20,213 | 5 | % | 6,215 | 31 | % | ||||||||||||||||||
| Operating expenses | 142,298 | 30 | % | 118,935 | 12 | % | — | 118,935 | 29 | % | 23,363 | 20 | % | |||||||||||||||||||
| Research and development | 20,497 | 4 | % | 18,862 | 2 | % | — | 18,862 | 5 | % | 1,635 | 9 | % | |||||||||||||||||||
| Depreciation | 61,225 | 14 | % | 47,282 | 5 | % | — | 47,282 | 11 | % | 13,943 | 29 | % | |||||||||||||||||||
| Amortization | 65,245 | 14 | % | 69,505 | 7 | % | — | 69,505 | 17 | % | (4,260 | ) | (6 | )% | ||||||||||||||||||
| Total costs and expenses | 383,702 | 82 | % | 893,129 | 92 | % | (564,202 | ) | 328,927 | 80 | % | 54,775 | 17 | % | ||||||||||||||||||
| Operating income | 85,813 | 18 | % | 81,819 | 8 | % | — | 81,819 | 20 | % | 3,994 | 5 | % | |||||||||||||||||||
46
| Year Ended | 2018 As Reported vs | ||||||||||||||||||||||||||||||
| December 31, 2018 | December 31, 2017 | 2017 As Adjusted | |||||||||||||||||||||||||||||
| $ | % | $ | % | $ | $ | % | $ | % | |||||||||||||||||||||||
| As Reported | As Reported | Adjustments | As Adjusted | ||||||||||||||||||||||||||||
| Other expenses | |||||||||||||||||||||||||||||||
| Interest expense, net of interest income | 83,001 | 18 | % | 102,136 | 11 | % | — | 102,136 | 24 | % | (19,135 | ) | (19 | )% | |||||||||||||||||
| Loss on extinguishment of debt | 166 | — | % | 51,750 | 5 | % | — | 51,750 | 13 | % | (51,584 | ) | (100 | )% | |||||||||||||||||
| Total other expenses | 83,167 | 18 | % | 153,886 | 16 | % | — | 153,886 | 37 | % | (70,719 | ) | (46 | )% | |||||||||||||||||
| Income (loss) before income tax | 2,646 | 1 | % | (72,067 | ) | (7 | )% | — | (72,067 | ) | (18 | )% | 74,713 | (104 | )% | ||||||||||||||||
| Income tax (benefit) provision | (9,710 | ) | (2 | )% | (20,164 | ) | (2 | )% | — | (20,164 | ) | (5 | )% | 10,454 | (52 | )% | |||||||||||||||
| Net income (loss) | $ | 12,356 | 3 | % | $ | (51,903 | ) | (5 | )% | — | $ | (51,903 | ) | (13 | )% | $ | 64,259 | 124 | % | ||||||||||||
Total Revenues
net versus gross retrospective impact of ASC 606. This was primarily due to higher Games and FinTech revenues.
Payments revenues increased by $26.9 million, or 5%17%, to $612.6$259.0 million for the year ended December 31, 2015,2018, as compared to the prior year period as adjusted for the net versus gross retrospective impact of ASC 606. This was primarily due to an increase in both unit sales and average selling prices and an increase in the average daily win per unit on a higher installed base of leased machines.
Coststo inventory disposals and Expenses
Games cost of revenues (exclusive of depreciationleased assets impairment charges.
Payments cost of revenues (exclusive of depreciation and amortization)segment.
Operating expenses increasedour Games segment.
Research and development costs increased by $18.3 million, or 2,275%,assets being fully amortized related to $19.1 million for the year ended December 31, 2015, as compared to the prior year. The increase in research and development is associated with the acquired Games business.
Goodwill impairment was $75.0 million for the year ended December 31, 2015. This non-cash charge was a result of our October 1, 2015 annual goodwill assessment and attributable toboth our Games reporting unit.
Depreciation increased by $36.8 million, or 421%, to $45.6 million for the year ended December 31, 2015, as compared to the prior year. This was primarily related to tangible assets from the acquired Games business. In connection with our fourth quarter 2015 annual impairment review, we concluded that certain of our gaming fixed assets either: (a) had economic lives that were no longer supportable and such lives were shortened, which resulted in an accelerated depreciation charge of approximately $2.6 million in the current period; or (b) were fully impaired, which resulted in an accelerated depreciation charge of approximately $1.0 million in the current period.
Amortization increased by $71.3 million, or 502%, to $85.5 million for the year ended December 31, 2015, as compared to the prior year. This was primarily related to the definite-lived intangible assets from the acquired Games business.
FinTech segments.
Interest expense,carrying value of our deferred tax liabilities as a result of the enactment of the 2017 Tax Act, offset by an increase in the valuation allowance for deferred tax assets.
Lossprior period results on extinguishmenta net basis of debtpresentation (amounts in thousands)*:
| Year Ended | 2017 As Adjusted vs | |||||||||||||||||||||||||||||||||||||||||
| December 31, 2017 | December 31, 2016 | 2016 As Adjusted | ||||||||||||||||||||||||||||||||||||||||
| $ | % | $ | $ | % | $ | % | $ | $ | % | $ | % | |||||||||||||||||||||||||||||||
| As Reported | Adjustments | As Adjusted | As Reported | Adjustments | As Adjusted | |||||||||||||||||||||||||||||||||||||
| Revenues | ||||||||||||||||||||||||||||||||||||||||||
| Games revenues | ||||||||||||||||||||||||||||||||||||||||||
| Gaming operations | $ | 148,654 | 15 | % | $ | (565 | ) | $ | 148,089 | 36 | % | $ | 152,514 | 18 | % | — | $ | 152,514 | 40 | % | $ | (4,425 | ) | (3 | )% | |||||||||||||||||
| Gaming equipment and systems | 70,118 | 7 | % | — | 70,118 | 17 | % | 56,277 | 6 | % | — | 56,277 | 15 | % | 13,841 | 25 | % | |||||||||||||||||||||||||
| Gaming other | 4,005 | 1 | % | — | 4,005 | 1 | % | 4,462 | 1 | % | — | 4,462 | 1 | % | (457 | ) | (10 | )% | ||||||||||||||||||||||||
| Games total revenues | 222,777 | 23 | % | (565 | ) | 222,212 | 54 | % | 213,253 | 25 | % | — | 213,253 | 56 | % | 8,959 | 4 | % | ||||||||||||||||||||||||
| FinTech revenues | ||||||||||||||||||||||||||||||||||||||||||
| Cash access services | 707,222 | 73 | % | (563,637 | ) | 143,585 | 35 | % | 601,874 | 70 | % | (476,380 | ) | 125,494 | 32 | % | 18,091 | 14 | % | |||||||||||||||||||||||
| Equipment | 13,258 | 1 | % | — | 13,258 | 3 | % | 14,995 | 2 | % | — | 14,995 | 4 | % | (1,737 | ) | (12 | )% | ||||||||||||||||||||||||
| Information services and other | 31,691 | 3 | % | — | 31,691 | 8 | % | 29,334 | 3 | % | — | 29,334 | 8 | % | 2,357 | 8 | % | |||||||||||||||||||||||||
| FinTech total revenues | 752,171 | 77 | % | (563,637 | ) | 188,534 | 46 | % | 646,203 | 75 | % | (476,380 | ) | 169,823 | 44 | % | 18,711 | 11 | % | |||||||||||||||||||||||
| Total revenues | 974,948 | 100 | % | (564,202 | ) | 410,746 | 100 | % | 859,456 | 100 | % | (476,380 | ) | 383,076 | 100 | % | 27,670 | 7 | % | |||||||||||||||||||||||
| Costs and expenses | ||||||||||||||||||||||||||||||||||||||||||
Games cost of revenues(1) | ||||||||||||||||||||||||||||||||||||||||||
| Gaming operations | 15,741 | 2 | % | (565 | ) | 15,176 | 4 | % | 15,265 | 2 | % | — | 15,265 | 4 | % | (89 | ) | (1 | )% | |||||||||||||||||||||||
| Gaming equipment and systems | 35,707 | 4 | % | — | 35,707 | 8 | % | 31,602 | 4 | % | — | 31,602 | 8 | % | 4,105 | 13 | % | |||||||||||||||||||||||||
| Gaming other | 3,247 | — | % | — | 3,247 | 1 | % | 3,441 | — | % | — | 3,441 | 1 | % | (194 | ) | (6 | )% | ||||||||||||||||||||||||
| Games total cost of revenues | 54,695 | 6 | % | (565 | ) | 54,130 | 13 | % | 50,308 | 6 | % | — | 50,308 | 13 | % | 3,822 | 8 | % | ||||||||||||||||||||||||
FinTech cost of revenues(1) | ||||||||||||||||||||||||||||||||||||||||||
| Cash access services | 572,880 | 59 | % | (563,637 | ) | 9,243 | 2 | % | 485,061 | 57 | % | (476,380 | ) | 8,681 | 2 | % | 562 | 6 | % | |||||||||||||||||||||||
| Equipment | 7,717 | 1 | % | — | 7,717 | 2 | % | 9,889 | 1 | % | — | 9,889 | 3 | % | (2,172 | ) | (22 | )% | ||||||||||||||||||||||||
| Information services and other | 3,253 | — | % | — | 3,253 | 1 | % | 3,756 | — | % | — | 3,756 | 1 | % | (503 | ) | (13 | )% | ||||||||||||||||||||||||
| FinTech total cost of revenues | 583,850 | 60 | % | (563,637 | ) | 20,213 | 5 | % | 498,706 | 58 | % | (476,380 | ) | 22,326 | 6 | % | (2,113 | ) | (9 | )% | ||||||||||||||||||||||
| Operating expenses | 118,935 | 12 | % | — | 118,935 | 28 | % | 118,709 | 14 | % | — | 118,709 | 31 | % | 226 | — | % | |||||||||||||||||||||||||
| Research and development | 18,862 | 2 | % | — | 18,862 | 5 | % | 19,356 | 2 | % | — | 19,356 | 5 | % | (494 | ) | (3 | )% | ||||||||||||||||||||||||
| Goodwill impairment | — | — | % | — | — | — | % | 146,299 | 17 | % | — | 146,299 | 38 | % | (146,299 | ) | (100 | )% | ||||||||||||||||||||||||
| Depreciation | 47,282 | 5 | % | — | 47,282 | 12 | % | 49,995 | 6 | % | — | 49,995 | 13 | % | (2,713 | ) | (5 | )% | ||||||||||||||||||||||||
| Amortization | 69,505 | 7 | % | — | 69,505 | 17 | % | 94,638 | 11 | % | — | 94,638 | 25 | % | (25,133 | ) | (27 | )% | ||||||||||||||||||||||||
| Total costs and expenses | 893,129 | 92 | % | (564,202 | ) | 328,927 | 80 | % | 978,011 | 114 | % | (476,380 | ) | 501,631 | 131 | % | (172,704 | ) | (34 | )% | ||||||||||||||||||||||
| Operating income | 81,819 | 8 | % | — | 81,819 | 20 | % | (118,555 | ) | (14 | )% | — | (118,555 | ) | (31 | )% | 200,374 | (169 | )% | |||||||||||||||||||||||
| Year Ended | 2017 As Adjusted vs | ||||||||||||||||||||||||||||||||||||||||
| December 31, 2017 | December 31, 2016 | 2016 As Adjusted | |||||||||||||||||||||||||||||||||||||||
| $ | % | $ | $ | % | $ | % | $ | $ | % | $ | % | ||||||||||||||||||||||||||||||
| As Reported | Adjustments | As Adjusted | As Reported | Adjustments | As Adjusted | ||||||||||||||||||||||||||||||||||||
| Other expenses | |||||||||||||||||||||||||||||||||||||||||
| Interest expense, net of interest income | 102,136 | 10 | % | — | 102,136 | 25 | % | 99,228 | 12 | % | — | 99,228 | 26 | % | 2,908 | 3 | % | ||||||||||||||||||||||||
| Loss on extinguishment of debt | 51,750 | 6 | % | — | 51,750 | 12 | % | — | — | % | — | — | — | % | 51,750 | — | % | ||||||||||||||||||||||||
| Total other expenses | 153,886 | 16 | % | — | 153,886 | 37 | % | 99,228 | 12 | % | — | 99,228 | 26 | % | 54,658 | 55 | % | ||||||||||||||||||||||||
| Income (loss) before income tax | (72,067 | ) | (7 | )% | — | (72,067 | ) | (18 | )% | (217,783 | ) | (25 | )% | — | (217,783 | ) | (57 | )% | 145,716 | (67 | )% | ||||||||||||||||||||
| Income tax (benefit) provision | (20,164 | ) | (2 | )% | — | (20,164 | ) | (5 | )% | 31,696 | 4 | % | — | 31,696 | 8 | % | (51,860 | ) | (164 | )% | |||||||||||||||||||||
| Net income (loss) | $ | (51,903 | ) | (5 | )% | — | $ | (51,903 | ) | (13 | )% | $ | (249,479 | ) | (29 | )% | — | $ | (249,479 | ) | (65 | )% | $ | 197,576 | (79 | )% | |||||||||||||||
47
Notes in the current year compared to extinguishment of unamortized deferred loan fees associated with the Prior Credit Facilities that were paid in full in connection with the Merger in the prior year.
Income tax expense decreasedGames revenues increased by $26.3$9.0 million, or 322%4%, to a benefit of $18.1$222.2 million for the year ended December 31, 2015,2017, as compared to the prior year period as adjusted for the net versus gross retrospective impact of ASC 606. This was primarily due to an increase in units sold, partially offset by lower daily win per unit on leased games.
Year ended December 31, 2014 compared to year ended December 31, 2013
The following table presents our consolidated results of operations (in thousands)*:
|
|
|
|
|
|
|
|
|
|
|
|
|
|
|
|
| December 31, |
| December 31, |
| December 31, |
| |||||||||
| 2014 |
| 2013 |
| 2014 Vs 2013 |
| |||||||||
| $ |
| % |
| $ |
| % |
| $ Variance |
| % Variance |
| |||
Revenues |
|
|
|
|
|
|
|
|
|
|
|
|
|
|
|
Games | $ | 7,406 |
| 1 | % | $ | — |
| — | % | $ | 7,406 |
| — | % |
Payments |
| 585,647 |
| 99 | % |
| 582,444 |
| 100 | % |
| 3,203 |
| 1 | % |
Total revenues |
| 593,053 |
| 100 | % |
| 582,444 |
| 100 | % |
| 10,609 |
| 2 | % |
Costs and expenses |
|
|
|
|
|
|
|
|
|
|
|
|
|
|
|
Cost of revenues (exclusive of depreciation and amortization) |
| 440,071 |
| 74 | % |
| 439,794 |
| 76 | % |
| 277 |
| — |
|
Operating expenses |
| 95,452 |
| 16 | % |
| 76,562 |
| 13 | % |
| 18,890 |
| 25 | % |
Research and development |
| 804 |
| — | % |
| — |
| — | % |
| 804 |
| — | % |
Depreciation |
| 8,745 |
| 1 | % |
| 7,350 |
| 1 | % |
| 1,395 |
| 19 | % |
Amortization |
| 14,199 |
| 3 | % |
| 9,588 |
| 2 | % |
| 4,611 |
| 48 | % |
Total costs and expenses |
| 559,271 |
| 94 | % |
| 533,294 |
| 92 | % |
| 25,977 |
| 5 | % |
Operating income |
| 33,782 |
| 6 | % |
| 49,150 |
| 8 | % |
| (15,368) |
| (31) | % |
Other expenses |
|
|
|
|
|
|
|
|
|
|
|
|
|
|
|
Interest expense, net of interest income |
| 10,756 |
| 2 | % |
| 10,265 |
| 2 | % |
| 491 |
| 5 | % |
Loss on extinguishment of debt |
| 2,725 |
| — | % |
| — |
| — | % |
| 2,725 |
| — | % |
Total other expenses |
| 13,481 |
| 2 | % |
| 10,265 |
| 2 | % |
| 3,216 |
| 31 | % |
Income from operations before tax |
| 20,301 |
| 4 | % |
| 38,885 |
| 6 | % |
| (18,584) |
| (48) | % |
Income tax provision |
| 8,161 |
| 2 | % |
| 14,487 |
| 2 | % |
| (6,326) |
| (44) | % |
Net income | $ | 12,140 |
| 2 | % | $ | 24,398 |
| 4 | % | $ | (12,258) |
| (50) | % |
*Rounding may cause variances.
Total Revenues
Total revenues increased by $10.6 million, or 2%, to $593.1 million for the year ended December 31, 2014, as compared to the prior year. This was primarily due to the revenues generated as a result of the Merger as well as, within our Payments segment, higher Cash Advance and Other revenues, partially offset by lower ATM and Check Services revenues.
Payments revenues increased by $3.2 million, or 1%, to $585.6 million for the year ended December 31, 2014, as compared to the prior year. This was due to due to higher international and domestic cash advance revenues; combined with a greater
dollar volume processed per transaction, and as a result of our compliance, audit, and data services offerings, partially offset by lost business and lower transaction volume from ATM cash withdrawals and check services transactions.
Games revenues of $7.4 million were generated as a result of the Merger.
Costs and Expenses
Cost of revenues (exclusive of depreciation and amortization) increased by $0.3 million, to $440.1 million for the year ended December 31, 2014, as compared to the prior year. This was primarily due to increased warranty expenses in our check services operations as well as the variable costs related to higher revenues in the Games and Payments segments, offset by a reduction in costs in the ATM cash withdrawal operations due to lost business and lower transaction volume.
Operating expenses increased by $18.9 million, or 25%, to $95.5 million for the year ended December 31, 2014, as compared to the prior year. This was primarily due to the acquisition-related costs and operating expenses incurred following the consummation of the Merger, an asset impairment charge and increases in non-cash stock compensation expense.
Depreciation increased by $1.4 million, or 19%, to $8.7 million for the year ended December 31, 2014, as compared to the prior year. This was primarily due to depreciation expense post-Merger.
Amortization increased by $4.6 million, or 48%, to $14.2 million for the year ended December 31, 2014, as compared to the prior year. This was primarily due to other intangible assets associated with the NEWave acquisition and the Merger.
Primarily as a result of the factors described above, operating income decreased by $15.4 million, or 31%, to $33.8 million for the year ended December 31, 2014, as compared to the prior year. Operating margin decreased to 6% for the year ended December 31, 2014 from 8% for the prior year. Exclusive of acquisition-related costs and asset impairment charges, the operating margin for 2014 would have been 8%.
Interest expense, net of interest income, increased by $0.5 million, or 5%, to $10.8 million for the year ended December 31, 2014, as compared to the prior year. This was primarily due to a $3.4 million increase in interest charges and amortization of debt issuance costs associated with the Merger; partially offset by a $2.1 million reduction in interest charges due to the lower outstanding debt balance and lower weighted average interest rate on the Prior Credit Facilities in 2014 that were paid in full in connection with the Merger and $0.8 million increase in interest income primarily related to the refund of a goods and services tax due to a favorable ruling from the Canadian Court of Appeals holding that commissions paid to Canadian casinos were not subject to such tax.
Loss on early extinguishment of debt was $2.7 million for the year ended December 31, 2014. This was due to the extinguishment of unamortized deferred loan fees associated with the Prior Credit Facilities that were paid in full in connection with the Merger.
Income tax expense decreased by $6.3 million, or 44%, to $8.2 million for the year ended December 31, 2014, as compared to the prior year. This was primarily due to the decrease in income from operations before income tax expense of $18.6 million. The provision for income tax reflected an effective income tax rate of 40.2% for the year ended December 31, 2014, which was greater than the statutory federal rate of 35.0% due primarily to non-deductible acquisition related costs associated with the Merger and partially offset by the lower tax rate on foreign earnings. The provision for income tax reflected an effective income tax rate of 37.3% for the prior year, which was greater than the statutory federal rate of 35.0% due in part to state taxes and the non-cash compensation expenses related to stock options.
Primarily as a result of the foregoing, net income decreased by $12.3 million, or 50%, to $12.1 million for the year ended December 31, 2014, as compared to the prior year.
49
Games Revenues and Participation Units
The following table includes the revenues from our Games segment and the related participation units (amounts in thousands):
|
|
|
|
|
|
|
|
|
|
| For the year ended December 31, |
| |||||
|
| 2015 |
| |||||
|
|
|
|
|
|
| % of Total Games |
|
|
| Total EGMs |
| Revenue |
| Revenue |
| |
Games revenues and participation units |
|
|
|
|
|
|
|
|
Contractual agreement |
| 5,528 |
| $ | 42,230 |
| 20 | % |
Participation revenue |
| 7,812 |
|
| 96,777 |
| 45 | % |
Sales |
| — |
|
| 51,142 |
| 24 | % |
NY Lottery |
| — |
|
| 17,510 |
| 8 | % |
Other |
| — |
|
| 6,765 |
| 3 | % |
Total |
| 13,340 |
| $ | 214,424 |
| 100 | % |
As the Merger occurred on December 19, 2014, Games revenue for the year ended December 31, 2014 was not material to our financial statements and there was no Games revenue for the year ended December 31, 2013. No comparative financial information was provided for years ended December 31, 2014 and 2013.
Critical Accounting Policies
Business Combinations. We apply the provisions of the ASC 805, Business Combinations in the accounting for acquisitions. It requires us to recognize separately from goodwill the assets acquired and the liabilities assumed, at their acquisition date fair values. Goodwill as of the acquisition date is measured as the excess of consideration transferred over the net of the acquisition date fair values of the assets acquired and the liabilities assumed. Significant estimates and assumptions are required to value assets acquired and liabilities assumed at the acquisition date as well as contingent
50
consideration, where applicable. These estimates are preliminary and typically include the calculation of an appropriate discount rate and projection of the cash flows associated with each acquired asset over its estimated useful life. As a result, during the measurement period, which may be up to one year from the acquisition date, we may record adjustments to the assets acquired and liabilities assumed with the corresponding offset to goodwill. In addition, deferred tax assets, deferred tax liabilities, uncertain tax positions and tax related valuation allowances assumed in connection with a business combination are initially estimated as of the acquisition date. We reevaluate these items quarterly based upon facts and circumstances that existed as of the acquisition date and any adjustments to its preliminary estimates are recorded to goodwill, in the period of identification, if identified within the measurement period. Upon the conclusion of the measurement period or final determination of the values of assets acquired or liabilities assumed, whichever comes first, any subsequent adjustments are recorded to the Consolidated Statements of (Loss) Income and Comprehensive (Loss) Income.
Acquisition‑related Costs. We recognize a liability for acquisition‑related costs when the expense is incurred. Acquisition‑related costs include, but are not limited to: financial advisory, legal and debt fees; accounting, consulting, and professional fees associated with due diligence, valuation and integration; severance; and other related costs and adjustments.
Property, Equipment and Leased Assets. We have approximately $106.3 million in net property, equipment and leased assets on our Consolidated Balance Sheets at December 31, 2015. Property, equipment and leased assets are stated at cost, less accumulated depreciation, and computed using the straight-line method over the lesser of the estimated life of the related assets, generally three to five years, or the related lease term. Player terminals and related components and equipment are included in our rental pool. The rental pool can be further delineated as “rental pool – deployed,” which consists of assets deployed at customer sites under participation arrangements, and “rental pool – undeployed,” which consists of assets held by us that are available for customer use. Rental pool – undeployed consists of both new units awaiting deployment to a customer site and previously deployed units currently back with us to be refurbished awaiting re-deployment. Routine maintenance of property, equipment and leased gaming equipment is expensed in the period incurred, while major component upgrades are capitalized and depreciated over the estimated remaining useful life of the component. Sales and retirements of depreciable property are recorded by removing the related cost and accumulated depreciation from the accounts. Gains or losses on sales and retirements of property are reflected in our Consolidated Statements of (Loss) Income and Comprehensive (Loss) Income. Property, equipment and leased assets are reviewed for impairment whenever events or circumstances indicate that their carrying amounts may not be recoverable. Impairment is indicated when undiscounted future cash flows do not exceed the asset’s carrying value.
Goodwill. We had approximately $789.8 million of goodwill on our Consolidated Balance Sheets at December 31, 20152018 resulting from acquisitions of other businesses. All of our goodwill was subject to our annual goodwill impairment testing. We test for impairment annually on a reporting unit basis, asat the beginning of October 1,our fourth fiscal quarter, or more often under certain circumstances. The annual impairment test is completed using either: a qualitative Step 0 assessment based on reviewing relevant events and circumstances; or a quantitative Step 1 assessment using an income approach that discounts future cash flows based on the estimated future results of the reporting units and a market approach that compares market multiples of comparable companies to determine whether or not any impairment exists. If the fair value of a reporting unit is less than its carrying amount, we use the Step 2 assessment to determine the impairment. Our most recent annual assessment was performed as of October 1, 2015, following which it was determined that a portion of our goodwill was impaired related to our Games reporting unit and an impairment charge in the amount of approximately $75.0 million was recorded. The annual evaluation of goodwill and other non‑amortizing intangible assets requires the use of estimates about future operating results of each reporting unit to determine their estimated fair value. Changes in forecasted operations can materially affect these estimates, which could materially affect our results of operations. Our reporting units are identified as operating segments or one level below an operating segment. Reporting units must: (a) engage in business activities from which they earn revenues and incur expenses; (b) have operating results that are regularly reviewed by our chief operating decision makers to ascertain the resources to be allocated to the segment and assess its performance; and (c) have discrete financial information available. As of December 31, 2015,we evaluate our reporting units included: Everi Games, Cash Advance, ATM, Check Services, Kiosk Sales and Service, Central Credit, and Everi Compliance. at least annually.
51
conclusion that an indication of goodwill impairment existed at the test date would not have changed had the test been conducted assuming: 1) a 100 basis point increase in the discount rate used to discount the aggregate estimated cash flows of our reporting units to their net present value in determining their estimated fair values (without any change in the aggregate estimated cash flows of our reporting units), or 2) a 100 basis point decrease in the estimated sales growth rate or terminal period growth rate without a change in the discount rate of each reporting unit.
Property, Equipment, Leased Assets, and Other Intangible Assets.Assets. We have approximately $382.5$116.3 million in net property, equipment, and leased assets and approximately $287.4 million in net unamortized other intangible assets on our Consolidated Balance Sheets at December 31, 2015. Other intangible2018. Such assets are stated at cost, less accumulated depreciation or amortization, computed primarily using the straight-line method. Our other intangible assets consist primarily of customer contracts (rights to provide Games and Payments services to gaming establishment customers) acquired through business combinations, capitalized software development costs, trade names, trademarks and the acquisition cost of our patent related to the 3‑in‑1 Rollover technology acquired in 2005, which expires in 2018. Customer contracts require us to make renewal assumptions, which impactmethod over the estimated useful lives of such assets. Capitalized software development costs require us to make certain judgments as toWe apply judgment in the stagesdetermination of development and costs eligible for capitalization. Capitalized software costs placed in service are amortized over theirthe useful lives, which are generally not to exceed five years. We reviewbased on the nature of the assets and the underlying contractual obligations for certain assets.
Determination of the amount and timing of future cash flows requires significant estimates and assumptions. If actual results differ from such estimates and assumptions, this may have a material impact on our conclusions.
Games Revenues
Games revenues are primarily generated by our gaming operations under development, placement, and participation arrangements in which we provide our customers with player terminals, player terminal‑content licenses and back‑ office equipment, collectively referred to herein as leased gaming equipment. Under these arrangements, we retain ownership of the leased gaming equipment installed at customer facilities, and we receive revenue based on a percentage of the net win per day generated by the leased gaming equipment or a fixed daily fee based on the number of player terminals installed at the facility. Revenue from lease participation or daily fee arrangements are considered both realizable and earned at the end of each gaming day.
Games revenues generated by player terminals deployed at sites under development or placement fee agreements is reduced by the accretion of contract rights acquired as part of those agreements. Contract rights are amounts allocated to intangible assets for dedicated floor space resulting from such agreements, described under “Development and Placement Fee
52
Agreements.” The related amortization expense, or accretion of contract rights, is netted against our respective revenue category in the Consolidated Statements of (Loss) Income and Comprehensive (Loss) Income.
We also generate games revenues from back‑office fees with certain customers. Back‑office fees cover the service and maintenance costs for back‑office servers installed in each gaming facility to run our gaming equipment, as well as the cost of related software updates. Back‑office fees are considered both realizable and earned at the end of each gaming day.
Payments Revenues
Cash advance revenues are comprised of transaction fees assessed to gaming patrons in connection with credit card cash access and POS debit card transactions and are recognized at the time the transactions are authorized. Such fees are based on a combination of a fixed amount plus a percentage of the face amount of the credit card cash access or POS debit card transaction amount.
ATM revenues are comprised of transaction fees in the form of cardholder surcharges assessed to gaming patrons in connection with ATM cash withdrawals at the time the transactions are authorized and reverse interchange fees paid to us by the patrons’ issuing banks. Cardholder surcharges are recognized as revenue when a transaction is initiated and reverse interchange is recognized as revenue on a monthly basis based on the total transactions occurring during the month. The cardholder surcharges assessed to gaming patrons in connection with ATM cash withdrawals are currently a fixed dollar amount and not a percentage of the transaction amount.
Check services revenues are principally comprised of check warranty revenues and are generally based upon a percentage of the face amount of checks warranted. These fees are paid to us by gaming establishments.
Other revenues include amounts derived from the sale of cash access devices, such as the provision of certain professional services, software licensing, and certain other ancillary fees associated with the sale, installation and maintenance of those devices. In addition, other revenues consist of Central Credit revenues that are based upon either a flat monthly unlimited usage fee or a variable fee structure driven by the volume of patron credit histories generated. Also included in other revenues are revenues generated from ancillary marketing, database and Internet gaming activities.
Equipment and Systems Revenues
We sell gaming equipment, fully integrated kiosks and gaming systems directly to our customers under independent sales contracts through normal credit terms, or may grant extended credit terms under contracts secured by the related equipment.
For sales arrangements with multiple deliverables, we apply the guidance from ASC 605-25, “Revenue Recognition - Multiple-Element Arrangements.” In addition, we apply the guidance from ASC 985-605, “Software – Revenue Recognition” which affects vendors that sell or lease tangible products in an arrangement that contains software that is more than incidental to the tangible product as a whole and clarifies what guidance should be used in allocating and measuring revenue.
The majority of our multiple element sales contracts are for some combination of gaming equipment, player terminals, content, system software, license fees, ancillary equipment and maintenance.
Revenue related to systems arrangements that contain both software and non‑software deliverables requires allocation of the arrangement fee to the separate deliverables using the relative selling price method. Revenue for software deliverables is recognized under software revenue recognition guidance. Revenue resulting from the sale of non‑software deliverables, such as gaming devices and other hardware, are accounted for based on other applicable revenue recognition guidance as the devices are tangible products containing both software and non‑software components that function together to deliver the product’s essential functionality.
In allocating the arrangement fees to separate deliverables, we evaluate whether we have vendor‑specific objective evidence (“VSOE”) of selling price, third party evidence (“TPE”) or estimate of selling price (“ESP”) for gaming devices, maintenance and product support fees and other revenue sources. We generally use ESP to determine the selling price used
53
in the allocation of separate deliverables, as VSOE and TPE are generally not available. We determine the ESP on separate deliverables by estimating a margin typically received on such items and applying that margin to the product cost incurred.
Generally, player terminal sales include ancillary equipment, such as networking gear, bases, chairs, and occasionally signage, some of which may be necessary for the full functionality of the player terminals in a casino. This ancillary equipment comprises an install kit that is shipped simultaneously with the player terminals. Although our products are analyzed as multiple deliverable arrangements, revenue for the player terminal and ancillary equipment is not recognized until all elements essential for the functionality of the product have been shipped or delivered. This includes game theme software and essential ancillary equipment. If elements that are not essential to the functionality of the player terminals are shipped after the unit, such as signage, chairs, or bases, these items would be classified as deferred revenue until shipped or delivered.
Stock‑Based Compensation. Stock‑based compensation expense for all awards is based on the grant date fair value estimated. We estimate the weighted‑ average fair value of options granted for our time‑based and cliff vesting time‑based options using the Black‑Scholes Option Pricing Model. We estimate the weighted‑average fair value of options granted for our market‑based options using a lattice‑based option valuation model. Each model is based on assumptions regarding expected volatility, dividend yield, risk‑free interest rates, the expected term of the option and the expected forfeiture rate. Each of these assumptions, while reasonable, requires a certain degree of judgment and the fair value estimates could vary if the actual results are materially different than those initially applied.
Recent Accounting Guidance
Recently Adopted Accounting Guidance
In November 2015, the FASB issued Accounting Standards Update (“ASU”) 2015-17 Balance Sheet Classification of Deferred Taxes, which requires that deferred tax assets and deferred tax liabilities be classified as noncurrent in the balance sheet. ASU No. 2015-17 is effective for the interim and annual periods beginning after December 15, 2016. Early adoption is permitted. During the fourth quarter of 2015, we elected to prospectively adopt this standard. The prior reporting period was not retrospectively adjusted. The adoption of this guidance had no impact on our Consolidated Statements of (Loss) Income and Comprehensive (Loss) Income.
In September 2015, the FASB issued ASU No. 2015-16, which provides guidance on business combinations. The ASU requires an acquirer recognize adjustments to estimated amounts that are identified during the measurement period in the reporting period in which the adjustment amounts are determined. The amendments require that the acquirer record, in the same period’s financial statements, the effect on earnings of changes in depreciation, amortization, or other income effects, if any, as a result of the change to the estimated amounts, calculated as if the accounting had been completed at the acquisition date. The standard is effective for annual reporting periods beginning after December 15, 2015, with early adoption permitted. We implemented this guidance during the current period as it impacted the final purchase price allocation adjustments associated with our acquisition of Multimedia Games Holdings Inc.
Recent Accounting Guidance Not Yet Adopted
In February 2016, the FASB issued ASU No. 2016-02, which provides guidance on the accounting treatment of leases. The ASU establishes a right-of-use (ROU) model that requires a lessee to record a ROU asset and a lease liability on the balance sheet for all leases with terms longer than 12 months. Leases will be classified as either financing or operating, with classification affecting the pattern of expense recognition in the income statement. The new standard is effective for fiscal years beginning after December 15, 2018, including interim periods within those fiscal years and early adoption is permitted. A modified retrospective transition approach is required for lessees for capital and operating leases existing at, or entered into after, the beginning of the earliest comparative period presented in the financial statements, with certain practical expedients available. We are currently evaluating the impact of adopting this guidance on our Consolidated Financial Statements and disclosures included within Notes to the Consolidated Financial Statements.
In July 2015, the FASB issued ASU No. 2015-11, which provides guidance on the measurement of inventory value. The amendments require an entity to measure in scope inventory at the lower of cost and net realizable value. Net realizable
54
value is the estimated selling prices in the ordinary course of business, less reasonably predictable costs of completion, disposal, and transportation. Subsequent measurement is unchanged for inventory measured using LIFO or the retail inventory method. The amendments do not apply to inventory that is measured using last-in, first-out (LIFO) or the retail inventory method. The amendments apply to all other inventory, which includes inventory that is measured using first-in, first-out (FIFO) or average cost. The pronouncement is effective for annual periods beginning after December 15, 2016, and interim periods within those fiscal years, and early adoption is permitted. We are currently evaluating the impact of adopting this guidance on our Consolidated Financial Statements and disclosures included within Notes to the Consolidated Financial Statements.
In April 2015, the FASB issued ASU No. 2015-03, which provides guidance to simplify the presentation of debt issuance costs. These amendments require that debt issuance costs related to a recognized debt liability be presented in the balance sheet as a direct deduction from the carrying amount of that debt liability, consistent with debt discounts. The recognition and measurement guidance for debt issuance costs are not affected by the amendments in this ASU. The pronouncement is effective for annual periods beginning after December 15, 2015, and interim periods within those fiscal years, and early adoption is permitted for financial statements that have not been previously issued. This guidance was further clarified in ASU No. 2015-15 which addressed the treatment of debt issuance costs related to line-of credit arrangements. It noted that as ASU No. 2015-03 did not provide guidance on debt issuance costs related to line-of credit arrangements, the SEC would not object to an entity deferring and presenting these specific debt issuance costs as an asset and subsequently amortizing the deferred debt issuance costs ratably over the term of the line-of-credit arrangement, regardless of whether there are any outstanding borrowings on the line-of-credit arrangement. We expect to adopt the guidance in ASU No. 2015-03 and 2015-15 to reclassify all debt issuance costs not associated with line-of-credit arrangements from other assets, non-current to contra-liabilities to long-term debt on our Consolidated Balance Sheets and related notes for the year ending December 31, 2016.
In January 2015, the FASB issued ASU No. 2015-01, which eliminates the requirement that an entity separately classify, present and disclose extraordinary events and transactions. The pronouncement is effective for annual periods ending after December 15, 2015. A reporting entity also may apply the amendments retrospectively to all prior periods presented in the financial statements. Early adoption is permitted provided that the guidance is applied from the beginning of the fiscal year of adoption. We expect to implement this guidance for the year ended December 31, 2016 and do not anticipate the ASU to have a material impact on our results of operations or financial condition.
In August 2014, the FASB issued ASU No. 2014-15, which provides guidance on determining when and how reporting entities must disclose going-concern uncertainties in their financial statements. The pronouncement is effective for annual periods ending after December 15, 2016, and interim periods thereafter, and early adoption is permitted. We are currently evaluating the impact of adopting this guidance on our Consolidated Financial Statements and disclosures included within Notes to the Consolidated Financial Statements.
In June 2014, the FASB issued ASU No. 2014-12, which requires that a performance target that affects vesting and that could be achieved after the requisite service period be treated as a performance condition. As such, the performance target should not be reflected in estimating the grant-date fair value of the award. The standard is effective for annual reporting periods beginning after December 15, 2015, with early adoption permitted. We expect to implement this guidance for the year ended December 31, 2016 and do not anticipate the ASU to have a material impact on our results of operations or financial condition.
55
In May 2014, the FASB issued ASU No. 2014-09, which created ASC Topic 606, “Revenue from Contracts with Customers” and supersedes ASC Topic 605, “Revenue Recognition”. The guidance replaces industry-specific guidance and establishes a single five-step model to identify and recognize revenue. The core principle of the guidance is that an entity should recognize revenue upon transfer oftransferring control of promised goods or services to our customers in an amount that reflects the consideration we expect to which an entity expects to be entitledreceive in exchange for those goods or services. Additionally, the guidance requires the entity to disclose further quantitative and qualitative information regarding the nature and amount of revenues arising fromWe enter into contracts with customers as well as other information aboutthat include various performance obligations consisting of goods, services, or combinations of goods and services. Timing of the transfer of control varies based on the nature of the contract.
elsewhere in this Annual Report on Form 10-K.
|
|
|
|
|
|
|
|
|
| At December 31, |
| ||||
|
| 2015 |
| 2014 |
| ||
Balance sheet data |
|
|
|
|
|
|
|
Total assets |
| $ | 1,574,065 |
| $ | 1,707,285 |
|
Total borrowings |
|
| 1,163,579 |
|
| 1,188,787 |
|
Stockholders’ equity |
|
| 137,420 |
|
| 231,473 |
|
|
|
|
|
|
|
|
|
Net available cash* |
|
|
|
|
|
|
|
Cash and cash equivalents |
|
| 102,030 |
|
| 89,095 |
|
Add: Settlement receivables |
|
| 44,933 |
|
| 43,288 |
|
Less: Settlement liabilities |
|
| (139,819) |
|
| (119,157) |
|
Total net available cash |
| $ | 7,144 |
| $ | 13,226 |
|
| At December 31, | ||||||||
| 2018 | 2017 | |||||||
| Balance sheet data | ||||||||
| Total assets | $ | 1,548,261 | $ | 1,537,074 | ||||
| Total borrowings | 1,163,216 | 1,167,843 | ||||||
| Total stockholders’ deficit | (108,895 | ) | (140,633 | ) | ||||
| Cash available | ||||||||
| Cash and cash equivalents | $ | 297,532 | $ | 128,586 | ||||
| Settlement receivables | 82,359 | 227,403 | ||||||
| Settlement liabilities | (334,198 | ) | (317,744 | ) | ||||
Net cash position(1) | 45,693 | 38,245 | ||||||
| Undrawn revolving credit facility | 35,000 | 35,000 | ||||||
Net cash available(1) | $ | 80,693 | $ | 73,245 | ||||
*Non‑GAAP measure
| (1) | Non‑GAAP measure. In order to enhance investor understanding of our cash balance, we are providing in this Annual Report on Form 10-K net cash position and net cash available, which are not measures of our financial performance or position under GAAP. Accordingly, these measures should not be considered in isolation or as a substitute for, and should be read in conjunction with, our cash and cash equivalents prepared in accordance with GAAP. We define (i) net cash position as cash and cash equivalents plus settlement receivables less settlement liabilities and (ii) net cash available as net cash position plus undrawn amounts available under our New Revolving Credit Facility (defined herein). We present net cash position because our cash position, as measured by cash and cash equivalents, depends upon changes in settlement receivables and the timing of payments related to settlement liabilities. As such, our cash and cash equivalents can change substantially based upon the timing of our receipt of payments for settlement receivables and payments we make to customers for our settlement liabilities. We present net cash available as management monitors this amount in connection with its forecasting of cash flows and future cash requirements, both on short term and long term basis. |
We provide cash settlement services to our customers. These services involve the movement ofif we repatriate foreign funds between the various parties associated with cash access transactions. These activities result in a balance due to us at the end of each business day that we recoup over the next few business days and classify as settlement receivables. These activities also result in a balance due to our customers at the end of each business day that we remit over the next few business days and classify as settlement liabilities. As of December 31, 2015, we had $44.9 million in settlement receivables for which we received payment in January 2016. As of December 31, 2015, we had $139.8 million in settlement liabilities due to our customers for these settlement services that were paid in January 2016. As the timing of cash received from settlement receivables
56
and payment of settlement liabilities may differ, the total amount of cash held by us will fluctuate throughout the year. As of December 31, 2015 and 2014, the net cash available after considering settlement amounts was $7.1 million and $13.2 million, respectively.
Cash Flows
The following table summarizes our cash flows for the years ended December 31, 2015, 2014 and 2013 (in thousands):
|
|
|
|
|
|
|
|
|
|
|
|
|
|
|
|
|
|
| Year Ended December 31, |
| Increase/(Decrease) |
| |||||||||||
|
| 2015 |
| 2014 |
| 2013 |
| 2015 Vs 2014 |
| 2014 Vs 2013 |
| |||||
Cash flow activities |
|
|
|
|
|
|
|
|
|
|
|
|
|
|
|
|
Net cash provided by operating activities |
| $ | 124,587 |
| $ | 24,531 |
| $ | 4,334 |
| $ | 100,056 |
| $ | 20,197 |
|
Net cash used in investing activities |
|
| (85,549) |
|
| (1,085,847) |
|
| (13,990) |
|
| 1,000,298 |
|
| (1,071,857) |
|
Net cash (used in)/provided by financing activities |
|
| (24,551) |
|
| 1,037,423 |
|
| (29,183) |
|
| (1,061,974) |
|
| 1,066,606 |
|
Effect of exchange rates on cash |
|
| (1,552) |
|
| (1,266) |
|
| 73 |
|
| (286) |
|
| (1,339) |
|
Cash and cash equivalents |
|
|
|
|
|
|
|
|
|
|
|
|
|
|
|
|
Net increase/(decrease) for the period |
|
| 12,935 |
|
| (25,159) |
|
| (38,766) |
|
| 38,094 |
|
| 13,607 |
|
Balance, beginning of the period |
|
| 89,095 |
|
| 114,254 |
|
| 153,020 |
|
| (25,159) |
|
| (38,766) |
|
Balance, end of the period |
| $ | 102,030 |
| $ | 89,095 |
| $ | 114,254 |
| $ | 12,935 |
| $ | (25,159) |
|
Cash flows provided by operating activities were $124.6 million, $24.5 million, and $4.3 million, for the years ended December 31, 2015, 2014 and 2013, respectively. Cash flows provided by operating activities increased by $100.1 million for the year ended December 31, 2015 as compared to the prior year. This was primarily due to increased operations from the acquisition of our Games segment in December 2014. Cash flows provided by operating activities increased by $20.2 millionUnited States, except for the year ended December 31, 2014 as compared to the prior year. This was primarily due to an increase in non-cash adjustments and the timing of our settlement receivables and settlement liabilities based on the number of business days outstanding prior to the settlement of our cash access transactions at the end of each period for the year ended December 31, 2014 as compared to the prior year, partially offset by a decrease in net income
Cash flows used in investing activities were $85.5 million, $1.1 billion, and $14.0 million for the years ended December 31, 2015, 2014 and 2013, respectively. Cash flows used in investing activities decreased by $1.0 billion for the year ended December 31, 2015 as compared to the prior year. This was primarily due to the use of proceeds raised to fund the Merger in 2014, partially offset by an increase in capital expenditures in 2015. Cash flows used in investing activities increased by $1.1 billion for the year ended December 31, 2014 as compared to the prior year. This was primarily due to the use of proceeds raised to fund the Merger.
Cash flows used in financing activities were $24.6 million and $29.2 million for the years ended December 31, 2015 and 2013, respectively. Cash flows provided by financing activities were $1.0 billion for the year ended December 31, 2014. Cash flows used in financing activities increased by $1.1 billion for the year ended December 31, 2015 as compared to the prior year. This was primarily due to the Company not acquiring additional funds from debt issuances in 2015 as well as reductions in debt issuance costs incurred and treasury stock acquired for the year ended December 31, 2015. Cash flows provided by financing activities increased by $1.1 billion for the year ended December 31, 2014 as compared to the prior year. This was primarily due to the proceeds raised to fund the Merger offset by repayments on debt on the Prior Credit Facilities, debt issuance costs and purchase of treasury stock.
57
Long‑Term Debt
The following table summarizes our indebtedness at December 31, 2015 (in thousands):
|
|
|
|
|
|
|
|
|
| At December 31, |
| ||||
|
| 2015 |
| 2014 |
| ||
Long-term debt |
|
|
|
|
|
|
|
Senior secured term loan |
| $ | 490,000 |
| $ | 500,000 |
|
Senior secured notes |
|
| 335,000 |
|
| 350,000 |
|
Senior unsecured notes |
|
| 350,000 |
|
| 350,000 |
|
Total debt |
|
| 1,175,000 |
|
| 1,200,000 |
|
Less: debt issuance costs and warrant discount |
|
| (11,421) |
|
| (11,213) |
|
Total debt after discount |
|
| 1,163,579 |
|
| 1,188,787 |
|
Less: current portion of long-term debt |
|
| (10,000) |
|
| (10,000) |
|
Long-term debt, less current portion |
| $ | 1,153,579 |
| $ | 1,178,787 |
|
In connection with the Merger, we refinanced all of our indebtedness outstanding under the Prior Credit Facilities with proceeds from the Credit Facilities and the Notes.
Credit Facilities
In December 2014, Everi Payments, as borrower, and Holdings entered into a credit agreement among Everi Payments, Holdings, Bank of America, N.A., as administrative agent, collateral agent, swing line lender and letter of credit issuer; Deutsche Bank Securities Inc., as syndication agent; and Merrill Lynch, Pierce, Fenner & Smith Incorporated and Deutsche Bank Securities, Inc. as joint lead arrangers and joint book managers, which governs the Credit Facilities (the “Credit Agreement”). The Credit Facilities consist of the $500.0 million Term Loan that matures in 2020 and the $50.0 million Revolving Credit Facility that matures in 2019. The fees associated with the Credit Facilities included discounts of approximately $7.5 million and debt issuance costs of approximately $13.9 million. All borrowings under the Credit Facilities are subject to the satisfaction of customary conditions, including the absence of a default and compliance with representations and warranties.
We are required to repay the Term Loan in an amount equal to 0.50% per quarter of the initial aggregate principal with the final principal repayment installment on the maturity date. Interest is due in arrears each March, June, September and December and at the maturity date; however, interest may be remitted within one to three months of such dates.
The Term Loan had an applicable interest rate of 6.25% as of December 31, 2015 and December 31, 2014.
The interest rate per annum applicable to the Revolving Credit Facility is, at our option, the base rate or London Interbank Offered Rate (“LIBOR”) plus, in each case, an applicable margin. The interest rate per annum applicable to the Term Loan is also, at our option, the base rate or LIBOR plus, in each case, an applicable margin. LIBOR will be reset at the beginning of each selected interest period based on the LIBOR rate then in effect; provided that, with respect to the Revolving Credit Facility, if LIBOR is below zero, then such rate will be equal to zero plus the applicable margin, and, with respect to the Term Loan, if LIBOR is below 1.0%, then such rate will be equal to 1.0% plus the applicable margin. The base rate is a fluctuating interest rate equal to the highest of (a) the prime lending rate announced by the administrative agent, (b) the federal funds effective rate from time to time plus 0.50%, and (c) LIBOR (after taking account of any applicable floor) applicable for an interest period of one month plus 1.00%. The applicable margins of 4.75% and 5.25% for the Revolving Credit Facility and Term Loan, respectively, are subject to adjustment based on our consolidated secured leverage ratio.
Voluntary prepayments of the Term Loan and the Revolving Credit Facility and voluntary reductions in the unused commitments are permitted in whole or in part, in minimum amounts as set forth in the Credit Agreement, with prior notice but without premium or penalty.
Subject to certain exceptions, the obligations under the Credit Facilities are secured by substantially all of the present and after acquired assets of each of Everi Payments, Holdings and the subsidiary guarantors (the “Collateral”) including: (a) a
58
perfected first priority pledge of all the capital stock of Everi Payments and each domestic direct, wholly owned material restricted subsidiary held by Holdings, Everi Payments or any such subsidiary guarantor; and (b) a perfected first priority security interest in substantially all other tangible and intangible assets of Holdings, Everi Payments, and such subsidiary guarantors (including, but not limited to, accounts receivable, inventory, equipment, general intangibles, investment property, real property, intellectual property and the proceeds of the foregoing). Subject to certain exceptions, the Credit Facilities are unconditionally guaranteed by Holdings and such subsidiary guarantors and Everi Games and its material domestic subsidiaries.
The Credit Agreement contains certain covenants that, among other things, limit Holdings’ ability, and the ability of certain of its subsidiaries, to incur additional indebtedness; sell assets or consolidate or merge with or into other companies; pay dividends or repurchase or redeem capital stock; make certain investments; issue capital stock of subsidiaries; incur liens; prepay, redeem or repurchase subordinated debt; and enter into certain types of transactions with our affiliates. The Credit Agreement also requires Holdings, together with its subsidiaries, to comply with a consolidated secured leverage ratio as well as an annual excess cash flow requirement.
Events of default under the Credit Agreement include customary events such as a cross-default provision with respect to other material debt (which includes the Refinanced Secured Notes and the Unsecured Notes). In addition, an event of default will occur if Holdings undergoes a change of control. This is defined to include the case where Holdings ceases to own 100% of the equity interests of Everi Payments, or where any person or group acquires a percentage of the economic or voting interests of Holdings’ capital stock of 35% or more (determined on a fully diluted basis), or where a majority of the board of directors of Everi Payments ceases to consist of persons who are directors of Holdings on the closing date of the Credit Facilities or other directors whose nomination for election to the board of directors of Holdings was recommended by a majority of the then continuing directors.
At December 31, 2015, we had approximately $490.0 million of borrowings outstanding under the Term Loan and $50.0 million of additional borrowing availability under the Revolving Credit Facility, based upon borrowing base calculations as of such date. We were in compliance with the terms of the Credit Facilities as of December 31, 2015.
We expect that our cash provided by operating activities will be sufficient for our operating and debt servicing needs during the next 12 months.foreseeable future. If not, we have sufficient borrowings available under our New Credit Facilities to meet additional funding requirements. We monitor the financial strength of our lenders on an ongoing basis using publicly-available information. Based upon that information, we believe there is not a likelihood that any of our lenders might not be able to honor their commitments under the Credit Agreement.
Senior Secured Notes and Refinance
Infunds between various parties involved in these types of transactions. We receive reimbursement from the patron’s credit or debit card issuing financial institution for the amount owed to the gaming establishment plus the fee charged to the patron. These activities result in amounts due to us at the end of each business day that we generally recover over the next few business days, which are classified as settlement receivables on our Balance Sheets. As of December 2014,31, 2018, we issued $350.0had $82.4 million in aggregate principalsettlement receivables. In addition, cash settlement services result in amounts due to gaming establishments for the cash disbursed to patrons through the issuance of a negotiable instrument or through electronic settlement for the face amount provided to patrons that we generally remit over the next few business days, which are classified as settlement liabilities on our Balance Sheets. As of December 31, 2018, we had $334.2 million in settlement liabilities. As the timing of cash received from cash settlement services may differ, the total amount of 7.75% Secured Notes due 2021. cash held by us will fluctuate throughout the year.
| Year Ended December 31, | Increase/(Decrease) | |||||||||||||||||||
| 2018 | 2017 | 2016 | 2018 vs 2017 | 2017 vs 2016 | ||||||||||||||||
| Cash flow activities | ||||||||||||||||||||
| Net cash provided by operating activities | $ | 294,286 | $ | 96,259 | $ | 131,899 | $ | 198,027 | $ | (35,640 | ) | |||||||||
| Net cash used in investing activities | (123,350 | ) | (109,780 | ) | (88,148 | ) | (13,570 | ) | (21,632 | ) | ||||||||||
| Net cash provided by (used in) financing activities | 11 | 22,394 | (24,922 | ) | (22,383 | ) | 47,316 | |||||||||||||
| Effect of exchange rates on cash | (1,370 | ) | 1,292 | (1,714 | ) | (2,662 | ) | 3,006 | ||||||||||||
| Cash and cash equivalents | ||||||||||||||||||||
| Net increase for the period | 169,577 | 10,165 | 17,115 | 159,412 | (6,950 | ) | ||||||||||||||
| Balance, beginning of the period | 129,604 | 119,439 | 102,324 | 10,165 | 17,115 | |||||||||||||||
| Balance, end of the period | $ | 299,181 | $ | 129,604 | $ | 119,439 | $ | 169,577 | $ | 10,165 | ||||||||||
In connection with the issuance of the Refinanced Secured Notes and pursuant to the terms of the Note Purchase Agreement, the Company issued the Warrant to the Purchaser. The Warrant expires on the sixth anniversary of the date of
59
issuance. The number of shares issuable pursuant to the Warrant and the warrant exercise price are subject to adjustment for stock splits, reverse stock splits, stock dividends, mergers and certain other events. The Warrant was valued at $2.2 million using a modified Black-Scholes model and was accounted for as a debt discount.
Interest is due quarterly in arrears each January, April, July and October.
We were in compliance with the terms of the Refinanced Secured Notes as of December 31, 2015.
Senior Unsecured Notes
In December 2014, we issued $350.0 million in aggregate principal amount of 10.0%2017 Unsecured Notes due 2022. The fees associated with the Unsecured Notes included original issue discounts of approximately $3.8 millionlimit our ability to declare and pay cash dividends.
Interest is due semi-annuallyas well as interest rate risk see “Contractual Obligations” in arrears each Januarythis Item 7 below, Part II, Item 7A “Quantitative and July.
The Unsecured Notes were acquired by the initial purchasers pursuant to the terms of a purchase agreement. Under the terms of the purchase agreement, during a one-year period following the closingQualitative Disclosures About Market Risk,” and upon prior notice from the initial purchasers, the Company was required to use commercially reasonable efforts to aid the purchasers in the resale of the Unsecured Notes, including by preparing an updated offering memorandumItem 8. Financial Statements and participating in reasonable marketing efforts including road shows, to the extent required therein. The Unsecured Notes were resold by the initial purchasers to third parties in the second quarter of 2015.
In connection with the issuance of the Unsecured Notes, the Company entered into a registration rights agreement pursuant to which the Company agreed, for the benefit of the initial holders of the Unsecured Notes, to file with the SEC, and use its commercially reasonable efforts to cause to become effective, a registration statement relating to an offer to exchange the Unsecured Notes for an issue of SEC-registered notes with terms identical to the Unsecured Notes. On October 23, 2015, we filed a registration statement on Form S-4 with the SEC in accordance with the registration rights agreement outlining our offer to exchange the Unsecured Notes for identical notes without transfer restrictions. The registration statement was declared effective on November 3, 2015, and the exchange offer for the Unsecured Notes was completed on December 4, 2015 with 100% percent participation.
We were in compliance with the terms of the Unsecured Notes as of December 31, 2015.
Supplementary Data “Note 12 — Long-Term Debt.”
|
|
|
|
|
|
|
|
|
|
|
|
|
|
|
|
|
|
|
|
|
|
|
|
| At December 31, 2015 |
| |||||||||||||||||||
|
| Total |
| 2016 |
| 2017 |
| 2018 |
| 2019 |
| 2020 |
| Thereafter |
| |||||||
Contractual obligations |
|
|
|
|
|
|
|
|
|
|
|
|
|
|
|
|
|
|
|
|
|
|
Debt obligations(1) |
| $ | 1,175,000 |
| $ | 10,000 |
| $ | 10,000 |
| $ | 10,000 |
| $ | 10,000 |
| $ | 450,000 |
| $ | 685,000 |
|
Estimated interest obligations(2) |
|
| 484,675 |
|
| 90,184 |
|
| 89,465 |
|
| 88,831 |
|
| 88,198 |
|
| 86,643 |
|
| 41,354 |
|
Operating lease obligations |
|
| 26,534 |
|
| 4,410 |
|
| 4,171 |
|
| 4,064 |
|
| 4,064 |
|
| 3,925 |
|
| 5,900 |
|
Purchase obligations(3) |
|
| 56,457 |
|
| 45,364 |
|
| 4,782 |
|
| 6,311 |
|
| — |
|
| — |
|
| — |
|
Total contractual obligations |
| $ | 1,742,666 |
| $ | 149,958 |
| $ | 108,418 |
| $ | 109,206 |
| $ | 102,262 |
| $ | 540,568 |
| $ | 732,254 |
|
| At December 31, | ||||||||||||||||||||||||||||
| Total | 2019 | 2020 | 2021 | 2022 | 2023 | Thereafter | ||||||||||||||||||||||
| Contractual obligations | ||||||||||||||||||||||||||||
Debt obligations(1) | $ | 1,182,700 | $ | 8,200 | $ | 8,200 | $ | 8,200 | $ | 8,200 | $ | 8,200 | $ | 1,141,700 | ||||||||||||||
Estimated interest obligations(2) | 435,709 | 73,566 | 73,186 | 72,769 | 72,189 | 71,730 | 72,269 | |||||||||||||||||||||
Operating lease obligations(3) | 19,721 | 5,570 | 5,680 | 4,598 | 2,799 | 1,074 | — | |||||||||||||||||||||
Purchase obligations(4) | 66,463 | 56,233 | 7,887 | 1,835 | 508 | — | — | |||||||||||||||||||||
| Total contractual obligations | $ | 1,704,593 | $ | 143,569 | $ | 94,953 | $ | 87,402 | $ | 83,696 | $ | 81,004 | $ | 1,213,969 | ||||||||||||||
| (1) | We are required to make principal payments of |
| (2) | Estimated interest payments were computed using the interest rate in effect at December 31, |
| (3) | Our operating lease obligations primarily consist of real estate arrangements we enter into with third parties. See Note 13 for additional information regarding our operating leases. |
| |
| (4) | Our purchase obligations |
60
Deferred Tax Asset
The Company recognized a deferred tax asset upon its conversion from a limited liability company to a corporation on May 14, 2004. Prior to that time, all tax attributes flowed through to the members of the limited liability company. The principal component of the deferred tax asset is a difference between our assets for financial accounting purposes and tax purposes. This difference results from a significant balance of acquired goodwill of approximately $687.4 million that was generated as part of the conversion to a corporation plus approximately $97.6 million in preexisting goodwill carried over from periods prior to the conversion. Both of these assets are recorded for tax purposes but not for accounting purposes. This asset is amortized over 15 years for tax purposes, resulting in annual pretax income being $52.3 million lower for tax purposes than for financial accounting purposes. At an estimated blended domestic statutory tax rate of 37.2%, this results in tax payments being approximately $19.5 million less than the annual provision for income taxes shown on the Consolidated Statements of (Loss) Income and Comprehensive (Loss) Income for financial accounting purposes, or the amount of the annual provision, if less. There is an expected aggregate of $64.9 million in cash savings over the remaining life of the portion of the deferred tax asset related to the conversion. This deferred tax asset may be subject to certain limitations. We believe that it is more likely than not that it will be able to utilize the deferred tax asset. However, the utilization of this tax asset is subject to many factors including our earnings, a change of control of the Company and future earnings.
Other Liquidity Needs and Resources
Our Contract Cash Solutions Agreement
In November 2014, we amended
In June 2015, weas amended, the Contract Cash Solutions Agreement to decreasewith Wells Fargo Bank, N.A. (“Wells Fargo”) provides us with cash in the maximum amount of cash$300.0 million with the ability to be provided to us from $500.0increase the amount by $75 million to $425.0 million and to extendover a 5-day period for special occasions, such as the term of theperiod around New Year’s Day. The agreement from November 30, 2015 tocurrently expires on June 30, 2018.
2021 and will auto renew for additional one-year periods unless either party provides a 90-day written notice of its intent not to renew.
61
Effects of Inflation
establishments.
Wells Fargo supplies us
62
63
and subsidiaries
NV
We conducted our audit in accordance with the standards of the Public Company Accounting Oversight Board (United States). Those standards require that we plan and perform the audit to obtain reasonable assurance about whether the financial statements are free of material misstatement. An audit includes examining, on a test basis, evidence supporting the amounts and disclosuresthree years in the period ended December 31, 2018, and the related notes (collectively referred to as the “consolidated financial statements, assessing the accounting principles used and significant estimates made by management, as well as evaluating the overall financial statement presentation. We believe that our audit provides a reasonable basis for our opinion.
statements”). In our opinion, the consolidated financial statements referred to above present fairly, in all material respects, the financial position of Everi Holdings Inc.the Company and subsidiaries at December 31, 2015,2018 and 2017, and the results of their operations and their cash flows for each of the year thenthree years in the period ended December 31, 2018, in conformity with accounting principles generally accepted in the United States of America.
/s/ BDO USA, LLP
Las Vegas, Nevada
March 15, 2016
64
REPORT OF INDEPENDENT REGISTERED PUBLIC ACCOUNTING FIRM
Toaccounting for revenue from contracts with customers in 2018 due to the Boardadoption of Directors and Stockholders of
Everi Holdings Inc.
Las Vegas, NV
We have audited the accompanying consolidated balance sheet of Global Cash Access Holdings, Inc. (now known as Everi Holdings Inc.) and subsidiaries (the "Company") as of December 31, 2014,Accounting Standards Update (ASU) No. 2014-09, “Revenue from Contracts with Customers (Topic 606),” and the related consolidated statements of income and comprehensive income, stockholders’ equity, and cash flowsamendments.
We are a public accounting firm registered with the PCAOB and are required to be independent with respect to the Company in accordance with the U.S. federal securities laws and the applicable rules and regulations of the Securities and Exchange Commission and the PCAOB.
In our opinion, such consolidated financial statements present fairly, in all material respects,
/s/ DELOITTE & TOUCHE LLP
Company’s auditor since 2015.
Nevada
65
EVERI HOLDINGS INC. AND SUBSIDIARIES
|
|
|
|
|
|
|
|
|
|
|
|
|
|
| Year Ended December 31, |
| |||||||
|
|
|
| 2015 |
|
| 2014 |
|
| 2013 |
|
|
|
|
|
|
|
|
|
|
|
|
|
Revenues |
|
|
|
|
|
|
|
|
|
|
|
Games |
|
| $ | 214,424 |
| $ | 7,406 |
| $ | — |
|
Payments |
|
|
| 612,575 |
|
| 585,647 |
|
| 582,444 |
|
Total revenues |
|
|
| 826,999 |
|
| 593,053 |
|
| 582,444 |
|
Costs and expenses |
|
|
|
|
|
|
|
|
|
|
|
Games cost of revenue (exclusive of depreciation and amortization) |
|
|
| 47,017 |
|
| 1,753 |
|
| — |
|
Payments cost of revenue (exclusive of depreciation and amortization) |
|
|
| 463,380 |
|
| 438,318 |
|
| 439,794 |
|
Operating expenses |
|
|
| 101,202 |
|
| 95,452 |
|
| 76,562 |
|
Research and development |
|
|
| 19,098 |
|
| 804 |
|
| — |
|
Goodwill impairment |
|
|
| 75,008 |
|
| — |
|
| — |
|
Depreciation |
|
|
| 45,551 |
|
| 8,745 |
|
| 7,350 |
|
Amortization |
|
|
| 85,473 |
|
| 14,199 |
|
| 9,588 |
|
Total costs and expenses |
|
|
| 836,729 |
|
| 559,271 |
|
| 533,294 |
|
Operating (loss) income |
|
|
| (9,730) |
|
| 33,782 |
|
| 49,150 |
|
Other expenses |
|
|
|
|
|
|
|
|
|
|
|
Interest expense, net of interest income |
|
|
| 100,290 |
|
| 10,756 |
|
| 10,265 |
|
Loss on extinguishment of debt |
|
|
| 13,063 |
|
| 2,725 |
|
| — |
|
Total other expenses |
|
|
| 113,353 |
|
| 13,481 |
|
| 10,265 |
|
(Loss) income from operations before tax |
|
|
| (123,083) |
|
| 20,301 |
|
| 38,885 |
|
Income tax (benefit) provision |
|
|
| (18,111) |
|
| 8,161 |
|
| 14,487 |
|
Net (loss) income |
|
|
| (104,972) |
|
| 12,140 |
|
| 24,398 |
|
Foreign currency translation |
|
|
| (1,251) |
|
| (1,258) |
|
| 269 |
|
Comprehensive (loss) income |
|
| $ | (106,223) |
| $ | 10,882 |
| $ | 24,667 |
|
(Loss) earnings per share |
|
|
|
|
|
|
|
|
|
|
|
Basic |
|
| $ | (1.59) |
| $ | 0.18 |
| $ | 0.37 |
|
Diluted |
|
| $ | (1.59) |
| $ | 0.18 |
| $ | 0.36 |
|
Weighted average common shares outstanding |
|
|
|
|
|
|
|
|
|
|
|
Basic |
|
|
| 65,854 |
|
| 65,780 |
|
| 66,014 |
|
Diluted |
|
|
| 65,854 |
|
| 66,863 |
|
| 67,205 |
|
| Year Ended December 31, | ||||||||||||
| 2018 | 2017 | 2016 | ||||||||||
| Revenues | ||||||||||||
| Games revenues | ||||||||||||
| Gaming operations | $ | 168,146 | $ | 148,654 | $ | 152,514 | ||||||
| Gaming equipment and systems | 87,038 | 70,118 | 56,277 | |||||||||
| Gaming other | 3,794 | 4,005 | 4,462 | |||||||||
| Games total revenues | 258,978 | 222,777 | 213,253 | |||||||||
| FinTech revenues | ||||||||||||
| Cash access services | 156,806 | 707,222 | 601,874 | |||||||||
| Equipment | 20,977 | 13,258 | 14,995 | |||||||||
| Information services and other | 32,754 | 31,691 | 29,334 | |||||||||
| FinTech total revenues | 210,537 | 752,171 | 646,203 | |||||||||
| Total revenues | 469,515 | 974,948 | 859,456 | |||||||||
| Costs and expenses | ||||||||||||
Games cost of revenues(1) | ||||||||||||
| Gaming operations | 17,603 | 15,741 | 15,265 | |||||||||
| Gaming equipment and systems | 47,121 | 35,707 | 31,602 | |||||||||
| Gaming other | 3,285 | 3,247 | 3,441 | |||||||||
| Games total cost of revenues | 68,009 | 54,695 | 50,308 | |||||||||
FinTech cost of revenues(1) | ||||||||||||
| Cash access services | 9,717 | 572,880 | 485,061 | |||||||||
| Equipment | 12,601 | 7,717 | 9,889 | |||||||||
| Information services and other | 4,110 | 3,253 | 3,756 | |||||||||
| FinTech total cost of revenues | 26,428 | 583,850 | 498,706 | |||||||||
| Operating expenses | 142,298 | 118,935 | 118,709 | |||||||||
| Research and development | 20,497 | 18,862 | 19,356 | |||||||||
| Goodwill impairment | — | — | 146,299 | |||||||||
| Depreciation | 61,225 | 47,282 | 49,995 | |||||||||
| Amortization | 65,245 | 69,505 | 94,638 | |||||||||
| Total costs and expenses | 383,702 | 893,129 | 978,011 | |||||||||
| Operating income (expense) | 85,813 | 81,819 | (118,555 | ) | ||||||||
| Year Ended December 31, | ||||||||||||
| 2018 | 2017 | 2016 | ||||||||||
| Other expenses | ||||||||||||
| Interest expense, net of interest income | 83,001 | 102,136 | 99,228 | |||||||||
| Loss on extinguishment of debt | 166 | 51,750 | — | |||||||||
| Total other expenses | 83,167 | 153,886 | 99,228 | |||||||||
| Income (loss) before income tax | 2,646 | (72,067 | ) | (217,783 | ) | |||||||
| Income tax (benefit) provision | (9,710 | ) | (20,164 | ) | 31,696 | |||||||
| Net income (loss) | 12,356 | (51,903 | ) | (249,479 | ) | |||||||
| Foreign currency translation | (1,745 | ) | 1,856 | (2,427 | ) | |||||||
| Comprehensive income (loss) | $ | 10,611 | $ | (50,047 | ) | $ | (251,906 | ) | ||||
| Earnings (loss) per share | ||||||||||||
| Basic | $ | 0.18 | $ | (0.78 | ) | $ | (3.78 | ) | ||||
| Diluted | $ | 0.17 | $ | (0.78 | ) | $ | (3.78 | ) | ||||
| Weighted average common shares outstanding | ||||||||||||
| Basic | 69,464 | 66,816 | 66,050 | |||||||||
| Diluted | 73,796 | 66,816 | 66,050 | |||||||||
66
EVERI HOLDINGS INC. AND SUBSIDIARIES
|
|
|
|
|
|
|
|
|
| At December 31, |
| At December 31, |
| ||
|
| 2015 |
| 2014 |
| ||
|
|
|
|
|
|
|
|
ASSETS |
|
|
|
|
|
|
|
Current assets |
|
|
|
|
|
|
|
Cash and cash equivalents |
| $ | 102,030 |
| $ | 89,095 |
|
Settlement receivables |
|
| 44,933 |
|
| 43,288 |
|
Trade receivables, net of allowances for doubtful accounts of $3.9 million and $2.8 million at December 31, 2015 and December 31, 2014 respectively |
|
| 52,382 |
|
| 37,697 |
|
Other receivables |
|
| 4,928 |
|
| 20,553 |
|
Inventory |
|
| 28,738 |
|
| 27,163 |
|
Prepaid expenses and other assets |
|
| 20,772 |
|
| 18,988 |
|
Deferred tax asset |
|
| — |
|
| 9,591 |
|
Total current assets |
|
| 253,783 |
|
| 246,375 |
|
Non-current assets |
|
|
|
|
|
|
|
Property, equipment and leased assets, net |
|
| 106,308 |
|
| 106,085 |
|
Goodwill |
|
| 789,803 |
|
| 857,913 |
|
Other intangible assets, net |
|
| 382,462 |
|
| 436,785 |
|
Other receivables, non-current |
|
| 6,655 |
|
| 9,184 |
|
Other assets, non-current |
|
| 35,054 |
|
| 50,943 |
|
Total non-current assets |
|
| 1,320,282 |
|
| 1,460,910 |
|
Total assets |
| $ | 1,574,065 |
| $ | 1,707,285 |
|
LIABILITIES AND STOCKHOLDERS’ EQUITY |
|
|
|
|
|
|
|
Current liabilities |
|
|
|
|
|
|
|
Settlement liabilities |
| $ | 139,819 |
| $ | 119,157 |
|
Accounts payable and accrued expenses |
|
| 101,512 |
|
| 104,668 |
|
Current portion of long-term debt |
|
| 10,000 |
|
| 10,000 |
|
Total current liabilities |
|
| 251,331 |
|
| 233,825 |
|
Non-current liabilities |
|
|
|
|
|
|
|
Deferred tax liability, non-current |
|
| 27,644 |
|
| 57,333 |
|
Long-term debt, less current portion |
|
| 1,153,579 |
|
| 1,178,787 |
|
Other accrued expenses and liabilities |
|
| 4,091 |
|
| 5,867 |
|
Total non-current liabilities |
|
| 1,185,314 |
|
| 1,241,987 |
|
Total liabilities |
|
| 1,436,645 |
|
| 1,475,812 |
|
|
|
|
|
|
|
|
|
Commitments and Contingencies (Note 13) |
|
|
|
|
|
|
|
|
|
|
|
|
|
|
|
Stockholders’ Equity |
|
|
|
|
|
|
|
Common stock, $0.001 par value, 500,000 shares authorized and 90,877 and 90,405 shares issued at December 31, 2015 and December 31, 2014, respectively |
|
| 91 |
|
| 90 |
|
Convertible preferred stock, $0.001 par value, 50,000 shares authorized and 0 shares outstanding at December 31, 2015 and December 31, 2014, respectively |
|
| — |
|
| — |
|
Additional paid-in capital |
|
| 258,020 |
|
| 245,682 |
|
Retained earnings |
|
| 55,180 |
|
| 160,152 |
|
Accumulated other comprehensive income |
|
| 318 |
|
| 1,569 |
|
Treasury stock, at cost, 24,849 and 24,816 shares at December 31, 2015 and December 31, 2014, respectively |
|
| (176,189) |
|
| (176,020) |
|
Total stockholders’ equity |
|
| 137,420 |
|
| 231,473 |
|
Total liabilities and stockholders’ equity |
| $ | 1,574,065 |
| $ | 1,707,285 |
|
EVERI HOLDINGS INC. AND SUBSIDIARIES (In thousands) Year Ended December 31, 2015 2014 2013 Cash flows from operating activities Net (loss) income $ $ $ Adjustments to reconcile net (loss) income to cash provided by operating activities: Depreciation and amortization Amortization of financing costs (Gain) loss on sale or disposal of assets Accretion of contract rights — Provision for bad debts Reserve for obsolescence Other asset impairment — — Goodwill impairment — — Loss on early extinguishment of debt — Stock-based compensation Other non-cash items — Changes in operating assets and liabilities: Settlement receivables Trade and other receivables Inventory Prepaid and other assets Deferred income taxes Settlement liabilities Other liabilities Net cash provided by operating activities Cash flows from investing activities Acquisitions, net of cash acquired — Capital expenditures Proceeds from sale of fixed assets Repayments under development agreements — Advances under placement agreements — — Changes in restricted cash and cash equivalents Net cash used in investing activities Cash flows from financing activities Repayments of prior credit facility — Repayments of credit facility — — Repayments of secured notes — — Proceeds from securing credit facility — — Proceeds from issuance of secured notes — Proceeds from issuance of unsecured notes — — Debt issuance costs Proceeds from exercise of stock options Purchase of treasury stock Net cash (used in) provided by financing activities Effect of exchange rates on cash Cash and cash equivalents Net increase (decrease) for the period Balance, beginning of the period Balance, end of the period $ $ $ Year Ended December 31, 2015 2014 2013 Supplemental cash disclosures Cash paid for interest $ $ $ Cash paid for income tax, net $ $ $ Cash refunded for income taxes from acquisitions, net $ $ — $ — Supplemental non-cash disclosures Non-cash tenant improvements paid by landlord $ — $ — $ Accrued and unpaid capital expenditures $ $ $ Accrued and unpaid contingent liability for acquisitions $ $ $ — Issuance of warrants $ $ — $ — See notes to consolidated financial statements. EVERI HOLDINGS INC. AND SUBSIDIARIES Common Stock— Accumulated Series A Additional Retained Other Number of Paid-in Earnings Comprehensive Total Shares Amount Capital (Deficit) Income Treasury Stock Equity Balance, December 31, 2012 $ $ $ $ $ $ Net income — — — — — Foreign currency translation — — — — — Stock-based compensation expense — — — — — Exercise of options — — — Treasury share repurchases — — — — — Restricted share vesting withholdings — — — — — Restricted shares vested — — — — — — Balance, December 31, 2013 $ $ $ $ $ $ Net income — — — — — Foreign currency translation — — — — — Stock-based compensation expense — — — — — Exercise of options — — — Treasury share repurchases — — — — — Restricted share vesting withholdings — — — — — Restricted shares vested — — — — — — Balance, December 31, 2014 $ $ $ $ $ $ Net loss — — — — — Foreign currency translation — — — — — Stock-based compensation expense — — — — — Exercise of options 1 — — — Restricted share vesting withholdings — — — — — Restricted shares vested — — — — — — Issuance of warrants — — — — — Balance, December 31, 2015 $ $ $ $ $ $ NOTES TO CONSOLIDATED Cash and Cash Equivalents Warranty Receivables . method (“FIFO”). Goodwill represents the excess of the purchase price over the identifiable tangible and intangible assets acquired plus liabilities assumed arising from business combinations. We test for impairment annually on a reporting unit basis, at the beginning of our fourth fiscal quarter, or more often under certain circumstances. The annual impairment test is completed using either: a qualitative Compliance Sales and Services. Revenue Recognition contract liabilities arising from contracts with customers: central determinant system for the VLTs in operation at licensed State of New York gaming facilities. Pursuant to our agreement with the New York State Gaming Commission, we receive a portion of the network-wide net win (generally, cash-in less prizes paid) per day in exchange for provision and maintenance of the central determinant system and records it in accordance with ASC 606. We also In connection with these types of transactions, we report certain direct costs incurred as reductions to revenues on a net basis, which generally include: (i) commission expenses payable to casino operators; (ii) interchange fees payable to the network associations; and (iii) processing and related costs payable to other third party partners. In connection with these types of transactions, we report certain direct costs incurred as reductions to revenues on a net basis, which generally include: (i) commission expenses payable to casino operators; (ii) interchange fees payable to the network associations; and (iii) processing and related costs payable to other third party partners. Information Services and Other customer. Amortization) Advertising, Marketing, and Promotional Costs Fair Values of Financial Instruments Year Ended December 31, 2015 Level of Outstanding Hierarchy Fair Value Balance Term loan 1 $ $ Senior secured notes 3 $ $ Senior unsecured notes 1 $ $ The 31, 2017. Earnings Applicable to Common Stock anti-dilutive. To the extent we report a net loss from continuing operations in a particular period, no potential dilution from the application of the treasury stock method would be applicable in accordance with ASC 260, Earnings per Share. date of an award. presentation, except for the adoption impact of the application of ASC 606 utilizing the modified retrospective transition method. In May 2014, the FASB issued ASU No. 2014-09, which creates We Useful Life Estimated (years) Fair Value Property, equipment and leased assets Gaming equipment - 4 $ Leasehold and building improvements Lease Term Machinery and equipment - 5 Other - 7 Total property, equipment and leased assets $ Useful Life Estimated (years) Fair Value Other intangible assets Tradenames and trademarks - 7 $ Computer software - 5 Developed technology - 6 Customer relationships - 12 Contract rights - 7 Total other intangible assets $ Year Ended December 31, 2014 2013 Unaudited pro forma results of operations (in thousands, except per share amounts) Revenues $ $ Net (loss) Basic loss per share Diluted loss per share 2016. Commercial Cash Arrangements rates increase. 2021 and will auto renew for additional one-year periods unless either party provides a 90-day written notice of its intent not to renew. 2016. At December 31, At December 31, 2015 2014 Trade receivables, net Games trade receivables $ $ Payments trade receivables Total trade receivables, net $ $ . At December 31, At December 31, 2015 2014 Other receivables Notes and loans receivable, net of discount of $699 and $853, respectively $ $ Federal and state income tax receivable Other Total other receivables Less: Notes and loans receivable, non-current Total other receivables, current portion $ $ At December 31, At December 31, 2015 2014 Prepaid expenses and other assets Prepaid expenses $ $ Deposits Other Total prepaid expenses and other assets $ $ At December 31, At December 31, 2015 2014 Other assets, non-current Debt issuance costs $ $ Prepaid expenses and deposits, non-current Other Total other assets, non-current $ $ Our inventory primarily consists of component parts as well as work-in-progress and finished our Games segment for the year ended December 31, 2018 to reduce the carrying value of certain component parts to their fair values. The adjustment was included in operating expenses in our Statements of Income (Loss). At December 31, At December 31, 2015 2014 Inventory Raw materials and component parts, net of reserves of $912 and $22, respectively $ $ Work in progress Finished goods Total inventory $ $ At December 31, 2015 At December 31, 2014 Useful Life Accumulated Net Book Accumulated Net Book (Years) Cost Depreciation Value Cost Depreciation Value Property, equipment and leased assets Rental pool - deployed - 4 $ $ $ $ $ $ Rental pool - undeployed - 4 ATM equipment 5 Leasehold and building improvements Lease Term Cash advance equipment 3 Machinery, office and other equipment - 5 Total $ $ $ $ $ $ . If the operations. The The changes in the carrying amount of goodwill are as follows (in thousands): Cash ATM Check Games Other Total Goodwill Balance, December 31, 2013 $ $ $ $ — $ $ Goodwill acquired during the year — — — Foreign translation adjustment — — — — Balance, December 31, 2014 $ $ $ $ $ $ Goodwill acquired during the year — — — — Goodwill impairment — — — — Foreign translation adjustment — — — — Other* — — — — Balance, December 31, 2015 $ $ $ $ $ $ At December 31, 2015 At December 31, 2014 Useful Life Accumulated Net Book Accumulated Net Book (years) Cost Amortization Value Cost Amortization Value Other intangible assets Contract rights under development and placement fee agreements - 7 $ $ $ $ $ $ Customer contracts - 14 Customer relationships - 12 Developed technology and software - 6 Patents, trademarks and other - 17 Total $ $ $ $ $ $ anticipated amortization expense related to other intangible assets, assuming no subsequent impairment of the underlying assets, is as follows (in thousands): Amount Anticipated amortization expense(1) 2016 $ 2017 2018 2019 2020 Thereafter Total $ For the year ended December 31, imputed interest. At December 31, At December 31, 2015 2014 Accounts payable and accrued expenses Trade accounts payable $ $ Accrued interest Payroll and related expenses Deferred and unearned revenues Cash access processing and related expenses Accrued taxes Other Total accounts payable and accrued expenses $ $ At December 31, At December 31, 2015 2014 Long-term debt Senior secured term loan $ $ Senior secured notes Senior unsecured notes Total debt Less: debt issuance costs and warrant discount Total debt after discount Less: current portion of long-term debt Long-term debt, less current portion $ $ credit. the Repricing Closing Date through the effectiveness of the Second Amendment were: (i) 3.50% in respect of Eurodollar Rate loans and (ii) 2.50% in respect of base rate loans. The applicable margins for the New Term Loan Facility from and after the effectiveness of the Second Amendment are: (i) 3.00% in respect of Eurodollar Rate loans and (ii) 2.00% in respect of base rate loans. penalty, except that certain refinancings of the term loans within six months after the Repricing Closing Date will be subject to a prepayment premium of 1.00% of the principal amount repaid. perfected first priority pledge of all the capital stock of Everi Payments and each domestic direct, wholly owned material restricted subsidiary held by Holdings, Everi Payments or any such subsidiary guarantor; and guarantors. of December 31, 2020, and 4.00 to 1.00 as of December 31, 2021 and each December 31 thereafter. 5.17%. 2018. Senior Unsecured Notes In December 2015, we completed an exchange offer in which all of the unregistered 2014 Unsecured Notes were exchanged for a like amount of 2014 Unsecured Notes that had been registered under the Securities Act. December 15, commencing on June 15, 2018. The 2017 Unsecured Notes Redemption Date. fees. 2018. Amount Maturities of borrowings 2016 $ 2017 2018 2019 2020 Thereafter Total $ 13. COMMITMENTS AND CONTINGENCIES April 2023. Amount Minimum aggregate rental commitments 2016 $ 2017 2018 2019 2020 Thereafter Total $ We are 15. WEIGHTED AVERAGE SHARES OF COMMON STOCK At December 31, 2015 2014 2013 Weighted average shares Weighted average number of common shares outstanding - basic Potential dilution from equity grants(1) — Weighted average number of common shares outstanding - diluted prices. 2018. Stock Options Restricted Stock Granted Granted Outstanding, December 31, 2014 Additional authorized shares — — Granted — Exercised options or vested shares Canceled or forfeited Outstanding, December 31, 2015 The Year ended December 31, 2015 2014 2013 Risk-free interest rate % % % Expected life of options (in years) Expected volatility % % % Expected dividend yield % % % following assumptions: Weighted Number of Weighted Average Average Life Aggregate Common Shares Exercise Price Remaining Intrinsic Value (in thousands) (per share) (years) (in thousands) Outstanding, December 31, 2014 $ $ Granted Exercised Canceled or forfeited Outstanding, December 31, 2015 $ $ Vested and expected to vest, December 31, 2015 $ $ Exercisable, December 31, 2015 $ $ Options Outstanding Options Exercisable Weighted Average Weighted Weighted Number Remaining Average Number Average Outstanding Contract Exercise Exercisable Exercise Range of Exercise Prices (000’s) Life (Years) Prices (000’s) Price $ — $ $ $ There were 2017. There were no options exercised in 2016. We recorded approximately $6.0 million and $6.3 million in non‑cash compensation expense related to options granted that were expected to vest as of December 31, 2017 and 2016, respectively. We received approximately $10.9 million in cash proceeds from the exercise of options during 2017 and there was no exercise of options during 2016, as no exercises occurred during the period. Awards Weighted Shares Average Grant Outstanding Date Fair Value (in thousands) (per share) Outstanding, December 31, 2014 $ Granted — — Vested Forfeited Outstanding, December 31, 2015 $ There was 17. INCOME TAXES Year Ended December 31, 2015 2014 2013 Consolidated (loss) income before tax Domestic $ $ $ Foreign Total $ $ $ Year Ended December 31, 2015 2014 2013 Income tax (benefit) provision Domestic $ $ $ Foreign Total income tax (benefit) provision $ $ $ Income tax provision components Current $ $ $ Deferred Total income tax (benefit) provision $ $ $ Year Ended December 31, 2015 2014 2013 Income tax reconciliation Federal statutory rate % % % Foreign provision % % % State/province income tax % % % Non-deductible compensation cost % % % Non-deductible acquisition cost % % % Adjustment to carrying value % % % Research credit % % % Goodwill impairment % % % Other % % % Effective tax rate % % % Year Ended December 31, 2015 2014 2013 Deferred income tax assets related to: Intangibles $ — $ — $ Net operating losses Stock compensation expense Accounts receivable allowances Accrued and prepaid expenses Long-term debt Other Tax credits — Property, equipment and leasehold improvements — — Valuation allowance Total deferred income tax assets $ $ $ Deferred income tax liabilities related to: Property, equipment and leased assets $ $ — Intangibles — Other Total deferred income tax liabilities $ $ Deferred income taxes, net $ $ $ Year Ended December 31, 2015 2014 2013 Unrecognized tax benefit Unrecognized tax benefit at the beginning of the period $ $ — $ — Gross increases - tax positions in prior period — — — Gross decreases - tax positions in prior period — — — Gross increases - tax positions in current period — — Settlements — — — Unrecognized tax benefit at the end of the period $ $ $ — asset valuation allowance (in thousands): more likely than not to be realized. benefits (in thousands): in our Statements of Income (Loss). Corporate overhead expenses have been allocated to the segments either through specific identification or based on a reasonable methodology. In addition, we Since we adopted ASC 606 utilizing the modified retrospective method, the prior year comparative amounts shown in the tables below have not been restated. Refer to For the Year Ended December 31, 2015 2014 2013 Revenues Games $ $ $ — Payments Total revenues $ $ $ Operating (loss) income Games $ $ $ — Payments Total operating (loss) income $ $ $ At December 31, 2015 December 31, 2014 Total assets Games $ $ Payments Total assets $ $ Major customers.For the years ended December 31, Quarter First Second Third Fourth Year 2015 Revenues $ $ $ $ $ Operating income (loss) Net income (loss) Basic earnings (loss) per share $ $ $ $ $ Diluted earnings (loss) per share $ $ $ $ $ Weighted average common shares outstanding Basic Diluted 2014 Revenues $ $ $ $ $ Operating income Net income (loss) Basic earnings (loss) per share $ $ $ $ $ Diluted earnings (loss) per share $ $ $ $ $ Weighted average common shares outstanding Basic Diluted Year Ended December 31, 2015 Parent Subsidiary Guarantor Non-Guarantor Eliminations Total Revenues $ — $ $ $ $ $ Costs and expenses Cost of revenues (exclusive of depreciation and amortization) — — Operating expenses — Research and development — — — — Goodwill impairment — — — — Depreciation — — Amortization — — Total costs and expenses — Operating income (loss) — — Other expenses Interest expense, net of interest income — — Income (loss) from subsidiaries — — — Loss on extinguishment of debt — — — — Total other expenses (Loss) income from operations before tax Income tax provision (benefit) — — Net (loss) income Foreign currency translation — — Comprehensive (loss) income $ $ $ $ $ $ Year Ended December 31, 2014 Parent Subsidiary Guarantor Non-Guarantor Eliminations Total Revenues $ — $ $ $ $ $ Costs and expenses Cost of revenues (exclusive of depreciation and amortization) — — Operating expenses — Research and development — — — — Depreciation — — Amortization — — Total costs and expenses — Operating income — — Other (income) expense Interest expense, net of interest income — — Income from subsidiaries — — — Loss on extinguishment of debt — — — Total other (income) expense Income from operations before tax Income tax expense — — Net income Foreign currency translation — — Comprehensive income $ $ $ $ $ $ Year Ended December 31, 2013 �� Parent Subsidiary Guarantor Non-Guarantor Eliminations Total Revenues $ — $ $ $ $ $ Costs and expenses Cost of revenues (exclusive of depreciation and amortization) — — Operating expenses — Depreciation — — Amortization — — — Total costs and expenses — Operating income — — Other expenses Interest expense, net of interest income — — — Income from subsidiaries — — — Total other expenses — Income from operations before tax Income tax provision — — Net income Foreign currency translation — — Comprehensive income $ $ $ $ $ $ At December 31, 2015 Parent Subsidiary Guarantor Non-Guarantor Eliminations Total ASSETS Current assets Cash and cash equivalents $ $ $ $ $ — $ Settlement receivables — — — Trade receivables, net — — Other receivables — — Inventory — — — Prepaid expenses and other assets — — Deferred tax asset — — — — — — Intercompany balances — — Total current assets Non-current assets Property, equipment and leasehold improvements, net — — Goodwill — — Other intangible assets, net — — Other receivables, non-current — — — Investment in subsidiaries — — Deferred tax asset, non-current — — — — Other assets, non-current — — Intercompany balances — — — — Total non-current assets Total assets $ $ $ $ $ $ LIABILITIES AND STOCKHOLDERS’ EQUITY Current liabilities Settlement liabilities $ — $ $ $ $ — $ Accounts payable and accrued expenses — — Current portion of long-term debt — — — — Intercompany balances — — Total current liabilities — Non-current liabilities Deferred tax liability, non-current — — — Long-term debt, less current portion — — — — Other accrued expenses and liabilities — — — Intercompany balances — — — — Total non-current liabilities — — Total liabilities — Stockholders’ Equity Common stock — — — — Additional paid-in capital Retained earnings Accumulated other comprehensive income Treasury stock, at cost — — — — Total stockholders’ equity Total liabilities and stockholders’ equity $ $ $ $ $ $ At December 31, 2014 Parent Subsidiary Guarantor Non-Guarantor Eliminations Total ASSETS Current assets Cash and cash equivalents $ — $ $ $ $ — $ Settlement receivables — — — Trade receivables, net — — Other receivables — — Inventory — — — Prepaid expenses and other assets — — Deferred tax asset — — — Intercompany balances — — Total current assets — Non-current assets Property, equipment and leasehold improvements, net — — Goodwill — — Other intangible assets, net — — Other receivables, non-current — — — Investment in subsidiaries — — Deferred tax asset, non-current — — — — Other assets, non-current — — Intercompany balances — — — — Total non-current assets Total assets $ $ $ $ $ $ LIABILITIES AND STOCKHOLDERS’ EQUITY Current liabilities Settlement liabilities $ — $ $ $ $ — $ Accounts payable and accrued expenses — — Current portion of long-term debt — — — — Intercompany balances — — Total current liabilities — Non-current liabilities Deferred tax liability, non-current — — Long-term debt, less current portion — — — — Other accrued expenses and liabilities — — — Intercompany balances — — — — Total non-current liabilities — — Total liabilities — Stockholders’ Equity Common stock — — — — Convertible preferred stock — — — — — — Additional paid-in capital Retained earnings Accumulated other comprehensive income — Treasury stock, at cost — — — — Total stockholders’ equity Total liabilities and stockholders’ equity $ $ $ $ $ $ Year Ended December 31, 2015 Parent Subsidiary Guarantor Non-Guarantor Eliminations Total Cash flows from operating activities Net (loss) income $ $ $ $ $ $ Adjustments to reconcile net (loss) income to cash provided by operating activities: Depreciation and amortization — — Amortization of financing costs — — — — Loss/(gain) on sale or disposal of assets — — — Accretion of contract rights — — — — Provision for bad debts — — — Reserve for obsolescence — — — Goodwill impairment — — — — Loss on early extinguishment of debt — — — — Equity loss (income) — — — Stock-based compensation — — — Other non-cash items — — — — Changes in operating assets and liabilities: Net settlement receivables and liabilities — — Other changes in operating assets and liabilities — Net cash (used in) provided by operating activities — Cash flows from investing activities Acquisitions, net of cash acquired — — — — Capital expenditures — — Proceeds from sale of fixed assets — — — Repayments under development agreements — — — — Advances under development and placement agreements — — — — Changes in restricted cash and cash equivalents — — — — Intercompany investing activities — Net cash used in investing activities Cash flows from financing activities Repayments of credit facility — — — — Repayments of secured notes — — — — Proceeds from issuance of secured notes — — — — Debt issuance costs — — — — Issuance of warrants — — — — Proceeds from exercise of stock options — — — — Purchase of treasury stock — — — — Intercompany financing activities — — — Net cash provided by (used in) financing activities — Effect of exchange rates on cash — — — — Cash and cash equivalents Net increase (decrease) for the period — Balance, beginning of the period — — Balance, end of the period $ — Year Ended December 31, 2014 Parent Subsidiary Guarantor Non-Guarantor Eliminations Total Cash flows from operating activities Net income $ $ $ $ $ $ Adjustments to reconcile net (loss) income to cash provided by operating activities: Depreciation and amortization — — Amortization of financing costs — — — — Loss on sale or disposal of assets — — — Accretion of contract rights — — — — Provision for bad debts — — — — Reserve for obsolescence — — — — Other asset impairment — — — — Loss on early extinguishment of debt — — — Equity income — — — Stock-based compensation — — — Other non-cash items — — — Changes in operating assets and liabilities: — — — — — — Net settlement receivables and liabilities — — Other changes in operating assets and liabilities — Net cash (used in) provided by operating activities — Cash flows from investing activities Acquisitions, net of cash acquired — — — Capital expenditures — — Proceeds from sale of fixed assets — — — — Repayments under development agreements — — — — Changes in restricted cash and cash equivalents — — — — Intercompany investing activities — — Net cash provided by (used in) investing activities Cash flows from financing activities Repayments of prior credit facility — — — — Proceeds from securing credit facility — — — — Proceeds from issuance of secured notes — — — — Proceeds from issuance of unsecured notes — — — — Debt issuance costs — — — — Proceeds from exercise of stock options — — — — Purchase of treasury stock — — — — Intercompany financing activities — — Net cash (used in) provided by financing activities Effect of exchange rates on cash — — — — Cash and cash equivalents Net (decrease) increase for the period — — Balance, beginning of the period — — Balance, end of the period $ — $ $ $ $ — $ Year Ended December 31, 2013 Parent Subsidiary Guarantor Non-Guarantor Eliminations Total Cash flows from operating activities Net income $ $ $ $ $ $ Adjustments to reconcile net (loss) income to cash provided by operating activities: Depreciation and amortization — — Amortization of financing costs — — — — Loss (gain) on sale or disposal of assets — — — Provision for bad debts — — — — Reserve for obsolescence — — — — Equity income — — — Stock-based compensation — — — — Changes in operating assets and liabilities: Net settlement receivables and liabilities — — — Other changes in operating assets and liabilities — Net cash provided by (used in) operating activities — Cash flows from investing activities Capital expenditures — — Proceeds from sale of fixed assets — — — — Changes in restricted cash and cash equivalents — — — — Intercompany investing activities — — — Net cash provided by (used in) investing activities Cash flows from financing activities Repayments of prior credit facility — — — — Debt issuance costs — — — — Proceeds from exercise of stock options — — — — Purchase of treasury stock — — — — Intercompany financing activities — — Net cash (used in) provided by financing activities Effect of exchange rates on cash — — — — Cash and cash equivalents Net (decrease) increase for the period — — Balance, beginning of the period — — Balance, end of the period $ — $ $ $ $ — $ Item 9. Changes in and Disagreements with Management within Part II, Item 8 of this Form 10-K. At December 31, 2018 2017 ASSETS Current assets Cash and cash equivalents $ 297,532 $ 128,586 Settlement receivables 82,359 227,403 64,387 47,782 Inventory 24,403 23,967 Prepaid expenses and other assets 20,259 20,670 Total current assets 488,940 448,408 Non-current assets Property, equipment and leased assets, net 116,288 113,519 Goodwill 640,537 640,589 Other intangible assets, net 287,397 324,311 Other receivables 8,847 2,638 Other assets 6,252 7,609 Total non-current assets 1,059,321 1,088,666 Total assets $ 1,548,261 $ 1,537,074 LIABILITIES AND STOCKHOLDERS’ DEFICIT Current liabilities Settlement liabilities $ 334,198 $ 317,744 Accounts payable and accrued expenses 129,238 134,504 Current portion of long-term debt 8,200 8,200 Total current liabilities 471,636 460,448 Non-current liabilities Deferred tax liability 27,867 38,207 Long-term debt, less current portion 1,155,016 1,159,643 Other accrued expenses and liabilities 2,637 19,409 Total non-current liabilities 1,185,520 1,217,259 Total liabilities 1,657,156 1,677,707 Commitments and contingencies (Note 13) Stockholders’ deficit Common stock, $0.001 par value, 500,000 shares authorized and 95,100 and 93,120 shares issued at December 31, 2018 and December 31, 2017, respectively 95 93 Convertible preferred stock, $0.001 par value, 50,000 shares authorized and no shares outstanding at December 31, 2018 and December 31, 2017, respectively — — Additional paid-in capital 298,929 282,070 Accumulated deficit (229,457 ) (246,202 ) Accumulated other comprehensive loss (1,998 ) (253 ) Treasury stock, at cost, 24,900 and 24,883 shares at December 31, 2018 and December 31, 2017, respectively (176,464 ) (176,341 ) Total stockholders’ deficit (108,895 ) (140,633 ) Total liabilities and stockholders’ deficit $ 1,548,261 $ 1,537,074 67S(104,972) 12,140 24,398 131,024 22,944 16,938 7,109 2,035 1,793 (2,789) 55 178 7,614 301 10,135 8,991 7,874 1,243 270 150 3,129 75,008 13,063 2,725 8,284 8,876 5,078 (149) (19) (1,830) (5,156) (8,793) (5,070) (12,256) (13,335) (1,075) (1,120) (2,436) (5,553) 904 (9,482) (19,878) 6,613 13,643 21,229 (25,523) (37,200) (8,806) (378) 5,528 124,587 24,531 4,334 (10,857) (1,068,000) (76,988) (18,442) (13,986) 2,102 421 86 3,104 276 (2,813) (97) (102) (90) (85,549) (1,085,847) (13,990) (103,000) (18,500) (10,000) (350,000) 500,000 335,000 350,000 350,000 (1,221) (52,735) (764) 1,839 5,338 8,431 (169) (12,180) (18,350) (24,551) 1,037,423 (29,183) (1,552) (1,266) 73 12,935 (25,159) (38,766) 89,095 114,254 153,020 102,030 89,095 114,254 Year Ended December 31, 2018 2017 2016 Cash flows from operating activities Net income (loss) $ 12,356 $ (51,903 ) $ (249,479 ) Adjustments to reconcile net income (loss) to cash provided by operating activities: Depreciation 61,225 47,282 49,995 Amortization 65,245 69,505 94,638 Amortization of financing costs and discounts 4,877 8,706 6,695 Loss on sale or disposal of assets 869 2,513 2,563 Accretion of contract rights 8,421 7,819 8,692 Provision for bad debts 11,459 9,737 9,908 Deferred income taxes (10,343 ) (20,015 ) 29,940 Write-down of assets 2,575 — 4,289 Reserve for obsolescence 1,919 397 3,581 Goodwill impairment — — 146,299 Loss on extinguishment of debt 166 51,750 — Stock-based compensation 7,251 6,411 6,735 Changes in operating assets and liabilities: Settlement receivables 143,705 (98,390 ) (83,998 ) Trade and other receivables (29,320 ) (884 ) (8,207 ) Inventory (3,848 ) (5,753 ) 5,600 Prepaid and other assets 1,672 (1,105 ) 4,668 Settlement liabilities 17,159 78,465 99,245 Accounts payable and accrued expenses (1,102 ) (8,276 ) 735 Net cash provided by operating activities 294,286 96,259 131,899 Cash flows from investing activities Capital expenditures (103,031 ) (96,490 ) (80,741 ) Acquisitions, net of cash acquired — — (694 ) Proceeds from sale of fixed assets 237 10 4,599 Placement fee agreements (20,556 ) (13,300 ) (11,312 ) Net cash used in investing activities (123,350 ) (109,780 ) (88,148 ) Cash flows from financing activities Proceeds from new credit facility — 820,000 — Proceeds from unsecured notes — 375,000 — Repayments of prior credit facility — (465,600 ) (24,400 ) Repayments of secured notes — (335,000 ) — Repayments of unsecured notes — (350,000 ) — Repayments of new credit facility (8,200 ) (4,100 ) — Debt issuance costs and discounts (1,276 ) (28,702 ) (480 ) Proceeds from exercise of stock options 9,610 10,906 — Purchase of treasury stock (123 ) (110 ) (42 ) Net cash provided by (used in) financing activities 11 22,394 (24,922 ) Effect of exchange rates on cash (1,370 ) 1,292 (1,714 ) Cash, cash equivalents and restricted cash Net increase for the period 169,577 10,165 17,115 Balance, beginning of the period 129,604 119,439 102,324 Balance, end of the period $ 299,181 $ 129,604 $ 119,439 Year Ended December 31, 2018 2017 2016 Supplemental cash disclosures Cash paid for interest $ 81,609 $ 89,008 $ 93,420 Cash paid for income tax 406 1,009 1,703 Cash refunded for income tax 4 829 171 Supplemental non-cash disclosures Accrued and unpaid capital expenditures $ 3,657 $ 1,386 $ 2,104 Accrued and unpaid placement fees added during the year — 39,074 — Accrued and unpaid contingent liability for acquisitions (550 ) — (3,169 ) Transfer of leased gaming equipment to inventory 10,028 7,820 9,042 68 Additional Retained Earnings Total Amount Balance, January 1, 2016 90,877 $ 91 $ 258,020 $ 55,180 $ 318 $ (176,189 ) $ 137,420 Net loss — — — (249,479 ) — — (249,479 ) Foreign currency translation — — — — (2,427 ) — (2,427 ) Stock-based compensation expense — — 6,735 — — — 6,735 Restricted share vesting withholdings — — — — — (42 ) (42 ) Restricted shares 75 — — — — — — Balance, December 31, 2016 90,952 $ 91 $ 264,755 $ (194,299 ) $ (2,109 ) $ (176,231 ) $ (107,793 ) Net loss — — — (51,903 ) — — (51,903 ) Foreign currency translation — — — — 1,856 — 1,856 Stock-based compensation expense — — 6,411 — — — 6,411 Exercise of options 2,037 2 10,904 — — — 10,906 Restricted share vesting withholdings — — — — — (110 ) (110 ) Restricted shares 131 — — — — — — Balance, December 31, 2017 93,120 $ 93 $ 282,070 $ (246,202 ) $ (253 ) $ (176,341 ) $ (140,633 ) Net income — — — 12,356 — — 12,356 Cumulative adjustment related to adoption of ASC 606 — — — 4,389 — — 4,389 Foreign currency translation — — — — (1,745 ) — (1,745 ) Stock-based compensation expense — — 7,251 — — — 7,251 Exercise of options 1,980 2 9,608 — — — 9,610 Restricted share vesting withholdings — — — — — (123 ) (123 ) Balance, December 31, 2018 95,100 $ 95 $ 298,929 $ (229,457 ) $ (1,998 ) $ (176,464 ) $ (108,895 ) 98,361 59,274 8,634 2,098 962 711 14,477 2,930 5,578 731 1,073 4,681 2,463 2,246 69CONSOLIDATED STATEMENTS OF STOCKHOLDERS’ EQUITY(In thousands)87,545 87 217,990 123,614 2,558 (145,490) 198,759 24,398 24,398 269 269 5,078 5,078 1,618 2 8,448 8,450 (18,241) (18,241) (109) (109) 70 89,233 89 231,516 148,012 2,827 (163,840) 218,604 12,140 12,140 (1,258) (1,258) 8,876 8,876 971 1 5,290 5,291 (11,721) (11,721) (459) (459) 201 90,405 90 245,682 160,152 1,569 (176,020) 231,473 (104,972) (104,972) (1,251) (1,251) 8,258 8,258 343 1,834 1,835 (169) (169) 129 2,246 2,246 90,877 91 258,020 55,180 318 (176,189) 137,420 See notes to consolidated financial statements.70EVERI HOLDINGS INC. AND SUBSIDIARIESFINANCIAFINANCIAL STATEMENTS AND BASIS OF PRESENTATION(formerly known as Global Cash Access Holdings, Inc.) (“Everi Holdings,” “Holdings”“Holdings,” or “Everi”) is a holding company, the assets of which are the issued and outstanding shares of capital stock of each of Everi Games Holding Inc. (formerly known as Multimedia(“Everi Games Holding Company, Inc.Holding”), which owns all of the issued and outstanding shares of capital stock of Everi Games Inc. (formerly known as Multimedia Games, Inc.) (“Everi Games” or “Games”), and Everi Payments Inc. (formerly known as Global Cash Access, Inc.) (“Everi Payments” or “Payments”). Unless otherwise indicated, the terms the “Company,” “we,” “us”“us,” and “our” refer to Everi Holdings together with its consolidated subsidiaries.dedicated to providing video and mechanical reel gaming content anda leading supplier of technology solutions integratedfor the casino gaming industry. We provide casino operators with a diverse portfolio of products including innovative gaming machines that power the casino floor, and casino operational and management systems that include comprehensive end-to-end payments solutions, critical intelligence offerings, and compliancegaming operations efficiency technologies.software. of the casino operator, support the comprehensive regulatory and tax requirements of their gaming customers, and improve players’ gaming experience by providing easy access to their funds and payment of winnings.provides:provides gaming operators products and services, including: (a) comprehensive content, electronic gaming unitsmachines primarily comprised of Class II and systems for Native AmericanClass III slot machines placed under participation or fixed fee lease arrangements or sold to casino customers, including TournEvent® that allows operators to switch from in-revenue gaming to out-of-revenue tournaments; (b) system software, licenses, ancillary equipment, and commercial casinos, including the award winning TournEvent® slot tournament solution;maintenance; and (b)(c) business-to-consumer and business-to-business interactive activities. In addition, Everi Games develops and manages the central determinant system for the video lottery terminals (“VLTs”) installed at racetracks in the State of New York. York and it also provides similar technology in certain tribal jurisdictions.Payments provides:FinTech provides gaming operators cash access and related products and services, including: (a) access to cash at gaming facilities via Automated Teller Machine (“ATM”) cash withdrawals, credit card cash access transactions, point of sale (“POS”) debit card cash access transactions, and check verification and warranty services; (b) fully integrated gaming industry kiosksequipment that provideprovides cash access and relatedefficiency-related services; (c) products and services that improve credit decision making, automate cashier operations, and enhance patron marketing activities for gaming establishments; (d) compliance, audit, and data solutions; and (e) online payment processing solutions for gaming operators in states that offer intrastate, Internet-based gaming, and lottery activities.(“FASB”(the “FASB”) Accounting Standards Codification (“ASC”) 805, “Business Combinations”,Combinations,” in the accounting for acquisitions. It requires us to recognize separately from goodwill the assets acquired and the liabilities assumed, at their acquisition date fair values. Goodwill as of the acquisition date is measured as the excess of consideration transferred over the net of the acquisition date fair values of the assets acquired and the liabilities assumed. Significant estimates and assumptions are required to value assets acquired and liabilities assumed at the acquisition date as well as contingent consideration, where applicable. These estimates are preliminary and typically include the calculation of an appropriate discount rate and projection of the cash flows associated with each acquired asset over its estimated useful life. As a result, during the measurement period, which may be up to one year from the acquisition date, the Company may record adjustments to the assets acquired and liabilities assumed with the corresponding offset to goodwill. In addition, deferred tax assets, deferred tax liabilities, uncertain tax positions, and tax related valuation allowances assumed in connection with a business combination are initially estimated as of the acquisition date. We reevaluate these items quarterly based upon facts and circumstances that existed as of the acquisition date and any adjustments to its preliminary estimates are recorded to goodwill, in the period ofConsolidated Statements of (Loss) Income and Comprehensive (Loss) Income..71Acquisition-related CostsWe recognize a liability for acquisition-related costs when the expense is incurred. Acquisition-related costs include financial advisory, legal and debt fees; accounting, consulting, and professional fees associated with due diligence, valuation and integration; severance; and other related costs and adjustments. all balances on deposit in banks and financial institutions. We consider all highly liquid investments with maturities of three months or less at the time of purchase to be cash and cash equivalents. Such balances generally exceed the federal insurance limits. However,limits, however, we periodically evaluate the creditworthiness of these institutions to minimize risk.Automated Teller Machines (“ATM” or “ATMs”)ATMs through various ATM Funding Agreements. Some gaming establishments provide the cash utilized within the ATM (“Site‑Funded”). The Site‑Funded receivables generated for the amount of cash dispensed from transactions performed at our ATMs are owned by us and we are liable to the gaming establishment for the face amount of the cash dispensed. In the Consolidatedour Balance Sheets, the amount of the receivable for transactions processed on these ATM transactions is included within settlement receivables and the amount due to the gaming establishment for the face amount of dispensing transactions is included within settlement liabilities.Non‑non‑Site‑Funded locations, our Contract Cash Solutions Agreementwe enter into commercial arrangements with Wells Fargo allows us to use funds owned by Wells Fargothird party vendors to provide us the currency needed for normal operating requirements for our ATMs. For the use of these funds, we pay Wells Fargo a cash usage fee onbased upon the average daily balance oftarget federal funds utilized multiplied by a contractually defined cash usage rate. Under this agreement, allthese agreements, the currency supplied by Wells Fargothe third party vendors remains the sole property of Wells Fargo at all timesthese suppliers until itcash is dispensed, at which time Wells Fargo obtainsthe third party vendors obtain an interest in the corresponding settlement receivable. As the cash is never an asset of ours, supplied cashthese suppliers, it is therefore not reflected on our balance sheet. We are charged a cashBalance Sheets. The usage fee for the cash usedsupplied in these ATMs which is included as interest expense in the Consolidated Statements of (Loss) Income and Comprehensive (Loss) Income. We recognize the. Our rationale to record cash usage fees as interest expense is primarily due to the similar operational characteristics to a revolving line of credit, the fact that the fees are calculated on a financial index, and the fees are paid for access to a capital resource.uncollectibility.uncollectibility or for which uncertainty exists as to whether the account balance has become uncollectible. Management reviews its accounts and notes receivable on a quarterly basis to determine if any receivables will potentially be uncollectible. Management analyzes historical collection trends and changes in our customer payment patterns, customer concentration, and creditworthiness when evaluating the adequacy of our allowance for doubtful accounts. In our overall allowance for doubtful accounts we include any receivable balances for which uncertainty exists as to whether the account balance has become uncollectible. Based on the information available, management believes the allowance for doubtful accounts is adequate; however, actual write-offs may exceed the recorded allowance.In the credit cardand POSservices, which involve the movement of funds between various parties involved in these types of transactions. We receive reimbursement from the patron’s credit or debit card cash access transactions provided by us,issuing financial institution for the amount owed to the gaming establishment is reimbursedplus the fee charged to the patron. These activities result in amounts due to us at the end of each business day that we generally recover over the next few business days, which are classified as settlement receivables on our Balance Sheets. In addition, cash settlement services result in amounts due to gaming establishments for the cash disbursed to gaming patrons through the issuance of a negotiable instrument or through electronic settlement. We receive reimbursement from the patron’s credit or debit card issuersettlement for the transaction in anface amount equalprovided to patrons that we generally remit over the amount owing to the gaming establishment plus the fee charged to the patron. This reimbursement is included within the settlement receivables on the Consolidated Balance Sheets. The amounts owed to gaming establishmentsnext few business days, which are included withinclassified as settlement liabilities on the Consolidatedour Balance Sheets.72third partythird-party check warranty service provider, asking whether it would be willing to accept the risk of cashing the check. If the check warranty provider accepts the risk and warrants the check, the gaming establishment negotiates the patron’s check by providing cash for the face amount of the check. If the check is dishonored by the patron’s bank upon presentment, the gaming establishment invokes the warranty, and the check warranty service provider purchases the check from the gaming establishment for the full check amount and then pursues collection activities on its own. In our Central Credit Check Warranty product under our agreement with the third partythird-party service provider, we receive all of the check warranty revenue. We are exposed to risk for the losses associated with any warranted items that cannot be collected from patrons issuing the items. Warranty receivables are defined as any amounts paid by the third partythird-party check warranty service provider to gaming establishments to purchase dishonored checks. Additionally, we pay a fee to the third partythird-party check warranty service provider for its services. Consolidated Balance Sheets. On a monthly basis, the Company evaluates the collectability of the outstanding balances and establishes a reserve for the face amount of the expected losses on these receivables. The warranty expense associated with this reserve is included within cost of revenues (exclusive of depreciation and amortization) on our Consolidated Statements of (Loss) Income and Comprehensive (Loss) Income.marketnet realizable value and accounted for using the first in, first out method.threetwo to five years, or the related lease term. Player terminals and related components and equipment are included in our rental pool. The rental pool can be further delineated as “rental pool – deployed,” which consists of assets deployed at customer sites under participation arrangements, and “rental pool – undeployed,” which consists of assets held by us that are available for customer use. Rental pool – undeployed consists of both new units awaiting deployment to a customer site and previously deployed units currently back with us to be refurbished awaiting re-deployment. Routine maintenance of property, equipment and leased gaming equipment is expensed in the period incurred, while major component upgrades are capitalized and depreciated over the estimated remaining useful life of the component. Sales and retirements of depreciable property are recorded by removing the related cost and accumulated depreciation from the accounts. Gains or losses on sales and retirements of property are reflected in our Consolidated Statements of (Loss) Income and Comprehensive (Loss) Income.. Property, equipment and leased assets are reviewed for impairment whenever events or circumstances indicate that their carrying amounts may not be recoverable. Impairment is indicated when undiscounted future cash flows, on an undiscounted basis, do not exceed the asset’s carrying value.Development and value of the asset.developmentplacement fee and, placement feeto a certain extent, development agreements to provide financing for new gaming facilities or for the expansion of existing facilities, or for new gaming facilities. All or a portion of theFunds provided under placement fee agreements are not reimbursed, while funds provided under development agreements are reimbursed to us, while funds provided under placement fee agreements are not reimbursed.in whole, or in part. In return, the facility dedicates a percentage of its floor space to placement of our player terminals, and we receive a fixed percentage of those player terminals'terminals’ hold amounts per day over the term of the agreement, which is generally forfrom 12 to 83 months. Certain of the agreements contain player terminal performance standards that could allow the facility to reduce a portion of our guaranteed floor space. In addition, certain development agreements allow the facilities to buy out floor space after advances that are subject to repayment have been repaid. The agreements typically provide for a portion of the amounts retained by the gaming facility for their share of the operating profits of the facility to be used to repay some or all of the advances recorded as notes receivable.73GoodwillStep 0“Step 0” assessment based on reviewing relevant events and circumstances; or a quantitative Step 1“Step 1” assessment, which determines the fair value of the reporting unit, using both an income approach that discounts future cash flows based on the estimated future results of our reporting units and a market approach that compares market multiples of comparable companies to determine whether or not any impairment exists. If the fair value of a reporting unit is less than its carrying amount, we will use the Step 2“Step 1” assessment to determine the impairment. impairment, in accordance with ASC 350, Intangibles - Goodwill and Other.chief operating decision makerssegment management to ascertain the resources to be allocated to the segment and assess its performance; and (c) have discrete financial2015,2018, our reporting units included: Games, Cash Advance, ATM, CheckAccess Services, Kiosk Sales and Service, Central Credit Services, and Everi Compliance.PaymentsFinTech services to gaming establishment customers), developed technology, trade names and trademarks, and contract rights acquired through business combinations; and (ii) capitalized software development costs; and (iii) the acquisition cost of our patent related to the 3-in-1 rollover technology acquired in 2005.costs. Customer contracts require us to make renewal assumptions, which impact the estimated useful lives of such assets. Capitalized software development costs require us to make certain judgments as to the stages of development and costs eligible for capitalization. Capitalized software costs placed in service are amortized over their useful lives, generally not to exceed five years. The acquisition cost of the 3-in-1 Rollover patent is being amortized over the term of the patent, which expires in 2018. We review intangible assets whenever events or changes in circumstances indicate that the carrying amount of an asset may not be recoverable. Such events or circumstances include, but are not limited to, a significant decrease in the fair value of the underlying business or market price of the asset, a significant adverse change in legal factors or business climate that could affect the value of an asset, or a current period operating or cash flow loss combined with a history of operating or cash flow losses. We group intangible assets for impairment analysis at the lowest level for which identifiable cash flows are largely independent of the cash flows of other assets and liabilities. Recoverability of definite lived intangible assets is measured by a comparison of the carrying amount of the asset to future net cash flows expected to be generated by the asset, on an undiscounted basis and without interest.interest or taxes. Any impairment to be recognized is measured by the amount by which the carrying amount of the assets exceeds the fair value of the assets.the Consolidatedour Balance Sheets. All other debt issuance costs are included as contra-liabilities in long-term debt.the Consolidatedour Balance Sheets.74Deferred RevenueDeferred revenue represents amounts from the sale of fully integrated kiosks and related service contracts, anti-money laundering and tax compliance software, and gaming equipment and systems that have been billed, or for which notes receivable have been executed, but which transaction has not met our revenue recognition criteria. The cost of the fully integrated kiosks and related service contracts, anti-money laundering and tax compliance software, and gaming equipment and systems is deferred and recorded at the time revenue is recognized. Amounts are classified between current and long-term liabilities, based upon the expected period in which the revenue will be recognized.Overallevidence of an arrangement exists, servicesthe SSP for performance obligations with observable prices have been rendered,established and the remaining performance obligation in the contract with a customer does not have an observable price as it is fixeduncertain or determinablehighly variable and, therefore, is not discernible.reasonably assured.probable that we will collect substantially all of the consideration to which we are entitled in exchange for the goods and services transferred to the customer in accordance with the terms and conditions of the contract. In connection with these procedures, we evaluate the customer using internal and external information available, including, but not limited to, research and analysis of the credit history with the customer. Based on the nature of our transactions and historical trends, we determine whether our customers have the ability and intention to pay the amounts of consideration when they become due to identify potentially significant credit risk exposure.streams for properrecognition. Such arrangements are evaluated to determine whether contract assets and liabilities exist. We generally record contract assets when the timing of cash collections differs from when revenue recognition. Revenue is recognized as productsdue to contracts containing specific performance obligations that are deliveredrequired to be met prior to a customer being billed. We generally record contract liabilities when cash is collected in advance of us satisfying performance obligations, including those that are satisfied over a period of time.or services are performed. For the Year Ended December 31, 2018 Balance at January 1 $ 8,433 Balance at December 31 11,310 Increase (decrease) 2,877 Balance at January 1 12,397 Balance at December 31 15,470 Increase (decrease) $ 3,073 development, placement, participation, and participationdevelopment arrangements, in which we providesprovide our customers with player terminals, including TournEvent® that allows operators to switch from in-revenue gaming to out-of-revenue tournaments, player terminal-content licenses, local-area progressive machines, and back-office equipment, collectively referred to herein as leased gaming equipment. UnderWe evaluate the recognition of lease revenues based on criteria set forth in ASC 840. Generally, under these arrangements, we retain ownership of the leased gaming equipmentmachines installed at customer facilities, and wefacilities. We receive recurring revenue based on a percentage of the net win per day generated by the leased gaming equipment or a fixed daily fee based on the number of player terminals installed at the facility. Revenuefee. Revenues from lease participation or daily fee arrangements are considered both realizable and earned at the end of each gaming day.Games Gaming operations revenues generated by player terminalsleased gaming equipment deployed at sites under development or placement fee agreements is reduced by the accretion ofgive rise to contract rights, acquired as part of those agreements. Contract rightswhich are amounts allocatedrecorded to intangible assets for dedicated floor space resulting from such agreements, described under “Development and Placement Fee Agreements.”agreements. The related amortization expense, orgaming operations revenues generated by these arrangements are reduced by the accretion of contract rights, is netted against our respective revenue categorywhich represents the related amortization of the contract rights recorded in connection with those agreements. Gaming operations lease revenues accounted for under ASC 840 are generally short-term in nature with payment terms ranging from 30 to 90 days. We recognized $136.6 million, $126.1 million, and $134.0 million in lease revenues for the years ended December 31, 2018, 2017, and 2016, respectively.Consolidatedreporting period. These arrangements are generally short-term in nature with a majority of invoices payable within 30 to 45 days. Such revenues are presented in the Statements of Income (Loss) Incomenet of the jackpot expense, which is comprised of incremental amounts funded by a portion of the coin-in from players. At the time a jackpot is won by a player, an additional jackpot expense is recordedComprehensive (Loss) Income.generateprovide central determinant system technology to Native American tribes in other licensed jurisdictions for which we receive a portion of the revenue generated from the VLTs connected to the system. These arrangements are generally short-term in nature with payments due monthly.back-office feesplayer purchases of virtual currency as it is consumed for game play, which is based on a historical data analysis. B2B relates to games offered to the online business partners, or social casinos, who then offer the games to consumers. Our B2B arrangements primarily provide access to our game content and revenue is recognized in accordance with ASC 606 as the control transfers upon the online business partners’ daily access to such content based on either a flat fee or revenue share arrangements with the social casinos.customers. Back-office fees coveragreements providing for extended payment terms, ranging from 12 to 24 months. Our contracts with customers do not contain any financing components that have been determined to be significant to the service and maintenance costscontract. Performance obligations for back-office servers installed in each gaming facility to run our gaming equipment as well asand systems arrangements include gaming equipment, player terminals, content, system software, license fees, ancillary equipment, maintenance, or various combinations thereof. Gaming equipment and systems are recognized at a point in time when control of the costpromised goods and services transfers to the customer generally upon shipment or delivery pursuant to the terms of related software updates. Back-office feesthe contract. The performance obligations are considered both realizable and earnedgenerally satisfied at the endsame time or within a short period of each gaming day.Paymentstime.transactions and are recognized at the time the transactions are authorized.cash access transactions. Such fees are primarily based on a combination of a fixed amount plus a percentage of the face amount of the credit card cash access or POS debit card cash access transaction amount. Cardholder surcharges are recognized as revenue when a transaction is initiated and reverse interchange is recognized as revenue on a monthly basis based on the total transactions occurring during the month. The cardholder surcharges assessed to gaming patrons in connection with ATM cash withdrawals are currently a fixed dollar amount and not a percentage of the transaction amount.75
Equipmentof cash access devices, such as the provision of certainof: (i) software licenses, software subscriptions, professional services software licensing, and certain other ancillary fees; (ii) service related fees associated with the sale, installation, and maintenance of those devices. In addition, other revenues consist of Central Credit revenuesequipment directly to our customers under contracts, which are generally short-term in nature with payment terms ranging from 30 to 90 days, secured by the related equipment; (iii) credit worthiness-related software subscription services that are based upon either a flat monthly unlimited usage fee or a variable fee structure driven by the volume of patron credit histories generated. Also included in other revenues are revenues generated fromgenerated; and (iv) ancillary marketing, database, and InternetInternet-based gaming related activities.EquipmentSystems RevenuesWe sell gaming equipment, fully integrated kiosksthe revenues are recognized as earned at a point in time. Subscription services are recognized over a period of time using an input method based on time elapsed as we transfer the control ratably by providing a stand-ready service. Professional and gaming systems directly to our customers under independent sales contracts through normal credit terms, or may grant extended credit terms under contracts secured byother services revenues are recognized over a period of time using an input method based on time elapsed as services are provided, thereby reflecting the related equipment.For sales arrangements with multiple deliverables, we apply the guidance from ASC 605-25, “Revenue Recognition - Multiple-Element Arrangements.” In addition, we apply the guidance from ASC 985-605, “Software – Revenue Recognition” which affects vendors that sell or lease tangible products in an arrangement that contains software that is more than incidentaltransfer of control to the tangible product as a whole and clarifies what guidance should be used in allocating and measuring revenue.The majority of our multiple element sales contracts are for some combination of gaming equipment, player terminals, content, system software, license fees, ancillary equipment and maintenance.Revenue related to systems arrangements that contain both software and non-software deliverables requires allocation of the arrangement fee to the separate deliverables using the relative selling price method. Revenue for software deliverables is recognized under software revenue recognition guidance. Revenue resulting from the sale of non-software deliverables, such as gaming devices and other hardware, are accounted for based on other applicable revenue recognition guidance as the devices are tangible products containing both software and non-software components that function together to deliver the product's essential functionality.In allocating the arrangement fees to separate deliverables, we evaluate whether we have vendor-specific objective evidence (“VSOE”) of selling price, third party evidence (“TPE”) or estimate of selling price (“ESP”) for gaming devices, maintenance and product support fees and other revenue sources. We generally use ESP to determine the selling price used in the allocation of separate deliverables, as VSOE and TPE are generally not available. We determine the ESP on separate deliverables by estimating a margin typically received on such items and applying that margin to the product cost incurred.Generally, player terminal sales include ancillary equipment, such as networking gear, bases, chairs, and occasionally signage, some of which may be necessary for the full functionality of the player terminals in a casino. This ancillary equipment comprises an install kit that is shipped simultaneously with the player terminals. Although our products are analyzed as multiple deliverable arrangements, revenue for the player terminal and ancillary equipment is not recognized until all elements essential for the functionality of the product have been shipped or delivered. This includes game theme software and essential ancillary equipment. If elements that are not essential to the functionality of the player terminals are shipped after the unit, such as signage, chairs, or bases, these items would be classified as deferred revenue until shipped or delivered.(exclusive(Exclusive of depreciationDepreciation and amortization)principal costs included within cost of revenues (exclusive of depreciation and amortization) are commissions paid to gaming establishments, interchange fees paid to credit and debit card networks, transaction processing fees to our transaction processor, inventory and related costs associated with the sale of our fully integrated kiosks, electronic gaming machines and system sales,sale, check cashing warranties, field service, and network operations personnel.76Consolidated Statements of (Loss) Income and Comprehensive (Loss) Income,, were $0.9$3.4 million, $1.1 million, and $0.7$1.2 million for the years ended December 31, 2015, 20142018, 2017, and 2013,2016, respectively.gaminggame engines, casino data management systems, casino central monitoring systems, video lottery outcome determination systems, gaming platforms and gaming content, as well asand to add enhancements toenhance our existing product lines. We believe our ability to deliver differentiated, appealing products and services to the marketplace is based on our research and development investments, and we expect to continue to make such investments in the future. Research and development costs consist primarily of salaries and benefits, consulting fees, and game lab testing fees. Once the technological feasibility of a project has been established, it is transferred from research to development and capitalization of development costs beginscapitalized until the product isit becomes available for general release.$19.1$20.5 million, $18.9 million, and $0.8$19.4 million for the years ended December 31, 20152018, 2017, and 2014,2016, respectively. As research and development costs relate to our Games segment which was acquired in 2014, there were no material research and development costs for the year ended December 31, 2013.Income tax expense includes U.S.taxes, plus the provision for U.S. taxes on undistributed earnings of international subsidiaries not deemed to be permanently invested. Since it is management’s practice and current intent to reinvest the earnings in the international operations oftaxes. The 2017 Tax Act also subjects our foreign subsidiaries, U.S. federal income taxes have not been provided onsubsidiary earnings to the undistributed earnings of any foreign subsidiaries except for GCA Macau.Global Intangible Low-Taxed Income (“GILTI”) tax provisions. Some items of income and expense are not reported in tax returns and the consolidated financial statementsour Financial Statements in the same year. The tax effect of such temporary differences is reported as deferred income taxes.In connection with the acquisition of Everi Games Holding Inc., we merged the Everi Payments(“Merged 401(k) Plan”) into the Everi Games Holding Inc. 401(k) Plan (“Surviving 401(k) Plan”), which was adopted for domestic employees of Everi Games and Everi Payments and their domestic subsidiaries. The Surving 401(k) Plan Participant investment elections were not mapped from the current provider as the Merged Plan assets were liquidated from their current investments and the proceeds were provided to the new provider. The Participant contributions were sent to the new provider into the Plan’s default fund until such time that a Participant made investment elections. The Surviving 401(k) Plan structure is similar to the Merged 401(k) Plan and allows employees to defer up to the lesser of the Internal Revenue Code prescribed maximum amount or 100% of their income on a pre-tax basis through contributions to the plan. As a benefit to employees, we matchthe Company matches a percentage of these employee contributions (as defined in the plan document). Expenses related to the matching portion of the contributions to the 401(k) Plan were $1.3$2.2 million, $0.5$2.3 million, and $0.5$1.9 million for the years ended December 31, 2015, 20142018, 2017, and 2013,2016, respectively.77receivables,and other receivables, settlement liabilities, accounts payable and accrued expenses approximatesapproximate fair value due to the short-term maturities of these instruments. The fair value of the long-term trade and loans receivable is estimated by discounting expected future cash flows using currentareis estimated based on various inputs to determine a market price, such as: market demand and supply, size of tranche, maturity, and similar instruments trading in more active markets. 445,900 490,000 314,900 335,000 297,500 350,000 senior secured notes wereestimated fair valuedvalue and outstanding balances of our borrowings are as follows (in thousands): Fair Value December 31, 2018 Term loan 2 $ 784,479 $ 807,700 Senior unsecured notes 1 $ 354,863 $ 375,000 December 31, 2017 Term loan 2 $ 826,099 $ 815,900 Senior unsecured notes 1 $ 372,656 $ 375,000 32 input by evaluating the trading activities of similar debt instruments as there was no market activitywere quoted prices in markets that were not considered active as of December 31, 2015.2018 and December 31, 2017. The senior unsecured notes were syndicated in April 2015 and transitioned from level 3 to level 1 on thereported at fair value hierarchy.Atusing a Level 1 input as there were quoted prices in markets that were considered active as of December 31, 2014, the fair value of our long-term debt was considered to approximate the carrying amount as our acquisition of Everi Games occurred on2018 and December 19, 2014, for which our long-term debt was incurred.Consolidated Statements of (Loss) Income and Comprehensive (Loss) Income.. Translation adjustments on intercompany balances of a long-term investment nature are recorded as a component of Accumulated Other Comprehensive Incomeaccumulated other comprehensive loss on our Consolidated Balance Sheets.notes.notes in conformity with accounting principles generally accepted in the United States. The actual results may differ from these estimates. These accounting estimates incorporated into the consolidated financial statements include, but are not limited to:·the estimates and assumptions related to the preparation of the unaudited pro forma financial information contained herein;·the estimates and assumptions related to the preliminary purchase price allocation based on the estimated fair values of the assets acquired and liabilities assumed related to any of our acquisitions;·the estimated reserve for warranty expense associated with our check warranty receivables;·the valuation and recognition of share based compensation;·the valuation allowance on our deferred income tax assets;·the estimated cash flows in assessing the recoverability of long lived assets;·the estimates of future operating performance, weighted average cost of capital (“WACC”) and growth rates as well 78as other factors used in our annual goodwill and assets impairment evaluations;·the renewal assumptions used for customer contracts to estimate the useful lives of such assets; and·the judgments used to determine the stages of development and costs eligible for capitalization as internally developed software.antidilutive.payment awards resultcompensation is considered an equity award and results in a cost that is measured at fair value on the award’s grant date. including our cliff vesting time-based awards, expected to be exercised currently, and in future periods, were measured at fair value on the grant date using the Black Scholes model. Our restricted stock awards expected to be vested currently, and restricted stock units, including the restricted stock units bound by certain performance-based metrics issued in future periods,2018, were measured at fair value based on the stock price on the grant date. The compensation expense is recognized on a straight-line basis over the vesting period of the awards.stock options willgranted in 2017 and 2016 under our 2014 Equity Incentive Plan (the “2014 Plan”) and 2012 Equity Incentive Plan (as amended, the “2012 Plan”) vest if our averageat a rate of 25% per year on each of the first four anniversaries of the grant date, provided that as of the vesting date for each vesting tranche, the closing price of the Company’s shares on the New York Stock Exchange is at least a specified price hurdle, defined as a 25% and 50% premium for 2017 and 2016, respectively, to the closing stock price in anyon the grant date. If the price hurdle is not met as of the vesting date for a vesting tranche, then the vested tranche shall vest and become vested shares on the last day of a period of 30 consecutive trading days meets certain target prices during a four year period that commenced onwhich the grant date of these options. If these target prices are not met duringclosing price is at least the four year period, the unvested shares underlying the options will terminate except if there is a change in control of the Company, as defined in the 2014 Equity Incentive Plan, in which case, the unvested shares underlying such options shall become fully vested on the effective date of such change in control transaction. price hurdle.market-basedperformance-based awards, with such estimates updated periodically; and with actual forfeitures recognized currently to the extent they differ from the estimates. years from the date of grant. In connection with our annual grant in 2015, certain market-based stock option awards were issued that expire seven years from the date of grant. The exercise price of stock options is generally the closing market price of our common stock on the date of the stock option grant.financial statementsFinancial Statements to conform to the current period presentation.November 2015, the FASB issued Accounting Standards Update (“ASU”) 2015-17 Balance Sheet Classification of Deferred Taxes, which requires that deferred tax assets and deferred tax liabilities be classified as noncurrent in the balance sheet. ASU No. 2015-17 is effective for the interim and annual periods beginning after December 15, 2016. Early adoption is permitted. During the fourth quarter of 2015, we elected to prospectively adopt this standard. The prior reporting period was not retrospectively adjusted. The adoption of this guidance had no impact on our Consolidated Statements of (Loss) Income and Comprehensive (Loss) Income.In September 2015,March 2018, the FASB issued ASU No. 2015-16,2018-05, which provides guidance on business combinations. The ASU requires an acquirer recognize adjustments to estimated amounts that are identified duringaccounting for the measurement period in the 79reporting period in which the adjustment amounts are determined. The amendments require that the acquirer record, in the same period’s financial statements, the effect on earnings of changes in depreciation, amortization, or other incometax effects if any, as a result of the change2017 Tax Act (pursuant to the estimated amounts, calculated as if the accounting had been completed at the acquisition date. The standard is effective for annual reporting periods beginning after December 15, 2015, with early adoption permitted. We implemented this guidance during the current period as it impacted the final purchase price allocation adjustments associated with our acquisition of Multimedia Games Holdings Inc.RecentSEC Staff Accounting Guidance Not Yet AdoptedIn February 2016, the FASB issued ASUBulletin No. 2016-02, which provides guidance on the accounting treatment of leases. The ASU establishes a right-of-use (ROU) model that requires a lessee to record a ROU asset and a lease liability on the balance sheet for all leases with terms longer than 12 months. Leases will be classified as either financing or operating, with classification affecting the pattern of expense recognition in the income statement.118). The new standard is effective for fiscal years beginning after December 15, 2018, including interim periods within those fiscal years and early adoption is permitted. A modified retrospective transition approach is required for lessees for capital and operating leases existing at, or entered into after,March 13, 2018. We have adopted this guidance in the beginningquarter ended March 31, 2018. In accordance with this guidance, some of the earliest comparative period presentedincome tax effects recorded in the financial statements, with certain practical expedients available. We are currently evaluating the impact2017 were provisional and insignificant adjustments were made during 2018. As of adopting this guidance onDecember 22, 2018, we completed our Consolidated Financial Statementsanalysis and disclosures included within Notes to the Consolidated Financial Statements.In July 2015, the FASB issued ASU No. 2015-11, which provides guidance on the measurement of inventory value. The amendments require an entity to measure in scope inventory at the lower of cost and net realizable value. Net realizable valueour updated assessment is the estimated selling prices in the ordinary course of business, less reasonably predictable costs of completion, disposal, and transportation. Subsequent measurement is unchanged for inventory measured using LIFO or the retail inventory method. The amendments do not apply to inventory that is measured using last-in, first-out (LIFO) or the retail inventory method. The amendments apply to all other inventory, which includes inventory that is measured using first-in, first-out (FIFO) or average cost. The pronouncement is effective for annual periods beginning after December 15, 2016, and interim periods within those fiscal years, and early adoption is permitted. We are currently evaluating the impact of adopting this guidance on our Consolidated Financial Statements and disclosures included within Notes to the Consolidated Financial Statements.In April 2015, the FASB issued ASU No. 2015-03, which provides guidance to simplify the presentation of debt issuance costs. These amendments require that debt issuance costs related to a recognized debt liability be presented in the balance sheet as a direct deduction from the carrying amount of that debt liability, consistent with debt discounts. The recognition and measurement guidance for debt issuance costs are not affected by the amendments in this ASU. The pronouncement is effective for annual periods beginning after December 15, 2015, and interim periods within those fiscal years, and early adoption is permitted for financial statements that have not been previously issued. This guidance was further clarified in ASU No. 2015-15 which addressed the treatment of debt issuance costs related to line-of credit arrangements. It noted that as ASU No. 2015-03 did not provide guidance on debt issuance costs related to line-of credit arrangements, the SEC would not object to an entity deferring and presenting these specific debt issuance costs as an asset and subsequently amortizing the deferred debt issuance costs ratably over the term of the line-of-credit arrangement, regardless of whether there are any outstanding borrowings on the line-of-credit arrangement. We expect to adopt the guidance in ASU No. 2015-03 and 2015-15 to reclassify all debt issuance costs not associated with line-of-credit arrangements from other assets, non-current to contra-liabilities to long-term debt on our Consolidated Balance Sheets and related notes for the year ending December 31, 2016.In January 2015, the FASB issued ASU No. 2015-01, which eliminates the requirement that an entity separately classify, present and disclose extraordinary events and transactions. The pronouncement is effective for annual periods ending after December 15, 2015. A reporting entity also may apply the amendments retrospectively to all prior periods presented in the financial statements. Early adoption is permitted provided that the guidance is applied from the beginning of the fiscal year of adoption. We expect to implement this guidance for the year ended December 31, 2016 and do not anticipate the ASU to have a material2017 Tax Act has no further impact on our results of operationspreviously reported income tax provisions or financial condition.In August 2014, the FASB issued ASU No. 2014-15, which provides guidance on determining when and how reporting entities must disclose going-concern uncertaintiesour deferred tax assets or liabilities; therefore, these amounts are no longer considered provisional in their financial statements. The pronouncement is effective for annual 80periods ending after December 15, 2016, and interim periods thereafter, and early adoption is permitted. We are currently evaluating the impact of adopting this guidance on our Consolidated Financial Statements and disclosures included within Notes to the Consolidated Financial Statements.In June 2014, the FASB issued ASU No. 2014-12, which requires that a performance target that affects vesting and that could be achieved after the requisite service period be treated as a performance condition. As such, the performance target should not be reflected in estimating the grant-date fair value of the award. The standard is effective for annual reporting periods beginning after December 15, 2015, with early adoption permitted. We expect to implement this guidance for the year ended December 31, 2016 and do not anticipate the ASU to have a material impact on our results of operations or financial condition.FASB ASC Topic 606 “Revenue from Contracts with Customers” and supersedes ASC Topic 605, “Revenue Recognition”.Recognition.” The guidance replaces industry-specific guidance and establishes a single five-step model to identify and recognize revenue. The core principle of the guidance is that an entity should recognize revenue upon transfer of control of promised goods or services to customers in an amount that reflects the consideration to which an entity expects to be entitled in exchange for those goods or services. Additionally, the guidance requires the entity to disclose further quantitative and qualitative information regarding the nature and amount of revenues arising from contracts with customers, as well as other information about the significant judgments and estimates used in recognizing revenues from contracts with customers. ThisThe guidance in ASU 2014-9 was originally effective for interim and annual reporting periods beginning after December 15, 2016; however,further updated by ASU 2016-08 in August 2015,March 2016, which provided clarification on the implementation of the principal versus agent considerations in ASU 2014-09. In April 2016, the FASB issued ASU No. 2015-14,2016-10, which extendedprovides clarification on the effective dateimplementation of performance obligations and licensing in ASU 2014-9. In May 2016, the FASB issued ASU 2016-11, which amended guidance provided in two SEC Staff Announcements at the March 3, 2016 Emerging Issues Task Force meeting over various topics relating to interim and annual periods beginning afterASU 606. In May 2016, the FASB issued ASU 2016-12, which clarified various topics in ASC 606. In December 15, 2017. Early application is permitted only as of annual reporting periods beginning after December 15, 2015, including interim reporting periods within that reporting period.2016, the FASB issued ASU 2016-20, which clarified additional topics in ASC 606. This guidance may be adopted retrospectively or under a modified retrospective method where the cumulative effect is recognized at the date of initial application. We adopted this guidance effective January 1, 2018 and have provided additional information with respect to the new revenue recognition topic elsewhere in this Note 2 disclosure and also in “Note 3 — Adoption of ASC 606, Revenue from Contracts with Customers.”Consolidated Financial Statements; however, we do not expect the impact to be material.disclosures includedlease liability, representing our obligation to make lease payments for operating leases, measured on a discounted basis. We expect the ROU assets and lease liabilities of operating leases recorded to be within the range of approximately 1%-2% of total assets. We elected the practical expedients offered in the aforementioned guidance, including the transition practical expedient that states that the Company need not reassess: (a) whether expired or existing contracts contain leases; (b) the lease classification of expired or existing leases; or (c) initial direct costs for any existing leases. Other expedients adopted include practical expedient that allows a Company, as an accounting policy election by class of underlying assets, choose not to separate non-lease components from lease components; and a short-term lease recognition exemption to not record short-term leases with an initial term of 12 months or less on the balance sheet.Notesfinancial statements as summarized within the table below:Lessor Perspective Expected Impact Upon Adoption Games and FinTech Segments The adoption of ASC 842 will not have a material impact on the Company from the lessor perspective as our lessor accounting for leases will be consistent with current practices. Lessee Perspective Expected Impact Upon Adoption Games and FinTech Segments We will recognize operating lease ROU assets and liabilities primarily associated with real estate leases on our Balance Sheets for lease contracts with terms that are longer than 12 months with no material impact to the Statements of Income (Loss). The operating lease ROU assets and liabilities are expected to be recognized at the commencement date based on the present value of lease payments over the lease terms. Consolidatedperiods presented in our Financial Statements.3. Year Ended December 31, 2018 As Reported Adjustments Revenues Games revenues Gaming operations $ 168,146 $ 2,364 $ 170,510 Games total revenues 258,978 2,364 261,342 FinTech revenues Cash access services 156,806 629,641 786,447 Equipment 20,977 (1,622 ) 19,355 FinTech total revenues 210,537 628,019 838,556 Total revenues 469,515 630,383 1,099,898 Costs and expenses Gaming operations 17,603 2,364 19,967 Games total cost of revenues 68,009 2,364 70,373 Cash access services 9,717 629,092 638,809 Equipment 12,601 (825 ) 11,776 FinTech total cost of revenues 26,428 628,267 654,695 Total costs and expenses 383,702 630,631 1,014,333 Operating income 85,813 (248 ) 85,565 Income before income tax 2,646 (248 ) 2,398 Income tax benefit (9,710 ) — (9,710 ) Net income 12,356 (248 ) 12,108 Comprehensive income 10,611 (248 ) 10,363 NEWave, Inc.In April 2014, we acquired all of the outstanding capital stock of NEWave, Inc. (“NEWave”) for an aggregate purchase price of approximately $14.9 million, of which we estimated that approximately $2.5 million would be paid in the second quarter of 2015. On June 30, 2015, a final payment of $2.3 million was remitted. NEWave is a supplier of anti-money laundering compliance, audit and data efficiency software to the gaming industry. The NEWave acquisition did not have a material impact on our results of operations or financial condition.have not provided the supplemental pro forma impact of the NEWave acquisition on the revenue and earnings of the combined entity as if the acquisition date had been January 1, 2014, and the amount of revenue and earnings derived from NEWave have not been presented on a supplemental basis as such amounts are not material for the twelve months ended December 31, 2015 and 2014, respectively.Everi Games Holding Inc.On December 19, 2014, Holdings completed its acquisition of Everi Games Holding Inc. (formerly known as Multimedia Games Holding Company, Inc.) (“Everi Games Holding”). Pursuant to the terms of the Agreement and Plan of Merger, dated as of September 8, 2014 (the “Merger Agreement”), by and among Holdings, Movie Merger Sub, Inc., a wholly owned subsidiary of Holdings (“Merger Sub”), and Everi Games Holding, Merger Sub merged with and into Everi Games Holding, with Everi Games Holding continuing as the surviving corporation (the “Merger”). In the Merger, Everi Games 81Holding became a wholly owned subsidiary of Holdings. Also, as a result of the Merger, each outstanding share of common stock, par value $0.01 per share, of Everi Games, other than shares held by Holdings, Everi Games Holding, Merger Sub or their respective subsidiaries, was cancelled and converted into the right to receive $36.50 in cash, without interest (“Merger Consideration”), together with the acceleration and full vesting of Everi Games Holding equity awards, (collectively, the “Total Merger Consideration”).Everi Games designs, manufactures and supplies gaming machines and systems to commercial and Native American casino operators as well as select lottery operators and commercial bingo facility operators. Everi Games’ revenue is generated from the operation of gaming machines in revenue sharing or lease arrangements and from the sale of gaming machines and systems that feature proprietary game themes.Our combination with Everi Games Holding creates a provider of Payments and Games solutions for our gaming establishment customers. The business combination provides us with: (a) growth opportunities, (b) enhanced scale, diversification and margins, and (c) the ability to increase profitability through cost synergies.The total purchase consideration for Everi Games Holding was as follows (in thousands, except per share amounts):AmountPurchase considerationTotal purchase price for Everi Games common stock (29,948 shares at $36.50 per share)$1,093,105Payment in respect to Everi Games outstanding equity awards56,284Total merger consideration1,149,389Repayments of Everi Games debt and other obligations25,065Less: Everi Games outstanding cash at acquisition date(118,299)Total purchase consideration$1,056,155The Merger was accounted for using the acquisition method of accounting, which requires, among other things, the assets acquired and liabilities assumed be recognized at their respective fair values as of the acquisition date. The excess of the purchase price over those fair values was recorded as goodwill, none of which was deductible for tax purposes. The goodwill recognized is attributable primarily to the income potential from Everi Games penetrating into the Class III commercial casino market, the assembled workforce of Everi Games and expected synergies.The estimates and assumptions used include the projected timing and amount of future cash flows and discount rates reflecting risk inherent in the future cash flows. The estimated fair values of Multimedia’s assets acquired and liabilities assumed and resulting goodwill were subject to adjustment as the Company finalized its fair value analysis. The significant items for which a final fair value adjustment was applicable and included in the filing of this Annual Report on Form 10-K were most notably: accrued liabilities, the valuation and estimated useful lives of tangible and intangible assets and deferred income taxes. We completed our fair value determinations and recorded the final measurement period adjustments to goodwill during the fourth quarter of 2015 in accordance with the newly adopted guidance set forth in ASU No. 2015-16 with no material change in our fair value determinations; however, there were differences compared to those amounts at December 31, 2014. In accordance with this new guidance and the immaterial nature of the measurement period adjustments, the goodwill associated with the acquisition as shown in this Note 3 section did not change from the amounts disclosed in our 2014 Annual Report on Form 10-K.We analyzed our inventory and fixed asset groups in conjunction with a review of our accrual amounts recorded in connection with the original purchase price allocation estimates. The nature of the identified inventory and undeployed fixed assets were gaming machines and related equipment with no future use that should not have been allocated any value in the original purchase price allocation. The final measurement period adjustments to goodwill were approximately $0.9 million, comprised of $1.1 million related to tangible assets and accrued liabilities and $0.2 million associated with deferred income taxes, partially offset by approximately $0.4 million associated with the tax effect of these measurement period adjustments. We determined the final measurement period adjustments to be immaterial on both a quantitative and a qualitative basis.82The information below reflects the purchase price allocation (in thousands):AmountPurchase price allocationCurrent assets$68,548Property, equipment and leasehold improvements, net87,283Goodwill669,542Other intangible assets, net403,300Other receivables, non-current5,030Other assets, long-term3,392Deferred tax asset, non-current22,287Total assets1,259,382Current liabilities44,291Deferred tax liability, non-current158,418Other accrued expenses and liabilities518Total liabilities203,227Net assets acquired$1,056,155Trade receivables acquired of $24.7 million were considered to be collectible and therefore the carrying amounts were considered to approximate fair value. Inventory acquired of $16.5 million was fair valued based on model-based valuationsacquisitions for which inputs and value drivers were observable.The following table summarizes acquired tangible assets (in thousands):2 78,201 2,105 3 4,126 2 2,851 87,283 The fair value of property, equipment and leased assets was determined using the cost approach as the primary approach for valuing the majority of the personal property. The market approach was used to estimate the value of vehicles. The income approach was used to quantify any economic obsolescence that may be present in the personal property. No economic obsolescence adjustments were made to the personal property, as the business enterprise valuation indicated sufficient cash flows to support the values established through the cost and market approaches.The following table summarizes acquired intangible assets (in thousands):3 14,800 3 3,755 2 139,645 8 231,100 1 14,000 403,300 The fair values of trade names and trademarks and developed technology were determined by applying the income approach utilizing the relief from royalty methodology. The fair value of customer relationships was determined by applying the income approach utilizing the excess earnings methodology. The fair value of contract rights was considered 83to approximate the carrying amount based on contractual obligations associated with these other intangible assets. The discount rates utilized to estimate the fair value of these other intangible assets ranged from 10.0% to 11.0%.Everi Payments and Everi Games Holding had different fiscal year ends. Accordingly, the unaudited pro forma combined statements of income for the year ended December 31, 2014 combined historical Everi Consolidated Statements of Income and Comprehensive Income for its year ended December 31, 2014 with historical Everi Games Holding Consolidated Statements of Operations for its year ended September 30, 2014, giving effect to the Merger as if it had occurred on January 1, 2013. The unaudited pro forma combined statements of income for the year ended December 31, 2013 combined historical Everi Consolidated Statements of Income and Comprehensive Income for its year ended December 31, 2013 with historical Everi Games Consolidated Statements of Operations for its year ended September 30, 2013, giving effect to the Merger as if it had occurred on January 1, 2013.The unaudited pro forma combined financial information does not purport to represent the results of operations of Everi that would have actually resulted had the Merger been completed as of the dates indicated, nor should the information be taken as indicative of the future results of operations or financial position of the combined company. The unaudited pro forma combined financial statements do not reflect the impacts of any potential operational efficiencies, cost savings or economies of scale that Everi may achieve with respect to the combined operations of Everi and Everi Games Holding. The unaudited pro forma amounts include the historical operating results of the Company and Everi Games Holding prior to the Merger, with adjustments directly attributable to the Merger. The unaudited pro forma results include increases to depreciation and amortization expense based on the purchased intangible assets and the step-up in basis associated with tangible assets acquired and increases to interest expense, related to debt issued to fund the Merger. Also reflected in the year ended December 31, 2014 are adjustments for the impact of acquisition-related costs and other cost as a result of the Merger of $27.4 million. There were no acquisition-related costs incurred for the year ended December 31, 2013. All adjustments utilized an effective federal statutory tax rate of 35.0%.The following table reflects selected financial data from the unaudited pro forma consolidated financial information assuming the Merger occurred as of January 1, 2013 (in thousands): 800,732 771,810 (5,083) (7,003) (0.08) (0.11) (0.08) (0.10) The financial results for Everi Games Holding included in our Consolidated Statements of Income and Comprehensive Income since the acquisition date of December 19, 2014 reflected revenues of approximately $7.4 million and net loss of approximately $3.0 million, including acquisition-related costs of $1.3 million.During the years ended December 31, 20152018, 2017, and 2014, we expensed approximately $2.7 and $10.7 million, respectively, of costs related to the acquisition of Everi Games for financial advisory services, financing related fees, accounting and legal fees and other transaction-related expenses and are included in the Consolidated Statements of (Loss) Income and Comprehensive (Loss) Income within Operating Expenses. These costs do not include any costs related to additional site consolidation or rationalization that we might consider following the closing of the Merger.Resort Advantage, LLC for an aggregate purchase price of approximately $14.0 million, of which we estimated that approximately $4.7 million would be paid under the provisions of the agreement over a period of 40 months. Resort Advantage is, a supplier of comprehensive and integrated solutions for complete Financial Crimes Enforcement Network (“FinCEN”) and IRSInternal Revenue Service regulatory compliance to the gaming industry.industry, for an aggregate purchase price of approximately $13.3 million, of which we estimated that approximately $4.7 million (the “earn out liability”) would be paid under the provisions of the agreement over a period of 40 months (the “payout period”) based upon an evaluation over a period of 36 months (the “earn out period”) following the closing of the transaction. Upon expiration of the earn out period in August 2018, we analyzed the remaining earn out liability of approximately $0.8 million and determined that approximately $0.6 million would not be realized; therefore, we reversed that amount into income. We continued to record approximately $0.2 million in remaining earn out liability to potentially be paid under the provisions of the agreement during the first quarter of 2019. The Resort Advantage acquisition did not have a material impact on our results of operations or financial condition.84not provided the supplemental pro forma impact of the Resort Advantage acquisition on the revenue and earnings of the combined entity as if the acquisition date had been January 1, 2014, and the amount of revenue and earnings derived from Resort Advantage have not been presented on a supplemental basis as such amounts are not material for the twelve months ended December 31, 2015 and 2014, respectively.4. ATM FUNDING AGREEMENTSContract Cash Solutions AgreementOur Contract Cash Solutions Agreementcommercial arrangements with Wells Fargo Bank, N.A. (“Wells Fargo”) allows us to use funds owned by Wells Fargothird party vendors to provide the currency neededcash for normal operating requirements forcertain of our ATMs. For the use of these funds, we pay Wells Fargo a cash usage fee on either the average daily balance of funds utilized multiplied by a contractually defined cash usage rate or the amounts supplied multiplied by a contractually defined cash usage rate. These cash usage fees, reflected as interest expense within the Consolidated Statements of (Loss) Income and Comprehensive (Loss) Income,, were $2.3$7.0 million, $2.3$4.9 million, and $2.2$3.1 million for the years ended December 31, 2015, 20142018, 2017, and 2013,2016, respectively. We are exposed to interest rate risk to the extent that the applicable London Interbank Offered Rate (“LIBOR”) increases.this agreement, allthese agreements, the currency supplied by Wells Fargo remains thethird party vendors remain their sole property of Wells Fargo at all times until it is dispensed, at which time Wells Fargo obtains an interest in the corresponding settlement receivable which is recorded on a net basis.funds are dispensed. As these funds are not our assets, supplied cash is not reflected on the Consolidatedin our Balance Sheets. The outstanding balances of ATM cash utilized by us from Wells Fargothe third parties were $364.5approximately $224.7 million and $396.3$289.8 million as of December 31, 20152018 and 2014,2017, respectively.In November 2014, we amendedto extend the term one year until November 30, 2015.In June 2015, weas amended, the Contract Cash Solutions Agreement to decreasewith Wells Fargo provides us with cash in the maximum amount of cash$300 million with the ability to be provided to us from $500.0increase the amount by $75 million to $425.0 million and to extendover a 5-day period for holidays, such as the period around New Year’s Day. The term of the agreement from November 30, 2015 toexpires on June 30, 2018. 20152018, 2017, and 2014.Site-Fundedsite-funded ATMs. The Site-Fundedsite-funded ATM liability is included within “Settlement liabilities”settlement liabilities in the accompanying Consolidated Balance Sheets and was $84.9$249.6 million and $69.3$210.8 million as of December 31, 20152018 and 2014,2017, respectively.5.for which collateral isas well as long-term loans receivable on our games, equipment, and compliance products. Trade and loans receivables generally do not required.require collateral. The balance of trade and loans receivables consists of outstanding balances owed to us by gaming establishmentsestablishments. Other receivables include income tax receivables and casino patrons. other miscellaneous receivables.38,064 28,270 14,318 9,427 52,382 37,697 A significant portion At December 31, 2018 2017 Trade and other receivables, net Games trade and loans receivables $ 53,011 $ 38,070 FinTech trade and loans receivables 18,890 10,780 Other receivables 1,333 1,570 Total trade and other receivables, net $ 73,234 $ 50,420 Non-current portion of receivables Games trade and loans receivables (2,922 ) (1,267 ) (5,925 ) (1,371 ) Total non-current portion of receivables $ (8,847 ) $ (2,638 ) Total trade and other receivables, current portion $ 64,387 $ 47,782 balanceeffective date of the allowance for doubtful accounts for trade receivables is from warranty receivables. On a monthly basis,adoption in accumulated deficit.85face amount of the expected losses on theseour receivables. The allowance for doubtful accounts for trade receivables was approximately $6.4 million and $4.7 million as of December 31, 2018 and 2017, respectively, and included approximately $3.2 million and $2.7 million of check warranty expense associated with this reservereserves, respectively. The provision for doubtful customer accounts receivable is generally included within cost of revenues (exclusive of depreciation and amortization)operating expenses in the Consolidated Statements of (Loss) Income and Comprehensive (Loss) Income.AmountBalance, December 31, 2012$6,908Warranty expense provision7,874Charge offs against reserve(12,005)Balance, December 31, 2013$2,777Warranty expense provision9,029Charge offs against reserve(9,022)Balance, December 31, 2014$2,784Warranty expense provision9,263Charge offs against reserve(9,074)Balance, December 31, 2015$2,973While the reserve for warranty losses comprises the majority of the Company’s total allowance for trade receivables, the Company had bad debt expense of $0.9 million during the year ended December 31, 2015. The amount expensed for other charge-offs during the year ended December 31, 2014 was not material. As of December 31, 2015, the Company had $0.9 million reserves exclusive of the warranty reserve. The combined balance of other reserves was not material as of December 31, 2014.6. OTHER RECEIVABLESOther receivables include the balance of notes and loans receivable on our games and fully integrated kiosk products, development agreements, which are generated from reimbursable amounts advanced to tribal customers generally used by the customer to build, expand or renovate its facility, and an agreement with Bee Caves Games, Inc. (“Bee Caves Games”) in July 2014, under which the Company agreed to make a loan pursuant to a secured promissory note in the amount of $4.5 million. In association with the promissory note, the Company received warrants to purchase Bee Caves Games common stock, and recorded a discount to the note for the fair value of the warrants received. The warrants are included in the balance of other assets, non-current. The note, which bears interest at 7%, requires interest only payments for the first 24 months followed by repayments of principal and interest in 48 equal monthly installments.Other receivables also include income taxes receivable and other miscellaneous receivables. The balance of other receivables consisted of the following (in thousands):9,930 13,939 421 15,092 1,232 706 11,583 29,737 6,655 9,184 4,928 20,553 86 Amount Balance, December 31, 2015 $ 2,973 Warranty expense provision 8,694 Charge-offs against reserve (8,972 ) Balance, December 31, 2016 2,695 Warranty expense provision 9,418 Charge-offs against reserve (9,404 ) Balance, December 31, 2017 2,709 Warranty expense provision 9,819 Charge-offs against reserve (9,366 ) Balance, December 31, 2018 $ 3,162 PREPAID AND OTHER ASSETSPrepaid and other assets include the balance of prepaid expenses, deposits, debt issuance costs, restricted cash and other assets. The short-term portion of these assets is included in prepaid and other assets and the long-term portion is included in other assets, non-current. The balance of prepaid and other assets, current consisted of the following (in thousands):8,255 7,163 8,946 8,781 3,571 3,044 20,772 18,988 The balance of other assets, non-current consisted of the following (in thousands):24,599 41,109 4,521 3,956 5,934 5,878 35,054 50,943 8. INVENTORYgoods and work-in-progress.goods. The cost of inventory includes cost of materials, labor, overhead and freight. The inventory is stated at the lower of cost or marketnet realizable value and accounted for using the firstFIFO method.first out method.23,663 21,151 1,495 803 3,580 5,209 28,738 27,163 87 At December 31, 2018 2017 Inventory Component parts, net of reserves of $1,468 and $1,327 at December 31, 2018 and December 31, 2017, respectively $ 23,197 $ 18,782 Work-in-progress 280 985 Finished goods 926 4,200 Total inventory $ 24,403 $ 23,967 At December 31, 2018 2017 Prepaid expenses and other assets Deposits $ 8,241 $ 9,003 Prepaid expenses 8,351 6,426 Other 3,667 5,241 Total prepaid expenses and other assets $ 20,259 $ 20,670 Contentsthe non-current portion of other assets consisted of the following (in thousands): At December 31, 2018 2017 Other assets Prepaid expenses and deposits $ 5,289 $ 4,103 Debt issuance costs of revolving credit facility 654 849 Other 309 2,657 Total other assets $ 6,252 $ 7,609 (amounts in(in thousands):2 91,743 29,993 61,750 70,295 876 69,419 2 11,950 3,361 8,589 10,562 151 10,411 20,601 12,885 7,716 23,572 16,544 7,028 7,564 2,038 5,526 6,289 895 5,394 7,662 2,711 4,951 3,372 1,873 1,499 2 32,313 14,537 17,776 21,405 9,071 12,334 171,833 65,525 106,308 135,495 29,410 106,085 At December 31, 2018 At December 31, 2017 Useful Life
(Years) Cost Cost Property, equipment and
leased assets Rental pool - deployed 2-4 $ 183,309 $ 105,038 $ 78,271 $ 162,319 $ 80,895 $ 81,424 Rental pool - undeployed 2-4 23,825 14,680 9,145 17,366 9,374 7,992 FinTech equipment 3-5 27,285 21,000 6,285 25,907 18,654 7,253 Leasehold and building
improvements Lease
Term 11,857 6,938 4,919 10,981 5,211 5,770 Machinery, office and other
equipment 2-5 46,322 28,654 17,668 35,167 24,087 11,080 Total $ 292,598 $ 176,310 $ 116,288 $ 251,740 $ 138,221 $ 113,519 other property, equipment and leased assets totaled approximately $45.6$61.2 million, $8.7$47.3 million, and $7.4$50.0 million for the years ended December 31, 2015, 20142018, 2017, and 2013,2016, respectively. In connection with our fourth quarter 2015 annual financial statement review, we determined that certain gaming fixed assets either: (a) had economic lives that were no longer supportable and shortened given approximately one year of experience with the Games segment that resulted in an accelerated depreciation charge of approximately $2.6 million in the current period; or (b) were fully impaired as there was little to no movement in the portfolio with recent shipments having been returned and no future deployment anticipated that resulted in an accelerated depreciation charge of approximately $1.0 million in the current period. Our property, equipment and leased assets were not impaired for the years ended December 31, 20142018 and 2013.In connection with the sale2017.certain assets related toapproximately $0.8 million in our PokerTek products duringGames segment for the year ended December 31, 2015 for a purchase price2018 to reduce the carrying value of $5.4 million, we recorded a gain of approximately $3.9 million, whichcertain leased assets to their fair values. The adjustment was included in operating expenses in our Consolidated Statements of (Loss) Income and Comprehensive (Loss) Income.in certain cases may be a component of anare identified as operating segment,segments or one level below, for impairment on an annual basis and between annual tests if events and circumstances indicate it is more likely than not that the fair value of a reporting unit is less than its carrying amount.Goodwill TestingIn performing2015beginning of our fourth fiscal quarter, or more often under certain circumstances. The annual impairment test is completed using either: a qualitative “Step 0” assessment based on reviewing relevant events and circumstances; or a quantitative “Step 1” assessment, which determines the fair value of the reporting unit, using both an income approach that discounts future cash flows based on the estimated future results of our reporting units and a market approach that compares market multiples of comparable companies to determine whether or not any impairment exists.utilizedutilize the two-step approach prescribed under ASC 350. The first step“Step 1” required a comparison of the carrying valueamount of each reporting unit to its estimated fair value. To estimate the fair value of our reporting units for Step 1,“Step 1”, we used a combination of thean income valuation approach and thea market valuation approach. The income approach is based on a discounted cash flow (“DCF”) analysis. This method involves estimating the after-tax cash flows attributable to a reporting unit and then discounting the after-tax cash flows to a present value, using a risk-adjusted discount rate. Assumptions used in the DCF require the exercise of significant judgment, including, but not limited to: appropriate discount rates and terminal values, growth rates and the amount and timing of expected future cash flows. The forecastedprojected cash flows are based on our most recent annual budget and projected years beyond. Our budgets and forecastedprojected cash flows are based on estimated future growth rates. We believe our assumptions are consistent with the plans and estimates used to manage the underlying businesses. The discount rates, which are intended to reflect the risks inherent in future cash flow projections, used in the DCF are based on estimates of the weighted average cost of capital (“WACC”)WACC of market participants relative to each respective reporting unit. The market approach considers comparable market data based on multiples of revenue or earnings before interest, taxes, depreciation and amortization (“EBITDA”).88 carrying amount of a reporting unit exceeds its estimated fair value, we are required to perform the second step of the goodwill impairment test to measure the amount of impairment loss, if any. The second step of the goodwill impairment test compares the implied fair value of a reporting unit’s goodwill tounit is less than its carrying amount. The implied fair value of goodwill is derivedamount, an impairment charge equal to the amount by performing a hypothetical purchase price allocation for the reporting unit as of the measurement date, allocating the reporting unit’s estimated fair value to its assets and liabilities. The residual amount from performing this allocation represents the implied fair value of goodwill. To the extent this implied fair value is belowwhich the carrying amount of goodwill an impairment charge is recorded.Key assumptions used in estimatingfor the reporting unit exceeds the fair value underof that goodwill is recorded in accordance with ASC 350.discounted cash flow approach included a discount rate of: (a) 11.0%carrying amount for each of the Games, Cash Access Services, Kiosk Sales and Services, Central Credit Services and Compliance Sales and Services reporting units for 2018 and 2017. Advance, ATM, CheckAccess Services, Kiosk Sales and Services, Central Credit Services and Central CreditCompliance Sales and Services reporting units; (b) 10.0%units, while Games reporting unit had a goodwill impairment of $146.3 million for 2016. The impairment recorded in 2016 was primarily based upon limited growth and capital expenditure constraints in the gaming industry, consolidation and increased competition in the gaming manufacturing space, stock market volatility, global and domestic economic uncertainty, and lower than forecasted operating profits and cash flows. Based on these indicators, we revised our estimates and assumptions for the Games reporting unit; (c) 12.5% for the Kiosk Salesunit.Services reporting unit; and (d) 16.0%, for the Compliance reporting unit. In addition, projected compound average revenue growth rates of approximately (3.3)% to 14.0% and terminal value growth rates of approximately (1.0)% to 3.1% were usedindustry trends. This process is generally completed in the analyses. fourth quarter and considered in conjunction with the annual goodwill impairment evaluation. discounted cash flow analyses forannual evaluation of goodwill requires the use of estimates about future operating results of each reporting unit to determine its estimated fair value. Changes in forecasted operations can materially affect these estimates, which could materially affect our reporting units included estimated future cash inflows from operations and estimated future cash outflows for capital expenditures.Key assumptions used in estimating fair value under the market approach were based on observed market multiplesresults of enterprise value to revenue and EBITDA for both comparable publicly traded companies and recent merger and acquisition transactions involving similar companies to estimate appropriate controlling basis multiples to apply to each of the reporting units. Based on the multiples implied by this market data, we selected multiples of revenue of approximately 0.9 to 10.6 times and multiples of EBITDA of 5.0 to 8.7 times.estimateestimates of fair value requiresrequire significant judgment. Wejudgment and are based our fair value estimates on assumptions that we believedetermined to be reasonable; buthowever, that are unpredictable and inherently uncertain, including:including, estimates of future growth rates, operating margins, and assumptions about the overall economic climate as well as the competitive environment for our reporting units. There can be no assurance that our estimates and assumptions made for purposes of our goodwill testing as of the time of testing will prove to be accurate predictions of the future. If our assumptions regarding business plans, competitive environments or anticipated growth rates are not correct, we may be required to record goodwill impairment charges in future periods, whether in connection with our next annual impairment testing, or earlier, if an indicator of an impairment is present prior to our next annual evaluation.We conduct our annual impairment test for ourduringare identified as operating segments or one level below. Reporting units must: (a) engage in business activities from which they earn revenues and incur expenses; (b) have operating results that are regularly reviewed by our segment management to ascertain the fourth quarter of eachresources to be allocated to the segment and assess its performance; and (c) have discrete financial information available. Our reporting period. In connection with our annual goodwill impairment testing process for 2015, we determined that ourunits included: Games, reporting unit did not pass the step one testCash Access Services, Kiosk Sales and therefore we were required to conduct a step two analysis to determine the amount of impairment which was approximately $75 million for the year ended December 31, 2015. This conclusion was primarily based upon limited growthServices, Central Credit Services, and capital expenditure constraints in the gaming industry, consolidationCompliance Sales and increased competition in the gaming manufacturing space, stock market volatility, global and domestic economic uncertainty, and lower than expected operating profits and cash flows in 2015. Based on these indicators, we revised our estimates and assumptions for the Games reporting unit, which resulted in a goodwill impairment charge.Our goodwill was not impaired for the years ended December 31, 2014 and 2013 based upon the results of our testing.89
Advance
Services100,880 33,051 23,281 22,872 180,084 669,452 8,439 677,891 (62) (62) 100,818 33,051 23,281 669,452 31,311 857,913 6,117 6,117 (75,008) (75,008) (115) (115) 896 896 100,703 33,051 23,281 595,340 37,428 789,803 *Includes the final 2015 measurement period adjustments associated with the acquisition of our Games business in late 2014. Games Cash Access Services Kiosk Sales and Services Central Credit Services Compliance Sales and Services Total Goodwill Balance, December 31, 2016 $ 449,041 $ 157,055 $ 5,745 $ 17,127 $ 11,578 $ 640,546 Foreign translation adjustment — 43 — — — 43 Balance, December 31, 2017 $ 449,041 $ 157,098 $ 5,745 $ 17,127 $ 11,578 $ 640,589 Foreign translation adjustment — (52 ) — — — (52 ) Balance, December 31, 2018 $ 449,041 $ 157,046 $ 5,745 $ 17,127 $ 11,578 $ 640,537 1 16,453 7,612 8,841 14,000 301 13,699 7 50,177 34,755 15,422 43,938 29,931 14,007 8 231,100 21,723 209,377 231,100 733 230,367 1 197,658 63,591 134,067 174,417 14,604 159,813 1 28,240 13,485 14,755 27,856 8,957 18,899 523,628 141,166 382,462 491,311 54,526 436,785 At December 31, 2018 At December 31, 2017 Cost Cost Other intangible assets 4 $ 57,440 $ 12,178 $ 45,262 $ 57,231 $ 3,910 $ 53,321 Customer contracts 6 51,175 46,162 5,013 51,175 43,638 7,537 Customer relationships 8 231,100 84,619 146,481 231,100 63,653 167,447 2 277,243 190,886 86,357 249,064 158,919 90,145 Patents, trademarks and other 4 29,168 24,884 4,284 29,046 23,185 5,861 Total $ 646,126 $ 358,729 $ 287,397 $ 617,616 $ 293,305 $ 324,311 20152018, 2017, and 2013. For the year ended December 31, 2014, our online payment processing intangible assets were identified for further testing. We determined that these definite-lived intangible assets were potentially impaired primarily due to a combination of the following factors: (a) legislative constraints at the state and federal level; (b) significant changes in management; and (c) lower than anticipated operating results.These definite-lived intangible assets were evaluated using an undiscounted cash flow approach to determine if an impairment existed. As impairment was indicated based on the undiscounted cash flow approach, we discounted the cash flows and applied probability factors to calculate the resulting fair values and compared to the existing carrying value to determine the amount of impairment. 2016.amount of impairment was approximately $3.1 million leaving a revised cost basis of $1.6 million and a remaining life of three years at December 31, 2014. This amount was recorded in Operating Expenses in our Consolidated Statements of (Loss) Income and Comprehensive (Loss) Income. These assets have been valued using level 3 fair value inputs.Amortization expense related to other intangible assets totaled approximately $85.5 million, $14.2 million and $9.6 million for the years ended December 31, 2015, 2014 and 2013, respectively. We capitalized and placed into service $6.1 million, $8.2 million and $5.1 million of software development costs for the years ended December 31, 2015, 2014 and 2013, respectively.The total net book value of amortizable intangible assets was approximately $382.5 million at December 31, 2015. The total net book value of amortizable intangible assets was approximately $436.8 million at December 31, 2014. The 9095,077 53,775 40,479 37,923 35,748 110,119 373,121 Anticipated amortization expense Amount 2019 $ 64,380 2020 52,168 2021 41,440 2022 33,473 2023 20,241 Thereafter 50,316 $ 262,018 (1) 2015,2018, the Company had $9.3$25.4 million in other intangible assets which had not yet been placed into service. development and placement fee agreements to provide financing for newsecure a long-term revenue share percentage and a fixed number of player terminal placements in a gaming facilities or for the expansion or improvement of existing facilities. All or a portion of the funds provided under development agreements are reimbursed to us, whilefacility. The funding under placement fee agreements is not reimbursed. In return for the fees under these agreements, each facility dedicates a percentage of its floor space, or an agreed upon unit count, for the placement of our EGMselectronic gaming machines (“EGMs”) over the term of the agreement, generally from 12 to 83 months, and we receive a fixed percentage or flat fee of those machines’ hold per day. Certain of the agreements contain EGM performance standards that could allow the respective facility to reduce a portion of our guaranteed floor space.In addition, certain development agreements allow the facilities to buy out floor space after advances that are subject to repayment have been repaid. The development agreements typically provide for a portion of the amounts retained by each facility for its share of the operating profits of the facility to be used to repay some or all of the advances recorded as notes receivable which are included as part of other receivables current and non-current in the Consolidated Balance Sheets. isare first applied against the intangible asset for that particular development or placement fee agreement, if any, and the remaining net book value of the intangible asset is prospectively amortized on a straight-line method over the remaining estimated useful life.During the year ended December 31, 2015,paid approximately $2.8 million toentered into a placement fee agreement with a customer for certain of its locations for approximately $49.1 million, net of $10.1 million of unamortized fees related to superseded contracts. We paid approximately $22.7 million and $13.3 million in Oklahomaplacement fees to extendthis customer for the placementyears ended December 31, 2018 and 2017, respectively. The payments made in 2018 included approximately $2.1 million of nearly 300 units for an additional term of up to 60 months.67,139 48,962 73 3,387 8,565 10,889 10,836 8,016 4,662 4,414 1,654 3,195 8,583 25,805 101,512 104,668 91 At December 31, 2018 2017 Accounts payable and accrued expenses Trade accounts payable $ 70,796 $ 59,435 16,746 22,328 Payroll and related expenses 15,055 14,178 Deferred and unearned revenues 12,887 10,450 Other 6,303 11,303 Cash access processing and related expenses 4,160 8,932 Accrued taxes 1,917 2,112 Accrued interest 1,374 5,766 Total accounts payable and accrued expenses $ 129,238 $ 134,504 (1) The total outstanding balance of the placement fee liability was approximately $16.7 million and $39.1 million as of December 31, 2018 and 2017, respectively. The placement fee liability was considered current portion due to the remaining obligation being due within twelve months of December 31, 2018. The remaining non-current placement fees of approximately $16.8 million as of December 31, 2017 were included in other accrued expenses and liabilities in our Balance Sheets. 490,000 500,000 335,000 350,000 350,000 350,000 1,175,000 1,200,000 (11,421) (11,213) 1,163,579 1,188,787 (10,000) (10,000) 1,153,579 1,178,787 In connection with the Merger, we refinanced all of our indebtedness outstanding under the Prior Credit Facilities with proceeds from the Credit Facilities and the Notes.Credit FacilitiesIn December 2014, At December 31, 2018 2017 Long-term debt Senior secured term loan $ 807,700 $ 815,900 Senior unsecured notes 375,000 375,000 Total debt 1,182,700 1,190,900 Debt issuance costs and discount (19,484 ) (23,057 ) Total debt after debt issuance costs and discount 1,163,216 1,167,843 Current portion of long-term debt (8,200 ) (8,200 ) Long-term debt, less current portion $ 1,155,016 $ 1,159,643 amongwith the lenders party thereto and Jefferies Finance LLC, as administrative agent, collateral agent, swing line lender, letter of credit issuer, sole lead arranger and sole book manager (amended as described below, the “New Credit Agreement”). The New Credit Agreement provides for: (i) a $35.0 million, five-year senior secured revolving credit facility (the “New Revolving Credit Facility”); and (ii) an $820.0 million, seven-year senior secured term loan facility (the “New Term Loan Facility,” and together with the New Revolving Credit Facility, the “New Credit Facilities”). The fees associated with the New Credit Facilities included discounts of approximately $4.1 million and debt issuance costs of approximately $15.5 million. All borrowings under the New Revolving Credit Facility are subject to the satisfaction of customary conditions, including the absence of defaults and the accuracy of representations and warranties.Payments, Holdings,Payments’ existing credit facility with an outstanding balance of approximately $462.3 million with Bank of America, N.A., as administrative agent, collateral agent, swing line lender and letter of credit issuer;issuer, Deutsche Bank Securities Inc., as syndication agent;agent, and Merrill Lynch, Pierce, Fenner & Smith Incorporated and Deutsche Bank Securities Inc., as joint lead arrangers and joint book managers (the “Prior Credit Facility”); and (b) Everi Payments’ 7.25% Senior Secured Notes due 2021 in the aggregate original principal amount of $335.0 million (the “Refinanced Secured Notes”); and (ii) pay related transaction fees and expenses.governsamong other things, reduced the Credit Facilities (the “Credit Agreement”). The Credit Facilities consistinterest rate on the approximately $818.0 million then-outstanding balance of the $500.0 millionNew Term Loan that matures in 2020 andFacility; however, it did not change the $50.0 millionmaturity dates for the New Term Loan Facility or the New Revolving Credit Facility that maturesor the financial covenants or other debt repayments terms set forth in 2019. Thethe New Credit Agreement. We incurred approximately $3.0 million of debt issuance costs and fees associated with the repricing of the New Term Loan Facility.Facilities included discountsAgreement, which reduced the interest rate on the $813.9 million outstanding balance of the senior secured term loan under the Credit Agreement by 50 basis points to LIBOR + 3.00% from LIBOR + 3.50% with the LIBOR floor unchanged at 1.00%. The senior secured term loan under the Credit Agreement will be subject to a prepayment premium of 1.00% of the principal amount repaid for any voluntary prepayment or mandatory prepayment with proceeds of debt that has a lower effective yield than the repriced term loan or any amendment to the repriced term loan that reduces the interest rate thereon, in each case, to the extent occurring within six months of the effective date of the Second Amendment. The maturity date for the Credit Agreement remains May 9, 2024, and no changes were made to the financial covenants or other debt repayment terms. We incurred approximately $7.5$1.3 million andof debt issuance costs and fees associated with the repricing of approximately $13.9 million. All borrowings under the New Term Loan Facility. are subject to the satisfaction of customary conditions, including the absence of a default and compliance with representations and warranties.We are required to repay thein an amount equal to 0.50% per quarterFacility matures seven years after the Closing Date and the New Revolving Credit Facility matures five years after the Closing Date. The New Revolving Credit Facility is available for general corporate purposes, including permitted acquisitions, working capital and the issuance of the initial aggregate principal with the final principal repayment installment on the maturity date. Interest is due in arrears each March, June, September and December and at the maturity date; however, interest may be remitted within one to three monthsletters of such dates.The Term Loan had an applicable interest rate of 6.25% as of December 31, 2015 and December 31, 2014.ourEveri Payments’ option, the base rate or LIBORthe Eurodollar Rate (defined to be the London Interbank Offered Rate or a comparable or successor rate) (the “Eurodollar Rate”) plus, in each case, an applicable margin. The interest rate per annum applicable to the New Term Loan Facility also is, also, at ourEveri Payments’ option, the base rate or LIBORthe Eurodollar Rate plus, in each case, an applicable margin. LIBOR will beThe Eurodollar Rate is reset at the beginning of each selected interest period based on the LIBOR rateEurodollar Rate then in effect; provided that, with respect toif the Revolving Credit Facility, if LIBOREurodollar Rate is below zero, then such rate will be equal to zero plus the applicable margin, and, with respect to the Term Loan, if LIBOR is below 1.0%, then such rate will be equal to 1.0% plus the applicable margin. The base rate is a fluctuating interest rate equal to the highest of (a)of: (i) the prime lending rate announced by the administrative agent, (b)agent; (ii) the federal funds effective rate from time to time plus 0.50%,; and (c) LIBOR(iii) the Eurodollar Rate (after taking account of any applicable floor) applicable for an interest period of one month plus 1.00%. ThePrior to the effectiveness of the First Amendment on the Repricing Closing Date, the applicable margins of 4.75% and 5.25% for both the New Revolving Credit Facility and the New Term Loan respectively, are subject to adjustment basedFacility were: (i) 4.50% in respect of Eurodollar Rate loans and (ii) 3.50% in respect of base rate loans. The applicable margins for the New Term Loan Facility from and after the effectiveness of the First Amendment on our consolidated secured leverage ratio.Term Loanterm loan and the Revolving Credit Facilityrevolving loans and voluntary reductions in the unused commitments are permitted in whole, or in part, in minimum amounts as set forth in the New Credit Agreement governing the New Credit Facilities, with prior notice, buthowever, without premium or penalty.aftersubsequently acquired assets of each of Everi Payments, Holdings and the subsidiary guarantors (the “Collateral”)party thereto including: (a)(i) a 92(b)(ii) a perfected first priority security interest in substantially all other tangible and intangible assets of Holdings, Everi Payments, and such subsidiary guarantors (including, but not limited to, accounts receivable, inventory, equipment, general intangibles, investment property, real property, intellectual property and the proceeds of the foregoing). Subject to certain exceptions, the New Credit Facilities are unconditionally guaranteed by Holdings and such subsidiary guarantors and Everi Games and its material domestic subsidiaries.indebtedness;indebtedness, sell assets or consolidate or merge with or into other companies;companies, pay dividends or repurchase or redeem capital stock;stock, make certain investments;investments, issue capital stock of subsidiaries;subsidiaries, incur liens;liens, prepay, redeem or repurchase subordinated debt;debt, and enter into certain types of transactions with ourits affiliates. The New Credit Agreement governing the New Credit Facilities also requires Holdings, together with its subsidiaries, to comply with a consolidated secured leverage ratio. At December 31, 2018, our consolidated secured leverage ratio was 3.28 to 1.00, with a maximum allowable ratio of 4.75 to 1.00. Our maximum consolidated secured leverage will be reduced to 4.50 to 1.00 as wellof December 31, 2019, 4.25 to 1.00 as an annual excess cash flow payment requirement.debt (which includes the Refinanced Secured Notes and the Unsecured Notes).debt. In addition, an event of default will occur if Holdings undergoes a change of control. This is defined to include the case where Holdings ceases to own 100% of the equity interests of Everi Payments, or where any person or group acquires a percentage of the economic or voting interests of Holdings’ capital stock of 35% or more (determined on a fully diluted basis), or where a majority.board of directors of Everi Payments ceases to consist of persons who are directors of Holdingsinitial aggregate principal, with the final principal repayment installment on the closingmaturity date. Interest is due in arrears on each interest payment date applicable thereto and at such other times as may be specified in the New Credit Agreement. As to any loan other than a base rate loan, the interest payment dates shall be the last day of each interest period applicable to such loan and the Credit Facilities or other directors whose nominationmaturity date (provided, however, that if any interest period for electiona Eurodollar Rate loan exceeds three months, the respective dates that fall every three months after the beginning of such interest period shall also be interest payment dates). As to any base rate loan, the boardinterest payment dates shall be last business day of directorseach March, June, September and December and the maturity date. Holdings was recommended by a majority of the then continuing directors.2015,2018, we had approximately $490.0$807.7 million of borrowings outstanding under the New Term Loan Facility and $50.0no borrowings outstanding under the New Revolving Credit Facility. We had $35.0 million of additional borrowing availability under the New Revolving Credit Facility based upon borrowing base calculations as of such date. We were in compliance with the terms of the Credit Facilities as of December 31, 2015.We expect that our cash provided by operating activities will be sufficient for our operating and debt servicing needs during the next 12 months. If not, we have sufficient borrowings available under our Credit Facilities to meet additional funding requirements. We monitor the financial strength of our lenders on an ongoing basis using publicly-available information. Based upon that information, we believe there is not a likelihood that any of our lenders might not be able to honor their commitments under the Credit Agreement. and Refinance of SeniorIn December 2014, we issued $350.0 million in the aggregate principal amount of 7.75% Secured Notes due 2021. The fees associated with$335.0 million plus accrued and unpaid interest. As a result of the Secured Notes included debt issuance costsredemption, the Company recorded non-cash charges in the amount of approximately $13.6 million. The Secured Notes$1.7 million, which consisted of unamortized deferred financing fees of $0.2 million and discounts of $1.5 million, which were acquired by the initial purchasers pursuant to the terms of a purchase agreement. Under the terms of the purchase agreement, during a one year period following the closing and upon prior notice from the initial purchasers, the Company was required to use commercially reasonable efforts to aid the purchasersincluded in the resale of the Secured Notes, including by preparing an updated offering memorandum and participating in reasonable marketing efforts including road shows, to the extent required therein. Alternatively, we had the ability to redeem the Secured Notes from the initial purchasers without penalty. On April 15, 2015, the Company entered into the Note Purchase Agreement, among Everi Payments, the Purchaser, and the Collateral Agent, and issued $335.0total $14.6 million in aggregate principal amount of the 7.25% Refinanced Secured Notes due 2021 to the Purchaser in a private offering. With the proceeds from the issuance of the Refinanced Secured Notes, we redeemed, in full, the Company’s then outstanding Secured Notes from the initial purchasers in accordance with the terms of the indenture governing the Secured Notes. In connection with the issuance of the Refinanced Secured Notes during the second quarter of 2015, we expensed $13.0 million of related debt issuance costs and fees to “Loss on extinguishment of debt” associated with the redeemed Senior Secured Notes that were outstanding prior to the refinance transaction.In connection with the issuance of the Refinanced Secured Notes and pursuant to the terms of the Note Purchase Agreement, the Company issued the Warrant to the Purchaser. The Warrant expires on the sixth anniversary of the date of 93issuance. The number of shares issuable pursuant to the Warrant and the warrant exercise price are subject to adjustment for stock splits, reverse stock splits, stock dividends, mergers and certain other events. The Warrant was valued at $2.2 million using a modified Black-Scholes model and was accounted for as a debt discount.Interest is due quarterly in arrears each January, April, July and October.We were in compliance with the terms of the Refinanced Secured Notes as of December 31, 2015.2022.2022 (the “2014 Unsecured Notes”) under an indenture (as supplemented, the “2014 Notes Indenture”), dated December 19, 2014, between Everi Payments (as successor issuer), and Deutsche Bank Trust Company Americas, as trustee. The fees associated with the 2014 Unsecured Notes included original issue discounts of approximately $3.8 million and debt issuance costs of approximately $14.0 million.duepayable semi-annually in arrears on each JanuaryJune 15 and July.were acquired bywill mature on December 15, 2025. We incurred approximately $6.1 million of debt issuance costs and fees associated with the initial purchasers pursuantrefinancing of our 2017 Unsecured Notes.terms2014 Unsecured Notes. To effect the satisfaction and discharge, Everi Payments issued an unconditional notice of a purchase agreement. Underredemption to Deutsche Bank Trust Company Americas, as trustee, of the redemption in full on January 15, 2018 (the “Redemption Date”) of all outstanding 2014 Unsecured Notes under the terms of the purchase agreement, during a one-year period following2014 Notes Indenture. In addition, using the closing and upon prior noticeproceeds from the initial purchasers, the Company was required to use commercially reasonable efforts to aid the purchasers in the resalesale of the 2017 Unsecured Notes and cash on hand, Everi Payments irrevocably deposited with the trustee funds sufficient to pay the redemption price of the 2014 Unsecured Notes of 107.5% of the principal amount thereof, plus accrued and unpaid interest to, but not including, by preparingthe Redemption Date (the “Redemption Price”), and irrevocably instructed the trustee to apply the deposited money toward payment of the Redemption Price for the 2014 Unsecured Notes on the Redemption Date. Upon the trustee’s receipt of such funds and instructions, along with an updated offering memorandumofficer’s certificate of Everi Payments and participating in reasonable marketing efforts including road shows,an opinion of counsel certifying and opining that all conditions under the 2014 Notes Indenture to the extent required therein.satisfaction and discharge of the 2014 Notes Indenture had been satisfied, the 2014 Notes Indenture was satisfied and discharged, and all of the obligations of Everi Payments and the guarantors under the 2014 Notes Indenture ceased to be of further effect, as of December 5, 2017 (subject to certain exceptions). The 2014 Unsecured Notes were resold bythereafter redeemed on the initial purchasers to third parties in the second quarter of 2015.Company entered intoredemption of the 2014 Unsecured Notes, we incurred a registration rights agreement pursuant$37.2 million loss on extinguishment of debt consisting of a $26.3 million make-whole premium related to which the Company agreed,satisfaction and redemption of the 2014 Unsecured Notes and approximately $10.9 million for the benefitwrite-off of the initial holders of the Unsecured Notes, to file with the SEC,related unamortized debt issuance costs and use its commercially reasonable efforts to cause to become effective, a registration statement relating to an offer to exchange the Unsecured Notes for an issue of SEC-registered notes with terms identical to the Unsecured Notes. On October 23, 2015, we filed a registration statement on Form S-4 with the SEC in accordance with the registration rights agreement outlining our offer to exchange the Unsecured Notes for identical notes without transfer restrictions. The registration statement was declared effective on November 3, 2015, and the exchange offer for the Unsecured Notes was completed on December 4, 2015 with 100% percent participation.2015.20152018 are as follows (in thousands):10,000 10,000 10,000 10,000 450,000 685,000 1,175,000 94 Amount Maturities of borrowings 2019 $ 8,200 2020 8,200 2021 8,200 2022 8,200 2023 8,200 Thereafter 1,141,700 Total $ 1,182,700 non‑cancelablenon-cancelable agreements. Total rent expense was approximately $5.5$7.8 million, $1.9$6.8 million, and $1.8$6.8 million for the years ended December 31, 2015, 20142018, 2017, and 2013,2016, respectively.In October 2012, we entered intowhich we occupiedthat expires in the first half of 2013.MarchJune 2021.2015,2018, the minimum aggregate rental commitment under all non‑cancelable operating leases were as follows (in thousands):4,410 4,171 4,064 4,064 3,925 5,900 26,534 Amount Minimum aggregate rental commitments 2019 $ 5,570 2020 5,680 2021 4,598 2022 2,799 2023 1,074 Thereafter — Total $ 19,721 Everi Games Holding Shareholder LitigationPutative shareholders of Everi Games Holding filed suits in the United States District Court for the Western District of Texas (the “Texas Federal Action”) and the District Court of Travis County, Texas (the “Texas State Court Action”) alleging that the directors of Everi Games Holding breached their fiduciary duties in connection with the Merger. The complaints further alleged that Everi Holdings and its formerly wholly-owned merger subsidiary, Merger Sub, aided and abetted those purported breaches of fiduciary duty.The parties agreed to settle all claims asserted in the Texas Federal Action. Everi Games Holding agreed to make certain additional disclosures in its proxy statement related to the Merger, and made those disclosures in a Current Report on Form 8-K filed on November 21, 2014. In addition, the defendants agreed not to oppose plaintiffs’ application for an attorneys’ fee award of up to $310,000. The court in the Texas Federal Action approved the settlement, awarded attorneys’ fees of $310,000, and entered judgment. The deadline to file any appeal from the judgment has expired and no appeal has been filed.The judgment in the Texas Federal Action includes a release of the claims asserted in the Texas State Court Action. The Texas State Court Action has been dismissed with prejudice.Alabama LitigationThe Company is currently involved in one lawsuit related to Everi Games Holding’s former charity bingo operations in the State of Alabama, which we believe is not material from a damages perspective. The lawsuit is currently pending in federal court and includes claims related to the alleged illegality of electronic charity bingo in the State of Alabama.Ozetta Hardy v. Whitehall Gaming Center, LLC, et al., a civil action, was filed against Whitehall Gaming Center, LLC (an entity that does not exist), Cornerstone Community Outreach, Inc., and Freedom Trail Ventures, Ltd., in the Circuit Court of Lowndes County, Alabama. On June 3, 2010, Everi Games Holding and other manufacturers were added as 95defendants. The plaintiffs, who claim to have been patrons of White Hall, allege that Everi Games participated in gambling operations that violated Alabama state law by supplying to White Hall purportedly unlawful electronic bingo machines played by the plaintiffs, and the plaintiffs seek recovery of the monies lost on all electronic bingo games played by the plaintiffs in the six months prior to the filing of the complaint under Ala. Code, Sec 8-1-150(A). The plaintiffs requested that the court certify the action as a class action. On July 2, 2010, the defendants removed the case to the United States District Court for the Middle District of Alabama, Northern Division. The court has not ruled on the plaintiffs' motion for class certification. The Company continues to vigorously defend this matter. Given the inherent uncertainties in this litigation, however, the Company is unable to make any prediction as to the ultimate outcome.also subject to other claims and suits that arise from time to time in the ordinary course of business. We do not believe the liabilities, if any, which may ultimately result from the outcome of such matters, individually or in the aggregate, will have a material adverse impact on our financial position, liquidity, or results of operations.20152018 and 2014,2017, we had no shares of preferred stock outstanding.20152018 and 2014,2017, we had 90,877,27395,099,532 and 90,405,45093,119,988 shares of common stock issued, respectively.Common Stock Repurchase Program. There were no share repurchases for the year ended December 31, 2015. Our most recent share repurchase program commenced in the first quarter of 2013 and expired at the end of the fourth quarter of 2014, wherein we repurchased approximately 1.5 million shares of common stock for cash of approximately $11.7 million under the share repurchase program for the year ended December 31, 2014.32,61717,552 and 55,50215,457 shares of common stock at an aggregate purchase price of $0.2 million and $0.5$0.1 million for the years ended December 31, 20152018 and 2014, respectively,2017 to satisfy the minimum applicable tax withholding obligations related to the vesting of such restricted stock awards.65,854 65,780 66,014 1,083 1,191 65,854 66,863 67,205 At December 31, 2018 2017 2016 Weighted average shares Weighted average number of common shares outstanding - basic 69,464 66,816 66,050 4,332 — — 73,796 66,816 66,050 (1) The Company was in a net loss position for the year ended December 31, 2015, and therefore, potential dilution from the application of the treasury stock method was not applicable. The potential dilution excludes the weighted average effect of equity awards to acquire 7.6 million and 5.9purchase approximately 7.5 million shares of our common stock atfor the year ended December 31, 2014 and 2013, respectively,2018, as the application of the treasury stock method, as required, makes them anti‑dilutive.(the “2014(as amended and restated effective May 23, 2017, the “Amended and Restated 2014 Plan”) isand our 2012 Equity Incentive Plan (as amended, the “2012 Plan”) are used to attract and retain the best available personnel, to provide additional incentives to employees, directors and consultants and to promote the success of our business. The 2014 Plan superseded the then current 2005 Stock Incentive Plan (the “2005 Plan”). The 2014 Plan isOur equity incentive plans are administered by the Compensation Committee of our Board of Directors, which has the authority to select individuals who are to receive options or other equity incentive awards and to specify the terms and conditions of grants of options or other equity incentivesuch awards, including, but not limited to the vesting provisions the term and the exercise price.options,options; (b) cliff-vestingmarket-based options; (c) time-based options, (c) market-based options,restricted stock; and (d) restricted stock. Thesestock units (“RSUs”) with either time- or performance-based criteria. Restricted Stock Awards Granted Restricted Stock Units Granted Outstanding, December 31, 2017 19,131 74 — Granted 20 — 1,877 Exercised options or vested shares (1,980 ) (66 ) — Cancelled or forfeited (1,497 ) — (80 ) Outstanding, December 31, 2018 15,674 8 1,797 have varying vesting provisionsof our common stock available for future equity grants, both under the Amended and expiration periods. ForRestated 2014 Plan and the year ended2012 Plan as of December 31, 2015, we granted time-based options and market-based options. yearly anniversaries of the option grant dates.date, provided that as of the vesting date for each vesting tranche, the closing price of the Company’s shares on the New York Stock Exchange is at least a specified price hurdle, defined as a 25% and 50% premium for 2017 and 2016, respectively, to the closing stock price on the grant date. If the price hurdle is not met as of the vesting date for a vesting tranche, then the vested tranche shall vest and become vested shares on the last day of a period of 30 consecutive trading days during which the closing price is at least the price hurdle. These options expire after a ten-year period.Ourstock optionsoption awards granted underduring the 2014 Plan vest if our average stock price in any period of 30 consecutive trading days meets certain target prices during a four-year period that commenced on the date of grant for these options. If these target prices are not met during such four-year period, the unvested shares underlying the options will terminate; however, upon the Participant’s termination of Service, if the Participant’s Service is terminated by the Company without Cause within ten days prior to, or within 18 months after, the date a Change in Control is consummated, the unvested options granted would become fully vested. These options expire after a seven-year period.A summary of award activity is as follows (in thousands):13,626 440 6,512 (343) (128) (2,355) (2) 17,440 310 97maximum number of shares available for future equity awards under the 2014 Plan is approximately 6.6 million sharesfair values of our common stock. There are no shares available for future equity awards under the 2005 Plan.Stock OptionsThe fair value ofstandard time-based options waswere determined as of the date of grant using the Black‑ScholesBlack-Scholes option pricing model with the following weighted‑average assumptions:1 1 1 4 4 4 43 54 61 0 0 0 Year Ended December 31, 2018 2017 2016 Risk-free interest rate 3 % 2 % 1 % Expected life of options (in years) 6 6 5 Expected volatility 53 % 54 % 51 % Expected dividend yield — — — valuevalues of our cliff vesting time-basedmarket-based options granted in the second quarter of 2014 waswere determined using the Black Scholes option pricing model as of the date of grant. For the five year cliff vesting time-based options, the assumptions were: (a) risk-free interest rate of 2%; (b) expected term of five years; (c) expected volatility of 52%; and (d) no expected dividend yield. For the six year cliff vesting time-based options, the assumptions were: (a) risk-free interest rate of 2%; (b) expected term of six years; (c) expected volatility of 58%; and (d) no expected dividend yield.The fair value of our market-based options was determinedgrant using a lattice-based option valuation model as ofwith the date of grant. For the market-based options issued during 2015, the assumptions were: (a) risk-free interest rate of 1%; (b) measurement period of four years; (c) expected volatility of 47%; and (d) no expected dividend yield. For the market-based options issued in the second quarter 2014, the assumptions were: (a) risk-free interest rate of 1%; (b) measurement period of four years; (c) expected volatility of 52%; and (d) no expected dividend yield. For the market-based options issued in the first quarter 2014, the assumptions were: (a) risk-free interest rate of 1%; (b) measurement period of four years; (c) expected volatility of 51%; and (d) no expected dividend yield.The fair value of the converted options related to the Merger was recalculated upon consummation of the acquisition and it was determined that the original fair value approximated the value upon conversion and was still applicable and will continue to amortize to stock compensation expense over the remaining life of the award. Year Ended December 31, 2017 2016 Risk-free interest rate 3 % 2 % Measurement period (in years) 10 10 Expected volatility 70 % 68 % Expected dividend yield — — tables presenttable presents the options activity:13,626 7.64 6.5 9,148 6,512 7.68 (343) 5.35 (2,355) 9.82 17,440 7.41 6.6 1,212 14,503 7.35 6.4 1,212 6,908 7.13 4.4 1,212 Outstanding, December 31, 2017 19,131 $ 5.34 6.4 $ 45,887 Granted 20 7.88 Exercised (1,980 ) 4.84 Canceled or forfeited (1,497 ) 5.51 Outstanding, December 31, 2018 15,674 $ 5.39 6.0 $ 17,733 Vested and expected to vest, December 31, 2018 14,947 $ 5.44 5.9 $ 16,559 Exercisable, December 31, 2018 9,728 $ 6.15 5.3 $ 7,284 98 Options Outstanding Options Exercisable Range of Exercise Prices (in thousands) Life (Years) Prices (in thousands) Price $ 1.46 $ 2.40 2,630 7.3 $ 1.54 1,110 $ 1.55 2.70 2.78 565 7.1 2.77 515 2.77 3.29 3.29 3,326 8.2 3.29 741 3.29 3.41 7.05 2,611 4.1 5.81 2,545 5.79 7.09 7.61 929 5.5 7.34 810 7.32 7.74 9.74 5,613 4.9 8.19 4,007 8.36 15,674 9,728 5.99 2,195 5.4 4.43 2,104 4.40 6.00 8.99 13,973 7.2 7.54 3,535 7.33 9.00 12.99 1,007 1.9 9.99 1,004 9.99 13.00 13.99 5 0.6 13.79 5 13.79 14.00 14.99 60 1.4 14.58 60 14.58 15.00 15.99 100 0.7 15.08 100 15.08 16.00 18.99 100 0.8 16.05 100 16.05 17,440 6,908 6.5 million, 6.620,000, 4.3 million, and 1.24.4 million options granted for the years ended December 31, 2015, 20142018, 2017, and 2013,2016, respectively. The weighted average grant date fair value per share of the options granted was $2.48, $3.20$4.15, $1.98, and $3.31$0.83 for the years ended December 31, 2015, 20142018, 2017, and 2013,2016, respectively. The total intrinsic value of options exercised was $0.8 million, $2.8$6.5 million and $4.6$5.3 million for the years ended December 31, 2015, 20142018 and 2013, respectively.$18.1approximately $3.4 million in unrecognized compensation expense related to options expected to vest as of December 31, 2015.2018. This cost was expected to be recognized on a straight‑line basis over a weighted average period of 2.62.8 years. We received $1.8 million in proceeds from the exercise of options and recorded $7.4 million in non‑cash compensation expense related to options granted that were expected to vest for the year ended and as of December 31, 2015.We recorded $7.6 million and $4.4approximately $5.1 million in non‑cash compensation expense related to options granted that were expected to vest as of December 31, 2014 and 2013, respectively.2018. We received $5.3 million and $8.4approximately $9.6 million in cash proceeds from the exercise of options during 2018.20142017 and 2013,2016, respectively.440 7.11 (128) 7.11 (2) 7.09 310 7.11 Outstanding, December 31, 2017 74 $ 7.00 Granted — — Vested (66 ) 7.04 Forfeited — — Outstanding, December 31, 2018 8 $ 6.66 2015 but 0.3 million and 0.4 million shares of restricted stock were granted for the years ended December 31, 2014, and 2013, respectively. The weighted average grant date fair value per share of restricted stock granted was $7.12 and $7.09 for the years ended December 31, 2014 and 2013.2018. The total fair value of restricted stock vested was $0.6approximately $0.5 million $1.4for the year ended December 31, 2018. There was $31,952 in unrecognized compensation expense related to shares of restricted stock expected to vest as of December 31, 2018, which was expected to be recognized on a straight‑line basis over a weighted average period of 0.3 years. There were 65,501 shares of restricted stock that vested during 2018, and we recorded approximately $0.4 million in non-cash compensation expense related to the restricted stock granted that was expected to vest during 2018.$0.7approximately $0.2 million for the years ended December 31, 2015, 20142017 and 20132016, respectively.$2.0approximately $0.5 million and approximately $1.0 million in unrecognized compensation expense related to shares of time‑based restricted sharesawards expected to vest as of December 31, 20152017 and 2016, respectively, and is expected to be recognized on a straight‑line basis over a weighted average period of 2.4 years.1.1 years and 1.7 years, respectively. There were 0.2 million shares, 0.2 million56,578 shares and 0.1 million74,919 shares of restricted stock that vested during 2017 and 2016, respectively, and we recorded $0.9 million, $1.2approximately $0.4 million and $0.7approximately $0.5 million in non‑cash compensation expense related to the restricted stock granted that was expected to vest during 2015,2017 and 2016, respectively. Outstanding, December 31, 2017 — $ — Granted 1,877 7.49 Exercised — — Canceled or forfeited (80 ) 7.46 Outstanding, December 31, 2018 1,797 $ 7.49 2.0 $ 9,254 Vested and expected to vest, December 31, 2018 1,219 $ 7.49 1.8 $ 6,278 2013, respectively.no RSUs granted for the years ended December 31, 2017 and 2016. There were zero RSUs that vested during the years ended December 31, 2018, 2017 and 2016.99(loss) incomeloss before tax for domestic and foreign operations (in thousands):(129,602) 13,870 35,473 6,519 6,431 3,412 (123,083) 20,301 38,885 Year Ended December 31, 2018 2017 2016 Consolidated income (loss) before tax Domestic $ 1,227 $ (73,445 ) $ (225,538 ) Foreign 1,419 1,378 7,755 Total $ 2,646 $ (72,067 ) $ (217,783 ) (loss) incomeloss from operations before tax consists of the following components (in thousands):(19,746) 6,637 13,626 1,635 1,524 861 (18,111) 8,161 14,487 1,767 1,598 844 (19,878) 6,563 13,643 (18,111) 8,161 14,487 Year Ended December 31, 2018 2017 2016 Income tax (benefit) provision Domestic $ (10,166 ) $ (20,507 ) $ 30,400 Foreign 456 343 1,296 Total income tax (benefit) provision $ (9,710 ) $ (20,164 ) $ 31,696 Income tax (benefit) provision Current $ 633 $ 461 $ 1,756 Deferred (10,343 ) (20,625 ) 29,940 Total income tax (benefit) provision $ (9,710 ) $ (20,164 ) $ 31,696 35.0 35.0 35.0 0.6 (3.6) (1.0) 1.1 0.9 1.3 (1.1) 0.7 1.1 0.0 5.9 0.0 0.6 1.9 0.3 0.6 0.0 0.0 (21.3) 0.0 0.0 (0.8) (0.6) 0.6 14.7 40.2 37.3 100 Year Ended December 31, 2018 2017 2016 Income tax reconciliation Federal statutory rate 21.0 % 35.0 % 35.0 % Foreign provision 6.8 % 0.3 % 0.5 % State/province income tax 12.4 % 2.4 % 0.8 % Non-deductible compensation cost (7.7 )% (2.0 )% (0.5 )% 6.2 % 31.2 % 0.2 % Research credit (76.3 )% 1.9 % 0.2 % Valuation allowance (344.9 )% (39.6 )% (27.4 )% Goodwill impairment — % — % (23.5 )% Global intangible low-taxed income 9.1 % — % — % Non-deductible expenses - other 7.2 % (0.5 )% (0.1 )% Other (0.8 )% (0.7 )% 0.2 % Effective tax rate (367.0 )% 28.0 % (14.6 )% (1) The adjustment to carrying value in 2017 is due primarily to the federal tax rate change in the Tax Cuts and Jobs Act of 2017 (“2017 Tax Act”). 44,845 81,531 64,357 37,333 10,212 8,841 7,066 1,444 1,613 1,703 3,958 7,917 1,331 300 290 348 658 373 406 5,896 5,146 333 (1,442) (2,319) (1,379) 102,557 86,218 91,986 18,274 23,785 108,727 109,103 3,200 1,072 942 130,201 133,960 942 (27,644) (47,742) 91,044 Year Ended December 31, 2018 2017 2016 Deferred income tax assets related to: Net operating losses $ 97,190 $ 87,250 $ 98,664 Stock compensation expense 7,264 6,601 11,559 Accounts receivable allowances 1,582 1,117 1,745 Accrued and prepaid expenses 3,639 3,953 6,276 Long-term debt — — 493 Other 1,319 479 1,399 Tax credits 9,244 6,822 6,394 Interest Limitation 2,738 — — Valuation allowance (53,156 ) (63,303 ) (61,012 ) Total deferred income tax assets $ 69,820 $ 42,919 $ 65,518 Deferred income tax liabilities related to: Property, equipment and leased assets $ 3,855 $ 3,129 $ 13,216 Intangibles 89,865 73,597 106,307 Long-term debt 3,614 3,292 — Other 353 1,108 3,606 Total deferred income tax liabilities $ 97,687 $ 81,126 $ 123,129 Deferred income taxes, net $ (27,867 ) $ (38,207 ) $ (57,611 ) Company prospectively adopted2017 Tax Act was enacted on December 22, 2017. The 2017 Tax Act made significant changes to the provisionsfederal tax law, including a reduction in the federal income tax rate from 35% to 21% effective January 1, 2018, stricter limits on deduction of ASU No. 2015-17 asinterest, an 80% taxable income limitation on the use of December 31, 2015. The adoptionpost-2017 net operating loss (“NOL”), and a one-time transition tax on previously deferred earnings of certain foreign subsidiaries. As a result of our initial analysis of the provision caused us to reclassify current2017 Tax Act and existing implementation guidance, we remeasured our deferred tax assets and liabilities, which resulted in a $22.5 million reduction in our income tax expense in 2017. We computed our transition tax liability of $1.3 million due to noncurrent (netted within noncurrent liabilities)the 2017 Tax Act, net of associated foreign tax credits, which was completely offset by additional foreign tax credits carried forward. Any remaining foreign tax credits not utilized by the transition tax were fully offset by a valuation allowance.Consolidated Balance Sheets. The prior reporting period was not retrospectively adjusted.The following is a tabular reconciliationvaluation allowance including the stricter limits on interest deductions, the GILTI provisions of the total amounts of unrecognized tax benefits (in thousands):729 729 729 729 For all2017 Tax Act, and the remeasurement of our investments in foreign subsidiaries, except for GCA (Macau), deferred taxes have not been provided on unrepatriated foreign earnings. tax assets and liabilities. During 2018, we recognized insignificant adjustments to the provisional amounts recorded at December 31, 2017 and included these adjustments as a component of income tax expense from continuing operations.$17.1$19.7 million as of December 31, 2015. These2018. Almost all of these earnings wereare considered permanently reinvested, as it wasis management’s intention to reinvest foreign earnings in foreign operations. We project sufficient cash flow, or sufficient borrowings available under our New Credit Facilities in the U.S. and; therefore, we do not need to repatriate theseour foreign earnings to finance U.S. operations at this time.As Due to the 2017 Tax Act, there is no U.S. federal tax on cash repatriation from foreign subsidiaries, however, it could be subject to foreign withholding tax and U.S. state income taxes.resultU.S. corporation to current tax on the GILTI earned by certain foreign subsidiaries and a base erosion anti-avoidance tax (“BEAT”). Our foreign subsidiaries’ earnings for the year-ended December 31, 2018 have been subject to U.S. federal income tax via the newly enacted GILTI provision. We have elected to recognize the taxes on GILTI and BEAT as a period expense in the period the taxes are incurred.certain realization requirements underour deferred tax assets to amounts that are estimated on a more likely than not basis to be realized. This assessment requires judgment and is performed on the basis of the weight of all available evidence, both positive and negative, with greater weight placed on information that is objectively verifiable such as historical performance.share based payments,our current year activity and the tablechanges in the 2017 Tax Act, we decreased our valuation allowance for deferred tax assets by $10.1 million during 2018. The decrease in our valuation allowance is primarily due to the net operating loss during the year and the interest deduction limitation (deferred tax assets) which can be offset against our indefinite lived deferred tax liabilities. The ultimate realization of deferred tax assets and liabilities shown above does not include certaindepends on having sufficient taxable income in the future years when the tax deductions associated with the deferred tax assets that arose directlybecome deductible. The establishment of a valuation allowance does not impact cash, nor does it preclude us from using our tax deductions related to equity compensation in excess of compensation recognized for financial reporting at December 31, 2015, 2014credits, loss carry-forwards and 2013, respectively. Equity will be increased by $4.6 million if, and when, suchother deferred tax assets are ultimately realized. We usein the accounting guidance on income taxes ordering for purposesfuture.determining when excessthe total amounts of deferred tax benefits have been realized. Year Ended December 31, 2018 2017 2016 Balance at beginning of period $ 63,303 $ 61,012 $ 1,442 Charged to provision for income taxes (9,125 ) (2,263 ) 59,570 (1,022 ) 4,554 — Balance at end of period $ 53,156 $ 63,303 $ 61,012 $218.8$395.2 million, or $76.6$83.0 million, tax effected, of accumulated federal net operating losses as of December 31, 1012015.2018. The net operating losses can be carried forward and applied to offset taxable income for 20 years and will expire starting in 2024.2022 (for losses incurred before 2018). Losses incurred in 2018 of approximately $38.9 million, or $8.2 million, tax effected, can be carried forward indefinitely to offset taxable income. We had $4.3$8.5 million, tax effected, of federal research and development credit carrycarry- forwards and $1.6$0.5 million, tax effected, of federal alternative minimumforeign tax credit carry forwardscarry-forwards as of December 31, 2015.2018. The research and development credits are limited to a 20 year carry forwardyears carry-forward period and will expire starting in 2033.2029. The federalforeign tax credits can be carried forward 10 years and will expire in 2020, if not utilized. Our $0.3 million balance of alternative minimum tax credit carry forwards docredits at December 31, 2018 will be refunded over the next four years in accordance with the 2017 Tax Act. We also have a receivable for $0.6 million related to alternative minimum tax credits for which a refund was requested on our December 31, 2017 federal tax return. As of December 31, 2018, $46.6 million of our valuation allowance relates to federal net operating loss carry-forwards and credits that we estimate are not expire.carry forwardscarry-forwards of approximately $9.4$14.1 million as of December 31, 2015.2018. The state net operating loss carry forwardscarry-forwards will expire between 20162019 and 2036.2039. The determination and utilization of these state net operating loss carry forwardscarry-forwards are dependent upon apportionment percentages and other respective state laws, which can change from year to year. As of December 31, 2015, $1.22018, $6.5 million of our valuation allowance relates to certain state net operating loss carry forwards whichcarry-forwards that we estimate are expectednot more likely than not to expire before utilization, due to shorter carry forward periods and decreased apportionment percentages in those states.be realized. The remaining valuation allowance of $0.2$0.1 million relates to foreign net operating losses.We recognizeddeferred tax asset upon our conversion from a limited liability company to a corporation on May 14, 2004. Prior to that time, all tax attributes flowed through to the memberstabular reconciliation of the limited liability company. The principal componenttotal amounts of the deferredunrecognized tax asset is a difference between our assets for financial accounting and tax purposes. This difference results from a significant balance of acquired goodwill of approximately $687.4 million that was generated as part of the conversion to a corporation plus approximately $97.6 million in pre-existing goodwill carried over from periods prior to the conversion. Both of these assets are recorded for tax purposes but not for accounting purposes. This asset is amortized over 15 years for tax purposes, resulting in annual pretax income being $52.3 million lower for tax purposes than for financial accounting purposes. At an estimated blended domestic statutory tax rate of 37.2%, this results in tax payments being approximately $19.5 million less than the annual provision for income taxes shown on the income statement for financial accounting purposes, or the amount of the annual provision, if less. There is an expected aggregate of $64.9 million in cash savings over the remaining life of the portion of our deferred tax asset related to the conversion. This deferred tax asset may be subject to certain limitations. We believe that it is more likely than not that we will be able to utilize our deferred tax asset. However, the utilization of this tax asset is subject to many factors including, but not limited to, a change of control of the Company and future earnings. Year Ended December 31, 2018 2017 2016 Unrecognized tax benefit Unrecognized tax benefit at the beginning of the period $ 937 $ 834 $ 729 Gross increases - tax positions in prior period 125 103 105 Unrecognized tax benefit at the end of the period $ 1,062 $ 937 $ 834 it iswe are required to file income tax returns, as well as all open tax years in these jurisdictions. As part of the Merger in 2014,December 31, 2018, the Company recorded $0.7$1.1 million of unrecognized tax benefits.benefits, all of which would impact our effective tax rate, if recognized. We do not anticipate that our unrecognized tax benefits will materially change within the next 12 months. The Company has not accrued any penalties and interest for its unrecognized tax benefits. Other than the unrecognized tax benefit related to the Merger,recorded, we believe that our income tax filing positions and deductions will be sustained upon audit, and we do not anticipate any other adjustments that will result in a material change to our financial position. We may, from time to time, be assessed interest or penalties by tax jurisdictions, although any such assessments historically have been minimal and immaterial to our financial results. Our policy for recording interest and penalties associated with audits and unrecognized tax benefits is to record such items as a component of income tax expense.carry forwards.carry-forwards. Accordingly, we are subject to examination for both U.S. federal and some of the state tax returns for the years 2004 to present. For the remaining state, local and foreign jurisdictions, with some exceptions, we are no longer subject to examination by tax authorities for years before 2012.18. RELATED PARTY TRANSACTIONSA member of our Board of Directors served as a member of the board of directors of a gaming company until April 2013 for which we provide various cash access products and services that are insignificant to our net income. This board member received customary both cash and equity compensation from this gaming company in consideration for serving on its board of directors, however, none of this consideration was tied in any manner to our performance or obligations under our cash access agreements with the gaming company. In addition, this board member was not involved in the negotiation of our cash access agreements with this gaming company.In October 2012, we entered into a long-term lease agreement related to office space for our corporate headquarters in which we moved into during the first half of 2013. We had engaged a brokerage firm in connection with the search for our corporate headquarters. An executive officer of this brokerage firm is the brother of our former Chief Financial Officer. This brokerage firm received approximately $0.4 million as compensation for acting as our broker.19.18. SEGMENT INFORMATIONin deciding how to allocate resources and in assessing performance.(the “CODM”). Our chief operating decision-making groupCODM consists of the Chief Executive Officer and the Chief Financial Officer. This group manages the business,Our CODM allocates resources and measures profitability based on our operating segments. The operating segments, which are managed and reviewed separately, becauseas each representsrepresent products and services that can be sold separately to our customers.Since the most recent filing of Our segments are monitored by management for performance against our Annual Report on Form 10-K for the year ended December 31, 2014, and in connection with the Merger, our chief operating decision-making group has determined the following to be the operating segments for which we conduct business: (a) Games, and (b) Payments. Therefore, beginning in the first quarter of 2015, we are reportinginternal forecasts. new segments in both the current and prior periods. This change had no impact onOur CODM determined that our consolidated financial statements. Eachoperating segments for conducting business are: (a) Games; and (b) FinTech:these segments is monitored by our management for performance against its internal forecastgaming equipment; gaming systems; interactive solutions; and is consistent with our internal management reporting. ancillary products and services.
The FinTech segment provides solutions directly to gaming establishments to offer their patrons cash access-related services and products, including: access to cash at gaming facilities via ATM cash withdrawals; credit card cash access transactions and POS debit card cash access transactions; check-related services; equipment and maintenance services; compliance, audit and data software; casino credit data and reporting services and other ancillary offerings.·The Games segment provides solutions directly to gaming establishments to offer their patrons gaming entertainment related experiences including: leased gaming equipment; sales and maintenance related services of gaming equipment; gaming systems; and ancillary products and services.·The Payments segment provides solutions directly to gaming establishments to offer their patrons cash access related services and products including: access to cash at gaming facilities via ATM cash withdrawals, credit card cash access transactions and point of sale debit card transactions; check-related services; fully integrated kiosks and maintenance services; compliance, audit and data software; casino credit data and reporting services and other ancillary offerings.allocaterecord depreciation and amortization expenses to the business segments.214,424 7,406 612,575 585,647 582,444 826,999 593,053 582,444 (73,503) (1,423) 63,773 35,205 49,150 (9,730) 33,782 49,150 For the Year Ended December 31, 2018 2017 2016 Games Revenue Gaming operations $ 168,146 $ 148,654 $ 152,514 Gaming equipment and systems 87,038 70,118 56,277 Gaming other 3,794 4,005 4,462 Total revenues $ 258,978 $ 222,777 $ 213,253 Costs and expenses Gaming operations 17,603 15,741 15,265 Gaming equipment and systems 47,121 35,707 31,602 Gaming other 3,285 3,247 3,441 Total cost of revenues 68,009 54,695 50,308 Operating expenses 57,244 42,780 42,561 Research and development 20,497 18,862 19,356 Goodwill impairment — — 146,299 Depreciation 55,058 40,428 41,582 Amortization 55,099 57,060 79,390 Total costs and expenses 255,907 213,825 379,496 Operating income (loss) $ 3,071 $ 8,952 $ (166,243 ) For the Year Ended December 31, 2018 2017 2016 FinTech Revenues Cash access services $ 156,806 $ 707,222 $ 601,874 Equipment 20,977 13,258 14,995 Information services and other 32,754 31,691 29,334 Total revenues $ 210,537 $ 752,171 $ 646,203 Costs and expenses Cash access services 9,717 572,880 485,061 Equipment 12,601 7,717 9,889 Information services and other 4,110 3,253 3,756 Cost of revenues 26,428 583,850 498,706 Operating expenses 85,054 76,155 76,148 Depreciation 6,167 6,854 8,413 Amortization 10,146 12,445 15,248 Total costs and expenses 127,795 679,304 598,515 Operating income $ 82,742 $ 72,867 $ 47,688 For the Year Ended December 31, 2018 2017 2016 Total Games and FinTech Total revenues $ 469,515 $ 974,948 $ 859,456 Costs and expenses 94,437 638,545 549,014 Operating expenses 142,298 118,935 118,709 Research and development 20,497 18,862 19,356 Goodwill impairment — — 146,299 Depreciation 61,225 47,282 49,995 Amortization 65,245 69,505 94,638 Total costs and expenses 383,702 893,129 978,011 Operating income (loss) $ 85,813 $ 81,819 $ (118,555 ) 103 At December 31, 2018 2017 Total assets Games $ 912,849 $ 925,186 FinTech 635,412 611,888 Total assets $ 1,548,261 $ 1,537,074 1,086,147 1,242,822 487,918 464,463 1,574,065 1,707,285 2015, 20142018, 2017, and 2013,2016, no single customer accounted for more than 10% of our revenues. Our five largest customers accounted for approximately 30%22%, 28%31%, and 33%31% of our total revenue in 2015, 20142018, 2017, and 2013,2016, respectively.20.:207,473 206,364 208,746 204,416 826,999 28,141 16,336 14,716 (68,923) (9,730) 469 (12,741) (6,110) (86,590) (104,972) 0.01 (0.19) (0.09) (1.31) (1.59) 0.01 (0.19) (0.09) (1.31) (1.59) 65,623 65,844 65,941 66,004 65,854 66,492 65,844 65,941 66,004 65,854 150,571 144,946 145,481 152,055 593,053 13,013 9,622 10,771 376 33,782 7,489 4,724 5,676 (5,749) 12,140 0.11 0.07 0.09 (0.09) 0.18 0.11 0.07 0.09 (0.09) 0.18 65,910 65,970 65,589 65,608 65,780 67,370 67,087 66,747 66,397 66,863 104 Quarter First Second Third Fourth Year 2018 Revenues $ 111,001 $ 118,682 $ 120,330 $ 119,502 $ 469,515 24,491 22,597 21,510 17,215 85,813 Net income 4,609 1,475 2,069 4,203 12,356 Basic earnings per share $ 0.07 $ 0.02 $ 0.03 $ 0.06 $ 0.18 Diluted earnings per share $ 0.06 $ 0.02 $ 0.03 $ 0.06 $ 0.17 Weighted average common shares outstanding Basic 68,686 69,203 69,750 70,196 69,464 Diluted 73,285 73,440 74,594 74,024 73,796 2017 Revenues $ 237,537 $ 242,230 $ 247,322 $ 247,859 $ 974,948 Operating income (loss) 22,603 21,292 19,795 18,129 81,819 (3,508 ) (19,057 ) (4,289 ) (25,049 ) (51,903 ) Basic loss per share $ (0.05 ) $ (0.29 ) $ (0.06 ) $ (0.37 ) $ (0.78 ) Diluted loss per share $ (0.05 ) $ (0.29 ) $ (0.06 ) $ (0.37 ) $ (0.78 ) Weighted average common shares outstanding Basic 66,090 66,350 66,897 67,755 66,816 Diluted 66,090 66,350 66,897 67,755 66,816 * Rounding may cause variances. Contents21. CONDENSED CONSOLIDATING FINANCIAL INFORMATIONWe conduct substantially allthe asset purchase agreement, we paid the seller $20 million at the closing of our business through our U.S.the transaction and foreign subsidiaries. Everi Payments’ (“Subsidiary Issuer”) obligations underwill pay an additional $10 million one year following after closing and another $10 million two years following after the Unsecured Notes are fully and unconditionally guaranteed, subject to certain customary release provisions, on a joint and several basis by Holdings (“Parent”) and substantially alldate of our 100%-owned U.S. subsidiaries other than Subsidiary Issuer (the “Guarantor Subsidiaries” and, together with Parent, the “Guarantors” and each a “Guarantor” ). The guarantees of our Unsecured Notesclosing. In addition, we expect that an additional $10 million in contingent consideration will be released underearned by the following customary circumstances: (i)seller based upon the sale or dispositionachievement of all or substantially allcertain revenue targets over the first two years post-closing. We expect the total purchase price for this acquisition, inclusive of the assets of the Guarantor (by way of merger, consolidation, or otherwise) to a person that is not (either before or after giving effect to such transaction) Parent, Subsidiary Issuer or a restricted subsidiary; (ii) the sale or disposition of sufficient capital stock of the Guarantor to a person that is not (either before or after giving effect to such transaction) Parent, Subsidiary Issuer or a restricted subsidiary and the Guarantor ceasescontingent consideration, to be approximately $50 million. We have not completed the purchase price accounting analysis, however, we do not expect that the acquisition will have a restricted subsidiary of Subsidiary Issuer as a result of the sale or other disposition; (iii) the designation of the Guarantor as an unrestricted subsidiary in accordance with the Indenture; or (iv) the legal or covenant defeasance of the Unsecured Notes or the satisfaction and discharge of the Indenture.Presented below is condensed consolidating financial information for (a) Parent, (b) Subsidiary Issuer, (c) the Guarantor Subsidiaries and (d)material impact on our U.S. subsidiaries that are not Guarantor Subsidiaries and our foreign subsidiaries (collectively, the “Non-Guarantor Subsidiaries”) as of December 31, 2015 and December 31, 2014 and for the years ended December 31, 2015, 2014 and 2013. The condensed consolidating financial information has been presented to show the nature of assets held and the results of operations and cash flows of Parent, Subsidiary Issuer, the Guarantor Subsidiaries and the Non-Guarantor Subsidiaries assuming that the guarantee structure of the Unsecured Notes had been in effect at the beginning of the periods presented.
Issuer
Subsidiaries
Subsidiaries566,634 243,974 17,219 (828) 826,999 444,990 56,382 9,025 510,397 61,615 38,554 1,861 (828) 101,202 19,098 19,098 75,008 75,008 7,635 37,734 182 45,551 9,842 73,195 2,436 85,473 524,082 299,971 13,504 (828) 836,729 42,552 (55,997) 3,715 (9,730) 7,639 92,343 308 100,290 104,972 (13,777) (91,195) 13,063 13,063 104,972 6,925 92,343 308 (91,195) 113,353 (104,972) 35,627 (148,340) 3,407 91,195 (123,083) 8,342 (27,673) 1,220 (18,111) (104,972) 27,285 (120,667) 2,187 91,195 (104,972) (1,251) (1,251) 1,251 (1,251) (106,223) 27,285 (120,667) 936 92,446 (106,223) 105
Issuer
Subsidiaries
Subsidiaries542,206 35,689 15,891 (733) 593,053 422,544 10,864 6,663 440,071 88,087 5,719 2,379 (733) 95,452 804 804 7,428 1,134 183 8,745 11,180 2,454 565 14,199 529,239 20,975 9,790 (733) 559,271 12,967 14,714 6,101 33,782 7,675 3,290 (209) 10,756 (12,140) (15,218) 27,358 2,523 202 2,725 (12,140) (5,020) 3,492 (209) 27,358 13,481 12,140 17,987 11,222 6,310 (27,358) 20,301 2,801 3,784 1,576 8,161 12,140 15,186 7,438 4,734 (27,358) 12,140 (1,258) (1,258) 1,258 (1,258) 10,882 15,186 7,438 3,476 (26,100) 10,882
Issuer
Subsidiaries
Subsidiaries541,002 28,277 13,838 (673) 582,444 424,129 7,905 7,760 439,794 71,623 3,445 2,167 (673) 76,562 7,186 1 163 7,350 9,217 371 9,588 512,155 11,351 10,461 (673) 533,294 28,847 16,926 3,377 49,150 10,342 (77) 10,265 (24,398) (13,596) 37,994 (24,398) (3,254) (77) 37,994 10,265 24,398 32,101 16,926 3,454 (37,994) 38,885 7,703 5,924 860 14,487 24,398 24,398 11,002 2,594 (37,994) 24,398 269 269 (269) 269 24,667 24,398 11,002 2,863 (38,263) 24,667 106
Issuer
Subsidiaries
Subsidiaries6 87,078 3,900 11,046 102,030 42,437 2,496 44,933 10,750 41,634 (2) 52,382 4,063 833 32 4,928 12,772 15,966 28,738 6,464 5,160 9,148 20,772 39,810 168,659 1,431 (209,900) 6 203,374 236,152 24,151 (209,900) 253,783 26,472 79,514 322 106,308 154,395 634,811 597 789,803 32,000 343,629 6,833 382,462 3,256 3,399 6,655 137,414 159,735 86 (297,235) 65,577 (65,577) 30,936 3,667 451 35,054 1,136,505 (1,136,505) 137,414 1,608,876 1,065,020 8,289 (1,499,317) 1,320,282 137,420 1,812,250 1,301,172 32,440 (1,709,217) 1,574,065 136,109 162 3,548 139,819 67,736 32,593 1,183 101,512 10,000 10,000 170,091 32,732 7,077 (209,900) 383,936 65,487 11,808 (209,900) 251,331 93,221 (65,577) 27,644 1,153,579 1,153,579 3,624 467 4,091 1,136,505 (1,136,505) 1,157,203 1,230,193 (1,202,082) 1,185,314 1,541,139 1,295,680 11,808 (1,411,982) 1,436,645 91 91 258,020 80,443 3,670 21,101 (105,214) 258,020 55,180 190,375 1,797 1,180 (193,352) 55,180 318 293 25 (1,649) 1,331 318 (176,189) (176,189) 137,420 271,111 5,492 20,632 (297,235) 137,420 137,420 1,812,250 1,301,172 32,440 (1,709,217) 1,574,065 107
Issuer
Subsidiaries
Subsidiaries68,143 6,489 14,463 89,095 40,157 3,131 43,288 6,578 31,116 3 37,697 3,416 16,992 145 20,553 10,595 16,568 27,163 7,143 2,821 9,024 18,988 2,743 6,848 9,591 18,038 151,179 1,623 (170,840) 156,813 232,013 28,389 (170,840) 246,375 17,864 87,898 323 106,085 148,278 708,922 713 857,913 24,771 402,816 9,198 436,785 4,411 4,773 9,184 231,473 147,195 86 (378,754) 78,229 (78,229) 47,508 3,366 69 50,943 1,130,380 (1,130,380) 231,473 1,598,636 1,207,775 10,389 (1,587,363) 1,460,910 231,473 1,755,449 1,439,788 38,778 (1,758,203) 1,707,285 111,375 140 7,642 119,157 61,544 41,395 1,729 104,668 10,000 10,000 152,802 8,159 9,879 (170,840) 335,721 49,694 19,250 (170,840) 233,825 1,072 134,490 (78,229) 57,333 1,178,787 1,178,787 5,377 490 5,867 1,130,380 (1,130,380) 1,185,236 1,265,360 (1,208,609) 1,241,987 1,520,957 1,315,054 19,250 (1,379,449) 1,475,812 90 90 245,682 69,654 2,269 21,115 (93,038) 245,682 160,152 163,269 122,465 (1,006) (284,728) 160,152 1,569 1,569 (581) (988) 1,569 (176,020) (176,020) 231,473 234,492 124,734 19,528 (378,754) 231,473 231,473 1,755,449 1,439,788 38,778 (1,758,203) 1,707,285 108
Issuer
Subsidiaries
Subsidiaries(104,972) 27,285 (120,667) 2,187 91,195 (104,972) 17,477 110,929 2,618 131,024 7,109 7,109 75 (2,864) (2,789) 7,614 7,614 51 10,084 10,135 140 1,103 1,243 75,008 75,008 13,063 13,063 104,972 (13,777) (91,195) 6,883 1,401 8,284 (149) (149) 22,455 22 (3,078) 19,399 (4) (3,299) (36,278) (801) (40,382) (4) 77,462 46,203 926 124,587 (10,857) (10,857) (25,796) (51,108) (84) (76,988) 102 2,000 2,102 3,104 3,104 (2,813) (2,813) (97) (97) (3,906) 6,593 25 (9) (2,703) (3,906) (30,055) (48,792) (93) (2,703) (85,549) (10,000) (10,000) (350,000) (350,000) 335,000 335,000 (1,221) (1,221) 2,246 (2,246) 1,839 1,839 (169) (169) (5) (2,698) 2,703 3,916 (28,472) (2,698) 2,703 (24,551) (1,552) (1,552) 6 18,935 (2,589) (3,417) 12,935 68,143 6,489 14,463 89,095 6 87,078 3,900 11,046 102,030 109
Issuer
Subsidiaries
Subsidiaries12,140 15,186 7,438 4,734 (27,358) 12,140 18,608 3,588 748 22,944 2,035 2,035 54 1 55 301 301 8,991 8,991 270 270 3,129 3,129 2,523 202 2,725 (12,140) (15,218) 27,358 8,849 27 8,876 (2) (17) (19) (31,414) 141 594 (30,679) (47) 34,504 (20,047) (20,647) (6,237) (47) 38,524 624 (14,570) 24,531 (11,845) (1,056,155) (1,068,000) (5,886) (3,464) (9,092) (18,442) 421 421 276 276 (102) (102) 6,889 (1,085,709) (1,425) 1,080,245 6,889 (1,103,121) (1,059,343) (10,517) 1,080,245 (1,085,847) (103,000) (103,000) 500,000 500,000 350,000 350,000 350,000 350,000 (52,735) (52,735) 5,338 5,338 (12,180) (12,180) (12,098) 1,063,059 29,284 (1,080,245) (6,842) 1,032,167 1,063,059 29,284 (1,080,245) 1,037,423 (1,266) (1,266) (32,430) 4,340 2,931 (25,159) 100,573 2,149 11,532 114,254 68,143 6,489 14,463 89,095 110
Issuer
Subsidiaries
Subsidiaries24,398 24,398 11,002 2,594 (37,994) 24,398 16,403 1 534 16,938 1,793 1,793 180 (2) 178 7,874 7,874 150 150 (24,398) (13,596) 37,994 5,078 5,078 (44,264) (1,729) (45,993) 19 13,241 (18,880) (462) (6,082) 19 3,383 (3) 935 4,334 (13,450) (330) (206) (13,986) 86 86 (90) (90) 9,900 (4,676) (5,224) 9,900 (18,130) (330) (206) (5,224) (13,990) (18,500) (18,500) (764) (764) 8,431 8,431 (18,350) (18,350) (7,056) 2,000 (168) 5,224 (9,919) (26,320) 2,000 (168) 5,224 (29,183) 73 73 (41,067) 1,667 634 (38,766) 141,640 482 10,898 153,020 100,573 2,149 11,532 114,254 22. SUBSEQUENT EVENTSAs of the date of the filing of our Annual Report on Form 10-K, we had not identified, and were not aware of, any material subsequent events that occurred for the year ended December 31, 2015.111AccountantAccountants on Accounting and Financial Disclosure.designed to provide reasonable assuranceeffective such that information required to be disclosed by the Company in ourthe reports that it files or submits under the Exchange Act is (i) recorded, processed, summarized and reported within the time periodperiods specified in the SEC’s rules and forms, and that such information is(ii) accumulated and communicated to ourthe Company’s management, including our Interimits Chief Executive Officer and Chief Financial Officer, as appropriate to allow timely decisions regarding required disclosure.As required by Rule 13a-15(b) promulgated under the Exchange Act, ourdisclosures.with the participation of our Interimincluding its Chief Executive Officer and Chief Financial Officer, evaluated the design and operating effectiveness as of December 31, 2015 of our disclosure controls and procedures, as defined in Rule 13a-15(e) promulgated under the Exchange Act. Based on this evaluation our Interim Chief Executive Officer and Chief Financial Officer concluded that our disclosure controls and procedures were effective as of December 31, 2015.Attached as exhibits to this Annual Report on Form 10-K are certifications of our Interim Chief Executive Officer and Chief Financial Officer, which are required pursuant to Rule 13a-14 of the Exchange Act. This “Controls and Procedures” section of this Annual Report on Form 10-K includes information concerning management’s assessment of our internal control over financial reporting and the controls evaluation referenced in the certifications. The report of BDO USA, LLP, our independent registered public accounting firm, is also included below. BDO USA, LLP’s report addresses their audit of our internal control over financial reporting. This section of the Annual Report on Form 10-K should be read in conjunction with the certifications and the report of BDO USA, LLP for a more complete understanding of the matters presented.Management’s Report of Internal Control over Financial ReportingManagement is responsible for establishing and maintaining effectiveadequate internal control over financial reporting as such term is defined in Rules 13a-15(f) and 15d-15(f) under the Exchange Act Rule 13a‑15(f). InternalAct. The Company’s internal control over financial reporting is a process designed to provide reasonable assurance regarding the reliability of financial reporting and the preparation of consolidated financial statements for external purposes in accordance with generally accepted accounting principles (“GAAP”).OurGAAP. Because of inherent limitations, internal control over financial reporting includes those policies and procedures that:(a)pertain to the maintenance of records that, in reasonable detail, accurately and fairly reflect the transactions and dispositions of our assets;(b)provide reasonable assurance that transactions are recorded as necessary to permit preparation of consolidated financial statements in accordance with GAAP, and that receipts and expenditures are being made only in accordance with authorizations of our management and directors; and(c)provide reasonable assurance regarding prevention or timely detection of unauthorized acquisition, use, or disposition of our assets that could have a material effect on the consolidated financial statements.Because of its inherent limitation, our internal control systems and procedures may not prevent or detect misstatements. An internal control system, no matter how well conceived and operated, can provide only reasonable, not absolute, assurance that the objectives of the control system are met. Because of the inherent limitations in all control systems, no evaluation of controls can provide absolute assurance that all control issues and instances of fraud, if any, have been detected. Also, projections of any evaluation of effectiveness to future periods are subject to the risks that controls may become inadequate because of changes in condition,conditions, or that the degree of compliance with the policies andor procedures may deteriorate.112conducted an evaluation ofassessed the effectiveness of our internal control over financial reporting based onas of December 31, 2018, utilizing the frameworkcriteria described in Internal Control-Integratedthe “Internal Control - Integrated Framework (2013)” issued by the Committee of Sponsoring Organizations of the Treadway Commission. Management’s assessment included evaluation of elements such as the design and operating effectiveness of key financial reporting controls, process documentation, accounting policies, and our overall control environment. Based on this evaluation,assessment, management has concluded that our internal control over financial reporting was effective at a reasonable assurance level as of December 31, 2018.was effective as of December 31, 2015. BDO USA, LLP has audited our internal control over financial reporting as of December 31, 2015 as stated in theirthe firm’s attestation report, which is included herein. during the Quarter Ended December 31, 2015Nointo our internal control over financial reporting (as defined in Rules 13a‑15(f) and 15d‑15(f) under the Exchange Act) that occurred during the fourth quarter ended December 31, 20152018 that has materially affected, or is reasonably likely to materially affect, our internal control over financial reporting.InformatioInformation.n.
None.
113
REPORT OF INDEPENDENT REGISTERED PUBLIC ACCOUNTING FIRM
and subsidiaries
We are a public accounting firm registered with the PCAOB and are required to be independent with respect to the Company in accordance with U.S. federal securities laws and the applicable rules and regulations of the Securities and Exchange Commission and the PCAOB.
In our opinion, Everi Holdings Inc. and subsidiaries maintained, in all material respects, effective internal control over financial reporting as of December 31, 2015, based on the COSO criteria.
We also have audited, in accordance with the standards of the Public Company Accounting Oversight Board (United States), the consolidated balance sheet of Everi Holdings Inc. and subsidiaries as of December 31, 2015, and the related consolidated statements of loss and comprehensive loss, stockholders’ equity, and cash flows for the year then ended and our report dated March 15, 2016 expressed an unqualified opinion thereon.
Nevada
114
We have adopted a Code of Business Conduct, Standards and Ethics that is designed to qualify as a “code of ethics” within the meaning of Section 406 of the Sarbanes-Oxley Act of 2002 and the rules promulgated thereunder. The Code of Business Conduct, Standards and Ethics is available on our website at www.everi.com. To the extent required by law, any amendments to, or waivers from, any provision of the Code of Business Conduct, Standards and Ethics will be promptly disclosed to the public. To the extent permitted by such legal requirements, we intend to make such public disclosure by posting the relevant material on our website in accordance with SEC rules.
Item 11. Executive Compensatio
The information set forth in our 2016 Proxy Statement under the captions “Executive Compensation,” “—Director Compensation” and “Compensation Committee Report” is incorporated herein by reference.
(a)The following documents are filed as part of this Annual Report on Form 10‑K:
Schedules.
| (a) | The following documents are filed as part of this Annual Report on Form 10‑K: |
| |||
† † *24.1 XBRL Instance Document. XBRL Taxonomy Extension Schema Document. XBRL Taxonomy Extension Calculation Linkbase Document. XBRL Taxonomy Extension Definition Linkbase Document. XBRL Taxonomy Extension Label Linkbase Document. XBRL Taxonomy Extension Presentation Linkbase Document. /s/ RANDY L. TAYLOR /s/ TODD A. VALLI /s/ E. MILES KILBURN /s/ EILEEN F. RANEYconsolidated financial statementsConsolidated Financial Statements or notes thereto.115
(b) Exhibits:ExhibitNumberExhibit Description2.1 Agreement and Plan of Merger, dated as of September 8, 2014, by and among Everi Holdings Inc. (formerly known as Global Cash Access Holdings, Inc.) (“Holdings”), Movie Merger Sub, Inc. and Everi Games Holding Inc. (formerly known as Multimedia Games Holding Company, Inc.) (“Everi Games”) (incorporated by reference to Exhibit 2.1 of Holdings’ Current Report on Form 8-K filed with the SEC on September 8, 2014).3.1 3.1 3.2 3.2 3.3 3.3 3.4 3.4 4.1 4.1 4.2 Supplemental Indenture, dated as of December 19, 2014, among Everi Payments, as issuer, Holdings, as a guarantor, the subsidiary guarantors party thereto and Deutsche Bank Trust Company Americas, as collateral agent and trustee, related to the 7.75% Senior Secured Notes due 2021 (incorporated by reference to Exhibit 4.2 of Holdings’ Current Report on Form 8-K filed with the SEC on December 22, 2014).4.3 10.1Indenture governing 10.0% Senior Unsecured Notes Due 2022, dated as of December 19, 2009, between Everi Payments and Deutsche Bank Trust Company Americas, as trustee and collateral agent (incorporated by reference to Exhibit 4.1 to Holdings’ Current Report on Form 8-K filed with the SEC on December 22, 2014).4.4 Supplemental Indenture, dated as of December 19, 2014, among Everi Payments, as issuer, Holdings, as a guarantor, the subsidiary guarantors party thereto and Deutsche Bank Trust Company Americas, as trustee, related to the 7.75% Senior Unsecured Notes due 2022 (incorporated by reference to Exhibit 4.2 to Holdings’ Current Report on Form 8-K filed with the SEC on December 22, 2014).4.5 Second Supplemental Indenture, dated as of August 4, 2015, among Everi Payments, as issuer, Holdings, as a guarantor, the subsidiary guarantors party thereto and Deutsche Bank Trust Company Americas, as trustee, related to the 7.75% Senior Unsecured Notes due 2022 (incorporated by reference to Exhibit 10.5 to Holdings’ Quarterly Report on Form 10-Q filed with the SEC on August 6, 2015).1164.6 4.7 Warrant, dated as of April 15, 2015, issued by Holdings to CPPIB Credit Investments III Inc. (incorporated by reference to Exhibit 4.1 to Holdings’ Current Report on Form 8-K filed with the SEC on April 15, 2015).10.1 Purchase Agreement, dated as of December 17, 2014, among Movie Escrow, Inc. (a former wholly owned subsidiary of Everi Payments), as issuer, and Merrill Lynch, Pierce, Fenner & Smith Incorporated, as representative for the initial purchasers listed thereinsole book manager (incorporated by reference to Exhibit 10.1 of Holdings’ Current Report on Form 8-K filed with the SEC on December 22, 2014)May 9, 2017).10.2 10.2 10.3 Credit Agreement, dated as of December 19, 2014, among Everi Payments, Holdings, Bank of America, N.A. as administrative agent, collateral agent, swing line lender and letter of credit issuer; Deutsche Bank Securities Inc., as syndication agent; and Merrill Lynch, Pierce, Fenner & Smith Incorporated and Deutsche Bank Securities, Inc., as joint lead arrangers and joint book managers (incorporated by reference to Exhibit 10.3 of Holdings’ Current Report on Form 8-K filed with the SEC on December 22, 2014).10.4 10.3Security Agreement, dated December 19, 2014, among Everi Payments, Holdings, as a guarantor, the subsidiary guarantors party thereto, and Bank of America, N.A., as collateral agent, related to the Credit Agreement (incorporated by reference to Exhibit 10.4 of Holdings’ Current Report on Form 8-K filed with the SEC on December 22, 2014).10.5 10.6 Note PurchaseExhibit Description10.4 10.7 Security Agreement, dated as of April 15, 2015, among Everi Payments, as issuer, Holdings, as a guarantor, the subsidiary guarantors party thereto, and Deutsche Bank Trust Company Americas, as collateral agent, related to the 7.75% Senior Secured Notes due 2021 (incorporated by reference to Exhibit 10.2 to Holdings’ Current Report on Form 8-K filed with the SEC on April 15, 2015).10.8 Guaranty, dated as of April 15, 2015, among Holdings, as a guarantor, and the subsidiary guarantorslenders party thereto in favor of Deutsche Bank Trust Company Americas,and Jefferies Finance LLC, as collateraladministrative agent related to the 7.75% Senior Secured Notes due 2021 (incorporated by reference to Exhibit 10.3 to Holdings’ Current Report on Form 8-K filed with the SEC on April 15, 2015).10.9 Patent Purchase and License Agreement, dated as of March 22, 2005, by and between Everi Payments and USA Payments, Inc. (incorporated by reference to Exhibit 10.28 of Holdings’ Registration Statement on Form S-1 (Registration No. 333-123514) filed with the SEC on March 22, 2005).+*10.10Agreement for Processing Services, effective as of August 20, 2013, by and between Columbus Data Services, LLC and Everi Payments.117*10.11Contract Cash Solutions Agreement, dated November 12, 2010, between Everi Payments and Wells Fargo Bank, N.A.10.12 Second Amendment to Contract Cash Solutions Agreement, dated June 4, 2012, between Everi Payments and Wells Fargo Bank, N.A. (incorporated by reference to Exhibit 10.1 of Holdings’ Current Report on Form 8-K filed with the SEC on June 7, 2012)November 13, 2017).10.13 Third Amendment to Contract Cash Solutions 10.5 10.14 Fourth Amendment to Contract Cash Solutions Agreement, dated January 29, 2015, between Everi Payments and Wells Fargo Bank, N.A. (incorporated by reference to Exhibit 10.1 of Holdings’ Current Report on Form 8-K filed with the SEC on July 1, 2015).+10.15†10.16†10.7 †10.17†10.8 †10.18†10.9 †10.19†10.10 †10.20†10.11 †10.21†10.12 †10.22†10.13 †10.14 †10.15 †10.16 †10.17 †10.18 †10.19 †10.23Form of Stock Option Agreement under the 2014 Equity Incentive Plan (incorporated by reference to Exhibit 10.7 to Holdings’ Quarterly Report on Form 10-Q filed with the SEC on August 5, 2014).10.24Form of Stock Option Award for Non-Employee Directors under the 2014 Equity Incentive Plan (incorporated by reference to Exhibit 10.8 to Holdings’ Quarterly Report on Form 10-Q filed with the SEC on August 5, 2014).†10.25Form of Stock Option Award for Executives (Single Trigger Acceleration) under the 2014 Equity Incentive Plan (incorporated by reference to Exhibit 10.9 to Holdings’ Quarterly Report on Form 10-Q filed with the SEC on August 5, 2014).118†10.26Form of Stock Option Award for Employees under the 2014 Equity Incentive Plan (incorporated by reference to Exhibit 10.10 to Holdings’ Quarterly Report on Form 10-Q filed with the SEC on August 5, 2014).†10.27†10.28†10.21 †10.29†10.22 Exhibit Description †10.23 †10.24 †10.25 †10.26 †10.27 †10.28 †10.30Employment Agreement with Ram V. Chary (effective January 27, 2014) (incorporated by reference to Exhibit 10.1 of Holdings’ Current Report on Form 8-K filed with the SEC on January 28, 2014).10.31Amendment No.1 to Employment Agreement with Ram V. Chary (effective as of August 5, 2014) (incorporated by reference to Exhibit 10.4 of Holdings’ Current Report on Form 8-K filed with the SEC on August 5, 2014).†10.32Form of Stock Option Agreement for Ram V. Chary (incorporated by reference to Exhibit 10.2 of Holdings’ Current Report on Form 8-K filed with the SEC on January 28, 2014).†10.33Form of Indemnification Agreement for Ram V. Chary (incorporated by reference to Exhibit 10.3of Holdings’ Current Report on Form 8-K filed with the SEC on January 28, 2014).†10.34†10.35†10.30 †10.36†10.31 †10.32 †10.37†10.33 †10.34 †10.38†10.35 †10.39†10.36 †10.40†10.37 16.1 Letter to Securities10.38 10.39 †*10.40 Exhibit Description †10.43 †10.50 *21.1 *23.1 *23.2Consent of Deloitte & Touche LLP.119*31.1 *31.2 ** 3232.1*101.INS *101.SCH *101.CAL *101.DEF *101.LAB *101.PRE * Filed herewith.** Furnished herewith.† Management contracts or compensatory plans or arrangements.+ Confidential treatment has been requested for certain portions of this exhibit pursuant to Rule 24b-2 of the Securities Exchange Act of 1934, as amended. The confidential information has been omitted and filed separately with the SEC.120* Filed herewith. ** Furnished herewith. † Management contracts or compensatory plans or arrangements. + Confidential treatment has been granted for certain portions of this exhibit pursuant to Rule 24b-2 of the Securities Exchange Act of 1934, as amended. The confidential information has been omitted and filed separately with the SEC. SIGNATUREItem 16. Form 10-K Summary.SDated: March 12, 2019 EVERI HOLDINGS INC. By: /s/ TODD A. VALLI By:/s/ RANDY L. TAYLORRandy L. TaylorFinancialAccounting Officer(Principal Financial Officer) (PrincipalDated: March 15, 2016Annual Report on Form 10‑Kreport has been signed below by the following persons on behalf of the registrant and in the capacities and on the date indicated.SignatureTitleDateSignature Title Date /s/ MICHAEL D. RUMBOLZ Michael D. RumbolzInterim President and Chief Executive Officer (Interim March 12, 2019 Michael D. Rumbolz (Principal Executive Officer) and Director March 15, 2016Chief Financial Officer March 12, 2019 Randy L. Taylor Chief Financial Officer (Principal(Principal Financial Officer) March 15, 2016Chief Accounting Officer March 12, 2019 Todd A. Valli Chief Accounting Officer (Principal(Principal Accounting Officer) March 15, 2016Chairman of the Board and Director March 12, 2019 E. Miles Kilburn /s/ GEOFFREY P. JUDGE Director March 12, 2019 Geoffrey P. Judge /s/ RONALD V. CONGEMI Director March 12, 2019 Ronald V. Congemi DirectorMarch 15, 2016/s/ E. MILES KILBURNE. Miles KilburnDirectorMarch 15, 2016/s/ GEOFFREY P. JUDGEGeoffrey P. JudgeDirectorMarch 15, 2016/s/ FRED C. ENLOWFred C. EnlowDirectorMarch 15, 2016Director March 12, 2019 Eileen F. Raney Director/s/ LINSTER W. FOX Director March 15, 201612, 2019Linster W. Fox /s/ MAUREEN T. MULLARKEY Director March 12, 2019 Maureen T. Mullarkey 121