y
UNITED STATES
SECURITIES AND EXCHANGE COMMISSION
Washington, D. C. 20549
FORM 10-K
☒ ANNUAL REPORT PURSUANT TO SECTION 13 OR 15(d) OF THE SECURITIES EXCHANGE ACT OF 1934
For the fiscal year ended December 31 2017, 2021
☐ TRANSITION REPORT PURSUANT TO SECTION 13 OR 15(d) OF THE SECURITIES EXCHANGE ACT OF 1934
For the transition period from to
Commission File Number 001-07349
Ball CorporationCorporation
| | |
State of Indiana | | 35-0160610 |
(State or other jurisdiction of | | (I.R.S. Employer |
incorporation or organization) | | Identification No.) |
| | |
9200 West 108th Circle | | |
10 Longs Peak Drive, P.O. Box 5000Westminster, Colorado
| | |
Broomfield, Colorado
| | 80021-251080021
|
(Address of registrant’s principal executive office) | | (Zip Code) |
Registrant’s telephone number, including area code: (303) (303) 469-3131
Securities registered pursuant to Section 12(b) of the Act:
| | | | |
Title of each class | | Trading Symbol | | Name of each exchange on which registered |
Common Stock, without par value | | BLL | | New York Stock Exchange |
Securities registered pursuant to Section 12(g) of the Act: NONE
Indicate by check mark if the registrant is a well-known seasoned issuer, as defined in Rule 405 of the Securities Act. YES ☒⌧ NO ☐◻
Indicate by check mark if the registrant is not required to file reports pursuant to Section 13 or Section 15(d) of the Act. YES ☐ ◻NO ☒⌧
Indicate by check mark whether the registrant (1) has filed all reports required to be filed by Section 13 or 15(d) of the Securities Exchange Act of 1934 during the preceding 12 months (or for such shorter period that the registrant was required to file such reports), and (2) has been subject to such filing requirements for the past 90 days. YES ☒⌧ NO ☐◻
Indicate by check mark whether the registrant has submitted electronically and posted on its corporate website, if any, every Interactive Data File required to be submitted and posted pursuant to Rule 405 of Regulation S-T during the preceding 12 months. YES☒ NO ☐◻
Indicate by check mark if disclosure of delinquent filers pursuant to Item 405 of Regulation S-K is not contained herein, and will not be contained, to the best of registrant’s knowledge, in definitive proxy or information statements incorporated by reference in Part III of this Form 10-K or any amendment to this Form 10-K. ☒
Indicate by check mark whether the registrant is a large accelerated filer, an accelerated filer, or a non-accelerated filer.filer, a smaller reporting company, or an emerging growth company. See definitionthe definitions of “large accelerated filer,” “accelerated filer,” “smaller reporting company,” and large accelerated filer”"emerging growth company" in Rule 12b-2 of the Exchange Act.
| | | | | | |
Large accelerated filer ☒⌧ | | Accelerated filer ☐◻ | | Non-accelerated filer ☐◻ | | Smaller reporting company ☐ |
Emerging growth company ☐ | | | | | | |
If an emerging growth company, indicate by check mark if the registrant has elected not to use the extended transition period for complying with any new or revised financial accounting standards provided pursuant to Section 13(a) of the Exchange Act. ☐
Indicate by check mark whether the registrant has filed a report on and attestation to its management’s assessment of the effectiveness of its internal control over financial reporting under Section 404(b) of the Sarbanes-Oxley Act (15 U.S.C. 7262(b)) by the registered public accounting firm that prepared or issued its audit report. ☒
Indicate by check mark whether the registrant is a shell company (as defined in Rule 12b-2 of the Act). YES ☐ NO ☒
The aggregate market value of voting stock held by non-affiliates of the registrant was $14.8$26.5 billion based upon the closing market price and common shares outstanding as of June 30, 2017.2021.
Number of shares and rights outstanding as of the latest practicable date.
| | |
Class | | Outstanding at February 20, 2018 |
| | 14, 2022 |
Common Stock, without par value | | 350,442,053321,495,737 shares
|
| | |
DOCUMENTS INCORPORATED BY REFERENCE
1. | Proxy statement to be filed with the Commission within 120 days after December 31, 2021, to the extent indicated in Part III. |
1.Proxy statement to be filed with the Commission within 120 days after December 31, 2017, to the extent indicated in Part III.
Ball Corporation
ANNUAL REPORT ON FORM 10-K
For the year ended December 31, 20172021
TABLE OF CONTENTS
| | |
| | |
| | Page Number |
| | Page Number
|
| | |
PART I. | | |
| | |
Item 1. | Business | 1 |
Item 1A.
| Risk Factors4
| 7 |
Item 1B.
| Unresolved Staff Comments
| 15 |
Item 2.
| Properties
| 15 |
Item 3.
| Legal Proceedings
| 18 |
Item 4.
| Mine Safety Disclosures
| 18 |
| | |
PART II.Item 1A.
| Risk Factors | |
| | 12 |
Item 5.1B. | Market for the Registrant’s Common Stock and Related Stockholder MattersUnresolved Staff Comments
| 1822 |
Item 6.2. | Selected Financial DataProperties
| 2022 |
Item 7.3. | Legal Proceedings | 24 |
Item 4. | Mine Safety Disclosures | 24 |
| | |
PART II. | |
| | |
Item 5. | Market for Registrant’s Common Equity, Related Stockholder Matters and Issuer Purchases | 24 |
Item 6. | [Reserved] | 25 |
Item 7. | Management’s Discussion and Analysis of Financial Condition and Results of Operations | 2226 |
| Forward-Looking Statements | 3736 |
Item 7A. | Quantitative and Qualitative Disclosures About Market Risk | 3836 |
Item 8. | Financial Statements and Supplementary Data | 4038 |
| Report of Independent Registered Public Accounting Firm(PCAOB ID 238) | 4038 |
| Consolidated Statements of Earnings for the Years Ended December 31, 2017, 20162021, 2020 and 20152019 | 4240 |
| Consolidated Statements of Comprehensive Earnings (Loss) for the Years Ended December 31, 2017, 20162021, 2020 and 20152019 | 4341 |
| Consolidated Balance Sheets at December 31, 2017,2021 and December 31, 20162020 | 4442 |
| Consolidated Statements of Cash Flows for the Years Ended December 31, 2017, 20162021, 2020 and 20152019 | 4543 |
| Consolidated Statements of Shareholders’ Equity for the Years Ended December 31, 2017, 20162021, 2020 and 20152019 | 4644 |
| Notes to the Consolidated Financial Statements | 4745 |
| Item 9.Note 1, Critical and Significant Accounting Policies
| 45 |
| Note 2, Accounting Pronouncements | 55 |
| Note 3, Business Segment Information | 55 |
| Note 4, Acquisitions and Dispositions | 58 |
| Note 5, Revenue from Contracts with Customers | 59 |
| Note 6, Business Consolidation and Other Activities | 60 |
| Note 7, Supplemental Cash Flow Statement Disclosures | 63 |
| Note 8, Receivables, Net | 63 |
| Note 9, Inventories, Net | 64 |
| Note 10, Property, Plant and Equipment, Net | 64 |
| Note 11, Goodwill | 65 |
| Note 12, Intangibles Assets, Net | 65 |
| Note 13, Other Assets | 66 |
| Note 14, Leases | 66 |
| Note 15, Debt and Interest Costs | 68 |
| Note 16, Taxes on Income | 69 |
| Note 17, Employee Benefit Obligations | 73 |
| Note 18, Shareholders’ Equity | 82 |
| Note 19, Stock-Based Compensation Programs | 84 |
| Note 20, Earnings Per Share | 85 |
| Note 21, Financial Instruments and Risk Management | 86 |
| Note 22, Contingencies | 91 |
| Note 23, Indemnifications and Guarantees | 93 |
PART I.
PART I.Item 1. Business
Ball Corporation and its consolidated subsidiaries (collectively, Ball, the company, we or our) is one of the world’s leading suppliers of metalaluminum packaging tofor the beverage, food, personal care and household products industries. The company was organized in 1880 and incorporated in the state of Indiana, United States of America (U.S.), in 1922. Our sustainable, aluminum packaging products are produced for a variety of end uses and are manufactured in facilities around the world. We also provide aerospace and other technologies and services to governmental and commercial customers within our aerospace segment. In 2017,2021, our total consolidated net sales were $11$13.8 billion. Our packaging businesses were responsible for 9186 percent of our net sales, with the remaining 914 percent contributed by our aerospace business.
Our largest product line is aluminum beverage containers. Wecontainers and we also produce steel food and aerosol containers, extruded aluminum aerosol containers, recloseable aluminum bottles across multiple consumer categories, aluminum slugs and aluminum slugs.cups.
We sell our aluminum packaging products mainlyglobally to large multinational beverage, food, personal care and household products companies with which we have developed long-term relationships. This is evidenced by our high customer retention and large number of long-term supply contracts. While we have a diversified customer base, we sell a significant portion of our packaging products to major companies and brands, as well as to numerous regional customers. Our significant customers include: The Coca-Cola Companyinclude top consumer packaging and its affiliated bottlers, Anheuser-Busch InBev n.v./s.a., Molson Coors Brewing Company and Unilever N.V.beverage companies.
Our aerospace business is a leader in delivering solutions ranging from entire missions to contributing component level expertise through the design, development and manufacture of innovative aerospace systems for intelligence surveillance and reconnaissance, civil, commercial and national cyber security aerospace markets. It produces spacecraft, instruments and sensors, radio frequency systems and components, data exploitation solutions and a variety of advanced aerospace technologies and products that enable weather prediction and climate change monitoring as well as deep space missions.
We are headquartered in Broomfield,Westminster, Colorado, and our stock is listed for trading on the New York Stock Exchange under the ticker symbol BLL. We intend to change the company’s ticker symbol from BLL to BALL immediately following our annual shareholders’ meeting in April 2022. A public press release will be issued 10 days prior to the actual change date.
Our Strategy
Our Strategy
Our overall business strategy is defined by our Drive for 10 vision which atdefines our overall business strategy. At its highest level, Drive for 10 is a mindset around perfection, with a greater sense of urgency around our future success. Launched in 2011, our Drive for 10 vision encompasses five strategic levers that are key to growing our businesses and achieving long-term success. These five levers are:
| ·
● | | Maximizing value in our existing businesses |
| ·
● | | Expanding into new products and capabilities |
| ·
● | | Aligning ourselves with the right customers and markets |
| ·
● | | Broadening our geographic reach and |
| ·
● | | Leveraging our know-how and technological expertise to provide a competitive advantage |
We also maintain a clear and disciplined financial strategy focused on improving shareholder returns through:by:
| ·
● | | Seeking to deliver comparable diluted earnings per share growth of 10 percent to 15 percent per annum over the long-term |
| ·
● | | Maximizing free cash flow generation |
| ·
● | | Increasing Economic Value Added (EVA®) dollars |
The cash generated by our businesses is used primarily: (1) to finance the company’s operations, (2) to fund strategicgrowth capital investments, (3) to service the company’s debt and (4) to return value to our shareholders via stock buy-backsbuybacks and dividend payments. From time to time, we have evaluated and expect to continue to evaluate possible transactions that we believe will benefit the company and our shareholders, which may include strategic acquisitions, divestitures of parts of our company or joint ventures.equity investments. At any time, we may be engaged in discussions or negotiations with respect to possible transactions or may have entered into non-binding letters of intent. There can be no assurance if or when we
will enter into any such transactions or the terms of such transactions. The compensation of many of our employees is tied directly to the company’s performance through our EVA®-based incentive programs.
Sustainability
At Ball Corporation, we believe in our people, our culture and our ability to deliver value to our stakeholders. Like uncompromising integrity and customer focus, sustainability is part of our Drive for 10 vision and has been a part of who we are since our founding in 1880.
Our triple bottom-line approach to sustainability – environmental, economic and social – has evolved over the years and is the lens through which we conduct business at every level of our organization today. Sustainability is a key part of our business strategy, and it influences how we manage and operate our businesses, serve our customers, care for the environment and our communities, secure profits and drive long-term prosperity.
We focus our sustainability efforts on product stewardship, operational excellence, human capital management, including diversity and inclusion, and community engagement. In our manufacturing operations around the world, we work on continuous improvement of employee safety and engagement, energy and water efficiency, reducing greenhouse gas emissions, waste reduction and recycling. Our commitment extends beyond our walls.
Today’s consumers are acutely aware of the plastic pollution crisis, and they are choosing brands based on their sustainability credentials. Customers understand this growing concern for the environment and their unique position in impacting the environment, especially through the packaging materials they use. Infinitely recyclable and economically valuable aluminum unlocks the full potential of packaging to help customers convey values and purpose to consumers. We are committed to doing what we can to move toward a truly circular economy, where materials can be – and actually are – used again and again.
Aluminum cans, bottles and now cups are an increasingly attractive option for sustainability-conscious brands and consumers who want to do the right thing for the environment. Unlike plastic, glass, cartons or compostable containers, aluminum containers are designed to be recycled again and again without losing quality, and are in high demand across industries and applications, pushing aluminum collection, sorting and recycling rates to the highest of any beverage packaging material. That’s why 75 percent of all aluminum ever produced is still in use today.
Aluminum beverage packaging is the leader in real recycling, where the package is collected and then transformed into an item of equal value (product-to-product or material-to-material recycling). In the case of aluminum cans, bottles or cups which are monomaterial, the aluminum can be recycled and made back into the same product in as little as 60 days. In contrast, only 10 percent of all plastic ever produced has been recycled and is mostly only downcycled. Down-cycled products, including but not limited to when plastic is converted to become part of a sneaker or fibers in a carpet, are not sustainable because eventually those products end up in landfills. Real recycling happens when the value of the product being recycled is maintained from one use to another.
Because recycling aluminum saves resources and uses significantly less energy than primary aluminum production, we are innovating and collaborating with our customers, supply chain, and other public and private partners to establish and financially support initiatives to increase recycling rates around the world. For example, we work together to create effective collection and recycling systems and educate consumers about the sustainability benefits of aluminum packaging. During 2021, the company proactively engaged with global regulators and legislators to raise awareness of the importance of recycling and infrastructure investment to improve global recycling rates. As part of this proactive engagement, the company also published the 50 States of Recycling Report, which is available at www.ball.com/realcircularity.
Our aerospace business plays a role in sustainability as well. More and more, our systems are measuring key elements of the physical environment and supporting environmental monitoring and operational weather forecasting programs, as well as providing environmental intelligence on weather, the Earth's climate system, precipitation, drought, air pollution, vegetation and biodiversity measurements. The data captured through Ball-built instruments and satellites enable an enhanced understanding of the Earth’s ecosystem and the stratospheric ozone layer and severe storm tracking, and better enabling effective management of natural resources, including helping experts to make routine drought assessments and fire prevention plans.
At Ball, our sustained long-term success depends not only on our products and our operations, but on an engaged workforce. We continue to invest in recruiting to ensure we have the right people with the right skills in the right roles, and in developing our employees at every level and providing them with opportunities to advance their careers. We also are committed to embracing diversity and providing an inclusive environment where employees can thrive. A focus on diversity among individuals and teams helps to unleash ideas and fuel innovation, which drives growth and economic value throughout our global organization.
A healthy and sustainable business also depends on thriving communities. Ball’s commitment to the communities where we live and operate is an integral part of our corporate culture, as we continue to support organizations, programs and civic initiatives that advance sustainable livelihoods. Community engagement is how our company and our employees enrich the places where we live and work beyond providing jobs, benefits and paying local taxes. Through the Ball Foundation, corporate giving, employee giving and volunteerism, we invest in the future of the communities that sustain us. In 2021, Ball and its employees donated over $5 million supporting more than 2,900 non-profits and logged more than 24,000 hours of volunteer service to non-profit organizations centered on building sustainable communities through recycling, education, and disaster preparedness and relief initiatives.
The company’s focus towards sustainability has been recognized by external organizations. Ball was recognized in the Top 1 Percent of Industry and received the Gold Class and Industry Mover Award by S&P Global in The Sustainability Yearbook 2022.
Human Capital and Employees
Ball Corporation’s people are its greatest asset and we are proud to outline the material aspects of our human capital program. At the end of 2021, the company and its subsidiaries employed approximately 24,300 employees, including approximately 11,900 employees in the U.S. Details of collective bargaining agreements are included within Item 1A, Risk Factors, of this annual report.
Our Culture
Embracing our rich 142-year history, we “know who we are”, a company that respects and values each of our employees and their collective desire to deliver value to all our stakeholders. We embrace our diversity and are “one Ball” in valuing:
| ● | Uncompromising integrity; |
| ● | Being close to our customers; |
| ● | Focusing on attention to detail; and |
Diversity and Inclusion
Diversity and Inclusion (D&I) is embedded in our Drive for 10 vision and is key to the sustained success of our business. We established a dedicated D&I function in 2015 to build on our longstanding commitment to D&I across the company and included D&I as an integral part of our goals for sustainability. Over the past six years, we have made meaningful progress on D&I, which has been recognized by external organizations, including Forbes, which recognized Ball among the “America’s Best Employers for Diversity” in 2020, and the Human Rights Campaign Foundation, which listed Ball among the “Best Places to Work for LGBTQ Equality” in 2021 and 2022 and awarded Ball with a perfect score on its Corporate Equality Index list in 2021 and 2022. Our dedicated D&I function reports directly to our CEO, and we understand that the key to success is shared accountability rather than designating a single owner for this critical area.
Our focus to date has been on providing unconscious bias training for our global workforce, expanding our Ball Network and Interest Groups (BNIs) in terms of quantity and geography, and increasing awareness about the importance of D&I and each employee’s role in ensuring that we have a culture where people can bring their authentic selves to work and thrive. While we are proud of our progress, we know there is more work to do.
As we move forward, we are accelerating our D&I efforts with a greater sense of urgency. In June 2020, we instituted a new global cloud-based human capital management platform that will – among many other talent-focused features – enable us to more fully understand employee demographics and identify how we can better enhance our diversity around the world. We continue to evolve our talent acquisition process and focus on diversity for internships, candidate slates, interview panels, talent reviews and succession planning. Each of our business segment leaders has committed to help drive further D&I progress during 2022 and beyond. Currently, 62 percent of our board of directors are either gender or ethnically diverse, including five female board members, and 30 percent of our company’s executive leadership team are either gender or ethnically diverse.
Talent
We seek to attract, develop and retain the best talent throughout the company. During the past decade, we established and expanded our talent management organization with dedicated talent acquisition and development functions that have implemented rigorous hiring and development processes, including standardized assessments for candidate selection, and an embedded “Inspire, Connect, Achieve” leadership framework, which details clear behaviors that we expect from our people leaders to ensure they align with our culture. We have also strengthened our succession planning through a holistic approach to developing key managers that includes challenging assignments, formal development plans and professional coaching.
Training and Development
Our global human capital management platform enables rigorous identification, analysis and development of talent around the world. In conjunction with that platform, the company utilizes an approach to performance management focused on development and continuous improvement. This approach emphasizes ongoing performance conversations between managers and employees and a focus on mitigating bias in performance conversations, resulting in an enhanced employee developmental experience and data points for our talent discussions. Additionally, all employees have access to create a personal development plan and we have resources to support employees in their personal and professional development, including:
| ● | Continuous education through various tuition reimbursement programs, apprenticeship and instructional programs; |
| ● | A learning management platform that has had significant employee utilization; |
| ● | Monthly global leadership panel discussions and breakout groups focused on real-time topics, such as supporting team wellbeing, working through stressful times, setting individual development goals, maximizing team performance, sharing practical steps to better enable our collective focus on D&I and sharing other best practice leadership behaviors |
| ● | A new LinkedIn Learning platform for all corporate and packaging employees who work in an office setting; |
| ● | Leadership and personal development coaching opportunities through a partnership with BetterUp; |
| ● | On-going education for people leaders around our Inspire, Connect, and Achieve leadership behaviors; |
| ● | Annual compliance, antitrust, bribery, corruption and business code of conduct and ethics training for key management level, sales and supply chain employees. |
Employee Engagement
As part of our Drive for 10 vision, we seek to ensure that everyone at Ball is motivated to perform their best work every day. To further that objective, our engagement approach focuses on clear communication and recognition. We communicate through quarterly employee town hall meetings, at both the corporate and operating division levels, with business and market updates and information on production, safety, quality and other operating metrics. We also communicate company information through news releases, executive communications, internal management information bulletins, digital signage and our weekly Ball eNews through the new BallConnect intranet, which are available to all employees. We have many recognition-oriented awards throughout our company, including our corporate and divisional awards of excellence. We conduct regular company-wide engagement surveys, as well as periodic pulse surveys, which have generally indicated high levels of engagement and trust in Ball’s leadership, key strategies and initiatives.
Total Rewards
We have steadily upgraded our total rewards function over the past decade with the objective of acquiring, rewarding and retaining the best talent by providing total rewards that are competitive and performance based. Our compensation programs, including our long-standing EVA® based incentive plans, reflect our commitment to reward performance that drives shareholder value. Total direct compensation is positioned in a competitive range of the applicable market median in each jurisdiction, differentiated based on tenure, skills and performance, and designed to attract and retain the best talent.
Health, Safety and Wellness
The health, safety and wellness of each of our employees has been one of Ball’s top priorities for many years. Our environmental, health and safety function and our operations executives partner to consistently reinforce policies and procedures that are designed to reduce workplace risks and ensure safe methods of plant production, including through regular training and reporting on injuries and lost-time incidents. Over the past 15 years, we have sponsored a variety of health and wellness programs designed to enhance the physical and mental well-being of our employees around the world. During 2020, the company expanded access to its existing Employee Assistance Program (EAP) to our entire global workforce. The EAP provides employees and their families access to mental health, stress management and support resources during these difficult times.
Since the onset of the ongoing novel coronavirus (COVID-19) pandemic, nearly all of our businesses have been deemed essential by the governments where we operate, and our production facilities have operated continuously. During this time, we have put employee health and well-being front and center, and we have adjusted our approach to how work gets done accordingly. Our guiding principles throughout the pandemic have been safety, flexibility and empathy. Ball has implemented rigorous safety protocols in all its locations, including face coverings, social distancing, contact tracing, employee testing and enhanced cleaning. Most office-based roles have transitioned to a flexible working environment, and our IT systems have been flexed to support more virtual meetings and remote collaboration. We are actively preparing for a more flexible approach to traditional office roles after the pandemic ends.
Finally, despite the effects of the pandemic and in direct support of our growing businesses, Ball increased its net employee headcount by approximately 2,800 employees during 2021. Additional information on our human capital programs can be found in the Ball Corporation Sustainability Report, which is available at www.ball.com/sustainability.
Our Reportable Segments
Ball Corporation reports its financial performance in fivefour reportable segments: (1) beverage packaging, North and Central America; (2) beverage packaging, South America;Europe, Middle East and Africa (beverage packaging, EMEA); (3) beverage packaging, Europe;South America and (4) food and aerosol packaging and (5) aerospace. Ball also has investments in the U.S., Guatemala, Panama South Korea and Vietnam that are accounted for using the equity method of accounting and, accordingly, those results are not included in segment sales or earnings. FinancialAdditional financial information related to each of our segments is included in Item 7. Management’s Discussion and Analysis of Financial Condition and Results of Operations, and in Note 3 to the consolidated financial statements within Item 8 of this Annual Report on Form 10-K (annual report).
Beverage Packaging, North and Central America, Segment
Beverage packaging, North and Central America, is Ball’s largest segment, accounting for 3842 percent of consolidated net sales in 2017. Metal2021. Aluminum beverage containers are primarily sold under multi-year supply contracts to fillers of carbonated soft drinks, beer, energy drinks and other beverages.
MetalAluminum beverage containers and ends are produced at 1920 manufacturing facilities in the U.S., one in Canada and two in Mexico. Additionally, Rocky Mountain Metal Container, LLC, a joint venture owned 50 percent by BallThe beverage packaging, North and 50 percent by a wholly owned subsidiary of Molson Coors Brewing Company, operates beverage container and end manufacturing facilitiesCentral America, segment also includes interests in Golden, Colorado.
The North American beverage container manufacturing industry is relatively mature. Where growth or contractionsfour investments that are projected in certain markets oraccounted for certain products, Ball undertakes selected capacity increases or decreases primarilyusing the equity method. In 2021, the company began production in its existing facilitiesnew plants in Glendale, Arizona, Pittston, Pennsylvania, and Bowling Green, Kentucky. The company has announced plans to meet market demand. A meaningful portion of the industry-wide reductionexpand its network to include new plants in demand for standard 12-ounce aluminum cans for the carbonated soft drink market is being offset with growing demand for specialty container volumes from newNorth Las Vegas, Nevada, and existing customers and consumer demand. During 2016, we began production at our newly constructed beverage can and end manufacturing facility in Monterrey, Mexico.Concord, North Carolina.
According to publicly available information and company estimates, the North America,American beverage container industry represents approximately 110133 billion units. FiveSix companies manufacture substantially all of the metalaluminum beverage containers in the U.S., Canada and Mexico. Ball producedshipped approximately 4654 billion recyclable aluminum beverage containers in North and Central America in 2017,2021, which represented approximately 4041 percent of the aggregate productionshipments in these countries. Historically, sales volumes of metal beverage containers in North America tend to be highest during the period from April through September. All of the beverage containers produced by Ball in the U.S., Canada and Mexico are made of aluminum. In North and Central America, fivea diverse base of no less than ten global suppliers provide the majorityprovides almost all of our aluminum can and end sheet requirements.
Beverage containers are sold based on price, quality, service, innovation and sustainability in a highly competitive market, which is relatively capital intensive and characterized by facilities that run more or less continuously in order to operate profitably. In addition, the metalaluminum beverage container competes aggressively with other packaging materials which include meaningful industry positions by the glass bottle in the packaged beer industry and the polyethylene terephthalate (PET) bottle in the carbonated soft drink and water industries.
We believe we have limitedlimit our exposure to changes in the cost of aluminum ingot as a result of the inclusion of provisions in most metalof our aluminum beverage container sales contracts to pass through aluminum price changes, as well as through the use of derivative instruments.
In order to better align our manufacturing footprint to meet the needs of our customers, the company announced in July 2015 the closure of its Bristol, Virginia, beverage end-making facility. The Bristol facility, which ceased production at the end of June 2016, produced beverage ends in a variety of sizes and its capacity was transitioned to existing North American Ball end-making facilities. In December 2016, the company announced the closure of its Reidsville, North Carolina, beverage packaging plant. The Reidsville facility, which ceased production at the end of June 2017, produced beverage cans in a variety of sizes and its customers are now supplied by the company’s other U.S. facilities. During the third quarter of 2017, the company announced the closure of its beverage can manufacturing facilities in Chatsworth, California, and Longview, Texas, and its beverage end manufacturing facility in Birmingham, Alabama. The Birmingham plant is currently expected to cease production by the end of the second quarter of 2018, and the Longview
and Chatsworth plants are currently expected to cease production by the end of the third quarter of 2018. The capacity from these locations will be transitioned to other North American Ball facilities. In order to serve growing customer demand for specialty cans in the southwestern U.S., the company is constructing a beverage packaging facility in Goodyear, Arizona, which is expected to begin production in the second quarter of 2018.
Beverage Packaging, South America,EMEA, Segment
The beverage packaging, South America,EMEA, segment accounted for 1525 percent of Ball’s consolidated net sales in 2017.2021. Our EMEA region operations consist of 14include 17 facilities 12throughout Europe, three facilities in BrazilRussia and one facility each in ArgentinaCairo, Egypt, and Chile.Manisa, Turkey. For the countries wherein which we operate, the South American beverage container market is approximately 2993 billion containers, and we are the largest producer in this region with an estimated 55 percent of South American shipments in 2017. Four companies currently manufacture substantially all of the metal beverage containers in Brazil.
The company’s South American beverage facilities produced approximately 16 billion aluminum beverage containers in 2017. Historically, sales volumes of beverage containers in South America tend to be highest during the period from September through December. In South America, two suppliers provide virtually all our aluminum sheet requirements.
In order to support contracted volumes for aluminum beverage packaging across Paraguay, Argentina and Bolivia, the company will construct a one-line beverage can and end manufacturing plant in Paraguay, and will add capacity to its Buenos Aires, Argentina, facility. The Paraguay plant is expected to begin production in the fourth quarter of 2019.
We believe we have limited our exposure to changes in the costs of aluminum ingot as a result of the inclusion of provisions in most metal beverage container sales contracts to pass through aluminum ingot price changes, as well as through the use of derivative instruments.
Beverage Packaging, Europe, Segment
The beverage packaging, Europe, segment, which accounted for 21 percent of Ball’s consolidated net sales in 2017. Our European operations consist of 20 facilities throughout Europe. The European beverage container market is approximately 64 billion containers, including Russia, and we are the largest producer with an estimated 4241 percent of European shipments.shipments in this region. The European market isregions served by our beverage packaging, EMEA, segment, including Russia, Egypt and Turkey, are highly regional in terms of sales growth rates and packaging mix. Four companies manufacture substantially all of the metal beverage containers in Europe.EMEA. Our EuropeanEMEA beverage facilities produced 27shipped 38 billion beverage containers in 2017,2021, the vast majority of which were producedmade from aluminum. As of December 31, 2021, all of the beverage containers produced by the company’s beverage packaging, EMEA, segment are now made of aluminum. The company has announced plans to construct additional plants in Pilsen, Czech Republic, Ulyanovsk, Russia, and Northamptonshire, U.K.
Historically, sales volumes of metal beverage containers in EuropeEMEA tend to be highest during the period from May through August, with a smaller increase in demand leading up to the winter holiday season in the U.K. offset by much lower demand in Russia. Much like in other parts of the world, the metalaluminum beverage container competes aggressively with other packaging materials used by the European beer and carbonated soft drink industries. The glass bottle is heavily utilized in the packaged beer industry, while the PET container is utilized in the carbonated soft drink, beer, juice and water industries. These trends are evolving, however, as customers respond to consumer demand, and regulators and non-governmental organizations press for more sustainable packaging in the wake of the plastic pollution crisis. More and more brands are choosing aluminum beverage packaging because of its infinite recyclability and other sustainability credentials. The overall recycling rate for aluminum beverage cans in the European Union, Switzerland, Norway and Iceland increased to a new record level of approximately 75 percent in 2017.
Raw material supply contracts in this region generally have longer term agreements. In Europe, fiveSix aluminum suppliers and two steel suppliers provide almost all of our aluminum can and end sheet requirements. Aluminum is traded primarily in U.S. dollars, while the functional currencies of our EuropeanEMEA operations are various other currencies. The company minimizes its exchange rate risk using derivative and supply contracts in local currencies. Purchase and sales contracts generally include fixed-price, floating or pass-through aluminum ingot component pricing arrangements.
In order to support strong growth for beverage cans in the Iberian Peninsula, the company is constructing a two-line, aluminum beverage can manufacturing facility near Madrid, Spain, with the majority of the new capacity secured under a long-term customer contract. The facility is expected to be fully operational in mid-2018 and will produce multiple can sizes. In the third quarter of 2017,We limit our beverage packaging container and end production facilities in Recklinghausen, Germany, ceased production, and the capacity was transitioned to existing European Ball facilities.
Food and Aerosol Packaging Segment
The food and aerosol packaging segment accounted for 10 percent of consolidated net sales in 2017. Ball produces two-piece and three-piece steel food containers and ends for packaging vegetables, fruit, soups, meat, seafood, nutritional products, pet food and other products. The segment also manufactures and sells steel aerosol containers, as well as
extruded aluminum aerosol containers and aluminum slugs. There are 10 facilities in the U.S., four in Europe, two in Argentina, one in Canada, one in Mexico and one in India that manufacture these products.
We estimate our steel aerosol business accounted for 34 percent of total annual U.S. and Canadian steel aerosol shipments in 2017. In the U.S. and Canada, we are the leading supplier of aluminum slugs used in the production of extruded aluminum aerosol containers and estimate our percentage of the total industry shipments to be 77 percent. We estimate our extruded aluminum aerosol business accounted for 21 percent of total annual North American extruded aluminum aerosol shipments in 2017. Ball’s European aluminum aerosol shipments represented 20 percent of total European industry shipments in 2017. Historically, sales volumes of metal food containers in North America tend to be highest from May through October as a result of seasonal fruit, vegetable and salmon packs. We estimate our 2017 shipments of 3 billion steel food containers to be 11 percent of total U.S. and Canadian metal food container shipments.
Cost containment and maximizing asset utilization are crucial to maintaining profitability in the metal food and aerosol container manufacturing industries and Ball is focused on doing so. During the first quarter of 2016, the company announced the closure of its food and aerosol packaging flat sheet production and end-making facility in Weirton, West Virginia, which ceased production in the first quarter of 2017, and its production capacity was consolidated into other Ball facilities in the U.S. In October 2016, the company sold its specialty tin manufacturing facility in Baltimore, Maryland. In March 2017, the company sold its paint and general line can plant in Hubbard, Ohio.
Competition in the U.S. steel aerosol container market primarily includes three other national suppliers. Competitors in the metal food container industry include three national and a small number of regional suppliers and self-manufacturers. Several producers in Mexico also manufacture steel food containers. Steel containers also compete with other packaging materials in the food and aerosol products industry including glass, aluminum, plastic, paper and pouches. As a result, profitability for this product line is dependent on price, cost reduction, service and quality. Two steel suppliers provide approximately 58 percent of our tinplate steel. We believe we have limited our exposure related to changes in the costscost of steel tinplate and aluminum as a result of the inclusion of provisions in manymost of our aluminum beverage container sales contracts to pass through steelaluminum price changes, as well as through the use of derivative instruments.
Beverage Packaging, South America, Segment
The beverage packaging, South America, segment accounted for 15 percent of Ball’s consolidated net sales in 2021. Our operations consist of 13 facilities—10 in Brazil and one each in Argentina, Chile and Paraguay. For the countries where we operate, the South American beverage container market is approximately 42 billion containers, and we are the largest producer in this region with an estimated 48 percent of South American shipments in 2021. Four companies currently manufacture substantially all of the aluminum beverage containers in Brazil.
The company’s South American beverage facilities shipped approximately 20 billion aluminum beverage containers in 2021. Historically, sales volumes of beverage containers in South America tend to be highest during the period from September through December. In South America, two suppliers provide virtually all our aluminum can and end sheet requirements with certain requirements also being imported from Asia.
To support long-term contracted volume growth and can-filling investments across South America, the previously announced multi-line facility in Frutal, Brazil, recently began production in 2021, and additional investments across our existing South American footprint continue.
We limit our exposure to changes in the cost changes andof aluminum as a result of the existenceinclusion of certain other steelprovisions in most of our aluminum beverage container sales contracts that incorporate annually negotiated metal costs. We also mitigateto pass through aluminum costprice changes, as well as through our self-supply of aluminum slugs and the use of aluminum scrap from our beverage can facilities.derivative instruments.
Aerospace Segment
Ball’s aerospace segment, which accounted for 914 percent of consolidated net sales in 2017,2021, includes national defense hardware, antenna and video tactical solutions, civil and operational space hardware and systems engineering services. The segment develops spacecraft, sensors and instruments, radio frequency systems and other advanced technologies for the civil, commercial and national security aerospace markets. The majority of the aerospace business involves work under contracts, generally from one to five years in duration, as a prime contractor or subcontractor for the U.S. Department of Defense (DoD), the National Aeronautics and Space Administration (NASA) and other U.S. government agencies. The company competes against both large and small prime contractors and subcontractors for these contracts. Contracts funded by the various agencies of the federal government represented 9897 percent of segment sales in 2017.2021.
Intense competition and long operating cycles are key characteristics of both the company’s business and the aerospace and defense industry. It is common in the aerospace and defense industry for work on major programs to be shared among a number of companies. A company competing to be a prime contractor may, upon ultimate award of the contract to a competitor, become a subcontractor for the ultimate prime contracting company. It is not unusual to compete for a contract award with a peer company and, simultaneously, perform as a supplier to or a customer of that same competitor on other contracts, or vice versa.
Geopolitical events and shifting executive and legislative branch priorities have resulted in an increase in opportunities over the past decade in areas matching our aerospace segment’s core capabilities in space hardware. The businesses include hardware and services sold primarily to U.S. customers, with emphasis on space science and exploration, climate monitoring, weather prediction, environmental and earth sciences, and defense and intelligence applications. Major activities frequently involve the design, manufacture and testing of satellites, remote sensors and ground station control hardware and software, as well as related services such as launch vehicle integration and satellite operations.
Other hardware activities include target identification, warning and attitude control systems and components; cryogenic systems for reactant storage, and associated sensor cooling devices; star trackers, which are general-purpose stellar attitude sensors; and fast-steering mirrors. Additionally, the aerospace segment provides diversified technical services
and productsBacklog represents the estimated transaction prices on performance obligations to government agencies, prime contractors and commercial organizationsour customers for a broad range of information warfare, electronic warfare, avionics, intelligence, training and space system needs.
Contracted backlogwhich work remains to be performed. Backlog in the aerospace segment was $1.75$2.5 billion and $1.4$2.4 billion at December 31, 20172021 and 2016,2020, respectively, and consisted of the aggregate contract value of firm orders, excluding amounts previously recognized as revenue. The 2017 contracted2021 backlog includes $844 million$1.3 billion expected to be recognized in revenues during 2018,2022, with the remainder expected to be recognized in revenues in the years thereafter. Unfunded amountsAmounts included in backlog for certain firm government orders, which are subject to annual funding, were $1.3$1 billion and $846 million$1.5 billion at December 31, 20172021 and 2016,2020, respectively. Year-over-year comparisons of backlog are not necessarily indicative of the trend of future operations, revenues and earnings due to the nature of varying delivery and milestone schedules on contracts, funding of programs and the uncertainty of timing of future contract awards. Uncertainties in the federal government budgeting process could delay the funding, or even result in cancellation of certain programs currently in our reported backlog.
Other
Other consists of a non-reportable segmentsoperating segment (beverage packaging, other) that manufactures and sells aluminum beverage containers in Africa,India, Saudi Arabia and Myanmar; a non-reportable segment that manufactures and sells extruded aluminum aerosol containers, recloseable aluminum bottles across multiple consumer categories and slugs (aerosol packaging); a non-reportable operating segment that manufactures and sells aluminum cups (aluminum cups); undistributed corporate expenses; intercompany eliminations and other business activities.
Beverage Packaging, Other
Our aluminum beverage packaging operations in the Middle East and Asia (AMEA) and Asia Pacific that manufacture and sell metal beverage containers.
AMEA
As part of the June 2016 Rexam acquisition, we added metal beverage container operations for the AMEA region, whichpackaging, other, segment consist of fivefour aluminum container and end manufacturing facilities–facilities – two in India and one each in Egypt, Saudi Arabia and Turkey. The manufacturing facility in Saudi Arabia, Rexam United Arab Can Manufacturing Limited, is a joint venture 51 percent owned by Ball and consolidated in our results. The beverage container market in these countries produced 24 billion cans in 2017, and we are one of four major producers in this region with 17 percent of shipments. Additionally, Ball has an ownership interest in an equity joint venture in South Korea.
In 2015, Rexam announced the establishment of a second metal beverage container facility in Sri City, India, near Chennai, which began production in the second quarter of 2017.
Asia Pacific
The metal beverage container market in the People’s Republic of China (PRC) is 41 billion containers, of which Ball’s operations represented an estimated 14 percent in 2017. Our percentage of the industry makes us one of the largest manufacturers of metal beverage containers in the PRC. We, along with five other manufacturers, account for 78 percent of the production. Our operations include the manufacture of aluminum containers and ends in four facilities in the PRC and one aluminum container facility in Myanmar. Our aluminum can and end sheet requirements are provided by several suppliers.
In May 2014, we announced the expansion of our Asian operations with the construction of a new one-line beverage can Our manufacturing facility in Myanmar, which began productionSaudi Arabia, Ball United Arab Can Manufacturing Company, is an investment 51 percent owned by Ball and consolidated in the second quarter of 2016.our results. Additionally, Ball has ownership interests in equity method investments in Vietnam. During 2021, Ball sold its minority-owned investment in South Korea. For additional details, refer to Note 4to the consolidated financial statements within Item 8 of this annual report
Aerosol Packaging
Our aluminum aerosol packaging operations manufacture and sell extruded aluminum aerosol containers, recloseable aluminum bottles across multiple consumer categories, and aluminum slugs, which represented less than 5 percent of Ball’s consolidated net sales in 2021. In 2020, Ball acquired an ownership interestaluminum aerosol packaging business in an equity joint ventureItupeva, Brazil, and in Vietnam2019, Ball sold its steel aerosol packaging business in Argentina. There are 9 manufacturing facilities that manufacture these products – four in Europe and one each in the U.S., Canada, Brazil, Mexico and India. The aerosol packaging market in these countries shipped approximately 5.8 billion aluminum aerosol units in 2021 and we are one of the major producers in this combined area with Thai Beverage Can Limited, which manufactures two-pieceshipments of 1.3 billion aluminum cansaerosol packaging containers, representing approximately 22 percent of total shipments in these markets. Our aluminum aerosol requirements are provided by several suppliers. In 2021, our aerosol business operations launched a new extruded, recloseable aluminum bottle line to provide a circular solution to plastic bottle pollution in personal care and endsother product categories.
Aluminum Cups
The Ball aluminum cups business serves the growing demand for beverages.innovative, sustainable beverage packaging among customers and consumers. Aligned with our Drive for 10 vision, the aluminum cups business leverages our years of experience and specialized expertise to provide another environmentally friendly offering to our industry-leading portfolio of aluminum packages. Sturdy, durable and cool to the touch, the infinitely recyclable Ball aluminum cup is produced at a dedicated manufacturing facility in Rome, Georgia. Ball plans to introduce additional offerings to round out its cups portfolio and intends to expand adoption of the cups to drinking establishments, parks and recreation, colleges and universities, hospitality, restaurants, retail, business and industry.
Patents
In the opinion of the company’s management, none of our active patents or groups of patents is material to the successful operation of our business as a whole. We manage our intellectual property portfolio to obtain the durations necessary to achieve our business objectives.
Research and Development
Research and development (R&D) efforts in our packaging segments are primarily directed toward packaging innovation, specifically the development of new features, sizes, shapes and types of containers, as well as new uses for existing containers. Other R&D efforts in these segments seek to improve manufacturing efficiencies and the overall sustainability of our products. Our packaging R&D activities are primarily conducted in a technical center located in Westminster, Colorado.
In our aerospace business, we continue to focus our R&D activities on the design, development and manufacture of innovative aerospace products and systems. This includes the production of spacecraft, instruments and sensors, radio frequency and system components, data exploitation solutions and a variety of advanced aerospace technologies and products that enable deep space missions. Our aerospace R&D activities are conducted at various locations in the U.S.
Additional information regarding company R&D activity is contained in Note 1 to the consolidated financial statements within Item 8 of this annual report, as well as in Item 2, “Properties.”Properties.
Sustainability
Sustainability is a key part of maximizing value at Ball. In our global operations, we focus our sustainability efforts on employee safety, energy, water, waste and air emissions. In addition to operational excellence, we identified product stewardship, talent management and community ambassadors as priorities for our corporate sustainability efforts. Information about our corporate sustainability management, goals and performance data are available at www.ball.com/sustainability.
By enhancing the unique sustainability credentials of our products along their life cycle, we position our metal containers as the most sustainable choice and help our customers grow their business. Because metal recycling saves resources and uses up to 20 times less energy than primary metal production, the biggest opportunity to further minimize the environmental impacts of metal packaging is to increase recycling rates. Aluminum and steel are infinitely recyclable materials. They also have the highest scrap value of all commonly used packaging substrates. In 2017, aluminum beverage cans were confirmed to be the most recycled beverage package in the world, with a global weighted average recycling rate for aluminum at 69 percent. In comparison, 43 percent of PET and 46 percent of glass bottles were collected for recycling, although not necessarily recycled. In some of Ball’s markets such as Brazil, China and several European countries, recycling rates for aluminum beverage cans are at or above 90 percent. The most recently available recycling rates in Europe are 73 percent for aluminum beverage containers in 2014 and 78 percent for steel containers in 2015. The most recently available recycling rates in the U.S. are 49 percent for aluminum beverage cans in 2016 and 71 percent for steel cans in 2014.
In markets where recycling rates are below expectations, we help establish and financially support packaging collection and recycling initiatives. These typically focus on collaborating with public and private partners to create effective collection and recycling systems, including education of consumers about the benefits of metal packaging. For details about programs we support, please visit www.ball.com/recycling.
Employee Relations
At the end of 2017, the company and its subsidiaries employed approximately 18,300 employees, including 8,100 employees in the U.S. Details of collective bargaining agreements are included within Item 1A, Risk Factors, of this annual report.
Where to Find More Information
Ball Corporation is subject to the reporting and other information requirements of the Securities Exchange Act of 1934, as amended (Exchange Act). Reports and other information filed with the Securities and Exchange Commission (SEC) pursuant to the Exchange Act may be inspected and copied at the public reference facility maintained by the SEC in Washington, D.C. The SEC maintains a website at www.sec.gov containing our reports, proxy materials and other items. The company also maintains a website at www.ball.com/investors on which it provides a link to access Ball’s SEC reports free of charge, under the link “Financials.”
The company has established written Ball Corporation Corporate Governance Guidelines; a Ball Corporation Executive Officers and Board of Directors Business Ethics Statement; a Business Ethics Code of Conduct; and charters for its Audit Committee, Nominating/Corporate Governance Committee, Human Resources Committee and Finance Committee. These documents are available on the company’s website at www.ball.com/investors, under the link “Corporate Governance.” A copy may also be obtained upon request from the company’s corporate secretary. The company’s sustainability report and updates on Ball’s progress are available at www.ball.com/sustainability.
The company intends to post on its website the nature of any amendments to the company’s codes of ethics that apply to executive officers and directors, including the chief executive officer, chief financial officer and controller, and the
nature of any waiver or implied waiver from any code of ethics granted by the company to any executive officer or director. These postings will appear on the company’s website at www.ball.com/investors, under the link “Corporate Governance.”
Nothing on our website, including postings to the “Corporate Governance” and “Financials” pages, or the Ball Corporation Sustainability Report, or sections thereof, shall be deemed incorporated by reference into this annual report.
Item 1A. Risk Factors
Any of the following risks could materially and adversely affect our business, financial condition or results of operations.operations, cash flows and financial condition.
General Risks
We may
If we do not realize all of the anticipated benefits of the acquisition of Rexam, or those benefits may take longer to realize than expected. We may also encounter significant unexpected difficulties in integrating the two businesses.effectively manage change and growth, our business could be adversely affected.
Our ability to realize the anticipated benefits of the acquisition of Rexamfuture revenue and operating results will depend to a large extent, on our ability to integrate our beverage packaging business with Rexam’s business. Combining two independent businesses is a complex, costly and time-consuming process. As a result, we are required to devote significant management attention and resources to integrating the business practices and operations of the company and the Rexam business we acquired. The integration process may disrupt the combined business and, if implemented ineffectively, could preclude the realization of the full benefits of the acquisition that are currently expected. Our failure to meet the challenges involved in integrating the two businesses and to realizeeffectively manage the anticipated benefitsgrowth of the acquisition could cause an interruption of, or a loss of momentumour business. We have experienced significant growth in the activities of the companydemand for our products and could adversely affect the company’s results of operations. In addition, the overall integration of the businessesservices in recent years and are expanding our operations, increasing our headcount and expanding into new product offerings. This growth has increased and may result in material unanticipated problems, expenses, liabilities, competitive responses, loss of customer relationshipscontinue to constrain our ability to fully supply our customers’ requirements. It has also placed significant demands on our management as well as our financial and diversion of management’s attention. The possible difficulties of combining the operations of the companies also include, among others:operational resources, and continued growth presents several challenges, including:
| ·
● | | difficulties in achieving anticipated cost savings, synergies, business opportunitiesexpanding manufacturing capacity, maintaining quality and growth prospects from combining our business with that of Rexam;
increasing production; |
| ·
● | | difficulties in integrating operations, business practices and systems;
|
| ·
| | difficulties in assimilatingidentifying, attracting and retaining employees;
qualified personnel; |
| ·
● | | difficulties in managing the expanded operations of a significantly largerdeveloping and more complex combined company;
retaining our global sales, marketing and administrative infrastructure and capabilities; |
| ·
● | | challenges in retaining existing customers and suppliers;
|
| ·
| | challenges in obtaining new customers and suppliers;
|
| ·
| | potential unknown liabilities and unforeseen increased expenses associated with the acquisition; and
|
| ·
| | challenges in retaining and attracting key personnel.
|
Many of these factors are or will be outside of our control and any one of them could result in increased costs, decreases in the amount of expected revenues and diversion of management’s time and energy, which could materially impact the business, financial condition and results of operations of the company. In addition, even if the operations of the businesses of the company and Rexam are integrated successfully, we may not realize the full benefits of the acquisition, including the synergies, cost savings or sales or growth opportunities that we expect, or the full benefits may not be achieved within the anticipated time frame, or at all. Additional unanticipated costs may be incurred in the integration of the businesses of the company and Rexam. All of these factors could adversely affect the earnings of the company, decrease or delay the expected accretive effect of the acquisition, or negatively impact the price of the company’s common stock. As a result, we cannot assure that the combination of the company’s and Rexam’s beverage packaging businesses will result in the realization of the full benefits anticipated from the acquisition.
In connection with satisfying requirements under the antitrust laws of the U.S., the European Union and Brazil, and obtaining associated approvals and clearances, we were required to effect significant divestitures. As a result of the required divestitures, we may not realize all or a significant portion of the anticipated benefits of the Rexam acquisition, including anticipated synergies, and the company may otherwise suffer other negative consequences that may materially and adversely affect the company’s business, financial condition and results of operations and, to the extent that the current price of the company’s common stock reflects an assumption that the anticipated benefits of the acquisition will be realized, the price per share for the company’s common stock could be negatively impacted.
We have a significant level of debt that could have important consequences for our business and any investment in our securities.
The company had $7 billion of interest-bearing debt at December 31, 2017. Such indebtedness could have significant consequences for our business and any investment in our securities, including:
| ·
| | increasing our vulnerability to adverse economic, industry or competitive developments; regulatory compliance capabilities, particularly in new lines of business; |
| ·
● | | requiring morebuilding out our expertise in a number of our cash flows from operations to be dedicated to the payment of principaldisciplines, including marketing, licensing, and interest on our indebtedness, limiting our cash flow available to fund our operations, capital expendituresmerchandising; and future business opportunities or returning additional cash to our shareholders;
|
| ·
● | | restricting us from making additional acquisitions;
implementing appropriate operational, financial and IT systems and internal controls. |
| ·
| | limiting our ability to obtain additional financing for working capital, capital expenditures, product development, debt service requirements, acquisitions and general corporate or other purposes; and
|
| ·
| | limiting our flexibility in planning for, or reacting to, changes in our business or market conditions and placing us at a competitive disadvantage compared to our competitors who may be less leveraged and who, therefore, may be able to take advantage of opportunities that our leverage prevents us from exploiting.
|
Our business, operating results and financial condition are subject to particular risks in certain regions of the world.
We may experience an operating loss in one or more regions of the world for one or more periods, which could have a material adverse effect on our business, operating results or financial condition. Moreover, overcapacity, which often leads to lower prices, existsmay develop over time in certain regions in which we operate and may persist even if demand grows.continues to grow. More generally, supply and demand fluctuations could make it difficult for us to forecast and meet certain customers’ needs. Our ability to manage such operational fluctuations and to maintain adequate long-term strategies in the face of such developments will be critical to our continued growth and profitability.
The loss of a key customer, or a reduction in its requirements, could have a significant negative impact on our sales.
We sell a majority of our packaging products to a relatively limited number of major beverage, packaged food, personal care and household product companies, some of which operate in multiple geographical markets we serve.
Although the majority of our customer contracts are long-term, these contracts, unless they are renewed, expire in accordance with their respective terms and are terminable under certain circumstances, such as our failure to meet quality, volume or market pricing requirements. Because we depend on a relatively limited number of major customers, our business, financial condition or results of operations could be adversely affected by the loss of any of these customers, a reduction in the purchasing levels of these customers, a strike or work stoppage by a significant number of these customers’ employees or an adverse change in the terms of the supply agreements with these customers.
The primary customers for our aerospace segment are U.S. government agencies or their prime contractors. Our contracts with these customers are subject to several risks, including funding cuts and delays, technical uncertainties, budget changes, government shutdowns, competitive activity and changes in scope.
We have a significant level of debt that could have important consequences for our business and any investment in our securities.
The company had $7.8 billion of interest-bearing debt at December 31, 2021. Such indebtedness could have significant consequences for our business and any investment in our securities, including:
| ● | increasing our vulnerability to adverse economic, industry or competitive developments; |
| ● | requiring more of our cash flows from operations to be dedicated to the payment of principal and interest on our indebtedness, thus limiting our cash flow available to fund our operations, capital expenditures and future business opportunities or the return of cash to our shareholders; |
| ● | restricting us from making additional acquisitions; |
| ● | limiting our ability to obtain additional financing for working capital, capital expenditures, product development, debt service requirements, acquisitions and general corporate or other purposes; and |
| ● | limiting our flexibility in planning for, or reacting to, changes in our business or market conditions and placing us at a competitive disadvantage compared to our competitors who may be less leveraged and who, therefore, may be able to take advantage of opportunities that our leverage prevents us from exploiting. |
We face competitive risks from many sources that may negatively impact our profitability.
Competition within the packaging and aerospace industries is intense. Increases in productivity, combined with existing or potential surplus capacity in the industry, have maintained competitive pricing pressures. The principal methods of competition in the general packaging industry are price, innovation, sustainability, service and quality. In the aerospace industry, they are technical capability, cost and schedule. Some of our competitors may have greater financial, technical and marketing resources, and some may currently have significant excess capacity. Our current or potential competitors may offer products at a lower price or products that are deemed superior to ours. The global economic environment has resulted in reductions in demand for our products in some instances, which, in turn, could increase these competitive pressures.
We are subject to competition from alternative products, which could result in lower profits and reduced cash flows.
Our metalaluminum packaging products are subject to significant competition from substitute products, particularly plastic carbonated soft drink bottles made from PET, single serve beer bottles and other food and beverage containers made of glass, cardboard or other materials. Competition from plastic carbonated soft drink bottles is particularly intense in the U.S., Europe and the PRC.Europe. Certain of our aerospace products are also subject to competition from alternative products
and solutions. There can be no assurance that our products will successfully compete against alternative products, which could result in a reduction in our profits or cash flow.flows.
Our packaging businesses have a narrow product range, and our business would suffer if usage of our products decreased or if decreases occur in the demand for the beverages food and other goods filled in our products.
For the year ended December 31, 2017, 81 percentThe majority of our consolidated net sales were from the sale of beverage containers, and we expect to derive a significant portion of our future revenues and cash flows from the sale of beverage containers. Our business would suffer if the use of beverage containers decreased. Accordingly, broad acceptance by consumers of aluminum and steel containers for a wide variety of beverages is critical to our future success. If demand for glass and PET bottles increases relative to metalaluminum containers, or the demand for aluminum and steel containers does not develop as expected, our business, financial condition or results of operations, cash flows and financial condition could be materially adversely affected.
Our business, financial condition, cash flows and results of operations are subject to risks resulting from broader geographic operations.
We derived approximately 47 percent of our consolidated net sales from outside of the U.S. for the year ended December 31, 2021. The sizeable scope of operations inside and outside of the U.S. may lead to more volatile financial results and make it more difficult for us to manage our business. Reasons for this include, but are not limited to, the following:
| ● | political and economic instability; |
| ● | governments’ restrictive trade policies; |
| ● | the imposition or rescission of duties, taxes or government royalties; |
| ● | inflation of direct input costs; |
| ● | virus and disease outbreaks and responses thereto; |
| ● | difficulties in enforcement of contractual obligations and intellectual property rights; and |
| ● | the geographic, language and cultural differences between personnel in different areas of the world. |
We are exposed to exchange rate fluctuations.
The company’s financial results are exposed to currency exchange rate fluctuations and a significant proportion of assets, liabilities and earnings denominated in non-U.S. dollar currencies. The company presents its financial statements in U.S. dollars and has a significant proportion of its net assets, debt and income in non-U.S. dollar currencies, primarily the euro, as well as the Russian ruble and other emerging market currencies. The company’s financial results and capital ratios are therefore sensitive to movements in currency exchange rates.
We manage our exposure to currency fluctuations, particularly our exposure to fluctuations in the euro to U.S. dollar exchange rate to attempt to mitigate the effect of cash flow and earnings volatility associated with exchange rate changes. We primarily use forward contracts and options to manage our currency exposures and, as a result, we experience gains and losses on these derivative positions which are offset, in part, by the impact of currency fluctuations on existing assets and liabilities.
We are vulnerable to fluctuations and disruptions in the supply and price of raw materials.
We purchase aluminum and other raw materials and packaging supplies, including dunnage, from several sources. While all such materials and supplies are available from independent suppliers, they are subject to fluctuations in price and availability attributable to a number of factors, including general economic conditions, commodity price fluctuations (particularly aluminum on the London Metal Exchange), the demand by other industries for the same raw materials and the availability of complementary and substitute materials. Although we enter into commodities purchase agreements from time to time and sometimes use derivative instruments to seek to manage our risk, we cannot ensure that our current suppliers of raw materials will be able to supply us with sufficient quantities at reasonable prices. Economic, financial, and operational factors, including strikes or labor shortages, as well as governmental action, could impact our suppliers, thereby causing supply shortages. Increases in raw material costs, including potential increases due to tariffs, sanctions, or other trade actions, could have a material adverse effect on our business, financial condition or results of operations. Global supply chain disruptions can negatively impact our results. In the Americas, Europe and Asia, some contracts do not allow us to pass along increased raw material costs and we generally use derivative agreements to seek to manage this risk. Our hedging procedures may be insufficient and our results could be materially impacted if costs of materials increase. Due to the fixed-price contracts, increased prices could decrease our sales volume over time. The delayed timing in recovering the pass-through of increasing raw material costs may also impact our short-term profitability and certain costs due to price increases or supply chain inefficiencies may be unrecoverable, which would also impact our profitability. In addition, in view of recent increases in our raw material and other production costs, we initiated a comprehensive cost pass-through program across all our businesses last year, which is ongoing, to seek to recover from our customers the full amount of those cost increases over time.
We use estimates in accounting for many of our programs in our aerospace business, and changes in our estimates could adversely affect our future financial results.
We account for sales and profits on a portion of long-term contracts in our aerospace business in accordance with the percentage-of-completion method of accounting, using the cost-to-cost method to account for updates in estimates. The percentage-of-completion method of accounting involves the use of various estimating techniques to project revenues and costs at completion and various assumptions and projections related to the outcome of future events, including the quantity and timing of product deliveries, future labor performance and rates, and material and overhead costs. These assumptions involve various levels of expected performance improvements. Under the cost-to-cost method, the impact of updates in our estimates related to units shipped to date or progress made to date is recognized immediately.
Given the significance of the judgments and estimates described above, it is likely that we could record materially different amounts if we used different assumptions or if the underlying circumstances or estimates were to change.
Our backlog includes both cost-type and fixed-price contracts. Cost-type contracts generally have lower profit margins than fixed-price contracts. Our earnings and margins may vary depending on the types of government contracts undertaken, the nature of the work performed under those contracts, the costs incurred in performing the work, the achievement of other performance objectives and their impact on our ability to receive fees. The fixed-price contracts could subject us to losses if we have cost overruns or if increases in our costs exceed the applicable escalation rate.
Net earnings and net assets could be materially affected by an impairment of goodwill.
We have a significant amount of goodwill recorded on our consolidated balance sheet as of December 31, 2021. We are required at least annually to test the recoverability of goodwill. The recoverability test of goodwill is based on the current fair value of our identified reporting units. Fair value measurement requires assumptions and estimates of many critical factors, including revenue and market growth, operating cash flows and discount rates. If general market conditions deteriorate in portions of our business, we could experience a significant decline in the fair value of our reporting units. This decline could lead to an impairment of all or a significant portion of the goodwill balance, which could materially affect our U.S. GAAP net earnings and net assets.
If the investments in Ball’s pension plans, or in the multi-employer pension plans in which Ball participates, do not perform as expected, we may have to contribute additional amounts to the plans, which would otherwise be available for other general corporate purposes.
Ball maintains defined benefit pension plans covering substantially all of its employees in the United States and a significant number of United Kingdom deferred and retired participants, which are funded based on certain actuarial assumptions. The plans’ assets consist primarily of common stocks, fixed-income securities and, in the U.S., alternative investments. Market declines, longevity increases or legislative changes, such as the Pension Protection Act in the U.S., could result in a prospective decrease in our available cash flow and net earnings over time, and the recognition of an increase in our pension obligations could result in a reduction to our shareholders’ equity. Additional risks exist related to the company’s participation in multi-employer pension plans. Assets contributed to a multi-employer pension plan by one employer may be used to provide benefits to employees of other participating employers. If a participating employer in a multi-employer pension plan stops contributing to the plan, the unfunded obligations of the plan may be borne by the remaining participants. This could result in increases to our contributions to the plans as well as pension expense.
Restricted access to capital markets could adversely affect our short-term liquidity and prevent us from fulfilling our obligations under the notes issued pursuant to our bond indentures.
A reduction in global market liquidity could:
| ● | restrict our ability to fund working capital, capital expenditures, research and development expenditures and other business activities; |
| ● | increase our vulnerability to general adverse economic and industry conditions, including the credit risks stemming from the economic environment; |
| ● | limit our flexibility in planning for, or reacting to, changes in our businesses and the industries in which we operate; |
| ● | restrict us from making strategic acquisitions or exploiting business opportunities; and |
| ● | limit, along with the financial and other restrictive covenants in our debt, among other things, our ability to borrow additional funds, dispose of assets, pay cash dividends or refinance debt maturities. |
If market interest rates increase, our variable-rate debt will create higher debt service requirements, which adversely affects our cash flows. While we sometimes enter into agreements limiting our exposure, any such agreements may not offer complete protection from this risk.
The global credit, financial and economic environment could have a negative impact on our results of operations, financial position or cash flows.
The overall credit, financial and economic environment could have significant negative effects on our operations, including:
| ● | the creditworthiness of customers, suppliers and counterparties could deteriorate resulting in a financial loss or a disruption in our supply of raw materials; |
| ● | volatile market performance could affect the fair value of our pension assets, potentially requiring us to make significant additional contributions to our defined benefit pension plans to maintain prescribed funding levels; |
| ● | a significant weakening of our financial position or operating results could result in noncompliance with our debt covenants; and |
| ● | reduced cash flows from our operations could adversely affect our ability to execute our long-term strategy to increase liquidity, reduce debt, repurchase our stock and invest in our businesses. |
Changes in U.S. generally accepted accounting principles (U.S. GAAP) and SEC rules and regulations could materially impact our reported results.
U.S. GAAP and SEC accounting and reporting changes are common. These changes could have significant effects on our reported results when compared to prior periods and other companies and may even require us to retrospectively adjust prior periods. Additionally, material changes to the presentation of transactions in the consolidated financial statements could impact key ratios that analysts and credit rating agencies use to rate Ball and ultimately impact our ability to access the credit markets in an efficient manner.
A material weakness in our internal control over financial reporting could, if not remediated, result in material misstatements in our financial statements.
Management is responsible for establishing and maintaining adequate internal control over financial reporting, as defined in Rule 13a-15(f) under the Securities Exchange Act. A material weakness is defined as a deficiency, or combination of deficiencies, in internal control over financial reporting, such that there is a reasonable possibility that a material misstatement of annual or interim financial statements will not be prevented or detected on a timely basis. If a material weakness is identified, management could conclude that internal control over financial reporting is not effective based on criteria set forth by the Committee of Sponsoring Organization of the Treadway Commission in “Internal Control—An Integrated Framework (2013).” If a material weakness is identified, a remediation plan would be designed to address the material weakness. If remedial measures are insufficient to address the material weakness, or if additional material weaknesses in internal control are discovered or occur in the future, our consolidated financial statements may contain material misstatements and we could be required to restate our financial results. As of December 31, 2021, the company had no material weaknesses.
We face risks related to health epidemics, pandemics and other outbreaks, including the ongoing COVID-19 pandemic, which could adversely affect our business.
The circumstances of the ongoing COVID-19 pandemic and responses thereto continue to evolve. The products produced and services provided by Ball have been deemed essential and, as a result, relevant governments around the world have allowed our operations to continue through this crisis. Additionally, overall demand for our aluminum beverage cans has remained high and has increased during the pandemic. However, COVID-19 and its related variants could give rise to circumstances that cause one or more of the following risk factors to occur:
| ● | We could lose key customers, customers could become insolvent or have a reduction in demand for our products and services; |
| ● | We could be subject to changes in laws and governmental regulations that adversely affect our business and operations; |
| ● | We could be subject to adverse fluctuations in currency exchange rates; |
| ● | We might lose key management and operating personnel; |
| ● | We may be subject to disruptions in the supply or price of our raw materials; |
| ● | We may face prolonged work stoppages at our facilities; |
| ● | We may be impacted by government budget constraints or government shutdowns; |
| ● | Our pension plan investments may not perform as expected, and we may be required to make additional contributions to our pension plans which would otherwise be available for other general corporate purposes; |
| ● | Our access to capital markets may be restricted, which could adversely affect our short-term liquidity and prevent us from fulfilling our obligations under the notes issued pursuant to our bond indentures; |
| ● | We may be subject to increased information technology (IT) security threats and reduced network access availability; |
| ● | Our operations and those of our principal customers and suppliers could be designated as non-essential in key markets; and |
| ● | A material weakness in our internal control over financial reporting or a material misstatement in our financial statements could occur. |
Because the COVID-19 pandemic is far-reaching and its impacts cannot be completely anticipated, additional risks may arise that could materially impact the company’s financial results and liquidity.
The company has or may implement actions to minimize the risks and associated negative effects from COVID-19, which do not guarantee the prevention or mitigation of material impacts on our business. Some of these actions may include, and are not limited to:
| ● | Implementing alternative work arrangements including work from home; |
| ● | Limiting or eliminating work-related travel; |
| ● | Effecting a full or partial shut-down of operations; |
| ● | Enhancing the cleaning and disinfecting of our physical locations; |
| ● | Implementing health screening for employees and third parties who enter our facilities; |
| ● | Adjusting inventory levels to mitigate potential supply disruptions; |
| ● | Modifying payment terms with customers; |
| ● | Providing additional health-related services to our employees; |
| ● | Reducing compensation for our employees; |
| ● | Reducing our workforce levels; |
| ● | Modifying our debt arrangements; and |
| ● | Adjusting contributions to defined benefit pension plans or income tax payments. |
Governmental and regulatory risks
Changes in laws and governmental regulations may adversely affect our business and operations.
We and our customers and suppliers are subject to various federal, state, provincial and local laws and regulations, which have been increasing in number and complexity. Each of our, and their, facilities is subject to federal, state, provincial and local licensing and regulation by health, environmental, workplace safety and other agencies in multiple jurisdictions. Requirements of worldwide governmental authorities with respect to manufacturing, manufacturing facility locations within the jurisdiction, product content and safety, climate change, workplace safety and health, environmental, expropriation of assets and other standards could adversely affect our ability to manufacture or sell our products, and the ability of our customers and suppliers to manufacture and sell their products. In addition, we face risks arising from compliance with and enforcement of numerous and complex federal, state, provincial and local laws and regulations.
Enacted regulatory developments regarding the reporting and use of “conflict minerals” mined from the Democratic Republic of the Congo and adjoining countries could affect the sourcing, availability and price of minerals used in the manufacture of certain of our products. As a result, there may only be a limited pool of suppliers who provide conflict-free materials, and we cannot give assurance that we will be able to obtain such products in sufficient quantities or at competitive prices. Also, because our supply chains are complex, we may face reputational challenges with our customers and other stakeholders if we are unable to sufficiently verify the origins of all materials used in the products that we sell. The compliance and reporting aspects of these regulations may result in incremental costs to the company. While deposit systems and other container-related legislation have been adopted in some jurisdictions, similar legislation has been defeated in public referenda and legislative bodies in many others. We anticipate that continuing efforts will be made to consider and adopt such legislation in the future. The packages we produce are widely used and perform well in U.S. states, Canadian provinces and European countries that have deposit systems, as well as in other countries worldwide.
Significant environmental, employment-related and other legislation and regulatory requirements exist and are also evolving. The compliance costs associated with current and proposed laws and potential regulations could be substantial, and any failure or alleged failure to comply with these laws or regulations could lead to litigation or governmental action, all of which could adversely affect our financial condition or results of operations.
Our business, financial condition and results of operations are subject to risks resulting from broader geographic operations.
We derived 50 percent of our consolidated net sales from outside of the U.S. for the year ended December 31, 2017. The sizeable scope of operations outside of the U.S. may lead to more volatile financial results and make it more difficult for us to manage our business. Reasons for this include, but are not limited to, the following:
| ·
| | political and economic instability;
|
| ·
| | governments’ restrictive trade policies;
|
| ·
| | the imposition or rescission of duties, taxes or government royalties;
|
| ·
| | difficulties in enforcement of contractual obligations and intellectual property rights; and
|
| ·
| | the geographic, language and cultural differences between personnel in different areas of the world.
|
Any of these factors, many of which are present in both the U.S. and other countries, could materially adversely affect our business, financial condition or results of operations.
We are exposed to exchange rate fluctuations.
The financial results of the company are exposed to currency exchange rate fluctuations and an increased proportion of assets, liabilities and earnings denominated in non-U.S. dollar currencies. The company presents its financial statements in U.S. dollars and has a significant proportion of its net assets, debt and income in non-U.S. dollar currencies, primarily the euro, as well as the Russian ruble and other emerging market currencies. The company’s financial results and capital ratios are therefore sensitive to movements in foreign exchange rates.
We manage our exposure to currency fluctuations, particularly our exposure to fluctuations in the euro to U.S. dollar exchange rate to attempt to mitigate the effect of cash flow and earnings volatility associated with exchange rate changes. We primarily use forward contracts and options to manage our currency exposures and, as a result, we experience gains and losses on these derivative positions offset, in part, by the impact of currency fluctuations on existing assets and liabilities. Our inability to properly manage our exposure to currency fluctuations could materially impact our results.
If we fail to retain key management and personnel, we may be unable to implement our key objectives.
We believe our future success depends, in part, on our experienced management team. Unforeseen losses of key members of our management team without appropriate succession and/or compensation planning could make it difficult for us to manage our business and meet our objectives.
Decreases in our ability to develop or apply new technology and know-how may affect our competitiveness.
Our success depends partially on our ability to improve production processes and services. We must also introduce new products and services to meet changing customer needs. If we are unable to implement better production processes or to develop new products through research and development or licensing of new technology, we may not be able to remain competitive with other manufacturers. As a result, our business, financial condition or results of operations could be adversely affected.
Adverse weather and climate changes may result in lower sales.
We manufacture packaging products primarily for beverages and foods. Unseasonably cool weather can reduce demand for certain beverages packaged in our containers. In addition, poor weather conditions or changes in climate that reduce crop yields of fruits and vegetables can adversely affect demand for our food containers. Climate change could have various effects on the demand for our products and the costs of inputs to our production in different regions around the world.
We are vulnerable to fluctuations in the supply and price of raw materials.
We purchase aluminum, steel and other raw materials and packaging supplies from several sources. While all such materials are available from independent suppliers, raw materials are subject to fluctuations in price and availability attributable to a number of factors, including general economic conditions, commodity price fluctuations (particularly aluminum on the London Metal Exchange), the demand by other industries for the same raw materials and the availability of complementary and substitute materials. Although we enter into commodities purchase agreements from time to time and sometimes use derivative instruments to seek to manage our risk, we cannot ensure that our current suppliers of raw materials will be able to supply us with sufficient quantities at reasonable prices. Economic and financial factors could impact our suppliers, thereby causing supply shortages. Increases in raw material costs could have a material adverse effect on our business, financial condition or results of operations. In the Americas, Europe and Asia, some contracts do not allow us to pass along increased raw material costs and we generally use derivative agreements to seek to manage this risk. Our hedging procedures may be insufficient and our results could be materially impacted if costs of materials increase. Due to the fixed-price contracts and derivative activities, while increasing raw material costs may not impact our near-term profitability, increased prices could decrease our sales volume over time.
Prolonged work stoppages at facilities with union employees could jeopardize our financial position.
As of December 31, 2017, 22 percent of our North American packaging facility employees and 59 percent of our European employees were covered by collective bargaining agreements. These collective bargaining agreements have staggered expirations during the next several years. Although we consider our employee relations to be generally good, a prolonged work stoppage or strike at any facility with union employees could have a material adverse effect on our business, financial condition or results of operations. In addition, we cannot ensure that upon the expiration of existing collective bargaining agreements, new agreements will be reached without union action or that any such new agreements will be on terms satisfactory to us.
Our aerospace segment is subject to certain risks specific to that business.
In our aerospace business, U.S. government contracts are subject to reduction or modification in the event of changes in requirements, and the government may also terminate contracts at its convenience pursuant to standard termination provisions. In such instances, Ball may be entitled to reimbursement for allowable costs and profits on authorized work that has been performed through the date of termination.
In addition, budgetary constraints and government shutdowns may result in further reductions to projected spending levels by the U.S. government. In particular, government expenditures are subject to the potential for automatic reductions, generally referred to as “sequestration.” Sequestration may occur in any given year, resulting in significant additional reductions to spending by various U.SU.S. government defense and aerospace agencies on both existing and new contracts, as well as the disruption of ongoing programs. Even if sequestration does not occur, we expect that budgetary constraints and ongoing concerns regarding the U.S. national debt will continue to place downward pressure on agency spending levels. Due to these and other factors, overall spending on various programs could decline, which could result in significant reductions to revenue, cash flows, net earnings and backlog primarily in our aerospace segment.
We use estimates in accounting for many19
We account for sales and profits on the majority of long-term contracts in our aerospace business in accordance with the percentage-of-completion method of accounting, using the cumulative catch-up method to account for updates in estimates. The percentage-of-completion method of accounting involves the use of various estimating techniques to project revenues and costs at completion and various assumptions and projections relative to the outcome of future events, including the quantity and timing of product deliveries, future labor performance and rates, and material and overhead costs. These assumptions involve various levels of expected performance improvements. Under the cumulative catch-up method, the impact of updates in our estimates related to units shipped to date is recognized immediately.
Because of the significance of the judgments and estimates described above, it is likely that we could record materially different amounts if we used different assumptions or if the underlying circumstances or estimates were to change. Accordingly, updates in underlying assumptions, circumstances or estimates may materially affect our future financial performance.
Our backlog includes both cost-type and fixed-price contracts. Cost-type contracts generally have lower profit margins than fixed-price contracts. Our earnings and margins may vary depending on the types of government contracts undertaken, the nature of the work performed under those contracts, the costs incurred in performing the work, the achievement of other performance objectives and their impact on our ability to receive fees. The fixed-price contracts could subject us to losses if we have cost overruns or if increases in our costs exceed the applicable escalation rate.
As a U.S. government contractor, we could be adversely affected by changes in regulations or any negative findings from a U.S. government audit or investigation.
Our aerospace business operates in a highly regulated environment and is routinely audited and reviewed by the U.S. government and its agencies, such as the Defense Contract Audit Agency (DCAA) and Defense Contract Management Agency (DCMA). These agencies review performance under our contracts, our cost structure and our compliance with applicable laws, regulations and standards, as well as the adequacy of, and our compliance with, our internal control systems and policies. Business systems that are subject to review under the DoD Federal Acquisition Regulation Supplement (DFARS) are purchasing, estimating, material management and accounting, as well as property and earned value management. Any costs ultimately found to be unallowable or improperly allocated to a specific contract will not
be reimbursed or must be refunded if already reimbursed. If an audit uncovers improper or illegal activities, we may be subject to civil and criminal penalties, sanctions or suspension or debarment from doing business with the U.S. government. Whether or not illegal activities are alleged, the U.S. government also has the ability to decrease or withhold certain payments when it deems systems subject to its review to be inadequate. If such actions were to result in suspension or debarment, this could have a material adverse effect on our business.
Our business is subject to substantial environmental remediation and compliance costs.
Our operations are subject to federal, state, provincial and local laws and regulations in multiple jurisdictions relating to environmental hazards, such as emissions to air, discharges to water, the handling and disposal of hazardous and solid wastes and the clean-up of hazardous substances. We have been designated, along with numerous other companies, as a potentially responsible party for the clean-up of several hazardous waste sites. Based on available information, we do not believe that any costs incurred in connection with such sites will have a material adverse effect on our financial condition, results of operations, capital expenditures or competitive position. There is increased focus on the regulation of greenhouse gas emissions and other environmental issues worldwide.
Our business faces the potential of increased regulation on some of the raw materials utilized in our packaging operations.
Our operations are subject to federal, state, provincial and local laws and regulations in multiple jurisdictions relating to some of the raw materials, such asincluding epoxy-based coatings utilized in our container making process. Epoxy-based coatings may contain Bisphenol-A (BPA). Scientific evidence evaluated by regulatory agencies in the U.S., Canada, Europe, Japan, Australia and New Zealand has consistently shown these coatings to be safe for food contact at current levels, and these regulatory agencies have stated that human exposure to BPA from epoxy-based container coatings is well below safe exposure limits set by government bodies worldwide. A significant change in these regulatory agency statements, adverse information concerning BPA or other chemicals present in our coatings, or rulings made within certain federal, state, provincial and local jurisdictions could have a material adverse effect on our business, financial condition or results of operations. Ball recognizes that significant interest exists in non-epoxy based coatings, and we have been proactively working with coatings suppliers and our customers to evaluate alternativestransition to currentalternative coatings.
Net earnings and net assets could be materially affected by an impairment of goodwill.
We have a significant amount of goodwill recorded on the consolidated balance sheet as of December 31, 2017. We are required at least annually to test the recoverability of goodwill. The recoverability test of goodwill is based on the current fair value of our identified reporting units. Fair value measurement requires assumptions and estimates of many critical factors, including revenue and market growth, operating cash flows and discount rates. If general market conditions deteriorate in portions of our business, we could experience a significant decline in the fair value of reporting units. This decline could lead to an impairment of all or a significant portion of the goodwill balance, which could materially affect our U.S. GAAP net earnings and net assets. We continue to see the industry supply of beverage packaging exceed demand in China, resulting in significant pricing pressure and negative impacts on the profitability of our beverage packaging, Asia Pacific, reporting unit. If it becomes an expectation that this situation will continue for an extended period of time, it may result in a noncash impairment of some or all of the goodwill associated with this reporting unit, totaling $78 million at December 31, 2017. The company’s annual goodwill impairment test completed in the fourth quarter of 2017 indicated the estimated fair value of the beverage packaging, Asia Pacific, reporting unit exceeded its carrying amount, including goodwill, by 24 percent.
If the investments in Ball’s pension plans, or in the multi-employer pension plans in which Ball participates, do not perform as expected, we may have to contribute additional amounts to the plans, which would otherwise be available for other general corporate purposes.
Ball maintains defined benefit pension plans covering substantially all of its North American and United Kingdom employees, which are funded based on certain actuarial assumptions. The plans’ assets consist primarily of common stocks, fixed-income securities and, in the U.S., alternative investments. Market declines, longevity increases or legislative changes, such as the Pension Protection Act in the U.S., could result in a prospective decrease in our available cash flow and net earnings over time, and the recognition of an increase in our pension obligations could result in a reduction to our shareholders’ equity. Additional risks exist related to the company’s participation in multi-employer pension plans. Assets contributed to a multi-employer pension plan by one employer may be used to provide benefits to employees of other participating employers. If a participating employer in a multi-employer pension plan stops
contributing to the plan, the unfunded obligations of the plan may be borne by the remaining participants. This could result in increases to our contributions to the plans as well as pension expense.
Restricted access to capital markets could adversely affect our short-term liquidity and prevent us from fulfilling our obligations under the notes issued pursuant to our bond indentures.
A reduction in global market liquidity could:
| ·
| | restrict our ability to fund working capital, capital expenditures, research and development expenditures and other business activities;
|
| ·
| | increase our vulnerability to general adverse economic and industry conditions, including the credit risks stemming from the economic environment;
|
| ·
| | limit our flexibility in planning for, or reacting to, changes in our businesses and the industries in which we operate;
|
| ·
| | restrict us from making strategic acquisitions or exploiting business opportunities; and
|
| ·
| | limit, along with the financial and other restrictive covenants in our debt, among other things, our ability to borrow additional funds, dispose of assets, pay cash dividends or refinance debt maturities.
|
If market interest rates increase, our variable-rate debt will create higher debt service requirements, which would adversely affect our cash flow. While we sometimes enter into agreements limiting our exposure, any such agreements may not offer complete protection from this risk.
The global credit, financial and economic environment could have a negative impact on our results of operations, financial position or cash flows.
The overall credit, financial and economic environment could have significant negative effects on our operations, including:
| ·
| | the creditworthiness of customers, suppliers and counterparties could deteriorate resulting in a financial loss or a disruption in our supply of raw materials;
|
| ·
| | volatile market performance could affect the fair value of our pension assets, potentially requiring us to make significant additional contributions to our defined benefit pension plans to maintain prescribed funding levels;
|
| ·
| | a significant weakening of our financial position or operating results could result in noncompliance with our debt covenants; and
|
| ·
| | reduced cash flow from our operations could adversely affect our ability to execute our long-term strategy to increase liquidity, reduce debt, repurchase our stock and invest in our businesses.
|
Changes in U.S. generally accepted accounting principles (U.S. GAAP) and SEC rules and regulations could materially impact our reported results.
U.S. GAAP and SEC accounting and reporting changes are common and have become more frequent and significant over the past several years. These changes could have significant effects on our reported results when compared to prior periods and other companies and may even require us to retrospectively adjust prior periods. Additionally, material changes to the presentation of transactions in the consolidated financial statements could impact key ratios that analysts and credit rating agencies use to rate Ball and ultimately impact our ability to access the credit markets in an efficient manner.
Earnings and cash flows can be impacted by changes in tax laws.
As a U.S.-based multinational business, the company is subject to income tax in the U.S. and numerous jurisdictions outside the U.S. The relevant tax rules and regulations are complex, often changing and, in some cases, are interdependent. If these or other tax rules and regulations should change, the company’s earnings and cash flows could be impacted.
In particular, the U.S. Tax Cuts and Jobs Act (the Act), which was signed into law on December 22, 2017, may result in fluctuations in the company’s net earnings and cash flows. The Act introduced major changes to U.S. income tax law
that require significant judgment to interpret the impact of the provisions of the Act on the company’s financial results.
Due to the timing of its enactment and the complexity associated with the provisions of the Act, the company has made reasonable estimates of its effects where possible and has recorded provisional estimates in its financial statements for the year ended December 31, 2017. The Internal Revenue Service and the U.S. Treasury Department may issue subsequent guidance on the provisions of the Act that differs from our current interpretations. As we continue to collect data, prepare analyses, and interpret additional guidance provided by standard-setting bodies, we may make adjustments to these provisional estimates that could materially affect the company’s financial results.
The company’s worldwide provision for income taxes is determined, in part, through the use of significant estimates and judgments. Numerous transactions arise in the ordinary course of business where the ultimate tax determination is uncertain. The company undergoes tax examinations by various worldwide tax authorities on a regular basis. While the company believes its estimates of its tax obligations are reasonable, the final outcome after the conclusion of any tax examinations and any litigation could be materially different from what has been reflected in the company’s historical financial statements.
Technological risks
Decreases in our ability to develop or apply new technology and know-how may affect our competitiveness.
Our success depends partially on our ability to improve production processes and services. We must also introduce new products and services to meet changing customer needs. If we are unable to implement better production processes or to develop new products through research and development or licensing of new technology, we may not be able to remain competitive with other manufacturers. As a result, our business, financial condition, cash flows or results of operations could be adversely affected.
Increased information technology (IT) security threats and more sophisticated and targeted computer crime could pose a risk to our systems, networks, products, solutions and services.services, as well as those of our suppliers and customers.
The company’s IT systems, or any third party’s system on which the company relies, as well as those of our suppliers and customers, could fail on their own accord or may be vulnerable to a variety of interruptions or shutdowns, including interruptions or shutdowns due to natural disasters, power outages or telecommunications failures, terrorist attacks or failures during the process of upgrading or replacing software or hardware. Increased global IT security threats and more sophisticated and targeted computer crime also pose a risk to the security of our systems and networks and the confidentiality, availability and integrity of our data. data, as well as to the security and data of our suppliers and customers. As a provider of products and services to government and commercial customers, our aerospace business in particular may be the target of cyber-attacks, including attempts to gain unauthorized access to classified or sensitive information and networks. The company has a number of shared service centers where many of the company’s IT systems are concentrated and any disruption at such a location could impact the company’s business within the operating zones served by the impacted service center.
While we attempt to mitigate all of these risks to our networks, systems and data by employing a number of measures, including employee training, comprehensive monitoring of our networks and systems, and maintenance of backup and protective systems, our systems, networks, products, solutions and services remain potentially vulnerable to advanced persistent threats.threats or other IT disruptions. Depending on their nature and scope, such threats could potentially lead to the compromise of confidential information, improper use of our systems and networks, manipulation and destruction of data, defective products, harm to individuals or property, contractual or regulatory actions and fines, penalties and potential liabilities, production downtimes and operational disruptions, which in turn could adversely affect our reputation, competitiveness and results of operations.
A material weakness in Data privacy and protection laws are evolving and present increasing compliance challenges, which may increase our internal control over financial reportingcosts, affect our competitiveness and could if not remediated,expose us to substantial fines or other penalties. In addition, a security breach that involves classified or other sensitive government information could subject us to civil or criminal penalties and could result in material misstatementsthe loss of our secure facility clearance and other accreditation, loss of our government contracts, loss of access to classified information or debarment as a government contractor.
Human capital risks
If we fail to retain key management and personnel, we may be unable to implement our key objectives.
We believe our future success depends, in part, on our experienced management team. Unforeseen losses of key members of our management team without appropriate succession and/or compensation planning could make it difficult for us to manage our business and meet our objectives.
Prolonged work stoppages at facilities with union employees could jeopardize our financial statements.position.
Management is responsible for establishingAs of December 31, 2021, 13 percent of our North American employees and maintaining adequate internal control over financial reporting, as defined in Rule 13a-15(f) under37 percent of our European employees were covered by collective bargaining agreements. These collective bargaining agreements have staggered expirations during the Securities Exchange Act. As disclosed in Item 9A in the 2016 Form 10-K filing and Item 4 of the subsequent 2017 Form 10-Q filings, management identifiednext several years. Although we consider our employee relations to be generally good, a material weakness in internal control over financial reporting connected to deficiencies associatedprolonged work stoppage or strike at any facility with the accounting for income taxes related to the sale of some of the company’s existing beverage packaging businesses and select beverage can assets of Rexam (the Divestment Business) and the discrete income tax effects related to the acquisition of Rexam. A material weakness is defined as a deficiency, or combination of deficiencies, in internal control over financial reporting, such that there is a reasonable possibility that a material misstatement of annual or interim financial statements will not be prevented or detected on a timely basis. As a result of this material weakness, management concluded that internal control over financial reporting was not effective based on criteria set forth by the Committee of Sponsoring Organization of the Treadway Commission in “Internal Control—An Integrated Framework (2013).” During 2017, we proactively implemented a remediation plan designed to address this material weakness, which has been evaluated, and the material weakness is now considered remediated. If remedial measures are insufficient to address the material weakness, or if additional material weaknesses in internal control are discovered or occur in the future, our consolidated financial statements may contain material misstatements and we could be required to restate our financial results.
Significant developments stemming from the U.K’s referendum on membership in the EUunion employees could have a material adverse effect on our business, financial condition, cash flows or results of operations. In addition, we cannot ensure that upon the expiration of existing collective bargaining agreements, new agreements will be reached without union action or that any such new agreements will be on terms satisfactory to us.
In June 2016, the U.K. held a referendumEnvironmental risks
Adverse weather and votedclimate changes may result in favor of leaving the European Union (EU). This referendum has created political and economic uncertainty, particularlylower sales.
We manufacture packaging products primarily for beverages. Unseasonable weather can reduce demand for certain beverages packaged in the U.K.our containers. Climate change and the EU, and this uncertainty may lastincreasing frequency of severe weather events could have various effects on the demand for years, particularly as the U.K.our products, our supply chain and the EU continuecosts of inputs to negotiateour production and delivery of products in different regions around the terms of withdrawal from the EU.world. Our business in the U.K., the EUplants’ production may be prevented or curtailed due to severe or unanticipated weather and worldwide could be affected during this period of uncertainty, and perhaps longer, by the impact of the U.K.’s referendum and withdrawal from the EU. There are many ways in which our business could be affected, only some of which we can identify at the present time.climate events.
Our business is subject to substantial environmental remediation and compliance costs.
The referendum,
Our operations are subject to federal, state, provincial and local laws and regulations in multiple jurisdictions relating to environmental hazards, such as emissions to air, discharges to water, the handling and disposal of hazardous and solid wastes and the likely withdrawalclean-up of the U.K. from the EU it triggers, has caused and,hazardous substances. We have been designated, along with events that could occur in the futurenumerous other companies, as a consequencepotentially responsible party for the clean-up of several hazardous waste sites. Additionally, there is increased focus on the U.K.’s withdrawal, including the possible breakupregulation of the U.K. or the EU, may continue to cause significant volatility in global financial markets, including in global currency and debt markets. This volatility could cause a slowdown in economic activity in the U.K., Europe or globally, which could adversely affect our operating results and growth prospects. In addition, our business could be negatively affected by new trade agreements between the U.K.greenhouse gas emissions and other countries,environmental issues worldwide. We strive to mitigate such risks related to environmental issues, including through the U.S.,purchase of renewable energy, the adoption of sustainable practices, and by the possible imposition of trade or other regulatory barrierspositioning ourselves as a sustainability leader in the U.K. These possible negative impacts, and others resulting from the U.K.’s actual or threatened withdrawal from the EU, may adversely affect our operating results and growth prospects.industry.
Item 1B. Unresolved Staff Comments
There were no matters required to be reported under this item.
Item 2. Properties
The company’s properties described below are well maintained, and management considers them to be adequate and utilized for their intended purposes.
Ball’s corporate headquarters are located in Westminster, Colorado, U.S. and theour aerospace segment management offices are located in Broomfield, Colorado, U.S..U.S. The operations of the aerospace segment occupy a variety of company-owned and leased facilities in Colorado, U.S., which together aggregate 1.7 million square feet ofcomprise office, laboratory, research and development, engineering and test and manufacturing space. Other aerospace operations carry on business in smaller company owned and leased facilities in other U.S. locations outside of Colorado.
The offices of the company’s various North and Central American beverage and food and aerosol packaging operations are located in Westminster, Colorado, U.S.; the offices for the European beverage packaging operations are located in Luton, U.K.; the offices for AMEA beverage packaging operations are located in Dubai, United Arab Emirates; the offices for the Asia Pacific beverage packaging operations are located in Hong Kong; and the South America beverage packaging offices are located in Rio de Janeiro, Brazil. The company’s research and development facilities are primarily located in Westminster, Colorado, U.S.
Information regarding the approximate size of theBall’s manufacturing locations for significant packaging operations, which are owned or leased by the company, isare set forth below. Facilities in the process of being constructed, or that have ceased
production, have been excluded from the list. Where certain locations include multiple facilities, the total approximate size for the location is noted. In addition to the facilities listed, the company leases other warehousing space.
Beverage packaging, North and Central America, locations:
| ● | Approximate
|
| | Floor Space in
|
Plant Location
| | Square Feet
|
| | |
Beverage packaging, North and Central America:
| | |
Birmingham, Alabama
| | 140,000 |
Chatsworth, California
| | 351,000 |
Conroe, Texas |
| ● | 275,000 |
Fairfield, California |
| ● | 733,000 |
Fort Atkinson, Wisconsin |
| ● | 250,000 |
Fort Worth, Texas |
| ● | 322,000Glendale, Arizona |
| ● | 509,000Goodyear, Arizona |
| ● | 127,000 |
Longview, Texas
| | 332,000 |
Monterrey, Mexico |
| ● | 440,000 |
Monticello, Indiana |
| ● | 106,000Pittston, Pennsylvania |
| ● | 386,000 |
Saint Paul, Minnesota |
| ● | 165,000 |
Saratoga Springs, New York |
| ● | 276,000 |
Wallkill, New York |
| ● | 312,000 |
Whitby, Ontario, Canada |
| ● | 205,000 |
Williamsburg, Virginia |
Beverage packaging, EMEA, locations:
Beverage packaging, South America:
| ● | Bierne, France |
| ● | Cabanillas del Campo, Spain |
| ● | Ejpovice, Czech Republic |
| ● | Milton Keynes, United Kingdom |
| ● | Wakefield, United Kingdom |
Beverage packaging, South America, locations:
| ● | 292,000Asuncion, Paraguay |
Belem, Brazil
| ● | 165,000 |
Brasilia, Brazil |
| ● | 267,000 |
Buenos Aires, Argentina |
| ● | 183,000 |
Cuiaba, Brazil
| | 182,000 |
Extrema, Brazil |
| ● | Jacarei, Sao Paulo, Brazil |
| ● | 119,000 |
Pouso Alegre, Brazil |
| ● | 380,000 |
Santa Cruz, Brazil |
| ● | 275,000 |
Simoes Filho, Brazil
| | 106,000 |
Tres Rios, Rio de Janeiro, Brazil | | 734,000 |
(a) Includes both metal beverage container and metal food container manufacturing operations.Beverage packaging, Other, locations:
Aerosol packaging locations:
| ● | Sherbrooke, Quebec, Canada |
Aluminum cups location:
| | |
| | Approximate
|
| | Floor Space in
|
Plant Location
| | Square Feet
|
| | |
Beverage packaging, Europe:
| | |
Argayash, Russia
| | 256,000 |
Belgrade, Serbia
| | 313,000 |
Bierne, France
| | 274,000 |
Ejpovice, Czech Republic
| | 185,000 |
Fosie, Sweden
| | 669,000 |
Fredericia, Denmark
| | 318,000 |
Gelsenkirchen, Germany
| | 378,000 |
La Selva, Spain
| | 278,000 |
Lublin, Poland
| | 280,000 |
Ludesch, Austria
| | 337,000 |
Mantsala, Finland
| | 230,000 |
Milton Keynes, United Kingdom
| | 148,000 |
Mont, France
| | 45,000 |
Naro Fominsk, Russia
| | 544,000 |
Nogara, Italy
| | 122,000 |
San Martino, Italy
| | 184,000 |
Vsevolozhsk, Russia
| | 316,000 |
Wakefield, United Kingdom
| | 269,000 |
Waterford, Ireland
| | 129,000 |
Widnau, Switzerland
| | 321,000 |
| | |
Beverage packaging, AMEA:
| | |
Cairo, Egypt
| | 201,000 |
Dammam, Saudi Arabia
| | 416,000 |
Manisa, Turkey
| | 173,000 |
Mumbai, India
| | 175,000 |
Sri City, India
| | 215,000 |
| | |
Beverage packaging, Asia Pacific:
| | |
Beijing, PRC
| | 303,000 |
Hubei (Wuhan), PRC
| | 416,000 |
Qingdao, PRC
| | 326,000 |
Sanshui (Foshan), PRC
| | 672,000 |
Yangon, Myanmar
| | 432,000 |
| | |
Food & Aerosol:
| | |
Ahmedabad, India
| | 58,000 |
Beaurepaire, France
| | 89,000 |
Bellegarde, France
| | 124,000 |
Buenos Aires, Argentina
| | 34,000 |
Canton, Ohio
| | 266,000 |
Chestnut Hill, Tennessee
| | 305,000 |
Columbus, Ohio
| | 380,000 |
DeForest, Wisconsin
| | 400,000 |
Devizes, United Kingdom
| | 110,000 |
Findlay, Ohio (a)
| | 733,000 |
Horsham, Pennsylvania
| | 162,000 |
Milwaukee, Wisconsin
| | 502,000 |
Oakdale, California
| | 370,000 |
San Luis, Argentina
| | 51,000 |
San Luis Potosí, Mexico
| | 158,000 |
Sherbrooke, Quebec, Canada
| | 100,000 |
Springdale, Arkansas
| | 286,000 |
Velim, Czech Republic
| | 252,000 |
Verona, Virginia
| | 72,000 |
(a) Includes both metal beverage container and metal food container manufacturing operations.
Item 3.Legal Proceedings
Details of the company’s legal proceedings are included in Note 2122 to the consolidated financial statements within Item 8 of this annual report.
Item 4.Mine Safety Disclosures
Not applicable.
Part II.
Part II.
Item 5.Market for the Registrant’s Common Stock andEquity, Related Stockholder Matters and Issuer Purchases of Equity Securities.
Ball Corporation common stock (BLL) is listed for trading on the New York Stock Exchange. There were 5,7376,330 common shareholders of record on February 20, 2018.14, 2022. We intend to change the company’s ticker symbol from BLL to BALL immediately following our annual shareholders’ meeting in April 2022. A public press release will be issued 10 days prior to the actual change date.
Common Stock Repurchases
The following table summarizes the company’s repurchases of its common stock during the quarter ended December 31, 2017.2021.
| | | | | | | | | |
Purchases of Securities |
($ in millions) | | Total Number of Shares Purchased (a) | | Average
Price
Paid per
Share | | Total Number of
Shares Purchased as
Part of Publicly
Announced Plans or
Programs (a) | | Maximum Number of
Shares that May Yet
Be Purchased Under
the Plans or Programs
(b) |
| | | | | | | | | |
October 1 to October 31, 2021 | | 1,163,215 | | $ | 90.93 | | 1,163,215 | | 31,183,521 |
November 1 to November 30, 2021 | | 1,683,252 | | | 93.32 | | 1,683,252 | | 29,500,269 |
December 1 to December 31, 2021 | | 1,459,760 | | | 92.81 | | 1,459,760 | | 28,040,509 |
Total | | 4,306,227 | | | 92.50 | | 4,306,227 | | |
| | | | | | | | | |
Purchases of Securities |
($ in millions) | | Total
Number of
Shares
Purchased (a) | | Average
Price
Paid per
Share | | Total Number of
Shares Purchased as
Part of Publicly
Announced Plans or
Programs (a) | | Maximum Number of
Shares that May Yet
Be Purchased Under
the Plans or Programs
(b) |
| | | | | | | | | |
October 1 to October 31, 2017 | | — | | $ | — | | — | | 18,436,374 |
November 1 to November 30, 2017 | | 270,476 | | | 40.45 | | 270,476 | | 18,165,898 |
December 1 to December 31, 2017 | | — | | | — | | — | | 18,165,898 |
Total | | 270,476 | | | — | | 270,476 | | |
(a) | Includes any open market purchases (on a trade-date basis), share repurchase agreements and/or shares retained by the company to settle employee withholding tax liabilities. |
(b) | The company has an ongoing repurchase program for which 50 million shares were authorized for repurchase by Ball’s Board of Directors. |
(a)Includes any open market purchases (on a trade-date basis) and/or shares retained by the company to settle employee withholding tax liabilities.
(b)The company has an ongoing repurchase program for which shares are authorized from time to time by Ball’s Board of Directors. On January 29, 2014, the Board authorized the repurchase by the company of up to a total of 40 million shares, as retrospectively adjusted for the two-for-one stock split that was effective on May 16, 2017. This repurchase authorization replaced all previous authorizations.
Quarterly Stock Prices and Dividends
Quarterly prices for the company’s common stock, as reported on the New York Stock Exchange composite tape, and quarterly dividends in 2017 and 2016 (on a calendar quarter basis) were:
| | | | | | | | | | | | | | | | | | | | | | | | |
| | 2017 | | 2016 |
| | 4th Quarter | | 3rd Quarter | | 2nd Quarter | | 1st Quarter | | 4th Quarter | | 3rd Quarter | | 2nd Quarter | | 1st Quarter |
| | | | | | | | | | | | | | | | | | | | | | | | |
High (a) | | $ | 43.24 | | $ | 43.06 | | $ | 42.73 | | $ | 38.68 | | $ | 41.07 | | $ | 41.12 | | $ | 38.35 | | $ | 36.50 |
Low (a) | | | 37.36 | | | 38.79 | | | 35.65 | | | 36.00 | | | 36.22 | | | 34.34 | | | 33.76 | | | 31.15 |
Dividends per
share (a) | | | 0.10 | | | 0.10 | | | 0.10 | | | 0.065 | | | 0.065 | | | 0.065 | | | 0.065 | | | 0.065 |
(a)Amounts in the first and second quarters of 2017 and all four quarters of 2016 have been retrospectively adjusted for the two-for-one stock split that was effective on May 16, 2017.
Shareholder Return Performance
The line graph below compares the annual percentage change in Ball Corporation’s cumulative total shareholder return on its common stock with the cumulative total return of the Dow Jones Containers & Packaging Index and the S&P Composite 500 Stock Index for the five-year period ended December 31, 2017. It2021. The graph assumes $100 was invested on December 31, 2012,2016, and that all dividends were reinvested. The Dow Jones Containers & Packaging Index total return has been weighted by market capitalization.
TOTAL RETURN TO STOCKHOLDERS
(Assumes $100 investment on 12/31/12)
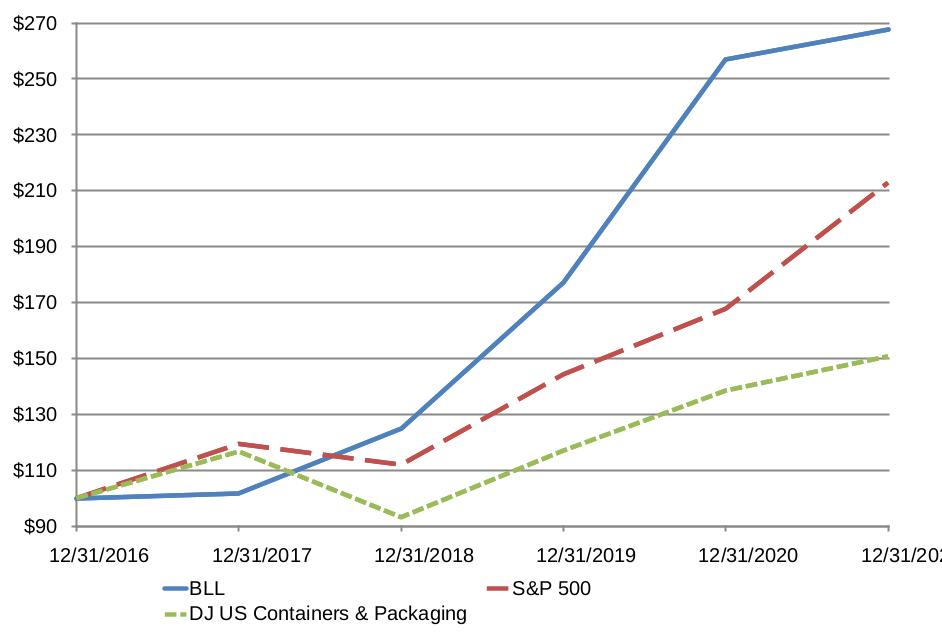
Total Return Analysis
| | | | | | | | | | | | | | | | | | | |
| | | 12/31/2012 | | | 12/31/2013 | | | 12/31/2014 | | | 12/31/2015 | | | 12/31/2016 | | | 12/31/2017 | |
| | | | | | | | | | | | | | | | | | | |
| | | 12/31/2016 | | 12/31/2017 | | 12/31/2018 | | 12/31/2019 | | 12/31/2020 | | 12/31/2021 |
BLL | | $ | 100.00 | | $ | 116.76 | | $ | 155.39 | | $ | 167.03 | | $ | 173.62 | | $ | 176.71 | | $ | 100.00 | | $ | 101.78 | | $ | 124.83 | | $ | 177.05 | | $ | 257.07 | | $ | 267.67 |
S&P 500 | | | 100.00 | | | 129.60 | | | 144.36 | | | 143.31 | | | 156.98 | | | 187.47 | | | 100.00 | | | 119.42 | | | 111.97 | | | 144.31 | | | 167.77 | | | 212.89 |
DJ US Containers & Packaging | | | 100.00 | | | 138.35 | | | 156.21 | | | 147.13 | | | 171.35 | | | 199.98 | | | 100.00 | | | 116.71 | | | 93.19 | | | 117.03 | | | 138.49 | | | 150.75 |
Source: Bloomberg L.P.® Charts
Item 6.[Reserved]
Removing and reserving Item 6 of Part II.
Item 6.Selected Financial Data
Five-Year Review of Selected Financial Data
Ball Corporation
| | | | | | | | | | | | | | | |
($ in millions, except per share amounts) | | 2017 | | 2016 | | 2015 | | 2014 | | 2013 |
| | | | | | | | | | | | | | | |
Net sales | | $ | 10,983 | | $ | 9,061 | | $ | 7,997 | | $ | 8,570 | | $ | 8,468 |
| | | | | | | | | | | | | | | |
Earnings before interest and taxes (EBIT) | | $ | 802 | | $ | 463 | | $ | 606 | | $ | 839 | | $ | 795 |
Total interest expense | | | (288) | | | (338) | | | (260) | | | (193) | | | (212) |
Earnings before taxes | | $ | 514 | | $ | 125 | | $ | 346 | | $ | 646 | | $ | 583 |
| | | | | | | | | | | | | | | |
Net earnings attributable to Ball Corporation from: | | | | | | | | | | | | | | | |
Continuing operations (a) | | $ | 374 | | $ | 263 | | $ | 281 | | $ | 470 | | $ | 406 |
Discontinued operations | | | — | | | — | | | — | | | — | | | 1 |
Total net earnings attributable to Ball
Corporation (a) | | $ | 374 | | $ | 263 | | $ | 281 | | $ | 470 | | $ | 407 |
| | | | | | | | | | | | | | | |
| | | | | | | | | | | | | | | |
Basic earnings per share: (c) | | | | | | | | | | | | | | | |
Basic – continuing operations (a) | | $ | 1.07 | | $ | 0.83 | | $ | 1.02 | | $ | 1.70 | | $ | 1.39 |
Basic – discontinued operations | | | — | | | — | | | — | | | — | | | — |
Basic earnings per share (a) | | $ | 1.07 | | $ | 0.83 | | $ | 1.02 | | $ | 1.70 | | $ | 1.39 |
| | | | | | | | | | | | | | | |
Weighted average common shares
outstanding (000s) (c) | | | 350,269 | | | 316,542 | | | 274,600 | | | 277,016 | | | 291,886 |
| | | | | | | | | | | | | | | |
Diluted earnings per share: (c) | | | | | | | | | | | | | | | |
Diluted – continuing operations (a) | | $ | 1.05 | | $ | 0.81 | | $ | 1.00 | | $ | 1.65 | | $ | 1.36 |
Diluted – discontinued operations | | | — | | | — | | | — | | | — | | | — |
Diluted earnings per share (a) | | $ | 1.05 | | $ | 0.81 | | $ | 1.00 | | $ | 1.65 | | $ | 1.36 |
| | | | | | | | | | | | | | | |
Diluted weighted average common shares
outstanding (000s) (c) | | | 356,985 | | | 322,884 | | | 281,968 | | | 284,860 | | | 298,446 |
| | | | | | | | | | | | | | | |
| | | | | | | | | | | | | | | |
Total assets | | $ | 17,169 | | $ | 16,173 | | $ | 9,697 | | $ | 7,535 | | $ | 7,774 |
Total interest bearing debt and capital lease
obligations | | $ | 6,971 | | $ | 7,532 | | $ | 5,051 | | $ | 3,133 | | $ | 3,559 |
Cash dividends per share (c) | | $ | 0.365 | | $ | 0.26 | | $ | 0.26 | | $ | 0.26 | | $ | 0.26 |
Total cash provided by operating activities | | $ | 1,478 | | $ | 194 | | $ | 1,007 | | $ | 1,012 | | $ | 839 |
| | | | | | | | | | | | | | | |
| | | | | | | | | | | | | | | |
Non-GAAP Measures (b) | | | | | | | | | | | | | | | |
| | | | | | | | | | | | | | | |
Comparable operating earnings | | $ | 1,220 | | $ | 976 | | $ | 801 | | $ | 920 | | $ | 874 |
Comparable net earnings | | $ | 728 | | $ | 563 | | $ | 490 | | $ | 553 | | $ | 490 |
Diluted earnings per share (comparable basis) (c) | | $ | 2.04 | | $ | 1.74 | | $ | 1.74 | | $ | 1.94 | | $ | 1.64 |
Free cash flow | | $ | 922 | | $ | (412) | | $ | 479 | | $ | 621 | | $ | 461 |
(a)Includes business consolidation and other activities and other items affecting comparability between years. Additional details regarding the 2017, 2016 and 2015 items are available in Note 5 to the consolidated financial statements within Item 8 of this Annual Report on Form 10-K.
(b)Non-U.S. GAAP measures should not be considered in isolation and should not be considered superior to, or a substitute for, financial measures calculated in accordance with U.S. GAAP. See below for reconciliations of non-U.S. GAAP financial measures to U.S. GAAP measures. Further discussion of non-GAAP financial measures is
available in Item 7 of this Annual Report on Form 10-K under Management Performance Measurements and Other Liquidity Measures.
(c)Amounts in 2016, 2015, 2014 and 2013 have been retrospectively adjusted for the two-for-one stock split that was effective on May 16, 2017.
Reconciliations of non-U.S. GAAP financial measures to U.S. GAAP measures are as follows:
| | | | | | | | | | | | | | | |
($ in millions) | | 2017 | | 2016 | | 2015 | | 2014 | | 2013 |
| | | | | | | | | | | | | | | |
Net earnings attributable to Ball Corporation | | $ | 374 | | $ | 263 | | $ | 281 | | $ | 470 | | $ | 407 |
Add: Net earnings attributable to noncontrolling interests | | | 6 | | | 3 | | | 22 | | | 28 | | | 28 |
Net earnings | | | 380 | | | 266 | | | 303 | | | 498 | | | 435 |
Less: Equity in results of affiliates, net of tax | | | (31) | | | (15) | | | (4) | | | (2) | | | (1) |
Add: Tax provision (benefit) | | | 165 | | | (126) | | | 47 | | | 150 | | | 149 |
Earnings before taxes, as reported | | | 514 | | | 125 | | | 346 | | | 646 | | | 583 |
Total interest expense | | | 288 | | | 338 | | | 260 | | | 193 | | | 212 |
Earnings before interest and taxes (EBIT) | | | 802 | | | 463 | | | 606 | | | 839 | | | 795 |
Business consolidation and other activities | | | 221 | | | 337 | | | 195 | | | 81 | | | 79 |
Amortization of acquired Rexam intangibles | | | 162 | | | 65 | | | — | | | — | | | — |
Catch-up depreciation and amortization for 2016 from finalization of Rexam valuation | | | 35 | | | — | | | — | | | — | | | — |
Cost of sales associated with Rexam inventory step-up | | | — | | | 84 | | | — | | | — | | | — |
Egyptian pound devaluation | | | — | | | 27 | | | — | | | — | | | — |
Comparable Operating Earnings | | $ | 1,220 | | $ | 976 | | $ | 801 | | $ | 920 | | $ | 874 |
| | | | | | | | | | | | | | | |
| | | | | | | | | | | | | | | |
Net earnings attributable to Ball Corporation, as reported | | $ | 374 | | $ | 263 | | $ | 281 | | $ | 470 | | $ | 407 |
Business consolidation and other activities | | | 221 | | | 337 | | | 195 | | | 81 | | | 79 |
Amortization of acquired Rexam intangibles | | | 162 | | | 65 | | | — | | | — | | | — |
Catch-up depreciation and amortization for 2016 from finalization of Rexam valuation | | | 35 | | | — | | | — | | | — | | | — |
Cost of sales associated with Rexam inventory step-up | | | — | | | 84 | | | — | | | — | | | — |
Egyptian pound devaluation | | | — | | | 27 | | | — | | | — | | | — |
Debt refinancing and other costs | | | 3 | | | 109 | | | 117 | | | 33 | | | 28 |
Discontinued operations | | | — | | | — | | | — | | | — | | | (1) |
Tax effect on above items | | | (150) | | | (322) | | | (103) | | | (31) | | | (23) |
Impact of U.S. tax reform | | | 83 | | | — | | | — | | | — | | | — |
Net earnings attributable to Ball Corporation before above transactions (Comparable Net Earnings) | | $ | 728 | | $ | 563 | | $ | 490 | | $ | 553 | | $ | 490 |
| | | | | | | | | | | | | | | |
| | | | | | | | | | | | | | | |
Total cash provided by operating activities (a) | | $ | 1,478 | | $ | 194 | | $ | 1,007 | | $ | 1,012 | | $ | 839 |
Capital expenditures | | | (556) | | | (606) | | | (528) | | | (391) | | | (378) |
Free cash flow | | $ | 922 | | $ | (412) | | $ | 479 | | $ | 621 | | $ | 461 |
| (a)
| | Includes payments of costs associated with the acquisition of Rexam and the sale of the Divestment Business.
|
Item 7.Management’s Discussion and Analysis of Financial Condition and Results of Operations
Management’s discussion and analysis should be read in conjunction with the consolidated financial statements and accompanying notes included in Item 8 of this Annual Report on Form 10-K (annual report), which include additional information about our accounting policies, practices and the transactions underlying our financial results. The preparation of our consolidated financial statements in conformity with accounting principles generally accepted in the United States of America (U.S. GAAP) requires us to make estimates and assumptions that affect the reported amounts in our consolidated financial statements and the accompanying notes, including various claims and contingencies related to lawsuits, taxes, environmental and other matters arising during the normal course of business. We apply our best judgment, our knowledge of existing facts and circumstances and actions that we may undertake in the future in determining the estimates that affect our consolidated financial statements. We evaluate our estimates on an ongoing basis using our historical experience, as well as other factors we believe appropriate under the circumstances, such as current economic conditions, and adjust or revise our estimates as circumstances change. As future events and their effects cannot be determined with precision, actual results may differ from these estimates. Ball Corporation and its subsidiaries are referred to collectively as “Ball Corporation,” “Ball,” “the company,” “we” or “our” in the following discussion and analysis.
OVERVIEW
Business Overview and Industry Trends
Ball Corporation is one of the world’s leading suppliers of metalaluminum packaging to the beverage, food, personal care and household products industries.suppliers. Our packaging products are produced for a variety of end uses, are manufactured in facilities around the world and are competitive with other substrates, such as plastics and glass. In the rigidaluminum packaging industry, sales and earnings can be increased by reducing costs, increasing prices, developing new products, expanding volumes and making strategic acquisitions. We also provide aerospace and other technologies and services to governmental and commercial customers.customers, including national defense hardware, antenna and video tactical solutions, civil and operational space hardware and system engineering services.
We sell our aluminum packaging products mainly to large, multinational beverage, food, personal care and household products companies with which we have developed long-term relationships. This is evidenced by our high customer retention and our large number of long-term supply contracts. While we have a diversified customer base, we sell a significant portion of our packaging products to major companies and brands, as well as to numerous regional customers. The overall metalglobal aluminum beverage and aerosol container industry isindustries are growing globally and isare expected to continue to grow in the medium to long term despite the North American industry having seen recent declines in standard-sized aluminum beverage packaging for the carbonated soft drink market.term. The primary customers for the products and services provided by our aerospace segment are U.S. government agencies or their prime contractors.
We purchase our raw materials from relatively few suppliers. We also have exposure to inflation, in particular the rising costs of raw materials, as well as other direct cost inputs. We mitigate our exposure to the changes in the costs of metalaluminum through the inclusion of provisions in contracts covering the majority of our volumes to pass through metalaluminum price changes, as well as through the use of derivative instruments. The pass-through provisions generally result in proportional increases or decreases in sales and costs with a greatly reduced impact, if any, on net earnings. Because of our customer and supplier concentration, our business, financial condition and results of operations could be adversely affected by the loss, insolvency or bankruptcy of a major customer or supplier or a change in a supply agreement with a major customer or supplier, although our contract provisions generally mitigate the risk of customer loss, and our long-term relationships represent a known, stable customer base.
We recognize sales under long-term contracts inThe majority of our aerospace segment using percentage-of-completionbusiness involves work under contracts, generally from one to five years in duration, as a prime contractor or subcontractor for various U.S. government agencies. Intense competition and long operating cycles are key characteristics of the cost-to-cost methodcompany’s aerospace and defense industry where it is common for work on major programs to be shared among a number of accounting. Throughoutcompanies. A company competing to be a prime contractor may, upon ultimate award of the period of contract performance, we regularly reevaluate and, if necessary, revise our estimates of aerospace total contract revenue, total contract cost and progress toward completion. Because of contract payment schedules, limitations on funding and other contract terms, our sales and accounts receivableto a competitor, become a subcontractor for this segment include amounts that have been earned but not yet billed.the ultimate prime contracting company.
Corporate Strategy
Our Drive for 10 vision encompasses five strategic levers that are key to growing our business and achieving long-term success. Since launching Drive for 10 in 2011, we have made progress on each of the levers as follows:
| ·
● | | Maximizing value in our existing businesses by rationalizing standard beverage container and end capacity in North America and Europe, and expanding specialty container production across our global plant network to meet current demand;demand, improving efficiencies and amplifying our sustainability credentials through Aluminum Stewardship Initiative certification in our global aluminum container and end facilities in North America, South America and Europe; leveraging plant floor and integrated planning systems into reduce costs and manage contractual provisions across our diverse customer base; successfully acquiring and integrating a large global aluminum beverage facilities to improve efficienciesbusiness and reduce costs; consolidating and/or closing multiple beverage and food andregional aluminum aerosol packaging facilities to gain efficiencies;facility while also divesting underperforming assets; and in the aluminum aerosol business, installing new extruded aluminum aerosol lines in our European, Mexican and Indian facilities while also implementing cost-out and value-in initiatives across all of our businesses; |
| ·
● | | Expanding further into new products and capabilities through commercializing our acquisition of Sonoco’s metal endnew lightweight, infinitely recyclable aluminum cup and closure manufacturing facilities in Canton, Ohio, in February 2015; successfully commercializingproviding next-generation extruded aluminum aerosol packaging that utilizes proprietary technology to significantly lightweight the can; and successfully commercializing the next-generationintroducing new specialty beverage cans and aluminum bottle-shaping technology; |
| ·
● | | Aligning ourselves with the right customers and markets by investing capital to meet continued growth for specialty beverage containers throughout our global network, which represent approximately 3750 percent of our global beverage packaging mix; aligning with craft brewers, sparkling water fillers, wine producersgrowing beverage categories and other new beverage producers who continue to use aluminum beverage containers to grow their business; and in our aluminum cup business, establishing partnerships with restaurants and event venues and utilizing online platforms and North American retailers to provide infinitely recyclable aluminum cups directly to consumers. |
| ·
● | | Broadening our geographic reach with our acquisition of Rexam and our new investments in a beverage manufacturing facilityfacilities in the United States, Brazil, Paraguay, Spain, Mexico, Myanmar and Panama, as well as an extruded aluminum aerosol manufacturing facilityfacilities in India and Brazil, and the constructionsuccessful start-up of new beverage canour aluminum cups business in the U.S.; and end facilities in Monterrey, Mexico, and in our Central American joint venture; and |
| ·
● | | Leveraging our technological expertise in packaging innovation, including the introduction of our new proprietary, brandable lightweight aluminum cup and providing next-generation aluminum bottle-shaping technologies the introduction of a new two-piece, lightweight steel aerosol can, G3 and the increased production of lightweight ReAl® containers, which utilize technology that increases the strength of aluminum used in the manufacturing process while lightweighting the can by 15up to 30 percent over a standard aluminum aerosol can, andas well as our investment in cyber, and data analytics methane monitoring, 5G and LIDAR capabilities to further enhance our aerospace technical expertise across a broader customer portfolio. |
These ongoing business developments and the successful acquisition of Rexam completed on June 30, 2016, help us stay close to our customers while expanding and/or sustaining our industry positions and global reach with major beverage, food, personal care, household products and aerospace customers. In order to successfully execute our strategy and reach our goals, we realize the importance of excelling in the following areas: customer focus, operational excellence, innovation and business development, people and culture focus and sustainability.
RESULTS OF OPERATIONS
Management’s discussion and analysis for our results of operations on a consolidated and segment basis include a quantification of factors that had a material impact. Other factors that did not have a material impact, but that are significant to understand the results, are qualitatively described.
Refer to Item 7. Management’s Discussion and Analysis of Financial Condition and Results of Operations of the company’s Annual Report on Form 10-K for the year ended December 31, 2020, as filed on February 17, 2021, for a comparison of our 2020 results of operations to the 2019 results.
Novel Coronavirus (COVID-19)
The ongoing novel coronavirus (COVID-19) had a significant effect upon the global business environment during the year ended December 31, 2021. Ball provides key products and services to the consumer beverage and household markets and the U.S. aerospace markets and, consequently, the operations of Ball and of its principal customers and suppliers have been designated as essential across our key markets. This designation allowed Ball to operate its manufacturing facilities throughout 2021, and it is expected that Ball will continue to operate its facilities without disruption in the foreseeable future. However, jurisdictions around the globe have issued stay-at-home orders and mandated operational closures of non-essential businesses and other restrictions, which have impacted certain of our customers by constraining some supply of products to certain consumers. The risks that COVID-19 and its related variants continue to present to Ball’s business have been outlined in Item 1. Risk Factors and Note 1 to the consolidated financial statements within Item 8 of this annual report.
Consolidated Sales and Earnings
| | | | | | | | | | | |
| | Years Ended December 31, | | |
| | | | | | | | | | | |
| | | Years Ended December 31, | |
($ in millions) | | 2017 | | 2016 | | 2015 | | | 2021 | | 2020 | | 2019 | |
| | | | | | | | | | | |
| | | | | | | | | | | |
Net sales | | $ | 10,983 | | $ | 9,061 | | $ | 7,997 | | | $ | 13,811 | | $ | 11,781 | | $ | 11,474 | |
Net earnings attributable to Ball Corporation | | | 374 | | | 263 | | | 281 | | | | 878 | | | 585 | | | 566 | |
Net earnings attributable to Ball Corporation as a % of consolidated net sales | | | 3 | % | | 3 | % | | 4 | % | |
Net earnings attributable to Ball Corporation as a % of net sales | | | | 6 | % | | 5 | % | | 5 | % |
Sales in 20172021 were $1.9 billion$2,030 million higher compared to 20162020 primarily as a result of increased sales volumes, for our North and Central America, South America and Europe segments, increased pass through of higher metalaluminum prices, for our Northimproved price/mix and Central America and South America segments, favorable currency exchange effects for our Europe segment,
favorable product mix for our South America segment and increased sales in our aerospace segment. Sales volumes for the year ended December 31, 2017 for our North and Central America, South America and Europe segments were higher compared to the same period in 2016 primarily as a result of 2017 including twelve months of sales volumes from the acquired Rexam business, while 2016 included six months of sales volumes from the acquired Rexam business and six months of sales volumes from the company’s legacy business, a significant portion of which was sold with the Divestment Business. The South America segment experienced organic sales growth, and increased sales from significant U.S. national defense contracts drove revenue growth in the aerospace segment. rates.
Net earnings attributable to Ball Corporation in 20172021 were $111$293 million higher than 20162020 primarily due to increased earnings related to higher sales volumes and favorable price/mix in the South America, Europe andour beverage packaging, North and Central America, beverage can segments, synergy realizations,segment, lower cost of sales in 2017 compared to 2016 which included $84 million for the step-up of inventory related to the acquired Rexam business, lower debt refinancing and other costs in 2017 and a decrease in business consolidation and other activities, in 2017, partially offset by higher incremental depreciation. These impacts on net earnings were partially offset by higher tax expense in 2017, due principally to provisional charges from the U.S. Tax Cuts and Jobs Act which was signed into law on December 22, 2017, income tax benefits in 2016 associated with the restructure of Brazil legal entities as a result of the sale of the Divestment Business, the tax benefit on transaction costs and derivative costs of the Rexam acquisition and sale of the Divestment Business in 2016.
Debt refinancing and other costs in 2017 were lower compared to 2016, which included costs on debt associated with the Rexam acquisition. See Note 13 located in Item 8 of this annual report for additional information on the activity in debt refinancing and other costs.
The increase in net sales in 2016 compared to 2015 was primarily due to sales of $1.5 billion related to the acquired Rexam business, net of Ball’s legacy sales included in the Divestment Business. This increase was partially offset by lower metal input costs passed through to customers of $299 million. Net earnings were lower in 2016 compared to 2015 due to higher business consolidation and other activities from increased costs associated with the Rexam acquisition and the sale of the Divestment Business, increased depreciation and amortization primarily attributable to depreciation and amortization associated with the acquired Rexam business, recognition in cost of sales of $84 million step-up of inventory related to the acquired Rexam business, highertotal interest expense, associated with the net increase in borrowings to fund the cash portion of the purchase price of Rexam and increased selling, general and administrative costs also due to costs from the acquired Rexam business. These decreases were partially offset by a gain of $344 million in 2016 recognized on the sale of the Ball legacy portion of the Divestment Business, lower income tax expense in 2016 compared to 2015 primarily due to the tax impacts of the sale of the Divestment Business,higher earnings from the increase in net sales from the acquired Rexam business, net of the sale of Ball’s legacy portion of the Divestment Business, lower net earnings attributable to noncontrolling interests and higher equity in results of affiliates.
The decreased debt refinancingaffiliates, partially offset by the tax effect of higher earnings and higher personnel, startup, and other costs in 2016 compared to 2015 included mark-to-market losses on derivative financial instruments designed to mitigate exposure to interest rate changes for debt issuances related to the Rexam acquisition, interest expense on issued 3.5 percent and 4.375 percent senior notes used to fund a portion of the purchase price for the Rexam acquisition, the write off of unamortized deferred financing charges for the partial extinguishment of the committed bridge loan agreement,support growth investments, and the revolving credit facility and amortizationtiming of deferred financing costs for the committed bridge loan agreement. See Note 13 located in Item 8 of this annual report for additional information on financial instruments.contractual non-aluminum input cost recovery.
Cost of Sales (Excluding Depreciation and Amortization)
Cost of sales, excluding depreciation and amortization, was $8,717$11,085 million in 20172021 compared to $7,296$9,323 million in 2016 and $6,460 million in 2015.2020. These amounts represented 79 percent, 8180 percent and 8179 percent of consolidated net sales for the years ended 2017, 20162021 and 2015,2020, respectively. CostThe increase year-over-year is primarily due to general inflationary cost pressures from limited supply of sales in 2016 included expenseraw materials and global supply chain transportation disruptions. To mitigate these recent cost trends, we have established a commercial cost recovery program that is designed to help us recover a significant portion of $84 million for the step-up of inventory related to the acquired Rexam business.those cost increases that fall outside our normal customer contracts.
Depreciation and Amortization
Depreciation and amortization expense was $729$700 million in 20172021 compared to $453$668 million in 2016 and $286 million in 2015.2020. These amounts represented 7 percent, 5 percent and 46 percent of consolidated net sales for 2017, 2016the years ended 2021 and 2015,2020, respectively. The expense was higher in 2017 compared to 2016 due to increased depreciation of fixed assets and amortization of intangible assets following the Rexam acquisition. During 2017, the company finalized the valuation of
the assets acquired in the Rexam acquisition. As a result, depreciation and amortization expense for 2017 included a cumulative catch-up adjustment of $35 million related to the last six months of 2016. Depreciation expense was higher in 2016 compared to 2015 primarily due to the acquired Rexam fixed assets. Amortization expense in 20172021 and 20162020 included $162$152 million and $65$150 million, respectively, for the amortization of acquired Rexam intangibles.
Selling, General and Administrative
Selling, general and administrative (SG&A) expenses were $514$593 million in 20172021 compared to $512$525 million in 2016 and $450 million in 2015.2020. These amounts represented 5 percent, 6 percent and 64 percent of consolidated net sales for those three years,2021 and 2020, respectively. The lower percentage of SG&A expense in 2017 as compared to 2016 was primarily due to office closures and various other cost-out initiatives implemented by the company in relation to the acquired Rexam business. The increase in SG&A expenses in 2016 compared to 2015 was primarily due to additional SG&A from the acquired Rexam businesshigher personnel and foreign exchange losses of $27 million for the devaluation of the Egyptian pound in the fourth quarter of 2016. other costs to support growth investments.
Business Consolidation Costs and Other Activities
Business consolidation costs and other activities were $221$142 million in 20172021 compared to $337$262 million in 2016 and $195 million in 2015.2020. These amounts represented 2 percent, 41 percent and 2 percent of consolidated net sales for the three years,2021 and 2020, respectively.
The year-over-year decreaseamounts in business consolidation2021 included a non-cash pension settlement charge of $135 million and other activitiesgains resulting from Brazilian indirect tax rulings of $22 million. The charges in 2017 compared to 2016 was primarily due to2020 included a decreasenon-cash pension settlement charge of $322$120 million, in Rexam transaction related costs and $83 milliona non-cash impairment charge of Rexam acquisition related compensation arrangements and a decrease of $173 million in foreign currency exchange losses associated with the Rexam transaction. These impacts were partially offset by a decrease of $289 million in the gain recognized in connection with the sale of the Ball portion of the Divestment Business, an increase of $99 million related to completed and pending plant closures, an increase of $44$62 million related to the settlementgoodwill of certain Ball U.S. defined benefit pension plans andour beverage packaging, other, reporting unit, an increaseadjustment of $34$15 million for indemnification of certain tax matters provided to the buyer inselling price of the company’s former steel food and steel aerosol business and a $23 million write-off of the potential future consideration related to the 2019 sale of the Divestment Business. See Note 5 located in Item 8 of this annual report for additional information on the activity in business consolidation and other activities.company’s former China beverage packaging business.
The year-over-year increase in business consolidation and other activities for 2016 compared to 2015 was primarily due to an increase of $202 million for transaction related costs, foreign currency exchange losses of $159 million on foreign currency-denominated restricted cash and debt and $108 million in expense for compensation arrangements, all associated with the Rexam acquisition and the sale of the Divestment Business. The increase was partially offset by a gain of $344 million in connection with the sale of the Divestment Business. The valuations of currency exchange and interest rates were a primary driver for the amounts recorded in business consolidation and other activities in 2016. See Notes 4 and 5 located in Item 8 of this annual report for additional information on the Rexam transaction and business consolidation and other activities.
Interest Expense
Total interest expense was $288$283 million in 20172021 compared to $338$316 million in 2016 and $260 million in 2015. Excluding debt refinancing and other costs, interest expense in 2017 was higher than in 2016 as the average level of debt held during the year was higher following the Rexam acquisition. Excluding debt refinancing and other costs, interest expense in 2016 was higher compared to 2015 as the company incurred additional debt to pay a portion of the cash consideration due to Rexam’s shareholders for the Rexam acquisition.2020. Interest expense, excluding the effect of debt refinancing and other costs, as a percentage of average monthly borrowings was 4decreased by approximately 10 basis points from 3.5 percent 2020 to 3.4 percent in each of2021 due to the years 2017, 2016 and 2015.drop in global interest rates.
Debt refinancing and other costs were $3 million for the year ended December 31, 2017, as compared to $109 million for the year ended December 31, 2016. The amount for the year ended 2016 consisted mainly of (1) interest expense of $49 million through June 30, 2016, on the 3.5 percent and 4.375 percent senior notes issued in December 2015, (2) fair value changes of $20 million on derivative instruments designed to mitigate risks of interest rate changes with debt issuances, (3) interest expense of $30 million through June 30, 2016, on Term A U.S. dollar and Term A euro dollar loans associated with the company’s credit facility, and (4) amortization of deferred financing fees of $7 million for the
Bridge Facility. See Notes 13 and 19 in Item 8 of this annual report for additional information on these instruments and the transactions flowing through debt refinancing and other costs.
Debt refinancing and other costs were $117 million for the year ended December 31, 2015. These costs consisted of (1) interest expense of $5 million on senior notes issued in December 2015 to fund a portion of the cash consideration of the Rexam acquisition, (2) fair value changes of $16 million on derivative instruments designed to mitigate risks of interest rate changes with anticipated debt issuances for a portion of the cash consideration payable in the acquisition of Rexam, (3) write offs of unamortized deferred financing fees and other charges of $16 million for the partial extinguishment of the committed bridge loan agreement, the partial extinguishment of the revolving credit facility, and refinance of the senior credit facility, (4) the amortization of deferred financing fees of $23 million on the Bridge Facility, and (5) write off of unamortized deferred financing fees and premiums of $57 million for the redemption of previously issued senior notes and the refinance of senior credit facilities. See Notes 13 and 19 in Item 8 of this annual report for additional information on these instruments and the transactions flowing through debt refinancing and other costs.
Tax Provision
The company’s effective tax rate is affected by recurring items such as income earned in foreignnon-U.S. jurisdictions with tax rates that differ from the U.S. tax rate and by discrete items that may occur in any given year but are not consistent from year to year.
The 20172021 effective income tax rate was 32.115.5 percent compared to negative 100.814.4 percent for 2016. The effective2020. As compared with the statutory U.S. federal income tax rate was increased by 16.1of 21 percent, for U.S. tax reform, including the impact of the transition tax and remeasurement of the company’s net deferred tax asset in the U.S., and by 3.5 percent for discrete tax costs associated with certain business dispositions. The2021 effective rate was reduced by 7.23.2 percent for the impact of the foreign taxnon-U.S. rate differential, net of valuation allowance impact, anddifferences including tax holidays, versus the U.S. tax rate and by 5.4 percent for the impact of current year changes in various foreign tax laws including the U.K. The 2017 effective rate was also reduced by 3.1 percent for the discrete tax benefit associated with the adoption in the first quarter of 2017 of amendments to existing accounting guidance for stock-based compensation, by 1.85.0 percent for the impact of the U.S. R&D credit, and by 1.61.9 percent for the impactchange in uncertain tax positions including interest and penalties. These reductions were partially offset by an increase of 1.8 percent for the U.S. domestic manufacturing deduction and of the foregoing, the impact of U.S. tax reform, discrete tax costs associated with certain business dispositions, the impact of current year changes to certain foreign tax laws and the impact of the domestic manufacturing deductionGILTI inclusion. While these items are primarily related to discrete transactions or changes in tax law that are not expected to recur, in future periods. the potential magnitude of each item is uncertain.
The 2016 full year2021 effective income tax rate was negative 100.8 percent compared to 13.6also increased by 4.3 percent for 2015. The lowerenacted changes in tax ratelaws and rates. Similar impacts may occur in 2016 compared to 2015 was primarily due to a 116.0 percentage point reduction for the tax benefit recorded with respect to tax deductible goodwill in a legal entity restructuring in Brazil that was completed in 2016. The tax rate was also reduced by 56.8 percentage points for increased benefits from foreign tax rate differences, primarily due to acquisitions, and by 49.6 percentage points for permanent tax differences on significant 2016 business dispositions. These amounts were partially offset by a 41.6 percentage point increase for non-deductible transaction costs related to 2016 acquisitions and a 36.8 percentage point increase for increases in valuation allowances, primarily on losses in the U.K. In 2016, we incurred a significant amount of nonrecurring business consolidation costs primarily in the U.S. The resulting reduction in earnings before income tax as a result of these costs increased the impact of permanent income tax items on the company’s effective tax rate in 2016 as compared to 2015.
On December 22, 2017, the U.S. Tax Cuts and Jobs Act (the Act) was signed into law. The Act significantly changed U.S. income tax law by, among other things, reducing the U.S. federal income tax rate from 35 percent to 21 percent, transitioning from a global tax system to a modified territorial tax system, eliminating the domestic manufacturing deduction, providing for immediate expensing of certain qualified capital expenditures and limiting the tax deductions for interest expense and executive compensation. In the fourth quarter of 2017, the company recorded tax expense of $83 million for the estimated impact of the mandatory deemed repatriation of its foreign earnings and revaluation of its U.S. deferred tax assets and liabilities. The company’s review of the implications of the Act will be ongoing throughout 2018, and as such, adjustments to any provisional estimates of the Act’s impact may be required. These provisional estimates are as follows:
| ·
| | Reduction of U.S. federal corporate tax rate: The company has recorded a provisional increase to tax expense of $52 million for the estimated impact of revaluing its net deferred tax asset position in the U.S. at the new
|
21 percent corporate tax rate. While this is a reasonable estimate, it may be impacted by other analyses related to the Act, including the calculation of the transition tax;
|
| ·
| | Transition tax: The company has recorded a provisional increase to tax expense of $31 million to reflect the impact of the tax on accumulated untaxed earnings and profits (E&P) of certain foreign affiliates. To determine the amount of the transition tax, the amount of the post-1986 E&P and the amount of non-U.S. income taxes paid on such earnings must be calculated for all relevant foreign affiliates. While this estimated impact is reasonable, additional information will be gathered and analyzed in order to more precisely calculate the final impact of the transition tax;
|
| ·
| | Valuation allowances: The company must assess the impact of the various aspects of the Act on its valuation allowance analyses, including the transition tax. As the company has recorded provisional estimates with respect to certain aspects of the Act, any corresponding impacts from changes in valuation allowances are also provisional estimates; and
|
| ·
| | Cost recovery: The company has made a provisional estimate of the impact on its current tax expense and deferred tax liabilities associated with the new immediate expensing provisions for certain qualifying expenditures made after September 27, 2017. The estimate will be refined as the necessary computations are completed with respect to the full inventory of all qualifying 2017 expenditures.
|
Due to the complexity of the new provisions for global intangible low-taxed income (GILTI) and the base erosion anti-abuse tax (BEAT),future periods, but given their inherent uncertainty, the company is continuingunable to evaluate the accounting implicationsreasonably estimate their potential future impacts.
Further details of these provisionstaxes on income, including impacts of the Act. The company is allowed to make an accounting policy choice of either (1) treating taxes due for GILTI or BEAT as a current-period expense when incurred or (2) factoring such amounts into the company’s measurement of its deferred taxes. The calculation of the impact and selection of an accounting policy will depend on a detailed analysis of the company’s global income and otherU.S. tax attributes to determine the potential impact, if any, of these provisions. The company is not currently able to determine a reasonable estimate for these items. As a result, no estimate has been recorded and no policy decision has yet been made regarding whether to factor the impact of GILTI or BEAT into the company’s measurement of its deferred taxes.
In future periods, while we cannot estimate the impact on our effective tax rate, the company expects the Act to favorably impact net earnings, diluted earnings per share and cash flows, primarily duereform, are provided in Note 16 to the reduction in the federal corporate tax rate effective asconsolidated financial statements within Item 8 of January 1, 2018. We do not expect the Act to have a material impact on our state income tax.this annual report.
Results of Business SegmentsRESULTS OF BUSINESS SEGMENTS
Segment Results
Ball’s operations are organized and reviewed by management along its product lines and geographical areas, and its operating results are presented in the fivefour reportable segments discussed below.
Beverage Packaging, North and Central America
| | | | | | | | | | |
| | Years Ended December 31, | |
($ in millions) | | 2017 | | 2016 | | 2015 | |
| | | | | | | | | | |
Net sales | | $ | 4,178 | | $ | 3,612 | | $ | 3,202 | |
| | | | | | | | | | |
Comparable operating earnings | | | 533 | | | 469 | | | 402 | |
Business consolidation and other activities (a) | | | (47) | | | (20) | | | (19) | |
Amortization of acquired Rexam intangibles | | | (32) | | | (11) | | | — | |
Catch-up depreciation and amortization for 2016 from finalization of Rexam valuation (b) | | | (6) | | | — | | | — | |
Cost of sales associated with Rexam inventory step-up | | | — | | | (10) | | | — | |
Total segment earnings | | $ | 448 | | $ | 428 | | $ | 383 | |
Comparable operating earnings as a % of segment net sales | | | 13 | % | | 13 | % | | 13 | % |
| (a)
| | Further details of these items are included in Note 5 to the consolidated financial statements within Item 8 of this annual report.
|
| (b)
| | Catch-up depreciation and amortization of $6 million related to the last six months of 2016 was recorded during 2017, as a result of the finalization of fixed asset and intangible asset valuations and useful lives for the Rexam acquisition during the second quarter of 2017.
|
| | | | | | | | | | |
| | Years Ended December 31, | |
($ in millions) | | 2021 | | 2020 | | 2019 | |
| | | | | | | | | | |
Net sales | | $ | 5,856 | | $ | 5,076 | | $ | 4,758 | |
Comparable operating earnings | | | 681 | | | 683 | | | 555 | |
Comparable operating earnings as a % of segment net sales | | | 12 | % | | 13 | % | | 12 | % |
The beverage packaging, North and Central America, segment consists of operations located in the U.S., Canada and Mexico that manufacture aluminum containers used in beverage packaging. In August 2017, the company announced that the Birmingham, Alabama, Chatsworth, California, and Longview, Texas, beverage packaging plants will cease production in 2018. In order to serve growing customer demand for specialty cans in the southwestern U.S., the company is constructing a beverage packaging facility in Goodyear, Arizona, which is expected to begin production in the second quarter of 2018. Our beverage can manufacturing facility in Reidsville, North Carolina, ceased production at the end of June 2017 and our beverage end manufacturing facility in Bristol, Virginia, ceased production at the end of June 2016. During the first quarter of 2016, our beverage manufacturing facility in Monterrey, Mexico, began production.
Segment sales in 20172021 were $566$780 million higher compared to 2016. The increase in 2017 was2020 primarily due to $350 million of higher volumes, primarily attributed to the Rexam acquisition, and $176 million from4 percent volume growth, the pass through of higher metal prices. Sales in 2017 included twelve months of sales volumes from the acquired Rexam business compared to 2016 which included six months of sales volumes from the acquired Rexam business. aluminum prices and improved price/mix.
Comparable operating earnings in 20172021 were $64$2 million lower compared to 2020 primarily due to the timing of contractual non-aluminum input cost recovery, startup costs associated with three new multi-line manufacturing plants and operational inefficiencies from persistent supply chain disruptions, partially offset by higher specialty volumes and improved customer contractual terms.
Beverage Packaging, EMEA
| | | | | | | | | | |
| | Years Ended December 31, | |
($ in millions) | | 2021 | | 2020 | | 2019 | |
| | | | | | | | | | |
Net sales | | $ | 3,509 | | $ | 2,945 | | $ | 2,857 | |
Comparable operating earnings | | | 452 | | | 354 | | | 351 | |
Comparable operating earnings as a % of segment net sales | | | 13 | % | | 12 | % | | 12 | % |
Segment sales in 2021 were $564 million higher compared to 20162020 primarily due to 8 percent volume growth, the pass through of higher sales volume, largely attributed to the Rexam acquisition,aluminum prices and favorable product mix, cost savings from the closure of the Reidsville plant and other synergy-related activities, partially offset by higher freight costs and increased depreciation. Earnings in 2017 included twelve months of sales volumes from the acquired Rexam business compared to 2016 which included six months of sales volumes from the acquired Rexam business.exchange rates.
Segment sales in 2016 were $410 million higher compared to 2015. The increase in 2016 was primarily due to the increase in sales volumes of $526 million from the acquired Rexam business partially offset by lower metal input prices of $176 million.
Comparable operating earnings in 20162021 were $67$98 million higher compared to 2015 primarily due to the earnings from the acquired Rexam business. Improved product mix from the legacy Ball business also contributed to the favorable year-over-year operating earnings improvement.
Beverage Packaging, South America
| | | | | | | | | | |
| | Years Ended December 31, | |
($ in millions) | | 2017 | | 2016 | | 2015 | |
| | | | | | | | | | |
Net sales | | $ | 1,692 | | $ | 1,014 | | $ | 591 | |
| | | | | | | | | | |
Comparable operating earnings | | | 333 | | | 185 | | | 80 | |
Business consolidation and other activities (a) | | | (5) | | | (15) | | | (3) | |
Amortization of acquired Rexam intangibles | | | (56) | | | (17) | | | — | |
Catch-up depreciation and amortization for 2016 from finalization of Rexam valuation (b) | | | (14) | | | — | | | — | |
Cost of sales associated with Rexam inventory step-up | | | — | | | (20) | | | — | |
Total segment earnings | | $ | 258 | | $ | 133 | | $ | 77 | |
Comparable operating earnings as a % of segment net sales | | | 20 | % | | 18 | % | | 14 | % |
| (a)
| | Further details of these items are included in Note 5 to the consolidated financial statements within Item 8 of this annual report.
|
| (b)
| | Catch-up depreciation and amortization of $14 million related to the last six months of 2016 was recorded during 2017, as a result of the finalization of fixed asset and intangible asset valuations and useful lives for the Rexam acquisition during the second quarter of 2017.
|
The beverage packaging, South America, segment consists of operations located in Brazil, Argentina and Chile that manufacture aluminum containers used in beverage packaging in most countries in South America. To support contracted volumes for aluminum beverage packaging across Paraguay, Argentina and Bolivia, the company plans to construct a one-line beverage can and end manufacturing plant in Paraguay, and to add capacity to our Buenos Aires, Argentina, facility. The Paraguay plant is expected to begin production in the fourth quarter of 2019.
Segment sales and comparable operating earnings in 2017 included twelve months of sales volumes from the acquired Rexam business compared to 2016 which included six months of sales volumes from the acquired Rexam business and six months of sales volumes from the company’s legacy business, the significant portion of which was sold with the Divestment Business.
Segment sales in 2017 were $678 million higher compared to 2016. The increase in 2017 was primarily due to $545 million in higher volumes, largely attributed to the Rexam acquisition, to organic growth and to additional revenue from the end sales agreement with the Divestment Business that will transition to the divested business in the first half of 2018. The higher sales also included $158 million from the pass through of higher metal prices.
Comparable operating earnings in 2017 were $148 million higher compared to 20162020 primarily due to higher sales volumes largely attributed to the Rexam acquisition, the end sales agreement with the Divestment Business, and favorable product mix.
Beverage Packaging, South America
| | | | | | | | | | |
| | Years Ended December 31, | |
($ in millions) | | 2021 | | 2020 | | 2019 | |
| | | | | | | | | | |
Net sales | | $ | 2,016 | | $ | 1,695 | | $ | 1,670 | |
Comparable operating earnings | | | 348 | | | 280 | | | 288 | |
Comparable operating earnings as a % of segment net sales | | | 17 | % | | 17 | % | | 17 | % |
Segment sales in 20162021 were $423$321 million higher compared to 2015 and comparable operating earnings in 2016 were $105 million higher compared to 2015. The second half of 2016 included earnings from the Rexam business while the second half of 2015 included the company’s smaller legacy Brazil business.
Beverage Packaging, Europe
| | | | | | | | | | |
| | Years Ended December 31, | |
($ in millions) | | 2017 | | 2016 | | 2015 | |
| | | | | | | | | | |
Net sales | | $ | 2,360 | | $ | 1,915 | | $ | 1,653 | |
| | | | | | | | | | |
Comparable operating earnings | | | 233 | | | 217 | | | 192 | |
Business consolidation and other activities (a) | | | (89) | | | (24) | | | (10) | |
Amortization of acquired Rexam intangibles | | | (67) | | | (31) | | | — | |
Catch-up depreciation and amortization for 2016 from finalization of Rexam valuation (b) | | | (19) | | | — | �� | | — | |
Cost of sales associated with Rexam inventory step-up | | | — | | | (47) | | | — | |
Total segment earnings | | $ | 58 | | $ | 115 | | $ | 182 | |
Comparable operating earnings as a % of segment net sales | | | 10 | % | | 11 | % | | 12 | % |
| (a)
| | Further details of these items are included in Note 5 to the consolidated financial statements within Item 8 of this annual report.
|
| (b)
| | Catch-up depreciation and amortization of $19 million related to the last six months of 2016 was recorded during 2017, as a result of the finalization of fixed asset and intangible asset valuations and useful lives for the Rexam acquisition during the second quarter of 2017.
|
The beverage packaging Europe segment includes the manufacture and sale of metal beverage containers in facilities located throughout Europe, including Russia. To support growth for beverage cans in the Iberian Peninsula, the company is constructing a two-line, aluminum beverage can manufacturing facility near Madrid, Spain, with a majority of the facility’s capacity secured under a long-term customer contract. The facility is expected to be fully operational in the second quarter of 2018 and will produce multiple can sizes. In the third quarter of 2017, our beverage packaging container and end production facilities in Recklinghausen, Germany, ceased production.
Segment sales and comparable operating earnings in 2017 included twelve months of sales volumes from the acquired Rexam business compared to 2016 which included six months of sales volumes from the acquired Rexam business and six months of sales volumes from the company’s legacy European business, the significant portion of which was sold with the Divestment Business.
Segment sales in 2017 were $445 million higher compared to 2016. The increase in 2017 was2020 primarily due to $388 million from increased sales volumes, largely attributed to3 percent volume growth and the Rexam acquisition, and favorable currency exchange effects. pass through of higher aluminum prices.
Comparable operating earnings in 20172021 were $16$68 million higher compared to 20162020 primarily duerelated to increasedhigher sales volumes largely attributed to the Rexam acquisition, cost savings from the closureand favorable mix.
Aerospace
| | | | | | | | | | |
| | Years Ended December 31, | |
($ in millions) | | 2021 | | 2020 | | 2019 | |
| | | | | | | | | | |
Net sales | | $ | 1,911 | | $ | 1,741 | | $ | 1,479 | |
Comparable operating earnings | | | 169 | | | 153 | | | 140 | |
Comparable operating earnings as a % of segment net sales | | | 9 | % | | 9 | % | | 9 | % |
Segment sales in 20162021 were $262$170 million higher compared to 2015 and comparable operating earnings in 2016 were $25 million higher compared to 2015, both attributed to the Rexam acquisition.
Food and Aerosol Packaging
| | | | | | | | | | |
| | Years Ended December 31, | |
($ in millions) | | 2017 | | 2016 | | 2015 | |
| | | | | | | | | | |
Net sales | | $ | 1,138 | | $ | 1,171 | | $ | 1,297 | |
| | | | | | | | | | |
Comparable operating earnings | | | 102 | | | 109 | | | 108 | |
Business consolidation and other activities (a) | | | 6 | | | (26) | | | — | |
Total segment earnings | | $ | 108 | | $ | 83 | | $ | 108 | |
Comparable operating earnings as a % of segment net sales | | | 9 | % | | 9 | % | | 8 | % |
(a)Further details of these items are included in Note 5 to the consolidated financial statements within Item 8 of this annual report.
The food and aerosol packaging segment consists of operations located in the U.S., Europe, Canada, Mexico, Argentina and India that manufacture and sell steel food and aerosol containers, extruded aluminum aerosol containers and slugs. In March 2017, we sold our paint and general line can facility in Hubbard, Ohio, and in October 2016, we sold our specialty tin manufacturing facility in Baltimore, Maryland. During the first quarter of 2016, we announced the closure of our food and aerosol packaging flat sheet production and end-making facility in Weirton, West Virginia, which ceased production in the first quarter of 2017.
Segment sales in 2017 were $33 million lower compared to 2016. The decrease in 2017 was primarily due to lower food can sales volumes and the sale of the company’s Baltimore, Maryland, and Hubbard, Ohio, plants.
Comparable operating earnings in 2017 were $7 million lower compared to 2016 primarily due to further food can volume and price/cost compression, one-time startup costs for our new flat sheet operations in Canton, Ohio, during 2017, and the sale of the company’s Baltimore and Hubbard plants, which were partially offset by favorable aerosol product mix and various cost-out initiatives.
Segment sales in 2016 were $126 million lower compared to 2015 as a result of $57 million in lower prices resulting from lower metal costs passed through to customers and $69 million in volume primarily driven by lower food can sales volumes. Comparable operating earnings in 2016 were relatively unchanged compared to 2015 due to improved extruded aluminum sales which offset the decline in food can sales volumes.
Aerospace
| | | | | | | | | | |
| | Years Ended December 31, | |
($ in millions) | | 2017 | | 2016 | | 2015 | |
| | | | | | | | | | |
Net sales | | $ | 991 | | $ | 818 | | $ | 810 | |
| | | | | | | | | | |
Comparable operating earnings | | | 98 | | | 88 | | | 82 | |
Business consolidation and other activities (a) | | | — | | | — | | | 1 | |
Total segment earnings | | $ | 98 | | $ | 88 | | $ | 83 | |
Comparable operating earnings as a % of segment net sales | | | 10 | % | | 11 | % | | 10 | % |
(a)Further details of these items are included in Note 5 to the consolidated financial statements within Item 8 of this annual report.
The aerospace segment consists of the manufacture and sale of aerospace and other related products and services provided for the defense, civil space and commercial space industries.
Segment sales in 2017 were $173 million higher compared to 2016,2020, and comparable operating earnings were $10$16 million higher. The increase in sales and operating earnings for 2017 washigher, primarily the result of increases from significant U.S. national defense contracts.
Segment sales in 2016 were relatively unchanged compared to 2015. Comparable operating earnings in 2016 increased $6 million compared to 2015 due to individually immaterial items.the company’s new program wins, backlog growth and related backlog liquidation through contract performance.
Sales to the U.S. government, either directly as a prime contractor or indirectly as a subcontractor, represented 98 percent of segment sales in 2017 compared to 97 percent of segment sales in 2016both 2021 and 96 percent in 2015.2020. The aerospace contract mix in 20172021 consisted of 6347 percent cost-type contracts, which are billed at our costs plus an agreed uponagreed-upon and/or earned profit component, and 3250 percent fixed-price contracts. The remaining sales were for time and materials contracts.
Contracted backlogBacklog for the aerospace segment at December 31, 20172021 and 2016,2020, was $1.75$2.5 billion and $1.4$2.4 billion, respectively. The year-over-year increase reflects several majoractual amount of funding received in the future may be higher or lower than our estimate of potential contract awards during 2017.value. The segment has numerous outstanding bids for future contract awards. The backlog at December 31, 2017,2021, consisted of 7840 percent cost-type contracts. Comparisons of backlog are not necessarily indicative of the trend of future operations due to the nature of varying delivery and milestone schedules on contracts, funding of programs and the uncertainty of timing of future contract awards.
Additional Segment Information
For additional information regarding our segments, see the business segment information in Note 3 accompanying the consolidated financial statements within Item 8 of this annual report. The charges recorded for business consolidation and other activities were based on estimates by Ball management and were developed from information available at the time. If actual outcomes vary from the estimates, the differences will be reflected in current period earnings in the consolidated statement of earnings and identified as business consolidation gains and losses. Additional details about our business consolidation and other activities are provided in Note 5 accompanying the consolidated financial statements within Item 8 of this annual report.
Management Performance Measures
Management internally uses various measures to evaluate company performance, such asincluding comparable operating earnings (earnings before interest, taxes and business consolidation and other non-comparable costs); comparable net earnings (earnings before business consolidation costs and other non-comparable costs after tax); comparable diluted earnings per share (comparable net earnings divided by diluted weighted average shares outstanding); return on average invested capital (net operating earnings after tax over the relevant performance period divided by average invested capital over the same period); economic value added (EVA®) dollars (net operating earnings after tax less a capital charge on average invested capital employed); earnings before interest and taxes (EBIT); earnings before interest, taxes, depreciation and amortization (EBITDA); and diluted earnings per share. Management alsoIn addition, management uses freeoperating cash flow (generally defined by the company as cash flow from operating activities less capital expenditures)flows as a measure to evaluate the company’s liquidity. We believe this information is also useful to investors as it provides insight into the earnings and cash flow criteria that management uses to make strategic decisions. These financial measures may be adjusted at times for items that affect comparability between periods such as business consolidation costs and gains or losses on acquisitions and dispositions.
Nonfinancial measures in the packaging businesses include production efficiency and spoilage rates; quality control figures; environmental, health and safety statistics; production and sales volumes;volume data; asset utilization rates; and measures of sustainability. Additional measures used to evaluate financial performance in the aerospace segment include contract revenue realization, award and incentive fees realized, proposal win rates and backlog (including awarded, contracted and funded backlog).backlog. References to volume data represent units shipped.
The followingMany of the above noted financial measurements are presented on a non-U.S. GAAP basis and should be considered in connection with the consolidated financial statements within Item 8 of this annual report. Non-U.S. GAAP measures should not be considered in isolation, andnor should they not be considered superior to, or a substitute for, financial measures calculated in accordance with U.S. GAAP. A presentation of earnings in accordance with U.S. GAAP is available in Item 8 of this annual report.
Based on the above definitions, our calculation of comparable operating earnings is summarized below:
| | | | | | | | | |
| | Years Ended December 31, |
($ in millions) | | 2017 | | 2016 | | 2015 |
| | | | | | | | | |
Net earnings attributable to Ball Corporation | | $ | 374 | | $ | 263 | | $ | 281 |
Add: Net earnings attributable to noncontrolling interests | | | 6 | | | 3 | | | 22 |
Net earnings | | | 380 | | | 266 | | | 303 |
Less: Equity in results of affiliates, net of tax | | | (31) | | | (15) | | | (4) |
Add: Tax provision (benefit) | | | 165 | | | (126) | | | 47 |
Earnings before taxes, as reported | | | 514 | | | 125 | | | 346 |
Add: Total interest expense | | | 288 | | | 338 | | | 260 |
Earnings before interest and taxes | | | 802 | | | 463 | | | 606 |
Add: Business consolidation and other activities | | | 221 | | | 337 | | | 195 |
Add: Amortization of acquired Rexam intangibles | | | 162 | | | 65 | | | — |
Add: Catch-up depreciation and amortization for 2016 from finalization of Rexam valuation (a) | | | 35 | | | — | | | — |
Add: Cost of sales associated with Rexam inventory step-up | | | — | | | 84 | | | — |
Add: Egyptian pound devaluation | | | — | | | 27 | | | — |
Comparable operating earnings | | $ | 1,220 | | $ | 976 | | $ | 801 |
Our calculation of comparable net earnings is summarized below:
| | | | | | | | | |
| | Years Ended December 31, |
($ in millions, except per share amounts) | | 2017 | | 2016 | | 2015 |
| | | | | | | | | |
Net earnings attributable to Ball Corporation | | $ | 374 | | $ | 263 | | $ | 281 |
Add: Business consolidation and other activities | | | 221 | | | 337 | | | 195 |
Add: Amortization of acquired Rexam intangibles | | | 162 | | | 65 | | | — |
Add: Catch-up depreciation and amortization for 2016 from finalization of Rexam valuation (a) | | | 35 | | | — | | | — |
Add: Cost of sales associated with Rexam inventory step-up | | | — | | | 84 | | | — |
Add: Egyptian pound devaluation | | | — | | | 27 | | | — |
Add: Debt refinancing and other costs | | | 3 | | | 109 | | | 117 |
Less: Tax effect on above items | | | (150) | | | (322) | | | (103) |
Add: Impact of U.S. tax reform | | | 83 | | | — | | | — |
Comparable net earnings | | $ | 728 | | $ | 563 | | $ | 490 |
| | | | | | | | | |
Per diluted share, as reported (b) | | $ | 1.05 | | $ | 0.81 | | $ | 1.00 |
Per diluted share, comparable basis (b) | | $ | 2.04 | | $ | 1.74 | | $ | 1.74 |
| | | | | | | | | |
Weighted average diluted shares outstanding (000s) | | | 356,985 | | | 322,884 | | | 281,968 |
| (a)
| | Catch-up depreciation and amortization of $35 million related to the last six months of 2016 was recorded during 2017 as a result of the finalization of fixed asset and intangible asset valuations and useful lives for the Rexam acquisition.
|
| (b)
| | Amounts in 2016 and 2015 have been retrospectively adjusted for the two-for-one stock split that was effective on May 16, 2017.
|
CRITICAL AND SIGNIFICANT ACCOUNTING POLICIES AND NEW ACCOUNTING PRONOUNCEMENTSESTIMATES
For information regarding the company’s critical and significant accounting policies, as well as recent accounting pronouncements, see NotesNote 1 and Note 2 to the consolidated financial statements within Item 8 of this annual report.
The company considers certain accounting estimates to be critical, as their application is made in accordance with generally accepted accounting principles that involve a significant level of estimation uncertainty and have had, or are reasonably likely to have, a material impact on the financial condition or results of operations. Detailed below is a discussion of why, to the extent the estimate is material, these estimates are subject to uncertainty and the sensitivity of the reported amounts to the methods, assumptions, and estimates underlying the estimate’s calculation.
Revenue Recognition in the Aerospace Segment
Sales under fixed-price long-term contracts in the aerospace segment are primarily recognized using percentage-of-completion accounting under the cost-to-cost method. The company believes the accounting estimates related to revenue recognition in its aerospace segment are critical accounting estimates because they are highly reliant upon estimation throughout the segment’s contracts with its customers. The recognition of revenue requires significant estimation on the part of management, including estimating techniques to project revenues and costs at completion and various assumptions and projections related to the outcome of future events, and evaluation of estimates of total contract revenue, total contract cost, and extent of progress toward completion. Aside from estimation of total contract cost and progress towards completion, total revenues in our aerospace segment are subject to uncertainty due to the total amount that will be paid by the customer giving rise to variable consideration. The primary types of variable consideration present in the company’s contracts are cost reimbursements, performance award fees, incremental funding and finalization of government rates. The company’s accounting policy around revenue recognition in its aerospace segment and further details of estimates used in revenue recognition in its aerospace segment can be found in Note 1 and Note 5, respectively, to the consolidated financial statements within Item 8 of this annual report.
Defined Benefit Pension Plans
The company has defined benefit plans which require management to make assumptions relating to the long-term rate of return on plan assets, discount rates used to determine the present value of future obligations and expenses, salary inflation rates, mortality rates and other assumptions. The company believes the accounting estimates related to its pension plans are critical accounting estimates because several of the company’s defined benefit plans have significant asset and liability balances, and because the assumptions used are highly susceptible to change from period to period based on the performance of plan assets, actuarial valuations, market conditions and contracted benefit changes. These assumptions do not change during the company’s fiscal year unless a remeasurement event occurs in one of the plans, such as a significant settlement. The assumptions used in accounting for the company’s defined benefit plans and how they have changed over time, as well as the sensitivity of the plans to changes in their related assumptions, can be found in Note 17 to the consolidated financial statements within Item 8 of this annual report.
FINANCIAL CONDITION, LIQUIDITY AND CAPITAL RESOURCES
Cash Flows and Capital Expenditures
Our primary sources of liquidity are cash provided by operating activities and external committed borrowings. We believe that cash flows from operationsoperating activities and cash provided by short-term, long-term and committed revolver borrowings, when necessary, will be sufficient to meet our ongoing operating requirements, scheduled principal and interest payments on debt, dividend payments, anticipated share repurchases and anticipated capital expenditures. The following table summarizes our cash flows:
| | | | | | | | | | |
| | Years Ended December 31, | |
| | | | | | | | | | |
| | | Years Ended December 31, |
($ in millions) | | 2017 | | 2016 | | 2015 | | 2021 | | 2020 | | 2019 |
| | | | | | | | | | |
| | | | | | | | | | |
Cash flows provided by (used in) operating activities | | $ | 1,478 | | $ | 194 | | $ | 1,007 | | $ | 1,760 | | $ | 1,432 | | $ | 1,548 |
Cash flows provided by (used in) investing activities | | | (545) | | | 672 | | | (2,721) | | | (1,639) | | | (1,181) | | | (422) |
Cash flows provided by (used in) financing activities | | | (1,073) | | | (387) | | | 1,737 | | | (894) | | | (602) | | | (46) |
Cash flows from operationsprovided by operating activities were $1,760 million in 2017 were higher compared to 20162021, primarily due to improveddriven by net earnings, depreciation and amortization of $700 million, business consolidation and other costs of $142 million and working capital. Working capital changesinflows of $120 million, partially offset by pension contributions of $207 million. In comparison to the same period in 2017 included a decrease2020, and after adjusting for the impact of capital expenditures, our working capital movements reflect an increase in days sales outstanding of 11 days in 2021, an increase in inventory days on hand from 68 to 61of 5 days a decrease in days receivables outstanding from 46 to 45 days2021 and an increase in days payable outstanding from 97 to 110 days. The continuing increaseof 19 days in days payable outstanding is a result2021, all of longer negotiated contractual terms with suppliers.which reflect increased aluminum prices during 2021.
Cash flowsoutflows from operationsinvesting activities were $1,639 million in 2016 were lower compared to 2015 due to increased operating cash outflows2021 predominantly driven by $1.7 billion in 2016 due to payments of professional fees and employee costs related to the acquisition of Rexam and sale of the Divestment Business of approximately $325 million; $297capital expenditures, partially offset by $110 million of additional pension funding, including $171 million related to the acquired Rexam U.K. defined benefit plan; approximately $150 million less cash inflows from working capital due toreceived for the sale of our minority-owned investment in South Korea.
Cash outflows from financing activities were $894 million in 2021, primarily driven by net share purchases of $719 million, the company’s legacy European business at its peak working capital requirements; $90repayment of $748 million of payments to settle derivatives associated with5% senior notes and common stock dividends of $229 million, partially offset by the acquired Rexam business; and $50issuance of $850 million of additional interest payments associated with the financing of the Rexam acquisition. Inventory days on hand increased from 49 days to 68 days, days sales outstanding increased from 35 days to 46 days and days payable outstanding increased from 82 days to 97 days. The increase in days outstanding is primarily attributable to the working capital positions of the acquired Rexam operations as compared to the legacy Ball operations included in the Divestment Business.3.125% senior notes.
We have entered into several regional committed and uncommitted accounts receivable factoring programs with various financial institutions for certain of our accounts receivable. Programs accounted for as true sales of the receivables, without recourse to Ball, had combined limits of approximately $1.0$1.7 billion and $1.6 billion at December 31, 2017.2021, and December 31, 2020, respectively. A total of $439$308 million and $374$232 million were available for sale under these programs at December 31, 20172021 and 2016,2020, respectively.
Annual cash dividends paid on common stock were 36.5 cents per share in 2017, and 26 cents per share in each of 2016 and 2015, as retrospectively adjusted for the two-for-one stock split that was effective on May 16, 2017. Total dividends paid to common shareholders were $129 million in 2017, $83 million in 2016 and $72 million in 2015. We paid dividends to noncontrolling interests of $5 million in 2017 and $18 million in 2015. No dividends were paid to noncontrolling interests in 2016.
As of December 31, 2017,2021, approximately $440$499 million of our cash was held outside of the U.S. In the event that we would need to utilize any of the cash held outside of the U.S. for purposes within the U.S., there are no material legal or other economic restrictions regarding the repatriation of cash from any of the countries outside the U.S. where we have cash, other than market liquidity constraints that limit the ability to convert Egyptian pounds held by the company in Egypt with a U.S. dollar equivalent value of $51 million into other currencies.cash. The company believes its U.S. operating cash flows; the $1.2 billion availableflows, cash on hand, as well as availability under the company’sits long-term, revolving credit facilities; the $110 million available under other U.S.-basedfacilities, uncommitted short-term credit facilities;facilities and availability under U.S.-based committed and uncommitted accounts receivable factoring programs will be sufficient to meet the cash requirements of the U.S. portion of the company’sour ongoing operations, scheduled principal and interest payments on U.S. debt, dividend payments, capital expenditures and other U.S. cash requirements. If foreignnon-U.S. funds would beare needed for our U.S. cash requirements and we are unable to provide the funds through intercompany financing arrangements, we would be required to repatriate funds from foreignnon-U.S. locations where the company has previously asserted indefinite reinvestment of funds outside the U.S. With the introduction of a modified territorial tax system in the recently enacted U.S. Tax Cuts
and Jobs Act, the company is currently reviewing its previously stated intent to permanently reinvest these foreign amounts outside the U.S. As the company does not believe a reasonable estimate of the impact of the U.S. Tax Cuts and Jobs Act on its indefinite reinvestment assertion can be determined at present, no provisional estimate is recorded in the financial statements for the period ended December 31, 2017. When either a reasonable estimate or the final determination becomes available, the impact will be recorded in that same reporting period. The final determination will be made and the impact will be recorded no later than December of 2018.
Based on its previous indefinite reinvestment assertion, the company has not provided deferred taxes on earnings in certain non-U.S. subsidiaries because such earnings wereare intended to be indefinitely reinvested in its international operations. Retained earnings in non-U.S. subsidiaries were $2.8 billion as of December 31, 2017. While itIt is not practical to estimate the additional taxes that maymight become payable if these earnings were remitted to the U.S., as a result of the company’s inclusion of a provisional transition tax estimate, U.S. tax has been accrued with respect to this amount.
Share Repurchases
The company’s share repurchases, net of issuances, totaled $76$719 million in 2017, $592021 and $75 million in 2016 and $100 million in 2015.2020. The repurchases were completed using cash on hand, cash provided by operating activities, proceeds from the sale of businesses and available borrowings and included accelerated share repurchase agreements and other purchases under our ongoing share repurchase program. Additional details about our share repurchase activities are provided in Note 16 to the consolidated financial statements within Item 8 of this annual report.borrowings.
Debt Facilities and Refinancing
Given our cash flow projections and unused credit facilities that are available until 2021,March 2024, our liquidity is strong and is expected to meet our ongoing cash and debt service requirements. Total interest-bearing debt was $7$7.8 billion at both December 31, 2017, compared to $7.5 billion at December 31, 2016.2021 and 2020.
In anticipation of the June 2016 acquisition of Rexam, the company entered into a £3.3 billion Bridge Facility in February 2015. Additionally, in December 2015,During 2021, Ball issued $1 billion$850 million of 4.375 percent3.125% senior notes €400 million of 3.5 percentdue in 2031 and redeemed the outstanding 5% senior notes and €700 milliondue in March 2022 in the amount of 4.375 percent senior notes. The company elected to restrict these proceeds in an escrow account, which enabled the reduction of its Bridge Facility to £1.9 billion.$748 million.
In March 2016, Ball refinanced in full its then existing £1.9 billion Bridge Facility with a $1.4 billion Term A loan facility available to Ball and a €1.1 billion Term A loan facility available to a subsidiary of Ball, and refinanced in full its then existing revolving credit facility with a long-term, multi-currency revolver available until March 2021. The euro Term A loan was repaid during 2017.
At December 31, 2017,2021, taking into account outstanding letters of credit, approximately $1.2$1.7 billion was available under the company’s long-term, multi-currency committed revolving credit facilities, which are available until March 2021.2024. In addition to these facilities, the company had $751 million$1 billion of short-term uncommitted credit facilities available at December 31, 2017,2021, of which $340$12 million was outstanding and due on demand. The majority of these amounts are available without violating our existing debt covenants. At December 31, 2016, the company had $143 million outstanding under short-term uncommitted credit facilities.
While ongoing financial and economic conditions in certain areas may raise concerns about credit risk with counterparties to derivative transactions, the company mitigates its exposure by allocating the risk among various counterparties and limiting exposure to any one party. We also monitor the credit ratings of our suppliers, customers, lenders and counterparties on a regular basis.
Some of Ball’s loan agreements use the London Inter-Bank Offered Rate (LIBOR) in determining interest rates. The company is currently evaluating the impact that the transition from its LIBOR-based interest rate loan agreements to Secured Overnight Financing Rate (SOFR) based interest rate agreements will have on its consolidated financial statements. Based on our most current understanding, the LIBOR to SOFR transition is not expected to have a material impact on our financial condition, results of operations or cash flows.
We were in compliance with all loan agreements at December 31, 2017,2021, and for all prior years presented, and we have met all debt payment obligations. The U.S. note agreements and bank credit agreement contain certain restrictions relating to dividends, investments, financial ratios, guarantees and the incurrence of additional indebtedness. The most restrictive of the company’sour debt covenants requires the companyus to maintain a leverage ratio (as defined) of no greater than 45.0 times, atwhich will change to 4.5 times as of December 31, 2017. The company was in compliance with all loan agreements and debt covenants at December 31, 2017 and 2016, and we have met all debt payment obligations.2022. As of December 31, 2017,2021, the amounts disclosed ascompany could borrow up to the limits available under the company’sits long-term multi-currency committed revolving facilities theand short-term uncommitted
credit facilities and the unsecured, committed bridge loan agreement, are available without violating ourany of its existing debt covenants. Additional details about our debt are available in Note 1315 to the consolidated financial statements within Item 8 of this annual report.
Defined Benefit Pension Plans
The company closed its pension plans to all non-unionized new entrants in the United States effective for anyone hired after December 31, 2021. New employees will instead receive a non-elective 401(k) company contribution that is expected to approximate the legacy pension benefit. Anyone employed by Ball prior to that date is unaffected by this change.
Other Liquidity Measures
Free Cash Flow
Management internally uses a free cash flow measure to: (1) evaluateGiven the company’s liquidity, (2) evaluate strategic investments, (3) plan stock buyback and dividend levels and (4) evaluate the company’s abilityon-going growth projects in our businesses being undertaken to incur and service debt. Free cash flow is not a defined term under U.S. GAAP, and it should not be inferred that the entire free cash flow amount is available for discretionary expenditures. The company defines free cash flow as cash flow from operating activities less capital expenditures. Free cash flow is typically derived directly from the company’s consolidated statement of cash flows; however, it may be adjusted for items that affect comparability between periods.
Based on the above definition, our consolidated free cash flow is summarized as follows:
| | | | | | | | | |
| | | Years Ended December 31, |
($ in millions) | | 2017 | | 2016 | | 2015 |
| | | | | | | | | |
Total cash provided by operating activities | | $ | 1,478 | | $ | 194 | | $ | 1,007 |
Capital expenditures | | | (556) | | | (606) | | | (528) |
Free cash flow | | $ | 922 | | $ | (412) | | $ | 479 |
Based on information currently available,support EVA-enchancing contacted volumes, in 2022, we estimate cash flows from operating activities for 2018 to be in the range of $1.5 billion,expect capital expenditures to beexceed $2 billion and we intend to return approximately $600 million and free cash flow$1.75 billion to beshareholders in the rangeform of $900 million. In 2018, westock repurchases and dividends. We further intend to utilize our operating cash flowflows to service debt and to fund our growth capital projects, dividend payments, stock buybacksrequirements and, to the extent available, acquisitions that meet our variousrate of return criteria. Of the total 2018 estimated
We have committed contracts to purchase raw materials and we align these purchase commitments with long-term sales contracts with our customers such that any commitment to purchase aluminum and other direct materials corresponds to a contractual sale. These aluminum purchase commitments include pass-through provisions which generally result in proportional changes in both sales and costs of sales.
The company’s growth plans will require significant capital expenditures approximately $465 million wasover the next years. These capital expenditures will be funded by operating cash flows and external borrowings. Approximately $1.2 billion of capital expenditures were contractually committed as of December 31, 2017.
Commitments
Cash payments required2021. Maturities for Ball’s long-term debt maturities, rental payments under noncancellable operating leases, purchase obligations and other commitmentsare disclosed in effect at December 31, 2017, are summarized in the following table:
| | | | | | | | | | | | | | | |
| | Payments Due By Period (a) |
| | | | | Less than | | | | | | | | More than |
($ in millions) | | Total | | 1 Year | | 1-3 Years | | 3-5 Years | | 5 Years |
| | | | | | | | | | | | | | | |
Long-term debt, including capital leases (b) | | $ | 6,691 | | $ | 113 | | $ | 1,862 | | $ | 1,875 | | $ | 2,841 |
Interest payments on long-term debt (c) | | | 1,273 | | | 267 | | | 500 | | | 304 | | | 202 |
Purchase obligations (d) | | | 11,974 | | | 3,745 | | | 5,619 | | | 2,608 | | | 2 |
Operating leases | | | 208 | | | 45 | | | 59 | | | 37 | | | 67 |
Total payments on contractual obligations | | $ | 20,146 | | $ | 4,170 | | $ | 8,040 | | $ | 4,824 | | $ | 3,112 |
| (a)
| | Amounts reported in local currencies have been translated at year end 2017 exchange rates.
|
| (b)
| | Amounts represent future cash payments due and exclude future amortization of debt issuance costs of $60 million at December 31, 2017.
|
(c)For variable rate facilities, amounts are based on interest rates in effect at year end and do not contemplate the effects of any hedging instruments utilized by the company.
(d)The company’s purchase obligations include capital expenditures and contracted amounts for aluminum, steel and other direct materials. Also included are commitments for purchases of natural gas and electricity, expenses related to aerospace and technologies contracts and other less significant items. In cases where variable prices and/or usage are involved, management’s best estimates have been used. Depending on the circumstances, early termination of the contracts may or may not result in penalties and, therefore, actual payments could vary significantly.
The table above does not include $84 million of uncertain tax positions, the timing of which is unknown at this time.
Contributions to the company’s defined benefit pension plans, not including the unfunded German, Swedish and certain U.S. plans, are expected to be in the range of $46 million in 2018. This estimate may change based on changes in the Pension Protection Act, actual plan asset performance and available company cash flow, among other factors. Benefit payments related to these plans are expected to be approximately $397 million to $416 million for each of the years ending December 31, 2018 through 2022 and a total of $2.2 billion for the years 2023 through 2027. Payments to participants in the unfunded German, Swedish and certain U.S. plans are expected to be approximately $17 million to $21 million in each of the years 2018 through 2022 and a total of $80 million for the years 2023 through 2027.
Based on changes in return on asset and discount rate assumptions, as well as revisions based on plan experience studies, total pension expense in 2018, excluding settlement and curtailment losses, is anticipated to be approximately $20 million lower than in 2017. A reduction of the expected return on pension assets assumption by one quarter of a percentage point would result in an estimated $15 million increase in the 2018 pension expense, while a quarter of a percentage point reduction in the discount rate applied to the pension liability would result in an estimated $3 million reduction of pension expense in 2018. Additional details about our defined benefit pension plans are available in Note 15 to the consolidated financial statements within Item 8 of this annual report. Repayments of debt and other operational cash requirements will also be funded by operating cash flows and external borrowings. The company has no material off-balance sheet arrangements.
ContingenciesCONTINGENCIES, INDEMNIFICATIONS AND GUARANTEES
Details of the company’s contingencies, legal proceedings, indemnifications and guarantees are available in Note 22 and Note 23 to the consolidated financial statements within Item 8 of this annual report. The company is routinely subject to litigation incident to operating its businesses and has been designated by various federal and state environmental agencies as a potentially responsible party, along with numerous other companies, for the clean-up of several hazardous waste sites, including in respect of sites related to alleged activities of certain former Rexam subsidiaries. The company believes the matters identified will not have a material adverse effect upon its liquidity, results of operations or financial condition. Details
Guaranteed Securities
The company’s senior notes are guaranteed on a full and unconditional, joint and several basis by the issuer of the company’s legal proceedingssenior notes and the subsidiaries that guarantee the notes (the obligor group). The entities that comprise the obligor group are included100 percent owned by the company. As described in the supplemental indentures governing the company’s existing senior notes, the senior notes are guaranteed by any of the company’s domestic subsidiaries that guarantee any other indebtedness of the company.
The following summarized financial information relates to the obligor group as of and for the years ended December 31, 2021 and 2020. Intercompany transactions, equity investments and other intercompany activity between obligor group subsidiaries have been eliminated from the summarized financial information. Investments in subsidiaries not forming part of the obligor group have also been eliminated.
| | | | | | |
| | Years Ended December 31, |
($ in millions) | | 2021 | | 2020 |
| | | | | | |
Net sales | | $ | 8,083 | | $ | 7,115 |
Gross profit (a) | | | 910 | | | 935 |
Net earnings (loss) | | | 432 | | | 528 |
Net earnings (loss) attributable to Ball Corporation | | | 432 | | | 528 |
| (a) | Gross profit is shown after depreciation and amortization related to cost of sales of $210 million and $167 million for the years ended December 31, 2021 and 2020, respectively. |
| | | | | | |
| | December 31, |
($ in millions) | | 2021 | | 2020 |
| | | | | | |
Current assets | | $ | 2,575 | | $ | 2,211 |
Noncurrent assets | | | 14,818 | | | 13,701 |
Current liabilities | | | 5,067 | | | 3,704 |
Noncurrent liabilities | | | 10,989 | | | 10,854 |
Included in the amounts disclosed in the tables above, at December 31, 2021 and 2020, the obligor group held receivables due from other subsidiary companies of $436 million and $221 million, respectively, long-term notes receivable due from other subsidiary companies of $9.2 billion in both years, payables due to other subsidiary companies of $2.0 billion and $1.7 billion, respectively, and long-term notes payable due to other subsidiary companies of $2.0 billion and $1.5 billion, respectively.
For the years ended December 31, 2021 and 2020, the obligor group recorded the following transactions with other subsidiary companies: sales to them of $803 million and $804 million, respectively, net credits from them of $18 million and $24 million, respectively, and net interest income from them of $337 million and $393 million, respectively. During the years ended December 31, 2021 and 2020, the obligor group received dividends from other subsidiary companies of $269 million and $56 million, respectively.
A description of the terms and conditions of the company’s debt guarantees is located in Note 2123 to the consolidated financial statements within Item 8 of this annual report.
FORWARD-LOOKING STATEMENTS
This report contains “forward-looking”"forward-looking" statements concerning future events and financial performance. Words such as “expects,” “anticipates,” “estimates,” “believes,” “targets,” “likely”"expects," "anticipates," "estimates," "believes," and similar expressions typically identify forward-looking statements, which are generally any statements other than statements of historical fact. Such statements are based on current expectations or views of the future and are subject to risks and uncertainties, which could cause actual results or events to differ materially from those expressed or implied. Readers of this reportYou should therefore not place undue reliance upon any forward-looking statements and any of such statementsthey should be read in conjunction with, and qualified in their entirety by, the cautionary statements referenced below. The company undertakes no obligation to publicly update or revise any forward-looking statements, whether as a result of new information, future events or otherwise. Key factors, risks and uncertainties that could cause actual outcomes and results to be different are summarized in filings with the Securities and Exchange Commission, including Exhibit 99 in our Form 10-K, which are available on our website and at www.sec.govhttp://www.sec.gov/. Somewww.sec.gov. Additional factors that could cause the company’s actual results or outcomes to differ materially from those discussed include, but are not limited to the following:might affect: a) in our packaging segments:segments include product capacity, supply, and demand fluctuations;constraints and fluctuations and changes in consumption patterns; availability/cost of raw materials;materials, equipment, and logistics; competitive packaging, pricing and substitution; changes in climate and weather; competitive activity;footprint adjustments and other manufacturing changes, including the startup of new facilities and lines; failure to achieve synergies, productivity improvements or cost reductions; unfavorable mandatory deposit or other restrictive packaging laws; customer and supplier consolidation,consolidation; power and supply chain influence;interruptions; changes in major customer or supplier contracts or a loss of a major customer or supplier; inability to pass through increased costs; political instability and sanctions; currency controls; and changes in foreigncurrency exchange or non-U.S. tax rates; b)and tariffs, trade actions, or other governmental actions, including business restrictions and shelter-in-place orders in any country or jurisdiction affecting goods produced by us or in our supply chain, including imported raw materials; b) our aerospace segment:segment include funding, authorization, availability and returns of government and commercial contracts; and delays, extensions and technical uncertainties affecting segment contracts; c) in the company as a whole include those listed above plus: the extent to which sustainability-related opportunities arise and can be capitalized upon; changes in senior management;management, succession, and the ability to attract and retain skilled labor; regulatory actionactions or issues including those related to tax, ESG reporting, competition, environmental, health and workplace safety, including U.S. FDA and other actions or public concerns affecting products filled in our containers, or chemicals or substances used in raw materials or in the manufacturing process; technological developments and innovations; the ability to manage cyber threats; litigation; strikes; disease; pandemic; labor cost changes; inflation; rates of return on assets of the company's defined benefit retirement plans; pension changes; uncertainties surrounding geopolitical events and governmental policies, both in the U.S.including policies, orders, and in other countries, including the U.S. government elections, budget, sequestration and debt limit;actions related to COVID-19; reduced cash flow; ability to achieve cost-out initiatives and synergies; interest rates affecting our debt; and successful or unsuccessful joint ventures, acquisitions and divestitures, including with respect to the Rexam acquisition and its integration, or the associated divestiture; the effect of the acquisition or the divestituretheir effects on our business relationships, operating results and business generally.
Item 7A. Quantitative and Qualitative Disclosures About Market Risk
Financial Instruments and Risk Management
The company employs established risk management policies and procedures which seek to reduce the company’s commercial risk exposure to fluctuations in commodity prices, interest rates, currency exchange rates and prices of the company’s common stock with regard to common share repurchases and the company’s deferred compensation stock plan. However, there can be no assurance that these policies and procedures will be successful. Although the instruments utilized involve varying degrees of credit, market and interest risk, the counterparties to the agreements are expected to perform fully under the terms of the agreements. The company monitors counterparty credit risk, including lenders, on a regular basis, but Ball cannot be certain that all risks will be discerned or that its risk management policies and procedures will always be effective. Additionally, in the event of default under the company’s master derivative agreements, the non-defaulting party has the option to set off any amounts owed with regard to open derivative positions.
We have estimated our market risk exposure using sensitivity analysis. Market risk exposure has been defined as the changes in fair value of derivative instruments, financial instruments and commodity positions. To test the sensitivity of our market risk exposure, we have estimated the changes in fair value of market risk sensitive instruments assuming a hypothetical 10 percent adverse change in market prices or rates. The results of the sensitivity analyses are summarized below.
Commodity Price Risk
Aluminum
We manage commodity price risk in connection with market price fluctuations of aluminum ingot through two different methods. First, we enter into container sales contracts that include aluminum ingot-basedaluminum-based pricing terms that generally reflect the same price fluctuations included in commercial purchase contracts for aluminum sheet. The terms include fixed, floating or pass-through aluminum ingot component pricing. Second, we use derivative instruments such as option and forward contracts as economic and cash flow hedges of commodity price risk where there are material differences between sales and purchase contracted pricing and volume.
Steel
Most sales contracts involving our steel products either include provisions permitting us to pass through some or all steel cost changes incurred, or they incorporate annually negotiated steel prices. We anticipate at this time that we will be able to pass through the majority of any steel price changes that may occur in 2018.
Considering the effects of derivative instruments, the company’s ability to pass through certain raw material costs through contractual provisions, the market’s ability to accept price increases and the company’s commodity price exposures under its contract terms, a hypothetical 10 percent adverse change in the company’s steel and aluminum prices would result in an estimated $8$4 million after taxafter-tax reduction in net earnings over a one-year period. Additionally, the company has currency exposures on raw materials and the effect of a 10 percent adverse change is included in the total currency exposure discussed below. Actual results may vary based on actual changes in market prices and rates.
Other
The company is also exposed to fluctuations in prices for natural gas and electricity, as well as the cost of diesel fuel as a component of freight cost. A hypothetical 10 percent increase in our natural gas and electricity prices would result in an estimated $14 million after tax reduction of net earnings over a one-year period. A hypothetical 10 percent increase in diesel fuel prices would result in a less than $1 million after tax reduction of net earnings over the same period. Actual results may vary based on actual changes in market prices and rates.
Interest Rate Risk
Our objective in managing exposure to interest rate changes is to minimize the impact of interest rate changes on earnings and cash flows and to minimize our overall borrowing and receivables factoring costs. To achieve these objectives, we may use a variety of interest rate swaps, collars and options to manage our mix of floating and fixed-rate debt. Interest rate instruments held by the company at December 31, 2017,2021, included pay-fixed interest rate swaps and options which effectively convert variable rate obligations to fixed-rate instruments.
Based on our interest rate exposure at December 31, 2017,2021, assumed floating rate debt levels throughout the next 12 months and the effects of our existing derivative instruments, a 100-basis point increase in interest rates would result in an estimated $7$3 million after taxafter-tax reduction in net earnings over a one-year period. Actual results may vary based on actual changes in market prices and rates and the timing of these changes.
Currency Exchange Rate Risk
Our objective in managing exposure to currency fluctuations is to limit the exposure of cash flows and earnings from changes associated with currency exchange rate changes through the use of various derivative contracts. In addition, at times Ball manages earnings translation volatility through the use of currency option strategies, and the change in the fair value of those options is recorded in the company’s net earnings. Our currency translation risk results from the currencies in which we transact business. The company faces currency exposures in our global operations as a result of various factors including intercompany currency denominated loans, selling our products in various currencies, purchasing raw materials and equipment in various currencies and tax exposures not denominated in the functional currency. Sales contracts are negotiated with customers to reflect cost changes and, where there is not an exchange pass-through arrangement, the company usesmay use forward and option contracts to manage significant currency exposures.
Considering the company’s derivative financial instruments outstanding at December 31, 2017,2021, and the various currency exposures, a hypothetical 10 percent reduction (U.S. dollar strengthening, mainly against the Russian ruble)strengthening) in currency exchange rates compared to the U.S. dollar would result in an estimated $15$13 million after taxafter-tax reduction in net earnings over a one-year period. This hypothetical adverse change in the U.S. dollar’s currency exchange rates would also reduceincrease our forecasted average debt balance by $132 million and increase our forecasted cross currency swap value by $129$227 million. Actual changes in market prices or rates may differ from hypothetical changes.
Common Stock Price Risk
The company’s deferred compensation stock program is subject to variable plan accounting and, accordingly, is marked to fair value using the company’s closing stock price at the end of the related reporting period. The company entered into total return swaps to reduce the company’s earnings exposure to these fair value fluctuations that will be outstanding until June 2018 and such swaps have a combined notional value of 2.7 million shares. Based on current levels in the program, each $1 change in the company’s stock price has an insignificant impact on pretax earnings, net of the impact of related derivatives.
Item 8.Financial Statements and Supplementary Data
Report of Independent Registered Public Accounting Firm
To the Board of Directors and Shareholders of Ball Corporation
Opinions on the Financial Statements and Internal Control over Financial Reporting
We have audited the accompanying consolidated balance sheets of Ball Corporation and its subsidiaries (the “Company”) as of December 31, 20172021 and 2016,2020, and the related consolidated statements of earnings, of comprehensive earnings (loss), shareholders’of shareholders' equity and of cash flows for each of the three years in the period ended December 31, 2017,2021, including the related notes (collectively referred to as the “consolidated financial statements”). We also have audited the Company's internal control over financial reporting as of December 31, 2017,2021, based on criteria established in Internal Control - Integrated Framework (2013) issued by the Committee of Sponsoring Organizations of the Treadway Commission (“COSO”)(COSO).
In our opinion, the consolidated financial statements referred to above present fairly, in all material respects, the financial position of the Company as of December 31, 20172021 and 2016,2020, and the results of theirits operations and theirits cash flows for each of the three years in the period ended December 31, 20172021 in conformity with accounting principles generally accepted in the United States of America. Also in our opinion, the Company maintained, in all material respects, effective internal control over financial reporting as of December 31, 2017,2021, based on criteria established in Internal Control - Integrated Framework (2013) issued by the COSO.
Basis for Opinions
The Company's management is responsible for these consolidated financial statements, for maintaining effective internal control over financial reporting, and for its assessment of the effectiveness of internal control over financial reporting,, included in Management’s Report on Internal Control Over Financial Reporting appearing under Item 9A. Our responsibility is to express opinions on the Company’s consolidated financial statements and on the Company's internal control over financial reporting based on our audits. We are a public accounting firm registered with the Public Company Accounting Oversight Board (United States) ("PCAOB")(PCAOB) and are required to be independent with respect to the Company in accordance with the U.S. federal securities laws and the applicable rules and regulations of the Securities and Exchange Commission and the PCAOB.
We conducted our audits in accordance with the standards of the PCAOB. Those standards require that we plan and perform the audits to obtain reasonable assurance about whether the consolidated financial statements are free of material misstatement, whether due to error or fraud, and whether effective internal control over financial reporting was maintained in all material respects.
Our audits of the consolidated financial statements included performing procedures to assess the risks of material misstatement of the consolidated financial statements, whether due to error or fraud, and performing procedures that respond to those risks. Such procedures included examining, on a test basis, evidence regarding the amounts and disclosures in the consolidated financial statements. Our audits also included evaluating the accounting principles used and significant estimates made by management, as well as evaluating the overall presentation of the consolidated financial statements. Our audit of internal control over financial reporting included obtaining an understanding of internal control over financial reporting, assessing the risk that a material weakness exists, and testing and evaluating the design and operating effectiveness of internal control based on the assessed risk. Our audits also included performing such other procedures as we considered necessary in the circumstances. We believe that our audits provide a reasonable basis for our opinions.
Definition and Limitations of Internal Control over Financial Reporting
A company’s internal control over financial reporting is a process designed to provide reasonable assurance regarding the reliability of financial reporting and the preparation of financial statements for external purposes in accordance with generally accepted accounting principles. A company’s internal control over financial reporting includes those policies and procedures that (i) pertain to the maintenance of records that, in reasonable detail, accurately and fairly reflect the transactions and dispositions of the assets of the company; (ii) provide reasonable assurance that transactions are
recorded as necessary to permit preparation of financial statements in accordance with generally accepted accounting principles, and that receipts and expenditures of the company are being made only in accordance with authorizations of management and directors of the company; and (iii) provide reasonable assurance regarding prevention or timely detection of unauthorized acquisition, use, or disposition of the company’s assets that could have a material effect on the financial statements.
Because of its inherent limitations, internal control over financial reporting may not prevent or detect misstatements. Also, projections of any evaluation of effectiveness to future periods are subject to the risk that controls may become inadequate because of changes in conditions, or that the degree of compliance with the policies or procedures may deteriorate.
Critical Audit Matters
The critical audit matter communicated below is a matter arising from the current period audit of the consolidated financial statements that was communicated or required to be communicated to the audit committee and that (i) relates to accounts or disclosures that are material to the consolidated financial statements and (ii) involved our especially challenging, subjective, or complex judgments. The communication of critical audit matters does not alter in any way our opinion on the consolidated financial statements, taken as a whole, and we are not, by communicating the critical audit matter below, providing a separate opinion on the critical audit matter or on the accounts or disclosures to which it relates.
Revenue Recognition - Estimated Costs at Completion for Aerospace Fixed-Price Contracts
As described in Notes 1 and 3 to the consolidated financial statements, net sales for the aerospace segment were $1.9 billion for the year ended December 31, 2021, including sales under fixed-price long-term contracts, which are primarily recognized using percentage-of-completion accounting under the cost-to-cost method. The percentage-of-completion method of accounting involves the use of various estimating techniques to project revenues and costs at completion and various assumptions and projections related to the outcome of future events, including the quantity and timing of product deliveries, future labor performance and rates, and material and overhead costs. Throughout the period of contract performance, management regularly evaluates and, if necessary, revises its estimates of total contract revenue, total contract cost, and extent of progress toward completion.
The principal considerations for our determination that performing procedures relating to revenue recognition - estimated costs at completion for aerospace fixed-price contracts is a critical audit matter are the significant judgment by management when determining the estimated costs at completion for such contracts. This in turn led to a high degree of auditor judgment, subjectivity, and effort in performing procedures and in evaluating the related audit evidence over management’s assumptions of estimated costs at completion for aerospace fixed-price contracts related to the availability and cost volatility of materials, subcontractor and vendor performance, and schedule and performance delays.
Addressing the matter involved performing procedures and evaluating audit evidence in connection with forming our overall opinion on the consolidated financial statements. These procedures included testing the effectiveness of controls relating to the accuracy of estimated costs at completion for aerospace fixed-price contracts. These procedures also included, among others, evaluating and testing management’s process for determining the estimated costs at completion for a sample of aerospace fixed-price contracts, including assessing the reasonableness of the significant assumptions related to each contract. Evaluating the reasonableness of management’s assumptions related to the availability and cost volatility of materials, subcontractor and vendor performance, and schedule and performance delays involved assessing the nature and status of the aerospace fixed-price contracts, performing retrospective reviews of the aerospace fixed-price contract estimates and changes in estimates over time, obtaining evidence to support estimated costs at completion, and assessing the reasonableness of factors considered and significant assumptions made by management in determining the estimated costs at completion used to recognize revenue.
/s/ PricewaterhouseCoopers LLP
Denver, Colorado
February 28, 201816, 2022
We have served as the Company’s auditor since at least 1962. We have not determinedbeen able to determine the specific year we began serving as auditor of the Company.
Consolidated Statements of Earnings
Ball Corporation
| | | | | | | | | | |
| | Years Ended December 31, | |
($ in millions, except per share amounts) | | 2017 | | 2016 | | 2015 | |
| | | | | | | | | | |
Net sales | | $ | 10,983 | | $ | 9,061 | | $ | 7,997 | |
| | | | | | | | | | |
Costs and expenses | | | | | | | | | | |
Cost of sales (excluding depreciation and amortization) | | | (8,717) | | | (7,296) | | | (6,460) | |
Depreciation and amortization | | | (729) | | | (453) | | | (286) | |
Selling, general and administrative | | | (514) | | | (512) | | | (450) | |
Business consolidation and other activities | | | (221) | | | (337) | | | (195) | |
| | | (10,181) | | | (8,598) | | | (7,391) | |
| | | | | | | | | | |
Earnings before interest and taxes | | | 802 | | | 463 | | | 606 | |
| | | | | | | | | | |
Interest expense | | | (285) | | | (229) | | | (143) | |
Debt refinancing and other costs | | | (3) | | | (109) | | | (117) | |
Total interest expense | | | (288) | | | (338) | | | (260) | |
| | | | | | | | | | |
Earnings before taxes | | | 514 | | | 125 | | | 346 | |
Tax (provision) benefit | | | (165) | | | 126 | | | (47) | |
Equity in results of affiliates, net of tax | | | 31 | | | 15 | | | 4 | |
Net earnings | | | 380 | | | 266 | | | 303 | |
Net earnings attributable to noncontrolling interests | | | (6) | | | (3) | | | (22) | |
Net earnings attributable to Ball Corporation | | $ | 374 | | $ | 263 | | $ | 281 | |
| | | | | | | | | | |
| | | | | | | | | | |
Earnings per share: (a) | | | | | | | | | | |
Basic | | $ | 1.07 | | $ | 0.83 | | $ | 1.02 | |
Diluted | | $ | 1.05 | | $ | 0.81 | | $ | 1.00 | |
| | | | | | | | | | |
| | | | | | | | | | |
Weighted average shares outstanding: (000s) (a) | | | | | | | | | | |
Basic | | | 350,269 | | | 316,542 | | | 274,600 | |
Diluted | | | 356,985 | | | 322,884 | | | 281,968 | |
| | | | | | | | | | |
Cash dividends declared and paid, per share (a) | | $ | 0.365 | | $ | 0.26 | | $ | 0.26 | |
| (a)
| | Amounts in 2016 and 2015 have been retrospectively adjusted for the two-for-one stock split that was effective on May 16, 2017.
|
| | | | | | | | |
| Years Ended December 31, |
($ in millions, except per share amounts) | 2021 | | 2020 | | 2019 |
| | | | | | | | |
Net sales | $ | 13,811 | | $ | 11,781 | | $ | 11,474 |
| | | | | | | | |
Costs and expenses | | | | | | | | |
Cost of sales (excluding depreciation and amortization) | | (11,085) | | | (9,323) | | | (9,203) |
Depreciation and amortization | | (700) | | | (668) | | | (678) |
Selling, general and administrative | | (593) | | | (525) | | | (417) |
Business consolidation and other activities | | (142) | | | (262) | | | (244) |
| | (12,520) | | | (10,778) | | | (10,542) |
| | | | | | | | |
Earnings before interest and taxes | | 1,291 | | | 1,003 | | | 932 |
| | | | | | | | |
Interest expense | | (270) | | | (275) | | | (317) |
Debt refinancing and other costs | | (13) | | | (41) | | | (7) |
Total interest expense | | (283) | | | (316) | | | (324) |
| | | | | | | | |
Earnings before taxes | | 1,008 | | | 687 | | | 608 |
Tax (provision) benefit | | (156) | | | (99) | | | (71) |
Equity in results of affiliates, net of tax | | 26 | | | (6) | | | (1) |
Net earnings | | 878 | | | 582 | | | 536 |
Net (earnings) loss attributable to noncontrolling interests | | — | | | 3 | | | 30 |
Net earnings attributable to Ball Corporation | $ | 878 | | $ | 585 | | $ | 566 |
| | | | | | | | |
| | | | | | | | |
Earnings per share: | | | | | | | | |
Basic | $ | 2.69 | | $ | 1.79 | | $ | 1.71 |
Diluted | $ | 2.65 | | $ | 1.76 | | $ | 1.66 |
| | | | | | | | |
| | | | | | | | |
Weighted average shares outstanding: (000s) | | | | | | | | |
Basic | | 325,989 | | | 326,260 | | | 331,102 |
Diluted | | 331,615 | | | 332,815 | | | 340,121 |
| | | | | | | | |
The accompanying notes are an integral part of the consolidated financial statements.
Consolidated Statements of Comprehensive Earnings (Loss)
Ball Corporation
| | | | | | | | | | |
| | Years Ended December 31, | |
($ in millions) | | 2017 | | 2016 | | 2015 | |
| | | | | | | | | | |
Net earnings | | $ | 380 | | $ | 266 | | $ | 303 | |
| | | | | | | | | | |
Other comprehensive earnings (loss): | | | | | | | | | | |
Foreign currency translation adjustment | | | 38 | | | (160) | | | (166) | |
Pension and other postretirement benefits | | | 296 | | | (178) | | | 78 | |
Effective financial derivatives | | | 17 | | | 9 | | | (9) | |
Total other comprehensive earnings (loss) | | | 351 | | | (329) | | | (97) | |
Income tax (provision) benefit | | | (65) | | | 27 | | | (21) | |
Total other comprehensive earnings (loss), net of tax | | | 286 | | | (302) | | | (118) | |
| | | | | | | | | | |
Total comprehensive earnings | | | 666 | | | (36) | | | 185 | |
Comprehensive (earnings) loss attributable to noncontrolling interests | | | (7) | | | (2) | | | (22) | |
Comprehensive earnings (loss) attributable to Ball Corporation | | $ | 659 | | $ | (38) | | $ | 163 | |
| | | | | | | | | | |
| | | Years Ended December 31, |
($ in millions) | | | 2021 | | 2020 | | 2019 |
| | | | | | | | | | |
Net earnings | | | $ | 878 | | $ | 582 | | $ | 536 |
| | | | | | | | | | |
Other comprehensive earnings (loss): | | | | | | | | | | |
Currency translation adjustment | | | | 19 | | | (215) | | | 166 |
Pension and other postretirement benefits | | | | 392 | | | 118 | | | (270) |
Derivatives designated as hedges | | | | 70 | | | 102 | | | 58 |
Total other comprehensive earnings (loss) | | | | 481 | | | 5 | | | (46) |
Income tax (provision) benefit | | | | (109) | | | (49) | | | 50 |
Total other comprehensive earnings (loss), net of tax | | | | 372 | | | (44) | | | 4 |
| | | | | | | | | | |
Total comprehensive earnings (loss) | | | | 1,250 | | | 538 | | | 540 |
Comprehensive (earnings) loss attributable to noncontrolling interests | | | | — | | | 3 | | | 30 |
Comprehensive earnings (loss) attributable to Ball Corporation | | | $ | 1,250 | | $ | 541 | | $ | 570 |
The accompanying notes are an integral part of the consolidated financial statements.
Consolidated Balance Sheets
Ball Corporation
| | | | | | | |
| | December 31, | |
($ in millions) | | 2017 | | 2016 | |
| | | | | | | |
Assets | | | | | | | |
Current assets | | | | | | | |
Cash and cash equivalents | | $ | 448 | | $ | 597 | |
Receivables, net | | | 1,634 | | | 1,491 | |
Inventories, net | | | 1,526 | | | 1,413 | |
Other current assets | | | 150 | | | 152 | |
Total current assets | | | 3,758 | | | 3,653 | |
Noncurrent assets | | | | | | | |
Property, plant and equipment, net | | | 4,610 | | | 4,387 | |
Goodwill | | | 4,933 | | | 5,095 | |
Intangible assets, net | | | 2,462 | | | 1,934 | |
Other assets | | | 1,406 | | | 1,104 | |
Total assets | | $ | 17,169 | | $ | 16,173 | |
| | | | | | | |
Liabilities and Shareholders' Equity | | | | | | | |
Current liabilities | | | | | | | |
Short-term debt and current portion of long-term debt | | $ | 453 | | $ | 222 | |
Accounts payable | | | 2,762 | | | 2,033 | |
Accrued employee costs | | | 352 | | | 315 | |
Other current liabilities | | | 540 | | | 399 | |
Total current liabilities | | | 4,107 | | | 2,969 | |
Noncurrent liabilities | | | | | | | |
Long-term debt | | | 6,518 | | | 7,310 | |
Employee benefit obligations | | | 1,463 | | | 1,497 | |
Deferred taxes | | | 695 | | | 439 | |
Other liabilities | | | 340 | | | 417 | |
Total liabilities | | | 13,123 | | | 12,632 | |
| | | | | | | |
Shareholders' equity | | | | | | | |
Common stock (670,576,215 shares issued - 2017; 668,504,350 shares issued - 2016) (a) | | | 1,084 | | | 1,038 | |
Retained earnings | | | 4,987 | | | 4,739 | |
Accumulated other comprehensive earnings (loss) | | | (656) | | | (941) | |
Treasury stock, at cost (320,694,598 shares - 2017; 318,774,098 shares - 2016) (a) | | | (1,474) | | | (1,401) | |
Total Ball Corporation shareholders' equity | | | 3,941 | | | 3,435 | |
Noncontrolling interests | | | 105 | | | 106 | |
Total shareholders' equity | | | 4,046 | | | 3,541 | |
Total liabilities and shareholders' equity | | $ | 17,169 | | $ | 16,173 | |
| (a)
| | Amounts in 2016 have been retrospectively adjusted for the two-for-one stock split that was effective on May 16, 2017.
|
| | | | | | |
| | December 31, | | December 31, |
($ in millions) | | 2021 | | 2020 |
| | | | | | |
Assets | | | | | | |
Current assets | | | | | | |
Cash and cash equivalents | | $ | 563 | | $ | 1,366 |
Receivables, net | | | 2,560 | | | 1,738 |
Inventories, net | | | 1,795 | | | 1,353 |
Other current assets | | | 305 | | | 218 |
Total current assets | | | 5,223 | | | 4,675 |
Noncurrent assets | | | | | | |
Property, plant and equipment, net | | | 6,502 | | | 5,351 |
Goodwill | | | 4,378 | | | 4,484 |
Intangible assets, net | | | 1,688 | | | 1,883 |
Other assets | | | 1,923 | | | 1,859 |
Total assets | | $ | 19,714 | | $ | 18,252 |
| | | | | | |
Liabilities and Equity | | | | | | |
Current liabilities | | | | | | |
Short-term debt and current portion of long-term debt | | $ | 15 | | $ | 17 |
Accounts payable | | | 4,759 | | | 3,430 |
Accrued employee costs | | | 349 | | | 347 |
Other current liabilities | | | 830 | | | 650 |
Total current liabilities | | | 5,953 | | | 4,444 |
Noncurrent liabilities | | | | | | |
Long-term debt | | | 7,722 | | | 7,783 |
Employee benefit obligations | | | 1,205 | | | 1,613 |
Deferred taxes | | | 665 | | | 634 |
Other liabilities | | | 484 | | | 441 |
Total liabilities | | | 16,029 | | | 14,915 |
| | | | | | |
Equity | | | | | | |
Common stock (680,944,867 shares issued - 2021; 679,524,325 shares issued - 2020) | | | 1,220 | | | 1,167 |
Retained earnings | | | 6,843 | | | 6,192 |
Accumulated other comprehensive earnings (loss) | | | (582) | | | (954) |
Treasury stock, at cost (360,101,024 shares - 2021; 351,938,709 shares - 2020) | | | (3,854) | | | (3,130) |
Total Ball Corporation shareholders' equity | | | 3,627 | | | 3,275 |
Noncontrolling interests | | | 58 | | | 62 |
Total equity | | | 3,685 | | | 3,337 |
Total liabilities and equity | | $ | 19,714 | | $ | 18,252 |
The accompanying notes are an integral part of the consolidated financial statements.
Consolidated Statements of Cash Flows
Ball Corporation
| | | | | | | | | | |
| | Years Ended December 31, | |
($ in millions) | | 2017 | | 2016 | | 2015 | |
| | | | | | | | | | |
Cash Flows from Operating Activities | | | | | | | | | | |
Net earnings | | $ | 380 | | $ | 266 | | $ | 303 | |
Adjustments to reconcile net earnings to cash provided by | | | | | | | | | | |
(used in) continuing operating activities: | | | | | | | | | | |
Depreciation and amortization | | | 729 | | | 453 | | | 286 | |
Business consolidation and other activities | | | 221 | | | 337 | | | 195 | |
Deferred tax provision (benefit) | | | 82 | | | (293) | | | (62) | |
Other, net | | | (268) | | | (60) | | | 145 | |
Working capital changes, excluding effects of acquisitions (a): | | | | | | | | | | |
Receivables | | | (189) | | | (53) | | | 35 | |
Inventories | | | (66) | | | 30 | | | 97 | |
Other current assets | | | 12 | | | 65 | | | 10 | |
Accounts payable | | | 639 | | | (55) | | | 125 | |
Accrued employee costs | | | 5 | | | (14) | | | (36) | |
Other current liabilities | | | (18) | | | (481) | | | (107) | |
Other, net | | | (49) | | | (1) | | | 16 | |
Total cash provided by (used in) operating activities | | | 1,478 | | | 194 | | | 1,007 | |
Cash Flows from Investing Activities | | | | | | | | | | |
Capital expenditures | | | (556) | | | (606) | | | (528) | |
Business acquisitions, net of cash acquired | | | — | | | (3,379) | | | (29) | |
Proceeds from dispositions, net of cash sold | | | (2) | | | 2,938 | | | 1 | |
Restricted cash, net | | | — | | | 1,966 | | | (2,183) | |
Settlement of Rexam acquisition related derivatives | | | — | | | (252) | | | (16) | |
Other, net | | | 13 | | | 5 | | | 34 | |
Cash provided by (used in) investing activities | | | (545) | | | 672 | | | (2,721) | |
Cash Flows from Financing Activities | | | | | | | | | | |
Long-term borrowings | | | 765 | | | 4,370 | | | 4,524 | |
Repayments of long-term borrowings | | | (1,810) | | | (4,624) | | | (2,430) | |
Net change in short-term borrowings | | | 184 | | | 23 | | | (93) | |
Proceeds from issuances of common stock | | | 27 | | | 48 | | | 36 | |
Acquisitions of treasury stock | | | (103) | | | (107) | | | (136) | |
Common dividends | | | (129) | | | (83) | | | (72) | |
Other, net | | | (7) | | | (14) | | | (92) | |
Cash provided by (used in) financing activities | | | (1,073) | | | (387) | | | 1,737 | |
| | | | | | | | | | |
Effect of exchange rate changes on cash | | | (9) | | | (106) | | | 10 | |
| | | | | | | | | | |
Change in cash and cash equivalents | | | (149) | | | 373 | | | 33 | |
Cash and cash equivalents – beginning of year | | | 597 | | | 224 | | | 191 | |
Cash and cash equivalents – end of year | | $ | 448 | | $ | 597 | | $ | 224 | |
| (a)
| | Includes payments of costs associated with the acquisition of Rexam and the sale of the Divestment Business.
|
| | | | | | | | | | |
| | Years Ended December 31, | |
($ in millions) | | 2021 | | 2020 | | 2019 | |
| | | | | | | | | | |
Cash Flows from Operating Activities | | | | | | | | | | |
Net earnings | | $ | 878 | | $ | 582 | | $ | 536 | |
Adjustments to reconcile net earnings to cash provided by (used in) operating activities: | | | | | | | | | | |
Depreciation and amortization | | | 700 | | | 668 | | | 678 | |
Business consolidation and other activities | | | 142 | | | 262 | | | 244 | |
Deferred tax provision (benefit) | | | 35 | | | 17 | | | (45) | |
Other, net | | | (115) | | | 9 | | | (101) | |
Working capital changes, excluding effects of acquisitions and dispositions: | | | | | | | | | | |
Receivables | | | (863) | | | (135) | | | 49 | |
Inventories | | | (464) | | | (64) | | | (45) | |
Other current assets | | | (24) | | | 5 | | | (18) | |
Accounts payable | | | 1,312 | | | 66 | | | 72 | |
Accrued employee costs | | | (1) | | | 84 | | | (1) | |
Other current liabilities | | | 159 | | | (35) | | | 175 | |
Other, net | | | 1 | | | (27) | | | 4 | |
Cash provided by (used in) operating activities | | | 1,760 | | | 1,432 | | | 1,548 | |
Cash Flows from Investing Activities | | | | | | | | | | |
Capital expenditures | | | (1,726) | | | (1,113) | | | (598) | |
Business acquisitions, net of cash acquired | | | — | | | (69) | | | — | |
Business dispositions, net of cash sold | | | 112 | | | (17) | | | 160 | |
Other, net | | | (25) | | | 18 | | | 16 | |
Cash provided by (used in) investing activities | | | (1,639) | | | (1,181) | | | (422) | |
Cash Flows from Financing Activities | | | | | | | | | | |
Long-term borrowings | | | 850 | | | 2,552 | | | 2,819 | |
Repayments of long-term borrowings | | | (750) | | | (2,794) | | | (1,524) | |
Net change in short-term borrowings | | | (2) | | | (20) | | | (183) | |
Proceeds (payments) from issuances of common stock, net of shares used for taxes | | | 47 | | | (18) | | | 19 | |
Acquisitions of treasury stock | | | (766) | | | (57) | | | (964) | |
Common dividends | | | (229) | | | (198) | | | (182) | |
Other, net | | | (44) | | | (67) | | | (31) | |
Cash provided by (used in) financing activities | | | (894) | | | (602) | | | (46) | |
| | | | | | | | | | |
Effect of exchange rate changes on cash | | | (29) | | | (74) | | | (2) | |
| | | | | | | | | | |
Change in cash, cash equivalents and restricted cash | | | (802) | | | (425) | | | 1,078 | |
Cash, cash equivalents and restricted cash – beginning of year | | | 1,381 | | | 1,806 | | | 728 | |
Cash, cash equivalents and restricted cash – end of year | | $ | 579 | | $ | 1,381 | | $ | 1,806 | |
The accompanying notes are an integral part of the consolidated financial statements.
Consolidated Statements of Shareholders’ Equity
Ball Corporation
| | | | | | | | | | | | | | | | | | | | | | | |
| | Ball Corporation and Subsidiaries | | | | | | | |
| | Common Stock | | Treasury Stock | | | | | Accumulated Other | | | | | Total | |
| | Number of | | | | Number of | | | | Retained | | Comprehensive | | Noncontrolling | | Shareholders' | |
($ in millions; share amounts in thousands) | | Shares (a) | | Amount | | Shares (a) | | Amount | | Earnings | | Income (Loss) | | Interest | | Equity | |
| | | | | | | | | | | | | | | | | | | | | | | |
Balance at December 31, 2014 | | 663,236 | | $ | 1,132 | | (389,304) | | $ | (3,923) | | $ | 4,347 | | $ | (522) | | $ | 206 | | $ | 1,240 | |
Net earnings | | — | | | — | | — | | | — | | | 281 | | | — | | | 22 | | | 303 | |
Other comprehensive earnings, net of tax | | — | | | — | | — | | | — | | | — | | | (118) | | | — | | | (118) | |
Common dividends, net of tax benefits | | — | | | — | | — | | | — | | | (71) | | | — | | | — | | | (71) | |
Treasury stock purchases | | — | | | — | | (3,532) | | | (136) | | | — | | | — | | | — | | | (136) | |
Treasury shares reissued | | — | | | — | | 658 | | | 23 | | | — | | | — | | | — | | | 23 | |
Shares issued and stock compensation for stock options and other stock plans, net of shares exchanged | | 2,062 | | | 29 | | — | | | — | | | — | | | — | | | — | | | 29 | |
Tax benefit on option exercises | | — | | | 21 | | — | | | — | | | — | | | — | | | — | | | 21 | |
Dividends paid to noncontrolling interests | | — | | | — | | — | | | — | | | — | | | — | | | (18) | | | (18) | |
Acquisition of noncontrolling interests | | — | | | (220) | | 11,460 | | | 403 | | | — | | | — | | | (200) | | | (17) | |
Other activity | | — | | | — | | — | | | 5 | | | — | | | — | | | — | | | 5 | |
Balance at December 31, 2015 | | 665,298 | | | 962 | | (380,718) | | | (3,628) | | | 4,557 | | | (640) | | | 10 | | | 1,261 | |
Net earnings | | — | | | — | | — | | | — | | | 263 | | | — | | | 3 | | | 266 | |
Other comprehensive earnings, net of tax | | — | | | — | | — | | | — | | | — | | | (301) | | | (1) | | | (302) | |
Common dividends, net of tax benefits | | — | | | — | | — | | | — | | | (81) | | | — | | | — | | | (81) | |
Treasury stock purchases | | — | | | — | | (3,198) | | | (107) | | | — | | | — | | | — | | | (107) | |
Treasury shares reissued | | — | | | — | | 640 | | | 23 | | | — | | | — | | | — | | | 23 | |
Shares issued and stock compensation for stock options and other stock plans, net of shares exchanged | | 3,206 | | | 54 | | | | | — | | | — | | | — | | | — | | | 54 | |
Tax benefit on option exercises | | — | | | 22 | | — | | | — | | | — | | | — | | | — | | | 22 | |
Acquisition of Rexam | | — | | | — | | 64,502 | | | 2,302 | | | — | | | — | | | 94 | | | 2,396 | |
Other activity | | — | | | — | | — | | | 9 | | | — | | | — | | | — | | | 9 | |
Balance at December 31, 2016 | | 668,504 | | | 1,038 | | (318,774) | | | (1,401) | | | 4,739 | | | (941) | | | 106 | | | 3,541 | |
Net earnings | | — | | | — | | — | | | — | | | 374 | | | — | | | 6 | | | 380 | |
Other comprehensive earnings, net of tax | | — | | | — | | — | | | — | | | — | | | 285 | | | 1 | | | 286 | |
Common dividends, net of tax benefits | | — | | | — | | — | | | — | | | (126) | | | — | | | — | | | (126) | |
Treasury stock purchases | | — | | | — | | (2,552) | | | (103) | | | — | | | — | | | — | | | (103) | |
Treasury shares reissued | | — | | | — | | 631 | | | 22 | | | — | | | — | | | — | | | 22 | |
Shares issued and stock compensation for stock options and other stock plans, net of shares exchanged | | 2,072 | | | 46 | | — | | | — | | | — | | | — | | | — | | | 46 | |
Dividends paid to noncontrolling interests | | — | | | — | | — | | | — | | | — | | | — | | | (5) | | | (5) | |
Other activity | | — | | | — | | — | | | 8 | | | — | | | — | | | (3) | | | 5 | |
Balance at December 31, 2017 | | 670,576 | | $ | 1,084 | | (320,695) | | $ | (1,474) | | $ | 4,987 | | $ | (656) | | $ | 105 | | $ | 4,046 | |
| (a)
| | Amounts in 2016, 2015 and 2014 have been retrospectively adjusted for the two-for-one stock split that was effective on May 16, 2017.
|
| | | | | | | | | | | | | | | | | | | | | | | |
| | Ball Corporation and Subsidiaries | | | | | | | |
| | Common Stock | | Treasury Stock | | | | | Accumulated Other | | | | | Total | |
| | Number of | | | | Number of | | | | Retained | | Comprehensive | | Noncontrolling | | Shareholders' | |
($ in millions; share amounts in thousands) | | Shares | | Amount | �� | Shares | | Amount | | Earnings | | Earnings (Loss) | | Interest | | Equity | |
| | | | | | | | | | | | | | | | | | | | | | | |
Balance at December 31, 2018 | | 673,237 | | | 1,157 | | (337,979) | | | (2,205) | | | 5,341 | | | (835) | | | 104 | | | 3,562 | |
Net earnings | | — | | | — | | — | | | — | | | 566 | | | — | | | (30) | | | 536 | |
Other comprehensive earnings (loss), net of tax | | — | | | — | | — | | | — | | | — | | | (41) | | | — | | | (41) | |
Currency translation recognized in earnings from the sale of the Argentina steel aerosol business | | — | | | — | | — | | | — | | | — | | | 45 | | | — | | | 45 | |
Reclassification of stranded tax effects | | — | | | — | | — | | | — | | | 79 | | | (79) | | | — | | | — | |
Common dividends, net of tax benefits | | — | | | — | | — | | | — | | | (181) | | | — | | | — | | | (181) | |
Treasury stock purchases | | — | | | — | | (14,383) | | | (950) | | | — | | | — | | | — | | | (950) | |
Treasury shares reissued | | — | | | — | | 695 | | | 25 | | | — | | | — | | | — | | | 25 | |
Shares issued and stock compensation for stock options and other stock plans, net of shares exchanged | | 3,065 | | | 21 | | — | | | — | | | — | | | — | | | — | | | 21 | |
Other activity | | — | | | — | | — | | | 8 | | | (2) | | | — | | | (4) | | | 2 | |
Balance at December 31, 2019 | | 676,302 | | | 1,178 | | (351,667) | | | (3,122) | | | 5,803 | | | (910) | | | 70 | | | 3,019 | |
Net earnings | | — | | | — | | — | | | — | | | 585 | | | — | | | (3) | | | 582 | |
Other comprehensive earnings (loss), net of tax | | — | | | — | | — | | | — | | | — | | | (44) | | | — | | | (44) | |
Common dividends, net of tax benefits | | — | | | — | | — | | | — | | | (197) | | | — | | | — | | | (197) | |
Treasury stock purchases | | — | | | — | | (775) | | | (54) | | | — | | | — | | | — | | | (54) | |
Treasury shares reissued | | — | | | — | | 503 | | | 28 | | | — | | | — | | | — | | | 28 | |
Shares issued and stock compensation for stock options and other stock plans, net of shares exchanged | | 3,222 | | | (11) | | — | | | — | | | — | | | — | | | — | | | (11) | |
Dividends paid to noncontrolling interest | | — | | | — | | — | | | — | | | — | | | — | | | (5) | | | (5) | |
Other activity | | — | | | — | | — | | | 18 | | | 1 | | | — | | | — | | | 19 | |
Balance at December 31, 2020 | | 679,524 | | | 1,167 | | (351,939) | | | (3,130) | | | 6,192 | | | (954) | | | 62 | | | 3,337 | |
Net earnings | | — | | | — | | — | | | — | | | 878 | | | — | | | — | | | 878 | |
Other comprehensive earnings (loss), net of tax | | — | | | — | | — | | | — | | | — | | | 372 | | | — | | | 372 | |
Common dividends, net of tax benefits | | — | | | — | | — | | | — | | | (227) | | | — | | | — | | | (227) | |
Treasury stock purchases | | — | | | — | | (8,507) | | | (766) | | | — | | | — | | | — | | | (766) | |
Treasury shares reissued | | — | | | — | | 345 | | | 33 | | | — | | | — | | | — | | | 33 | |
Shares issued and stock compensation for stock options and other stock plans, net of shares exchanged | | 1,421 | | | 53 | | — | | | — | | | — | | | — | | | — | | | 53 | |
Dividends paid to noncontrolling interest | | — | | | — | | — | | | — | | | — | | | — | | | (4) | | | (4) | |
Other activity | | — | | | — | | — | | | 9 | | | — | | | — | | | — | | | 9 | |
Balance at December 31, 2021 | | 680,945 | | $ | 1,220 | | (360,101) | | $ | (3,854) | | $ | 6,843 | | $ | (582) | | $ | 58 | | $ | 3,685 | |
The accompanying notes are an integral part of the consolidated financial statements.
1. Critical and Significant Accounting Policies
The preparation of Ball Corporation’s (collectively, Ball, the company, we or our) consolidated financial statements in conformity with accounting principles generally accepted in the United States of America (U.S. GAAP) requires Ball’s management to make estimates and assumptions that affect the reported amounts of assets and liabilities and disclosure of contingent liabilities at the date of the financial statements and reported amounts of revenues and expenses during the reporting periods. These estimates are based on historical experience and various assumptions believed to be reasonable under the circumstances. Ball’s management evaluates these estimates on an ongoing basis and adjusts or revises the estimates as circumstances change. As future events and their impacts cannot be determined with precision, actual results may differ from these estimates. In the opinion of management, the financial statements reflect all adjustments necessary to fairly present the results of the periods presented.
Critical Accounting Policies
The company considers certain accounting policies to be critical, as their application requires management’s judgment about the impacts of matters that are inherently uncertain. Detailed below is a discussion of the accounting policies the companythat management considers to be critical to ourthe company’s consolidated financial statements.
AcquisitionsRevenue Recognition in the Aerospace Segment
Sales under fixed-price long-term contracts in the aerospace segment are primarily recognized using percentage-of-completion accounting under the cost-to-cost method.
At contract inception, the company assesses the goods and services promised in its contracts with customers and identifies a performance obligation for each promise to transfer goods or services to the customer. The performance obligation may be represented by a good or service (or a series of goods or services) that is distinct, or by a series of distinct goods or services that are substantially the same and have the same pattern of transfer to the customer. In each of these scenarios, the company treats the promise to transfer the customer goods or services as a single performance obligation. Backlog represents the estimated transaction prices on performance obligations to customers for which work remains to be performed.
To identify its performance obligations, the company considers all of the goods or services promised in the contract, regardless of whether they are explicitly stated or are implied by customary business practices.
The company has determined that the following distinct goods and services represent separate performance obligations:
| ● | Manufacture and delivery of distinct spacecraft and/or hardware components; |
| ● | Research reports, for contracts where such reports are the sole or primary deliverable; |
| ● | Design, add-on or special studies for contracts where such studies have stand-alone value or a material right exists due to discounted pricing; and |
| ● | Warranty and performance guarantees beyond standard repair/replacement. |
Performance obligations with no alternative use are recognized over time, when the company has an enforceable right to payment for efforts completed to-date. Because of sales contract payment schedules, limitations on funding, and contract terms, the company’s sales and accounts receivable generally include amounts that have been earned but not yet billed. The company’s payment terms vary by the type and location of the company’s customer and the products or services offered. All payment terms are less than one year.
Contracts are often modified to account for changes in contract specifications and requirements. The company considers contract modifications to exist when the modification either creates new or revised enforceable rights and obligations. Most of the company’s contract modifications are for goods or services that are not distinct from the existing contract due to the significant integration service provided in the context of the contract, and such contract modifications are accounted for as if they were part of that existing contract. The effect of a contract modification on the transaction price, and the company’s measure of progress for the performance obligation to which it relates, is recognized as an adjustment to sales (either as an increase or reduction of sales) on a cumulative catch-up basis.
Within the aerospace segment, performance obligations are recognized over time. Aerospace contracts involve specialized and unique products that are tailored to the specific needs of the customer, such as a spacecraft or other hardware conforming to the specifications required by the customer, and as such, no alternative use exists. When there is an enforceable right to payment at cost plus reasonable margin for performance completed to date, the sales are recorded over time as the goods are manufactured or services are performed. Determining a measure of progress requires management to make judgments that affect the timing of recording sales. The extent of progress towards completion is measured based on the ratio of costs incurred to date versus the total estimated costs upon completion of the performance obligation. The cost-to-cost method best depicts the transfer of assets to the customer as the company incurs costs on the company’s contracts. The percentage-of-completion method of accounting involves the use of various estimating techniques to project revenues and costs at completion and various assumptions and projections related to the outcome of future events, including the quantity and timing of product deliveries, future labor performance and rates, and material and overhead costs. Throughout the period of contract performance, the company regularly evaluates and, if necessary, revises estimates of total contract revenue, total contract cost, and extent of progress toward completion.
The 2 primary types of long-term sales contracts utilized are cost-type contracts, which are agreements to perform for cost plus an agreed-upon profit component, and fixed price sales contracts, which are completed for a fixed price. Cost-type sales contracts can have different types of fee arrangements, including fixed-fee, cost, milestone and performance incentive fees, award fees or a combination thereof. At the inception of contract performance, the company estimates sales associated with base, incentive and other fees exclusive of any constraint. In other words, the company estimates sales to the extent that it is not probable a significant reversal will occur over the period of contract performance. The company has determined that the above provides a faithful depiction of the transfer of goods to the customer and is the best measure of depicting the company’s performance as control is transferred to customers.
Due to the unique and customized nature of deliverables within aerospace contracts, a readily observable selling price for a similar good is not typically available; therefore, in making its determination of stand-alone selling price, the company generally applies the “expected cost plus a margin” approach (whereby the transaction price is allocated based on the relative amount of costs plus an appropriate margin). Use of the expected cost plus a margin approach requires Ball to determine the expected costs for each performance obligation, as well as an appropriate margin (i.e., cost-to-cost percentage of completion). The calculation is made at contract inception to determine the allocation of consideration.
Uncertainty as to the total amount that will be paid by the customer (such as the exact amount of costs that will be incurred and fees that will be earned by us to satisfy the contractual requirements) gives rise to variable consideration. To estimate variable consideration, the company applies the “most likely amount” method or the “expected value” method depending on the nature of the variable consideration. In certain cases, both methods may be used within a single contract if multiple forms of variable consideration exist. However, once a method has been applied to one form of variable consideration, it is applied consistently throughout the contract term.
The primary types of variable consideration present in the company’s contracts are cost reimbursements, performance award fees, incremental funding and finalization of government rates. These types of arrangements are most commonly (though not exclusively) estimated based on the “most likely” method. Once variable consideration has been estimated, it will be constrained if a significant reversal of the cumulative amount of sales is probable in the context of the contract.
Defined Benefit Pension Plans and Other Employee Benefits
The company has defined benefit plans and postretirement plans that provide certain medical benefits and life insurance for retirees and eligible dependents and, to a lesser extent, participates in multi-employer defined benefit plans for which Ball is not the sponsor. For the company-sponsored plans, the relevant accounting guidance requires that management make certain assumptions relating to the long-term rate of return on plan assets, discount rates used to determine the present value of future obligations and expenses, salary inflation rates, health care cost trend rates, mortality rates and other assumptions. The company believes the accounting estimates related to the company’s pension and postretirement plans are critical accounting estimates because they are highly susceptible to change from period to period based on the performance of plan assets, actuarial valuations, market conditions and contracted benefit changes. The selection of assumptions is based on historical trends and known economic and market conditions at the time of valuation, as well as independent studies of trends performed by the company’s actuaries. However, actual results may differ substantially from the estimates that were based on the critical assumptions.
The company recognizes the funded status of each defined benefit pension plan and other postretirement benefit plans in the consolidated balance sheet. Each overfunded plan is recognized as an asset, and each underfunded plan is recognized as a liability. Pension plan obligations are revalued annually, or when an event occurs that requires remeasurement, based on updated assumptions and information about the individuals covered by the plan. For pension plans, accumulated actuarial gains and losses in excess of a 10 percent corridor and the prior service cost are amortized on a straight-line basis from the date recognized over the average remaining service period of active participants or the average life expectancy for plans with significant inactive participants. For other postemployment benefits, the 10 percent corridor is not used. Costs related to defined benefit and other postretirement plans are included in cost of sales and selling, general and administrative expenses, while settlement and curtailment expenses are included in business consolidation expenses.
Significant Accounting Policies
Principles of Consolidation and Basis of Presentation
The consolidated financial statements include the accounts of Ball, its consolidated subsidiaries, and variable interest entities in which the company is considered to be the primary beneficiary. Equity investments in which the company exercises significant influence but does not control and is not the primary beneficiary are accounted for using the equity method of accounting. Investments in which the company neither exercises significant influence over the investee, nor is the primary beneficiary of the investment, are accounted for using the cost method of accounting. Intercompany transactions are eliminated in consolidation.
Reclassifications
Certain prior year amounts have been reclassified in order to conform to the current year presentation.
Cash and Cash Equivalents
Cash and cash equivalents include cash on hand and highly liquid investments with original maturities of three months or less.
Inventories
Inventories are stated at the lower of cost or net realizable value using either the first-in, first-out (FIFO) cost method of accounting or the average cost method. Inventory cost is calculated for each inventory component taking into consideration the appropriate cost factors, including fixed and variable overhead, material price volatility and production levels.
Recoverability of Goodwill
On an annual basis and at interim periods as circumstances require, the company performs a qualitative analysis to determine whether it is more likely than not that the fair value of a reporting unit exceeds its carrying amount, which includes an evaluation as to whether there have been significant changes to macro-economic factors related to the reporting unit that could materially impact fair value. If the qualitative analysis concludes that fair value could be materially impacted, the company performs a quantitative impairment test to determine the fair value of the reporting unit and recognizes an impairment charge for the amount by which the carrying value exceeds the fair value.
When performing a quantitative analysis, the company estimates fair value for each reporting unit primarily using the income approach. Under the income approach, fair value is estimated as the present value of estimated future cash flows of each reporting unit. The projected cash flows incorporate various assumptions related to weighted average cost of capital (WACC) and growth rates that are specific to each reporting unit, including assumptions relating to net sales growth rates, terminal growth rates and EBITDA (a non-U.S. GAAP measure defined by the company as earnings before interest, taxes, depreciation and amortization) margin. The company corroborates the results of its income approach using the market approach. Under the market approach, the company uses available information regarding multiples used in any recent market transactions involving transfer of controlling interests as well as publicly available trading multiples based upon the enterprise value of companies in either the packaging or aerospace and defense industries. The appropriate multiple is applied to forecasted EBITDA of each reporting unit to estimate fair value.
Impairment of Long-Lived Assets
Ball reviews long-lived assets for impairment when circumstances indicate the carrying amount of an asset or asset group may not be recoverable based on the undiscounted future cash flows of the asset. The company reviews long-lived assets for impairment at the individual asset or the asset group level for which the lowest level of independent cash flows can be identified. If the carrying amount of the asset or asset group is determined not to be recoverable, a write-down to fair value is recorded. Fair values are determined based on quoted market values, discounted cash flows or with the assistance of external appraisals, as applicable.
Depreciation and Amortization
Property, plant and equipment are carried at the cost of acquisition or construction. Repairs and maintenance costs, including labor and material costs for major improvements such as annual production line overhauls, are expensed as incurred, unless those costs substantially increase the useful lives or capacity of the existing assets. Assets are depreciated and amortized using the straight-line method over their estimated useful lives, generally 5 to 40 years for buildings and improvements and 2 to 20 years for machinery and equipment. Finite-lived intangible assets, excluding capitalized software costs, are generally amortized over their estimated useful lives of 3 to 18 years. Capitalized software is generally amortized over estimated useful lives of 3 to 7 years. The company periodically reviews these estimated useful lives and when appropriate, changes are made prospectively.
For certain business consolidation activities, accelerated depreciation may be required for the revised remaining useful life for assets designated to be scrapped or abandoned. The accelerated depreciation related to such activities is recorded as part of business consolidation and other activities in the appropriate period.
Environmental Reserves
The company estimates its liability for environmental matters based on, among other factors, the degree of probability of an unfavorable outcome and the ability to make a reasonable estimate of the amount of loss. The company records the best estimate of a loss when the loss is considered probable. As additional information becomes available, the company reassesses the potential liability related to pending matters and revises the estimates.
Revenue Recognition in the Beverage and Aerosol Packaging Segments
The company recognizes sales of products in its packaging segments when a customer obtains control of promised goods or services, which occurs either over time or at a point in time.
At contract inception, the company assesses the goods and services promised in its contracts with customers and identifies a performance obligation for each promise to transfer goods or services to the customer. The performance obligation may be represented by a good or service (or a series of goods or services) that is distinct, or by a series of distinct goods or services that are substantially the same and have the same pattern of transfer to the customer. In each instance, the company treats the promise to transfer the customer goods or services as a single performance obligation.
To identify its performance obligations, the company considers all of the goods or services promised in the contract, regardless of whether they are explicitly stated or are implied by customary business practices.
The company has determined that the following distinct goods and services represent separate performance obligations:
| ● | Manufacture of beverage containers, which may be generic or unique; |
| ● | Manufacture of aerosol containers, which may be generic or unique; and |
| ● | Manufacture of beverage and aerosol lids and ends, which may be generic or unique. |
Performance obligations for products with no alternative use are recognized over time when the company has manufactured a unique item and has an enforceable right to payment. Conversely, generic products with alternative use are recognized at a point in time. Contracts may be short-term or long-term, with varying payment terms. Ball’s payment terms vary by the type and location of the customer and the products or services offered. Customers pay in accordance with negotiated terms, which are typically triggered upon ownership transfer. All payment terms are less than one year. For all contracts, the transaction price is determined upon establishment of the contract that contains the final terms of the sale, including the description, quantity, and price of each product or service purchased.
Ball typically enters into master agreements with customers, which establish the terms and conditions for subsequent orders of goods. In the context of the revenue recognition standard, enforceable contracts are those that have an enforceable right to payment, which Ball typically has once a binding forecast or purchase order (or similar evidence) is in place and Ball produces under the contract. Within Ball’s packaging segments, these enforceable contracts all have a duration of less than one year. Contracts that have an original duration of less than one year are excluded from the requirement to disclose remaining performance obligations, based on the company’s election to use the practical expedient. The nature of the remaining performance obligations within these contracts, as well as the nature of the variability and how it will be resolved, are described in the section below.
Within the company’s beverage and aerosol operations, performance obligations are recognized both over time and at a point in time. The determination that sales should be recognized at a point in time most often results from the existence of an alternative use for the product. Cans and ends that are not customized for a customer prior to delivery are considered to have an alternative use, and sales are recognized at the point of control transfer. Determining when control transfer occurs requires management to make judgments that affect the timing of when sales are recognized. The current revenue accounting standard provides five indicators that a customer has obtained control of an asset: 1) present right to payment; 2) transfer of legal title; 3) physical possession; 4) significant risks and rewards of ownership; and 5) customer acceptance. The company considers control to have transferred for these products upon shipment or delivery, depending on the legal terms of the contract, because the company has a present right to payment at that time, the customer has legal title to the asset, the company has transferred physical possession of the asset and/or the customer has significant risks and rewards of ownership of the asset. The company determines that control transfers to a customer as described above and provides a faithful depiction of the transfer of goods.
For performance obligations related to products that are specialized with no alternative use (e.g., specialized sizes or customer-specific materials, or labeled with customer-specific artwork), the company transfers control and records sales over time. The recognition of sales occurs over time as goods are manufactured and Ball has an enforceable right to payment for those goods, which is an output method. Determining a measure of progress requires management to make judgments that impact the timing of when sales are recognized. The company has determined the above provides a faithful depiction of the transfer of goods to the customer. The number of units manufactured that have an enforceable right to payment is the best measure of depicting the company’s performance as control is transferred. The customer obtains value as each unit is produced against a binding contract.
The enforceable right to payment may be explicit or implied in the contract. If the enforceable right to payment is not explicit in the contract, Ball must consider if there is an implied right based on customer relationships or previous business practices and applicable law. Typically, Ball has an enforceable right to payment of costs plus a reasonable margin once a binding forecast or purchase order (or similar evidence) is in place and Ball produces under the contract.
In making its determination of stand-alone selling price, Ball maximizes its use of observable inputs. Stand-alone selling price is then used to allocate total consideration proportionally to the various performance obligations within a contract.
To estimate variable consideration, the company may apply both the “expected value” method and “most likely amount” method based on the form of variable consideration, after considering which method would provide the best prediction of consideration to be received from the company’s customers. The expected value method involves a probability-weighted determination of the expected amount, whereas the most likely amount method identifies the single most likely outcome in a range of possible amounts. In certain cases, both methods may be used within a single contract if multiple forms of variable consideration exist. However, once a method has been applied to one form of variable consideration, it is applied consistently throughout the contract term.
The primary types of variable consideration present in the company’s contracts are per-unit price changes, volume discounts and rebates. Once variable consideration has been estimated, it will be constrained if a significant reversal of the cumulative amounts of sales is probable in the context of the contract.
Revenue Contract Costs
The company has determined there are no material costs that meet the capitalization criteria for costs to obtain or fulfill a contract.
Revenue Recognition Practical Expedients
For contracts that have an original duration of one year or less, the company has elected the practical expedient applicable to such contracts and has not disclosed the transaction price for future performance obligations as of the end of each reporting period or when the company expects to recognize sales.
The company has also elected the sales tax practical expedient; therefore, sales and other taxes assessed by a governmental authority that are collected concurrent with revenue-producing activities are excluded from the transaction price.
For shipping and handling activities performed after a customer obtains control of the goods, the company has elected to account for these costs as activities to fulfill the promise to transfer the goods; therefore, these activities are not assessed as separate performance obligations.
The company has also elected the significant financing component practical expedient which allows management to not assess whether the contract has a significant financing component in circumstances where, at contract inception, the expected contract duration is less than one year.
Disaggregation of Sales
The company disaggregates net sales by reportable segments, as disclosed in Note 3, and based on the timing of transfer of control for goods and services, as disclosed in Note 5. The transfer of control for goods and services may occur at a point in time or over time; in other words, sales may be recognized over the course of the underlying contract, or they may occur at a single point in time based upon the transfer of control. The company determined that disaggregating sales into these categories achieves the disclosure objective to depict how the nature, amount, timing, and uncertainty of sales and cash flows are affected by economic factors. As disclosed in Note 3, the company’s business consists of 4 reportable segments, which encompass disaggregated product lines and geographical areas: (1) beverage packaging, North and Central America; (2) beverage packaging, EMEA; (3) beverage packaging, South America; and (4) aerospace.
Revenue Contract Balances
The company enters into contracts to sell beverage packaging, aerosol packaging, and aerospace products. The payment terms and conditions in customer contracts vary. Those customers that prepay are represented by the contract liabilities shown in Note 5, until the company’s performance obligations are satisfied. Contract assets would exist when sales have been recorded (i.e., control of the goods or services has been transferred to the customer) but customer payment is contingent on a future event beyond the passage of time (i.e., satisfaction of additional performance obligations). Unbilled receivables, which are not classified as contract assets, represent arrangements in which sales have been recorded prior to billing and right to payment is unconditional.
Leases
The company enters into operating leases, the accounting guidance for which requires a lessee to recognize a right-of-use (ROU) asset and a lease liability. The guidance also requires a lessee to recognize a single lease cost, calculated so that the cost of the lease is allocated over the lease term, generally on a straight line basis.
A contract is a lease or contains one when (1) the contract contains an explicitly or implicitly identified asset and (2) the customer obtains substantially all of the economic benefits from the use of that underlying asset and directs how and for what purpose the asset is used during the term of the contract in exchange for consideration. The company assesses whether an arrangement is a lease, or contains a lease, upon inception of the contract.
The company enters into operating leases for buildings, warehouses, office equipment, production equipment, aircraft, land and other types of equipment. When readily determinable, the discount rate used to calculate the lease liability is the rate implicit in the lease. Otherwise, the company uses its incremental borrowing rate based on the information available at lease commencement. The company’s finance and short-term leases are immaterial.
Many of the company’s leases include one or more renewal and/or termination options at the company’s discretion, which are included in the determination of the lease term if the company is reasonably certain to exercise the option. The company also enters into lease agreements that have variable payments, such as those related to usage or adjustments to certain indexes. Variable lease payments are recognized in the period in which those payments are incurred. Certain leases also include residual value guarantees; however, these amounts are not probable to be owed and are not included in the calculation of the lease liability.
The company subleases all or portions of certain building and warehouse leases to third parties, all of which are classified as operating leases. Some of these arrangements offer the lessee renewal options.
Fair Value Measurements
Generally accepted accounting principles define fair value as the price that would be received to sell an asset or be paid to transfer a liability in an orderly transaction between market participants at the measurement date (exit price) and such principles also establish a fair value hierarchy that prioritizes the inputs used to measure fair value using the following definitions (from highest to lowest priority):
| ● | Level 1 – Unadjusted quoted prices in active markets that are accessible at the measurement date for identical, unrestricted assets or liabilities. |
| ● | Level 2 – Observable inputs other than quoted prices included within Level 1 that are observable for the asset or liability, either directly or indirectly, including quoted prices for similar assets and liabilities in active markets; quoted prices for identical or similar assets and liabilities in markets that are not active; or other inputs that are observable or can be corroborated by observable market data by correlation or other means. |
| ● | Level 3 – Prices or valuation techniques requiring inputs that are both significant to the fair value measurement and unobservable. |
Acquisitions
The company records acquisitions resulting in the consolidation of an enterprise using the purchase method of accounting. Under this method, the acquiring company records the assets acquired, including intangible assets that can be identified and named, and liabilities assumed based on their estimated fair values at the date of acquisition. The purchase price in excess of the fair value of the assets acquired and liabilities assumed is recorded as goodwill. If the assets acquired, net of liabilities assumed, are greater than the purchase price paid, then a bargain purchase has occurred and the company will recognize the gain immediately in earnings. Among other sources of relevant information, the company uses independent appraisals and actuarial or other valuations to assist in determining the estimated fair values of the assets and liabilities. Various assumptions are used in the determination of these estimated fair values including discount rates, market and volume growth rates, product selling prices, production costs and other prospective financial information. Transaction costs associated with acquisitions are expensed as incurred and included in the business consolidation and other activities line of the consolidated statement of earnings.
For acquisitions where the company already owns an equity investment in the acquired company, the company will recognize in earnings, upon the completion of the acquisition, a gain or loss related to the company’s existing equity investment. This gain or loss is calculated based on the fair value of the equity investment as compared to the carrying value of the existing equity investment on the date of acquisition.
When the company purchases additional interests of consolidated subsidiaries that does not result in a change in control, the difference between the fair value and carrying value of the noncontrolling interests acquired is accounted for in the common stock line within shareholders' equity.
Business Consolidation and Other Closure Costs (Business Consolidation Costs)Activities
The company estimates its liabilities for business closure activities by accumulating detailed estimates of costs and asset sale proceeds, if any, for each business consolidation initiative. This includes the estimated costs of employee severance, pension and related benefits; impairment of property and equipment and other assets, including estimates of net realizable value; accelerated depreciation; termination payments for contracts and leases; contractual obligations; and any other qualifying costs related to the exit plan. These estimated costs are grouped by specific projects within the overall exit plan and are then monitored on a monthly basis. Such charges represent management’s best estimates, buthowever, they require assumptions about the plans that may change over time. Changes in estimates for individual locations and other matters are evaluated periodically to determine if a change in estimate is required for the overall restructuring plan.
Subsequent changes to the original estimates are included in current earnings and identified as business consolidation gains or losses.
RecoverabilityStock-Based Compensation
Ball has a variety of Goodwillrestricted stock, stock option, and Intangible Assets
On an annual basisstock-settled appreciation rights (SSARs) plans, and the related stock-based compensation is primarily reported as part of selling, general and administrative expenses in the consolidated statements of earnings. The compensation expense associated with restricted stock grants is calculated using the fair value at interim periods when circumstances require,the date of grant (closing stock price) and is amortized over the restriction period. For stock options and SSARs, the company tests the recoverability of its goodwill and indefinite-lived intangible assets. The company utilizes the new impairment analysis, as updated in 2017, and it has elected not to use the qualitative assessment or “step zero” approach. UnderBlack-Scholes valuation model and amortizes the new impairment analysis, the company compares the carrying value of each identified reporting unit to its fair value. If the carrying value of the reporting unit is greater than itsestimated fair value, the company recognizes an impairment charge for the amount by which the carrying amount of goodwill exceeds its implied fair value. The company estimates fair value for each reporting unit using the market and income approaches. Under the market approach, the company uses available information regarding multiples used in recent transactions, if any, involving transfers of controlling interests as well as publicly available trading multiples based on the enterprise value of companies in either the packaging or aerospace and defense industries, as applicable. The appropriate multiple is applied to forecasted EBITDA (a non-GAAP item defined by the company as earnings before interest, taxes, depreciation and amortization) of each reporting unit to estimate fair value. Under the income approach, fair value is estimated as the present value of estimated future cash flows of each reporting unit. The projected cash flows incorporate various assumptions related to weighted average cost of capital (WACC) and growth rates specific to each reporting unit.
Amortizable intangible assets are tested for impairment, when deemed necessary, based on an income approach using undiscounted cash flows and, if impaired, are written down to fair value based on either discounted cash flows or appraised values.
Defined Benefit Pension Plans and Other Employee Benefits
The company has defined benefit plans that cover a significant portion of its employees. The company also has postretirement plans that provide certain medical benefits and life insurance for retirees and eligible dependents and, to a lesser extent, participates in multi-employer defined benefit plans for which Ball is not the sponsor. For the company-sponsored plans, the relevant accounting guidance requires that management make certain assumptions relating to the long-term rate of return on plan assets, discount rates used to determine the present value of future obligations and expenses, salary inflation rates, health care cost trend rates, mortality rates and other assumptions. The company believes that the accounting estimates related to our pension and postretirement plans are critical accounting estimates because they are highly susceptible to change from period to period based on the performance of plan assets, actuarial valuations, market conditions and contracted benefit changes. The selection of assumptions is based on historical trends and known economic and market conditionsdetermined at the timedate of valuation, as well as independent studies of trends performed by the company’s actuaries. However, actual results may differ substantially from the estimates that were based on the critical assumptions.
The company recognizes the funded status of each defined benefit pension plan and other postretirement benefit plans in the consolidated balance sheet. Each overfunded plan is recognized as an asset, and each underfunded plan is recognized as a liability. Pension plan liabilities are revalued annually, or when an event occurs that requires remeasurement, based on updated assumptions and information about the individuals covered by the plan. For pension plans, accumulated actuarial gains and losses in excess of a 10 percent corridor and the prior service cost are amortizedgrant, on a straight-line basis from the date recognized over the average remainingrequisite service period (generally, the vesting period). The company’s deferred compensation stock program is subject to variable plan accounting and, accordingly, is valued at the closing price of active participants or over the average life expectancycompany’s common stock at the end of each reporting period.
Research and Development Costs
Research and development costs are expensed as incurred in connection with the company’s programs for plansthe development of products and processes. Costs incurred in connection with significant inactive participants. For other postemployment benefits,these programs, the 10 percent corridor is not used. The majority of costs related to defined benefit and other postretirement planswhich are included in cost of sales;sales, amounted to $56 million, $47 million and $44 million for the remainder is includedyears ended December 31, 2021, 2020 and 2019, respectively.
Currency Translation
Assets and liabilities of non-U.S. operations with a functional currency other than the U.S. dollar are translated using period-end exchange rates, and revenues and expenses are translated using average exchange rates during each period. Translation gains and losses are reported in selling, general and administrative expenses.accumulated other comprehensive earnings (loss) as a component of shareholders’ equity.
In addition to defined benefit and postretirement plans, the company maintains reserves for employee medical claims, up to our insurance stop-loss limit, and workers’ compensation claims. These are regularly evaluated and revised, as
needed, based on a variety of information, including historical experience, actuarial estimates and current employee statistics.
Income Taxes
Deferred income taxes reflect the future tax consequences of differences between the tax bases of assets and liabilities and their financial reporting amounts at each balance sheet date, based upon enacted income tax laws and tax rates. Income tax expense or benefit is provided based on earnings reported in the financial statements. The provision for income tax expense or benefit differs from the amounts of income taxes currently payable because certain items of income and expense included in the consolidated financial statements are recognized in different time periods by taxing authorities.
Deferred tax assets, including operating loss, capital loss and tax credit carryforwards, are reduced by a valuation allowance when, in the opinion of management, it is more likely than not that any portion of these tax attributes will not be realized. In addition, from time to time, management must assess the need to accrue or disclose uncertain tax positions for proposed adjustments from various federal, state and foreignnon-U.S. tax authorities who regularly audit the company in the normal course of business. In making these assessments, management must often analyze complex tax laws of multiple jurisdictions, including many foreignnon-U.S. jurisdictions. The accounting guidance prescribes a recognition threshold and measurement attribute for the financial statement recognition and measurement of a tax position taken or expected to be taken in a tax return. The company records the related interest expense and penalties, if any, as tax expense in the tax provision.
Stranded taxes in accumulated other comprehensive income are reclassified to the consolidated statement of earnings when the activity that generated the deferred gains and losses has fully ceased.
Derivative Financial Instruments
The company uses derivative financial instruments for the purpose of hedging commercial risk exposures to fluctuations in interest rates, currency exchange rates, raw material costs inflation rates and common share prices. The company’s derivative instruments are recorded in the consolidated balance sheets at fair value. The company values each derivative financial instrument either by using a single valuation technique based on observable market inputs performed internally or by obtaining valuation information from a reliable and observable market source. For a derivative designated as a cash flow hedge, the derivative's mark to fair value is initially recorded as a component of accumulated other comprehensive earnings and subsequently reclassified into earnings when the hedged item affects earnings, unless it is probable that the forecasted transaction will not occur. Derivatives that do not qualify for hedge accounting are marked to fair value with gains and losses immediately recorded in earnings. In the consolidated statements of cash flows, derivative activities are classified based on the cash flows of the items being hedged.hedged, except for those activities that are hedging the effect of exchange rate changes on cash, which are presented in investing activities.
Realized gains and losses from hedges are classified in the consolidated statements of earnings consistent with the accounting treatment of the items being hedged. Upon the early dedesignation of an effective derivative contract, the gains or losses are deferred in accumulated other comprehensive earnings until the originally hedged item affects earnings unless it is probable the hedged item will not occur at which time it is recognized immediately. Any gains or losses incurred after the dedesignation date are recorded in earnings immediately.
Contingencies
The company is subject to various legal proceedings and claims, including those that arise in the ordinary course of business. The company records loss contingencies when it determines that the outcome of the future event is probable of occurring and the amount of the loss can be reasonably estimated. Gain contingencies are recognized in the financial statements when they are realized.realized or realizable.
The determination of a reserve for a loss contingency is based on management’s judgment of probability and estimates with respect to the likelihood of an outcome and valuation of the future event. Liabilities are recorded or adjusted when events or circumstances cause these judgments or estimates to change. In assessing whether a loss is probable, Ball may
consider the following factors, among others: the nature of the litigation, claim or assessment; available information, opinions or views of legal counsel and other advisors; and the experience gained from similar cases by the company and others. The company provides disclosures for material contingencies when there is a reasonable possibility that a loss or an additional loss may be incurred. Actual amounts realized upon settlement of contingencies may be different than amounts recorded and disclosed, and such adjustments could have a significant impact on the company's consolidated financial statements.
Significant Accounting Policies
Principles of Consolidation and Basis of Presentation
The consolidated financial statements include the accounts of Ball, its consolidated subsidiaries, and variable interest entities in which the company is considered to be the primary beneficiary. Equity investments in which the company exercises significant influence but does not control and is not the primary beneficiary are accounted for using the equity method of accounting. Investments in which the company neither exercises significant influence over the investee, nor is the primary beneficiary of the investment, are accounted for using the cost method of accounting. Intercompany transactions are eliminated in consolidation.
Reclassifications
Certain prior year amounts have been reclassified in order to conform to the current year presentation.
Cash and Cash Equivalents
Cash and cash equivalents include cash on hand and highly liquid investments with original maturities of three months or less.
Inventories
Inventories are stated at the lower of cost or market using either the first-in, first-out (FIFO) cost method of accounting or the average cost method. Inventory cost is calculated for each inventory component taking into consideration the appropriate cost factors including fixed and variable overhead, material price volatility and production levels.
Impairment of Long-Lived Assets
We review long-lived assets for impairment when circumstances indicate the carrying amount of an asset or asset group may not be recoverable based on the undiscounted future cash flows of the asset. We review long-lived assets for impairment at the individual asset or the asset group level for which the lowest level of independent cash flows can be identified. If the carrying amount of the asset or asset group is determined not to be recoverable, a write-down to fair value is recorded. Fair values are determined based on quoted market values, discounted cash flows or external appraisals, as applicable.
Depreciation and Amortization
Property, plant and equipment are carried at the cost of acquisition or construction and depreciated over the estimated useful lives of the assets. Repairs and maintenance costs, including labor and material costs for major improvements such as annual production line overhauls, are expensed as incurred, unless those costs substantially increase the useful lives or capacity of the existing assets. Assets are depreciated and amortized using the straight-line method over their estimated useful lives, generally 5 to 40 years for buildings and improvements and 2 to 20 years for machinery and equipment. Finite-lived intangible assets, excluding capitalized software costs, are generally amortized over their estimated useful lives of 3 to 18 years. For capitalized software, costs are generally amortized over their estimated useful
livesRisks and Uncertainties – Novel Coronavirus (COVID-19)
The current global business environment is being impacted directly and indirectly by the effects of 3the novel coronavirus (COVID-19), and it is not possible to 7 years. The company periodically reviews these estimated useful livesaccurately estimate the impacts of COVID-19. However, Ball management has reviewed the estimates used in preparing the company’s consolidated financial statements and when appropriate, changes are made prospectively.the following have a reasonably possible likelihood of being affected, to a material extent, by the direct and indirect impacts of COVID-19 in the near term.
| ● | Estimates regarding the future financial performance of the business used in the impairment tests for goodwill, long-lived assets, equity method investments, recoverability of deferred tax assets and estimates regarding cash needs and associated indefinite reinvestment assertions; |
| ● | Estimates of recoverability for customer receivables; |
| ● | Estimates of net realizable value for inventory; and |
| ● | Estimates regarding the likelihood of forecasted transactions associated with hedge accounting positions at December 31, 2021, which could impact the company’s ability to satisfy hedge accounting requirements and result in the recognition of income and/or expenses. |
For certain business consolidation activities, accelerated depreciation may be required overIn addition to the revised remaining useful life for assets designatedabove potential impacts on the estimates used in preparing financial statements, COVID-19 has the potential to be scrapped or abandoned. The accelerated depreciationincrease Ball’s vulnerabilities to near-term severe impacts related to such activities is disclosed as part of business consolidation andcertain concentrations in its business. In line with other activities in the appropriate period.
Environmental Reserves
The company estimates its liability for environmental matters based on, among other factors, the degree of probability of an unfavorable outcome and the ability to make a reasonable estimate of the amount of loss. The company records the best estimate of a loss when the loss is considered probable. As additional information becomes available, the company reassesses the potential liability related to pending matters and revises the estimates.
Revenue Recognition in the Packaging Segments
The company recognizes sales of productscompanies in the packaging segments when the four basic criteria of revenue recognition are met: delivery has occurred, title has transferred, there is persuasive evidence of an agreement or arrangement and the price is fixed or determinable and collection is reasonably assured. Shipping and handling costs are reported within cost of sales in the consolidated statement of earnings. All revenues are presented net of tax.
Revenue Recognition in the Aerospace Segment
Sales under long-term contracts in the aerospace segment are primarily recognized using percentage-of-completion under the cost-to-cost method of accounting. The two primary types of long-term sales contracts utilized are cost-type contracts, which are agreements to perform for cost plus an agreed upon profit component and fixed price sales contracts, which are completed for a fixed-price. Cost-type sales contracts can have different types of fee arrangements, including fixed-fee, cost, milestone and performance incentive fees, award fees or a combination thereof.
At the inception of contract performance, our estimates of base, incentive and other fees are established at a conservative estimate of profit over the period of contract performance. Throughout the period of contract performance, the company regularly reevaluates and, if necessary, revises estimates of total contract revenue, total contract cost, extent of progress toward completion, probability of receipt of any award and performance fees and any clawback provisions included in the contract. Provision for estimated contract losses, if any, is made in the period that such losses are determined to be probable. Because of sales contract payment schedules, limitations on funding and contract terms, our sales and accounts receivable generally include amounts that have been earned but not yet billed. Contract claims are only recorded if it is probable that the claim will result in additional contract revenue and the claim amounts can be reliably estimated. Revenue associated with claims is recorded only for costs already incurred and does not include a profit component. Pre-contract costs that are not approved by the customer for reimbursement are expensed as incurred. As a prime U.S. government contractor or subcontractor, the aerospace segment is subject to a high degree of regulation, financial review and oversight by the U.S. government. All revenues are presented net of tax.
Fair Value Measurements
Generally accepted accounting principles define fair value as the price that would be received to sell an asset or be paid to transfer a liability in an orderly transaction between market participants at the measurement date (exit price) and establish a fair value hierarchy that prioritizes the inputs used to measure fair value using the following definitions (from highest to lowest priority):
| ·
| | Level 1–Unadjusted quoted prices in active markets that are accessible at the measurement date for identical, unrestricted assets or liabilities.
|
Table of Contents
industries, Ball Corporation
Notes to the Consolidated Financial Statements
| ·
| | Level 2–Observable inputs other than quoted prices included within Level 1 that are observable for the asset or liability, either directly or indirectly, including quoted prices for similar assets and liabilities in active markets; quoted prices for identical or similar assets and liabilities in markets that are not active; or other inputs that are observable or can be corroborated by observable market data by correlation or other means.
|
| ·
| | Level 3–Prices or valuation techniques requiring inputs that are both significant to the fair value measurement and unobservable.
|
Stock-Based Compensation
Ball has a variety of restricted stock, stock option, and stock-settled appreciation rights (SSARs) plans, and the related stock-based compensation is primarily reported as part of selling, general and administrative expenses in the consolidated statements of earnings. The compensation expense associated with restricted stock grants is calculated using the fair value at the date of grant (closing stock price) and is amortized over the restriction period. For stock options and SSARs, the company has elected to use the Black-Scholes valuation model and amortizes the estimated fair value, determined at the date of grant, on a straight-line basis over the requisite service period (generally the vesting period). The company’s deferred compensation stock program is subject to variable plan accounting and, accordingly, is valued at the closing price of the company’s common stock at the end of each reporting period.
Research and Development
Research and development costs are expensed as incurred in connection with the company’s programs for the development of products and processes. Costs incurred in connection with these programs,makes the majority of which are included in costits sales and significant purchases to or from a relatively small number of global, or large regional, customers and suppliers. Furthermore, Ball makes the majority of its sales amountedfrom a small number of product lines. The potential of COVID-19 to $27 million, $28 million and $26 millionaffect a significant customer or supplier, or to affect demand for certain products to a significant degree, heightens the years ended December 31, 2017, 2016 and 2015, respectively.vulnerability of Ball to these concentrations.
Currency Translation
Assets and liabilities of foreign operations with a functional currency other than the U.S. dollar are translated using period-end exchange rates, and revenues and expenses are translated using average exchange rates during each period. Translation gains and losses are reported in accumulated other comprehensive earnings as a component of shareholders’ equity.
2. Accounting Pronouncements
Recently Adopted Accounting Standards
Income Tax Simplification
In August 2017, amendments to existing derivative and hedge accounting2019, new guidance werewas issued to simplify existing guidance in order to allow companies to more accurately present the economic effects of risk management activities in the financial statements. The amendments will more closely align the results of cash flow and fair value hedge accounting with risk management activities through changes to both the designation and measurement guidance for qualifying hedging relationships and the presentation of hedge results in the financial statements. This guidance will be effective for annual reporting periods beginning after December 15, 2018, and early adoption is permitted. The company elected to early adoptincome taxes. Ball adopted this guidance duringand all related amendments on January 1, 2021, applying either the fourth quarterretrospective basis, the modified retrospective method, or the prospective method where appropriate. The adoption of 2017, and the adoption did not have a materialthis guidance had no impact on the company’s consolidated financial statements.
New Accounting Guidance
Reference Rate Reform
In January 2017, amendments to existing accounting guidance were issued simplifying an entity’s subsequent goodwill measurement by eliminating Step 2, which requires a hypothetical purchase price allocation, from its annual or interim goodwill impairment test. Pursuant to this guidance, an entity should recognize an impairment charge for the amount by which the carrying amount exceeds the reporting unit’s fair value; however, the loss recognized should not exceed the
total amount of goodwill allocated to that reporting unit. Additionally, an entity should consider income tax effects from any tax deductible goodwill on the carrying amount of the reporting unit when measuring the goodwill impairment loss, if applicable. This guidance is required to be applied prospectively on January 1, 2020, and early adoption is permitted. The company elected to early adopt this guidance effective January 1, 2017, and it did not have an impact on the company’s consolidated financial statements.
In March 2016, final accounting guidance was issued clarifying that the assessment of whether an embedded contingent put or call option is clearly and closely related to the debt host only requires an analysis of the four-step decision sequence outlined in the accounting standards codification. Consequently, when a contingent put or call option embedded in a debt instrument would be evaluated for possible separate accounting as a derivative instrument, the nature of the exercise contingency would be disregarded. This guidance was applied on a modified retrospective basis on January 1, 2017, and did not have an impact on the company’s consolidated financial statements.
In March 2016, final accounting guidance was issued eliminating the requirement to retrospectively apply the equity method in previous periods when an investor initially obtains significant influence over an investee. The new guidance requires the investor to apply the equity method prospectively from the date the investment qualifies for the equity method. The investor will add the carrying value of the existing investment to the cost of the additional investment to determine the initial cost basis of the equity method investment. This guidance was applied prospectively on January 1, 2017, and did not have a material impact on the company’s consolidated financial statements.
In March 2016, amendments to existing accounting guidance were issued to simplify various aspects related to how share-based payments are accounted for and presented in the consolidated financial statements. The company adopted these amendments on January 1, 2017, as discussed below, which did not have a material impact on the company’s consolidated financial statements.
| ·
| | All excess tax benefits and tax deficiencies that were previously recognized in common stock are now recognized as income tax provisions (benefits) in the income statement as a discrete item. As required, this change was applied prospectively for settlements occurring after the adoption of the guidance on January 1, 2017.
|
| ·
| | Any prior period excess tax benefits that did not reduce taxes payable in the period in which they arose were required to be recorded on a modified retrospective basis, with a cumulative effect adjustment to opening retained earnings. However, the company was able to reduce taxes payable for all previous excess tax benefits and, therefore, was not required to record a cumulative effect adjustment.
|
| ·
| | The company elected to use a prospective approach to report all tax-related cash flows resulting from share-based payments as operating activities on the statement of cash flows and, therefore, no adjustments were made to prior periods. Previously, excess tax benefits were reported as part of financing activities.
|
| ·
| | The company elected to account for forfeitures as they occur. No cumulative effect adjustment was required as the amount calculated was immaterial.
|
In March 2016, accounting guidance was issued regarding the effect of derivative contract novations on existing hedge accounting relationships. The amendments clarify that a change in the counterparty to a derivative instrument designated as a hedging instrument does not in and of itself require dedesignation of that hedging relationship, provided that all other hedge accounting criteria continue to be met. The guidance was applied prospectively on January 1, 2017, and it did not have a material impact on the company’s consolidated financial statements.
In December 2017, new guidance was issued related to permit a range of responses to the U.S. Tax Cuts and Jobs Act (the Act) depending on the degree to which an entity had completed its analysis of the tax effects of the Act. Where the analysis of a given effect of the Actglobal reference rates reform. Ball is incomplete at the time of reporting, the guidance allows an entity to book provisional entries (where amounts can be reasonably estimated) or to report under previously applicable tax accounting guidance where amounts under the Act cannot be reasonably estimated. The entity subsequently has a measurement period of up to one
year to finalize the provisional impacts of the Act. The guidance was immediately effective and Ball applied the option to record provisional impacts of the Act in its results for the year ended December 31, 2017.
New Accounting Guidance
In February 2018, amendments to existing guidance were issued to permit the reclassification from accumulated other comprehensive income to retained earnings for stranded tax effects resulting from the Act. The guidance is effective for Ball on January 1, 2019, with early adoption and retrospective application to the time of implementation of the Act permitted. The company has not elected to early adopt the new guidance in 2017 and is assessingcurrently evaluating the impact that it is expectedthe transition from its LIBOR-based interest rate loan agreements to SOFR-based interest rate agreements will have on theits consolidated financial statements.
In May 2017, amendments Based on the company’s most current understanding, the LIBOR to existing accounting guidance were issued to provide clarity and reduce diversity in practice, cost and complexity when applying existing accounting guidance for modifications to the terms or conditions of a share-based payment award. The amendments specify that all changes to the terms and conditions of a share-based payment award will require an entity to apply modification accounting, unless all of the following are met: (1) the fair value of the modified awardSOFR transition is the same as the fair value of the original award immediately before the original award is modified, (2) the vesting conditions of the modified award are the same as the vesting conditions of the original award immediately before the original award is modified and (3) the classification of the modified award as an equity instrument or a liability instrument is the same as the classification of the original award immediately before the original award is modified. This guidance will be effective for annual reporting periods beginning on January 1, 2018, and early adoption is permitted. The company does not expect the amendmentsexpected to have a material impact on its consolidated financial statements, and the company has not elected to early adopt this new accounting standard.
In March 2017, amendments to existing accounting guidance were issued to improve the presentationcondition, results of net periodic pension cost and net periodic postretirement benefit cost, which requires employers to report the service cost component in the same line item as other compensation costs arising from services rendered by the associated employees during the period. The other components of net periodic pension and benefit cost are required to be presented in the income statement separately from the service cost component and outside a subtotal of income from operations if one is presented. The amendments also permit only the service cost component of net benefit cost to be eligible for capitalization. This guidance is required to be applied retrospectively for the presentation of the service cost component and the other components of net periodic pension cost and net periodic postretirement benefit cost in the income statement and prospectively for the capitalization of the service cost component. Employers can elect a practical expedient that permits use of the amounts disclosed in its pension footnote for prior comparative periods as the estimation basis for applying the retrospective presentation requirements. The guidance is effective for Ball on January 1, 2018, and early adoption is permitted. The company has not elected to early adopt the new standard and does not expect these amendments to have a material impact on its consolidated financial statements.
In February 2017, amendments to existing accounting guidance were issued to clarify the scope and to add guidance for partial sales of nonfinancial assets. The guidance requires that all entities account for the derecognition of a business in accordance with guidance for consolidation, including instances in which the business is considered to be in substance real estate. This guidance is required to be applied on January 1, 2018, using a full retrospective approach or a modified retrospective approach and early adoption is permitted. The company has not elected to early adopt the new standard and is currently assessing the impact that the adoption of this new guidance will have on its consolidated financial statements.
In January 2017, amendments to existing accounting guidance were issued to further clarify the definition of a business in determining whether or not a company has acquired or sold a business. The amendments provide a screen to determine when an integrated set of assets and activities (collectively referred to as a “set”) is not a business. The screen requires that when substantially all of the fair value of the gross assets acquired (or disposed of) is concentrated in a single identifiable asset or a group of similar identifiable assets, the set is not a business. If the screen is not met, the amendments in this update (1) require that to be considered a business, a set must include, at a minimum, an input and a
substantive process that together significantly contribute to the ability to create output and (2) remove the evaluation of whether a market participant could replace missing elements. The amendments also narrow the definition of the term “output” so that the term is consistent with how outputs are described in the new guidance for revenue recognition. The guidance is required to be applied prospectively for Ball on January 1, 2018, and early adoption is permitted. The company has not elected to early adopt the new standard and does not expect these amendments to have a material impact on its consolidated financial statements.
In November 2016, accounting guidance was issued that will require the statement of cash flows to explain the change in the total of cash, cash equivalents and restricted cash or restricted cash equivalents. In addition, restricted cash and restricted cash equivalents will need to be included in a cash reconciliation of beginning-of-period and end-of-period total amounts shown on the statement of cash flows.This guidance is required to be applied retrospectively on January 1, 2018. The company expects there to be a material impact on its 2016 and 2015 statements of cash flows due to approximately $2 billion of cash received from the issuance of senior notes in December 2015 that the company elected to restrict in an acquisition escrow account. In July 2016, the funds in the escrow account were used to pay a portion of the cash component of the acquisition price of Rexam. The impacts on the company’s 2017 statement of cash flows are not expected to be material.
In October 2016, amendments to existing accounting guidance were issued that will require entities to recognize the income tax consequences of an intra-entity transfer of an asset other than inventory when the transfer occurs, as opposed to when the asset is sold to an unrelated third party. The amendments also eliminate the exception for an intra-entity transfer of an asset other than inventory. This guidance is required to be applied on a modified retrospective basis through a cumulative-effect adjustment directly to retained earnings on January 1, 2018. The company is currently assessing the impact that the adoption of this new guidance will have on its consolidated financial statements.
In August 2016, accounting guidance was issued addressing the following eight specific cash flow issues:
| ·
| | Debt prepayment or debt extinguishment costs
|
| ·
| | Settlement of zero-coupon debt instruments or other debt instruments with coupon interest rates that are insignificant in relation to the effective interest rate of the borrowing
|
| ·
| | Contingent consideration payments made after a business combination
|
| ·
| | Proceeds from the settlement of insurance claims
|
| ·
| | Proceeds from the settlement of corporate-owned life insurance policies (including bank-owned life insurance policies)
|
| ·
| | Distributions received from equity method investees
|
| ·
| | Beneficial interests in securitization transactions
|
| ·
| | Separately identifiable cash flows and, for cash flows with aspects of more than one class which are not separately identifiable, classification based on the predominant source for those cash flows
|
This guidance is required to be applied retrospectively on January 1, 2018, and the company does not expect the guidance to have a material impact on its consolidated financial statements.
In June 2016, amendments to existing accounting guidance were issued that will require financial assets or a group of financial assets measured at amortized cost basis to be presented at the net amount expected to be collected when finalized. The allowance for credit losses is a valuation account that will be deducted from the amortized cost basis of the financial asset to present the net carrying value at the amount expected to be collected on the financial asset. This guidance affects loans, debt securities, trade receivables, net investments in leases, off-balance-sheet credit exposures, reinsurance receivables and any other financial assets not excluded from the scope that have the contractual right to receive cash. The guidance will be effective on January 1, 2020. The company is currently assessing the impact that the adoption of this new guidance will have on its consolidated financial statements.
In February 2016, lease accounting guidance was issued which, for operating leases, will require a lessee to recognize a right-of-use asset and a lease liability, initially measured at the present value of the lease payments, on its balance sheet. The guidance also requires a lessee to recognize a single lease cost, calculated so the cost of the lease is allocated over the lease term, generally on a straight-line basis. The guidance will be effective for Ball on January 1, 2019. The company is currently assessing the impact the adoption of this standard will have on its consolidated financial statements and it is expected that a material amount of lease assets and liabilities will be recorded on its consolidated balance sheet.
In January 2016, accounting guidance was issued on the classification and measurement of financial assets and liabilities (equity securities and financial liabilities) under the fair value option and the presentation and disclosure requirements for financial instruments. The guidance modifies how entities measure equity investments and present changes in the fair value of financial liabilities. Under the new guidance, entities will have to measure equity investments that do not result in consolidation and are not accounted for under the equity method at fair value and recognize any related changes in fair value in net income unless the investments qualify for the new practicality exception. An exception will apply to those equity investments that do not have a readily determinable fair value and do not qualify for the practical expedient to estimate fair value under the guidance and, as such, these investments may be measured at cost. The guidance will be effective on January 1, 2018. The company does not expect the guidance to have a material impact on its consolidated financial statements.
New Revenue Guidance
In May 2014, the FASB and International Accounting Standards Board jointly issued new revenue recognition guidance which outlines a single comprehensive model for entities to use in accounting for revenue arising from contracts with customers. The new guidance contains a more robust framework for addressing revenue issues and is intended to remove inconsistencies in existing guidance and improve comparability of revenue recognition practices across entities, industries, jurisdictions and capital markets. Under the new standard, revenue is recognized when a customer obtains control of promised goods or services and is recognized in an amount that reflects the consideration which the entity expects to receive in exchange for those goods or services. In addition, the standard requires disclosure of the nature, amount, timing and uncertainty of revenue and cash flows arising from contracts with customers. In July 2015, the FASB approved the deferral of the effective date of the new revenue recognition guidance by one year. The new standard is now effective for annual reporting periods beginning after December 15, 2017.
In March 2016, the principal versus agent guidance within the new revenue recognition standard was amended to clarify how an entity should identify the unit of accounting for the principal versus agent evaluation. The new standard requires an entity to determine whether it is a principal or an agent in a transaction in which another party is involved in providing goods or services to a customer by evaluating the nature of its promise to the customer. An entity is a principal and records revenue on a gross basis if it controls the promised good or service before transferring the good or service to the customer. An entity is an agent and records as revenue the net amount it retains for its agency services if its role is to arrange for another entity to provide the goods or services.
In April 2016, a clarification on implementation guidance related to identifying performance obligations was issued. The amendments clarify when a promised good or service is separately identifiable and allow entities to disregard items that are immaterial in the context of a contract.
In May 2016, narrow scope amendments and practical expedients were issued to clarify the new revenue recognition standard. The amendments clarify the collectability criterion of the revenue standard wherein an entity is allowed to recognize revenue in the amount of consideration received when the following criteria are met: the entity has transferred control of the goods or services, the entity has stopped transferring goods or services, or has no obligation under the contract to transfer additional goods or services and the consideration received from the customer is nonrefundable. The amendments also clarify the following: the fair value of noncash consideration should be measured at contract inception when determining the transaction price, allows an entity to make an accounting policy election to exclude from the transaction price certain types of taxes collected from a customer when the company discloses that policy, for contracts
to be considered completed at transition, all (or substantially all) of the revenue must have been recognized under legacy U.S. GAAP, and a practical expedient is provided in which an entity can avoid having to evaluate the effects of each contract modification from contract inception through the beginning of the earliest period presented when accounting for contracts that were modified prior to adoption under both the full and modified retrospective transition approach. Additionally, the amendments included a rescission of SEC guidance, because of the new revenue guidance, to revenue and expense recognition for freight services in process, accounting for shipping and handling fees and costs and accounting for consideration given by a vendor to a customer.
In December 2016, technical corrections and improvements were issued on a variety of topics within the new revenue recognition standard. The corrections represent minor corrections or improvements and are not expected to have a significant impact on accounting practices. The amendments clarify the following: guarantee fees within the scope of accounting guidance for guarantees are not within the scope of the new revenue recognition guidance, impairment testing for capitalized contract costs should consider both expected contract renewals and extensions and unrecognized consideration already received along with expected future consideration, the sequence of impairment testing for assets within the scope of different topics, allowance of an accounting policy election to determine the provision for losses at the performance obligation level instead of the contract level, exclude all topics within the financial services–insurance guidance from the scope of the new revenue recognition guidance, allow exemptions from the disclosures of remaining performance obligations, disclosure of prior-period performance obligations pertains to all performance obligations and is not limited to those with corresponding contract balances and better aligns accounting guidance and examples within the guidance.
The new guidance is effective for Ball on January 1, 2018, and will supersede the current revenue recognition guidance, including industry-specific guidance. Entities have the option of using either a full retrospective or modified retrospective approach for the adoption of the standard. We adopted the standard for the period beginning January 1, 2018, using the modified retrospective method.
We established a cross-functional implementation team, which includes representatives from all of our business segments. We utilized a bottoms-up approach to analyze the impact of the new standard on our contracts with customers by reviewing our current accounting policies and practices to identify potential differences that would result from applying the requirements of the new standard to revenues arising from such contracts. In addition, we are finalizing changes to our business processes, systems and controls to support recognition and disclosure under the standard upon adoption.
The most significant impact will be in the way we account for revenue in our global metal beverage packaging segments and, to a lesser extent, in our food and aerosol packaging segment. We currently recognize revenue from many of our contracts in these segments when the four established criteria of revenue recognition under the current guidance have been met, generally occurring upon shipment or delivery of goods. Under the new guidance we expect to recognize revenue from many of these contracts over time, which will accelerate the timing of revenue recognition from these arrangements, such that some portion of revenue will be recognized prior to shipment or delivery of goods. In addition to accelerating the timing of recording revenue, we expect corresponding decreases in inventories with an offsetting increase to unbilled receivables to the extent the amounts have not yet been invoiced to the customer.
Relative to the aerospace segment, at this time we do not expect the implementation of the new standard to materially impact the manner in which we currently recognize revenue as the standard supports the recognition of revenue over time under the “cost-to-cost” method, which is consistent with the current revenue recognition model utilized for the majority of our contracts in this segment. We expect revenue arising from the majority of our contracts to continue to be recognized over time because of the continuous transfer of control to the customer. However, due to the complexity of most of our aerospace contracts, the actual revenue recognition treatment required under the new standard will be dependent on contract-specific terms and may vary in some instances from recognition over time.
Our processes, systems and internal controls will be in a position to report under the new accounting standard upon adoption in the first quarter of 2018.
3. Business Segment Information
Ball’s operations are organized and reviewed by management along its product lines and geographical areas and presented in the five4 reportable segments outlined below:below.
Beverage packaging, North and Central America: Consists of operations in the U.S., Canada and Mexico that manufacture and sell metalaluminum beverage containers.containers throughout those countries.
Beverage packaging, EMEA: Consists of operations in numerous countries throughout Europe, including Russia, as well as Egypt and Turkey, that manufacture and sell aluminum beverage containers throughout those regions.
Beverage packaging, South America: Consists of operations in Brazil, Argentina, Paraguay and Chile that manufacture and sell metalaluminum beverage containers.containers throughout most of South America.
Beverage packaging, EuropeAerospace:Consists of operations in numerous countries in Europe, including Russia, that manufacture and sell metal beverage containers.
Food and aerosol packaging: Consists of operations in the U.S., Europe, Canada, Mexico, Argentina and India that manufacture and sell steel food and aerosol containers, as well as extruded aluminum aerosol containers and aluminum slugs.
Aerospace: Consists of operations that manufacture and sell aerospace and other related products and the provision ofprovide services used in the defense, civil space and commercial space industries.
As presented in the tables below, Other consists of a non-reportable segmentsoperating segment (beverage packaging, other) that manufactures and sells aluminum beverage containers in Africa, Middle EastIndia, Saudi Arabia and Asia (AMEA) andthroughout the Asia Pacific region; a non-reportable operating segment that manufacturemanufactures and sell metal beveragesells extruded aluminum aerosol containers, recloseable aluminum bottles across multiple consumer categories and aluminum slugs (aerosol packaging) throughout North America, South America, Europe, and Asia; a non-reportable operating segment that manufactures and sells aluminum cups (aluminum cups); undistributed corporate expenses,expenses; intercompany eliminations and other business activities.
The accounting policies of the segments are the same as those used in the consolidated financial statements, and areas discussed in Note 1. The company also has investments in operations in Guatemala, Panama, South Korea, the U.S. and Vietnam that are accounted for under the equity method of accounting and, accordingly, those results are not included in segment sales or earnings. During 2021, Ball sold its minority-owned investment in South Korea. In January 2022, Ball sold its remaining equity method investment in Ball Metalpack. Refer to Note 4for additional details.
Major Customers
Net sales to major customers, as a percentage of consolidated net sales, were as follows:
| | | | | | | |
| | 2017 | | 2016 | | 2015 | |
| | | | | | | |
Anheuser-Busch InBev and subsidiaries | | 14 | % | 7 | % | 10 | % |
Coca-Cola Bottlers' Sales & Services Company LLC | | 11 | % | 9 | % | 11 | % |
U.S. Government | | 9 | % | 9 | % | 10 | % |
Molson Coors Brewing Company and subsidiaries | | 7 | % | 9 | % | 11 | % |
| | | | | | | |
| | 2021 | | 2020 | | 2019 | |
| | | | | | | |
U.S. Government | | 13 | % | 14 | % | 13 | % |
Anheuser-Busch InBev and affiliates | | 12 | % | 13 | % | 12 | % |
Coca-Cola Bottlers' Sales & Services Company LLC and affiliates | | 10 | % | 9 | % | 9 | % |
Summary of Net Sales by Geographic Area (a)
| | | | | | | | | | | | |
($ in millions) | | U.S. | | Brazil | | Other | | Consolidated |
| | | | | | | | | | | | |
2021 | | $ | 7,284 | | $ | 1,458 | | $ | 5,069 | | $ | 13,811 |
2020 | | | 6,317 | | | 1,295 | | | 4,169 | | | 11,781 |
2019 | | | 5,747 | | | 1,351 | | | 4,376 | | | 11,474 |
| | | | | | | | | | | | |
($ in millions) | | U.S. | | Brazil | | Other | | Consolidated |
| | | | | | | | | | | | |
2017 | | $ | 5,496 | | $ | 1,427 | | $ | 4,060 | | $ | 10,983 |
2016 | | | 4,929 | | | 904 | | | 3,228 | | | 9,061 |
2015 | | | 4,738 | | | 591 | | | 2,668 | | | 7,997 |
| (a) | (a)
| | Revenue is attributed based on origin of sale and includes intercompany eliminations. |
Summary of Net Long-Lived Assets by Geographic Area (a)
| | | | | | | | | | | | | | | |
($ in millions) | | U.S. | | Brazil | | U.K. | | Other | | Consolidated |
| | | | | | | | | | | | | | | |
As of December 31, 2021 | | $ | 4,024 | | $ | 1,035 | | $ | 857 | | $ | 2,509 | | $ | 8,425 |
As of December 31, 2020 | | | 2,819 | | | 839 | | | 766 | | | 2,786 | | | 7,210 |
| | | | | | | | | | | | | | | |
($ in millions) | | U.S. | | Brazil | | U.K. | | Other | | Consolidated |
| | | | | | | | | | | | | | | |
As of December 31, 2017 | | $ | 1,852 | | $ | 876 | | $ | 659 | | $ | 2,629 | | $ | 6,016 |
As of December 31, 2016 | | | 2,097 | | | 885 | | | 182 | | | 2,327 | | | 5,491 |
| (a) | (a)
| | Long-lived assets exclude goodwill and intangible assets and noncurrent restricted cash. assets. |
Summary of Business by Segment
| | | | | | | | | | |
| | | Years Ended December 31, |
($ in millions) | | | 2021 | | 2020 | | 2019 |
| | | | | | | | | | |
Net sales | | | | | | | | | | |
Beverage packaging, North and Central America | | | $ | 5,856 | | $ | 5,076 | | $ | 4,758 |
Beverage packaging, EMEA | | | | 3,509 | | | 2,945 | | | 2,857 |
Beverage packaging, South America | | | | 2,016 | | | 1,695 | | | 1,670 |
Aerospace | | | | 1,911 | | | 1,741 | | | 1,479 |
Reportable segment sales | | | | 13,292 | | | 11,457 | | | 10,764 |
Other | | | | 519 | | | 324 | | | 710 |
Net sales | | | $ | 13,811 | | $ | 11,781 | | $ | 11,474 |
| | | | | | | | | | |
Comparable operating earnings | | | | | | | | | | |
Beverage packaging, North and Central America | | | $ | 681 | | $ | 683 | | $ | 555 |
Beverage packaging, EMEA | | | | 452 | | | 354 | | | 351 |
Beverage packaging, South America | | | | 348 | | | 280 | | | 288 |
Aerospace | | | | 169 | | | 153 | | | 140 |
Reportable segment comparable operating earnings | | | | 1,650 | | | 1,470 | | | 1,334 |
Reconciling items | | | | | | | | | | |
Other (a) | | | | (65) | | | (55) | | | (3) |
Business consolidation and other activities | | | | (142) | | | (262) | | | (244) |
Amortization of acquired intangibles | | | | (152) | | | (150) | | | (155) |
Earnings before interest and taxes | | | | 1,291 | | | 1,003 | | | 932 |
Interest expense | | | | (270) | | | (275) | | | (317) |
Debt refinancing and other costs | | | | (13) | | | (41) | | | (7) |
Total interest expense | | | | (283) | | | (316) | | | (324) |
Earnings before taxes | | | $ | 1,008 | | $ | 687 | | $ | 608 |
| | | | | | | | | |
| | Years Ended December 31, |
($ in millions) | | 2017 | | 2016 | | 2015 |
| | | | | | | | | |
Net sales | | | | | | | | | |
Beverage packaging, North and Central America | | $ | 4,178 | | $ | 3,612 | | $ | 3,202 |
Beverage packaging, South America | | | 1,692 | | | 1,014 | | | 591 |
Beverage packaging, Europe | | | 2,360 | | | 1,915 | | | 1,653 |
Food and aerosol packaging | | | 1,138 | | | 1,171 | | | 1,297 |
Aerospace | | | 991 | | | 818 | | | 810 |
Reportable segment sales | | | 10,359 | | | 8,530 | | | 7,553 |
Other | | | 624 | | | 531 | | | 444 |
Net sales | | $ | 10,983 | | $ | 9,061 | | $ | 7,997 |
| | | | | | | | | |
Comparable operating earnings | | | | | | | | | |
Beverage packaging, North and Central America | | $ | 533 | | $ | 469 | | $ | 402 |
Beverage packaging, South America | | | 333 | | | 185 | | | 80 |
Beverage packaging, Europe | | | 233 | | | 217 | | | 192 |
Food and aerosol packaging | | | 102 | | | 109 | | | 108 |
Aerospace | | | 98 | | | 88 | | | 82 |
Reportable segment comparable operating earnings | | | 1,299 | | | 1,068 | | | 864 |
Reconciling items | | | | | | | | | |
Other (a) | | | (79) | | | (92) | | | (63) |
Business consolidation and other activities | | | (221) | | | (337) | | | (195) |
Amortization of acquired Rexam intangibles | | | (162) | | | (65) | | | — |
Catch-up depreciation and amortization for 2016 from finalization of Rexam valuation | | | (35) | | | — | | | — |
Cost of sales associated with Rexam inventory step-up | | | — | | | (84) | | | — |
Egyptian pound devaluation | | | — | | | (27) | | | — |
Earnings before interest and taxes | | | 802 | | | 463 | | | 606 |
Interest expense | | | (285) | | | (229) | | | (143) |
Debt refinancing and other costs | | | (3) | | | (109) | | | (117) |
Total interest expense | | | (288) | | | (338) | | | (260) |
Earnings before taxes | | | 514 | | | 125 | | | 346 |
Tax (provision) benefit | | | (165) | | | 126 | | | (47) |
Equity in results of affiliates, net of tax | | | 31 | | | 15 | | | 4 |
Net earnings | | | 380 | | | 266 | | | 303 |
Net earnings attributable to noncontrolling interests | | | (6) | | | (3) | | | (22) |
Net earnings attributable to Ball Corporation | | $ | 374 | | $ | 263 | | $ | 281 |
| (a) | (a)
| | Includes undistributed corporate expenses, net, of $128$72 million, $110$58 million and $93$50 million for the years ended December 2017, 20162021, 2020 and 2015,2019, respectively. |
| | Years Ended December 31, |
($ in millions) | | 2021 | | 2020 | | 2019 |
| | | | | | | | | |
Depreciation and amortization (a) | | | | | | | | | |
Beverage packaging, North and Central America | | $ | 200 | | $ | 184 | | $ | 190 |
Beverage packaging, EMEA | | | 223 | | | 230 | | | 246 |
Beverage packaging, South America | | | 141 | | | 142 | | | 136 |
Aerospace | | | 65 | | | 53 | | | 43 |
Reportable segment depreciation and amortization | | | 629 | | | 609 | | | 615 |
Other | | | 71 | | | 59 | | | 63 |
Depreciation and amortization | | $ | 700 | | $ | 668 | | $ | 678 |
| | | | | | | | | |
Capital expenditures | | | | | | | | | |
Beverage packaging, North and Central America | | $ | 697 | | $ | 367 | | $ | 139 |
Beverage packaging, EMEA | | | 305 | | | 262 | | | 147 |
Beverage packaging, South America | | | 334 | | | 159 | | | 150 |
Aerospace | | | 198 | | | 174 | | | 96 |
Reportable segment capital expenditures | | | 1,534 | | | 962 | | | 532 |
Other | | | 192 | | | 151 | | | 66 |
Capital expenditures | | $ | 1,726 | | $ | 1,113 | | $ | 598 |
| | | | | | | | | |
| | Years Ended December 31, |
($ in millions) | | 2017 | | 2016 | | 2015 |
| | | | | | | | | |
Depreciation and amortization (a) | | | | | | | | | |
Beverage packaging, North and Central America | | $ | 179 | | $ | 117 | | $ | 73 |
Beverage packaging, South America | | | 144 | | | 78 | | | 41 |
Beverage packaging, Europe | | | 254 | | | 121 | | | 60 |
Food and aerosol packaging | | | 56 | | | 57 | | | 59 |
Aerospace | | | 31 | | | 30 | | | 27 |
Reportable segment depreciation and amortization | | | 664 | | | 403 | | | 260 |
Other | | | 65 | | | 50 | | | 26 |
Depreciation and amortization | | $ | 729 | | $ | 453 | | $ | 286 |
| | | | | | | | | |
Capital expenditures | | | | | | | | | |
Beverage packaging, North and Central America | | $ | 283 | | $ | 234 | | $ | 250 |
Beverage packaging, South America | | | 36 | | | 33 | | | 25 |
Beverage packaging, Europe | | | 81 | | | 126 | | | 122 |
Food and aerosol packaging | | | 50 | | | 80 | | | 61 |
Aerospace | | | 70 | | | 41 | | | 28 |
Reportable segment capital expenditures | | | 520 | | | 514 | | | 486 |
Other | | | 36 | | | 92 | | | 42 |
Capital expenditures | | $ | 556 | | $ | 606 | | $ | 528 |
| (a) | (a)
| | Includes amortization of acquired Rexam intangibles for the years ended December 2017 and 2016. intangibles. |
The company does not disclose total assets by segment as it is not provided to the chief operating decision makers.maker.
4. Acquisitions and Dispositions
RexamBall Metalpack Investment
On June 30, 2016,January 26, 2022, Ball acquired 100sold its remaining 49 percent owned equity method investment in Ball Metalpack to Sonoco, a global provider of consumer, industrial, healthcare and protective packaging, for approximately $300 million in cash, subject to customary closing adjustments. The carrying value of the outstanding sharesinvestment was zero, therefore the proceeds, net of Rexam,adjustments, will be reported as a U.K.-based beverage container manufacturer,pre-tax gain in business consolidation and other activities in the unaudited condensed consolidated statements of earnings. Cash proceeds will be presented in business dispositions in the unaudited condensed consolidated statements of cash flows.
South Korea Investment
In the third quarter of 2021, Ball sold its minority-owned investment in South Korea. Consideration for the transaction was cash of $120 million, of which $110 million has been received and presented in business dispositions within cash flows from investing activities in Ball’s consolidated statements of cash flows. The remaining $10 million will be received on or before December 31, 2022, and this amount is included in other current assets on Ball’s consolidated balance sheets. In the second quarter of 2021, the company recorded a loss of $5 million related to the disposal, which is presented in business consolidation and other activities in the consolidated statement of earnings. See Note 6 for further details.
Brazil Aluminum Aerosol Packaging Business
In the third quarter of 2020, the company acquired the entire share capital of Tubex Industria E Comercio de Embalagens Ltda, an aluminum aerosol packaging business with a plant in Itupeva, Brazil, for the purchase price of £2.9 billion ($3.8 billion) in cash, and 64.5$80 million, treasury shares of Ball Corporation common stock (valued at $35.70 per share, as adjusted for the two-for-one stock split, for a total share consideration of $2.3 billion). Additionally, the company recorded $24 million of consideration for stock-based compensation. The common shares were valued using the price on the date of acquisition and were presented as a reduction of treasury stock. The cash portion of the acquisition price was paid in July 2016 using proceeds from restricted cash held in escrow and borrowings under the $1.4 billion and €1.1 billion Term A loan facilities obtained in March 2016.
The consummation of the acquisition was subject to, among other things, approval from Ball’s shareholders, approval from Rexam’s shareholders, certain regulatory approvals and satisfaction of other customary closing conditions. In order to satisfy certain regulatory requirements, the company was required to sell a portion of Ball’s existing beverage packaging business and select beverage can assets of Rexam (the Divestment Business). The sale of the Divestment Business to Ardagh Group S.A. (Ardagh), was completed concurrently on June 30, 2016, for $3.42 billion, subject to customary closing adjustments, including initial cash consideration of $69 million plus potential additional consideration not to exceed $30 million in total over the next three years. The business is part of Ball’s aerosol packaging operating segment. The transaction broadens the geographic reach of Ball’s aluminum aerosol packaging business, serving the growing Brazilian personal care market. In 2021, the company recorded credits of $6 million resulting from revisions to its estimate of contingent consideration, which is recorded in business consolidation and certain transaction service arrangements between Ballother activities in the company’s consolidated statement of earnings. See Note 6 for further details.
Argentina Steel Aerosol Business
In 2019, the company sold its Argentina steel aerosol packaging business, which included facilities in Garin and Ardagh duringSan Luis, Argentina, and recorded a transition period.loss on disposal of $52 million, which included the write-off of cumulative translation adjustments of $45 million related to the Argentina business that had been previously recorded in accumulated other comprehensive income. The loss on disposal has been presented in business consolidation and other activities in the company’s consolidated statement of earnings.
Beverage Packaging China
In 2019, the company completed the sale agreement with Ardaghof its metal beverage packaging business in respectChina for upfront consideration of approximately $213 million, subject to customary closing adjustments, plus potential additional consideration related to the Divestment Business contains customary representations, warranties, covenants and provisions allocating liabilities,relocation of an existing facility in China in the coming years, the value of which was fully impaired in 2020, as well as indemnification obligations to anddescribed in Note 6. The upfront proceeds from Ardagh, pursuant to which claims may be made when applicable. A pretax gainthis sale were received in 2019. The loss on sale $344disposal of $45 million for the year ended December 31, 2016, was recorded in 2019 within business consolidation and other activities and was subject to finalizationin the company’s consolidated statement of working capital and other items. earnings.
5. Revenue from Contracts with Customers
The following table disaggregates the company’s net sales based on the timing of transfer of control:
| | | | | | | | | |
| | ($ in millions) |
Years Ended December 31, | | Point in Time | | Over Time | | Total |
| | | | | | | | | |
2021 | | $ | 2,459 | | $ | 11,352 | | $ | 13,811 |
2020 | | | 2,223 | | | 9,558 | | | 11,781 |
2019 | | | 2,220 | | | 9,254 | | | 11,474 |
| | | | | | | | | |
The company also entered into a supply agreement with Ardagh to manufacturedid not have any contract assets at December 31, 2021, 2020, or 2019. The opening and sellclosing balances of the company’s current and noncurrent contract liabilities are as follows:
| | | | | | |
| | Contract | | Contract |
| | Liabilities | | Liabilities |
($ in millions) | | (Current) | | (Noncurrent) |
| | | | | | |
Balance at December 31, 2019 | | $ | 87 | | $ | 9 |
Increase (decrease) | | | 21 | | | 20 |
Balance at December 31, 2020 | | | 108 | | | 29 |
Increase (decrease) | | | 164 | | | 9 |
Balance at December 31, 2021 | | $ | 272 | | $ | 38 |
can ends to the Divestment Business in Brazil in exchange for proceeds of $103 million. As a condition of the sale of the Divestment Business to Ardagh, the company guaranteed a minimum volume of sales for the Divestment Business in 2017, whereby the company was required to pay Ardagh up to $75 million based upon any shortfall of 2017 sales relative to an agreed-upon minimum threshold. In 2017, the company finalized the Ardagh closing adjustments and minimum volume guarantees and recorded an additional gain on sale of $55 million.
In connection with the sale of the Divestment Business to Ardagh on June 30, 2016, the company provided indemnifications for the uncertain tax positions of the Divestment Business sold to Ardagh. These indemnifications were accounted for as guarantees and the company initially recognized a liability equal to the fair value of the indemnities. There are no limitations on the maximum potential future payments the company could be obligated to make and, based on the nature of the indemnified items, the company is unable to reasonably estimate its potential exposure under these items in excess of liabilities recorded. During 2017, the company recorded $34 million in business consolidation and other activities for an increase in the estimated amount of the claims covered by indemnifications for tax matters provided to the buyer in relation to the Divestment Business. The estimated value of the claims under these indemnities is $55 million at December 31, 2017, and the liabilities have been recorded in other current liabilities.
The portion of the Divestment Business composed of Ball's legacy beverage packaging businesses had earnings before taxes as shown below. These earnings before taxes may not be indicative of the earnings before taxes that would be generated by these components of the Divestment Business in future periods. Additionally, due to complexities associated with how Ball's legacy beverage packaging businesses included in the Divestment Business were integrated into Ball Corporation in historical periods, these earnings before taxes may not be indicative of the earnings before taxes of these Divestment Business components had they been operated as a stand-alone business or businesses.
| | | | | | |
| | Years Ended December 31, |
($ in millions) | | 2016 | | 2015 |
| | | | | | |
Earnings before taxes | | $ | 104 | | $ | 178 |
Earnings before taxes attributable to Ball Corporation | | | 104 | | | 170 |
The Rexam portion of the Divestment Business is not included in the table above as the financial information is not included in Ball’s historical results.
A total of 54 manufacturing facilities were acquired from Rexam, including 17 in North America, 20 in Europe, 12 in South America and five in the AMEA region. A total of 22 manufacturing facilities were sold as part of the Divestment Business, including 12 Ball facilities and 10 Rexam facilities. Of these 22 facilities, eight are located in North America, 12 are located in Europe and two are located in Brazil. The company had a total of 75 beverage manufacturing facilities and joint ventures after the completion of the Rexam acquisition and sale of the Divestment Business.
The Rexam acquisition aligns with Ball’s Drive for 10 vision, including the company’s long-standing capital allocation strategy and EVA philosophy. The combination created the world’s largest supplier of beverage containers allowing the company to better serve its customers with its enhanced geographic footprint and innovative product offerings. In particular, Ball expects the acquisition to continue to deliver long-term shareholder value through optimizing global sourcing, reducing general and administrative expenses, sharing best practices to improve production efficiencies and leveraging its footprint to lower freight, logistics and warehousing costs. In addition, further value can continue to be created through balance sheet improvements with a focus on working capital and inventory management and sustainability priorities as a result of the larger plant network.
The Rexam acquisition was accounted for as a business combination and its results of operations have been included in the company’s consolidated statements of earnings and cash flows from the date of acquisition. In total, pretax charges of $216 million were incurred for transaction costs associated with the acquisition which, in accordance with current accounting guidance, were expensed as incurred. The transaction costs are included in the business consolidation and other activities line in the consolidated statement of earnings.
In connection with the acquisition, Ball assumed Rexam debt of approximately $2.8 billion, of which approximately $2.7 billion was extinguished during 2016. The proceeds from the sale of the Divestment Business were partially used to extinguish the assumed Rexam debt.
During the second quarter of 2017, the company finalized the allocation of the purchase price for the Rexam acquisition. The measurement period adjustments to the acquisition fair values and useful lives for acquired identifiable intangible assets and fixed assets were due to the refinement of our valuation models, assumptions and inputs. The updated assumptions and inputs incorporated additional information obtained subsequent to the closing of the transaction related to facts and circumstances that existed as of the acquisition date. The final purchase price allocation changes during the second quarter of 2017 included an increase of $590 million in the value of intangible assets, an increase of $31 million in the value of investments in affiliates and a decrease of $384 million in the value of goodwill. Net long-term deferred tax liabilities also increased by $244 million primarily due to the tax effect of these changes to the final purchase price allocation. The company recorded an additional charge of $35 million in 2017 in relation to the year ended December 31, 2016, for incremental depreciation2021, contract liabilities increased by $173 million, which is net of cash received of $755 million and amortizationamounts recognized as sales of $582 million, all of which related to current contract liabilities. The amount of sales recognized during the finalizationyear ended December 31, 2021, that was included in the company’s opening contract liabilities balance was $108 million, all of Rexam asset valueswhich related to current contract liabilities. The difference between the opening and useful lives. closing balances of the company’s contract liabilities primarily results from timing differences between the company’s performance and the customer’s payment. Current contract liabilities are classified within other current liabilities on the consolidated balance sheet and noncurrent contract liabilities are classified within other liabilities.
The cumulative impactscompany also recognized sales of all adjustments have been reflected in the consolidated financial statements, which are summarized in the table below:
| | | |
| | June 30, |
($ in millions) | | 2016 |
| | | |
Cash | | $ | 450 |
Receivables, net | | | 778 |
Inventories, net | | | 782 |
Other current assets | | | 165 |
Assets held for sale (sold to Ardagh on June 30, 2016) | | | 911 |
Total current assets | | | 3,086 |
| | | |
Property, plant and equipment | | | 2,301 |
Goodwill | | | 3,415 |
Intangible assets | | | 2,478 |
Restricted cash | | | 174 |
Other assets | | | 490 |
Total assets acquired | | | 11,944 |
| | | |
Short-term debt and current portion of long-term debt | | | 2,792 |
Accounts payable | | | 858 |
Accrued employee costs | | | 135 |
Liabilities held for sale (sold to Ardagh on June 30, 2016) | | | 7 |
Other current liabilities | | | 373 |
Total current liabilities | | | 4,165 |
| | | |
Long-term debt | | | 28 |
Employee benefit obligations | | | 508 |
Deferred taxes and other liabilities | | | 993 |
Total liabilities assumed | | | 5,694 |
| | | |
Net assets acquired | | | 6,250 |
| | | |
Noncontrolling interests | | | (90) |
Aggregate value of consideration paid | | $ | 6,160 |
The following table details the identifiable intangible assets acquired, their fair values$16 million and estimated useful lives:
| | | | | | |
($ in millions) | | Fair Value | | Weighted-
Average
Estimated
Useful Life (in
Years) | |
| | | | | | |
Customer relationships | | $ | 2,437 | | 17 | |
Trademarks | | | 41 | | 3 | |
| | $ | 2,478 | | | |
Because the acquisition of Rexam was a stock purchase, neither the goodwill nor the intangible assets acquired are deductible under local country corporate tax laws; however, they will generally be deductible in computing earnings and profits for U.S. tax purposes.
The following unaudited pro forma consolidated results of operations (pro forma information) have been prepared as if the acquisition of Rexam and the sale of the Divestment Business had occurred as of January 1, 2015. The pro forma information combines the historical results of Ball and Rexam. The pro forma information is not necessarily indicative of the actual results that would have occurred had the acquisition been in effect for the periods presented, nor is it necessarily indicative of the results that may be obtained in the future.
| | | | | | |
| | Years Ended December 31, |
($ in millions, except per share amounts) | | 2016 | | 2015 |
| | | | | | |
Net sales (a) | | $ | 10,455 | | $ | 11,190 |
Net earnings attributable to Ball Corporation (b) | | | 227 | | | (417) |
Basic earnings per share | | | 0.65 | | | (1.19) |
Diluted earnings per share | | | 0.64 | | | (1.19) |
| (a)
| | Net sales were adjusted to include net sales of Rexam. The company also excluded the net sales attributable to the Divestment Business.
|
| (b)
| | Pro forma adjustments to net earnings attributable to Ball Corporation were adjusted as follows:
|
| ·
| | Excludes acquisition-related transaction costs and debt refinancing costs incurred in the year ended December 31, 2016, pro forma statements of earnings. The twelve months ended December 31, 2015, pro forma net earnings were adjusted to include the acquisition-related transaction costs and debt refinancing costs incurred in the year ended December 31, 2016, as the pro forma information shown assumes that the Rexam acquisition has been consummated as of January 1, 2015.
|
| ·
| | Includes interest expense associated with the new debt utilized to finance the acquisition.
|
| ·
| | Includes depreciation and amortization expense based on the final fair value of property, plant and equipment and amortizable intangible assets acquired.
|
| ·
| | Includes an additional charge to cost of sales of $84$20 million in the year ended December 31, 2015, based on the step-up value of inventory, and removes the charge of $84 million for the year ended December 31, 2016.
|
| ·
| | Excludes net earnings attributable to the Divestment Business for the years ended December 31, 2016 and 2015.
|
| ·
| | Excludes the gain on sale of the Divestment Business for the year ended December 31, 2016.
|
| ·
| | Includes the effect of final measurement period adjustments for the years ended December 31, 2016 and 2015.
|
All of these pro forma adjustments were adjusted for the applicable income tax impacts. Ball has applied enacted statutory tax rates in the U.K. during the periods indicated above. Ball used a tax rate of 20 percent and 20.25 percent to calculate the financing, acquisition and divestment business-related adjustments for the years ended December 31, 20162021 and 2015, respectively. However,2020, respectively, from performance obligations satisfied (or partially satisfied) in prior periods. These sales amounts are the tax impact on acquisition-related transaction costs already incurred was recorded at a U.S. statutory rateresult of approximately 37 percent as these transaction costs were incurredchanges in the U.S. These rates may not be reflective of Ball’s effective tax rate for future periods after the Rexam acquisition and saletransaction price of the Divestment Business.company’s contracts with customers.
InTransaction Price Allocated to Remaining Performance Obligations
The table below discloses: (1) the fourth quarteraggregate amount of 2015, Ball completed the acquisitiontransaction price allocated to performance obligations that are unsatisfied (or partially unsatisfied) as of the end of the reporting period, for those contracts with an original duration of at least one year, and (2) when the company expects to record sales on these multi-year contracts.
| | | | | | | | | |
($ in millions) | | Next Twelve Months | | Thereafter | | Total |
| | | | | | | | | |
Sales expected to be recognized on multi-year contracts in place as of December 31, 2021 | | $ | 1,210 | | $ | 1,136 | | $ | 2,346 |
The contracts with an original duration of less than one year, which are excluded from the table above based on the company’s election of the practical expedient, are primarily related to contracts where control will be fully transferred to the customers in less than one year. The nature of the remaining outstanding noncontrolling interests in a Ball-consolidated joint venture company (Latapack-Ball) organized and operating in Brazil. Ball and its joint venture partners reached an agreement forperformance obligations within these contracts, as well as the partners to exchange all of their interest in Latapack-Ball for a total of approximately 11.4 million treasury shares of Ball common stock, as retrospectively adjusted for the two-for-one stock split that was effective on May 16, 2017, and $17 million of cash. The acquisitionnature of the noncontrolling interestsvariability and how it will be resolved, are described in the joint venture was completed in December 2015, and Latapack-Ball is now a wholly owned subsidiary of Ball and its results are recorded in the beverage packaging, South America, segment.Note 1.
Food and Aerosol Paint and General Line Plant
In March 2017, the company sold its paint and general line can manufacturing facility in Hubbard, Ohio, for approximately $32 million in cash and recorded a $15 million gain on the sale.
Food and Aerosol Specialty Tin Business
In October 2016, the company sold its specialty tin manufacturing facility in Baltimore, Maryland, for approximately $24 million in cash and recorded a $9 million gain on the sale.
Wavefront Technologies (Wavefront)
In January 2016, the company acquired Wavefront located in Annapolis Junction, Maryland, for total cash consideration of $36 million, net of cash acquired. Wavefront provides systems and network engineering, software development software and analytical services for cyber and mission-focused programs to the U.S. government and commercial industry. The financial results of Wavefront have been included in our aerospace segment from the date of acquisition. The acquisition is not material to the company.
5.6. Business Consolidation and Other Activities
Following is a summary of business consolidation and other activity (charges) income included in the consolidated statements of earnings:
| | | | | | | | | |
| | Years Ended December 31, |
($ in millions) | | 2017 | | 2016 | | 2015 |
| | | | | | | | | |
Beverage packaging, North and Central America | | $ | (47) | | $ | (20) | | $ | (19) |
Beverage packaging, South America | | | (5) | | | (15) | | | (3) |
Beverage packaging, Europe | | | (89) | | | (24) | | | (10) |
Food and aerosol packaging | | | 6 | | | (26) | | | — |
Aerospace | | | — | | | — | | | 1 |
Other | | | (86) | | | (252) | | | (164) |
| | $ | (221) | | $ | (337) | | $ | (195) |
| | | | | | | | |
| Years Ended December 31, |
($ in millions) | 2021 | | 2020 | | 2019 |
| | | | | | | | |
Beverage packaging, North and Central America | $ | (6) | | $ | (5) | | $ | (14) |
Beverage packaging, EMEA | | (7) | | | (10) | | | (39) |
Beverage packaging, South America | | 9 | | | 1 | | | 15 |
Other | | (138) | | | (248) | | | (206) |
| $ | (142) | | $ | (262) | | $ | (244) |
20172021
Beverage Packaging, North and Central America
During 2017,2021, the company recorded charges of $4 million resulting from damage to plant assets, less anticipated insurance receipts, sustained when the southeastern U.S. was impacted by tornadoes. Additional charges were $2 million for individually insignificant activities.
Beverage Packaging, EMEA
During 2021, the company recorded charges of $6 million in connection with previously announced plant closures and $1 million for individually insignificant activities.
Beverage Packaging, South America
During 2021, the closurecompany recorded a $22 million gain related to indirect tax gain contingencies in Brazil as these amounts are now estimable and realizable. The company’s Brazilian subsidiaries filed lawsuits in 2014 and 2015 to challenge the Brazilian tax authorities regarding the computation of certain indirect taxes, claiming amounts were overpaid to the tax authorities because the tax base included a “tax on tax” component. The amounts recorded in business consolidation and other activities relate to periods prior to 2019. See Note 22 for further details. Additional charges were $4 million in connection with previously announced plant closures and $9 million for individually insignificant activities.
Other
During 2021, the company recorded the following amounts:
| ● | A non-cash settlement loss of $135 million related to the purchase of non-participating group annuity contracts and lump-sum payments to settle the projected pension benefit obligations for certain of Ball’s U.S. defined benefit pension plans, which triggered settlement accounting. The settlement loss primarily reflects recognition of unamortized actuarial losses in these U.S. pension plans. See Note 17 for further details. |
| ● | A loss of $5 million related to the sale of Ball’s minority-owned investment in South Korea. See Note 4 for further details. |
| ● | Income of $6 million resulting from revisions to the estimate of contingent consideration related to the 2020 acquisition of Tubex Industria E Comercio de Embalagens Ltda in Brazil. See Note 4 for further details. |
| ● | Charges of $4 million for individually insignificant activities. |
2020
Beverage Packaging, North and Central America
During 2020, the company recorded charges of $5 million for individually insignificant activities in connection with previously announced closures of certain beverage can and end manufacturing facilities and other activities.
Beverage Packaging, EMEA
During 2020, the company recorded charges of $10 million for individually insignificant activities in connection with previously announced plant closures, restructuring and other activities.
Beverage Packaging, South America
During 2020, the company recorded credits of $1 million for individually insignificant activities.
Other
During 2020, the company recorded the following amounts:
| ● | Non-cash settlement losses of $120 million related to the purchase of non-participating group annuity contracts and lump-sum payments to settle the projected pension benefit obligations for certain of Ball’s U.S. defined benefit pension plans, which triggered settlement accounting. The settlement losses primarily reflect the recognition of aggregated unamortized actuarial losses in these U.S. pension plans. See Note 17 for further details. |
| ● | A non-cash impairment charge of $62 million related to the goodwill of the new beverage packaging, other, operating segment. See Note 11 for further details. |
| ● | A non-cash charge of $23 million resulting from the recent deterioration of China’s real estate market, which led the company to reduce the value of potential future consideration due as part of the sale of its China beverage packaging business. |
| ● | Charges of $15 million resulting from an adjustment to the selling price of the company’s steel food and aerosol business. |
| ● | A credit of $11 million related to the reversal of reserves against working capital recorded in the fourth quarter of 2019 in the new beverage packaging, other, segment, as previously at-risk balances were subsequently collected. |
| ● | Charges of $6 million for long-term incentive and other compensation arrangements associated with the 2016 Rexam acquisition. |
| ● | Charges of $33 million for individually insignificant activities. |
2019
Beverage Packaging, North and Central America
During 2019, the company recorded charges of $8 million for revised estimates of charges recorded in prior periods in connection with the 2018 closures of its beverage can manufacturing facilities in Chatsworth, California, and Longview, Texas, and its beverage end manufacturing facility in Birmingham, Alabama.
Other income and charges in 2019 included $6 million of expense for individually insignificant activities.
Beverage Packaging, EMEA
During 2019, the company recorded charges of $26 million for asset impairments, accelerated depreciation and inventory impairments related to previously announced plant closures and restructuring activities.
Other charges in 2019 included $13 million of expense for individually insignificant activities.
Beverage Packaging, South America
During 2019, the company recorded a $57 million gain related to indirect tax gain contingencies in Brazil as these amounts were determined to be estimable and realizable. The Birmingham plant is expectedcompany’s Brazilian subsidiaries filed lawsuits in 2014 and 2015 to cease production bychallenge the endBrazilian tax authorities regarding the computation of certain indirect taxes, claiming amounts were overpaid to the second quarter of 2018,tax authorities because the tax base included a “tax on tax” component. See Note 22 for further details. The amounts recorded in business consolidation and the Chatsworth and Longview plants are expectedother activities relate to cease production by the end of the third quarter of 2018. During 2017, theperiods prior to 2019.
The company recorded charges of $29 million for employee severance and benefits and $4 million for facility shutdown costs,in 2019 related to asset impairment,impairments, accelerated depreciation and other costsinventory impairments related to the closures. The majorityplant closures and restructuring activities.
Other charges in 2019 included $13 million of these charges are expected to be paid by the end of the third quarter of 2018.
In 2016, the company announced the closure of its beverage packaging facility in Reidsville, North Carolina, which ceased production during the second quarter of 2017. During 2017, the company recorded charges of $9 millionexpense for employee severance and benefits, facility shutdown costs, asset impairment, accelerated depreciation and other costs related to the closure of its Reidsville, North Carolina, plant.
individually insignificant activities.
Other
Other charges in 2017 included $5 million of individually insignificant activities.
Beverage Packaging, South America
Charges in 2017 included $3 million of professional services and other costs associated with the acquisition of Rexam
and $2 million for individually insignificant activities.
Beverage Packaging, Europe
During 2017, the company closed its beverage packaging facility in Recklinghausen, Germany. During 2017, the company recorded charges of $59 million for employee severance and benefits and $22 million for facility shutdown costs, asset impairment, accelerated depreciation and other costs. The company expects to incur approximately $15 million of additional expense related to the closure. The majority of these charges are expected to be paid by the end of 2018.
During 2017, the company recorded charges of $4 million for professional services and other costs associated with the acquisition of Rexam.
Other charges in 2017 included $4 million for individually insignificant activities.
Food and Aerosol Packaging
During 2017, the company recorded charges of $7 million for facility shutdown costs and accelerated depreciation for the closure of its Weirton, West Virginia, plant.
In 2017, the company sold its food and aerosol packaging paint and general line can plant in Hubbard, Ohio, and recorded a gain on sale of $15 million.
Other charges in 2017 included $2 million for individually insignificant activities.
Other
During 2017,2019, the company recorded the following amounts:
| ·
● | A $45 million loss on the sale of the metal beverage packaging business in China and charges of $18 million for estimated employee severance costs and professional services associated with the sale. |
| ● | A loss of $52 million related to the sale of the Argentina steel aerosol packaging business, including $45 million related to cumulative translation adjustments previously recorded in accumulated other comprehensive earnings. |
| ● | A $64 million impairment charge related to certain property, plant and equipment, intangible assets and other assets of the company’s Saudi Arabian beverage packaging business (of which Ball owns 51 percent). |
| ● | A settlement loss of $44$8 million primarily related to the purchase of non-participating group annuity contracts to settle a portion of the projected pension benefit obligations in certain Ball U.S.Ball’s Canadian defined benefit pension plansplan, which triggered settlement accounting. The settlement loss primarily represented a pro rata portion ofrepresents the aggregate unamortized actuarial loss in thesethis pension plans.plan. |
| ·
● | | ExpenseCharges of $34 million for the estimated amount of claims covered by the indemnification for certain tax matters provided to the buyer in the sale of the Divestment Business.
|
| ·
| | Expense of $25 million for long-term incentive and other compensation arrangements associated with the Rexam acquisition.
|
| ·
| | A $55 million gain recognized in connection with the sale of the Ball portion of the Divestment Business.
|
| ·
| | Expense of $12 million for professional services and other costs associated with the acquisition of Rexam.
|
| ·
| | Expense of $26$19 million for individually insignificant activities.
|
7. Supplemental Cash Flow Statement Disclosures
| | | | | | |
| | December 31, |
($ in millions) | | 2021 | | 2020 |
| | | | | | |
Beginning of period: | | | | | | |
Cash and cash equivalents | | $ | 1,366 | | $ | 1,798 |
Current restricted cash (included in other current assets) | | | 15 | | | 8 |
Total cash, cash equivalents and restricted cash | | $ | 1,381 | | $ | 1,806 |
| | | | | | |
End of period: | | | | | | |
Cash and cash equivalents | | $ | 563 | | $ | 1,366 |
Current restricted cash (included in other current assets) | | | 16 | | | 15 |
Total cash, cash equivalents and restricted cash | | $ | 579 | | $ | 1,381 |
The company’s restricted cash is primarily related to receivables factoring programs and represents amounts collected from customers but not yet remitted to the banks as of the end of the reporting period.
Noncash investing activities include the acquisition of property, plant and equipment (PP&E) for which payment has not been made. These noncash capital expenditures are excluded from the statement of cash flows. The PP&E acquired but not yet paid for amounted to $540 million and $409 million at December 31, 2021 and 2020, respectively.
8. Receivables, Net
| | | | | | |
| | December 31, |
($ in millions) | | 2021 | | 2020 |
| | | | | | |
Trade accounts receivable | | $ | 1,304 | | $ | 825 |
Unbilled receivables | | | 727 | | | 528 |
Less: Allowance for doubtful accounts | | | (9) | | | (9) |
Net trade accounts receivable | | | 2,022 | | | 1,344 |
Other receivables | | | 538 | | | 394 |
| | $ | 2,560 | | $ | 1,738 |
2016
Beverage Packaging, North and Central America
During 2016, the company recorded charges of $4 million for professional services and other costs associated with the acquisition of Rexam.
During 2016, the company recorded charges of $4 million related to the plant closure in Bristol, Virginia, announced in 2015.
In 2016, the company announced the planned closure of its beverage packaging facility in Reidsville, North Carolina, which ceased production in 2017. Charges in 2016 of $9 million were comprised of employee severance, pension and other benefits, asset impairments, and facility shut down and disposal costs.
Other charges in 2016 included $3 million of individually insignificant activities.
Beverage Packaging, South America
During 2016, the company recorded charges of $14 million for professional services and other costs associated with the acquisition of Rexam.
Other charges in 2016 included $1 million of individually insignificant activities.
Beverage Packaging, Europe
During 2016, the company recorded charges of $22 million for professional services and other costs associated with the acquisition of Rexam.
Other charges in 2016 included $2 million of individually insignificant activities.
Food and Aerosol Packaging
In 2016, the company announced the planned closure of its food and aerosol packaging flat sheet production and end-making facility in Weirton, West Virginia, which ceased production in the first quarter of 2017. Charges in 2016 of $18 million were composed of employee severance and benefits, facility shutdown costs, and asset impairment and disposal costs.
In 2016, the company sold its specialty tin manufacturing facility in Baltimore, Maryland, which resulted in a gain on sale of $9 million.
During 2016, the company rationalized certain manufacturing equipment to align production capacity with its customer requirements. The charge recorded of $10 million included accelerated depreciation of the rationalized equipment and write offs of costs associated with relocated assets.
Other charges in 2016 included $7 million of individually insignificant activities.
Other
During 2016, the company recorded the following charges:
| ·
| | Expense of $301 million for professional services and other costs associated with the acquisition of Rexam.
|
| ·
| | Foreign currency losses of $173 million from the revaluation of foreign currency denominated restricted cash and intercompany loans related to the cash component of the Rexam acquisition purchase price, the sale of the Divestment Business and the revaluation of the euro-denominated debt issuance obtained in December 2015.
|
| ·
| | Expense of $108 million for long-term incentive and other compensation arrangements associated with the Rexam acquisition.
|
| ·
| | A gain of $344 million in connection with the sale of the Ball portion of the Divestment Business.
|
| ·
| | Expense of $14 million for individually insignificant activities.
|
2015
Beverage Packaging, North and Central America
During 2015, the company announced the planned closure of its Bristol, Virginia, beverage packaging end-making facility, which ceased production in 2016. The company recorded charges of $19 million in 2015, which were comprised of $17 million in severance, pension and other employee benefits and other individually insignificant items totaling $2 million.
Beverage Packaging, South America
During 2015, the company recognized charges of $3 million for individually insignificant items.
Beverage Packaging, Europe
During 2015, the company recorded a charge of $5 million for the write down of property held for sale to fair value less cost to sell.
During 2015, the company also recognized charges of $5 million for individually insignificant items.
Aerospace
During 2015, the company recognized a net $1 million gain for individually insignificant items.
Other
During the year ended December 31, 2015, the company recorded the following charges:
| ·
| | Expenses of $139 million for professional services and other costs associated with the acquisition of Rexam announced in February 2015.
|
| ·
| | $14 million of net foreign currency gains and losses from the revaluation of foreign currency denominated restricted cash held to pay a portion of the cash component of the Rexam acquisition purchase price and the revaluation of the euro-denominated debt issuance in December 2015.
|
| ·
| | Expenses of $11 million for individually insignificant activities.
|
Following is a summary by segment for the restructuring liabilities recorded in other current liabilities and accrued employee costs in connection with business consolidation activities:
| | | | | | | | | | | | | | | |
($ in millions) | | Beverage Packaging, North & Central America | | Beverage Packaging, Europe | | Food & Aerosol Packaging | | Other | | Total |
| | | | | | | | | | | | | | | |
Balance at December 31, 2016 | | $ | 8 | | $ | 4 | | $ | 6 | | $ | 2 | | $ | 20 |
Charges in earnings | | | 24 | | | 67 | | | 8 | | | 1 | | | 100 |
Cash payments and other activity | | | (6) | | | (30) | | | (13) | | | (3) | | | (52) |
Balance at December 31, 2017 | | $ | 26 | | $ | 41 | | $ | 1 | | $ | — | | $ | 68 |
6. Receivables
| | | | | | |
| | December 31, |
($ in millions) | | 2017 | | 2016 |
| | | | | | |
Trade accounts receivable | | $ | 1,353 | | $ | 1,169 |
Less allowance for doubtful accounts | | | (10) | | | (11) |
Net trade accounts receivable | | | 1,343 | | | 1,158 |
Other receivables | | | 291 | | | 333 |
| | $ | 1,634 | | $ | 1,491 |
Net accounts receivable under long-term contracts, due primarily from agencies of the U.S. government and their prime contractors, were $214$278 million and $224$232 million for the years endedat December 31, 20172021 and 2016,2020, respectively, and included $153$233 million and $165$157 million at each period end,December 31, 2021 and 2020, respectively, representing the recognized sales value of performance that was not yet billable to customers. The average length of the long-term contracts is approximately 2.7three years, and the average length remaining on those contracts at December 31, 2017,2021, was one year. At December 31, 2017, $2142021, $264 million of net accounts receivables is expected to be collected within the next year and is related to customary fees and cost withholdings that will be paid upon milestone or contract completions, as well as final overhead rate settlements.
Other receivables include income and sales tax receivables, certain vendor rebatealuminum scrap sale receivables and other miscellaneous receivables.
The company has entered into several regional uncommitted and committed accounts receivable factoring programs with various financial institutions for certain receivables of the company. Programs accounted for as true sales of the receivables, without recourse to Ball, had combined limits of approximately $1.0$1.7 billion and $1.6 billion at December 31, 2017.2021 and 2020, respectively. A total of $439$308 million and $374$232 million were available for sale under these programs as of December 31, 20172021 and 2016,2020, respectively. The company has recorded $41 million, $29 million and $41 million of expense related to its factoring programs in 2021, 2020 and 2019, respectively, and has presented these amounts in selling, general, and administrative in its consolidated statements of earnings.
9. Inventories, Net
7. Inventories
| | | | | | |
| | December 31, |
($ in millions) | | 2021 | | 2020 |
| | | | | | |
Raw materials and supplies | | $ | 1,064 | | $ | 889 |
Work-in-process and finished goods | | | 821 | | | 557 |
Less: Inventory reserves | | | (90) | | | (93) |
| | $ | 1,795 | | $ | 1,353 |
| | | | | | |
| | December 31, |
($ in millions) | | 2017 | | 2016 |
| | | | | | |
Raw materials and supplies | | $ | 691 | | $ | 607 |
Work-in-process and finished goods | | | 902 | | | 839 |
Less inventory reserves | | | (67) | | | (33) |
| | $ | 1,526 | | $ | 1,413 |
8.10. Property, Plant and Equipment, Net
| | | | | | | |
| | December 31, | |
| | | | | | | |
| | | December 31, |
($ in millions) | | 2017 | | 2016 | | 2021 | | 2020 |
| | | | | | | |
| | | | | | | |
Land | | $ | 172 | | $ | 105 | | $ | 167 | | $ | 163 |
Buildings | | | 1,390 | | | 1,301 | | | 2,081 | | | 1,653 |
Machinery and equipment | | | 5,282 | | | 4,723 | | | 6,876 | | | 6,214 |
Construction-in-progress | | | 542 | | | 503 | | | 1,179 | | | 883 |
| | | 7,386 | | | 6,632 | |
| | | | 10,303 | | | 8,913 |
Accumulated depreciation | | | (2,776) | | | (2,245) | | | (3,801) | | | (3,562) |
| | $ | 4,610 | | $ | 4,387 | |
| | | $ | 6,502 | | $ | 5,351 |
Property, plant and equipment are stated at historical or acquired cost. Depreciation expense amounted to $509$520 million, $349$488 million and $247 $491 million for the years ended December 31, 2017, 20162021, 2020 and 2015,2019, respectively. Noncash investing activities include
Table of Contents
Ball Corporation
Notes to the acquisitionConsolidated Financial Statements
11. Goodwill
| | | | | | | | | | | | | | | | | | |
($ in millions) | |
Beverage
Packaging,
North & Central
America | |
Beverage
Packaging,
EMEA | |
Beverage
Packaging,
South America | |
Aerospace | | Other | | Total |
| | | | | | | | | | | | | | | | | | |
Balance at December 31, 2019 | | $ | 1,275 | | $ | 1,500 | | $ | 1,298 | | $ | 40 | | $ | 306 | | $ | 4,419 |
Additions | | | — | | | — | | | — | | | — | | | 49 | | | 49 |
Goodwill impairment | | | — | | | — | | | — | | | — | | | (62) | | | (62) |
Effects of currency exchange | | | — | | | 73 | | | — | | | — | | | 5 | | | 78 |
Balance at December 31, 2020 | | $ | 1,275 | | $ | 1,573 | | $ | 1,298 | | $ | 40 | | $ | 298 | | $ | 4,484 |
Effects of currency exchange | | | — | | | (90) | | | — | | | — | | | (16) | | | (106) |
Balance at December 31, 2021 | | $ | 1,275 | | $ | 1,483 | | $ | 1,298 | | $ | 40 | | $ | 282 | | $ | 4,378 |
Goodwill in the above table is presented net of property, plant and equipment that has not yet been paid. These noncash capital expenditures are excluded from the statementaccumulated impairment losses of cash flows and were $124$62 million for the year endedas of December 31, 2017. 2021 and 2020.
9. Goodwill
| | | | | | | | | | | | | | | | | | | | | |
($ in millions) | |
Beverage
Packaging,
North & Central
America
| |
Beverage
Packaging,
South America
| |
Beverage
Packaging,
Europe
| | Food
&
Aerosol
Packaging | |
Aerospace
| | Other | | Total |
| | | | | | | | | | | | | | | | | | | | | |
Balance at December 31, 2015 | | $ | 561 | | $ | 100 | | $ | 817 | | $ | 612 | | $ | 9 | | $ | 78 | | $ | 2,177 |
Business acquisition | | | 1,053 | | | 901 | | | 1,625 | | | — | | | 31 | | | 192 | | | 3,802 |
Business dispositions | | | — | | | (31) | | | (783) | | | (8) | | | — | | | — | | | (822) |
Effects of currency exchange | | | — | | | — | | | (27) | | | (5) | | | — | | | (30) | | | (62) |
Balance at December 31, 2016 | | $ | 1,614 | | $ | 970 | | $ | 1,632 | | $ | 599 | | $ | 40 | | $ | 240 | | $ | 5,095 |
Opening balance sheet adjustments | | | (339) | | | 329 | | | (274) | | | — | | | — | | | (68) | | | (352) |
Business dispositions | | | — | | | — | | | — | | | (9) | | | — | | | — | | | (9) |
Effects of currency exchange | | | — | | | — | | | 173 | | | 19 | | | — | | | 7 | | | 199 |
Balance at December 31, 2017 | | $ | 1,275 | | $ | 1,299 | | $ | 1,531 | | $ | 609 | | $ | 40 | | $ | 179 | | $ | 4,933 |
DuringAs discussed in Note 4, Ball acquired the second quartershare capital of 2017, the company finalized the allocationTubex Industria E Comercio Embalagens Ltda, an aluminum aerosol packaging business in Brazil, in 2020 and recorded $49 million to goodwill based on estimates of the purchase price for the Rexam acquisition. The decrease related to goodwill is a result of the finalization of fair values and useful lives of fixed assets and intangiblesliabilities acquired with the business.
As discussed in the Rexam acquisition.
The company’s annual goodwill impairment test completed in the fourth quarter of 2017 indicated that the fair value of the metal beverage packaging, Asia Pacific (Beverage Asia Pacific) reporting unit exceeded its carrying amount by approximately 24 percent. The current supply of metal beverage packaging exceeds demand in China, resulting in pricing pressure and negative impacts on the profitability of our Beverage Asia Pacific reporting unit. If it becomes an expectation that this oversupply situation will continue for an extended period of time, the company may be required to recordNote 6, Ball recorded a noncashnon-cash impairment charge for some or all of $62 million in 2020 related to the goodwill associated with the Beverage Asia Pacificbeverage packaging, other, reporting unit as the total balancecarrying amount of this reporting unit exceeded its fair value. The impairment review was triggered by the restructuring of the company’s reporting units which was $78 million at December 31, 2017.made in connection with a January 1, 2020 change in segment management and internal reporting structure.
10.12. Intangible Assets, netNet
| | | | | | |
| | December 31, |
($ in millions) | | 2017 | | 2016 |
| | | | | | |
Acquired Rexam intangibles (net of accumulated amortization of $246 million at December 31, 2017, and $62 million at December 31, 2016) | | $ | 2,303 | | $ | 1,766 |
Capitalized software (net of accumulated amortization of $129 million at December 31, 2017, and $87 million at December 31, 2016) | | | 84 | | | 79 |
Other intangibles (net of accumulated amortization of $163 million at December 31, 2017, and $143 million at December 31, 2016) | | | 75 | | | 89 |
| | $ | 2,462 | | $ | 1,934 |
| | | | | | |
| | December 31, |
($ in millions) | | 2021 | | 2020 |
| | | | | | |
Acquired customer relationships and other intangibles (net of accumulated amortization of $862 million at December 31, 2021, and $729 million at December 31, 2020) | | $ | 1,593 | | $ | 1,785 |
Capitalized software (net of accumulated amortization of $187 million at December 31, 2021, and $196 million at December 31, 2020) | | | 74 | | | 69 |
Other intangibles (net of accumulated amortization of $97 million at December 31, 2021, and $124 million at December 31, 2020) | | | 21 | | | 29 |
| | $ | 1,688 | | $ | 1,883 |
Total amortization expense of intangible assets amounted to $220$180 million, $104$180 million and $39$187 million for the years ended December 31, 2017, 20162021, 2020 and 2015,2019, respectively including $162$152 million in 2017 and $652021, $150 million in 20162020 and $155 million in 2019 of amortization expense related to the acquired intangible assets from Rexam.assets. Based on intangible asset values and currency exchange rates as of December 31, 2017,2021 total annual intangible asset amortization expense is expected to be $208 million, $195 million, $184 million, $175 million, $168 million, $162 million, $160 million and $169$157 million for the years ending December 31, 20182022 through 2022,2026, respectively, and $1.5 billionapproximately $866 million combined for all years thereafter.
13. Other Assets
| | | | | | | |
| | December 31, | |
| | | | | | | |
| | | December 31, |
($ in millions) | | 2017 | | 2016 | | 2021 | | 2020 |
| | | | | | | |
Long-term deferred tax assets | | $ | 325 | | $ | 443 | |
| | | | | | | |
Long-term pension assets | | | 504 | | | 147 | | $ | 579 | | $ | 562 |
Investments in affiliates | | | 274 | | | 204 | | | 184 | | | 321 |
Company and trust-owned life insurance | | | 160 | | | 146 | |
Right-of-use operating lease assets | | | | 420 | | | 302 |
Long-term deferred tax assets | | | | 126 | | | 227 |
Other | | | 143 | | | 164 | | | 614 | | | 447 |
| | $ | 1,406 | | $ | 1,104 | |
| | | $ | 1,923 | | $ | 1,859 |
Investments in affiliates primarily includes the company’s 40 percent ownership interest in an entity in South Korea, a 50 percent ownership interest in an entity in Guatemala, a 50 percent ownership interest in an entity in Panama, a 50 percent ownership interest in an entity in Vietnam and aownership interests of 50 percent ownership interest in an entityentities in the U.S. In 2021, Ball sold its minority-owned investment in South Korea. See Note 4 for further details.
12.In 2020, the shareholders of Ball Metalpack, an equity method investment of which Ball has 49 percent interest, provided additional equity contributions and loans to Ball Metalpack. Ball's share was $30 million, which resulted in Ball recognizing this same level of previously unrecorded equity method losses associated with prior periods. These losses are presented in equity in results of affiliates, net of tax, in the company’s consolidated statement of earnings. Ball is under no obligation to provide additional equity contributions or loans to Ball Metalpack. In January 2022, Ball sold its remaining 49 percent investment in Ball Metalpack. See Note 4 for further details.
See Note 14, Note 16 and Note 17 for further details related to the company’s long-term right-of-use operating lease assets, deferred tax assets and pension assets, respectively.
14. Leases
The company leases office, warehousing and manufacturing space and certain equipment in the packaging segments and office and technical space in the aerospace segment. Total noncancellable operating leases in effect at December 31, 2017, require rental paymentscomponents of $45 million, $34 million, $25 million, $21 million and $16 million for the years 2018 through 2022, respectively, and $67 million combined for all years thereafter. Leaselease expense for all operating leases was $77 million, $57 million and $66 million in 2017, 2016 and 2015, respectively.were as follows:
| | | | | | |
| | December 31, |
($ in millions) | | 2021 | | 2020 |
| | | | | | |
Operating lease expense | | $ | (94) | | $ | (75) |
Financing lease expense | | | (2) | | | (1) |
Variable lease expense | | | (20) | | | (16) |
Sublease income | | | 3 | | | 2 |
Net lease expense | | $ | (113) | | $ | (90) |
Supplemental cash flow information related to leases was as follows:
| | | | | | |
| | December 31, |
($ in millions) | | 2021 | | 2020 |
| | | | | | |
Cash paid for amounts included in the measurements of lease liabilities: | | | | | | |
Operating cash outflows for operating leases | | $ | (87) | | $ | (71) |
Financing cash outflows for finance leases | | | (2) | | | (1) |
| | | | | | |
ROU assets obtained in exchange for: | | | | | | |
Operating lease obligations | | | 182 | | | 97 |
Finance lease obligations | | | 5 | | | 12 |
Supplemental balance sheet information related to leases was as follows:
| | | | | | | |
| | | December 31, |
($ in millions) | Balance Sheet Location | | 2021 | | 2020 |
| | | | | | | |
Operating leases: | | | | | | | |
Operating lease ROU asset | Other assets | | $ | 420 | | $ | 302 |
Current operating lease liabilities | Other current liabilities | | | 80 | | | 63 |
Noncurrent operating lease liabilities | Other liabilities | | | 340 | | | 232 |
Finance leases: | | | | | | | |
Finance lease ROU assets, net | Property, plant and equipment, net | | | 14 | | | 11 |
Current finance lease liabilities | Short-term debt and current portion of long-term debt | | | 2 | | | 2 |
Noncurrent finance lease liabilities | Long-term debt | | | 12 | | | 10 |
Weighted average remaining lease term and weighted average discount rate for the company’s leases were as follows:
| | | | | |
| December 31, | |
| 2021 | | | 2020 | |
| | | | | |
Weighted average remaining lease term in years: | | | | | |
Operating leases | 10 | | | 11 | |
Finance leases | 7 | | | 7 | |
Weighted average discount rate: | | | | | |
Operating leases | 3.7 | % | | 4.0 | % |
Finance leases | 3.0 | % | | 3.0 | % |
Maturities of lease liabilities are as follows:
| | | | | | |
($ in millions) | | Operating Leases | | Finance Leases |
| | | | | | |
2022 | | $ | 85 | | $ | 3 |
2023 | | | 74 | | | 3 |
2024 | | | 59 | | | 3 |
2025 | | | 47 | | | 2 |
2026 | | | 36 | | | 1 |
Thereafter | | | 197 | | | 4 |
Future value of lease liabilities | | | 498 | | | 16 |
Less: Imputed interest | | | (78) | | | (2) |
Present value of lease liabilities | | $ | 420 | | $ | 14 |
15. Debt and Interest Costs
Long-term debt and interest rates in effect consisted of the following:
| | | | | | | |
| | December 31, | |
| | | | | | | |
| | | December 31, |
($ in millions) | | 2017 | | 2016 | | 2021 | | 2020 |
| | | | | | | |
| | | | | | | |
Senior Notes | | | | | | | | | | | | |
5.25% due July 2025 | | $ | 1,000 | | $ | 1,000 | |
4.375% due December 2020 | | | 1,000 | | | 1,000 | |
5.00% due March 2022 | | | $ | — | | $ | 748 |
4.00% due November 2023 | | | 1,000 | | | 1,000 | | | 1,000 | | | 1,000 |
4.375%, euro denominated, due December 2023 | | | 840 | | | 736 | | | 796 | | | 855 |
5.00% due March 2022 | | | 750 | | | 750 | |
3.50%, euro denominated, due December 2020 | | | 480 | | | 421 | |
Senior Credit Facilities, due March 2021 (at variable rates) | | | | | | | |
Term A loan, due June 2021 | | | 1,313 | | | 1,383 | |
Term A loan, euro denominated, due June 2021 | | | — | | | 954 | |
Multi-currency, U.S. dollar revolver, due March 2021 | | | 285 | | | 190 | |
0.875%, euro denominated, due March 2024 | | | | 853 | | | 916 |
5.25% due July 2025 | | | | 1,000 | | | 1,000 |
4.875% due March 2026 | | | | 750 | | | 750 |
1.50%, euro denominated, due March 2027 | | | | 625 | | | 672 |
2.875% due August 2030 | | | | 1,300 | | | 1,300 |
3.125% due September 2031 | | | | 850 | | | — |
Senior Credit Facility (at variable rates) | | | | | | | |
Term A loan due March 2024 (1.35% - 2021; 1.40% - 2020) | | | | 593 | | | 593 |
Finance lease obligations | | | | 14 | | | 12 |
Other (including debt issuance costs) | | | (37) | | | (45) | | | (56) | | | (60) |
| | | 6,631 | | | 7,389 | |
Less: Current portion of long-term debt | | | (113) | | | (79) | |
| | $ | 6,518 | | $ | 7,310 | |
| | | | 7,725 | | | 7,786 |
Less: Current portion | | | | (3) | | | (3) |
| | | $ | 7,722 | | $ | 7,783 |
Following is a summary of debt refinancing and other costs included in the consolidated statements of earnings:
| | | | | | | | | |
| | Years Ended December 31, |
($ in millions) | | 2017 | | 2016 | | 2015 |
| | | | | | | | | |
Debt Refinancing and Other Costs: | | | | | | | | | |
Interest expense on 3.5% and 4.375% senior notes | | $ | — | | $ | (49) | | $ | (5) |
Refinance of bridge and revolving credit facilities | | | — | | | (30) | | | (16) |
Economic hedge - interest rate risk | | | — | | | (20) | | | (16) |
Amortization of unsecured, committed bridge facility financing fees | | | — | | | (7) | | | (23) |
Redemption of 6.75% and 5.75% senior notes, due September 2020 and May 2021, respectively, and refinance of senior credit facilities | | | — | | | — | | | (57) |
Individually insignificant items | | | (3) | | | (3) | | | — |
| | $ | (3) | | $ | (109) | | $ | (117) |
The company’s senior credit facilities include long-term multi-currency committed revolving credit facilities that mature in March 2024 and provide the company with up to the U.S. dollar equivalent of $1.5$1.75 billion. At December 31, 2017,2021, taking into account outstanding letters of credit, approximately $1.2$1.7 billion was available under these revolving credit facilities. In addition to these facilities, the company had $751 million$1 billion of short-term uncommitted credit facilities available at December 31, 2017,2021, of which $340$12 million was outstanding and due on demand. At December 31, 2016,2020, the company had $143$14 million outstanding under short-term uncommitted credit facilities. The weighted average interest rate of the outstanding short-term facilities was 2.314.92 percent at December 31, 2017,2021, and 1.675.45 percent at December 31, 2016.2020.
In anticipation of the June 2016 acquisition of Rexam, the company entered into a £3.3 billion Bridge Facility in February 2015. Additionally, in December 2015,During 2021, Ball issued $1 billion$850 million of 4.375 percent3.125% senior notes €400 million of 3.5 percentdue in 2031 and redeemed the outstanding 5% senior notes and €700 milliondue in March 2022 in the amount of 4.375 percent senior notes. The company elected to restrict these proceeds in an escrow account, which enabled the reduction of its Bridge Facility to £1.9 billion. Until the acquisition was consummated, interest on the Bridge Facility and these senior notes was included in debt refinancing and other costs.$748 million.
In March 2016, Ball refinanced in full its then existing £1.9 billion Bridge Facility with a $1.4 billion Term A loan facility available to Ball and a €1.1 billion Term A loan facility available to a subsidiary of Ball (collectively, the Term Loans), and refinanced in full its then existing revolving credit facility with a long-term, multi-currency revolver available until March 2021. The euro Term A loan was repaid during 2017.
In connection with the June 2016 acquisition of Rexam, Ball assumed Rexam’s debt of approximately $2.8 billion, of which $2.7 billion was extinguished in July and August 2016. The company used the proceeds from the sale of the Divestment Business to partially extinguish the assumed Rexam debt. Also in July 2016, Ball repaid the Latapack-Ball notes.
Fees paid in connection with obtaining financing for the Rexam acquisition, which totaled $32 million and $77 million in 2016 and 2015, respectively, are classified as other, net in cash flows from financing activities in the consolidated statements of cash flows.
The fair value of theBall’s long-term debt was estimated to be $7.0$8 billion and $8.3 billion at December 31, 2017, which approximated2021 and 2020, respectively, compared to its carrying value of $6.6 billion. The fair value was estimated to be $7.7 billion at December 31, 2016, which approximated its carrying value of $7.4 billion.and $7.8 billion in 2021 and 2020, respectively. The fair value reflects the market rates at each period end for debt with credit ratings similar to the company’s ratings and is classified as Level 2 within the fair value hierarchy. Rates currently available to the company for loans with similar terms and maturities are used to estimate the fair value of long-term debt, based on discounted cash flows.
Long-term debt obligations outstanding at December 31, 2017,2021, have maturities (excluding unamortized debt issuance costs of $60$62 million) of $113$3 million, $218 million, $1.6$1.8 billion, $1.1$1.4 billion, $1 billion and $750 million in the years ending December 31, 20182022 through 2022,2026, respectively, and $2.8 billion thereafter.
Ball provides letters of credit in the ordinary course of business to secure liabilities recorded in connection with certain self-insurance arrangements. Letters of credit outstanding at December 31, 20172021 and 2016,2020, were $33$62 million and $32$43 million, respectively.
Interest payments were $287$306 million, $190$332 million and $130$331 million in 2017, 20162021, 2020 and 2015,2019, respectively. In 2020, new guidance was issued related to global reference rates reform. Ball is evaluating the impact transitioning its LIBOR-based interest rate loan agreements to SOFR-based interest rate agreements will have on its consolidated financial statements. Based on the company’s most current understanding, the LIBOR to SOFR transition is not expected to have a material impact on its financial condition, results of operations or cash flows.
The company’s senior notes and senior credit facilities are guaranteed on a full, unconditional and joint and several basis by certain of the company’sits material subsidiaries. Each of the guarantor subsidiaries is 100 percent owned by Ball Corporation. These guarantees are required in support of these notes and credit facilities, are coterminous with the terms of the respective note indentures and would require performance upon certain events of default referred toreferenced in the respective guarantees. Note 22 includes23 provides further details about the company’s debt guarantees of the company’s senior notes and Note 23 contains further details,the subsidiaries that guarantee the notes (the obligor group).
Ball was in compliance with all loan agreements as well as required condensed consolidating financial informationof December 31, 2021, and for theall prior years presented. The company segregating the guarantor subsidiaries and non-guarantor subsidiaries as defined in thehas also met all debt agreements.
payment obligations. The U.S. note agreements and bank credit agreement contain certain restrictions relating to dividend payments, share repurchases,dividends, investments, financial ratios, guarantees and the incurrence of additional indebtedness. The most restrictive of the company’s debt covenants require the companyrequires it to maintain a leverage ratio (as defined) of no greater than 45.0 times, atwhich will change to 4.5 times as of December 31, 2017.
The company was in compliance with all loan agreements and debt covenants at2022. As of December 31, 2017 and 2016, and has met all debt payment obligations.
Table of Contents
Ball Corporation
Notes2021, the company could borrow up to the Consolidated Financial Statementslimits available under its long-term multi-currency committed revolving facilities and short-term uncommitted credit facilities without violating any existing debt covenants.
14.16. Taxes on Income
The amount of earnings (loss) before income taxes is:
| | | | | | | | | | |
| | Years Ended December 31, | |
($ in millions) | | 2021 | | 2020 | | 2019 | |
| | | | | | | | | | |
U.S. | | $ | 146 | | $ | 196 | | $ | 224 | |
Non-U.S. | | | 862 | | | 491 | | | 384 | |
| | $ | 1,008 | | $ | 687 | | $ | 608 | |
| | | | | | | | | | |
| | Years Ended December 31, | |
($ in millions) | | 2017 | | 2016 | | 2015 | |
| | | | | | | | | | |
U.S. | | $ | 147 | | $ | (381) | | $ | 47 | |
Foreign | | | 367 | | | 506 | | | 299 | |
| | $ | 514 | | $ | 125 | | $ | 346 | |
69
The provision (benefit) for income tax expense is:
| | | | | | | | | | | |
| | Years Ended December 31, | | |
| | | | | | | | | | | |
| | | Years Ended December 31, | |
($ in millions) | | 2017 | | 2016 | | 2015 | | | 2021 | | 2020 | | 2019 | |
| | | | | | | | | | | |
| | | | | | | | | | | |
Current | | | | | | | | | | | | | | | | | | | | |
U.S. | | $ | 6 | | $ | (3) | | $ | 26 | | | $ | (20) | | $ | (33) | | $ | (1) | |
State and local | | | — | | | 27 | | | 7 | | | | 8 | | | 3 | | | 7 | |
Foreign | | | 77 | | | 143 | | | 76 | | |
Non-U.S. | | | | 133 | | | 112 | | | 110 | |
Total current | | | 83 | | | 167 | | | 109 | | | | 121 | | | 82 | | | 116 | |
| | | | | | | | | | | |
| | | | | | | | | | | |
Deferred | | | | | | | | | | | | | | | | | | | | |
U.S. | | | 92 | | | (67) | | | (38) | | | | (7) | | | (44) | | | (26) | |
State and local | | | 7 | | | (17) | | | (4) | | | | (4) | | | (5) | | | (1) | |
Foreign | | | (17) | | | (209) | | | (20) | | |
Non-U.S. | | | | 46 | | | 66 | | | (18) | |
Total deferred | | | 82 | | | (293) | | | (62) | | | | 35 | | | 17 | | | (45) | |
Tax provision (benefit) | | $ | 165 | | $ | (126) | | $ | 47 | | | $ | 156 | | $ | 99 | | $ | 71 | |
The income tax provision recorded within the consolidated statements of earnings differs from the provision determined by applying the U.S. statutory tax rate to pretax earnings as a result of the following:
| | | | | | | | | | |
| | Years Ended December 31, | |
($ in millions) | | 2021 | | 2020 | | 2019 | |
| | | | | | | | | | |
Statutory U.S. federal income tax | | $ | 212 | | $ | 144 | | $ | 128 | |
Increase (decrease) due to: | | | | | | | | | | |
Non-U.S. tax rate differences including tax holidays | | | (32) | | | 2 | | | (11) | |
Non-U.S. tax law and rate changes | | | 43 | | | 18 | | | — | |
U.S. tax reform (a) | | | (2) | | | (9) | | | — | |
Currency exchange loss on revaluation of Brazilian deferred tax balances | | | 4 | | | 23 | | | 4 | |
Global intangible low-taxed income (GILTI) | | | 18 | | | 2 | | | 12 | |
Permanent differences on business dispositions or impairments | | | 4 | | | 20 | | | (3) | |
U.S. state and local taxes, net | | | 4 | | | (2) | | | 4 | |
U.S. taxes on Non-U.S. earnings, net of tax deductions and credits | | | 4 | | | 5 | | | (6) | |
U.S. research and development tax credits | | | (50) | | | (39) | | | (10) | |
Uncertain tax positions, including interest | | | (19) | | | (14) | | | (19) | |
Change in valuation allowances | | | (3) | | | 17 | | | 24 | |
Equity compensation related impacts | | | (10) | | | (47) | | | (43) | |
U.S. CARES Act | | | (10) | | | (16) | | | — | |
Other, net | | | (7) | | | (5) | | | (9) | |
Provision (benefit) for taxes | | $ | 156 | | $ | 99 | | $ | 71 | |
Effective tax rate expressed as a percentage of pretax earnings | | | 15.5 | % | | 14.4 | % | | 11.7 | % |
| | | | | | | | | | |
| | Years Ended December 31, | |
($ in millions) | | 2017 | | 2016 | | 2015 | |
| | | | | | | | | | |
Statutory U.S. federal income tax | | $ | 180 | | $ | 44 | | $ | 121 | |
Increase (decrease) due to: | | | | | | | | | | |
Foreign tax rate differences including tax holidays | | | (52) | | | (71) | | | (51) | |
Foreign tax law and rate changes | | | (28) | | | — | | | — | |
U.S. tax reform (a) | | | 83 | | | — | | | — | |
Permanent differences on business dispositions | | | 18 | | | (62) | | | — | |
Foreign subsidiaries restructuring | | | — | | | (145) | | | — | |
Non-deductible transaction costs | | | — | | | 52 | | | — | |
U.S. state and local taxes, net | | | 3 | | | 6 | | | 2 | |
U.S. taxes on foreign earnings, net of tax deductions and credits | | | (6) | | | 21 | | | 2 | |
U.S. manufacturing deduction | | | (8) | | | — | | | (4) | |
U.S. research and development tax credits | | | (9) | | | (9) | | | (15) | |
Uncertain tax positions, including interest | | | (3) | | | 3 | | | (4) | |
Company and trust-owned life insurance | | | (7) | | | (6) | | | (2) | |
Change in valuation allowances | | | 15 | | | 46 | | | — | |
Benefit from equity compensation | | | (16) | | | (5) | | | — | |
Other, net | | | (5) | | | — | | | (2) | |
Provision (benefit) for taxes | | $ | 165 | | $ | (126) | | $ | 47 | |
Effective tax rate expressed as a percentage of pretax earnings | | | 32.1 | % | | (100.8) | % | | 13.6 | % |
| (a) | (a)
| | Includes enacted regulatory changes during the impact ofyear in connection with the tax expense accrued on undistributed foreign earnings, net of the related foreign tax credits. The total income tax provision impact of the transition tax, net of associated foreign tax credit, is offset by a corresponding changeU.S. Tax Cuts and Jobs Act (TCJA) signed into law in the valuation allowance previously recorded against U.S. foreign tax credit carryforwards. 2017. |
The 2017 effective income tax rate was 32.1 percent comparedcompany generally intends to negative 100.8 percent for 2016. The effective rate was increased by 16.1 percent for U.S. tax reform, including the impact of the transition tax and remeasurement of the company’s net deferred tax assetlimit distributions from non-U.S. subsidiaries to earnings previously taxed in the U.S., and by 3.5 percent for discrete tax costs associated with certain business dispositions. The effective rate was reduced by 7.2 percent for the impact of the foreign tax rate differential, net of valuation allowance impact, and tax holidays versus the U.S. tax rate, and by 5.4 percent for the impact of current year changes in various foreign tax laws, including the U.K. The 2017 effective rate was also reduced by 3.1 percent for the discrete tax benefit associated with the adoption in the first quarter of 2017 of amendments to existing accounting guidance for stock-based compensation, by 1.8 percent for the impact of the U.S. R&D credit, and by 1.6 percent for the impact of the U.S. domestic manufacturing deduction and of the foregoing, the impact of U.S. tax reform, discrete tax costs associated with certain business dispositions, the impact of current year changes to certain foreign tax laws and the impact of the domestic manufacturing deduction are primarily related to discrete transactions or changes in tax law that are not expected to recur in future periods.
The 2016 effective income tax rate was negative 100.8 percent compared to 13.6 percent for 2015. The lower tax rate in 2016 compared to 2015 was primarily due to the tax benefit recorded for tax deductible goodwill created as a result of the 2016 legal entity restructuring in Brazil. The 2016transition tax rate was also reduced for increased benefits from foreignor tax rate differences related to 2016 acquisitions and by permanent differences on 2016 business dispositions. These amounts were partially offset by the tax impact of non-deductible transaction costs related to 2016 acquisitions and increases in valuation allowances, primarily for losses in the U.K. where no tax benefit was expected.
Table of Contents
Ball Corporation
NotesGILTI incurred pursuant to the Consolidated Financial Statements
OnTCJA. As of December 22, 2017,31, 2021, the U.S. Tax Cuts and Jobs Act (the Act) was signed into law. The Act significantly changed U.S. income tax law by, among other things, reducing thecompany has $1.8 billion of adjusted retained earnings in non-U.S. subsidiaries. Of these undistributed earnings, $851 million were previously subjected to U.S. federal income tax rate from 35 percent to 21 percent, transitioning from a global tax system to a modified territorial tax system, eliminating the domestic manufacturing deduction, providing for immediate expensing of certain qualified capital expenditures and limiting the tax deductions for interest expense and executive compensation. In the fourth quarter of 2017, thetax. The company recorded tax expense of $83has accrued approximately $63 million for the estimated impactnon-U.S. withholding taxes on portions of the mandatory deemed repatriation of its foreignnon-U.S. earnings and revaluation of its U.S. deferred tax assets and liabilities. The company’s review of the implications of the Act will be ongoing throughout 2018, and as such, adjustments to any provisional estimates of the Act’s impact may be required. These provisional estimatesthat are as follows:
| ·
| | Reduction of U.S. federal corporate tax rate: The company has recorded a provisional increase to tax expense of $52 million for the estimated impact of revaluing its net deferred tax asset position in the U.S. at the new 21 percent corporate tax rate. While this is a reasonable estimate, it may be impacted by other analyses related to the Act, including the calculation of the transition tax;
|
| ·
| | Transition tax: The company has recorded a provisional increase to tax expense of $31 million to reflect the impact of the tax on accumulated untaxed earnings and profits (E&P) of certain foreign affiliates. To determine the amount of the transition tax, the amount of the post-1986 E&P and the amount of non-U.S. income taxes paid on such earnings must be calculated for all relevant foreign affiliates. While this estimated impact is reasonable, additional information will be gathered and analyzed in order to more precisely calculate the final impact of the transition tax;
|
| ·
| | Valuation allowances: The company must assess the impact of the various aspects of the Act on its valuation allowance analyses, including the transition tax. As the company has recorded provisional estimates with respect to certain aspects of the Act, any corresponding impacts from changes in valuation allowances are also provisional estimates; and
|
| ·
| | Cost recovery: The company has made a provisional estimate of the impact on its current tax expense and deferred tax liabilities associated with the new immediate expensing provisions for certain qualifying expenditures made after September 27, 2017. The estimate will be refined as the necessary computations are completed with respect to the full inventory of all qualifying 2017 expenditures.
|
Due to the complexity of the new provisions for global intangible low-taxed income (GILTI) and the base erosion anti-abuse tax (BEAT), the company is continuing to evaluate the accounting implications of these provisions of the Act.not indefinitely reinvested. The company is allowed to make an accounting policy choice of either (1) treating taxes due for GILTI or BEAT as a current-period expense when incurred or (2) factoring such amounts into the company’s measurement of its deferred taxes. The calculation of the impact and selection of an accounting policy will depend on a detailed analysis of the company’s global income and other tax attributes to determine the potential impact, if any, of these provisions. The company is not currently able to determine a reasonable estimate for these items. As a result, no estimate has been recorded and no policy decision has yet been made regarding whether to factor the impact of GILTI or BEAT into the company’s measurement of its deferred taxes.
Based on its previous indefinite reinvestment assertion, the company has not historically provided deferred taxes on earningsany other outside basis differences in certainits investments in other non-U.S. subsidiaries because such earnings were intendedas these other outside basis differences are indefinitely reinvested. A determination of the unrecognized deferred taxes related to be indefinitely reinvested in its international operations. Retained earnings in non-U.S. subsidiaries were $2.8 billion asany of December 31, 2017. While itthese other outside basis differences is not practical to estimate the additional taxes, including foreign withholding taxes, that may become payable if these earnings were remitted to the U.S., as a result of the company’s inclusion of a provisional transition tax estimate, U.S. tax has been accrued with respect to this amount.practicable.
With the introduction of a modified territorial tax system in the Act, the company is currently reviewing its previously stated intent to indefinitely reinvest the undistributed earnings of certain of its foreign subsidiaries. As the company does
not believe a reasonable estimate of the impact of the Act on its indefinite reinvestment assertion can currently be determined, no provisional estimate has been recorded as allowed by applicable accounting standards. When either a reasonable estimate or the final determination becomes available, the impact will be recorded in the corresponding reporting period, no later than December 2018.
Ball’s Serbian subsidiary was granted anand Polish subsidiaries benefit from tax holidays which reduced income taxes during the year by $2 million for each subsidiary. These tax holiday that applies to only a portion of earningsholidays expire during 2031 and expired at the end of 2015. In addition, the Serbian subsidiary was granted tax relief equal to 80 percent of additional local investment over a ten-year period that will expire in 2022. The tax relief may be used to offset tax on earnings not covered by the initial tax holiday and has $12 million remaining as of December 31, 2017. Ball’s Polish subsidiary was granted a tax holiday in 2014 based on new capital investment. The holiday provides up to $34 million of tax relief over a ten-year period of which $33 million remained as of December 31, 2017.2026 respectively. Several of Ball’s Brazilian subsidiaries benefit from various tax holidays with expiration dates ranging from 20222025 to 2025.2032. These tax holidays reduced income tax by $47$74 million $20or $0.23 per share, $72 million or $0.22 per share and $16$62 million respectively,or $0.19 per share for 2017, 20162021, 2020 and 2015.2019, respectively.
Net income tax payments were $107$136 million, $68$157 million and $58$128 million in 2017, 20162021, 2020 and 2015,2019, respectively.
The significant components of deferred tax assets and liabilities were:are as follows:
| | | | | | |
| | December 31, |
($ in millions) | | 2021 | | 2020 |
| | | | | | |
Deferred tax assets: | | | | | | |
Deferred compensation | | $ | 127 | | $ | 109 |
Accrued employee benefits | | | 79 | | | 84 |
Accrued pensions | | | 113 | | | 201 |
Net operating losses, non-U.S. tax credits and other tax attributes | | | 523 | | | 440 |
Deferred interest | | | 102 | | | 83 |
Operating lease liabilities | | | 85 | | | 56 |
Other | | | 180 | | | 156 |
Total deferred tax assets | | | 1,209 | | | 1,129 |
Valuation allowance | | | (303) | | | (264) |
Net deferred tax assets | | | 906 | | | 865 |
Deferred tax liabilities: | | | | | | |
Property, plant and equipment | | | (509) | | | (399) |
Goodwill and other intangible assets | | | (543) | | | (570) |
Pension assets | | | (146) | | | (106) |
Tax on undistributed non-U.S. earnings | | | (63) | | | (64) |
Operating lease right of use assets | | | (87) | | | (54) |
Other | | | (97) | | | (79) |
Total deferred tax liabilities | | | (1,445) | | | (1,272) |
Net deferred tax asset (liability) | | $ | (539) | | $ | (407) |
| | | | | | |
| | | | | | |
| | December 31, |
($ in millions) | | 2017 | | 2016 |
| | | | | | |
Deferred tax assets: | | | | | | |
Deferred compensation | | $ | 71 | | $ | 110 |
Accrued employee benefits | | | 104 | | | 188 |
Deferred revenue | | | 14 | | | 34 |
Accrued pensions | | | 164 | | | 228 |
Inventory and other reserves | | | 42 | | | 87 |
Net operating losses, foreign tax credits and other tax attributes | | | 369 | | | 425 |
Unrealized losses on currency exchange and derivative transactions | | | 5 | | | 59 |
Goodwill and other intangible assets | | | 98 | | | 100 |
Other | | | 30 | | | 64 |
Total deferred tax assets | | | 897 | | | 1,295 |
Valuation allowance | | | (165) | | | (183) |
Net deferred tax assets | | | 732 | | | 1,112 |
Deferred tax liabilities: | | | | | | |
Property, plant and equipment | | | (334) | | | (428) |
Goodwill and other intangible assets | | | (697) | | | (590) |
Pension assets | | | (56) | | | — |
Other | | | (15) | | | (90) |
Total deferred tax liabilities | | | (1,102) | | | (1,108) |
Net deferred tax asset (liability) | | $ | (370) | | $ | 4 |
| | | | | | |
71
The net deferred tax asset (liability) was included in the consolidated balance sheets as follows:
| | | | | | | |
| | December 31, | |
| | | | | | | |
| | | December 31, |
($ in millions) | | 2017 | | 2016 | | 2021 | | 2020 |
| | | | | | | |
| | | | | | | |
Other assets | | $ | 325 | | $ | 443 | | $ | 126 | | $ | 227 |
Deferred taxes and other liabilities | | | (695) | | | (439) | |
Deferred taxes | | | | (665) | | | (634) |
Net deferred tax asset (liability) | | $ | (370) | | $ | 4 | | $ | (539) | | $ | (407) |
| | | | | | | |
| | | | | | | |
Due to the remeasurement of U.S. deferred tax balances under the Act, as well as reductions in deferred tax assets related to pension assets, the net deferred tax position shifted from an asset to a liability as of December 31, 2017.
At December 31, 2017,2021, Ball has recorded deferred tax assets related to federal and foreign net operating and capital loss carryforwards of approximately $327$246 million, deferred interest expense carryforwards of $102 million, and state net operating losscredit carryforwards for foreign taxes, research and development, and various other business credits of $42$277 million. These attributes are spread across the regions in which the company operates, including Europe, North and Central America, Asia and South America, and generally have expiration periods beginning in 20182022 to indefinite, with the largest portion not expiring until 2029.indefinite. Each has been assessed for realization as of December 31, 2017. As a result of tax law changes from the Act, Ball has utilized all U.S. foreign tax credit, research and development credit and alternative minimum tax credit carryforwards as of December 31, 2017.2021.
In 2017,2021, the company’s overall valuation allowances decreasedincreased by a net $18$39 million. DecreasesThe increase to the valuation allowance werewas primarily due to enacted tax rate changes in the releaseU.K. The valuation allowance was further increased due to nondeductible U.K. interest expense and operating losses incurred primarily in various U.S. state and non-U.S. jurisdictions, none of which are expected to be utilized in future periods. These increases were partially offset by reductions due to the utilization of previously unrealized operating losses. Ball’s 2021 effective tax rate was impacted by $3 million of the change in the valuation allowance.
In 2020, the company’s overall valuation allowances increased by a net $20 million. The increase to the valuation allowance was primarily due to nondeductible U.K. interest expense and operating losses incurred primarily in various U.S. state and non-U.S. jurisdictions, none of which are expected to be utilized in future periods. Ball’s 2020 effective tax rate was impacted by $17 million of the net change in the valuation allowance.
In 2019, the company’s overall valuation allowances increased by a net $20 million. The increase to the valuation allowance was primarily due to nondeductible U.K. interest expense and operating losses incurred primarily in various U.S. state and non-U.S. jurisdictions, none of which are expected to be utilized in future periods. This increase was partially offset by a reduction due to the disposition of certain Asian subsidiaries. Ball’s 2019 effective tax rate was impacted by $24 million of the net change in the valuation allowance.
A roll forward of the company’s $46 million valuation allowance on its foreign tax credit carryforwards that will be realized against a portion of the transition tax incurred as a result of the Act and a net decrease of $6 million related to the law change in the U.K., including valuation allowances established against nondeductible interest expense. These items all had an impact on Ball’s effective rate and are included as components of U.S. tax reform, foreign tax law changes and foreign tax rate differences in the rate reconciliation. This net decrease was offset by increases for recording additional valuation allowances of $19 million related to the 2016 acquisition of Rexam and for unusable 2017 losses of $15 million incurred in various jurisdictions. The increase in unusable losses had a tax rate impact which is reflected in the valuation allowance line of the rate reconciliation.
A rollforward of the unrecognized tax benefits, as included in other noncurrent liabilities, related to uncertain income tax positions at December 31 follows:
| | | | | | | | | |
($ in millions) | | 2017 | | 2016 | | 2015 |
| | | | | | | | | |
Balance at January 1 | | $ | 77 | | $ | 51 | | $ | 66 |
Additions related to acquisitions | | | — | | | 55 | | | — |
Additions based on tax positions related to the current year | | | 18 | | | 18 | | | 1 |
Additions for tax positions of prior years | | | 1 | | | 6 | | | 2 |
Reductions related to Divestment Business | | | — | | | (30) | | | — |
Reductions for tax positions from prior years | | | — | | | (5) | | | — |
Reductions for settlements | | | (7) | | | — | | | (8) |
Reductions due to lapse of statute of limitations | | | (12) | | | (16) | | | (6) |
Effect of foreign currency exchange rates | | | 7 | | | (2) | | | (4) |
Balance at December 31 | | $ | 84 | | $ | 77 | | $ | 51 |
| | | | | | | | | |
($ in millions) | | 2021 | | 2020 | | 2019 |
| | | | | | | | | |
Balance at January 1 | | $ | 55 | | $ | 63 | | $ | 80 |
Additions based on tax positions related to the current year | | | — | | | 1 | | | — |
Reductions due to lapse of statute of limitations | | | (17) | | | (12) | | | (16) |
Effect of currency exchange rates | | | (2) | | | 3 | | | (1) |
Balance at December 31 | | $ | 36 | | $ | 55 | | $ | 63 |
The annual provisions for income taxes included a tax benefit related to uncertain tax positions, including interest and penalties, of $3$19 million in 2017, a tax expense of $32021, $14 million in 2016,2020 and a tax benefit of $4$19 million in 2015.2019.
At December 31, 2017,2021, the amounts of unrecognized tax benefits that, if recognized, would reduce tax expense were $99 million.$44 million, inclusive of interest, penalties and the federal impact of U.S. state items. The company and its subsidiaries file various income tax returns in the U.S. federal, various state, local and foreignnon-U.S. jurisdictions. The U.S. federal statute of limitations is closed for years prior to 2014. With a few exceptions, the company is no longer subject to examination by state and local tax authorities for years prior to 2010.2014. The company’s significant non-U.S. filings are in Argentina, Brazil, Canada, Chile, Czech Republic, Egypt, France, Germany, France,Mexico, Paraguay, Poland, Russia, Serbia, Spain, Sweden, Switzerland, Turkey, and the U.K., Spain, the Netherlands, Poland, Serbia, Switzerland, Sweden, Russia, Turkey, Egypt, Saudi Arabia, the PRC, Canada, Brazil, the Czech Republic, Mexico, Chile and Argentina. The company’s foreignnon-U.S. statutes of limitationlimitations are generally open for years after 2011.2017. At December 31, 2017,2021, the company is either under examination or has been notified of a pending examination by tax authorities in Austria, Brazil, Egypt, France, Germany, Hong Kong, India, Italy, the Netherlands, Saudi Arabia, Switzerland, the U.S., Germany, the U.K., the PRC, Saudi Arabia, India and various U.S. states.
TableDue primarily to potential expiration of Contentscertain statutes of limitations, it is reasonably possible that a decrease in the range of $10 million to $17 million in the total amount of unrecognized tax benefits may occur within the coming year, all of which would reduce income tax expense.
Ball Corporation
Notes to the Consolidated Financial Statements
The company recognizes the accrual of interest and penalties related to unrecognized tax benefits in income tax expense. Ball recognized $4 million of tax benefit, $3 million of tax expense and $2 million of tax benefit, $2 million of tax benefit and $3 million of tax benefit in 2017, 20162021, 2020 and 2015,2019, respectively, for potential interest on these items. At December 31, 2017, 20162021, 2020 and 2015,2019, the accrual for uncertain tax positions included potential interest expense of $7$6 million $10 million and $9 million, respectively.for each year. The company has accrued penalties of $10$2 million in both 20172021, $4 million in 2020 and 2016, while no penalties were accrued$6 million in 2015.2019.
15.
17. Employee Benefit Obligations
| | | | | | | |
| | December 31, | |
| | | | | | | |
| | | December 31, |
($ in millions) | | 2017 | | 2016 | | 2021 | | 2020 |
| | | | | | | |
| | | | | | | |
Underfunded defined benefit pension liabilities | | $ | 945 | | $ | 963 | | $ | 582 | | $ | 955 |
Less: Current portion | | | (27) | | | (25) | | | (21) | | | (24) |
Long-term defined benefit pension liabilities | | | 918 | | | 938 | | | 561 | | | 931 |
Long-term retiree medical liabilities | | | 196 | | | 208 | | | 135 | | | 156 |
Deferred compensation plans | | | 275 | | | 272 | | | 441 | | | 439 |
Other | | | 74 | | | 79 | | | 68 | | | 87 |
| | $ | 1,463 | | $ | 1,497 | |
| | | $ | 1,205 | | $ | 1,613 |
During 2016, Ball acquired 11 pension plans and two retiree medical plans as part of the Rexam acquisition and divested plans in certain foreign countries. The company’s pension plans cover U.S., Canadian and various European employees meeting certain eligibility requirements. The defined benefit plans for salaried employees, as well as those for hourly employees in Sweden, Switzerland, the U.K. and Ireland, provide pension benefits based on employee compensation and years of service. Plans for North American hourly employees provide benefits based on fixed rates for each year of service. While the German, Swedish and certain U.S. plans are not funded, the company maintains liabilities, and annual additions to such liabilities are generally tax deductible.tax-deductible. With the exception of the unfunded German, Swedish and certain U.S. plans, ourthe company’s policy is to fund the defined benefit plans in amounts at least sufficient to satisfy statutory funding requirements, taking into consideration deductibility under existing tax laws and regulations.
The company also participates in three multi-employer defined benefitclosed its pension plans for which Ball is not the sponsor. The aggregated expense in 2017 for these plans of $2 million, which approximated the total annual funding, is includedto all non-unionized new entrants in the summary of net periodic benefit cost set forth below. The risks of participating in multi-employer pension plans are different from single-employer plans. Assets contributedUnited States effective for anyone hired after December 31, 2021. Anyone employed by Ball prior to a multi-employer planthat date is unaffected by one employer may be used to provide benefits to employees of other participating employers. If a participating employer stops contributing to the plan, the unfunded obligations of the plan may be borne by the remaining participating employers. In the event that Ball withdraws from participation in one of these plans, applicable law could require the company to make additional lump-sum contributions to the plan. The company’s withdrawal liability for any multi-employer defined benefit pension plan would depend on the extent of the plan’s funding of vested benefits. Additionally, if a multi-employer defined benefit pension plan fails to satisfy certain minimum funding requirements, the IRS may impose a non deductible excise tax of 5 percent on the amount of the accumulated funding deficiency for those employers contributing to the plan.this change.
Defined Benefit Pension Plans
Amounts recognized in the consolidated balance sheets for the funded status of ourthe company’s defined benefit pension plans consisted of:
| | | | | | | | | | | | | | | | | | |
| | December 31, |
| | 2021 | | 2020 |
($ in millions) | | U.S. | | Non-U.S. | | Total | | U.S. | | Non-U.S. | | Total |
| | | | | | | | | | | | | | | | | | |
Long-term pension asset | | $ | — | | $ | 579 | | $ | 579 | | $ | — | | $ | 562 | | $ | 562 |
Defined benefit pension liabilities (a) | | | (344) | | | (238) | | | (582) | | | (667) | | | (288) | | | (955) |
Funded status | | $ | (344) | | $ | 341 | | $ | (3) | | $ | (667) | | $ | 274 | | $ | (393) |
| | | | | | | | | | | | | | | | | | |
| | December 31, |
| | 2017 | | 2016 |
($ in millions) | | U.S. | | Foreign | | Total | | U.S. | | Foreign | | Total |
| | | | | | | | | | | | | | | | | | |
Long-term pension asset | | $ | — | | $ | 504 | | $ | 504 | | $ | — | | $ | 147 | | $ | 147 |
Defined benefit pension liabilities (a) | | | (641) | | | (304) | | | (945) | | | (679) | | | (284) | | | (963) |
| | $ | (641) | | $ | 200 | | $ | (441) | | $ | (679) | | $ | (137) | | $ | (816) |
| (a) | (a)
| | Included is an unfunded, non-qualified U.S. plan obligation of $34$32 million at December 31, 2017,2021, that has been annuitized with a corresponding asset of $34$28 million ($($3 million in other current assets and $31$25 million in other assets). At December 31, 2016,2020, the unfunded non-qualified U.S. plan obligation of $33$34 million was annuitized with a corresponding asset of $33$28 million recorded($3 million in other assets. current assets and $25 million in other assets). |
An analysis of the change in benefit accrualsaccounts for 20172021 and 20162020 follows:
| | | | | | | | | | | | | | | | | | |
| | December 31, |
| | 2021 | | 2020 |
($ in millions) | | U.S. | | Non-U.S. | | Total | | U.S. | | Non-U.S. | | Total |
| | | | | | | | | | | | | | | | | | |
Change in projected benefit obligation: | | | | | | | | | | | | | | | | | | |
Benefit obligation at prior year end | | $ | 2,752 | | $ | 3,479 | | $ | 6,231 | | $ | 2,849 | | $ | 3,348 | | $ | 6,197 |
Service cost | | | 83 | | | 13 | | | 96 | | | 64 | | | 13 | | | 77 |
Interest cost | | | 50 | | | 36 | | | 86 | | | 72 | | | 56 | | | 128 |
Benefits paid | | | (143) | | | (150) | | | (293) | | | (163) | | | (263) | | | (426) |
Net actuarial (gains) losses | | | (76) | | | (138) | | | (214) | | | 320 | | | 194 | | | 514 |
Settlements and other | | | (362) | (a) | | — | | | (362) | | | (392) | (a) | | — | | | (392) |
Plan amendments | | | — | | | — | | | — | | | 1 | | | 5 | | | 6 |
Other | | | — | | | 2 | | | 2 | | | 1 | | | 1 | | | 2 |
Effect of exchange rates | | | — | | | (53) | | | (53) | | | — | | | 125 | | | 125 |
Benefit obligation at year end | | | 2,304 | | | 3,189 | | | 5,493 | | | 2,752 | | | 3,479 | | | 6,231 |
Change in plan assets: | | | | | | | | | | | | | | | | | | |
Fair value of assets at prior year end | | | 2,085 | | | 3,753 | | | 5,838 | | | 2,202 | | | 3,514 | | | 5,716 |
Actual return on plan assets | | | 205 | | | (58) | | | 147 | | | 322 | | | 360 | | | 682 |
Employer contributions | | | 187 | | | 5 | | | 192 | | | 77 | | | 2 | | | 79 |
Contributions to unfunded plans | | | 6 | | | 18 | | | 24 | | | 6 | | | 18 | | | 24 |
Benefits paid | | | (143) | | | (150) | | | (293) | | | (163) | | | (263) | | | (426) |
Settlements and other | | | (380) | (a) | | — | | | (380) | | | (359) | (a) | | — | | | (359) |
Other | | | — | | | 2 | | | 2 | | | — | | | 1 | | | 1 |
Effect of exchange rates | | | — | | | (40) | | | (40) | | | — | | | 121 | | | 121 |
Fair value of assets at end of year | | | 1,960 | | | 3,530 | | | 5,490 | | | 2,085 | | | 3,753 | | | 5,838 |
Funded status | | $ | (344) | | $ | 341 | | $ | (3) | | $ | (667) | | $ | 274 | | $ | (393) |
| | | | | | | | | | | | | | | | | | |
| | December 31, |
| | 2017 | | 2016 |
($ in millions) | | U.S. | | Foreign | | Total | | U.S. | | Foreign | | Total |
| | | | | | | | | | | | | | | | | | |
Change in projected benefit obligation: | | | | | | | | | | | | | | | | | | |
Benefit obligation at prior year end | | $ | 3,186 | | $ | 3,437 | | $ | 6,623 | | $ | 1,362 | | $ | 647 | | $ | 2,009 |
Service cost | | | 49 | | | 17 | | | 66 | | | 58 | | | 14 | | | 72 |
Interest cost | | | 124 | | | 92 | | | 216 | | | 96 | | | 58 | | | 154 |
Benefits paid | | | (222) | | | (190) | | | (412) | | | (161) | | | (94) | | | (255) |
Net actuarial (gains) losses | | | 183 | | | (242) | | | (59) | | | (47) | | | 344 | | | 297 |
Curtailments and settlements including special termination benefits | | | (260) | (b) | | (5) | | | (265) | | | — | | | — | | | — |
Business acquisition | | | — | | | — | | | — | | | 1,888 | | | 3,196 | | | 5,084 |
Business divestiture | | | — | | | — | | | — | | | — | | | (440) | | | (440) |
Other | | | 1 | | | 2 | | | 3 | | | (10) | | | 2 | | | (8) |
Effect of exchange rates | | | — | | | 321 | | | 321 | | | — | | | (290) | | | (290) |
Benefit obligation at year end | | | 3,061 | | | 3,432 | | | 6,493 | | | 3,186 | | | 3,437 | | | 6,623 |
Change in plan assets: | | | | | | | | | | | | | | | | | | |
Fair value of assets at prior year end | | | 2,507 | | | 3,300 | | | 5,807 | | | 988 | | | 316 | | | 1,304 |
Actual return on plan assets | | | 224 | | | 180 | | | 404 | | | (17) | | | 163 | | | 146 |
Employer contributions (a) | | | 174 | | | 9 | | | 183 | | | 111 | | | 185 | | | 296 |
Contributions to unfunded plans | | | 6 | | | 20 | | | 26 | | | 4 | | | 18 | | | 22 |
Benefits paid | | | (222) | | | (190) | | | (412) | | | (161) | | | (94) | | | (255) |
Curtailments and settlements including special termination benefits | | | (269) | (b) | | (2) | | | (271) | | | — | | | — | | | — |
Business acquisition | | | — | | | — | | | — | | | 1,592 | | | 3,296 | | | 4,888 |
Business divestiture | | | — | | | — | | | — | | | — | | | (303) | | | (303) |
Other | | | — | | | 2 | | | 2 | | | (10) | | | 2 | | | (8) |
Effect of exchange rates | | | — | | | 313 | | | 313 | | | — | | | (283) | | | (283) |
Fair value of assets at end of year | | | 2,420 | | | 3,632 | | | 6,052 | | | 2,507 | | | 3,300 | | | 5,807 |
Funded status | | $ | (641) | | $ | 200 | | $ | (441) | | $ | (679) | | $ | (137) | | $ | (816) |
| (a) | | In 2016, Rexam agreed to establish and fund an escrow cash account in the amount of $171 million on behalf of the acquired Rexam U.K. pension plan. This escrow amount was subsequently contributed to the U.K. pension plan in July 2016 and is reflected as employer contributions.
|
| (b)
| | Relates toIncludes the purchase of non-participating group annuity contracts and term-vested lump sum payments discussed below.
|
The company’s German, Swedish and certain U.S. plans are unfunded and the liabilities are included in the company’s consolidated balance sheets. Benefits are paid directly by the company to the participants.
Amounts recognized in accumulated other comprehensive (earnings) loss,earnings (loss), including other postemployment benefits, consisted of:
| | | | | | | | | | | | | | | | | | | |
| | December 31, | |
| | 2017 | | 2016 | |
| | | | | | | | | | | | | | | | | | | |
| | | December 31, |
| | | 2021 | | 2020 |
($ in millions) | | U.S. | | Foreign | | Total | | U.S. | | Foreign | | Total | | U.S. | | Non-U.S. | | Total | | U.S. | | Non-U.S. | | Total |
| | | | | | | | | | | | | | | | | | | |
| | | | | | | | | | | | | | | | | | | |
Net actuarial (loss) gain | | $ | (611) | | $ | 36 | | $ | (575) | | $ | (585) | | $ | (272) | | $ | (857) | | $ | (290) | | $ | 83 | | $ | (207) | | $ | (625) | | $ | 57 | | $ | (568) |
Net prior service (cost) credit | | | (1) | | | — | | | (1) | | | (11) | | | — | | | (11) | | | 15 | | | (51) | | | (36) | | | 15 | | | (54) | | | (39) |
Tax effect and currency exchange rates | | | 224 | | | (10) | | | 214 | | | 232 | | | 46 | | | 278 | | | 80 | | | (6) | | | 74 | | | 162 | | | (21) | | | 141 |
| | $ | (388) | | $ | 26 | | $ | (362) | | $ | (364) | | $ | (226) | | $ | (590) | |
| | | $ | (195) | | $ | 26 | | $ | (169) | | $ | (448) | | $ | (18) | | $ | (466) |
Net actuarial losses decreased by $361 million during 2021, principally resulting from the effects of settlement accounting in the U.S., wherein deferred losses were released into the consolidated statement of earnings, and a reduction in pension liabilities as global discount rates used increased.
The accumulated benefit obligation for all U.S. defined benefit pension plans was $2,996$2,171 million and $3,130$2,643 million at December 31, 20172021 and 2016,2020, respectively. The accumulated benefit obligation for all foreignnon-U.S. defined benefit pension plans was $3,429$3,185 million and $3,433$3,476 million at December 31, 20172021 and 2016,2020, respectively. Following is the information for defined benefit plans with a projected benefit obligation, or an accumulated benefit obligation, in excess of plan assets:
| | | | | | | | | | | | | | | | | | |
| | December 31, |
| | 2021 | | 2020 |
($ in millions) | | U.S. | | Non-U.S. | | Total | | U.S. | | Non-U.S. | | Total |
| | | | | | | | | | | | | | | | | | |
Projected benefit obligation | | $ | 2,304 | | $ | 311 | | $ | 2,615 | | $ | 2,752 | | $ | 356 | | $ | 3,108 |
Accumulated benefit obligation | | | 2,171 | | | 307 | | | 2,478 | | | 2,643 | | | 353 | | | 2,996 |
Fair value of plan assets (a) | | | 1,960 | | | 73 | | | 2,033 | | | 2,085 | | | 68 | | | 2,153 |
| | | | | | | | | | | | | | | | | | |
| | December 31, |
| | 2017 | | 2016 |
($ in millions) | | U.S. | | Foreign | | Total | | U.S. | | Foreign | | Total |
| | | | | | | | | | | | | | | | | | |
Projected benefit obligation | | $ | 3,061 | | $ | 389 | | $ | 3,450 | | $ | 3,186 | | $ | 326 | | $ | 3,512 |
Accumulated benefit obligation | | | 2,996 | | | 385 | | | 3,381 | | | 3,130 | | | 322 | | | 3,452 |
Fair value of plan assets (a) | | | 2,420 | | | 85 | | | 2,505 | | | 2,507 | | | 43 | | | 2,550 |
| (a) | (a)
| | The German, Swedish and certain U.S. plans are unfunded and, therefore, there is no0 fair value of plan assets associated with these plans. |
Components of net periodic benefit cost were:were as follows:
| | | | | | | | | | | | | | | | | | | | | | | | | | | | |
| | | Years Ended December 31, |
| | | 2021 | | 2020 | | 2019 |
($ in millions) | | | U.S. | | Non-U.S. | | Total | | U.S. | | Non-U.S. | | Total | | U.S. | | Non-U.S. | | Total |
| | | | | | | | | | | | | | | | | | | | | | | | | | | | |
Ball-sponsored plans: | | | | | | | | | | | | | | | | | | | | | | | | | | | | |
Service cost | | | $ | 83 | | $ | 13 | | $ | 96 | | $ | 64 | | $ | 13 | | $ | 77 | | $ | 50 | | $ | 11 | | $ | 61 |
Interest cost | | | | 50 | | | 36 | | | 86 | | | 72 | | | 56 | | | 128 | | | 101 | | | 72 | | | 173 |
Expected return on plan assets | | | | (117) | | | (65) | | | (182) | | | (119) | | | (85) | | | (204) | | | (116) | | | (109) | | | (225) |
Amortization of prior service cost | | | | 1 | | | 3 | | | 4 | | | 2 | | | 2 | | | 4 | | | 1 | | | 3 | | | 4 |
Recognized net actuarial loss | | | | 45 | | | 5 | | | 50 | | | 40 | | | 5 | | | 45 | | | 22 | | | 4 | | | 26 |
Settlement losses (a) | | | | 135 | | | — | | | 135 | | | 120 | | | — | | | 120 | | | — | | | 8 | | | 8 |
Net periodic benefit cost for Ball sponsored plans | | | $ | 197 | | $ | (8) | | $ | 189 | | $ | 179 | | $ | (9) | | $ | 170 | | $ | 58 | | $ | (11) | | $ | 47 |
| | | | | | | | | | | | | | | | | | | | | | | | | | | |
| | Years Ended December 31, |
| | 2017 | | 2016 | | 2015 |
($ in millions) | | U.S. | | Foreign | | Total | | U.S. | | Foreign | | Total | | U.S. | | Foreign | | Total |
| | | | | | | | | | | | | | | | | | | | | | | | | | | |
Ball-sponsored plans: | | | | | | | | | | | | | | | | | | | | | | | | | | | |
Service cost | | $ | 49 | | $ | 17 | | $ | 66 | | $ | 58 | | $ | 14 | | $ | 72 | | $ | 52 | | $ | 15 | | $ | 67 |
Interest cost | | | 124 | | | 92 | | | 216 | | | 96 | | | 58 | | | 154 | | | 57 | | | 18 | | | 75 |
Expected return on plan assets | | | (126) | | | (110) | | | (236) | | | (106) | | | (70) | | | (176) | | | (79) | | | (20) | | | (99) |
Amortization of prior service cost | | | 2 | | | — | | | 2 | | | (1) | | | — | | | (1) | | | (1) | | | — | | | (1) |
Recognized net actuarial loss | | | 34 | | | 5 | | | 39 | | | 32 | | | 6 | | | 38 | | | 39 | | | 9 | | | 48 |
Curtailment and settlement losses including special termination benefits | | | 47 | (a) | | (1) | | | 46 | | | — | | | 80 | | | 80 | | | 5 | | | — | | | 5 |
Net periodic benefit cost for Ball sponsored plans | | | 130 | | | 3 | | | 133 | | | 79 | | | 88 | | | 167 | | | 73 | | | 22 | | | 95 |
| | | | | | | | | | | | | | | | | | | | | | | | | | | |
Net periodic benefit cost for multi-employer plans | | | 2 | | | — | | | 2 | | | 2 | | | — | | | 2 | | | 1 | | | — | | | 1 |
Total net periodic benefit cost | | $ | 132 | | $ | 3 | | $ | 135 | | $ | 81 | | $ | 88 | | $ | 169 | | $ | 74 | | $ | 22 | | $ | 96 |
| (a) | (a)
| | In 2017, the company recorded a $47 million loss of which $44 million isIncludes settlement losses related to the purchase of non-participating group annuity contracts, as well as lump sum settlements for certain U.S. plans; see below for further discussion. The companyannuities and lump-sum payments which were recorded an additional $3 million for plant shut-down benefits in 2017. Included in 2016 is a curtailment charge of $80 million related to the sale of the Divestment Business. The expense in both years is included in business consolidation and other activities.
See Note 6 for further details. |
In August 2017,addition to regular lump sum payments made each year, Ball completed the purchase of non-participating group annuity contracts that were transferred to an insurance company for a portion of the company’s U.S. pension benefit obligationobligations in 2021 and 2020 and for certainthe entirety of its U.S. definedthe company’s Canadian pension benefit pension plans.obligations in 2019, totaling approximately $325 million in 2021, $245 million in 2020 and $32 million in 2019. The $224 million purchase of the annuity contracts triggered settlement accounting. Regular lump sums paidaccounting in each year. Ball also undertook a terminated vested buy-out exercise in 2020 for a portion of the normal course of plan operations are also included incompany’s U.S. pension obligations, reducing the total settlement amount. Both of these paymentsobligations by $147 million. These transactions resulted in the recognition of a $44 million settlement loss which waslosses recorded in business consolidation and other activities recognizing amounts transferred from accumulated other comprehensive income.of $135 million in 2021, $120 million in 2020, $8 million in 2019. The company’s pension obligation was alsoobligations were remeasured during the third quarter of 20172021 and 2020 for the impacted U.S. plans impacted. plans.
The estimated actuarial net lossNon-service pension income of $42 million in 2021, $27 million in 2020 and net prior service cost for the defined benefit pension plans that will be amortized from accumulated other comprehensive earnings (loss) into net periodic benefit cost during 2018 are a loss of $43$22 million in 2019, is included in selling, general, and a cost of $2 million, respectively.administrative (SG&A) expenses.
Contributions to the company’s defined benefit pension plans not including the unfunded German, Swedish and certain U.S. plans, are expected to be approximately $41$127 million for the U.S. and $5in 2022, of which $100 million for the foreign planswas already contributed in 2018.January 2022. This estimate may change based on changes in the Pension Protection Act, actual plan asset performance and available company cash flow, among other factors. Benefit payments related to the U.S. plans are expected to be approximately $216$303 million, for the year ended December 31, 2018, $206$299 million, for each of the years ending December 31, 2019 through 2022, and a total of $1.0 billion for the years ending December 31, 2023 through 2027. Benefit payments for the foreign plans, excluding the German and Swedish plans, are expected to be $185$304 million, $191 million, $197 million, $204$316 million and $210$321 million for the years ending December 31, 20182022 through 2022,2026, respectively, and aapproximately $1.6 billion in total of $1.2 billion for the years ending December 31, 20232027 through 2027.2031.
Benefit payments to participants in the unfunded German, Swedish and certain U.S. plans are expected to be between $18 million to $21 million in each of the years ending December 31, 2018 through 2022 and a total of $80 million for the years ending December 31, 2023 through 2027.
Weighted average assumptions used to determine benefit obligations for the company’s significant North AmericanU.S. plans at December 31 were:were as follows:
| | | | | | | | | | | | | | |
| | U.S. | | Canada | |
| | 2017 | (a) | 2016 | (a) | 2015 | | 2017 | | 2016 | | 2015 | | |
| | | | | | | | |
| | | U.S. | |
| | | 2021 | | 2020 | | 2019 | |
Discount rate | | 3.72 | % | 4.26 | % | 4.60 | % | 2.80 | % | 3.50 | % | 3.50 | % | | 2.87 | % | 2.49 | % | 3.35 | % |
Rate of compensation increase | | 4.15 | % | 4.14 | % | 4.80 | % | N/A | (b) | N/A | (b) | 3.00 | % | | 4.48 | % | 4.05 | % | 4.03 | % |
| (a)
| | In 2017 and 2016, the weighted average assumptions for U.S. pension plans include pension plans assumed as part of the Rexam acquisition.
|
| (b)
| | The Canadian plans are frozen.
|
Weighted average assumptions used to determine benefit obligations for the company’s significant European plans at December 31 were:were as follows:
| | | | | | | | | | | | | |
| | U.K. | | Germany |
| | 2017 | (a) | 2016 | (a) | 2015 | | 2017 | (a) | 2016 | (a) | 2015 | |
Discount rate | | 2.55 | % | 2.70 | % | 3.75 | % | 1.68 | % | 1.54 | % | 2.25 | % |
Rate of compensation increase | | 4.41 | % | 4.30 | % | 3.00 | % | 2.50 | % | 2.50 | % | 2.50 | % |
Pension increase | | 3.41 | % | 3.30 | % | 3.15 | % | 1.50 | % | 1.50 | % | 1.75 | % |
| (a)
| | In 2017 and 2016, the U.K. weighted average assumptions are for the acquired Rexam plan only, and the German assumptions include pension plans assumed as part of the Rexam acquisition and one legacy Ball plan.
|
| | | | | | | | | | | | | |
| | U.K. | | Germany |
| | 2021 | | 2020 | | 2019 | | 2021 | | 2020 | | 2019 | |
Discount rate | | 1.81 | % | 1.39 | % | 2.07 | % | 1.12 | % | 0.80 | % | 1.11 | % |
Rate of compensation increase | | 3.50 | % | 3.50 | % | 3.50 | % | 2.50 | % | 2.50 | % | 2.50 | % |
Pension increase | | 3.64 | % | 3.19 | % | 3.22 | % | 1.70 | % | 1.50 | % | 1.50 | % |
Weighted average assumptions used to determine net periodic benefit cost for the company’s significant North AmericanU.S. plans for the years ended December 31 were:were as follows:
| | | | | | | | | | | | | |
| | U.S. | | Canada |
| | 2017 | (a) | 2016 | (a) | 2015 | | 2017 | | 2016 | | 2015 | |
Discount rate | | 4.27 | % | 4.60 | % | 4.15 | % | 3.50 | % | 3.50 | % | 3.50 | % |
Rate of compensation increase | | 4.14 | % | 4.98 | % | 4.80 | % | N/A | (b) | N/A | (b) | 3.00 | % |
Expected long-term rate of return on assets | | 5.50 | % | 6.88 | % | 7.25 | % | 4.00 | % | 4.00 | % | 4.00 | % |
| (a)
| | In 2017 and 2016, the weighted average assumptions for U.S. pension plans include pension plans assumed as part of the Rexam acquisition.
|
| (b)
| | The Canadian plans are frozen.
|
| | | | | | | |
| | U.S. | |
| | 2021 | | 2020 | | 2019 | |
Discount rate | | 2.49 | % | 3.35 | % | 4.41 | % |
Rate of compensation increase | | 4.05 | % | 4.03 | % | 4.02 | % |
Expected long-term rate of return on assets | | 6.32 | % | 6.00 | % | 5.58 | % |
Weighted average assumptions used to determine net periodic benefit cost for the company’s significant European plans for the years ended December 31 were:were as follows:
| | | | | | | | | | | | | |
| | U.K. | | Germany |
| | 2017 | (a) | 2016 | (a) | 2015 | | 2017 | (a) | 2016 | (a) | 2015 | |
Discount rate | | 2.70 | % | 2.90 | % | 3.75 | % | 1.52 | % | 1.29 | % | 1.75 | % |
Rate of compensation increase | | 4.30 | % | 3.80 | % | 3.00 | % | 2.50 | % | 2.00 | % | 2.50 | % |
Pension increase | | 3.41 | % | 2.80 | % | 3.15 | % | 1.50 | % | 1.50 | % | 1.75 | % |
Expected long-term rate of return on assets | | 3.20 | % | 3.40 | % | 6.50 | % | N/A | | N/A | | N/A | |
| (a)
| | In 2017 and 2016, the U.K. assumption is for the acquired Rexam plan only, and the German weighted average assumptions include pension plans assumed as part of the Rexam acquisition and one legacy Ball plan.
|
| | | | | | | | | | | | | |
| | U.K. | | Germany |
| | 2021 | | 2020 | | 2019 | | 2021 | | 2020 | | 2019 | |
Discount rate | | 1.39 | % | 2.07 | % | 2.90 | % | 0.80 | % | 1.11 | % | 1.74 | % |
Rate of compensation increase | | 3.50 | % | 3.50 | % | 3.50 | % | 2.50 | % | 2.50 | % | 2.50 | % |
Pension increase | | 3.19 | % | 3.22 | % | 3.45 | % | 1.50 | % | 1.50 | % | 1.50 | % |
Expected long-term rate of return on assets | | 1.74 | % | 2.57 | % | 3.40 | % | N/A | | N/A | | N/A | |
The discount and compensation increase rates used above to determine the December 31, 2017,2021, benefit obligations will be used to determine net periodic benefit cost for 2018.2022. A reduction of the expected return on pension assets assumption by one quarter of a percentage point would result in an approximate $15$13 million increase in 20182022 pension expense, while a quarter of a percentage point reduction in the discount rate applied to the pension liability would result in an estimated reduction ofapproximate $3 million increase to pension expense of approximately $3 million in 2018.2022.
Accounting for pensions and postretirement benefit plans requires that the benefit obligation be discounted to reflect the time value of money at the measurement date and the rates of return currently available on high-quality, fixed-income securities whose cash flows (via coupons and maturities) match the timing and amount of future benefit plan payments. Other factors used in measuring the obligation include compensation increases, health care cost increases, future rates of inflation, mortality and employee turnover.
Actual results may differ from the company’s actuarial assumptions, which may have an impact on the amount of reported expense or liability for pensions or postretirement benefits. In 2017,2021, the company recorded pension expense of $133$189 million for Ball-sponsored plans, including $46$135 million of settlement charges, special termination and curtailment losses, andthe company currently expects its 20182022 pension expense to be $65 million, using foreign currency exchange rates in effect at December 31, 2017.2021. The decreaseexpected increase in pension expense, excluding settlement charges, is primarily the result of increased service cost from growth in employee numbers and higher interest cost due to a change in approach to measuring service andhigher global interest costs and a better plan experience in the U.K., offset by a reduction in return on assets on the U.S. pension plans.rates.
Table of Contents
For 2017, the company measured service and interest costs utilizing the expected or hypothetical payments for each plan. The expected or hypothetical payments were discounted using the spot rates from the actuarial yield curve for each plan to obtain a single equivalent discount rate that is appropriate for the duration of each plan. For 2018, the company will measure service and interest costs by applying the specific spot rates along that yield curveBall Corporation
Notes to the plans’ liability cash flows. The company believes the new approach provides a more precise measurement of service and interest costs by aligning the timing of the plans’ liability cash flows to the corresponding spot rates on the yield curve. This change in estimate does not affect the measurement of plan obligations nor the funded status of the plans.Consolidated Financial Statements
The assumption related to the expected long-term rate of return on plan assets reflects the average rate of earnings expected on the funds invested to provide for pension benefits over the life of the plans. The assumption was based upon Ball’s pension plan asset allocations, investment strategies and the views of its investment managers, consultants and other large pension plan sponsors. Some reliance was placed on the historical and expected asset returns of ourthe company’s plans. An asset-allocation optimization model was used to project future asset returns using simulation and asset class correlation. The analysis included expected future risk premiums, forward-looking return expectations derived from the yield on long-term bonds and the price earnings ratios of major stock market indexes, expected inflation levels and real risk-free interest rate assumptions and the fund’s expected asset allocation.
The expected long-term rates of return on assets were calculated by applying the expected rate of return to a market-related value of plan assets at the beginning of the year, adjusted for the weighted average expected contributions and
benefit payments. The market-related value of plan assets used to calculate the expected return was $6,121$5,633 million for 2017, $6,0682021, $5,573 million for 20162020 and $1,395$5,375 million for 2015.2019.
For pension plans, accumulated actuarial gains and losses in excess of a 10 percent corridor and the prior service cost are amortized over the average remaining service period of active participants or over the average life expectancy for plans with significant inactive participants.
Defined Benefit Pension Plan Assets
Policies and Allocation Information
Pension investment committees or scheme trustees of the company and its relevant subsidiaries establish investment policies and strategies for the company’s pension plan assets. The investment policies and strategies include the following common themes to: (1) provide for long-term growth of principal without undue exposure to risk, (2) minimize contributions to the plans, (3) minimize and stabilize pension expense and (4) achieve a rate of return equal to or above the market average for each asset class over the long term. The pension investment committees are required to regularly, but no less frequently than annually, review asset mix and asset performance, as well as the performance of the investment managers. Based on their reviews, which are generally conducted quarterly, investment policies and strategies are revised as appropriate.
Target asset allocations are set using a minimum and maximum range for each asset category as a percent of the total funds’ market value. Following are the target asset allocations established as of December 31, 2017:2021:
| | | | | | | | | | | | |
| | U.S. | | U.K. | | | | | | |
| | Legacy Ball
| | Legacy Rexam
| | | Canada
| | Ireland
| | U.K.
| |
| | | | | | | | | | | | |
Cash and cash equivalents | | 0-10
| %
| 0-10
| %
| | —
| %
| — | % | 50-8060-100
| %(c)(a) |
Equity securities | | 10-75
| %(a)
| 10-25
| %(d)
| | 5
| %
| 39-4726-54
| % | 5-300-15
| % |
Fixed income securities | | 25-70
| %(b)
| 75-9024-58
| % | | 9560-100
| % | 42-52
| %
| 50-80
| %(c)(a)
|
Alternative investments | | 0-355-19
| % | —
| %
| | —
| %
| 9-11
| %
| 0-200-5
| % |
| (a) | | Equity securities may consist of: (1) up to 25 percent large cap equities, (2) up to 10 percent mid cap equities, (3) up to 10 percent small cap equities, (4) up to 35 percent foreign equities and (5) up to 35 percent special equities. Holdings in Ball Corporation common stock or Ball bonds cannot exceed 5 percent of the trust’s assets.
|
| (b)
| | Debt securities may include up to 10 percent non-investment grade bonds, up to 10 percent bank loans and up to 15 percent international bonds.
|
| (c)
| | The combined target allocation for fixed income securities and cash and cash equivalents is 5060 to 80100 percent. |
| (d)
| | Equity securities may consist of: (1) up to 20 percent domestic equities, (2) up to 10 percent international equities, and (3) up to 10 percent private equities.
|
The actual weighted average asset allocations for Ball’s defined benefit pension plans, which individually were within the established targets for each country for that year, were as follows at December 31:
| | | | | | |
| | 2017 | | 2016 | | |
| | | | | | |
| | | 2021 | | 2020 | |
Cash and cash equivalents | | 2 | % | 6 | % | | — | % | 1 | % |
Equity securities | | 17 | % | 18 | % | | 17 | % | 17 | % |
Fixed income securities | | 74 | % | 68 | % | | 81 | % | 79 | % |
Alternative investments | | 7 | % | 8 | % | | 2 | % | 3 | % |
| | 100 | % | 100 | % | |
| | | 100 | % | 100 | % |
Fair Value Measurements of Pension Plan Assets
Following is a description of the valuation methodologies used for pension assets measured at fair value:
Cash and cash equivalents: Consist of cash on deposit with brokers and short-term U.S. Treasury money market funds with a maturity of less than 90 days, and such amounts are shown net of receivables and payables for securities traded at period end but not yet settled. All cash and cash equivalents are stated at cost, which approximates fair value.
Corporate equity securities: Valued at the closing price reported on the active market on which the individual security is traded.
U.S. government and agency securities: Valued using the pricing of similar agency issues, live trading feeds from several vendors and benchmark yields.
Corporate bonds and notes: Valued using market inputs including benchmark yields, reported trades, broker/dealer quotes, issuer spreads, benchmark securities, bids, offers and reference data including market research publications. Inputs may be prioritized differently at certain times based on market conditions.
Commingled funds: The shares held are valued at their net asset value (NAV) at year end.
NAV practical expedient: Includes certain commingled fixed income and equity funds as well as limited partnership and other funds. Certain of the partnership investments receive fair market valuations on a quarterly basis. Certain other commingled funds and partnerships invest in market-traded securities, both on a long and short basis. These investments are valued using quoted market prices.
The preceding methods described may produce a fair value calculation that is not indicative of net realizable value or reflective of future fair values. Furthermore, although the company believes its valuation methods are appropriate and consistent with other market participants, the use of different methodologies or assumptions to determine the fair value of certain financial instruments could result in a different fair value measurement at the reporting date.
The company’s assessment of the significance of a particular input to the fair value measurement requires judgment and may affect the valuation of pension assets and liabilities and their placement within the fair value hierarchy levels. The fair value hierarchy levels assigned to the company’s defined benefit plan assets are summarized in the tables below:
| | | | | | | | | |
| | December 31, 2021 |
($ in millions) | | Level 1 | | Level 2 | | Total |
| | | | | | | | | |
U.S. pension assets, at fair value: | | | | | | | | | |
Cash and cash equivalents | | $ | — | | $ | 26 | | $ | 26 |
U.S. government, agency and asset-backed securities: | | | | | | | | | |
Municipal bonds | | | — | | | 25 | | | 25 |
Treasury bonds | | | 106 | | | — | | | 106 |
Other | | | — | | | 7 | | | 7 |
Non-U.S. government bonds | | | — | | | 20 | | | 20 |
Corporate bonds and notes: | | | | | | | | | |
Basic materials | | | — | | | 5 | | | 5 |
Communications | | | — | | | 34 | | | 34 |
Consumer discretionary | | | — | | | 20 | | | 20 |
Consumer staples | | | — | | | 41 | | | 41 |
Energy | | | — | | | 23 | | | 23 |
Financials | | | — | | | 86 | | | 86 |
Industrials | | | — | | | 283 | | | 283 |
Information technology | | | — | | | 12 | | | 12 |
Private placement | | | — | | | 1 | | | 1 |
Utilities | | | — | | | 98 | | | 98 |
Other | | | — | | | 1 | | | 1 |
Total level 1 and level 2 | | $ | 106 | | $ | 682 | | | 788 |
Other investments measured at net asset value (a) | | | | | | | | | 1,172 |
Total assets | | | | | | | | $ | 1,960 |
| | | | | | | | | |
| | December 31, 2017 |
($ in millions) | | Level 1 | | Level 2 | | Total |
| | | | | | | | | |
U.S. pension assets, at fair value (includes U.S. Rexam assets): | | | | | | | | | |
Cash and cash equivalents | | $ | 1 | | $ | 124 | | $ | 125 |
Corporate equity securities: | | | | | | | | | |
Consumer discretionary | | | 54 | | | — | | | 54 |
Financials | | | 47 | | | — | | | 47 |
Healthcare | | | 45 | | | — | | | 45 |
Industrials | | | 81 | | | — | | | 81 |
Information technology | | | 97 | | | — | | | 97 |
Other | | | 74 | | | — | | | 74 |
U.S. government and agency securities: | | | | | | | | | |
FHLMC mortgage backed securities | | | — | | | 35 | | | 35 |
FNMA mortgage backed securities | | | — | | | 69 | | | 69 |
Municipal bonds | | | — | | | 61 | | | 61 |
Treasury bonds | | | 54 | | | — | | | 54 |
Other | | | — | | | 15 | | | 15 |
Corporate bonds and notes: | | | | | | | | | |
Communications | | | — | | | 86 | | | 86 |
Consumer discretionary | | | — | | | 83 | | | 83 |
Consumer staples | | | — | | | 64 | | | 64 |
Financials | | | — | | | 329 | | | 329 |
Healthcare | | | — | | | 136 | | | 136 |
Industrials | | | — | | | 137 | | | 137 |
Information technology | | | — | | | 87 | | | 87 |
Oil and gas | | | — | | | 122 | | | 122 |
Private placement | | | — | | | 128 | | | 128 |
Utilities | | | — | | | 128 | | | 128 |
Other | | | — | | | 70 | | | 70 |
Commingled funds | | | 22 | | | 80 | | | 102 |
Total level 1 and level 2 | | $ | 475 | | $ | 1,754 | | | 2,229 |
Other investments measured at net asset value (a) | | | | | | | | | 191 |
Total assets | | | | | | | | $ | 2,420 |
| (a) | (a)
| | Certain investments measured at fair value using the NAV per share (or its equivalent) practical expedient have not been classified within the fair value hierarchy. The fair value amounts presented in this table are intended to permit reconciliation of the fair value hierarchy to the amounts presented in the change in plan assets reconciliation. |
| | | | | | | | | |
| | December 31, 2020 |
($ in millions) | | Level 1 | | Level 2 | | Total |
| | | | | | | | | |
U.S. pension assets, at fair value: | | | | | | | | | |
Cash and cash equivalents | | $ | — | | $ | 23 | | $ | 23 |
U.S. government, agency and asset-backed securities: | | | | | | | | | |
Municipal bonds | | | — | | | 24 | | | 24 |
Treasury bonds | | | 53 | | | — | | | 53 |
Other | | | — | | | 6 | | | 6 |
Non-U.S. government bonds | | | — | | | 19 | | | 19 |
Corporate bonds and notes: | | | | | | | | | |
Basic materials | | | — | | | 17 | | | 17 |
Communications | | | — | | | 113 | | | 113 |
Consumer discretionary | | | — | | | 88 | | | 88 |
Consumer staples | | | — | | | 53 | | | 53 |
Energy | | | — | | | 114 | | | 114 |
Financials | | | — | | | 145 | | | 145 |
Healthcare | | | — | | | 30 | | | 30 |
Industrials | | | — | | | 41 | | | 41 |
Information technology | | | — | | | 25 | | | 25 |
Private placement | | | — | | | 1 | | | 1 |
Utilities | | | — | | | 56 | | | 56 |
Other | | | — | | | 51 | | | 51 |
Total level 1 and level 2 | | $ | 53 | | $ | 806 | | | 859 |
Other investments measured at net asset value (a) | | | | | | | | | 1,226 |
Total assets | | | | | | | | $ | 2,085 |
| | | | | | | | | |
| | December 31, 2016 |
($ in millions) | | Level 1 | | Level 2 | | Total |
| | | | | | | | | |
U.S. pension assets, at fair value (includes U.S. Rexam assets): | | | | | | | | | |
Cash and cash equivalents | | $ | — | | $ | 185 | | $ | 185 |
Corporate equity securities: | | | | | | | | | |
Consumer discretionary | | | 53 | | | — | | | 53 |
Financials | | | 43 | | | — | | | 43 |
Healthcare | | | 27 | | | — | | | 27 |
Industrials | | | 47 | | | — | | | 47 |
Information technology | | | 66 | | | — | | | 66 |
Other | | | 39 | | | — | | | 39 |
U.S. government and agency securities: | | | | | | | | | |
FHLMC mortgage backed securities | | | — | | | 17 | | | 17 |
FNMA mortgage backed securities | | | — | | | 64 | | | 64 |
Municipal bonds | | | — | | | 49 | | | 49 |
Treasury bonds | | | 85 | | | — | | | 85 |
Other | | | 8 | | | 18 | | | 26 |
Corporate bonds and notes: | | | | | | | | | |
Communications | | | — | | | 58 | | | 58 |
Consumer discretionary | | | — | | | 57 | | | 57 |
Consumer staples | | | — | | | 64 | | | 64 |
Financials | | | — | | | 280 | | | 280 |
Healthcare | | | — | | | 98 | | | 98 |
Industrials | | | — | | | 115 | | | 115 |
Information technology | | | — | | | 84 | | | 84 |
Oil and gas | | | — | | | 122 | | | 122 |
Private placement | | | — | | | 76 | | | 76 |
Utilities | | | — | | | 139 | | | 139 |
Other | | | — | | | 71 | | | 71 |
Commingled funds | | | | | | | | | |
International | | | 17 | | | — | | | 17 |
Total level 1 and level 2 | | $ | 385 | | $ | 1,497 | | | 1,882 |
Other investments measured at net asset value (a) | | | | | | | | | 625 |
Total assets | | | | | | | | $ | 2,507 |
| (a) | (a)
| | Certain investments measured at fair value using the NAV per share (or its equivalent) practical expedient have not been classified in the fair value hierarchy. The fair value amounts presented within this table are intended to permit reconciliation of the fair value hierarchy to the amounts presented in the change in plan assets reconciliation.
|
| | | | | |
| | December 31, |
($ in millions) | | 2017 | | | 2016 |
| | | | | |
U.K. pension assets, at fair value: | | | | | |
Cash and cash equivalents | $ | 43 | | $ | 279 |
U.K. government bonds | | 2,184 | | | 1,538 |
Other | | 14 | | | 31 |
Total level 1 | | 2,241 | | | 1,848 |
Other investments measured at net asset value (a) | | 1,306 | | | 1,374 |
Total assets | $ | 3,547 | | $ | 3,222 |
| (a)
| | Certain investments measured at fair value using the NAV per share (or its equivalent) practical expedient have not been classified within the fair value hierarchy. The fair value amounts presented in this table are intended to permit reconciliation of the fair value hierarchy to the amounts presented in the change in plan assets reconciliation. |
| | | | | |
| December 31, |
($ in millions) | 2021 | | 2020 |
| | | | | |
U.K. pension assets, at fair value: | | | | | |
Cash and cash equivalents | $ | 5 | | $ | 44 |
Equity commingled funds | | 7 | | | 24 |
U.K. government bonds | | 2,493 | | | 2,572 |
Other | | 7 | | | 39 |
Total level 1 | | 2,512 | | | 2,679 |
Level 2: Investment funds - corporate bonds | | 844 | | | 904 |
Other investments measured at net asset value (a) | | 100 | | | 102 |
Total assets | $ | 3,456 | | $ | 3,685 |
| (a) | Certain investments measured at fair value using the NAV per share (or its equivalent) practical expedient have not been classified within the fair value hierarchy. The fair value amounts presented in this table are intended to permit reconciliation of the fair value hierarchy to the amounts presented in the change in plan assets reconciliation. |
Other PostemploymentPostretirement Benefits
The company sponsors postretirement health care and life insurance plans for certain U.S. and Canadian employees. Also, postretirement health care and life insurance plans were acquired as part of the Rexam acquisition. Employees may also qualify for long-term disability, medical and life insurance continuation and other postemployment benefits upon termination of active employment prior to retirement. All of the Ball-sponsored postretirement health care and life insurance plans are unfunded and, with the exception of life insurance benefits, which are self-insured.
In Canada, the company provides supplemental medical The benefit obligation associated with these plans was $148 million and other benefits in conjunction$170 million as of December 31, 2021 and 2020, respectively, including current portions of $12 million and $14 million, respectively. Net periodic cost associated with Canadian provincial health care plans. Effective July 1, 2017, Ball no longer offers medical and life insurance coverage in the U.S. for non-bargaining, Medicare eligible retirees through company-sponsored plans. Current and future non-bargaining retirees may access benefits through a private exchange by purchasing coverage direct from insurance carriers.
Ball provides a fixed subsidy to certain retirees which shall be used to purchase medical insurance. Ball has no commitments to increase benefits provided by anythese plans was income of the postemployment benefit plans and retains the right, subject to existing agreements, to change or eliminate these benefits.
For other postretirement benefits in the U.S & Canada the accumulated actuarial gains and losses and accumulated prior service gains and losses are amortized over the average remaining service period for active participants or average future lifetime for inactive employees depending upon the plan.
An analysis of the change in other postretirement benefit accruals for 2017 and 2016 follows:
| | | | | | | | | |
| | | | | | | | | |
($ in millions) | | | | | 2017 | | 2016 |
| | | | | | | | | |
Change in benefit obligation: | | | | | | | | | |
Benefit obligation at prior year end | | | | | $ | 232 | | $ | 135 |
Service cost | | | | | | 1 | | | 3 |
Interest cost | | | | | | 9 | | | 8 |
Benefits paid | | | | | | (22) | | | (16) |
Net actuarial (gain) loss | | | | | | 6 | | | (18) |
Business acquisition | | | | | | — | | | 120 |
Special termination benefits | | | | | | 2 | | | — |
Plan amendments | | | | | | (9) | | | — |
Effect of exchange rates and other | | | | | | 1 | | | — |
Benefit obligation at year end | | | | | $ | 220 | | $ | 232 |
Less current portion | | | | | | (24) | | | (24) |
Long-term retiree medical liabilities | | | | | $ | 196 | | $ | 208 |
Components of net periodic benefit cost were:
| | | | | | | | | |
| | Years Ended December 31, |
($ in millions) | | 2017 | | 2016 | | 2015 |
| | | | | | | | | |
Service cost | | $ | 1 | | $ | 3 | | $ | 2 |
Interest cost | | | 9 | | | 8 | | | 6 |
Amortization of prior service cost | | | (1) | | | (1) | | | (1) |
Recognized net actuarial loss (gain) | | | (5) | | | (3) | | | (2) |
Special termination benefits | | | 2 | | | — | | | 2 |
Net periodic benefit cost | $ | 6 | | $ | 7 | | $ | 7 |
Approximately $6 million of estimated net actuarial gain and $1 million, of prior service benefit will be amortized from accumulated other comprehensive earnings (loss) into net periodic benefit cost during 2018.
The assumptions$3 million and $3 million for the U.S.years ended December 31, 2021, 2020 and Canadian plans were based upon a long-term forecast of medical and direct trends and claims data projected forward using generally accepted actuarial methods. For other postretirement benefits, accumulated actuarial gains and losses and prior service cost are amortized over the average remaining service period of active participants.2019, respectively.
Weighted average assumptions used to determine benefit obligations for the other postretirement benefit plans at December 31 were:were as follows:
| | | | | | | | | | | | | |
| | U.S. | | Canada | |
| | 2021 | | 2020 | | 2019 | | 2021 | | 2020 | | 2019 | |
Discount rate | | 2.79 | % | 2.39 | % | 3.24 | % | 2.75 | % | 2.25 | % | 3.00 | % |
Rate of compensation increase (a) | | 4.37 | % | 4.50 | % | 4.50 | % | N/A | | N/A | | N/A | |
| | | | | | | | | | | | | |
| | U.S. | | Canada |
| | 2017 | | 2016 | (a) | 2015 | | 2017 | | 2016 | | 2015 | |
Discount rate | | 3.64 | % | 4.16 | % | 4.60 | % | 3.25 | % | 3.50 | % | 3.50 | % |
Rate of compensation increase (b) | | 4.50 | % | 4.50 | % | N/A | | N/A | | N/A | | N/A | |
| (a) | (a)
| | In 2017 and 2016, the weighted average assumptions for U.S. other postretirement benefit plans include plans assumed as part of the Rexam acquisition.
|
| (b)
| | In 2017 and 2016, theThe rate of compensation increase is not applicable for certain U.S. other postretirement benefit plans.
|
Weighted average assumptions used to determine net periodic benefit cost for the other postretirement benefit plans at December 31 were:were as follows:
| | | | | | | | | | | | | |
| | U.S. | | Canada | |
| | 2021 | | 2020 | | 2019 | | 2021 | | 2020 | | 2019 | |
Discount rate | | 2.39 | % | 3.24 | % | 4.35 | % | 2.25 | % | 3.00 | % | 3.50 | % |
Rate of compensation increase (a) | | 4.50 | % | 4.50 | % | 4.50 | % | N/A | | N/A | | N/A | |
| | | | | | | | | | | | | |
| | U.S. | | Canada |
| | 2017 | | 2016 | (a) | 2015 | | 2017 | | 2016 | | 2015 | |
Discount rate | | 4.16 | % | 4.04 | % | 4.15 | % | 3.50 | % | 3.50 | % | 3.50 | % |
Rate of compensation increase (b) | | 4.50 | % | 4.50 | % | N/A | | N/A | | N/A | | N/A | |
| (a) | (a)
| | In 2017 and 2016, the weighted average assumptions for U.S. other postretirement benefit plans include plans assumed as part of the Rexam acquisition.
|
| (b)
| | In 2017 and 2016, theThe rate of compensation increase is not applicable for certain U.S. other postretirement benefit plans.
|
For the U.S. health care plans at December 31, 2017, a 7 percent health care cost trend rate was used for pre-65 and post-65 benefits, and trend rates were assumed to increase to 5 percent in 2022 and remain at that level thereafter. For the Canadian plans, a 5 percent health care cost trend rate was used for 2018 and in subsequent years. Benefit payment caps exist in many of the company’s health care plans.
Contributions to the company’s other postretirement plans are expected to be approximately $19 million in 2018. This estimate may change based on available company cash flow, among other factors. Benefit payments related to these plans are expected to be between $17 million and $20 million in each of the years ending December 31, 2018 through 2022, and a total of $72 million for the years 2023 through 2027.
Health care cost trend rates can have an effect on the amounts reported for the health care plan. A one-percentage point increase in assumed health care cost trend rates would increase the total of service and interest cost by less than $1 million and the postretirement benefit obligation by $6 million. A one-percentage point decrease would decrease the total of service and interest cost by less than $1 million and the postretirement benefit obligation by $6 million.
Deferred Compensation Plans
Certain management employees may elect to defer the payment of all or a portion of their annual incentive compensation and certain long-term stock-based compensation into the company’s deferred compensation plan and/or the company’s deferred compensation stock plan. The employee becomes a general unsecured creditor of the company with respect to any amounts deferred.
16.18. Shareholders’ Equity
At December 31, 2017,2021, the company had 1.1 billion shares of common stock and 15 million shares of preferred stock authorized, both without par value. Preferred stock includes 550,000 authorized but unissued shares designated as Series A Junior Participating Preferred Stock.
In April 2017,Under its ongoing share repurchase program, the company’s Boardcompany repurchased $719 million, $75 million and $945 million of Directors declared a two-for-one splitits shares, net of Ball Corporation’s common stockissuances, during the years ended December 31, 2021, 2020, and increased the quarterly cash dividend by 54 percent to 10 cents on a post-split basis.2019, respectively. The stock split was effective as of May 16, 2017.
In 2017, in a privately negotiated transaction, Ball entered into an2019 amount included shares repurchased under accelerated share repurchase agreementagreements with third-party financial institutions.
In the third quarter of 2021, Ball’s board of directors increased the company’s quarterly common share dividend by 33 percent to buy $100 million of its common shares using cash on hand and available borrowings, and the company received 2.5 million shares. 20 cents per share.
Accumulated Other Comprehensive Earnings (Loss)
The activity related to accumulated other comprehensive earnings (loss) was as follows:
| | | | | | | | | | | | |
($ in millions) | | Foreign Currency Translation (Net of Tax) | | Pension and Other Postretirement Benefits (Net of Tax) | | Effective Derivatives (Net of Tax) | | Accumulated Other Comprehensive Earnings (Loss) |
| | | | | | | | | | | | |
Balance at December 31, 2015 | | $ | (183) | | $ | (445) | | $ | (12) | | $ | (640) |
Other comprehensive earnings (loss) before reclassifications | | | (146) | | | (227) | (a) | | 46 | | | (327) |
Amounts reclassified from accumulated other comprehensive earnings (loss) | | | — | | | 82 | (b) | | (56) | | | 26 |
Balance at December 31, 2016 | | $ | (329) | | $ | (590) | | $ | (22) | | $ | (941) |
Other comprehensive earnings (loss) before reclassifications | | | 22 | | | 179 | | | (30) | | | 171 |
Amounts reclassified from accumulated other comprehensive earnings (loss) | | | — | | | 49 | (c) | | 65 | | | 114 |
Balance at December 31, 2017 | | $ | (307) | | $ | (362) | | $ | 13 | | $ | (656) |
| (a)
| | Includes $195 million of after-tax net actuarial loss at December 31, 2016, for the remeasurement of acquired plans and $38 million of after-tax actuarial loss at June 30, 2016, for the remeasurement of divested plans.
|
| (b)
| | Includes $60 million, net of tax, from plans sold with the Divestment Business.
|
| (c)
| | Includes $28 million of after tax losses recognized during 2017 related to the annuity buyout and lump sum settlements. Refer to Note 15 for further details.
|
| | | | | | | | | | | | |
($ in millions) | |
Currency
Translation
(Net of Tax) | | Pension and Other Postretirement Benefits (Net of Tax) | | Derivatives Designated as Hedges
(Net of Tax) | | Accumulated Other Comprehensive Earnings (Loss) |
| | | | | | | | | | | | |
Balance at December 31, 2019 | | $ | (340) | | $ | (558) | | $ | (12) | | $ | (910) |
Other comprehensive earnings (loss) before reclassifications | | | (215) | | | (29) | | | (4) | | | (248) |
Amounts reclassified from accumulated other comprehensive earnings (loss) into earnings | | | — | | | 121 | | | 83 | | | 204 |
Balance at December 31, 2020 | | | (555) | | | (466) | | | 67 | | | (954) |
Other comprehensive earnings (loss) before reclassifications | | | 19 | | | 158 | | | 156 | | | 333 |
Reclassification of net deferred (gains) losses into earnings | | | — | | | 139 | | | (100) | | | 39 |
Balance at December 31, 2021 | | $ | (536) | | $ | (169) | | $ | 123 | | $ | (582) |
The following table provides additional details of the amounts recognizedreclassified into net earnings from accumulated other comprehensive earnings (loss):
| | | | | | | | | |
| | Years Ended December 31, |
($ in millions) | | 2021 | | 2020 | | 2019 |
| | | | | | | | | |
Gains (losses) on cash flow hedges: | | | | | | | | | |
Commodity contracts recorded in net sales | | $ | (121) | | $ | 22 | | $ | 18 |
Commodity contracts recorded in cost of sales | | | 153 | | | (65) | | | (45) |
Currency exchange contracts recorded in selling, general and administrative | | | 90 | | | (54) | | | 7 |
Cross-currency swaps recorded in selling, general and administrative | | | — | | | (2) | | | 35 |
Interest rate contracts recorded in interest expense | | | (2) | | | (8) | | | 13 |
Total before tax effect | | | 120 | | | (107) | | | 28 |
Tax benefit (expense) on amounts reclassified into earnings | | | (20) | | | 24 | | | (6) |
Recognized gain (loss), net of tax | | $ | 100 | | $ | (83) | | $ | 22 |
| | | | | | | | | |
Amortization of pension and other postretirement benefits: (a) | | | | | | | | | |
Actuarial gains (losses) | | $ | (47) | | $ | (39) | | | (14) |
Prior service income (expense) | | | (2) | | | (2) | | | (2) |
Effect of pension settlements | | | (135) | | | (120) | | | (8) |
Total before tax effect | | | (184) | | | (161) | | | (24) |
Tax benefit (expense) on amounts reclassified into earnings | | | 45 | | | 40 | | | 6 |
Recognized gain (loss), net of tax | | $ | (139) | | $ | (121) | | $ | (18) |
| | | | | | | | | |
| | Years Ended December 31, |
($ in millions) | | 2017 | | 2016 | | 2015 |
| | | | | | | | | |
Gains (losses) on cash flow hedges: | | | | | | | | | |
Commodity contracts recorded in net sales | | $ | (7) | | $ | (1) | | $ | 5 |
Commodity contracts recorded in cost of sales | | | 50 | | | (7) | | | (23) |
Currency exchange contracts recorded in selling, general and administrative | | | (1) | | | 4 | | | 2 |
Currency exchange contracts recorded in business consolidation and other activities | | | — | | | 64 | | | — |
Cross-currency swaps recorded in selling, general and administrative | | | (136) | | | — | | | — |
Cross-currency swaps recorded in interest expense | | | 16 | | | — | | | — |
Interest rate contracts recorded in interest expense | | | — | | | (1) | | | — |
Commodity and currency exchange contracts attributable to the Divestment Business recorded in business consolidation and other activities | | | — | | | (5) | | | — |
Total before tax effect | | | (78) | | | 54 | | | (16) |
Tax benefit (expense) on amounts reclassified into earnings | | | 13 | | | 2 | | | 6 |
Recognized gain (loss) | | $ | (65) | | $ | 56 | | $ | (10) |
| | | | | | | | | |
Amortization of pension and other postretirement benefits: (a) | | | | | | | | | |
Prior service income (expense) | | $ | (1) | | $ | 2 | | $ | 1 |
Actuarial gains (losses) | | | (34) | | | (35) | | | (48) |
Effect of pension settlement (b) | | | (44) | | | (80) | | | — |
Total before tax effect | | | (79) | | | (113) | | | (47) |
Tax benefit (expense) on amounts reclassified into earnings | | | 30 | | | 31 | | | 17 |
Recognized gain (loss) | | $ | (49) | | $ | (82) | | $ | (30) |
| (a) | (a)
| | These components are included ininclude the computation of net periodic benefit cost includeddetailed in Note 15. 17. |
| (b)
| | 2017 includes a pretax settlement loss related to the purchase of non-participating group annuity contracts and lump sum payouts. 2016 includes a curtailment charge related to the sale of the Divestment Business. Refer to Note 15 for further details.
|
Noncontrolling Interest
In 2015, Ball acquired the remaining interests in its Latapack-Ball joint venture in Brazil for consideration of approximately 11.4 million treasury shares of Ball common stock, on a post-split basis, valued at $403 million, and $17 million in cash. The accounting guidance requires changes in noncontrolling interests that do not result in a change of control to be recorded as an equity transaction. Where there is a difference between the fair value of consideration paid and the carrying value of the noncontrolling interest, it is recorded to common stock. The difference of $220 million between the noncontrolling interest carrying value of $200 million at the time of acquisition and the fair value of the consideration paid of $420 million was recorded as a decrease to common stock. The acquisition of the joint venture company was completed in December 2015, and Latapack-Ball is a wholly owned subsidiary of Ball Corporation.
17.19. Stock-Based Compensation Programs
The company has shareholder-approved stock plans under which options and stock-settled appreciation rights (SSARs) have been granted to employees at the market value of the company’s stock on the date of grant. In the case of stock options, payment must be made by the employee at the time of exercise in cash or with shares of stock owned by the employee, which are valued at fair market value on the date exercised. For SSARs, the employee receives the share equivalent of the difference between the fair market value on the date exercised and the exercise price of the SSARs exercised. In general, options and SSARs are exercisable in four4 equal installments commencing one year from the date of grant and terminating 10 years from the date of grant. A summary of outstanding stock option and SSAR activity for the year ended December 31, 2017,2021, follows:
| | | | | |
| | |
| | Number of | | Weighted Average |
| | Shares | | Exercise Price |
Beginning of year (a) | | 17,346,382 | | $ | 21.29 |
Granted | | 2,383,208 | | | 37.95 |
Exercised | | (2,564,761) | | | 16.13 |
Canceled/forfeited | | (257,530) | | | 33.88 |
End of period | | 16,907,299 | | | 24.21 |
| | | | | |
Vested and exercisable, end of period | | 11,414,125 | | $ | 19.24 |
Reserved for future grants | | 25,404,206 | | | |
| (a)
| | Amounts have been retrospectively adjusted for the two-for-one stock split that was effective on May 16, 2017.
|
| | | | | |
| | |
| | Number of | | Weighted Average |
| | Shares | | Exercise Price |
Beginning of year | | 10,113,396 | | $ | 40.40 |
Granted | | 1,193,934 | | | 85.52 |
Exercised | | (1,441,190) | | | 33.07 |
Canceled/forfeited | | (100,044) | | | 73.65 |
End of period | | 9,766,096 | | | 46.66 |
| | | | | |
Vested and exercisable, end of year | | 6,500,576 | | $ | 36.04 |
Reserved for future grants | | 14,793,877 | | | |
The weighted average remaining contractual term for all options and SSARs outstanding at December 31, 2017,2021, was 5.25.5 years and the aggregate intrinsic value (difference in exercise price and closing price at that date) was $231$485 million. The weighted average remaining contractual term for options and SSARs vested and exercisable at December 31, 2017,2021, was 3.84.3 years and the aggregate intrinsic value was $212$392 million. The company received $21$33 million, $36$38 million and $22$41 million from options and SSARs exercised during 2017, 20162021, 2020 and 2015,2019, respectively, and the intrinsic value associated with these exercises was $26$84 million, $45$230 million and $33$61 million for the same periods, respectively. The excess tax benefit associated with the company’s stock compensation programs was $20$19 million for 2017,2021, and was reported as a discrete item in the consolidated tax provision. The total fair value of options and SSARs vested during 2017, 20162021, 2020 and 20152019 was $14$18 million, $13$17 million and $12$16 million, respectively.
These options and SSARs cannot be traded in any equity market. However, basedBased on the Black-Scholes option pricing model, options and SSARs granted in April 2017, January 2017, July 2016, January 20162021, 2020 and February 20152019 have estimated weighted average fair values at the date of grant of $7.21$19.86 per share, $8.54 per share, $8.35 per share, $9.29$15.36 per share and $7.10$12.26 per share, respectively. The actual value an employee may realize will depend on the excess of the stock price over the exercise price on the date the option or SSAR is exercised. Consequently, there is no assurance that the value realized by an employee will equal the fair value estimated at the grant date. The fair values were estimated using the following weighted average assumptions:
| | | | | | | | |
| | 2017 Grants | | 2016 Grants | | 2015 Grants | | |
| | | | | | | | |
| | | | | | | | |
| | | 2021 Grants | | 2020 Grants | | 2019 Grants | |
| | | | | | | | |
Expected dividend yield | | 0.89 | % | 0.73 | % | 0.79 | % | | 0.70 | % | 0.83 | % | 0.79 | % |
Expected stock price volatility | | 19.62 | % | 24.14 | % | 22.11 | % | | 25.08 | % | 20.84 | % | 20.36 | % |
Risk-free interest rate | | 2.00 | % | 1.22 | % | 1.39 | % | | 0.61 | % | 1.47 | % | 2.59 | % |
Expected life of options (in years) | | 5.94 | years | 6.10 | years | 5.85 | years | | 6.25 | years | 6.40 | years | 6.40 | years |
In addition to stock options and SSARs, the company issues to certain employees restricted shares and restricted stock units, which vest over various periods. Other than the performance-contingent grants discussed below, suchSuch restricted
shares and restricted stock units generally vest in equal installments over five years. Compensation cost is recorded based upon
Table of Contents
Ball Corporation
Notes to the fair value of the shares at the grant date.Consolidated Financial Statements
Following is a summary of restricted stock activity for the year ended December 31, 2017:2021:
| | | | | |
| | | | Weighted |
| | Number of | | Average |
| | Shares/Units | | Grant Price |
| | | | | |
Beginning of year (a) | | 2,036,122 | | $ | 27.81 |
Granted | | 1,958,320 | | | 36.10 |
Vested | | (597,222) | | | 25.27 |
Canceled/forfeited | | (173,126) | | | 36.95 |
End of period | | 3,224,094 | | $ | 32.82 |
| (a)
| | Amounts have been retrospectively adjusted for the two-for-one stock split that was effective on May 16, 2017.
|
| | | | | |
| | | | Weighted |
| | Number of | | Average |
| | Shares/Units | | Grant Price |
| | | | | |
Beginning of year | | 1,267,952 | | $ | 42.78 |
Granted | | 376,035 | | | 88.53 |
Vested | | (380,103) | | | 41.37 |
Canceled/forfeited | | (17,480) | | | 69.10 |
End of year | | 1,246,404 | | $ | 56.64 |
The company’s Board of Directors granted 237,452, 265,636 and 233,118 performance-contingent restricted stock units (PCEQs) to key employees in 2017, 2016 and 2015, respectively. These PCEQs vest three years from the date of grant, and the number of shares available at the vesting date are based on the company’s increase in economic valued added (EVA®) dollars compared to the EVA® dollars generated in the calendar year prior to the grant and ranging from zero to 200 percent of each participant’s assigned award opportunity. If the minimum performance goals are not met, the shares will be forfeited. Grants under the plan are being accounted for as equity awards and compensation expense is recorded based upon the most probable outcome using the closing market price of the shares at the grant date. On a quarterly basis, the company reassesses the probability of the goals being met and adjusts compensation expense as appropriate. The expense associated with the performance-contingent grants, recognized in selling, general and administrative expenses, totaled $9 million in 2017, $15 million in 2016, and $7 million in 2015.
Also during 2017, the company’s Board of Directors granted 1.1 million performance-contingent restricted stock units (on a post-stock split basis) to employees related to the Special Acquisition-Related Incentive Plan (SAIP). The number of shares issued at the vesting date in January 2020 will be based on the company’s achievement of cumulative EVA® and Cash Flow performance goals through the vesting date and can range from zero to 200 percent of each participant’s assigned award. If the minimum performance goals are not met, the awards will be forfeited. Grants under the plan are being accounted for as equity awards and compensation expense is recorded based upon the most probable outcome using the closing market price of the shares at the grant date. On a quarterly basis, the company reassesses the probability of the goals being met and adjusts compensation expense as appropriate. The company recorded expense, recognized in business consolidation and other activities, of $11 million during 2017 in connection with the SAIP.
For the years ended December 31, 2017, 20162021, 2020 and 2015,2019, the company recognized pretax expense of $46$40 million ($35 million after tax), $35$43 million ($2237 million after tax) and $25$37 million ($1533 million after tax), respectively, for all of its share-based compensation arrangements. At December 31, 2017,2021, there was $89$64 million of total unrecognized compensation cost related to nonvested share‑basedshare-based compensation arrangements. This cost is expected to be recognized in earnings over a weighted average period of 2.32.4 years.
18.20. Earnings Per Share
| | | | | | | | | |
| | Years Ended December 31, |
($ in millions, except per share amounts; shares in thousands) | | 2017 | | 2016 | | 2015 |
| | | | | | | | | |
Net earnings attributable to Ball Corporation | | $ | 374 | | $ | 263 | | $ | 281 |
| | | | | | | | | |
Basic weighted average common shares (a) | | | 350,269 | | | 316,542 | | | 274,600 |
Effect of dilutive securities (a) | | | 6,716 | | | 6,342 | | | 7,368 |
Weighted average shares applicable to diluted earnings per share (a) | | | 356,985 | | | 322,884 | | | 281,968 |
| | | | | | | | | |
Per basic share (a) | | $ | 1.07 | | $ | 0.83 | | $ | 1.02 |
Per diluted share (a) | | $ | 1.05 | | $ | 0.81 | | $ | 1.00 |
| (a)
| | Amounts have been retrospectively adjusted for the two-for-one stock split that was effective on May 16, 2017.
|
| | | | | | | | | |
| | Years Ended December 31, |
($ in millions, except per share amounts; shares in thousands) | | 2021 | | 2020 | | 2019 |
| | | | | | | | | |
Net earnings attributable to Ball Corporation | | $ | 878 | | $ | 585 | | $ | 566 |
| | | | | | | | | |
Basic weighted average common shares | | | 325,989 | | | 326,260 | | | 331,102 |
Effect of dilutive securities | | | 5,626 | | | 6,555 | | | 9,019 |
Weighted average shares applicable to diluted earnings per share | | | 331,615 | | | 332,815 | | | 340,121 |
| | | | | | | | | |
Per basic share | | $ | 2.69 | | $ | 1.79 | | $ | 1.71 |
Per diluted share | | $ | 2.65 | | $ | 1.76 | | $ | 1.66 |
Certain outstanding options and SSARs were excluded from the diluted earnings per share calculation because they were anti-dilutive (i.e., the sum of the proceeds, including the unrecognized compensation, and windfall tax benefits, exceeded the average closing stock price for the period). The excluded options and SSARs excluded totaled approximately 21 million for the years ended December 31, 2021 and 2020. There were no anti-dilutive options for the year ended December 31, 2019.
The company declared and paid dividends of $0.70 per share in each2021, $0.60 per share in 2020 and $0.55 per share in 2019.
21. Financial Instruments and Risk Management
Policies and Procedures
The company employs established risk management policies and procedures, which seek to reduce the company’s commercial risk exposure to fluctuations in commodity prices, interest rates, currency exchange rates and prices of the company’s common stock with regard to common share repurchases and the company’s deferred compensation stock plan. However, there can be no assurance that these policies and procedures will be successful. Although the instruments utilized involve varying degrees of credit, market and interest risk, the counterparties to the agreements are expected to perform fully under the terms of the agreements. The company monitors counterparty credit risk, including lenders, on a regular basis, but Ball cannot be certain that all risks will be discerned or that its risk management policies and procedures will always be effective. Additionally, in the event of default under the company’s master derivative agreements, the non-defaulting party has the option to set-offoffset any amounts owed with regard to open derivative positions.
Commodity Price Risk
Aluminum
- The company manages commodity price risk in connection with market price fluctuations of aluminum ingot through two2 different methods. First, the company enters into container sales contracts that include aluminum ingot-basedaluminum-based pricing terms thatwhich generally reflect the same price fluctuations under commercial purchase contracts for aluminum sheet. The terms include fixed, floating or pass-throughpass through aluminum ingot component pricing. Second, the company uses certain derivative instruments, such asincluding option and forward contracts, as economic and cash flow hedges of commodity price risk where there are material differences between sales and purchase contracted pricing and volume.
At December 31, 2017, the company had aluminum contracts limiting its aluminum exposure with notional amounts of approximately $581 million, of which approximately $506 million received hedge accounting treatment. The aluminum contracts, which are recorded at fair value, include economic derivative instruments that are undesignated, as well as cash flow hedges that offset sales and purchase contracts of various terms and lengths. Cash flow hedges relate to
forecasted transactions that expire within the next two years. Included in shareholders’ equity at December 31, 2017, within accumulated other comprehensive earnings is a net after-tax gain of $36 million associated with these contracts. A net gain of $32 million is expected to be recognized in the consolidated statement of earnings during the next 12 months, the majority of which will be offset by pricing changes in sales and purchase contracts, thus resulting in little or no earnings impact to Ball.
Steel
Most sales contracts involving our steel products either include provisions permitting the company to pass through some or all steel cost changes incurred, or they incorporate annually negotiated steel prices.
Interest Rate Risk
- The company’s objective in managing exposure to interest rate changes is to minimize the impact of interest rate changes on earnings and cash flows and to lower ourits overall borrowing costs. To achieve these objectives, the company may use a variety of interest rate swaps, collars and options to manage ourits mix of floating and fixed-rate debt. At December 31, 2017, the company had outstanding interest rate swap and option contracts with notional amounts of approximately $1.7 billion paying fixed rates expiring within the next two years. The amount recorded in accumulated other comprehensive earnings at December 31, 2017, is insignificant.
Currency Exchange Rate Risk
- The company’s objective in managing exposure to currency fluctuations is to limit the exposure of cash flows and earnings from changes associated with currency exchange rate changes through the use of various derivative contracts. In addition, at times the company manages earnings translation volatility through the use of currency option strategies, and the change in the fair value of those options is recorded in the company’s net earnings.
The company’s currency translation risk results from the currencies in which we transact business. The company faces currency exposures in its global operations as a result of various factors including intercompany currency denominated loans, selling our products in various currencies, purchasing raw materials and equipment in various currencies and tax exposures not denominated in the functional currency. Sales contracts are negotiated with customers to reflect cost changes and, where there is not an exchange pass-through arrangement, the company uses forward and option contracts to manage currency exposures. At December 31, 2017, the company had outstanding exchange forward contracts and option contracts with notional amounts totaling approximately $2.3 billion. Approximately $4 million of net after-tax gain related to these contracts is included in accumulated other comprehensive earnings at December 31, 2017, substantially all of which is expected to be recognized in the consolidated statement of earnings during the next 12 months. The contracts outstanding at December 31, 2017, expire within the next year.
Additionally, the company entered into a $1 billion cross-currency swap contract to partially mitigate the risk on foreign currency denominated intercompany debt in the second quarter of 2016. Approximately $27 million of net after-tax lossfollowing table provides additional information related to the intercompany debt is included in accumulated other comprehensive earnings at December 31, 2017, nonecommercial risk management instruments described above:
| | | | | | | | |
($ in millions) | December 31, 2021 |
Commercial risk area | Commodity | | Currency | | Interest Rate |
| | | | | | | | |
Notional amount of contracts | $ | 1,882 | (a) | $ | 2,761 | | $ | 1,182 |
Net gain (loss) included in AOCI, after-tax | | 106 | (b) | | 17 | | | — |
Net gain (loss) included in AOCI, after-tax, expected to be recognized in net earnings within the next 12 months | | 104 | (b) | | 17 | | | — |
| | | | | | | | |
Longest duration of forecasted cash flow hedge transactions in years | | 2 | | | 3 | | | 2 |
| (a) | Substantially all aluminum contracts received hedge accounting treatment as of December 31, 2021. |
| (b) | Substantially all of this gain (loss) will be offset by pricing changes in sales and purchase contracts. |
Table of which is expectedContents
Ball Corporation
Notes to be recognized in the consolidated statement of earnings during the next 12 months. As of December 31, 2017, the fair value of the cross-currency swap was a $117 million loss. The contract expires within the next three years.Consolidated Financial Statements
Common Stock Price Risk
The company’s deferred compensation stock program is subject to variable plan accounting and, accordingly, is marked to fair value using the company’s closing stock price at the end of the related reporting period. The company entered into total return swaps to reduce the company’s earnings exposure to these fair value fluctuations that will be outstanding through March 2019May 2022, and thatwhich have a combined notional value of 2.72.6 million shares. Based on the current number of
shares in the program, each $1 change in the company’s stock price haswould have an insignificant impact on pretax earnings, net of the impact of related derivatives. As of December 31, 2017, the fair value of the swaps was a $5 million loss.
Collateral Calls
The company’s agreements with its financial counterparties require the company to post collateral in certain circumstances when the negative mark to fair value of the contracts exceeds specified levels. Additionally, the company has collateral posting arrangements with certain customers on these derivative contracts. The cash flows of the margin calls are shown within the investing section of the company’s consolidated statements of cash flows. As of December 31, 20172021 and 2016,2020, the aggregate fair value of all derivative instruments with credit-risk-related contingent features that were inwas a net liability position was $27of $3 million and $44$52 million, respectively, and no0 collateral was required to be posted.
Fair Value Measurements
Ball has classified all applicable financial derivative assets and liabilities as Level 2 within the fair value hierarchy as of December 31, 20172021 and 2016,2020, and presented those values in the table below. The company’s assessment of the significance of a particular input to the fair value measurement requires judgment and may affect the valuation of fair value assets and liabilities and their placement within the fair value hierarchy levels.
| | | | | | | | | | |
| | | December 31, 2021 |
($ in millions) | Balance Sheet Location | | Derivatives
Designated
as Hedging
Instruments | | Derivatives not
Designated as
Hedging
Instruments | | Total |
| | | | | | | | | | |
Assets: | | | | | | | | | | |
Commodity contracts | | | $ | 142 | | $ | — | | $ | 142 |
Currency contracts | | | | 2 | | | 19 | | | 21 |
Other contracts | | | | 1 | | | 6 | | | 7 |
Total current derivative contracts | Other current assets | | $ | 145 | | $ | 25 | | $ | 170 |
| | | | | | | | | | |
Commodity contracts | | | $ | 3 | | $ | — | | $ | 3 |
Currency contracts | | | | 59 | | | 1 | | | 60 |
Total noncurrent derivative contracts | Other noncurrent assets | | $ | 62 | | $ | 1 | | $ | 63 |
| | | | | | | | | | |
Liabilities: | | | | | | | | | | |
Commodity contracts | | | $ | 20 | | $ | — | | $ | 20 |
Currency contracts | | | | — | | | 8 | | | 8 |
Other contracts | | | | — | | | 1 | | | 1 |
Total current derivative contracts | Other current liabilities | | $ | 20 | | $ | 9 | | $ | 29 |
| | | | | | | | | | |
Currency contracts | | | $ | — | | $ | 3 | | $ | 3 |
Total noncurrent derivative contracts | Other noncurrent liabilities | | $ | — | | $ | 3 | | $ | 3 |
| | | | | | | | | | | | | | | | | | |
| | December 31, 2017 | | December 31, 2016 |
($ in millions) | | Derivatives
Designated
as Hedging
Instruments | | Derivatives not
Designated as
Hedging
Instruments | | Total | | Derivatives
Designated
as Hedging
Instruments | | Derivatives not
Designated as
Hedging
Instruments | | Total |
| | | | | | | | | | | | | | | | | | |
Assets: | | | | | | | | | | | | | | | | | | |
Commodity contracts | | $ | 46 | | $ | 3 | | $ | 49 | | $ | 17 | | $ | 1 | | $ | 18 |
Foreign currency contracts | | | 5 | | | 10 | | | 15 | | | 1 | | | — | | | 1 |
Interest rate and other contracts | | | — | | | — | | | — | | | — | | | 21 | | | 21 |
Total current derivative contracts | | $ | 51 | | $ | 13 | | $ | 64 | | $ | 18 | | $ | 22 | | $ | 40 |
| | | | | | | | | | | | | | | | | | |
Commodity contracts | | $ | 6 | | $ | — | | $ | 6 | | $ | 7 | | $ | — | | $ | 7 |
Interest rate and other contracts | | | — | | | — | | | — | | | 39 | | | — | | | 39 |
Total noncurrent derivative contracts | | $ | 6 | | $ | — | | $ | 6 | | $ | 46 | | $ | — | | $ | 46 |
| | | | | | | | | | | | | | | | | | |
Liabilities: | | | | | | | | | | | | | | | | | | |
Commodity contracts | | $ | 4 | | $ | 4 | | $ | 8 | | $ | 3 | | $ | — | | $ | 3 |
Foreign currency contracts | | | — | | | 21 | | | 21 | | | — | | | 22 | | | 22 |
Interest rate and other contracts | | | — | | | 2 | | | 2 | | | — | | | — | | | — |
Total current derivative contracts | | $ | 4 | | $ | 27 | | $ | 31 | | $ | 3 | | $ | 22 | | $ | 25 |
| | | | | | | | | | | | | | | | | | |
Interest rate and other contracts | | $ | 117 | | $ | 3 | | $ | 120 | | $ | — | | $ | — | | $ | — |
Total noncurrent derivative contracts | | $ | 117 | | $ | 3 | | $ | 120 | | $ | — | | $ | — | | $ | — |
87
| | | | | | | | | | |
| | | December 31, 2020 |
| | | Derivatives
Designated
as Hedging
Instruments | | Derivatives not
Designated as
Hedging
Instruments | | Total |
| | | | | | | | | | |
Assets: | | | | | | | | | | |
Commodity contracts | | | $ | 50 | | $ | — | | $ | 50 |
Currency contracts | | | | 3 | | | 27 | | | 30 |
Other contracts | | | | — | | | 2 | | | 2 |
Total current derivative contracts | Other current assets | | $ | 53 | | $ | 29 | | $ | 82 |
| | | | | | | | | | |
Commodity contracts | | | $ | 8 | | $ | — | | $ | 8 |
Total noncurrent derivative contracts | Other noncurrent assets | | $ | 8 | | $ | — | | $ | 8 |
| | | | | | | | | | |
Liabilities: | | | | | | | | | | |
Commodity contracts | | | $ | 17 | | $ | — | | $ | 17 |
Currency contracts | | | | — | | | 63 | | | 63 |
Other contracts | | | | — | | | 4 | | | 4 |
Total current derivative contracts | Other current liabilities | | $ | 17 | | $ | 67 | | $ | 84 |
| | | | | | | | | | |
Currency contracts | | | $ | 8 | | $ | 2 | | $ | 10 |
Total noncurrent derivative contracts | Other noncurrent liabilities | | $ | 8 | | $ | 2 | | $ | 10 |
The company uses closing spot and forward market prices as published by the London Metal Exchange, the Chicago Mercantile Exchange, Reuters and Bloomberg to determine the fair value of any outstanding aluminum, currency, energy, inflation and interest rate spot and forward contracts. Option contracts are valued using a Black-Scholes model with observable market inputs for aluminum, currency and interest rates. We valueThe company values each of ourits financial instruments either internally using a single valuation technique, or from a reliable observable market source.source or from third-party software. The company does not adjust the value of its financial instruments except in determining the fair value of a trade that settles in the future by
discounting the value to itsfuture. The present value usingdiscounting factor is based on the comparable time period LIBOR rate or 12-month LIBOR as the discount factor.LIBOR. Ball performs validations of ourthe company’s internally derived fair values reported for ourthe company’s financial instruments on a quarterly basis utilizing counterparty valuation statements. The company additionally evaluates counterparty creditworthiness and, as of December 31, 2017,2021, has not identified any circumstances requiring that the reported values of ourthe company’s financial instruments be adjusted.
The following tables provide the effects of derivative instruments in the consolidated statement of earnings and on accumulated other comprehensive earnings (loss):
| | | | | | | | | | |
| | | | | |
| | | | Year Ended December 31, 2017 | | |
| | | | | | | | | | |
| | | | | | |
| | | | | | Year Ended December 31, 2021 |
($ in millions) | | Location of Gain (Loss)
Recognized in Earnings
on Derivatives | | Cash Flow
Hedge -
Reclassified
Amount from
Accumulated
Other
Comprehensive
Earnings (Loss) | | Gain (Loss) on
Derivatives not
Designated as
Hedge
Instruments | | | Location of Gain (Loss)
Recognized in Earnings
on Derivatives | | | Cash Flow
Hedge -
Reclassified
Amount from
Accumulated
Other
Comprehensive
Earnings (Loss) | | Gain (Loss) on
Derivatives not
Designated as
Hedge
Instruments |
| | | | | | | | | | |
| | | | | | | | | | |
Commodity contracts - manage exposure to customer pricing | | Net sales | | $ | (7) | | $ | (4) | | | Net sales | | | $ | (121) | | $ | — |
Commodity contracts - manage exposure to supplier pricing | | Cost of sales | | | 50 | | | (5) | | | Cost of sales | | | | 153 | | | 18 |
Foreign currency contracts - manage general exposure with the business | | Selling, general and administrative | | | (1) | | | (57) | | |
Cross-currency swaps - manage intercompany currency exposure within the business | | Selling, general and administrative | | | (136) | | | — | | |
Cross-currency swaps - manage intercompany currency exposure within the business | | Interest expense | | | 16 | | | — | | |
Interest rate contracts - manage exposure for outstanding debt | | | Interest expense | | | | (2) | | | — |
Currency contracts - manage currency exposure | | | Selling, general and administrative | | | | 90 | | | 56 |
Equity contracts | | Selling, general and administrative | | | — | | | (1) | | | Selling, general and administrative | | | | — | | | 5 |
Total | | | | $ | (78) | | $ | (67) | | | | | | $ | 120 | | $ | 79 |
| | | | | | | | | |
| | | | | Year Ended December 31, 2020 |
($ in millions) | | Location of Gain (Loss)
Recognized in Earnings
on Derivatives | | | Cash Flow
Hedge -
Reclassified
Amount from
Accumulated
Other
Comprehensive
Earnings (Loss) | | Gain (Loss) on
Derivatives not
Designated as
Hedge
Instruments |
| | | | | | | | | |
Commodity contracts - manage exposure to customer pricing | | Net sales | | | $ | 22 | | $ | 1 |
Commodity contracts - manage exposure to supplier pricing | | Cost of sales | | | | (65) | | | (1) |
Interest rate contracts - manage exposure for outstanding debt | | Interest expense | | | | (8) | | | — |
Currency contracts - manage currency exposure | | Selling, general and administrative | | | | (54) | | | (17) |
Cross-currency swaps - manage intercompany currency exposure | | Selling, general and administrative | | | | (2) | | | — |
Equity contracts | | Selling, general and administrative | | | | — | | | 76 |
Total | | | | | $ | (107) | | $ | 59 |
| | | | | | | | | |
| | | | | | | | | |
| | | | Year Ended December 31, 2016 | |
($ in millions) | | Location of Gain (Loss)
Recognized in Earnings
on Derivatives | | Cash Flow
Hedge -
Reclassified
Amount from
Accumulated
Other
Comprehensive
Earnings (Loss) | | Gain (Loss) on
Derivatives not
Designated as
Hedge
Instruments | |
| | | | | | | | | |
Commodity contracts - manage exposure to customer pricing | | Net sales | | $ | (1) | | $ | — | |
Commodity contracts - manage exposure to supplier pricing | | Cost of sales | | | (7) | | | (4) | |
Interest rate contracts - manage exposure for outstanding debt | | Interest expense | | | (1) | | | — | |
Interest rate contracts - manage exposure for forecasted Rexam financing | | Debt refinancing and other costs | | | — | | | (20) | |
Foreign currency contracts - manage exposure to sales of products | | Cost of sales | | | 1 | | | 1 | |
Foreign currency contracts - manage general exposure with the business | | Selling, general and administrative | | | 3 | | | 53 | |
Foreign currency contracts - manage exposure for acquisition of Rexam | | Business consolidation and other activities | | | — | | | (191) | |
Cross-currency swaps - manage exposure for acquisition of Rexam | | Business consolidation and other activities | | | — | | | (4) | |
Cross-currency swaps - manage intercompany currency exposure within the business | | Selling, general and administrative | | | 64 | | | — | |
Commodity contracts and currency exchange contracts - attributed to the Divestment Business | | Business consolidation and other activities | | | (5) | | | — | |
Equity contracts | | Selling, general and administrative | | | — | | | (1) | |
Total | | | | $ | 54 | | $ | (166) | |
| | | | | | | | | |
| | | | | | | | | |
| | | | | Year Ended December 31, 2019 |
($ in millions) | | Location of Gain (Loss)
Recognized in Earnings
on Derivatives | | | Cash Flow
Hedge -
Reclassified
Amount from
Accumulated
Other
Comprehensive
Earnings (Loss) | | Gain (Loss) on
Derivatives not
Designated as
Hedge
Instruments |
| | | | | | | | | |
Commodity contracts - manage exposure to customer pricing | | Net sales | | | $ | 18 | | $ | — |
Commodity contracts - manage exposure to supplier pricing | | Cost of sales | | | | (45) | | | 2 |
Interest rate contracts - manage exposure for outstanding debt | | Interest expense | | | | 13 | | | — |
Currency contracts - manage currency exposure | | Selling, general and administrative | | | | 7 | | | 111 |
Cross-currency swaps - manage intercompany currency exposure | | Selling, general and administrative | | | | 35 | | | — |
Equity contracts | | Selling, general and administrative | | | | — | | | 46 |
Total | | | | | $ | 28 | | $ | 159 |
| | | | | | | | | |
Table of Contents
Ball Corporation
Notes to the Consolidated Financial Statements
| | | | | | | | | |
| | | | Year Ended December 31, 2015 | |
($ in millions) | | Location of Gain (Loss)
Recognized in Earnings
on Derivatives | | Cash Flow
Hedge -
Reclassified
Amount from
Accumulated
Other
Comprehensive
Earnings (Loss) | | Gain (Loss) on
Derivatives not
Designated as
Hedge
Instruments | |
| | | | | | | | | |
Commodity contracts - manage exposure to customer pricing | | Net sales | | $ | 5 | | $ | 1 | |
Commodity contracts - manage exposure to supplier pricing | | Cost of sales | | | (23) | | | (5) | |
Interest rate contracts - manage exposure for forecasted Rexam financing | | Debt refinancing and other costs | | | — | | | (16) | |
Foreign currency contracts - manage exposure to sales of products | | Cost of sales | | | — | | | 2 | |
Foreign currency contracts - manage general exposure with the business | | Selling, general and administrative | | | 2 | | | (7) | |
Foreign currency contracts - manage exposure for acquisition of Rexam | | Business consolidation and other activities | | | — | | | (41) | |
Cross-currency swaps - manage exposure for acquisition of Rexam | | Business consolidation and other activities | | | — | | | (7) | |
Equity contracts | | Selling, general and administrative | | | — | | | 4 | |
Total | | | | $ | (16) | | $ | (69) | |
| | | | | | | | | |
The changes in accumulated other comprehensive earnings (loss) for effective derivatives were as follows:
| | | | | | | | | | |
| | Years Ended December 31, | |
| | | | | | | | | | |
| | | Years Ended December 31, |
($ in millions) | | 2017 | | 2016 | | 2015 | | 2021 | | 2020 | | 2019 |
| | | | | | | | | | |
| | | | | | | | | | |
Amounts reclassified into earnings: | | | | | | | | | | | | | | | | | | |
Commodity contracts | | $ | (43) | | $ | 8 | | $ | 18 | | $ | (32) | | $ | 43 | | $ | 27 |
Cross-currency swap contracts | | | 120 | | | (64) | | | — | | | — | | | 2 | | | (35) |
Interest rate contracts | | | — | | | 1 | | | — | | | 2 | | | 8 | | | (13) |
Commodity and currency exchange contracts attributed to the divestment business | | | — | | | 5 | | | — | |
Currency exchange contracts | | | 1 | | | (4) | | | (2) | | | (90) | | | 54 | | | (7) |
Change in fair value of cash flow hedges: | | | | | | | | | | | | | | | | | | |
Commodity contracts | | | 67 | | | 22 | | | (29) | | | 122 | | | 21 | | | (10) |
Interest rate contracts | | | — | | | (1) | | | — | | | — | | | (5) | | | 1 |
Cross-currency swap contracts | | | (137) | | | 39 | | | — | | | — | | | 1 | | | 78 |
Currency exchange contracts | | | 7 | | | 3 | | | 4 | | | 68 | | | (22) | | | 17 |
Foreign currency and tax impacts | | | 20 | | | (19) | | | 1 | |
| | $ | 35 | | $ | (10) | | $ | (8) | |
Currency and tax impacts | | | | (14) | | | (23) | | | (13) |
Stranded tax effects reclassified into retained earnings: | | | | | | | | | | |
Commodity contracts | | | | — | | | — | | | 2 |
Cross-currency swap contracts | | | | — | | | — | | | (5) |
| | | $ | 56 | | $ | 79 | | $ | 42 |
22. Contingencies
20. Quarterly Results of Operations (Unaudited)
Set forth below are the company’s 2017 and 2016 results for the quarters ended March 31, June 30, September 30 and December 31.
| | | | | | | | | | | | | | | |
($ in millions, except per share amounts) | | First Quarter | | Second Quarter | | Third Quarter | | Fourth Quarter | | Total |
| | | | | | | | | | | | | | | |
2017 | | | | | | | | | | | | | | | |
Net sales | | $ | 2,473 | | $ | 2,855 | | $ | 2,908 | | $ | 2,747 | | $ | 10,983 |
Gross profit (a) | | | 390 | | | 431 | | | 455 | | | 481 | | | 1,757 |
Earnings before taxes | | $ | 84 | | $ | 112 | | $ | 50 | | $ | 268 | | $ | 514 |
Net earnings (loss) attributable to Ball Corporation | | $ | 68 | | $ | 99 | | $ | 48 | | $ | 159 | | $ | 374 |
| | | | | | | | | | | | | | | |
Basic earnings (loss) per share (b) (c) | | $ | 0.19 | | $ | 0.28 | | $ | 0.14 | | $ | 0.45 | | $ | 1.07 |
| | | | | | | | | | | | | | | |
Diluted earnings (loss) per share (b) (c) | | $ | 0.19 | | $ | 0.28 | | $ | 0.13 | | $ | 0.45 | | $ | 1.05 |
| | | | | | | | | | | | | | | |
| | First Quarter | | Second Quarter | | Third Quarter | | Fourth Quarter | | Total |
2016 | | | | | | | | | | | | | | | |
Net sales | | $ | 1,756 | | $ | 2,030 | | $ | 2,752 | | $ | 2,523 | | $ | 9,061 |
Gross profit (a) | | | 275 | | | 367 | | | 372 | | | 406 | | | 1,420 |
Earnings before taxes | | $ | (209) | | $ | 192 | | $ | 50 | | $ | 92 | | $ | 125 |
Net earnings attributable to Ball Corporation | | $ | (127) | | $ | 307 | | $ | 31 | | $ | 52 | | $ | 263 |
| | | | | | | | | | | | | | | |
Basic earnings per share (b) (c) | | $ | (0.45) | | $ | 1.08 | | $ | 0.09 | | $ | 0.15 | | $ | 0.83 |
| | | | | | | | | | | | | | | |
Diluted earnings per share (b) (c) | | $ | (0.45) | | $ | 1.06 | | $ | 0.09 | | $ | 0.15 | | $ | 0.81 |
| (a)
| | Gross profit is shown after depreciation and amortization related to cost of sales of $510 million and $345 million for the years ended December 31, 2017 and 2016, respectively.
|
| (b)
| | Earnings per share calculations for each quarter are based on the weighted average shares outstanding for that period. As a result, the sum of the quarterly amounts may not equal the annual earnings per share amount.
|
| (c)
| | Amounts in 2016 have been retrospectively adjusted for the two-for-one stock split that was effective on May 16, 2017.
|
The unaudited quarterly results of operations included business consolidation and other activities that affected the company’s operating performance. Further details are included in Note 5.
21. Contingencies
Ball is subject to numerous lawsuits, claims or proceedings arising out of the ordinary course of business, including actions related to product liability; personal injury; the use and performance of company products; warranty matters; patent, trademark or other intellectual property infringement; contractual liability; the conduct of the company’s business; tax reporting in domestic and foreignnon-U.S. jurisdictions; workplace safety and environmental and other matters. The company has also been identified as a potentially responsible party (PRP) at several waste disposal sites under U.S. federal and related state environmental statutes and regulations and may have joint and several liability for any investigation and remediation costs incurred with respect to such sites. In addition, we havethe company has received claims alleging that employees in certain plants have suffered damages due to exposure to alleged workplace hazards. Some of these lawsuits, claims and proceedings involve substantial amounts, including as described below, and some of the
environmental proceedings involve potential monetary costs or sanctions that may be material. Ball has denied liability with respect to many of these lawsuits, claims and proceedings and is vigorously defending such lawsuits, claims and proceedings. The company carries various forms of commercial, property and casualty, and other forms of insurance; however, such insurance may not be applicable or adequate to cover the costs associated with a judgment against Ball with respect to these lawsuits, claims and proceedings. The company estimates that potential liabilities for all currently known and estimable environmental matters are approximately $37$26 million in the aggregate, and such amounts have been included in other current liabilities and other noncurrent liabilities at December 31, 2017.2021.
As previously reported, the U.S. Environmental Protection Agency (USEPA) considers the company a PRP with respect to the Lowry Landfill site located east of Denver, Colorado. In 1992, the company was served with a lawsuit filed by the City and County of Denver (Denver) and Waste Management of Colorado, Inc., seeking contributions from the company and approximately 38 other companies. The company filed its answer denying the allegations of the complaint. Subsequently in 1992, the company was served with a third-party complaint filed by S.W. Shattuck Chemical Company, Inc., seeking contribution from the company and other companies for the costs associated with cleaning up the Lowry Landfill. The company denied the allegations of the complaint.
Also in 1992, Ball entered into a settlement and indemnification agreement with Chemical Waste Management, Inc., and Waste Management of Colorado, Inc. (collectively Waste Management) and Denver pursuant to which Waste Management and Denver dismissed their lawsuit against the company, and Waste Management agreed to defend, indemnify and hold harmless the company from claims and lawsuits brought by governmental agencies and other parties relating to actions seeking contributions or remedial costs from the company for the clean-up of the site. Waste Management, Inc., has agreed to guarantee the obligations of Waste Management. Waste Management and Denver may seek additional payments from the company if the response costs related to the site exceed $319 million. In 2003 Waste Management, Inc., indicated that the cost of the site might exceed $319 million in 2030, approximately three years before the projected completion of the project. In February 2018, Waste Management reported that total project costs through 2016 were approximately $142 million. The company might also be responsible for payments (based on 1992 dollars) for any additional wastes that may have been disposed of by the company at the site but which are identified after the execution of the settlement agreement. While remediating the site, contaminants were encountered, which could add an additional clean-up cost of approximately $10 million. This additional clean-up cost could, in turn, add approximately $1 million to total site costs for the PRP group. At this time, there are no Lowry Landfill actions in which the company is actively involved. Based on the information available to the company at this time, we do not believe that this matter will have a material adverse effect upon the liquidity, results of operations or financial condition of the company.
In November 2012, the USEPA wrote to the company asserting that it is one of at least 50 PRPs with respect to the Lower Duwamish site located in Seattle, Washington, based on the company’s ownership of a glass container plant prior to 1995, and notifying the company of a proposed remediation action plan. A site was selected to begin data review on over 30 industrial companies and government entities and at least two PRP groups have been discussing various allocation proposals. The USEPA issued the site Record of Decision (ROD) in December 2014. Ball submitted its initial responses to the allocator’s questionnaire in March 2015, and after reviewing submissions from the PRPs alleging deficiencies in certain of Ball’s responses, the allocator denied certain of the allegations and directed the company to answer others, to which Ball responded during the fourth quarter of 2016. A group of de minimis PRPs, including Ball, retained a technical consultant to assist with their positions vis-à-vis larger PRPs, and further presentations were made to the site allocator during the fourth quarter of 2017 and the first quarter of 2018. Total site remediation costs of $342 million, to cover remediation of approximately 200 acres of river bottom, are expected according to the proposed remediation action plan, which does not include $100 million that has already been spent, and which will be allocated among the numerous PRPs in due course. Based on the information available to the company at this time, we do not believe that this matter will have a material adverse effect upon the liquidity, results of operations or financial condition of the company.
In February 2012, Ball Metal Beverage Container Corp. (BMBCC) filed an action against Crown Packaging Technology, Inc. (Crown) in the U.S. District Court for the Southern District of Ohio (the Court) seeking a declaratory judgment that the manufacture, sale and use of certain ends by BMBCC and its customers do not infringe certain claims of Crown’s U.S. patents. Crown subsequently filed a counterclaim alleging infringement of certain claims in these patents seeking unspecified monetary damages, fees and declaratory and injunctive relief. The District Court issued a claim construction order at the end of December 2015 and held a scheduling conference on February 10, 2016, to determine the timeline for future steps in the litigation. The case was stayed by mutual agreement of the parties into the third quarter of 2016, during which Crown made preparations for its discovery with respect to certain ends previously produced by Rexam’s U.S. subsidiary, Rexam and suchBeverage Can Company (RBCC). Such discovery began during the first half of 2017.2017 and concluded in the fourth quarter of 2018. The parties attempted to mediate the case on August 1, 2017, but no progress was made, and the case continuescontinued as scheduled,scheduled. In December, 2018, BMBCC and RBCC filed a motion for summary judgment that the Crown patents at issue are invalid and that the applicable ends supplied by BMBCC and RBCC did not infringe the patents. Crown did not file a motion for summary judgment. On June 21, 2019, the District Court issued an order sustaining the BMBCC/RBCC motion as to invalidity, declining to rule on the other grounds as moot, and indicating that an expanded opinion and an appealable order would be forthcoming. The expanded opinion was docketed on July 22, 2019. The final, appealable order was issued by the Court on September 25, 2019, and the expanded opinion was unsealed. On October 22, 2019, Crown filed a Notice of Appeal of the decision of the Court to the Court of Appeals for the Federal Circuit. On December 31, 2020, the Court of Appeals vacated the decision of the District Court and remanded the case for further proceedings. The District Court held a telephonic hearing with discovery expectedcounsel for the parties in March 2021 to continue throughdiscuss the third quarterscope of 2018.the proceedings on remand and initial position statements regarding remand which was submitted by each party. The District Court also directed each party to submit a document in response to the initial position statements of the other party in April 2021. The parties submitted their position statements to the District Court on April 21, 2021. On August 25, 2021, the Court issued its order regarding the further proceedings permitting each party to submit supplemental expert reports and depositions of the experts. On September 9, 2021, the parties submitted a Submission Regarding Scheduling in which most issues were agreed, but the Court was requested to resolve a dispute regarding the process and timing for the submission of each expert’s report and the deposition of the experts. The Court has not yet responded to this filing and has not issued a schedule for proceedings on remand. Based on the information available to the company at the present time, the company does not believe that this matter will have a material adverse effect upon theits liquidity, results of operations or financial conditioncondition.
Table of Contents
Ball Corporation
Notes to the company.Consolidated Financial Statements
A former Rexam Personal Care site in Annecy, France, was found in 2003 to be contaminated following a leak of chlorinated solvents (TCE) from an underground feedline. The site underwent extensive investigation and an active remediation treatment system was put in place in 2006. The business operating from the site was sold to Albea in 2013 and in turn to a French company CATIDOM (operating as Reboul). Reboul vacated the site in September 2014, and the site reverted back to Rexam during the first quarter of 2015. As part of the site closure regulatory requirements, a new regulatory permit (Prefectoral Order) was issued in June 2016, which includes requirements to undertake a cost-benefit analysis and pilot studies of further treatment for the known residual solvent contamination following the shutdown of the current on-site treatment system. A new management plan will bewas proposed to the French Environmental Authorities (DREAL) during 2018. Tenders for the proposed remediation work were issued in 2020 and a preferred supplier of the remedial works has been identified. These proposed works are the subject of discussions taking place with the French environmental authorities before adoption of the final plan for the site and conduct of the remediation activity. Based on the information available to the company at this time, we dothe company does not believe that this matter will have a material adverse effect upon theits liquidity, results of operations or financial condition of the company.condition.
The company’s operations in Brazil are involved in various governmental assessments, principallywhich have historically mainly related to claims for taxes on the internal transfer of inventory, gross revenue taxes, and indirect tax incentives.incentives and deductibility of goodwill. In addition, 1 of the company’s Brazilian subsidiaries received an income tax assessment focused on the disallowance of deductions associated with the acquisition price paid to a third party for a portion of its operations. The company does not believe that the ultimate resolution of these matters will materially impact the company’sits results of operations, financial position or cash flows. Under customary local regulations, the company’s Brazilian subsidiaries may need to post cash or other collateral if the process to challenge any administrative assessment proceeds to the Brazilian court system; however, the level of any potential cash or collateral required would not significantly impact the liquidity of those subsidiaries or Ball Corporation.
During the first quarter of 2017, the Brazilian Supreme Court (the Court) ruled against the Brazilian tax authorities in a leading case related to the computation of certain indirect taxes. The Court ruled that the indirect tax base should not include a value-added tax known as “ICMS.” By removing the ICMS from the tax base, the Court effectively eliminated a “tax on tax.”
The Court decision, in principle, affects all applicable judicial proceedings in progress. However, after publication of the decision in October 2017, the Brazilian tax authorities filed an appeal seeking clarification of certain matters, including the amount of ICMS to which taxpayers would be entitled in order to reduce their indirect tax base (i.e., the gross rate or net rate).
The appeal also requested a modulation of the decision’s effects, which may limit its impact on taxpayers.
Ourcompany’s Brazilian subsidiaries have paid to the Brazilian tax authorities the gross amounts of certain indirect taxes (which included ICMS in their tax base) and have filed lawsuits in 2014 and 2015 in order to challenge the legislation regarding those taxes.legality of these tax on tax amounts. Pursuant to these lawsuits, we havethe company requested reimbursement of prior excess tax payments. Taking into consideration thatpayments and entitlement to retain amounts not remitted. During 2018, the company learned of a further decision of the Court may settle different premises forindicating that lawsuits filed prior to the trial resulting in its 2017 decision, such as those filed by the company, would likely be upheld. The company also noted that other Brazilian companies, including customers of its Brazilian subsidiaries, which had timely filed equivalent lawsuits, were recording income based on the applicable ICMS exclusion, which willamounts retained. During 2021, 2020 and 2019, the company received additional favorable court rulings and completed its analysis of certain prior year overpayments related to ICMS. As these gain contingency amounts were determined to be resolved only afterestimable and realizable, the pending appeal is decided, we believecompany recorded $22 million, $4 million and $57 million of prior year collections in business consolidation and other activities within its 2021, 2020 and 2019 consolidated statement of earnings. As of December 31, 2021, the outcome of this matter is uncertain at this time. The resolution of the appeal maycompany has no additional claims outstanding that would result in a material reimbursement to the company from the Brazilian government, the amount of which cannot be estimated at this time. reimbursements.
22.23. Indemnifications and Guarantees
General Guarantees
The company or its appropriate consolidated direct or indirect subsidiaries, including Rexam and its subsidiaries have made certain indemnities, commitments and guarantees under which the specified entity may be required to make payments in relation to certain transactions. These indemnities, commitments and guarantees include indemnities to the customers of the subsidiaries in connection with the sales of their packaging and aerospace products and services; guarantees to suppliers of subsidiaries of the company guaranteeing the performance of the respective entity under a purchase agreement, construction contract, renewable energy purchase contract or other commitment; guarantees in respect of certain foreignnon-U.S. subsidiaries’ pension plans; indemnities for liabilities associated with the infringement of third-party patents, trademarks or copyrights under various types of agreements; indemnities to various lessors in connection with facility, equipment, furniture and other personal property leases for certain claims arising from such leases; indemnities to governmental agencies in connection with the issuance of a permit or license to the company or a subsidiary; indemnities pursuant to agreements relating to certain joint ventures; indemnities in connection with the sale of businesses or substantially all of the assets and specified liabilities of businesses; and indemnities to directors, officers and employees of the company to the extent permitted under the laws of the State of Indiana and the United States of America. The duration of these indemnities, commitments and guarantees varies and, in certain cases, is indefinite.
In addition, many of these indemnities, commitments and guarantees do not provide for any limitation on the maximum potential future payments the company could be obligated to make. As such, the company is unable to reasonably estimate its potential exposure under these items.
Other than the indemnifications provided in connection with the sale of the Divestment Business (refer to Note 4), theThe company has not recorded any material liabilities for these indemnities, commitments and guarantees in the accompanying consolidated balance sheets. The company does, however, accrue for payments under promissory notes and other evidences of incurred indebtedness and for losses for any known contingent liability, including those that may arise from indemnifications, commitments and guarantees, when future payment is both reasonably estimable and probable. Finally, the company carries specific and general liability insurance policies and has obtained indemnities, commitments and guarantees from third-party purchasers, sellers and other contracting parties, which the company believes would, in certain circumstances, provide recourse to anycertain claims arising from these indemnifications, commitments and guarantees.
Debt Guarantees
The company’s and its subsidiaries’ obligations under the senior notes and senior credit facilities (or, in the case of U.S. domiciled foreignnon-U.S. subsidiaries under the senior credit facilities, the obligations of foreignnon-U.S. credit parties only) are guaranteed on a full, unconditional and joint and several basis by certain of the company’s domestic subsidiaries and the domestic subsidiary borrowers, and obligations of other guarantors and the subsidiary borrowers under the senior credit facilities are guaranteed by the company, in each case with certain exceptions and subject to grace periods.exceptions. These guarantees are required in support of the senior notes and senior credit facilities referred to above, are coterminous with the terms of the respective note indentures, senior notes and credit agreement, and they could be enforced by the holders of the obligations thereunder during the continuation of an event of default under the note indentures, the senior notes and/or the credit agreement or any other loan document in respect thereof.agreement. The maximum potential amounts which could be required to be paid under such guarantees are essentially equal to the then outstandingthen-outstanding obligations under the respective senior notes or the credit agreement (or, in the case of U.S. domiciled foreignnon-U.S. subsidiaries under the senior credit facilities, the obligations of foreignnon-U.S. credit parties only), with certain exceptions. All obligations under the guarantees of the senior credit facilities are secured, with certain exceptions, and subject to certain grace periods, by a valid first priority perfected lien or pledge on (i) 100 percent of the capital stock of each of the company's material wholly owned domestic subsidiaries directly owned by the company or any of its wholly owned domestic subsidiaries and (ii) 65 percent of the capital stock of each of the company's material wholly owned first-tier foreignnon-U.S. subsidiaries directly owned
by the company or any of its wholly owned domestic subsidiaries. In addition, the obligations of certain foreignnon-U.S. borrowers and foreignnon-U.S. pledgors under the loan documents will be secured, with certain exceptions, and subject to certain grace periods, by a valid first priority perfected lien or pledge on 100 percent of the capital stock of certain of the company's material wholly owned foreignnon-U.S. subsidiaries and material wholly owned U.S. domiciled foreignnon-U.S. subsidiaries directly owned by the company or any of its wholly owned material subsidiaries. The company is not in default under the above senior notes or senior credit facilities. The condensed consolidating financial information for the guarantor and non-guarantor subsidiaries is presented in Note 23. Separate financial statements for the guarantor subsidiaries and the non-guarantor subsidiaries are not presented because management has determined that such financial statements are not required under the Securities and Exchange Commission (SEC) regulations.
23. Subsidiary Guarantees of Debt
The following condensed consolidating financial information is presented in accordance with SEC Regulations S-X Rule 3-10, Financial Statements of Guarantors and Issuers of Guaranteed Securities Registered or Being Registered. For purposes of the presentation of condensed consolidating financial information, the subsidiaries of the company providing the guarantees are referred to as the guarantor subsidiaries, and subsidiaries of the company other than the guarantor subsidiaries are referred to as the non-guarantor subsidiaries. The eliminating adjustments substantively consist of intercompany transactions and the elimination of equity investments and earnings of subsidiaries. Separate financial statements for the guarantor subsidiaries and the non-guarantor subsidiaries are not presented because management has determined that such financial statements are not required under SEC regulations.
The company’s senior notes are guaranteed on a full and unconditional guarantee on a joint and several basis by certain domestic subsidiaries of the company. Each of the guarantor subsidiaries is 100 percent owned by the company. As described in the supplemental indentures governing the company’s existing senior notes, the senior notes are to be guaranteed by any of the company’s domestic subsidiaries that guarantee any other indebtedness of the company. The following is condensed consolidating financial information for the company, segregating the guarantor subsidiaries and non-guarantor subsidiaries, as of December 31, 2017 and 2016, and for the three years ended December 31, 2017, 2016 and 2015. The condensed consolidating financial information presented below is not necessarily indicative of the financial position, results of operations, earnings or cash flows of the company or any of the company’s subsidiaries on a stand-alone basis.
| | | | | | | | | | | | | | | |
| | Condensed Consolidating Statement of Earnings |
| | For the Year Ended December 31, 2017 |
($ in millions) | | Ball
Corporation | | Guarantor
Subsidiaries | | Non-Guarantor
Subsidiaries | | Eliminating
Adjustments | | Consolidated
Total |
| | | | | | | | | | | | | | | |
Net sales | | $ | — | | $ | 4,839 | | $ | 6,317 | | $ | (173) | | $ | 10,983 |
| | | | | | | | | | | | | | | |
Cost and expenses | | | | | | | | | | | | | | | |
Cost of sales (excluding depreciation and amortization) | | | — | | | (3,980) | | | (4,910) | | | 173 | | | (8,717) |
Depreciation and amortization | | | (8) | | | (150) | | | (571) | | | — | | | (729) |
Selling, general and administrative | | | (168) | | | (121) | | | (225) | | | — | | | (514) |
Business consolidation and other activities | | | (120) | | | (57) | | | (44) | | | — | | | (221) |
Equity in results of subsidiaries | | | 673 | | | 191 | | | (40) | | | (824) | | | — |
Intercompany | | | 301 | | | (149) | | | (152) | | | — | | | — |
| | | 678 | | | (4,266) | | | (5,942) | | | (651) | | | (10,181) |
| | | | | | | | | | | | | | | |
Earnings (loss) before interest and taxes | | | 678 | | | 573 | | | 375 | | | (824) | | | 802 |
Interest expense | | | (275) | | | 6 | | | (16) | | | — | | | (285) |
Debt refinancing and other costs | | | — | | | — | | | (3) | | | — | | | (3) |
Total interest expense | | | (275) | | | 6 | | | (19) | | | — | | | (288) |
Earnings (loss) before taxes | | | 403 | | | 579 | | | 356 | | | (824) | | | 514 |
Tax (provision) benefit | | | (29) | | | (112) | | | (24) | | | — | | | (165) |
Equity in results of affiliates, net of tax | | | — | | | 1 | | | 30 | | | — | | | 31 |
Net earnings | | | 374 | | | 468 | | | 362 | | | (824) | | | 380 |
Less net earnings attributable to noncontrolling interests | | | — | | | — | | | (6) | | | — | | | (6) |
Net earnings attributable to Ball Corporation | | $ | 374 | | $ | 468 | | $ | 356 | | $ | (824) | | $ | 374 |
| | | | | | | | | | | | | | | |
Comprehensive earnings (loss) attributable to Ball Corporation | | $ | 659 | | $ | 731 | | $ | 639 | | $ | (1,370) | | $ | 659 |
| | | | | | | | | | | | | | | | |
| | Condensed Consolidating Statement of Earnings | |
| | For the Year Ended December 31, 2016 |
($ in millions) | | Ball
Corporation | | Guarantor
Subsidiaries | | Non-Guarantor
Subsidiaries | | Eliminating
Adjustments | | Consolidated
Total | |
| | | | | | | | | | | | | | | | |
Net sales | | $ | — | | $ | 4,589 | | $ | 4,698 | | $ | (226) | | $ | 9,061 | |
| | | | | | | | | | | | | | | | |
Cost and expenses | | | | | | | | | | | | | | | | |
Cost of sales (excluding depreciation and amortization) | | | — | | | (3,756) | | | (3,766) | | | 226 | | | (7,296) | |
Depreciation and amortization | | | (5) | | | (142) | | | (306) | | | — | | | (453) | |
Selling, general and administrative | | | (58) | | | (204) | | | (250) | | | — | | | (512) | |
Business consolidation and other activities | | | (577) | | | (49) | | | 289 | | | — | | | (337) | |
Equity in results of subsidiaries | | | 692 | | | 503 | | | (33) | | | (1,162) | | | — | |
Intercompany | | | 345 | | | (259) | | | (86) | | | — | | | — | |
| | | 397 | | | (3,907) | | | (4,152) | | | (936) | | | (8,598) | |
| | | | | | | | | | | | | | | | |
Earnings (loss) before interest and taxes | | | 397 | | | 682 | | | 546 | | | (1,162) | | | 463 | |
Interest expense | | | (207) | | | — | | | (22) | | | — | | | (229) | |
Debt refinancing and other costs | | | (97) | | | — | | | (12) | | | — | | | (109) | |
Total interest expense | | | (304) | | | — | | | (34) | | | — | | | (338) | |
Earnings (loss) before taxes | | | 93 | | | 682 | | | 512 | | | (1,162) | | | 125 | |
Tax (provision) benefit | | | 170 | | | (122) | | | 78 | | | — | | | 126 | |
Equity in results of affiliates, net of tax | | | — | | | — | | | 15 | | | — | | | 15 | |
Net earnings | | | 263 | | | 560 | | | 605 | | | (1,162) | | | 266 | |
Less net earnings attributable to noncontrolling interests | | | — | | | — | | | (3) | | | — | | | (3) | |
Net earnings attributable to Ball Corporation | | $ | 263 | | $ | 560 | | $ | 602 | | $ | (1,162) | | $ | 263 | |
| | | | | | | | | | | | | | | | |
Comprehensive earnings (loss) attributable to Ball Corporation | | $ | (38) | | $ | 296 | | $ | 334 | | $ | (630) | | $ | (38) | |
| | | | | | | | | | | | | | | |
| Condensed Consolidating Statement of Earnings | |
| For the Year Ended December 31, 2015 |
($ in millions) | Ball
Corporation | | Guarantor
Subsidiaries | | Non-Guarantor
Subsidiaries | | Eliminating
Adjustments | | Consolidated
Total | |
| | | | | | | | | | | | | | | |
Net sales | $ | — | | $ | 4,788 | | $ | 3,259 | | $ | (50) | | $ | 7,997 | |
| | | | | | | | | | | | | | | |
Cost and expenses | | | | | | | | | | | | | | | |
Cost of sales (excluding depreciation and amortization) | | — | | | (3,959) | | | (2,551) | | | 50 | | | (6,460) | |
Depreciation and amortization | | (6) | | | (132) | | | (148) | | | — | | | (286) | |
Selling, general and administrative | | (80) | | | (170) | | | (200) | | | — | | | (450) | |
Business consolidation and other activities | | (159) | | | (18) | | | (18) | | | — | | | (195) | |
Equity in results of subsidiaries | | 453 | | | 215 | | | — | | | (668) | | | — | |
Intercompany | | 207 | | | (175) | | | (32) | | | — | | | — | |
| | 415 | | | (4,239) | | | (2,949) | | | (618) | | | (7,391) | |
| | | | | | | | | | | | | | | |
Earnings (loss) before interest and taxes | | 415 | | | 549 | | | 310 | | | (668) | | | 606 | |
Interest expense | | (139) | | | 5 | | | (9) | | | — | | | (143) | |
Debt refinancing and other costs | | (115) | | | — | | | (2) | | | — | | | (117) | |
Total interest expense | | (254) | | | 5 | | | (11) | | | — | | | (260) | |
Earnings (loss) before taxes | | 161 | | | 554 | | | 299 | | | (668) | | | 346 | |
Tax (provision) benefit | | 120 | | | (110) | | | (57) | | | — | | | (47) | |
Equity in results of affiliates, net of tax | | — | | | 2 | | | 2 | | | — | | | 4 | |
Net earnings | | 281 | | | 446 | | | 244 | | | (668) | | | 303 | |
Less net earnings attributable to noncontrolling interests | | — | | | — | | | (22) | | | — | | | (22) | |
Net earnings attributable to Ball Corporation | $ | 281 | | $ | 446 | | $ | 222 | | $ | (668) | | $ | 281 | |
| | | | | | | | | | | | | | | |
Comprehensive earnings (loss) attributable to Ball Corporation | $ | 163 | | $ | 328 | | $ | 100 | | $ | (428) | | $ | 163 | |
| | Condensed Consolidating Balance Sheet |
| | December 31, 2017 |
($ in millions) | | Ball
Corporation | | Guarantor
Subsidiaries | | Non-Guarantor
Subsidiaries | | Eliminating
Adjustments | | Consolidated
Total |
| | | | | | | | | | | | | | | |
Assets | | | | | | | | | | | | | | | |
Current assets | | | | | | | | | | | | | | | |
Cash and cash equivalents | | $ | 5 | | $ | — | | $ | 443 | | $ | — | | $ | 448 |
Receivables, net | | | 3 | | | 233 | | | 1,398 | | | — | | | 1,634 |
Intercompany receivables | | | 39 | | | 470 | | | 912 | | | (1,421) | | | — |
Inventories, net | | | — | | | 605 | | | 921 | | | — | | | 1,526 |
Other current assets | | | 9 | | | 48 | | | 93 | | | — | | | 150 |
Total current assets | | | 56 | | | 1,356 | | | 3,767 | | | (1,421) | | | 3,758 |
Noncurrent assets | | | | | | | | | | | | | | | |
Property, plant and equipment, net | | | 20 | | | 1,275 | | | 3,315 | | | — | | | 4,610 |
Investment in subsidiaries | | | 8,639 | | | 4,662 | | | 389 | | | (13,690) | | | — |
Goodwill | | | — | | | 981 | | | 3,952 | | | — | | | 4,933 |
Intangible assets, net | | | 15 | | | 65 | | | 2,382 | | | — | | | 2,462 |
Other assets | | | 185 | | | 296 | | | 925 | | | — | | | 1,406 |
Total assets | | $ | 8,915 | | $ | 8,635 | | $ | 14,730 | | $ | (15,111) | | $ | 17,169 |
| | | | | | | | | | | | | | | |
Liabilities and Shareholders' Equity | | | | | | | | | | | | | | | |
Current liabilities | | | | | | | | | | | | | | | |
Short-term debt and current portion of long-term debt | | $ | 351 | | $ | — | | $ | 102 | | $ | — | | $ | 453 |
Accounts payable | | | 14 | | | 986 | | | 1,762 | | | — | | | 2,762 |
Intercompany payables | | | 705 | | | 76 | | | 640 | | | (1,421) | | | — |
Accrued employee costs | | | 28 | | | 157 | | | 167 | | | — | | | 352 |
Other current liabilities | | | 170 | | | 81 | | | 289 | | | — | | | 540 |
Total current liabilities | | | 1,268 | | | 1,300 | | | 2,960 | | | (1,421) | | | 4,107 |
Noncurrent liabilities | | | | | | | | | | | | | | | |
Long-term debt | | | 6,504 | | | — | | | 14 | | | — | | | 6,518 |
Employee benefit obligations | | | 333 | | | 707 | | | 423 | | | — | | | 1,463 |
Intercompany long-term notes | | | (3,172) | | | 1,599 | | | 1,572 | | | 1 | | | — |
Deferred taxes | | | (109) | | | 256 | | | 548 | | | — | | | 695 |
Other liabilities | | | 150 | | | 23 | | | 167 | | | — | | | 340 |
Total liabilities | | | 4,974 | | | 3,885 | | | 5,684 | | | (1,420) | | | 13,123 |
| | | | | | | | | | | | | | | |
Common stock | | | 1,084 | | | 1,128 | | | 6,291 | | | (7,419) | | | 1,084 |
Preferred stock | | | — | | | — | | | 5 | | | (5) | | | — |
Retained earnings | | | 4,987 | | | 4,197 | | | 2,914 | | | (7,111) | | | 4,987 |
Accumulated other comprehensive earnings (loss) | | | (656) | | | (575) | | | (269) | | | 844 | | | (656) |
Treasury stock, at cost | | | (1,474) | | | — | | | — | | | — | | | (1,474) |
Total Ball Corporation shareholders' equity | | | 3,941 | | | 4,750 | | | 8,941 | | | (13,691) | | | 3,941 |
Noncontrolling interests | | | — | | | — | | | 105 | | | — | | | 105 |
Total shareholders' equity | | | 3,941 | | | 4,750 | | | 9,046 | | | (13,691) | | | 4,046 |
Total liabilities and shareholders' equity | | $ | 8,915 | | $ | 8,635 | | $ | 14,730 | | $ | (15,111) | | $ | 17,169 |
| | | | | | | | | | | | | | | |
| | Condensed Consolidating Balance Sheet |
| | December 31, 2016 |
($ in millions) | | Ball
Corporation | | Guarantor
Subsidiaries | | Non-Guarantor
Subsidiaries | | Eliminating
Adjustments | | Consolidated
Total |
| | | | | | | | | | | | | | | |
Assets | | | | | | | | | | | | | | | |
Current assets | | | | | | | | | | | | | | | |
Cash and cash equivalents | | $ | 2 | | $ | (11) | | $ | 606 | | $ | — | | $ | 597 |
Receivables, net | | | 96 | | | 450 | | | 945 | | | — | | | 1,491 |
Intercompany receivables | | | 39 | | | 467 | | | 963 | | | (1,469) | | | — |
Inventories, net | | | — | | | 516 | | | 897 | | | — | | | 1,413 |
Other current assets | | | 40 | | | 39 | | | 73 | | | — | | | 152 |
Total current assets | | | 177 | | | 1,461 | | | 3,484 | | | (1,469) | | | 3,653 |
Noncurrent assets | | | | | | | | | | | | | | | |
Property, plant and equipment, net | | | 23 | | | 1,087 | | | 3,277 | | | — | | | 4,387 |
Investment in subsidiaries | | | 7,815 | | | 4,291 | | | 423 | | | (12,529) | | | — |
Goodwill | | | — | | | 985 | | | 4,110 | | | — | | | 5,095 |
Intangible assets, net | | | 18 | | | 76 | | | 1,840 | | | — | | | 1,934 |
Other assets | | | 94 | | | 306 | | | 704 | | | — | | | 1,104 |
Total assets | | $ | 8,127 | | $ | 8,206 | | $ | 13,838 | | $ | (13,998) | | $ | 16,173 |
| | | | | | | | | | | | | | | |
Liabilities and Shareholders' Equity | | | | | | | | | | | | | | | |
Current liabilities | | | | | | | | | | | | | | | |
Short-term debt and current portion of long-term debt | | $ | 141 | | $ | — | | $ | 81 | | $ | — | | $ | 222 |
Accounts payable | | | 18 | | | 772 | | | 1,243 | | | — | | | 2,033 |
Intercompany payables | | | 1,010 | | | 53 | | | 408 | | | (1,471) | | | — |
Accrued employee costs | | | 25 | | | 152 | | | 138 | | | — | | | 315 |
Other current liabilities | | | 138 | | | 69 | | | 192 | | | — | | | 399 |
Total current liabilities | | | 1,332 | | | 1,046 | | | 2,062 | | | (1,471) | | | 2,969 |
Noncurrent liabilities | | | | | | | | | | | | | | | |
Long-term debt | | | 6,337 | | | — | | | 973 | | | — | | | 7,310 |
Employee benefit obligations | | | 347 | | | 760 | | | 390 | | | — | | | 1,497 |
Intercompany long-term notes | | | (3,142) | | | 2,018 | | | 1,122 | | | 2 | | | — |
Deferred taxes | | | (308) | | | 232 | | | 515 | | | — | | | 439 |
Other liabilities | | | 127 | | | 35 | | | 255 | | | — | | | 417 |
Total liabilities | | | 4,693 | | | 4,091 | | | 5,317 | | | (1,469) | | | 12,632 |
| | | | | | | | | | | | | | | |
Common stock | | | 1,038 | | | 1,120 | | | 6,301 | | | (7,421) | | | 1,038 |
Preferred stock | | | — | | | — | | | 5 | | | (5) | | | — |
Retained earnings | | | 4,739 | | | 3,832 | | | 2,661 | | | (6,493) | | | 4,739 |
Accumulated other comprehensive earnings (loss) | | | (942) | | | (837) | | | (552) | | | 1,390 | | | (941) |
Treasury stock, at cost | | | (1,401) | | | — | | | — | | | — | | | (1,401) |
Total Ball Corporation shareholders' equity | | | 3,434 | | | 4,115 | | | 8,415 | | | (12,529) | | | 3,435 |
Noncontrolling interests | | | — | | | — | | | 106 | | | — | | | 106 |
Total shareholders' equity | | | 3,434 | | | 4,115 | | | 8,521 | | | (12,529) | | | 3,541 |
Total liabilities and shareholders' equity | | $ | 8,127 | | $ | 8,206 | | $ | 13,838 | | $ | (13,998) | | $ | 16,173 |
| | | | | | | | | | | | |
| | Condensed Consolidating Statement of Cash Flows |
| | For the Year Ended December 31, 2017 |
($ in millions) | | Ball
Corporation | | Guarantor
Subsidiaries | | Non-Guarantor
Subsidiaries | | Consolidated
Total |
| | | | | | | | | | | | |
Cash provided by (used in) operating activities | | $ | 234 | | $ | 645 | | $ | 599 | | $ | 1,478 |
| | | | | | | | | | | | |
Cash flows from investing activities | | | | | | | | | | | | |
Capital expenditures | | | (6) | | | (298) | | | (252) | | | (556) |
Business dispositions, net of cash sold | | | 17 | | | 31 | | | (50) | | | (2) |
Other, net | | | (2) | | | 34 | | | (19) | | | 13 |
Cash provided by (used in) investing activities | | | 9 | | | (233) | | | (321) | | | (545) |
| | | | | | | | | | | | |
Cash flows from financing activities | | | | | | | | | | | | |
Long-term borrowings | | | 765 | | | — | | | — | | | 765 |
Repayments of long-term borrowings | | | (741) | | | — | | | (1,069) | | | (1,810) |
Net change in short-term borrowings | | | 174 | | | — | | | 10 | | | 184 |
Proceeds from issuances of common stock, net of shares used for taxes | | | 27 | | | — | | | — | | | 27 |
Acquisitions of treasury stock | | | (103) | | | — | | | — | | | (103) |
Common stock dividends | | | (129) | | | — | | | — | | | (129) |
Intercompany | | | (226) | | | (398) | | | 624 | | | — |
Other, net | | | — | | | (3) | | | (4) | | | (7) |
Cash provided by (used in) financing activities | | | (233) | | | (401) | | | (439) | | | (1,073) |
| | | | | | | | | | | | |
Effect of exchange rate changes on cash | | | (7) | | | — | | | (2) | | | (9) |
| | | | | | | | | | | | |
Change in cash and cash equivalents | | | 3 | | | 11 | | | (163) | | | (149) |
Cash and cash equivalents – beginning of period | | | 2 | | | (11) | | | 606 | | | 597 |
Cash and cash equivalents – end of period | | $ | 5 | | $ | — | | $ | 443 | | $ | 448 |
| | | | | | | | | | | | |
| | Condensed Consolidating Statement of Cash Flows |
| | For the Year Ended December 31, 2016 |
($ in millions) | | Ball
Corporation | | Guarantor
Subsidiaries | | Non-Guarantor
Subsidiaries | | Consolidated
Total |
| | | | | | | | | | | | |
Cash provided by (used in) operating activities | | $ | (1,051) | | $ | 85 | | $ | 1,160 | | $ | 194 |
| | | | | | | | | | | | |
Cash flows from investing activities | | | | | | | | | | | | |
Capital expenditures | | | (15) | | | (222) | | | (369) | | | (606) |
Business acquisition, net of cash acquired | | | 2,303 | | | 29 | | | (5,711) | | | (3,379) |
Business dispositions, net of cash sold | | | 1,010 | | | 24 | | | 1,904 | | | 2,938 |
Decrease in restricted cash | | | 1,966 | | | — | | | — | | | 1,966 |
Settlement of Rexam acquisition related derivatives | | | (252) | | | — | | | — | | | (252) |
Other, net | | | 2 | | | 4 | | | (1) | | | 5 |
Cash provided by (used in) investing activities | | | 5,014 | | | (165) | | | (4,177) | | | 672 |
| | | | | | | | | | | | |
Cash flows from financing activities | | | | | | | | | | | | |
Long-term borrowings | | | 2,610 | | | — | | | 1,760 | | | 4,370 |
Repayments of long-term borrowings | | | (1,038) | | | — | | | (3,586) | | | (4,624) |
Net change in short-term borrowings | | | 71 | | | (29) | | | (19) | | | 23 |
Proceeds from issuances of common stock, net of shares used for taxes | | | 48 | | | — | | | — | | | 48 |
Acquisitions of treasury stock | | | (107) | | | — | | | — | | | (107) |
Common stock dividends | | | (83) | | | — | | | — | | | (83) |
Intercompany | | | (5,467) | | | 98 | | | 5,369 | | | — |
Other, net | | | (2) | | | (3) | | | (9) | | | (14) |
Cash provided by (used in) financing activities | | | (3,968) | | | 66 | | | 3,515 | | | (387) |
| | | | | | | | | | | | |
Effect of exchange rate changes on cash | | | 2 | | | 3 | | | (111) | | | (106) |
| | | | | | | | | | | | |
Change in cash and cash equivalents | | | (3) | | | (11) | | | 387 | | | 373 |
Cash and cash equivalents – beginning of period | | | 5 | | | — | | | 219 | | | 224 |
Cash and cash equivalents – end of period | | $ | 2 | | $ | (11) | | $ | 606 | | $ | 597 |
| | | | | | | | | | | |
| Condensed Consolidating Statement of Cash Flows |
| For the Year Ended December 31, 2015 |
($ in millions) | Ball
Corporation | | Guarantor
Subsidiaries | | Non-Guarantor
Subsidiaries | | Consolidated
Total |
| | | | | | | | | | | |
Cash provided by (used in) operating activities | $ | (13) | | $ | 568 | | $ | 452 | | $ | 1,007 |
| | | | | | | | | | | |
Cash flows from investing activities | | | | | | | | | | | |
Capital expenditures | | (8) | | | (194) | | | (326) | | | (528) |
Business acquisition, net of cash acquired | | — | | | (29) | | | — | | | (29) |
Business dispositions, net of cash sold | | — | | | — | | | 1 | | | 1 |
Increase in restricted cash | | (2,183) | | | — | | | — | | | (2,183) |
Settlement of Rexam acquisition related derivatives | | (16) | | | — | | | — | | | (16) |
Other, net | | 23 | | | 8 | | | 3 | | | 34 |
Cash provided by (used in) investing activities | | (2,184) | | | (215) | | | (322) | | | (2,721) |
| | | | | | | | | | | |
Cash flows from financing activities | | | | | | | | | | | |
Long-term borrowings | | 4,509 | | | — | | | 15 | | | 4,524 |
Repayments of long-term borrowings | | (2,301) | | | — | | | (129) | | | (2,430) |
Net change in short-term borrowings | | (2) | | | (7) | | | (84) | | | (93) |
Proceeds from issuances of common stock, net of shares used for taxes | | 36 | | | — | | | — | | | 36 |
Acquisitions of treasury stock | | (136) | | | — | | | — | | | (136) |
Common stock dividends | | (72) | | | — | | | — | | | (72) |
Intercompany | | 249 | | | (341) | | | 92 | | | — |
Other, net | | (73) | | | (2) | | | (17) | | | (92) |
Cash provided by (used in) financing activities | | 2,210 | | | (350) | | | (123) | | | 1,737 |
| | | | | | | | | | | |
Effect of exchange rate changes on cash | | (10) | | | (3) | | | 23 | | | 10 |
| | | | | | | | | | | |
Change in cash and cash equivalents | | 3 | | | — | | | 30 | | | 33 |
Cash and cash equivalents – beginning of period | | 2 | | | — | | | 189 | | | 191 |
Cash and cash equivalents – end of period | $ | 5 | | $ | — | | $ | 219 | | $ | 224 |
24. Subsequent Events
On February 6, 2018, the company announced plans to build a one-line beverage can and end manufacturing plant in Asuncion, Paraguay, and to add capacity in its Buenos Aires, Argentina, facility. These investments will allow the company to serve the growing beverage can market in Paraguay, Bolivia and Argentina, and to support various customer demands with multiple can sizes. The Paraguay plant is expected to begin production in the fourth quarter of 2019 and most of its capacity is contracted under long-term agreements.
Item 9.Changes in and Disagreements with Accountants on Accounting and Financial Disclosure
There were no matters required to be reported under this item.
Item 9A. | Controls and Procedures |
Item 9A.Controls and Procedures
Evaluation of Disclosure Controls and Procedures
Ball Corporation has established disclosure controls and procedures to ensure that information required to be disclosed by us in the reports that we filethe company files or submitsubmits under the Securities Exchange Act of 1934, as amended, is recorded, processed, summarized and reported, within the time periods specified in the Commission's rules and forms, and that such information is accumulated and communicated to management of the company, including its Chief Executive Officer and Chief Financial Officer, as appropriate to allow timely decisions regarding required disclosure. As of December 31, 2017,2021, Ball Corporation, under the supervision of the Chief Executive Officer and Chief Financial Officer of the company, has conducted an evaluation of the effectiveness of the design and operation of the company’s disclosure controls and procedures (as defined in Rules 13a-15(e) and 15d-15(e) under the Securities Exchange Act of 1934, as amended) and the Chief Executive Officer and Chief Financial Officer have concluded that the company’s disclosure controls and procedures were effective.
Management’s Report on Internal Control Over Financial Reporting
Management of Ball Corporation is responsible for establishing and maintaining adequate internal control over financial reporting, as such term is defined in Exchange Act Rules 13a-15(f) and 15d-15(f). Under the supervision and with the participation of our management, including our Chief Executive Officer and Chief Financial Officer, wethe company conducted an evaluation of the effectiveness of our internal control over financial reporting based on the framework described in “Internal Control — Integrated Framework” (2013) issued by the Committee of Sponsoring Organizations of the Treadway Commission. Based on this evaluation, our management concluded that our internal control over financial reporting was effective as of December 31, 2017.2021.
The effectiveness of our internal control over financial reporting as of December 31, 2017,2021, has been audited by PricewaterhouseCoopers LLP, an independent registered public accounting firm, as stated in their report, which is included herein.
Remediation of the 2016 Material Weakness
In 2016, we did not design and maintain effective controls over the accuracy and completeness of the accounting for income taxes related to the sale of the Divestment Business and certain discrete income tax benefits related to the acquisition of Rexam. During 2017, our management, with the oversight of the Audit Committee of our Board of Directors, has been engaged in efforts to remediate the material weakness identified and disclosed in Item 9A of the December 31, 2016 Form 10-K. Internal control enhancements have been designed, implemented and tested for operational effectiveness. Based on the results of our testing, management has concluded that the controls are adequately designed and have operated effectively for a sufficient period of time during 2017. Accordingly, the material weakness is considered to be remediated.
Changes in Internal Control over Financial Reporting
There were no changes in our internal control over financial reporting that occurred during the quarter ended December 31, 2017,2021, that have materially affected, or are reasonably likely to materially affect, our internal control over financial reporting.
Item 9B. Other Information
There were no matters required to be reported under this item.
Item 9C. Disclosure Regarding Foreign Jurisdictions that Prevent Inspections
There were no matters required to be reported under this item.
Part III
Item 10. Directors, Executive Officers and Corporate Governance of the Registrant
Governance.
The executive officers of the company as of February 28, 2018,16, 2022, were as follows:
Charles E. Baker, 60,64, Vice President, General Counsel and Corporate Secretary since July 2011; Vice President, General Counsel and Assistant Corporate Secretary from 2004 to 2011; Associate General Counsel, 1999 to 2004; various other positions within the company, 1993 to 1999.2004.
Nate C. Carey, 39,43, Vice President and Controller since November 2017; Assistant Controller from 2014 to November 2017; Senior Manager, PricewaterhouseCoopers LLP, 2001 to 2014.2017.
Daniel W. Fisher, 45,49, President, since January 2021; elected as Chief Executive Officer on January 26, 2022, which will become effective April 27, 2022; Senior Vice President, Ball Corporation, and Chief Operating Officer, Global Beverage Packaging, since December 2016; President, Beverage Packaging North and Central America from 2014 to 2016; Senior Vice President, Finance and Planning, Beverage Packaging North and Central America, 2013 to 2014; various other positions within the company, 2010 to 2014.
John A. Hayes, 52,56, Chairman and Chief Executive Officer since January 2021; Chairman, President and Chief Executive Officer since 2013; President and Chief Executive Officer, 2011 to 2013; President and Chief Operating Officer during 2010; Executive Vice President and Chief Operating Officer from 2008 to 2009; various other positions within the company, 1999 to 2008.2013. John Hayes will transition solely to Chairman of the Board of Directors effective April 27, 2022.
JeffreyDavid A. Knobel, 46, Vice President and Treasurer since 2011; Treasurer from 2010 to 2011; Senior Director, Treasury, 2008 to 2010; Director, Treasury Operations, 2005 to 2008; various other positions within the company, 1997 to 2005.
Scott C. Morrison, 55, Senior Vice President and Chief Financial Officer since 2010; Vice President and Treasurer from 2002 to 2009; and Treasurer, 2000 to 2002.
Lisa A. Pauley,Kaufman, 56, Senior Vice President, Human Resources and Administration, since 2011; Vice President, Administration and Compliance, 2007 to 2011; Senior Director, Administration and Compliance, 2004 to 2007; various other positions within the company, 1981 to 2004.
James N. Peterson, 49, Senior Vice President, Ball Corporation, and Chief Operating Officer, Global Food and Aerosol Packaging, since 2015; Vice President, Marketing and Corporate Affairs from 2011 to 2015; Vice President, Marketing and Corporate Relations, 2008 to 2011; Director, Marketing North America, 2006 to 2008; and Vice President, Marketing & Business Development, U.S. Can Company, 2004 to 2006.
Robert D. Strain, 61, Senior Vice President, Ball Corporation, and President, Ball Aerospace & Technologies Corp. since 2013;January 2021; Chief Operating Officer, Ball Aerospace & Technologies Corp. from 20122020 to 2013;2021; Vice President and Director at NASA Goddard Space Flight CenterGeneral Manager of National Defense, Ball Aerospace & Technologies Corp from 20082013 to 2012.2020; various other positions within the company, 2000 to 2013.
Jeffrey A. Knobel, 50, Vice President and Treasurer since 2011; Treasurer from 2010 to 2011; various other positions within the company, 1997 to 2010.
Ronald J. Lewis, 55, Senior Vice President, Ball Corporation, and Chief Operating Officer, Global Beverage Packaging, since January 2021; President, Beverage Packaging EMEA from 2019 to 2021; Chief Supply Chain Officer, Coca-Cola European Partners plc, 2016 to 2019.
Scott C. Morrison, 59, Executive Vice President and Chief Financial Officer since January 2021; Senior Vice President and Chief Financial Officer since 2010; various other positions within the company, 2000 to 2010.
Stacey Valy Panayiotou, 49, Senior Vice President and Chief Human Resources Officer since November 2021; Executive Vice President of Human Resources, Graphic Packaging International, 2019 to 2021. Senior Vice President, Global Talent and Development, The Coca-Cola Company, 2013 to 2019.
Other information required by Item 10 appearing under the caption “Director Nominees and Continuing Directors” and “Section 16(a) Beneficial Ownership Reporting Compliance,” of the company’s proxy statement to be filed pursuant to Regulation 14A within 120 days after December 31, 2016,2021, is incorporated herein by reference.
Item 11. Executive Compensation
The information required by Item 11 appearing under the caption “Executive Compensation” in the company’s proxy statement, to be filed pursuant to Regulation 14A within 120 days after December 31, 2017,2021, is incorporated herein by reference. Additionally, the Ball Corporation 2000 Deferred Compensation Company Stock Plan, the Ball Corporation 2005 Deferred Compensation Company Stock Plan, the Ball Corporation Deposit Share Program and the Ball Corporation Directors Deposit Share Program were created to encourage key executives and other participants to acquire a larger equity ownership interest in the company and to increase their interest in the company’s stock performance.
Nonemployee directors may also be a participant in the 2000 Deferred Compensation Company Stock Plan and the 2005 Deferred Compensation Company Stock Plan.
Item 12. Security Ownership of Certain Beneficial Owners and Management and Related Stockholder Matters
The information required by Item 12 appearing under the caption “Voting Securities and Principal Shareholders,” in the company’s proxy statement to be filed pursuant to Regulation 14A within 120 days after December 31, 2017,2021, is incorporated herein by reference.
Securities authorized for issuance under equity compensation plans are summarized below:
| | | | | | | | |
| | | Equity Compensation Plan Information |
| | | | | | | | Number of |
| | | | | | | | Securities |
| | | Number of | | | | | Remaining Available |
| | | Securities to be | | | | | for Future Issuance |
| | | Issued Upon | | Weighted-Average | | Under Equity |
| | | Exercise of | | Exercise Price of | | Compensation Plans |
| | | | | | | | | Outstanding Options, | | Outstanding Options, | | (Excluding Securities |
| | Equity Compensation Plan Information | |
| | | | | | | Number of | |
| | | | | | | Securities | |
| | Number of | | | | | Remaining Available | |
| | Securities to be | | | | | for Future Issuance | |
| | Issued Upon | | Weighted-Average | | Under Equity | |
| | Exercise of | | Exercise Price of | | Compensation Plans | |
| | Outstanding Options, | | Outstanding Options, | | (Excluding Securities | |
| | Warrants and Rights | | Warrants and Rights | | Reflected in Column (A)) | |
| | | Warrants and Rights | | Warrants and Rights | | Reflected in Column (A)) |
Plan Category | | (A) | | (B) | | (C) | | (A) | | (B) | | (C) |
| | | | | | | | |
| | | | | | | | |
Equity compensation plans approved by security holders | | 25,404,206 | | $ | 24.21 | | 25,404,206 | | 9,766,096 | | $ | 46.66 | | 14,793,877 |
Equity compensation plans not approved by security holders | | — | | | — | | — | | — | | | — | | — |
Total | | 25,404,206 | | $ | 24.21 | | 25,404,206 | | 9,766,096 | | $ | 46.66 | | 14,793,877 |
Item 13. Certain Relationships and Related Transactions, and Director Independence
The information required by Item 13 appearing under the caption “Ratification of the Appointment of Independent Registered Public Accounting Firm,” in the company’s proxy statement to be filed pursuant to Regulation 14A within 120 days after December 31, 2017,2021, is incorporated herein by reference.
Item 14. Principal Accountant Fees and Services
The information required by Item 14 appearing under the caption “Certain Committees of the Board,” in the company’s proxy statement to be filed pursuant to Regulation 14A within 120 days after December 31, 2017,2021, is incorporated herein by reference.
Part IV.
Part IV.Item 15. Exhibits and Financial Statement Schedules
(a) (1) Financial Statements:
The following documents are included in Part II, Item 8:
Report of independent registered public accounting firm
Consolidated statements of earnings — Years ended December 31, 2017, 20162021, 2020 and 20152019
Consolidated statements of comprehensive earnings (loss) — Years ended December 31, 2017, 20162021, 2020 and 20152019
Consolidated balance sheets — December 31, 20172021 and 20162020
Consolidated statements of cash flows — Years ended December 31, 2017, 20162021, 2020 and 20152019
Consolidated statements of shareholders’ equity — Years ended December 31, 2017, 20162021, 2020 and 20152019
Notes to consolidated financial statements
(2) Financial Statement Schedules:
Financial statement schedules have been omitted, as they are either not applicable, are considered insignificant or the required information is included in the consolidated financial statements or notes thereto.
(3) Exhibits:
| Exhibit
Number | | | | Description of Exhibit |
|---|
| | | | | |
|---|
3.i | | Amended Articles of Incorporation revised May 4, 2017 (Filed herewith).(filed by incorporation by reference to the Annual Report on Form 10-K for the year ended December 31, 2017) filed March 1, 2018. |
| | |
3.ii | | Bylaws of Ball Corporation as amended October 24, 2017 (Filed herewith).December 1, 2020 (filed by incorporation by reference to the Annual Report on Form 10-K for the year ended December 31, 2020) filed February 17, 2021. |
| | |
4.1(a) | | Indenture, dated as of March 27, 2006, by and between Ball Corporation and The Bank of New York Mellon Trust Company, N.A. (formerly known as The Bank of New York Trust Company, N.A.), as Trustee (filed by incorporation by reference to the Current Report on Form 8-K dated March 27, 2006) filed March 30, 2006. |
| | |
4.1(b) | | Seventh Supplemental Indenture, dated as of March 9, 2012, among Ball Corporation, the guarantors named therein and The Bank of New York Mellon Trust Company, N.A. (formerly known as The Bank of New York Trust Company, N.A.) (filed by incorporation by reference to the Current Report on Form 8-K dated March 8, 2012) filed March 9, 2012. |
| | |
4.1(c) | | Eighth Supplemental Indenture dated as of May 16, 2013, among Ball Corporation, the guarantors named therein and The Bank of New York Mellon Trust Company, N.A. (formerly known as The Bank of New York Trust Company, N.A.) (filed by incorporation by reference to Exhibit 4.2 of the Current Report on Form 8-K dated May 16, 2013) filed May 17, 2013. |
| | |
Exhibit
Number
| | Description of Exhibit
|
| | |
10.10 | | Ball Corporation 2005 Deferred Compensation Company Stock Plan, effective January 1, 2005 (filed by incorporation by reference to Exhibit 10.2 of the Current Report on Form 8-K dated December 23, 2005) filed December 23, 2005, and as amended and restated on January 1, 2013 (filed by incorporation by reference to Exhibit 10.11 of the Annual Report on Form 10-K for the year ended December 31, 2013) , filed February 24, 2014. * |
| | |
10.11 | | Ball Corporation 2005 Deferred Compensation Plan for Directors, effective January 1, 2005 (filed by incorporation by reference to Exhibit 10.3 of the Current Report on Form 8-K dated December 23, 2005) filed December 23, 2005, and as amended and restated on January 1, 2013 (filed by incorporation by reference to Exhibit 10.12 of the Annual Report on Form 10-K for the year ended December 31, 2013), filed February 24, 2014.* |
| | |
10.12 | | Ball Corporation Long-Term Cash Incentive Plan dated October 25, 1994, amended and restated effective January 1, 2003 (filed by incorporation by reference to the Annual Report on Form 10-K for the year ended December 31, 2003) filed March 12, 2004, amended and restated as of April 26, 2016. (Filed herewith.)2016 (filed by incorporation by reference to Exhibit 10.12 to the Annual Report on Form 10-K for the year ended December 31, 2018), filed February 22, 2019.* |
| | |
10.13 | | Ball Corporation 2005 Stock and Cash Incentive Plan filed by incorporation by reference to the Proxy Statement filed March 18, 2005.* |
| | |
10.14 | | Ball Corporation 2010 Stock and Cash Incentive Plan filed by incorporation by reference to the Proxy Statement filed March 12, 2010.* |
| | |
10.15 | | Ball Corporation Deposit Share Program for United States Participants as amended (filed by incorporation by reference to the Quarterly report on Form 10-Q for the quarter ended July 4, 2014) filed on August 11, 2004 and amended and restated as of July 27, 2016. (Filed herewith.)2016 (filed by incorporation by reference to Exhibit 10.15 to the Annual Report on Form 10-K for the year ended December 31, 2018), filed February 22, 2019.* |
| | |
10.16 | | Ball Corporation Deposit Share Program for International Participants effective as of March 7, 2001 (filed by incorporation by reference to the 10-K for the year ended December 31, 2000), filed March 30, 2001, and amended and restated as of July 27, 2016. (Filed herewith.)2016 (filed by incorporation by reference to Exhibit 10.16 to the Annual Report on Form 10-K for the year ended December 31, 2018), filed February 22, 2019.* |
| | |
10.17 | | Ball Corporation Directors Deposit Share Program, as amended and restated on July 27, 2016. This plan is referred to in Item 11, the Executive Compensation section of the Form 10-K (filed by incorporation by reference to the Quarterly Report on Form 10-Q for the quarter ended July 4, 2004) filed August 11, 2004, as amended and restated on July 27, 2016. (Filed herewith.)2016 (filed by incorporation by reference to Exhibit 10.17 to the Annual Report on Form 10-K for the year ended December 31, 2018), filed February 22, 2019.* |
| | |
10.18 | | Ball Corporation 2013 Stock and Cash Incentive Plan filed by incorporation by reference to the Proxy Statement filed March 8, 2013, amended and restated on April 26, 2017 and filed as the Ball Corporation Amended and Restated 2013 Stock and Cash Incentive Plan (filed by incorporation by reference to the Proxy Statement filed March 15, 2017.)* |
| | |
Exhibit
Number | | Description of Exhibit |
|---|
| | |
|---|
10.19 | | Ball Corporation 2017 Deferred Compensation Company Stock Plan for Directors, effective April 1, 2017 (filed by incorporation by reference to Exhibit 10.1 of the Quarterly Report on Form 10-Q for the quarter ended March 31, 2017) filed May 8, 2017.* |
| | |
10.20 | | Credit Agreement, dated as of March 18, 2016, among Ball Corporation, certain subsidiaries of Ball Corporation party thereto as borrowers, Deutsche Bank AG New York Branch as administrative agent and collateral agent, and certain financial institutions party thereto as lenders and initial facing agents (filed by incorporation by reference to Exhibit 10.1 of the Current Report on Form 8-K dated March 18, 2016) filed March 18, 2016. |
| | | |
Exhibit
Number
| | Description of Exhibit
|
| | |
11 | | Statement re: Computation of Earnings per Share (filed by incorporation by reference toherewith in the notes to the consolidated financial statements in Item 8, “Financial Statements and Supplementary Data”.) |
| | |
12 | | Statement re: ComputationObligor group subsidiaries of Ratio of Earnings to Fixed Charges.Ball Corporation. (Filed herewith.)
|
| | |
14 | | Ball Corporation Executive Officers and Board of Directors Business Ethics Statement, revised July 29, 2015 (filed by incorporation by reference to Exhibit 14 of the Annual Report on Form 10-K for the year ended December 31, 2015) filed February 16, 2016. |
| | |
18.1 | | Letter re: Change in Accounting Principles regarding change in pension plan valuation measurement date (filed by incorporation by reference to the Annual Report on Form 10-K for the year ended December 31, 2002) filed March 27, 2003. |
| | |
18.2 | | Letter re: Change in Accounting Principles regarding the change in accounting for certain inventories (filed by incorporation by reference to the Annual Report on Form 10-K for the year ended December 31, 2006) filed February 22, 2007. |
| | |
18.3 | | Letter re: Change in Accounting Principles regarding the change in testing date for potential impairment of goodwill (filed by incorporation by reference to the Annual Report on Form 10-K for the year ended December 31, 2009) filed February 25, 2010. |
| | |
21 | | List of Subsidiaries of Ball Corporation. (Filed herewith.) |
| | |
23 | | Consent of Independent Registered Public Accounting Firm. (Filed herewith.) |
| | |
24 | | Limited Power of Attorney. (Filed herewith.) |
| | |
31.1 | | Certifications pursuant to Rule 13a-14(a) or Rule 15d-14(a), by John A. Hayes, Chairman President and Chief Executive Officer of Ball Corporation. (Filed herewith.) |
| | |
31.2 | | Certifications pursuant to Rule 13a-14(a) or Rule 15d-14(a), by Scott C. Morrison, SeniorExecutive Vice President and Chief Financial Officer of Ball Corporation. (Filed herewith.) |
| | |
32.1 | | Certifications pursuant to Rule 13a-14(b) or Rule 15d-14(b) and Section 1350 of Chapter 63 of Title 18 of the United States Code, by John A. Hayes, Chairman President and Chief Executive Officer of Ball Corporation. (Furnished herewith.) |
| | |
32.2 | | Certifications pursuant to Rule 13a-14(b) or Rule 15d-14(b) and Section 1350 of Chapter 63 of Title 18 of the United States Code, by Scott C. Morrison, SeniorExecutive Vice President and Chief Financial Officer of Ball Corporation. (Furnished herewith.) |
| | |
99 | | Cautionary statement for purposes of the safe harbor provisions of the Private Securities Litigation Reform Act of 1995, as amended. (Filed herewith.) |
| | |
Exhibit
Number | | Description of Exhibit |
|---|
| | |
|---|
101.INS | | Extensible Business Reporting Language (XBRL) Instance Document - the instance document does not appear in the Interactive Data File because its XBRL tags are embedded within the Inline XBRL document. |
101
| | |
101.SCH | | Inline XBRL Taxonomy Extension Schema Document. |
| | |
101.CAL | | Inline XBRL Taxonomy Extension Calculation Linkbase Document. |
| | |
101.DEF | | Inline XBRL Taxonomy Extension Definitions Linkbase Document. |
| | |
101.LAB | | Inline XBRL Taxonomy Extension Label Linkbase Document. |
| | |
101.PRE | | Inline XBRL Taxonomy Extension Presentation Linkbase Document. |
| | |
104 | | The following financial information from Ball Corporation’s Annual Report on Form 10-K for the year ended December 31, 2016,2021, formatted in Inline XBRL (Extensible Business Reporting Language)(contained in Exhibit 101): (i) the Consolidated Statements of Earnings, (ii) the Consolidated Statements of Comprehensive Earnings, (iii) the Consolidated Balance Sheets, (iv) the Consolidated Statements of Cash Flows, (v) the Consolidated Statements of Shareholders’ Equity and Comprehensive Earnings and (vi) Notes to the Consolidated Financial Statements. (Filed herewith.) |
* Represents a management contract or compensatory plan or agreement.
Item 16. Form 10-K Summary
Not applicable.
SIGNATURES
SIGNATURES
Pursuant to the requirements of Section 13 or 15(d) of the Securities Exchange Act of 1934, the registrant has duly caused this report to be signed on its behalf by the undersigned, thereunto duly authorized.
| | |
| BALL CORPORATION |
| (Registrant) |
| | |
| | |
| By: | /s/ John A. Hayes |
| | John A. Hayes |
| | Chairman President and Chief Executive Officer |
| | February 28, 201816, 2022 |
Pursuant to the requirements of the Securities Exchange Act of 1934, this report has been signed below by the following persons on behalf of the registrant and in the capacities and on the dates indicated.
| | | | (1) | Principal Executive Officer: | | | | | | | | | | /s/ John A. Hayes | | | Chairman President and Chief Executive Officer | | John A. Hayes | | | February 28, 201816, 2022 | | | | | | (2) | Principal Financial Officer: | | | | | | | | | | /s/ Scott C. Morrison | | | SeniorExecutive Vice President and Chief Financial Officer
| | Scott C. Morrison | | | February 28, 201816, 2022 | | | | | | (3) | Principal Accounting Officer: | | | | | | | | | | /s/ Nate C. Carey | | | Vice President and Controller | | Nate C. Carey | | | February 28, 201816, 2022 | | | | | | (4) | A Majority of the Board of Directors: | | | | | | | | | | /s/ Robert W. AlspaughJohn Bryant | * | | Director | | Robert W. AlspaughJohn Bryant
| | | February 28, 201816, 2022 | | | | | | | /s/ Michael J. Cave | * | | Director | | Michael J. Cave | | | February 28, 201816, 2022 | | | | | | | /s/ Hanno C. FiedlerDaniel W. Fisher | * | | Director | | Hanno C. FiedlerDaniel W. Fisher
| | | February 28, 201816, 2022 | | | | | | | /s/ John A. Hayes | * | | Chairman of the Board and Director | | John A. Hayes | | | February 28, 201816, 2022 | | | | | | | /s/ Daniel J. Heinrich | * | | Director | | John A. HayesDaniel J. Heinrich
| | | February 28, 201816, 2022 | | | | | | | /s/ R. David HooverDune Ives | * | | Director | | R. David HooverDune Ives
| | | February 28, 201816, 2022 | | | | | | | /s/ Pedro H. Mariani | * | | Director | | Pedro H. Mariani | | | February 28, 201816, 2022 |
| | | | | | /s/ Georgia R. Nelson | * | | Director | | Georgia R. Nelson | | | February 28, 201816, 2022 | | | | | |
| /s/ Cynthia A. Niekamp | * | | Director |
| Cynthia A. Niekamp | | | February 28, 201816, 2022 | | | | | | | /s/ Todd Penegor | * | | Director | | Todd Penegor | | | February 16, 2022 | | | | | | | /s/ Cathy D. Ross | * | | Director | | Cathy D. Ross | | | February 28, 201816, 2022 | | | | | | | /s/ George M. SmartBetty Sapp | * | | Director | | George M. SmartBetty Sapp
| | | February 28, 201816, 2022 | | | | | | | /s/ Theodore M. Solso
| *
| | Director
| | Theodore M. Solso
| | | February 28, 2018
| | | | | | | /s/ Stuart A. Taylor II | * | | Director | | Stuart A. Taylor II | | | February 28, 201816, 2022 |
* By John A. Hayes as Attorney-in-Fact pursuant to a Limited Power of Attorney executed by the directors listed above, which Power of Attorney has been filed with the Securities and Exchange Commission. | BALL CORPORATION | | (Registrant) | | | | | | | | By: | /s/ John A. Hayes | | | John A. Hayes | | | As Attorney-in-Fact | | | February 28, 201816, 2022 |
|