Our net product sales from Wal-Mart Stores, Inc. aggregated approximately 22.7%, 23.5%, and 24.2% of net product sales during the years ended December 31, 2021, 2020 and 2019, respectively. Our net sales from Dollar Tree, Inc. (which includes net sales from Family Dollar which is owned by Dollar Tree) aggregated approximately 12.1%, 11.7%, and 11.3% of net product sales during the years ended December 31, 2021, 2020 and 2019, respectively. Some of the aforementioned sales to Wal-Mart and Dollar Tree were sold to McLane Company, a large national grocery wholesaler, which services and delivers certain of the Company’s products to Wal-Mart, Dollar Tree and other retailers in the U.S.A. Net product sales revenues from McLane, which includes these Wal-Mart and Dollar Tree sales as well as sales and deliveries to other Company customers, were 21.0% in 2021 and 22.1% in 2020 and 17.7% in 2019. At December 31, 2021 and 2020, the Company’s three largest customers discussed above accounted for approximately 36% and 21% of total accounts receivable, respectively. Although no customer, other than McLane Company, Inc., Wal-Mart Stores, Inc. and Dollar Tree, accounted for more than 10% of net product sales, the loss of one or more significant customers could have a material adverse effect on the Company’s business. The Company historically offers extended credit terms for sales made under seasonal sales programs, including Halloween. Each year, after accounts receivables related to third quarter sales have been collected, the Company invests such funds in various marketable securities.
Sales revenues from Wal-Mart Stores, Inc. aggregated approximately 24.0%, 23.3%, and 23.7% of net product sales during the years ended December 31, 2017, 2016 and 2015, respectively. Some of the aforementioned sales to Wal-Mart are sold to McLane Company, a large national grocery wholesaler, which services and delivers certain of the Company’s products to Wal-Mart and other retailers in the U.S.A. Net product sales revenues from McLane, which includes these Wal-Mart sales as well as sales and deliveries to other Company customers, were 16.9% in 2017 and 16.3% in 2016 and 16.7% in 2015. Although no customer other than McLane Company, Inc. and Wal-Mart Stores, Inc. accounted for more than 10% of net product sales, the loss of one or more significant customers could have a material adverse effect on the Company’s business.
For a summary of sales and long-lived assets of the Company by geographic area see Note 9 of the “NotesNotes to Consolidated Financial Statements”Statements which is incorporated herein by reference.
4
Information regarding the Company’s Form 10-K, Form 10-Q, current reports on Form 8-K, and any amendments to these reports, will be made available, free of charge, upon written request to Tootsie Roll Industries, Inc., 7401 South Cicero Avenue, Chicago, Illinois 60629, Attention: Barry Bowen, Treasurer and Assistant Secretary. The Company does not make all such reports available on its website at www.tootsie.com because it believes that they are readily available from the Securities Exchange Commission at www.sec.gov, and because the Company provides them free of charge upon request. The information on our website is not incorporated into this Annual Report on Form 10-K. Interested parties, including shareholders, may communicate to the Board of Directors or any individual director in writing, by regular mail, addressed to the Board of Directors or an individual director, in care of Tootsie Roll Industries, Inc., 7401 South Cicero Avenue, Chicago, Illinois 60629, Attention: Ellen R. Gordon, Chairman and Chief Executive Officer. If an interested party wishes to communicate directly with the Company’s non-employee directors, it should be noted on the cover of the communication.
Significant factors that could impact the Company’s financial condition or results of operations include, without limitation, the following:
Risk factors which we believe affect all competitors in our industry
|
|
a. Significant reductions in demand for one or more of our products - Changes in demand may be caused by, among other things, the temporary inability of consumers to purchase our products due to illness, quarantine, travel restrictions, financial hardship, “shelter in place” directives, or overall fear to return to past behaviors.
5
Shifts in demand for one or more of our products, changes in trade and distribution patterns, or changes in consumer buying habits, if prolonged, could negatively impact our results.
b. The inability to meet our customers’ needs and achieve efficient production of finished products - Disruptions in our manufacturing operations or supply chain delivery disruptions caused by the loss or disruption of essential manufacturing ingredients, materials, supplies and services, transportation resources, workforce availability, or other manufacturing and distribution capability could have significant adverse effects on our business and financial results.
c. Significant adverse changes in the political conditions and government mandates or directives - In markets in which we manufacture, sell or distribute our products, governmental or regulatory actions, closures or other restrictions such as quarantine or travel restrictions, that limit or close our manufacturing, distribution or office facilities, or otherwise prevent our third-party suppliers, sales brokers, or customers from achieving the level of operations necessary for the production, distribution, sale, and support of our products, could negatively impact our results.
d. Risk related to Halloween and other seasonal sales - The Company’s net product sales are highest during the Halloween season which have historically comprised approximately 50% of third quarter domestic net product sales. Changes in consumer behavior, traditions, behaviors, and interest in Halloween activities and events, or changes mandated or recommended by government or health officials, as well as negative media coverage, could significantly affect the Company’s seasonal sales.
e. Risks relating to potential employer liability – The effects of Covid-19 relating to employer liability remains uncertain, and if it is determined that employers are to have liability for employee or other matters related to Covid-19, this could have significant adverse effects on our financial results.
| Risk of changes in the price and availability of ingredients and raw materials - The principal ingredients used by the Company are subject to price volatility. Although the Company engages in commodity hedging transactions and annual supply agreements as well as leveraging the high volume of its annual purchases, the Company may experience price increases in |
| Risk of changes in product performance and competition - The Company competes with other well-established manufacturers of confectionery products. A failure of new or existing products to be favorably received, a failure to retain preferred shelf space at retail or a failure to sufficiently counter aggressive promotional and price competition could have an adverse impact on the Company’s results of operations and financial condition. |
| Risk of discounting and other competitive actions - Discounting and pricing pressure by the Company’s retail customers and other competitive actions could make it more difficult for the Company to maintain its operating margins. Actions taken by major customers and competitors may make shelf space less available for |
| Risk of pricing actions |
| Risk related to seasonality of sales - The Company’s sales are highest during the Halloween |
6
| Halloween, such as, widespread adverse weather or other widespread events that affect consumer behavior and related media coverage at that time of year or general changes in consumer interest in Halloween, could significantly affect the Company’s sales. |
|
|
5
|
| Risk of changes in consumer preferences and tastes - Failure to adequately anticipate and react to changing demographics, consumer trends, consumer health concerns and product preferences, including product ingredients and packaging materials, could have an adverse impact on the Company’s results of operations and financial condition. |
| Risk of economic conditions on consumer purchases - The Company’s sales are impacted by consumer spending levels and impulse purchases which are affected by general macroeconomic conditions, consumer confidence, employment levels, disposable income, inflation, availability of consumer credit and interest rates on that credit, consumer debt levels, energy costs and other factors. Volatility in food and energy costs, rising unemployment and/or underemployment, declines in personal spending, |
| Risks related to environmental matters - The Company’s operations are not particularly impactful on the environment, but increased government environmental regulation or legislation, including various “green” initiatives could adversely impact the Company’s profitability. |
| ● | Risk of new governmental laws and regulations - Governmental laws and regulations, including those that affect food advertising and marketing to children, use of certain ingredients in products, new labeling requirements, income and other taxes and tariffs, including the effects of changes to international trade agreements, new taxes targeted toward confectionery products and the environment, both in and outside the U.S.A., are subject to change over time, which could adversely impact the Company’s results of operations and ability to compete in domestic or foreign marketplaces. |
| ● | Risk of labor stoppages - To the extent the Company experiences any significant labor stoppages, strikes or possible labor shortages, could negatively affect overall operations including production or shipments of finished product to customers. The Company’s union labor agreement at its Chicago plant was executed in 2018 and will continue through September 2022. |
| ● | Risk of the cost of energy increasing - Higher energy costs would likely result in higher plant overhead, distribution, freight and delivery, and other operating costs. The Company may not be able to offset these cost increases or pass such cost increases onto customers in the form of price increases, which could have an adverse impact on the Company’s results of operations and financial condition. In addition, higher energy costs also adversely affect the cost of many resins which are used as a foundation material for many of our packaging materials. |
| ● | Risk of a product recall - Issues related to the quality and safety of the Company’s products could result in a voluntary or involuntary large-scale product recall. Costs associated with a product recall and related litigation or fines, and marketing costs relating to the re-launch of such products or brands, could negatively affect operating results. In addition, negative publicity associated with this type of event, including a product recall relating to product contamination or product tampering, whether valid or not, could negatively impact future demand for the Company’s products. |
| ● | Risk of operational interruptions relating to computer software or hardware failures, including cyber-attacks - The Company is reliant on computer systems to operate its business and supply chain. Software failure or corruption, including cyber-based attacks or network security breaches, or catastrophic hardware or software failures or other disasters could disrupt communications, supply chain planning and activities relating to sales demand forecasts, materials procurement, production and inventory planning, customer orders, shipments, and collections, and financial and accounting, all of which could negatively impact sales and profits. |
7
| Risk of releasing sensitive information - Although the Company does not believe that it maintains a large amount of sensitive data, a system breach, whether inadvertent or perpetrated by hackers, could result in identity theft, ransomware and/or a disruption in operations which could expose the Company to financial costs and adversely affect profitability. |
| ● | Disruption to the Company’s supply chain could impair the Company’s ability to produce or deliver its finished products, resulting in a negative impact on operating results - Disruption to the manufacturing operations or supply chain, some of which are discussed above, could result from, but are not limited to adverse tariffs which could effectively limit supply or make supply more costly, natural disasters, pandemics, weather, fire or explosion, earthquakes, terrorism or other acts of violence, unavailability of ingredients or packaging materials which could result if our suppliers are unable to obtain certain raw materials or make timely deliveries, labor strikes or other labor activities, labor shortages including over-the-road truck drivers, logistical delays including materials from foreign locations, operational and/or financial instability of key suppliers, and other vendors or service providers. Although precautions are taken to mitigate the impact of possible disruptions, if the Company is unable, or if it is not financially feasible to effectively mitigate the likelihood or potential impact of such disruptive events, the Company’s results of operations and financial condition could be negatively impacted. |
Risk factors which we believe are principally specific to our Company (although some may apply to varying degrees to competitors in our industry)
| ● | Risks relating to participation in the multi-employer pension plan for certain Company union employees - As outlined in the Note 7 of the Company’s Notes to |
|
|
|
|
| Risk of impairment of goodwill or indefinite-lived intangible assets - In accordance with authoritative guidance, goodwill and indefinite-lived intangible assets are not amortized but are subject to an impairment evaluation annually or more frequently upon the occurrence of a triggering event. Other long-lived assets are likewise tested for impairment upon the occurrence of a triggering event. Such evaluations are based on assumptions and variables including sales growth, profit margins and discount rates. Adverse changes in any of these variables could affect the carrying value of these intangible assets and the Company’s reported profitability. |
|
|
6
|
|
|
|
|
|
|
| Risk of production interruptions - The majority of the Company’s products are manufactured in a single production facility on specialized equipment. In the event of a disaster, such as a fire or earthquake, at a specific plant location, or other disruption, it would be difficult to transfer production to other facilities or a new location in a timely manner, which could result in loss of market share for the affected products. In addition, from time to time, the Company upgrades or replaces this specialized equipment. In many cases these are integrated and complex installations. A failure or delay in implementing such an installation could impact the availability of one or more of the Company’s products which would have an adverse impact on sales and profits. |
| ● | Risk related to investments in marketable securities - The Company invests its surplus cash in a diversified portfolio of highly rated marketable securities, including corporate bonds, with maturities of generally up to three years, and variable rate demand notes with weekly resets of interest rates and “puts’ to redeem the investment each week. Nonetheless, such investments could become impaired in the event of certain adverse economic and/or geopolitical events which, if severe, would adversely affect the Company’s financial condition. |
8
| Risk of further losses in Spain - The Company has restructured its Spanish subsidiary and is exploring a variety of programs to increase sales and profitability. These efforts thus far are resulting in reductions in operating losses, and our efforts are continuing. Nonetheless, if our efforts are not successful, additional losses and impairments may be reported in the future. See also Management’s Discussion and Analysis. |
| ● | Risk of dependence on large customers - The Company’s largest customers, McLane Company, Wal-Mart and Dollar Tree, accounted for approximately 36% of net product sales in 2021, and other large national chains are also material to the Company’s sales. The loss of any of these customers, or one or more other large customers, or a material decrease in purchases by one or more large customers, could result in decreased sales and adversely impact the Company’s results of operations and financial condition. |
| ● | Risk related to acquisitions - From time to time, the Company has purchased other confectionery companies or brands. These acquisitions generally come at a high multiple of earnings and are justified based on various assumptions related to sales growth, and operating margins. Were the Company to make another acquisition and be unable to achieve the assumed sales and operating margins, it could have an adverse impact on future sales and profits. In addition, it could become necessary to record an impairment which would have a further adverse impact on reported profits. |
| ● | Risk of “slack fill” litigation - The Company, as well as other confectionery and food companies, have experienced a number of plaintiff claims that certain products are sold in boxes that are not completely full, and therefore such “slack filled” products are misleading, and even deceptive, to the consumer. Although the Company believes that these claims are without merit and has generally been successful in litigation and court decrees, the Company could be exposed to significant legal fees to defend its position, and in the event that it is not successful, could be subject to fines and costs of settlement, including class action settlements. |
| ● | Risk related to international operations - To the extent there |
|
|
|
|
|
|
7
|
|
|
|
|
| The Company is a controlled company due to the common stock holdings of the Gordon family - The Gordon family’s share ownership represents a majority of the combined voting power of all classes of the Company’s common stock as of December 31, |
The factors identified above are believed to be significant factors, but not necessarily all of the significant factors, that could impact the Company’s business. Unpredictable or unknown factors could also have material effects on the Company.
Additional significant factors that may affect the Company’s operations, performance and business results include the risks and uncertainties listed from time to time in filings with the Securities and Exchange Commission and the risk factors or uncertainties listed herein or listed in any document incorporated by reference herein.
ITEM 1B. Unresolved Staff Comments.
None.
89
The Company owns its principal manufacturing, warehousing and distribution, and offices facilities which are locatedfacilities. The Company’s largest operating facility in Chicago, Illinois also serves as the Corporate headquarters. The Company also owns domestic manufacturing, warehousing and distribution facilities in a building consisting of approximately 2,354,000 square feet.Tennessee (Covington), Massachusetts (Cambridge), and Wisconsin (Delavan) and international manufacturing facilities in Mexico (Mexico City), Spain (Barcelona) and two in Canada (Concord, Ontario). In addition, the Company leases manufacturing and warehousing facilities at a second location in Chicago which comprises 137,000 square feet.Chicago. The lease is renewable by the Company every five years through June 2041; the Company expects to renew this lease prior to termination. The Company also periodically leases additional warehousing space at this second location as needed on a month-to-month basis.2041.
The Company’s other principal manufacturing, warehousing and distribution facilities, all of which are owned, are:
|
| ||
|
| ||
|
| ||
|
| ||
|
|
| |
|
|
| |
|
| ||
|
|
|
|
|
|
|
|
|
|
|
The Company owns substantially all of the production machinery and equipment located in its plants.plants, warehouses and distribution centers. The Company also holds four commercial real estate properties for investment which were acquired with the proceeds from a sale of surplus real estate in 2005.2005 as well as two warehouse facilities (in Concord, Ontario, Canada, and Hazelton, Pennsylvania, USA) that are currently leased to third parties.
There are no material pendingIn the ordinary course of business, the Company is, from time to time, subject to a variety of active or threatened legal proceedings knownand claims. While it is not possible to predict the Companyoutcome of such matters with certainty, in the Company’s opinion, both individually and in the aggregate, they are not expected to which the Company or any of its subsidiaries ishave a party or of which any of their property is the subject, and no penalties have been imposed by the Internal Revenue Servicematerial effect on the Company.Company’s financial condition, results of operations or cash flows.
ADDITIONAL ITEM. Executive Officers of the Registrant.
See the information on Executive Officers set forth in the table in Part III, Item 10.
ITEM 4. Mine Safety Disclosures.
None.
910
PART II
ITEM 5. Market for Registrant’s Common Equity, Related Stockholder Matters and Issuer Purchases of Equity Securities.
The Company’s common stock is traded on the New York Stock Exchange. The Company’s Class B common stock is subject to restrictions on transferability. The Class B common stock is convertible at the option of the holder into shares of common stock on a share-for-share basis. As of March 1, 2018,February 21, 2022 there were approximately 2,6002,300 and 1,000900 registered holders of record of common and Class B common stock, respectively. In addition, the Company estimates that as of March 1, 2018February 21, 2022 there were 12,50021,000 and 4,3001,000 beneficial holders of common and Class B common stock, respectively.
The following table sets forth information about the shares of its common stock the Company purchased on the open market during the fiscal quarter ended December 31, 2017:
Issuer Purchases of Equity Securities
|
|
|
|
|
|
|
|
|
|
|
|
|
|
|
|
|
| Total Number of |
| Maximum Number (or |
|
|
| Total |
| Average |
| Shares Purchased |
| Approximate Dollar Value) |
| |
|
| Number |
| Price |
| as Part of Publicly |
| of Shares that May Yet |
| |
|
| of Shares |
| Paid per |
| Announced Plans |
| be Purchased Under the |
| |
Period |
| Purchased |
| Share |
| or Programs |
| Plans or Programs |
| |
|
|
|
|
|
|
|
|
|
|
|
Oct 1 to Oct 31 |
| — |
| $ | — |
| Not Applicable |
| Not Applicable |
|
Nov 1 to Nov 30 |
| 54,631 |
|
| 36.36 |
| Not Applicable |
| Not Applicable |
|
Dec 1 to Dec 31 |
| 58,028 |
|
| 36.45 |
| Not Applicable |
| Not Applicable |
|
Total |
| 112,659 |
| $ | 36.40 |
|
|
|
|
|
While the Company does not have a formal or publicly announceddividend policy, but has historically issued quarterly dividends and in 2021 issued a quarterly dividend of $0.09 per share. The Company commonhas also historically distributed an annual 3% stock purchase program,dividend. While the Company repurchases its common stock on the open market from timeplans to time as authorized by the Board of Directors.
Quarterly Stock Prices and Dividends
The high and lowcontinue to issue quarterly prices for the Company’s common stock, as reported on the New York Stock Exchange and quarterly dividends in 2017 and 2016 were:
|
|
|
|
|
|
|
|
|
|
|
|
|
|
|
|
|
|
|
|
|
|
|
|
|
|
| 2017 |
| 2016 | ||||||||||||||||||||
|
| 4th |
| 3rd |
| 2nd |
| 1st |
| 4th |
| 3rd |
| 2nd |
| 1st | ||||||||
|
|
| Quarter |
|
| Quarter |
|
| Quarter |
|
| Quarter |
|
| Quarter |
|
| Quarter |
|
| Quarter |
|
| Quarter |
|
|
|
|
|
|
|
|
|
|
|
|
|
|
|
|
|
|
|
|
|
|
|
|
|
High |
| $ | 38.45 |
| $ | 38.00 |
| $ | 38.90 |
| $ | 40.55 |
| $ | 41.55 |
| $ | 38.44 |
| $ | 39.54 |
| $ | 34.98 |
Low |
|
| 34.75 |
|
| 34.95 |
|
| 34.45 |
|
| 37.00 |
|
| 34.35 |
|
| 36.48 |
|
| 34.08 |
|
| 30.41 |
Dividends per share |
|
| 0.09 |
|
| 0.09 |
|
| 0.09 |
|
| 0.09 |
|
| 0.09 |
|
| 0.09 |
|
| 0.09 |
|
| 0.09 |
NOTE: In addition to the above cash dividends a 3%and the annual stock dividend was issued on April 17, 2017 and April 8, 2016. there can be no assurance that it will continue to do so in the future.
10
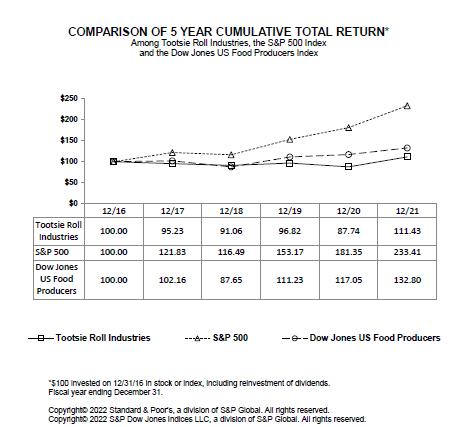
Performance Graph
The following performance graph compares the cumulative total shareholder return on the Company’s common stock for a five-year period (December 31, 20122016 to December 31, 2017)2021) with the cumulative total return of Standard & Poor’s 500 Stock Index (“S&P 500”) and the Dow Jones Industry Food Index (“Peer Group,” which includes the Company), assuming (i) $100 invested on December 31 of the first year of the chart in each of the Company’s common stock, S&P 500 and the Dow Jones Industry Food Index and (ii) the reinvestment of cash and stock dividends.
![]()
11
ITEM 6. Selected Financial Data.
Five Year Summary of Earnings and Financial Highlights
(Thousands of dollars except per share, percentage and ratio figures)
| | | | | | | | | | | | | | | | |
|
| 2021 |
| 2020 |
| 2019 |
| 2018 |
| 2017 |
| |||||
Sales and Earnings Data | | | | | | | | | | | | | | | | |
Net product sales | | $ | 566,043 | | $ | 467,427 | | $ | 523,616 | | $ | 515,251 | | $ | 515,674 | |
Product gross margin | |
| 195,938 | |
| 167,717 | |
| 194,514 | |
| 185,371 | |
| 189,263 | |
Interest expense | |
| 46 | |
| 164 | |
| 220 | |
| 181 | |
| 144 | |
Provision for income taxes | |
| 20,421 | |
| 17,288 | |
| 20,565 | |
| 16,401 | |
| 3,907 | |
Net earnings attributable to Tootsie Roll Industries, Inc. | |
| 65,326 | |
| 58,995 | |
| 64,920 | |
| 56,893 | |
| 80,864 | (2) |
% of net product sales | |
| 11.5 | % |
| 12.6 | % |
| 12.4 | % |
| 11.0 | % |
| 15.7 | % |
% of shareholders’ equity | |
| 8.5 | % |
| 7.7 | % |
| 8.5 | % |
| 7.6 | % |
| 11.0 | % |
Per Common Share Data (1) | | | | | | | | | | | | | | | | |
Net earnings attributable to Tootsie Roll Industries, Inc. | | $ | 0.97 | | $ | 0.86 | | $ | 0.94 | | $ | 0.81 | | $ | 1.14 | (2) |
Cash dividends declared | |
| 0.36 | |
| 0.36 | |
| 0.36 | |
| 0.36 | |
| 0.36 | |
Stock dividends | |
| 3 | % |
| 3 | % |
| 3 | % |
| 3 | % |
| 3 | %�� |
Additional Financial Data (1) | | | | | | | | | | | | | | | | |
Working capital | | $ | 188,333 | | $ | 250,851 | | $ | 273,786 | | $ | 242,655 | | $ | 207,132 | |
Net cash provided by operating activities | |
| 85,298 | |
| 74,710 | |
| 100,221 | |
| 100,929 | |
| 42,973 | |
Net cash provided by (used in) investing activities | |
| (91,899) | |
| 9,501 | |
| (15,009) | |
| (44,510) | |
| (9,320) | |
Net cash used in financing activities | |
| (54,146) | |
| (55,846) | |
| (57,187) | |
| (42,353) | |
| (56,881) | |
Property, plant & equipment additions | |
| 31,426 | |
| 17,970 | |
| 20,258 | |
| 27,612 | |
| 16,673 | |
Net property, plant & equipment | |
| 208,906 | |
| 187,328 | |
| 188,455 | |
| 186,101 | |
| 178,972 | |
Total assets | |
| 1,018,618 | |
| 984,558 | |
| 977,864 | |
| 947,361 | |
| 930,946 | |
Long-term debt | |
| 7,500 | |
| 7,500 | |
| 7,500 | |
| 7,500 | |
| 7,500 | |
Total Tootsie Roll Industries, Inc. shareholders’ equity | |
| 769,042 | |
| 763,327 | |
| 759,854 | |
| 750,622 | |
| 733,840 | |
Average shares outstanding | |
| 67,431 | |
| 68,482 | |
| 69,386 | |
| 70,042 | |
| 70,874 | |
|
|
|
|
|
|
|
|
|
|
|
|
|
|
|
|
|
|
| 2017 |
| 2016 |
| 2015 |
| 2014 |
| 2013 |
| |||||
Sales and Earnings Data |
|
|
|
|
|
|
|
|
|
|
|
|
|
|
|
|
Net product sales |
| $ | 515,674 |
| $ | 517,373 |
| $ | 536,692 |
| $ | 539,895 |
| $ | 539,627 |
|
Product gross margin |
|
| 189,750 |
|
| 197,083 |
|
| 196,602 |
|
| 198,962 |
|
| 188,667 |
|
Interest expense |
|
| 144 |
|
| 105 |
|
| 76 |
|
| 99 |
|
| 92 |
|
Provision for income taxes |
|
| 3,907 |
|
| 30,593 |
|
| 26,451 |
|
| 28,434 |
|
| 23,634 |
|
Net earnings attributable to Tootsie Roll Industries, Inc. |
|
| 80,864 |
|
| 67,510 |
|
| 66,089 |
|
| 63,298 |
|
| 60,849 |
|
% of net product sales |
|
| 15.7 | % |
| 13.0 | % |
| 12.3 | % |
| 11.7 | % |
| 11.3 | % |
% of shareholders’ equity |
|
| 11.0 | % |
| 9.5 | % |
| 9.5 | % |
| 9.2 | % |
| 8.9 | % |
Per Common Share Data (1) |
|
|
|
|
|
|
|
|
|
|
|
|
|
|
|
|
Net earnings attributable to Tootsie Roll Industries, Inc. |
| $ | 1.28 |
| $ | 1.05 |
| $ | 1.02 |
| $ | 0.96 |
| $ | 0.91 |
|
Cash dividends declared |
|
| 0.36 |
|
| 0.36 |
|
| 0.35 |
|
| 0.32 |
|
| 0.32 |
|
Stock dividends |
|
| 3 | % |
| 3 | % |
| 3 | % |
| 3 | % |
| 3 | % |
Additional Financial Data (1) |
|
|
|
|
|
|
|
|
|
|
|
|
|
|
|
|
Working capital |
| $ | 207,132 |
| $ | 235,739 |
| $ | 221,744 |
| $ | 200,162 |
| $ | 179,990 |
|
Net cash provided by operating activities |
|
| 42,973 |
|
| 98,550 |
|
| 91,073 |
|
| 88,769 |
|
| 109,823 |
|
Net cash provided by (used in) investing activities |
|
| (9,343) |
|
| (51,884) |
|
| (8,523) |
|
| (30,459) |
|
| (47,963) |
|
Net cash used in financing activities |
|
| (56,881) |
|
| (51,387) |
|
| (53,912) |
|
| (44,664) |
|
| (37,425) |
|
Property, plant & equipment additions |
|
| 16,673 |
|
| 16,090 |
|
| 15,534 |
|
| 10,704 |
|
| 15,752 |
|
Net property, plant & equipment |
|
| 178,972 |
|
| 180,905 |
|
| 184,586 |
|
| 190,081 |
|
| 196,916 |
|
Total assets |
|
| 930,946 |
|
| 920,101 |
|
| 908,983 |
|
| 910,386 |
|
| 888,409 |
|
Long-term debt |
|
| 7,500 |
|
| 7,500 |
|
| 7,500 |
|
| 7,500 |
|
| 7,500 |
|
Total Tootsie Roll Industries, Inc. shareholders’ equity |
|
| 733,840 |
|
| 711,364 |
|
| 698,183 |
|
| 690,809 |
|
| 680,305 |
|
Average shares outstanding |
|
| 63,179 |
|
| 64,086 |
|
| 65,103 |
|
| 66,020 |
|
| 66,857 |
|
| (1) |
| Per common share data and average shares outstanding adjusted for annual 3% stock dividends. |
| (2) | The 2017 net earnings and earnings per share includes $20,318 or $0.29 per share relating to a favorable accounting adjustment to revalue the Company’s deferred income tax liabilities resulting from the enactment of the U.S. Tax Cuts and Jobs Act in December 2017. |
12
ITEM 7. Management’s Discussion and Analysis of Financial Condition and Results of Operations.
(Thousands(Thousands of dollars except per share, percentage and ratio figures)
The following discussion should be read in conjunction with the other sections of this report, including the consolidated financial statements and related notes contained in Item 8 of this Form 10-K.
FINANCIAL REVIEW
This financial review discusses the Company’s financial condition, results of operations, liquidity and capital resources, significant accounting policies and estimates, new accounting pronouncements, market risks and other matters. It should be read in conjunction with the Consolidated Financial Statements and related Notes that follow this discussion.
FINANCIAL CONDITION
The Company’s overall financial position remains strong as a result of net earnings increasing from $67,318 in 2016 to 80,654 in 2017, andgiven that aggregate cash, cash equivalents and investments including long-term investments, of $328,430is $436,983 at December 31, 2017.2021, including $89,736 in trading securities discussed below. Cash flows from 20172021 operating activities totaled $42,973$85,298 compared to $74,710 in 2020, and are discussed in the section entitled Liquidity and Capital Resources. During 2017,2021, the Company paid cash dividends of $22,621,$24,136, purchased and retired $34,133$30,184 of its outstanding shares, and made capital expenditures of $16,673.$31,426.
The Company’s net working capital was $207,132$188,333 at December 31, 20172021 compared to $235,739$250,851 at December 31, 2016 which generally2020. This change principally reflects lower aggregate cash, cash equivalents and short-term investments.the effects of a $71,155 increases in long-term investments because more of our investments have maturities greater than one year at December 31, 2021 compared to December 31, 2020. As of December 31, 2017,2021, the Company’s total cash, cash equivalents and investments, including all long-term investments, in marketable securities, was $328,430$436,983 compared to $351,323$428,951 at December 31, 2016, a decrease2020, an increase of $22,893, which generally reflects increases in prepaid expenses and current income taxes receivable as well as payments of deferred compensation in 2017.$8,032. See Liquidity And Capital Resources section below. The aforementioned includes $60,520$89,736 and $67,995$73,828 of investments in trading securities as of December 31, 20172021 and 2016,2020, respectively. The Company invests in trading securities to provide an economic hedge for its deferred compensation liabilities, as further discussed herein and in Note 7 of the Company’s Notes to Consolidated Financial Statements.
Shareholders’ equity increased from $711,364$763,327 at December 31, 20162020 to $733,840$769,041 as of December 31, 2017,2021, which principally reflecting 2017reflects 2021 net earnings of $80,864,$65,326, less cash dividends of $22,621,$24,136 and share repurchases of $34,133, and an increase in accumulated other comprehensive loss, primarily foreign translation, of $1,545 during 2017.$30,184.
The Company has a relatively straight-forward financial structure and has historically maintained a conservative financial position. Except for an immaterial amount of operating leases, theThe Company has no special financing arrangements or “off-balance sheet” special purpose entities. Cash flows from operations plus maturities of short-term investments are expected to be adequate to meet the Company’s overall financing needs, including capital expenditures, in 2018.2021. Periodically, the Company considers possible acquisitions, and if the Company were to pursue and complete such an acquisition, that could result in bank borrowings or other financing.
RESULTS OF OPERATIONS
20172021 vs. 20162020
Twelve months 20172021 consolidated net product sales were $515,674$566,043 compared to $517,373$467,427 in twelve months 2016, a decrease2020, an increase of $1,699$98,616 or 0.3%21.1%. Twelve months 2017 consolidatedFourth quarter 2021 net product sales were adversely affected by currency translation of $2,047 due to a stronger U.S. dollar in 2017$166,598 compared to 2016, principally relating to the Company’s Mexican subsidiary. Fourth quarter 2017 net sales were $125,179 compared to $124,279$127,866 in fourth quarter 2016,2020, an increase of $900$38,732, or 0.7%30%. Unfavorable foreign exchange, primarily Mexico, also contributed to lower salesThe growth in fourth quarter 2017 comparedand twelve months 2021 sales reflect effective sales and marketing programs as well as the favorable effects of the continuing economic recovery from the adverse effects of the Covid-19 pandemic. The Company had continuing improvement in customer orders and sales throughout 2021 as consumers returned to more activities which included planned purchases of the Company’s products for “sharing” and “give-a-way” occasions. Many of the Company’s products are consumed at group events, outings, and other gatherings which had been significantly curtailed or in some cases eliminated in response to the Covid-19 virus. Fourth quarter 2021 sales also exceeded fourth quarter 2019 sales by 24% which provides a quarterly sales comparison to a period prior year corresponding period. The Company’s unit selling prices and price realization in 2017 was consistent with 2016. Theto the
13
Company’spandemic, and twelve months 2021 sales results inwere 8% ahead of twelve months 2019 sales. Fourth quarter 2021 sales also benefited from the United States continuetiming of some sales that were rescheduled from third to reflect the challenges of many of the Company’s retail customers including their profit margin pressures and other competitive factors.fourth quarter due to supply chain disruptions.
Product cost of goods sold were $325,924$370,105 in 20172021 compared to $320,290$299,710 in 2016,2020, an increase of $5,634$70,395 or 1.8%23.5%. Product cost of goods sold includes $1,953$687 and $1,137$610 in certain deferred compensation expenses in 20172021 and 2016,2020, respectively. These deferred compensation expenses principally result from changes in the market value of investments and investment income from trading securities relating to compensation deferred in previous years and are not reflective of current operating results. Adjusting for the aforementioned, product cost of goods sold increased from $319,153$299,100 in 20162020 to $323,971$369,418 in 2017,2021, an increase of $4,818$70,318 or 1.5%23.5%. As a percent of net product sales, these adjusted costs increased from 61.7%64.0% in 20162020 to 62.8%65.3% in 2017, an2021, a 1.3 unfavorable increase of 1.1% as a percent of net product sales. Higherpercentage point change. Fourth quarter and twelve months 2021 gross profit margins were adversely affected by increasing costs for ingredients, packaging materials, and certain manufacturing plant overhead, including increases in wages, salariessupplies and benefits, contributed to higherservices. Fourth quarter and twelve months product cost of goods sold compared to the corresponding prior year periods, were also adversely impacted by inefficiencies caused by higher than expected sales demand, supply chain challenges and adversely affecteddisruptions, longer supplier lead times, and some labor shortages. These factors resulted in additional costs related to our efforts to meet this higher demand. Certain cost and expense reductions, including Company initiatives to reduce costs did provide some benefit to 2021 gross profit margins in 2017 compared to 2016. Continuing improvements in manufacturing plant efficiencies driven by capital investments and ongoing cost containment programs mitigated some of these higher costs and expenses. The Company is continuing its focus on capital expenditures that will result in operational efficiencies and cost reductions, as well as product improvements.margins.
Selling, marketing and administrative expenses were $120,977$132,108 in 20172021 compared to $107,377$112,117 in 2016,2020, an increase of $13,600$19,991 or 12.7%17.8%. Selling, marketing and administrative expenses include $8,024$13,521 and $3,138$11,909 in certain deferred compensation expenses in 20172021 and 2016,2020, respectively. These deferred compensation expenses principally result from changesincreases in the market value of investments and investment income from trading securities relating to compensation deferred in previous years and are not reflective of current operating results. Adjusting for the aforementioned, theseselling, marketing and administrative expenses increased from $104,239$100,208 in 20162020 to $112,953$118,587 in 2017,2021, an increase of $8,714$18,379 or 8.4%18.3%. AsThis increase was principally driven by the increase in certain variable expenses, primarily freight and delivery and direct selling expenses, relating to the increase in sales as discussed above. However, as a percent of net product sales, these adjusted expenses increaseddecreased from 20.1%21.4% of net product sales in 20162020 to 21.9%21.0% of net product sales in 2017,2021, a 1.7% unfavorable increase as a0.4 favorable percentage of sales.point change.
Selling, marketing and administrative expenses include freight, delivery and warehousing expenses. These expenses increased from $40,629$42,593 in 20162020 to $43,973$55,289 in 2017,2021, an increase of $3,344$12,696 or 8.2%29.8%. As a percent of net product sales, these adjusted expenses increased from 7.9%9.1% in 20162020 to 8.5%9.8% in 2017, an2021, a 0.7 unfavorable increasepercentage point change. Increasing energy costs and related effects on fuel surcharges, and the adverse effects of 0.6% as a percentthe continuing shortage of net product sales. Increasingover-the-road drivers and high demand for over-the-road truckcarriers, were the principal drivers of these higher freight and delivery expenses in 2021 compared to 2020.
In response to the higher input costs discussed above, the confectionary industry, as well as many companies in the broader consumer products industry, announced increases in selling prices. We have followed with price increases as well, with the objective of improving sales price realization and an imbalance in supply and demand for freight carriers, has resulted in higher prices for these services, particularlyrestoring margin declines. Price increases, which principally became effective during fourth quarter 2021, contributed to the improved results in fourth quarter 2017. There is a shortage of over-the-road trucks and truck drivers, and2021 as well as the Company expects these related cost pressurestwelve months 2021. Price increases for certain products that were not increased in 2021 have also been announced for first half 2022 in our continuing efforts to continue in 2018. Increases in marketing and sales expenses relatingrestore margins.
Our input costs continued to new product development and packaging changes to comply with product labeling requirements also contributed to higher selling, marketing and administrative expenses in 2017 compared to 2016, and these expenses also were much higherremain elevated in fourth quarter 2017.2021 and we expect even higher costs in 2022 as our 2021 supply contracts and hedging programs come to closure and new contracts and hedging at higher 2022 costs begin to take effect. Higher commodity markets are driving up our costs for key ingredients, packaging materials and energy, including the adverse effects of higher energy costs on freight and delivery fuel surcharges and plant manufacturing utilities. We expect these higher input costs and the overall increase in inflation, some of which is driven by supply chain problems, to continue through most of, and possibly all of, 2022. The Company uses the Last-In-First-Out (LIFO) method of accounting for inventory and costs of goods sold which results in lower current income taxes during such periods of increasing costs, but this method does charge the most current costs to cost of goods sold and thereby accelerates the realization of these higher costs. Although the Company continues to monitor these higher input costs and price increases in the industry, we are mindful of the effects and limits of passing on all of the above discussed higher input costs to consumers of our products. As a result, we believe that margins for part or all of 2022 will not fully recover to historical norms.
14
The Company has foreign operating businesses in Mexico, Canada and Spain, and exports products to many foreign markets. Such foreign sales were $43,452 and comprised 8%The Company’s Spanish subsidiary (97% owned by the Company) incurred an operating loss of the Company’s consolidated net product sales$598 in 2017. In fourth quarter 2017, the Company recorded a pre-tax impairment charge of $2,371 relating2021 which was an improvement compared to its Spanish subsidiaries. The Company currently has a 97% ownership of two Spanish companies (93% ownership at December 31, 2016). During 2017 and 2016, these Spanish subsidiaries incurred operating losses of $3,212 and $1,689, respectively, and the Company provided approximately $2,734 and $886, respectively, of additional cash to finance these losses.$691 loss in 2020. Company management expects the competitive and business challenges in Spain to continue and expectsbut believes that there will be continued reductions in operating losses in 20182022 compared to 2021. Nonetheless, management believes that operating losses will likely continue beyond 2022 and likely beyond; andthat these future losses, as well as some capital expenditures, will likely require some additional cash financing.
The Company believes that the carrying values of its goodwill and trademarks have indefinite lives as they are expected to generate cash flows indefinitely. In accordance with current accounting guidance, these indefinite-lived intangible assets are assessed at least annually for impairment as of December 31 or whenever events or circumstances indicate that the carrying values may not be recoverable from future cash flows. No impairments were recorded in 2017, 20162021, 2020 or 2015.2019. Current accounting guidance provides entities an option of performing a qualitative assessment (a "step-zero" test) before performing a quantitative analysis. If the entity determines, on the basis of certain qualitative factors, that it is more-likely-than-not that the intangibles (goodwill and certain trademarks) are not impaired, the entity would not need to proceed to the two step impairment testing process (quantitative analysis) as prescribed in the guidance. During fourth quarter 2017,2021 (and fourth quarters 2020 and 2019), the Company performed a “step zero” test of its goodwill and certain trademarks, and concluded that there was no impairment based on this guidance. For the fair value assessment of certain trademarks where the “step-zero” analysis was not considered appropriate, impairment testing was performed in fourth quarter 20172021 (and fourth quarters 2020 and 2019) using discounted cash flows and
14
estimated royalty rates. For these trademarks, holding all other assumptions constant at the test date, a 100 basis point increase in the discount rate or a 100 basis point decrease in the royalty rate would reduce the fair value of suchthese trademarks by approximately 16% and 10%, respectively. Individually, a 100 basis point increase in the discount rate or a 100 basis point decrease in the royalty rate would not result in a potential impairment of these trademarks as of December 31, 2017.2021.
Earnings from operations were $71,416$67,133 in 20172021 compared to $92,414$58,244 in 2016, a decrease2020, an increase of $20,998.$8,889. Earnings from operations include $9,977$14,208 and $4,275$12,519 in certain deferred compensation expense in 20172021 and 2016,2020, respectively, which are discussed above. Adjusting for these deferred compensation expenses, adjusted earnings from operations decreasedincreased from $96,689$70,763 in 20162020 to $81,393$81,341 in 2017, a decrease2021, an increase of $15,296$10,578 or 15.8%14.9%. Twelve months results were adversely affected by lower gross profit margins, includingThe above discussed increase in net product sales was the effectsprincipal driver of higher operating earnings in 2021 compared to 2020. Although higher 2021 sales contributed to improved operating earnings compared to the corresponding prior year periods, higher input costs and expenses for ingredients, packaging materials, and manufacturing plant overhead as discussed above. In addition, earnings from operations were also adversely affected by higher selling, marketing and administrative expenses, primarily freight and delivery, marketing and sales expenses relating to new product development and packaging changes to comply with product labeling requirements, and declines in foreign results and an impairmentmitigated much of foreign subsidiaries, allthe benefits of which are discussed above. Many of these increased costs and expenses accelerated in fourth quarter 2017. sales.
Management believes the comparisons presented in the preceding paragraphs, after adjusting for changes in deferred compensation, are more reflective of the underlying operations of the Company.
Other income, net was $13,145$18,596 in 20172021 compared to $5,498$18,018 in 2016,2020, an increase of $7,647.$578. Other income, net principally reflects $9,977$14,208 and $4,275$12,519 of aggregate net gains and investment income on trading securities in 20172021 and 2016,2020, respectively. These trading securities provide an economic hedge of the Company’s deferred compensation liabilities; and the related net gains and investment income were offset by a like amount of expense in aggregate product cost of goods sold and selling, marketing, and administrative expenses in the respective years as discussed above. Other income, net includes investment income on available for sale securities including variable rate demand notes, of $2,851$2,740 and $2,130$4,005 in 20172021 and 2016,2020, respectively. Other income, net also includes foreign exchange gains/(losses)gains of $259$667 and $(955)$534 in 20172021 and 2016,2020, respectively.
In connection with enactment of the U.S. Tax Cuts and Jobs Act (Tax Reform Act) in December 2017, the Company recorded a favorable accounting adjustment of $20,318, or $0.32 per share, during the fourth quarter of 2017. This reflects the estimated benefit from the revaluation of net deferred income tax liabilities based on the new lower U.S. corporateThe Company’s effective income tax rate effective January 1, 2018. U.S. tax reform also includes a one-time toll charge resulting fromwas 23.8% and 22.7% in 2021 and 2020, respectively. The increase in the mandatory deemed repatriation of undistributed foreign earnings and profits. The Company determined that there were no net undistributed foreign earnings and profits subject to this toll charge. Based on SEC guidance in Staff Accounting Bulletin No. 118, the Company considers its accounting for the effects of U.S. tax reform to be provisional as of December 31, 2017. The ultimate impact may differ from these provisional amounts, possibly materially, due to, among other things, additional regulatory guidance that may be issued by the Internal Revenue Service and state authorities.
The consolidated effective tax rate was 4.6% and 31.2%rates in 2017 and 2016, respectively. The principal drivers of the lower 2017 effective2021 generally reflects higher rates for state income tax rate are the effects of U.S. tax reform and a worthless stock deduction relating to the Company’s Spanish subsidiaries, which favorably reduced the Company’s effective 2017 tax rate by 24.2% and 3.8%, respectively.provisions. A reconciliation of the differences between the U.S. statutory rate and these effective tax rates is provided in Note 4 of the Company’s Notes to Consolidated Financial Statements. At December 31, 2017 and 2016, the Company’s deferred tax assets include $3,740 and $6,346 of income tax benefits relating to its Canadian subsidiary tax loss carry-forwards which the Company expects to realize before their expiration dates (2029 through 2031). The Company utilized $2,606 and $1,776 of these tax carry-forward benefits in 2017 and 2016, respectively. The Company has concluded that it is more-likely-than-not that it would realize these deferred tax assets relating to its Canadian tax loss carry-forwards because it is expected that sufficient levels of taxable income will be generated during the carry-forward periods.
The Company has provided a full valuation allowance on its Spanish subsidiaries’ tax loss carry-forward benefits of $3,038$4,376 and $2,106$4,508 as of December 31, 20172021 and 2016,2020, respectively, because the Company has concluded that it is not more-likely-than-not that these losses will be utilized before their expiration dates. The Spanish subsidiaries havesubsidiary has a history of net operating losses and it is not known when and if they will generate taxable income in the future.
15
U.S. tax reform changes(US Tax Cuts and Jobs Act enacted in December 2017) changed the United States approach to the taxation of foreign earnings to a territorial system by providing a one hundred percent dividends received deduction for certain qualified dividends received from foreign subsidiaries. These provisions of the U.S. tax reform significantly impact the accounting for the undistributed earnings of foreign subsidiaries, and as a result the Company intends to distribute approximately $10,000 of the earnings held in excess cash by its foreign subsidiaries in 2018.subsidiaries. The tax costs associated with a future distribution, including foreign withholding taxes, are not material to the Company’s financial statements. After carefully considering these facts, the Company has determined that it willwould not be asserting permanent reinvestment of all of its foreign subsidiaries earnings as of December 31, 2017.2017, and the Company continued to take this position as of December 31, 2021.
Net earnings attributable to Tootsie Roll Industries, Inc. were $80,864$65,326 in 20172021 compared to $67,510$58,995 in 2016,2020, and net earnings per share were $1.28$0.97 and $1.05$0.86 in 20172021 and 2016,2020, respectively, an increase of $0.23$0.11 per share or 21.9%13%. The increase in earningsEarnings per share in 2017 principally resulted from U.S. tax reform ($20,318 or $.32 per share), however, many of the above discussed increases in input costs and operating expenses and the impairment of the Company’s Spanish subsidiaries adversely affected 2017 net earnings when compared to 2016. In addition, 2017 earning per share2021 benefited from the reduction in average shares outstanding resulting from purchases of the Company’s common stock in the open market by the Company. Average shares outstanding decreased from 64,08668,482 in 20162020 to 63,17967,431 in 2017.2021 which reflects share repurchases of $30,184 during 2021.
Fourth quarter 20172021 and 2020 net earnings attributable to Tootsie Roll Industries, Inc. were $31,985 compared to $17,841 in fourth quarter 2016,$20,032 and $14,952, respectively, and net earnings per share were $0.51$0.30 and $0.28 in fourth quarter 2017 and 2016,$0.22, respectively, an increase of $0.23$0.08 per share or 82.1%36%. This increase wasThe Company’s fourth quarter 2021 results were principally driven by the favorable accounting adjustment relating to U.S. tax reform of $20,318, or $0.32 per share. Higher input costs and expenses as discussed above also adversely affected fourth quarter results, and many of the input cost increases, primarily freight and delivery, acceleratedits 30% increase in fourth quarter 2017 compared tosales and price increases that became effective in fourth quarter 2016.2021 as discussed above.
Beginning in 2012, the Company received periodic notices from the Bakery and Confectionery Tobacco WorkersUnion and Grain MillersIndustry International Union Pension PlanFund (Plan), a multi-employer defined benefit pension plan for certain Company union employees, that the Plan’s actuary certified the Plan to be in “critical status”, the “Red Zone”, as defined by the Pension Protection Act (PPA) and the Pension Benefit Guaranty Corporation (PBGC); and that a plan of rehabilitation was adopted by the trustees of the Plan in fourth quarter 2012. During 2015, the Company received notices that theThe Plan’s status was changed to “critical and declining status”, as defined by the PPA and PBGC, for the plan year beginning January 1, 2015, and that the Plan was projected to have an accumulated funding deficiency for the 2017 through 2024 plan years. A designation of “critical and declining status” implies that the Plan is expected to become insolvent in the next 20 years. In second quarter 2016, theThe Company received newhas continued to receive annual notices each year (2016 to 2021) that the Plan’s trustees adopted an updated Rehabilitation Plan effective January 1, 2016, and that thethis Plan remains in “critical and declining status” and is projected to become insolvent within the year 2030.next 20 years. These new notices have also adviseadvised that the Plan trustees were considering the reduction or elimination of certain retirement benefits and may seek assistance from the PBGC. Plans in “critical and declining status” may elect to suspend (temporarily or permanently) some benefits payable to all categories of participants, including retired participants, except retirees that are disabled or over the age of 80. Suspensions must be equally distributed and cannot drop below 110% of what would otherwise be guaranteed by the PBGC.
Based on these updated notices, the Plan’s funded percentage (plan investment assets as a percentage of plan liabilities), as defined, were 57.0%48.3%, 62.8%50.4%, and 65.1%51.6% as of the most recent valuation dates available, January 1, 2016, 2015,2020, 2019, and 2014,2018, respectively (these valuation dates are as of the beginning of each Plan year). These funded percentages are based on actuarial values, as defined, and do not reflect the actual market value of Plan investments as of these dates. If the market value of investments had been used as of January 1, 20162020 the funded percentage would be 53.0%51.6% (not 57.0%48.3%). The Plan’s market value of its investments declined by 3.7% and its unfunded vested benefits increased by 6.4% during 2016. As of the January 1, 20162020 valuation date (most recent valuation available), only 20%16% of Plan participants were current active employees, 51%53% were retired or separated from service and receiving benefits, and 29%31% were retired or separated from service and entitled to future benefits. The number of current active employee Plan participants as of January 1, 20162020 fell 2%4% from the previous year and 4%17% over the past two years. When compared to the Plan valuation date of January 1, 2011 (five years earlier)(just prior to the Plan being certified to be in “critical status”), current active employeesemployee participants have declined 31%49%, whereas participants who were retired or separated from service and receiving benefits increased 6%4% and participants who were retired or separated from service and entitled to future benefits increased 8%12%. The bankruptcy of a major participating employer in the Plan contributed to the above discussed Plan results. The Company understands that the Plan is currently exploring additional restructuring measures which include incentives to participating employers in exchange for providing additional future cash contributions as well as suspension of certain retirement benefits.
16
The Company has been advised that its withdrawal liability would have been $82,200, $72,700,$104,300, $99,300 and $61,000$99,800 if it had withdrawn from the Plan during 2017, 20162021, 2020 and 2015,2019, respectively. The increase from 2016 to 2017 principally reflects a decrease in the PBGC interest rates, a decrease in the assets and increase in the Plan’s unfunded vested benefits during 2016 and the Company comprising a largerCompany’s relative share of the Plan’s contribution base.base, driven by employer withdrawals, has increased for the last several years, and management believes that this trend could continue indefinitely which will continue to add upward pressure on the Company’s withdrawal liability. Based on the above, including the Plan’s projected insolvency in the year 2030,next 20 years, management believes that the Company’s withdrawal liability will likelycould increase further in future years.
16
Based on the Company’s updated actuarial study and certain provisions in ERISA and the law relating to withdrawal liability payments, management believes that the Company’s liability would likely be limited to twenty annual payments of $3,059$2,793 which have a present value in the range of $35,900$32,800 to $46,900$46,600 depending on the interest rate used to discount these payments. While the Company’s actuarial consultant does not believe that the Plan will suffer a future mass withdrawal (as defined) of participating employers, in the event of a mass withdrawal, the Company’s annual withdrawal payments would theoretically be payable in perpetuity. Based on the Company’s updated actuarial study, the present value of such perpetuities is in the range of $45,764 to $142,447 and would apply in the unlikely event that substantially all employers withdraw from the Plan. The aforementioned is based on a range of valuationvaluations and interest rates which management understandsthe Company’s actuary has advised is provided under the statute. Should the Company actually withdraw from the Plan at a future date, a withdrawal liability, which could be higher than the above discussed amounts, could be payable to the Plan.
The Company and the union are currently inconcluded a new labor contract negotiations and are continuing to operate under extensions of the recently expired contractin 2018 which requires the Company’s continued participation in this Plan.Plan through September 2022 (the expiration of this union contract). The amended rehabilitation plan, which also continues, requires that employer contributions include 5% compounded annual surcharge increases each year for an unspecified period of time beginning in 2012 as well as certain plan benefit reductions. The Company’s pension expense for this Plan for 2017, 20162021, 2020 and 20152019 was $2,617, $2,541$3,156, $2,866 and $2,574,$2,961, respectively. The aforementioned expense includes surcharges of $656, $542$1,112, $1,010 and $447$948 in 2017, 20162021, 2020 and 2015,2019, respectively, as required under the planamended rehabilitation plan.
In fourth quarter 2020, the Plan Trustees advised the Company that the surcharges would no longer increase annually and therefore be “frozen” at the rates and amounts in effect as of rehabilitationDecember 31, 2020 provided that the local bargaining union and the Company executed a formal consent agreement by March 31, 2021. The Trustees advised that they have concluded that continuing increases in surcharges would likely have a long-term adverse effect on the solvency of the Plan. The Trustees concluded that further increases would result in increasing financial hardships and withdrawals of participating employers, and that this change will not have a material effect on the Plan’s insolvency date. In first quarter 2021, the local bargaining union and the Company executed this agreement which resulted in the “freezing” of such surcharges as amended.of December 31, 2020.
The Plan recently advised the Company that it will be applying for benefits available to financial troubled plans under the American Rescue Plan Act of 2021. Company management understands that this legislation would provide financial assistance from the PBGC to shore up financially distressed multi-employer plans to ensure that they can remain solvent and continue to pay benefits to retirees through 2051 without any reduction in retiree benefits. Nonetheless, the Company’s actuary believes that given the Plan’s projected insolvency date of 2031 as well as other factors, that it still remains unclear if the Plan can remain solvent through the targeted date of 2051. The Company’s actuary also advised that the regulations under the aforementioned PBGC financial assistance could result in a higher withdrawal liability even with PBGC financial assistance. The Company is currently unable to determine the ultimate outcome of the above discussed multi-employer union pension matter and therefore is unable to determine the effects on its consolidated financial statements, but the ultimate outcome or the effects of any modifications to the current rehabilitation plan could be material to its consolidated results of operations or cash flows in one or more future periods. See also Note 7 inof the Company’s Note to Consolidated Financial Statements on Form 10-K for the year ended December 31, 2017.2021.
17
2020 vs. 2019
2016 vs. 2015
Twelve months 20162020 consolidated net product sales were $517,373$467,427 compared to $536,692$523,616 in twelve months 2015,2019, a decrease of $19,319$56,189 or 3.6%10.7%. Twelve months 2016 consolidatedNet product sales were adversely impacted by the effects of the Covid-19 pandemic, which curtailed and limited access to certain channels of trade where the Company has historically sold its products. Response to this pandemic has resulted in the disruption and changes in lifestyles, shopping habits, daily work routines, and consumer behaviors, all of which have adversely affected planned consumer purchases of the Company’s products for “sharing” and “give away” occasions. Many of the Company’s products are consumed at group events, outings, and other gatherings which have been significantly curtailed or in some cases eliminated due to concern of possible infection or spreading of the Covid-19 virus. Impulse purchases of Company products at retail outlets have also been adversely affected by currency translation of $3,473 due to a stronger U.S. dollarthese changes in 2016 compared to 2015, principally relating to Mexico and Canada. The timing of sales between fourth quarter 2016 and first quarter 2017consumer behavior. Unfavorable foreign exchange also had some adverse effectimpact on twelve months 20162020 net product sales compared to 2019.
Fourth quarter 2020 net product sales were $127,866 compared to $134,663 in fourth quarter 2019, a decrease of $6,797 or 5.0%. After a 2% sales increase in first quarter 2020, sales declined 25% in second quarter 2020 at the height of the pandemic and economic downturn. In third quarter 2020 sales declined 14%, while in fourth quarter 2020 the sales decline was narrowed to 5% when compared to the twelve monthscorresponding quarterly periods in the prior year. The Company had higher sales price realization in 2016 compared to 2015 in order to recover increased costs for ingredients and certain other inputs. Fourth quarter 2016 net sales were $124,279 compared to $139,881 in fourth quarter 2015, a decrease of $15,602 or 11.2%. Fourth quarter 2016 net sales were adversely affected by the timing of certain customer sales at both the beginning and end of the quarter when compared to the prior year fourth quarter in 2015. Unfavorable foreign exchange also contributed to lower sales in fourth quarter 2016 compared to the prior year corresponding period.2019.
Product cost of goods sold were $320,290$299,710 in 20162020 compared to $340,090$329,102 in 2015,2019, a decrease of $19,800$29,392 or 5.8%8.9%. Product cost of goods sold includes $1,137$610 and $497$408 in certain deferred compensation expenses in 20162020 and 2015,2019, respectively. These deferred compensation expenses principally result from changes in the market value of investments and investment income from trading securities relating to compensation deferred in previous years and are not reflective of current operating results. Adjusting for the aforementioned, product cost of goods sold decreased from $339,593$328,694 in 20152019 to $319,153$299,100 in 2016,2020, a decrease of $20,440$29,594 or 6.0%9.0%. As a percent of net product sales, these adjusted costs decreasedincreased from 63.3%62.8% in 20152019 to 61.7%64.0% in 2016,2020, a favorable1.2 unfavorable percentage point change. Lower sales and production volumes had an unfavorable impact on plant manufacturing overhead costs included in the aforementioned adjusted product cost of goods sold. These plant overhead costs are primarily fixed and recurring each year, and only partially decline with lower volumes.
Product gross margin was $167,717 in 2020 compared to $194,514 in 2019, a decrease of 1.6% as a percent of net product sales. Higher price realization on$26,797 or 13.8%. The above discussed sales continuing improvements in manufacturing plant efficiencies driven by capital investments, and ongoing cost containment programs contributed to this improvement in lower costs of goods sold anddecline was the resulting improvement inprincipal driver that adversely impacted gross profit margins in twelve months 2016 compared2020. Certain cost and expense reductions, including Company initiatives to 2015. Higherreduce costs for ingredients and additional manufacturing costs relatingdid provide some benefit to changes in and uncertainties relating to product labeling requirements adversely affected2020 gross profit margins in 2016. These higher manufacturing costs in 2016 include the effects of lower production volumes runs for many products
17
in order to reduce and minimize finished goods inventory levels and additional costs to meet new product labeling requirements. This inventory reduction was in response to uncertainties surrounding changes in state and national labeling regulations and requirements during 2016.margins. The Company is continuing its focus on cost reductions and savings, including savings resulting from capital investments in orderits plant manufacturing operations to meet new consumer and customer demands, achieve manufacturing efficienciesquality improvements, provide genuine value to consumers, and productivity improvements. The Company has made progress on restoring margins to their historical levels before the increases in commodity and other input costs in past years.increase operational efficiencies.
Selling, marketing and administrative expenses were $107,377$112,117 in 20162020 compared to $108,051$127,802 in 2015,2019, a decrease of $674$15,685 or 0.6%12.3%. Selling, marketing and administrative expenses include $3,138$11,909 and $953$10,884 in certain deferred compensation expenses in 20162020 and 2015,2019, respectively. These deferred compensation expenses principally result from changes in the market value of investments and investment income from trading securities relating to compensation deferred in previous years and are not reflective of current operating results. Adjusting for the aforementioned, theseselling, marketing and administrative expenses decreased from $107,098$116,918 in 20152019 to $104,239$100,208 in 2016,2020, a decrease of $2,859$16,710 or 2.7%14.3%. As a percent of net product sales, these adjusted expenses increased slightlydecreased from 20.0%22.3% of net product sales in 20152019 to 20.1%21.4% of net product sales in 2016,2020, a 0.1% unfavorable increase0.9 favorable percentage point change. Reductions in travel and trade show expense resulting from changes in Company policies in response to the Covid-19 pandemic, and more favorable freight and delivery unit costs were the principal drivers in this expense reduction as a percentage of sales. sales in 2020.
Selling, marketing and administrative expenses include $40,629 and $42,619 of freight, delivery and warehousing expenses. These expenses decreased from $49,288 in 2016 and 2015, respectively, were 7.9%2019 to $42,593 in 2020, a decrease of $6,695 or 13.6%. As a percent of net product sales, these adjusted expenses decreased from 9.4% in both 20162019 to 9.1% in 2020, a 0.3 favorable percentage point change. More favorable freight and 2015. Internal expensedelivery rates from third-party over-the-road truck carriers, and certain operational and cost reduction initiatives, mitigated some of the higher costs of freight, delivery and warehousing in 2016 comparedcontributed to 2015.this favorable change.
The Company has foreign operating businesses in Mexico, Canada and Spain, and exports products to many foreign markets. The strength of the U.S. dollar and related devaluations of most these related foreign currencies, primarily Mexico and Canada, have adversely affected these foreign and export operations in 2016 compared to 2015. The operating income of these foreign and export operations decreased by $3,269 in 2016 compared to 2015. The Company currently has a 93% ownership of two Spanish companies (93% and 83% ownership at December 31, 2016 and 2015, respectively) which had operating losses for each of the years 2008 through 2016. Company management has restructured the Spanish operations and made other changes to its business plan but these companies continue to have operating losses.
Earnings from operations were $92,414$58,244 in 20162020 compared to $91,082$69,214 in 2015, an increase2019, a decrease of $1,332.$10,970. Earnings from operations include $4,275$12,519 and $1,450$11,292 in certain deferred compensation expense in 20162020 and 2015,2019, respectively, which are discussed above. Adjusting for these deferred compensation expenses, adjusted earnings from operations increased decreased
18
from $92,532$80,506 in 20152019 to $96,689$70,763 in 2016, an increase2019, a decrease of $4,157$9,743 or 4.5%12.1%. Although ingredient costs and results from foreign operations adversely affected adjusted 2016The above discussed decline in net product sales was the principal driver of lower operating income in 2020 compared to 2019, however, 2020 earnings from operations higher price realization on sales and thedid benefit from some cost and expense reductions as discussed above, allowed the Company to achieve these higher adjusted operating earnings in 2016 despite the decline in 2016 net sales compared to 2015.above.
Management believes the comparisons presented in the preceding paragraphs, after adjusting for changes in deferred compensation, are more reflective of the underlying operations of the Company.
Other income, net was $5,498$18,018 in 20162020 compared to $1,496$16,190 in 2015,2019, an increase of $4,002.$1,828. Other income, net principally reflects $4,275$12,519 and $1,450$11,292 of aggregate net gains and investment income on trading securities in 20162020 and 2015,2019, respectively. These trading securities provide an economic hedge of the Company’s deferred compensation liabilities; and the related net gains and investment income were offset by a like amount of expense in aggregate product cost of goods sold and selling, marketing, and administrative expenses in the respective years as discussed above. Other income, net includes investment income on available for sale securities including variable rate demand notes, of $2,130$4,005 and $1,421$4,423 in 20162020 and 2015,2019, respectively. Other income, net also includes foreign exchange lossesgains (losses) of $955$534 and $1,427$(533) in 20162020 and 2015,2019, respectively.
The consolidatedCompany’s effective income tax rate was 22.7% and 24.1% in 2020 and 2019, respectively. The decrease in the effective tax rate was 31.2% and 28.6% in 2016 and 2015, respectively. The lower effective2020 reflects more favorable foreign tax rate for 2015 principally reflects benefits from favorable prior yearrates, income tax settlements, including a $1,066 release of ancredits and adjustments for reserves for uncertain income tax liability resulting from a decision by a foreign court in second quarter 2015. positions.
The Company utilized $1,776$617 and $2,758$1,227 of its Canadian subsidiary’s tax carry-forward benefits in 20162020 and 2015,2019, respectively. At December 31, 2019, the Company’s deferred tax assets included $617 of income tax benefits relating to its Canadian subsidiary tax loss carry-forwards. The Company hasfully utilized this deferred tax asset in 2020 as expected. The Company provided a full valuation allowance on its Spanish subsidiaries’ tax loss carry-forward benefits of $2,106$4,508 and $1,834$4,584 as of December 31, 20162020 and 2015,2019, respectively, because the Company has concluded that it is not more-likely-than-not that these losses will be utilized before their expiration dates.
On March 27, 2020, the Coronavirus Aid, Relief, and Economic Security (“CARES”) Act was signed into U.S. law. The CompanyCARES Act has provided a substantial stimulus and assistance package intended to address the economic impact of the Covid-19 pandemic, including tax relief and government loans, grants and investments. The Canadian government also enacted a stimulus program, Canadian Emergency Wage Subsidy (“CEWS”), to respond to the economic impact of Covid-19 during 2020. The Company’s financial results in 2020 did not provide for U.S. federal or foreign withholding taxes on approximately $22,081reflect some benefits, primarily in the second and $20,174third quarters of foreign subsidiaries’ undistributed earnings as of December 31, 2016 and December 31, 2015, respectively, because such earnings were considered to be permanently
18
reinvested. The Company estimates that the federal income tax liability on such undistributed earnings would approximate 30% of2020, from these amounts.stimulus programs.
Net earnings attributable to Tootsie Roll Industries, Inc. were $67,510$58,995 in 20162020 compared to $66,089$64,920 in 2015,2019, and net earnings per share were $1.05$0.86 and $1.02$0.94 in 20162020 and 2015,2019, respectively, an increasea decrease of $0.03$0.08 per share or 2.9%. As discussed above, net earnings principally benefited from higher price realization on domestic sales and cost and expense reductions, although higher ingredient costs, lower foreign operating income, and the adverse effects of lower sales mitigated some of these benefits. In addition, a lower effective income tax rate in prior year 2015 adversely affects the comparison to 2016 net earnings.9%. Earnings per share in 20162020 benefited from the reduction in average shares outstanding resulting from purchases of the Company’s common stock in the open market by the Company. Average shares outstanding decreased from 65,10369,386 in 20152019 to 64,08668,482 in 2016. 2020 which reflects share repurchases of $32,055 during 2020.
Fourth quarter 20162020 and 2019 net earnings attributable to Tootsie Roll Industries, Inc. were $17,841 compared to $19,705 in fourth quarter 2015,$14,952 and $14,555, respectively, and net earnings per share were $.28$0.22 and $.30$0.21, respectively, an increase of $0.01 per share or 5%. Certain cost and expense reductions, including Company operational changes and initiatives to reduce costs as discussed above, did provide some benefit to fourth quarter 2020 results. Although unfavorable foreign exchange adversely affected fourth quarter 2020 results, a lower effective income tax rate contributed to the increase in net earnings in fourth quarter 20162020 compared to fourth quarter 2019.
Our Company is focused on the longer term and 2015, respectively, a decreasetherefore we are continuing to make investments in plant manufacturing operations to meet new consumer and customer product demands, achieve product quality improvements, and increase operational efficiencies in order to provide genuine value to consumers. We are continuing to focus on the supply chain and possible delays and disruptions, but this area continues to have much less predictability compared to past history. The effects of $.02 or 6%.the Covid-19 pandemic, including variants and sub-variants, are unprecedented, and therefore the Company is unable to determine the related effects on its sales and net earnings in 2022 and beyond.
19
LIQUIDITY AND CAPITAL RESOURCES
Cash flows from operating activities were $42,973, $98,550$85,298, $74,710 and $91,073$100,221 in 2017, 20162021, 2020 and 2015,2019, respectively. The $55,577$10,588 increase in cash flows from operating activities from 2020 to 2021 primarily reflects increases in net earnings as a result of higher revenue as the Company experienced the favorable effects of the continuing economic recovery from the adverse effects of the Covid-19 pandemic. Increases in accounts payable and accrued liabilities in 2021 compared to 2020 as a result of higher production to support the recovery in demand discussed above and payments of deferred compensation that reduced cash flows from operations in 2020 were offset by an increase in accounts receivable also due to higher revenue. The $25,511 decrease in cash flows from operating activities from 20162019 to 20172020 primarily reflects increasesdecreases in income taxes receivable and prepaid expenses and other assets; and a decrease in income taxes payablenet earnings and payments of deferred compensation during 2017. Cash flows in 2016 benefited from decreases in accounts receivable and inventories, net of a decrease in income taxes payable. 2020.
The Company manages and controls a VEBA trust, to fund the estimated future costs of certain union employee health, welfare and other benefits. A contribution of $20,024 was made to this trust during fourth quarterin 2017; no contribution was made to the trust during 2016.2019, 2020 or 2021. The Company uses these funds to pay the actual cost of such benefits over each union contract period. At December 31, 20172021 and 2016,2020, the VEBA trust held $19,713$3,941 and $3,027,$8,272, respectively, of aggregate cash and cash equivalents.equivalents, which the Company will use to pay certain union employee benefits through part or all of 2022. This asset value is included in prepaid expenses and long-term other assets in the Company’s Consolidated Statement of Financial Position. These assets arePosition and is categorized as Level 1 within the fair value hierarchy.
Cash flows from investing activities reflect capital expenditures of $16,673, $16,090,$31,426, $17,970, and $15,534$20,258 in 2017, 20162021, 2020 and 2015,2019, respectively. The changes inincrease amounts each yearfrom 2020 to 2021 principally reflects the timing of expenditures relating to plant manufacturing projects. Company management has recently committed approximately $15,000 to a manufacturing plantcapital projects, primarily for the rehabilitation upgrade and expansion of one of its manufacturing plants in the U.S.A. Management’s projectedThe Company spent approximately $15,000, $6,000 and $2,000 in 2021, 2020 and 2019, respectively, for this plant rehabilitation upgrade and expansion and expects additional cash outlays for this project are approximately $6,000to approximate $2,000 in each of 2018 and 2019 and $3,000 in 2020. In addition, Company management has committed approximately $13,000 to new packaging lines in 2018 which will result in additional capital spending in 2018 in excess of historical levels.2022. All capital expenditures have been or are expected to be funded from the Company’s cash flow from operations and internal sources including available for sale securities. The repayment of $2,514 of previously paid premiums on split dollar life insurance policies did provide additional cash from investing activities in 2021.
Other than the bank loans and the related restricted cash of the Company’s Spanish subsidiaries,subsidiary which are discussed in Note 1 of the Company’s Notes to Consolidated Financial Statements, the Company had no bank borrowings or repayments in 2015, 2016,2019, 2020, or 2017,2021, and had no outstanding bank borrowings as of December 31, 20162020 or 2017.2021. Nonetheless, the Company would consider bank borrowing or other financing in the event that a business acquisition is completed.
Financing activities include Company common stock purchases and retirements of $34,133, $29,093,$30,184, $32,055, and $33,004$34,116 in 2017, 20162021, 2020 and 2015,2019, respectively. Cash dividends of $22,621, $22,266,$24,136, $23,810, and $20,775$23,460 were paid in 2017, 20162021, 2020 and 2015,2019, respectively.
SIGNIFICANTCRITICAL ACCOUNTING POLICIES AND ESTIMATES
Preparation of the Company’s financial statements involves judgments and estimates due to uncertainties affecting the application of accounting policies, and the likelihood that different amounts would be reported under different conditions or using different assumptions. The Company bases its estimates on historical experience and other assumptions, as discussed herein, that it believes are reasonable. If actual amounts are ultimately different from previous estimates, the
19
revisions are included in the Company’s results of operations for the period in which the actual amounts become known. The Company’s significant accounting policies are discussed in Note 1 of the Company’s Notes to Consolidated Financial Statements.
Following is a summary and discussion of the more significant accounting policies and estimates which management believes to have a significant impact on the Company’s operating results, financial position, cash flows and footnote disclosure.
20
Revenue recognition
Revenue, netAs further discussed in Note 1 of applicable provisionsthe Company’s Notes to Consolidated Financial Statements, the Company follows the revenue recognition guidance in ASC 606. ASC 606 requires adjustments for estimated customer cash discounts upon payment, discounts for price adjustments, product returns, allowances, and certain advertising and promotional costs, including consumer coupons, which are variable consideration and are recorded as a reduction of product sales revenue in the same period the related product sales are recorded. Such estimates are calculated using historical averages adjusted for any expected changes due to current business conditions and experience. Revenue for net product sales is recognized at a point in time when products are delivered to customers based on an acceptedor picked up by the customer, as designated by customers’ purchase order. These include quantity, sales price and other relevant termsorders, as discussed in Note 1 of sale, and collectability is reasonably assured. The accounting for promotional costs is discussed under “Customer incentive programs, advertising and marketing” below. Accounts receivable are unsecured.the Company’s Notes to Consolidated Financial Statements.
Provisions for bad debts are recorded as selling, marketing and administrative expenses. Write-offs of bad debts did not exceed 0.1% of net product sales in each of 2017, 20162021, 2020 and 2015,2019, and accordingly, have not been significant to the Company’s financial position or results of operations.
Customer freight and delivery, and finished goods warehousing and handling expenses are included in selling, marketing and administrative expenses.
The Company is continuing its review and evaluation of revenue recognition under new guidance (ASC 606, “Revenue with Contracts from Customers”) which is effective at the beginning of the first quarter 2018. The Company will adopt this new guidance via the modified retrospective approach with the initial adoption impacting opening retained earnings effective January 1, 2018. Company management does not believe that the adoption of this new guidance will have a material effect on its consolidated statements of earnings, but management is expecting to reduce certain accrued liabilities (and increase retained earnings) relating to variable consideration, as defined by the new guidance on its consolidated statement financial position (balance sheet) of January 1, 2018.
Intangible assets
The Company’s intangible assets consist primarily of goodwill and acquired trademarks. In accordance with accounting guidance, goodwill and other indefinite-lived assets, trademarks, are not amortized, but are instead subjected to annual testing for impairment unless certain triggering events or circumstances are noted. The Company performs its annual impairment review and assessment as of December 31. All trademarks have been assessed by management to have indefinite lives because they are expected to generate cash flows indefinitely. The Company reviews and assesses certain trademarks (non-amortizable intangible assets) for impairment by comparing the fair value of each trademark with its carrying value. Current accounting guidance provides entities an option of performing a qualitative assessment (a "step-zero" test) before performing a quantitative analysis. If the entity determines, on the basis of certain qualitative factors, that it is more-likely-than-not that the intangibles (goodwill and certain trademarks) are not impaired, the entity would not need to proceed to the two step impairment testing process (quantitative analysis) as prescribed in the guidance. During fourth quarter 2017,2021, the Company performed a “step zero” test of its goodwill and certain trademarks, and concluded that there was no impairment based on this guidance.
The Company determines the fair value of certain trademarks using discounted cash flows and estimates of royalty rates. If the carrying value exceeds fair value, such trademarks are considered impaired and isare reduced to fair value. The Company utilizes third-party professional valuation firms to assist in the determination of valuation of suchcertain trademarks. Impairments have not generally been material to the Company’s historical operating results.
20
Cash flow projections require the Company to make assumptions and estimates regarding the Company’s future plans, including sales projections and profit margins, market based discount rates, competitive factors, and economic conditions; and the Company’s actual results and conditions may differ over time. A change in the assumptions relating to the impairment analysis including but not limited to a reduction in projected cash flows, the use of a different discount rate to discount future cash flows or a different royalty rate applied to such trademarks, could cause impairment in the future.
Customer incentive programs, advertising and marketing
Advertising and marketing costs are recorded in the period to which such costs relate. The Company does not defer the recognition of any amounts on its consolidated balance sheet with respect to such costs. Customer incentives and other promotional costs, including consumer coupon (price reduction) incentives, are recorded in accordance with ASU 606 at the time of the Company’s sale based upon incentive program terms and historical utilization statistics, which are generally consistent from year to year. The liabilities associated with these programs are reviewed quarterly and adjusted if utilization rates differ from management’s original estimates. Such adjustments have not historically been material to the Company’s operating results.
21
Split dollar officer life insurance
The Company provides split dollar life insurance benefits to certain executive officers and records an asset principally equal to the cumulative premiums paid. The Company will fully recover these premiums in future years under the termsTable of the plan. The Company retains a collateral assignment of the cash surrender values and policy death benefits payable to insure recovery of these premiums.Contents
Valuation of long-lived assets
Long-lived assets, primarily property, plant and equipment, are reviewed for impairment as events or changes in business circumstances occur indicating that the carrying value of the asset may not be recoverable. The estimated cash flows produced by assets or asset groups, are compared to the asset carrying value to determine whether impairment exists. Such estimates involve considerable management judgment and are based upon assumptions about expected future operating performance. As a result, actual cash flows could differ from management’s estimates due to changes in business conditions, operating performance, and economic and competitive conditions. Such impairments have not historically been material to the Company’s operating results.
Income taxes
Deferred income taxes are recognized for future tax effects of temporary differences between financial and income tax reporting using tax rates in effect for the years in which the differences are expected to reverse. The Company records valuation allowances in situations where the realization of deferred tax assets, including those relating to net operating tax losses, is not more-likely-than-not; and the Company adjusts and releases such valuation allowances when realization becomes more-likely-than-not as defined by accounting guidance. The Company periodically reviews assumptions and estimates of the Company’s probable tax obligations and effects on its liability for uncertain tax positions, using informed judgment which may include the use of third-party consultants, advisors and legal counsel, as well as historical experience.
Valuation of investments
Investments primarily comprise high quality corporate and municipal (tax-free) bonds, including variable rate demand notes (generally long term bonds where interest rates are reset weekly, and provide a weekly “put” which allows the holder to also sell each week with no loss in principal), which are reviewed for impairment at each reporting period by comparing the carrying value or amortized cost to the fair market value. In the event that an investment security’s fair value is below carrying value or amortized cost, the Company will record an other-than-temporary impairment or a temporary impairment based on accounting guidance. The Company’s investment policy, which guides investment decisions, is focused on high quality
21
investments which mitigates the risk of impairment. The Company does not invest in Level 3 securities, as defined, but may utilize third-party professional valuation firms as necessary to assist in the determination of the value of investments that utilize Level 3 inputs (as defined by guidance) should any of its investments be downgraded to such level.Level 3.
Other matters
In the opinion of management, other than contracts for foreign currency forwards and raw materials, including currency and commodity hedges and outstanding purchase orders for packaging, ingredients, supplies, and operational services, and capital expenditures, all entered into in the ordinary course of business, the Company does not have any significant contractual obligations or future commitments. The Company’s outstanding contractual commitments as of December 31, 2017, all of which are generally normal and recurring in nature, are summarized in the chart which follows below.
RECENT ACCOUNTING PRONOUNCEMENTS
See Note 1 of the Company’s Notes to Consolidated Financial Statements.
MARKET RISKS
The Company is exposed to market risks related to commodity prices, interest rates, investments in marketable securities, equity price and foreign exchange.
The Company’s ability to forecast the direction and scope of changes to its major input costs is impacted by significant potential volatility in crude oil and energy, sugar, corn, edible oils, cocoa and cocoa powder, and dairy products markets. The prices of these commodities are influenced by changes in global demand, changes in weather and crop yields, including the possible effects of climate change, changes in import tariffs and governments’ farm policies, including mandates for ethanol and bio-fuels, environmental matters, fluctuations in the U.S. dollar relative to dollar-denominated commodities in world markets, and in some cases, geo-political risks. The Company believes that its competitors face the same or similar challenges.
22
In order to address the impact of changes in input and other costs, the Company periodically reviews each item in its product portfolio to ascertain if price realization adjustments or other actions should be taken. These reviews include an evaluation of the risk factors relating to market place acceptance of such changes and their potential effect on future sales volumes. In addition, the estimated cost of packaging modifications associated with weight changes, if applicable, is evaluated. The Company also maintains ongoing cost reduction and productivity improvement programs under which cost savings initiatives are encouraged and progress monitored. The Company is not able to accurately predict the outcome of these cost savings initiatives and their effects on its future results.
Changes in U.S.A. tax policy, including a “border tax” and possible new tariffs on foreign imports which are under discussion, could have an adverse impact on such products made in Canada and sold in the U.S.A. as well as certain other ingredients and materials which are imported.
Commodity future and foreign currency forward contracts
Commodity price risks relate to ingredients, primarily sugar, cocoa and cocoa powder, chocolate, corn syrup, dextrose, edible oils, milk, whey and gum base ingredients. The Company believes its competitors face similar risks, and the industry has historically adjusted prices, and/or product weights, to compensate for adverse fluctuations in commodity costs. The Company, as well as competitors in the confectionery industry, has historically taken actions, including higher price realization to mitigate rising input costs for ingredients, packaging, labor and fringe benefits, energy, and freight and delivery. Although management seeks to substantially recover cost increases over the long-term, there is risk that higher price realization cannot be fully passed on to customers and, to the extent they are passed on, they could adversely affect customer and consumer acceptance and resulting sales volume.
22
The Company utilizes commodity futures contracts, as well as annual supply agreements, to hedge and plan for anticipated purchases of certain ingredients, including sugar, in order to mitigate commodity cost fluctuation. The Company also may purchase forward foreign exchange contracts to hedge its costs of manufacturing certain products in Canada for sale and distribution in the United States (U.S.A.), and periodically does so for purchases of equipment or raw materials from foreign suppliers. Such commodity futures and currency forward contracts are cash flow hedges and are effective as hedges as defined by accounting guidance. The unrealized gains and losses on such contracts are deferred as a component of accumulated other comprehensive loss (or gain) and are recognized as a component of product cost of goods sold when the related inventory is sold.
The potential change in fair value of commodity and foreign currency derivative instruments held by the Company at December 31, 2017,2021, assuming a 10% change in the underlying contract price, was $1,476.$1,274. The analysis only includes commodity and foreign currency derivative instruments and, therefore, does not consider the offsetting effect of changes in the price of the underlying commodity or foreign currency. This amount is not significant compared with the net earnings and shareholders’ equity of the Company.
Interest rates
Interest rate risks primarily relate to the Company’s investments in marketable securities with maturitiesmaturity dates of generally up to three years.
The majority of the Company’s investments, which are classified as available for sale, have historically been held until their maturity which is generally up to about 3 years, which limits the Company’s exposure to interest rate fluctuations. The Company also invests in variable rate demand notes which have interest rates whichthat are reset weekly and can be “put back” and sold each week through a remarketing agent, generally a large financial broker, which also substantially eliminates the Company’s exposure to interest rate fluctuations on the principal invested. The accompanying chart summarizes the maturities of the Company’s investments in debt securities at December 31, 2017.2021.
| | | |
Less than 1 year |
| $ | 39,460 |
1 – 2 years | |
| 99,223 |
2 – 3 years | |
| 102,724 |
Total | | $ | 241,407 |
|
|
|
|
Less than 1 year |
| $ | 62,656 |
1 – 2 years |
|
| 54,155 |
2 – 3 years |
|
| 54,702 |
Over 3 years |
|
| 83 |
Total |
| $ | 171,596 |
23
The Company’s outstanding debt at December 31, 20172021 and 20162020 was $7,500 in an industrial revenue bond in which interest rates reset each week based on the current market rate. Therefore, the Company does not believe that it has significant interest rate risk with respect to its interest bearing debt.
Investment in marketable securities
As stated above, the Company invests primarily in marketable securities including variable rate demand notes (VRDNs). The VRDNs have weekly “puts” which are collateralized by bank letters of credit or other assets, and interest rates are reset weekly. Except for VRDN’s, the Company’s marketable securities are held to maturity with maturities generally not exceeding three years. The Company utilizes professional money managers and maintains investment policy guidelines which emphasize high quality and liquidity in order to minimize the potential loss exposures that could result in the event of higher interest rates, a default or other adverse event. The Company continues to monitor these investments and markets, as well as its investment policies, however, the financial markets could experience unanticipated or unprecedented events as it did in 2008 and 2009, and future outcomes may be less predictable than in the past.
Equity price
Equity price risk relates to the Company’s investments in mutual funds which are principally used to fund and hedge the Company’s deferred compensation liabilities. These investments in mutual funds are classified as trading securities. Any change in the fair value of these trading securities is completely offset by a corresponding change in the respective hedged
23
deferred compensation liability, and therefore, the Company does not believe that it has significant equity price risk with respect to these investments.
.
Foreign currency
Foreign currency risk principally relates to the Company’s foreign operations in Canada, Mexico and Spain, as well as periodic purchase commitments of machinery and equipment from foreign sources.sources, generally the European Union where the EURO is the currency.
Certain of the Company’s Canadian manufacturing costs, including local payroll and plant operations, and a portion of its packaging and ingredients are sourced in Canadian dollars. The Company may purchase Canadian forward contracts to receive Canadian dollars at a specified date in the future and uses its Canadian dollar collections on Canadian sales as a partial hedge of its overall Canadian manufacturing obligations sourced in Canadian dollars. The Company also periodically purchases and holds Canadian dollars to facilitate the risk management of these currency changes.
From time to time, the Company may use foreign exchange forward contracts and derivative instruments to mitigate its exposure to foreign exchange risks, as well as those related to firm commitments to purchase equipment from foreign vendors. See Note 1011 of the Company’s Notes to Consolidated Financial Statements for outstanding foreign exchange forward contracts as of December 31, 2017.2021.
Open Contractual Commitments as of December 31, 2017:
|
|
|
|
|
|
|
|
|
|
|
|
|
|
|
|
|
|
|
|
|
| Less than |
| 1 to 3 |
| 3 to 5 |
| More than |
| ||||
Payable in |
| Total |
| 1 Year |
| Years |
| Years |
| 5 Years |
| |||||
Commodity hedges |
| $ | 13,840 |
| $ | 11,468 |
| $ | 2,372 |
| $ | — |
| $ | — |
|
Foreign currency hedges |
|
| 919 |
|
| 919 |
|
| — |
|
| — |
|
| — |
|
Purchase obligations |
|
| 8,553 |
|
| 8,553 |
|
| — |
|
| — |
|
| — |
|
Interest bearing debt |
|
| 7,500 |
|
| — |
|
| — |
|
| — |
|
| 7,500 |
|
Operating leases |
|
| 5,481 |
|
| 1,025 |
|
| 1,770 |
|
| 1,083 |
|
| 1,603 |
|
Total |
| $ | 36,293 |
| $ | 21,965 |
| $ | 4,142 |
| $ | 1,083 |
| $ | 9,103 |
|
Note: Commodity hedges and foreign currency hedges reflect the amounts at which the Company will settle the related contracts. The above amounts exclude deferred income tax liabilities of $41,457, liabilities for uncertain tax positions of $4,817, postretirement health care benefits of $13,497 and deferred compensation of $66,588 because the timing of payments relating to these items cannot be reasonably determined.
24
QUARTERLY FINANCIAL DATA
| | | | | | | | | | | | | | | | |
| | (Thousands of dollars except per share data) |
| |||||||||||||
|
| First |
| Second |
| Third |
| Fourth |
| Year |
| |||||
2021 | | | | | | | | | | | | | | | | |
Net product sales | | $ | 101,795 | | $ | 114,560 | | $ | 183,090 | | $ | 166,598 | | $ | 566,043 | |
Product gross margin | |
| 36,230 | |
| 38,612 | |
| 64,644 | |
| 56,452 | |
| 195,938 | |
Net earnings attributable to Tootsie Roll Industries, Inc. | |
| 10,767 | |
| 9,794 | |
| 24,733 | |
| 20,032 | |
| 65,326 | |
Net earnings attributable to Tootsie Roll Industries, Inc. per share | |
| 0.16 | |
| 0.14 | |
| 0.37 | |
| 0.30 | |
| 0.97 | |
| | | | | | | | | | | | | | | | |
2020 | | | | | | | | | | | | | | | | |
Net product sales | | $ | 102,803 | | $ | 79,796 | | $ | 156,962 | | $ | 127,866 | | $ | 467,427 | |
Product gross margin | |
| 36,360 | |
| 29,417 | |
| 57,775 | |
| 44,165 | |
| 167,717 | |
Net earnings attributable to Tootsie Roll Industries, Inc. | |
| 11,982 | |
| 7,388 | |
| 24,673 | |
| 14,952 | |
| 58,995 | |
Net earnings attributable to Tootsie Roll Industries, Inc. per share | |
| 0.17 | |
| 0.11 | |
| 0.36 | |
| 0.22 | |
| 0.86 | |
Net earnings per share is based upon average outstanding shares as adjusted for 3% stock dividends issued during the second quarter of each year as discussed above. The sum of the quarterly per share amounts may not equal annual amounts due to rounding.
25
ITEM 7A. Quantitative and Qualitative Disclosures About Market Risk.
The information required by this item is included under the caption “Market Risk” in Item 7 above.
See also Note 1 of the Notes to Consolidated Financial Statements.
ITEM 8. Financial Statements and Supplementary Data.
Management’s Report on Internal Control Over Financial Reporting
The management of Tootsie Roll Industries, Inc. is responsible for establishing and maintaining adequate internal control over financial reporting, as such term is defined in the Securities Exchange Act of 1934 (SEC) Rule 13a-15(f). Company management conducted an evaluation of the effectiveness of the Company’s internal control over financial reporting as of December 31, 20172021 as required by SEC Rule 13a-15(c). In making this assessment, the Company used the criteria established in Internal Control—Integrated Framework (2013) issued by the Committee of Sponsoring Organizations of the Treadway Commission (the COSO criteria). Based on the Company’s evaluation under the COSO criteria, Company management concluded that its internal control over financial reporting was effective as of December 31, 2017.2021.
The effectiveness of the Company’s internal control over financial reporting as of December 31, 20172021 has been audited by PricewaterhouseCoopersGrant Thornton LLP (PCAOB ID: 248), an independent registered public accounting firm, as stated in their report which is included herein.
2526
REPORT OF INDEPENDENT REGISTERED PUBLIC ACCOUNTING FIRM
Report of Independent Registered Public Accounting Firm
To the Board of Directors and Shareholders of
Tootsie Roll Industries, Inc.:
Opinions on the Financial Statementsfinancial statements and Internal Controlinternal control over Financial Reportingfinancial reporting
We have audited the accompanying consolidated financial statements, including the related notes, as listed in the index appearing under Item 15(a)(1) and the financial statement schedule listed in the index appearing under Item 15(a)(2),position of Tootsie Roll Industries, Inc. (a Virginia corporation) and its subsidiaries (the “Company”) as of December 31, 2021 and 2020, and the related consolidated statements of earnings and retained earnings, comprehensive earnings, and cash flows for each of the three years in the period ended December 31, 2021, and the related notes and financial statement schedule included under Item 15(a) (collectively referred to as the “consolidated financial“financial statements”). We also have audited the Company'sCompany’s internal control over financial reporting as of December 31, 2017,2021, based on criteria established in the 2013 Internal Control - Control—Integrated Framework (2013) issued by the Committee of Sponsoring Organizations of the Treadway Commission (COSO)(“COSO”).
In our opinion, the consolidatedfinancial statements referred to above present fairly, in all material respects, the financial position of the Company as of December 31, 20172021 and December 31, 2016, 2020, and the results of their itsoperations and their itscash flows for each of the three years in the period endedDecember 31, 20172021 in conformity with accounting principles generally accepted in the United States of America. Also in our opinion, the Company maintained, in all material respects, effective internal control over financial reporting as of December 31, 2017,2021, based on criteria established in the 2013 Internal Control - Control—Integrated Framework (2013) issued by the COSO.
As discussed in Note 1 to the consolidated financial statements, the Company changed the manner in which it classifies deferred taxes in the Statement of Financial Position effective January 1, 2017.
Basis for Opinionsopinions
The Company'sCompany’s management is responsible for these consolidated financial statements, for maintaining effective internal control over financial reporting, and for its assessment of the effectiveness of internal control over financial reporting, included in the accompanying Management’s Report on Internal Control over Financial Reporting. Our responsibility is to express opinionsan opinion on the Company’s consolidatedfinancial statements and an opinion on the Company'sCompany’s internal control over financial reporting based on our audits. We are a public accounting firm registered with the Public Company Accounting Oversight Board (United States) ("PCAOB"(“PCAOB”) and are required to be independent with respect to the Company in accordance with the U.S. federal securities laws and the applicable rules and regulations of the Securities and Exchange Commission and the PCAOB.
We conducted our audits in accordance with the standards of the PCAOB. Those standards require that we plan and perform the audits to obtain reasonable assurance about whether the consolidatedfinancial statements are free of material misstatement, whether due to error or fraud, and whether effective internal control over financial reporting was maintained in all material respects.
Our audits of the consolidatedfinancial statements included performing procedures to assess the risks of material misstatement of the consolidatedfinancial statements, whether due to error or fraud, and performing procedures that respond to those risks. Such procedures included examining, on a test basis, evidence regarding the amounts and disclosures in the consolidatedfinancial statements. Our audits also included evaluating the accounting principles used and significant estimates made by management, as well as evaluating the overall presentation of the consolidatedfinancial statements. Our audit of internal control over financial reporting included obtaining an understanding of internal control over financial reporting, assessing the risk that a material weakness exists, and testing and evaluating the design and operating effectiveness of internal control based on the assessed risk. Our audits also included performing such other procedures as we considered necessary in the circumstances. We believe that our audits provide a reasonable basis for our opinions.
Definition and Limitations of Internal Control over Financial Reporting
2627
Definition and limitations of internal control over financial reporting
A company’s internal control over financial reporting is a process designed to provide reasonable assurance regarding the reliability of financial reporting and the preparation of financial statements for external purposes in accordance with generally accepted accounting principles. A company’s internal control over financial reporting includes those policies and procedures that (i)(1) pertain to the maintenance of records that, in reasonable detail, accurately and fairly reflect the transactions and dispositions of the assets of the company; (ii)(2) provide reasonable assurance that transactions are recorded as necessary to permit preparation of financial statements in accordance with generally accepted accounting principles, and that receipts and expenditures of the company are being made only in accordance with authorizations of management and directors of the company; and (iii)(3) provide reasonable assurance regarding prevention or timely detection of unauthorized acquisition, use, or disposition of the company’s assets that could have a material effect on the financial statements.
Because of its inherent limitations, internal control over financial reporting may not prevent or detect misstatements. Also, projections of any evaluation of effectiveness to future periods are subject to the risk that controls may become inadequate because of changes in conditions, or that the degree of compliance with the policies or procedures may deteriorate.
Critical audit matters
The critical audit matters communicated below are matters arising from the current period audit of the financial statements that were communicated or required to be communicated to the audit committee and that: (1) relate to accounts or disclosures that are material to the financial statements and (2) involved our especially challenging, subjective, or complex judgments. The communication of critical audit matters does not alter in any way our opinion on the financial statements, taken as a whole, and we are not, by communicating the critical audit matters below, providing separate opinions on the critical audit matters or on the accounts or disclosures to which they relate.
Trademark Impairment Assessment
As described in Note 1 and Note 13 to the consolidated financial statements, the Company’s consolidated trademark balance was $175 million at December 31, 2021, which is allocated to the Company’s brands that were purchased. Indefinite-lived trademarks are tested for impairment at least annually. For several trademarks, a Step 0 approach is used to test for impairment based on relevant qualitative factors, as outlined within Accounting Standards Codifications (ASC) 350-20 and 350-30. For the fair value assessment of certain other trademarks where a Step 0 analysis was not considered appropriate, Step 1 impairment testing is performed annually using discounted cash flows, derived from inputs including but not limited to projected revenue, operating margins and estimated discount rates. The determination of the fair value of the trademarks subjected to a Step 1 impairment test requires management to make significant estimates and assumptions related to forecasts of future revenues, operating margins and discount rates. As disclosed by management, changes in these assumptions could have a significant impact on either the fair value of the trademark, the amount of any trademark impairment charge, or both.
We identified the Step 1 trademark impairment assessment as a critical audit matter, as auditing management’s judgements regarding forecasts of future revenue, operating margin and discount rate involves a high degree of subjectivity.
The primary procedures we performed to address this critical audit matter included:
| ● | Testing the operating effectiveness of controls relating to management’s impairment tests, including controls over the determination of the fair value of these specific trademarks. Through these tests, we evaluated management’s review controls over the financial projections, including reperformance and approval of the reasonableness of the key assumptions and inputs to the analysis, such as discount rates, growth rates, and key performance indicators such as sales forecast and operating margins. |
| ● | Testing management’s process for determining the fair value of the trademarks. We evaluated the reasonableness of management’s forecasts of future revenue and operating margin by considering the impact that COVID-19 had on the year ended December 31, 2021, and its expected impact on future periods. We also considered whether such assumptions were consistent with historical forecasts and operating results for the Company, as well as evidence obtained in other areas of the audit. Additionally, a sensitivity analysis was performed using a Capital Asset Pricing |
28
| Model in order to evaluate whether the assumptions used in management’s model fell within reasonable ranges based on third-party industry market data. |
| ● | Utilizing a valuation specialist to assist in evaluating the reasonableness of and testing the methodology used in the Company’s discounted cash flow model for the trademarks and certain significant assumptions, including projected revenue, operating margins, and discount rates. Additionally, we evaluated the work, expertise and objectivity of management’s specialist. |
/s/PricewaterhouseCoopers GRANT THORNTON LLP
Chicago, Illinois
March 1, 2018
We have served as the Company’s auditor since1968. 2018.
Chicago, Illinois
March 1, 2022
2729
|
CONSOLIDATED STATEMENTS OF
Earnings and Retained Earnings
| |
TOOTSIE ROLL INDUSTRIES, INC. AND SUBSIDIARIES | (in thousands except per share data) |
|
|
|
|
|
|
|
|
|
|
|
|
| For the year ended December 31, |
| |||||||
|
| 2017 |
| 2016 |
| 2015 |
| |||
Net product sales |
| $ | 515,674 |
| $ | 517,373 |
| $ | 536,692 |
|
Rental and royalty revenue |
|
| 3,615 |
|
| 3,727 |
|
| 3,420 |
|
Total revenue |
|
| 519,289 |
|
| 521,100 |
|
| 540,112 |
|
Product cost of goods sold |
|
| 325,924 |
|
| 320,290 |
|
| 340,090 |
|
Rental and royalty cost |
|
| 972 |
|
| 1,019 |
|
| 889 |
|
Total costs |
|
| 326,896 |
|
| 321,309 |
|
| 340,979 |
|
Product gross margin |
|
| 189,750 |
|
| 197,083 |
|
| 196,602 |
|
Rental and royalty gross margin |
|
| 2,643 |
|
| 2,708 |
|
| 2,531 |
|
Total gross margin |
|
| 192,393 |
|
| 199,791 |
|
| 199,133 |
|
Selling, marketing and administrative expenses |
|
| 120,977 |
|
| 107,377 |
|
| 108,051 |
|
Earnings from operations |
|
| 71,416 |
|
| 92,414 |
|
| 91,082 |
|
Other income, net |
|
| 13,145 |
|
| 5,498 |
|
| 1,496 |
|
Earnings before income taxes |
|
| 84,561 |
|
| 97,912 |
|
| 92,578 |
|
Provision for income taxes |
|
| 3,907 |
|
| 30,593 |
|
| 26,451 |
|
Net earnings |
|
| 80,654 |
|
| 67,319 |
|
| 66,127 |
|
Less: Net earnings (loss) attributable to noncontrolling interests |
|
| (210) |
|
| (191) |
|
| 38 |
|
Net earnings attributable to Tootsie Roll Industries, Inc. |
| $ | 80,864 |
| $ | 67,510 |
| $ | 66,089 |
|
|
|
|
|
|
|
|
|
|
|
|
Net earnings attributable to Tootsie Roll Industries, Inc. per share |
| $ | 1.28 |
| $ | 1.05 |
| $ | 1.02 |
|
Average number of shares outstanding |
|
| 63,179 |
|
| 64,086 |
|
| 65,103 |
|
|
|
|
|
|
|
|
|
|
|
|
Retained earnings at beginning of period |
| $ | 43,833 |
| $ | 52,349 |
| $ | 64,927 |
|
Net earnings attributable to Tootsie Roll Industries, Inc. |
|
| 80,864 |
|
| 67,510 |
|
| 66,089 |
|
Cash dividends |
|
| (22,548) |
|
| (22,209) |
|
| (21,308) |
|
Stock dividends |
|
| (44,924) |
|
| (53,817) |
|
| (57,359) |
|
Retained earnings at end of period |
| $ | 57,225 |
| $ | 43,833 |
| $ | 52,349 |
|
| | | | | | | | | | |
| | For the year ended December 31, | ��� | |||||||
|
| 2021 |
| 2020 |
| 2019 | | |||
Net product sales | | $ | 566,043 | | $ | 467,427 | | $ | 523,616 | |
Rental and royalty revenue | |
| 4,733 | |
| 3,636 | |
| 3,497 | |
Total revenue | |
| 570,776 | |
| 471,063 | |
| 527,113 | |
Product cost of goods sold | |
| 370,105 | |
| 299,710 | |
| 329,102 | |
Rental and royalty cost | |
| 1,430 | |
| 992 | |
| 995 | |
Total costs | |
| 371,535 | |
| 300,702 | |
| 330,097 | |
Product gross margin | |
| 195,938 | |
| 167,717 | |
| 194,514 | |
Rental and royalty gross margin | |
| 3,303 | |
| 2,644 | |
| 2,502 | |
Total gross margin | |
| 199,241 | |
| 170,361 | |
| 197,016 | |
Selling, marketing and administrative expenses | |
| 132,108 | |
| 112,117 | |
| 127,802 | |
Earnings from operations | |
| 67,133 | |
| 58,244 | |
| 69,214 | |
Other income, net | |
| 18,596 | |
| 18,018 | |
| 16,190 | |
Earnings before income taxes | |
| 85,729 | |
| 76,262 | |
| 85,404 | |
Provision for income taxes | |
| 20,421 | |
| 17,288 | |
| 20,565 | |
Net earnings | |
| 65,308 | |
| 58,974 | |
| 64,839 | |
Less: net earnings (loss) attributable to noncontrolling interests | |
| (18) | |
| (21) | |
| (81) | |
Net earnings attributable to Tootsie Roll Industries, Inc. | | $ | 65,326 | | $ | 58,995 | | $ | 64,920 | |
| | | | | | | | | | |
Net earnings attributable to Tootsie Roll Industries, Inc. per share | | $ | 0.97 | | $ | 0.86 | | $ | 0.94 | |
Average number of shares outstanding | |
| 67,431 | |
| 68,482 | |
| 69,386 | |
| | | | | | | | | | |
Retained earnings at beginning of period | | $ | 32,312 | | $ | 40,809 | | $ | 33,767 | |
Net earnings attributable to Tootsie Roll Industries, Inc. | |
| 65,326 | |
| 58,995 | |
| 64,920 | |
Cash dividends | |
| (24,061) | |
| (23,739) | |
| (23,371) | |
Stock dividends | |
| (34,032) | |
| (43,753) | |
| (34,507) | |
Retained earnings at end of period | | $ | 39,545 | | $ | 32,312 | | $ | 40,809 | |
(The accompanying notes are an integral part of these statements.)
2830
CONSOLIDATED STATEMENTS OF
Comprehensive Earnings
| |
TOOTSIE ROLL INDUSTRIES, INC. AND SUBSIDIARIES | (in thousands) |
|
|
|
|
|
|
|
|
|
|
|
|
| For the year ended December 31, |
| |||||||
|
| 2017 |
| 2016 |
| 2015 |
| |||
Net earnings |
| $ | 80,654 |
| $ | 67,319 |
| $ | 66,127 |
|
|
|
|
|
|
|
|
|
|
|
|
Other comprehensive income (loss), before tax: |
|
|
|
|
|
|
|
|
|
|
Foreign currency translation adjustments |
|
| 1,198 |
|
| (3,816) |
|
| (4,145) |
|
|
|
|
|
|
|
|
|
|
|
|
Pension and postretirement reclassification adjustment: |
|
|
|
|
|
|
|
|
|
|
Unrealized gains (losses) for the period on postretirement and pension benefits |
|
| (1,009) |
|
| (688) |
|
| 1,446 |
|
Less: reclassification adjustment for (gains) losses to net earnings |
|
| (1,462) |
|
| (1,642) |
|
| (1,451) |
|
Unrealized gains (losses) on postretirement and pension benefits |
|
| (2,471) |
|
| (2,330) |
|
| (5) |
|
|
|
|
|
|
|
|
|
|
|
|
Investments: |
|
|
|
|
|
|
|
|
|
|
Unrealized gains (losses) for the period on investments |
|
| (300) |
|
| (151) |
|
| (428) |
|
Less: reclassification adjustment for (gains) losses to net earnings |
|
| — |
|
| 5 |
|
| — |
|
Unrealized gains (losses) on investments |
|
| (300) |
|
| (146) |
|
| (428) |
|
|
|
|
|
|
|
|
|
|
|
|
Derivatives: |
|
|
|
|
|
|
|
|
|
|
Unrealized gains (losses) for the period on derivatives |
|
| (1,410) |
|
| 2,832 |
|
| (3,814) |
|
Less: reclassification adjustment for (gains) losses to net earnings |
|
| (107) |
|
| 1,150 |
|
| 4,133 |
|
Unrealized gains (losses) on derivatives |
|
| (1,517) |
|
| 3,982 |
|
| 319 |
|
|
|
|
|
|
|
|
|
|
|
|
Total other comprehensive income (loss), before tax |
|
| (3,090) |
|
| (2,310) |
|
| (4,259) |
|
Income tax benefit (expense) related to items of other comprehensive income |
|
| 1,545 |
|
| (572) |
|
| (7) |
|
Total comprehensive earnings |
|
| 79,109 |
|
| 64,437 |
|
| 61,861 |
|
Comprehensive earnings (loss) attributable to noncontrolling interests |
|
| (210) |
|
| (191) |
|
| 38 |
|
Total comprehensive earnings attributable to Tootsie Roll Industries, Inc. |
| $ | 79,319 |
| $ | 64,628 |
| $ | 61,823 |
|
| | | | | | | | | | |
| | For the year ended December 31, | | |||||||
|
| 2021 |
| 2020 |
| 2019 |
| |||
Net earnings | | $ | 65,308 | | $ | 58,974 | | $ | 64,839 | |
| | | | | | | | | | |
Other comprehensive income (loss), before tax: | | | | | | | | | | |
Foreign currency translation adjustments | |
| (301) | |
| (1,213) | |
| 791 | |
| | | | | | | | | | |
Pension and postretirement reclassification adjustments: | | | | | | | | | | |
Unrealized gains (losses) for the period on postretirement and pension benefits | |
| 448 | |
| 467 | |
| (1,230) | |
Less: reclassification adjustment for (gains) losses to net earnings | |
| (1,405) | |
| (1,349) | |
| (1,522) | |
Unrealized gains (losses) on postretirement and pension benefits | |
| (957) | |
| (882) | |
| (2,752) | |
| | | | | | | | | | |
Investments: | | | | | | | | | | |
Unrealized gains (losses) for the period on investments | |
| (4,227) | |
| 1,463 | |
| 3,130 | |
Less: reclassification adjustment for (gains) losses to net earnings | |
| (96) | |
| — | |
| 34 | |
Unrealized gains (losses) on investments | |
| (4,323) | |
| 1,463 | |
| 3,164 | |
| | | | | | | | | | |
Derivatives: | | | | | | | | | | |
Unrealized gains (losses) for the period on derivatives | |
| 1,423 | |
| 1,259 | |
| 451 | |
Less: reclassification adjustment for (gains) losses to net earnings | |
| (2,593) | |
| 325 | |
| 677 | |
Unrealized gains (losses) on derivatives | |
| (1,170) | |
| 1,584 | |
| 1,128 | |
| | | | | | | | | | |
Total other comprehensive income (loss), before tax | |
| (6,751) | |
| 952 | |
| 2,331 | |
Income tax benefit (expense) related to items of other comprehensive income | |
| 1,553 | |
| (522) | |
| (354) | |
Total comprehensive earnings | | | 60,110 | | | 59,404 | | | 66,816 | |
Comprehensive earnings (loss) attributable to noncontrolling interests | | | (18) | | | (21) | | | (81) | |
Total comprehensive earnings attributable to Tootsie Roll Industries, Inc. | | $ | 60,128 | | $ | 59,425 | | $ | 66,897 | |
(The accompanying notes are an integral part of these statements.)
2931
| |
| |
CONSOLIDATED STATEMENTS OF | |
Financial Position | |
TOOTSIE ROLL INDUSTRIES, INC. AND SUBSIDIARIES | (in thousands) |
Assets
|
|
|
|
|
|
|
|
|
| December 31, |
| ||||
|
| 2017 |
| 2016 |
| ||
CURRENT ASSETS: |
|
|
|
|
|
|
|
Cash and cash equivalents |
| $ | 96,314 |
| $ | 119,145 |
|
Restricted cash |
|
| 406 |
|
| 382 |
|
Investments |
|
| 41,606 |
|
| 67,513 |
|
Accounts receivable trade, less allowances of $1,921 and $1,884 |
|
| 47,354 |
|
| 42,964 |
|
Other receivables |
|
| 5,425 |
|
| 3,299 |
|
Inventories: |
|
|
|
|
|
|
|
Finished goods and work-in-process |
|
| 31,922 |
|
| 34,631 |
|
Raw materials and supplies |
|
| 22,905 |
|
| 22,900 |
|
Income taxes receivable |
|
| 12,974 |
|
| 1,444 |
|
Prepaid expenses |
|
| 12,014 |
|
| 5,702 |
|
Deferred income taxes |
|
| — |
|
| 1,320 |
|
Total current assets |
|
| 270,920 |
|
| 299,300 |
|
PROPERTY, PLANT AND EQUIPMENT, at cost: |
|
|
|
|
|
|
|
Land |
|
| 21,962 |
|
| 22,081 |
|
Buildings |
|
| 118,491 |
|
| 116,398 |
|
Machinery and equipment |
|
| 381,665 |
|
| 369,802 |
|
Construction in progress |
|
| 4,866 |
|
| 3,546 |
|
|
|
| 526,984 |
|
| 511,827 |
|
Less—Accumulated depreciation |
|
| 348,012 |
|
| 330,922 |
|
Net property, plant and equipment |
|
| 178,972 |
|
| 180,905 |
|
OTHER ASSETS: |
|
|
|
|
|
|
|
Goodwill |
|
| 73,237 |
|
| 73,237 |
|
Trademarks |
|
| 175,024 |
|
| 175,024 |
|
Investments |
|
| 190,510 |
|
| 164,665 |
|
Split dollar officer life insurance |
|
| 26,042 |
|
| 26,042 |
|
Prepaid expenses and other |
|
| 15,817 |
|
| 602 |
|
Deferred income taxes |
|
| 424 |
|
| 326 |
|
Total other assets |
|
| 481,054 |
|
| 439,896 |
|
Total assets |
| $ | 930,946 |
| $ | 920,101 |
|
| | | | | | | |
| | December 31, | | ||||
|
| 2021 |
| 2020 |
| ||
CURRENT ASSETS: | | | | | | | |
Cash and cash equivalents | | $ | 105,840 | | $ | 166,841 | |
Restricted cash | | | 386 | | | 415 | |
Investments | |
| 39,968 | |
| 42,090 | |
Accounts receivable trade, less allowances of $2,281 and $1,694 | |
| 54,921 | |
| 41,209 | |
Other receivables | |
| 3,920 | |
| 3,894 | |
Inventories: | | | | | | | |
Finished goods and work-in-process | |
| 31,431 | |
| 35,583 | |
Raw materials and supplies | |
| 24,074 | |
| 23,996 | |
Prepaid expenses | |
| 7,761 | |
| 6,844 | |
Total current assets | |
| 268,301 | |
| 320,872 | |
PROPERTY, PLANT AND EQUIPMENT, at cost: | | | | | | | |
Land | |
| 21,704 | |
| 21,738 | |
Buildings | |
| 130,158 | |
| 123,883 | |
Machinery and equipment | |
| 446,777 | |
| 422,506 | |
Construction in progress | |
| 15,344 | |
| 14,347 | |
Operating lease right-of-use assets | |
| 7,419 | |
| 858 | |
| |
| 621,402 | |
| 583,332 | |
Less — accumulated depreciation | |
| 412,496 | |
| 396,004 | |
Net property, plant and equipment | |
| 208,906 | |
| 187,328 | |
OTHER ASSETS: | | | | | | | |
Goodwill | |
| 73,237 | |
| 73,237 | |
Trademarks | |
| 175,024 | |
| 175,024 | |
Investments | |
| 291,175 | |
| 220,020 | |
Split dollar officer life insurance | |
| — | |
| 2,514 | |
Prepaid expenses and other assets | |
| 603 | |
| 4,525 | |
Deferred income taxes | |
| 1,372 | |
| 1,038 | |
Total other assets | |
| 541,411 | |
| 476,358 | |
Total assets | | $ | 1,018,618 | | $ | 984,558 | |
(The accompanying notes are an integral part of these statements.)
3032
(in thousands except per share data)
Liabilities and Shareholders’ Equity
|
|
|
|
|
|
|
|
|
| December 31, |
| ||||
|
| 2017 |
| 2016 |
| ||
CURRENT LIABILITIES: |
|
|
|
|
|
|
|
Accounts payable |
| $ | 11,928 |
| $ | 10,320 |
|
Bank loans |
|
| 440 |
|
| 336 |
|
Dividends payable |
|
| 5,660 |
|
| 5,573 |
|
Accrued liabilities |
|
| 45,157 |
|
| 46,300 |
|
Postretirement health care benefits |
|
| 603 |
|
| 513 |
|
Deferred income taxes |
|
| — |
|
| 519 |
|
Total current liabilities |
|
| 63,788 |
|
| 63,561 |
|
NONCURRENT LIABILITIES: |
|
|
|
|
|
|
|
Deferred income taxes |
|
| 41,457 |
|
| 46,060 |
|
Bank loans |
|
| — |
|
| 230 |
|
Postretirement health care benefits |
|
| 12,894 |
|
| 11,615 |
|
Industrial development bonds |
|
| 7,500 |
|
| 7,500 |
|
Liability for uncertain tax positions |
|
| 4,817 |
|
| 5,185 |
|
Deferred compensation and other liabilities |
|
| 66,686 |
|
| 74,412 |
|
Total noncurrent liabilities |
|
| 133,354 |
|
| 145,002 |
|
TOOTSIE ROLL INDUSTRIES, INC. SHAREHOLDERS’ EQUITY: |
|
|
|
|
|
|
|
Common stock, $.69-4/9 par value— 120,000 shares authorized— 37,960 and 37,701, respectively, issued |
|
| 26,361 |
|
| 26,181 |
|
Class B common stock, $.69-4/9 par value— 40,000 shares authorized— 24,891 and 24,221, respectively, issued |
|
| 17,285 |
|
| 16,820 |
|
Capital in excess of par value |
|
| 656,752 |
|
| 646,768 |
|
Retained earnings |
|
| 57,225 |
|
| 43,833 |
|
Accumulated other comprehensive loss |
|
| (21,791) |
|
| (20,246) |
|
Treasury stock (at cost)— 85 shares and 83 shares, respectively |
|
| (1,992) |
|
| (1,992) |
|
Total Tootsie Roll Industries, Inc. shareholders’ equity |
|
| 733,840 |
|
| 711,364 |
|
Noncontrolling interests |
|
| (36) |
|
| 174 |
|
Total equity |
|
| 733,804 |
|
| 711,538 |
|
Total liabilities and shareholders’ equity |
| $ | 930,946 |
| $ | 920,101 |
|
| | | | | | | |
| | December 31, | | ||||
| | 2021 |
| 2020 |
| ||
CURRENT LIABILITIES: | | | | | | | |
Accounts payable | | $ | 14,969 | | $ | 13,025 | |
Bank loans | | | 939 | | | 832 | |
Dividends payable | |
| 6,042 | |
| 5,948 | |
Accrued liabilities | |
| 53,896 | |
| 45,099 | |
Postretirement health care benefits | |
| 616 | |
| 544 | |
Operating lease liabilities | | | 1,072 | | | 780 | |
Income taxes payable | | | 2,434 | |
| 3,793 | |
Total current liabilities | |
| 79,968 | |
| 70,021 | |
NONCURRENT LIABILITIES: | | | | | | | |
Deferred income taxes | |
| 45,461 | |
| 47,900 | |
Postretirement health care benefits | |
| 12,619 | |
| 12,943 | |
Industrial development bonds | |
| 7,500 | |
| 7,500 | |
Liability for uncertain tax positions | |
| 3,415 | |
| 3,351 | |
Operating lease liabilities | | | 6,347 | | | 78 | |
Deferred compensation and other liabilities | |
| 94,511 | |
| 79,665 | |
Total noncurrent liabilities | |
| 169,853 | |
| 151,437 | |
TOOTSIE ROLL INDUSTRIES, INC. SHAREHOLDERS’ EQUITY: | | | | | | | |
Common stock, $.69-4/9 par value — 120,000 shares authorized — 39,344 and 39,073, respectively, issued | |
| 27,322 | |
| 27,134 | |
Class B common stock, $.69-4/9 par value — 40,000 shares authorized — 27,793 and 27,012, respectively, issued | |
| 19,300 | |
| 18,758 | |
Capital in excess of par value | |
| 709,880 | |
| 706,930 | |
Retained earnings | |
| 39,545 | |
| 32,312 | |
Accumulated other comprehensive loss | |
| (25,013) | |
| (19,815) | |
Treasury stock (at cost) — 96 shares and 93 shares, respectively | |
| (1,992) | |
| (1,992) | |
Total Tootsie Roll Industries, Inc. shareholders’ equity | |
| 769,042 | |
| 763,327 | |
Noncontrolling interests | | | (245) | | | (227) | |
Total equity | | | 768,797 | | | 763,100 | |
Total liabilities and shareholders' equity | | $ | 1,018,618 | | $ | 984,558 | |
(The accompanying notes are an integral part of these statements.)
3133
| | | | | | | | | | | |
CONSOLIDATED STATEMENTS OF | | ||||||||||
Cash Flows | | ||||||||||
TOOTSIE ROLL INDUSTRIES, INC. AND SUBSIDIARIES | (in thousands) | ||||||||||
| | | | | | | | | | | |
|
|
|
|
|
|
|
|
|
|
|
|
| For the year ended December 31, |
| |||||||
|
| 2017 |
| 2016 |
| 2015 |
| |||
CASH FLOWS FROM OPERATING ACTIVITIES: |
|
|
|
|
|
|
|
|
|
|
Net earnings |
| $ | 80,654 |
| $ | 67,319 |
| $ | 66,127 |
|
Adjustments to reconcile net earnings to net cash provided by operating activities: |
|
|
|
|
|
|
|
|
|
|
Depreciation |
|
| 18,991 |
|
| 19,627 |
|
| 20,388 |
|
Deferred income taxes |
|
| (2,337) |
|
| 199 |
|
| 255 |
|
Impairment of majority-owned Spanish subsidiaries |
|
| 2,371 |
|
| — |
|
| — |
|
Amortization of marketable security premiums |
|
| 2,386 |
|
| 2,830 |
|
| 3,105 |
|
Changes in operating assets and liabilities: |
|
|
|
|
|
|
|
|
|
|
Accounts receivable |
|
| (4,012) |
|
| 6,869 |
|
| (8,929) |
|
Other receivables |
|
| (3,146) |
|
| 473 |
|
| 1,119 |
|
Inventories |
|
| 1,558 |
|
| 4,183 |
|
| 7,530 |
|
Prepaid expenses and other assets |
|
| (22,052) |
|
| 2,999 |
|
| 11,593 |
|
Accounts payable and accrued liabilities |
|
| (557) |
|
| (2,061) |
|
| 3,839 |
|
Income taxes payable |
|
| (11,899) |
|
| (5,797) |
|
| (115) |
|
Postretirement health care benefits |
|
| (1,192) |
|
| (1,216) |
|
| (903) |
|
Deferred compensation and other liabilities |
|
| (17,792) |
|
| 3,125 |
|
| (12,936) |
|
Net cash provided by operating activities |
|
| 42,973 |
|
| 98,550 |
|
| 91,073 |
|
CASH FLOWS FROM INVESTING ACTIVITIES: |
|
|
|
|
|
|
|
|
|
|
Change in restricted cash |
|
| (23) |
|
| — |
|
| 1,149 |
|
Capital expenditures |
|
| (16,673) |
|
| (16,090) |
|
| (15,534) |
|
Purchases of trading securities |
|
| (5,089) |
|
| (4,569) |
|
| (4,095) |
|
Sales of trading securities |
|
| 22,396 |
|
| 1,433 |
|
| 16,644 |
|
Purchase of available for sale securities |
|
| (89,364) |
|
| (81,835) |
|
| (61,951) |
|
Sale and maturity of available for sale securities |
|
| 79,410 |
|
| 49,177 |
|
| 55,264 |
|
Net cash used in investing activities |
|
| (9,343) |
|
| (51,884) |
|
| (8,523) |
|
CASH FLOWS FROM FINANCING ACTIVITIES: |
|
|
|
|
|
|
|
|
|
|
Shares purchased and retired |
|
| (34,133) |
|
| (29,093) |
|
| (33,004) |
|
Dividends paid in cash |
|
| (22,621) |
|
| (22,266) |
|
| (20,775) |
|
Proceeds from bank loans |
|
| 2,162 |
|
| 2,760 |
|
| — |
|
Repayment of bank loans |
|
| (2,289) |
|
| (2,788) |
|
| (133) |
|
Net cash used in financing activities |
|
| (56,881) |
|
| (51,387) |
|
| (53,912) |
|
|
|
|
|
|
|
|
|
|
|
|
Effect of exchange rate changes on cash |
|
| 420 |
|
| (2,279) |
|
| (2,601) |
|
|
|
|
|
|
|
|
|
|
|
|
Increase (decrease) in cash and cash equivalents |
|
| (22,831) |
|
| (7,000) |
|
| 26,037 |
|
Cash and cash equivalents at beginning of year |
|
| 119,145 |
|
| 126,145 |
|
| 100,108 |
|
Cash and cash equivalents at end of year |
| $ | 96,314 |
| $ | 119,145 |
| $ | 126,145 |
|
|
|
|
|
|
|
|
|
|
|
|
Supplemental cash flow information: |
|
|
|
|
|
|
|
|
|
|
Income taxes paid |
| $ | 18,854 |
| $ | 36,365 |
| $ | 24,940 |
|
Interest paid |
| $ | 68 |
| $ | 34 |
| $ | 17 |
|
Stock dividend issued |
| $ | 69,739 |
| $ | 61,671 |
| $ | 57,220 |
|
| | | | | | | | | | |
| | For the year ended December 31, | | |||||||
|
| 2021 |
| 2020 |
| 2019 |
| |||
CASH FLOWS FROM OPERATING ACTIVITIES: | | | | | | | | | | |
Net earnings | | $ | 65,308 | | $ | 58,974 | | $ | 64,839 | |
Adjustments to reconcile net earnings to net cash provided by operating activities: | | | | | | | | | | |
Depreciation | |
| 17,570 | |
| 18,184 | |
| 18,779 | |
Deferred income taxes | | | (1,263) | | | (279) | | | 2,832 | |
Impairment of majority-owned foreign subsidiaries | |
| — | |
| — | |
| 377 | |
Amortization of marketable security premiums | |
| 3,837 | |
| 1,404 | |
| 1,282 | |
Changes in operating assets and liabilities: | | | | | | | | | | |
Accounts receivable | |
| (14,130) | |
| 3,483 | |
| 5,086 | |
Other receivables | |
| (706) | |
| 636 | |
| (313) | |
Inventories | |
| 3,940 | |
| (770) | |
| (4,383) | |
Prepaid expenses and other assets | |
| 2,622 | |
| 2,961 | |
| 4,362 | |
Accounts payable and accrued liabilities | |
| 10,010 | |
| 3,849 | |
| 1,080 | |
Income taxes payable | |
| (1,296) | |
| 3,012 | |
| 4,336 | |
Postretirement health care benefits | |
| (1,281) | |
| (1,041) | |
| (1,478) | |
Deferred compensation and other liabilities | |
| 687 | |
| (15,703) | |
| 3,422 | |
Net cash provided by operating activities | |
| 85,298 | |
| 74,710 | |
| 100,221 | |
CASH FLOWS FROM INVESTING ACTIVITIES: | | | | | | | | | | |
Capital expenditures | |
| (31,426) | |
| (17,970) | |
| (20,258) | |
Repayment of premiums on split dollar life insurance policies | | | 2,514 | | | 23,527 | | | — | |
Purchases of trading securities | |
| (2,668) | |
| (3,183) | |
| (3,427) | |
Sales of trading securities | | | 968 | | | 18,058 | |
| 795 | |
Purchase of available for sale securities | |
| (108,576) | |
| (109,816) | |
| (67,730) | |
Sale and maturity of available for sale securities | |
| 47,289 | |
| 98,885 | |
| 75,611 | |
Net cash (used in) provided by investing activities | |
| (91,899) | |
| 9,501 | |
| (15,009) | |
CASH FLOWS FROM FINANCING ACTIVITIES: | | | | | | | | | | |
Shares purchased and retired | |
| (30,184) | |
| (32,055) | |
| (34,116) | |
Dividends paid in cash | | | (24,136) | |
| (23,810) | |
| (23,460) | |
Proceeds from bank loans | | | 3,792 | | | 3,902 | | | 3,582 | |
Repayment of bank loans | |
| (3,618) | |
| (3,883) | |
| (3,193) | |
Net cash used in financing activities | |
| (54,146) | |
| (55,846) | |
| (57,187) | |
Effect of exchange rate changes on cash | | | (283) | | | (449) | | | 28 | |
Increase (decrease) in cash and cash equivalents | |
| (61,030) | |
| 27,916 | |
| 28,053 | |
Cash, cash equivalents and restricted cash at beginning of year | |
| 167,256 | |
| 139,340 | |
| 111,287 | |
Cash, cash equivalents and restricted cash at end of year | | $ | 106,226 | | $ | 167,256 | | $ | 139,340 | |
| | | | | | | | | | |
Supplemental cash flow information: | | | | | | | | | | |
Income taxes paid | | $ | 22,855 | | $ | 14,503 | | $ | 13,858 | |
Interest paid | | $ | 6 | | $ | 57 | | $ | 121 | |
Stock dividend issued | | $ | 64,667 | | $ | 63,402 | | $ | 70,557 | |
(The accompanying notes are an integral part of these statements.)
3234
Notes to Consolidated Financial Statements ($ in thousands except per share data)
TOOTSIE ROLL INDUSTRIES, INC. AND SUBSIDIARIES
NOTE 1—SIGNIFICANT ACCOUNTING POLICIES:
Basis of consolidation:
The consolidated financial statements include the accounts of Tootsie Roll Industries, Inc. and its wholly-owned and majority-owned subsidiaries (the Company), which are primarily engaged in the manufacture and sales of candy products. Non-controlling interests relating to majority-owned subsidiaries are reflected in the consolidated financial statements and all significant intercompany transactions have been eliminated. Certain amounts previously reported have been reclassified to conform to the current year presentation.These reclassifications had no effect on previously reported net earnings.
The preparation of financial statements in conformity with generally accepted accounting principles in the United States of America requires management to make estimates and assumptions that affect the reported amounts of assets and liabilities and disclosure of contingent assets and liabilities at the date of the financial statements and the reported amounts of revenues and expenses during the reporting period. Actual results could differ from those estimates.
Revenue recognition:
Products are soldThe Company’s revenues, primarily net product sales, principally result from the sale of goods, reflect the consideration to customerswhich the Company expects to be entitled, generally based on acceptedcustomer purchase orders which include quantity, salesorders. The Company records revenue based on a five-step model in accordance with Accounting Standards Codification ("ASC") Topic 606. Adjustments for estimated customer cash discounts upon payment, discounts for price and other relevant terms of sale. Revenue, net of applicable provisions for discounts,adjustments, product returns, allowances, and certain advertising and promotional costs, including consumer coupons, (price reduction),are variable consideration and are recorded as a reduction of product sales revenue in the same period the related product sales are recorded. Such estimates are calculated using historical averages adjusted for any expected changes due to current business conditions and experience. A net product sale is recognizedrecorded when productsthe Company delivers the product to the customer, or in certain instances, the customer picks up the goods at the Company’s distribution centers, and thereby obtains control of such product. Amounts billed and due from our customers are delivered to customersclassified as accounts receivables trade on the balance sheet and collectability is reasonably assured.require payment on a short-term basis. Accounts receivable are unsecured. Shipping and handling costs of $43,973, $40,629,$55,289, $42,593, and $42,619$49,288 in 2017, 20162021, 2020 and 2015,2019, respectively, are included in selling, marketing and administrative expenses. Accounts receivableA minor amount of royalty income (less than 0.2% of our consolidated net sales) is also recognized from sales-based licensing arrangements, pursuant to which revenue is recognized as the third-party licensee sales occur. Rental income (less than 1% of our consolidated net sales) is not considered revenue from contracts from customers.
Leases:
The Company identifies leases by evaluating its contracts to determine if the contract conveys the right to use an identified asset for a stated period of time in exchange for consideration. The Company considers whether it can control the underlying asset and has the right to obtain substantially all of the economic benefits or outputs from the asset. Leases with terms greater than 12 months are unsecured.classified as either operating or finance leases at the commencement date. For these leases, the Company capitalized the present value of the minimum lease payments over the lease terms as a right-of-use asset with an offsetting lease liability. The discount rate used to calculate the present value of the minimum lease payments is typically the Company’s incremental borrowing rate, as the rate implicit in the lease is generally not known or determinable. The lease term includes any noncancelable period for which the Company has the right to use the asset. Currently, all capitalized leases are classified as operating leases and the Company records lease expense on a straight-line basis over the term of the lease.
Cash and cash equivalents:
The Company considers temporary cash investmentsshort-term debt securities with an original maturity of three months or less to be cash equivalents. Substantially all cash and cash equivalents are held at a major U.S. money center bank or its foreign branches (Bank of America), or its investment broker affiliate (Merrill Lynch). The Company also holds certificates of deposit (CDs)
35
of U.S. banks selected by this investment broker based on their financial ratings; substantially all such CDs are invested in separate individual banks which are generally not in excess of the Federal Deposit Insurance Corporation (FDIC) limit of $250 per bank. The cash in the Company's U.S. banks (primarily Bank of America) is not fully insured by the FDIC due to the statutory limit of $250. The Company had approximately $4,577 and $8,303 of cash held by it is foreign subsidiaries, principally foreign branches of a U.S. bank (Bank of America), at December 31, 2021 and 2020, respectively. The Company's cash in its foreign bank accounts is also not fully insured.
Investments:
Investments consist of various marketable securities with maturities of generally up to three years, and variable rate demand notes with interest rates that are generally reset weekly and the security can be “put” back and sold weekly. The Company classifies debt and equity securities as either available for sale or trading. Available for sale debt securities are not actively traded by the Company and are carried at fair value. The Company follows current fair value measurement guidance and unrealized gains and losses on these securities are excluded from earnings and are reported as a separate component of shareholders’ equity, net of applicable taxes, until realized or other-than-temporarily impaired. Trading securities related to deferred compensation arrangements are carried at fair value with gains or losses included in other income, net. The Company invests in trading securities to economically hedge changes in its deferred compensation liabilities.
The Company regularly reviews its investments to determine whether a decline in fair value below the cost basis is other-than-temporary. If the decline in fair value is judged to be other-than-temporary, the cost basis of the security is written down to fair value and the amount of the write-down is included in other income, net. Further information regarding the fair value of the Company’s investments is included in Note 10 of the Company’s Notes to Consolidated Financial Statements.
Derivative instruments and hedging activities:
Authoritative guidance requires qualitative disclosures about objectives and strategies for using derivatives, quantitative disclosures about fair value amounts of derivative instruments and related gains and losses, and disclosures about credit-risk-related contingent features in derivative agreements.
33
From time to time, the Company enters into commodity futures commodity options contracts and foreign currency forward contracts. Commodity futures and options are intended and are effective as hedges of market price risks associated with the anticipated purchase of certain raw materials (primarily sugar). Foreign currency forward contracts are intended and are effective as hedges of the Company’s exposure to the variability of cash flows, primarily related to the foreign exchange rate changes of products manufactured in Canada and sold in the United States, and periodic equipment purchases from foreign suppliers denominated in a foreign currency. The Company does not engage in trading or other speculative use of derivative instruments. Further information regarding derivative instruments and hedging activities is included in Note 11 of the Company’s Notes to Consolidated Financial Statements.
Inventories:
Inventories are stated at lower of cost not to exceed market.or net realizable value. The cost of substantially all of the Company’s inventories ($51,69451,355 and $53,278$54,935 at December 31, 20172021 and 2016,2020, respectively) has been determined by the last-in, first-out (LIFO) method. The excess of current cost over LIFO cost of inventories approximates $18,825$21,348 and $17,574$19,339 at December 31, 20172021 and 2016,2020, respectively. The cost of certain foreign inventories ($4,4234,150 and $4,253$4,644 at December 31, 20172021 and 2016,2020, respectively) has been determined by the first-in, first-out (FIFO) method. Rebates, discounts and other cash consideration received from vendors related to inventory purchases is reflected as a reduction in the cost of the related inventory item, and is, therefore, reflected in cost of sales when the related inventory item is sold.
Property, plant and equipment:
Depreciation is computed for financial reporting purposes by use of the straight-line method based on useful lives of 20 to 3550 years for buildings and 5 to 20 years for machinery and equipment. Depreciation expense was $18,991, $19,627$17,570, $18,184 and $20,388$18,779 in 2017, 20162021, 2020 and 2015,2019, respectively.
36
Carrying value of long-lived assets:
The Company reviews long-lived assets to determine if there are events or circumstances indicating that the amount of the asset reflected in the Company’s balance sheet may not be recoverable. When such indicators are present, the Company compares the carrying value of the long-lived asset, or asset group, to the future undiscounted cash flows of the underlying assets to determine if impairment exists. If applicable, an impairment charge would be recorded to write down the carrying value to its fair value. The determination of fair value involves the use of estimates of future cash flows that involve considerable management judgment and are based upon assumptions about expected future operating performance. The actual cash flows could differ from management’s estimates due to changes in business conditions, operating performance, and economic conditions. In fourth quarter 2017,2019, the Company recorded a chargecharges of $2,371$377 relating to the impairment of assets of a foreign subsidiary which is included in selling, marketing and administrative expense. NoExcept for the aforementioned, no impairment charges of long-lived assets were recorded by the Company during 2016 and 2015.2021, 2020 or 2019.
Postretirement health care benefits:
The Company provides certain postretirement health care benefits to a group of “grandfathered” corporate office and management employees. The cost of these postretirement benefits is accrued during the employees’ working careers. See Note 7 of the Company’s Notes to Consolidated Financial Statements for additional information. The Company also providesprovided split dollar life benefits to certainan executive officers.officer. The Company recordsrecorded an asset equal to the cumulative insurance premiums paid that will be recovered upon the death of the covered employeesexecutive officer or earlier under the terms of the plan. No premiums were paid in 2017, 2016 and 2015. Certain split dollar agreements were terminated during 2015 which resulted in the full repayment to the Company of all of the cumulative premiums previously paid on these policies. No split dollar agreements were terminated during 2016 or 2017. During 2015,2021, the Company received $7,591$2,514 of such repaymentspreviously paid premiums on these insurance policies which was recorded as a reduction to this asset and has now fully recovered all the premiums under the terms of the plan. NaN premiums were paid in the carrying value of Split Dollar Officer Life Insurance.2021, 2020 or 2019.
34
Goodwill and indefinite-lived intangible assets:
In accordance with authoritative guidance, goodwill and intangible assets with indefinite lives are not amortized, but rather reviewed and tested for impairment at least annually unless certain interim triggering events or circumstances require more frequent testing. All trademarks have been assessed by management to have indefinite lives because they are expected to generate cash flows indefinitely. Management believes that all assumptions used for the impairment review and testing are consistent with those utilized by market participants performing similar valuations. NoNaN impairments of intangibles, including trademarks and goodwill, were recorded in 2017, 20162021, 2020 or 2015.2019.
Current accounting guidance provides entities an option of performing a qualitative assessment (a "step-zero" test) before performing a quantitative analysis. If the entity determines, on the basis of certain qualitative factors, that it is more-likely-than-not that the intangibles (goodwill and certain trademarks) are not impaired, the entity would not need to proceed to the two step impairment testing process (quantitative analysis) as prescribed in the guidance. During fourth quarter 2017,2021 and 2020, the Company performed a “step zero” test of its goodwill and certain trademarks, and concluded that there was no impairment based on this guidance. Impairment testingFor the fair value assessment of certain trademarks where the “step-zero” analysis was not considered appropriate, impairment testing was performed in fourth quarter 20172021 and 2020 using discounted cash flows and estimated royalty rates. For these trademarks, holding all other assumptions constant at the test date in 2021, a 100 basis point increase in the discount rate or a 100 basis point decrease in the royalty rate would reduce the fair value of these trademarks by approximately 16% and 10%, respectively. Individually, a 100 basis point increase in the discount rate or a 100 basis point decrease in the royalty rate would not result in a potential impairment as of December 31, 2021.
Income taxes:
Deferred income taxes are recorded and recognized for future tax effects of temporary differences between financial and income tax reporting. The Company records valuation allowances in situations where the realization of deferred tax assets is not more-likely-than-not. The Company periodically reviews assumptions and estimates of the Company’s probable tax obligations and effects on its liability for uncertain tax positions, using informed judgment which may include the use of third-party consultants, advisors and legal counsel, as well as historical experience.
37
Further information regarding U.S. tax reform and other income tax matters are included in Note 4 of the Company’s Notes to Consolidated Financial Statements.
Foreign currency translation:
The U.S. dollar is used as the functional currency where a substantial portion of the subsidiary’s business is indexed to the U.S. dollar or where its manufactured products are principally sold in the U.S. All other foreign subsidiaries use the local currency as their functional currency. Where the U.S. dollar is used as the functional currency, foreign currency remeasurements are recorded as a charge or credit to other income, net in the statement of earnings. Where the foreign local currency is used as the functional currency, translation adjustments are recorded as a separate component of accumulated other comprehensive income (loss).
Restricted cash:
Restricted cash comprises certain cash deposits of the Company’s majority-owned Spanish subsidiariessubsidiary with international banks that are pledged as collateral for letters of credit and bank borrowings.
VEBA trust:
The Company maintains a VEBA trust managed and controlled by the Company, to fund the estimated future costs of certain employee health, welfare and other benefits. The Company made a $20,024 contribution to the VEBA trust in fourth quarter 2017 but no contribution0 contributions were made to the trust in 2016.2021, 2020 or 2019. The Company will becontinue using the VEBA trust funds to pay the actual cost of such benefits through most or possibly all of 2022. At December 31, 20172021 and 2016,2020, the VEBA trust held $19,713$3,941 and $3,027,$8,272, respectively, of aggregate cash and cash equivalents. This asset value is included in prepaid expenses and long-term other assets in the Company’s Consolidated Statement of Financial Position. These assets are categorized as Level 1 within the fair value hierarchy.
Bank loans:
Bank loans compriseconsist of short term (less than 120 days) borrowings by the Company’s majority-owned Spanish subsidiaries whichsubsidiary that are held by international banks. The weighted-average interest rate as of December 31, 2021 and 2020 was 3.1% and 3.0%, respectively.
35
Comprehensive earnings:
Comprehensive earnings include net earnings, foreign currency translation adjustments and unrealized gains/losses on commodity and/or foreign currency hedging contracts, available for sale securities and certain postretirement benefit obligations.
Earnings per share:
A dual presentation of basic and diluted earnings per share is not required due to the lack of potentially dilutive securities under the Company’s simple capital structure. Therefore, all earnings per share amounts represent basic earnings per share.
The Class B common stock has essentially the same rights as common stock, except that each share of Class B common stock has ten10 votes per share (compared to one1 vote per share of common stock), is not traded on any exchange, is restricted as to transfer and is convertible on a share-for-share basis, at any time and at no cost to the holders, into shares of common stock which are traded on the New York Stock Exchange.
Use of estimates:
The preparation of consolidated financial statements in conformity with accounting principles generally accepted in the U.S. requires management to make estimates and assumptions that affect the amounts reported. Estimates are used
38
when accounting for sales discounts, allowances and incentives, product liabilities, assets recorded at fair value, income taxes, depreciation, amortization, employee benefits, contingencies and intangible asset and liability valuations. Actual results may or may not differ from those estimates.
RecentRecently adopted accounting pronouncements:
In May 2014,March 2020, the Financial Accounting Standards Board ("FASB")FASB issued Accounting Standards Update ("ASU") 2014-09ASU 2020-04 which provides optional guidance for a limited time to ease the potential burden in accounting for reference rate reform. In January 2021, the FASB issued ASU 2021-1 which clarified the scope of ASU 2020-04. The new guidance provides optional expedients and exceptions for applying U.S. GAAP to contracts, hedging relationships and other transactions affected by reference rate reform if certain criteria are met. The amendments apply only to contracts and hedging relationships that introduces a new five-step revenue recognition model in which an entity should recognize revenue to depict the transfer of promised goodsreference LIBOR or services to customers in an amount that reflects the consideration to which the entity expectsanother reference rate expected to be entitleddiscontinued due to reference rate reform. These amendments are effective immediately and may be applied prospectively to contract modifications made and hedging relationships entered into or evaluated on or before December 31, 2022. The Company adopted ASU 2020-04 and ASU 2021-1 in exchangefirst quarter 2021. The adoption of these ASU’s did not have a material impact on the Company’s consolidated financial statements.
In December 2019, the FASB issued ASU No. 2019-12 which is designed to simplify the accounting for those goods or services. Thisincome taxes by removing certain exceptions to the general principles in Topic 740. ASU also requires disclosures sufficient to enable users to understand the nature, amount, timing, and uncertainty of revenue and cash flows arising from contracts with customers, including qualitative and quantitative disclosures about contracts with customers, significant judgments and changes in judgments, and assets recognized from the costs to obtain or fulfill a contract. This standardNo. 2019-12 is effective for fiscal years beginning after December 15, 2017, including interim periods within that reporting period. The Company has substantially completed its evaluation of the new guidance, and based upon this evaluation,the Company does not believe that the adoption of this new guidance will have a material effect on its consolidated statements of earnings, but management is expecting to reduce certain accrued liabilities (and increase retained earnings) relating to variable consideration, as defined by the new guidance on its consolidated statement of financial position (balance sheet). The Company is adopting the new standard effective January 1, 2018 (first quarter 2018), on a “modified retrospective” basis.
In January 2016, the FASB issued ASU 2016-01 which modifies certain aspects of the recognition, measurement, presentation, and disclosure of financial instruments. This standard is effective for fiscal years, and interim periods within those years, beginning after December 15, 2017, and early adoption is permitted. The Company does not expect this standard will have a significant impact on the Company’s consolidated financial statements upon adoption.
In February 2016, the FASB issued ASU 2016-02 which amends existing guidance to require lessees to recognize assets and liabilities on the balance sheet for the rights and obligations created by long-term leases and to disclose additional quantitative and qualitative information about leasing arrangements. This ASU also provides clarifications surrounding the presentation of the effects of leases in the income statement and statement of cash flows. This guidance will be effective for the Company on January 1, 2019. The Company owns substantially all of its real and personal property and does not expect this standard will have a significant impact on the Company’s consolidated financial statements upon adoption.
36
In April 2016, the FASB issued ASU 2016-10, which contains amendments to the new revenue recognition standard on identifying performance obligations and accounting for licenses of intellectual property. The amendments related to identifying performance obligations clarify when a promised good or service is separately identifiable and allows entities to disregard items that are immaterial in the context of a contract. The licensing implementation amendments clarify how an entity should evaluate the nature of its promise in granting a license of intellectual property, which will determine whether revenue is recognized over time or at a point in time. This standard is effective for fiscal years beginning after December 15, 2017, including interim periods within that reporting period. The Company does not have any significant licenses of intellectual property and does not expect this standard will have a significant impact on the Company’s consolidated financial statements upon adoption.
In August 2016, the FASB issued ASU 2016-15, which includes amendments addressing eight specific cash flow issues with the objective of reducing the existing diversity in practice. The effective date of the amendments to the standard is for fiscal years beginning after December 15, 2017,2020, including interim periods within those fiscal years. The Company does not expect this standard will have a significant impact on the Company’s consolidated financial statements upon adoption.
In March 2017, the FASB issuedadopted ASU 2017-07, which requires employers who offer defined benefit and postretirement benefit plans to report the service cost component2019-12 in the same line item as other compensation costs arising from services rendered by employees during the reporting period. The other components of net benefit costs will be presented in the income statement separately from the service cost and outside of a subtotal of income from operations. In addition, only the service cost component may be eligible for capitalization where applicable. This guidance is effective for annual periods beginning after December 15, 2017. The Company does not expect this standard will have a significant impact on the Company’s consolidated financial statements upon adoption.
In August 2017, the FASB issued ASU 2017-12, guidance that amends hedge accounting. Under the new guidance, more hedging strategies will be eligible for hedge accounting and the application of hedge accounting is simplified. The new guidance amends presentation and disclosure requirements, and how effectiveness is assessed. The guidance is effective for fiscal years beginning after December 15, 2018, and interim periods within those years. Early adoption is permitted. The Company is currently evaluating the impact that the new guidance will have on its consolidated financial statements.
In February 2018, the FASB issued ASU 2018-02, which allows for the reclassification of certain income tax effects related to the U.S. Tax Cuts and Jobs Act (Tax Reform Act) between “Accumulated other comprehensive income” and “Retained earnings.” This ASU relates to the requirement that adjustments to deferred tax liabilities and assets related to a change in tax laws or rates to be included in “Income from continuing operations”, even in situations where the related items were originally recognized in “Other comprehensive income” (rather than in “Earnings from operations”). The amendments in this ASU are effective for all entities for fiscal years beginning after December 15, 2018, and interim periods within those fiscal years, with early adoption permitted. Adoption of this ASU is to be applied either in the period of adoption or retrospectively to each period in which the effect of the change in the tax laws or rates were recognized. The Company is currently evaluating the new guidance to determine the impact it may have on the consolidated financial statements.
Recently adopted pronouncements:
In November 2015, the FASB issued ASU 2015-17 which simplifies the presentation of deferred income taxes by requiring that deferred tax assets and liabilities be classified as non-current in a classified statement of financial position. This guidance was adopted on January 1, 2017 on a prospective basis. Prior period balances have not been adjusted.
In January 2017, the FASB issued ASU No. 2017-04 which simplifies the accounting for goodwill impairment. The guidance removes Step 2 of the goodwill impairment test, which required a hypothetical purchase price allocation. A goodwill impairment is now the amount by which a reporting unit’s carrying value exceeds its fair value, not to exceed the carrying amount of goodwill. ASU No. 2017-04 will be effective for annual or interim goodwill impairment tests in fiscal years beginning after December 15, 2019. Early adoption was permitted for any impairment tests performed after January
37
1, 2017, and the Company early adopted this ASU effective in the fourthfirst quarter of 2017.2021. The adoption of thisthe ASU did not have a material impact on the Company'sCompany’s consolidated financial statements.
NOTE 2—ACCRUED LIABILITIES:
Accrued liabilities are comprised of the following:
|
|
|
|
|
|
|
| |||||||
|
| December 31, |
| |||||||||||
|
| 2017 |
| 2016 |
| |||||||||
| | | | | | | | |||||||
| | December 31, | | |||||||||||
|
| 2021 |
| 2020 |
| |||||||||
Compensation |
| $ | 10,107 |
| $ | 9,840 |
| | $ | 10,865 | | $ | 8,135 | |
Other employee benefits |
|
| 7,659 |
|
| 7,012 |
| |
| 8,640 | |
| 8,841 | |
Taxes, other than income |
|
| 3,210 |
|
| 3,004 |
| |
| 3,574 | |
| 3,169 | |
Advertising and promotions |
|
| 18,834 |
|
| 21,421 |
| |
| 22,547 | |
| 18,455 | |
Other |
|
| 5,347 |
|
| 5,023 |
| |
| 8,270 | |
| 6,499 | |
|
| $ | 45,157 |
| $ | 46,300 |
| |||||||
| | $ | 53,896 | | $ | 45,099 | | |||||||
NOTE 3—INDUSTRIAL DEVELOPMENT BONDS:
Industrial development bonds are due in 2027. The average floating interest rate, which is reset weekly, was 1.0%0.7% and 0.5%0.7% in 20172021 and 2016,2020, respectively. See Note 10 of the Company’s Notes to Consolidated Financial Statements for fair value disclosures.
NOTE 4—INCOME TAXES:
On December 22, 2017, the President of the United States signed into law the U.S. Tax Cuts and Jobs Act (Tax Reform Act). The legislation significantly changes U.S. tax law by, among other things, lowering corporate income tax rates, implementing a territorial tax system and imposing a toll tax on deemed repatriated earnings of foreign subsidiaries. The Tax Reform Act permanently reduces the U.S. corporate income tax rate from a maximum of 35% to a flat 21% rate, effective January 1, 2018. The Company is required to record the effects of a change in tax law in the period of enactment which is 2017. The provision for income tax and effective tax rate include a $20,318 favorable adjustment related to the remeasurement of its U.S. deferred tax assets and liabilities at the rate expected to be in effect when the temporary differences are realized or settled (remeasured at 21% versus 35%). The other key provision analyzed was the enactment of a one-time toll charge resulting from the mandatory deemed repatriation of undistributed foreign earnings and profits. There was no impact in 2017 from the deemed repatriation provision as the Company determined that there were no net undistributed foreign earnings and profits subject to the toll charge. The SEC staff issued Staff Accounting Bulletin No. 118 (“SAB 118”) to address the application of U.S. GAAP in situations when a registrant does not have the necessary information available, prepared, or analyzed (including computations) in reasonable detail to complete the accounting for certain income tax effects of the Tax Reform Act. The Company believes it has obtained and analyzed all reasonably available information necessary to record the effects of the change in tax law and considers its accounting for the effects of the 2017 Tax Reform Act to be provisional as of December 31, 2017. The ultimate impact may differ from these provisional amounts, possibly materially, due to, among other things, additional regulatory guidance that may be issued by the Internal Revenue Service, and actions the Company may take as a result of the Tax Reform Act.
The domestic and foreign components of pretax income are as follows:
|
|
|
|
|
|
|
|
|
|
| ||||||||||
|
| 2017 |
| 2016 |
| 2015 |
| |||||||||||||
| | | | | | | | | | | ||||||||||
|
| 2021 |
| 2020 |
| 2019 |
| |||||||||||||
Domestic |
| $ | 76,042 |
| $ | 87,016 |
| $ | 82,276 |
| | $ | 77,434 | | $ | 69,211 | | $ | 74,978 | |
Foreign |
|
| 8,519 |
|
| 10,896 |
|
| 10,302 |
| |
| 8,295 | |
| 7,051 | |
| 10,426 | |
|
| $ | 84,561 |
| $ | 97,912 |
| $ | 92,578 |
| ||||||||||
| | $ | 85,729 | | $ | 76,262 | | $ | 85,404 | | ||||||||||
3839
The provision for income taxes is comprised of the following:
|
|
|
|
|
|
|
|
|
|
| ||||||||||
|
| 2017 |
| 2016 |
| 2015 |
| |||||||||||||
| | | | | | | | | | | ||||||||||
|
| 2021 |
| 2020 |
| 2019 |
| |||||||||||||
Current: |
|
|
|
|
|
|
|
|
|
| | | | | | | | | | |
Federal |
| $ | 6,019 |
| $ | 28,484 |
| $ | 26,259 |
| | $ | 16,886 | | $ | 14,831 | | $ | 15,133 | |
Foreign |
|
| — |
|
| 86 |
|
| (596) |
| |
| 1,983 | |
| 1,029 | |
| — | |
State |
|
| 369 |
|
| 1,954 |
|
| 785 |
| |
| 2,822 | |
| 1,763 | |
| 2,942 | |
|
|
| 6,388 |
|
| 30,524 |
|
| 26,448 |
| ||||||||||
| |
| 21,691 | |
| 17,623 | |
| 18,075 | | ||||||||||
Deferred: |
|
|
|
|
|
|
|
|
|
| | | | | | | | | | |
Federal |
|
| (7,191) |
|
| (2,547) |
|
| (1,189) |
| |
| (2,069) | |
| (1,006) | |
| (543) | |
Foreign |
|
| 3,425 |
|
| 3,323 |
|
| 2,106 |
| |
| 39 | |
| 1,316 | |
| 2,422 | |
State |
|
| 1,285 |
|
| (707) |
|
| (914) |
| |
| 760 | |
| (645) | |
| 611 | |
|
|
| (2,481) |
|
| 69 |
|
| 3 |
| ||||||||||
|
| $ | 3,907 |
| $ | 30,593 |
| $ | 26,451 |
| ||||||||||
| |
| (1,270) | |
| (335) | |
| 2,490 | | ||||||||||
| | $ | 20,421 | | $ | 17,288 | | $ | 20,565 | | ||||||||||
Significant components of the Company’s net deferred tax liability at year end were as follows:
|
|
|
|
|
|
|
| |||||||
|
| December 31, |
| |||||||||||
|
| 2017 |
| 2016 |
| |||||||||
| | | | | | | | |||||||
| | December 31, | | |||||||||||
|
| 2021 |
| 2020 |
| |||||||||
Deferred tax assets: |
|
|
|
|
|
|
| | | | | | | |
Accrued customer promotions |
| $ | 1,583 |
| $ | 3,194 |
| | $ | 2,107 | | $ | 1,506 | |
Deferred compensation |
|
| 15,403 |
|
| 26,509 |
| |
| 22,311 | |
| 18,501 | |
Postretirement benefits |
|
| 3,352 |
|
| 4,732 |
| |
| 3,324 | |
| 3,355 | |
Other accrued expenses |
|
| 4,200 |
|
| 6,543 |
| |
| 5,158 | |
| 3,078 | |
Foreign subsidiary tax loss carry forward |
|
| 7,270 |
|
| 8,452 |
| |
| 4,497 | |
| 4,508 | |
Outside basis difference in foreign subsidiary | | | 365 | | | 365 | | |||||||
Deductible state tax depreciation | | | 736 | | | 471 | | |||||||
Tax credit carry forward |
|
| 3,435 |
|
| 2,514 |
| |
| 2,517 | |
| 3,288 | |
|
|
| 35,243 |
|
| 51,944 |
| |||||||
Valuation allowance |
|
| (3,269) |
|
| (2,317) |
| |||||||
| |
| 41,015 | |
| 35,072 | | |||||||
Valuation allowances | |
| (5,555) | |
| (5,593) | | |||||||
Total deferred tax assets |
| $ | 31,974 |
| $ | 49,627 |
| | $ | 35,460 | | $ | 29,479 | |
Deferred tax liabilities: |
|
|
|
|
|
|
| | | | | | | |
Depreciation |
| $ | 18,791 |
| $ | 28,049 |
| | $ | 23,342 | | $ | 22,192 | |
Deductible goodwill and trademarks |
|
| 34,593 |
|
| 45,733 |
| |
| 38,255 | |
| 37,348 | |
Accrued export company commissions |
|
| 4,189 |
|
| 6,044 |
| |
| 4,615 | |
| 4,508 | |
Employee benefit plans |
|
| 4,662 |
|
| 928 |
| |
| 525 | |
| 1,767 | |
Inventory reserves |
|
| 2,147 |
|
| 3,529 |
| |
| 2,532 | |
| 1,994 | |
Prepaid insurance |
|
| 769 |
|
| 1,015 |
| |
| 965 | |
| 569 | |
Other prepaid expenses |
|
| 1,196 |
|
| — |
| |||||||
Unrealized capital gains | | | 3,874 | | | 2,515 | | |||||||
Deferred foreign exchange gain |
|
| 405 |
|
| 436 |
| | | 132 | | | 179 | |
Unrealized capital gain |
|
| 977 |
|
| 733 |
| |||||||
Deferred gain on sale of real estate |
|
| 5,278 |
|
| 8,093 |
| |
| 5,309 | |
| 5,269 | |
Total deferred tax liabilities |
| $ | 73,007 |
| $ | 94,560 |
| | $ | 79,549 | | $ | 76,341 | |
Net deferred tax liability |
| $ | 41,033 |
| $ | 44,933 |
| | $ | 44,089 | | $ | 46,862 | |
At December 31, 2017,2021, the Company has benefits related to state tax credit carry-forwards expiring by year as follows: $104$175 in 2018, $8532023, $200 in 2019, $6742024, $35 in 2020 $6092025, $40 in 2021, $2202026, $50 in 2028, $131 in 2029, $222$213 in 2030, $234$225 in 2031, $238 in 2032, $211 in 2033, $235 in 2034, $274 in 2035 and $231$235 in 2032.2036. The Company expects that these state credit carry-forwardsnot all the credits will be utilized before their expiration.expiration and has provided a valuation allowance for the estimated amounts that will expire. Such valuation allowances were $924 and $837 at December 31, 2021 and 2020, respectively.
At December 31, 2017, the tax benefits of the Company’s Canadian subsidiary tax loss carry-forwards expiring by year are as follows: $3,075 in 2029 and $665 in 2031. The tax benefits of the Company’s Mexican subsidiary tax loss carry forwards expiring by year are as follows: $492 in 2036. At December 31, 2017, the Company also had $288 in foreign tax credit carry-forwards. The Company expects that these carry-forwards will be realized before their expiration.
At December 31, 2017,2021, the amounts of the Company’s Spanish subsidiary loss carry-forwards expiring by year are as follows: $301$286 in 2026, $64$61 in 2027, $192$182 in 2028, $109$103 in 2029, $331$314 in 2030, $441$418 in 2031, $332$315 in 2032, $134$127 in 2033,
39
$464 $440 in 2034, $556 in 2035, $805 in 2036, $412 in 2037, $197 in 2038 and $670$160 in 2035.2039. A full valuation allowance has
40
been provided for all of these Spanish loss carry-forwards as the Company expects that the losses will not be utilized before their expiration.
The effective income tax rate differs from the statutory rate as follows:
|
|
|
|
|
|
|
| |||||||
|
| 2017 |
| 2016 |
| 2015 |
| |||||||
| | | | | | | | |||||||
|
| 2021 |
| 2020 |
| 2019 |
| |||||||
U.S. statutory rate |
| 35.0 | % | 35.0 | % | 35.0 | % |
| 21.0 | % | 21.0 | % | 21.0 | % |
State income taxes, net |
| 1.6 |
| 1.0 |
| 1.1 |
|
| 2.4 | | 2.1 | | 2.2 | |
Exempt municipal bond interest |
| (0.1) |
| (0.1) |
| (0.1) |
|
| — | | — | | (0.1) | |
Foreign tax rates |
| 0.5 |
| (0.4) |
| (1.3) |
| |||||||
Qualified domestic production activities deduction |
| (0.8) |
| (2.7) |
| (2.6) |
| |||||||
Tax credits receivable |
| (1.4) |
| (0.5) |
| (1.2) |
| |||||||
Foreign income tax rates |
| 0.2 | | 1.0 | | (0.1) | | |||||||
Income tax credits and adjustments |
| (0.6) | | (1.4) | | 0.5 | | |||||||
Adjustment of deferred tax balances |
| (24.2) |
| (0.5) |
| 0.2 |
|
| 0.6 | | (0.2) | | — | |
Reserve for uncertain tax benefits |
| (0.3) |
| — |
| (2.1) |
|
| — | | (0.8) | | 0.4 | |
Worthless stock deduction |
| (3.8) |
| — |
| — |
| |||||||
Other, net |
| (1.9) |
| (0.6) |
| (0.4) |
|
| 0.2 | | 1.0 | | 0.2 | |
Effective income tax rate |
| 4.6 | % | 31.2 | % | 28.6 | % |
| 23.8 | % | 22.7 | % | 24.1 | % |
The
As a result of the 2017 Tax ReformCuts and Jobs Act, changes the United States approach to the taxation of foreign earnings to a territorial system by providing a one hundred percent dividends received deduction for certain qualified dividends received from foreign subsidiaries. This provision of the Act significantly impacts the accounting for the undistributed earnings of foreign subsidiaries and as a result the Company intends to distribute the earnings of its foreign subsidiaries. The costs associated with a future distribution aredoes not material to the Company’s financial statements. After carefully considering these facts, the Company has determined that it will not be assertingassert permanent reinvestment of its foreign subsidiaries earnings as of December 31, 2017.earnings.
At December 31, 20172021 and 2016,2020, the Company had unrecognized tax benefits of $4,342$3,133 and $4,746,$3,011, respectively. Included in this balance is $2,475$1,547 and $2,761,$1,468, respectively, of unrecognized tax benefits that, if recognized, would favorably affect the annual effective income tax rate. As of December 31, 20172021 and 2016, $4752020, $282 and $439,$340, respectively, of interest and penalties were included in the liability for uncertain tax positions.
A reconciliation of the beginning and ending balances of the total amounts of unrecognized tax benefits is as follows:
|
|
|
|
|
|
|
|
|
|
| ||||||||||
|
| 2017 |
| 2016 |
| 2015 |
| |||||||||||||
| | | | | | | | | | | ||||||||||
|
| 2021 |
| 2020 |
| 2019 |
| |||||||||||||
Unrecognized tax benefits at January 1 |
| $ | 4,746 |
| $ | 4,680 |
| $ | 6,993 |
| | $ | 3,011 | | $ | 3,678 | | $ | 3,339 | |
Increases in tax positions for the current year |
|
| 394 |
|
| 803 |
|
| 812 |
| |
| 700 | |
| 377 | |
| 1,164 | |
Reductions in tax positions for lapse of statute of limitations |
|
| (793) |
|
| (718) |
|
| (865) |
| |
| (578) | |
| (501) | |
| (576) | |
Reductions in tax positions relating to settlements with taxing authorities |
|
| — |
|
| (27) |
|
| (772) |
| ||||||||||
Increases (decreases) in prior period unrecognized tax benefits |
|
| (5) |
|
| 8 |
|
| (1,488) |
| ||||||||||
Reductions in tax positions for settlements and payments | | | — | | | (308) | | | (249) | | ||||||||||
Increases (decreases) in prior period unrecognized tax benefits due to change in judgment | | | — | | | (235) | | | — | | ||||||||||
Unrecognized tax benefits at December 31 |
| $ | 4,342 |
| $ | 4,746 |
| $ | 4,680 |
| | $ | 3,133 | | $ | 3,011 | | $ | 3,678 | |
The Company recognizes interest and penalties related to unrecognized tax benefits in the provision for income taxes on the Consolidated Statements of Earnings and Retained Earnings.
The Company is subject to taxation in the U.S. and various state and foreign jurisdictions.jurisdictions, primarily Canada and Mexico. The Company generally remains subject to examination by U.S. federal, and state and foreign tax authorities for the years 20142018 through 2016.2020. With few exceptions, the Company is no longer subject to examinations by tax authorities for the years 20132017 and prior.
4041
NOTE 5—SHARE CAPITAL AND CAPITAL IN EXCESS OF PAR VALUE:
|
|
|
|
|
|
|
|
|
|
|
|
|
|
|
|
|
|
|
| |||||||||||||||||||
|
|
|
|
|
|
|
|
|
|
|
|
|
|
|
|
| Capital in |
| ||||||||||||||||||||
|
|
|
|
|
|
| Class B |
|
|
|
|
|
| Excess |
| |||||||||||||||||||||||
|
| Common Stock |
| Common Stock |
| Treasury Stock |
| of Par |
| |||||||||||||||||||||||||||||
|
| Shares |
| Amount |
| Shares |
| Amount |
| Shares |
| Amount |
| Value |
| |||||||||||||||||||||||
|
| (000’s) |
|
|
|
| (000’s) |
|
|
|
| (000’s) |
|
|
|
|
|
|
| |||||||||||||||||||
Balance at January 1, 2015 |
| 37,285 |
| $ | 25,892 |
| 22,887 |
| $ | 15,894 |
| 78 |
| $ | (1,992) |
| $ | 599,186 |
| |||||||||||||||||||
| | | | | | | | | | | | | | | | | | | | |||||||||||||||||||
| | | | | | | | | | | | | | | | | Capital in |
| ||||||||||||||||||||
| | | | | | | Class B | | | | | | | Excess |
| |||||||||||||||||||||||
| | Common Stock | | Common Stock | | Treasury Stock | | of Par |
| |||||||||||||||||||||||||||||
|
| Shares |
| Amount |
| Shares |
| Amount |
| Shares |
| Amount |
| Value |
| |||||||||||||||||||||||
| | (000’s) | | | | | (000’s) | | | | | (000’s) | | | | | | |
| |||||||||||||||||||
Balance at December 31, 2018 |
| 38,544 | |
| 26,767 |
| 25,584 | |
| 17,767 |
| 88 | |
| (1,992) | |
| 696,535 | | |||||||||||||||||||
Issuance of 3% stock dividend |
| 1,112 |
|
| 773 |
| 687 |
|
| 476 |
| 2 |
|
| — |
|
| 55,982 |
|
| 1,150 | |
| 798 |
| 768 | |
| 532 |
| 2 | |
| — | |
| 32,999 | |
Conversion of Class B common shares to common shares |
| 32 |
|
| 22 |
| (32) |
|
| (22) |
| — |
|
| — |
|
| — |
|
| 65 | |
| 45 |
| (65) | |
| (45) |
| — | |
| — | |
| — | |
Purchase and retirement of common shares |
| (1,047) |
|
| (727) |
| — |
|
| — |
| — |
|
| — |
|
| (32,286) |
|
| (923) | |
| (641) |
| — | |
| — |
| — | |
| — | |
| (33,475) | |
Balance at December 31, 2015 |
| 37,382 |
|
| 25,960 |
| 23,542 |
|
| 16,348 |
| 80 |
|
| (1,992) |
|
| 622,882 |
| |||||||||||||||||||
Balance at December 31, 2019 |
| 38,836 | |
| 26,969 |
| 26,287 | |
| 18,254 |
| 90 | |
| (1,992) | |
| 696,059 | | |||||||||||||||||||
Issuance of 3% stock dividend |
| 1,111 |
|
| 772 |
| 705 |
|
| 490 |
| 3 |
|
| — |
|
| 52,410 |
|
| 1,157 | |
| 804 |
| 787 | |
| 547 |
| 3 | |
| — | |
| 42,244 | |
Conversion of Class B common shares to common shares |
| 26 |
|
| 18 |
| (26) |
|
| (18) |
| — |
|
| — |
|
| — |
|
| 62 | |
| 43 |
| (62) | |
| (43) |
| — | |
| — | |
| — | |
Purchase and retirement of common shares |
| (818) |
|
| (569) |
| — |
|
| — |
| — |
|
| — |
|
| (28,524) |
|
| (982) | |
| (682) |
| — | |
| — |
| — | |
| — | |
| (31,373) | |
Balance at December 31, 2016 |
| 37,701 |
|
| 26,181 |
| 24,221 |
|
| 16,820 |
| 83 |
|
| (1,992) |
|
| 646,768 |
| |||||||||||||||||||
Balance at December 31, 2020 |
| 39,073 | | | 27,134 |
| 27,012 | | | 18,758 |
| 93 | | | (1,992) | | | 706,930 | | |||||||||||||||||||
Issuance of 3% stock dividend |
| 1,124 |
|
| 781 |
| 726 |
|
| 504 |
| 2 |
|
| — |
|
| 43,477 |
|
| 1,163 | |
| 807 |
| 810 | |
| 562 |
| 3 | |
| — | |
| 32,495 | |
Conversion of Class B common shares to common shares |
| 56 |
|
| 39 |
| (56) |
|
| (39) |
| — |
|
| — |
|
| — |
|
| 29 | |
| 20 |
| (29) | |
| (20) |
| — | |
| — | |
| — | |
Purchase and retirement of common shares |
| (921) |
|
| (640) |
| — |
|
| — |
| — |
|
| — |
|
| (33,493) |
|
| (921) | |
| (639) |
| — | |
| — |
| — | |
| — | |
| (29,545) | |
Balance at December 31, 2017 |
| 37,960 |
| $ | 26,361 |
| 24,891 |
| $ | 17,285 |
| 85 |
| $ | (1,992) |
| $ | 656,752 |
| |||||||||||||||||||
Balance at December 31, 2021 |
| 39,344 | | $ | 27,322 |
| 27,793 | | $ | 19,300 |
| 96 | | $ | (1,992) | | $ | 709,880 | | |||||||||||||||||||
Average shares outstanding and all per share amounts included in the financial statements and notes thereto have been adjusted retroactively to reflect annual three percent stock dividends.
While the Company does not have a formal or publicly announced Company common stock purchase program, the Company’s board of directors periodically authorizes a dollar amount for such share purchases.
Based upon this policy, shares were purchased and retired as follows:
|
|
|
|
|
|
|
|
| Total Number of Shares |
|
|
|
|
Year |
| Purchased (000’s) |
| Average Price Paid Per Share |
| |
2017 |
| 921 |
| $ | 37.01 |
|
2016 |
| 818 |
| $ | 35.51 |
|
2015 |
| 1,047 |
| $ | 31.47 |
|
| | | | | | |
|
| Total Number of Shares |
| | |
|
Year | | Purchased (000’s) | | Average Price Paid Per Share |
| |
2021 |
| 921 | | $ | 32.76 | |
2020 |
| 982 | | $ | 32.59 | |
2019 |
| 923 | | $ | 36.93 | |
NOTE 6—OTHER INCOME, NET:
Other income, net is comprised of the following:
|
|
|
|
|
|
|
|
|
|
| ||||||||||
|
| 2017 |
| 2016 |
| 2015 |
| |||||||||||||
| | | | | | | | | | | ||||||||||
|
| 2021 |
| 2020 |
| 2019 |
| |||||||||||||
Interest and dividend income |
| $ | 2,851 |
| $ | 2,130 |
| $ | 1,421 |
| | $ | 2,740 | | $ | 4,005 | | $ | 4,423 | |
Gains on trading securities relating to deferred compensation plans |
|
| 9,977 |
|
| 4,275 |
|
| 1,450 |
| ||||||||||
Gains (losses) on trading securities relating to deferred compensation plans | |
| 14,207 | |
| 12,519 | |
| 11,292 | | ||||||||||
Interest expense |
|
| (144) |
|
| (105) |
|
| (76) |
| |
| (46) | |
| (164) | |
| (220) | |
Foreign exchange gains (losses) |
|
| 259 |
|
| (955) |
|
| (1,427) |
| |
| 667 | |
| 534 | |
| (533) | |
Capital gains (losses) |
|
| 25 |
|
| 7 |
|
| 2 |
| |
| (286) | |
| (6) | |
| 22 | |
Miscellaneous, net |
|
| 177 |
|
| 146 |
|
| 126 |
| |
| 1,314 | |
| 1,130 | |
| 1,206 | |
|
| $ | 13,145 |
| $ | 5,498 |
| $ | 1,496 |
| ||||||||||
| | $ | 18,596 | | $ | 18,018 | | $ | 16,190 | | ||||||||||
4142
NOTE 7—EMPLOYEE BENEFIT PLANS:
Pension plans:
The Company sponsors a defined contribution pension plansplan covering certain non-union employees with over one year of credited service. The Company’s policy is to fund pension costs accrued based on compensation levels. Total pension expense for 2017, 2016this plan for 2021, 2020 and 20152019 approximated $3,087, $3,126$3,010, $2,722 and $3,100, respectively.$3,114, respectively, for this defined contribution plan. The Company also maintains certain defined contribution 401K profit sharing and retirement savings-investment plans. Company contributions in 2017, 20162021, 2020 and 20152019 to these plans were $2,512, $2,493$3,201, $2,766 and $2,533$2,858 respectively.
The Company also contributes to a multi-employer defined benefit pension plan for certain of its union employees under a collective bargaining agreement which is as follows:
Plan name: Bakery and Confectionery Union and Industry International Pension Fund (Plan)
Employer Identification Number and plan number: 52-6118572, plan number 001
Funded Status as of the most recent year available: 57.01%48.30% funded as of January 1, 20162020
The Company’s contributions to such plan: $2,603, $2,515$3,118, $2,850 and $2,574$2,943 in 2017, 20162021, 2020 and 2015,2019, respectively
Plan status: Critical and declining as of December 31, 20162020 (most recent date information is available)
Beginning in 2012, the Company received periodic notices from the Bakery, Confectionery, Tobacco Workers and Grain Millers International Union Pension Plan, (Plan), a multi-employer defined benefit pension plan for certain Company union employees, that the Plan’s actuary certified the Plan to be in “critical status”, the “Red Zone”, as defined by the Pension Protection Act (PPA) and the Pension Benefit Guaranty Corporation (PBGC); and that a plan of rehabilitation was adopted by the trustees of the Plan in fourth quarter 2012. During second quarterBeginning in 2015, the Company received new notices that the Plan is now inwas reclassified to “critical and declining status”, as defined by the PPA and PBGC, for the plan year beginning January 1, 2015. A designation of “critical and declining status” implies that the Plan is expected to become insolvent in the next 20 years. In second quarter 2016, the Company received new notices that the Plan’s trustees adopted an updated Rehabilitation Plan effective January 1, 2016, and thatall annual notices through 2020 have continued to classify the Plan remains in the “critical and declining status” and is projected to become insolvent the year 2030. A designation of “critical and declining status” implies that the Plan is expected to become insolvent in the next 20 yearscategory.
The Company has been advised that its withdrawal liability would have been $82,200, $72,700$104,300, $99,300 and $61,000$99,800 if it had withdrawn from the Plan during 2017, 20162021, 2020 and 2015,2019, respectively. The increase from 2016 to 2017 principally reflects a decrease in the PBGC interest rates, a decrease in the assets and increase in the Plan’s unfunded vested benefits during 2016 and the Company comprising a larger share the Plan’s contribution base. Should the Company actually withdraw from the Plan at a future date, a withdrawal liability, which could be higher than the above discussed amounts, could be payable to the Plan.
The amended rehabilitation plan, which continues, requires that employer contributions include 5% compounded annual surcharge increases each year for an unspecified period of time beginning January 2013 (in addition to the 5% interim surcharge initiated in June 2012) as well as certain plan benefit reductions. In fourth quarter 2020, the Plan Trustees advised the Company that the surcharges would no longer increase and therefore be “frozen” at the rates and amounts in effect as of December 31, 2020 provided that the local bargaining union and the Company executed a formal consenting agreement by March 31, 2021. During first quarter 2021, the local bargaining union and the Company executed this agreement which resulted in the “freezing” of such surcharges as of December 31, 2020. The Company’s pension expense for this Plan for 20172021, 2020 and 20162019 was $2,617$3,156, $2,866 and $2,541,$2,961, respectively. The aforementioned expense includes surcharges of $656$1,112, $1,010 and $542$948 in 20172021, 2020 and 2016,2019, respectively, as required under the plan of rehabilitation, as amended.
The Company is currently unable to determine the ultimate outcome of the above discussed matter and therefore is unable to determine the effects on its consolidated financial statements, but the ultimate outcome or the effects of any modifications to the current rehabilitation plan could be material to its consolidated results of operations or cash flows in one or more future periods.
4243
Deferred compensation:
The Company sponsors three3 deferred compensation plans for selected executives and other employees: (i) the Excess Benefit Plan, which restores retirement benefits lost due to IRS limitations on contributions to tax-qualified plans, (ii) the Supplemental Plan, which allows eligible employees to defer the receipt of eligible compensation until designated future dates and (iii) the Career Achievement Plan, which provides a deferred annual incentive award to selected executives. Participants in these plans earn a return on amounts due them based on several investment options, which mirror returns on underlying investments (primarily mutual funds). The Company economically hedges its obligations under the plans by investing in the actual underlying investments. These investments are classified as trading securities and are carried at fair value. At December 31, 20172021 and 2016,2020, these investments totaled $60,520$89,736 and $67,995,$73,828, respectively. All gains and losses and related investment income from these investments, which are recorded in other income, net, are equally offset by corresponding increases and decreases in the Company’s deferred compensation liabilities.
Postretirement health care benefit plans:
The Company maintains a post-retirement health benefits plan for a group of “grandfathered” corporate employees. The plan, as amended in 2013, generally limited future annual cost increases in health benefits to 3%, restricted this benefit to current employees and retirees with long-term service with the Company, and eliminated all post-retirement benefits for future employees effective April 1, 2014. Post-retirement benefits liabilities (as amended) were $13,497$13,235 and $12,128$13,487 at December 31, 20172021 and 2016,2020, respectively.
Amounts recognized in accumulated other comprehensive loss (pre-tax) at December 31, 20172021 are as follows:
| | | |
Prior service credit |
| $ |
|
Net actuarial gain | |
|
|
Net amount recognized in accumulated other comprehensive loss | | $ |
|
The estimated actuarial gain and prior service credit to be amortized from accumulated other comprehensive loss into net periodic benefit income during 2018 are $97 and $1,226, respectively.
The changes in the accumulated postretirement benefit obligation at December 31, 20172021 and 20162020 consist of the following:
|
|
|
|
|
|
|
| |||||||
|
| December 31, |
| |||||||||||
|
| 2017 |
| 2016 |
| |||||||||
| | | | | | | | |||||||
| | December 31, | | |||||||||||
|
| 2021 |
| 2020 |
| |||||||||
Benefit obligation, beginning of year |
| $ | 12,128 |
| $ | 11,400 |
| | $ | 13,487 | | $ | 13,743 | |
Service cost |
|
| 323 |
|
| 331 |
| |
| 270 | |
| 288 | |
Interest cost |
|
| 468 |
|
| 462 |
| |
| 291 | |
| 403 | |
Actuarial (gain)/loss |
|
| 897 |
|
| 235 |
| |
| (326) | |
| (510) | |
Benefits paid |
|
| (319) |
|
| (300) |
| |
| (487) | |
| (437) | |
Benefit obligation, end of year |
| $ | 13,497 |
| $ | 12,128 |
| | $ | 13,235 | | $ | 13,487 | |
The actuarial (gain) in 2021 is attributable to an actuarial gain due to an increase in the discount rate partially offset by updated mortality projections for the year ended December 31, 2021. The actuarial (gain) in 2020 is attributable to updated participation rates and participant spending as well as mortality table projections partially offset by an actuarial loss due to the decrease in discount rate for the year ended December 31, 2020.
Net periodic postretirement benefit cost (income) included the following components:
|
|
|
|
|
|
|
|
|
|
| ||||||||||
|
| 2017 |
| 2016 |
| 2015 |
| |||||||||||||
| | | | | | | | | | | ||||||||||
|
| 2021 |
| 2020 |
| 2019 |
| |||||||||||||
Service cost—benefits attributed to service during the period |
| $ | 323 |
| $ | 331 |
| $ | 441 |
| | $ | 270 | | $ | 288 | | $ | 270 | |
Interest cost on the accumulated postretirement benefit obligation |
|
| 468 |
|
| 462 |
|
| 465 |
| |
| 291 | |
| 403 | |
| 499 | |
Net amortization |
|
| (1,462) |
|
| (1,642) |
|
| (1,451) |
| |
| (1,405) | |
| (1,349) | |
| (1,522) | |
Net periodic postretirement benefit cost (income) |
| $ | (671) |
| $ | (849) |
| $ | (545) |
| | $ | (844) | | $ | (658) | | $ | (753) | |
43
The Company estimates future benefit payments will be $603, $525, $556, $598$616, $646, $668, $686 and $632$693 in 2018each year beginning in 2022 through 2022,2026, respectively, and a total of $3,647$3,572 in 20232027 through 2027.2031.
44
NOTE 8—COMMITMENTS:
RentalLease expense aggregated $785, $703$1,068, $942 and $728$1,032 in 2017, 20162021, 2020 and 2015,2019, respectively.
Future operating lease commitments are not significant.as follows: $1,072 in 2022, $717 in 2023, $420 in 2024, $422 in 2025, $409 in 2026 and $4,379 thereafter.
NOTE 9—SEGMENT AND GEOGRAPHIC INFORMATION:
The Company operates as a single reportable segment encompassing the manufacture and sale of confectionery products. Its principal manufacturing operations are located in the United States and Canada, and its principal market is the United States. The Company also manufactures confectionery products in Mexico, primarily for sale in Mexico, and exports products to Canada and other countries worldwide.
The following geographic data includes net product sales summarized on the basis of the customer location and long-lived assets based on their physical location:
|
|
|
|
|
|
|
|
|
|
| ||||||||||
|
| 2017 |
| 2016 |
| 2015 |
| |||||||||||||
| | | | | | | | | | | ||||||||||
|
| 2021 |
| 2020 |
| 2019 |
| |||||||||||||
Net product sales: |
|
|
|
|
|
|
|
|
|
| | | | | | | | | | |
United States |
| $ | 472,222 |
| $ | 475,055 |
| $ | 492,450 |
| | $ | 514,437 | | $ | 431,024 | | $ | 478,790 | |
Canada, Mexico and Other |
|
| 43,452 |
|
| 42,318 |
|
| 44,242 |
| |
| 51,606 | |
| 36,403 | |
| 44,826 | |
|
| $ | 515,674 |
| $ | 517,373 |
| $ | 536,692 |
| ||||||||||
| | $ | 566,043 | | $ | 467,427 | | $ | 523,616 | | ||||||||||
Long-lived assets: |
|
|
|
|
|
|
|
|
|
| | | | | | | | | | |
United States |
| $ | 145,210 |
| $ | 147,296 |
| $ | 149,144 |
| | $ | 178,936 | | $ | 155,664 | | $ | 155,428 | |
Canada |
|
| 30,823 |
|
| 29,806 |
|
| 31,408 |
| | | 27,051 | | | 28,765 | | | 30,412 | |
Mexico and Other |
|
| 2,939 |
|
| 3,803 |
|
| 4,034 |
| |
| 2,919 | |
| 2,899 | |
| 2,615 | |
|
| $ | 178,972 |
| $ | 180,905 |
| $ | 184,586 |
| ||||||||||
| | $ | 208,906 | | $ | 187,328 | | $ | 188,455 | | ||||||||||
Sales revenues from Wal-Mart Stores, Inc. aggregated approximately 24.0%22.7%, 23.3%23.5%, and 23.7%24.2% of net product sales during the yearsyear ended December 31, 2017, 20162021, 2020 and 2015,2019, respectively. Sales revenues from Dollar Tree, Inc. (which includes Family Dollar which was acquired by Dollar Tree) aggregated approximately 12.1%, 11.7%, and 11.3% of net product sales during the year ended December 31, 2021, 2020 and 2019, respectively. Some of the aforementioned sales to Wal-Mart and Dollar Tree are sold to McLane Company, a large national grocery wholesaler, which services and delivers certain of the CompanyCompany’s products to Wal-Mart, Dollar Tree and other retailers in the U.S.A. Net product sales revenues from McLane, which includes these Wal-Mart and Dollar Tree sales as well as sales and deliveries to other Company customers, were 16.9%21.0% in 20172021 and 16.3%22.1% in 20162020 and 16.7%17.7% in 2015.2019. At December 31, 2021 and 2020, the Company’s 3 largest customers discussed above accounted for approximately 36% and 21% of total accounts receivable, respectively.
NOTE 10—FAIR VALUE MEASUREMENTS:
Current accounting guidance defines fair value as the price that would be received in the sale of an asset or paid to transfer a liability in an orderly transaction between market participants at the measurement date. Guidance requires disclosure of the extent to which fair value is used to measure financial assets and liabilities, the inputs utilized in calculating valuation measurements, and the effect of the measurement of significant unobservable inputs on earnings, or changes in net assets, as of the measurement date. Guidance establishes a three-level valuation hierarchy based upon the transparency of inputs utilized in the measurement and valuation of financial assets or liabilities as of the measurement date. Level 1 inputs include quoted prices for identical instruments and are the most observable. Level 2 inputs include quoted prices for similar assets and observable inputs such as interest rates, foreign currency exchange rates, commodity rates and yield curves. Level 3 inputs are not observable in the market and include management’s own judgments about the assumptions market participants would use in pricing the asset or liability. The use of observable and unobservable inputs is reflected in the hierarchy assessment disclosed in the table below.
45
As of December 31, 20172021 and 2016,2020, the Company held certain financial assets that are required to be measured at fair value on a recurring basis. These include derivative hedging instruments related to the foreign currency forward contracts
44
and purchase of certain raw materials, investments in trading securities and available for sale securities. The Company’s available for sale and trading securities principally consist of municipalcorporate bonds and variable rate demand notes.
The fair value of the Company’s industrial revenue development bonds at December 31, 2021 and 2020 were valued using Level 2 inputs which approximates the carrying value of $7,500 for both periods. Interest rates on these bonds reset weekly based on current market conditions.
The following tables present information about the Company’s financial assets and liabilities measured at fair value as of December 31, 20172021 and 2016,2020, and indicate the fair value hierarchy and the valuation techniques utilized by the Company to determine such fair value:
|
|
|
|
|
|
|
|
|
|
|
|
|
| |||||||||||||
|
| Estimated Fair Value December 31, 2017 |
| |||||||||||||||||||||||
|
| Total |
| Input Levels Used |
| |||||||||||||||||||||
|
| Fair Value |
| Level 1 |
| Level 2 |
| Level 3 |
| |||||||||||||||||
| | | | | | | | | | | | | | |||||||||||||
| | Estimated Fair Value December 31, 2021 |
| |||||||||||||||||||||||
| | Total | | Input Levels Used |
| |||||||||||||||||||||
|
| Fair Value |
| Level 1 |
| Level 2 |
| Level 3 |
| |||||||||||||||||
Cash and equivalents |
| $ | 96,314 |
| $ | 96,314 |
| $ | — |
| $ | — |
| | $ | 105,840 | | $ | 105,840 | | $ | — | | $ | — | |
Available for sale securities |
|
| 171,596 |
|
| 1,200 |
|
| 170,396 |
|
| — |
| |
| 241,407 | |
| 1,282 | |
| 240,125 | |
| — | |
Foreign currency forward contracts |
|
| 79 |
|
| — |
|
| 79 |
|
| — |
| |
| 426 | |
| — | |
| 426 | |
| — | |
Commodity futures contracts, net |
|
| 32 |
|
| 32 |
|
| — |
|
| — |
| |
| 124 | |
| 124 | |
| — | |
| — | |
Trading securities |
|
| 60,520 |
|
| 60,520 |
|
| — |
|
| — |
| |
| 89,736 | |
| 76,196 | |
| 13,540 | |
| — | |
Total assets measured at fair value |
| $ | 328,541 |
| $ | 158,066 |
| $ | 170,475 |
| $ | — |
| | $ | 437,533 | | $ | 183,442 | | $ | 254,091 | | $ | — | |
|
|
|
|
|
|
|
|
|
|
|
|
|
| |||||||||||||
|
| Estimated Fair Value December 31, 2016 |
| |||||||||||||||||||||||
|
| Total |
| Input Levels Used |
| |||||||||||||||||||||
|
| Fair Value |
| Level 1 |
| Level 2 |
| Level 3 |
| |||||||||||||||||
| | | | | | | | | | | | | | |||||||||||||
| | Estimated Fair Value December 31, 2020 |
| |||||||||||||||||||||||
| | Total | | Input Levels Used |
| |||||||||||||||||||||
|
| Fair Value |
| Level 1 |
| Level 2 |
| Level 3 |
| |||||||||||||||||
Cash and equivalents |
| $ | 119,145 |
| $ | 119,145 |
| $ | — |
| $ | — |
| | $ | 166,841 | | $ | 166,841 | | $ | — | | $ | — | |
Available for sale securities |
|
| 164,183 |
|
| 2,419 |
|
| 161,764 |
|
| — |
| |
| 188,282 | |
| 3,149 | |
| 185,133 | |
| — | |
Foreign currency forward contracts |
|
| (119) |
|
| — |
|
| (119) |
|
| — |
| |
| 778 | |
| — | |
| 778 | |
| — | |
Commodity futures contracts, net |
|
| 1,746 |
|
| 1,746 |
|
| — |
|
| — |
| |
| 941 | |
| 941 | |
| — | |
| — | |
Trading securities |
|
| 67,995 |
|
| 67,995 |
|
| — |
|
| — |
| |
| 73,828 | |
| 61,431 | |
| 12,397 | |
| — | |
Total assets measured at fair value |
| $ | 352,950 |
| $ | 191,305 |
| $ | 161,645 |
| $ | — |
| | $ | 430,670 | | $ | 232,362 | | $ | 198,308 | | $ | — | |
Available for sale securities which utilize Level 2 inputs consist primarily of municipalcorporate bonds and corporate bonds,variable rate demand notes, which are valued based on quoted market prices or alternative pricing sources with reasonable levels of price transparency.
A summary of the aggregate fair value, gross unrealized gains, gross unrealized losses, realized losses and amortized cost basis of the Company’s investment portfolio by major security type is as follows:
|
|
|
|
|
|
|
|
|
|
|
|
|
|
|
|
| ||||||||||||||||
|
| December 31, 2017 |
| |||||||||||||||||||||||||||||
|
| Amortized |
| Fair |
| Unrealized |
| Realized |
| |||||||||||||||||||||||
| | | | | | | | | | | | | | | | | ||||||||||||||||
| | December 31, 2021 |
| |||||||||||||||||||||||||||||
| | Amortized | | Fair | | Unrealized | | Realized |
| |||||||||||||||||||||||
Available for Sale: |
| Cost |
| Value |
| Gains |
| Losses |
| Losses |
|
| Cost |
| Value |
| Gains |
| Losses |
| Losses |
| ||||||||||
Municipal bonds |
| $ | 32,411 |
| $ | 31,484 |
| $ | — |
| $ | (927) |
| $ | — |
| | $ | 542 | | $ | 536 | | $ | — | | $ | (6) | | $ | — | |
Variable rate demand notes | | | — | | | — | | | — | | | — | | | — | | ||||||||||||||||
Corporate bonds |
|
| 134,143 |
|
| 133,684 |
|
| — |
|
| (459) |
|
| — |
| |
| 238,045 | |
| 236,332 | |
| — | |
| (1,713) | |
| — | |
Government securities |
|
| 1,192 |
|
| 1,208 |
|
| 16 |
|
| — |
|
| — |
| |
| 1,271 | |
| 1,282 | | | 11 | |
| — | | | — | |
Certificates of deposit |
|
| 5,245 |
|
| 5,220 |
|
| — |
|
| (25) |
|
| — |
| | | 3,246 | | | 3,257 | | | 11 | | | — | | | — | |
|
| $ | 172,991 |
| $ | 171,596 |
| $ | 16 |
| $ | (1,411) |
| $ | — |
| ||||||||||||||||
| | $ | 243,104 | | $ | 241,407 | | $ | 22 | | $ | (1,719) | | $ | — | | ||||||||||||||||
|
|
|
|
|
|
|
|
|
|
|
|
|
|
|
|
|
|
| December 31, 2016 |
| |||||||||||||
|
| Amortized |
| Fair |
| Unrealized |
| Realized |
| |||||||
Available for Sale: |
| Cost |
| Value |
| Gains |
| Losses |
| Losses |
| |||||
Municipal bonds |
| $ | 16,046 |
| $ | 15,206 |
| $ | — |
| $ | (840) |
| $ | — |
|
Variable rate demand notes |
|
| 19,700 |
|
| 19,700 |
|
| — |
|
| — |
|
| — |
|
Corporate bonds |
|
| 122,568 |
|
| 122,298 |
|
| — |
|
| (270) |
|
| — |
|
Government securities |
|
| 2,411 |
|
| 2,426 |
|
| 15 |
|
| — |
|
| — |
|
Certificates of deposit |
|
| 4,553 |
|
| 4,553 |
|
| — |
|
| — |
|
| — |
|
|
| $ | 165,278 |
| $ | 164,183 |
| $ | 15 |
| $ | (1,110) |
| $ | — |
|
The fair value of the Company’s industrial revenue development bonds at December 31, 2017 and 2016 were valued using Level 2 inputs which approximates the carrying value of $7,500 for both periods. Interest rates on these bonds reset weekly based on current market conditions.
4546
| | | | | | | | | | | | | | | | |
| | December 31, 2020 |
| |||||||||||||
| | Amortized | | Fair | | Unrealized | | Realized |
| |||||||
Available for Sale: |
| Cost |
| Value |
| Gains |
| Losses |
| Losses |
| |||||
Municipal bonds | | $ | 556 | | $ | 561 | | $ | 5 | | $ | — | | $ | — | |
Variable rate demand notes | | | 1,300 | | | 1,300 | | | — | | | — | | | — | |
Corporate bonds | |
| 174,835 | |
| 177,229 | |
| 2,394 | |
| — | |
| — | |
Government securities | |
| 3,049 | |
| 3,149 | | | 100 | |
| — | | | — | |
Certificates of deposit | |
| 5,915 | | | 6,043 | | | 128 | | | — | | | — | |
| | $ | 185,655 | | $ | 188,282 | | $ | 2,627 | | $ | — | | $ | — | |
NOTE 11—DERIVATIVE INSTRUMENTS AND HEDGING ACTIVITIES:
From time to time, the Company uses derivative instruments, including foreign currency forward contracts commodity futures contracts and commodity optionfutures contracts to manage its exposures to foreign exchange and commodity prices. Commodity futures contracts and most commodity option contracts are intended and effective as hedges of market price risks associated with the anticipated purchase of certain raw materials (primarily sugar). Foreign currency forward contracts are intended and effective as hedges of the Company’s exposure to the variability of cash flows, primarily related to the foreign exchange rate changes of products manufactured in Canada and sold in the United States, and periodic equipment purchases from foreign suppliers denominated in a foreign currency. The Company does not engage in trading or other speculative use of derivative instruments.
The Company recognizes all derivative instruments as either assets or liabilities at fair value in the Consolidated Statements of Financial Position. Derivative assets are recorded in other receivables and derivative liabilities are recorded in accrued liabilities. The Company uses either hedge accounting or mark-to-market accounting for its derivative instruments. Derivatives that qualify for hedge accounting are designated as cash flow hedges by formally documenting the hedge relationships, including identification of the hedging instruments, the hedged items and other critical terms, as well as the Company’s risk management objectives and strategies for undertaking the hedge transaction.
Changes in the fair value of the Company’s cash flow hedges are recorded in accumulated other comprehensive loss, net of tax, and are reclassified to earnings in the periods in which earnings are affected by the hedged item. Substantially all amounts reported in accumulated other comprehensive loss for commodity derivatives are expected to be reclassified to cost of goods sold. Approximately $84$124 of this accumulated comprehensive gain is expected to be reclassifiedcharged to earnings in 20182022. Approximately $420 and a $52 accumulated comprehensive loss is expected to be reclassified as a charge to earnings in 2019. Substantially all amounts reported$6 in accumulated other comprehensive lossgain for foreign currency derivatives areis expected to be reclassified to other income, net in 2018.2022 and 2023, respectively.
The following table summarizes the Company’s outstanding derivative contracts and their effects on its Consolidated Statements of Financial Position at December 31, 20172021 and 2016:2020:
|
|
|
|
|
|
|
|
|
|
| ||||||||||
|
| December 31, 2017 |
| |||||||||||||||||
|
| Notional |
|
|
|
|
|
|
| |||||||||||
|
| Amounts |
| Assets |
| Liabilities |
| |||||||||||||
| | | | | | | | | | | ||||||||||
| | December 31, 2021 |
| |||||||||||||||||
|
| Notional |
| | |
| | |
| |||||||||||
| | Amounts | | Assets | | Liabilities |
| |||||||||||||
Derivatives designated as hedging instruments: |
|
|
|
|
|
|
|
|
|
| | | | | | | | | | |
Foreign currency forward contracts |
| $ | 919 |
| $ | 79 |
| $ | — |
| | $ | 6,729 | | $ | 426 | | $ | — | |
Commodity futures contracts |
|
| 13,840 |
|
| 284 |
|
| (252) |
| |
| 6,012 | |
| 231 | |
| (107) | |
Total derivatives |
|
|
|
| $ | 363 |
| $ | (252) |
| | | | | $ | 657 | | $ | (107) | |
|
|
|
|
|
|
|
|
|
|
| ||||||||||
|
| December 31, 2016 |
| |||||||||||||||||
|
| Notional |
|
|
|
|
|
|
| |||||||||||
|
| Amounts |
| Assets |
| Liabilities |
| |||||||||||||
| | | | | | | | | | | ||||||||||
| | December 31, 2020 |
| |||||||||||||||||
|
| Notional |
| | |
| | |
| |||||||||||
| | Amounts | | Assets | | Liabilities |
| |||||||||||||
Derivatives designated as hedging instruments: |
|
|
|
|
|
|
|
|
|
| | | | | | | | | | |
Foreign currency forward contracts |
| $ | 2,357 |
| $ | — |
| $ | (119) |
| | $ | 6,391 | | $ | 778 | | $ | — | |
Commodity futures contracts |
|
| 10,811 |
|
| 1,932 |
|
| (186) |
| |
| 4,010 | |
| 941 | |
| — | |
Total derivatives |
|
|
|
| $ | 1,932 |
| $ | (305) |
| | | | | $ | 1,719 | | $ | — | |
4647
The effects of derivative instruments on the Company’s Consolidated Statement of Earnings, Comprehensive Earnings and Retained Earnings for yearsyear ended December 31, 20172021 and 20162020 are as follows:
|
|
|
|
|
|
|
|
|
|
| ||||||||||
|
| For Year Ended December 31, 2017 |
| |||||||||||||||||
|
|
|
|
|
|
|
| Gain (Loss) |
| |||||||||||
|
|
|
|
| Gain (Loss) |
| on Amount Excluded |
| ||||||||||||
|
| Gain (Loss) |
| Reclassified from |
| from Effectiveness |
| |||||||||||||
|
| Recognized |
| Accumulated OCI |
| Testing Recognized |
| |||||||||||||
|
| in OCI |
| into Earnings |
| in Earnings |
| |||||||||||||
| | | | | | | | | | |||||||||||
| | For Year Ended December 31, 2021 |
| |||||||||||||||||
|
| | |
| | |
| Gain (Loss) |
| |||||||||||
| | | | Gain (Loss) | | on Amount Excluded |
| |||||||||||||
| | Gain (Loss) | | Reclassified from | | from Effectiveness |
| |||||||||||||
| | Recognized | | Accumulated OCI | | Testing Recognized |
| |||||||||||||
| | in OCI | | into Earnings | | in Earnings |
| |||||||||||||
Foreign currency forward contracts |
| $ | 236 |
| $ | 39 |
| $ | — |
| | $ | 93 | | $ | 445 | | $ | — | |
Commodity futures contracts |
|
| (1,646) |
|
| 68 |
|
| — |
| �� |
| 1,330 | |
| 2,148 | |
| — | |
Total |
| $ | (1,410) |
| $ | 107 |
| $ | — |
| | $ | 1,423 | | $ | 2,593 | | $ | — | |
|
|
|
|
|
|
|
|
|
| |||||||||||
|
| For Year Ended December 31, 2016 |
| |||||||||||||||||
|
|
|
|
|
|
|
| Gain (Loss) |
| |||||||||||
|
|
|
| Gain (Loss) |
| on Amount Excluded |
| |||||||||||||
|
| Gain (Loss) |
| Reclassified from |
| from Effectiveness |
| |||||||||||||
|
| Recognized |
| Accumulated OCI |
| Testing Recognized |
| |||||||||||||
|
| in OCI |
| into Earnings |
| in Earnings |
| |||||||||||||
| | | | | | | | | | |||||||||||
| | For Year Ended December 31, 2020 |
| |||||||||||||||||
|
| | |
| | |
| Gain (Loss) |
| |||||||||||
| | | | Gain (Loss) | | on Amount Excluded |
| |||||||||||||
| | Gain (Loss) | | Reclassified from | | from Effectiveness |
| |||||||||||||
| | Recognized | | Accumulated OCI | | Testing Recognized |
| |||||||||||||
| | in OCI | | into Earnings | | in Earnings |
| |||||||||||||
Foreign currency forward contracts |
| $ | 511 |
| $ | (1,997) |
| $ | — |
| | $ | 686 | | $ | (78) | | $ | — | |
Commodity futures contracts |
|
| 2,321 |
|
| 847 |
|
| — |
| |
| 573 | |
| (247) | |
| — | |
Total |
| $ | 2,832 |
| $ | (1,150) |
| $ | — |
| | $ | 1,259 | | $ | (325) | | $ | — | |
NOTE 12—ACCUMULATED OTHER COMPREHENSIVE LOSS:
The following table sets forth information with respect to accumulated other comprehensive earnings (loss):
|
|
|
|
|
|
|
|
|
|
|
|
|
|
|
|
|
|
| ||||||||||||||||||
|
|
|
|
|
|
|
|
|
|
|
|
|
|
|
|
| Accumulated | |||||||||||||||||||
|
| Foreign |
|
|
| Foreign |
|
|
| Postretirement |
| Other | ||||||||||||||||||||||||
|
| Currency |
|
|
| Currency |
| Commodity |
| and Pension |
| Comprehensive | ||||||||||||||||||||||||
|
| Translation |
| Investments |
| Derivatives |
| Derivatives |
| Benefits |
| Earnings (Loss) | ||||||||||||||||||||||||
Balance at December 31, 2015 |
| $ | (21,644) |
| $ | (605) |
| $ | (1,675) |
| $ | 173 |
| $ | 6,387 |
| $ | (17,364) | ||||||||||||||||||
| | | | | | | | | | | | | | | | | | | ||||||||||||||||||
| |
| | |
| | |
| | |
| | |
| | | Accumulated | |||||||||||||||||||
| | Foreign | | | | Foreign | | | | Postretirement | | Other | ||||||||||||||||||||||||
| | Currency | | | | Currency | | Commodity | | and Pension | | Comprehensive | ||||||||||||||||||||||||
| | Translation | | Investments | | Derivatives | | Derivatives | | Benefits | | Earnings (Loss) | ||||||||||||||||||||||||
Balance at December 31, 2019 | | $ | (23,368) | | $ | 882 | | $ | 10 | | $ | 92 | | $ | 2,139 | | $ | (20,245) | ||||||||||||||||||
Other comprehensive earnings (loss) before reclassifications |
|
| (3,816) |
|
| (95) |
|
| 325 |
|
| 1,481 |
|
| (466) |
|
| (2,571) | | | (1,213) | | | 1,110 | | | 520 | | | 434 | | | 356 | | | 1,207 |
Reclassifications from accumulated other comprehensive loss |
|
| — |
|
| 3 |
|
| 1,274 |
|
| (540) |
|
| (1,048) |
|
| (311) | | | — | | | — | | | 59 | | | 187 | | | (1,023) | | | (777) |
Other comprehensive earnings (loss) net of tax |
|
| (3,816) |
|
| (92) |
|
| 1,599 |
|
| 941 |
|
| (1,514) |
|
| (2,882) | | | (1,213) | | | 1,110 | | | 579 | | | 621 | | | (667) | | | 430 |
Balance at December 31, 2016 |
| $ | (25,460) |
| $ | (697) |
| $ | (76) |
| $ | 1,114 |
| $ | 4,873 |
| $ | (20,246) | ||||||||||||||||||
Balance at December 31, 2020 | | $ | (24,581) | | $ | 1,992 | | $ | 589 | | $ | 713 | | $ | 1,472 | | $ | (19,815) | ||||||||||||||||||
Other comprehensive earnings (loss) before reclassifications |
|
| 1,198 |
|
| (192) |
|
| 152 |
|
| (1,050) |
|
| (651) |
|
| (543) | | | (301) | | | (3,205) | | | 70 | | | 1,009 | | | 332 | | | (2,095) |
Reclassifications from accumulated other comprehensive loss |
|
| — |
|
| — |
|
| (25) |
|
| (44) |
|
| (933) |
|
| (1,002) | | | — | | | (73) | | | (337) | | | (1,628) | | | (1,065) | | | (3,103) |
Other comprehensive earnings (loss) net of tax |
|
| 1,198 |
|
| (192) |
|
| 127 |
|
| (1,094) |
|
| (1,584) |
|
| (1,545) | | | (301) | | | (3,278) | | | (267) | | | (619) | | | (733) | | | (5,198) |
Balance at December 31, 2017 |
| $ | (24,262) |
| $ | (889) |
| $ | 51 |
| $ | 20 |
| $ | 3,289 |
| $ | (21,791) | ||||||||||||||||||
Balance at December 31, 2021 | | $ | (24,882) | | $ | (1,286) | | $ | 322 | | $ | 94 | | $ | 739 | | $ | (25,013) | ||||||||||||||||||
4748
The amounts reclassified from accumulated other comprehensive income (loss) consisted of the following:
|
|
|
|
|
|
|
|
|
| |||||||||
| | | | | | | | | | |||||||||
Details about Accumulated Other |
| Year to Date Ended |
|
|
| | Year to Date Ended | | | | ||||||||
Comprehensive Income Components |
| December 31, 2017 |
| December 31, 2016 |
| Location of (Gain) Loss Recognized in Earnings |
| | December 31, 2021 | | December 31, 2020 | | Location of (Gain) Loss Recognized in Earnings | | ||||
Investments |
| $ | - |
| $ | 5 |
| Other income, net |
| | $ | (96) | | $ | - | | Other income, net | |
Foreign currency derivatives |
|
| (39) |
|
| 1,997 |
| Other income, net |
| | | (445) | | | 78 | | Other income, net | |
Commodity derivatives |
|
| (68) |
|
| (847) |
| Product cost of goods sold |
| | | (2,148) | | | 247 | | Product cost of goods sold | |
Postretirement and pension benefits |
|
| (746) |
|
| (838) |
| Selling, marketing and administrative expenses |
| | | (1,405) | | | (1,349) | | Other income, net | |
Postretirement and pension benefits |
|
| (716) |
|
| (804) |
| Product cost of goods sold |
| |||||||||
Total before tax |
|
| (1,569) |
|
| (487) |
|
|
| | | (4,094) | | | (1,024) | | | |
Tax expense (benefit) |
|
| 567 |
|
| 176 |
|
|
| | | 991 | | | 247 | | | |
Net of tax |
| $ | (1,002) |
| $ | (311) |
|
|
| | $ | (3,103) | | $ | (777) | | | |
NOTE 13—GOODWILL AND INTANGIBLE ASSETS:
All of the Company’s intangible indefinite-lived assets are trademarks.
The changes in the carrying amount of trademarks for 20172021 and 20162020 were as follows:
|
|
|
|
|
|
|
| |||||||
|
| 2017 |
| 2016 |
| |||||||||
| | | | | | | | |||||||
|
| 2021 |
| 2020 | | |||||||||
Original cost |
| $ | 193,767 |
| $ | 193,767 |
| | $ | 193,767 | | $ | 193,767 | |
Accumulated impairment losses as of January 1 |
|
| (18,743) |
|
| (18,743) |
| |
| (18,743) | |
| (18,743) | |
Balance at January 1 |
| $ | 175,024 |
| $ | 175,024 |
| | $ | 175,024 | | $ | 175,024 | |
Current year impairment losses |
|
| — |
|
| — |
| |
| — | |
| — | |
Balance at December 31 |
| $ | 175,024 |
| $ | 175,024 |
| | $ | 175,024 | | $ | 175,024 | |
Accumulated impairment losses as of December 31 |
| $ | (18,743) |
| $ | (18,743) |
| | $ | (18,743) | | $ | (18,743) | |
The fair value of indefinite-lived intangible assets was primarily assessed using the present value of estimated future cash flows and relief-from-royalty method.
The Company has no0 accumulated impairment losses of goodwill.
NOTE 14—QUARTERLY FINANCIAL DATA (UNAUDITED):Note 14 — LEASES:
|
|
|
|
|
|
|
|
|
|
|
|
|
|
|
|
|
|
| (Thousands of dollars except per share data) |
| |||||||||||||
|
| First |
| Second |
| Third |
| Fourth |
| Year |
| |||||
2017 |
|
|
|
|
|
|
|
|
|
|
|
|
|
|
|
|
Net product sales |
| $ | 103,425 |
| $ | 104,897 |
| $ | 182,173 |
| $ | 125,179 |
| $ | 515,674 |
|
Product gross margin |
|
| 38,009 |
|
| 39,638 |
|
| 67,325 |
|
| 44,778 |
|
| 189,750 |
|
Net earnings attributable to Tootsie Roll Industries, Inc. |
|
| 10,051 |
|
| 11,895 |
|
| 26,933 |
|
| 31,985 |
|
| 80,864 |
|
Net earnings attributable to Tootsie Roll Industries, Inc. per share |
|
| 0.16 |
|
| 0.19 |
|
| 0.43 |
|
| 0.51 |
|
| 1.28 |
|
|
|
|
|
|
|
|
|
|
|
|
|
|
|
|
|
|
2016 |
|
|
|
|
|
|
|
|
|
|
|
|
|
|
|
|
Net product sales |
| $ | 103,362 |
| $ | 104,259 |
| $ | 185,473 |
| $ | 124,279 |
| $ | 517,373 |
|
Product gross margin |
|
| 37,538 |
|
| 39,250 |
|
| 70,725 |
|
| 49,570 |
|
| 197,083 |
|
Net earnings attributable to Tootsie Roll Industries, Inc. |
|
| 9,896 |
|
| 11,136 |
|
| 28,637 |
|
| 17,841 |
|
| 67,510 |
|
Net earnings attributable to Tootsie Roll Industries, Inc. per share |
|
| 0.15 |
|
| 0.17 |
|
| 0.45 |
|
| 0.28 |
|
| 1.05 |
|
Net earnings per shareThe Company leases certain buildings, land and equipment that are classified as operating leases. These leases have remaining lease terms of up to approximately 20 years. In the twelve months of 2021 and 2020, operating lease cost and cash paid for operating lease liabilities totaled $1,068 and $1,023, respectively, which is based upon average outstanding sharesclassified in cash flows from operating activities. As of December 31, 2021 and 2020, operating lease right-of-use assets and operating lease liabilities were both $7,419 and $858, respectively. The weighted-average remaining lease term related to these operating leases was approximately 7.7 years and 0.7 years as adjustedof December 31, 2021 and 2020, respectively. The weighted-average discount rate related to the Company’s operating leases was 2.3% and 3.0% as of December 31, 2021 and 2020, respectively. Maturities of operating lease liabilities at December 31, 2021 are as follows: $1,072 in 2022, $717 in 2023, $420 in 2024, $422 in 2025, $409 in 2026 and $4,379 in 2027 through 2041.
The Company, as lessor, rents certain commercial real estate to third party lessees. The December 31, 2021 and 2020 cost related to these leased properties was $51,384 and $51,426, respectively, and the accumulated depreciation related to these leased properties was $15,844 and $14,784, respectively. Terms of certain such leases, including renewal options, may be extended for 3% stock dividends issued during the second quarterup to approximately sixty years, many of each year as discussed above. The sum of the quarterly per share amounts may not equal annual amounts due to rounding. In connection with enactment of the U.S. Tax Cuts and Jobs Act (Tax Reform Act) in December 2017, the Company recorded a favorable accountingwhich provide for periodic adjustment of $20,318, or $0.32 per share, during the fourth quarter of 2017. This reflects the estimated benefit from the revaluation of net deferred income tax liabilitiesrent payments based on changes in consumer or other price indices. The Company recognizes lease income on a straight-line basis over the new lower U.S. corporatelease term. Lease income tax rate effective January 1, 2018.in the twelve months of 2021 and 2020 was $4,223 and $3,191, respectively, and is classified in cash flows from operating activities.
4849
ITEM 9. Changes in and Disagreements with Accountants on Accounting and Financial Disclosure.
None.
ITEM 9A. Controls Andand Procedures.
Disclosure Controls and Procedures
The Company’s Chief Executive Officer and Chief Financial Officer have concluded, based on their evaluation as of the end of the period covered by this report, that the Company’s disclosure controls and procedures (as defined in Rule 13a-15(e) of the Securities Exchange Act of 1934, as amended (the “Exchange Act”) ) are effective to ensure that information required to be disclosed in the reports that the Company files or submits under the Exchange Act is (i) recorded, processed, summarized and reported within the time periods specified in the Securities and Exchange Commission’s rules and forms, and (ii) is accumulated and communicated to the Company’s management, including its Chief Executive Officer and Chief Financial Officer, as appropriate to allow timely decisions regarding required disclosure.
Internal Control over Financial Reporting
(a) | See “Management’s Report on Internal Control Over Financial Reporting,” included in Item 8 “Financial Statements and Supplementary Data,” which is incorporated herein by reference. |
(b) | See “Report of Independent Registered Public Accounting Firm” included in Item 8 “Financial Statements and Supplementary Data” for the attestation report of the Company’s independent registered public accounting firm, which is incorporated herein by reference. |
(c) | There were no changes in the Company’s internal control over financial reporting during the quarter ended December 31, |
None.
ITEM 9C. Disclosure Regarding Foreign Jurisdictions that Prevent Inspections.
None.
4950
PART III
ITEM 10. Directors, Executive Officers and Corporate Governance.
See the information with respect to the Directors of the Company which is set forth in the section entitled “Election of Directors” of the 20182021 Proxy Statement, which section of the 20182021 Proxy Statement is incorporated herein by reference. See the information in the section entitled “Section 16(a) Beneficial Ownership Reporting Compliance” of the Company’s 20182021 Proxy Statement, which section is incorporated herein by reference.
The following table sets forth the information with respect to the executive officers of the Company:
| | | | |
Name | Position (1) | Age | ||
| |
| |
|
| ||||
Ellen R. Gordon* |
| Chairman of the Board and Chief Executive Officer |
|
|
| | | | |
G. Howard Ember Jr. |
| Vice President/Finance |
|
|
| | | | |
Stephen P. Green |
| Vice President/Manufacturing |
|
|
| | | | |
|
| Vice President/Marketing and Sales |
|
|
| | | | |
|
|
| ||
| ||||
Barry P. Bowen |
| Treasurer |
|
|
* A member of the Board of Directors of the Company.
| (1) |
| All of the above named officers have served in the positions set forth in the table as their principal occupations for more than the past five years except for |
Code of Ethics
The Company has a Code of Business Conduct and Ethics, which applies to all of the Company’s directors and employees, and which meets the Securities Exchange Commission criteria for a “code of ethics.” The Code of Business Conduct and Ethics is available on the Company’s website, located at www.tootsie.com, and the information in such is available in print to any shareholder who requests a copy.
ITEM 11. Executive Compensation.
See the information set forth in the sections entitled “Executive Compensation” and “Director Compensation”Compensation��� of the Company’s 20182022 Proxy Statement, which are incorporated herein by reference.
ITEM 12. Security Ownership of Certain Beneficial Owners and Management and Related Stockholder Matters.
For information with respect to the beneficial ownership of the Company’s common stock and Class B common stock by the beneficial owners of more than 5% of said shares and by the management of the Company, see the sections entitled “Ownership of Common Stock and Class B Common Stock by Certain Beneficial Owners” and “Ownership of Common Stock and Class B Common Stock by Management” of the 20182022 Proxy Statement. These sections of the 20182022 Proxy Statement are incorporated herein by reference. The Company does not have any compensation plans under which equity securities of the Company are authorized for issuance.
5051
ITEM 13. Certain Relationships and Related Transactions, and Director Independence.
See the section entitled “Related Person Transactions” of the 20182022 Proxy Statement, which is incorporated herein by reference.
The Company’s board of directors has determined that its non-management directors, Mr. Seibert and Ms. Wardynski and Ms. Lewis-Brent, are independent under the New York Stock Exchange listing standards because they have no direct or indirect relationship with the Company other than through their service on the Board of Directors.
ITEM 14. Principal Accounting Fees and Services.
See the section entitled “Independent Auditor Fees and Services” of the 20182022 Proxy Statement, which is incorporated herein by reference.
ITEM 15. Exhibits, Financial Statement Schedules.
| |
(a) Financial Statements. | |
| |
| |
(1) The following financial statements are included in Item 8: | |
| |
Report of Independent Registered Public Accounting Firm | |
| |
Consolidated Statements of Earnings and Retained Earnings for each of the three years ended December 31, | |
| |
Consolidated Statements of Comprehensive Earnings for each of the three years ended December 31, | |
| |
Consolidated Statements of Financial Position at December 31, | |
| |
Consolidated Statements of Cash Flows for each of the three years ended in the period December 31, | |
| |
Notes to Consolidated Financial Statements | |
| |
| |
| |
| |
(2) Financial Statement Schedules. | |
| |
The financial statement schedule included in this Form 10-K is Schedule II - Valuation and Qualifying Accounts and Reserves for the | |
| |
| |
| |
(3) Exhibits required by Item 601 of Regulation S-K: | |
| |
See Index to Exhibits which appears following Financial Schedule II. | |
None.
5152
SCHEDULE II – VALUATION AND QUALIFYING ACCOUNTS (in thousands)
DECEMBER 31, 2017, 2016 AND 20152021, 2020 and 2019
| | | | | | | | | | | | | |
|
| | |
| Additions |
| | |
| | |
| |
| | | | | (reductions) | | | | | | |
| |
| | Balance at | | charged | | | | | Balance at |
| |||
| | beginning | | (credited) to | | | | | End of |
| |||
Description | | of year | | expense | | Deductions(1) | | Year |
| ||||
| | | | | | | | | | | | | |
2021: | | | | | | | | | | | | | |
Reserve for bad debts | | $ | 1,108 | | $ | 418 | | $ | 134 | | $ | 1,392 | |
Reserve for cash discounts | |
| 586 | |
| 10,153 | |
| 9,850 | |
| 889 | |
Deferred tax asset valuation | |
| 5,593 | |
| (38) | |
| — | |
| 5,555 | |
| | $ | 7,287 | | $ | 10,533 | | $ | 9,984 | | $ | 7,836 | |
| | | | | | | | | | | | | |
2020: | | | | | | | | | | | | | |
Reserve for bad debts | | $ | 1,337 | | $ | 123 | | $ | 352 | | $ | 1,108 | |
Reserve for cash discounts | |
| 612 | |
| 8,504 | |
| 8,530 | |
| 586 | |
Deferred tax asset valuation | |
| 4,985 | |
| 608 | |
| — | |
| 5,593 | |
| | $ | 6,934 | | $ | 9,235 | | $ | 8,882 | | $ | 7,287 | |
| | | | | | | | | | | | | |
2019: | | | | | | | | | | | | | |
Reserve for bad debts | | $ | 1,128 | | $ | 676 | | $ | 467 | | $ | 1,337 | |
Reserve for cash discounts | |
| 692 | |
| 9,482 | |
| 9,562 | |
| 612 | |
Deferred tax asset valuation | |
| 3,892 | |
| 1,093 | |
| — | |
| 4,985 | |
| | $ | 5,712 | | $ | 11,251 | | $ | 10,029 | | $ | 6,934 | |
|
|
|
|
|
|
|
|
|
|
|
|
|
|
|
|
|
|
| Additions |
|
|
|
|
|
|
| |
|
|
|
|
| (reductions) |
|
|
|
|
|
|
| |
|
| Balance at |
| charged |
|
|
|
| Balance at |
| |||
|
| beginning |
| (credited) to |
|
|
|
| End of |
| |||
Description |
| of year |
| expense |
| Deductions(1) |
| Year |
| ||||
|
|
|
|
|
|
|
|
|
|
|
|
|
|
2017: |
|
|
|
|
|
|
|
|
|
|
|
|
|
Reserve for bad debts |
| $ | 1,225 |
| $ | 27 |
| $ | 55 |
| $ | 1,197 |
|
Reserve for cash discounts |
|
| 659 |
|
| 9,268 |
|
| 9,203 |
|
| 724 |
|
Deferred tax asset valuation |
|
| 2,317 |
|
| 952 |
|
| — |
|
| 3,269 |
|
|
| $ | 4,201 |
| $ | 10,247 |
| $ | 9,258 |
| $ | 5,190 |
|
|
|
|
|
|
|
|
|
|
|
|
|
|
|
2016: |
|
|
|
|
|
|
|
|
|
|
|
|
|
Reserve for bad debts |
| $ | 1,410 |
| $ | (166) |
| $ | 19 |
| $ | 1,225 |
|
Reserve for cash discounts |
|
| 815 |
|
| 9,247 |
|
| 9,403 |
|
| 659 |
|
Deferred tax asset valuation |
|
| 2,077 |
|
| 240 |
|
| — |
|
| 2,317 |
|
|
| $ | 4,302 |
| $ | 9,321 |
| $ | 9,422 |
| $ | 4,201 |
|
|
|
|
|
|
|
|
|
|
|
|
|
|
|
2015: |
|
|
|
|
|
|
|
|
|
|
|
|
|
Reserve for bad debts |
| $ | 1,300 |
| $ | 267 |
| $ | 157 |
| $ | 1,410 |
|
Reserve for cash discounts |
|
| 668 |
|
| 9,678 |
|
| 9,531 |
|
| 815 |
|
Deferred tax asset valuation |
|
| 2,478 |
|
| (401) |
|
| — |
|
| 2,077 |
|
|
| $ | 4,446 |
| $ | 9,544 |
| $ | 9,688 |
| $ | 4,302 |
|
| (1) |
| Deductions against reserve for bad debts consist of accounts receivable written off net of recoveries and exchange rate movements. Deductions against reserve for cash discounts consist of allowances to customers. |
5253
| | | | |
3.1 | | |||
| | | ||
3.2 | | |||
| | | ||
3.3 | | |||
| | | ||
4.1 | | Specimen Class B Common Stock Certificate. Incorporated by reference to Exhibit 1.1 of the Company’s Registration Statement on Form 8-A dated February 29, 1988. | ||
| | | ||
4.2 | | |||
| | | ||
10.1* | | Excess Benefit Plan. Incorporated by reference to Exhibit 10.8.1 of the Company’s Annual Report on Form 10-K for the year ended December 31, 1990. | ||
| | | ||
10.2* | | |||
| | | ||
10.3* | | |||
| | | ||
10.4* | | |||
| | | ||
10.5* | | |||
| | | ||
10.6* | | |||
| | | ||
10.7* | | |||
| | | ||
10.8* | | |||
| | | ||
10.9* | | |||
| | | ||
10.10* | | |||
| | | ||
54
10.11* | | |||
| | | ||
10.12* | | |||
53
| | | ||
10.13* | | |||
| | | ||
10.14* | | |||
| | | ||
21 | | |||
| | | ||
31.1 | | |||
| | | ||
31.2 | | |||
| | | ||
32 | | |||
| | | ||
| | XBRL Instance Document - The | ||
| | | ||
101.SCH | | XBRL Taxonomy Extension Schema Document. | ||
| | | ||
101.CAL | | XBRL Taxonomy Extension Calculation Linkbase Document. | ||
| | | ||
101.LAB | | XBRL Taxonomy Extension Label Linkbase Document. | ||
| | | ||
101.PRE | | XBRL Taxonomy Extension Presentation Linkbase Document. | ||
| | | ||
101.DEF | | XBRL Taxonomy Extension Definition Linkbase Document. | ||
| | | ||
104 | | Cover Page Interactive Data File - The cover page interactive data file does not appear in the Interactive Data File because its XBRL | ||
*Management compensation plan or arrangement.
5455
SIGNATURES
Pursuant to the requirements of Section 13 or 15 (d) of the Securities Exchange Act of 1934, Tootsie Roll Industries, Inc., has duly caused this report to be signed on its behalf by the undersigned, thereunto duly authorized.
| | |
| TOOTSIE ROLL INDUSTRIES, INC. | |
| | |
| | |
| By: | Ellen R. Gordon |
| | Ellen R. Gordon, Chairman of the Board of Directors and Chief Executive Officer |
| | |
| Date: | March 1, |
Pursuant to the requirements of the Securities Exchange Act of 1934, this report has been signed below by the following persons on behalf of the registrant and in the capacities and on the dates indicated.
| | | | |
Ellen R. Gordon | | Chairman of the Board of Directors and Chief Executive Officer | | March 1, |
Ellen R. Gordon | | (principal executive officer) | | |
| | | | |
Paula M. Wardynski | | Director | | March 1, |
Paula M. Wardynski | | | | |
| | | | |
Lana Jane Lewis-Brent | | Director | | March 1, |
Lana Jane Lewis-Brent | | | | |
| | | | |
Barre A. Seibert | | Director | | March 1, |
Barre A. Seibert | | | | |
| | | | |
Virginia L. Gordon | | Director | | March 1, 2022 |
Virginia L. Gordon | | | | |
| | | | |
G. Howard Ember, Jr. | | Vice President, Finance | | March 1, |
G. Howard Ember, Jr. | | (principal financial officer and principal accounting officer) | | |
5556