Table of Contents | (1)
| | Filed herewith under Items 1 and 2. Business and Properties.
|
(1) Filed herewith under Items 1 and 2. Business and Properties. ITEM 16. FORM 10-K SUMMARY None. ITEM 16. FORM 10-K SUMMARY
SIGNATURES Pursuant to the requirements of Section 13 or 15(d) of the Securities Exchange Act of 1934, the registrant has duly caused this report to be signed on its behalf by the undersigned, thereunto duly authorized. | | UR-ENERGY INC. | | | | | UR-ENERGY INC.
| | | | Date: March 1, 2018
| By:
| /s/ Jeffrey T. Klenda
| | | Jeffrey T. Klenda
| | | Chief Executive Officer
| | | | | Date: February 26, 2021 | By: | /s/ Jeffrey T. Klenda | | | | Jeffrey T. Klenda | | | | Chief Executive Officer | |
Pursuant to the requirements of the Securities Exchange Act of 1934, this report has been signed by the following persons on behalf of the registrant and in the capacities and on the dates indicated. | | | Date: March 1, 2018
Date: February 26, 2021 | By: | /s/ Jeffrey T. Klenda | | | | Jeffrey T. Klenda | | | | Chief Executive Officer (Principal Executive Officer) | | | | Date: March 1, 2018
| By:
| /s/ Roger L. Smith
| | | Roger L. Smith
| | | Chief Financial Officer (Principal Financial Officer and Principal Accounting Officer)
| | | | Date: March 1, 2018
| By:
| /s/ W. William Boberg
| | | W. William Boberg
| | | Director
| | | | Date: March 1, 2018
| By:
| /s/ James M. Franklin
| | | James M. Franklin
| | | Director
| | | | Date: March 1, 2018
| By:
| /s/ Paul Macdonell
| | | Paul Macdonell
| | | Director
| | | | Date: March 1, 2018
| By:
| /s/ Thomas Parker
| | | Thomas Parker
| | | Director
| | | | | | | Date: March 1, 2018
| By:
| /s/ Gary C. Huber
| | | Gary C. Huber
| | | Director
| | | | | | | Date: March 1, 2018
| By:
| /s/ Kathy E. Walker
| | | Kathy E. Walker
| | | Director
| | | |
Date: February 26, 2021 | 75By:
| | /s/ Roger L. Smith | | | | Roger L. Smith | | | | Chief Financial Officer (Principal Financial Officer and Principal Accounting Officer) | | | | | |
Date: February 26, 2021 | By: | /s/ James M. Franklin | | Ur-Energy Inc.
| | Headquartered in Littleton, ColoradoJames M. Franklin
| Consolidated Financial Statements
| | December 31, 2017
| Director | | | | | | Date: February 26, 2021 | By: | /s/ W. William Boberg | | | | W. William Boberg | | | | Director | | | | | | Date: February 26, 2021 | By: | /s/ Thomas Parker | | | | Thomas Parker | | | | Director | | | | | | Date: February 26, 2021 | By: | /s/ Gary C. Huber | | | | Gary C. Huber | | | | Director | | | | | | Date: February 26, 2021 | By: | /s/ Kathy E. Walker | | | | Kathy E. Walker | | | | Director | | | | | | Date: February 26, 2021 | By: | /s/ Rob Chang | | | | Rob Chang | | | | Director | | | |
Ur-Energy Inc. Headquartered in Littleton, Colorado Consolidated Financial Statements December 31, 2020 (expressed in thousands of U.S. dollars unless otherwise indicated) Report of Independent Registered Public Accounting Firm To the Shareholders and Board of Directors of Ur-Energy Inc. Opinion on the Financial Statements We have audited the accompanying consolidated balance sheets of Ur-Energy Inc. and its subsidiaries (together, the Company) as of December 31, 2020 and 2019, and the related consolidated statements of operations and comprehensive loss, changes in shareholders’ equity and cash flow for each of the three years in the period ended December 31, 2020, including the related notes (collectively referred to as the consolidated financial statements). In our opinion, the consolidated financial statements present fairly, in all material respects, the financial position of the Company as of December 31, 2020 and 2019, and the results of its operations and its cash flows for each of the three years in the period ended December 31, 2020 in conformity with accounting principles generally accepted in the United States of America. Basis for Opinion These consolidated financial statements are the responsibility of the Company’s management. Our responsibility is to express an opinion on the Company’s consolidated financial statements based on our audits. We are a public accounting firm registered with the Public Company Accounting Oversight Board (United States) (PCAOB) and are required to be independent with respect to the Company in accordance with the U.S. federal securities laws and the applicable rules and regulations of the Securities and Exchange Commission and the PCAOB. We conducted our audits of these consolidated financial statements in accordance with the standards of the PCAOB. Those standards require that we plan and perform the audit to obtain reasonable assurance about whether the consolidated financial statements are free of material misstatement, whether due to error or fraud. The Company is not required to have, nor were we engaged to perform, an audit of its internal control over financial reporting. As part of our audits we are required to obtain an understanding of internal control over financial reporting but not for the purpose of expressing an opinion on the effectiveness of the Company’s internal control over financial reporting. Accordingly, we express no such opinion. Our audits included performing procedures to assess the risks of material misstatement of the consolidated financial statements, whether due to error or fraud, and performing procedures that respond to those risks. Such procedures included examining, on a test basis, evidence regarding the amounts and disclosures in the consolidated financial statements. Our audits also included evaluating the accounting principles used and significant estimates made by management, as well as evaluating the overall presentation of the consolidated financial statements. We believe that our audits provide a reasonable basis for our opinion. Critical Audit Matters The critical audit matter communicated below is a matter arising from the current period audit of the consolidated financial statements that was communicated or required to be communicated to the audit committee and that (i) relates to accounts or disclosures that are material to the consolidated financial statements and (ii) involved our especially challenging, subjective, or complex judgments. The communication of critical audit matters does not alter in any way our opinion on the consolidated financial statements, taken as a whole, and we are not, by communicating the critical audit matter below, providing a separate opinion on the critical audit matter or on the accounts or disclosures to which it relates. To the Shareholders and Directors of Ur-Energy Inc.
Opinions on the Financial Statements and Internal Control over Financial Reporting
We have audited the accompanying consolidated balance sheets of Ur-Energy Inc. and its subsidiaries,(together, the Company) as of December 31, 2017 and 2016, and the related consolidated statements of operations and comprehensive loss, consolidated statements of cash flows and consolidated statements of shareholder’s equity for the years then ended, including the related notes (collectively referred to as the consolidated financial statements). We also have audited the Company's internal control over financial reporting as of December 31, 2017, based on criteria established in Internal Control – Integrated Framework (2013) issued by the Committee of Sponsoring Organizations of the Treadway Commission (COSO).
In our opinion, the consolidated financial statements referred to above present fairly, in all material respects, the financial position of the Company as of December 31, 2017 and 2016, and their results of operations and their cash flows for the years then ended in conformity with accounting principles generally accepted in the United States of America. Also in our opinion, the Company maintained, in all material respects, effective internal control over financial reporting as of December 31, 2017, based on criteria established in Internal Control – Integrated Framework (2013) issued by the COSO.
Change in Accounting Principle
As discussed in note 3 to the consolidated financial statements, the Company had changed its presentation of restricted Cash.
Basis for Opinions
The Company's management is responsible for these consolidated financial statements, for maintaining effective internal control over financial reporting, and for its assessment of the effectiveness of internal control over financial reporting, included in Management’s Report on Internal Control over Financial Reporting appearing under Item 9A. Our responsibility is to express opinions on the Company’s consolidated financial statements and on the Company's internal control over financial reporting based on our audits. We are a public accounting firm registered with the Public Company Accounting Oversight Board (United States) (PCAOB) and are required to be independent with respect to the Company in accordance with the U.S. federal securities laws and the applicable rules and regulations of the Securities and Exchange Commission and the PCAOB.
We conducted our audits in accordance with the standards of the PCAOB. Those standards require that we plan and perform the audits to obtain reasonable assurance about whether the consolidated financial statements are free of material misstatement, whether due to error or fraud, and whether effective internal control over financial reporting was maintained in all material respects.
Our audits of the consolidated financial statements included performing procedures to assess the risks of material misstatement of the consolidated financial statements, whether due to error or fraud, and performing procedures that respond to those risks. Such procedures included examining, on a test basis, evidence regarding the amounts and disclosures in the consolidated financial statements. Our audits also included evaluating the accounting principles used and significant estimates made by management, as well as evaluating the overall presentation of the consolidated financial statements. Our audit of internal control over financial reporting included obtaining an understanding of internal control over financial reporting, assessing the risk that a
| | 69 | | Table of Contentsmaterial weakness exists, and testing and evaluating the design and operating effectiveness of internal control based on the assessed risk. Our audits also included performing such other procedures as we considered necessary in the circumstances. We believe that our audits provide a reasonable basis for our opinions.
|
Assessment of impairment indicators of mineral properties and capital assets As described in Notes 7 and 8 to the consolidated financial statements, the carrying amounts of the Company’s mineral properties and capital assets were $39.2 million and $21.9 million respectively as at December 31, 2020. Management applies judgement to assess mineral properties and capital assets for impairment indicators that could give rise to the requirement to conduct a formal impairment test. Internal and external factors such as (i) significant decreases in the market price of the assets, (ii) current period cash flow or operating losses combined with a history of losses or a forecast of continuing losses associated with the use of the assets, (iii) significant changes in expected capital and operating costs, and reclamation costs, (iv) significant adverse changes in the business climate or legal factors including changes in uranium prices, and (v) current expectation that the assets will more likely than not be sold or disposed of significantly before the end of their estimated useful lives, are evaluated by management in determining whether there are any indicators of impairment. The principal considerations for our determination that performing procedures relating to the assessment of impairment indicators of mineral properties and capital assets is a critical audit matter are that there was judgment by management when assessing whether there were indicators of impairment for the mineral properties and capital assets, specifically related to assessing: (i) significant changes in expected capital and operating costs, and reclamation costs, (ii) significant adverse changes in the business climate or legal factors including changes in uranium prices, (iii) significant decreases in the market price of the assets, and (iv) current period cash flow or operating losses combined with a history of losses or a forecast of continuing losses associated with the use of the assets. This in turn led to a high degree of auditor judgment, subjectivity and effort in performing procedures to evaluate audit evidence relating to the judgements made by management in their assessment of indicators of impairment that could give rise to the requirement to conduct a formal impairment test. Addressing the matter involved performing procedures and evaluating audit evidence in connection with forming our overall opinion on the consolidated financial statements. These procedures included, among others, evaluating management’s assessment of indicators of impairment; and assessing whether there have been significant decreases in the market price of the assets, significant changes in the expected capital costs, operating costs, and reclamation costs, and current period cash flow or operating losses combined with a history of losses or forecasted continued losses associated with the use of the assets, by considering the current and past performance of the mineral properties and capital assets including other third-party information and evidence obtained in other areas of the audit, as applicable. The procedures performed also included (i) evaluating whether there were significant adverse changes in the business climate or legal factors including changes in uranium prices by considering external market data and industry data; and (ii) assessing the completeness of external or internal factors that could be considered as indicators of impairment of the Company’s mineral properties and capital assets, including consideration of evidence obtained in other areas of the audit. /s/PricewaterhouseCoopers LLP Definition and limitations of internal control over financial reporting
A company’s internal control over financial reporting is a process designed to provide reasonable assurance regarding the reliability of financial reporting and the preparation of consolidated financial statements for external purposes in accordance with generally accepted accounting principles. A company’s internal control over financial reporting includes those policies and procedures that (i) pertain to the maintenance of records that, in reasonable detail, accurately and fairly reflect the transactions and dispositions of the assets of the company; (ii) provide reasonable assurance that transactions are recorded as necessary to permit preparation of consolidated financial statements in accordance with generally accepted accounting principles, and that receipts and expenditures of the company are being made only in accordance with authorizations of management and directors of the company; and (iii) provide reasonable assurance regarding prevention or timely detection of unauthorized acquisition, use, or disposition of the company’s assets that could have a material effect on the consolidated financial statements.
Because of its inherent limitations, internal control over financial reporting may not prevent or detect misstatements. Also, projections of any evaluation of effectiveness to future periods are subject to the risk that controls may become inadequate because of changes in conditions, or that the degree of compliance with the policies or procedures may deteriorate.
Pricewaterhouse Coopers LLP
Chartered Professional Accountants Vancouver, Canada March 2, 2018February 26, 2021
We have served as the Company'sCompany’s auditor since 2004. Ur-Energy Inc.
Consolidated Balance Sheets
(expressed in thousands of U.S. dollars)
Ur-Energy Inc. | | | | | | | | | | Conolidated Balance Sheets | | | | | | | | | | (expressed in thousands of U.S. dollars) | | | | | | | | | | (the accompanying notes are an integral part of these consolidated finacial statements) | | | | | | | | | | | | | | | | | | | | | | Note | | | December 31, 2020 | | | December 31, 2019 | | | | | | | | | | | | Assets | | | | | | | | | | Current assets | | | | | | | | | | Cash and cash equivalents | | | 4 | | | | 4,268 | | | | 7,403 | | Accounts receivable | | | | | | | 0 | | | | 22 | | Prepaid expenses | | | | | | | 814 | | | | 885 | | Total current assets | | | | | | | 5,082 | | | | 8,310 | | | | | | | | | | | | | | | Non-current assets | | | | | | | | | | | | | Non-current portion of inventory | | | 5 | | | | 7,814 | | | | 7,426 | | Restricted cash | | | 6 | | | | 7,859 | | | | 7,812 | | Mineral properties | | | 7 | | | | 39,184 | | | | 43,212 | | Capital assets | | | 8 | | | | 21,891 | | | | 23,630 | | Total non-current assets | | | | | | | 76,748 | | | | 82,080 | | Total assets | | | | | | | 81,830 | | | | 90,390 | | | | | | | | | | | | | | | Liabilities and shareholders' equity | | | | | | | | | | | | | Current liabilities | | | | | | | | | | | | | Accounts payable and accrued liabilities | | | 9 | | | | 2,320 | | | | 2,211 | | Current portion of notes payable | | | 10 | | | | 459 | | | | 0 | | Current portion of warrant liability | | | 12 | | | | 729 | | | | 0 | | Environmental remediation accrual | | | | | | | 76 | | | | 72 | | Total current liabilities | | | | | | | 3,584 | | | | 2,283 | | | | | | | | | | | | | | | Non-current liabilities | | | | | | | | | | | | | Notes payable | | | 10 | | | | 12,720 | | | | 12,215 | | Lease liability | | | | | | | 50 | | | | 12 | | Asset retirement obligations | | | 11 | | | | 29,965 | | | | 30,972 | | Warrant liability | | | 12 | | | | 1,415 | | | | 575 | | Total non-current liabilities | | | | | | | 44,150 | | | | 43,774 | | | | | | | | | | | | | | | Shareholders' equity | | | | | | | | | | | | | Share capital | | | 13 | | | | 189,620 | | | | 185,754 | | Contributed surplus | | | | | | | 20,946 | | | | 20,317 | | Accumulated other comprehensive income | | | | | | | 3,707 | | | | 3,654 | | Accumulated deficit | | | | | | | (180,177 | ) | | | (165,392 | ) | Total shareholders' equity | | | | | | | 34,096 | | | | 44,333 | | Total liabilities and shareholders' equity | | | | | | | 81,830 | | | | 90,390 | |
| | | | | December 31, | | December 31, | | 2017 | | 2016 | Assets | | | | Current assets | | | | Cash and cash equivalents (note 4) | 3,879 | | 1,552 | Accounts receivable | 33 | | 16 | Inventory (note 5) | 4,515 | | 4,109 | Prepaid expenses | 741 | | 829 | | 9,168 | | 6,506 | Restricted cash (note 6) | 7,558 | | 7,557 | Mineral properties (note 7) | 44,677 | | 47,029 | Capital assets (note 8) | 26,961 | | 28,848 | | 79,196 | | 83,434 | | 88,364 | | 89,940 | Liabilities and shareholders' equity | | | | Current liabilities | | | | Accounts payable and accrued liabilities (note 9) | 3,039 | | 3,625 | Current portion of notes payable (note 10) | 4,774 | | 4,502 | Environmental remediation accrual | 72 | | 85 | | 7,885 | | 8,212 | Notes payable (note 10) | 14,662 | | 19,435 | Asset retirement obligations (note 12) | 27,036 | | 26,061 | | 49,583 | | 53,708 | Shareholders' equity (note 13) | | | | Share Capital | | | | Class A preferred shares, without par value, unlimited shares authorized; no shares issued and outstanding | - | | - | Common shares, without par value, unlimited shares authorized; shares issued and outstanding: 146,531,933 at December 30, 2017 and 143,676,384 at December 31, 2016 | 177,063 | | 174,902 | Warrants | 4,109 | | 4,109 | Contributed surplus | 15,454 | | 15,201 | Accumulated other comprehensive income | 3,663 | | 3,604 | Deficit | (161,508) | | (161,584) | | 38,781 | | 36,232 | | 88,364 | | 89,940 |
The accompanying notes are an integral part of these consolidated financial statements.
Ur-Energy Inc. | | | | | | | | | | | | | Consolidated Statements of Operations and Comprehensive Loss | (expressed in thousands of U.S. dollars, except per share data) | | | | | | | | | | | | | (the accompanying notes are an integral part of these consolidated finacial statements) | | | | | | | | | | | | | | | | | | | | | | | | | | | | | | | Year ended | | | | | | | December 31, | | | | Note | | | 2020 | | | 2019 | | | 2018 | | | | | | | | | | | | | | | Sales | | | 14 | | | | 8,316 | | | | 32,255 | | | | 23,496 | | Cost of sales | | | 15 | | | | (12,968 | ) | | | (30,275 | ) | | | (12,203 | ) | Gross profit (loss) | | | | | | | (4,652 | ) | | | 1,980 | | | | 11,293 | | | | | | | | | | | | | | | | | | | Operating costs | | | 16 | | | | (8,689 | ) | | | (10,258 | ) | | | (9,986 | ) | Profit (loss) from operations | | | | | | | (13,341 | ) | | | (8,278 | ) | | | 1,307 | | | | | | | | | | | | | | | | | | | Net interest expense | | | | | | | (710 | ) | | | (668 | ) | | | (1,002 | ) | Warrant mark to market gain (loss) | | | | | | | (680 | ) | | | 524 | | | | 581 | | Foreign exchange gain (loss) | | | | | | | (72 | ) | | | (28 | ) | | | 43 | | Other income (expense) | | | | | | | 18 | | | | 32 | | | | 3,605 | | Net income (loss) | | | | | | | (14,785 | ) | | | (8,418 | ) | | | 4,534 | | | | | | | | | | | | | | | | | | | Foreign currency translation adjustment | | | | | | | 53 | | | | (16 | ) | | | 7 | | Comprehensive income (loss) | | | | | | | (14,732 | ) | | | (8,434 | ) | | | 4,541 | | | | | | | | | | | | | | | | | | | Income (loss) per common share: | | | | | | | | | | | | | | | | | Basic | | | | | | | (0.09 | ) | | | (0.05 | ) | | | 0.03 | | Diluted | | | | | | | (0.09 | ) | | | (0.05 | ) | | | 0.03 | | | | | | | | | | | | | | | | | | | Weighted average common shares: | | | | | | | | | | | | | | | | | Basic | | | | | | | 164,257,092 | | | | 159,903,052 | | | | 150,034,566 | | Diluted | | | | | | | 164,257,092 | | | | 159,903,052 | | | | 151,598,180 | |
Ur-Energy Inc. | | | | | | | | | | | | | | | | | | | | | | | | | Consolidated Statements of Changes in Shareholders' Equity | (expressed in thousands of U.S. dollars, except share data) | | | | | | | | | | | | | | | | | | (the accompanying notes are an integral part of these consolidated finacial statements) | | | | | | | | | | | | | | | | | | | | | | | | | | | | | | | | | | | | | | | | | | | | | | | | | | | | | | | | | | | | Accumulated | | | | | | | | | | | | | | | | | | | | | | | | | | Other | | | | | | | | | | | | | | Share Capital | | | | | | Contributed | | | Comprehensive | | | Accumulated | | | Shareholders' | | | | | Note | | | Shares | | | Amount | | | Warrants | | | Surplus | | | Income | | | Deficit | | | Equity | | | | | | | | | | | | | | | | | | | | | | | | | | | | December 31, 2017 | | | | | | | 146,531,933 | | | | 177,063 | | | | 4,109 | | | | 15,454 | | | | 3,663 | | | | (161,508 | ) | | | 38,781 | | | | | | | | | | | | | | | | | | | | | | | | | | | | | | | | | | | Exercise of stock options | | | | | | | 496,838 | | | | 415 | | | | 0 | | | | (125 | ) | | | 0 | | | | 0 | | | | 290 | | Common shares issued for cash | | | | | | | 12,195,122 | | | | 10,001 | | | | 0 | | | | 0 | | | | 0 | | | | 0 | | | | 10,001 | | Warrants issued | | | | | | | - | | | | (1,709 | ) | | | 0 | | | | 0 | | | | 0 | | | | 0 | | | | (1,709 | ) | Share issue costs | | | | | | | - | | | | (893 | ) | | | 0 | | | | 0 | | | | 0 | | | | 0 | | | | (893 | ) | Redemption of RSUs | | | | | | | 505,510 | | | | 344 | | | | 0 | | | | (423 | ) | | | 0 | | | | 0 | | | | (79 | ) | Expiry of warrants | | | | | | | - | | | | 0 | | | | (4,109 | ) | | | 4,109 | | | | 0 | | | | 0 | | | | 0 | | Non-cash stock compensation | | | | | | | - | | | | 0 | | | | 0 | | | | 915 | | | | 0 | | | | 0 | | | | 915 | | Comprehensive income (loss) | | | | | | | - | | | | 0 | | | | 0 | | | | 0 | | | | 7 | | | | 4,534 | | | | 4,541 | | | | | | | | | | | | | | | | | | | | | | | | | | | | | | | | | | | December 31, 2018 | | | | | | | 159,729,403 | | | | 185,221 | | | | 0 | | | | 19,930 | | | | 3,670 | | | | (156,974 | ) | | | 51,847 | | | | | | | | | | | | | | | | | | | | | | | | | | | | | | | | | | | Exercise of stock options | | | | | | | 323,618 | | | | 288 | | | | 0 | | | | (85 | ) | | | 0 | | | | 0 | | | | 203 | | Redemption of RSUs | | | | | | | 425,038 | | | | 245 | | | | 0 | | | | (315 | ) | | | 0 | | | | 0 | | | | (70 | ) | Non-cash stock compensation | | | | | | | - | | | | 0 | | | | 0 | | | | 787 | | | | 0 | | | | 0 | | | | 787 | | Comprehensive income (loss) | | | | | | | - | | | | 0 | | | | 0 | | | | 0 | | | | (16 | ) | | | (8,418 | ) | | | (8,434 | ) | | | | | | | | | | | | | | | | | | | | | | | | | | | | | | | | | | December 31, 2019 | | | | | | | 160,478,059 | | | | 185,754 | | | | 0 | | | | 20,317 | | | | 3,654 | | | | (165,392 | ) | | | 44,333 | | | | | | | | | | | | | | | | | | | | | | | | | | | | | | | | | | | Exercise of stock options | | | | | | | 159,982 | | | | 141 | | | | 0 | | | | (42 | ) | | | 0 | | | | 0 | | | | 99 | | Common shares issued for cash | | | | | | | 9,259,640 | | | | 4,805 | | | | 0 | | | | 0 | | | | 0 | | | | 0 | | | | 4,805 | | Warrants issued | | | | | | | - | | | | (860 | ) | | | 0 | | | | 0 | | | | 0 | | | | 0 | | | | (860 | ) | Share issue costs | | | | | | | - | | | | (431 | ) | | | 0 | | | | 0 | | | | 0 | | | | 0 | | | | (431 | ) | ATM renewal costs | | | | | | | - | | | | 0 | | | | 0 | | | | 0 | | | | 0 | | | | 0 | | | | 0 | | Redemption of RSUs | | | | | | | 356,071 | | | | 211 | | | | 0 | | | | (280 | ) | | | 0 | | | | 0 | | | | (69 | ) | Non-cash stock compensation | | | | | | | - | | | | 0 | | | | 0 | | | | 951 | | | | 0 | | | | 0 | | | | 951 | | Comprehensive income (loss) | | | | | | | - | | | | 0 | | | | 0 | | | | 0 | | | | 53 | | | | (14,785 | ) | | | (14,732 | ) | | | | | | | | | | | | | | | | | | | | | | | | | | | | | | | | | | December 31, 2020 | | | | | | | 170,253,752 | | | | 189,620 | | | | 0 | | | | 20,946 | | | | 3,707 | | | | (180,177 | ) | | | 34,096 | |
Ur-Energy Inc. | | | | | | | | | | | | | Consolidated Statements of Cash Flow | (expressed in thousands of U.S. dollars) | | | | | | | | | | | | | (the accompanying notes are an integral part of these consolidated finacial statements) | | | | | | | | | | | | | | | | | | | | | | | | | | | | | | | Year ended | | | | | | | December 31, | | | | | Note | | | 2020 | | | 2019 | | | 2018 | | | | | | | | | | | | | | | | Cash provided by (used for): | | | | | | | | | | | | | | | | | | | | | | | | | | | | Operating activities | | | | | | | | | | | | | | Net income (loss) for the year | | | | | | | (14,785 | ) | | | (8,418 | ) | | | 4,534 | | | | | | | | | | | | | | | | | | | Items not affecting cash: | | | | | | | | | | | | | | | | | Stock based compensation | | | | | | | 951 | | | | 787 | | | | 915 | | Net realizable value adjustments | | | | | | | 7,802 | | | | 10,263 | | | | 318 | | Depreciation of capital assets | | | | | | | 1,818 | | | | 1,812 | | | | 1,860 | | Amortization of mineral properties | | | | | | | 2,445 | | | | 2,601 | | | | 1,743 | | Accretion expense | | | | | | | 576 | | | | 577 | | | | 508 | | Amortization of deferred loan costs | | | | | | | 71 | | | | 108 | | | | 121 | | Provision for reclamation | | | | | | | 4 | | | | (5 | ) | | | 5 | | Write-off of mineral properties | | | | | | | 0 | | | | 11 | | | | 0 | | Loss from equity investment | | | | | | | 0 | | | | 0 | | | | 5 | | Mark to market loss (gain) | | | | | | | 680 | | | | (524 | ) | | | (581 | ) | Gain on sale of monetized contract | | | | | | | 0 | | | | 0 | | | | (3,540 | ) | Gain on sale of assets | | | | | | | (16 | ) | | | (18 | ) | | | (2 | ) | Gain (loss) on unrealized foreign exchange | | | | | | | 0 | | | | (28 | ) | | | 45 | | Accounts receivable | | | | | | | 22 | | | | 9 | | | | 2 | | Inventory | | | | | | | (8,190 | ) | | | (2,997 | ) | | | (10,495 | ) | Prepaid expenses | | | | | | | 71 | | | | 5 | | | | (95 | ) | Accounts payable and accrued liabilities | | | | | | | 108 | | | | (196 | ) | | | (706 | ) | | | | | | | | (8,443 | ) | | | 3,987 | | | | (5,363 | ) | | | | | | | | | | | | | | | | | | Investing activities | | | | | | | | | | | | | | | | | Mineral property costs | | | | | | | 0 | | | | (9 | ) | | | (31 | ) | Decrease (increase) in bonding and other deposits | | | | | | | 0 | | | | 19 | | | | 0 | | Proceeds from sale of monetized contract | | | | | | | 0 | | | | 0 | | | | 3,540 | | Funding of equity investment | | | | | | | 0 | | | | 0 | | | | (5 | ) | Proceeds from sale of capital assets | | | | | | | 18 | | | | 18 | | | | 0 | | Purchase of capital assets | | | | | | | (43 | ) | | | (271 | ) | | | (55 | ) | | | | | | | | (25 | ) | | | (243 | ) | | | 3,449 | | | | | | | | | | | | | | | | | | | Financing activities | | | | | | | | | | | | | | | | | Issuance of common shares and warrants for cash | | | 13 | | | | 4,805 | | | | 0 | | | | 10,000 | | Share issue costs | | | 13 | | | | (431 | ) | | | 0 | | | | (902 | ) | Proceeds from exercise of warrants and stock options | | | | | | | 99 | | | | 203 | | | | 290 | | RSU redeemed for cash | | | | | | | (39 | ) | | | (70 | ) | | | (76 | ) | Proceeds from debt financing | | | 10 | | | | 893 | | | | 0 | | | | 0 | | Repayment of debt | | | | | | | 0 | | | | (2,554 | ) | | | (4,895 | ) | | | | | | | | 5,327 | | | | (2,421 | ) | | | 4,417 | | | | | | | | | | | | | | | | | | | Effects of foreign exchange rate changes on cash | | | | | | | 53 | | | | 62 | | | | (110 | ) | | | | | | | | | | | | | | | | | | Increase (decrease) in cash, cash equivalents, and restricted cash | | | | | | | (3,088 | ) | | | 1,385 | | | | 2,393 | | Beginning cash, cash equivalents, and restricted cash | | | | | | | 15,215 | | | | 13,830 | | | | 11,437 | | Ending cash, cash equivalents, and restricted cash | | | 18 | | | | 12,127 | | | | 15,215 | | | | 13,830 | |
Ur-Energy Inc. Notes to Consolidated Financial Statements | /s/ Jeffrey T. Klenda, ChairmanDecember 31, 2020
| | /s/ Thomas H. Parker, Director
|
Ur-Energy Inc.
Consolidated Statements of Operations and Comprehensive Loss
(expressed in thousands of U.S. dollars except for share data)
| | | | | | | Year ended December 31, | | 2017 | | 2016 | | 2015 | | | | | | | Sales (note 14) | 38,368 | | 27,305 | | 41,877 | Cost of sales | (24,401) | | (15,848) | | (29,292) | Gross profit | 13,967 | | 11,457 | | 12,585 | | | | | | | Operating Expenses | | | | | | Exploration and evaluation | (2,623) | | (2,964) | | (2,853) | Development | (4,340) | | (2,886) | | (5,358) | General and administrative | (5,090) | | (4,740) | | (5,715) | Accretion of asset retirement obligations (note 12) | (527) | | (534) | | (515) | Write-off of mineral properties (note 7) | - | | (62) | | - | Income (loss) from operations | 1,387 | | 271 | | (1,856) | Interest expense (net) | (1,377) | | (1,977) | | (2,557) | Warrant mark to market adjustment | - | | 36 | | 307 | Loss on equity investment | (5) | | (5) | | (8) | Write-off of equity investments | - | | (1,089) | | - | Foreign exchange loss | (50) | | (278) | | (1) | Other income | 121 | | 15 | | 5 | | | | | | | Income (loss) before income taxes | 76 | | (3,027) | | (4,110) | | | | | | | Income tax recovery (net) (note 11) | - | | 17 | | 3,315 | Net income (loss) for the period | 76 | | (3,010) | | (795) | | | | | | | Income (loss) per common share | | | | | | Basic | 0.00 | | (0.02) | | (0.01) | Diluted | 0.00 | | (0.02) | | (0.01) | Weighted average number of common shares outstanding | | | | | | Basic | 145,818,394 | | 141,999,537 | | 130,056,932 | Diluted | 147,533,966 | | 141,999,537 | | 130,056,932 | | | | | | | COMPREHENSIVE INCOME (LOSS) | | | | | | Net income (loss) for the period | 76 | | (3,010) | | (795) | Other Comprehensive income (loss), net of tax | | | | | | Translation adjustment on foreign operations | 59 | | 247 | | 20 | Comprehensive income (loss) for the period | 135 | | (2,763) | | (775) |
The accompanying notes are an integral part of these consolidated financial statements.
Ur-Energy Inc.
Consolidated Statements of Shareholders’ Equity
(expressed in thousands of U.S. dollars except for share data)
| | | | | | | | | | | | | | | | | | | | | | | Accumulated | | | | | | | | | | | | | | Other | | | | | | Capital Stock | | | | Contributed | | Comprehensive | | | | Shareholders' | | Shares | | Amount | | Warrants | | Surplus | | Income | | Deficit | | Equity | | | | | | | | | | | | | | | | # | | $ | | $ | | $ | | $ | | $ | | $ | | | | | | | | | | | | | | | Balance, December 31, 2014 | 129,365,076 | | 168,118 | | 4,175 | | 14,250 | | 3,337 | | (157,779) | | 32,101 | | | | | | | | | | | | | | | Exercise of stock options | 608,531 | | 626 | | - | | (216) | | - | | - | | 410 | Redemption of vested RSUs | 215,168 | | 167 | | - | | (295) | | - | | - | | (128) | Non-cash stock compensation | - | | - | | - | | 893 | | - | | - | | 893 | Net loss and comprehensive income | - | | - | | - | | - | | 20 | | (795) | | (775) | | | | | | | | | | | | | | | Balance, December 31, 2015 | 130,188,775 | | 168,911 | | 4,175 | | 14,632 | | 3,357 | | (158,574) | | 32,501 | | | | | | | | | | | | | | | Exercise of stock options | 16,620 | | 13 | | - | | (4) | | - | | - | | 9 | Common shares issued for cash, net | | | | | | | | | | | | | | of $884 of issue costs | 13,085,979 | | 5,684 | | - | | - | | - | | - | | 5,684 | Redemption of vested RSUs | 385,010 | | 294 | | - | | (350) | | - | | - | | (56) | Expiry of warrants | - | | - | | (66) | | 66 | | - | | - | | - | Non-cash stock compensation | - | | - | | - | | 857 | | - | | - | | 857 | Net loss and comprehensive income | - | | - | | - | | - | | 247 | | (3,010) | | (2,763) | | | | | | | | | | | | | | | Balance, December 31, 2016 | 143,676,384 | | 174,902 | | 4,109 | | 15,201 | | 3,604 | | (161,584) | | 36,232 | | | | | | | | | | | | | | | Exercise of stock options | 871,717 | | 795 | | - | | (253) | | - | | - | | 542 | Common shares issued for cash, net | | | | | | | | | | | | | | of $93 of issue costs | 1,536,169 | | 1,076 | | - | | - | | - | | - | | 1,076 | Redemption of vested RSUs | 447,663 | | 290 | | - | | (385) | | - | | - | | (95) | Non-cash stock compensation | - | | - | | - | | 891 | | - | | - | | 891 | Net income and comprehensive income | - | | - | | - | | - | | 59 | | 76 | | 135 | | | | | | | | | | | | | | | Balance, December 31, 2017 | 146,531,933 | | 177,063 | | 4,109 | | 15,454 | | 3,663 | | (161,508) | | 38,781 |
The accompanying notes are an integral part of these consolidated financial statements
Ur-Energy Inc.
Consolidated Statements of Cash Flow
(expressed in thousands of U.S. dollars)
| | | | | | | Year ended December 31, | | 2017 | | 2016 | | 2015 | | | | (Restated - note 2) | | (Restated - note 2) | Cash provided by (used in) | | | | | | Operating activities | | | | | | Net income (loss) for the period | 76 | | (3,010) | | (795) | Items not affecting cash: | | | | | | Stock based expense | 891 | | 857 | | 893 | Depreciation and amortization | 4,890 | | 5,144 | | 6,504 | Accretion of asset retirement obligations | 527 | | 534 | | 515 | Amortization of deferred loan costs | 120 | | 152 | | 177 | Provision for reclamation | (13) | | - | | - | Write off of equity investments | - | | 1,089 | | - | Write-off of mineral properties | - | | 62 | | - | Warrants mark to market gain | - | | (36) | | (307) | Gain on disposition of assets | (2) | | (14) | | (5) | Loss on foreign exchange | 53 | | 280 | | - | Other loss | 4 | | 5 | | 9 | Income tax recovery | - | | (17) | | (3,345) | Change in non-cash working capital items: | | | | | | Accounts receivable | (17) | | (7) | | 19 | Inventory | (406) | | (765) | | 1,823 | Prepaid expenses | 109 | | (111) | | 125 | Accounts payable and accrued liabilities | (606) | | (773) | | (101) | | 5,626 | | 3,390 | | 5,512 | | | | | | | Investing activities | | | | | | Mineral property costs | (18) | | - | | 1 | Funding of equity investment | (5) | | (5) | | (8) | Proceeds from sale of property and equipment | - | | 91 | | 26 | Purchase of capital assets | (181) | | (296) | | (79) | | (204) | | (210) | | (60) | | | | | | | Financing activities | | | | | | Issuance of common shares for cash | 1,169 | | 6,568 | | - | Share issue costs | (93) | | (884) | | - | Proceeds from exercise of stock options | 542 | | 9 | | 410 | RSUs redeemed to pay withholding or paid in cash | (94) | | (56) | | (142) | Repayment of debt | (4,623) | | (8,679) | | (7,374) | | (3,099) | | (3,042) | | (7,106) | | | | | | | Effects of foreign exchange rate changes on cash | 5 | | (28) | | (7) | | | | | | | Net change in cash, cash equivalents and restricted cash | 2,328 | | 110 | | (1,661) | Beginning cash, cash equivalents and restricted cash | 9,109 | | 8,999 | | 10,660 | Ending cash, cash equivalents and restricted cash (note 15) | 11,437 | | 9,109 | | 8,999 |
The accompanying notes are an integral part of these consolidated financial statements
Table of Contents
Ur-Energy Inc.
Notes to Consolidated Financial Statements
December 31, 2017
(expressed in thousands of U.S. dollars unless otherwise indicated) 1.Nature of Operations
Ur-Energy Inc. (the “Company”) was incorporated on March 22, 2004 under the laws of the Province of Ontario. The Company continued under the Canada Business Corporations Act on August 8, 2006. The Company is an exploration stageExploration Stage mining company, as defined by United States Securities and Exchange Commission (“SEC”) Industry Guide 7. The Company is engaged in uranium mining and recovery operations, with activities including the acquisition, exploration, development, and production of uranium mineral resources located primarily in Wyoming. As of August 2013, theThe Company commenced uranium production at its Lost Creek Project in Wyoming.Wyoming in 2013. Due to the nature of the uranium mining methods used by the Company on the Lost Creek Property, and the definition of “mineral reserves” under National Instrument 43-101 (“NI 43-101”), which uses the Canadian Institute of Mining, Metallurgy and Petroleum (“CIM”) Definition Standards, the Company has not determined whether the properties contain mineral reserves. However, the Company’s “Amended Preliminary Economic Assessment of the Lost Creek Property, Sweetwater County, Wyoming,” as amended in non-substantive ways, February 8, 2016 (“Lost Creek PEA”) outlines the potential viability of the Lost Creek Property. The recoverability of amounts recorded for mineral properties is dependent upon the discovery of economic resources, the ability of the Company to obtain the necessary financing to develop the properties and upon attaining future profitable production from the properties or sufficient proceeds from disposition of the properties. 2.Liquidity Risk
Our operations are based on a small number of large sales. As a result, our cash flow and therefore our current assets and working capital may vary widely during the year based on the timing of those sales. Virtually allMost of our past sales arewere made under term contracts, which specify delivery quantities, sales prices, and payment dates. The only exceptions are spot sales which we are currently only making when advantageous. As a result, we are able to performperformed cash management functions over the course of an entire year based on the timing of the term contracts and arewere less reliant on current commodity prices and market conditions. We monitor our cash projectionsOur remaining term contracts were completed in 2020 Q2 and any future sales will be dependent on a weekly basis and have used various techniquesspot market commodity prices until we are able to manage our cash flows including the assignment of deliveries, as we have done in the past, negotiating changes in delivery dates, purchasing inventory at favorable prices and raising capital.enter new term contracts.
As atof December 31, 2017,2020, the current Company’s financial liabilities consisted of trade accounts payable and accrued trade and payroll liabilities of $1.2$2.3 million, which are due within normal trade termsand the current portion of generally 30 to 60 days, notes payable of $19.3 million of which $4.7 million is due within 1 year, and asset retirement obligations with estimated completion dates until 2033.$0.5 million. In addition, most of our current assets exceptThe payment schedule for prepaid expensesthe $12.4 million State Bond Loan was modified on October 1, 2019 to defer principal payments for six quarters. On October 6, 2020, the State Bond Loan was again modified to defer principal payments for an additional six quarters. Quarterly principal payments are immediately realizable, if necessary, while our current liabilities include a substantial portion that is not due for a minimum of three monthsscheduled to over a year which, given the existence of our contractsresume on October 1, 2022 (see notes 10 and set prices, allows us to plan for those payments well in advance and address shortfalls, if any, well in advance.20).
On April 16, 2020, we received $0.9 million under the U.S. Small Business Administration (“SBA”) Payroll Protection Program (“PPP”), which was created under the Coronavirus Aid, Relief and Economic Security Act (the “CARES Act”). We anticipate the loans will meet the requirements for forgiveness under this program (see note 10). TableOn August 4, 2020, the Company closed a $4.68 million registered direct offering of Contents9,000,000 common shares and accompanying one-half common share warrants to purchase up to 4,500,000 common shares, at a combined public offering price of $0.52 per common share and accompanying one-half common share warrant. After fees and expenses of $0.4 million, net proceeds to the Company were $4.3 million (see note 13).
Ur-Energy Inc.
Notes to Consolidated Financial Statements
December 31, 2017
Ur-Energy Inc. Notes to Consolidated Financial Statements | December 31, 2020 |
(expressed in thousands of U.S. dollars unless otherwise indicated) Besides operational cash flows,Subsequent to December 31, 2020, on February 4, 2021, the Company closed a $15.2 million underwritten public offering of 16,930,530 common shares and accompanying one-half common share warrants to purchase up to 8,465,265 common shares, at a combined public offering price of $0.90 per common share and accompanying one-half common share warrant. The gross proceeds to the Company from this offering were approximately $15.2 million, before deducting the underwriting discounts and commissions and other estimated offering expenses payable by the Company (see note 22).
In addition to our cash flow management functions referredposition, our finished, ready-to-sell, conversion facility inventory value is immediately realizable, if necessary. We do not anticipate selling our existing finished-product inventory in 2021, unless market conditions change sufficiently to above, The Company has financedwarrant its operations from its inception primarily through the issuance of equity securities and debt instrumentssale. It is possible that additional funding might be sought. Although the Company has been successful in obtaining debt and raising equity financing in the past, there can be no guarantee that such funding will be available in the future.
3.Summary of Significant Accounting Policies
3. | Summary of Significant Accounting Policies |
Basis of presentation These financial statements have been prepared by management in accordance with United States generally accepted accounting principles (“US GAAP”) and include all the assets, liabilities and expenses of the Company and its wholly-ownedwholly owned subsidiaries Ur-Energy USA Inc.; NFU Wyoming, LLC; Lost Creek ISR, LLC; NFUR Bootheel, LLC; Hauber Project LLC; NFUR Hauber, LLC; and Pathfinder Mines Corporation. All inter-company balances, and transactions have been eliminated upon consolidation. Ur-EnergyUr‑Energy Inc. and its wholly-ownedwholly owned subsidiaries are collectively referred to herein as the “Company.” Exploration Stage The Company has established the existence of uranium resources for certain uranium projects, including the Lost Creek Property. The Company has not established proven or probable reserves, as defined by the SEC, under Industry Guide 7, through the completion of a final or “bankable” feasibility study for any of its uranium projects, including the Lost Creek Property. Furthermore, the Company currently has no plans to establish proven or probable reserves for any of its uranium projects for which the Company plans on utilizing in situ recovery (“ISR”) mining, such as the Lost Creek Property or the Shirley Basin Project. As a result, and despite the fact thateven though the Company commenced recovery of uranium at the Lost Creek Project in August 2013, the Company remains in the Exploration Stage as defined under Industry Guide 7 and will continue to remain in the Exploration Stage until such time proven or probable mineral reserves have been established. Since
Because the Company commenced recovery of uranium at the Lost Creek Project without having established proven and probable reserves, any uranium resources established or extracted from the Lost Creek Project should not be in any way associated with having established proven or probable mineral reserves. Accordingly, information concerning mineral deposits set forth herein may not be comparable to information made public by companies that have reserves in accordance with United States standards.
Ur-Energy Inc. Notes to Consolidated Financial Statements | December 31, 2020 |
(expressed in thousands of U.S. dollars unless otherwise indicated) Use of estimates The preparation of consolidated financial statements in conformity with US GAAP requires management to make estimates and assumptions that affect the reported amounts of assets and liabilities and disclosure of contingent assets and liabilities at the date of the financial statements and the reported amounts of revenues and expenses during the reporting periods. The most significant estimates management makes in the preparation of Table of Contents
Ur-Energy Inc.
Notes to Consolidated Financial Statements
December 31, 2017
(expressed in thousands of U.S. dollars unless otherwise indicated)
these consolidated financial statements relate to potential impairment in the carrying value of the Company’s long-lived assets due to depressed uranium prices or other internal or external factors, the fair value of stock-based compensation using the factors associated with the Black-Scholes calculations, estimation of the amount of recoverable uranium included in the in-process inventory, estimation of factors surrounding asset retirement obligations such as interest rates, discount rates and inflation rates, total cost and the time until the asset retirement commences and the offset of future income taxes through deferred tax assets. Actual results could differ from those estimates. Cash and cash equivalents Cash and cash equivalents consistsconsist of cash balances and highly liquid investments with original maturities of three months or less that are considered to be cash equivalents.less. Cash equivalents are held for the purpose of meeting short-term cash commitments rather than for investment or other purposes. Restricted cash is excluded from cash and cash equivalents and is included in other long-term assetsassets. Restricted cash Cash which is restricted contractually or whichthat secures various instruments includingrelated to surety bonds, and letters of credit securingwhich secure reclamation obligations, and a state lease is shown as restricted cash. Inventory In-process inventory represents uranium that has been extracted from the wellfield and captured in the processing plant and is currently being transformed into a saleable product. Plant inventory is U3O8 that is contained in yellowcake, which has been dried and packaged in drums, but not yet shipped to the conversion facility. The amount of U3O8 in the plant inventory is determined by weighing and assaying the amount of U3O8 packaged into drums at the plant. Conversion facility inventory is U3O8 that has been shipped to the conversion facility. The amount of U3O8 in the conversion facility inventory includes the amount of U3O8 contained in drums shipped to the conversion facility plus or minus any final weighing and assay adjustments per the terms of theour uranium supplier’s agreement with the conversion facility. The Company’s inventories are measured at the lower of cost or net realizable value and reflect the U3O8 content in various stages of the production and sales process including in-process inventory, plant inventory and conversion facility inventory. Operating supplies are expensed when purchased. Mineral properties Acquisition costs of mineral properties are capitalized. When production is attained, amortization is calculated on a straight-line basis. The original estimated life for the Lost Creek projectProject was 10 years which is being used to amortize the mineral property acquisition costs.
Ur-Energy Inc. Notes to Consolidated Financial Statements | December 31, 2020 |
(expressed in thousands of U.S. dollars unless otherwise indicated) If properties are abandoned or sold, they are written off. If properties are considered to be impaired in value, the costs of the properties are written down to their estimated fair value at that time. Table of Contents
Ur-Energy Inc.
Notes to Consolidated Financial Statements
December 31, 2017
(expressed in thousands of U.S. dollars unless otherwise indicated)
Exploration, evaluation, and development costs Exploration and evaluation expensescosts consist of labor, annual lease and claim maintenance fees, and the associated costs of the exploration, geology departmentevaluation, and regulatory departments as well as exploration costs including drilling and analysis on properties whichthat have not reached the permitting or operations stage. Development expense relates to the Company’s Lost Creek, LC East and Shirley Basin projects, which are more advanced in terms of permitting and preliminary economic assessments.assessment work. Development expenses include all costs associated with exploring, delineating, and permitting, within those projects, the costs associated with the construction and development of permitted mine units including wells, pumps, piping, header houses, roads, and other infrastructure related to the preparation of a mine unit to begin extraction operations as well as the cost of drilling and completing disposal wells. Capital assets Property, plant, and equipment assets, including machinery, processing equipment, enclosures, and vehicles are recorded at cost including acquisition, installation costs, and expenditures that extend the life of such assets, are recorded at cost including acquisition and installation costs.assets. The enclosure costs include both the building housingenclosure and the processing equipment necessary for the extraction of uranium from impregnated water pumped in from the wellfield to the packaging of uranium yellowcake for delivery into sales. These enclosure costs are combined as the equipment and related installation associated with the equipment is an integral part of the structure itself.The costs of self-constructed assets include direct construction costs, direct overhead, and allocated interest during the construction phase. Depreciation is calculated using a declining balance method for most assets, with the exception ofexcept the plant enclosure and related equipment. Depreciation onof the plant enclosure and related equipment is calculated on a straight-line basis. Estimated lives for depreciation purposes range from three years for computer equipment and software to 20 years for the plant enclosure and the name plate life of the related equipment. Impairment of long-lived assets The Company assesses the possibility of impairment in the net carrying value of its long-lived assets when events or circumstances indicate that the carrying amounts of the asset or asset group may not be recoverable. When potential impairment is indicated, management calculates the estimated undiscounted future net cash flows relating to the asset or asset group using estimated future prices, recoverable resources, and operating, capital, and reclamation costs. When the carrying value of an asset exceeds the related undiscounted cash flows, the asset is written down to its estimated fair value, which is determined using discounted future net cash flows, or other measures of fair value. Ur-Energy Inc. Notes to Consolidated Financial Statements | December 31, 2020 |
(expressed in thousands of U.S. dollars unless otherwise indicated) Right of Use Assets and Liabilities Right of use assets include office and office equipment leases. We recognize an asset and corresponding liability, which are included in non-current assets and other liabilities in the consolidated balance sheet, based on the present value of the remaining minimum rental payments of the leases. The discount rates used are based on either the Company’s borrowing rate or the imputed interest rate based on the price of the equipment and the lease terms. Debt Long-Term Debt is carried at amortized cost. Debt issuance costs, debt premiums and discounts and annual fees are included in the long-term debt balance and amortized using the effective interest rate over the contractual terms of the Long-Term Debt. Asset retirement obligations For mining properties, various federal and state mining laws and regulations require the Company to reclaim the surface areas and restore groundwater quality to the pre-existing quality or class of use after the completion of mining. The Company records the fair value of an asset retirement obligation as a liability in the period in which it incurs an obligation associated with the retirement of tangible long-lived assets that result from the acquisition, construction, development and/or normal use of the assets. Table of Contents
Ur-Energy Inc.
Notes to Consolidated Financial Statements
December 31, 2017
(expressed in thousands of U.S. dollars unless otherwise indicated)
Asset retirement obligations consist of estimated final well closures, plant closure and removal, and the associated reclamation and restoration costs to be incurred by the Company in the future. The estimated fair value of the asset retirement obligation is based on the current estimated reclamation cost escalated at an inflation rate and then discounted at a credit adjusted risk-free rate. This liability is recorded, and a corresponding asset is capitalized as part of the cost of the related asset. The asset andis amortized over its usefulremaining productive life. The liability accretes until the Company settles the obligation. Revenue recognition The recognition of revenueOur revenues are primarily derived from the sale of U3O8 is under either long-term (delivery in accordancetypically two to five years) or spot (immediate delivery) contracts with our customers. The contracts specify the guidelines outlinedquantity to be delivered, the price or specific calculation method of the price, payment terms, and the year(s) of the delivery. There may be some variability in ASC Section 605-10-25, Revenue Recognition. The Company delivers U3O8 to a conversion facility and receives credit forthe dates of the delivery quantity, measured in pounds, less a reserve for variances inor the quantity and quality ofto be delivered depending on the product delivered. Oncecontract, but those issues are addressed before the product is assayed, the credit is adjusted to the full amount calculated.delivery date. When a delivery is approved, the Company notifies the conversion facility with instructions for a title transfer to the customer. Revenue is recognized once a title transfer of the U3O8is confirmed by the conversion facility.
Occasionally,We also receive a small amount of revenue from disposal fees. We have contracts with our customers that specify the Company sellstype and volume of disposal material we accept. Monthly, we invoice those customers based on deliveries of material to the disposal site by the customer. Materials are measured and categorized at the time of delivery commitments to an independent trader. The proceeds are recorded as deferredand verified by the customer. We recognize the revenue untilat the trader or purchaser acknowledges the deliveries had been made, at which time the portionend of the sale relating to those deliveries is taken into sales revenue. The Company sold two delivery commitments to an independent tradermonth that the material was received.
Ur-Energy Inc. Notes to Consolidated Financial Statements | December 31, 2020 |
(expressed in 2016. The corresponding deliveries were made in 2016 and the income recognized in that year.thousands of U.S. dollars unless otherwise indicated) Stock-based compensation Stock-based compensation cost from the issuance of stock options and restricted share units (“RSUs”) is measured at the grant date based on the fair value of the award and is recognized over the related service period. Stock-based compensation cost iscosts are charged to construction,mine operations, exploration and evaluation, development, and general and administrative expense on the same basis as other compensation costs. Income taxes The Company accounts for income taxes under the asset and liability method which requires the recognition of deferred income tax assets and liabilities for the expected future tax consequences of temporary differences between the carrying amounts and tax bases of assets and liabilities. The Company provides a valuation allowance on deferred tax assets unless it is more likely than not that such assets will be realized. Earnings and loss per share calculations Diluted earnings per common share are calculated by including all options whichthat are in-the-money based on the average stock price for the period as well as RSUs which were outstanding at the end of the quarter.that are outstanding. The treasury stock method was applied to determine the dilutive number of options. Warrants are included only if the exercise price is less than the average stock price for the quarter. In periods of loss, the diluted loss per common share is equal to the basic loss per common share due to the anti-dilutive effect of all convertible securities. Table of Contents
Ur-Energy Inc.
Notes to Consolidated Financial Statements
December 31, 2017
(expressed in thousands of U.S. dollars unless otherwise indicated)
Classification of financial instruments The Company’s financial instruments consist of cash, short-term investments, accounts receivable, restricted cash, deposits, accounts payable and accrued liabilities, other liabilities, and notes payable. The Company has made the following classifications for these financial instruments: | · | | Cash, accounts receivable, restricted cash, and deposits are recorded at amortized cost. Interest income is recorded using the effective interest rate method and is included in income for the period. |
| · | | Accounts payable and accrued liabilities, and notes payable, are measured at amortized cost. |
| · | | Other liabilities, which relatedrelate to the derivative on the warrantwarrants issued in U.S. dollars, are adjusted to the market value using the Black-Sholes valuation method at the end of each reporting period. |
New accounting pronouncements which may affect future reporting
In May 2014, the FASB issued ASU 2014-09, “Revenue from Contracts with Customers (Topic 606).” The amendments in ASU 2014-09 affect any entity that either enters into contracts with customers to transfer goods or services or enters into contracts for the transfer of nonfinancial assets unless those contracts are within the scope of other standards (e.g., insurance contracts or lease contracts). This ASU will supersede the revenuerecognition requirements in Topic 605, RevenueRecognition, and most industry-specific guidance, and creates a Topic 606 Revenue from Contracts with Customers. The core principle of the guidance is that an entity should recognize revenue to depict the transfer of the promised goods or services to customers in an amount that reflects the consideration to which the entity expects to be entitled in exchange for those goods or services. The amendments are effective for annual reporting periods beginning after December 15, 2017, including interim periods within that reporting period. Early application is not permitted. We have reviewed our contracts as well as our procedures and do not anticipate any changes in the manner or timing with which we reflect our revenues.
In January 2016, the FASB issued ASU 2016-1, Recognition and Measurement of Financial Assets and Financial Liabilities (Topic 825). The amendments in this ASU supersede the guidance to classify equity securities with readily determinable fair values into different categories (that is, trading or available-for-sale) and require equity securities (including other ownership interests, such as partnerships, unincorporated joint ventures, and limited liability companies) to be measured at fair value with changes in the fair value recognized through net income. The amendments allow equity investments that do not have readily determinable fair values to be remeasured at fair value either upon the occurrence of an observable price change or upon identification of an impairment. The amendments also require enhanced disclosures about those investments. The amendments improve financial reporting by providing relevant information about an entity’s equity investments and reducing the number of items that are recognized in other comprehensive income. This guidance is effective for annual reporting beginning after December 15, 2017, including interim periods within the year of adoption, and calls for prospective application, with early application permitted. Accordingly, the standard is effective for us beginning in the first quarter of fiscal 2018. The adoption of this guidance is not expected to have a material impact on our consolidated financial statements.
Table of Contents
Ur-Energy Inc.
Notes to Consolidated Financial Statements
December 31, 2017
Ur-Energy Inc. Notes to Consolidated Financial Statements | December 31, 2020 |
(expressed in thousands of U.S. dollars unless otherwise indicated) In February 2016, the FASB issued ASU 2016-02, Leases (Topic 842), which requires lessees to recognize all leases, including operating leases, unless the lease is a short-term lease. ASU 2016-02 also requires additional disclosures regarding leasing arrangements. ASU 2016-02 is effective for interim periods and fiscal years beginning after December 15, 2018, and early application is permitted. Now, the only leases we hold are for equipment, office space in one location and a limited number of leases on select mineral properties. We do not anticipate the additional disclosures to reflect those leases will have an impact on our statement of financial position, as the total future lease payments are not material.
New accounting pronouncements which were implemented this year
In July 2015, the FASB issued ASU No. 2015-11,Inventory (Topic 330): Simplifying the Measurement of Inventory. ASU2015-11 requires that inventory within the scope of this ASU be measured at the lower of cost and net realizable value. Net realizable value is the estimated selling prices in the ordinary course of business, less reasonably predictable costs of completion, disposal, and transportation. The amendments apply to all inventory, measured using average cost which is how the Company measures inventory. For all entities, the guidance is effective for annual periods, and interim periods within those annual periods, beginning after December 15, 2016. This is consistent with our past policies and had no financial or reporting impact when implemented during the first quarter of 2017.
In March 2016, the FASB issued ASU No. 2016-09, Compensation-Stock Compensation - Improvements to Employee Share-Based Payment Accounting (Topic 718), which involves several aspects of the accounting for share-based payment transactions, including the income tax consequences, classification of awards as either equity or liabilities, and classification on the statement of cash flows. Under the new standard, income tax benefits and deficiencies are to be recognized as income tax expense or benefit in the income statement and the tax effects of exercised or vested awards should be treated as discrete items in the reporting period in which they occur. An entity should also recognize excess tax benefits regardless of whether the benefit reduces taxes payable in the current period. Excess tax benefits should be classified along with other income tax cash flows as an operating activity. Regarding forfeitures, the entity may make an entity-wide accounting policy election to either estimate the number of awards that are expected to vest or account for forfeitures when they occur. This ASU is effective for fiscal years beginning after December 15, 2016 including interim periods within that reporting period. We currently recognize no income tax expense or benefit due to significant income tax credits and net operating losses which are fully reserved under a valuation allowance. There was therefore no effect on our accounting or reporting at the time of implementation earlier this year. We have made the election to continue to recognize losses from forfeitures at inception rather than when they vest or occur.
In November 2016, the FASB issued ASU No. 2016-18, Statement of Cash Flows – Restricted Cash a consensus of the FASB Emerging Task Force (Topic 230), which addresses the presentation of restricted cash in the statement of cash flows. Under the new standard, restricted cash will be presented with cash and cash equivalents in the statement of cash flows instead of being reflected as non-cash investing or financing activities. A reconciliation of the make-up of the ending cash, cash equivalent and restricted cash balance will be required for entities who reflect restricted cash as separate items on the statement of financial position. In addition, a description of the restrictions on the cash will be required. This ASU is effective for fiscal years beginning after December 15, 2017 including interim periods within that reporting period, however early adoption is permitted. We elected to adopt this standard as of the first quarter of 2017. Accordingly, the cash balances
Table of Contents
Ur-Energy Inc.
Notes to Consolidated Financial Statements
December 31, 2017
(expressed in thousands of U.S. dollars unless otherwise indicated)
reflected in the Statement of Cash Flows have been increased by $7.8 million for the year ended December 31, 2017 and $7.7 million for the years ended December 31, 2016 and 2015. In addition, we have added note 15 – Supplemental Information for the Statement of Cash Flows which reconciles the cash balances shown on the Statement of Cash Flows with the appropriate balances on the Balance Sheet.
4.Cash and cash equivalents
4. | Cash and cash equivalents |
The Company’s cash and cash equivalents consists of the following: Cash and cash equivalent | | | December 31, 2020 | | | December 31, 2019 | | | | | | | | | | | | As at | | | December 31, 2017 | | December 31, 2016 | | | $ | | $ | | Cash on deposit at banks | 1,667 | | 580 | | Cash on deposit | | | 852 | | 1,406 | | Money market funds | 2,212 | | 972 | | | 3,416 | | | | 5,997 | | | | | | | | 4,268 | | | | 7,403 | | | 3,879 | | 1,552 | |
5.Inventory
The Company’s inventory consists of the following: Inventory by Type | | | December 31, 2020 | | | December 31, 2019 | | | | | | | | | | | | As at | | | December 31, 2017 | | December 31, 2016 | | | $ | | $ | | In-process inventory | 315 | | 897 | | Plant inventory | 369 | | 461 | | 463 | | 0 | | Conversion facility inventory | 3,831 | | 2,751 | | | 7,351 | | | | 7,426 | | | | | | | | 7,814 | | | | 7,426 | | | 4,515 | | 4,109 | | | | | | Inventory by Duration | | | December 31, 2020 | | December 31, 2019 | | | | | | | | | Non-current portion of inventory | | | | 7,814 | | | | 7,426 | | | | | | 7,814 | | | | 7,426 | |
AsUsing lower of cost or net realizable value (“NRV”) calculations, the Company reduced the inventory valuation by $7,802 in 2020 and $10,263 in 2019.
The Company’s restricted cash consists of the following: Restricted Cash | | December 31, 2020 | | | December 31, 2019 | | | | | | | | | Cash pledged for reclamation | | | 7,859 | | | | 7,812 | | | | | 7,859 | | | | 7,812 | |
The Company’s restricted cash consists of money market accounts and short-term government bonds. The bonding requirements for reclamation obligations on various properties have been reviewed and approved by the Wyoming Department of Environmental Quality (“WDEQ”), the Wyoming Uranium Recovery Program (“URP”), and the Bureau of Land Management (“BLM”) as applicable. The restricted cash is pledged as collateral against performance surety bonds, which secure the estimated costs of reclamation related to the properties. Surety bonds providing $27.8 million and $29.9 million of coverage towards reclamation obligations were collateralized by the restricted cash as of December 31, 2017, inventory was carried at net realizable value. The cost of inventory is recognized as an expense when the corresponding sale is made2020 and the costs are included in Cost of Sales. Adjustments to inventory to reflect the net realizable value are also included in Cost of Sales. For the year 2017, there was a write down of $2.6 million.December 31, 2019, respectively. Table of Contents
Ur-Energy Inc.
Notes to Consolidated Financial Statements
December 31, 2017
Ur-Energy Inc. Notes to Consolidated Financial Statements | December 31, 2020 |
(expressed in thousands of U.S. dollars unless otherwise indicated) 6.Restricted Cash
The Company’s restricted cash consists of the following:
| | | | | | | | | As at | | December 31, 2017 | | December 31, 2016 | | $ | | $ | | | | | Money market account | 7,458 | | 7,457 | Certificates of deposit | 100 | | 100 | | | | | | 7,558 | | 7,557 |
7. | (a)
Mineral Properties | | The bonding requirements for reclamation obligations on various properties have been agreed to by the Wyoming Department of Environmental Quality, United States Department of the Interior and United States Nuclear Regulatory Commission. The restricted money market accounts are pledged as collateral against performance surety bonds which are used to secure the potential costs of reclamation related to those properties. Surety bonds providing $27,081 of coverage towards specific reclamation obligations are collateralized by $7,444 of the restricted cash at December 31, 2017.
|
Table of Contents
Ur-Energy Inc.
Notes to Consolidated Financial Statements
December 31, 2017
(expressed in thousands of U.S. dollars unless otherwise indicated)
7. Mineral Properties
The Company’s mineral properties consist of the following: | | Lost Creek | | | Pathfinder | | | Other U.S. | | | | | Mineral Properties | | Property | | | Mines | | | Properties | | | Total | | | | | | | | | | | | | | | December 31, 2017 | | | 11,810 | | | | 19,701 | | | | 13,166 | | | | 44,677 | | | | | | | | | | | | | | | | | | | Acquisition costs | | | 0 | | | | 0 | | | | 31 | | | | 31 | | Change in estimated reclamation costs | | | 2,577 | | | | 263 | | | | 0 | | | | 2,840 | | Depletion and amortization | | | (1,743 | ) | | | 0 | | | | 0 | | | | (1,743 | ) | December 31, 2018 | | | 12,644 | | | | 19,964 | | | | 13,197 | | | | 45,805 | | | | | | | | | | | | | | | | | | | Acquisition costs | | | 0 | | | | 0 | | | | 8 | | | | 8 | | Change in estimated reclamation costs | | | 125 | | | | (114 | ) | | | 0 | | | | 11 | | Property write-offs | | | 16 | | | | 0 | | | | (27 | ) | | | (11 | ) | Depletion and amortization | | | (2,601 | ) | | | 0 | | | | 0 | | | | (2,601 | ) | December 31, 2019 | | | 10,184 | | | | 19,850 | | | | 13,178 | | | | 43,212 | | | | | | | | | | | | | | | | | | | Change in estimated reclamation costs | | | (1,463 | ) | | | (120 | ) | | | 0 | | | | 1,583 | ) | Depletion and amortization | | | (2,445 | ) | | | 0 | | | | 0 | | | | (2,445 | ) | December 31, 2020 | | | 6,276 | | | | 19,730 | | | | 13,178 | | | | 39,184 | |
| | | | | | | | | Lost Creek | | Pathfinder | | Other U.S. | | | | Property | | Mines | | Properties | | Total | | $ | | $ | | $ | | $ | Balance, December 31, 2015 | 16,662 | | 20,738 | | 13,210 | | 50,610 | | | | | | | | | Change in estimated reclamation costs (note 12) | 338 | | (872) | | - | | (534) | Property write-offs | - | | - | | (62) | | (62) | Amortization | (2,985) | | - | | - | | (2,985) | | | | | | | | | Balance, December 31, 2016 | 14,015 | | 19,866 | | 13,148 | | 47,029 | | | | | | | | | Acquisition costs | - | | - | | 18 | | 18 | Change in estimated reclamation costs (note 12) | 613 | | (165) | | - | | 448 | Amortization | (2,818) | | - | | - | | (2,818) | | | | | | | | | Balance, December 31, 2017 | 11,810 | | 19,701 | | 13,166 | | 44,677 |
United States United States
Lost Creek Property The Company acquired certain Wyoming properties in 2005 when Ur-Energy USA Inc. entered into the Membership Interest Purchase Agreement (“MIPA”) with New Frontiers Uranium, LLC in 2005. Under the terms of the MIPA, the Company purchased 100% of NFU Wyoming, LLC. Assets acquired in this transaction include the Lost Creek Project, other Wyoming properties and development databases. NFU Wyoming, LLC was acquired for aggregate consideration of $20 million plus interest. Since 2005, the Company has increased its holdings adjacent to the initial Lost Creek acquisition through staking additional claims and making additional property purchases and leases. There is a royalty on each of the State of Wyoming sections under lease at the Lost Creek, LC West and EN Projects, as required by law. We are not recovering U3O8 within the State section under lease at Lost Creek and are therefore not subject to royalty payments currently. Other royalties exist on certain mining claims at the LC South, LC East and EN Projects. There are no royalties on the mining claims in the Lost Creek, LC North or LC West Projects. | | 82 | In September 2013, after the Company commenced mineral extraction and production at the Lost Creek Project, it began amortizing the related mineral properties on a straight-line basis.
| | Table of Contents |
Table of Contents
Ur-Energy Inc.
Notes to Consolidated Financial Statements
December 31, 2017
Ur-Energy Inc. Notes to Consolidated Financial Statements | December 31, 2020 |
(expressed in thousands of U.S. dollars unless otherwise indicated) Pathfinder Mines Corporation The Company acquired additional Wyoming properties when Ur-Energy USA Inc. closed a Share Purchase Agreement (“SPA”) with an AREVA Mining affiliate in December 2013. Under the terms of the SPA, the Company purchased Pathfinder Mines Corporation (“Pathfinder”) to acquire additional mineral properties.. Assets acquired in this transaction include the Shirley Basin mine, portions of the Lucky Mc mine, machinery and equipment, vehicles, office equipment, and development databases. Pathfinder was acquired for aggregate consideration of $6.7 million, a 5% production royalty under certain circumstances and the assumption of $5.7 million in estimated asset reclamation obligations. The purchase price allocation attributed $5.7 million to asset retirement obligations, $3.3 million to deferred tax liabilities, $15.3 million to mineraland other consideration. Other U.S. properties and the balance to the remaining assets and liabilities. The royalty expired on June 30, 2016. Other U.S. properties The other U.S. properties include the acquisition costcosts of several potentialprospective mineralized properties, includingwhich the Lost Soldier Project. The Company continues to maintain those properties through claim payments, lease payments, insurance, and other holding costs in anticipation of future exploration efforts.
In June 2016,Impairment testing
Long-lived assets are reviewed for impairment whenever events or changes in circumstances indicate the Company decidedcarrying amount of an asset may not be recoverable. Management applies judgement to abandon its claimsassess mineral properties and capital assets for impairment indicators that could give rise to the requirement to conduct a formal impairment test. Circumstances that could trigger a review include, but are not limited to: significant decreases in the Hauber Projectmarket price of the asset; significant adverse changes in the business climate or legal factors; significant changes in expected capital, operating, or reclamation costs; current period cash flow or operating losses combined with a history of losses or a forecast of continuing losses associated with the use of the asset; and wrote off $62 thousand beingcurrent expectation that the asset will more likely than not be sold or disposed of significantly before the end of its estimated useful life. Recoverability of these assets is measured by comparison of the carrying valueamounts to the future undiscounted net cash flows expected to be generated by the assets. An impairment loss is recognized when the carrying amount is not recoverable and exceeds fair value. Management did not identify impairment indicators that would require a formal impairment test. Lost Creek has been the Company’s sole source for the uranium concentrates sold to generate sales revenues since 2013. The economic viability of the investment in that project. Impairment testing
The Company reviewsCompany’s mining activities, including the impairment indicators outlined in US GAAP guidance. In 2017, the sole indication of possible impairment was the continuing weakness in industry-wide reported sales prices despite a slight increase in prices for the year. While this price has no immediate effect on the Company since it has sales contracts until 2021, a cash flow analyses for eachexpected duration and profitability of Lost Creek and of any future ISR mines, such as Shirley Basin, was performed. The mine life used was consistent with that reportedhave many risks and uncertainties. These include, but are not limited to: (i) a significant, prolonged decrease in the respective NI 43-101 Preliminary Economic Assessment for each property. Cash flows were calculated using a salesmarket price of $31 per pounduranium; (ii) difficulty in marketing and/or selling uranium concentrates; (iii) significantly higher than expected capital costs to construct the mine and/or processing plant; (iv) significantly higher than expected extraction costs; (v) significantly lower than expected uranium extraction; (vi) significant delays, reductions or stoppages of uranium extraction activities; and (vii) the introduction of significantly more stringent regulatory laws and regulations. Our mining activities may change because of any one or more of these risks and uncertainties and there is no assurance that any mineral deposit from which was the long-term quoted pricewe extract uranium or other minerals from will result in industry periodicals as of December 31, 2017. Based on these undiscounted cash flow models, the assets will be recovered and no impairments were indicated for any of the respective properties. profitable mining activities.
| | 83 | For other properties which have reported mineral resources supported by NI 43-101 Technical Reports, we applied the estimated market pricing to the mineral resource estimates as well as realization percentages which were taken from a previous valuation completed by a third party with respect to the Lost Creek Project in conjunction with obtaining our Wyoming bond loan.
| | Table of Contents |
Our remaining properties, which have no estimated mineral resource, continue to be carried at their acquisition costs.
The Company’s accounting policy is to expense development costs including, but not limited to, production wells, header houses, piping and power as we have no proven and probable reserves.
Table of Contents
Ur-Energy Inc.
Notes to Consolidated Financial Statements
December 31, 2017
Ur-Energy Inc. Notes to Consolidated Financial Statements | December 31, 2020 |
(expressed in thousands of U.S. dollars unless otherwise indicated) 8.Capital Assets
The Company’s capital assets consist of the following: | | | | | | | | | | | | | December 31, 2020 | | December 31, 2019 | | | As of | | As of | | | | Accumulated | | Net Book | | | | Accumulated | | Net Book | | | December 31, 2017 | | December 31, 2016 | | | | | Accumulated | | Net Book | | | | Accumulated | | Net Book | | | Cost | | Depreciation | | Value | | Cost | | Depreciation | | Value | | | $ | | $ | | $ | | $ | | $ | | $ | | Capital Assets | | | Cost | | | Depreciation | | | Value | | | Cost | | | Depreciation | | | Value | | | | | | | | | | | | | | | | | | | | | | | | | | | Rolling stock | 3,388 | | 3,184 | | 204 | | 3,251 | | 2,966 | | 285 | | 3,450 | | (3,369 | ) | | 81 | | 3,452 | | (3,311 | ) | | 141 | | Enclosures | 32,991 | | 6,880 | | 26,111 | | 32,991 | | 5,229 | | 27,762 | | 33,008 | | (11,834 | ) | | 21,174 | | 33,008 | | (10,181 | ) | | 22,827 | | Machinery and equipment | 1,237 | | 663 | | 574 | | 1,262 | | 599 | | 663 | | 1,446 | | (885 | ) | | 561 | | 1,426 | | (808 | ) | | 618 | | Furniture, fixtures and leasehold improvements | 119 | | 104 | | 15 | | 119 | | 98 | | 21 | | Furniture and fixtures | | | 119 | | (119 | ) | | 0 | | 119 | | (115 | ) | | 4 | | Information technology | 1,120 | | 1,063 | | 57 | | 1,153 | | 1,036 | | 117 | | 1,123 | | (1,098 | ) | | 25 | | 1,100 | | (1,072 | ) | | 28 | | Right of use assets | | | | 165 | | | | (115 | ) | | | 50 | | | | 83 | | | | (71 | ) | | | 12 | | | | | | | | | | | | | | | | 39,311 | | | | (17,420 | ) | | | 21,891 | | | | 39,188 | | | | (15,558 | ) | | | 23,630 | | | 38,855 | | 11,894 | | 26,961 | | 38,776 | | 9,928 | | 28,848 | |
Total depreciation expense was $3.5 million, $3.8 million and $5.1 million for the years ended December 31, 2017, 2016 and 2015, respectively.
9.Accounts Payable and Accrued Liabilities
9. | Accounts Payable and Accrued Liabilities |
Accounts payable and accrued liabilities consist of the following: | | | | | | | | | As at | | December 31, 2017 | | December 31, 2016 | | $ | | $ | Accounts payable | 840 | | 725 | Payroll and other taxes | 1,224 | | 1,251 | Severance and ad valorem tax payable | 975 | | 1,649 | | | | | | 3,039 | | 3,625 |
Accounts Payable and Accrued Liabilities | | December 31, 2020 | | | December 31, 2019 | | | | | | | | | Accounts payable | | | 396 | | | | 523 | | Accrued payroll liabilities | | | 1,767 | | | | 1,393 | | Accrued severance, ad valorem, and other taxes payable | | | 157 | | | | 295 | | | | | 2,320 | | | | 2,211 | |
10.Notes Payable
On October 15, 2013, the Sweetwater County Commissioners approved the issuance of a $34.0$34.0 million Sweetwater County, State of Wyoming, Taxable Industrial Development Revenue Bond (Lost Creek Project), Series 2013 (the “Sweetwater IDR Bond”) to the State of Wyoming, acting by and through the Wyoming State Treasurer, as purchaser. On October 23, 2013, the Sweetwater IDR Bond was issued, and the proceeds were in turn loaned by Sweetwater County to Lost Creek ISR, LLC pursuant to a financing agreement dated October 23, 2013 (the “State Bond Loan”). The State Bond Loan calls for payments of interest at a fixed rate of 5.75% Table of Contents
Ur-Energy Inc.
Notes to Consolidated Financial Statements
December 31, 2017
(expressed in thousands of U.S. dollars unless otherwise indicated)
per annum on a quarterly basis commencing January 1, 2014. The principal is payablewas to be paid in 28 quarterly installments commencing January 1, 2015 and continuing through October 1, 2021. Deferred loan fees include legal fees, commissions, commitment fees and other costs associated with obtaining the various financings. Those fees amortizable within 12 months of December 31, 2017 are considered current.
The following table lists the current and long-term portion of the Company’s debt instrument at December 31, 2017 and December 31, 2016:
| | | | | As at | | December 31, 2017 | | December 31, 2016 | | $ | | $ | Current debt | | | | Sweetwater County Loan | 4,895 | | 4,623 | Less deferred financing costs | (121) | | (121) | | 4,774 | | 4,502 | | | | | Long term debt | | | | Sweetwater County Loan | 14,996 | | 19,891 | Less deferred financing costs | (334) | | (456) | | 14,662 | | 19,435 |
Schedule of payments on outstanding debt as of December 31, 2017:
| | | | | | | | | | | | Debt | Total | | 2018 | | 2019 | | 2020 | | 2021 | | Maturity | | $ | | $ | | $ | | $ | | $ | | | Sweetwater County Loan | | | | | | | | | | | | Principal | 19,891 | | 4,895 | | 5,183 | | 5,487 | | 4,326 | | 01-Oct-21 | Interest | 2,363 | | 1,039 | | 752 | | 447 | | 125 | | | | | | | | | | | | | | | Total | 22,254 | | 5,934 | | 5,935 | | 5,934 | | 4,451 | | |
11.Income Taxes2015.
On December 22, 2017,October 1, 2019, the U.S. government enacted comprehensive tax legislation commonly referredSweetwater County Commissioners and the State of Wyoming approved a six-quarter deferral of principal payments beginning October 1, 2019. On October 6, 2020, the State Bond Loan was again modified to asdefer principal payments for an additional six quarters. Quarterly principal payments are scheduled to resume on October 1, 2022 and the Tax Cut and Jobs Act (the “Tax Act”). The Tax Act makes broad and complex changes to the U.S. tax code that affects 2017. The Tax Act reduces the U.S. federal corporate tax rate from 35% to 21% for tax years beginning after December 31, 2017. In addition, the Tax Act makes certain changes to the depreciation rules and implements new limitslast payment will be due on the deductibility of certain executive compensation. The Company has evaluated these changes and has recorded a provisional decrease to net deferred tax assets of $16.5 million with a corresponding decrease to the related valuation allowance.October 1, 2024 (see also note 20). Table of Contents
Ur-Energy Inc.
Notes to Consolidated Financial Statements
December 31, 2017
Ur-Energy Inc. Notes to Consolidated Financial Statements | December 31, 2020 |
(expressed in thousands of U.S. dollars unless otherwise indicated) A reconciliationOn April 16, 2020, we obtained two SBA PPP loans (one for each of income taxesour subsidiaries with U.S. payroll obligations) through the Bank of Oklahoma Financial (“BOKF”). The program was a part of the CARES Act enacted by Congress March 27, 2020 in response to the COVID-19 (Coronavirus) pandemic. The combined loan amount was $0.9 million.
On June 5, 2020, the Paycheck Protection Program Flexibility Act of 2020 (the “Flexibility Act”) became law. The Flexibility Act changes key provisions of the PPP, including maturity of the loans, deferral of loan payments, and the forgiveness of the PPP loans, with revisions being retroactive to the date of the CARES Act. Under the program, as modified by the Flexibility Act and SBA and Treasury rulemakings, the repayment of our loans, including interest, may be forgiven based on eligible payroll, payroll-related, and other allowable costs incurred in a twenty-four-week period following the funding of the loans. To have the full amount of the loans forgiven, the following requirements must be met within that period, and be sufficiently documented in the application for forgiveness: | (1) | Spend not less than 60% of loan proceeds on eligible payroll costs. | | (2) | Spend the remaining loan proceeds on: |
| a. | additional eligible payroll costs above 60%; | | b. | payments of interest on mortgage obligations incurred before February 15, 2020; | | c. | rent payments on leases dated before February 15, 2020; and/or | | d. | utility payments under service agreements dated before February 15, 2020. |
| (3) | Maintain employee compensation levels (subject to specific program requirements). |
For any portion of the loans that are not forgiven, the program provides for an initial deferral of payments based upon the timing of a borrower’s application for forgiveness and SBA’s action on the application up to a maximum of ten months after the use and forgiveness covered period ends (July 30, 2021). Any remaining amount owing on the loans has a two-year maturity (April 16, 2022), unless renegotiated with the lender for up to a five-year term, with an interest rate of one percent per annum. We anticipate the loans will meet the requirements for forgiveness under this program. In December 2020, we applied for loan forgiveness, but we have not yet received loan forgiveness and therefore continue to treat the PPP loans as debt. Ur-Energy Inc. Notes to Consolidated Financial Statements | December 31, 2020 |
(expressed in thousands of U.S. dollars unless otherwise indicated) The following table summarizes the Company’s current and long-term debts. Current and Long-term Debt | | December 31, 2020 | | | December 31, 2019 | | | | | | | | | Current | | | | | | | Small Business Administration PPP Loans | | | 502 | | | | 0 | | State Bond Loan | | | 0 | | | | 0 | | Deferred financing costs | | | (43 | ) | | | 0 | | | | | 459 | | | | - | | | | | | | | | | | Long-term | | | | | | | | | Small Business Administration PPP Loans | | | 398 | | | | 0 | | State Bond Loan | | | 12,441 | | | | 12,441 | | Deferred financing costs | | | (119 | ) | | | (226 | ) | | | | 12,720 | | | | 12,215 | |
The schedule of remaining payments on outstanding debt as of December 31, 2020 is presented below. Remaining Payments | | Total | | | 2021 | | | 2022 | | | 2023 | | | 2024 | | | Final payment | | | | | | | | | | | | | | | | | | | | | SBA PPP Loans | | | | | | | | | | | | | | | | | | | Principal | | | 900 | | | | 497 | | | | 403 | | | | 0 | | | | 0 | | | Apr-2022 | | Interest | | | 15 | | | | 9 | | | | 6 | | | | 0 | | | | 0 | | | | | | | | | | | | | | | | | | | | | | | | | | | | | State Bond Loan | | | | | | | | | | | | | | | | | | | | | | | | Principal | | | 12,441 | | | | 0 | | | | 2,628 | | | | 5,487 | | | | 4,326 | | | Oct-2024 | | Interest | | | 1,984 | | | | 715 | | | | 697 | | | | 447 | | | | 125 | | | | | | | | | | | | | | | | | | | | | | | | | | | | | Total | | | 15,340 | | | | 1,221 | | | | 3,734 | | | | 5,934 | | | | 4,451 | | | | |
11. | Asset Retirement Obligations |
Asset retirement obligations ("ARO") relate to the Lost Creek mine and Pathfinder projects and are equal to the current estimated reclamation cost escalated at an inflation rate and then discounted at a credit adjusted risk-free rates ranging from 0.33% to 7.25%. Current estimated reclamation costs include costs of closure, reclamation, demolition and stabilization of the statutory Canadian income tax ratewell fields, processing plants, infrastructure, aquifer restoration, waste dumps, and ongoing post-closure environmental monitoring and maintenance costs. The schedule of payments required to net income taxessettle the future reclamation extends through 2033. Ur-Energy Inc. Notes to Consolidated Financial Statements | December 31, 2020 |
(expressed in thousands of U.S. dollars unless otherwise indicated) The present value of the estimated future closure estimate is presented in the following table. Asset Retirement Obligations | | Total | | | | | | December 31, 2017 | | | 27,036 | | | | | | | Change in estimated reclamation costs | | | 2,840 | | Accretion expense | | | 508 | | | | | | | December 31, 2018 | | | 30,384 | | | | | | | Change in estimated reclamation costs | | | 11 | | Accretion expense | | | 577 | | | | | | | December 31, 2019 | | | 30,972 | | | | | | | Change in estimated reclamation costs | | | (1,583 | ) | Accretion expense | | | 576 | | | | | | | December 31, 2020 | | | 29,965 | |
The restricted cash discussed in note 6 relates to the surety bonds provided to the governmental agencies for these obligations. In September 2018, we issued 13,062,878 warrants as part of a public offering with two warrants redeemable for one Common Share of the Company’s stock at a price of $1.00 per full share. The warrants expire in September 2021. Because the warrants expire in September 2021, they are included in the current portion of warrant liability on the balance sheet. In August 2020, we issued 9,000,000 warrants as part of a registered direct offering with two warrants redeemable for one Common Share of the Company’s stock at a price of $0.75 per full share. The warrants expire in August 2022. Because both warrants are priced in U.S. dollars and the functional currency of Ur-Energy Inc. is Canadian dollars, a derivative financial liability was created. The liability created, and adjusted quarterly, is calculated using the Black-Scholes technique described below as there is no active market for the warrants. Any gain or loss from the adjustment of the liability is reflected in net income for the period. Ur-Energy Inc. Notes to Consolidated Financial Statements | December 31, 2020 |
(expressed in thousands of U.S. dollars unless otherwise indicated) The present value of the warrant liabilities is presented in the following table. | | Sep-2018 | | | Aug-2020 | | | | | Warrant Liabilities | | Warrants | | | Warrants | | | Total | | | | | | | | | | | | December 31, 2017 | | | 0 | | | | 0 | | | | 0 | | | | | | | | | | | | | | | Warrants issued | | | 1,709 | | | | 0 | | | | 1,709 | | Mark to market revaluation loss (gain) | | | (581 | ) | | | 0 | | | | (581 | ) | Effects for foreign exchange rate changes | | | (78 | ) | | | 0 | | | | (78 | ) | | | | | | | | | | | | | | December 31, 2018 | | | 1,050 | | | | 0 | | | | 1,050 | | | | | | | | | | | | | | | Warrants issued | | | 0 | | | | 0 | | | | 0 | | Mark to market revaluation loss (gain) | | | (524 | ) | | | 0 | | | | (524 | ) | Effects for foreign exchange rate changes | | | 49 | | | | 0 | | | | 49 | | | | | | | | | | | | | | | December 31, 2019 | | | 575 | | | | 0 | | | | 575 | | | | | | | | | | | | | | | Warrants issued | | | 0 | | | | 860 | | | | 860 | | Mark to market revaluation loss (gain) | | | 161 | | | | 519 | | | | 680 | | Effects for foreign exchange rate changes | | | (7 | ) | | | 36 | | | | 29 | | | | | | | | | | | | | | | December 31, 2020 | | | 729 | | | | 1,415 | | | | 2,144 | |
The fair value of the warrant liabilities on December 31, 2020 was determined using the Black-Scholes model with the following assumptions: | | Sep-2018 | | | Aug-2020 | | Black-Scholes Assumptions at December 31, 2020 | | Warrants | | | Warrants | | | | | | | | | Expected forfeiture rate | | | 0.0 | % | | | 0.0 | % | Expected life (years) | | | 0.7 | | | | 1.6 | | Expected volatility | | | 67.7 | % | | | 76.7 | % | Risk free rate | | | 0.2 | % | | | 0.2 | % | Expected dividend rate | | | 0.0 | % | | | 0.0 | % | Exercise price | | $ | 1.00 | | | $ | 0.75 | | Market price | | $ | 0.80 | | | $ | 0.80 | |
Ur-Energy Inc. Notes to Consolidated Financial Statements | December 31, 2020 |
(expressed in thousands of U.S. dollars unless otherwise indicated) 13. | Shareholders’ Equity and Capital Stock |
Common shares The Company’s share capital consists of an unlimited amount of Class A preferred shares authorized, without par value, of which no shares are issued and outstanding; and an unlimited amount of common shares authorized, without par value, of which 170,253,752 shares and 160,478,059 shares were issued and outstanding as of December 31, 2020 and December 31, 2019, respectively. In September 2018, we completed a US$10 million public offering of Common Shares, which included the offering of 12,195,122 Common Shares and accompanying statementswarrants to purchase up to 6,097,561 Common Shares, at a combined public offering price of operationsUS$0.82 per Common Share and accompanying warrant. We also granted the underwriters a 30-day option to purchase up to 1,829,268 additional Common Shares and warrants to purchase up to an aggregate of 914,634 Common Shares on the same terms. The underwriters exercised a portion of their option to purchase additional securities at closing, acquiring 867,756 additional warrants to purchase an aggregate of 433,878 Common Shares. Including the partial exercise of the option, the Company issued a total of 12,195,122 Common Shares and 13,062,878 warrants to purchase up to 6,531,439 Common Shares. During the year ended December 31, 2018, the Company exchanged 505,510 Common Shares for vested RSUs. In addition, 496,838 stock options were exercised for proceeds of $0.3 million. During the year ended December 31, 2019, the Company exchanged 425,038 Common Shares for vested RSUs. In addition, 323,618 stock options were exercised for proceeds of $0.2 million. During the year ended December 31, 2020, the Company exchanged 356,071 Common Shares for vested RSUs. In addition, 159,982 stock options were exercised for proceeds of $0.1 million. In August 2020, the Company closed a $4.68 million registered direct offering of 9,000,000 common shares and accompanying one-half common share warrants to purchase up to 4,500,000 common shares, at a combined public offering price of $0.52 per common share and accompanying warrant, with gross proceeds to the Company of $4.68 million. After fees and expenses of $0.4 million, net proceeds to the Company were $4.3 million. The common share warrants will expire two years from the date of issuance and will allow the holders to purchase our common shares at an exercise price of $0.75 per whole common share. Because the warrants are priced in US$ and the functional currency of Ur-Energy Inc. is Cdn$, this creates a derivative financial liability. The fair value of the liability will be recorded and adjusted quarterly using the Black-Scholes technique described herein as there is no active market for the warrants. Any gain or loss will be reflected in net income for the period. Ur-Energy Inc. Notes to Consolidated Financial Statements | December 31, 2020 |
(expressed in thousands of U.S. dollars unless otherwise indicated) Stock options In 2005, the Company’s Board of Directors approved the adoption of the Company's stock option plan (the “Option Plan”). The Option Plan was most recently approved by the shareholders on May 7, 2020. Eligible participants under the Option Plan include directors, officers, employees, and consultants of the Company. Under the terms of the Option Plan, grants of options will vest over a three-year period: 33.3% on the first anniversary, 33.3% on the second anniversary, and 33.4% on the third anniversary of the grant. The term of the options is five years. Activity with respect to stock options outstanding is summarized as follows: | | | | | | | Year ended December 31, | | 2017 | | 2016 | | 2015 | | $ | | $ | | $ | Income (loss) before income taxes | 76 | | (3,027) | | (4,110) | | | | | | | Statutory rate | 26.50% | | 26.50% | | 26.50% | Expected recovery of income tax | 20 | | (804) | | (1,089) | Effect of foreign tax rate differences | 355 | | (28) | | (212) | Non-deductible amounts | 91 | | 154 | | 57 | Effect of changes in enacted future rates from Tax Reform | 16,493 | | - | | - | Effect of changes in enacted future rates | (499) | | 66 | | 76 | Effect of change in foreign exchange rates | - | | - | | (155) | Effect of stock based compensation | 1,127 | | (149) | | - | Effect of prior year true-ups and other | (6) | | (317) | | - | Expiration of prior year NOLs | - | | 290 | | - | Change in valuation allowance | (17,581) | | 771 | | (1,992) | | - | | (17) | | (3,315) | Recovery of deferred income taxes | | | | | (3,345) | | - | | (17) | | 30 |
| | Outstanding | | | Weighted-average | | Stock Option Activity | | Options | | | exercise price | | | | # | | | $ | | December 31, 2017 | | | 9,459,401 | | | $ | 0.70 | | | | | | | | | | | Granted | | | 2,182,955 | | | | 0.70 | | Exercised | | | (496,838 | ) | | | 0.58 | | Forfeited | | | (275,085 | ) | | | 0.72 | | Expired | | | (1,138,821 | ) | | | 0.83 | | | | | | | | | | | December 31, 2018 | | | 9,731,612 | | | $ | 0.64 | | | | | | | | | | | Granted | | | 2,852,386 | | | | 0.61 | | Exercised | | | (323,618 | ) | | | 0.63 | | Forfeited | | | (395,851 | ) | | | 0.71 | | Expired | | | (787,946 | ) | | | 0.83 | | | | | | | | | | | December 31, 2019 | | | 11,076,583 | | | $ | 0.64 | | | | | | | | | | | Granted | | | 2,950,180 | | | | 0.48 | | Exercised | | | (159,982 | ) | | | 0.63 | | Forfeited | | | (534,425 | ) | | | 0.64 | | Expired | | | (1,421,932 | ) | | | 0.66 | | | | | | | | | | | December 31, 2020 | | | 11,910,424 | | | $ | 0.61 | |
The exercise price of a new grant is set at the closing price for the stock on the Toronto Stock Exchange (TSX) on the trading day immediately preceding the grant date so there is no intrinsic value as of the date of grant. Ur-Energy Inc. Notes to Consolidated Financial Statements | December 31, 2020 |
(expressed in thousands of U.S. dollars unless otherwise indicated) As of December 31, 2020, outstanding stock options were as follows: | | | Options outstanding | | | Options exercisable | | | | | | | | | | Weighted- | | | | | | | | | Weighted- | | | | | | | | | | | | | average | | | | | | | | | average | | | | | | | | | | | | | remaining | | | Aggregate | | | | | | remaining | | | Aggregate | | | | Exercise | | | Number | | | contractual | | | intrinsic | | | Number | | | contractual | | | intrinsic | | | | price | | | of options | | | life (years) | | | value | | | of options | | | life (years) | | | value | | | Expiry | $ | | | # | | | | | | $ | | | | | | | | | $ | | | | | 0.57 | | | | 2,238,988 | | | | 1.0 | | | | 514,967 | | | | 2,238,988 | | | | 1.0 | | | | 514,967 | | | 2021-12-16 | | 0.80 | | | | 300,000 | | | | 1.2 | | | | 0 | | | | 300,000 | | | | 1.2 | | | | 0 | | | 2022-03-02 | | 0.57 | | | | 200,000 | | | | 1.7 | | | | 46,000 | | | | 200,000 | | | | 1.7 | | | | 46,000 | | | 2022-09-07 | | 0.71 | | | | 1,668,089 | | | | 2.0 | | | | 150,128 | | | | 1,668,089 | | | | 2.0 | | | | 150,128 | | | 2022-12-15 | | 0.60 | | | | 200,000 | | | | 2.2 | | | | 40,000 | | | | 133,333 | | | | 2.2 | | | | 26,667 | | | 2023-03-30 | | 0.73 | | | | 929,269 | | | | 2.6 | | | | 65,049 | | | | 622,298 | | | | 2.6 | | | | 43,561 | | | 2023-08-20 | | 0.71 | | | | 777,037 | | | | 3.0 | | | | 69,933 | | | | 515,660 | | | | 3.0 | | | | 46,409 | | | 2023-12-14 | | 0.62 | | | | 2,646,861 | | | | 3.8 | | | | 476,435 | | | | 867,128 | | | | 3.8 | | | | 156,083 | | | 2024-11-05 | | 0.49 | | | | 2,950,180 | | | | 4.9 | | | | 914,556 | | | | - | | | | - | | | | 0 | | | 2025-11-13 | | | | | | | | | | | | | | | | | | | | | | | | | | | | | | | 0.61 | | | | 11,910,424 | | | | 3.0 | | | | 2,277,068 | | | | 6,545,496 | | | | 2.0 | | | | 983,815 | | | |
The aggregate intrinsic value of the options in the preceding table represents the total pre-tax intrinsic value for stock options, with an exercise price less than the Company’s TSX closing stock price of CAD$1.04 (approximately US$0.80) as of the last trading day in the year ended December 31, 2020, that would have been received by the option holders had they exercised their options on that date. There were 11,610,424 in-the-money stock options outstanding and 6,245,496 in-the-money stock options exercisable as of December 31, 2020. The fair value of the stock options on their respective grant dates was determined using the Black-Scholes model with the following assumptions: Stock Option Fair Value Assumptions | | 2020 | | | 2019 | | | 2018 | | | | | | | | | | | | Expected forfeiture rate | | | 6.1 | % | | | 6.2 | % | | 5.8% - 6.0% | | Expected life (years) | | | 3.9 | | | | 3.7 | | | 3.7 - 3.8 | | Expected volatility | | | 63.2 | % | | | 58.6 | % | | 54.6% - 55.0% | | Risk free rate | | | 0.4 | % | | | 1.6 | % | | 1.9% - 2.1% | | Expected dividend rate | | | 0.0 | % | | | 0.0 | % | | | 0.0 | % | Black-Scholes value (CAD$) | | $ | 0.30 | | | $ | 0.35 | | | $0.33 - $0.39 | |
Ur-Energy Inc. Notes to Consolidated Financial Statements | December 31, 2020 |
(expressed in thousands of U.S. dollars unless otherwise indicated) Restricted share units On June 24, 2010, the Company’s shareholders approved the adoption of the Company’s restricted share unit plan (the “RSU Plan”). The RSU Plan was approved most recently by our shareholders on May 2, 2019. Eligible participants under the RSU Plan include directors and employees of the Company. Granted RSUs are redeemed on the second anniversary of the grant. Upon an RSU vesting, the holder of the RSU will receive one Common Share, for no additional consideration, for each RSU held. Activity with respect to RSUs outstanding is summarized as follows: | | | | | Weighted average | | | | Outstanding | | | grant date | | Restricted Share Unit Activity | | RSUs | | | fair value | | | | | | | | | December 31, 2017 | | | 1,175,952 | | | $ | 0.65 | | | | | | | | | | | Granted | | | 470,756 | | | $ | 0.71 | | Released | | | (621,092 | ) | | $ | 0.63 | | Forfeited | | | (40,120 | ) | | $ | 0.57 | | | | | | | | | | | December 31, 2018 | | | 985,496 | | | $ | 0.67 | | | | | | | | | | | Granted | | | 713,106 | | | $ | 0.61 | | Released | | | (542,674 | ) | | $ | 0.68 | | | | | | | | | | | December 31, 2019 | | | 1,155,928 | | | $ | 0.65 | | | | | | | | | | | Granted | | | 737,553 | | | $ | 0.48 | | Released | | | (475,086 | ) | | $ | 0.70 | | Forfeited | | | (13,433 | ) | | $ | 0.61 | | | | | | | | | | | December 31, 2020 | | | 1,404,962 | | | $ | 0.54 | |
Ur-Energy Inc. Notes to Consolidated Financial Statements | December 31, 2020 |
(expressed in thousands of U.S. dollars unless otherwise indicated) As of December 31, 2020, outstanding RSUs were as follows: RSUs outstanding | | | | | Weighted- | | | | | | | | | | | average | | | | | | | | | | | remaining | | | Aggregate | | | | | Number | | | contractual | | | intrinsic | | | Redemption | | of RSUs | | | life (years) | | | value | | | Date | | # | | | | | | $ | | | | | | 667,409 | | | | 0.8 | | | | 533,927 | | | 2021-11-05 | | | 737,553 | | | | 1.9 | | | | 590,042 | | | 2022-11-13 | | | | | | | | | | | | | | | | | 1,404,962 | | | | 1.4 | | | | 1,123,969 | | | | |
The fair value of restricted share units on their respective grant dates was determined using the Black-Scholes model with the following assumptions: Restricted Share Unit Fair Value Assumptions | | 2020 | | | 2019 | | | 2018 | | | | | | | | | | | | Expected forfeiture rate | | | 4.2 | % | | | 4.8 | % | | 5.5% - 5.9% | | Grant date fair value (CAD$) | | $ | 0.63 | | | $ | 0.79 | | | $0.91 - $0.93 | |
Warrants In September 2018, the Company issued 13,062,878 warrants to purchase 6,531,439 of our Common Shares at $1.00 per full share. In August 2020, the Company issued 9,000,000 warrants to purchase 4,500,000 of our Common Shares at $0.75 per full share (see note 12). Ur-Energy Inc. Notes to Consolidated Financial Statements | December 31, 2020 |
(expressed in thousands of U.S. dollars unless otherwise indicated) Activity with respect to warrants outstanding is summarized as follows: | | | | | Number of | | | | | | | Outstanding | | | shares to be issued | | | Per share | | Warrant Activity | | warrants | | | upon exercise | | | exercise price | | | | | | | | | | | | December 31, 2017 | | | 5,844,567 | | | | 5,844,567 | | | | 0.97 | | | | | | | | | | | | | | | Issued | | | 13,062,878 | | | | 6,531,439 | | | | 1.00 | | Expired | | | (5,844,567 | ) | | | (5,844,567 | ) | | | 0.97 | | | | | | | | | | | | | | | December 31, 2018 | | | 13,062,878 | | | | 6,531,439 | | | | 1.00 | | | | | | | | | | | | | | | December 31, 2019 | | | 13,062,878 | | | | 6,531,439 | | | | 1.00 | | | | | | | | | | | | | | | Issued | | | 9,000,000 | | | | 4,500,000 | | | | 0.75 | | | | | | | | | | | | | | | December 31, 2020 | | | 22,062,878 | | | | 11,031,439 | | | | 0.90 | |
As of December 31, 2020, the outstanding warrants were as follows: | | | | | | Weighted- | | | | | | | | | | | | | | average | | | | | | | | | | | | | | remaining | | | Aggregate | | | | | Exercise | | | Number | | | contractual | | | Intrinsic | | | | | price | | | of warrants | | | life (years) | | | Value | | | Expiry | | $ | | | # | | | | | | $ | | | | | | 1.00 | | | | 13,062,878 | | | | 0.7 | | | | 0 | | | 2021-09-25 | | | 0.75 | | | | 9,000,000 | | | | 1.6 | | | | 225,000 | | | 2022-08-04 | | | | | | | | | | | | | | | | | | | | | 0.90 | | | | 22,062,878 | | | | 1.1 | | | | 225,000 | | | | |
Ur-Energy Inc. Notes to Consolidated Financial Statements | December 31, 2020 |
(expressed in thousands of U.S. dollars unless otherwise indicated) The fair value of the warrants on their respective grant dates was determined using the Black-Scholes model with the following assumptions: Warrant Fair Value Assumptions | | 2020 | | | 2019 | | | 2018 | | | | | | | | | | | | Expected forfeiture rate | | | 0.0 | % | | | - | | | | 0.0 | % | Expected life (years) | | | 2.0 | | | | - | | | | 3.0 | | Expected volatility | | | 71.2 | % | | | - | | | | 55.2 | % | Risk free rate | | | 0.2 | % | | | - | | | | 2.2 | % | Expected dividend rate | | | 0.0 | % | | | - | | | | 0.0 | % | Black-Scholes value (CAD$) | | $ | 0.26 | | | $ | 0.00 | | | $ | 0.34 | |
Share-based compensation expense Stock-based compensation expense was $1.0 million, $0.8 million, and $0.9 million for the years ended December 31, 2020, 2019, and 2018, respectively. The expenses are expected to be recognized over a weighted-average remaining life of 3.0 years and 1.4 years under the Option Plan and RSU Plan, respectively As of December 31, 2020, there was approximately $1.1 million unamortized stock-based compensation expense related to the Option Plan and $0.5 million related to the RSU Plan. The expenses are expected to be recognized over a weighted-average remaining life of 3.0 years and 1.4 years under the Option Plan and RSU Plan, respectively. Cash received from stock options exercised during the years ended December 31, 2020, 2019, and 2018 was $0.1 million, $0.2 million, and $0.3 million, respectively. Fair Value Calculations The Company estimates expected future volatility based on daily historical trading data of the Company’s common shares. The risk-free interest rates are determined by reference to Canadian Treasury Note constant maturities that approximate the expected life. The Company has never paid dividends and currently has no plans to do so. Share-based compensation expense is recognized net of estimated pre-vesting forfeitures, which results in expensing the awards that are ultimately expected to vest over the expected life. Forfeitures and expected lives were estimated based on actual historical experience. Ur-Energy Inc. Notes to Consolidated Financial Statements | December 31, 2020 |
(expressed in thousands of U.S. dollars unless otherwise indicated) Revenue is primarily derived from the sale of U3O8 to domestic utilities under contracts or spot sales. Revenue consists of: | | Year ended | | | | 2020 | | | 2019 | | Revenue Summary | | $ | | | % | | | $ | | | % | | | | | | | | | | | | | | | Sale of produced inventory | | | | | | | | | | | | | Company A | | | 0 | | | | 0.0 | % | | | 7,483 | | | | 23.2 | % | Company B | | | 0 | | | | 0.0 | % | | | 2,406 | | | | 7.5 | % | | | | 0 | | | | 0.0 | % | | | 9,889 | | | | 30.7 | % | | | | | | | | | | | | | | | | | | Sales of purchased inventory | | | | | | | | | | | | | | | | | Company B | | | 0 | | | | 0.0 | % | | | 3,525 | | | | 10.9 | % | Company C | | | 8,300 | | | | 99.8 | % | | | 7,990 | | | | 24.8 | % | Company D | | | 0 | | | | 0.0 | % | | | 10,848 | | | | 33.6 | % | | | | 8,300 | | | | 99.8 | % | | | 22,363 | | | | 69.3 | % | | | | | | | | | | | | | | | | | | Total sales | | | 8,300 | | | | 99.8 | % | | | 32,252 | | | | 100.0 | % | | | | | | | | | | | | | | | | | | Disposal fee income | | | 16 | | | | 0.2 | % | | | 3 | | | | 0.0 | % | | | | | | | | | | | | | | | | | | | | | 8,316 | | | | 100.0 | % | | | 32,255 | | | | 100.0 | % |
Cost of sales includes ad valorem and severance taxes related to the extraction of uranium, all costs of wellfield and plant operations including the related depreciation and amortization of capitalized assets, reclamation, and mineral property costs, plus product distribution costs. These costs are also used to value inventory. The resulting inventoried cost per pound is compared to the NRV of the product, which is based on the estimated sales price of the product, net of any necessary costs to finish the product. Any inventory value more than the NRV is charged to cost of sales. Ur-Energy Inc. Notes to Consolidated Financial Statements | December 31, 2020 |
(expressed in thousands of U.S. dollars unless otherwise indicated) Cost of sales consists of the following: | | Year ended | | | | December 31, | | Cost of Sales | | 2020 | | | 2019 | | | 2018 | | | | | | | | | | | | Cost of product sales | | | 5,166 | | | | 20,011 | | | | 11,885 | | Lower of cost or NRV adjustments | | | 7,802 | | | | 10,264 | | | | 318 | | | | | | | | | | | | | | | | | | 12,968 | | | | 30,275 | | | | 12,203 | |
Operating expenses include exploration and evaluation expense, development expense, General and Administration (“G&A”) expense, and mineral property write-offs. Exploration and evaluation expense consist of labor and the associated costs of the exploration and evaluation departments as well as land holding and exploration costs including drilling and analysis on properties which have not reached the permitting or operations stage. Development expense relates to properties that have reached the permitting or operations stage and include costs associated with exploring, delineating, and permitting a property. Once permitted development expense also includes the costs associated with the construction and development of the permitted property that are otherwise not eligible to be capitalized. G&A expense relates to the administration, finance, investor relations, land, and legal functions, and consists principally of personnel, facility, and support costs. Operating costs consist of the following: | | Year ended | | | | December 31, | | Operating Costs | | 2020 | | | 2019 | | | 2018 | | | | | | | | | | | | Exploration and evaluation | | | 1,816 | | | | 2,476 | | | | 2,431 | | Development | | | 1,097 | | | | 1,404 | | | | 1,654 | | General and administration | | | 5,200 | | | | 5,801 | | | | 5,393 | | Accretion | | | 576 | | | | 577 | | | | 508 | | | | | | | | | | | | | | | | | | 8,689 | | | | 10,258 | | | | 9,986 | |
Ur-Energy Inc. Notes to Consolidated Financial Statements | December 31, 2020 |
(expressed in thousands of U.S. dollars unless otherwise indicated) In June 2018, the Company monetized the present value from portions of agreements with a utility customer related to 165,000 pounds of U3O8 to be delivered in 2021. The Company received proceeds of $3.5 million when the transaction was executed. No comparable transactions occurred in 2019 or 2020. 18. | Supplemental Information for Statement of Cash Flows |
Cash and cash equivalents, and restricted cash per the Statement of Cash Flows consists of the following: Cash and Cash Equivalents, and Restricted Cash | | December 31, 2020 | | | December 31, 2019 | | | | | | | | | Cash and cash equivalents | | | 4,268 | | | | 7,403 | | Restricted cash | | | 7,859 | | | | 7,812 | | | | | | | | | | | | | | 12,127 | | | | 15,215 | |
Interest expense paid was $0.8 million, and $0.9 million for the years ended December 31, 2020 and 2019, respectively. Income (loss) before provision for income taxes consisted of the following: | | Year ended | | | | December 31, | | Income (Loss) before Income Tax Provision | | 2020 | | | 2019 | | | 2018 | | | | | | | | | | | | United States | | | (11,164 | ) | | | (6,080 | ) | | | 6,896 | | Canada | | | (3,561 | ) | | | (2,345 | ) | | | (2,333 | ) | | | | | | | | | | | | | | | | | 14,725 | ) | | | (8,425 | ) | | | 4,563 | |
There was no federal or state income tax provision (benefit) in the years presented above. Ur-Energy Inc. Notes to Consolidated Financial Statements | December 31, 2020 |
(expressed in thousands of U.S. dollars unless otherwise indicated) Deferred tax assets and liabilitiesincome taxes reflect the net tax effects of net operating losses, credit carryforwards and(a) temporary differences between the carrying amounts of assets and liabilities for financial reporting purposes and the amounts used for income tax purposes.purposes, and (b) operating losses and tax credit carryforwards. The componentstax effects of significant items comprising the Company’s deferred tax assets and liabilitiestaxes are as follows: | | | | | | | As at December 31, | | 2017 | | 2016 | | 2015 | | $ | | $ | | $ | Future income tax assets | | | | | | Deferred tax assets | 9,617 | | 15,344 | | 8,386 | Net operating loss carry forwards | 30,250 | | 41,634 | | 41,647 | Less: valuation allowance | (39,867) | | (56,978) | | (50,033) | Net future income tax assets | - | | - | | - |
| | As at | | | | December 31, | | Deferred Tax Assets | | 2020 | | | 2019 | | | | | | | | | Deffered tax assets | | | 11,184 | | | | 9,650 | | Net operating losses - non-current | | | 35,366 | | | | 30,883 | | Total deferred tax assets | | | 46,550 | | | | 40,533 | | | | | | | | | | | Valuation allowance | | | (46,550 | ) | | | (40,533 | ) | | | | | | | | | | Net deferred taxes | | | 0 | | | | 0 | |
Based uponASC 740 requires that the leveltax benefit of historicalnet operating losses, temporary differences and credit carryforwards be recorded as an asset to the extent that management assesses that realization is "more likely than not." Realization of the future tax benefits is dependent on the Company's ability to generate sufficient taxable loss,income within the carryforward period. Because of the Company's recent history of operating losses, management believes itthat recognition of the deferred tax assets arising from the above-mentioned future tax benefits is morecurrently not likely than not that the Company will not realize the benefits of these deductible differencesto be realized and, accordingly, has establishedprovided a fullvaluation allowance.
The valuation allowance increased by $6,017 during 2020 and $20,870 during 2019. Net operating losses and tax credit carryforwards as of December 31, 2017, 2016 and 2015. No deferred tax assets2020 are therefore recognized at this point. Table of Contents
Ur-Energy Inc.
Notes to Consolidated Financial Statements
December 31, 2017as follows:
(expressed in thousands of U.S. dollars unless otherwise indicated)
| | | | | | Income tax recovery (expense) | 2017 | | 2016 | | 2015 | | $ | | $ | | $ | Recovery of deferred tax liability stemming from Pathfinder acquisition | - | | - | | 3,345 | Current income tax recovery (expense) | - | | 17 | | (30) | | | | | | | | - | | 17 | | 3,315 |
In 2013, we acquired Pathfinder as a corporate entity. In terms for the acquisition, there were no net operating losses or other tax attributes that carried forward to the Company with the acquisition. In addition, the assets acquired had no tax basis within the corporation. The seller also did not make the Sec. 338(h)(10) election to allow us to push the purchase price down to the asset level for tax purposes. As a result, it was determined that the acquisition should not be treated as a business combination since Pathfinder was not a going concern. A tax of $3.3 million was calculated as a potential liability of the acquisition and was recorded as a deferred tax liability and an increase in basis. For accounting/reporting purposes, this value was added to the accounting basis in the assets acquired.
In early 2015, we completed and filed the Shirley Basin PEA based on drilling data purchased as a part of the acquisition combined with data gathered during the exploration / confirmation program undertaken in 2014. After filing the Shirley Basin PEA, we continued to do baseline and confirmation work at Shirley Basin and in late 2015 we submitted a permit application to the state of Wyoming to begin construction and operations at the project. Based on the filing of those permits, we anticipate that we will be in a position to commence construction of a plant facility and the related wellfields within several years. Once operations commence, the cost of the property will be amortized over the anticipated productive life of the property for accounting and reporting purposes. At that point, the asset now has an identifiable life and the associated DTL is available to offset the DTA recorded before the application of the valuation allowance. We therefore applied a portion of the valuation allowance to the DTL arising from the Pathfinder acquisition.
As of December 31, 2017, the Company had the following net operating loss carryforwards available:
| | | | | Expiration | | Income Tax Loss Carryforwards | | Amount | | | Years | | | | | | | | | Income tax loss carry forwardsNet operating losses, federal (Post December 31, 2017)
| | | 14,486 | | | No expirations | | Canadian (expiring 2011 - 2031)Net operating losses, federal (Pre January 1, 2018)
| | | 79,699 | | | 34,520,0232029 - 2035
| | United States (expiring 2017 - 2031)Net operating losses, state
| | | 100,602 | | | 87,851,252Varies by state
| | Net operating losses, Canada | | | 38,906 | | | 2026 - 2040 | |
Ur-Energy Inc. Notes to Consolidated Financial Statements | December 31, 2020 |
(expressed in thousands of U.S. dollars unless otherwise indicated) The effective tax rate of the Company’s provision (benefit) for income taxes differs from the federal statutory rate as follows: | | Year ended | | | | December 31, | | Income Tax Rate Reconciliation | | 2020 | | | 2019 | | | 2018 | | | | | | | | | | | | Statutory rate | | | 26.5 | % | | | 26.5 | % | | | 26.5 | % | State tax | | | 18.2 | % | | | 11.4 | % | | | 7.4 | % | Permanent differences | | | -2.0 | % | | | 0.5 | % | | | -3.6 | % | True-ups and other | | | 0.8 | % | | | -6.3 | % | | | 9.2 | % | Canada statutory rate addition | | | -4.2 | % | | | -4.0 | % | | | -8.3 | % | Change in valuation allowance | | | -39.3 | % | | | -28.1 | % | | | -31.2 | % | Total | | | 0.0 | % | | | 0.0 | % | | | 0.0 | % |
The Company follows a comprehensive model for recognizing, measuring, presenting, and disclosing uncertain tax positions taken or expected to be taken on a tax return. Tax positions must initially be recognized in the financial statements when it is more likely than not the position will be sustained upon examination by the tax authorities. Such tax positions must initially and subsequently be measured as the largest amount of tax benefit that has a greater than 50% likelihood of being realized upon ultimate settlement with the tax authority assuming full knowledge of the position and relevant facts. The Company currently has no uncertain tax positions and is therefore not reflecting any adjustments for such in its deferred tax assets. Table of Contents
Ur-Energy Inc.
Notes to Consolidated Financial Statements
December 31, 2017
(expressed in thousands of U.S. dollars unless otherwise indicated)
There are open statutes of limitations for tax authorities in the U.S., Canada and state jurisdictions to audit the Company’s tax returns for the years ended December 31, 2014, 2015 and 2016.
The Company’s policy is to account for income tax related interest and penalties in income tax expense in the accompanying statements of operations. There have been no income tax related interest or penalties assessed or recorded. Other comprehensive loss was not subject to income tax effects and is therefore shown net of taxes. Asset retirement obligations ("ARO") for the Lost Creek Project are equal to the present value of all estimated future costs required to remediate any environmental disturbances that exist as of the end of the period, using discount rates ranging from 0.1% to 3.2%. Included in this liability are the costs of closure, reclamation, demolition and stabilization of the mine, processing plant, infrastructure, groundwater restoration and ongoing post-closure environmental monitoring and maintenance costs. At December 31, 2017, the total undiscounted amount of the future cash needs was estimated to be $15.6 million. The schedule of payments required to settle the ARO liability extends through 2033.
Asset retirement obligations for the Pathfinder properties are equal to the present value of all estimated future costs required to remediate any environmental disturbances that exist as of the end of the period, using discount rates of 2.16% to 3.0%. Included in this liability are the costs of closure, reclamation, demolition and stabilization of the mines, processing plants, infrastructure, groundwater restoration, waste dumps and ongoing post-closure environmental monitoring and maintenance costs. At December 31, 2017, the total undiscounted amount of the future cash needs was estimated to be $11.4 million. The schedule of payments required to settle the ARO liability extends through 2033.
The undiscounted future cash needs are based on information provided to the State of Wyoming in conjunction with annual reclamation bonding renewals. Increases in the estimated future cash needs are normally based on increased disturbances projected for the upcoming year. In 2017, there was a small increase in the estimated liability on the Lost Creek Project.
Table of Contents
Ur-Energy Inc.
Notes to Consolidated Financial Statements
December 31, 2017
Ur-Energy Inc. Notes to Consolidated Financial Statements | December 31, 2020 |
(expressed in thousands of U.S. dollars unless otherwise indicated) The restricted cash as discussed in note 6 is related to surety bonds and letters of credit which provide security to the related governmental agencies on these obligations.
| | | | | For the period ended | | Year ended | | December 31, 2017 | | December 31, 2016 | | | | | | $ | | $ | Beginning of period | 26,061 | | 26,061 | Change in estimated liability | 448 | | (534) | Accretion expense | 527 | | 534 | | | | | End of period | 27,036 | | 26,061 |
13.Shareholders’ Equity and Capital Stock
Common share issuances
On August 19, 2014, we filed a universal shelf registration statement on Form S-3 in order that we may offer and sell, from time to time, in one or more offerings, at prices and terms to be determined, up to $100 million of our common shares, warrants to purchase our common shares, our senior and subordinated debt securities, and rights to purchase our common shares and/or our senior and subordinated debt securities. The registration statement became effective September 12, 2014. The 12,921,000 common shares offered in the February 2016 financing were sold for $0.50 per share raising $5.7 million (net of issue costs of $0.8 million) under the shelf registration statement.
On May 27, 2016, we entered into an At Market Issuance Sales Agreement with MLV & Co. LLC and FBR Capital Markets & Co. under which we may, from time to time, issue and sell common shares at market prices on the NYSE American or other U.S. market through the distribution agents for aggregate sales proceeds of up to $10,000,000. During 2016, we sold 164,979 common shares under the sales agreement at an average price of $0.65 per share for gross proceeds of $108 thousand. After deducting transaction fees and commissions we received net proceeds of $105 thousand. After deducting all other costs associated with the completion of the agreement and filing the related prospectus supplement, we received $13 thousand. During 2017, we sold 1,536,169 common shares under the sales agreement at an average price of $0.76 per share for gross proceeds of $1.2 million. After deducting transaction fees, commissions and all other costs associated with the completion of the agreement and filing the related prospectus supplement, we received net proceeds of $1.1 million.
During the year ended December 31, 2017, the Company exchanged 447,663 common shares for vested RSUs. In addition, 871,717 stock options were exercised for proceeds of $0.5 million.
During the year ended December 31, 2016, the Company exchanged 385,010 common shares for vested RSUs. In addition, 16,620 stock options were exercised for proceeds of less than $0.1 million.
Table of Contents
Ur-Energy Inc.
Notes to Consolidated Financial Statements
December 31, 2017
(expressed in thousands of U.S. dollars unless otherwise indicated)
During the year ended December 31, 2015, the Company exchanged 215,168 common shares for vested RSUs. In addition, 608,531 stock options were exercised for proceeds of $0.4 million.
Stock options
In 2005, the Company’s Board of Directors approved the adoption of the Company's stock option plan (the “Option Plan”). Eligible participants under the Option Plan include directors, officers, employees and consultants of the Company. Under the terms of its operating leases for offices and equipment, the Option Plan, stock options generally vest with Option Plan participants as follows: 10% at the date of grant; 22% four and one-half months after grant; 22% nine months after grant; 22% thirteen and one-half months after grant; and the balance of 24% eighteen months after the date of grant. Following the May 2017 amendment of the Option Plan, grants of options will vest over a three-year period: 33.3% on the first anniversary, 33.3% on the second anniversary, and 33.4% on the third anniversary of the grant. The term of options remains unchanged.
Activity with respectCompany is committed to stock options is summarizedminimum annual lease payments as follows:
| | | | | | | | | | | Weighted- | | | | | | average | | | | Options | | exercise price | | | | # | | $ | Outstanding, December 31, 2014 | | | 8,468,614 | | 1.12 | | | | | | | Granted | | | 2,384,052 | | 0.67 | Exercised | | | (608,531) | | 0.66 | Forfeited | | | (258,918) | | 1.09 | Expired | | | (10,810) | | 0.64 | | | | | | | Balance, December 31, 2015 | | | 9,974,407 | | 0.88 | | | | | | | Granted | | | 3,062,542 | | 0.57 | Exercised | | | (16,620) | | 0.58 | Forfeited | | | (788,883) | | 0.70 | Expired | | | (2,482,512) | | 1.56 | | | | | | | Balance, December 31, 2016 | | | 9,748,934 | | 0.63 | | | | | | | Granted | | | 2,666,644 | | 0.69 | Exercised | | | (871,717) | | 0.62 | Forfeited | | | (536,178) | | 0.64 | Expired | | | (1,548,282) | | 0.71 | | | | | | | Outstanding, December 31, 2017 | | | 9,459,401 | | 0.70 |
Lease Payments | | | | | | 2021 | | | 49 | | 2022 | | | 1 | | 2023 and after | | | 0 | | | | | | | | | | 50 | |
Table of Contents
Ur-Energy Inc.
Notes to Consolidated Financial Statements
December 31, 2017
(expressed in thousands of U.S. dollars unless otherwise indicated)
The exercise price of a new grant is set at the closing price for the stock on the Toronto Stock Exchange (TSX) on the trading day immediately preceding the grant date so there is no intrinsic value as of the date of grant. The fair value of options vested during the year ended December 31, 2017 was $0.7 million.
As of December 31, 2017, outstanding stock optionsPrincipal payments required under debt agreements are as follows:
| | | | | | | | | | | | | | | | | Options outstanding | | Options exercisable | | | | | | | Weighted- | | | | | | Weighted- | | | | | | | | | average | | | | | | average | | | | | | | | | remaining | | Aggregate | | | | remaining | | Aggregate | | | Exercise | | Number | | contractual | | Intrinsic | | Number | | contractual | | Intrinsic | | | price | | of options | | life (years) | | Value | | of options | | life (years) | | Value | | Expiry | $ | | | | | | $ | | | | | | $ | | | | | | | | | | | | | | | | | | 0.61 | | 452,656 | | 0.3 | | 31 | | 452,656 | | 0.3 | | 31 | | 25-Apr-18 | 0.99 | | 100,000 | | 0.6 | | - | | 100,000 | | 0.6 | | - | | 01-Aug-18 | 0.96 | | 739,976 | | 1.0 | | - | | 739,976 | | 1.0 | | - | | 27-Dec-18 | 1.34 | | 100,000 | | 1.2 | | - | | 100,000 | | 1.2 | | - | | 31-Mar-19 | 0.81 | | 777,896 | | 1.9 | | - | | 777,896 | | 1.9 | | - | | 12-Dec-19 | 0.91 | | 200,000 | | 2.4 | | - | | 200,000 | | 2.4 | | - | | 29-May-20 | 0.69 | | 640,969 | | 2.6 | | - | | 640,969 | | 2.6 | �� | - | | 17-Aug-20 | 0.64 | | 1,047,836 | | 2.9 | | 45 | | 1,047,836 | | 2.9 | | 45 | | 11-Dec-20 | 0.58 | | 2,733,424 | | 4.0 | | 259 | | 1,474,324 | | 4.0 | | 139 | | 16-Dec-21 | 0.81 | | 300,000 | | 4.2 | | - | | 162,000 | | 4.2 | | - | | 02-Mar-22 | 0.58 | | 200,000 | | 4.7 | | 19 | | 0 | | - | | - | | 07-Sep-22 | 0.72 | | 2,166,644 | | 5.0 | | - | | 0 | | - | | - | | 15-Dec-22 | | | | | | | | | | | | | | | | 0.70 | | 9,459,401 | | 3.3 | | 354 | | 5,695,657 | | 2.5 | | 215 | | |
The aggregate intrinsic value of the options in the preceding table represents the total pre-tax intrinsic value for stock options with an exercise price less than the Company’s TSX closing stock price of CAD $0.86 as of the last trading day in the year ended December 31, 2017, that would have been received by the option holders had they exercised their options as of that date. There were 4,433,916 in-the-money stock options outstanding and 2,974,816 exercisable as of December 31, 2017.
Principal Payments | | | | | | 2021 | | | 497 | | 2022 | | | 3,031 | | 2023 | | | 5,487 | | 2024 | | | 4,326 | | | | | | | | | | 13,341 | |
Restricted share units
On June 24, 2010, the Company’s shareholders approved the adoption of the Company’s restricted share unit plan (the “RSU Plan”). The RSU Plan was approved most recently by our shareholders on May 5, 2016.
Eligible participants under the RSU Plan include directors and employees, including officers, of the Company. Under the terms of the RSU Plan, RSUs vest 100% on the second anniversary of the date of the grant. The RSU Plan also provides for redemption, instead of cancellation, of outstanding RSUs at the date of redemption for retiring directors and executive officers, which is defined as a threshold of combined service and age of 65
Table of Contents
Ur-Energy Inc.
Notes to Consolidated Financial Statements
December 31, 2017
(expressed in thousands of U.S. dollars unless otherwise indicated)
years, and a minimum of five years of service to the Company. Upon RSU vesting, the holder of an RSU will receive one common share, for no additional consideration, for each RSU held.
Activity with respect to RSUs is summarized as follows:
| | | | | | | | | Number | | Weighted | | | | of | | average grant | | | | RSUs | | date fair value | | | | | | $ | Unvested, December 31, 2014 | | | 379,435 | | 0.89 | | | | | | | Granted | | | 795,592 | | 0.83 | Vested | | | (286,223) | | 0.91 | Forfeited | | | (28,709) | | 0.85 | | | | | | | Unvested, December 31, 2015 | | | 860,095 | | 0.82 | | | | | | | Granted | | | 715,638 | | 0.57 | Vested | | | (281,342) | | 0.81 | Forfeited | | | (20,401) | | 0.65 | | | | | | | Unvested, December 31, 2016 | | | 1,273,990 | | 0.60 | | | | | | | Granted | | | 541,658 | | 0.69 | Vested | | | (575,818) | | 0.69 | Forfeited | | | (63,878) | | 0.58 | | | | | | | Unvested, December 31, 2017 | | | 1,175,952 | | 0.65 |
As of December 31, 2017, outstanding RSUs are as follows:
| | | | | | | | | Number of | | Remaining | | Aggregate | | | unvested | | life | | Intrinsic | Grant date | | RSUs | | (years) | | Value | | | | | | | $ | December 16, 2016 | | 634,294 | | 0.96 | | 438 | December 15, 2017 | | 541,658 | | 1.96 | | 374 | | | | | | | | | | 1,175,952 | | 1.42 | | 812 |
As of December 31, 2016, 8,374 RSUs had been vested and redeemed but not issued due to the timing of transferring them to the brokers designated by the related employees. They were subsequently issued in January and February 2017.
Table of Contents
Ur-Energy Inc.
Notes to Consolidated Financial Statements
December 31, 2017
(expressed in thousands of U.S. dollars unless otherwise indicated)
As of December 31, 2015, 212,803 RSUs had been vested but not redeemed. In January 2016, 197,374 were redeemed for common shares while the balance of 15,429 were retained and not redeemed to pay the related taxes due on redemption.
Warrants
The warrants were issued in Canadian dollars and have been converted to their US$ equivalent for presentation purposes. The First Loan Facility with RMB Australia Holdings account for the warrants.
Activity with respect to warrants is summarized as follows:
| | | | | | | | | Number | | Weighted- | | | | of | | average | | | | Warrants | | exercise price | | | | | | $ | Outstanding, December 31, 2014 | | | 8,374,112 | | 1.20 | | | | | | | Expired | | | (150,000) | | 0.89 | | | | | | | Outstanding, December 31, 2015 | | | 8,224,112 | | 1.71 | | | | | | | Expired | | | (2,379,545) | | 1.34 | | | | | | | Outstanding, December 31, 2016 | | | 5,844,567 | | 1.02 | | | | | | | Outstanding, December 31, 2017 | | | 5,844,567 | | 0.97 |
As of December 31, 2017, outstanding warrants are as follows:
| | | | | | | | | | | | | Remaining | | Aggregate | | | Exercise | | Number | | contractual | | Intrinsic | | | price | | of warrants | | life (years) | | Value | | Expiry | $ | | | | | | $ | | | 0.96 | | 4,294,167 | | 0.5 | | - | | 24-Jun-18 | 1.00 | | 1,550,400 | | 0.7 | | - | | 27-Aug-18 | | | | | | | | | | 0.97 | | 5,844,567 | | 0.5 | | - | | |
Share-based compensation expense
Stock-based compensation expense was $0.9 million, $0.9 million and $0.9 million for the years ended December 31, 2017, 2016 and 2015, respectively.
Table of Contents
Ur-Energy Inc.
Notes to Consolidated Financial Statements
December 31, 2017
(expressed in thousands of U.S. dollars unless otherwise indicated)
As of December 31, 2017, there was approximately $1.1 million of total unrecognized compensation expense (net of estimated pre-vesting forfeitures) related to unvested share-based compensation arrangements granted under the Option Plan and $0.6 million under the RSU Plan. The expenses are expected to be recognized over a weighted-average period of 2.3 years and 1.4 years, respectively.
Cash received from stock options exercised during the years ended December 31, 2017, 2016 and 2015 was $0.5 million, less than $0.1 million and $0.4 million, respectively.
Fair Value Calculations
The initial fair value of RSUs, options and warrants granted during the years ended December 31, 2017, 2016 and 2015 was determined using the Black-Scholes option pricing model with the following assumptions:
| | | | | 2017 | 2016 | 2015 | | | | | Expected option life (years) | 3.73-3.74 | 3.72 | 3.6-3.67 | Expected volatility | 56-57% | 57% | 55-57% | Risk-free interest rate | 1.0%-1.6% | 1.0% | 0.5-0.7% | Forfeiture rate (options) | 5.3%-6.0% | 5.6% | 4.9-5.0% | Forfeiture rate (RSUs) | 6.1% | 6.2% | 7.2-8.3% | Expected dividend rate | 0% | 0% | 0% |
The Company estimates expected volatility using daily historical trading data of the Company’s common shares, because this is recognized as a valid method used to predict future volatility. The risk-free interest rates are determined by reference to Canadian Treasury Note constant maturities that approximate the expected option term. The Company has never paid dividends and currently has no plans to do so.
Share-based compensation expense is recognized net of estimated pre-vesting forfeitures, which results in recognition of expense on options that are ultimately expected to vest over the expected option term. Forfeitures were estimated using actual historical forfeiture experience.
The fair value used for each RSU issued in 2017 and 2016 was CAD$0.90 and CAD $0.73, respectively. Those issued in 2015 ranged from CAD $0.80 to CAD $1.22 per unit. Each of the issuance prices were the closing prices of the stock on the TSX as of the trading day immediately preceding the grant date.
14.Sales
Revenue is primarily derived from the sale of U3O8 to domestic utilities under contracts or spot sales. In 2016, the Company also sold deliveries under two of its contracts to a third-party trader. The income was deferred at the time and recognized when the respective deliveries were completed.
Table of Contents
Ur-Energy Inc.
Notes to Consolidated Financial Statements
December 31, 2017
(expressed in thousands of U.S. dollars unless otherwise indicated)
Revenue consists of:
| | | | | | | | | Year ended December 31, | | 2017 | | 2016 | | $ | | | | $ | | | Sale of produced inventory | | | | | | | | Company A | 7,821 | | 20.4% | | - | | 0.0% | Company B | 3,141 | | 8.2% | | 12,741 | | 46.7% | Company C | 1,777 | | 4.6% | | - | | 0.0% | Company D | - | | 0.0% | | 6,375 | | 23.3% | Company E | - | | 0.0% | | 3,075 | | 11.2% | | 12,739 | | 33.2% | | 22,191 | | 81.3% | Sales of purchased inventory | | | | | | | | Company B | 10,212 | | 26.6% | | - | | 0.0% | Company C | 15,340 | | 40.0% | | - | | 0.0% | | 25,552 | | 66.6% | | - | | 0.0% | | | | | | | | | Total sales | 38,291 | | 99.8% | | 22,191 | | 81.3% | | | | | | | | | Disposal fee income | 77 | | 0.2% | | 29 | | 0.1% | Recognition of revenue from sale of deliveries under assignment | - | | 0.0% | | 5,085 | | 18.6% | | | | | | | | | | 38,368 | | 100.0% | | 27,305 | | 100.0% |
Table of Contents
Ur-Energy Inc.
Notes to Consolidated Financial Statements
December 31, 2017
(expressed in thousands of U.S. dollars unless otherwise indicated)
15. Supplemental Information for Statement of Cash Flows
Cash per the Statement of Cash Flows consists of the following:
| | | | | | | As at | | December 31, 2017 | | December 31, 2016 | | December 31,
2015 | | $ | | $ | | $ | Cash and cash equivalents | 3,879 | | 1,552 | | 1,442 | Restricted cash | 7,558 | | 7,557 | | 7,557 | | | | | | | | 11,437 | | 9,109 | | 8,999 |
16.Financial instruments
The Company’s financial instruments consist of cash and cash equivalents, accounts receivable, restricted cash, deposits, accounts payable and accrued liabilities, and notes payable. The Company is exposed to risks related to changes in foreign currency exchange rates, interest rates and management of cash and cash equivalents and short-term investments. Credit risk Financial instruments that potentially subject the Company to concentrations of credit risk consist of cash and cash equivalents and restricted cash. These assets include Canadian dollar and U.S. dollar denominated certificates of deposits,deposit, money market accounts, and demand deposits. These instruments are maintained at financial institutions in Canada and the United States.U.S. Of the amount held on deposit, approximately $0.6$0.5 million is covered by the Canada Deposit Insurance Corporation, the Securities Investor Protection Corporation, or the United StatesU.S. Federal Deposit Insurance Corporation, leaving approximately $10.8$11.6 million at risk aton December 31, 20172020 should the financial institutions with which these amounts are invested be rendered insolvent. The Company does not consider any of its financial assets to be impaired as of December 31, 2017.2020. Ur-Energy Inc. Notes to Consolidated Financial Statements | December 31, 2020 |
(expressed in thousands of U.S. dollars unless otherwise indicated) Liquidity risk Liquidity risk is the risk that the Company will not be able to meet its financial obligations as they come due. The Company has financed its operations from its inception primarily through the issuanceAs of equity securities and debt instruments. Production commenced in August 2013 after receiving final operational clearance from the NRC. Product sales commenced in December 2013.
As at December 31, 2017,2020, the Company’s financial liabilities consisted of trade accounts payable and accrued trade and payroll liabilities of $1.3$2.3 million, which are due within normal trade termsand the current portion of generally 30 to 60 days,
Tablenotes payable of Contents
Ur-Energy Inc.
Notes to Consolidated Financial Statements
December 31, 2017$0.5 million.
(expressedOn May 15, 2020, we filed a universal shelf registration statement on Form S-3 with the SEC in thousandsorder that we may offer and sell, from time to time, in one or more offerings, at prices and terms to be determined, up to $100 million of U.S. dollars unless otherwise indicated)
notes payable which will be payable over periods of 0our Common Shares, warrants to 5 years,purchase our Common Shares, our senior and asset retirement obligations with estimated completion dates until 2033.subordinated debt securities, and rights to purchase our Common Shares and/or senior and subordinated debt securities. The registration statement became effective May 27, 2020 for a three-year period. In August 2020, we utilized the registration statement for a $4.68 million registered direct offering (see note 13) and in February 2021, we utilized the registration statement for a $15.2 million underwritten public offering (see note 22).
On May 29, 2020, we entered into an At Market riskIssuance Sales Agreement (the “Sales Agreement”) with B. Riley Securities, Inc. (formerly, B. Riley FBR, Inc.), under which we may, from time to time, issue and sell common shares at market prices on the NYSE American LLC through the Agent for aggregate sales proceeds of up to $10,000,000. The Sales Agreement replaces the prior At Market Issuance Sales Agreement entered by the Company on May 27, 2016, as amended. In 2020 Q4, we utilized the Sales Agreement and received gross proceeds of $0.1 million. Market risk is the risk to the Company of adverse financial impacts due to changes in the fair value or future cash flows of financial instruments as a result of fluctuations in interest rates and foreign currency exchange rates.
Interest rate risk
Financial instruments that expose the Company to interest rate risk are its cash equivalents, deposits, restricted cash and debt financings. The Company’s objectives for managing its cash and cash equivalents are to maintain sufficient funds on hand at all times to meet day to day requirements and to place any amounts considered in excess of day to day requirements on short-term deposit with the Company's financial institutions so that they earn interest.
Currency risk
The Company maintains a balance of less than $0.3 million in foreign currency resulting in a low currency risk.
Sensitivity analysis The Company has completed a sensitivity analysis to estimate the impact that a change in interest rates would have on the net loss of the Company. This sensitivity analysis shows that a change of +/- 100 basis points in interest rate would have 0.1 impact fora negligible effect on the yearyears ended December 31, 2017.2020, 2019, or 2018. The financial position of the Company may vary at the time that a change in interest rates occurs causing the impact on the Company’s results to differ from that shown above.vary. 17.Commitments
On February 4, 2021, the Company closed an underwritten public offering of 14,722,200 common shares and accompanying warrants to purchase up to 7,361,100 common shares, at a combined public offering price of $0.90 per common share and accompanying warrant. The warrants will have an exercise price of $1.35 per whole common share and will expire three years from the date of issuance. Ur-Energy also granted the underwriters a 30-day option to purchase up to an additional 2,208,330 common shares and warrants to purchase up to 1,104,165 common shares on the same terms. The option was exercised in full. Including the exercised option, Ur-Energy issued a total of 16,930,530 common shares and 16,930,530 warrants to purchase up to 8,465,265 common shares. The gross proceeds to Ur‑Energy from this offering were approximately $15.2 million, before deducting the underwriting discounts and commissions and other estimated offering expenses payable by Ur-Energy. Under the terms of its operating lease for vehicles and the office premises in Casper, Wyoming, the Company is committed to minimum annual lease payments as follows:
| | Year ended December 31, | $ | 2018 | 352 | 2019 | 95 | 2020 and thereafter | - | | 447 |
Rent expense under these agreements was $0.2 million, $0.2 million and $0.2 million for the years ended December 31, 2017, 2016 and 2015, respectively.
Table of Contents
Ur-Energy Inc.
Notes to Consolidated Financial Statements
December 31, 2017
(expressed in thousands of U.S. dollars unless otherwise indicated)
Principal payments required under debt agreements are as follows:
|


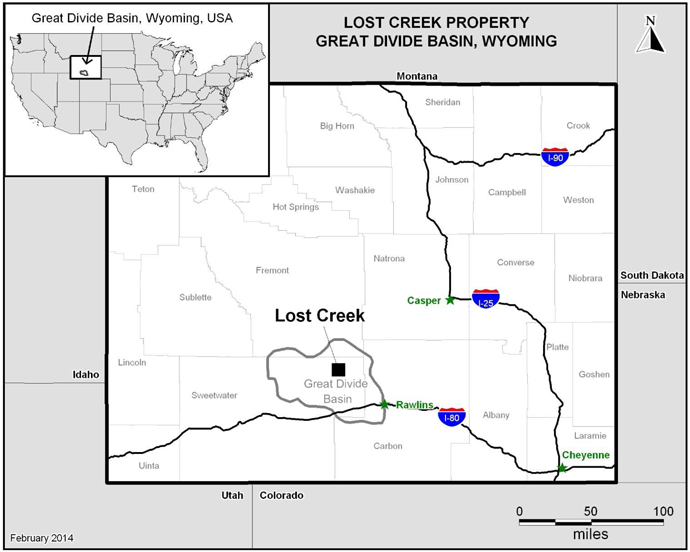