NOTE REGARDING FORWARD-LOOKING STATEMENTS
Certain statements included in this Annual Report on Form 10-K and the documents incorporated into this document by reference contain certain “forward-looking statements” within the meaning of Section 27A of the Securities Act of 1933, as amended (the “Securities Act”), and Section 21E of the Securities Exchange Act of 1934, as amended (the “Exchange Act”). Such forward-looking statements include statements regarding our plans and objectives, including, among other things, our future financial condition, anticipated capital expenditures, anticipated dividends and other matters. Forward-looking statements are typically identified by the use of terms such as “may,” “will,” “should,” “expect,” “intend,” “plan,” “anticipate,” “estimate,” “believe,” “continue,” “predict,” “potential” or the negative of such terms and other comparable terminology. These statements are only predictions and are not historical facts. Actual events or results may differ materially.
The forward-looking statements included herein are based on our current expectations, plans, estimates and beliefs that involve numerous risks and uncertainties. Assumptions relating to the foregoing involve judgments with respect to, among other things, future economic, competitive and market conditions and future business decisions, all of which are difficult or impossible to predict accurately and many of which are beyond our control. Any of the assumptions underlying the forward-looking statements contained herein could be inaccurate. Although we believe the expectations reflected in such forward-looking statements are based on reasonable assumptions, we cannot assure readers that the forward-looking statements included in this filing will prove to be accurate. The accompanying information contained in this Annual Report on Form 10-K, including, without limitation, the information set forth under the section entitled “Risk Factors” in Item 1A, identifies important additional factors that could materially adversely affect actual results and performance. We undertake no obligation to update or revise forward-looking statements to reflect changed assumptions, the occurrence of certain unanticipated events or changes to future operating results.
All dollar amounts in this Form 10-K are stated in thousands with the exception of share and per share amounts, unless otherwise indicated.
GENERAL
Sterling Real Estate Trust (“we,” “us,” “our,” “Company”“Company,” “Trust” or “Sterling”) is a real estate investment trust (“REIT”),. Sterling was registered in North Dakota as an unincorporated business trust onin December 4, 2002. References in this Annual Report on Form 10-K to the “Company,” “Sterling,” “Trust,” “we,” “us,” or “our” include consolidated subsidiaries, unless the context indicates otherwise. As a REIT, we are not subject to U.S. federal income taxation as long as we satisfy certain requirements, principally relating to the nature of our income, the level of our dividends and other factors. AtAs of December 31, 2017,2022, we owned directly or through our operating partnership, 166185 properties in twelve (12)12 states.
UPREIT Structure
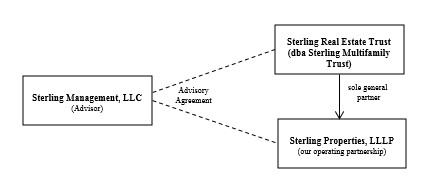
We operateThe Trust operates as an Umbrella Partnership Real Estate Investment Trust, which is a REIT that holds all or substantially all of its assets through a partnership which the REIT controls as general partner. Therefore, we conductthe Trust conducts substantially all investment activities and holds substantially all of our investment activities and hold all or substantially all of ourthe Trust’s assets through ourthe operating partnership Sterling Properties, LLLP. We controlThe Trust controls the operating partnership as the general partner and ownowns approximately 32.64%36.60% of the operating partnership as of December 31, 2017.2022. For purposes of satisfying the asset and income tests for qualification as a REIT for tax purposes, ourthe proportionate shares of the assets and income of ourthe operating partnership are deemed to be ourthe assets and income.income of the Trust.
3
3
Operating Partnership
OurThe UPREIT structure is used to facilitate acquisitions of real estate properties. A sale of property directly to a REIT is generally a taxable transaction to the property seller. However, in an UPREIT structure, if a property seller exchanges the property for limited partnership units, the seller may defer taxation of gain in such exchange until the seller resells its limited partnership units or exchanges its limited partnership units for the REIT’s common stock. By offering the ability to defer taxation, the Trust may gain a competitive advantage in acquiring desired properties over other buyers who cannot offer this benefit. In addition, investing in the operating partnership, rather than directly in the Trust, may be more attractive to certain institutional or other investors due to their business or tax structure. If an investor is interested in making a substantial investment in our operating partnership, the structure provides the Trust the flexibility to accommodate different terms for each investment, while applicable tax laws generally restrict a REIT from charging different fee rates among its shareholders. Finally, if the Trust’s shares become publicly traded, the former property seller may be able to achieve liquidity for the investment in order to pay taxes.
Operating Partnership
Sterling Properties, LLLP, was formed as a North Dakota limited liability limited partnership onin April 25, 2003 to acquire, own and operate properties on ourthe Trust’s behalf. The operating partnership holds a diversified portfolio of multifamily dwellings and commercial properties located principally in the upper and central Midwest United States.
Since our formation, ourthe Trust’s focus has consisted of owning and operating income-producing real estate properties. In 2006, wethe Trust held 23 total properties approximating $56,265 in total assets.assets, in the operating partnership. Between 2007 and 2017, we2022, the Trust focused extensively on strengthening the multifamily component of ourthe portfolio, acquiring properties directly or through UPREIT transactions. A majority of these multifamily properties wereare located in North Dakota. OurThe portfolio has grown to 166185 properties, approximating $691,605$888,723 in total assets, and book equity, including noncontrolling interests, of approximately $273,775$323,466 as of December 31, 2017.2022. As of December 31, 2017, our2022, the portfolio contained approximately 9,40111,300 apartment units and 1,691,0001,498,000 square feet of leasable commercial space.
As of December 31, 2017, approximately 71.0% (based on cost) of the properties were apartment communities located primarily in North Dakota and Minnesota with others located in Missouri and Nebraska. Most multifamily dwelling properties are leased to a variety of tenants under short-term leases.
As of December 31, 2017, approximately 29.0% (based on cost) of the properties comprised industrial, office, retail and medical commercial properties located primarily in North Dakota with others located in Arkansas, Colorado, Iowa, Louisiana, Michigan, Mississippi, Minnesota, Nebraska, Texas and Wisconsin. Most commercial properties are leased to a variety of tenants under long-term leases.
OUR PEOPLE
We do not have any employees. Instead, we rely on our external Advisor to conduct our day-to-day affairs.
Our Advisor to the Trust
Our external Advisor is Sterling Management, LLC, a North Dakota limited liability company formed onin November 14, 2002. Our2002, is the external Advisor to the Trust. The Advisor is responsible for managing our day-to-day affairs and for identifying, acquiring and disposing investments on our behalf. The Advisor is 100% owned by Trustmark Enterprises, Inc., formerly known as Alloy, a North Dakota corporation (“Trustmark”). Trustmark is owned in part by Kenneth P. Regan, a trusteeTrustee and our Chief Executive Officer by an entity controlledof the Trust, by James S. Wieland, also onea Trustee of our trustees andthe Trust, by Joel S. Thomsen, our Chief Investment Officer.President of the Trust. In addition, Messrs. Regan, Wieland, Thomsen and ThomsenGleave serve on the Advisor’s Board of Governors of the Advisor. From 2007 to 2017, ourGovernors. The Advisor’s staff increasedemployee base has seen considerable growth, both in number and expertise, growing from 4since its inception.
Audit and Disclosure Committee
The Audit and Disclosure Committee was established by the Board of Trustees to 19 full-time employeesassist the Board in fulfilling its fiduciary duties and oversight responsibilities. The Audit and Disclosure Committee assists the Board by overseeing the integrity of the Trust’s financial statements, financial reporting and disclosure processes, internal accounting and financial controls and the annual independent audit of the Trust’s financial statements. The Audit and Disclosure Committee also oversees the establishment and maintenance of processes to assure the Trust’s compliance with all applicable laws, regulations, and Trust policy, including a president, chief accounting officer, chief investment officer, controller, accounting supervisor,compliance with filing requirements under the Exchange Act and the rules and regulations promulgated thereunder. In performing its work, it is the Audit and Disclosure Committee’s responsibility to foster free and open means of communication between the Trustees, the independent auditors and the Trust’s financial accountants, asset managers, directormanagers. Our Audit and Disclosure Committee is currently comprised of investor relations,Trustees Timothy A. Hunt (Chair of the Committee), Ann L. Christenson, Timothy L. Haugen, Michelle L. Korsmo, and directorMark T. Polovitz.
4
Our Board of Trustees and Executive Officers
We operateThe Trust operates under the direction of our Board of Trustees, the members of which are accountable to usboth the Trust and ourits shareholders. Our trusteesThe Trustees are elected annually by our shareholders. In addition, the Board has a duty to supervise our relationship with the Advisor and evaluatesevaluate the performance of and fees paid to the Advisor on an annual basis. The Advisory Agreement was approved by the Board of Trustees (including all the independent trustees) on March 24, 2022, effective April 6, 2017, effective January 1, 2017. Our2022 until March 31, 2023. The Board of Trustees has provided investment guidance for the Advisor to follow and must approve each investment recommended by the Advisor. Currently, we have ninethe Advisor has eight members on our board, seventhe Board, six of whom are independent.
Although we havethe Trust has executive officers, we doit does not have any paid employees. OurThe President, Chief Executive Officer, Chief Investment Officer, Chief AccountingFinancial Officer and Treasurer, and General Counsel and Secretary of the Trust, are also officers, employees, owners, or governors of our Advisor. Among others, such executive officers oversee ourthe Advisor’s day-to-day operations with respect to us.the Trust. However, when doing so, such executive officers are acting on behalf of ourthe Advisor in performing the Advisor’s obligations under the Advisory Agreement. Generally, the only services performed by ourthe Trust’s executive officers are those
4
required by law or regulation, such as executing documents as required by North Dakota law and providing certifications required by the federal securities laws.
Organizational Structure
On January 1, 2021, the advisor was acquired by Trustmark Enterprises, Inc. in an equity transfer.
The following chart shows our structure:the relationship structure with the advisor:
![]()
| (1) |
|
|
| (2) |
|
|
| (3) |
|
|
OUR
5
CORE INVESTMENT OBJECTIVES AND STRATEGY
Investment Objectives
OurThe Trust’s primary investment objectives are to:
|
|
|
|
|
|
WeThe Trust may change ourthe investment objectives only with the approval of holders of a majority of the outstanding common shares.
Investment Guidance
The Board of Trustees has provided investment guidance to the Advisor to direct the investment strategy of the Trust. Changes to the investment guidance must be approved by the Board. The Advisor has been authorized to execute:
| ● | Commercial and multifamily real estate property acquisitions and dispositions, |
| ● | Investments in other real estate related assets, in each case so long as such investments are approved by our Board, |
| ● | Acquisitions of property or land for the purposes of future development; and |
| ● | Capital investments in the portfolio’s current properties through capital improvements. |
The Board will have ultimate oversight over the Trust’s investments and may change from time to time the scope of authority delegated to the Advisor with respect to acquisition and disposition transactions.
Investment Strategy
PriorSterling’s current investment strategy and focus is on multifamily properties. Our Advisor monitors industry trends and invests in property believed to January 1, 2016,provide the most favorable return balanced with risk. We attempt to manage our real estate portfolio by evaluating changes or trends in the industries in which our tenants operate, the creditworthiness of our tenants and changes or trends in the area demographics surrounding our properties for evidence that our properties will continue to meet our investment strategy was primarily to acquireobjectives of cash flow, preservation of capital and hold a diverse portfolio of commercial real estate properties or portfolios or real estate properties in various sectors, including multifamily residential, industrial, retail, office, medical and other commercial properties, including restaurants, primarily located in the central corridor of the contiguous 48 states. Effective January 1, 2016, the Trust’s investment strategy is to acquire and hold ownership interests
5
in real estate properties in multifamily residential properties located in these markets.capital appreciation. There is no current plan for the existing commercial properties (industrial, medical, office and retail) in regards toregarding retention, acquisition, or disposition.
The majority of our acquisitions are locatedTrust will primarily invest in existing or near metropolitan areas. However, there is no limitation on the geographic areasnewly developed real estate properties. The Trust may also invest in which we may acquire targeted investments.
We may acquire portfolios ofinterests in real estate properties held by individual owners and real estate properties held by funds, including hedge funds. We anticipate such property owners will primarily sell the properties in exchange for limited partnershipacquiring direct ownership or ownership interests of the operating partnership.
We may make investments alone or together with other investors, including with affiliates of the Advisor, through holding company structures or joint ventures, real estate partnerships, tenant-in-common deals, REITs, or other collective investment vehicles.
Investment Guidance
Our Board of Trustees has provided investment guidance to the Advisor to direct our investment strategy. Changes to our investment guidance must be approved by our Board. The Advisor has been authorized to execute (1) commercial real estate property acquisitions and dispositions and (2) investments in other real estate related assets, in each case so long as such investments are approved by our Board. Our Board will at all times have ultimate oversight over our investments and may change from time to time the scope of authority delegated to our Advisor with respect to acquisition and disposition transactions. Effective January 1, 2016, our investment guidance is that future real estate investments be limited to multifamily apartment properties. We currently have no plans with respect to our commercial properties in regards to retention or disposition.
Investments in Real Estate Properties
Our investment guidance provides we will primarily invest in existing or newly constructed real estate properties and interests in real estate properties in multifamily residential, apartment and senior housing properties by acquiring direct ownership or ownership interests through equity interests or other joint venture structures. WeTrust may also invest in other real estate property types, including undeveloped land or other development opportunities if the land is acquired for the purpose of producing rental or other operating income and either development or construction is in process or development or construction is planned. Wethe future. The properties the Trust primarily investinvests in real estate properties withhave existing rent and expense schedules, or the properties are newly constructed properties with predictable cash flows. We concentrate our efforts on real estate properties located primarily in North Dakota and Minnesota, the central corridor of the contiguous 48 states and
Most current acquisitions are in or near metropolitan areas.
Investments However, there is no limitation on the geographic areas in Real Estate Related Assets
Our guidelines providewhich we may invest in real estate related assets. These assets include securities of other companies engaged in real estate activities, mortgage-backed securities and conventional mortgage loans. However, to date, our investment in such assets have been nominal. We may increase such investments in the future, but do not anticipate such investment amounts to be material or long term. acquire targeted investments.
Investments in Cash, Cash Equivalents and Other Short-Term Investments
We may invest in cash, cash equivalents and other short-term investments. Consistent with the rules applicable to qualification as a REIT, such investments may include investments in the following: money market instruments; short-term debt instruments, such as commercial paper, certificates of deposit, bankers’ acceptances, repurchase agreements, interest-bearing time deposits and corporate debt securities; corporate asset-backed securities; and U.S. government or government agency securities. However, to date, our investment in such assets have not been material, and we do not expect to increase such investments in the near future.
6
CONFLICTS OF INTEREST
We are subject to various conflicts of interest arising out of our relationship with our trustees, executive officers, key personnel and our Advisor and its affiliates. Some of the conflicts of interest in our transactions with our Advisor and others are described below.
Our trustees and officers and the officers and key personnel of our Advisor (herein individually and collectively our “Leadership”) may spend a portion of their time on activities unrelated to us, which may significantly reduce the amount of time to be spent by one or more of our Leadership on Sterling activities. Each of our Leadership, including Messrs. Regan and Wieland, is currently expected to spend a significant portion of their time on our behalf, but may not always spend a majority of their time on our behalf.
One or more of our Leadership, including Messrs. Regan and Wieland,The Trust may also serve as trustees, directors, governors, members, officers or key personnel of other: (a) affiliated entities, including our Advisor; (b) real estate programs, real estate entities, or REITs; (c) advisors to other real estate programs, real estate entities or REITs; or (d) property managers to real estate programs, real estate entities or REITs (herein collectively “Other Real Estate Related Activities”). In addition, from time to time, members of our Leadership may purchase real estate or interests in real estate for themselves, which may conflict with Sterling’s activities or objectives. Leadership’s management of Other Real Estate Related Activities may significantly reduce the amount of time our Leadership is able to spend on Sterling related activities. Given Leadership is or may become involved in Other Real Estate Related Activities, there may be times where Sterling’s fundraising, acquisition, disposition and liquidation activities overlap with similar activities of Leadership’s Other Real Estate Related Activities. This overlap may cause conflicts of interest to arise with respect to, among other things, finding investors, locating and acquiring real estate investments, leasing activities and disposing of investments. The conflicts of interest faced could generally cause our operating results to suffer.
Certain members of Leadership will have fiduciary duties relating to their Other Real Estate Related Activities. These fiduciary duties may conflict with Leadership’s duties to Sterling and its shareholders. Leadership’s Other Real Estate Related Activities could result in actions or inactions detrimental to Sterling, which could harm the implementation of Sterling’s business strategies and Sterling’s investments. If Sterling does not successfully implement its business strategy, we may be unable to generate cash needed to pay dividends to shareholders and to maintain or increase the value of our assets.
Conflicts with Sterling’s business and interests are most likely to arise from Leadership’s involvement in activities related to: (a) allocation of new investments and management time and services between Sterling and Leadership’s Other Real Estate Related Activities, (b) allocation of time and services between Sterling and Leadership’s Other Real Estate Related Activities; (c) Sterling’s purchase of properties from, or sale of properties to, affiliated entities, (c) the timing and terms of the investment in or sale of an asset, (d) development of our properties by affiliates, (e) investments with or activities of affiliates of our Advisor and (f) compensation to our Advisor.
To the extent Leadership engages in future Other Real Estate Related Activities, Sterling may compete for investors with such activities. Any overlap of capital raising efforts of Other Real Estate Related Activities with Sterling’s capital raising efforts or other activities could adversely affect our ability to raise capital in the future and the amount of proceeds we have to spend on real estate investments.
Sterling may, in the future, purchase real estate investments at the same time as Leadership is purchasing real estate investments via Other Real Estate Related Activities. As a result, Leadership may owe duties to both Sterling and the Other Real Estate Related Activities, their members and limited partners and these investors, which duties may from time to time conflict with the duties they owe to Sterling and its shareholders.
Leadership may engage for their own account in business activities of the types conducted or to be conducted by Sterling or our subsidiaries. To the extent Leadership takes actions that are more favorable to other entities than to us, these actions could have a negative impact on Sterling’s financial performance and, consequently, on dividends to our shareholders and
7
the value of our stock. For a description of some of the risks related to these conflicts of interest, see the section of this periodic report captioned ‘‘Risk Factors — Risks Related to Conflicts of Interest.’’
Interests in Other Real Estate Programs
Leadership and entities owned by Leadership may, in the future, acquire real estate investments for their own accounts, and have done so in the past. Furthermore, Leadership and entities owned or managed by Leadership may form additional real estate investment entities in the future, including additional REITs, which can be expected to have the same or similar investment objectives and policies as we do and which may be involved in the same geographic areas. Leadership is not obligated to present to us any particular investment opportunity that comes to their attention, unless such opportunity is of a character that might be suitable for investment by us. Leadership likely will experience conflicts of interest as they simultaneously perform services for us and Other Real Estate Related Activities.
Any affiliated entity, whether or not currently existing, could compete with us in the purchase, sale or operationportfolios of real estate investments. Weproperties held by individual owners and real estate properties held by funds, including hedge funds. It is anticipated that such property owners will seek to achieve any operating efficiency or similar savings that may result from affiliated management of competitive investments. However, toprimarily sell the extent that affiliates own or acquire an investment that is adjacent or its underlying property is adjacent, orproperties in close proximity, to a property we own, our property may compete with the affiliate’s propertyexchange for tenants or purchasers. Every transaction that we enter into with Leadership is subject to an inherent conflict of interest. Leadership may encounter conflicts of interest in enforcing our rights against any affiliate in the event of a default by or disagreement with an affiliate or in invoking powers, rights or options pursuant to any agreement between us and our advisor or any of its affiliates.
Other Activities of Our Advisor and Its Affiliates
We rely on our Advisor for the day-to-day operation of our business. As a resultlimited partnership interests of the current and/or future interests of Leadership in any other program and the fact that they also are engaged, or may continue to engage, in Other Real Estate Related Activities, Leadership has conflicts of interest in allocating their time between us and any other programs and other activities in which they are involved. Our Advisor presently believes that it and its affiliates have sufficient personnel to discharge fully their responsibilities to all of the sponsored programs and other ventures in which they are or may become involved.operating partnership.
In addition, each of our executive officers also serves or may serve in the future as an officer of one or more affiliated entities, including our Advisor, and/or other affiliated entities. As a result, these individuals owe or will owe fiduciary duties to these other entities, which may conflict with the fiduciary duties that they owe to us and our shareholders.
We may purchase real estate investments from affiliates of our Advisor. The prices we pay to affiliates of our Advisor for these investments will not be the subject of arm’s-length negotiations, which could mean that the acquisitions may be on terms less favorable to us than those negotiated with unaffiliated parties.
Competition in Acquiring, Leasing and Operating of Properties
Conflicts of interest will exist to the extent Sterling acquires, or seeks to acquire, properties in the same geographic areas where properties owned by Leadership or Leadership’s Other Real Estate Related Activities are located. In such a case, a conflict could arise in the acquisition or leasing of properties if we and one of Leadership’s Other Real Estate Related Activities were to compete for the same properties or tenants in negotiating leases, or a conflict could arise in connection with the resale of properties if we were to attempt to sell similar properties at the same time.
Conflicts of interest also may exist at such time as we or our affiliates managing property on our behalf seek to employ developers, contractors or building managers, as well as under other circumstances. Leadership will seek to reduce conflicts relating to the employment of developers, contractors or building managers. Leadership will also seek to reduce conflicts that may arise with respect to properties available for sale or rent. However, these conflicts cannot be fully avoided in that there may be established differing compensation arrangements at different properties or differing terms for resales or leasing of the various properties.
8
6
Joint Ventures with Affiliates
We may enter into joint ventures with Leadership’s Other Real Estate Related Activities (as well as other parties) for the acquisition of real estate investments. Leadership may have conflicts of interest in determining whether its Other Real Estate Related Activity should enter into any particular joint venture agreement. The co-venturer may have economic or business interests or goals which are or which may become inconsistent with Sterling’s business interests or goals. In addition, should any such joint venture be consummated, Leadership may face a conflict in structuring the terms of the relationship between Sterling’s interests and the interest of the co-venturer and in managing the joint venture. Since Leadership may control both us and any affiliated co-venturer, agreements and transactions between the co-venturers with respect to any such joint venture may not have the benefit of arm’s-length negotiation of the type normally conducted between unrelated co-venturers.
Conflict Resolution
Every transaction that we enter into with Leadership will be subject to an inherent conflict of interest. Our Board of Trustees may encounter conflicts of interest in enforcing our rights or options against a member of Leadership in the event of a disagreement.
SEGMENT DATA
We report our results in two reportable segments: residential and commercial properties. Our residential properties include multifamily. Our commercial properties include retail, office, industrial restaurant and medical properties. We assess and measure operating results based on the non-GAAP financial measurement of net operating income (“NOI”), which we define as total real estate segment revenues less real estate expenses (which consist of real estate taxes, property management fees, utilities, repairs and maintenance, insurance and direct administrative costs). We believe NOI is an important measure of operating performance even though it should not be considered an alternative to net income or cash flow from operating activities. NOI is unaffected by financing, depreciation, amortization, legal and professional fees and othercertain general and administrative expenses.
COMPETITION
Our properties are located in highly competitive real estate markets. The number of competitive properties in a particular area could have a material adverse effect on our ability to lease space and the amount of rent we can charge at our properties. We compete with many property owners, such as corporations, limited partnerships, individual owners, other real estate investment trusts, insurance companies and pension funds.
Our competition also consists of other owners and developers of multifamily and commercial properties who are trying to attract tenants to their properties. We also compete with other real estate investors such as individuals, partnerships, corporations and other REITs to acquire properties that meet our investment objectives. This competition influences our ability to acquire properties and the prices that we may pay for those properties. We do not have a dominant position in any of the markets in which we operate and many of our competitors have greater financial and other resources than us and may have substantially more operating experience than either us or our Advisor. We believe, however, that the diversity of our investments, the experience and abilities of our management and the quality of our assets affords us some competitive advantages that have in the past, and should in the future, allow us to operate our business successfully despite the competitive nature of our business.
Generally, there are multifamily and other similar commercial properties within relatively close proximity to each of our properties. RegardingThe majority of our retail properties inare restaurants and pharmacies. In addition to competitor retail properties with similar business models, we and our tenants face increasing competition from outlet malls, internet shopping websites, discount shopping clubs, catalog companies, direct mail and telemarketing.
9
ENVIRONMENTAL MATTERS AND GOVERNMENT REGULATION
As an owner of real estate, we are subject to various environmental laws, rules and regulations adopted by various governmental bodies or agencies. These laws and regulations generally govern wastewater discharges, air emissions, the operation and removal of underground and above-ground storage tanks, the use, storage, treatment, transportation and disposal of solid hazardous materials, the remediation of contaminated property associated with the disposal of solid and hazardous materials and other health and safety-related concerns. Under these laws, a current or previous owner or operator of real estate may be liable for the costs of removal or remediation of certain hazardous or toxic substances released at a property and may be held liable to a governmental entity or to third parties for property damage or personal injuries and for investigation and clean-up costs incurred in connection with any contamination. We could be subject to liability in the form of fines or damages for noncompliance with these laws and regulations, and some environmental laws create a lien on a contaminated site in favor of the government for damages and costs it incurs in connection with the contamination. Some of these laws and regulations may impose joint and several liability on residents, owners, or operators for the costs of investigation or remediation of contaminated properties, regardless of fault or the legality of the original disposal. In addition, the presence of these substances, or the failure to properly remediate these substances, may adversely affect our ability to sell or rent the property or to use the property as collateral for future borrowing. Compliance with new or more stringent laws or regulations or stricter interpretation of existing laws may require material expenditures by us.
In addition, we are subject to many other laws and governmental regulations applicable to our properties, and changes in the laws and regulations, or in their interpretation by agencies and the courts, occur frequently. Under the Americans with Disabilities Act of 1990 (the “ADA”), all places of public accommodation are required to meet certain federal requirements related to access and use by disabled persons. The Fair Housing Amendments Act of 1988 (the “FHAA”) requires apartment communities first occupied after March 13, 1991, to be accessible to the handicapped and prohibits housing discrimination based upon familial status, which is commonly referred to as age-based discrimination. status.
7
The Housing for Older Persons Act (HOPA)(“HOPA”) provides age-based discrimination exceptions for housing developments qualifying as housing for older persons. Non-compliance with ADA, FHAA or HOPA could result in the imposition of fines, awards of damages to private litigants, payment of attorneys’ fees and other costs to plaintiffs, substantial litigation costs and substantial costs of remediation. We believe our properties which are subject to ADA, FHAA and/or HOPA are substantially in compliance with their present requirements.
Compliance with these laws, rules, and regulations has not had a material adverse effect on our business, assets, or results of operations, financial condition, or ability to pay dividends. We do not believe our existing portfolio as of December 31, 20172022 will require us to incur material expenditures to comply with these laws and regulations. However, we cannot assure that future laws, ordinances, or regulations will not impose any material liability, or that the current environmental condition of our properties will not be affected by the operations of tenants, by the existing condition of the land, by operations in the vicinity of the properties, such as the presence of underground storage tanks, or by the activities of unrelated third parties.
AVAILABLE INFORMATION
We electronically file our Annual Report on Form 10-K, Quarterly Reports on Form 10-Q, Current Reports on Form 8-K, proxy and information statements and all amendments to these filings with the Securities and Exchange Commission (“SEC”). The public may read and copy any materials filed by us with the SEC at the SEC’s Public Reference Room at 100 F Street, NE, Washington, DC 20549, on official business days during the operation of 10:00 am to 3:00 pm. The public may obtain information on the operation of the Public Reference Roominternet site maintained by calling the SEC at (800)-SEC-0330. The SEC maintains an Internet site at www.sec.gov that contains reports, proxy and information statements and other information regarding issuers that file electronically.
. We will make these reports available, free of charge, by responding to requests addressed to 1711 Gold Drive South, Suite 100, Fargo, North Dakota 58103. You may also request reports by calling the telephone number (701) 353-2720. Additionally, we maintain an internet site at www.sretrust.comwww.smftrust.com, which includes the Annual Report on Form 10-K, Quarterly Reports on Form 10-Q, Current Reports on Form 8-Kreports and all amendments to those reports.other documents we file with the SEC. These reports are
10
available as soon as reasonably practicable after such material is electronically filed or furnished to the SEC. This reference to our website is not intended to incorporate information found on the website into this filing.
Risks Related to Sterling Real Estate Trust
Common shares of beneficial interest represent an investment in equity only, and not a direct investment in our assets. Therefore, common shareholders will hold only an indirect interest in our assets.
The common shares of beneficial interest represent an equity interest only in us, not in any of our assets or the real estate or real estate related investments made by our operating partnership. We will have no substantial assets other than our equity interest in the operating partnership. Neither the Advisor nor any of its managers or affiliates have any obligation with respect to the payment of dividends to our shareholders or the return of capital investments made to us by the shareholders.
Our results are dependent on amounts received from the leasing and resale of investments, which are subject to market and economic changes. If income is insufficient to meet our capital needs, our ability to carry out our business plans could be adversely affected.
Our purpose is to acquire and hold our real estate investments as long-term investments before we resell the investments to maximize anticipated appreciation for our shareholders.investments. The primary income that will be generated by us will be the profits, if any, from the operation or holding of the real estate and real estate related investments and upon the resale of the investments. If circumstances arise which cause an investment to become undesirable or remain at its current value or decrease in value, we may generate less income than anticipated.
We may raise additional funds in the future to fund our capital needs, which may not be available on acceptable terms if at all.
We may need to raise additional capital in the future in order to fulfill our business plans. The timing and amount of our future capital needs will depend on a number of factors, including the revenue generated by the operation of our real estate investments, when and if the properties will appreciate in value, the resale price of the properties and other real estate related investments, our future operating expenses and required capital outlays. There can be no assurance additional financing will be available when needed on terms favorable to us, if at all.
Further, we may be required to raise additional capital and sell additional securities in the future on terms which are more favorable to those investors than the terms under which our current shareholders purchased their common shares. If adequate funds are not available or are not available on acceptable terms, our ability to fund our current business plans and to acquire additional real estate and real estate related investments would be significantly limited. Such limitation could have a material adverse effect on our results.
Our success is based on continuing to locate and hold suitable real estate investments, and failure of our Advisor to locate additional suitable properties or the unsuccessful operation of our existing real estate investments could adversely affect our operations and our ability to pay dividends.
Our ability to achieve our investment objectives and to pay dividends to our shareholders and distributions to unitholders is dependent upon the performance of our Advisor in locating suitable investments and appropriate financing arrangements for us as well as on the successful management of our properties after acquisition. We currently own, through the operating partnership, the properties described under Item 2 –— Properties.
11
We cannot be sure our Advisor will be successful in locating suitable investments on financially attractive terms, or be certain that operation of the properties will avoid the risks attendant to real estate acquisitions, such as:
| The risk properties may not perform in accordance with expectations, including projected occupancy and rental |
| The risk we may have underestimated the cost of improvements or repairs required to bring or keep an acquired property up to or at standards established for its intended use or its intended market position. |
Our Board
8
We may have to make expedited decisions on whether to invest in certain properties, or real estate-related assets, including prior to receipt of detailed information.
Our Board of TrusteesWe may be required to make expedited decisions in order to effectively compete for the acquisition of desirable properties and other real estate-related assets. In such cases, our Advisor and Board of Trustees may not have access to detailed information regarding real estate investments such as physical characteristics, environmental matters, zoning regulations or other local conditions affecting the real estate investment, at the time of making an investment decision to pay a non-refundable deposit and to proceed with an acquisition. In addition, the actual time period during which our Advisor will be allowed to conduct due diligence may be limited. Therefore, there can be no assurance our Advisor and Board of Trustees will have knowledge of all circumstances that may adversely affect an investment.
We face competition from other real estate investors for suitable properties, and may not be successful in our attempts to acquire desirable properties.
The multifamily and commercial real estate industries are highly competitive, and we face competition for investment opportunities. These competitors may be real estate developers, real estate financing entities, real estate investment trusts, mutual funds, hedge funds, investment banking firms, institutional investors and other entities or investors that acquire real estate and may have substantially greater financial resources than we do. These entities or investors may be able to accept more risk than our Board of Trustees believes is in our best interest. This competition may limit the number of suitable investment opportunities offered to us. This competition also may increase the bargaining power of property owners seeking to sell to us, making it more difficult for us to acquire properties or interests in properties. In addition, we believe competition from entities organized for purposes similar to ours may increase in the future.
We may change our investment and operational policies without shareholder consent, and such changes could increase our exposure to additional risks.
Generally, the Board of Trustees may change our investment and operational policies, including our policies with respect to investments, acquisitions, growth, operations, indebtedness, capitalization and distributions, at any time without the consent of our shareholders, which could result in our making investments different from, and possibly riskier than investments made in the past. A change in our investment policies may, among other things, increase our exposure to interest rate risk, default risk and commercial real estate market fluctuations, all of which could materially affect our ability to achieve our investment objectives.
There can be no assurance dividends or distributions will be paid or increase over time.
There are many factors that can affect the availability and timing of cash dividends to our shareholders.shareholders and distributions to unitholders. Dividends and distributions will be based principally on cash available from our real estate and real estate relatedother investments. The amount of cash available for dividends will be affected by many factors, such as our ability to acquire profitable real estate investments, and successfully manage our real estate properties, and our operating expenses.expenses, and general economic conditions. We can give no assurance we will be able to pay or maintain dividends or distributions or that dividends or distributions will increase over time. Our actual results may differ significantly from the assumptions used by our Board of Trustees in establishing the dividend rate to our shareholders.
12
We may pay dividends from sources other than our cash flow from operations, which could subject us to additional risks.
We are permitted to pay distributions from any source. If we fund dividends from cash flow from operations or working capital, we will have less funds available for investment in real estate and real estate related investments and our shareholders’ overall return may be reduced. Actual cash available for dividends may vary substantially from the estimates of our Board of Trustees. Because we may receive income from interest or rents at various times during our fiscal year, dividends paid may not reflect our income earned in that particular dividend period. In these instances, we may obtain third party financing to fund our dividends, causing us to incur additional interest expense. We may also fund such dividends from the sale of assets or additional securities. Any of these actions could potentially negatively affect future results of operations.
Dividends may include a return of capital, and shareholders may be required to recognize capital gain on distributions.
Dividends payable to shareholders may include a return of capital. To the extent dividends exceed cash flow from operations, a shareholder’s basis in our shares will be reduced and, to the extent dividends exceed a shareholder’s basis, the shareholder may recognize capital gain and be required to make tax payments.
We depend on certain executive officers and trustees, and the loss of such persons may delay or hinder our ability to carry out our investment strategies.
Our future success substantially depends on the active participation of James Wieland, one of our trustees, Kenneth Regan, our Chief Executive Officer and a trustee, and Joel Thomsen, ourPresident, Damon Gleave, Chief Financial Officer and Treasurer, and Barry Schmiess, Chief Investment Officer. Messrs. Wieland, Regan, and Thomsen are also governors and owners of theour Advisor. Messrs. Wieland, and Regan, have over 3740 years of extensive experience each in the commercial real estate industry, and have been instrumental in setting our strategic direction, operating our business and arranging necessary financing, and through the Advisor, in locating desirable real estate investments and wherewere serving as property manager, managing our properties. Losing the services of Messrs. Wieland, Regan, Thomsen, Gleave, or ThomsenSchmiess without replacing their position with someone of the same competence and experience, could have a material adverse effect on our ability to successfully carry out our investment strategies and achieve our investment objectives. There can be no guarantee they will remain affiliated with us. See “Risks Related to Conflicts of Interest.”Interest”.
Our systems9
Cybersecurity risks and cyber incidents may not be adequate to support our growth, and our failure to successfully oversee our portfolio of real estate investments could adversely affect our business by causing a disruption to our operations, a compromise or corruption of our confidential information, and/or damage to our business relationships, all of which could negatively impact our financial results.
A cyber incident is considered to be any adverse event that threatens the confidentiality, integrity or availability of our information resources. These incidents may be an intentional attack or an unintentional event and could involve gaining unauthorized access to our information systems for purposes of misappropriating assets, stealing confidential information, corrupting data, or causing operational disruption. The result of these incidents may include disrupted operations, misstated or unreliable financial data, liability for stolen assets or information, increased cybersecurity protection and insurance costs, litigation, and damage to our investor relationships. As our reliance on technology has increased, so have the risks posed to our information systems, both internal and those provided by Sterling Management and service providers. Our and Sterling Management’s processes, procedures and internal controls that are designed to mitigate cybersecurity risks and cyber intrusions do not guarantee that a cyber incident will not occur or that our financial results, operations, or confidential information will not be negatively impacted by such an incident.
We are not required to comply with certain reporting requirements, including those relating to auditor’s attestation reports on the effectiveness of operation.our system of internal control over financial reporting, accounting standards and disclosure about our executive compensation, that apply to other public companies.
There can be no assuranceSo long as our shares of common stock are not traded on a securities exchange, we will be abledeemed to adaptbe a “non-accelerated filer” under the Exchange Act, and as a non-accelerated filer, we will be exempt from compliance with the auditor attestation requirements of Section 404 of the Sarbanes-Oxley Act. In addition, so long as we are externally managed by the Advisor and we do not directly compensate our management,executive officers, or reimburse the Advisor or its affiliates for salaries, bonuses, benefits and severance payments for persons who also serve as one of our executive officers or as an executive officer of the Advisor, we do not have any executive compensation.
Many of our costs, such as operating and general and administrative accounting and operational systems, or hire and retain sufficient staff, to support any growth we may experience. Our failure to successfully oversee our current and futureexpenses, real estate investmentsacquisition, and constructions costs, could be adversely impacted by period of heightened inflation.
A sustained or developmentsfurther increase in inflation could have a materialan adverse effectimpact on our results of operationoperating expenses incurred in connection with, among others, the property-related services such as repairs and financial conditionmaintenance, janitorial, utilities, security and our ability to pay dividends to our shareholders.insurance. Our operating expenses may be recoverable through commercial lease arrangements.
Risks Related to Our Structure
There are limitations on ownership of our common shares of beneficial interest, which could discourage a takeover transaction even if it is beneficial to our shareholders.
Our Amended Declaration of Trust provides no person may own more than 9.9% of our outstanding common shares of beneficial interest. Even if a shareholder did not acquire more than 9.9% of our shares, the shareholder may become subject to such restrictions if redemptions by other shareholders cause the holdings to exceed 9.9% of our outstanding shares. This limitation may have the effect of delaying, deferring or preventing a transaction or a change in control of us, including an extraordinary transaction (such as a merger, tender offer or sale of all or substantially all of our assets) that might provide a premium price for our shareholders, even if it would be in the best interest of our shareholders. The ownership limits and restrictions on transferability will continue to apply until our Board of Trustees determines it is no longer in our best interest to continue to qualify or seek to qualify as a REIT.
13
Our shareholders may experience dilution if we or our operating partnership issues additional securities.
Our shareholders do not have preemptive rights to any shares issued by us in the future. If we sell or issue additional shares in the future to raise capital, issue additional shares pursuant to a dividend reinvestment plan or issue shares in exchange for limited partnership units pursuant to theour operating partnership’s Limited Liability Limited Partnership Agreement (“LLLP Agreement”) of our operating partnership,, our shareholders will experience dilution of their equity investment in us.investment. In addition, if our operating partnership sells additional securities or issues additional securities in connection with a property acquisition transaction, we would, and indirectly our shareholders would, experience dilution in their equity position in the operating partnership.position.
Our shareholderssecurityholders have limited control over our operation, and the Board of Trustees has the sole power to appoint and terminate the Advisor.
Our Board of Trustees has the sole authority to determine our major policies, including our policies regarding financing, growth, investment strategies, debt capitalization, REIT qualification, distribution, and to take certain actions including acquiring or disposing of real estate and real estate related investments, dividend declaration and the election or removal of the Advisor. Our shareholderssecurityholders do not have the right to remove the Advisor but have the right to elect and remove trustees.
10
Under theour Third Amended and Restated Declaration of Trust, our trustees may not do the following without the approval of the holders of a majority of the outstanding common shares of beneficial interest:
| Amend the Third Amended and Restated Declaration of Trust, except for amendments which do not adversely affect the rights, preference and privileges of |
| Sell all or substantially all of our assets other than in the ordinary course of business or in connection with a liquidation and |
| Conduct a merger or other reorganization of the trust; or |
| Dissolve or liquidate us. |
In addition, theOur shareholders have the right, without the concurrence of the Board of Trustees, to terminate the trust and liquidate our assets or amend the Third Amended and Restated Declaration of Trust.
Shareholders have no role in determining our investments and must rely on our Advisor and oversight by the Board of Trustees.
For future acquisitions or dispositions, the Board of Trustees has the authority to approve such investment acquisitions or dispositions without shareholder approval. Therefore, shareholders will not be able to evaluate the terms of future investment acquisitions or dispositions, their economic merit or other relevant financial data before we acquire or sell such investments. The shareholdersShareholders must rely entirely on the oversight of our Board of Trustees, the management ability of our Advisor and the performance of the property managers.
We may issue securities with more favorable terms than the outstanding shares without shareholder approval.
Under our Third Amended and Restated Declaration of Trust, our Board of Trustees has the authority to establish more than one class or series of shares and to fix the relative preferences and rights regarding conversion, voting powers, restrictions, limitations as to dividends and other distributions, and terms or conditions of redemption of such different classes or series without shareholder approval. Thus, our Board could authorize the issuance of a class or series of shares with terms and conditions that could have priority as to dividends and amounts payable upon liquidation over the rights of the holders of our outstanding common shares of beneficial interest. Such class or series of shares could also have the effect of delaying, deferring or preventing a change in control of us, including an extraordinary transaction (such as a merger, tender offer or sale of all or substantially all of our assets) that might otherwise provide a premium price to holders of our shares, even if it would be in the best interest of our shareholders.
14
Shareholders could incur current tax liability on dividends they elect to reinvest in our shares, and may have to use separate funds to pay their tax liability.
Shareholders that participate in our dividend reinvestment plan will be deemed to have received, and for income tax purposes will be taxed on, the amount reinvested in shares to the extent the amount reinvested was not a tax-free return of capital. In addition, our shareholders will be treated for tax purposes as having received an additional dividend to the extent the shares are purchased at a discount to fair market value. As a result, unless shareholders are a tax-exempt entity, they may have to use funds from other sources to pay their tax liability on the value of the shares received.
Our trustees, officers, Advisor and its affiliates have limited liability to us and our shareholders, and may have the right to be indemnified under certain conditions.
Our Amended Declaration
11
There may be conflicts of interest between us and our shareholders on one side and our operating partnership and its limited partners on the other side.
Our trustees and officers have duties to us and our shareholders in connection with their management of us. At the same time, we, as general partner will have duties to our operating partnership and its limited partners in connection with the management of the operating partnership. Our duties as general partner of the operating partnership may come into conflict with the duties of our trustees and officers to us and our shareholders. The LLLP Agreement of our operating partnership expressly limits our liability for monetary damages by providing we will not be liable for losses sustained, liabilities incurred or benefits not derived if we acted in good faith. In addition, our operating partnership is required to indemnify us and our trustees and officers from and against any and all claims arising from operations of our operating partnership, unless it is established: (1) the act or omission was material and committed in bad faith or was the result of active and deliberate dishonesty; (2) the indemnified party received an improper personal benefit in money, property or services; or (3) in the case of a criminal proceeding, the indemnified person had reasonable cause to believe the act or omission was unlawful. The LLLP Agreement also provides that we will not be held responsible for any misconduct or negligence on the part of any agent appointed by us in good faith.
If we are deemed to be an investment company under the Investment Company Act, our shareholders’ investment return may be reduced.
We are not registered as an investment company under the Investment Company Act of 1940, as amended (“Investment Company Act”) based on exemptions we believe are available to us. If we were obligated to register as an investment company, we would have to comply with a variety of substantive requirements under the Investment Company Act. Registration as an investment company would be costly, would subject us to a host of complex regulations, and would divert the attention of management from the conduct of our business. If the SEC or a court of competent jurisdiction were to find we are required, but in violation of the Investment Company Act had failed, to register as an investment company, possible consequences include, but are not limited to, the following: (i) the SEC could apply to a district court to enjoin the violation; (ii) our shareholders could sue us and recover any damages caused by the violation; (iii) any contract to which we are party made in, or whose performance involves a violation of the Investment Company Act would be unenforceable by any party to the contract unless a court were to find that under the circumstances enforcement would produce a more equitable result than non-enforcement and would not be inconsistent with the purposes of the Investment
15
Company Act; and (iv) criminal and civil actions could be brought against us. Should we be subjected to any or all of the foregoing, our operations and results of operations would be materially and adversely affected.
There is no public trading market for our shares, nor do we expect one to develop, which may negatively impact a shareholdersour shareholders’ ability to sell their shares and the price at which shares may be sold.
There is no public market for our shares and there is no assurance one may develop. In addition, the price shareholders may receive for the sale of their shares is likely to be less than the proportionate value of our investments. If our shareholders are able to find a buyer for their shares, they may have to sell them at a substantial discount from the price they purchased the shares. Consequently, shareholders may not be able to liquidate their investments in the event of emergency or for any other reason. Therefore, shareholders should consider our securities as illiquid and a long-term investment and should be prepared to hold their shares for an indefinite period of time.
The estimated value of our common stock is based on a number of assumptions and estimates that may not be accurate and is also subject to a number of limitations.
The current estimated value of our common stock equals $18.50as of January 1, 2023, is approximately $23.00 per share. The methodology used by our boardBoard to determine this value was based on estimates of the value of our real estate investments, cash and other assets and debt and other liabilities as of a date certain and no subsequentcertain additional information. No formal valuation has been undertaken by us. TheOur valuation process involves a number of estimates, assumptions and subjective judgments that may not be accurate and complete. Further, different parties using different assumptions and estimates could derive a different estimated value per share, which could be significantly different from our estimated value per share. The estimated value per share may not represent current market values or fair values as determined in accordance with U.S. generally accepted accounting principles. The estimated value of our real estate assets used in the analysis may not necessarily represent the value we would receive or accept if the assets were marketed for sale. Further, acquisitions and dispositions of properties will have an effect on the value of our estimated price per share, which is not reflected in the current estimated price. Moreover, the estimated per share value of the common stock does not reflect a liquidity discount for the fact that the shares are not currently traded on a public market, a discount for the non-assumability or prepayment obligations associated with certain loans and other costs that may be incurred in connection with the sale of assets. A shareholder should not rely on the estimated value per share as being an accurate or precise measure of the then-current value of the shares of our common stock in making a decision to buy or sell shares of our common stock, including whether to reinvest dividends by participating in the dividend reinvestment plan and whether to request redemption pursuant to our share redemption program.
Shareholders may not be able to have their shares redeemed under the Share Redemption Plan, and if shareholders do redeem their shares, they will not receive the current value of the shares.
We have adopted a share redemption plan. However, our Board of Trustees can limit, suspend, terminate or amend the plan at any time without shareholder approval, and there is no assurance we will have sufficient funds available at the time of any request to honor a redemption request for cash. Shares redeemed under this plan may be purchased at a discount to the current price of the shares or to the price paid for such shares by the shareholder. Therefore, shareholders may not receive the amount they paid for the shares and may receive less by selling their shares back to us than they would receive if they were to sell their shares to other buyers.
There are transfer restrictions on the shares, and we do not plan to register the shares for resale.
Other than shares issued under our dividend reinvestment plan, we have not registered our shares under federal or state securities laws, but rather we have sold the shares in reliance on exemptions under applicable federal and state securities laws. Therefore, the shares may be “restricted securities” and may not be resold unless they are subsequently registered under the Securities Act and applicable state securities laws or pursuant to exemption from such registration requirements or may have other transfer restrictions based on the exemption relied on for the sale of the shares. We are not obligated to, nor do we currently plan to, register any shares for resale.
16
Risks Related to Our Status as a REIT and Related Federal Income Tax Matters
If we fail to continue to qualify as a REIT, we would incur additional tax liabilities that would adversely affect our operations and our ability to make distributions and could result in a number of other negative consequences.
Although our management believes we are organized, have operated, and will be able to continue to be organized and to operate in such a manner to qualify as a real estate investment trust (REIT), as that term is defined under the Internal Revenue Code, we may not have been organized, may not have operated, or may not be able to continue to be organized or to operate in a manner to have qualified or remain qualified as a REIT. Qualification as a REIT involves the application of highly technical and complex Internal Revenue Code provisions for which there are only limited judicial or administrative interpretations. Even a technical or inadvertent mistake could endanger our REIT status.
12
The determination that we qualify as a REIT requires an ongoing analysis of various factual matters and circumstances, some of which may not be within our control, regarding our organization and ownership, distributions of our income and the nature and diversification of our income and assets. The fact we hold substantially all of our assets through our operating partnership and our ongoing reliance on factual determinations, such as determinations related to the valuation of our assets, further complicates the application of the REIT requirements for us.
If we lose our REIT qualification, we will face income tax consequences that will reduce substantially our available cash for dividends and investments for each of the years involved because:
| We would be subject to federal corporate income taxation on our taxable income, including any applicable alternative minimum tax, and could be subject to increased state and local |
| We would not be allowed a deduction for dividends paid to shareholders in computing our taxable income; and |
| Unless we are entitled to relief under applicable statutory provisions, we could not elect to be taxed as a REIT for four taxable years following the year during which we were disqualified. |
The increased taxes could reduce the value of the shares as well as cash available for dividends to shareholders and investments in additional assets. In addition, if we fail to continue to qualify as a REIT, we will not be required to pay dividends to shareholders. Our failure to continue to qualify as a REIT also could impair our ability to expand our business and to raise capital.
As a REIT, we may be subject to tax liabilities that reduce our cash flow.
Even if we continue to qualify as a REIT for federal income tax purposes, we may be subject to federal and state taxes on our income or property, including the following:
| To continue to qualify as a REIT, we must distribute annually at least 90% of our REIT taxable income (which is determined without regard to the dividends-paid deduction or net capital gains) to our shareholders. If we satisfy the distribution requirement but distribute less than 100% of our REIT taxable income, we will be subject to corporate income tax on the undistributed income. In such situation, shareholders will be treated as having received the undistributed income and having paid the tax directly, but tax-exempt shareholders, such as charities or qualified pension plans, will receive no benefit from any deemed tax payments. |
| We may be subject to state and local taxes on our income or property, either directly or indirectly, because of the taxation of our operating partnership or of other entities through which we indirectly own our assets. |
| If we have net income from the sale of foreclosure property we hold primarily for sale to customers in the ordinary course of business or other non-qualifying income from foreclosure property, we must pay a tax on that income at the highest corporate income tax rate. |
| If we sell a property, other than foreclosure property, we hold primarily for sale to customers in the ordinary course of business, our gain will be subject to the 100% “prohibited transaction” tax. |
| We will be subject to a 4% nondeductible excise tax on the amount, if any, by which the distributions we pay in any calendar year are less than the sum of 85% of our ordinary income, 95% of our capital gain net income, and 100% of our undistributed income from prior years. |
17
13
We may be forced to borrow funds on a short-term basis, to sell assets or to issue securities to meet the REIT minimum distribution requirement or for working capital purposes.
To qualify as a REIT, in general, we must distribute to our shareholders at least 90% of our net taxable income each year, excluding capital gains. However, we could be required to include earnings in our net taxable income before we actually receive the related cash. If we do not have sufficient cash to pay the necessary dividends to preserve our REIT status for any year or to avoid taxation, we may need to borrow funds, to sell assets or to issue additional securities even if the then-prevailing market conditions are not favorable for such actions.
In addition, we will require a minimum amount of cash to fund our daily operations. Due to the REIT distribution requirements, we may be forced to make distributions when we otherwise would use the cash to fund our working capital needs. Therefore, we may be forced to borrow funds, to sell assets or to issue additional securities at certain times for our working capital needs.
If our operating partnership does not qualify as a partnership, its income may be subject to taxation, and we would no longer qualify as a REIT.
The Internal Revenue Code classifies “publicly traded partnerships” as associations taxable as corporations (rather than as partnerships), unless substantially all of their taxable income consists of specified types of passive income. We structured our operating partnership to be classified as a partnership for federal income tax purposes. However, no assurance can be given the IRS will not challenge our position or will classify our operating partnership as a “publicly traded partnership” for federal income tax purposes. To minimize this risk, we have placed certain restrictions on the transfer and/or redemption of partnership units in the LLLP Agreement. If the IRS would assert successfully our operating partnership should be treated as a “publicly traded partnership” and substantially all of the operating partnership’s gross income did not consist of the specified types of passive income, the Internal Revenue Code would treat the operating partnership as an association taxable as a corporation. In such event, we would cease to qualify as a REIT. In addition, the imposition of a corporate tax on the operating partnership would reduce the amount of distributions the operating partnership could make to us and, in turn, reduce the amount of cash available to us to pay dividends to our shareholders.
We have transfer restrictions on our shares that may limit offers to acquire substantial amounts of the trust’sTrust’s shares at a premium.
To qualify as a REIT, our shares must be beneficially owned by 100 or more persons and no more than 50% of the value of our issued and outstanding shares may be owned directly or indirectly by five or fewer individuals. Currently, ourThird Amended and Restated Declaration of Trust prohibits transfers of our shares that would result in: (1) our shares being beneficially owned by fewer than 100 persons, (2) five or fewer individuals, including natural persons, private foundations, specified employee benefit plans and trusts, and charitable trusts, owning more than 50% of our shares, applying broad attribution rules imposed by the federal income tax laws, or (3) before our shares qualify as a class of publicly-offered securities, 25% or more of our shares being owned by ERISA investors. If a shareholder acquires shares in excess of the ownership limits or in violation of the restrictions on transfer, we:
| May consider the transfer to be void ab initio. |
| May not reflect the transaction on our books. |
| May institute legal action to enjoin the transaction. |
| May redeem such excess shares. |
| Automatically transfer any excess shares to a charitable trust for the benefit of a charitable beneficiary. |
If such excess shares are transferred to a trust for the benefit of a charitable beneficiary, the charitable trustee shall sell the excess shares and the shareholder will be paid the net proceeds from the sale equal to the lesser of: (1) the price paid by the shareholder or the “market price” of our shares if no value was paid or (2) the price per share received by the charitable trustee.
18
14
If shares are acquired in violation of the ownership limits or the restrictions on transfer described above:
| Transferee may lose its power to dispose of the shares; and |
| Transferee may incur a loss from the sale of such shares if the fair market price decreases. |
These limitations may have the effect of preventing a change of control or takeover of us by a third party, even if the change in control or takeover would be in the best interest of our shareholders.
Complying with REIT requirements may restrict our ability to operate in a way to maximize profits.
To qualify as a REIT, we must continually satisfy tests concerning, among other things, the sources of our income, the nature and diversification of our assets, the amounts we distribute to our shareholders, and the ownership of our common shares. For example, we may be required to pay dividends to our shareholders at disadvantageous times, including when we do not have readily available funds. Thus, compliance with the REIT requirements may hinder our ability to operate solely on the basis of maximizing profits.
Complying with REIT requirements may force us to forego or liquidate otherwise attractive investments which could negatively impact shareholder value.
To qualify as a REIT, at the end of each calendar quarter, at least 75% of our assets must consist of cash, cash items, government securities and qualified real estate assets. The remainder of our investments in securities (other than government securities and qualified real estate assets), in general, cannot include more than 10% of the voting securities of any one issuer or more than 10% of the value of the outstanding securities of any one issuer. In addition, no more than 5% of the value of our assets (other than government securities and qualified real estate assets) can consist of the securities of any one issuer, and no more than 25% of the value of our assets may be represented by securities of one or more taxable REIT subsidiaries. Therefore, we may be required to liquidate otherwise attractive investments or may be forced to forego attractive investments to satisfy these requirements. Such action or inaction could be adverse to our shareholder interests.
Gains from asset sales may be subject to a 100% prohibited transaction tax, which tax could reduce the trust’sTrust’s available assets and reduce shareholder value.
We may have to sell assets from time to time to satisfy our REIT distribution requirements and other REIT requirements or for other purposes. The IRS may posit one or more asset sales may be “prohibited transactions.” If we are deemed to have engaged in a “prohibited transaction,” our gain from such sale would be subject to a 100% tax. The Internal Revenue Code sets forth a safe harbor for REITs that wish to sell property without risking the imposition of the 100% tax, but we cannot assure you we will be able to qualify for the safe harbor. We will use reasonable efforts to avoid the 100% tax by: (1) conducting activities that may otherwise be considered a prohibited transaction through a taxable REIT subsidiary, (2) conducting our operations in such a manner so no sale or other disposition of an assetand we own, directly or through any subsidiary other than a taxable REIT subsidiary, will be treated as a prohibited transaction or (3) structuring certain sales of our assets to comply with a safe harbor available under the Internal Revenue Code. We do not intend to hold assets in a manner to cause their dispositions to be treated as “prohibited transactions,” but we cannot assure you the IRS will not challenge our position, especially if we make frequent sales or sales of assets in which we have short holding periods. Payment of a 100% tax would adversely affect our results of operations.
Ordinary dividends payable by REITs generally are taxed at the higher ordinary income rate which could reduce the net cash received by shareholders as a result of an investment in the trust and may be detrimental to our ability to raise additional funds through the sale of our common shares.shareholders.
The maximum U.S. federal income tax rate for “qualified dividends” payable by U.S. corporations to individual U.S. shareholders currently is 20% in. In addition, the 3.8% tax on net investment income may apply to such dividends. In general, ordinary dividends payable by REITs to its individual U.S. shareholders, however, are generally not eligible for the reduced rates and generally are taxed at ordinary income rates (for REIT dividends received after December 31, 2017, the maximum individual income tax rate currently is 37%, but the current maximum, effective federal income tax rate as to REIT
19
dividends may be reduced to 29.6% because of a partial deduction that may apply with respect to REIT dividends; in addition, the 3.8% tax on net investment income may apply to REIT dividends). It is possible also thatpossible tax legislation enacted in 2018that has or subsequent yearsmay be enacted might increase this rate differential. The differing treatment of dividends received from REITs and other corporations might cause individual investors to view an investment in REITs as less attractive related to other corporations which might be detrimental to our ability to raise additional funds through the sale of our common shares.
15
Changes in legislative or other actions affecting REITs may adversely affect our status as a REIT.
The rules dealing with U.S. federal income taxation are constantly under review by the legislative process, the IRS and the U.S. Treasury Department. Changes to tax laws (which changes may apply retroactively) could adversely affect us or our shareholders. Furthermore, new legislation, regulations, administrative interpretations or court decisions could change the federal income tax laws with respect to our qualification as a REIT or the federal income tax consequences of our qualification. We cannot predict whether, when, in what forms, or with what effective dates, the laws applicable to us or our shareholders may be changed.
Our Board of Trustees may revoke our REIT election without shareholder approval, and we would no longer be required to make distributions of our net income.
Our Board of Trustees can revoke or otherwise terminate our REIT election without the approval of our shareholders if our Board determines it is not in our best interest to continue to qualify as a REIT. In such case, we would become subject to U.S. federal income tax on our taxable income, and we no longer would be required to distribute most of our net income to our shareholders, which may reduce the total return to our shareholders and affect the value of the shares.
Risks Related to Tax-Exempt Investors
Common shares may not be a suitable investment for tax-exempt investors.
There are special considerations that apply to investing in common shares on behalf of a trust, pension, profit sharing or 401(k) plans, health or welfare plans, trusts, individual retirement accounts (IRAs), or Keogh plans. If you are investing the assets of any of the above in common shares, you should satisfy yourself:
| Your investment is consistent with your fiduciary obligations under applicable law, including common law, ERISA and the Internal Revenue |
| Your investment is made in accordance with the documents and instruments that govern the trust, plan or IRA, including any investment |
| Your investment satisfies the prudence and diversification requirements of Sections 404(a)(1)(B) and 404(a)(1)(C) of ERISA and other applicable provisions of ERISA and the Internal Revenue |
| Your investment will not impair the liquidity of the trust, plan or |
| Your investment will not produce “unrelated business taxable income” for the trust, plan or |
| You will be able to value the assets of the trust, plan or IRA annually in accordance with ERISA requirements and applicable provisions of the trust, plan, or IRA; and |
| Your investment will not constitute a prohibited transaction under Section 406 of ERISA or Section 4975 of the Internal Revenue Code. |
We have not evaluated, and will not evaluate, whether an investment in us is suitable for any particular trust, plan, or IRA.
20
16
Under certain circumstances, tax-exempt shareholders may be subject to unrelated business taxable income, which could adversely affect such shareholders.
Neither ordinary nor capital gain distributions with respect to our common shares nor gain from the sale of our common shares, in general, should constitute unrelated business taxable income to tax-exempt shareholders. The following, however, are some exceptions to this rule:
| Under certain circumstances, part of the income and gain recognized by certain qualified employee pension trusts with respect to our common shares may be treated as unrelated business taxable income if our common shares are held predominately by qualified employee pension trusts (which we do not expect to be the case) |
| Part of the income and gain recognized by a tax-exempt shareholder with respect to common shares would constitute unrelated business taxable income if the tax-exempt shareholder incurs debt to acquire the common shares; and |
| Part or all of the income or gain recognized with respect to our common shares held by social clubs, voluntary employee benefit associations, supplemental unemployment benefit trusts and qualified group legal services plans that are exempt from federal income taxation under Sections 501(c)(7), (9), (17), or (20) of the Internal Revenue Code may be treated as unrelated business taxable income. |
Therefore, tax-exempt shareholders are not assured all dividends received from the trust will be tax-exempt.
17
Risks Related to Our Relationship with the Advisor and Its Affiliates
We depend on our Advisor for the successful operations of the REIT, and if required, we may not be able to find a suitable replacement advisor.
Our ability to achieve our investment objectives is dependent upon the successful performance of our Advisor in locating attractive acquisitions, advising on dispositions of real estate properties and other real estate related assets, advising on any financing arrangements and other administrative tasks to operate our business. If the Advisor suffers or is distracted by adverse financial and operational problems in connection with its operations unrelated to us or for any reason, it may be unable to allocate a sufficient amount of time and resources to our operations. If this occurs, our ability to achieve our investment objectives or pay dividends to our shareholders may be adversely affected. Any adversity experienced by the Advisor or problems in our relationship with the Advisor could also adversely impact the operation of our properties and, consequently, our cash flow and ability to pay dividends to shareholders.
Either we or the Advisor can terminate the Advisory Agreement upon 60 days written notice to the other party for any reason, or we can terminate the Advisory Agreement immediately for cause or material breach of the Advisory Agreement. In addition, the Board of Trustees may determine not to renew the Advisory Agreement in any year. If this occurs, we would need to find another advisor to provide us with day-to-day management services or engage employees to provide these services directly to us, which would likely be difficult to do and may be costly. There can be no assurances we would be able to find a suitable replacement advisor or suitable employees or enter into agreements for such services on acceptable terms.
The termination or replacement of the Advisor could trigger a default or repayment event under financings.
Lenders providing financing for our acquired properties may include provisions in the mortgage loan documentation that state the termination or replacement of the Advisor is an event of default or an event triggering acceleration of the repayment of the loan in full. Even though we will attempt to have such provisions excluded from the loan documents, the lenders may still require them to be included. In addition, the termination or replacement of the Advisor could trigger an event of default under any credit agreement governing a line of credit we may obtain in the future.obtain. If an event of default or repayment event occurs with respect to any of our properties, our ability to achieve our investment objectives could be materially adversely affected.
21
The Advisor may not be able to retain its key employees, which could adversely affect our ability to carry out our investment strategies.
We depend on the retention by the Advisor of itsAdvisor’s key officers, employees and governors. However, none of these individuals have an employment agreement with the Advisor. TheAdvisor and the loss of any or all of thesuch person’s services by the Advisor’s key officers, employees and governors and the Advisor’s inability to find, or any delay in finding, replacements with equivalent skills and experience, could adversely impact our ability to successfully carry out our investment strategies and achieve our investment objectives.
Our future success also depends on the Advisor’s and its affiliates’ ability to identify, hire, train and retain highly qualified real estate, managerial, financial, marketing, and technical personnel to provide the services to us pursuant to the Advisory Agreement and any other written services agreement, including any property management agreements. Competition for such personnel is intense, and the Advisor or its affiliates may not be able to attract, assimilate or retain such personnel in the future. The inability to attract and retain the necessary personnel could have a material adverse effect on our business and results of operations.
Payment
18
Table of fees and expenses to the Advisor reduces the cash available for dividends.Contents
The Advisor performs services for us in connection with the selection, acquisition and disposition of our investments; the management of our assets; and certain administrative services. We pay the Advisor an annual management fee, reimbursement for operating and acquisition expenses as well as acquisition, disposition, financing and development fees. Such fees and payments reduce the amount of cash available for further investments or dividends to our shareholders. Additionally, such fees increase the risk shareholders may receive a lower price when they resell their shares than the purchase price they initially paid for their shares.
Risks Related to Investments in Real Estate
Our performance could be adversely affected by the general risks involved in real estate investments.
Our results of operation and financial condition, the value of our real estate assets, and the value of an investment in us are subject to the risks normally associated with the ownership and operation of real estate properties, including, among others:
|
|
|
|
|
|
|
|
|
|
|
|
|
|
|
|
|
|
|
|
All of these factors are beyond our control. Any negative changes in these factors could affect our ability to meet our obligations, pay dividends to shareholders or achieve our investment objectives.
22
Market disruptions may significantly and adversely affect our financial condition and results of operations.
Our results of operations may be sensitive to changes in overall economic conditions impacting tenant leasing practices, such as increased unemployment, weakening of tenant financial condition, large-scale business failures and tight credit markets. Adverse economic conditions affecting tenant income, such as employment levels, business conditions, interest rates, tax rates, fuel and energy costs and other matters, could reduce overall tenant leasing or cause tenants to shift their leasing practices. In addition, periods of economic slowdown or recession, rising interest rates or declining demand for real estate, or the public perception any of these events may occur, could result in a general decline in rents or an increased incidence of defaults under existing leases. A general reduction in the level of tenant leasing could adversely affect our ability to maintain our current occupancy rates and gain new tenants, affecting our growth and profitability. Accordingly, difficult financial and macroeconomic conditions could have a significant adverse effect on our cash flows, profitability and results of operations.
Lack ofInsufficient geographic diversity of our real estate investments could adversely affect our operating results if economic changes impact those real estate markets.markets where we own significant assets.
Geographic concentration of our properties may expose us to economic downturns in those areas where our properties are located. A recession in any area where we own several properties or interests in properties could adversely affect our ability to generate or increase operating revenues, locate, and retain financially sound tenants or dispose of unproductive properties. In addition, it could have an adverse impact on our tenant’s revenues, costs and results of operations and may adversely affect their ability to meet their obligations to us. Likewise, we may be required to lower our rental rates to attract desirable tenants in such an environment. Currently, the majority of our properties are located in North Dakota and Minnesota, and we hold several properties in Fargo, North Dakota.Dakota and Moorhead, Minnesota. To the extent weak economic or real estate conditions affect North Dakota, Minnesota, or other markets in which we own properties more severely than other areas of the country, our financial performance could be negatively impacted.
We face numerous risks associated with property acquisitions which could adversely affect our operating results.
Through our operating partnership, we acquire properties and portfolios of properties. Our acquisition activities and their success are subject to the following risks typically encountered in real estate acquisitions:
|
|
|
|
|
|
|
|
|
|
|
|
These risks could have an adverse effect on our results of operation, our financial condition and the amount available for payment of dividends to our shareholders.
We may invest in and develop undeveloped real property, which requires us to pay expenses prior to receiving any income on the property.
We have the discretion to invest up to 10% of our total assets in undeveloped property. IfWhen we invest in undeveloped property, such property willdoes not generate operating revenue while costs are incurred to develop the property and may generate other expenses including property taxes and insurance. In addition, construction and development of such properties may not be completed within budget or as scheduled and projected rental levels may not be achieved. In addition to the risks of real estate investments
23
in general, an investment in undeveloped property is subject to additional risks, including the expense and delay which may be associated with rezoning the land for a higher use and the development and environmental concerns of governmental entities and/or community groups. Therefore, we will not generate income on such property until development is completed and we begin leasing the property.
We may acquire multiple properties in a single transaction, which may adversely affect our operations through the inclusion of less desirable investments or financing requirements greater than we would otherwise be willing to incur.
Periodically, we may acquire multiple properties in a single transaction. Portfolio acquisitions are more complex and expensive than single property acquisitions, and the risk a multiple property acquisition does not close may be greater than in a single property acquisition. Portfolio acquisitions may also result in us owning investments in geographically dispersed markets, placing additional demands on our ability to manage the properties in the portfolio. In addition, a seller may require a group of properties be purchased as a package even though we may not want to purchase one or more properties in the portfolio. In these situations, if we are unable to identify another person or entity to acquire the unwanted properties, we may be required to operate or attempt to dispose of these properties. To acquire multiple properties in a single transaction we may be required to accumulate a large amount of cash. We would expect the returns we can earn on such cash to be less than the ultimate returns in real property and therefore, accumulating such cash could reduce the funds available for dividends. Any of the foregoing events may increase the risk of adverse business results and negatively affect our results of operations.
We may invest in co-ventures, where our co-venture partners, co-tenants or other partners in co-ownership arrangements could take actions that decrease the value of a real estate investment and lower our overall return.
We may enter into joint ventures, tenant-in-common investments or other co-ownership arrangements with our Advisor, its affiliates, our trustees, or third parties having investment objectives similar to ours in the acquisition of real estate investments. In such arrangements, we may be acquiring non-controlling interests in or sharing responsibility for managing the affairs of the joint venture.investment. In such event, we would not be in a position to exercise sole decision-making authority regarding the joint venture.authority. Investments in joint venturessuch as these may, under certain circumstances, involve risks not present where another party is not involved, including the possibility that partners or co-venturersco-investees might become bankrupt or fail to fund their required capital contributions. Co-venturersCo-investees may have economic or other business interests or goals which are inconsistent with our business interests or goals, and may be in a position to take actions contrary to our policies or objectives.
19
Such investments may also have the potential risk of impasses on decisions, such as a sale, because neither we nor the co-venturerco-investee would have full control over the joint venture. Disputes between us and co-venturersco-investees may result in litigation or arbitration that would increase our expenses and prevent our management and the Advisor from focusing their time and effort on our business. Consequently, actions by or disputes with co-venturersco-investees might result in subjecting additional risk to properties owned by the joint venture to additional risk.investment. In addition, we may in certain circumstances be liable for the actions of our co-venturers.co-investees. Any of these risks could subject us to liabilities in excess of those contemplated and reduce our returns on that investment.
We could experience difficulties or delays renewing leases or re-leasing space, which will increase our costs to maintain such properties without receiving income.
We derive a significant portion of our net income from rent received from our tenants. Our properties include both residential as well as commercial properties. If a tenant experiences a downturn in its business or other types of financial distress, it may be unable to make timely rental payments. If a significant number of tenants default on lease payments to us, it would cause us to lose the revenue associated with such leases and require us to find alternative sources of revenue to meet mortgage payments and prevent a foreclosure if the property is subject to a mortgage. If lease defaults occur, we may experience delays in enforcing our rights as landlord. Also, if our tenants decide not to renew their leases, terminate early or default on their lease, we may not be able to re-let the space or may experience delays in finding suitable replacement tenants. Even if tenants decide to renew or lease new space, the terms of renewals or new leases, including the cost of required renovations or concessions to tenants, particularly commercial tenants, may be less favorable to us than current lease terms. As a result, our net income and ability to pay dividends to shareholders could be materially
24
adversely affected. Further, if one of our properties cannot be leased on terms and conditions favorable to us, the property may not be marketable at a suitable price without substantial capital improvements, alterations, or at all.
We could face potential adverse effects if a commercial tenant is unable to make timely rental payments, declares bankruptcy or become insolvent.
If a tenant experiences a downturn in its business or other types of financial distress, it may be unable to make timely rental payments. Delayed rental payments could adversely affect cash flow available for dividends. If a commercial tenant declares bankruptcy or becomes insolvent, it may adversely affect the income produced by our properties. If a tenant defaults, we may experience delays and incur substantial costs in enforcing our rights as landlord. However, if a tenant files for bankruptcy, we cannot evict the tenant solely because of such bankruptcy. If a court authorizes the commercial tenant to reject and terminate its lease with us, our claim against the tenant for unpaid future rent would be subject to a statutory cap that might be substantially less than the remaining rent actually owed under the lease. In addition, it is unlikely a bankrupt tenant would pay in full amounts it owes us under a lease. Additionally, we may be required to incur additional costs in the form of tenant improvements and leasing commissions in our efforts to lease the space to a new tenant, as well as lower our rental rates to reflect any decline in market rents. This shortfall could adversely affect our cash flow and results of operations.
If our reserves for making capital improvements on our real estate investments are insufficient, we may be required to defer necessary capital improvements which could negatively affect our revenues.
We establish capital reserves on a property-by-property basis, as we deem appropriate. If we do not have enough reserves to cover the costs of capital improvements throughout the life of the real estate property and there is insufficient cash available from our operations, we may have to borrow funds or defer necessary improvements to the property. If we delay or do not make necessary capital improvements when needed, there are risks the property may decline in value and may result in fewer tenants maintaining or renewing their leases and attracting new tenants to the property. If this happens, we may not be able to maintain projected rental rates for affected properties, and our results of operations may be negatively impacted.
Properties will face significant competition for tenants, which could limit our profitability.
We face significant competition from owners, operators and developers of similar real estate properties designed and dedicated to serve tenants with the same needs as the tenants that occupy or could occupy our properties in the same market. These competitors may have greater resources than we do, and may have other advantages resulting from lower cost of capital and enhanced operating efficiencies. This competition may affect our ability to attract and retain tenants and may reduce the rents we are able to charge. These competing properties may have vacancy rates higher than our properties, which may result in their owners being willing to lease available space at lower prices than the space in our properties. Due to such competition, the terms and conditions of any lease we enter into with our tenants may vary substantially from those we anticipate when we acquire a property. Our properties experience competition from existing and planned projects, as well as newer developments located within the market area. We cannot assure competitors will not develop similar properties in the area or not be able to negotiate better leases for existing or new properties which could adversely affect the profitability and viability of our properties.
Increased affordability of single-family homes could limit our ability to retain residents, lease apartment units or increase or maintain rents.
The residential properties we own or may acquire can compete with numerous housing alternatives in attracting residents, including other apartment communities and single-family homes, as well as owner occupied single- and multifamily homes available to rent. Competitive housing in a particular area and the increasing affordability of owner occupied single- and multifamily homes available to rent or buy could adversely affect our ability to retain our residents, lease apartment units and increase or maintain rental rates.
25
Investments in real estate are illiquid, and we may not be able to resell a property on terms favorable to us.
We intend to hold real estate properties until such time as our Advisor determines a sale or other disposition appears to be advantageous to achieve our investment objectives or when our shareholders approve our termination and liquidation. Because real estate investments are relatively illiquid, it could be difficult for us to promptly sell one or more of our real estate properties on favorable terms. This may be a result of economic conditions, availability of financing, interest rates and other factors beyond our control. This may limit our ability to change our portfolio promptly in response to adverse changes in the performance of any such property or economic or market trends. We cannot predict the length of time needed to find a willing purchaser and to close the sale of a property. Real estate investments by their nature are often difficult or time consuming to liquidate. In addition, federal tax laws imposing a 100% excise tax on gains from sales of certain types of property sales by a REIT (generally, property viewed as being purchased for resale, rather than investment) could limit our ability to sell properties and may affect our ability to sell properties without adversely affecting returns to our shareholders. These restrictions could adversely affect our ability to achieve our investment objectives.
20
Valuations and appraisals of our investments may not necessarily correspond to realizable value.
We value our real estate properties initially at cost, which we expect to represent fair value at that time. After acquisition, valuations may include appraisals of our properties periodically. The valuation methodologies used to value our real estate properties will involve subjective judgments regarding such factors as comparable sales, rental and operating expense data, the capitalization and/or discount rate and projections of future rent and expenses based on appropriate analysis. Our investments in real estate related assets will initially be valued at cost, and thereafter will be valued periodically, or in the case of liquid securities, daily, as applicable, at fair value as determined by the Advisor in good faith. Although we believe our valuation procedures are designed to determine the accurate fair value of our assets, appraisals and valuations of our real estate properties and valuations of ourother investments in real estate related assets will be only estimates of fair value and therefore may not correspond to realizable value upon a sale of those assets.
Uninsured losses related to real estate investments may adversely affect our results of operation.
We purchase, and we may be required by lenders of mortgage loans or other financings to obtain, certain insurance coverage on our real estate investments. Either the property manager or the Advisor selects policy specifications and insured limits which it believes to be appropriate and adequate given the risk of loss, the cost of the coverage and industry practice. The nature of the tenants at the properties we hold may expose us and our operations to an increase in liability for personal injuries or other losses. There can be no assurance that such insurance will be sufficient to cover potential liabilities. Some of our policies may be subject to limitations involving large deductibles or co-payments and policy limits which may not be sufficient to cover losses. Furthermore, insurance against certain risks, such as terrorism, flood, and toxic mold, may be unavailable or available at commercially unreasonable rates or in amounts less than the full market value or replacement cost of the properties. There can be no assurance particular risks that are currently insurable, will continue to be insurable on an economical basis or current levels of coverage will continue to be available. If a loss occurs that is partially or completely uninsured, we may lose all or part of our investment in a property as well as the anticipated future cash flows from such properties. In addition, if the damaged properties are subject to recourse indebtedness, we would continue to be liable for the indebtedness, even if these properties were irreparably damaged. We may also be liable for any uninsured or underinsured personal injury, death, or property damage claims, which could result in decreased dividends to shareholders.
Discovery of toxic mold in or at our properties may adversely affect our results of operation.
Litigation and concern about indoor exposure to certain types of toxic molds have been increasing as the public becomes aware exposure to mold can cause a variety of health effects and symptoms, including allergic reactions. Toxic molds can be found almost anywhere; they can grow on virtually any organic substance, as long as moisture and oxygen are present. There are molds that can grow on wood, paper, carpet, foods and insulation. When excessive moisture accumulates in buildings or on building materials, mold growth will often occur, particularly if the moisture problem remains undiscovered or unaddressed. It is impossible to eliminate all mold and mold spores in the indoor environment. The difficulty in discovering indoor toxic mold growth could lead to a risk of lawsuits by affected persons and the risk that the cost to
26
remedy toxic mold could exceed the value of the property. We will attempt to acquire properties where there is no toxic mold or where there has not been any proceeding or litigation with respect to the presence of toxic mold. However, we cannot provide assurances toxic mold will not exist on any of our properties when we acquire the properties or will not subsequently develop on any of our properties.
We may acquire a property or properties “AS IS,” which increases the risk of an investment that requires us to remedy defects or costs without recourse to the prior owner.
We may acquire real estate properties “as is” with only limited representations and warranties from the property seller regarding matters affecting the condition, use and ownership of the property. As a result, if defects in the property (including any building on the property) or other matters adversely affecting the property are discovered, we may not be able to pursue a claim for any or all damage against the property seller. Such a situation could negatively affect our results of operations.
We may engage in leaseback transactions, which involve risks including a failure to qualify as a REIT.
From time to time we have purchased certain real estate properties and leased them back to the sellers of such properties. While we will use our best efforts to structure any such leaseback transactions to be characterized as a “true lease” so we will be treated as the owner of the property for federal income tax purposes, we cannot assure you the IRS will not challenge such characterization. If any such re-characterization were successful, deductions for depreciation and cost recovery relating to such real property would be disallowed, interest and penalties could be assessed by the IRS and it is possible, under some circumstances, we could fail to qualify as a REIT as a result.
We rely on affiliated and outside property managers to properly manage and lease our properties.
The Advisor and an affiliate of the Advisor serve as our mainprincipal property managers, and the Advisor has hired and intends to hire other affiliates and/or third parties to serve as additional property managers, to manage our properties and act as leasing agents to lease vacancies in our real estate properties. These property managers will have significant decision-making authority with respect to the management of our properties. Our ability to direct and control how our properties are managed may be limited. We will not, and the Advisor will not as to its affiliates and third partythird-party property managers, supervise any of the property managers or any of their respective personnel on a day-to-day basis. Thus, the success of our business may depend in large part on the ability of our property managers to manage the day-to-day operations and their ability to lease vacancies in our properties. Any adversity experienced by our property managers could adversely impact the operation and profitability of our properties and, consequently, our ability to achieve our investment objectives.
21
Risks Related with Our Indebtedness and Financing
Market conditions could adversely affect our ability to obtain financing.
As a REIT, we are required to distribute at least 90% of our taxable income (excluding net capital gains) to our shareholders in each taxable year, and thus our ability to retain internally generated cash is limited. Accordingly, our ability to acquire properties or to make capital improvements to or remodel properties can depend on our ability to obtain debt or equity financing from third parties or the sellers of properties or to sell other properties. We have incurred mortgage debt and pledged some or all of our properties as security for debt in order to obtain funds to acquire additional properties or for working capital. We have also obtained lines of credit to provide a flexible borrowing source of funds.
Market fluctuations and disruptions in the credit markets could significantly affect our ability to access capital. Reductions in our available borrowing capacity, or inability to establish a credit facility when required or when business conditions warrant, could then limit the number, size and quality of properties we could acquire or the amount of improvements we could make on acquired properties, which could materially affect our ability to achieve our investment objectives and may result in price or value decreases of our real estate assets.
27Derivatives and hedging activity could adversely affect cash flow.
We will incur mortgage indebtedness andbusiness, we use derivatives to manage our exposure to interest rate volatility on debt instruments, including hedging for future debt issuances. At other borrowings, which will increase our business risks.
We have obtained mortgage loans on many of our properties so we can use our capital to acquire additional real estate properties and make improvements on the properties. However,times we may not incur indebtednessutilize derivatives to decrease our exposure to floating interest rates. There can be no assurance that these hedging arrangements will have the desired beneficial impact. These arrangements, which can include a number of more than 300% of our net assets, unless such excess is approved by a majority of our trustees. High debt levels will causecounterparties, may expose us to incur higher interest charges, which would result in higher debt service payments and could be accompanied by restrictive covenants. If there is a shortfall between the cash flow from a property and the cash flow needed to service mortgage debt on that property, then the amount available for dividends to shareholders may be reduced. In addition, incurring mortgage debt increases the riskadditional risks, including failure of loss since defaults on indebtedness secured by a property may result in lenders initiating foreclosure actions. In that case, we could lose the property securing the loan in default, thus reducing the value of our shareholders’ investment.
For tax purposes, a foreclosure on any of our properties will be treated as: (1)counterparties to perform under these contracts, and may involve extensive costs, such as transaction fees or breakage costs, if we terminate them. No strategy can completely insulate us from the foreclosed debtrisks associated with interest rate volatility.
The phase out of LIBOR and transition to SOFR as a benchmark interest rate could have adverse effects.
In 2018, the Alternative Reference Rate Committee identified the Secured Overnight Financing Rate (“SOFR”) as the alternative to LIBOR. SOFR is nonrecourse, a salebroad measure of the property for a purchase price equalcost of borrowing cash overnight collateralized by U.S. Treasury securities, published by the Federal Reserve Bank of New York. By the end of 2023, it is expected that no new contracts will reference LIBOR and will instead use SOFR. Due to the outstanding balancebroad use of LIBOR as a reference rate, all financial market participants, including the debt securedCompany, are impacted by the mortgage or (2) if the foreclosed debt is recourse, a sale of the property for a purchase price equal to its fair market valuerisks associated with this transition and as cancellation of debt income to the extent, if any, the outstanding debt balance exceeds the fair market value. If the outstanding balance of the debt secured by the mortgage exceedstherefore it could adversely affect our tax basis in the property, we will recognize taxable income on foreclosure, but we would not receive anyoperations and cash proceeds. We may give full or partial guarantees to lenders of mortgage debt on behalf of our operating partnership, whereby we will be responsible to the lender for satisfaction of the debt if it is not paid by our operating partnership. If any mortgage contains cross-collateralization or cross-default provisions, a default on a single property could affect multiple properties. If any of our properties are foreclosed upon due to a default, our ability to pay cash dividends to our shareholders could be adversely affected.flows.
We could face difficulties in refinancing loans involving balloon payment obligations.
Some of our mortgage loans require us to make a lump-sum or “balloon” payment at maturity. Our ability to make a balloon payment at maturity could be uncertain and may depend upon our ability to obtain additional financing, to refinance the debt or our ability to sell the particular property. If we try and refinance the debt, we may not be able to obtain terms as favorable as the original loan. Based on historicalcurrent market interest rates, current interest rates are low and, as a result, it is likely the interest rate that will be obtained upon refinancing in subsequent years may be higher than the original loan. If we are not able to refinance the debt, or obtain acceptable terms, we may be required to sell the mortgaged property at a time which may not permit realization of the maximum return on such property. The effect of a refinancing or sale could affect the rate of return to shareholders and the projected time of disposition of our assets.
Lenders may require restrictive covenants relating to our operations, which may adversely affect our flexibility and our ability to achieve our investment objectives.
Some of our mortgageMortgage loans obtained by us could impose restrictions on us that affect our distribution and operating policies, our ability to incur additional debt and our ability to resell interests in the property. Loan documents may contain covenants that limit our ability to further mortgage the property, discontinue insurance coverage, replace the Advisor or the property manager, or terminate certain operating or lease agreements related to the property. Such restrictions may limit our ability to achieve our investment objectives.
22
Increases in interest rates on variable rate debt incurred and new financings by us will reduce cash available for dividends.
Increases in interest rates andon any variable rate debt incurred or new financings would increase our interest costs, which wouldcould reduce our cash flows and our ability to pay dividends to our shareholders. In addition, if we need to repay existing debt during periods of rising interest rates, we could be required to liquidate one or more of our investments in properties at times which may not permit realization of the maximum return on such investments.
28
Complying with REIT requirements may limit our ability to hedge liabilities through tax-efficient means, which may adversely affect our results of operations.
We have entered into twoa number of hedging transactions and may enter into additional such transactions. Hedging transactions could take a variety of forms, including interest rate swaps or cap agreements, options, futures contracts, forward rate agreements, or similar financial instruments. The REIT provisions of the Code substantially limit our ability to hedge liabilities, including through the previously described hedging transactions.liabilities. Because we conduct substantially all of our operations through our operating partnership, any income from a hedging transaction entered into to manage risk of interest rate changes with respect to borrowings made or to be made to acquire or carry real estate assets will not constitute gross income to us for purposes of the 75% or 95% gross income test. As a result, we may be required to limit the operating partnership’s use of advantageous hedging techniques or to implement hedges through certain taxable corporations. This could increase the costs and risks of hedging activities because any taxable corporation would be subject to tax on gains or expose the operating partnership to greater risks associated with changes in interest rates than is otherwise desirable. In addition, losses of a taxable corporation will generally not be deductible by the operating partnership and will generally only be available to offset future taxable income of such corporation.activities. We intend to structure any hedging transaction in a manner that does not jeopardize our ability to qualify as a REIT.
We may structure acquisitions of property in exchange for limited partnership units in our operating partnership on terms that could limit our liquidity or our flexibility.
We may acquire properties by issuing limited partnership units in our operating partnership to contributors of property. If we enter into such transactions, in order to induce the property owners to accept limited partnership units rather than cash, it may be necessary for us to provide them with additional incentives. For instance, our operating partnership’s LLLP Agreement provides any holder of limited partnership units may, subject to certain conditions, request redemption of their units and we may acquire our shares on a one-for-one exchange basis.
We may, however, enter into additional contractual arrangements with contributors of property under which we would agree to redeem a contributor’s units for our shares or cash, at the option of the contributor, at set times. If the contributor required us to redeem units for cash pursuant to such a provision, it would limit our liquidity and thus our ability to use cash to make other investments, satisfy other obligations or pay dividends. Moreover, if we were required to redeem units for cash at a time when we did not have sufficient cash to fund the redemption, we might be required to sell one or more properties to raise funds to satisfy this obligation or seek short-term financing. Furthermore, in order to allow a contributor of a property to defer taxable gains on the contribution of property to our operating partnership, we might agree not to sell a contributed property for a defined period of time or until the contributor exchanged the contributor’s units for cash or our shares. Such an agreement would prevent us from selling those properties, even if market conditions made such a sale favorable to us.
Risks Related to Other Investments
Investments in Real Estate Related Assets
From time to time, our investment portfolio containsother real estate related assets. The following risk factors apply to such assets.
Investments in real estate related equity assetsinvestments could involve higher risks than other investments,investment in real estate properties, which could adversely affect our operations and ability to make dividend payments.
We are permitted to invest in other real estate assets. We can invest in common and preferred stock of both publicly traded and private real estate companies, including REITs, which involve a higher degree of risk thanequity, debt, securities due to a variety of factors, including subordination to creditors and lack of any security. Our investments in real estate related equity securitiesderivative securities. These assets can involve special risks relating tobe quite risky, illiquid, and volatile and the particular issuer of the equity securities, including the financial condition and business outlook of the issuer. Issuers of real estate related common equity securities generally invest in real estate or real estate related assets and are subject to the inherent risks associated with real estate discussed in this report, including risks relating to rising interest rates.
29
The value of real estate related securities may be volatile andthese assets could cause the value of our shares to fluctuate and could result in losses that materially adversely affect our business operations and our ability to make dividend payments.
The valueresults of real estate related securities, including those of REITs, fluctuate in response to issuer, political, market and economic developments. In the short term, equity prices can fluctuate dramatically in response to these developments. Different parts of the market and different types of equity securities can react differently to these developments and they can affect a single issuer or multiple issuers within an industry or economic sector or geographic region or the market as a whole. The real estate industry is sensitive to economic downturns. The value of securities of companies engaged in real estate activities can be affected by changes in real estate values and rental income, property taxes, interest rates and tax and regulatory requirements. In addition, the value of a REIT’s equity securities can depend on the structure and amount of cash flow generated by the REIT. Fluctuations in value of our securities may cause the value of our shares to vary regardless of the performance of our real estate assets, adversely affect our business operations and our ability to pay dividends to our shareholders.
Investments in commercial mortgage-backed securities have similar risks to mortgage loans, and we could be adversely affected if the value of such investments decrease due to repayment changes or non-payment.
Commercial mortgage-backed securities are bonds which evidence interests in, or are secured by, a single commercial mortgage loan or a pool of commercial mortgage loans. Accordingly, any mortgage-backed securities we invest in will be subject to all the risks of the underlying mortgage loans, including the risks of prepayment or non-payment.
The value of commercial mortgage-backed securities may be adversely affected when repayments on underlying mortgage loans do not occur as anticipated, resulting in the extension of the security’s effective maturity and the related increase in interest rate sensitivity of a longer-term instrument. The value of commercial mortgage-backed securities also may change due to shifts in the market’s perception of issuers and regulatory or tax changes adversely affecting the mortgage securities markets as a whole. In addition, commercial mortgage-backed securities are subject to the credit risk associated with the performance of the underlying mortgage properties.
Commercial mortgage-backed securities are also subject to several risks created through the securitization process. Certain subordinate commercial mortgage-backed securities are paid interest only to the extent there are funds available to make payments. To the extent the collateral pool includes a large percentage of delinquent loans, there is a risk interest payments on subordinate commercial mortgage-backed securities will not be fully paid. Subordinate securities of commercial mortgage-backed securities are also subject to greater risk than more highly rated commercial mortgage-backed securities.
Investments in mortgage instruments could adversely affect our business operations if the values of the underlying properties decrease or there are repayment defaults.
For any investments we make in mortgage loans, we will be at risk of loss on those investments, including losses as a result of defaults on mortgage loans. These losses may be caused by many conditions beyond our control, including general prevailing local, national and global economic conditions; economic conditions affecting real estate values; changes in specific industry segments; tenant defaults and lease expirations; financial condition of tenants; changes in use of property; shift of business processes and functions offshore; declines in regional or local real estate values, or rental or occupancy rates; increases in interest rates, real estate tax rates and other operating expenses; competition from comparable types of properties; and property management decisions.
If we acquire a property by foreclosure following defaults under any mortgage loan investments, we will bear a risk of loss of principal to the extent of any deficiency between the value of the collateral less costs to hold and dispose of a property and the principal and accrued interest of the mortgage loan, which could have a material adverse effect on our ability to achieve our investment objectives. We do not know whether the values of the property securing any of our real estate securities investments will remain at the levels existing on the dates we initially make the related investment. If the values of the underlying properties drop, our risk will increase and the values of our interests may decrease. Further, seeking available remedies could be a time-consuming and expensive process and would increase the costs associated with holding such mortgage and reduce our cash available for shareholders.
30
If there are delays in liquidating defaulted mortgage loan investments, we could be required to incur additional expenses to pursue such remedies, which could adversely affect our operations.
If there are defaults under any mortgage loan investments we hold, we may not be able to foreclose on or obtain a suitable remedy with respect to such investments. Specifically, we may not be able to repossess and sell the underlying properties quickly, which could reduce the value of our investment. For example, an action to foreclose on a property securing a mortgage loan is regulated by state statutes and rules and is subject to many of the delays and expenses of lawsuits if the defendant raises defenses or counterclaims. Additionally, in the event of default by a mortgagor, these restrictions, among other things, may impede our ability to foreclose on or sell the mortgaged property or to obtain proceeds sufficient to repay all amounts due to us on the mortgage loan. Therefore, we may experience a delay and additional costs in liquidating the investment and return of the funds to invest in new investments.
Investments in mezzanine loans may involve higher risks, and we may not be able to obtain full recourse if the investment becomes unsecured or the assets of the entity providing the pledge become insufficient to satisfy the loan.
We may invest in mezzanine loans taking the form of subordinated loans secured by second mortgages on the underlying real property or loans secured by a pledge of the ownership interests of either the entity owning the real property or the entity that owns the interest in the entity owning the real property. These types of investments involve a higher degree of risk than long-term senior first-lien mortgage loans secured by income producing real property because the investment may become unsecured as a result of foreclosure by the senior lender. In the event of a bankruptcy of the entity providing the pledge of its ownership interests as security, we may not have full recourse to the assets of such entity, or the assets of the entity may not be sufficient to satisfy our mezzanine loan. If a borrower defaults on our mezzanine loan or debt senior to our loan, or in the event of a borrower bankruptcy, our mezzanine loan will be satisfied only after the senior debt. As a result, we may not recover some or all of our investment. In addition, mezzanine loans may have higher loan-to-value ratios than conventional mortgage loans, resulting in less equity in the real property and increasing the risk of loss of principal.
Investments subject to interest rate risks may decline in value due to changes in the market interest rates, which could adversely affect the value of our assets.
Interest rate risk is the risk fixed income securities such as preferred and debt securities, and to a lesser extent dividend paying common stocks, will decline in value due to changes in market interest rates. When market interest rates rise, the fair value of such securities tend to decline, and vice versa.
During periods of rising interest rates, the average life of certain types of securities may be extended because of slower than expected principal payments. This may lock in a below-market interest rate, increase the security’s duration and reduce the value of the security. During periods of declining interest rates, an issuer may be able to exercise an option to prepay principal earlier than scheduled. If this occurs, we may be forced to reinvest in lower yielding securities. Preferred and debt securities frequently have call features allowing the issuer to repurchase the security prior to its stated maturity. An issuer may redeem an obligation if the issuer can refinance the debt at a lower cost due to declining interest rates or an improvement in the credit standing of the issuer. These risks may reduce the value of any real estate related securities investments.
Investments in illiquid investments could adversely affect the value of our assets if we are unable to resell the investments when desired to protect ourselves from changes in market or economic conditions.
We may purchase real estate related securities in connection with privately negotiated transactions not registered under the relevant securities laws, resulting in a prohibition against their transfer, sale, pledge or other disposition except in a transaction exempt from the registration requirements of, or is otherwise in accordance with, those laws. As a result, our ability to vary these investments in response to changes in economic and other conditions may be relatively limited. Any mezzanine and bridge loans we may purchase will be particularly illiquid investments due to their short life, their
31
unsuitability for securitization and the greater risk of our inability to recover loaned amounts in the event of a borrower’s default.
Liquidation prior to the maturity of any real estate securities investments could require us to sell on unfavorable terms and for a lower price than anticipated if held to maturity.
Our Board of Trustees may choose to liquidate assets, including any real estate related securities investments. If we liquidate those types of investments prior to their maturity, we may be forced to sell those investments on unfavorable terms or at a loss during a time when prevailing interest rates are higher than the interest rates of such mortgage loans, whereby we would sell such investments at a discount to their stated principal values.
Risks Related to Conflicts of Interest
We will beare subject to several conflicts of interest arising out of our relationships with our affiliates, our Advisor and its affiliates, including the material conflicts discussed below. The “Conflicts of Interest” section of this periodic report provides a more detailed discussion of the conflicts of interest between us and our affiliates, our Advisor and its affiliates.
There are conflicts of interest in our relationship with the Advisor and its affiliates and several trustees, which could adversely affect our operations and business operations.
We are subject to potential conflicts of interest arising out of our relationships with the trustees, Advisor, its affiliates, and its affiliates.certain trustees. Conflicts of interest may arise among a trustee or the Advisor and its respective affiliates, on the one hand, and us and our shareholders, on the other hand. As a result of these conflicts, the trustee or Advisor may favor its own interests or the interests of its affiliates over the interest of our shareholders.shareholders or operating partnership.
Division of Loyalty/Allocation of time and effort
We rely on the personnel of the Advisor and its affiliates to manage our assets and daily operations. Two of our trustees are also governors and owners of the Advisor and the primary property manager of a number of our properties, and therefore have conflicts of interest in allocating their time, services and functions among us and other real estate programs or business ventures the Advisor or its affiliates organize or serve.
Division of loyalty
Several of our officers and/or trustees serve as officers, governors, and owners of one or more entities (certain of which are affiliated with our Advisor or trustees, includingtrustees), property managers, tenants of our properties, brokerage companies and brokerage companies.other real estate entities owning real estate investments. As a result, these individuals owe duties to these other entities and their investors, which may conflict with the duties that they owe to us and our shareholders. Their loyalties to these other entities and investors could result in action or inaction detrimental to our business or result in conflicts relating to the allocation of their time and services, which could harm implementation of our business strategy and investment and leasing opportunities.
23
Allocation of investment opportunities
The Advisor and its affiliates are or may become committed to the continuing management of other business ventures. Accordingly, there may be conflicts of interest between our investments and other investments or business ventures in which the Advisor and its affiliates are participants. In addition, the Advisor and its officers will advise other investment programs that invest in commercial real estate properties and real estate related assets in which we may be interested. Therefore, the Advisor could face conflicts of interest in allocating and determining which programs will have the opportunity to acquire and participate in such investments as they become available. As a result, other investment programs advised by the Advisor may compete with us with respect to investors and certain investments we may want to acquire.
32
Investments owned by Advisor or its affiliates
Our Advisor identifies and selects potential investments in real estate properties and other real estate related assets in which we may be interested. Such investments could include property owned by the Advisor or its affiliates.
May profit even if investment is not profitable
The Advisor receives acquisition, disposition, management, financing, and development fees under the Advisory Agreement. The Advisor and its affiliates may also be appointed or utilized to provide other services to us and our assets and receive fees and compensation for providing such other services, such as property management fees and construction fees. Therefore, the Advisor and its affiliates may profit from real estate investments even where we lose all or a portion of our investment. In addition, the agreements and arrangements, including those relating to compensation, between us and the Advisor and its affiliates are not the result of arm’s-length negotiations and their terms may not be as favorable to us as if they had been negotiated with an unaffiliated third party.
Fees received by the parties
The Advisor is paid an annual management fee for its services based on total assets as reflected on our consolidated financial statements. The Advisor may benefit by us retaining ownership of certain investments at times when our shareholders may be better served by the sale or disposition of such investments in order to avoid a reduction in the total assets and correspondingly to the Advisor’s annual management fee. In addition, the Advisor may recommend we purchase investments that increase the total assets and correspondingly the Advisor’s annual management fee but that are not necessarily the most suitable investments for our portfolio. Further, the book value of the assets may include property-related debt, which could influence the amount of leverage obtained on real estate investments and other real estate related investments.
Our Advisor and its affiliates (including some of our trustees) may also be entitled to additional fees for providing other services, including property management and assistance with investment acquisition and disposition. These fees could influence our Advisor’s advice to us as well as the judgment of their affiliates and our trustees performing services for us. These compensation arrangements could affect their judgment with respect to:
|
|
|
|
|
|
|
|
|
|
Leadership will face conflicts of interest relating to purchasing real estate investment opportunities, and such conflicts may not be resolved in our favor, which could adversely affect our investment opportunities.
One or more of our trustees and officers and the officers and key personnel of our Advisor (such persons referred to herein, individually and collectively, as our “Leadership”) currently, and may in the future, also serve as trustees, directors, governors, members, officers or key personnel of or may sponsor other: (a) affiliated entities, including our Advisor; (b) real estate programs, real estate entities, or REITs; (c) advisors to other real estate programs, real estate entities or REITs; or (d) property managers to real estate programs, real estate entities or REITs (herein collectively “Other Real Estate
33
Related Activities”). There is a risk that members of Leadership will choose to pursue an investment opportunity outside of Sterling or choose for Sterling an investment that provides lower returns to us than a property purchased by one of Leadership’s Other Real Estate Related Activities. Sterling cannot be sure that Leadership will act in our best interests when deciding whether to allocate any particular investment to Sterling. In addition, Sterling may acquire investments in geographic areas where Leadership’s Other Real Estate Related Activities own investments. In such a case, a conflict could arise in the acquisition of investments if Sterling and one of Leadership’s Other Real Estate Related Activities were to compete for the same investments in negotiating leases, or a conflict could arise in connection with the resale of properties if Sterling and one of Leadership’s Other Real Estate Related Activities were to attempt to sell similar investments at the same time. Also, Sterling may acquire investments from, or sell investments to, Leadership’s Other Real Estate Related Activities. If one of Leadership’s Other Real Estate Related Activities acquires an investment for which Sterling is competing, attracts a borrower for which Sterling is competing, attempts to sell similar investments as Sterling around the same time, or other circumstances occur where a conflict of interest is not resolved in our favor, Sterling could suffer a loss of revenue due to delays in locating another suitable investment.
Leadership will face conflicts of interest relating to joint ventures, which could result in a disproportionate benefit to the other venture partners at Sterling’s expense and adversely affect the return on your investment.
Sterling may enter into joint ventures with Leadership’s Other Real Estate Related Activities (as well as other parties) for the acquisition of real estate and other real estate investments. Leadership may have conflicts of interest in determining whether one of its Other Real Estate Related Activities should enter into any particular joint venture agreement with Sterling. The co‑venturer may have economic or business interests or goals that are or may become inconsistent with Sterling’s business interests or goals. In addition, should any such joint venture be consummated, Leadership may face a conflict in structuring the terms of the relationship between Sterling’s interests and the interest of the co-venturer and in managing the joint venture. Since Leadership will control both Sterling and any Leadership-affiliated co-venturer, agreements and transactions between the co-venturers with respect to any such joint venture will not have the benefit of arm’s-length negotiation of the type normally conducted between unrelated co-venturers, which could result in the co‑venturer receiving benefits greater than the benefits that Sterling receives. In addition, Sterling may assume liabilities related to the joint venture that exceed the percentage of Sterling’s investment in the joint venture.
Leadership may face competing demands relating to its time and real estate investment opportunities, and this may cause our operating results to suffer.
One or more of our Leadership are or may become engaged in Other Real Estate Related Activities, some of which may have investment objectives and legal and financial obligations similar to Sterling’s. Each member of Leadership affiliated with our Advisor is currently expected to spend a significant portion of his or her time on our behalf, but may not always spend a majority of his or her time on our behalf. In addition, members of our Leadership may engage for their own account in business activities of the types conducted or to be conducted by Sterling or its affiliates, including Other Real Estate Related Activities. Because Leadership may have competing demands on their time and resources, they may have conflicts of interest in allocating time between Sterling’s business and these other activities. If this occurs, the returns to our investors may suffer. Although Leadership’s resources are not dedicated exclusively to Sterling, members of our Leadership are required to devote sufficient resources to Sterling’s administration to discharge their obligations.
One or more of our Leadership also serve as officers, governors, key professionals or holders of a direct or indirect controlling interest in our Advisor and Other Real Estate Related Activities.
One or more of our Leadership are also officers, governors, key professionals or holders of a direct or indirect controlling interest in our Advisor or Other Real Estate Related Activities. Certain of our Leadership have legal and financial obligations with respect to such other Real Estate Related Activities that are similar to their obligations to Sterling. In the future, some of our Leadership may organize other real estate programs, serve as the advisor to other investors and acquire for their own account real estate properties that may be suitable for Sterling. As a result of their interests in other programs, their obligations to other investors and the fact that they engage in, and they will continue to engage in, other business activities on behalf of themselves and others, our Leadership face conflicts of interest in allocating their time among us
34
and their Other Real Estate Related Activities. In addition, many members of our Leadership have existing obligations to Other Real Estate Related Activities sponsored by Mr. Regan and/or Mr. Wieland.
Leadership are not obligated to devote a fixed amount of their time to Sterling, but believe that they have sufficient time to fully discharge their responsibilities to Sterling and to the other businesses in which they are involved.
Members of Leadership may spend a portion of their time on activities unrelated to Sterling, which may significantly reduce the amount of time spent by one or more of our Leadership on Sterling-related activities. Leadership are not obligated to devote a fixed amount of their time to Sterling, but believe that they have sufficient time to fully discharge their responsibilities to Sterling and to the Other Real Estate Related Activities in which they are involved. Sterling believes that its Leadership will devote the time required to manage Sterling’s business and expects that the amount of time Leadership devotes to Sterling will vary during the course of the year and depend on Sterling’s business activities at a given time. For example, Leadership may spend significantly more time focused on Sterling’s activities when it is reviewing potential property acquisitions or negotiating a financing arrangement than during times when it is not.
Our Leadership face conflicts of interest related to the positions they hold with other real estate entities, which could hinder our ability to successfully implement our business strategy and to generate returns to our shareholders.
One or more of our Leadership, including Mr. Regan and Mr. Wieland, may also engage in Other Real Estate Related Activities, and members of Leadership will have fiduciary duties relating to such Other Real Estate Related Activities. These fiduciary duties may conflict with Leadership’s duties to Sterling and its shareholders. Leadership’s Other Real Estate Related Activities could result in actions or inactions detrimental to Sterling, which could harm the implementation of Sterling’s business strategies, and Sterling’s investment, sale and leasing opportunities. Conflicts with Sterling’s business and interests are most likely to arise from involvement in activities related to: (i) allocation of new investments and management time and services between Sterling and Leadership’s Other Real Estate Related Activities, (ii) allocation of time and services between Sterling and Leadership’s Other Real Estate Related Activities; (iii) Sterling’s purchase of properties from, or sale of properties to, affiliated entities, (iv) the timing and terms of the investment in or sale of an asset, (v) development of our properties by affiliates, (vii) investments with affiliates of our Advisor and (viii) compensation to our Advisor. If Sterling does not successfully implement its business strategy, we may be unable to generate cash needed to pay dividends to shareholders and to maintain or increase the value of our assets.
Leadership’s management of Other Real Estate Related Activities may significantly reduce the amount of time our Leadership is able to spend on Sterling related activities and may cause other conflicts of interest, which may cause our operating results to suffer.
Given that our Leadership is or may become involved in Other Real Estate Related Activities, there may be times where Sterling’s fundraising, acquisition, disposition and liquidation activities overlap with similar activities of Leadership’s Other Real Estate Related Activities. This overlap may cause conflicts of interest to arise with respect to, among other things, finding investors, locating and acquiring properties, entering into leases and disposing of properties. The conflicts of interest our Leadership and each of our executive officers and each officer of our advisor may face could delay our fund raising and investment of our proceeds due to the competing time demands and generally cause our operating results to suffer.
We may compete for investors with Leadership’s Other Real Estate Related Activities, which could adversely affect the amount of capital we have to invest.
To the extent Leadership engages in future Other Real Estate Related Activities, Sterling will compete for investors with such activities. Any overlap of capital raising efforts of Other Real Estate Related Activities with Sterling’s capital raising
35
efforts or other activities could adversely affect our ability to raise capital in the future, the timing and availability of additional capital and the amount of proceeds we have to spend on real estate investments.
ITEM 1B. UNRESOLVED STAFF COMMENTS
None.
General
As of December 31, 2017, we owned 166 properties, containing approximately 9,401 apartments and 1,691,000 square feet of leasable commercial space.
ItOur policy is our policy to acquire assets with an intention to hold these assets as long-term investments seeking income and capital appreciation through an increase in value of our real estate portfolio, as well as increased revenue as a result of higher rent. These types of investments are the core of our strategy of creating shareholder value. We currently own and maintain a portfolio of real estate diversified by geographical location and by type and size. Effective January 1, 2016, our investment focus shifted to focus on acquisition of multifamily apartment properties. There is no current plan for the existing commercial properties (industrial, medical, office and retail) in regards to retention or disposition. Our Advisor monitors industry trends and invests in property believed to provide the most favorable return balanced with risk. We attempt to manage our real estate portfolio by evaluating changes or trends in the industries in which our tenants operate, the creditworthiness of our tenants and changes or trends in the area demographics surrounding our properties for evidence that our properties will continue to meet our investment objectives of cash flow, preservation of capital and capital appreciation.
With the exception of single tenant buildings, theThe majority of our real estate investments are managed by a third party. Property management firms usually receive between 3%2% and 5% of gross rent collection for their services. Substantially all of our commercial revenues consist of base rents received under leases having terms ranging from month-to-month to over 25 years. More than half of our existing commercial property leases as of December 31, 20172022 contain “step up” rental clauses providing for annual increases in the base rental payments of approximately 1.0% to 3.0% each year during the term of the lease.
Properties
As of December 31, 2017,2022, we owned 166185 properties in twelve states, primarily located in North Dakota with others located Arkansas, Colorado, Iowa, Louisiana, Michigan, Minnesota, Mississippi, Missouri, Nebraska, Texas12 states, containing approximately 11,300 apartment units and Wisconsin. This1,498,000 square feet of leasable commercial space. The residential and commercial portfolio of properties includes a diversified mixture of multifamily, single, and multi-tenant retail and office buildings.buildings as well as industrial and medical facility properties. The majority of the properties are located in the largest cities in the states of North Dakota and Minnesota. We report our results in two reportable segments: residential and commercial properties. Please see Notes 2 and 3 to the consolidated financials included in this report for more information.
As of December 31, 2017,2022, approximately 71.0%78.8% (based on cost) of the properties were apartment communities located primarily in North Dakota and Minnesota with others located in Missouri and Nebraska.communities. Most multifamily dwelling properties are leased to a variety of tenants under short-term leases.leases of less than a year.
As of December 31, 2017,2022, approximately 29.0%21.2% (based on cost) of the properties were comprised of industrial, office, retail and medical commercial properties located primarily in North Dakota with others located in Arkansas, Colorado, Iowa, Louisiana, Michigan, Minnesota, Mississippi, Nebraska, Texas and Wisconsin.properties. Most commercial properties are leased to a variety of tenants under long-term leases.
36
The following table sets forth certain information regarding each of our properties owned, including unconsolidated affiliates, as of December 31, 2017 (in thousands, except units or leasable sq. ft.).
|
|
|
|
|
|
|
|
|
|
|
|
|
|
|
|
|
|
| # of |
|
|
|
| Physical |
|
|
|
|
|
|
| Units or |
|
|
|
| Occupancy |
|
|
|
|
| Year |
| Leasable |
|
| Total |
| at December |
|
Property |
| Location |
| Acquired |
| Sq. Ft |
|
| Investment |
| 31, 2017 |
|
|
|
|
|
|
|
|
|
|
|
|
|
|
32nd Avenue Office |
| Fargo, ND |
| 2004 |
| 31,750 |
| $ | 4,086 |
| 100.00 | % |
Aetna |
| Bismarck, ND |
| 2006 |
| 75,000 |
|
| 10,218 |
| 66.70 | % |
Amberwood |
| Grand Forks, ND |
| 2016 |
| 95 |
|
| 4,044 |
| 93.32 | % |
Applebee’s Neighborhood Bar & Grill |
| Apple Valley, MN |
| 2011 |
| 4,997 |
|
| 2,523 |
| 100.00 | % |
Applebee’s Neighborhood Bar & Grill |
| Bloomington, MN |
| 2010 |
| 5,043 |
|
| 2,208 |
| 100.00 | % |
Applebee’s Neighborhood Bar & Grill |
| Coon Rapids, MN |
| 2010 |
| 5,576 |
|
| 2,434 |
| 100.00 | % |
Applebee’s Neighborhood Bar & Grill |
| Savage, MN |
| 2010 |
| 4,936 |
|
| 1,518 |
| 100.00 | % |
Arbor |
| Bismarck, ND |
| 2013 |
| 12 |
|
| 696 |
| 96.47 | % |
Arbor II |
| Bismarck, ND |
| 2013 |
| 12 |
|
| 671 |
| 100.00 | % |
Arbor III |
| Bismarck, ND |
| 2013 |
| 12 |
|
| 667 |
| 96.26 | % |
Ashbury |
| Fargo, ND |
| 2013 & 2016 |
| 61 |
|
| 4,121 |
| 100.00 | % |
Auburn II |
| Fargo, ND |
| 2007 |
| 24 |
|
| 1,089 |
| 100.00 | % |
Autumn Ridge |
| Grand Forks, ND |
| 2004 |
| 144 |
|
| 10,370 |
| 97.71 | % |
Barrett Arms |
| Crookston, MN |
| 2014 |
| 24 |
|
| 1,159 |
| 91.55 | % |
Bayview |
| Fargo, ND |
| 2007 |
| 100 |
|
| 4,768 |
| 98.18 | % |
Becker Furniture |
| Waite Park, MN |
| 2006 |
| 30,200 |
|
| 1,578 |
| 79.47 | % |
Bell Plaza* (FKA Northland Plaza) |
| Bloomington, MN |
| 2015 |
| 296,967 |
|
| 52,408 |
| 93.02 | % |
Berkshire |
| Fargo, ND |
| 2008 |
| 12 |
|
| 474 |
| 100.00 | % |
Betty Ann |
| Fargo, ND |
| 2009 |
| 24 |
|
| 928 |
| 97.69 | % |
Biolife Plasma Center |
| Bismarck, ND |
| 2008 |
| 11,671 |
|
| 2,756 |
| 100.00 | % |
Biolife Plasma Center |
| Grand Forks, ND |
| 2008 |
| 13,190 |
|
| 2,909 |
| 100.00 | % |
Biolife Plasma Center |
| Janesville, WI |
| 2008 |
| 12,225 |
|
| 2,282 |
| 100.00 | % |
Biolife Plasma Center |
| Mankato, MN |
| 2008 |
| 13,181 |
|
| 4,055 |
| 100.00 | % |
Biolife Plasma Center |
| Marquette, MI |
| 2008 |
| 11,737 |
|
| 3,196 |
| 100.00 | % |
Biolife Plasma Center |
| Onalaska, WI |
| 2008 |
| 12,180 |
|
| 2,450 |
| 100.00 | % |
Biolife Plasma Center |
| Oshkosh, WI |
| 2008 |
| 12,191 |
|
| 2,187 |
| 100.00 | % |
Biolife Plasma Center |
| Sheboygan, WI |
| 2008 |
| 13,230 |
|
| 2,573 |
| 100.00 | % |
Biolife Plasma Center |
| Stevens Point, WI |
| 2008 |
| 13,190 |
|
| 2,482 |
| 100.00 | % |
Birchwood I |
| Fargo, ND |
| 2017 |
| 18 |
|
| 421 |
| 100.00 | % |
Birchwood II |
| Fargo, ND |
| 2017 |
| 48 |
|
| 2,517 |
| 91.51 | % |
Bridgeport |
| Fargo, ND |
| 2016 |
| 120 |
|
| 8,299 |
| 93.75 | % |
Bristol Park |
| Grand Forks, ND |
| 2016 |
| 80 |
|
| 5,471 |
| 91.03 | % |
Brookfield |
| Fargo, ND |
| 2008 |
| 72 |
|
| 2,535 |
| 94.22 | % |
Buffalo Wild Wings |
| Austin, TX |
| 2010 |
| 7,296 |
|
| 2,549 |
| 100.00 | % |
Cambridge (FKA 44th Street) |
| Fargo, ND |
| 2013 |
| 42 |
|
| 2,418 |
| 96.87 | % |
Candlelight |
| Fargo, ND |
| 2012 |
| 66 |
|
| 2,029 |
| 100.00 | % |
Carling Manor |
| Grand Forks, ND |
| 2008 |
| 12 |
|
| 795 |
| 100.00 | % |
Carlton Place |
| Fargo, ND |
| 2008 |
| 213 |
|
| 8,506 |
| 96.21 | % |
Carr |
| Fargo, ND |
| 2017 |
| 18 |
|
| 830 |
| 93.98 | % |
Chandler 1802 |
| Grand Forks, ND |
| 2014 |
| 24 |
|
| 1,338 |
| 100.00 | % |
Chandler 1866 |
| Grand Forks, ND |
| 2005 |
| 12 |
|
| 354 |
| 97.55 | % |
Cherry Creek (FKA Village) |
| Grand Forks, ND |
| 2008 |
| 35 |
|
| 1,770 |
| 97.12 | % |
37
|
|
|
|
|
|
|
|
|
|
|
|
|
|
|
|
|
|
| # of |
|
|
|
| Physical |
|
|
|
|
|
|
| Units or |
|
|
|
| Occupancy |
|
|
|
|
| Year |
| Leasable |
|
| Total |
| at December |
|
Property |
| Location |
| Acquired |
| Sq. Ft |
|
| Investment |
| 31, 2017 |
|
Columbia West |
| Grand Forks, ND |
| 2008 |
| 70 |
|
| 4,090 |
| 98.40 | % |
Country Club |
| Fargo, ND |
| 2011 |
| 40 |
|
| 1,737 |
| 92.13 | % |
Countryside |
| Fargo, ND |
| 2011 |
| 24 |
|
| 878 |
| 95.99 | % |
Courtyard |
| St. Louis Park, MN |
| 2013 |
| 151 |
|
| 9,050 |
| 91.46 | % |
Dairy Queen |
| Dickinson, ND |
| 2012 |
| 2,811 |
|
| 1,330 |
| 100.00 | % |
Dairy Queen |
| Moorhead, MN |
| 2011 |
| 2,712 |
|
| 1,185 |
| 100.00 | % |
Dakota Manor |
| Fargo, ND |
| 2014 |
| 54 |
|
| 2,720 |
| 96.28 | % |
Danbury |
| Fargo, ND |
| 2007 |
| 135 |
|
| 7,287 |
| 91.28 | % |
Dellwood Estates |
| Anoka, MN |
| 2013 |
| 132 |
|
| 11,882 |
| 99.25 | % |
Eagle Run |
| West Fargo, ND |
| 2010 |
| 144 |
|
| 6,968 |
| 95.40 | % |
Eagle Sky I |
| Bismarck, ND |
| 2016 |
| 20 |
|
| 1,573 |
| 90.09 | % |
Eagle Sky II |
| Bismarck, ND |
| 2016 |
| 20 |
|
| 1,584 |
| 89.56 | % |
East Bridge |
| Fargo, ND |
| 2017 |
| 58 |
|
| 6,426 |
| 96.29 | % |
Echo Manor |
| Hutchinson, MN |
| 2014 |
| 30 |
|
| 1,112 |
| 100.00 | % |
Eide Bailly Building*** |
| Fargo, ND |
| 2007 |
| 74,646 |
|
| 6,175 |
| 100.00 | % |
Emerald Court |
| Fargo, ND |
| 2008 |
| 24 |
|
| 1,041 |
| 91.76 | % |
Essex |
| Fargo, ND |
| 2017 |
| 18 |
|
| 870 |
| 100.00 | % |
Fairview |
| Bismarck, ND |
| 2008 |
| 84 |
|
| 5,361 |
| 98.12 | % |
Family Dollar Store |
| Mandan, ND |
| 2010 |
| 9,100 |
|
| 820 |
| 100.00 | % |
First International Bank & Trust |
| Moorhead, MN |
| 2011 |
| 3,510 |
|
| 1,014 |
| 100.00 | % |
Flickertail |
| Fargo, ND |
| 2008 |
| 180 |
|
| 6,696 |
| 94.40 | % |
Forest Avenue |
| Fargo, ND |
| 2013 |
| 20 |
|
| 768 |
| 99.95 | % |
Four Points Office Building |
| Fargo, ND |
| 2007 |
| 11,973 |
|
| 1,332 |
| 83.72 | % |
Galleria III |
| Fargo, ND |
| 2010 |
| 18 |
|
| 889 |
| 88.49 | % |
Garden Grove |
| Bismarck, ND |
| 2016 |
| 95 |
|
| 7,188 |
| 92.56 | % |
Gate City Bank |
| Grand Forks, ND |
| 2008 |
| 17,406 |
|
| 1,490 |
| 100.00 | % |
Georgetown |
| Fridley, MN |
| 2014 |
| 462 |
|
| 31,348 |
| 97.61 | % |
Glen Pond |
| Eagan, MN |
| 2011 |
| 414 |
|
| 26,626 |
| 99.58 | % |
Goldmark Office Park |
| Fargo, ND |
| 2007 |
| 124,425 |
|
| 19,184 |
| 100.00 | % |
Grand Forks Marketplace** |
| Grand Forks, ND |
| 2003 |
| 182,522 |
|
| 10,661 |
| 100.00 | % |
Granger Court |
| Fargo, ND |
| 2013 |
| 59 |
|
| 3,149 |
| 96.62 | % |
Great American Insurance Building |
| Fargo, ND |
| 2005 |
| 15,000 |
|
| 2,258 |
| 100.00 | % |
Griffin Court |
| Moorhead, MN |
| 2014 |
| 128 |
|
| 5,181 |
| 95.78 | % |
Guardian Building Products |
| Fargo, ND |
| 2012 |
| 100,600 |
|
| 3,709 |
| 100.00 | % |
Hannifin |
| Bismarck, ND |
| 2013 |
| 14 |
|
| 789 |
| 92.69 | % |
Highland Meadows |
| Bismarck, ND |
| 2011 |
| 144 |
|
| 10,386 |
| 96.98 | % |
Hunter’s Run I |
| Fargo, ND |
| 2007 |
| 12 |
|
| 481 |
| 91.51 | % |
Hunter’s Run II |
| Fargo, ND |
| 2008 |
| 12 |
|
| 518 |
| 91.63 | % |
Huntington |
| Fargo, ND |
| 2015 |
| 10 |
|
| 435 |
| 100.00 | % |
Islander |
| Fargo, ND |
| 2011 |
| 24 |
|
| 1,097 |
| 79.49 | % |
Jadestone |
| Fargo, ND |
| 2017 |
| 18 |
|
| 822 |
| 100.00 | % |
Kennedy |
| Fargo, ND |
| 2013 |
| 12 |
|
| 772 |
| 92.19 | % |
Library Lane |
| Grand Forks, ND |
| 2007 |
| 60 |
|
| 2,999 |
| 93.45 | % |
Madison (FKA Columbine) |
| Grand Forks, ND |
| 2015 |
| 12 |
|
| 681 |
| 100.00 | % |
Maple Ridge |
| Omaha, NE |
| 2008 |
| 168 |
|
| 7,987 |
| 96.79 | % |
38
|
|
|
|
|
|
|
|
|
|
|
|
|
|
|
|
|
|
| # of |
|
|
|
| Physical |
|
|
|
|
|
|
| Units or |
|
|
|
| Occupancy |
|
|
|
|
| Year |
| Leasable |
|
| Total |
| at December |
|
Property |
| Location |
| Acquired |
| Sq. Ft |
|
| Investment |
| 31, 2017 |
|
Maplewood |
| Maplewood, MN |
| 2014 |
| 240 |
|
| 15,853 |
| 94.91 | % |
Maplewood Bend |
| Fargo, ND |
| 2009 and 2010 |
| 182 |
|
| 7,268 |
| 96.60 | % |
Martha Alice |
| Fargo, ND |
| 2009 |
| 24 |
|
| 951 |
| 95.91 | % |
Mayfair (FKA Colony Manor) |
| Grand Forks, ND |
| 2008 |
| 24 |
|
| 1,218 |
| 95.66 | % |
Midtown Plaza |
| Minot, ND |
| 2004 |
| 17,797 |
|
| 1,258 |
| 87.01 | % |
Monticello |
| Fargo, ND |
| 2013 |
| 18 |
|
| 903 |
| 98.55 | % |
Montreal Courts |
| Little Canada, MN |
| 2013 |
| 444 |
|
| 27,777 |
| 98.70 | % |
Oak Court |
| Fargo, ND |
| 2008 |
| 81 |
|
| 3,111 |
| 96.50 | % |
Oakview Townhomes (FKA Arrowhead) |
| Grand Forks, ND |
| 2017 |
| 82 |
|
| 5,713 |
| 99.81 | % |
O'Reilly Auto Store |
| Mandan, ND |
| 2010 |
| 6,300 |
|
| 679 |
| 100.00 | % |
Pacific Park I |
| Fargo, ND |
| 2013 |
| 30 |
|
| 972 |
| 100.00 | % |
Pacific Park II |
| Fargo, ND |
| 2013 |
| 39 |
|
| 1,075 |
| 99.93 | % |
Pacific South |
| Fargo, ND |
| 2013 |
| 15 |
|
| 550 |
| 99.89 | % |
Park Circle |
| Fargo, ND |
| 2017 |
| 18 |
|
| 934 |
| 88.74 | % |
Parkview Arms |
| Bismarck, ND |
| 2015 |
| 62 |
|
| 4,590 |
| 97.96 | % |
Parkway Office (FKA Echelon Building) |
| Fargo, ND |
| 2006 |
| 17,000 |
|
| 1,897 |
| 100.00 | % |
Parkwest Gardens |
| West Fargo, ND |
| 2014 |
| 142 |
|
| 7,393 |
| 90.25 | % |
Parkwood |
| Fargo, ND |
| 2008 |
| 40 |
|
| 1,389 |
| 96.55 | % |
Pebble Creek |
| Bismarck, ND |
| 2008 |
| 70 |
|
| 4,014 |
| 98.73 | % |
Plumtree |
| Fargo, ND |
| 2017 |
| 18 |
|
| 929 |
| 91.66 | % |
Prairiewood Court I & II |
| Fargo, ND |
| 2006 and 2007 |
| 60 |
|
| 2,419 |
| 86.72 | % |
Prairiewood Meadows |
| Fargo, ND |
| 2012 |
| 85 |
|
| 3,536 |
| 88.69 | % |
Quail Creek |
| Springfield, MO |
| 2015 |
| 164 |
|
| 10,967 |
| 91.29 | % |
Redpath |
| White Bear Lake, MN |
| 2016 |
| 25,817 |
|
| 4,017 |
| 100.00 | % |
Regis Building |
| Edina, MN |
| 2009 |
| 102,448 |
|
| 13,131 |
| 100.00 | % |
Richfield Harrison |
| Grand Forks, ND |
| 2007 |
| 140 |
|
| 7,886 |
| 95.55 | % |
Robinwood |
| Coon Rapids, MN |
| 2014 |
| 120 |
|
| 7,965 |
| 96.97 | % |
Rosedale Estates |
| Roseville, MN |
| 2014 |
| 360 |
|
| 26,166 |
| 95.70 | % |
Rosegate |
| Fargo, ND |
| 2008 |
| 90 |
|
| 3,568 |
| 96.22 | % |
Roughrider |
| Grand Forks, ND |
| 2016 |
| 12 |
|
| 664 |
| 100.00 | % |
Saddlebrook |
| West Fargo, ND |
| 2008 |
| 60 |
|
| 1,598 |
| 94.49 | % |
Sage Park (FKA Brighton Village) |
| New Brighton, MN |
| 2014 |
| 240 |
|
| 17,548 |
| 99.82 | % |
Sargent |
| Fargo, ND |
| 2017 |
| 36 |
|
| 1,713 |
| 100.00 | % |
Schrock |
| Fargo, ND |
| 2013 |
| 18 |
|
| 751 |
| 93.63 | % |
Sheridan Pointe |
| Fargo, ND |
| 2013 |
| 48 |
|
| 2,849 |
| 100.00 | % |
Sierra Ridge |
| Bismarck, ND |
| 2006 and 2011 |
| 136 |
|
| 10,304 |
| 91.05 | % |
Social Security Building |
| St. Cloud, MN |
| 2007 |
| 10,810 |
|
| 2,912 |
| 100.00 | % |
Somerset |
| Fargo, ND |
| 2008 |
| 75 |
|
| 3,953 |
| 96.06 | % |
Southgate |
| Fargo, ND |
| 2007 |
| 162 |
|
| 6,500 |
| 95.34 | % |
Southview III |
| Grand Forks, ND |
| 2011 |
| 18 |
|
| 726 |
| 100.00 | % |
Southview Village |
| Fargo, ND |
| 2007 |
| 72 |
|
| 3,137 |
| 92.53 | % |
Spring |
| Fargo, ND |
| 2013 |
| 25 |
|
| 975 |
| 83.71 | % |
Stanford Court |
| Grand Forks, ND |
| 2013 |
| 96 |
|
| 4,505 |
| 94.98 | % |
Stonefield |
| Bismarck, ND |
| 2014 |
| 192 |
|
| 30,975 |
| 93.40 | % |
Stony Brook |
| Omaha, NE |
| 2009 |
| 148 |
|
| 11,290 |
| 96.03 | % |
39
|
|
|
|
|
|
|
|
|
|
|
|
|
|
|
|
|
|
| # of |
|
|
|
| Physical |
|
|
|
|
|
|
| Units or |
|
|
|
| Occupancy |
|
|
|
|
| Year |
| Leasable |
|
| Total |
| at December |
|
Property |
| Location |
| Acquired |
| Sq. Ft |
|
| Investment |
| 31, 2017 |
|
Summerfield |
| Fargo, ND |
| 2015 |
| 18 |
|
| 825 |
| 100.00 | % |
Summit Point |
| Fargo, ND |
| 2015 |
| 87 |
|
| 6,672 |
| 98.77 | % |
Sunchase |
| Fargo, ND |
| 2017 |
| 36 |
|
| 1,801 |
| 94.49 | % |
Sunset Ridge |
| Bismarck, ND |
| 2008 and 2010 |
| 180 |
|
| 13,815 |
| 97.29 | % |
Sunview |
| Grand Forks, ND |
| 2008 |
| 36 |
|
| 1,930 |
| 93.53 | % |
Sunwood Estates |
| Fargo, ND |
| 2007 |
| 81 |
|
| 4,223 |
| 96.23 | % |
Terrace on the Green |
| Moorhead, MN |
| 2012 |
| 116 |
|
| 3,639 |
| 92.67 | % |
Titan Machinery |
| Bismarck, ND |
| 2015 |
| 22,293 |
|
| 3,423 |
| 100.00 | % |
Titan Machinery |
| Dickinson, ND |
| 2012 |
| 17,760 |
|
| 1,790 |
| 100.00 | % |
Titan Machinery |
| Fargo, ND |
| 2012 |
| 29,800 |
|
| 3,330 |
| 100.00 | % |
Titan Machinery |
| Marshall, MN |
| 2011 |
| 42,000 |
|
| 5,081 |
| 100.00 | % |
Titan Machinery |
| Minot, ND |
| 2012 |
| 23,690 |
|
| 2,630 |
| 100.00 | % |
Titan Machinery |
| North Platte, NE |
| 2016 |
| 16,480 |
|
| 1,769 |
| 100.00 | % |
Titan Machinery |
| Redwood Falls, MN |
| 2013 |
| 38,932 |
|
| 4,658 |
| 100.00 | % |
Titan Machinery |
| Sioux City, IA |
| 2013 |
| 32,532 |
|
| 4,567 |
| 100.00 | % |
Twin Oaks |
| Hutchinson, MN |
| 2014 |
| 80 |
|
| 4,413 |
| 98.35 | % |
Twin Parks |
| Fargo, ND |
| 2008 |
| 66 |
|
| 2,391 |
| 97.38 | % |
Valley Homes Duplexes |
| Grand Forks, ND |
| 2015 |
| 24 |
|
| 2,323 |
| 96.37 | % |
Valley View |
| Golden Valley, MN |
| 2014 |
| 72 |
|
| 7,557 |
| 94.70 | % |
Village Park |
| Fargo, ND |
| 2008 |
| 60 |
|
| 2,375 |
| 99.14 | % |
Village West |
| Fargo, ND |
| 2008 |
| 80 |
|
| 2,872 |
| 94.88 | % |
Walgreens |
| Alexandria, LA |
| 2009 |
| 14,560 |
|
| 4,296 |
| 100.00 | % |
Walgreens |
| Batesville, AR |
| 2009 |
| 14,820 |
|
| 7,616 |
| 100.00 | % |
Walgreens |
| Denver, CO |
| 2011 |
| 13,390 |
|
| 5,210 |
| 100.00 | % |
Walgreens |
| Fayetteville, AR |
| 2009 |
| 14,550 |
|
| 5,810 |
| 100.00 | % |
Walgreens |
| Laurel, MS |
| 2010 |
| 14,820 |
|
| 4,542 |
| 100.00 | % |
Washington |
| Grand Forks, ND |
| 2016 |
| 17 |
|
| 705 |
| 100.00 | % |
Wells Fargo Building |
| Duluth, MN |
| 2007 |
| 95,961 |
|
| 10,092 |
| 84.28 | % |
West Oak |
| Fargo, ND |
| 2017 |
| 18 |
|
| 802 |
| 99.05 | % |
Westcourt |
| Fargo, ND |
| 2014 |
| 64 |
|
| 3,601 |
| 97.65 | % |
Westside |
| Hawley, MN |
| 2010 |
| 14 |
|
| 481 |
| 84.88 | % |
Westwind |
| Fargo, ND |
| 2008 |
| 18 |
|
| 620 |
| 94.20 | % |
Westwood Estates |
| Fargo, ND |
| 2008 |
| 200 |
|
| 7,576 |
| 96.02 | % |
Willow Park |
| Fargo, ND |
| 2008 |
| 102 |
|
| 6,387 |
| 98.48 | % |
|
|
|
|
|
|
|
|
|
|
|
|
|
|
|
|
|
|
|
|
|
|
|
|
|
|
* 70.00% ownership interest |
|
|
|
|
|
|
|
|
|
|
|
|
** 66.67% ownership interest |
|
|
|
|
|
|
|
|
|
|
|
|
*** 50.00% ownership interest |
|
|
|
|
|
|
|
|
|
|
|
|
|
|
|
|
|
|
|
|
|
|
|
|
|
The following information applies to all of our operating properties:
| We believe all of our properties are adequately covered by insurance and suitable for their intended |
40
|
|
| Our properties are located in markets where we are subject to competition in attracting new tenants and retaining current tenants; and |
| Depreciation is provided on a straight-line basis over the estimated useful lives of the buildings. |
24
The below table sets forth certain information regarding each of our properties owned, including unconsolidated affiliates, as of December 31, 2022 (in thousands, except units or leasable sq. ft.).
| | | | | | | | | | | | |
| | | | | | # of | | | | | Physical | |
| | | | | | Units or | | | | | Occupancy | |
| | | | Year | | Leasable | | | Total | | at December | |
Property |
| Location |
| Acquired |
| Sq. Ft |
| | Investment |
| 31, 2022 | |
| | | | | | | | | | | | |
Bluemont Lakes Financial Center | | Fargo, ND | | 2004 | | 31,750 | | $ | 5,255 | | 81.17 | % |
Amberwood | | Grand Forks, ND | | 2016 | | 96 | | | 4,147 | | 94.67 | % |
Applebee’s Neighborhood Bar & Grill | | Coon Rapids, MN | | 2010 | | 5,576 | | | 2,442 | | 100.00 | % |
Arbor | | Bismarck, ND | | 2013 | | 12 | | | 696 | | 98.49 | % |
Arbor II | | Bismarck, ND | | 2013 | | 12 | | | 700 | | 96.52 | % |
Arbor III | | Bismarck, ND | | 2013 | | 12 | | | 696 | | 97.80 | % |
Ashbury | | Fargo, ND | | 2013 & 2016 | | 61 | | | 4,139 | | 99.52 | % |
Auburn II | | Fargo, ND | | 2007 | | 24 | | | 1,111 | | 98.45 | % |
Autumn Ridge | | Grand Forks, ND | | 2004 | | 144 | | | 10,418 | | 95.50 | % |
Barrett Arms | | Crookston, MN | | 2014 | | 24 | | | 1,281 | | 94.35 | % |
Bayview | | Fargo, ND | | 2007 | | 100 | | | 6,083 | | 92.18 | % |
Bell Plaza* (FKA Northland Plaza) | | Bloomington, MN | | 2015 | | 299,660 | | | 51,421 | | 65.57 | % |
Belmont | | Bismarck, ND | | 2020 | | 26 | | | 1,601 | | 88.55 | % |
Berkshire | | Fargo, ND | | 2008 | | 12 | | | 525 | | 97.96 | % |
Betty Ann | | Fargo, ND | | 2009 | | 24 | | | 1,012 | | 97.58 | % |
Biolife Plasma Center | | Bismarck, ND | | 2008 | | 11,671 | | | 2,881 | | 100.00 | % |
Biolife Plasma Center | | Grand Forks, ND | | 2008 | | 13,190 | | | 2,944 | | 100.00 | % |
Biolife Plasma Center | | Janesville, WI | | 2008 | | 12,225 | | | 2,388 | | 100.00 | % |
Biolife Plasma Center | | Mankato, MN | | 2008 | | 13,181 | | | 4,149 | | 100.00 | % |
Biolife Plasma Center | | Marquette, MI | | 2008 | | 11,737 | | | 3,215 | | 100.00 | % |
Biolife Plasma Center | | Onalaska, WI | | 2008 | | 12,180 | | | 2,531 | | 100.00 | % |
Biolife Plasma Center | | Oshkosh, WI | | 2008 | | 12,191 | | | 2,297 | | 100.00 | % |
Biolife Plasma Center | | Sheboygan, WI | | 2008 | | 13,230 | | | 2,654 | | 100.00 | % |
Biolife Plasma Center | | Stevens Point, WI | | 2008 | | 13,190 | | | 2,595 | | 100.00 | % |
Birchwood I | | Fargo, ND | | 2017 | | 12 | | | 468 | | 98.78 | % |
Birchwood II | | Fargo, ND | | 2017 | | 54 | | | 2,881 | | 96.96 | % |
Bradbury | | Bismarck, ND | | 2018 | | 96 | | | 6,093 | | 93.48 | % |
Briar Pointe | | Fargo, ND | | 2021 | | 30 | | | 1,935 | | 97.61 | % |
Bridgeport | | Fargo, ND | | 2016 | | 120 | | | 8,420 | | 98.71 | % |
Bristol Park | | Grand Forks, ND | | 2016 | | 80 | | | 5,837 | | 92.84 | % |
Brookfield | | Fargo, ND | | 2008 | | 72 | | | 2,680 | | 95.90 | % |
Brownstone | | Fargo, ND | | 2021 | | 72 | | | 4,390 | | 96.91 | % |
Cambridge (FKA 44th Street) | | Fargo, ND | | 2013 | | 42 | | | 2,558 | | 99.37 | % |
Candlelight | | Fargo, ND | | 2012 | | 66 | | | 2,214 | | 93.73 | % |
Carling Manor | | Grand Forks, ND | | 2008 | | 12 | | | 838 | | 95.34 | % |
Carlton Place | | Fargo, ND | | 2008 | | 213 | | | 9,072 | | 93.54 | % |
Carr | | Fargo, ND | | 2017 | | 18 | | | 874 | | 99.13 | % |
Cedars 4 | | Fargo, ND | | 2018 | | 18 | | | 1,245 | | 97.23 | % |
Chandler 1802 | | Grand Forks, ND | | 2014 | | 24 | | | 1,434 | | 96.12 | % |
Chandler 1834 | | Grand Forks, ND | | 2018 | | 12 | | | 710 | | 91.43 | % |
Chandler 1866 | | Grand Forks, ND | | 2005 | | 12 | | | 384 | | 98.71 | % |
Chandler 1898 | | Grand Forks, ND | | 2022 | | 12 | | | 512 | | 100.00 | % |
Cherry Creek (FKA Village) | | Grand Forks, ND | | 2008 | | 35 | | | 2,008 | | 96.95 | % |
Cityside | | Fargo, ND | | 2018 | | 36 | | | 1,396 | | 89.43 | % |
Columbia Park Village | | Grand Forks, ND | | 2020 | | 12 | | | 648 | | 91.03 | % |
Columbia West | | Grand Forks, ND | | 2008 | | 70 | | | 4,487 | | 93.12 | % |
Country Club | | Fargo, ND | | 2011 | | 40 | | | 1,843 | | 95.04 | % |
Countryside | | Fargo, ND | | 2011 | | 24 | | | 951 | | 97.20 | % |
Courtyard | | St. Louis Park, MN | | 2013 | | 151 | | | 9,252 | | 93.37 | % |
Dairy Queen | | Dickinson, ND | | 2012 | | 2,811 | | | 1,331 | | 100.00 | % |
Dairy Queen | | Moorhead, MN | | 2011 | | 2,712 | | | 1,186 | | 100.00 | % |
Dairy Queen | | Apple Valley, MN | | 2018 | | 5,348 | | | 1,673 | | - | % |
Dakota Manor | | Fargo, ND | | 2014 | | 54 | | | 2,865 | | 96.57 | % |
Danbury | | Fargo, ND | | 2007 | | 135 | | | 7,547 | | 94.53 | % |
Dellwood Estates | | Anoka, MN | | 2013 | | 132 | | | 12,320 | | 97.50 | % |
Deer Park | | Hutchinson, MN | | 2022 | | 138 | | | 15,091 | | 95.99 | % |
Desoto Estates | | Grand Forks, ND | | 2022 | | 68 | | | 6,111 | | 98.06 | % |
25
Desoto Townhomes | | Grand Forks, ND | | 2022 | | 24 | | | 3,338 | | 95.85 | % |
Diamond Bend | | Mandan, ND | | 2022 | | 78 | | | 10,971 | | 92.53 | % |
Eagle Run | | West Fargo, ND | | 2010 | | 144 | | | 7,067 | | 96.38 | % |
Eagle Sky I | | Bismarck, ND | | 2016 | | 20 | | | 1,604 | | 96.23 | % |
Eagle Sky II | | Bismarck, ND | | 2016 | | 20 | | | 1,680 | | 94.72 | % |
East Bridge | | Fargo, ND | | 2017 | | 58 | | | 6,490 | | 96.18 | % |
Eastbrook | | Bismarck, ND | | 2020 | | 24 | | | 1,381 | | 87.84 | % |
Echo Manor | | Hutchinson, MN | | 2014 | | 30 | | | 1,198 | | 99.04 | % |
Eide Bailly Building*** | | Fargo, ND | | 2007 | | 74,646 | | | 9,331 | | 100.00 | % |
Emerald Court | | Fargo, ND | | 2008 | | 24 | | | 1,144 | | 98.00 | % |
Essex | | Fargo, ND | | 2017 | | 18 | | | 928 | | 87.97 | % |
Evergreen Terrace | | Omaha, NE | | 2020 | | 144 | | | 8,798 | | 95.30 | % |
Fairview | | Bismarck, ND | | 2008 | | 84 | | | 5,467 | | 95.34 | % |
Family Dollar Store | | Mandan, ND | | 2010 | | 9,100 | | | 874 | | 100.00 | % |
First International Bank & Trust | | Moorhead, MN | | 2011 | | 3,510 | | | 1,037 | | 100.00 | % |
Flagstone | | Fargo, ND | | 2021 | | 120 | | | 7,792 | | 97.00 | % |
Flickertail | | Fargo, ND | | 2008 | | 180 | | | 8,151 | | 92.73 | % |
Forest Avenue | | Fargo, ND | | 2013 | | 20 | | | 815 | | 99.19 | % |
Four Points Office Building | | Fargo, ND | | 2007 | | 12,383 | | | 1,494 | | 100.00 | % |
Foxtail Creek Townhomes | | Fargo, ND | | 2020 | | 30 | | | 1,488 | | 96.21 | % |
Galleria III | | Fargo, ND | | 2010 | | 18 | | | 1,144 | | 93.18 | % |
Garden Grove | | Bismarck, ND | | 2016 | | 95 | | | 7,274 | | 92.78 | % |
Gate City Bank | | Grand Forks, ND | | 2008 | | 17,406 | | | 2,200 | | 100.00 | % |
Georgetown | | Fridley, MN | | 2014 | | 468 | | | 33,586 | | 89.63 | % |
Glen Pond | | Eagan, MN | | 2011 | | 528 | | | 44,377 | | 95.38 | % |
Goldmark Office Park | | Fargo, ND | | 2007 | | 124,613 | | | 23,692 | | 100.00 | % |
Grand Forks Marketplace** | | Grand Forks, ND | | 2003 | | 182,522 | | | 26,710 | | 78.04 | % |
Granger Court | | Fargo, ND | | 2013 | | 59 | | | 2,841 | | 96.07 | % |
Great American Insurance Building | | Fargo, ND | | 2005 | | 15,000 | | | 2,360 | | 100.00 | % |
Guardian Building Products | | Fargo, ND | | 2012 | | 100,600 | | | 3,760 | | 100.00 | % |
Hannifin | | Bismarck, ND | | 2013 | | 14 | | | 789 | | 93.51 | % |
Harrison Richfield | | Grand Forks, ND | | 2007 | | 140 | | | 7,915 | | 94.13 | % |
Hartford | | Fargo, ND | | 2018 | | 30 | | | 1,426 | | 92.51 | % |
Hawn | | Fargo, ND | | 2020 | | 48 | | | 2,557 | | 97.89 | % |
Highland Meadows | | Bismarck, ND | | 2011 | | 144 | | | 10,629 | | 96.92 | % |
Hunter’s Run I | | Fargo, ND | | 2007 | | 12 | | | 483 | | 97.71 | % |
Hunter’s Run II | | Fargo, ND | | 2008 | | 12 | | | 518 | | 95.04 | % |
Huntington | | Fargo, ND | | 2015 | | 10 | | | 439 | | 99.18 | % |
Islander | | Fargo, ND | | 2011 | | 24 | | | 1,407 | | 96.76 | % |
Jadestone | | Fargo, ND | | 2017 | | 18 | | | 898 | | 83.60 | % |
Kennedy | | Fargo, ND | | 2013 | | 12 | | | 813 | | 99.62 | % |
Library Lane | | Grand Forks, ND | | 2007 | | 60 | | | 3,003 | | 91.22 | % |
Madison (FKA Columbine) | | Grand Forks, ND | | 2015 | | 12 | | | 740 | | 95.54 | % |
Maple Ridge | | Omaha, NE | | 2008 | | 174 | | | 10,822 | | 96.57 | % |
Maplewood | | Maplewood, MN | | 2014 | | 240 | | | 17,626 | | 94.12 | % |
Maplewood Bend | | Fargo, ND | | 2009 and 2010 | | 183 | | | 7,637 | | 96.69 | % |
Martha Alice | | Fargo, ND | | 2009 | | 24 | | | 1,055 | | 97.03 | % |
Mayfair (FKA Colony Manor) | | Grand Forks, ND | | 2008 | | 24 | | | 1,319 | | 91.99 | % |
Midtown Plaza | | Minot, ND | | 2004 | | 17,808 | | | 1,345 | | 77.48 | % |
Monticello | | Fargo, ND | | 2013 | | 18 | | | 989 | | 97.25 | % |
Montreal Courts | | Little Canada, MN | | 2013 | | 444 | | | 30,686 | | 94.51 | % |
Morningside | | Fargo, ND | | 2018 | | 17 | | | 803 | | 98.40 | % |
Newgate | | Bismarck, ND | | 2022 | | 46 | | | 2,473 | | 89.52 | % |
Oak Court | | Fargo, ND | | 2008 | | 81 | | | 3,118 | | 96.48 | % |
Oakview Townhomes (FKA Arrowhead) | | Grand Forks, ND | | 2017 | | 82 | | | 6,004 | | 97.75 | % |
O'Reilly Auto Store | | Mandan, ND | | 2010 | | 6,300 | | | 706 | | 100.00 | % |
Oxford | | Fargo, ND | | 2021 | | 144 | | | 10,219 | | 97.54 | % |
Pacific Park I | | Fargo, ND | | 2013 | | 30 | | | 1,064 | | 95.51 | % |
Pacific Park II | | Fargo, ND | | 2013 | | 39 | | | 1,182 | | 94.54 | % |
Pacific South | | Fargo, ND | | 2013 | | 15 | | | 607 | | 96.37 | % |
Park Circle | | Fargo, ND | | 2017 | | 18 | | | 937 | | 99.56 | % |
Parkview Arms | | Bismarck, ND | | 2015 | | 62 | | | 4,850 | | 92.80 | % |
Parkway Office (FKA Echelon Building) | | Fargo, ND | | 2006 | | 17,000 | | | 1,954 | | 100.00 | % |
Parkwest Gardens | | West Fargo, ND | | 2014 | | 142 | | | 8,292 | | 96.10 | % |
Parkwood | | Fargo, ND | | 2008 | | 40 | | | 1,462 | | 97.77 | % |
Pebble Creek | | Bismarck, ND | | 2008 | | 70 | | | 3,396 | | 95.86 | % |
26
Pinehurst | | Fargo, ND | | 2021 | | 210 | | | 14,982 | | 95.31 | % |
Plumtree | | Fargo, ND | | 2017 | | 18 | | | 939 | | 99.76 | % |
Prairiewood Court I & II | | Fargo, ND | | 2006 and 2007 | | 60 | | | 2,434 | | 90.98 | % |
Prairiewood Meadows | | Fargo, ND | | 2012 | | 88 | | | 5,290 | | 93.30 | % |
Prose | | Fort Worth, TX | | 2022 | | 270 | | | 55,690 | | 75.19 | % |
Quail Creek | | Springfield, MO | | 2015 | | 164 | | | 11,236 | | 95.51 | % |
Redpath | | White Bear Lake, MN | | 2016 | | 25,817 | | | 4,017 | | 100.00 | % |
Robinwood | | Coon Rapids, MN | | 2014 | | 120 | | | 8,399 | | 93.70 | % |
Rosedale Estates | | Roseville, MN | | 2014 | | 360 | | | 26,637 | | 90.13 | % |
Rosegate | | Fargo, ND | | 2008 | | 90 | | | 3,608 | | 94.55 | % |
Rosser | | Bismarck, ND | | 2020 | | 24 | | | 1,468 | | 95.21 | % |
Roughrider | | Grand Forks, ND | | 2016 | | 12 | | | 699 | | 92.64 | % |
Saddlebrook | | West Fargo, ND | | 2008 | | 60 | | | 1,804 | | 97.04 | % |
Sage Park (FKA Brighton Village) | | New Brighton, MN | | 2014 | | 240 | | | 17,840 | | 94.88 | % |
Sargent | | Fargo, ND | | 2017 | | 36 | | | 1,734 | | 94.51 | % |
Schrock | | Fargo, ND | | 2013 | | 18 | | | 811 | | 98.63 | % |
SE Maple Grove, LLC**** | | Maple Grove, MN | | 2021 | | 161 | | | 32,079 | | 59.28 | % |
SE Savage, LLC**** | | Savage, MN | | 2021 | | 190 | | | 36,794 | | 94.32 | % |
Sheridan Pointe | | Fargo, ND | | 2013 | | 48 | | | 2,945 | | 94.96 | % |
Sierra Ridge | | Bismarck, ND | | 2006 and 2011 | | 136 | | | 11,165 | | 97.83 | % |
Somerset | | Fargo, ND | | 2008 | | 75 | | | 4,027 | | 96.32 | % |
Southgate | | Fargo, ND | | 2007 | | 162 | | | 6,581 | | 98.26 | % |
Southview III | | Grand Forks, ND | | 2011 | | 18 | | | 776 | | 89.31 | % |
Southview Village | | Fargo, ND | | 2007 | | 72 | | | 3,648 | | 97.62 | % |
Spring | | Fargo, ND | | 2013 | | 25 | | | 1,053 | | 98.80 | % |
Stanford Court | | Grand Forks, ND | | 2013 | | 96 | | | 4,864 | | 90.35 | % |
Stonefield | | Bismarck, ND | | 2014 | | 192 | | | 30,096 | | 97.87 | % |
Stony Brook | | Omaha, NE | | 2009 | | 148 | | | 11,599 | | 95.45 | % |
Summerfield | | Fargo, ND | | 2015 | | 18 | | | 862 | | 97.58 | % |
Summit Point | | Fargo, ND | | 2015 | | 87 | | | 7,005 | | 97.86 | % |
Sunchase | | Fargo, ND | | 2017 | | 36 | | | 1,878 | | 98.01 | % |
Sunset Ridge | | Bismarck, ND | | 2008 and 2010 | | 180 | | | 12,471 | | 96.59 | % |
Sunview | | Grand Forks, ND | | 2008 | | 36 | | | 2,073 | | 95.77 | % |
Sunwood Estates | | Fargo, ND | | 2007 | | 80 | | | 4,452 | | 92.81 | % |
Thunder Creek | | Fargo, ND | | 2018 | | 57 | | | 5,391 | | 94.37 | % |
Titan Machinery | | Bismarck, ND | | 2015 | | 22,293 | | | 3,448 | | 100.00 | % |
Titan Machinery | | Dickinson, ND | | 2012 | | 17,760 | | | 1,790 | | 100.00 | % |
Titan Machinery | | Fargo, ND | | 2012 | | 29,800 | | | 3,336 | | 100.00 | % |
Titan Machinery | | Marshall, MN | | 2011 | | 67,600 | | | 5,081 | | 100.00 | % |
Titan Machinery | | Minot, ND | | 2012 | | 23,690 | | | 2,630 | | 100.00 | % |
Titan Machinery | | North Platte, NE | | 2016 | | 18,910 | | | 1,769 | | 100.00 | % |
Titan Machinery | | Sioux City, IA | | 2013 | | 36,332 | | | 4,567 | | 100.00 | % |
Trustmark | | Fargo, ND | | 2020 | | 45,755 | | | 13,425 | | 100.00 | % |
Twin Oaks | | Hutchinson, MN | | 2014 | | 80 | | | 4,470 | | 97.75 | % |
Twin Parks | | Fargo, ND | | 2008 | | 66 | | | 2,596 | | 98.76 | % |
Valley Homes Duplexes | | Grand Forks, ND | | 2015 | | 24 | | | 2,572 | | 93.45 | % |
Valley View | | Golden Valley, MN | | 2014 | | 72 | | | 7,820 | | 98.99 | % |
Village Park | | Fargo, ND | | 2008 | | 60 | | | 2,416 | | 98.82 | % |
Village West | | Fargo, ND | | 2008 | | 80 | | | 2,987 | | 95.82 | % |
Walgreens | | Alexandria, LA | | 2009 | | 14,560 | | | 4,296 | | 100.00 | % |
Walgreens | | Batesville, AR | | 2009 | | 14,820 | | | 7,616 | | 100.00 | % |
Walgreens | | Denver, CO | | 2011 | | 13,390 | | | 5,210 | | 100.00 | % |
Walgreens | | Fayetteville, AR | | 2009 | | 14,550 | | | 5,810 | | 100.00 | % |
Walgreens | | Laurel, MS | | 2010 | | 14,820 | | | 4,542 | | 100.00 | % |
Washington | | Grand Forks, ND | | 2016 | | 17 | | | 745 | | 94.30 | % |
Wells Fargo Building | | Duluth, MN | | 2007 | | 95,961 | | | 10,801 | | 55.24 | % |
West Oak | | Fargo, ND | | 2017 | | 18 | | | 869 | | 97.94 | % |
Westcourt | | Fargo, ND | | 2014 | | 64 | | | 3,710 | | 93.43 | % |
Westside | | Hawley, MN | | 2010 | | 14 | | | 544 | | 90.67 | % |
Westwind | | Fargo, ND | | 2008 | | 18 | | | 633 | | 91.87 | % |
Westwood Estates | | Fargo, ND | | 2008 | | 200 | | | 8,277 | | 93.58 | % |
Willow Park | | Fargo, ND | | 2008 | | 102 | | | 6,767 | | 94.94 | % |
Wolf Creek | | Fargo, ND | | 2020 | | 54 | | | 5,364 | | 99.18 | % |
Woodland Pines (FKA Fredericksburg) | | Omaha, NE | | 2018 | | 173 | | | 13,250 | | 95.21 | % |
| | | | | | | | | | | | |
* 70.00% ownership interest | | | | | | | | | | | | |
27
** 66.67% ownership interest | | | | | | | | | | | | |
*** 50.00% ownership interest | | | | | | | | | | | | |
**** 60% ownership interest | | | | | | | | | | | | |
Geography
Geography
Of our 166185 properties, 118142 are located in North Dakota, with 7789 being located in the greater Fargo, North Dakota and Moorhead, Minnesota metropolitan statistical area. These 118 residential and commercial propertiesThe North Dakota region generated approximately 51.5%51.9% of our rental revenue for the year ended December 31, 2017. 2022.
The following table presents the total real estate investment amount by state and annual rental revenue by state, as of and for the yearsyear ended December 31, 20172022 (in thousands):
|
|
|
|
|
|
|
|
|
|
|
|
| ||||||||||||
|
| Real Estate |
|
|
|
| Rental |
|
|
| ||||||||||||||
| | | | | | | | | | | | | ||||||||||||
| | Real Estate | | | | | Rental | | | | ||||||||||||||
State |
| Investment |
| % |
|
| Revenue |
| % |
|
| Investment | | % | | | Revenue | | % | | ||||
North Dakota |
| $ | 391,097 |
| 51.5 | % |
| $ | 54,251 |
| 50.2 | % | | $ | 510,127 | | 52.5 | % | | $ | 70,132 | | 51.9 | % |
Minnesota |
|
| 290,979 |
| 38.3 | % |
|
| 44,788 |
| 41.4 | % | | | 305,463 | | 34.6 | % | | | 51,314 | | 38.0 | % |
Other |
|
| 77,627 |
| 10.2 | % |
|
| 9,097 |
| 8.4 | % | | | 155,558 | | 16.0 | % | | | 13,614 | | 10.1 | % |
|
| $ | 759,703 |
| 100.0 | % |
| $ | 108,136 |
| 100.0 | % | ||||||||||||
| | $ | 971,148 | | 103.1 | % | | $ | 135,060 | | 100.0 | % | ||||||||||||
Economy
The North Dakota workforce is concentrated in agricultural, energy, information technology, aerospace sciences and medical sciences. According to the U.S. Census Bureau, the 20152022 estimated combined population of the Fargo, West Fargo and Moorhead metro area is 233,836was 210,903 people.
The following chart depicts the difference in unemployment rates between North Dakota and the national average for 2017: 2022:
| | | | | | | | | | | | | | | | | | | | | | | | | | | | | | | | | | | | |
|
| Jan | | | Feb | | | Mar | | | Apr | | | May | | | Jun | | | Jul | | | Aug | | | Sep | | | Oct | | | Nov | | | Dec | |
National (1) | | 4.0 | % | | 3.8 | % | | 3.6 | % | | 3.6 | % | | 3.6 | % | | 3.6 | % | | 3.5 | % | | 3.7 | % | | 3.5 | % | | 3.7 | % | | 3.6 | % | | 3.5 | % |
North Dakota (1) | | 3.1 | % | | 2.9 | % | | 2.9 | % | | 2.8 | % | | 2.6 | % | | 2.5 | % | | 2.3 | % | | 2.3 | % | | 2.2 | % | | 2.3 | % | | 2.3 | % | | 2.3 | % |
|
|
|
|
|
|
|
|
|
|
|
|
|
|
|
|
|
|
|
|
|
|
|
|
|
|
|
|
|
|
|
|
|
|
|
|
|
|
| Jan |
|
| Feb |
|
| Mar |
|
| Apr |
|
| May |
|
| Jun |
|
| Jul |
|
| Aug |
|
| Sep |
|
| Oct |
|
| Nov |
|
| Dec |
|
National (1) |
| 4.8 | % |
| 4.7 | % |
| 4.5 | % |
| 4.4 | % |
| 4.3 | % |
| 4.3 | % |
| 4.3 | % |
| 4.4 | % |
| 4.2 | % |
| 4.1 | % |
| 4.1 | % |
| 4.1 | % |
North Dakota (1) |
| 3.0 | % |
| 3.0 | % |
| 2.8 | % |
| 2.7 | % |
| 2.5 | % |
| 2.3 | % |
| 2.3 | % |
| 2.3 | % |
| 2.4 | % |
| 2.5 | % |
| 2.6 | % |
| 2.6 | % |
| (1) |
| Seasonally adjusted |
Source: Bureau of Labor Statistics
Tenants
Our tenants are varied and consist of individuals, national, regional, and local businesses. Our commercial/retail properties generally attract a mix of tenants who provide basic staples, convenience items and services tailored to the specific cultures, needs and preferences of the surrounding community. In 2017, 2016 and 2015, no single tenant represented more than 10% of our revenues. We have investments in several types of real estate, including multifamily, retail, office, industrial, restaurant, and medical. Within our office, retail and industrial properties, we have over 114 tenants who operate in numerous industries, including restaurants, pharmacy, financing, banking, insurance, professional services, technology, wholesale and direct retail.
Lease Expirations
The vast majority of residential leases are for one year periods. The following table lists a summary, as of December 31, 2017, of lease expirations on non-residential properties schedule to occur during each of the ten calendar years from 2018 to 2027 and
41
thereafter, assuming that tenants exercise no renewal options or early termination rights. Base rents do not include CAM (common area maintenance).
The table is based on leases at December 31, 2017 for our non-residential properties including our unconsolidated affiliates (in thousands, except leasable area data).
|
|
|
|
|
|
|
|
|
|
|
|
|
|
|
| # of Leases |
| Gross |
| % of Gross |
|
| Expiring |
| % of Total |
| |
Lease Expiration Year |
| Expiring |
| Leasable Area |
| Leasable Area |
|
| Base Rent |
| Base Rent |
| |
Month-to-Month |
| 7 |
| 55,348 |
| 3.43 | % |
| $ | 770 |
| 5.21 | % |
2018 |
| 15 |
| 51,384 |
| 3.19 | % |
|
| 466 |
| 3.15 | % |
2019 |
| 21 |
| 78,692 |
| 4.88 | % |
|
| 785 |
| 5.31 | % |
2020 |
| 22 |
| 251,448 |
| 15.60 | % |
|
| 1,377 |
| 9.31 | % |
2021 |
| 25 |
| 415,864 |
| 25.81 | % |
|
| 2,984 |
| 20.18 | % |
2022 |
| 14 |
| 274,069 |
| 17.01 | % |
|
| 1,558 |
| 10.54 | % |
2023 |
| 7 |
| 28,911 |
| 1.79 | % |
|
| 204 |
| 1.38 | % |
2024 |
| 3 |
| 26,456 |
| 1.64 | % |
|
| 115 |
| 0.78 | % |
2025 |
| 3 |
| 35,040 |
| 2.17 | % |
|
| 686 |
| 4.64 | % |
2026 |
| 2 |
| 71,451 |
| 4.43 | % |
|
| 633 |
| 4.28 | % |
2027 |
| 3 |
| 52,474 |
| 3.26 | % |
|
| 360 |
| 2.43 | % |
Thereafter |
| 18 |
| 270,369 |
| 16.78 | % |
|
| 4,850 |
| 32.79 | % |
Leased Total |
| 140 |
| 1,611,506 |
| 100.00 | % |
| $ | 14,788 |
| 100.00 | % |
Mortgage Notes Secured by the Properties
At December 31, 2017, we had $397,567 in mortgage notes payable with respect to our properties. Principal payments on these notes are payable as follows (in thousands):
|
|
|
|
Years ending December 31, |
| Amount | |
2018 |
| $ | 15,593 |
2019 |
|
| 25,364 |
2020 |
|
| 28,045 |
2021 |
|
| 45,935 |
2022 |
|
| 31,210 |
Thereafter |
|
| 251,420 |
|
| $ | 397,567 |
Acquisitions and Dispositions
We acquired a controlling interest in twelve propertieshad eight acquisitions and disposedfive dispositions of one retail property during the year ended December 31, 2017. 2022. We had five acquisitions and two dispositions of property during the year ended December 31, 2021. We had nine acquisitions and three dispositions of property during the year ended December 31, 2020.
Capitalization rates are a key decision makingdecision-making item used by the Board. Capitalization rates for acquisitions are calculated using projected net operating income divided by the investment. Net operating income is calculated by taking GAAP net income and adding back depreciation, amortization and interest expense. Capitalization rates for dispositions are calculated in the same way with the exception of using historical, rather than projected, net operating income.
We use historical occupancy, rental income, and expenses to calculate projected net operating income for potential real estate investments. For residential properties, we make various assumptions about future rents, occupancy levels, and expenses based on historical financial information and our assessment of the property’s future potential. The projected NOI for residential acquisitions is typically based on historical occupancy and expenses over a three to five year period. When historical information is unavailable, market vacancy and credit loss factors are estimated. We normally do not assign a value to residential tenant leases already in place due to the short-term duration of twelve months or less of these leases and the uncertainty of retaining all tenants due to a change in ownership and in some cases property management companies.
42
For commercial properties, assumptions regarding rental income and expenses are based on the terms of the in-place leases and available historical financial information which is then used to generate projected net operating income.
Numerous estimates and assumptions are necessary to generate projected net operating income for potential commercial and residential acquisitions, and there is no guarantee actual net operating income will equal projected net operating income.
In making acquisitions, the Board currently targets capitalization rates between 6.0 to 10.0%, depending on the amount of risk involved. For those properties with greater risk, the Board targets greater capitalization rates (9.0% or greater). For those properties exhibiting less risk, a lower capitalization risk is acceptable. For potential acquisitions, the Board also requires an adequate spread between the financing on the property and the capitalization rate. Capitalization rates for acquisitions are calculated using projected net operating income divided by the investment. Net operating income is calculated by taking GAAP net income and adding back depreciation, amortization, and interest expense. Capitalization rates for dispositions are calculated in the same way with the exception of using historical, rather than projected, net operating income. The market has seen an increase in investors, driving up overall acquisition prices, thus lowering capitalization rates below the target thresholds set by the Board.
See
28
We use historical occupancy, rental income, and expenses to calculate projected net operating income for potential real estate investments. For residential properties, we make various assumptions about future rents, occupancy levels, and expenses based on historical financial statement note 19information and 20our assessment of the property’s future potential. The projected NOI for additional detailsresidential acquisitions is typically based on historical occupancy and expenses over a three-to-five year period. When historical information is unavailable, market vacancy and credit loss factors are estimated.
For commercial and residential properties, assumptions regarding rental income and expenses are based on the terms of the in-place leases and available historical financial information which is then used to generate projected net operating income.
Numerous estimates and assumptions are necessary to generate projected net operating income for potential commercial and residential acquisitions, and dispositions.there is no guarantee actual net operating income will equal projected net operating income.
InsuranceTenants
Our tenants are varied and consist of individuals and national, regional, and local businesses. Our commercial properties generally attract a mix of tenants. In 2022, 2021 and 2020, no single tenant represented more than 10% of our revenues. We have investments in several types of real estate, including multifamily, retail, office, industrial, and medical. Within our office, retail, and industrial properties, we have over 100 tenants who operate in numerous industries, including restaurants, pharmacy, medical, financing, banking, insurance, professional services, technology, wholesale and direct retail.
Lease Expirations
The vast majority of residential leases are for one-year periods. The following table lists a summary, as of December 31, 2022, of lease expirations on non-residential properties scheduled to occur during each of the ten calendar years from 2023 to 2032 and thereafter, assuming that tenants exercise no renewal options or early termination rights. Base rents do not include CAM (common area maintenance).
The table is based on leases on December 31, 2022 for our non-residential properties including our unconsolidated affiliates (in thousands, except leasable area data).
| | | | | | | | | | | | | |
| | # of Leases | | Gross | | % of Gross | | | Expiring | | % of Total | | |
Lease Expiration Year |
| Expiring |
| Leasable Area |
| Leasable Area | |
| Base Rent |
| Base Rent | | |
Month-to-Month | | 0 | | — | | 0.00 | % | | $ | — | | 0.00 | % |
2023 | | 7 | | 23,335 | | 1.81 | % | | | 234,781 | | 1.05 | % |
2024 | | 19 | | 156,445 | | 12.16 | % | | | 828,540 | | 3.72 | % |
2025 | | 13 | | 142,130 | | 11.05 | % | | | 831,440 | | 3.73 | % |
2026 | | 11 | | 150,378 | | 11.69 | % | | | 1,136,265 | | 5.10 | % |
2027 | | 13 | | 128,878 | | 10.02 | % | | | 2,695,716 | | 12.09 | % |
2028 | | 7 | | 69,390 | | 5.39 | % | | | 1,038,051 | | 4.65 | % |
2029 | | 5 | | 86,532 | | 6.73 | % | | | 484,989 | | 2.17 | % |
2030 | | 13 | | 147,113 | | 11.43 | % | | | 1,994,416 | | 8.94 | % |
2031 | | 3 | | 111,196 | | 8.64 | % | | | 1,314,405 | | 5.89 | % |
2032 | | 8 | | 181,795 | | 14.13 | % | | | 1,668,691 | | 7.48 | % |
Thereafter | | 7 | | 89,384 | | 6.95 | % | | | 10,072,420 | | 45.18 | % |
Leased Total | | 106 | | 1,286,576 | | 100.00 | % | | $ | 22,299,714 | | 100.00 | % |
29
Mortgage Notes Secured by the Properties
On December 31, 2022, we had $508,305 in mortgage notes payable with respect to our properties. Principal payments on these notes are payable as follows (in thousands):
| | | |
Years ending December 31, | | Amount | |
2023 | | $ | 53,341 |
2024 | | | 22,376 |
2025 | | | 53,130 |
2026 | | | 45,546 |
2027 | | | 77,845 |
Thereafter | | | 256,067 |
| | $ | 508,305 |
Insurance
We believe we have adequate property damage, fire loss and liability insurance on all of our properties with reputable, commercially rated companies. We also believe our insurance policies contain commercially reasonable deductibles and limits, adequate to cover our properties. We expect to maintain this type of insurance coverage and to obtain similar coverage with respect to any additional properties we acquire in the near future. Further, we have title insurance relating to our properties in an aggregate amount we believe to be adequate.
Regulations
Our properties, as well as any other properties we may acquire in the future, are subject to various federal, state, and local laws, ordinances and regulations. They include, among other things, zoning regulations, land use controls, environmental controls relating to air and water quality, noise pollution and indirect environmental impacts such as increased motor vehicle activity. We believe we have all permits and approvals necessary under current law to operate our properties.
InThe Company is subject, from time to time, to various legal proceedings and claims that arise in the ordinary course of our operations, we may become involved in litigation. Suchbusiness. While the resolution of such matters maycannot be generally covered by insurance. At this time, we arepredicted with certainty, management believes, based on currently available information, that the final outcome of such matters will not awarehave a material effect on the financial statements of any material pending or threatened legal proceedings, or other proceedings contemplated by governmental authorities.the Company.
ITEM 4. MINE SAFETY DISCLOSURES
Not applicable.
PART II
ITEM 5. MARKET FOR REGISTRANT’S COMMON EQUITY, RELATED SHAREHOLDER MATTERS AND ISSUER PURCHASES OF EQUITY SECURITIES
Market Information
Our common shares of beneficial interest are not listed on any national exchange or over-the-counter market or quoted on any national securities market, and we currently do not have plans to list or have our common shares quoted.
30
Shareholders and Unit Holders
As of March 9, 2018,14, 2023, we had 8,633,57510,947,790, common shares of beneficial interests outstanding, held by a total of 9711,122 common shareholders and no outstanding options or warrants to purchase our common shares.
43
In addition, as of March 9, 2018,14, 2023, there were approximately 17,499,91018,687,896 limited partnership units of our operating partnership outstanding held by approximately 503529 limited partners. Pursuant to the exchange rights under the LLLP Agreement of the operating partnership, we have the option, upon redemption requests by the holders of the limited partnership units, to acquire the limited partnership units by paying the holders with our common shares of beneficial interest on a one-for-one exchange basis.in lieu of delivering cash. The numbers of common shareholders and limited partners is based on the Company’s records. There is no public trading market for our common shares or the limited partnership units of our Operating Partnership.
Quarterly Dividend Data
We have declared and intend to continue to declare regular quarterly dividends to our common shareholders. Because all of our operations are conducted through our operating partnership, our ability to pay dividends depends on the operating partnership’s ability to make distributions to us and its other limited partners. We pay declared dividends quarterly, whereby the dividend attributable to a calendar quarter would be paid during the first month of the next quarter. Dividends will be paid to common shareholders as of the record dates selected by the Board of Trustees. We intend to make dividends sufficient to satisfy the requirements for qualification as a REIT for federal tax purposes.
The following tables show the dividends we have declared (including the total amount paid on a per share basis, paid in cash, reinvested in shares of our common stock pursuant to the Dividend Reinvestment Plan, and the total amount paid) during the last two fiscal years (in thousands, except per share data).
|
|
|
|
|
|
|
|
|
|
|
|
|
| |||||||||||||
|
| Dividends Per |
|
|
|
| Reinvested |
|
|
|
| |||||||||||||||
2017 Quarter Ended |
| Common Share |
| Cash |
| via DRP |
| Total Dividends |
| |||||||||||||||||
| | | | | | | | | | | ||||||||||||||||
| | Dividends Per | | | | Reinvested | | | | | ||||||||||||||||
2022 Quarter Ended |
| Common Share |
| Cash |
| via DRP |
| Total Dividends | | |||||||||||||||||
December 31 |
| $ | 0.2475 |
| $ | 726 |
| $ | 1,375 |
| $ | 2,101 | (a) | | $ | 0.287500 | | $ | 1,146 | | $ | 1,962 | | $ | 3,108 | (a) |
September 30 |
| $ | 0.2475 |
|
| 740 |
|
| 1,327 |
|
| 2,067 |
| | $ | 0.287500 | | 1,097 | | 1,973 | | | 3,070 | | ||
June 30 |
| $ | 0.2475 |
|
| 746 |
|
| 1,290 |
|
| 2,036 |
| | $ | 0.287500 | | 1,127 | | 1,910 | | | 3,037 | | ||
March 31 |
| $ | 0.2475 |
|
| 715 |
|
| 1,293 |
|
| 2,008 |
| | $ | 0.287500 | | | 1,130 | | | 1,877 | | | 3,007 | |
|
|
|
|
| $ | 2,927 |
| $ | 5,285 |
| $ | 8,212 |
| |||||||||||||
| | | | $ | 4,500 | | $ | 7,722 | | $ | 12,222 | | ||||||||||||||
| | | | | | | | | | | | | |
| | Dividends Per | | | | | Reinvested | | | | | ||
2021 Quarter Ended | | Common Share | | Cash | | via DRP | | Total Dividends | | ||||
December 31 | | $ | 0.265000 | | $ | 1,024 | | $ | 1,716 | | $ | 2,740 | (a) |
September 30 | | $ | 0.265000 | | | 927 | | | 1,780 | | | 2,707 | |
June 30 | | $ | 0.265000 | | | 928 | | | 1,743 | | | 2,671 | |
March 31 | | $ | 0.265000 | | | 963 | | | 1,679 | | | 2,642 | |
| | | | | $ | 3,842 | | $ | 6,918 | | $ | 10,760 | |
|
|
|
|
|
|
|
|
|
|
|
|
|
|
|
| Dividends Per |
|
|
|
| Reinvested |
|
|
|
| ||
2016 Quarter Ended |
| Common Share |
| Cash |
| via DRP |
| Total Dividends |
| ||||
December 31 |
| $ | 0.2400 |
| $ | 668 |
| $ | 1,252 |
| $ | 1,920 | (a) |
September 30 |
| $ | 0.2400 |
|
| 676 |
|
| 1,217 |
|
| 1,893 |
|
June 30 |
| $ | 0.2400 |
|
| 642 |
|
| 1,227 |
|
| 1,869 |
|
March 31 |
| $ | 0.2400 |
|
| 664 |
|
| 1,181 |
|
| 1,845 |
|
|
|
|
|
| $ | 2,650 |
| $ | 4,877 |
| $ | 7,527 |
|
| (a) |
| Fourth quarter dividends paid on January |
We expectThe Trust expects that future dividends will be maintained at least at the present rate, unless there are changes in our results of operations, our general financial condition, general economic conditions, or the Board determines other action prudent.
31
Sale of Securities
Neither Sterling norDuring the operating partnership issued any unregistered securities during the three monthsyear ended December 31, 2017, except as noted below:
44
In connection$12,870, for the purchase of real estate investments. The units were sold to accredited investors unaffiliated with the completionOperating Partnership in private placement transactions exempt from the registration requirements of the acquisitionSecurities Act of certain contributed properties,1933 pursuant to Section 4(a)(2) of such Act. Limited Partners may request, in accordance with the operating partnership issued units as a portionrequirements of the purchase price, atredemptions plans, the redemption of their limited partnership units for cash or the exchange of their limited partnership units for common shares of the Trust in lieu of cash for the redemption on a price perbasis of one limited partnership unit for one common share. At the sole and absolute discretion of the Operating partnership, and so long as our redemption plans exist and applicable conditions and limitations are satisfied, the Trust may, acting for itself or in its capacity as General Partner of $16.50, as set forth in the table below, duringOperating Partnership, elect to redeem or exchange such limited partnership units.
Other Sales
During the three monthsyears ended December 31, 2017 (in thousands, except per unit data) pursuant to Section 4(2)2022, 2021 and Rule 506 of Regulation D.
|
|
|
|
|
|
|
|
|
|
| Property |
|
|
|
|
|
|
|
| Acquisition |
|
| Number of |
| Aggregate | |
Property |
| Date |
|
| Units |
| Consideration | |
Birchwood I Apartments, Fargo, ND |
| 12/01/17 |
|
| 3,120 |
| $ | 51 |
Birchwood II Apartments, Fargo, ND |
| 12/01/17 |
|
| 18,398 |
|
| 304 |
|
|
|
|
| 21,518 |
| $ | 355 |
Other Sales
During the three months ended December 31, 2017,2020, there were no common shares exchangedof the Trust issued in exchange for limited partnership units of the operating partnership on a one-for-one basis pursuant to redemption requests made by accredited investors pursuant to Section 4(2) and Rule 506 of Regulation D.partnership.
Redemptions of Securities
Set forth below is information regarding common shares and limited partnership units redeemed during the three monthsyear ended December 31, 2017:2022
|
|
|
|
|
|
|
|
|
|
|
|
|
|
|
|
|
|
|
|
|
|
| Average |
| Total Number of |
| Total Number of |
| Approximate Dollar Value of | ||
|
| Total Number |
|
| Total Number |
| Price |
| Shares Redeemed |
| Units Redeemed |
| Shares (or Units) that May | ||
|
| of Common |
|
| of Limited |
| Paid per |
| as Part of |
| as Part of |
| Yet Be Redeemed Under | ||
|
| Shares |
|
| Partner Units |
| Common |
| Publicly Announced |
| Publicly Announced |
| Publicly Announced | ||
Period |
| Redeemed |
|
| Redeemed |
| Share/Unit |
| Plans or Programs |
| Plans or Programs |
| Plans or Programs | ||
October 1-31, 2017 |
| 3,000 |
|
| 6,000 |
| $ | 15.50 |
| 1,083,000 |
| 687,000 |
| $ | 6,045 |
November 1-30, 2017 |
| 27,000 |
|
| 18,000 |
| $ | 15.50 |
| 1,110,000 |
| 705,000 |
| $ | 5,345 |
December 1-31, 2017 |
| — |
|
| 1,000 |
| $ | 15.50 |
| 1,110,000 |
| 706,000 |
| $ | 5,317 |
Total |
| 30,000 |
|
| 25,000 |
|
|
|
|
|
|
|
|
|
|
| | | | | | | | | | | | | | | |
| | | | | | | Average | | Total Number of | | Total Number of | | Approximate Dollar Value of | ||
| | Total Number | | | Total Number | | Price | | Shares Redeemed | | Units Redeemed | | Shares (or Units) that May | ||
| | of Common | | | of Limited | | Paid per | | as Part of | | as Part of | | Yet Be Redeemed Under | ||
| | Shares | | | Partner Units | | Common | | Publicly Announced | | Publicly Announced | | Publicly Announced | ||
Period |
| Redeemed | |
| Redeemed |
| Share/Unit |
| Plans or Programs |
| Plans or Programs |
| Plans or Programs | ||
October 1-31, 2022 | | 1,000 | | | — | | $ | 21.85 | | 1,501,000 | | 1,147,000 | | $ | 14,870 |
November 1-30, 2022 | | 1,000 | | | 4,000 | | $ | 21.85 | | 1,502,000 | | 1,151,000 | | $ | 14,750 |
December 1-31, 2022 | | — | | | 3,000 | | $ | 21.85 | | 1,502,000 | | 1,154,000 | | $ | 14,684 |
Total | | 2,000 | | | 7,000 | | | | | | | | | | |
For the three monthsyear ended December 31, 2017, we2022, the Trust redeemed all shares or units for which we received redemption requests. In addition, for the three monthsyear ended December 31, 2017,2022, all common shares and units redeemed were redeemed as part of the publicly announced plans.
The Amended and Restated Share Redemption Plan, effective January 1, 2022, permits us to repurchase common shares held by our shareholders and limited partnership units held by partners of our operating partnership,Operating Partnership, up to a maximuman aggregate amount of $30,000$55,000 worth of shares and units, upon request by the holders after they have held them for at least one year and subject to other conditions and limitations described in the plan. The amount remaining to be redeemed as of December 31, 2022, was $14,684. The redemption price for such shares and units redeemed under the plan was fixed at $15.00$21.85 per share or unit, which was increased to $15.50 effective March 29, 2017. Subsequently the redemption price was increased to $17.50became effective January 1, 2018, and is the current redemption price.2022. The redemption plan will terminate in the event the shares become listed on any national securities exchange, the subject of bona fide quotes on any inter-dealer quotation system or electronic communications network or are the subject of bona fide quotes in the pink sheets. Additionally, the Board, in its sole discretion, may terminate, amend or suspend the redemption plan at any time if it determines to do so is in our best interest.
45
ITEM 6. SELECTED FINANCIAL DATA
The following table sets forth our selected consolidated financial information and should be read in conjunction with “Management’s Discussion and AnalysisNone.
32
|
|
|
|
|
|
|
|
|
|
|
|
|
|
|
|
|
| December 31, | |||||||||||||
|
| 2017 |
| 2016 |
| 2015 |
| 2014 |
| 2013 | |||||
BALANCE SHEET DATA: |
| (in thousands, except per share data) | |||||||||||||
Total assets |
| $ | 691,605 |
| $ | 670,513 |
| $ | 642,375 |
| $ | 564,145 |
| $ | 448,300 |
Mortgage loans payable, net |
| $ | 394,843 |
| $ | 390,479 |
| $ | 379,911 |
| $ | 324,886 |
| $ | 239,008 |
Total liabilities |
| $ | 417,830 |
| $ | 411,858 |
| $ | 401,948 |
| $ | 358,511 |
| $ | 251,094 |
Stockholders' equity |
| $ | 273,775 |
| $ | 258,655 |
| $ | 240,427 |
| $ | 205,634 |
| $ | 197,206 |
|
|
|
|
|
|
|
|
|
|
|
|
|
|
|
|
|
| Year Ended December 31, | |||||||||||||
|
| 2017 |
| 2016 |
| 2015 |
| 2014 |
| 2013 | |||||
STATEMENT OF OPERATIONS DATA: |
|
|
|
|
|
|
|
|
|
|
|
|
|
|
|
Rental income |
| $ | 114,298 |
| $ | 108,063 |
| $ | 97,182 |
| $ | 70,936 |
| $ | 61,943 |
Operating expenses |
|
| 95,062 |
|
| 91,500 |
|
| 81,834 |
|
| 57,404 |
|
| 47,260 |
Interest |
|
| 18,630 |
|
| 18,366 |
|
| 17,141 |
|
| 12,958 |
|
| 11,222 |
Depreciation and amortization |
|
| 21,544 |
|
| 22,145 |
|
| 19,574 |
|
| 13,575 |
|
| 12,219 |
Total expenses |
|
| 100,206 |
|
| 97,100 |
|
| 87,481 |
|
| 64,228 |
|
| 52,866 |
Total other income (expense) |
|
| 5,791 |
|
| 1,894 |
|
| 1,683 |
|
| 2,595 |
|
| 890 |
Loss on impairment of property |
|
| — |
|
| — |
|
| 412 |
|
| — |
|
| 226 |
Discontinued operations |
|
| — |
|
| — |
|
| — |
|
| — |
|
| 3,350 |
Net income |
|
| 19,883 |
|
| 12,857 |
|
| 11,384 |
|
| 9,303 |
|
| 13,317 |
Noncontrolling interest in income |
|
| 13,369 |
|
| 8,432 |
|
| 7,098 |
|
| 6,724 |
|
| 9,355 |
Net income attributable to Sterling |
| $ | 6,514 |
| $ | 4,425 |
| $ | 4,286 |
| $ | 2,579 |
| $ | 3,962 |
Net income per common share |
| $ | 0.78 |
| $ | 0.56 |
| $ | 0.59 |
| $ | 0.47 |
| $ | 0.75 |
Weighted average shares outstanding |
|
| 8,300 |
|
| 7,844 |
|
| 7,223 |
|
| 5,507 |
|
| 5,384 |
STATEMENT OF CASH FLOWS DATA: |
|
|
|
|
|
|
|
|
|
|
|
|
|
|
|
Cash flows provided by operating activities |
| $ | 37,597 |
| $ | 34,719 |
| $ | 28,315 |
| $ | 27,927 |
| $ | 23,150 |
Cash flows provided by (used in) investing activities |
|
| (13,965) |
|
| (15,968) |
|
| (25,766) |
|
| (55,304) |
|
| 557 |
Cash flows provided by (used in) financing activities |
|
| (23,176) |
|
| (13,178) |
|
| 3,269 |
|
| 14,171 |
|
| (14,414) |
OTHER DATA |
|
|
|
|
|
|
|
|
|
|
|
|
|
|
|
Dividends declared (a) |
| $ | 8,212 |
| $ | 7,527 |
| $ | 6,885 |
| $ | 4,948 |
| $ | 4,514 |
Dividends declared per share |
| $ | 0.9900 |
| $ | 0.9600 |
| $ | 0.9300 |
| $ | 0.9000 |
| $ | 0.8400 |
|
|
ITEM 7. MANAGEMENT’S DISCUSSION AND ANALYSIS OF FINANCIAL CONDITION AND RESULTS OF OPERATIONS
Safe Harbor Statement Under the Private Securities Litigation Reform Act of 1995
Certain statements contained in this section and elsewhere in this Form 10-K constitute “forward-looking statements” within the meaning of the Private Securities Litigation Reform Act of 1995. Such forward-looking statements involve a number of known and unknown risks, uncertainties and other factors which may cause our actual results, performance, or achievements to be materially different from any future results, performance or achievements expressed or implied by such forward-looking statements. Please see “Note Regarding Forward-Looking Statements” and “Risk Factors” for more information. Readers are cautioned not to place undue reliance on these forward-looking statements, which speak only as of the date the statements were made and are not guarantees of future performance.
46
Introduction
this Annual Report on Form 10-K.
Executive SummaryOur Management's Discussion and Analysis of Financial Condition and Results of Operations ("MD&A") within this section is focused on the years ended December 31, 2022 and 2021, including year-to-year comparisons between these years. Our MD&A for the year ended December 31, 2020, including year-to-year comparisons between 2021 and 2020, can be found in Part II, Item 7, Management's Discussion and Analysis of Financial Condition and Results of Operations in the Company's Annual Report on Form 10-K for the year ended December 31, 2021.
Overview
Sterling Real Estate Trust d/b/a Sterling Multifamily Trust (“Sterling”, “the Trust” or “the Company”) is a registered, but unincorporated business trust organized in North Dakota in December 2002. Sterling has elected to be taxed as a Real Estate Investment Trust (“REIT”) under Sections 856-860 of the Internal Revenue Code, which requires that 75% of the assets of a REIT must consist of real estate assets and that 75% of its gross income must be derived from real estate. The net income of the REIT is allocated in accordance with the stock ownership in the same fashion as a regular corporation. Our real estate portfolio consistsconsisted of 166185 properties in twelve (12) states, primarily located in North Dakota, containing 9,40111,300 apartment units and approximately 1,691,0001,498,000 square feet of leasable commercial space as of December 31, 2017.2022. The portfolio has a net book value of real estate investments (cost less accumulated depreciation) of approximately $648,677,$776,299, which includes construction in progress. Our portfolioSterling’s current acquisition strategy and focus is on multifamily apartment properties.
Critical Accounting Policies and Estimates
Below are the accounting policies and estimates that management believe are critical to the preparation of the audited consolidated financial statements included in this Report. Certain accounting policies used in the preparation of these consolidated financial statements are particularly important for an understanding of the financial position and results of operations presented in the historical consolidated financial statements included in this Report. A summary of significant accounting policies is also provided in the aforementioned notes to our consolidated financial statements (see note 2 to the audited consolidated financial statements). These policies require the application of judgment and assumptions by management and, as a result, are subject to a degree of uncertainty. Due to this uncertainty, actual results could differ materially from estimates calculated and utilized by management.
33
Impairment of Real Estate Investments
TheTrust’sinvestment properties are reviewed for potential impairment at the end of each reporting period or whenever events or changes in circumstances indicate that the carrying value may not be recoverable. At the end of each reporting period, the Trust separately determines whether impairment indicators exist for each property.
Examples of situations considered to be impairment indicators include, but are not limited to:
| o | A substantial decline or negative cash flows; |
| o | Continued low occupancy rates; |
| o | Continued difficulty in leasing space; |
| o | Significant financially troubled tenants; |
| o | A change in plan to sell a property prior to the end of its useful life or holding period; |
| o | A significant decrease in market price not in line with general market trends; and |
| o | Any other quantitative or qualitative events or factors deemed significant by the Trust’s management or Board of Trustees. |
If the presence of one or more impairment indicators as described above is identified with respect to an investment property, the asset is tested for recoverability by comparing its carrying value to the estimated future undiscounted cash flows. An investment property is considered to be impaired when the estimated future undiscounted cash flows are less than its current carrying value. When performing a test for recoverability or estimating the fair value of an impaired investment property, the Trust makes complex or subjective assumptions which include, but are not limited to:
| o | Projected operating cash flows considering factors such as vacancy rates, rental rates, lease terms, tenant financial strength, demographics, holding period and property location; |
| o | Projected capital expenditures; |
| o | Projected cash flows from the eventual disposition of an operating property using a property specific capitalization rate; |
| o | Comparable selling prices; and |
| o | Property specific discount rates for fair value estimates as necessary. |
To the extent impairment has occurred, the Trust will record an impairment charge calculated as the excess of the carrying value of the asset over its fair value. Based on evaluation, there was one impairment loss of $561 during the year ended December 31, 2022. There were no impairment losses during the years ended December 31, 2021 and 2020.
There have been no material changes in our Critical Accounting Policies as disclosed in Note 2 to our financial statements for the year ended December 31, 2022 included elsewhere in this report.
Acquisition of Real Estate Investments
The Company allocates the purchase price of properties that meet the definition of an asset acquisition to net tangible and identified intangible assets acquired based on their relative fair values. In making estimates of relative fair values for purposes of allocating purchase price, the Company utilizes a number of sources, including independent appraisals that may be obtained in connection with the acquisition or financing of the respective property, our own analysis of recently acquired and existing comparable properties in our portfolio and other market data. The Company also considers information obtained about each property as a result of its pre-acquisition due diligence, marketing, and leasing activities in estimating the relative fair value of the tangible and intangible assets acquired.
34
REIT Status
We operate in a manner intended to enable us to continue to qualify as a REIT under Sections 856-860 of the Internal Revenue Code. Under those sections, a REIT which distributes at least 90% of its REIT taxable income, excluding net capital gains, as a distribution to its shareholders each year and which meets certain other conditions will not be taxed on that portion of its taxable income which is distributed to its shareholders. We intend to distribute to our shareholders 100% of our taxable income. Therefore, no provision for Federal income taxes is required. If we fail to distribute the required amount of income to our shareholders, we would fail to qualify as a REIT and substantial adverse tax consequences may result
Principal Business Activity
The operating partnershipcurrently includes a diversified mixture of multifamily, single and multi-tenant retail and office buildings. Effective January 1, 2016 the Trust’s investment strategy was amended to focus on multifamily real estatedirectly owns 185 properties. Of these, 143 are residential properties located primarily in the central corridor of the contiguous forty-eight (48) states. There is no current plan for the existingNorth Dakota, Minnesota, Missouri, Nebraska and Texas and are principally multifamily apartment buildings. The remaining 42 are commercial properties (industrial,primarily located in North Dakota with others located in Arkansas, Colorado, Iowa, Louisiana, Michigan, Minnesota, Mississippi, Nebraska and Wisconsin. The commercial properties include retail, office, industrial, and medical office,properties. The Trust’s mix of properties is 78.8% residential and retail)21.2% commercial (based on cost) with a total carrying value of $776,299 at December 31, 2022. Currently our focus is limited to multifamily apartment properties. We will consider unsolicited offers for purchase of commercial properties on a case-by-case basis.
The following table represents the number of properties the Trust owns in regards to retention or disposition.each state as of December 31, 2022:
| | | | | | |
Residential Property |
| Location |
| No. of Properties |
| Units |
| | North Dakota | | 122 | | 7,187 |
| | Minnesota | | 15 | | 3,040 |
| | Missouri | | 1 | | 164 |
| | Nebraska | | 4 | | 639 |
| | Texas | | 1 | | 270 |
| | | | 143 | | 11,300 |
| | | | | | |
Commercial Property |
| Location |
| No. of Properties |
| Sq. Ft |
| | North Dakota | | 20 | | 772,000 |
| | Arkansas | | 2 | | 28,000 |
| | Colorado | | 1 | | 17,000 |
| | Iowa | | 1 | | 33,000 |
| | Louisiana | | 1 | | 15,000 |
| | Michigan | | 1 | | 12,000 |
| | Minnesota | | 9 | | 524,000 |
| | Mississippi | | 1 | | 15,000 |
| | Nebraska | | 1 | | 19,000 |
| | Wisconsin | | 5 | | 63,000 |
| | | | 42 | | 1,498,000 |
Specific Achievements
35
Management Highlights
| Increased revenues from rental operations by |
|
|
|
|
|
|
| Declared |
47
Results of Operations for the Years Year Ended December 31, 20172022 and 20162021
|
|
|
|
|
|
|
|
|
|
|
|
|
|
|
|
|
|
|
|
| Year ended December 31, 2017 |
| Year ended December 31, 2016 | ||||||||||||||
|
| Residential |
| Commercial |
| Total |
| Residential |
| Commercial |
| Total | ||||||
|
| (unaudited) |
| (unaudited) | ||||||||||||||
|
| (in thousands) |
| (in thousands) | ||||||||||||||
Real Estate Revenues |
| $ | 86,859 |
| $ | 27,439 |
| $ | 114,298 |
| $ | 80,497 |
| $ | 27,566 |
| $ | 108,063 |
Real Estate Expenses |
|
|
|
|
|
|
|
|
|
|
|
|
|
|
|
|
|
|
Real Estate Taxes |
|
| 8,118 |
|
| 2,934 |
|
| 11,052 |
|
| 6,997 |
|
| 2,527 |
|
| 9,524 |
Property Management Fees |
|
| 11,363 |
|
| 889 |
|
| 12,252 |
|
| 9,979 |
|
| 873 |
|
| 10,852 |
Utilities |
|
| 7,103 |
|
| 1,423 |
|
| 8,526 |
|
| 6,323 |
|
| 1,349 |
|
| 7,672 |
Repairs and Maintenance |
|
| 19,294 |
|
| 2,120 |
|
| 21,414 |
|
| 19,169 |
|
| 2,098 |
|
| 21,267 |
Insurance |
|
| 1,406 |
|
| 92 |
|
| 1,498 |
|
| 1,298 |
|
| 77 |
|
| 1,375 |
Total Real Estate Expenses |
|
| 47,284 |
|
| 7,458 |
|
| 54,742 |
|
| 43,766 |
|
| 6,924 |
|
| 50,690 |
Net Operating Income |
| $ | 39,575 |
| $ | 19,981 |
|
| 59,556 |
| $ | 36,731 |
| $ | 20,642 |
|
| 57,373 |
Interest |
|
|
|
|
|
|
|
| 18,630 |
|
|
|
|
|
|
|
| 18,366 |
Depreciation and amortization |
|
|
|
|
|
|
|
| 21,544 |
|
|
|
|
|
|
|
| 22,145 |
Administration of REIT |
|
|
|
|
|
|
|
| 5,144 |
|
|
|
|
|
|
|
| 5,600 |
Loss on lease terminations |
|
|
|
|
|
|
|
| 146 |
|
|
|
|
|
|
|
| 299 |
Other (income)/expense |
|
|
|
|
|
|
|
| (5,791) |
|
|
|
|
|
|
|
| (1,894) |
Net Income |
|
|
|
|
|
|
| $ | 19,883 |
|
|
|
|
|
|
| $ | 12,857 |
|
|
|
|
|
|
|
|
|
|
|
|
|
|
|
|
|
|
|
Net Income Attributed to: |
|
|
|
|
|
|
|
|
|
|
|
|
|
|
|
|
|
|
Noncontrolling Interest |
|
|
|
|
|
|
| $ | 13,369 |
|
|
|
|
|
|
| $ | 8,432 |
Sterling Real Estate Trust |
|
|
|
|
|
|
| $ | 6,514 |
|
|
|
|
|
|
| $ | 4,425 |
Dividends per share (1) |
|
|
|
|
|
|
| $ | 0.9900 |
|
|
|
|
|
|
| $ | 0.9600 |
Earnings per share |
|
|
|
|
|
|
| $ | 0.7800 |
|
|
|
|
|
|
| $ | 0.5600 |
Weighted average number of common shares |
|
|
|
|
|
|
|
| 8,300 |
|
|
|
|
|
|
|
| 7,844 |
|
|
Revenues
Property revenues totaled approximately $114,298 for the year ended December 31, 2017 which constituted an increase of approximately $6,235 or 5.8% compared to the same period in 2016. Residential property revenues increased approximately $6,362 and commercial property revenues decreased approximately $127.
The following table illustrates the occupancy percentage for the twelve month periods indicated:
|
|
|
|
|
|
|
| December 31, |
| December 31, |
|
|
| 2017 |
| 2016 |
|
Residential occupancy |
| 94.7 | % | 94.9 | % |
Commercial occupancy |
| 96.4 | % | 95.8 | % |
Residential revenues for the year ended December 31, 2017 increased $6,362 in comparison to the same period for 2016. Residential properties acquired since January 1, 2016 contributed approximately $5,425 to the increase in total residential revenues in the year ended December 31, 2017. Rental income from residential properties owned for more than one year increased approximately $937 in comparison to the year ended December 31, 2016. Residential revenues comprised 76.0% of total revenues for the year ended December 31, 2017 compared to 74.5% of total revenues for the year ended December 31, 2016. The residential occupancy rates for the year ended December 31, 2017 were comparable to December 31, 2016.
48
For the year ended December 31, 2017 total commercial revenues decreased $127 in comparison to the same period for 2016. Rental income from commercial properties owned for more than one year decreased approximately $173 in comparison to the year-ended December 31, 2016. The decrease was primarily attributed to the sale of a retail property in June 2017 which contributed to twelve months of revenues in 2016 but only six months of revenue in 2017. Commercial revenues comprised 24.0% of total revenue for the year ended December 31, 2017 compared to 25.5% of total revenues for the year ended December 31, 2016. The commercial occupancy rates for the year ended December 31, 2017 were comparable to December 31, 2016.
Expenses
Residential expenses from operations of $47,292 during the year ended December 31, 2017 increased $3,526 or 8.1% in comparison to the same period in 2016. This increase was primarily attributed to the increase in number of residential properties owned during the year ended December 31, 2017 versus the same period in 2016. Included within this increase were real estate tax expenses, which increased $1,129 or 16.1% primarily due to real estate tax law changes in North Dakota and increases in property management fees of $1,384 due to increased competition for labor.
Commercial expenses from operations of $7,450 during the year ended December 31, 2017 increased $526 or 7.6% in comparison to the same period in 2016. The increase was primarily attributable to increases in real estate taxes for one Bloomington, Minnesota office property and the North Dakota properties.
Interest expense of $18,630 during the year ended December 31, 2017 increased $264 in comparison to the same period in 2016 due to increased levels of debt outstanding. Interest expense was approximately 16.3% and 17.0% of rental income for the years ended December 31, 2017 and 2016, respectively.
Depreciation and amortization expense decreased 2.7% from $22,145 for the year ended December 31, 2016 to approximately $21,544 for the year ended December 31, 2017. The $601 net decrease was primarily a result of a $1,150 decrease in amortization related to lease intangibles that are fully amortized. Amortization expense will continue to decrease as lease intangibles become fully amortized. Depreciation and amortization expense as a percentage of rental income for the years the year ended December 31, 2017 and 2016 was relatively consistent at 18.8% and 20.5%, respectively.
Other income (expense) during the year ended December 31, 2017 was $5,791. This amount included a net gain of $2,049 incurred in connection with the sale of a retail property in June 2017 and the sale of vehicles in January 2017. In addition, other income includes a $2,186 gain on a change in control over a real estate investment. Other income (expense) during the year ended December 31, 2016 included a loss of $321 incurred in connection with the sale of a medical property in April 2016 and the sale of two vehicles in 2016. The building sale was pursuant to the exercise of an option contained in the tenant’s lease. In addition, during the year ended December 31, 2016, we also sold our membership interest in Michigan Street Transit Center, LLC (held as equity method investment) and recognized a gain of $597; and we acquired the remaining ownership interest of 17.5% in Ashbury (previously held as equity method investment) which resulted in a gain of $550.
REIT administration expenses decreased from $5,600 for the year ended December 31, 2016 to $5,144 for the year ended December 31, 2017 due to a decrease in acquisition expenses related to lower acquisition activity in 2017 in comparison to the same period in 2016. In addition, the acquisitions completed after July 1, 2017 were considered asset acquisitions and, as such, transaction costs were capitalized upon closing. For acquisitions prior to July 1, 2017, which were accounted for as business combinations, the transaction costs totaled $1,131 and $1,972 for the years ended December 31, 2017 and 2016, respectively, and are included in “Acquisition and disposition expenses” in the accompanying condensed consolidated statements of operations and other comprehensive (loss) income.
49
| | | | | | | | | | | | | | | | | | | ||||||||||||||||||||||||||||||||||||||||||||||||||||||||||||||||||||||||||||||||||||||||||||||||||||||||||||||||||||||||||||||||||||||||||||||||||||||||||||||||||||||||||||||||||||||||||||||||||||||||||||||||||||||||||||||||||||||||||||||||||||||||||||||||||||||||||||||||||||||||||||||||||||||||||||||||||||||||||||||||||||||||||||||||||||||||||||||||||||||||||||||||||||||||||||||||||||||||||||||||||||||||||||||||||||||||||||||||||||||||||||||||||||||||||||||||||||||||||||||||||||||||||||||||||||||||||||||||||||||||||||||||||||||||||||||||||||||||||||||||||||||
| | Year ended December 31, 2022 |
| Year ended December 31, 2021 | ||||||||||||||||||||||||||||||||||||||||||||||||||||||||||||||||||||||||||||||||||||||||||||||||||||||||||||||||||||||||||||||||||||||||||||||||||||||||||||||||||||||||||||||||||||||||||||||||||||||||||||||||||||||||||||||||||||||||||||||||||||||||||||||||||||||||||||||||||||||||||||||||||||||||||||||||||||||||||||||||||||||||||||||||||||||||||||||||||||||||||||||||||||||||||||||||||||||||||||||||||||||||||||||||||||||||||||||||||||||||||||||||||||||||||||||||||||||||||||||||||||||||||||||||||||||||||||||||||||||||||||||||||||||||||||||||||||||||||||||||||||||||||||||||||||
|
| Residential |
| Commercial |
| Total |
| Residential |
| Commercial |
| Total | ||||||||||||||||||||||||||||||||||||||||||||||||||||||||||||||||||||||||||||||||||||||||||||||||||||||||||||||||||||||||||||||||||||||||||||||||||||||||||||||||||||||||||||||||||||||||||||||||||||||||||||||||||||||||||||||||||||||||||||||||||||||||||||||||||||||||||||||||||||||||||||||||||||||||||||||||||||||||||||||||||||||||||||||||||||||||||||||||||||||||||||||||||||||||||||||||||||||||||||||||||||||||||||||||||||||||||||||||||||||||||||||||||||||||||||||||||||||||||||||||||||||||||||||||||||||||||||||||||||||||||||||||||||||||||||||||||||||||||||||||||||||||||||
| | (unaudited) | | (unaudited) | ||||||||||||||||||||||||||||||||||||||||||||||||||||||||||||||||||||||||||||||||||||||||||||||||||||||||||||||||||||||||||||||||||||||||||||||||||||||||||||||||||||||||||||||||||||||||||||||||||||||||||||||||||||||||||||||||||||||||||||||||||||||||||||||||||||||||||||||||||||||||||||||||||||||||||||||||||||||||||||||||||||||||||||||||||||||||||||||||||||||||||||||||||||||||||||||||||||||||||||||||||||||||||||||||||||||||||||||||||||||||||||||||||||||||||||||||||||||||||||||||||||||||||||||||||||||||||||||||||||||||||||||||||||||||||||||||||||||||||||||||||||||||||||||||||||
| | (in thousands) | | (in thousands) | ||||||||||||||||||||||||||||||||||||||||||||||||||||||||||||||||||||||||||||||||||||||||||||||||||||||||||||||||||||||||||||||||||||||||||||||||||||||||||||||||||||||||||||||||||||||||||||||||||||||||||||||||||||||||||||||||||||||||||||||||||||||||||||||||||||||||||||||||||||||||||||||||||||||||||||||||||||||||||||||||||||||||||||||||||||||||||||||||||||||||||||||||||||||||||||||||||||||||||||||||||||||||||||||||||||||||||||||||||||||||||||||||||||||||||||||||||||||||||||||||||||||||||||||||||||||||||||||||||||||||||||||||||||||||||||||||||||||||||||||||||||||||||||||||||||
Real Estate Revenues |
| $ | 113,968 |
| $ | 21,092 |
| $ | 135,060 |
| $ | 107,284 |
| $ | 22,040 |
| $ | 129,324 | ||||||||||||||||||||||||||||||||||||||||||||||||||||||||||||||||||||||||||||||||||||||||||||||||||||||||||||||||||||||||||||||||||||||||||||||||||||||||||||||||||||||||||||||||||||||||||||||||||||||||||||||||||||||||||||||||||||||||||||||||||||||||||||||||||||||||||||||||||||||||||||||||||||||||||||||||||||||||||||||||||||||||||||||||||||||||||||||||||||||||||||||||||||||||||||||||||||||||||||||||||||||||||||||||||||||||||||||||||||||||||||||||||||||||||||||||||||||||||||||||||||||||||||||||||||||||||||||||||||||||||||||||||||||||||||||||||||||||||||||||||||||
Real Estate Expenses | | | | | | | | | | | | | | | | | | | ||||||||||||||||||||||||||||||||||||||||||||||||||||||||||||||||||||||||||||||||||||||||||||||||||||||||||||||||||||||||||||||||||||||||||||||||||||||||||||||||||||||||||||||||||||||||||||||||||||||||||||||||||||||||||||||||||||||||||||||||||||||||||||||||||||||||||||||||||||||||||||||||||||||||||||||||||||||||||||||||||||||||||||||||||||||||||||||||||||||||||||||||||||||||||||||||||||||||||||||||||||||||||||||||||||||||||||||||||||||||||||||||||||||||||||||||||||||||||||||||||||||||||||||||||||||||||||||||||||||||||||||||||||||||||||||||||||||||||||||||||||||
Real Estate Taxes | | | 11,734 | | | 2,511 | | | 14,245 | | | 10,778 | | | 2,928 | | | 13,706 | ||||||||||||||||||||||||||||||||||||||||||||||||||||||||||||||||||||||||||||||||||||||||||||||||||||||||||||||||||||||||||||||||||||||||||||||||||||||||||||||||||||||||||||||||||||||||||||||||||||||||||||||||||||||||||||||||||||||||||||||||||||||||||||||||||||||||||||||||||||||||||||||||||||||||||||||||||||||||||||||||||||||||||||||||||||||||||||||||||||||||||||||||||||||||||||||||||||||||||||||||||||||||||||||||||||||||||||||||||||||||||||||||||||||||||||||||||||||||||||||||||||||||||||||||||||||||||||||||||||||||||||||||||||||||||||||||||||||||||||||||||||||
Property Management | | | 13,778 | | | 789 | | | 14,567 | | | 12,907 | | | 1,217 | | | 14,124 | ||||||||||||||||||||||||||||||||||||||||||||||||||||||||||||||||||||||||||||||||||||||||||||||||||||||||||||||||||||||||||||||||||||||||||||||||||||||||||||||||||||||||||||||||||||||||||||||||||||||||||||||||||||||||||||||||||||||||||||||||||||||||||||||||||||||||||||||||||||||||||||||||||||||||||||||||||||||||||||||||||||||||||||||||||||||||||||||||||||||||||||||||||||||||||||||||||||||||||||||||||||||||||||||||||||||||||||||||||||||||||||||||||||||||||||||||||||||||||||||||||||||||||||||||||||||||||||||||||||||||||||||||||||||||||||||||||||||||||||||||||||||
Utilities | | | 10,901 | | | 1,274 | | | 12,175 | | | 9,031 | | | 1,104 | | | 10,135 | ||||||||||||||||||||||||||||||||||||||||||||||||||||||||||||||||||||||||||||||||||||||||||||||||||||||||||||||||||||||||||||||||||||||||||||||||||||||||||||||||||||||||||||||||||||||||||||||||||||||||||||||||||||||||||||||||||||||||||||||||||||||||||||||||||||||||||||||||||||||||||||||||||||||||||||||||||||||||||||||||||||||||||||||||||||||||||||||||||||||||||||||||||||||||||||||||||||||||||||||||||||||||||||||||||||||||||||||||||||||||||||||||||||||||||||||||||||||||||||||||||||||||||||||||||||||||||||||||||||||||||||||||||||||||||||||||||||||||||||||||||||||
Repairs and Maintenance | | | 24,479 | | | 1,812 | | | 26,291 | | | 21,571 | | | 1,956 | | | 23,527 | ||||||||||||||||||||||||||||||||||||||||||||||||||||||||||||||||||||||||||||||||||||||||||||||||||||||||||||||||||||||||||||||||||||||||||||||||||||||||||||||||||||||||||||||||||||||||||||||||||||||||||||||||||||||||||||||||||||||||||||||||||||||||||||||||||||||||||||||||||||||||||||||||||||||||||||||||||||||||||||||||||||||||||||||||||||||||||||||||||||||||||||||||||||||||||||||||||||||||||||||||||||||||||||||||||||||||||||||||||||||||||||||||||||||||||||||||||||||||||||||||||||||||||||||||||||||||||||||||||||||||||||||||||||||||||||||||||||||||||||||||||||||
Insurance | | | 3,755 | | | 105 | | | 3,860 | | | 3,167 | | | 110 | | | 3,277 | ||||||||||||||||||||||||||||||||||||||||||||||||||||||||||||||||||||||||||||||||||||||||||||||||||||||||||||||||||||||||||||||||||||||||||||||||||||||||||||||||||||||||||||||||||||||||||||||||||||||||||||||||||||||||||||||||||||||||||||||||||||||||||||||||||||||||||||||||||||||||||||||||||||||||||||||||||||||||||||||||||||||||||||||||||||||||||||||||||||||||||||||||||||||||||||||||||||||||||||||||||||||||||||||||||||||||||||||||||||||||||||||||||||||||||||||||||||||||||||||||||||||||||||||||||||||||||||||||||||||||||||||||||||||||||||||||||||||||||||||||||||||
Total Real Estate Expenses | | | 64,647 | | | 6,491 | | | 71,138 | | | 57,454 | | | 7,315 | | | 64,769 | ||||||||||||||||||||||||||||||||||||||||||||||||||||||||||||||||||||||||||||||||||||||||||||||||||||||||||||||||||||||||||||||||||||||||||||||||||||||||||||||||||||||||||||||||||||||||||||||||||||||||||||||||||||||||||||||||||||||||||||||||||||||||||||||||||||||||||||||||||||||||||||||||||||||||||||||||||||||||||||||||||||||||||||||||||||||||||||||||||||||||||||||||||||||||||||||||||||||||||||||||||||||||||||||||||||||||||||||||||||||||||||||||||||||||||||||||||||||||||||||||||||||||||||||||||||||||||||||||||||||||||||||||||||||||||||||||||||||||||||||||||||||
Net Operating Income | |
| 49,321 | | $ | 14,601 | | | 63,922 | | $ | 49,830 | | $ | 14,725 | | | 64,555 | ||||||||||||||||||||||||||||||||||||||||||||||||||||||||||||||||||||||||||||||||||||||||||||||||||||||||||||||||||||||||||||||||||||||||||||||||||||||||||||||||||||||||||||||||||||||||||||||||||||||||||||||||||||||||||||||||||||||||||||||||||||||||||||||||||||||||||||||||||||||||||||||||||||||||||||||||||||||||||||||||||||||||||||||||||||||||||||||||||||||||||||||||||||||||||||||||||||||||||||||||||||||||||||||||||||||||||||||||||||||||||||||||||||||||||||||||||||||||||||||||||||||||||||||||||||||||||||||||||||||||||||||||||||||||||||||||||||||||||||||||||||||
Interest | | | | | | | | | 19,994 | | | | | | | | | 18,142 | ||||||||||||||||||||||||||||||||||||||||||||||||||||||||||||||||||||||||||||||||||||||||||||||||||||||||||||||||||||||||||||||||||||||||||||||||||||||||||||||||||||||||||||||||||||||||||||||||||||||||||||||||||||||||||||||||||||||||||||||||||||||||||||||||||||||||||||||||||||||||||||||||||||||||||||||||||||||||||||||||||||||||||||||||||||||||||||||||||||||||||||||||||||||||||||||||||||||||||||||||||||||||||||||||||||||||||||||||||||||||||||||||||||||||||||||||||||||||||||||||||||||||||||||||||||||||||||||||||||||||||||||||||||||||||||||||||||||||||||||||||||||
Depreciation and amortization | | | | | | | | | 24,679 | | | | | | | | | 22,203 | ||||||||||||||||||||||||||||||||||||||||||||||||||||||||||||||||||||||||||||||||||||||||||||||||||||||||||||||||||||||||||||||||||||||||||||||||||||||||||||||||||||||||||||||||||||||||||||||||||||||||||||||||||||||||||||||||||||||||||||||||||||||||||||||||||||||||||||||||||||||||||||||||||||||||||||||||||||||||||||||||||||||||||||||||||||||||||||||||||||||||||||||||||||||||||||||||||||||||||||||||||||||||||||||||||||||||||||||||||||||||||||||||||||||||||||||||||||||||||||||||||||||||||||||||||||||||||||||||||||||||||||||||||||||||||||||||||||||||||||||||||||||
Administration of | | | | | | | | | 5,247 | | | | | | | | | 4,381 | ||||||||||||||||||||||||||||||||||||||||||||||||||||||||||||||||||||||||||||||||||||||||||||||||||||||||||||||||||||||||||||||||||||||||||||||||||||||||||||||||||||||||||||||||||||||||||||||||||||||||||||||||||||||||||||||||||||||||||||||||||||||||||||||||||||||||||||||||||||||||||||||||||||||||||||||||||||||||||||||||||||||||||||||||||||||||||||||||||||||||||||||||||||||||||||||||||||||||||||||||||||||||||||||||||||||||||||||||||||||||||||||||||||||||||||||||||||||||||||||||||||||||||||||||||||||||||||||||||||||||||||||||||||||||||||||||||||||||||||||||||||||
Other income | |
| | |
| |
| (10,530) | | | | | | | | | (4,609) | |||||||||||||||||||||||||||||||||||||||||||||||||||||||||||||||||||||||||||||||||||||||||||||||||||||||||||||||||||||||||||||||||||||||||||||||||||||||||||||||||||||||||||||||||||||||||||||||||||||||||||||||||||||||||||||||||||||||||||||||||||||||||||||||||||||||||||||||||||||||||||||||||||||||||||||||||||||||||||||||||||||||||||||||||||||||||||||||||||||||||||||||||||||||||||||||||||||||||||||||||||||||||||||||||||||||||||||||||||||||||||||||||||||||||||||||||||||||||||||||||||||||||||||||||||||||||||||||||||||||||||||||||||||||||||||||||||||||||||||||||||||||
Net Income | | | | | | | | $ | 24,532 | | | | | | | | $ | 24,438 | ||||||||||||||||||||||||||||||||||||||||||||||||||||||||||||||||||||||||||||||||||||||||||||||||||||||||||||||||||||||||||||||||||||||||||||||||||||||||||||||||||||||||||||||||||||||||||||||||||||||||||||||||||||||||||||||||||||||||||||||||||||||||||||||||||||||||||||||||||||||||||||||||||||||||||||||||||||||||||||||||||||||||||||||||||||||||||||||||||||||||||||||||||||||||||||||||||||||||||||||||||||||||||||||||||||||||||||||||||||||||||||||||||||||||||||||||||||||||||||||||||||||||||||||||||||||||||||||||||||||||||||||||||||||||||||||||||||||||||||||||||||||
| | | | | | | | | | | | | | | | | | | ||||||||||||||||||||||||||||||||||||||||||||||||||||||||||||||||||||||||||||||||||||||||||||||||||||||||||||||||||||||||||||||||||||||||||||||||||||||||||||||||||||||||||||||||||||||||||||||||||||||||||||||||||||||||||||||||||||||||||||||||||||||||||||||||||||||||||||||||||||||||||||||||||||||||||||||||||||||||||||||||||||||||||||||||||||||||||||||||||||||||||||||||||||||||||||||||||||||||||||||||||||||||||||||||||||||||||||||||||||||||||||||||||||||||||||||||||||||||||||||||||||||||||||||||||||||||||||||||||||||||||||||||||||||||||||||||||||||||||||||||||||||
Net | | | | | | | | | | | | | | | | | | | ||||||||||||||||||||||||||||||||||||||||||||||||||||||||||||||||||||||||||||||||||||||||||||||||||||||||||||||||||||||||||||||||||||||||||||||||||||||||||||||||||||||||||||||||||||||||||||||||||||||||||||||||||||||||||||||||||||||||||||||||||||||||||||||||||||||||||||||||||||||||||||||||||||||||||||||||||||||||||||||||||||||||||||||||||||||||||||||||||||||||||||||||||||||||||||||||||||||||||||||||||||||||||||||||||||||||||||||||||||||||||||||||||||||||||||||||||||||||||||||||||||||||||||||||||||||||||||||||||||||||||||||||||||||||||||||||||||||||||||||||||||||
Noncontrolling Interest | | | | | | | | $ | 15,611 | | | | | | | | $ | 15,644 | ||||||||||||||||||||||||||||||||||||||||||||||||||||||||||||||||||||||||||||||||||||||||||||||||||||||||||||||||||||||||||||||||||||||||||||||||||||||||||||||||||||||||||||||||||||||||||||||||||||||||||||||||||||||||||||||||||||||||||||||||||||||||||||||||||||||||||||||||||||||||||||||||||||||||||||||||||||||||||||||||||||||||||||||||||||||||||||||||||||||||||||||||||||||||||||||||||||||||||||||||||||||||||||||||||||||||||||||||||||||||||||||||||||||||||||||||||||||||||||||||||||||||||||||||||||||||||||||||||||||||||||||||||||||||||||||||||||||||||||||||||||||
Sterling Real Estate Trust | | | | | | | | $ | 8,921 | | | | | | | | $ | 8,794 | ||||||||||||||||||||||||||||||||||||||||||||||||||||||||||||||||||||||||||||||||||||||||||||||||||||||||||||||||||||||||||||||||||||||||||||||||||||||||||||||||||||||||||||||||||||||||||||||||||||||||||||||||||||||||||||||||||||||||||||||||||||||||||||||||||||||||||||||||||||||||||||||||||||||||||||||||||||||||||||||||||||||||||||||||||||||||||||||||||||||||||||||||||||||||||||||||||||||||||||||||||||||||||||||||||||||||||||||||||||||||||||||||||||||||||||||||||||||||||||||||||||||||||||||||||||||||||||||||||||||||||||||||||||||||||||||||||||||||||||||||||||||
Dividends per share (1) | | | | | | | | $ | 1.1500 | | | | | | | | $ | 1.0600 | ||||||||||||||||||||||||||||||||||||||||||||||||||||||||||||||||||||||||||||||||||||||||||||||||||||||||||||||||||||||||||||||||||||||||||||||||||||||||||||||||||||||||||||||||||||||||||||||||||||||||||||||||||||||||||||||||||||||||||||||||||||||||||||||||||||||||||||||||||||||||||||||||||||||||||||||||||||||||||||||||||||||||||||||||||||||||||||||||||||||||||||||||||||||||||||||||||||||||||||||||||||||||||||||||||||||||||||||||||||||||||||||||||||||||||||||||||||||||||||||||||||||||||||||||||||||||||||||||||||||||||||||||||||||||||||||||||||||||||||||||||||||
Earnings per share | | | | | | | | $ | 0.8400 | | | | | | | | $ | 0.8700 | ||||||||||||||||||||||||||||||||||||||||||||||||||||||||||||||||||||||||||||||||||||||||||||||||||||||||||||||||||||||||||||||||||||||||||||||||||||||||||||||||||||||||||||||||||||||||||||||||||||||||||||||||||||||||||||||||||||||||||||||||||||||||||||||||||||||||||||||||||||||||||||||||||||||||||||||||||||||||||||||||||||||||||||||||||||||||||||||||||||||||||||||||||||||||||||||||||||||||||||||||||||||||||||||||||||||||||||||||||||||||||||||||||||||||||||||||||||||||||||||||||||||||||||||||||||||||||||||||||||||||||||||||||||||||||||||||||||||||||||||||||||||
Weighted average number of common shares | | | | | | | | | 10,632 | | | | | | | | | 10,160 | ||||||||||||||||||||||||||||||||||||||||||||||||||||||||||||||||||||||||||||||||||||||||||||||||||||||||||||||||||||||||||||||||||||||||||||||||||||||||||||||||||||||||||||||||||||||||||||||||||||||||||||||||||||||||||||||||||||||||||||||||||||||||||||||||||||||||||||||||||||||||||||||||||||||||||||||||||||||||||||||||||||||||||||||||||||||||||||||||||||||||||||||||||||||||||||||||||||||||||||||||||||||||||||||||||||||||||||||||||||||||||||||||||||||||||||||||||||||||||||||||||||||||||||||||||||||||||||||||||||||||||||||||||||||||||||||||||||||||||||||||||||||
| (1) | Does not take into consideration the
|
Revenues
Property revenues totaled approximately $135,060 for the year ended December 31, 2022, which constituted an increase of approximately $5,736 or 4.4% compared to the same period in 2021. Residential property revenues increased approximately $6,684 and commercial property revenues decreased approximately $948.
The following table illustrates the occupancy percentage for the periods ended indicated:
| | | | | |
| | December 31, | | December 31, | |
|
| 2022 | | 2021 | |
Residential occupancy | | 93.2 | % | 94.8 | % |
Commercial occupancy | | 87.0 | % | 80.7 | % |
Residential revenues for the year ended December 31, 2022, increased $6,684 or 6.2%, in comparison to the same period in 2021. Residential properties acquired since January 1, 2021, contributed approximately $5,232 to the increase in total
During the year ended December 31, 2017, the operating partnership sold a retail property in Fargo, North Dakota for approximately $4,400 and recognized a gain of $2,072.
Property Acquisitions and Dispositions during the year ended December 31, 2016
We acquired ten properties and a parcel of land for a total of $35,312 during the year ended December 31, 2016. Total consideration for the acquisitions was the issuance of approximately $23,020 in limited partnership units of the operating partnership, new loans of $2,662, assumed liabilities of $78 and cash of $9,552. In addition, there was a change in control over a real estate investment, with the operating partnership acquiring the other tenant in common’s 17.50% ownership interest in the property (see Notes 2 and 20 of the consolidated financial statements). The operating partnership paid total cash consideration of approximately $193 before transaction costs and financed with the issuance of $448 of limited partnership units for a total purchase price of approximately $641.
During the year ended December 31, 2016, the operating partnership sold a medical property in Eau Claire, Wisconsin for approximately $1,400 and recognized a loss of $316.
Property Acquisitions and Dispositions during the year ended December 31, 2015
We acquired nine properties and two parcels of land for a total of $82,586 during the year ended December 31, 2015. Total consideration for the acquisitions was the issuance of approximately $11,228 in limited partnership units of the operating partnership, new loans of $45,830, assumed loans of $719, assumed liabilities and deferred maintenance of $1,329 and cash of $23,480.
53
During the year ended December 31, 2015, the operating partnership sold 3.38 acres of development land in Fargo, North Dakota for approximately $1,424 and recognized a gain of $470.
See Notes 19 and 20 to the Consolidated Financial Statements included herein for more information regarding our acquisitions and dispositions during the years ended December 31, 2017, 2016 and 2015.
Construction in Progress and Development Projects
Construction in progress as of December 31, 2017 consists primarily of development and planning costs associated with phase III of a multifamily apartment community under construction in Bismarck, North Dakota and a project to rebuild a multifamily apartment building destroyed by fire in Omaha, Nebraska. Phase I and II of the Bismarck development are completed and Phase III is still in the planning and review stages to determine if the Company will commence construction. In 2017, Phase I and II contributed $2,218 in rental revenues and had 93.4% economic occupancy.
Funds From Operations and Modified Funds From Operations (FFO and MFFO)
Funds From Operations (FFO) applicable to common shares and limited partnership units means net income (computed in accordance with GAAP), excluding gains (or losses) from sales of property, plus depreciation and amortization, and after adjustments for unconsolidated partnerships and joint ventures. Adjustments for unconsolidated partnerships and joint ventures will be calculated to reflect funds from operations on the same basis.
Historical cost accounting for real estate assets implicitly assumes the value of real estate assets diminishes predictably over time. Since real estate values have historically risen or fallen with market conditions, many industry investors have considered presentations of operating results for real estate companies that use historical cost accounting to be insufficient by themselves. The term Funds From Operations (FFO) was created to address this problem. It was intended to be a standard supplemental measure of REIT operating performance that excluded historical cost depreciation from — or “added back” to — GAAP net income.
Our management believes this non-GAAP measure is useful to investors because it provides supplemental information that facilitates comparisons to prior periods and for the evaluation of financial results. Management uses this non-GAAP measure to evaluate our financial results, develop budgets and manage expenditures. The method used to produce non-GAAP results is not computed according to GAAP, is likely to differ from the methods used by other companies and should not be regarded as a replacement for corresponding GAAP measures. Management encourages the review of the reconciliation of this non-GAAP financial measure to the comparable GAAP results.
Since the introduction of the definition of FFO, the term has come to be widely used by REITs. In the view of National Association of Real Estate Investment Trusts (“NAREIT”), the use of the definition of FFO (combined with the primary GAAP presentations required by the Securities and Exchange Commission) has been fundamentally beneficial, improving the understanding of operating results of REITs among the investing public and making it easier than before to compare the results of one REIT with another.
In addition to FFO, management also uses Modified Funds From Operations (“MFFO”) as a non-GAAP supplemental performance measure. MFFO as defined by us excludes from FFO acquisition related costs which are required to be expensed in accordance with GAAP. Our definition of MFFO also excludes disposition costs related to sales of real estate investments. Acquisition and disposition related expenses include those paid to our Advisor and third parties. Management believes that excluding acquisition and disposition related costs from MFFO provides useful supplemental performance information that is comparable over the long-term and that is consistent with management’s analysis of the operating performance of the REIT.
While FFO and MFFO applicable to common shares and limited partnership units are widely used by REITs as performance metrics, all REITs do not use the same definition of FFO and MFFO or calculate FFO and MFFO in the same way. The FFO and MFFO reconciliation presented here is not necessarily comparable to FFO and MFFO presented by other real estate investment trusts. FFO and MFFO should also not be considered as an alternative to net income as
54
determined in accordance with GAAP as a measure of a real estate investment trust’s performance, but rather should be considered as an additional, supplemental measure, and should be viewed in conjunction with net income as presented in the consolidated financial statements included in this report. FFO and MFFO applicable to common shares and limited partnership units does not represent cash generated from operating activities in accordance with GAAP, and is not necessarily indicative of sufficient cash flow to fund a real estate investment trust’s needs or its ability to service indebtedness or to pay dividends to shareholders.
Because of the ASU 2017-01 issued by the FASB in January 2017 which the Company adopted effective July 2017, the calculation of MFFO will not be substantially different from the FFO. Thus, we plan on dropping the MFFO from future reports.
55
The following tables include calculations of FFO and MFFO, and the reconciliations to net income, for the years ended December 31, 2017, 2016 and 2015, respectively. We believe these calculations are the most comparable GAAP financial measure (in thousands):
Reconciliation of Net Income Attributable to Sterling to FFO and MFFO Applicable to Common Shares and Limited Partnership Units
|
|
|
|
|
|
|
|
|
|
|
|
|
|
|
|
|
|
|
|
|
|
|
|
|
|
| Year ended December 31, 2017 |
|
| Year ended December 31, 2016 |
|
| Year ended December 31, 2015 | ||||||||||||||||
|
|
|
|
| Weighted Avg |
| Per |
|
|
|
| Weighted Avg |
| Per |
|
|
|
| Weighted Avg |
| Per | |||
|
|
|
|
| Shares and |
| Share and |
|
|
|
| Shares and |
| Share and |
|
|
|
| Shares and |
| Share and | |||
|
| Amount |
| Units(1) |
| Unit (2) |
| Amount |
| Units(1) |
| Unit (2) |
| Amount |
| Units(1) |
| Unit (2) | ||||||
|
| (unaudited) |
|
|
|
|
|
|
|
| ||||||||||||||
|
| (in thousands, except per share data) |
|
|
|
|
|
|
|
| ||||||||||||||
Net Income attributable to Sterling Real Estate Trust |
| $ | 6,514 |
| 8,300 |
| $ | 0.78 |
| $ | 4,425 |
| 7,844 |
| $ | 0.56 |
| $ | 4,286 |
| 7,223 |
| $ | 0.59 |
|
|
|
|
|
|
|
|
|
|
|
|
|
|
|
|
|
|
|
|
|
|
|
|
|
Add back: |
|
|
|
|
|
|
|
|
|
|
|
|
|
|
|
|
|
|
|
|
|
|
|
|
Noncontrolling Interest - OPU |
|
| 13,634 |
| 17,375 |
|
|
|
|
| 9,034 |
| 16,015 |
|
|
|
|
| 7,684 |
| 15,002 |
|
|
|
Depreciation & Amortization from continuing operations |
|
| 21,544 |
|
|
|
|
|
|
| 22,145 |
|
|
|
|
|
|
| 19,574 |
|
|
|
|
|
Pro rata share of unconsolidated affiliate depreciation & amortization |
|
| 382 |
|
|
|
|
|
|
| 467 |
|
|
|
|
|
|
| 482 |
|
|
|
|
|
Loss on sale of depreciable real estate investments |
|
| — |
|
|
|
|
|
|
| 316 |
|
|
|
|
|
|
| — |
|
|
|
|
|
Loss on impairment of real estate investments |
|
| — |
|
|
|
|
|
|
| — |
|
|
|
|
|
|
| 412 |
|
|
|
|
|
Subtract: |
|
|
|
|
|
|
|
|
|
|
|
|
|
|
|
|
|
|
|
|
|
|
|
|
Gain on sale of land, depreciable real estate, investment in equity method investee, and change in control of real estate investments |
|
| (4,261) |
|
|
|
|
|
|
| (1,148) |
|
|
|
|
|
|
| (470) |
|
|
|
|
|
Funds from operations applicable to common shares and limited partnership units (FFO) |
|
| 37,813 |
| 25,675 |
| $ | 1.47 |
|
| 35,239 |
| 23,859 |
| $ | 1.48 |
|
| 31,968 |
| 22,225 |
| $ | 1.44 |
Add back: |
|
|
|
|
|
|
|
|
|
|
|
|
|
|
|
|
|
|
|
|
|
|
|
|
Acquisition, and disposition expenses |
|
| 1,375 |
|
|
|
|
|
|
| 2,081 |
|
|
|
|
|
|
| 2,323 |
|
|
|
|
|
Modified Funds from Operations applicable to common shares and limited partnership units (MFFO) |
| $ | 39,188 |
| 25,675 |
| $ | 1.53 |
| $ | 37,320 |
| 23,859 |
| $ | 1.56 |
| $ | 34,291 |
| 22,225 |
| $ | 1.54 |
|
|
|
|
|
|
|
|
|
|
|
|
|
|
|
|
|
|
|
|
|
|
|
|
|
|
|
36
|
|
Liquidity and Capital Resources
Our principal demands for funds will be for the: (i) acquisition of real estate and real estate-related investments, (ii) payment of acquisition related expenses and operating expenses, (iii) payment of dividends/distributions, (iv) payment of principal and interest on current and any future outstanding indebtedness, and (v) redemptions of our securities under our redemption plans. Generally, we expect to meet cash needs for the payment of operating expenses and interest on
56
outstanding indebtedness from cash flow from operations. We expect to pay dividends/distributions and fund any repurchase requests from our shareholders and the unit holders of our operating partnership from cash flow from operations; however, we may use other sources to fund dividends/distributions and repurchases, as necessary. We expect to meet cash needs for acquisitions and other real-estate investments from cash flow from operations, net proceeds of share offerings, UPREIT issuance of partnership units and debt proceeds.
Evaluation of Liquidity
We continually evaluate our liquidity and ability to fund future operations, debt obligations and any repurchase requests. As part of our analysis, we consider among other items, credit quality of tenants and lease expirations.
Credit Quality of Tenants
We are exposed to credit risk within our tenant portfolio, which can reduce our results of operations and cash flow from operations if our tenants are unable to pay their rent. Tenants experiencing financial difficulties may become delinquent on their rent or default on their leases and, if they file for bankruptcy protection, may reject our lease in bankruptcy court, resulting in reduced cash flow. This may negatively impact net asset values and require us to incur impairment charges. Even if a default has not occurred and a tenant is continuing to make the required lease payments, we may restructure or renew leases on less favorable terms, or the tenant’s credit profile may deteriorate, which could affect the value of the leased asset and could in turn require us to incur impairment charges.
Historically, the geographic location of our properties and credit-worthiness of our tenants have resulted in minimal to no property impairments or write-offs on uncollectible rental revenues. We currently anticipate the trend to continue. It is possible, however, that tenants may file for bankruptcy or default on their leases in the future and that economic conditions may deteriorate.
To mitigate credit risk on commercial properties, we have historically looked to invest in assets that we believe are critically important to our tenant’s operations and have attempted to diversify our portfolio by tenant, tenant industry and geography. We also monitor all of our properties performance through review of rent delinquencies as a precursor to a potential default, meetings with tenant management and review of tenants’ financial statements and compliance with financial covenants. When necessary, our asset management process includes restructuring transactions to meet the evolving needs of tenants, refinancing debt and selling properties, as well as protecting our rights when tenants default or enter into bankruptcy.
Lease Expirations and Occupancy
No significant leases are scheduled to expire or renew in the next twelve months. The Advisor, with the assistance of our property managers, actively manages our real estate portfolio and begins discussing options with tenants in advance of scheduled lease expirations. In certain cases, we may obtain lease renewals from our tenants; however, tenants may elect to move out at the end of their term. In the cases where tenants elect not to renew, we may seek replacement tenants or try to sell the property.
Cash Flow Analysis
Our objectives are to generate sufficient cash flow over time to provide shareholders with increasing dividends and to seek investments with potential for strong returns and capital appreciation throughout varying economic cycles. We have funded 100% of dividends paid from operating cash flows. In setting a dividend rate, we focus primarily on expected returns from investments we have already made to assess the sustainability of a particular dividend rate over time.
57
|
|
|
|
|
|
|
|
| Year Ended | ||||
|
| December 31, | ||||
|
| 2017 |
| 2016 | ||
|
| (in thousands) | ||||
Net cash flows provided by operating activities |
| $ | 37,597 |
| $ | 34,719 |
Net cash flows used in investing activities |
| $ | (13,965) |
| $ | (15,968) |
Net cash flows used in financing activities |
| $ | (23,176) |
| $ | (13,178) |
Operating Activities
Our real estate properties generate cash flow in the form of rental revenues, which is reduced by interest payments, direct lease costs and property-level operating expenses. Property-level operating expenses consist primarily of property management fees including salaries and wages of property management personnel, utilities, cleaning, repairs, insurance, security and building maintenance cost, and real estate taxes. Additionally, we incur general and administrative expenses, advisory fees, acquisition and disposition expenses and financing fees.
Net cash provided by operating activities was $37,597 and $34,719 for the years ended December 31, 2017 and 2016, respectively, which consists primarily of net income from property operations adjusted for non-cash depreciation and amortization. The funds generated for the years ended December 31, 2017 and 2016 were primarily from property operations of our real estate portfolio.
Investing Activities
Our investing activities generally consist of real estate-related transactions (purchases and sales of properties) and payments of capitalized property-related costs such as intangible assets and reserve escrows.
Net cash used in investing activities was $13,965 and $15,968 for the years ended December 31, 2017 and 2016, respectively (this does not include the value of UPREIT units issued in connection with investing activities). For the years ended December 31, 2017 and 2016, cash flows used in investing activities related primarily to the acquisition of properties and capital expenditures was $15,646 and $20,593, respectively, and the changes in restricted cash for replacement reserve escrows was $ (863) and $ (841), respectively. In addition, during the years ended December 31, 2017 and 2016, proceeds of $4,442 were generated from the sale of one commercial retail property and the sale of vehicles and $1,409 were generated from the sale of one commercial medical property and the sale of two vehicles, respectively. In 2016, proceeds of $2,600 were generated from the sale of membership interest in Michigan Street Transit Center, LLC, an equity method investment.
Financing Activities
Our financing activities generally consist of funding property purchases by raising capital, issuing UPREIT units, using excess cash and/or securing mortgage notes payable as well as paying dividends, paying syndication costs and making principal payments on mortgage notes payable.
Net cash used in financing activities was $23,176 and $13,178 for the year ended December 31, 2017 and 2016. During the year ended December 31, 2017, we paid approximately $20,272 in dividends and distributions, redeemed $2,394 of shares and units, received proceeds from new mortgage notes payable of approximately $23,916 and made mortgage principal payments of approximately $26,208. For the year ended December 31, 2016, we paid approximately $17,712 in dividends and distributions, redeemed $2,062 of shares and units, received proceeds from new mortgage notes payable of approximately $20,271 and made mortgage principal payments of approximately $13,345.
58
Dividends
Common Stock
We declared cash dividends to our shareholders during the period from January 1, 2017 to December 31, 2017 totaling $8,212 or $0.9900 per share, including amounts reinvested through the dividend reinvestment plan. During the year ended December 31, 2017, we paid cash dividends of $2,927 and dividends of $5,285 were reinvested under the dividend reinvestment plan. The cash dividends were paid with the $37,597 from our cash flows from operations and $92 provided by distributions from unconsolidated affiliates.
We declared cash dividends to our shareholders during the period from January 1, 2016 to December 31, 2016 totaling $7,527 or $0.9600 per share, including amounts reinvested through the dividend reinvestment plan. During the year ended December 31, 2016, we paid cash dividends of $2,651 and dividends of $4,876 were reinvested under the dividend reinvestment plan. The cash dividends were paid with the $34,719 from our cash flows from operations and $542 provided by distributions from unconsolidated affiliates.
We continue to provide cash dividends to our shareholders from cash generated by our operations. The following chart summarizes the sources of our cash used to pay dividends. Our primary source of cash is cash flow provided by operating activities from our investments as presented in our cash flow statement. We also include distributions from unconsolidated affiliates to the extent that the underlying real estate operations in these entities generate these cash flows and the gain on sale of properties relates to net profits from the sale of certain properties. Our presentation is not intended to be an alternative to our consolidated statement of cash flows and does not present all sources and uses of our cash.
The following table presents certain information regarding our dividend coverage:
|
|
|
|
|
|
|
|
| Year Ended | ||||
|
| December 31, | ||||
|
| 2017 |
| 2016 | ||
|
| (in thousands) | ||||
Cash flows provided by operations (includes net income of $19,883 and $12,857, respectively) |
| $ | 37,597 |
| $ | 34,719 |
Distributions in excess of earnings received from unconsolidated affiliates |
|
| 92 |
|
| 542 |
Gain (Loss) on sales of real estate and non-real estate investments |
|
| 2,049 |
|
| (320) |
Dividends declared |
|
| (8,212) |
|
| (7,527) |
Excess |
| $ | 31,526 |
| $ | 27,414 |
Limited Partnership Units
The operating partnership agreement provides that our operating partnership will distribute to the partners (subject to certain limitations) cash from operations on a quarterly basis (or more frequently, if we so elect) in accordance with the percentage interests of the partners. We determine the amounts of such distributions in our sole discretion.
For the year ended December 31, 2017, we declared quarterly distributions totalling $17,244 to holders of limited partnership units in our operating partnership, which we paid on April 15, July 15 and October 15, 2017 and January 15, 2018. Distributions were paid at a rate of $0.2475 per unit per quarter, which is equal to the per share distribution rate paid to the common shareholders. As of December 31, 2017, the limited partnership declared distributions of $4,335 which represented distributions for the quarter ended December 31, 2017, and we paid such amount on January 16, 2018.
For the year ended December 31, 2016, we declared quarterly distributions totaling $15,552 to holders of limited partnership units in our operating partnership, which we paid on April 15, July 15 and October 15, 2016 and January 15, 2017. Distributions were paid at a rate of $0.2400 per unit per quarter, which is equal to the per share distribution rate paid to the common shareholders. As of December 31, 2016, the limited partnership declared distributions of $4,005 which represented distributions for the quarter ended December 31, 2016, and we paid such amount on January 15, 2017.
59
Sources of Dividends
For the year ended December 31, 2017, we paid aggregate dividends of $8,212, which were paid with cash flows provided by operating activities and distributions from unconsolidated affiliates. Aggregate dividends included $5,285 of dividends reinvested. Our funds from operations, or FFO, was $37,813 while our modified funds from operations, or MFFO, for the year ended December 31, 2017 was $39,188; therefore our management believes our distribution policy is sustainable over time.
For the year ended December 31, 2016, we paid aggregate dividends of $7,527 which were paid with cash flows provided by operating activities and distributions from unconsolidated affiliates. Aggregate dividends included $4,876 of dividends reinvested. Our FFO was $35,239 while our MFFO, as of the year ended December 31, 2016 was $37,320. For a further discussion of FFO and MFFO, including a reconciliation of FFO and MFFO to net income, see “Funds from Operations and Modified Funds from Operations” above.
Cash Resources
At December 31, 2017, our cash resources consisted of cash and cash equivalents totaling approximately $12,490. Our cash reserves can be used for working capital needs and other commitments. In addition, we had unencumbered properties with a gross book value of $43,362, which could potentially be used as collateral to secure additional financing in future periods.
At December 31, 2017, there was no balance outstanding on the lines of credit, leaving $39,015 available and unused under the agreements. See Note 8 to the accompanying consolidated financial statements for additional details regarding our line of credit agreements.
The sale of our securities and issuance of limited partnership units of the operating partnership in exchange for property acquisitions and sale of additional common or preferred shares is also expected to be a source of long-term capital for us. During the year ended December 31, 2017, we did not sell anycommon shares in private placements. During the year ended December 31, 2017, we issued 331,000 and 216,000 common shares under the dividend reinvestment plan and optional share purchases, respectively which raised gross proceeds of $8,706. During the year ended December 31, 2016, we did not sell anycommon shares in private placements. During the year ended December 31, 2016, we issued 315,000 and 136,000 common shares under the dividend reinvestment plan and as optional share repurchases, respectively which raised gross proceeds of $6,910.
During the year ended December 31, 2017, we issued limited partnership units valued at approximately $14,733 in connection with the acquisition of 12 properties and one property that had a change in control.
During the year ended December 31, 2016, we issued limited partnership units valued at approximately $23,468 in connection with the acquisitions of 10 properties and one property that had a change in control.
Off-Balance Sheet Arrangements
As of December 31, 2017 and 2016, we had no off-balance sheet arrangements that have or are reasonably likely to have a current or future effect on our financial condition, changes in financial condition, revenues or expenses, results of operations, liquidity, capital expenditures or capital resources.
60
Contractual Obligations
The table below presents our obligations and commitments to make future payments under our debt obligations as of December 31, 2017.
|
|
|
|
|
|
|
|
|
|
|
|
|
|
|
|
|
|
|
|
|
|
|
| Payments Due by Year (in thousands) | |||||||||||||||||||
|
| 2018 |
| 2019 |
| 2020 |
| 2021 |
| 2022 |
| Thereafter |
| Total | |||||||
Long-term debt (a): |
|
|
|
|
|
|
|
|
|
|
|
|
|
|
|
|
|
|
|
|
|
Fixed rate (b) |
| $ | 15,593 |
| $ | 25,364 |
| $ | 28,045 |
| $ | 45,935 |
| $ | 31,210 |
| $ | 251,420 |
| $ | 397,567 |
Interest (c) |
|
| 17,204 |
|
| 16,291 |
|
| 15,010 |
|
| 13,090 |
|
| 11,406 |
|
| 44,517 |
|
| 117,518 |
Special assessments |
|
| 79 |
|
| 57 |
|
| 58 |
|
| 56 |
|
| 52 |
|
| 520 |
|
| 822 |
Purchase obligations (d) |
|
| 2,031 |
|
| — |
|
| — |
|
| — |
|
| — |
|
| — |
|
| 2,031 |
|
| $ | 34,907 |
| $ | 41,712 |
| $ | 43,113 |
| $ | 59,081 |
| $ | 42,668 |
| $ | 296,457 |
| $ | 517,938 |
|
|
|
|
residential revenues. The remaining increase is due to decreased rental incentives caused by increased renewals and general market rent increases at our stabilized properties. Residential revenues comprised 84.4% of total revenues for the year ended December 31, 2022 compared to 83.0% of total revenues for the year ended December 31, 2021. Residential economic occupancy year-over-year decreased 1.6%, during the year ended December 31, 2022. For the year ended December 31, 2022, total commercial revenues decreased $948 or 4.3%, in comparison to the same period in 2021. The decrease was primarily attributed to the disposition of three commercial properties which accounts for $772 of the decrease during the year ended December 31, 2022 The remaining difference in commercial revenues is related to early termination fees which decreased $173 for the year ended December 31, 2022, as compared to the same period in 2021. The early termination fees will vary from year to year and are dependent on operational leases on commercial properties. Expenses Residential expenses from operations of $64,647 during the year ended December 31, 2022 increased $7,193 or 12.5% in comparison to the same period in 2021. The increase is attributed to an increase in repairs and maintenance expense of $2,908 or 13.5%. Properties acquired since January 1, 2021, attributed $937 to the increase in repairs and maintenance expense. Additionally, increased project and upgrade costs, that are considered to be deferred maintenance costs from the year ended 2021, due to COVID-19 restrictions attribute to the increase in repairs and maintenance expense during the year ended December 31, 2022. The increase is also attributed to an increase in property management fees of $871 or 6.7%, an increase in utility expense of $1,870 or 20.7%, as well as an increase in real estate taxes of $956 or 8.9%. The main reason for the increases in property management fees, utility expenses and real estate taxes is related to the properties acquired since January 1, 2021, which account for $665, $559 and $529 of the increase, respectively. Commercial expenses from operations of $6,491 during the year ended December 31, 2022 decreased $824 or 11.3% in comparison to the same period in 2021. For the year ended December 31, 2022 property management fees decreased by $428 or 35.2%. The decrease is also attributable to a decrease in advertising and marketing expenses in an office building located in Minneapolis, Minnesota in efforts to lease up vacant space. The decrease is also attributed to a decrease in real estate taxes of $417 or 14.2%, due to a property in Minneapolis, Minnesota receiving a real estate tax refund and property in Fargo, ND whose tenant is responsible for real estate taxes in 2022. Interest expense of $19,994 during the year ended December 31, 2022 increased $1,852 or 10.2% in comparison to the same period in 2021. Interest expense related to financing activities increased by $1,677 during 2022. One property in Minnesota had a secondary mortgage taken out which attributes to $1,036 of the increase. Capitalized interest expense related to construction in progress decreased $154 during the year ended December 31, 2022. Depreciation and amortization expense of $24,679 during the year ended December 31, 2022 increased $2,476 or 11.2% in comparison to the same period in 2021. Properties acquired since January 1, 2021, contributed approximately $2,122 to the increase in depreciation expense, which is offset by $206 of reduced depreciation expense related to the disposition of four properties during the year ended December 31, 2022. Amortization expense will continue to decrease as lease intangibles become fully amortized but will increase upon acquisitions of intangible assets. Depreciation and amortization expense as a percentage of rental income for the years ended December 31, 2022 and 2021 were relatively consistent at 18.3% and 17.2%, respectively. REIT administration expenses of $5,249 for the year ended December 31, 2022, increased $866 or 19.8% in comparison to the same period in 2021, which is attributed to two joint venture’s development fee of $600 in 2022, and an increase in REIT advisory fees paid of $335. Other income of $10,530 for the year ended December 31, 2022 increased $5,921 or 128.5% in comparison to the same period in 2021. The increase is primarily attributed to the sale of three commercial and two residential properties for $11,090 in 2022 as compared to only one commercial and one residential properties in 2021 for $1,710. This is offset by the increase in net loss allocations from Sterling’s ownership in six joint ventures for $2,078 in 2022. |
|
|
|
|
Inflation
Substantially all of our multifamily property leases are for a term of one year or less. In an inflationary environment, this may allow us to realize increased rents upon renewal of existing leases or the beginning of new leases. Short-term leases generally will minimize our risk from the adverse effects of inflation, although these leases generally permit residents to leave at the end of the lease term and therefore will expose us to the effect of a decline in market rents. In a deflationary rent environment, we may be exposed to declining rents more quickly under these shorter term leases.
As of December 31, 2017, most of our commercial leases require tenants to reimburse us for a share of our operating expenses. As a result, we are able to pass on much of any increases to our property operating expenses that might occur due to inflation by correspondingly increasing our expense reimbursement revenues. During the year-ended December 31, 2017, inflation did not have a material impact on our revenues or net income.
Critical Accounting Estimates
The following discloses accounting policies and estimates we believe are most “critical” to the portrayal of our financial condition and results of operations and require our most difficult, subjective or complex judgments. These judgments often result from the need to make estimates about the effect of matters that are inherently uncertain. GAAP requires information in financial statements about accounting principles, methods used and disclosures pertaining to significant estimates. This discussion addresses our judgment pertaining to trends, events or uncertainties known which were taken into consideration upon the application of those policies and the likelihood that materially different amounts would be reported upon taking into consideration different conditions and assumptions. See also Note 2 to the consolidated financial statements.
Acquisition of Real Estate Investments
Real estate investments are recorded at cost less accumulated depreciation. Ordinary repairs and maintenance are expensed as incurred.
The Company allocates the purchase price of each acquired investment property accounted for as a business combination based upon the estimated acquisition date fair value of the individual assets acquired and liabilities assumed, which generally include (i) land, (ii) building and other improvements, (iii) in-place lease value intangibles, (iv) acquired above and below market lease intangibles, (v) any assumed financing that is determined to be above or below market, (vi) the value of customer relationships and (vii) goodwill, if any. Transaction costs related to acquisitions accounted for as
37
61
business combinations are expensed as incurred and included within “Administration of REIT expenses” in the accompanying consolidated statements of operations and other comprehensive income.
The Company elected to early adopt ASU 2017-01, Business Combinations, on a prospective basis as of July 1, 2017. This new guidance clarifies the definition of a business and provides a screen to determine when an integrated set of assets and activities is not considered a business and, thus, accounted for as an asset acquisition as opposed to a business combination. Refer to the “Recent Accounting Pronouncements” section within Note 2 to the consolidated financial statements. Under this new guidance, the Company expects most acquisitions of investment property will meet this screen and, thus, be accounted for as asset acquisitions. The Company allocates the purchase price of each acquired investment property that is accounted for as an asset acquisition based upon the relative fair value of the individual assets acquired and liabilities assumed, which generally include (i) land, (ii) building and other improvements, (iii) in-place lease value intangibles, (iv) acquired above and below market lease intangibles, (v) any assumed financing that is determined to be above or below market and (vi) the value of customer relationships. Asset acquisitions do not give rise to goodwill and the related transaction costs are capitalized and included with the allocated purchase price.
For tangible assets acquired, including land, building and other improvements, the Company considers available comparable market and industry information in estimating acquisition date fair value. Key factors considered in the calculation of fair value of both real property and intangible assets include the current market rent values, “dark” periods (building in vacant status), direct costs estimated with obtaining a new tenant, discount rates, escalation factors, standard lease terms, and tenant improvement costs. The Company allocates a portion of the purchase price to the estimated acquired in-place lease value intangibles based on factors available in third party appraisals or cash flow estimates of the property prepared by our internal analysis. These estimates are based upon cash flow projections for the property, existing leases, lease origination costs for similar leases as well as lost rental payments during an assumed lease-up period. The Company also evaluates each acquired lease as compared to current market rates. If an acquired lease is determined to be above or below market, the Company allocates a portion of the purchase price to such above or below market leases based upon the present value of the difference between the contractual lease payments and estimated market rent payments over the remaining lease term. Renewal periods are included within the lease term in the calculation of above and below market lease values if, based upon factors known at the acquisition date, market participants would consider it reasonably assured that the lessee would exercise such options. Fair value estimates used in acquisition accounting, including the discount rate used, require the Company to consider various factors, including, but not limited to, market knowledge, demographics, age and physical condition of the property, geographic location, and size and location of tenant spaces within the acquired investment property.
The portion of the purchase price allocated to acquired in-place lease value intangibles is amortized on a straight-line basis over the life of the related lease as amortization expense. The portion of the purchase price allocated to acquired above and below market lease intangibles is amortized on a straight-line basis over the life of the related lease as an adjustment to rental income.
Impairment of Long-Lived Assets
Our real estate investments are reviewed for potential impairment at the end of each reporting period whenever events or changes in circumstances indicate that the carrying value may not be recoverable. At the end of each reporting period, we separately determine whether impairment indicators exist for each property.
62
Examples of situations considered to be impairment indicators include, but are not limited to:
|
|
|
|
|
|
Furthermore, the increase is offset by the Trust receiving $1,000 from related parties, in reimbursement for expenses paid that were associated with capital projects in 2021. Construction in Progress and Development Projects The Trust capitalizes direct and certain indirect project costs incurred during the development period such as construction, insurance, architectural, legal, interest and other financing costs, and real estate taxes. At such time as the development is considered substantially complete, the capitalization of certain indirect costs such as real estate taxes, interest, and financing costs cease, all project-related costs included in construction in process are reclassified to land and building and other improvements. Construction in progress as of December 31, 2022, consists primarily of construction at several residential properties located in North Dakota and Minnesota. The Prairiewood Meadows construction consists of the re-development of one building due to a fire, a new clubhouse for residents, and parking lot repairs. Current expectations are that the projects will be completed in the first quarter of 2023, and the current budget approximates $3,683, of which $3,085 has been incurred and is included in construction in progress. The Rosedale Estates project is primarily related to a new parking structure. Current expectations are the project will be completed in the first quarter of 2024, and the current budget is approximately $5,142, of which $129 has been incurred and is included in construction in progress. Remaining construction in progress projects are primarily related to building and roof system, roof replacements on multiple residential properties, residential exterior window systems, and new deck systems on multiple residential properties. The Trust has two on-going developments through ventures in unconsolidated affiliates. Park Hill Apartments, currently being developed in Dallas, Texas, is expected to be completed in the third quarter of 2023 and the current project budget approximates $53,138 of which $37,714 has been incurred as of December 31, 2022. Kessler Apartments, currently being developed in Fort Worth, Texas is expected to be completed in the third quarter of 2024 and the current project budget approximates $55,000 of which $8,709 has been incurred as of December 31, 2022. Funds From Operations (FFO) Funds From Operations (FFO) applicable to common shares and limited partnership units means net income (computed in accordance with GAAP), excluding gains (or losses) from sales of property, plus depreciation and amortization, and after adjustments for unconsolidated partnerships and joint ventures. Adjustments for unconsolidated partnerships and joint ventures will be calculated to reflect funds from operations on the same basis. Historical cost accounting for real estate assets implicitly assumes the value of real estate assets diminishes predictably over time. Since real estate values have historically risen or fallen with market conditions, many industry investors have considered presentations of operating results for real estate companies that use historical cost accounting to be insufficient by themselves. The term Funds From Operations (FFO) was created to address this problem. It was intended to be a standard supplemental measure of REIT operating performance that excluded historical cost depreciation from — or “added back” to — GAAP net income. Our management believes this non-GAAP measure is useful to investors because it provides supplemental information that facilitates comparisons to prior periods and for the evaluation of financial results. Management uses this non-GAAP measure to evaluate our financial results, develop budgets and manage expenditures. The method used to produce non-GAAP results is not computed according to GAAP, is likely to differ from the methods used by other companies and should not be regarded as a replacement for corresponding GAAP measures. Management encourages the review of the reconciliation of this non-GAAP financial measure to the comparable GAAP results. |
|
|
|
|
38
|
|
If the presence of one or more impairment indicators as described above is identified at the end of the reporting period or throughout the year with respect to a real estate investment, the asset is tested for recoverability by comparing its carrying value to the estimated future undiscounted cash flows. A real estate investment is considered to be impaired when the estimated future undiscounted cash flows are less than its current carrying value. When performing a test for recoverability or estimating the fair value of an impaired real estate investment, we make complex or subjective assumptions which include, but are not limited to:
|
|
|
|
Since the introduction of the definition of FFO, the term has come to be widely used by REITs. In the view of National Association of Real Estate Investment Trusts (“NAREIT”), the use of the definition of FFO (combined with the primary GAAP presentations required by the Securities and Exchange Commission) has been fundamentally beneficial, improving the understanding of operating results of REITs among the investing public and making it easier than before to compare the results of one REIT with another. While FFO applicable to common shares and limited partnership units are widely used by REITs as performance metrics, all REITs do not use the same definition of FFO or calculate FFO in the same way. The FFO reconciliation presented here is not necessarily comparable to FFO presented by other real estate investment trusts. FFO should also not be considered as an alternative to net income as determined in accordance with GAAP as a measure of a real estate investment trust’s performance, but rather should be considered as an additional, supplemental measure, and should be viewed in conjunction with net income as presented in the consolidated financial statements included in this report. FFO applicable to common shares and limited partnership units does not represent cash generated from operating activities in accordance with GAAP and is not necessarily indicative of sufficient cash flow to fund a real estate investment trust’s needs or its ability to service indebtedness or to pay dividends to shareholders. The following tables include calculations of FFO, and the reconciliations to net income, for the years ended December 31, 2022, 2021 and 2020, respectively. We believe these calculations are the most comparable GAAP financial measure (in thousands): Reconciliation of Net Income Attributable to Sterling to FFO Applicable to Common Shares and Limited Partnership Units
|
|
| ||||||||||||||||||||||||||||||||||||||||||||||||||||||||||||||||||||||||||||||||||||||||||||||||||||||||||||||||||||||||||||||||||||||||||||||||||||||||||||||||||||||||||||||||||||||||||||||||||||||||||||||||||||||||||||||||||||||||||||||||||||||||||||||||||||||||||||||||||||||||||||||||||||||||||||||||||||||||||||||||||||
|
|
39
|
|
To the extent impairment has occurred, we will record an impairment charge calculated as the excess of the carrying value of the asset over its fair value for impairment of real estate investments.
Revenue Recognition
We derive over 95% of our revenues from tenant rents and other tenant-related activities. We lease multifamily units under operating leases with terms of one year or less. Rental income and other property revenues are recorded when due from tenants and recognized monthly as earned pursuant to the terms of the underlying leases. Other property revenues consist primarily of laundry, application and other fees charged to tenants.
We lease commercial space primarily under long-term lease agreements. Commercial tenant rents include base rents, expense reimbursements (such as common area maintenance, real estate taxes and utilities), and a straight-line rent adjustment. We record base rents on a straight-line basis. The monthly base rent income according to the terms of our leases is adjusted so that an average monthly rent is recorded for each tenant over the term of its lease. We receive payments for expense reimbursements from substantially all our multi-tenant commercial tenants throughout the year based on estimates. Differences between estimated recoveries and the final billed amounts, which generally are immaterial, are recognized in the subsequent year.
Federal Income Taxes
We have elected to be taxed as a REIT under the Internal Revenue Code, as amended. A REIT calculates taxable income similar to other domestic corporations, with the major difference being a REIT is entitled to a deduction for dividends paid. A REIT is generally required to distribute each year at least 90% of its taxable income. If it chooses to retain the remaining 10% of taxable income, it may do so, but it will be subject to a corporate tax on such income. REIT shareholders are taxed on REIT distributions of ordinary income in the same manner as they are taxed on other corporate distributions.
63
We intend to continue to qualify as a REIT and, as such, will not be taxed on the portion of the income that is distributed to shareholders. In addition, we intend to distribute all of our taxable income; therefore, no provisions or liabilities for income taxes have been recorded in the consolidated financial statements.
Sterling conducts its business activity as an Umbrella Partnership Real Estate Investment Trust (“UPREIT”) through its Operating Partnership – Sterling Properties, LLLP. The Operating Partnership is organized as a limited liability limited partnership. Income or loss is allocated to the partners in accordance with the provisions of the Internal Revenue Code 704(b) and 704(c). UPREIT status allows non-recognition of gain by an owner of appreciated real estate if that owner contributes the real estate to a partnership in exchange for a partnership interest. The conversion of a partnership interest to shares of beneficial interest in the REIT will be a taxable event to the limited partner.
We follow ASC Topic 740, Income Taxes, to recognize, measure, present and disclose in our consolidated financial statements uncertain tax positions that we have taken or expect to take on a tax return. As of December 31, 2017, 2016 and 2015 we did not have any liabilities for uncertain tax positions that we believe should be recognized in our consolidated financial statements. We are no longer subject to Federal and State tax examinations by tax authorities for years before 2014.
The operating partnership has elected to record related interest and penalties, if any, as income tax expense on the consolidated statements of operations and other comprehensive income.
Estimated Value of Units/Shares
The Board of Trustees determined an estimate of fair value for the trust shares in 2017 and 2016. In addition, the Board of Trustees, acting as general partner for the operating partnership, determined an estimate of fair value for the limited partnership units in 2017 and 2016. In determining this value, the Board relied upon their experience with, and knowledge about, the Trust’s real estate portfolio and debt obligations. The Board typically determines the share price on an annual basis. The trustees determine the price in their discretion and use data points to guide their determination which is typically based on a consensus of opinion. In addition, the Board considers how the price chosen will affect existing share and unit values, redemption prices, dividend coverage ratios, yield percentages, dividend reinvestment factors, and future UPREIT transactions, among other considerations and information.
Determination of price is a matter within the Board’s sole discretion. The Trust does not determine price based on any rote formula or specific factors. At this time, no shares are held in street name accounts and the Trust is not subject to FINRA’s specific pricing requirements set out in Rule 2340 or otherwise. Thus, the Trust does not employ any specific valuation methodology or formula. Rather, the Board looks to available data and information, which is often adjusted and weighted, or discounts are applied to comport more closely with the assets held by the Trust at the time of valuation. The principal valuation methodology utilized is the NAV calculation/direct capitalization method. The information made available to the Board is assembled by the Trust’s Advisor.
As with any valuation methodology, the methodologies utilized by the Board in reaching an estimate of the value of the shares and limited partnership units are based upon a number of estimates, assumptions, judgments or opinions that may, or may not, prove to be correct. The use of different estimates, assumptions, judgments, or opinions would likely have resulted in significantly different estimates of the value of the shares and limited partnership units. In addition, the Board’s estimate of share and limited partnership unit value is not based on the book values of our real estate, as determined by GAAP, as our book value for most real estate is based on the amortized cost of the property, subject to certain adjustments.
Furthermore, in reaching an estimate of the value of the shares and limited partnership units, the Board applied a liquidity discount to one valuation scenario in order to reflect the fact that the shares and limited partnership units are not currently traded on a national securities exchange; a discount for debt that may include a prepayment obligation or a provision precluding assumption of the debt by a third party; or the costs that are likely to be incurred in connection with an appropriate exit strategy, whether that strategy might be a listing of the limited partnership units or common shares on a national securities exchange or a merger or sale of our portfolio.
64
There have been no material changes in our Significant Accounting Policies as disclosed in Note 2 to our consolidated financial statements for the year ended December 31, 2017 included elsewhere in this report.
Recently Issued Accounting Pronouncements
For a discussion of recently issued accounting pronouncements, see Note 2, Principal Activity and Significant Accounting Policies— Recently Issued Accounting Pronouncements, to the consolidated financial statements that are a part of this Annual Report on Form 10-K.
Recent Developments
Common Share Dividends. On January 16, 2018, we paid a dividend or distribution of $0.2475 per share on our common shares of beneficial interest, to common shareholders and limited unit holders of record on December 31, 2017. All future dividends remain subject to the discretion of our Board of Trustees.
ITEM 7A. QUANTITATIVE AND QUALITATIVE DISCLOSURES ABOUT MARKET RISK
The principal material financial market risk to which we are exposed is interest-rate risk. Our exposure to market risk for changes in interest rates relates primarily to refinancing long-term fixed rate obligations, the opportunity cost of fixed rate obligations in a falling interest rate environment and our variable rate lines of credit.
The following table shows the scheduled maturities and principal amortization of our indebtedness as of December 31, 2017 for each of the next five years and thereafter and the weighted average interest rates by year.
|
|
|
|
|
|
|
|
|
|
|
|
|
|
|
|
|
|
|
|
|
|
|
| 2018 |
| 2019 |
| 2020 |
| 2021 |
| 2022 |
| Thereafter |
| Total | |||||||
Debt: |
|
|
|
|
|
|
|
|
|
|
|
|
|
|
|
|
|
|
|
|
|
Fixed rate debt: |
|
|
|
|
|
|
|
|
|
|
|
|
|
|
|
|
|
|
|
|
|
Mortgage notes payable (a) |
| $ | 15,593 |
| $ | 25,364 |
| $ | 28,045 |
| $ | 45,935 |
| $ | 31,210 |
| $ | 251,420 |
| $ | 397,567 |
|
|
|
|
|
|
|
|
|
|
|
|
|
|
|
|
|
|
|
|
|
|
Weighted average interest rate on debt: |
|
|
|
|
|
|
|
|
|
|
|
|
|
|
|
|
|
|
|
|
|
Fixed rate debt |
|
|
|
|
|
|
|
|
|
|
|
|
|
|
|
|
|
|
|
|
|
Mortgage notes payable (a) |
|
| 5.34% |
|
| 5.26% |
|
| 4.66% |
|
| 4.41% |
|
| 4.09% |
|
| 4.33% |
|
| 4.38% |
|
|
The table incorporates only those interest rate exposures that existed as of December 31, 2017. It does not consider those interest rate exposures or positions that could arise after that date. The information presented herein is merely an estimate and has limited predictive value. As a result, the ultimate realized gain or loss with respect to interest rate fluctuations will depend on the interest rate exposures that arise during future periods, our hedging strategies at that time and future changes in interest rates.
ITEM 8. FINANCIAL STATEMENTS AND SUPPLEMENTARY DATA
Our consolidated financial statements included in this Annual Report are listed in Item 15 and begin immediately after the signature pages.
ITEM 9. CHANGES IN AND DISAGREEMENTS WITH ACCOUNTANTS ON ACCOUNTING AND FINANCIAL DISCLOSURE
None.
65
ITEM 9A. CONTROLS AND PROCEDURES
Disclosure Controls and Procedures
Under the supervision and with the participation of our management, including our Chief Executive Officer and Chief Accounting Officer, we conducted an evaluation of the effectiveness of the design and operation of our disclosure controls and procedures (as defined in Rules 13a-15(e) and 15d-15(e) under the Exchange Act) as of the end of the period covered by this Annual Report on Form 10-K (the “Evaluation Date”). Based upon the evaluation, our Chief Executive Officer and Chief Accounting Officer concluded as of the Evaluation Date that our disclosure controls and procedures were effective to ensure that information required to be disclosed in our reports that we file or submit under the Exchange Act is recorded, processed, summarized and reported within the time periods specified in the Commission’s rules and forms, and is accumulated and communicated to management, including our principal executive and principal financial officers, as appropriate to allow timely decisions regarding required disclosure.
Report of Management on Internal Control Over Financial Reporting
Our management is responsible for establishing and maintaining a comprehensive system of internal control over financial reporting to provide reasonable assurance of the proper authorization of transactions, the safeguarding of assets and the reliability of the financial records. Our internal control system was designed to provide reasonable assurance to our management and Board of Trustees regarding the preparation and fair presentation of published financial statements. The system of internal control over financial reporting provides for appropriate division of responsibility and is documented by written policies and procedures that are communicated to employees. The framework upon which management relied in evaluating the effectiveness of our internal control over financial reporting was set forth in Internal Controls – Integrated Framework (2013) published by the Committee of Sponsoring Organization of the Treadway Commission.
Liquidity and Capital Resources
Evaluation of Liquidity
Wecontinually evaluate our liquidity and ability to fund future operations, debt obligations, and any repurchase requests. As part of our analysis, we consider among other items, the credit quality of tenants and lease expirations.
Our principal demands for funds will be for the: (i) acquisition of real estate and real estate-related investments, (ii) payment of acquisition related expenses and operating expenses, (iii) payment of dividends/distributions, (iv) payment of principal and interest on current and any future outstanding indebtedness, (v) redemptions of our securities under our redemption plans and (vi) capital improvements, development projects, and property related expenditures. Generally, we expect to meet cash needs for the payment of operating expenses and interest on outstanding indebtedness from cash flow from operations. We expect to pay dividends/distributions and any repurchase requests to our shareholders and the unit holders of our operating partnership from cash flow from operations; however, we may use other sources to fund dividends/distributions and repurchases, as necessary.
At December 31, 2022, our unrestricted cash resources consisted of cash and cash equivalents totaling $3,257. Our unrestricted cash reserves can be used for working capital needs and other commitments. In addition, we had unencumbered properties with a gross book value of $107,577, which could potentially be used as collateral to secure additional financing in future periods.
The Trust has a $4,915 variable rate (SOFR plus 2.00%) line of credit agreement with Bremer Bank, which expires in December 2026; and a $5,000 variable rate (SOFR plus 2.00%) line of credit agreement with Bremer Bank, which expires December 2026. The lines of credit are secured by specific properties. At December 31, 2022, the Bremer lines of credit secured one letter of credit totaling $50, leaving $8,857 available and unused under the agreements. The Trust anticipates renewing the line of credit expiring in the next 12 months to continue to hold it as a cash resource to the Trust.
The sale of our securities and issuance of limited partnership units of the operating partnership in exchange for property acquisitions and sale of additional common or preferred shares is also expected to be a source of long-term capital for us.
During the year ended December 31, 2022, we did not sell any common shares in private placements. During the year ended December 31, 2022, we issued 342,000 and 177,000 common shares under the dividend reinvestment plan and optional share purchases, respectively which raised gross proceeds of $11,531. During the year ended December 31, 2021, we did not sell any common shares in private placements. During the year ended December 31, 2021, we issued 363,000 and 203,000 common shares under the dividend reinvestment plan and as optional share purchases, respectively which raised gross proceeds of $10,952.
Additionally, to reduce our cash investment and liquidity needs, the Trust utilizes the UPREIT structure whereby we can acquire property in whole or in part by issuing partnership units in lieu of cash payments. During the year end December 31, 2022, the operating partnership issued approximately 560,000 limited partnership units of the operating partnership valued at $23.00 per unit for an aggregate consideration of approximately $12,870 for the purchase of real estate investments. During the year end December 31, 2021, the Trust issued approximately 144,000 limited partnership units of the operating partnership valued at $20.00 per unit for an aggregate consideration of approximately $2,883 for the purchase of real estate investments.
40
The Board of Trustees, acting as general partner for the operating partnership, determined an estimate of fair value for the limited partnership units exchanged through the UPREIT structure. In determining this value, the Board relied upon their experience with, and knowledge about, the Trust’s real estate portfolio and debt obligations. The Board typically determines the fair value on an annual basis. The Trustees determine the fair value, in their sole discretion and use data points to guide their determination which is typically based on a consensus of opinion. Thus, the Trust does not employ any specific valuation methodology or formula. Rather, the Board looks to available data and information, which is often adjusted and weighted to comport more closely with the assets held by the Trust at the time of valuation. The principal valuation methodology utilized is the NAV calculation/direct capitalization method. The information made available to the Board is assembled by the Trust’s Advisor. In addition, the Board considers how the price chosen will affect existing share and unit values, redemption prices, dividend coverage ratios, yield percentages, dividend reinvestment factors, and future UPREIT transactions, among other considerations and information. The fair value was not determined based on, nor intended to comply with, fair value standards under US GAAP and the value may not be indicative of the price we would get for selling our assets in their current condition. At this time, no shares are held in street name accounts and the Trust is not subject to FINRA’s specific pricing requirements set out in Rule 2340 or otherwise.
As with any valuation methodology, the methodologies utilized by the Board in reaching an estimate of the value of the shares and limited partnership units are based upon a number of estimates, assumptions, judgments or opinions that may, or may not, prove to be correct. The use of different estimates, assumptions, judgments, or opinions would likely have resulted in significantly different estimates of the value of the shares and limited partnership units. In addition, the Board’s estimate of share and limited partnership unit value is not based on the book values of our real estate, as determined by GAAP, as our book value for most real estate is based on the amortized cost of the property, subject to certain adjustments.
Cash on hand, together with cash from operations and access to the lines of credit is expected to provide sufficient capital to meet the Company’s needs for at least the next 12 months and as appropriate, we will use cash flows from operations, net proceeds from share offerings, debt proceeds, and proceeds from the disposition of real estate investments to meet long term liquidity demands.
Credit Quality of Tenants
We are exposed to credit risk within our tenant portfolio, which can reduce our results of operations and cash flow from operations if our tenants are unable to pay their rent. Tenants experiencing financial difficulties may become delinquent on their rent or default on their leases and, if they file for bankruptcy protection, may reject our lease in bankruptcy court, resulting in reduced cash flow. This may negatively impact net asset values and require us to incur impairment charges. Even if a default has not occurred and a tenant is continuing to make the required lease payments, we may restructure or renew leases on less favorable terms, or the tenant’s credit profile may deteriorate, which could affect the value of the leased asset and could in turn require us to incur impairment charges.
To mitigate credit risk on commercial properties, we have historically looked to invest in assets that we believe are critically important to our tenant’s operations and have attempted to diversify our portfolio by tenant, tenant industry and geography. We also monitor all of our properties’ performance through review of rent delinquencies as a precursor to a potential default, meetings with tenant management and review of tenants’ financial statements and compliance with financial covenants. When necessary, our asset management process includes restructuring transactions to meet the evolving needs of tenants, refinancing debt and selling properties, as well as protecting our rights when tenants default or enter into bankruptcy.
Lease Expirations and Occupancy
Our residential leases are for a term of one year or less. The Advisor, with the assistance of our property managers, actively manages our real estate portfolio and begins discussing options with tenants in advance of scheduled lease expirations. In certain cases, we may obtain lease renewals from our tenants; however, tenants may elect to move out at the end of their term. In the cases where tenants elect not to renew, we may seek replacement tenants or try to sell the property.
41
Cash Flow Analysis
Our objectives are to generate sufficient cash flow over time to provide shareholders with increasing dividends and to seek investments with potential for strong returns and capital appreciation throughout varying economic cycles. We have funded 100% of dividends paid with operating cash flows. In setting a dividend rate, we focus primarily on expected returns from investments we have already made to assess the sustainability of a particular dividend rate over time.
| | | | | | |
| | Year Ended | ||||
| | December 31, | ||||
|
| 2022 |
| 2021 | ||
| | (in thousands) | ||||
Net cash flows provided by operating activities | | $ | 40,770 | | $ | 45,055 |
Net cash flows used in investing activities | | $ | (107,960) | | $ | (59,141) |
Net cash flows provided by financing activities | | $ | 19,114 | | $ | 47,107 |
Operating Activities
Our real estate properties generate cash flow in the form of rental revenues, which is reduced by interest payments, direct lease costs and property-level operating expenses. Property-level operating expenses consist primarily of property management fees including salaries and wages of property management personnel, utilities, cleaning, repairs, insurance, security and building maintenance cost, and real estate taxes. Additionally, we incur general and administrative expenses, advisory fees, acquisition and disposition expenses and financing fees.
Net cash provided by operating activities was $40,770 and $45,053 for the years ended December 31, 2022 and 2021, respectively, which consists primarily of net income from property operations, adjusted for non-cash depreciation and amortization.
Investing Activities
Our investing activities generally consist of real estate-related transactions (purchases and sales of properties) and payments of capitalized property-related costs such as intangible assets.
Net cash used in investing activities was $107,960 and $59,119 for the years ended the year ended December 31, 2022 and 2021, respectively (this does not include the value of UPREIT units issued in connection with investing activities). For the years ended December 31, 2022 and 2021, cash flows used in investing activities related specifically to the acquisition of properties and capital expenditures was $91,600 and $53,900, respectively. For the years ended December 31, 2022 and 2021, cash flows used in investing activities related to the purchase of securities was $29,130 and $-, respectively. Proceeds received from the sale of real estate investments during the years ended December 31, 2022 and 2021, offset this amount by $25,463 and $5,610, respectively.
Financing Activities
Our financing activities generally consist of funding property purchases by raising proceeds and securing mortgage notes payable as well as paying dividends, paying syndication costs, and making principal payments on mortgage notes payable.
Net cash provided by financing activities was $19,114 and $47,107, respectively, for the years ended December 31, 2022 and 2021. During the year ended December 31, 2022, we paid $25,310 in dividends and distributions, redeemed $2,077 of shares and units, received $26,500 from a note payable, received $37,569 from new mortgage notes payable, and made mortgage principal payments of $22,231. For the year ended December 31, 2021, we paid $22,622 in dividends and distributions, redeemed $5,566 of shares and units, received $116,180 from new mortgage notes payable, and made mortgage principal payments of $43,641.
42
Dividends and Distributions
Common Stock
We declared cash dividends to our shareholders during the period from January 1, 2022, to December 31, 2022 totaling $12,222 or $1.1500 per share, of which $4,507 was cash dividends and $7,715 were reinvested through the dividend reinvestment plan. The cash dividends were paid with the $40,770 from our cash flows from operations.
We declared cash dividends to our shareholders during the period from January 1, 2021, to December 31, 2021 totaling $10,761 or $1.0600 per share, of which $3,842 was cash dividends and $6,918 were reinvested through the dividend reinvestment plan. The cash dividends were paid with the $45,053 from our cash flows from operations.
We continue to provide cash dividends to our shareholders from cash generated by our operations. The following chart summarizes the sources of our cash used to pay dividends. Our primary source of cash is cash flow provided by operating activities from our investments as presented in our cash flow statement. We also include distributions from unconsolidated affiliates to the extent that the underlying real estate operations in these entities generate these cash flows and the gain on sale of properties relates to net profits from the sale of certain properties. Our presentation is not intended to be an alternative to our consolidated statement of cash flows and does not present all sources and uses of our cash.
The following table presents certain information regarding our dividend coverage:
| | | | | | |
| | Year Ended | ||||
| | December 31, | ||||
|
| 2022 |
| 2021 | ||
| | (in thousands) | ||||
Cash flows provided by operations (includes net income of $24,532 and $24,438, respectively) | | $ | 40,770 | | $ | 45,055 |
Distributions in excess of earnings received from unconsolidated affiliates | |
| 504 | |
| — |
Gain on sales of real estate and non-real estate investments | |
| 10,529 | |
| 1,710 |
Dividends declared | |
| (12,222) | |
| (10,760) |
Excess | | $ | 39,581 | | $ | 36,005 |
Limited Partnership Units
The operating partnership agreement provides that our operating partnership will distribute to the partners (subject to certain limitations) cash from operations on a quarterly basis (or more frequently, if we so elect) in accordance with the percentage interests of the partners. We determine the amounts of such distributions in our sole discretion.
For the year ended December 31, 2022, we declared quarterly distributions totaling $21,482 to holders of limited partnership units in our operating partnership, which we paid on April 15, July 15, and October 17, 2022, and January 17, 2023. Distributions were paid at a rate of $0.2875 per unit per quarter, which is equal to the per share distribution rate paid to the common shareholders.
For the year ended December 31, 2021, we declared quarterly distributions totaling $19,319 to holders of limited partnership units in our operating partnership, which we paid on April 15, July 15, October 15, 2021, and January 18, 2022. Distributions were paid at a rate of $0.2650 per unit per quarter, which is equal to the per share distribution rate paid to the common shareholders.
43
Sources of Dividends and Distributions
For the year ended December 31, 2022, we paid aggregate dividends of $11,854, which were paid with cash flows provided by operating activities. Our funds from operations, or FFO, was $42,011, therefore, our management believes our distribution policy is sustainable over time. For the year ended December 31, 2021, we paid aggregate dividends of $10,629 which were paid with cash flows provided by operating activities. Our FFO was $45,788 for the year ended December 31, 2021. For a further discussion of FFO, including a reconciliation of FFO to net income, see “Funds from Operations” above.
RecentlyIssuedAccountingPronouncements
For a discussion of recently issued accounting pronouncements, see Note 2, Principal Activity and Significant Accounting Policies— Recently Issued Accounting Pronouncements, to the consolidated financial statements that are a part of this Annual Report on Form 10-K.
44
Recent Developments
On January 17, 2023, we paid a dividend or distribution of $0.2875 per share on our common shares of beneficial interest or limited partnership units, to common shareholders and limited unit holders of record on December 31, 2022.
We have evaluated subsequent events through the date of this filing. We are not aware of any other subsequent events which would require recognition or disclosure in the consolidated financial statements.
ITEM 7A. QUANTITATIVE AND QUALITATIVE DISCLOSURES ABOUT MARKET RISK
The Trust is exposed to certain risk arising from both its business operations and economic conditions and principally manages its exposures to a wide variety of business and operational risks through management of its core business activities. The Trust manages economic risks, liquidity, and credit risk primarily by managing the amount, sources, and duration of its assets and liabilities. The principal material financial market risk to which we are exposed, is interest-rate risk, which the Trust manages through the use of derivative financial instruments. Specifically, the Trust enters into derivative financial instruments to manage exposures that arise from business activities that result in the receipt or payment of future known and uncertain cash amounts, the value of which are determined by interest rates. During the year ended December 31, 2022, the Trust used 12 interest rate swaps to hedge the variable cash flows associated with market interest rate risk. These swaps have an aggregated notional amount of $106,033 for the year ended December 31, 2022. We do not enter into derivative instruments for trading or speculative purposes. The interest rate swaps expose us to credit risk in the event of non-performance by the counterparty under the terms of the agreement.
As of December 31, 2022, The Trust had $106,033 of variable-rate borrowings, with the total outstanding balance fixed through interest rate swaps. Even though our goal is to maintain a fairly low exposure to interest rate risk, we may become vulnerable to significant fluctuations in interest rates on any future repricing or refinancing of our fixed or variable rate debt or future debt.
ITEM 8. FINANCIAL STATEMENTS AND SUPPLEMENTARY DATA
Our consolidated financial statements included in this Annual Report are listed in Item 15 and begin immediately after the signature pages.
ITEM 9. CHANGES IN AND DISAGREEMENTS WITH ACCOUNTANTS ON ACCOUNTING AND FINANCIAL DISCLOSURE
None.
ITEM 9A. CONTROLS AND PROCEDURES
Disclosure Controls and Procedures
Sterling Real Estate Trust’s Chief Executive Officer and Chief Financial Officer have evaluated the effectiveness of Sterling Real Estate Trust’s disclosure controls and procedures (as defined in Rule 13a-15(e) under the Securities Exchange Act of 1934) as of the end of the period covered by this Report. Based on the evaluation, Sterling Real Estate Trust’s Chief Executive Officer and Chief Financial Officer have concluded that Sterling Real Estate Trust’s disclosure controls and procedures were effective to ensure that information required to be disclosed in our reports that we file or submit under the Exchange Act is recorded, processed, summarized and reported within the time periods specified in the Commission’s rules and forms, and is accumulated and communicated to management, including our principal executive and principal financial officers, as appropriate to allow timely decisions regarding required disclosure.
45
Report of Management on Internal Control Over Financial Reporting
Our management is responsible for establishing and maintaining a comprehensive system of internal control over financial reporting to provide reasonable assurance of the proper authorization of transactions, the safeguarding of assets and the reliability of the financial records. Our internal control system was designed to provide reasonable assurance to our management and Board of Trustees regarding the preparation and fair presentation of published financial statements. The system of internal control over financial reporting provides for appropriate division of responsibility and is documented by written policies and procedures that are communicated to employees. The framework upon which management relied in evaluating the effectiveness of our internal control over financial reporting was set forth in Internal Controls – Integrated Framework (2013) published by the Committee of Sponsoring Organization of the Treadway Commission.
Our internal control system was designed to provide reasonable assurance regarding the reliability of financial reporting and the preparation of financial statements for external purposes in accordance with generally accepted accounting principles in the U.S. Our internal control over financial reporting includes those policies and procedures that:
| i. | pertain to the maintenance of records that, in reasonable detail, accurately and fairly reflect the transactions and disposition of our assets, |
| ii. | provide reasonable assurance that transactions are recorded as necessary to permit preparation of financial statements in accordance with accounting principles generally accepted in the U.S., and that our receipts and expenditures are being made only in accordance with authorization of our management and trustees; and |
Based on the results of our evaluation, our management concluded that our internal control over financial reporting was effective as of December 31, 2022. However, projections of any evaluation of effectiveness to future periods are subject to the risk that controls may become inadequate because of changes in our business or other conditions, or that the degree of compliance with our policies or procedures may deteriorate.
46
Inherent Limitations of Disclosure Controls and Procedures and Internal Control over Financial Reporting
There are inherent limitations to the effectiveness of any control system. A control system, no matter how well conceived and operated, can provide only reasonable assurance that its objectives are met. No evaluation of controls can provide absolute assurance that all control issues and instances of fraud, if any, within us have been detected. Also, projections of any evaluation of effectiveness to future periods are subject to the risk that controls may become inadequate because of changes in conditions or because the degree of compliance with the policies and procedures may deteriorate.
Changes in Internal Control Over Financial Reporting
There have been no changes in our internal control over financial reporting (as defined in Rule 13a-15(f) and Rule 15d-15(f) under the Exchange Act) during the fourth quarter ended December 31, 2022 that have materially affected, or are reasonably likely to materially affect, our internal control over financial reporting.
ITEM 9B. OTHER INFORMATION
None.
PART III
The information required in Item 10 (Directors, Executive Officers and Corporate Governance), Item 11 (Executive Compensation), Item 12 (Security Ownership of Certain Beneficial Owners and Management and Related Stockholder Matters), Item 13 (Certain Relationships and Related Transactions, and Director Independence), and Item 14 (Principal Accountant Fees and Services) is incorporated by reference to our definitive proxy statement for the 2023 Annual Meeting of Shareholders to be filed with the SEC or filed by amendment to this Annual Report on or before May 1, 2023.
47
PART IV
ITEM 15. EXHIBITS AND FINANCIAL STATEMENT SCHEDULES
(a)(1) The financial statements listed below are included in this report
Reports of Independent Registered Public Accounting Firms (PCAOB ID Number 49 and PCAOB ID Number 23)
Consolidated Financial Statements
Consolidated Balance Sheets at December 31, 2022 and 2021
Consolidated Statements of Operations and Other Comprehensive Income for the years ended December 31, 2022, 2021 and 2020
Consolidated Statements of Stockholders’ Equity for the Years Ended December 31, 2022, 2021 and 2020
Consolidated Statements of Cash Flows for the Years Ended December 31, 2022, 2021 and 2020
Notes to Consolidated Financial Statements
Real Estate and Accumulated Depreciation (Schedule III)
(a)(3) Exhibits
See the Exhibit Index filed as part of this Annual Report on Form 10-K.
ITEM 16. FORM 10-K SUMMARY
Not applicable.
48

STERLING REAL ESTATE TRUST AND SUBSIDIARIES
CONSOLIDATED BALANCE SHEETS AS OF DECEMBER 31, 2022 AND 2021,
AND THE RELATED CONSOLIDATED STATEMENTS OF OPERATIONS AND
OTHER COMPREHENSIVE INCOME, SHAREHOLDERS’ EQUITY AND CASH FLOWS
FOR THE YEARS ENDED
DECEMBER 31, 2022, 2021 AND 2020,
INCLUDING NOTES
and
REPORTS OF INDEPENDENT REGISTERED
PUBLIC ACCOUNTING FIRM
69
49
STERLING REAL ESTATE TRUST AND SUBSIDIARIES
| PAGE | |||
| ||||
| 51 | |||
| | | | |
| | | ||
| ||||
CONSOLIDATED FINANCIAL STATEMENTS | ||||
55 |
| |||
Consolidated Statements of Operations and Other Comprehensive Income | 56 |
| ||
57 |
| |||
58 |
| |||
60 |
| |||
| 85 | |
70
50
REPORT OF INDEPENDENT REGISTERED PUBLIC ACCOUNTING FIRMReport of Independent Registered Public Accounting Firm
To the Shareholders the Audit Committee, and the Board of DirectorsTrustees of Sterling Real Estate Trust:Trust
OpinionsOpinion on the Financial Statements and Internal Control over Financial Reporting
We have audited the accompanying consolidated balance sheets of Sterling Real Estate Trust and its subsidiaries (the "Company")Company) as of December 31, 20172022 and 2016,2021, the related consolidated statements of operations and other comprehensive income, changes in shareholders’ equity and cash flows for each of the three years in the periodyear then ended, December 31, 2017, and the related notes to the consolidated financial statements and schedule (collectively, the financial statement schedules (collectively referred to as the "consolidated financial statements")statements). We also have audited the Company’s internal control over financial reporting as of December 31, 2017, based on criteria established in Internal Control – Integrated Framework: (2013) issued by the Committee of Sponsoring Organizations of the Treadway Commission (COSO).
In our opinion, the consolidated financial statements present fairly, in all material respects, the financial position of the Company as of December 31, 20172022 and 2016,2021, and the results of its operations and its cash flows for each of the three years in the periodyear then ended, December 31, 2017, in conformity with accounting principles generally accepted in the United States of America. Also in our opinion, the Company maintained, in all material respects, effective internal control over financial reporting as of December 31, 2017, based on criteria established in Internal Control – Integrated Framework: (2013) issued by COSO.
Basis for Opinion
The Company’s management is responsible for these consolidatedThese financial statements for maintaining effective internal control over financial reporting, and for its assessmentare the responsibility of the effectiveness of internal control over financial reporting, included in the accompanying Report of Management on Internal Control Over Financial Reporting.Company’s management. Our responsibility is to express an opinion on the Company's consolidatedCompany’s financial statements based on our audits. We are a public accounting firm registered with the Public Company Accounting Oversight Board (United States) (PCAOB) and are required to be independent with respect to the Company in accordance with U.S. federal securities laws and the applicable rules and regulations of the Securities and Exchange Commission and the PCAOB.
We conducted our audit in accordance with the standards of the PCAOB. Those standards require that we plan and perform the audit to obtain reasonable assurance about whether the financial statements are free of material misstatement, whether due to error or fraud. The Company is not required to have, nor were we engaged to perform, an audit of its internal control over financial reporting. As part of our audit, we are required to obtain an understanding of internal control over financial reporting but not for the purpose of expressing an opinion on the effectiveness of the Company’s internal control over financial reportingreporting. Accordingly, we express no such opinion.
Our audit included performing procedures to assess the risks of material misstatement of the financial statements, whether due to error or fraud, and performing procedures that respond to those risks. Such procedures included examining, on a test basis, evidence regarding the amounts and disclosures in the financial statements. Our audit also included evaluating the accounting principles used and significant estimates made by management, as well as evaluating the overall presentation of the financial statements. We believe that our audits provide a reasonable basis for our opinion.
Critical Audit Matters
The critical audit matters communicated below are matters arising from the current period audit of the financial statements that were communicated or required to be communicated to the audit committee and that: (1) relates to accounts or disclosures that are material to the financial statements and (2) involved our especially challenging, subjective or complex judgments. The communication of critical audit matters does not alter in any way our opinion on the financial statements, taken as a whole, and we are not, by communicating the critical audit matters below, providing separate opinions on the critical audit matters or on the accounts or disclosures to which they relate.Evaluation of real estate investments for impairment
The Company’s real estate investments and related intangible assets were $776.3 million and $5.3 million, respectively, as of December 31, 2022. As described in Note 2, the Company performs impairment testing on a quarterly basis or whenever events or changes in circumstances indicate the carrying amount of its real estate investments may not be recoverable. As part of the Company’s impairment indicator analysis, management considers numerous potential indicators of impairment of operating properties. These indicators could include a substantial decline in or continued low occupancy rate, continued difficulty in leasing space, significant financially troubled tenants, a change in plan to sell a property prior to the end of its useful life or holding period, a significant decrease in market price not in line with general market trends, and any other quantitative or qualitative events or factors deemed significant by the Trust’s management or board of trustees. The Company identified indicators of impairment for certain real estate investments and, in such cases, further assessed the assets for recoverability by comparing the net carrying value to estimated future cash flows on an undiscounted basis.
51
We identified the determination of the existence of impairment indicators for the Company’s real estate investments and related intangible assets as a critical audit matter because of the significant judgments made by management, including the evaluation of the impact of the factors described above. Auditing management’s judgments used in the determination of impairment indicators involved a high degree of auditor judgment and increased audit effort. Further, auditing the Company’s undiscounted cash flow model required a high degree of auditor judgment and increased audit effort as estimates underlying the calculation, including terminal capitalization rates, were based on assumptions affected by expected future market and economic conditions.
Our audit procedures related to the Company’s evaluation of real estate investments for impairment included the following, among others.
We tested the underlying data used in management’s analysis for completeness and accuracy, agreed such data to source documents and the underlying accounting records and evaluated management’s conclusions around potential indicators of impairment.
We evaluated the accuracy of management’s conclusions around potential indicators of impairment by developing an independent expectation of potential impairment indicators on a property by property basis, considering information such as historical trends, current year property level operating performance, and changes in expected hold periods, among others, and compared our expectation to management’s analysis.
For the Company’s real estate investments that were assessed by management using an undiscounted cash flow model, we inspected relevant industry data to consider market conditions. Further, we tested that the significant assumptions utilized in estimating property undiscounted cash flows, such as terminal capitalization rates, were within an observable market range.
Evaluation of purchase price allocation of real estate acquisitions
As described in Note 2 and 19 to the consolidated financial statements, the transaction consideration exchanged in the Company’s real estate acquisitions during 2022 amounted to $94.8 million. The transactions were accounted for as asset acquisitions and resulted in the Company recording approximately $9.9 million of land and land improvements, approximately $83.6 million of building and improvements and approximately $1.3 million of other net assets and assumed liabilities. Management allocates the purchase price in an asset acquisition to the assets acquired and liabilities assumed based upon their estimated relative fair values at the date of the acquisition.
We identified the allocation of the purchase price to the assets acquired and liabilities assumed in the asset acquisitions referred to above as a critical audit matter because of the significant judgments made by management when determining the estimates of fair value of certain assets acquired. Auditing management’s estimates and judgments involved a high degree of auditor judgment and increased audit effort, including the use of valuation specialists, due to the impact these estimates have on the allocation of the purchase price.
Our audit procedures related to the allocation of the purchase price to the assets acquired and liabilities assumed in the asset acquisitions referred to above included the following, among others:
| ● | We obtained and read the purchase agreements. |
| ● | We tested the underlying data used in management’s fair value estimates for completeness and accuracy and agreed the inputs to source documents. |
| ● | We utilized valuation specialists to assist in performing the following procedures: |
| o | Evaluated the appropriateness of the valuation methodology utilized by management to estimate fair value. |
| o | Obtained independently sourced market data for certain significant assumptions, including comparable land sales, market rent, discount rates and capitalization rates, among others, and compared them to management’s estimates. |
| o | Assessed the reasonableness and recalculated management’s allocation of the purchase price to the assets acquired and liabilities assumed. |
52
/s/ RSM US LLP
We have served as the Company’s auditor since 2021.
Minneapolis, Minnesota
March 15, 2023
PCAOB ID: 49
53
Report of Independent Registered Public Accounting Firm
To the Shareholders, the Audit and Disclosure Committee, and the Board of Trustees of Sterling Real Estate Trust:
Opinion on the Financial Statements
We have audited the accompanying consolidated statements of operations and other comprehensive income, shareholders’ equity and cash flows of Sterling Real Estate Trust (the "Company") for the year ended December 31, 2020, and the related notes and financial statement schedule listed in the Index at Item 15(a) (collectively referred to as the “financial statements”). In our opinion, the financial statements present fairly, in all material respects, the results of its operations and its cash flows for the year ended December 31, 2020, in conformity with accounting principles generally accepted in the United States of America.
Basis for Opinion
These financial statements are the responsibility of the Company’s management. Our responsibility is to express an opinion on the Company’s financial statements based on our audits.audit. We are a public accounting firm registered with the Public Company Accounting Oversight Board (United States) ("PCAOB") and are required to be independent with respect to the Company in accordance with the U.S. federal securities laws and the applicable rules and regulations of the Securities and Exchange Commission and the PCAOB.
We conducted our auditsaudit in accordance with the standards of the PCAOB. Those standards require that we plan and perform the audit to obtain reasonable assurance about whether the consolidated financial statements are free of material misstatement, whether due to error or fraud and whether effective internal control over financial reporting was maintained in all material respects.
71
fraud. Our audits of the financial statementsaudit included performing procedures to assess the risks of material misstatement of the consolidated financial statements, whether due to error or fraud, and performing procedures that respond to those risks. Such procedures included examining, on a test basis, evidence regarding the amounts and disclosures in the consolidated financial statements. Our auditsaudit also included evaluating the accounting principles used and significant estimates made by management, as well as evaluating the overall presentation of the consolidated financial statements. Our audit of internal control over financial reporting included obtaining an understanding of internal control over financial reporting, assessing the risk that a material weakness exists, and testing and evaluating the design and operating effectiveness of internal control based on the assessed risk. Our audits also included performing such other procedures as we considered necessary in the circumstances. We believe that our audits provideaudit provides a reasonable basis for our opinion.
Definition and Limitations of Internal Control Over Financial Reporting
A company's internal control over financial reporting is a process designed to provide reasonable assurance regarding the reliability of financial reporting and the preparation of financial statements for external purposes in accordance with generally accepted accounting principles. A company's internal control over financial reporting includes those policies and procedures that (1) pertain to the maintenance of records that, in reasonable detail, accurately and fairly reflect the transactions and dispositions of the assets of the company; (2) provide reasonable assurance that transactions are recorded as necessary to permit preparation of financial statements in accordance with generally accepted accounting principles, and that receipts and expenditures of the company are being made only in accordance with authorizations of management and directors of the company; and (3) provide reasonable assurance regarding prevention or timely detection of unauthorized acquisition, use, or disposition of the company's assets that could have a material effect on the financial statements.
Because of its inherent limitations, internal control over financial reporting may not prevent or detect misstatements. Also, projections of any evaluation of effectiveness to future periods are subject to the risk that controls may become inadequate because of changes in conditions, or that the degree of compliance with the policies or procedures may deteriorate.
/s/ Baker Tilly Virchow Krause,US, LLP
Chicago, IL
We have served as the Company'sCompany’s auditor since 2013.from 2013 until 2021.
Chicago, Illinois
March 15, 201831, 2021
72
54
PART I – FINANCIAL INFORMATION
Item 1. Financial StatementsItem
STERLING REAL ESTATE TRUST AND SUBSIDIARIES
CONSOLIDATED BALANCE SHEETS
as of December 31, 20172022 and 20162021
| | | | | | |
| | December 31, | | December 31, | ||
|
| 2022 |
| 2021 | ||
| | (in thousands) | ||||
ASSETS | | | | | | |
Real estate investments | | | | | | |
Land and land improvements | | $ | 129,682 | | $ | 125,338 |
Building and improvements | | | 834,356 | | | 763,003 |
Construction in progress | | | 7,110 | | | 8,361 |
Real estate investments | | | 971,148 | | | 896,702 |
Less accumulated depreciation | | | (194,849) | | | (179,155) |
Real estate investments, net | | | 776,299 | | | 717,547 |
Cash and cash equivalents | | | 3,257 | | | 51,507 |
Restricted deposits | | | 9,323 | | | 9,149 |
Investment in securities | | | 29,371 | | | — |
Investment in unconsolidated affiliates | | | 29,423 | | | 18,658 |
Notes receivable | | | 8,448 | | | 7,457 |
Lease intangible assets, less accumulated amortization | | | 5,290 | | | 6,246 |
Other assets, net | | | 27,312 | | | 10,302 |
| | | | | | |
Total Assets | | $ | 888,723 | | $ | 820,866 |
| | | | | | |
LIABILITIES | | | | | | |
Mortgage notes payable, net | | $ | 506,167 | | $ | 493,142 |
Notes payable | | | 26,500 | | | — |
Lines of credit | | | 1,008 | | | — |
Dividends payable | | | 8,493 | | | 7,567 |
Tenant security deposits payable | | | 6,368 | | | 5,225 |
Lease intangible liabilities, less accumulated amortization | | | 646 | | | 811 |
Accrued expenses and other liabilities | | | 16,075 | | | 18,604 |
Total Liabilities | | | 565,257 | | | 525,349 |
| | | | | | |
COMMITMENTS and CONTINGENCIES - Note 17 | | | | | | |
| | | | | | |
SHAREHOLDERS' EQUITY | | | | | | |
Beneficial interest | | | 123,996 | | | 116,856 |
Noncontrolling interest | | | | | | |
Operating partnership | | | 183,048 | | | 176,954 |
Partially owned properties | | | 2,640 | | | 2,657 |
Accumulated other comprehensive income (loss) | | | 13,782 | | | (950) |
Total Shareholders' Equity | | | 323,466 | | | 295,517 |
| | | | | | |
| | $ | 888,723 | | $ | 820,866 |
See Notes to Consolidated Financial Statements
55
STERLING REAL ESTATE TRUST AND SUBSIDIARIES
CONSOLIDATED STATEMENTS OF OPERATIONS AND OTHER COMPREHENSIVE INCOME
FOR THE YEARS ENDED DECEMBER 31, 2022, 2021 and 2020
|
|
|
|
|
|
|
|
| December 31, |
| December 31, | ||
|
| 2017 |
| 2016 | ||
|
| (in thousands) | ||||
ASSETS |
|
|
|
|
|
|
Real estate investments |
| $ | 648,677 |
| $ | 622,975 |
Cash and cash equivalents |
|
| 12,490 |
|
| 12,034 |
Restricted deposits and funded reserves |
|
| 8,063 |
|
| 7,213 |
Investment in unconsolidated affiliates |
|
| 2,772 |
|
| 3,653 |
Due from related party |
|
| 3 |
|
| 34 |
Receivables |
|
| 5,113 |
|
| 4,258 |
Prepaid expenses |
|
| 482 |
|
| 433 |
Notes receivable |
|
| — |
|
| 600 |
Financing and lease costs, less accumulated amortization of $1,943 in 2017 and $1,720 in 2016 |
|
| 737 |
|
| 950 |
Assets held for sale |
|
| — |
|
| 2,482 |
Lease intangible assets, less accumulated amortization of $12,932 in 2017 and $10,770 in 2016 |
|
| 13,263 |
|
| 15,852 |
Other assets |
|
| 5 |
|
| 29 |
|
|
|
|
|
|
|
Total Assets |
| $ | 691,605 |
| $ | 670,513 |
|
|
|
|
|
|
|
LIABILITIES |
|
|
|
|
|
|
Mortgage notes payable, net |
| $ | 394,843 |
| $ | 390,479 |
Special assessments payable |
|
| 518 |
|
| 480 |
Dividends payable |
|
| 6,436 |
|
| 5,925 |
Due to related party |
|
| 366 |
|
| 957 |
Tenant security deposits payable |
|
| 4,038 |
|
| 3,851 |
Subordinated debt |
|
| 175 |
|
| 175 |
Lease intangible liabilities, less accumulated amortization of $1,386 in 2017 and $1,122 in 2016 |
|
| 1,776 |
|
| 2,075 |
Accounts payable - trade |
|
| 486 |
|
| 438 |
Retainage payable |
|
| 16 |
|
| 288 |
Liabilities related to assets held for sale |
|
| — |
|
| 125 |
Fair value of interest rate swaps |
|
| 65 |
|
| 145 |
Deferred insurance proceeds |
|
| 1,216 |
|
| 102 |
Accrued expenses and other liabilities |
|
| 7,895 |
|
| 6,818 |
Total Liabilities |
|
| 417,830 |
|
| 411,858 |
|
|
|
|
|
|
|
COMMITMENTS and CONTINGENCIES - Note 18 |
|
|
|
|
|
|
|
|
|
|
|
|
|
SHAREHOLDERS' EQUITY |
|
|
|
|
|
|
Beneficial interest |
|
| 90,816 |
|
| 84,727 |
Noncontrolling interest |
|
|
|
|
|
|
Operating partnership |
|
| 179,844 |
|
| 170,138 |
Partially owned properties |
|
| 3,180 |
|
| 3,935 |
Accumulated other comprehensive loss |
|
| (65) |
|
| (145) |
Total Shareholders' Equity |
|
| 273,775 |
|
| 258,655 |
|
|
|
|
|
|
|
|
| $ | 691,605 |
| $ | 670,513 |
| | | | | | | | |
| Year Ended | |||||||
| December 31, | |||||||
| 2022 |
| 2021 |
| 2020 | |||
| (in thousands, except per share data) | |||||||
Income from rental operations | | | | | ||||
Real estate rental income | $ | 135,060 | | $ | 129,324 | | $ | 124,616 |
Expenses | | | | | | | | |
Expenses from rental operations | | | | | | | | |
Operating expenses | | 56,893 | | | 51,063 | | | 47,071 |
Real estate taxes | | 14,245 | | | 13,706 | | | 12,498 |
Depreciation and amortization | | 24,679 | | | 22,203 | | | 21,214 |
Interest | | 19,994 | | | 18,142 | | | 17,097 |
| | 115,811 | | | 105,114 | | | 97,880 |
Loss on impairment of property | | 561 | | | — | | | — |
Administration of REIT | | 5,247 | | | 4,381 | | | 4,217 |
Total expenses | | 121,619 | | | 109,495 | | | 102,097 |
Income from operations | | 13,441 | | | 19,829 | | | 22,519 |
| | | | | | | | |
Other income | | | | | | | | |
Equity in (losses) gains of unconsolidated affiliates | | (2,339) | | | (261) | | | 263 |
Other income | | 1,293 | | | 1,935 | | | 455 |
Gain on sale or conversion of real estate investments | | 11,090 | | | 1,710 | | | 3,383 |
Gain on involuntary conversion | | 1,047 | | | 1,225 | | | 360 |
Total other income | | 11,091 | | | 4,609 | | | 4,461 |
Net income | $ | 24,532 | | $ | 24,438 | | $ | 26,980 |
Net income attributable to noncontrolling interest: | | | | | | | | |
Operating partnership | | 15,628 | | | 15,783 | | | 17,645 |
Partially owned properties | | (17) | | | (139) | | | (70) |
Net income attributable to Sterling Real Estate Trust | $ | 8,921 | | $ | 8,794 | | $ | 9,405 |
| | | | | | | | |
Net income attributable to Sterling Real Estate Trust per common share, basic and diluted | $ | 0.84 | | $ | 0.87 | | $ | 0.97 |
| | | | | | | | |
Comprehensive income: | | | | | | | | |
Net income | $ | 24,532 | | $ | 24,438 | | $ | 26,980 |
Other comprehensive gain (loss) - change in fair value of interest rate swaps | | 14,732 | | | 855 | | | (1,842) |
Comprehensive income | | 39,264 | | | 25,293 | | | 25,138 |
Comprehensive income attributable to noncontrolling interest | | 24,989 | | | 16,193 | | | 16,373 |
Comprehensive income attributable to Sterling Real Estate Trust | $ | 14,275 | | $ | 9,100 | | $ | 8,765 |
| | | | | | | | |
Weighted average common shares outstanding, basic and diluted | | 10,632 | | | 10,160 | | | 9,694 |
See Notes to Consolidated Financial Statements
73
56
STERLING REAL ESTATE TRUST AND SUBSIDIARIES
CONSOLIDATED STATEMENTS OF OPERATIONS AND OTHER COMPREHENSIVE INCOME
FOR THE YEARS ENDED DECEMBER 31,, 2017, 2016 and 2015 2022, 2021 AND 2020
| | | | | | | | | | | | | | | | | | | | | | | |
| | | | | | Accumulated | | | | Noncontrolling | | | | | | ||||||||
| | | | | | | Distributions | | Total | | Interest | | Accumulated | | | | |||||||
| | Common | | Paid-in | | in Excess of | | Beneficial | | Operating | | Partially Owned | | Comprehensive | | | | ||||||
|
| Shares |
| Capital |
| Earnings |
| Interest |
| Partnership |
| Properties |
| Income (Loss) |
| Total | |||||||
| | (in thousands) | |||||||||||||||||||||
BALANCE AT DECEMBER 31, 2019 | | 9,436 | | $ | 131,261 | | $ | (28,888) | | $ | 102,373 | | $ | 174,221 | | $ | 2,416 | | $ | 37 | | $ | 279,047 |
Shares issued under trustee compensation plan | | 3 | | | 64 | | | — | | | 64 | | | — | | | — | | | — | | | 64 |
Contribution of assets in exchange for the issuance of noncontrolling interest shares | | — | | | — | | | — | | | — | | | 10,293 | | | — | | | — | | | 10,293 |
Shares/units redeemed | | (127) | | | (2,321) | | | — | | | (2,321) | | | (1,216) | | | — | | | — | | | (3,537) |
Dividends and distributions declared | | — | | | — | | | (10,256) | | | (10,256) | | | (19,322) | | | — | | | — | | | (29,578) |
Dividends reinvested - stock dividend | | 356 | | | 6,511 | | | — | | | 6,511 | | | — | | | — | | | — | | | 6,511 |
Issuance of shares under optional purchase plan | | 187 | | | 3,590 | | | — | | | 3,590 | | | — | | | — | | | — | | | 3,590 |
Change in fair value of interest rate swaps | | — | | | — | | | — | | | — | | | — | | | — | | | (1,842) | | | (1,842) |
Net income | | — | | | — | | | 9,405 | | | 9,405 | | | 17,645 | | | (70) | | | — | | | 26,980 |
BALANCE AT DECEMBER 31, 2020 | | 9,855 | | $ | 139,105 | | $ | (29,739) | | $ | 109,366 | | $ | 181,621 | | $ | 2,346 | | $ | (1,805) | | $ | 291,528 |
Shares issued pursuant to trustee compensation plan | | 3 | | | 57 | | | — | | | 57 | | | — | | | — | | | — | | | 57 |
Contribution of assets in exchange for the issuance of noncontrolling interest shares | | — | | | — | | | — | | | — | | | 2,883 | | | — | | | — | | | 2,883 |
Shares/units redeemed | | (82) | | | (1,552) | | | — | | | (1,552) | | | (4,014) | | | — | | | — | | | (5,566) |
Dividends and distributions declared | | — | | | — | | | (10,761) | | | (10,761) | | | (19,319) | | | — | | | — | | | (30,080) |
Dividends reinvested - stock dividend | | 363 | | | 6,888 | | | — | | | 6,888 | | | — | | | — | | | — | | | 6,888 |
Issuance of shares under optional purchase plan | | 203 | | | 4,064 | | | — | | | 4,064 | | | — | | | — | | | — | | | 4,064 |
Change in fair value of interest rate swaps | | — | | | — | | | — | | | — | | | — | | | — | | | 855 | | | 855 |
Contributions from consolidated real estate entity noncontrolling interests | | — | | | — | | | — | | | — | | | — | | | 450 | | | — | | | 450 |
Net income | | — | | | — | | | 8,794 | | | 8,794 | | | 15,783 | | | (139) | | | — | | | 24,438 |
BALANCE AT DECEMBER 31, 2021 | | 10,342 | | $ | 148,562 | | $ | (31,706) | | $ | 116,856 | | $ | 176,954 | | $ | 2,657 | | $ | (950) | | $ | 295,517 |
Shares issued pursuant to trustee compensation plan | | 3 | | | 65 | | | — | | | 65 | | | — | | | — | | | — | | | 65 |
Contribution of assets in exchange for the issuance of noncontrolling interest shares | | — | | | — | | | — | | | — | | | 12,870 | | | — | | | — | | | 12,870 |
Shares/units redeemed | | (53) | | | (1,155) | | | — | | | (1,155) | | | (922) | | | — | | | — | | | (2,077) |
Dividends and distributions declared | | — | | | — | | | (12,222) | | | (12,222) | | | (21,482) | | | — | | | — | | | (33,704) |
Dividends reinvested - stock dividend | | 341 | | | 7,468 | | | — | | | 7,468 | | | — | | | — | | | — | | | 7,468 |
Issuance of shares under optional purchase plan | | 177 | | | 4,063 | | | — | | | 4,063 | | | — | | | — | | | — | | | 4,063 |
Change in fair value of interest rate swaps | | — | | | — | | | — | | | — | | | — | | | — | | | 14,732 | | | 14,732 |
Net income | | — | | | — | | | 8,921 | | | 8,921 | | | 15,628 | | | (17) | | | — | | | 24,532 |
BALANCE AT DECEMBER 31, 2022 | | 10,810 | | $ | 159,003 | | $ | (35,007) | | $ | 123,996 | | $ | 183,048 | | $ | 2,640 | | $ | 13,782 | | $ | 323,466 |
|
|
|
|
|
|
|
|
|
| Year Ended | |||||||
| December 31, | |||||||
| 2017 |
| 2016 |
| 2015 | |||
| (in thousands, except per share data) | |||||||
Income from rental operations |
|
|
|
| ||||
Real estate rental income | $ | 108,136 |
| $ | 101,885 |
| $ | 93,330 |
Tenant reimbursements |
| 6,162 |
|
| 6,178 |
|
| 3,852 |
|
| 114,298 |
|
| 108,063 |
|
| 97,182 |
Expenses |
|
|
|
|
|
|
|
|
Expenses from rental operations |
|
|
|
|
|
|
|
|
Interest |
| 18,630 |
|
| 18,366 |
|
| 17,141 |
Depreciation and amortization |
| 21,544 |
|
| 22,145 |
|
| 19,574 |
Real estate taxes |
| 11,052 |
|
| 9,524 |
|
| 7,852 |
Property management fees |
| 12,252 |
|
| 10,852 |
|
| 9,617 |
Utilities |
| 8,526 |
|
| 7,672 |
|
| 7,220 |
Repairs and maintenance |
| 21,414 |
|
| 21,267 |
|
| 17,726 |
Insurance |
| 1,498 |
|
| 1,375 |
|
| 2,292 |
Loss on lease terminations |
| 146 |
|
| 299 |
|
| — |
Loss on impairment of property |
| — |
|
| — |
|
| 412 |
|
| 95,062 |
|
| 91,500 |
|
| 81,834 |
Administration of REIT |
|
|
|
|
|
|
|
|
Administrative expenses |
| 350 |
|
| 360 |
|
| 338 |
Advisory fees |
| 2,830 |
|
| 2,644 |
|
| 2,401 |
Acquisition and disposition expenses |
| 1,375 |
|
| 2,081 |
|
| 2,323 |
Trustee fees |
| 56 |
|
| 59 |
|
| 51 |
Legal and accounting |
| 533 |
|
| 456 |
|
| 534 |
|
| 5,144 |
|
| 5,600 |
|
| 5,647 |
Total expenses |
| 100,206 |
|
| 97,100 |
|
| 87,481 |
Income from operations |
| 14,092 |
|
| 10,963 |
|
| 9,701 |
Other income (expense) |
|
|
|
|
|
|
|
|
Equity in income of unconsolidated affiliates |
| 1,016 |
|
| 1,019 |
|
| 957 |
Other income |
| 85 |
|
| 83 |
|
| 59 |
Gain (Loss) on sale of real estate and non-real estate investments |
| 2,049 |
|
| (321) |
|
| 470 |
Gain on change in control of real estate investments |
| 2,186 |
|
| 550 |
|
| — |
Gain on sale of investment in equity method investee |
| 3 |
|
| 597 |
|
| — |
Gain (Loss) on involuntary conversion |
| 452 |
|
| (34) |
|
| 197 |
|
| 5,791 |
|
| 1,894 |
|
| 1,683 |
Net income | $ | 19,883 |
| $ | 12,857 |
| $ | 11,384 |
Net income (loss) attributable to noncontrolling interest: |
|
|
|
|
|
|
|
|
Operating Partnership |
| 13,634 |
|
| 9,034 |
|
| 7,684 |
Partially owned properties |
| (265) |
|
| (602) |
|
| (586) |
Net income attributable to Sterling Real Estate Trust | $ | 6,514 |
| $ | 4,425 |
| $ | 4,286 |
|
|
|
|
|
|
|
|
|
Net income per common share, basic and diluted | $ | 0.78 |
| $ | 0.56 |
| $ | 0.59 |
|
|
|
|
|
|
|
|
|
Comprehensive income: |
|
|
|
|
|
|
|
|
Net income | $ | 19,883 |
| $ | 12,857 |
| $ | 11,384 |
Other comprehensive gain (loss) - change in fair value of interest rate swaps |
| 80 |
|
| 74 |
|
| 53 |
Comprehensive income |
| 19,963 |
|
| 12,931 |
|
| 11,437 |
Comprehensive income attributable to noncontrolling interest |
| 13,423 |
|
| 8,482 |
|
| 7,134 |
Comprehensive income attributable to Sterling Real Estate Trust | $ | 6,540 |
| $ | 4,449 |
| $ | 4,303 |
See Notes to Consolidated Financial Statements
7457
STERLING REAL ESTATE TRUST AND SUBSIDIARIES
CONSOLIDATED STATEMENT OF SHAREHOLDERS’ EQUITY
CONSOLIDATED STATEMENTS OF CASH FLOWS
FOR THE YEARS ENDED DECEMBER 31 2017, 2016 AND 2015, 2022, 2021 and 2020
|
|
|
|
|
|
|
|
|
|
|
|
|
|
|
|
|
|
|
|
|
|
|
|
|
|
|
|
|
| Accumulated |
|
|
| Noncontrolling |
|
|
|
|
| ||||||||
|
|
|
|
|
|
| Distributions |
| Total |
| Interest |
| Accumulated |
|
|
| |||||||
|
| Common |
| Paid-in |
| in Excess of |
| Beneficial |
| Operating |
| Partially Owned |
| Comprehensive |
|
|
| ||||||
|
| Shares |
| Capital |
| Earnings |
| Interest |
| Partnership |
| Properties |
| Income (Loss) |
| Total | |||||||
|
| (in thousands) | |||||||||||||||||||||
BALANCE AT DECEMBER 31, 2014 |
| 5,624 |
| $ | 69,756 |
| $ | (14,444) |
| $ | 55,312 |
| $ | 150,594 |
| $ | — |
| $ | (272) |
| $ | 205,634 |
Issuance of common shares |
| 1,677 |
|
| 25,750 |
|
|
|
|
| 25,750 |
|
|
|
|
|
|
|
|
|
|
| 25,750 |
Shares issued under trustee compensation plan |
| 4 |
|
| 56 |
|
|
|
|
| 56 |
|
|
|
|
|
|
|
|
|
|
| 56 |
Contribution of assets in exchange for the issuance of noncontrolling interest shares |
|
|
|
|
|
|
|
|
|
|
|
|
| 11,228 |
|
| — |
|
|
|
|
| 11,228 |
Shares/units redeemed |
| (132) |
|
| (1,915) |
|
|
|
|
| (1,915) |
|
| (633) |
|
| — |
|
|
|
|
| (2,548) |
Dividends declared |
|
|
|
|
|
|
| (6,885) |
|
| (6,885) |
|
| (13,976) |
|
| — |
|
|
|
|
| (20,861) |
Dividends reinvested - stock dividend |
| 284 |
|
| 4,160 |
|
|
|
|
| 4,160 |
|
|
|
|
|
|
|
|
|
|
| 4,160 |
Issuance of shares under optional purchase plan |
| 116 |
|
| 1,783 |
|
|
|
|
| 1,783 |
|
|
|
|
|
|
|
|
|
|
| 1,783 |
UPREIT units converted to REIT common shares |
| 6 |
|
| 87 |
|
|
|
|
| 87 |
|
| (87) |
|
| — |
|
|
|
|
| — |
Syndication costs |
|
|
|
|
|
|
| (1,335) |
|
| (1,335) |
|
| — |
|
| — |
|
|
|
|
| (1,335) |
Change in fair value of interest rate swaps |
|
|
|
|
|
|
|
|
|
|
|
|
|
|
|
|
|
|
| 53 |
|
| 53 |
Contributions from consolidated real estate entity noncontrolling interests |
|
|
|
|
|
|
|
|
|
|
|
|
|
|
|
| 5,123 |
|
| — |
|
| 5,123 |
Net income |
|
|
|
|
|
|
| 4,286 |
|
| 4,286 |
|
| 7,684 |
|
| (586) |
|
|
|
|
| 11,384 |
BALANCE AT DECEMBER 31, 2015 |
| 7,579 |
| $ | 99,677 |
| $ | (18,378) |
| $ | 81,299 |
| $ | 154,810 |
| $ | 4,537 |
| $ | (219) |
| $ | 240,427 |
Shares issued pursuant to trustee compensation plan |
| 4 |
|
| 60 |
|
|
|
|
| 60 |
|
|
|
|
|
|
|
|
|
|
| 60 |
Contribution of assets in exchange for the issuance of noncontrolling interest shares |
|
|
|
|
|
|
|
|
|
|
|
|
| 23,468 |
|
| — |
|
|
|
|
| 23,468 |
Shares/units redeemed |
| (80) |
|
| (1,194) |
|
|
|
|
| (1,194) |
|
| (868) |
|
| — |
|
|
|
|
| (2,062) |
Dividends declared |
|
|
|
|
|
|
| (7,527) |
|
| (7,527) |
|
| (15,552) |
|
| — |
|
|
|
|
| (23,079) |
Dividends reinvested - stock dividend |
| 315 |
|
| 4,760 |
|
|
|
|
| 4,760 |
|
|
|
|
|
|
|
|
|
|
| 4,760 |
Issuance of shares under optional purchase plan |
| 136 |
|
| 2,150 |
|
|
|
|
| 2,150 |
|
|
|
|
|
|
|
|
|
|
| 2,150 |
UPREIT units converted to REIT common shares |
| 47 |
|
| 754 |
|
|
|
|
| 754 |
|
| (754) |
|
| — |
|
|
|
|
| — |
Change in fair value of interest rate swaps |
|
|
|
|
|
|
|
|
|
|
|
|
|
|
|
|
|
|
| 74 |
|
| 74 |
Net income |
|
|
|
|
|
|
| 4,425 |
|
| 4,425 |
|
| 9,034 |
|
| (602) |
|
|
|
|
| 12,857 |
BALANCE AT DECEMBER 31, 2016 |
| 8,001 |
| $ | 106,207 |
| $ | (21,480) |
| $ | 84,727 |
| $ | 170,138 |
| $ | 3,935 |
| $ | (145) |
| $ | 258,655 |
Shares issued pursuant to trustee compensation plan |
| 4 |
|
| 59 |
|
|
|
|
| 59 |
|
|
|
|
|
|
|
|
|
|
| 59 |
Contribution of assets in exchange for the issuance of noncontrolling interest shares |
|
|
|
|
|
|
|
|
|
|
|
|
| 14,733 |
|
| — |
|
|
|
|
| 14,733 |
Shares/units redeemed |
| (72) |
|
| (1,110) |
|
|
|
|
| (1,110) |
|
| (1,284) |
|
| — |
|
|
|
|
| (2,394) |
Dividends declared |
|
|
|
|
|
|
| (8,212) |
|
| (8,212) |
|
| (17,244) |
|
| — |
|
|
|
|
| (25,456) |
Dividends reinvested - stock dividend |
| 331 |
|
| 5,163 |
|
|
|
|
| 5,163 |
|
|
|
|
|
|
|
|
|
|
| 5,163 |
Issuance of shares under optional purchase plan |
| 216 |
|
| 3,543 |
|
|
|
|
| 3,543 |
|
|
|
|
|
|
|
|
|
|
| 3,543 |
UPREIT units converted to REIT common shares |
| 8 |
|
| 133 |
|
|
|
|
| 133 |
|
| (133) |
|
| — |
|
|
|
|
| — |
Change in fair value of interest rate swaps |
|
|
|
|
|
|
|
|
|
|
|
|
|
|
|
|
|
|
| 80 |
|
| 80 |
Distributions paid to consolidated real estate entity noncontrolling interests |
|
|
|
|
|
|
|
|
|
|
|
|
| — |
|
| (490) |
|
|
|
|
| (490) |
Net income |
|
|
|
|
|
|
| 6,514 |
|
| 6,514 |
|
| 13,634 |
|
| (265) |
|
|
|
|
| 19,883 |
BALANCE AT DECEMBER 31, 2017 |
| 8,488 |
| $ | 113,995 |
| $ | (23,179) |
| $ | 90,816 |
| $ | 179,844 |
| $ | 3,180 |
| $ | (65) |
| $ | 273,775 |
| | | | | | | | | |
| | Year Ended | |||||||
| | December 31, | |||||||
|
| 2022 |
| 2021 |
| 2020 | |||
| | (in thousands) | |||||||
OPERATING ACTIVITIES | | | | | | | | | |
Net income | | $ | 24,532 | | $ | 24,438 | | $ | 26,980 |
Adjustments to reconcile net income to net cash provided by operating activities | | | | | | | | | |
Gain on sale or conversion of real estate investments | | | (11,090) | | | (1,710) | | | (3,383) |
Loss on impairment of property | | | 561 | | | — | | | |
Gain on involuntary conversion | | | (1,047) | | | (1,225) | | | (360) |
Change in fair value of securities | | | (322) | | | — | | | |
Equity in loss (gain) of unconsolidated affiliates | | | 2,339 | | | 261 | | | (263) |
Distributions of earnings of unconsolidated affiliates | | | 261 | | | 233 | | | 361 |
Allowance for uncollectible accounts receivable | | | (281) | | | (667) | | | 540 |
Depreciation | | | 22,161 | | | 20,918 | | | 19,770 |
Amortization | | | 2,518 | | | 1,285 | | | 1,418 |
Amortization of debt issuance costs | | | 675 | | | 608 | | | 634 |
Effects on operating cash flows due to changes in | | | | | | | | | |
Other assets | | | (209) | | | 807 | | | (177) |
Tenant security deposits payable | | | 1,143 | | | 349 | | | 328 |
Accrued expenses and other liabilities | | | (471) | | | (242) | | | (1,159) |
NET CASH PROVIDED BY OPERATING ACTIVITIES | | | 40,770 | | | 45,055 | | | 44,689 |
INVESTING ACTIVITIES | | | | | | | | | |
Gross purchase of securities | | | (29,130) | | | - | | | - |
Proceeds from maturity of securities | | | 81 | | | - | | | - |
Purchase of real estate investment properties | | | (81,974) | | | (35,915) | | | (13,377) |
Capital expenditures and tenant improvements | | | (9,623) | | | (18,007) | | | (31,136) |
Proceeds from sale of real estate investments and non-real estate investments | | | 25,463 | | | 5,610 | | | 12,502 |
Proceeds from involuntary conversion | | | 1,579 | | | 4,095 | | | 1,288 |
Investment in unconsolidated affiliates | | | (13,869) | | | (9,493) | | | (2,264) |
Distributions in excess of earnings received from unconsolidated affiliates | | | 504 | | | — | | | 422 |
Notes receivable issued net of payments received | | | (991) | | | (5,431) | | | (726) |
NET CASH USED IN INVESTING ACTIVITIES | | | (107,960) | | | (59,141) | | | (33,291) |
FINANCING ACTIVITIES | | | | | | | | | |
Payments for financing, debt issuance | | | (408) | | | (1,283) | | | (484) |
Payments on investment certificates and subordinated debt | | | — | | | (25) | | | (100) |
Principal payments on special assessments payable | | | — | | | — | | | (498) |
Proceeds from issuance of mortgage notes payable and subordinated debt | | | 37,569 | | | 116,180 | | | 71,175 |
Principal payments on mortgage notes payable | | | (22,231) | | | (43,641) | | | (48,553) |
Advances on lines of credit | | | 1,008 | | | 818,689 | | | 30,964 |
Payments on lines of credit | | | — | | | (818,689) | | | (30,964) |
Proceeds from notes payable | | | 26,500 | | | — | | | — |
Proceeds from issuance of shares under optional purchase plan | | | 4,063 | | | 4,064 | | | 3,590 |
Shares/units redeemed | | | (2,077) | | | (5,566) | | | (3,537) |
Dividends/distributions paid | | | (25,310) | | | (22,622) | | | (22,738) |
NET CASH PROVIDED (USED) BY FINANCING ACTIVITIES | | | 19,114 | | | 47,107 | | | (1,145) |
NET CHANGE IN CASH AND CASH EQUIVALENTS AND RESTRICTED DEPOSITS | | | (48,076) | | | 33,021 | | | 10,253 |
CASH AND CASH EQUIVALENTS AND RESTRICTED DEPOSITS AT BEGINNING OF PERIOD | | | 60,656 | | | 27,635 | | | 17,382 |
CASH AND CASH EQUIVALENTS AND RESTRICTED DEPOSITS AT END OF PERIOD | | $ | 12,580 | | $ | 60,656 | | $ | 27,635 |
| | | | | | | | | |
CASH AND CASH EQUIVALENTS AND RESTRICTED DEPOSITS AT END OF PERIOD | | | | | | | | | |
Cash and cash equivalents | | $ | 3,257 | | $ | 51,507 | | $ | 11,716 |
Restricted deposits | | | 9,323 | | | 9,149 | | | 15,919 |
TOTAL CASH AND CASH EQUIVALENTS AND RESTRICTED DEPOSITS, END OF PERIOD | | $ | 12,580 | | $ | 60,656 | | $ | 27,635 |
See Notes to Consolidated Financial Statements
75
58
STERLING REAL ESTATE TRUST AND SUBSIDIARIES
CONSOLIDATED STATEMENTS OF CASH FLOWS
FOR THE YEARS ENDED DECEMBER 31,, 2017, 2016 2022, 2021 and 20152020 (Continued)
| | | | | | | | | |
| | Year Ended | |||||||
| | December 31, | |||||||
|
| 2022 |
| 2021 |
| 2020 | |||
| | (in thousands) | |||||||
SCHEDULE OF CASH FLOW INFORMATION | | | | | | | | | |
Cash paid during the period for interest, net of capitalized interest | | $ | 19,305 | | $ | 17,332 | | $ | 16,491 |
| | | | | | | | | |
SUPPLEMENTARY SCHEDULE OF NONCASH INVESTING AND FINANCING ACTIVITIES | | | | | | | | | |
Dividends reinvested | | $ | 7,468 | | $ | 6,888 | | $ | 6,511 |
Dividends declared and not paid | | | 3,108 | | | 2,740 | | | 2,608 |
UPREIT distributions declared and not paid | | | 5,385 | | | 4,827 | | | 4,838 |
Shares issued pursuant to trustee compensation plan | | | 65 | | | 57 | | | 64 |
Acquisition of assets in exchange for the issuance of noncontrolling interest units in UPREIT | | | 12,870 | | | 2,883 | | | 10,293 |
Increase in land improvements due to increase in special assessments payable | | | 219 | | | 235 | | | 231 |
Unrealized gain (loss) on interest rate swaps | | | 14,732 | | | 855 | | | (1,842) |
Acquisition of assets through assumption of debt and liabilities | | | 406 | | | 569 | | | 6,193 |
Capitalized interest and real estate taxes related to construction in progress | | | 91 | | | 250 | | | 644 |
|
|
|
|
|
|
|
|
|
|
|
| Year Ended | |||||||
|
| December 31, | |||||||
|
| 2017 |
| 2016 |
| 2015 | |||
|
| (in thousands) | |||||||
OPERATING ACTIVITIES |
|
|
|
|
|
|
|
|
|
Net income |
| $ | 19,883 |
| $ | 12,857 |
| $ | 11,384 |
Adjustments to reconcile net income to net cash from operating activities |
|
|
|
|
|
|
|
|
|
(Gain) loss on sale of real estate investments |
|
| (2,072) |
|
| 316 |
|
| (470) |
Loss on sale of non-real estate investments |
|
| 23 |
|
| 4 |
|
| — |
(Gain) on change in control of real estate investment |
|
| (2,186) |
|
| (550) |
|
| — |
(Gain) on sale of joint venture interest |
|
| — |
|
| (597) |
|
| — |
(Gain) loss on involuntary conversion |
|
| (452) |
|
| 34 |
|
| (197) |
Loss on impairment of real estate investment |
|
| — |
|
| — |
|
| 412 |
Loss on lease terminations |
|
| 146 |
|
| 299 |
|
| — |
Equity in income of unconsolidated affiliates |
|
| (1,016) |
|
| (1,019) |
|
| (957) |
Distributions of earnings of unconsolidated affiliates |
|
| 1,016 |
|
| 1,014 |
|
| 900 |
Depreciation |
|
| 19,057 |
|
| 18,507 |
|
| 16,466 |
Amortization |
|
| 2,429 |
|
| 3,539 |
|
| 3,076 |
Amortization of debt issuance costs |
|
| 769 |
|
| 694 |
|
| 666 |
Effects on operating cash flows due to changes in |
|
|
|
|
|
|
|
|
|
Restricted deposits - tenant security deposits |
|
| (137) |
|
| (120) |
|
| (1,169) |
Restricted deposits - real estate tax and insurance escrows |
|
| 256 |
|
| (159) |
|
| 330 |
Due from related party |
|
| 31 |
|
| 26 |
|
| 49 |
Receivables |
|
| (446) |
|
| (474) |
|
| (475) |
Prepaid expenses |
|
| (50) |
|
| 411 |
|
| 737 |
Other assets |
|
| 24 |
|
| 111 |
|
| (64) |
Due to related party |
|
| (532) |
|
| 179 |
|
| (2,037) |
Tenant security deposits payable |
|
| 149 |
|
| 103 |
|
| 159 |
Accounts payable - trade |
|
| (164) |
|
| (432) |
|
| (815) |
Accrued expenses and other liabilities |
|
| 869 |
|
| (24) |
|
| 320 |
NET CASH PROVIDED BY OPERATING ACTIVITIES |
|
| 37,597 |
|
| 34,719 |
|
| 28,315 |
INVESTING ACTIVITIES |
|
|
|
|
|
|
|
|
|
Purchase of real estate investment properties |
|
| (4,599) |
|
| (9,745) |
|
| (23,480) |
Capital expenditures and tenant improvements |
|
| (11,047) |
|
| (10,848) |
|
| (5,759) |
Proceeds from sale of real estate investments and non-real estate investments |
|
| 4,442 |
|
| 1,409 |
|
| 1,424 |
Restricted deposits - exchange escrow |
|
| (4,278) |
|
| — |
|
| — |
Proceeds from involuntary conversion |
|
| 1,940 |
|
| 973 |
|
| 529 |
Proceeds from sale of joint venture interest |
|
| — |
|
| 2,600 |
|
| — |
Investment in unconsolidated affiliates |
|
| (294) |
|
| (67) |
|
| (37) |
Distributions in excess of earnings received from unconsolidated affiliates |
|
| 92 |
|
| 542 |
|
| 152 |
Restricted deposits - replacement reserve escrows |
|
| (863) |
|
| (841) |
|
| 1,456 |
Notes receivable issued |
|
| — |
|
| — |
|
| (51) |
Notes receivable payments received |
|
| 642 |
|
| 9 |
|
| — |
NET CASH USED IN INVESTING ACTIVITIES |
|
| (13,965) |
|
| (15,968) |
|
| (25,766) |
FINANCING ACTIVITIES |
|
|
|
|
|
|
|
|
|
Payments for financing, debt issuance and lease costs |
|
| (486) |
|
| (446) |
|
| (1,938) |
Payments on investment certificates and subordinated debt |
|
| — |
|
| (50) |
|
| (319) |
Principal payments on special assessments payable |
|
| (1,275) |
|
| (1,984) |
|
| (117) |
Proceeds from issuance of mortgage notes payable and subordinated debt |
|
| 23,916 |
|
| 20,271 |
|
| 36,385 |
Principal payments on mortgage notes payable |
|
| (26,208) |
|
| (13,345) |
|
| (27,160) |
Advances on lines of credit |
|
| — |
|
| 6,669 |
|
| 16,305 |
Payments on lines of credit |
|
| — |
|
| (6,669) |
|
| (32,725) |
Proceeds from contributions received from noncontrolling interest - partially owned properties |
|
| — |
|
| — |
|
| 5,123 |
Proceeds from issuance of common shares |
|
| — |
|
| — |
|
| 25,750 |
Proceeds from issuance of shares under optional purchase plan |
|
| 3,543 |
|
| 2,150 |
|
| 1,783 |
Shares/units redeemed |
|
| (2,394) |
|
| (2,062) |
|
| (2,548) |
Dividends/distributions paid |
|
| (20,272) |
|
| (17,712) |
|
| (15,935) |
Payment of syndication costs |
|
| — |
|
| — |
|
| (1,335) |
NET CASH USED IN FINANCING ACTIVITIES |
|
| (23,176) |
|
| (13,178) |
|
| 3,269 |
NET CHANGE IN CASH AND CASH EQUIVALENTS |
|
| 456 |
|
| 5,573 |
|
| 5,818 |
CASH AND CASH EQUIVALENTS AT BEGINNING OF PERIOD |
|
| 12,034 |
|
| 6,461 |
|
| 643 |
CASH AND CASH EQUIVALENTS AT END OF PERIOD |
| $ | 12,490 |
| $ | 12,034 |
| $ | 6,461 |
See Notes to Consolidated Financial StatementsStatements
76
59
STERLING REAL ESTATE TRUST AND SUBSIDIARIES
CONSOLIDATED STATEMENTS OF CASH FLOWS
FOR THE YEARS ENDED DECEMBER 31, 2017, 2016 and 2015 (Continued)
|
|
|
|
|
|
|
|
|
|
|
| Year Ended | |||||||
|
| December 31, | |||||||
|
| 2017 |
| 2016 |
| 2015 | |||
|
| (in thousands) | |||||||
SCHEDULE OF CASH FLOW INFORMATION |
|
|
|
|
|
|
|
| |
Cash paid during the period for interest, net of capitalized interest |
| $ | 18,615 |
| $ | 18,319 |
| $ | 16,249 |
|
|
|
|
|
|
|
|
|
|
SUPPLEMENTARY SCHEDULE OF NONCASH INVESTING AND FINANCING ACTIVITIES |
|
|
|
|
|
|
|
|
|
Dividends reinvested |
| $ | 5,163 |
| $ | 4,760 |
| $ | 4,160 |
Dividends declared and not paid |
|
| 2,101 |
|
| 1,920 |
|
| 1,762 |
UPREIT distributions declared and not paid |
|
| 4,335 |
|
| 4,005 |
|
| 3,557 |
UPREIT units converted to REIT common shares |
|
| 133 |
|
| 754 |
|
| 87 |
Shares issued pursuant to trustee compensation plan |
|
| 59 |
|
| 60 |
|
| 56 |
Acquisition of assets in exchange for the issuance of noncontrolling interest units in UPREIT |
|
| 14,733 |
|
| 23,468 |
|
| 11,228 |
Increase in land improvements due to increase in special assessments payable |
|
| 1,300 |
|
| 908 |
|
| 850 |
Unrealized gain on interest rate swaps |
|
| 80 |
|
| 74 |
|
| 53 |
Acquisition of assets with new financing |
|
| 5,052 |
|
| 2,662 |
|
| 45,830 |
Acquisition of assets through assumption of debt and liabilities |
|
| 1,427 |
|
| 78 |
|
| 2,051 |
Capitalized interest and real estate taxes related to construction in progress |
|
| 142 |
|
| 136 |
|
| 71 |
Construction in progress with new financing |
|
| — |
|
| — |
|
| 3,424 |
Acquisition of assets with accounts payable |
|
| 416 |
|
| (34) |
|
| 213 |
See Notes to Consolidated Financial Statements
77
STERLING REAL ESTATE TRUST AND SUBSIDIARIES
NOTES TO CONSOLIDATED FINANCIAL STATEMENTS
DECEMBER 31, 2017, 20162022, 2021 AND 20152020
(Dollar amounts in thousands, except share and per share data)
Sterling Real Estate Trust, d/b/a Sterling Multifamily Trust (“Sterling”, “the Trust” or “the Company”) is a registered, but unincorporated business trust organized in North Dakota in December 2002. Sterling has elected to be taxed as a Real Estate Investment Trust (“REIT”) under Sections 856-860 of the Internal Revenue Code, which requires that 75% of the assets of a REIT must consist of real estate assets and that 75% of its gross income must be derived from real estate. The net income of the REIT is allocated in accordance with the stock ownership in the same fashion as a regular corporation. Code.
Sterling previously established an operating partnership (“Sterling Properties, LLLP”) and transferred all of its assets and liabilities to the operating partnership in exchange for general partnership units. As the general partner, Sterling has management responsibility for all activities of the operating partnership. As of December 31, 20172022 and 2016,2021, Sterling owned approximately 32.64%36.60% and 32.41%36.22%, respectively, of the operating partnership.
NOTE 2 – PRINCIPAL ACTIVITY AND SIGNIFICANT ACCOUNTING POLICIES
Basis of Presentation
The accompanying consolidated financial statements include the accounts of Sterling and all subsidiaries for which we maintain a controlling interest.
The accompanying consolidated financial statements have been prepared in accordance with United States Generally Accepted Accounting Principles (“U.S. GAAP”) and require management to make estimates and assumptions that affect the reported amounts of assets and liabilities at the date of the consolidated financial statements and the reported amounts of income and expenses during the reporting periods. Actual results could differ from those estimates..
Principles of Consolidation
The consolidated financial statements include the accounts of Sterling, Sterling Properties, LLLP, and wholly-ownedwholly owned limited liability companies and partially-owned limited liability companies. All significant intercompany transactions and balances have been eliminated in consolidation.
As of December 31, 2022, the Trust owned approximately 36.60% of the partnership interests (“OP Units”) of the Operating Partnership. The remaining OP Units, consisting exclusively of limited partner interests, are held by persons who contributed their interests in properties to the Operating Partnership in exchange for OP Units. Under the LLLP Agreement and the redemptions plans, these persons have the right to request the Operating Partnership redeem their OP Units following a specified restricted period. All redemptions are at the sole discretion of the Trust, acting for itself or in its capacity as General Partner of the Operating Partnership, and further subject to the conditions and limitations of the LLLP Agreement and redemption plans, as the same may be amended or modified from time to time. If the Trust accepts a redemption request, the redemption of OP Units shall be made in cash in an amount equal to the fair value of an equivalent number of common shares of the Trust. In lieu of delivering cash, however, the Trust, as the Operating Partnership’s general partner, may, at its option and in its sole and absolute discretion, choose to acquire any OP Units so tendered by issuing common shares in exchange for the tendered OP Units. If the Trust so chooses, its common shares will be exchanged for OP Units on a one-for-one basis. This one-for-one exchange ratio is subject to adjustment to prevent dilution. With each such exchange or redemption, the Trust’s percentage ownership in the Operating Partnership will increase. In addition, whenever the Trust issues common or other classes of its shares, it contributes the net proceeds it receives from the issuance to the Operating Partnership and the Operating Partnership issues to the Trust an equal number of OP Units or other partnership interests having preferences and rights that mirror the preferences and rights of the shares issued. This structure is commonly referred to as an umbrella partnership REIT or “UPREIT.”
Additionally, we evaluate the need to consolidate affiliates based on standards set forth in the Financial Accounting Standards Board (“FASB”) Accounting Standards Codification (“ASC”) 810, Consolidation (“ASC 810”). In determining whether we have a requirement to consolidate the accounts of an entity, management considers factors such as our ownership interest, our authority to make decisions and contractual and substantive participating rights of the limited partners and shareholders, as well as whether the entity is a variable interest entity (“VIE”) for which we have both: a) the power to direct the activities of the VIE that most significantly impact the entity’s economic performance, and b) the obligation to absorb losses or the right to receive benefits from the VIE that could be potentially significant to the VIE.
Principal Business Activity
Sterling currently owns directly and indirectly, 166 properties. The Trust’s 117 residential properties are located in North Dakota, Minnesota, Missouri and Nebraska and are principally multifamily apartment buildings. The Trust owns 49 commercial properties primarily located in North Dakota with others located in Arkansas, Colorado, Iowa, Louisiana, Michigan, Minnesota, Mississippi, Nebraska, Texas and Wisconsin. The commercial properties include retail, office, industrial, restaurant and medical properties. The Trust’s mix of properties is 71.0% residential
78
60
STERLING REAL ESTATE TRUST AND SUBSIDIARIES
NOTES TO CONSOLIDATED FINANCIAL STATEMENTS
DECEMBER 31, 2017, 20162022, 2021 AND 20152020
(Dollar amounts in thousands, except share and per share data)
and 29.0% commercial (based on cost) at December 31, 2017. Currently our focus
In instances where the Trust determines that it is limited to multifamily apartment properties. We currently have no plansnot the primary beneficiary of a VIE or the Trust does not control the joint venture but can exercise influence over the entity with respect to our non-multifamily apartment properties. its operations and major decisions, the Trust will use the equity method of accounting. Under the equity method, the operations of a joint venture will not be consolidated with the Trust’s operations but instead its share of operations will be reflected as equity in earnings (loss) of unconsolidated entity on its consolidated statements of operations and comprehensive loss. Additionally, the Trust’s net investment in the joint venture will be reflected as investment in unconsolidated entity on the consolidated balance sheets. See Note 5 for additional details regarding variable interest entities where the Trust uses the equity method of investing.
|
|
|
|
|
|
|
Residential Property |
| Location |
| No. of Properties |
| Units |
|
| North Dakota |
| 98 |
| 5,894 |
|
| Minnesota |
| 16 |
| 3,027 |
|
| Missouri |
| 1 |
| 164 |
|
| Nebraska |
| 2 |
| 316 |
|
|
|
| 117 |
| 9,401 |
|
|
|
|
|
|
|
Commercial Property |
| Location |
| No. of Properties |
| Sq. Ft |
|
| North Dakota |
| 20 |
| 805,000 |
|
| Arkansas |
| 2 |
| 29,000 |
|
| Colorado |
| 1 |
| 13,000 |
|
| Iowa |
| 1 |
| 33,000 |
|
| Louisiana |
| 1 |
| 15,000 |
|
| Michigan |
| 1 |
| 12,000 |
|
| Minnesota |
| 15 |
| 683,000 |
|
| Mississippi |
| 1 |
| 15,000 |
|
| Nebraska |
| 1 |
| 16,000 |
|
| Texas |
| 1 |
| 7,000 |
|
| Wisconsin |
| 5 |
| 63,000 |
|
|
|
| 49 |
| 1,691,000 |
The operating partnership meets the criteria as a variable interest entity (“VIE”). The Trust’s sole significant asset is its investment in the operating partnership. The Trust is the primary beneficiary of the Operating Partnership and accordingly consolidated the Operating Partnership. As a result, substantially all of the Trust’s assets and liabilities represent those assets and liabilities of the Operating Partnership. All of the Trust’s debt is an obligation of the Operating Partnership, and the Trust guarantees the unsecured debt obligations of the Operating Partnership. The Trust may acquire property using a reverse like-kind exchange structure (a “Reverse 1031 Like-Kind Exchange”) under the Code to defer taxable gains on the subsequent sale of real estate property. As such, the acquired property (the “Parked Property”) remains in the possession of a VIE whose legal equity interests are owned by a qualified intermediary engaged to execute the Reverse 1031 Like-Kind Exchange until the subsequent sale transaction and the Reverse 1031 Like-Kind Exchange are completed. Although the VIE is legally owned by the qualified intermediary, the Trust retains essentially all of the legal and economic benefits and obligations related to the VIE (which holds the legal title to the Parked Property prior to the completion of the Reverse 1031 Like-Kind Exchange) and, as its designated manager, has the key decision-making power over the Parked Property. The VIE (including the Parked Property) is included in the Trust’s consolidated financial statements as a consolidated VIE until legal title is transferred to the Trust upon completion of the Reverse 1031 Like-Kind Exchange.
Concentration of Credit Risk
Our cash balances are maintained in various bank deposit accounts. The bank deposit amounts in these accounts may exceed federally insured limits at various times throughout the year.
Use of Estimates
The preparation of consolidated financial statements in conformity with US GAAP requires management to make estimates and assumptions that affect the reported amounts of assets and liabilities and disclosure of contingent assets and liabilities at the date of the financial statements and the reported amounts of revenues and expenses during the reporting period. Actual results could differ from those estimates.
Real Estate Investments
Real estate investments are recorded at cost less accumulated depreciation. Ordinary repairs and maintenance are expensed as incurred.
The CompanyTrust allocates the purchase price of each acquired investment property accounted for as a business combinationan asset acquisition based upon the estimatedrelative acquisition date fair value of the individual assets acquired and liabilities assumed, which generally include (i) land, (ii) building and other improvements, (iii) in-place lease value intangibles, (iv) acquired above and below market lease intangibles, and (v) any assumed financing that is determined to be above or below market, (vi) the value of customer relationships and (vii) goodwill, if any. Transaction costs related to acquisitions accounted for as business combinationsasset acquisitions are expensedcapitalized as incurred and included within “Administrationas a cost of REIT expenses”the building in the accompanying consolidated statements of operations and other comprehensive income.balance sheet.
The Company elected to early adopt ASU 2017-01, Business Combinations, on a prospective basis as of July 1, 2017. This new guidance clarifies the definition of a business and provides a screen to determine when an integrated set of assets and activities is not considered a business and, thus, accounted for as an asset acquisition as opposed to a business combination. Refer to the “Recent Accounting Pronouncements” section within Note 2 to the consolidated financial statements. Under this new guidance, the Company expects most acquisitions of investment property will meet this screen and, thus, be accounted for as asset acquisitions. The Company allocates the purchase price of each acquired investment property that is accounted for as an asset acquisition based upon the relative fair value of the individual assets acquired and liabilities assumed, which generally include (i) land, (ii) building and other improvements, (iii) in-place lease value intangibles, (iv) acquired above and below market lease intangibles, (v) any assumed financing that is determined to be above or below market and (vi) the value of customer relationships. Asset acquisitions do not give rise to goodwill and the related transaction costs are capitalized and included with the allocated purchase price.
79
STERLING REAL ESTATE TRUST AND SUBSIDIARIES
NOTES TO CONSOLIDATED FINANCIAL STATEMENTS
DECEMBER 31, 2017, 2016 AND 2015
(Dollar amounts in thousands, except share and per share data)
For tangible assets acquired, including land, building and other improvements, the Company considers available comparable market and industry information in estimating acquisition date fair value. Key factors considered in the calculation of fair value of both real property and intangible assets include the current market rent values, “dark” periods (building in vacant status), direct costs estimated with obtaining a new tenant, discount rates, escalation factors, standard lease terms, and tenant improvement costs. The Company allocates a portion of the purchase price to the estimated acquired in-place lease value intangibles based on factors available in third party appraisals or cash flow estimates of the property prepared by our internal analysis. These estimates are based upon cash flow projections for the property, existing leases, lease origination costs for similar leases as well as lost rental payments during an assumed lease-up period. The Company also evaluates each acquired lease as compared to current market rates. If an acquired lease is determined to be above or below market, the Company allocates a portion of the purchase price to such above or below market leases based upon the present value of the difference between the contractual lease payments and estimated market rent payments over the remaining lease term. Renewal periods are included within the lease term in the calculation of above and below market lease values if, based upon factors known at the acquisition date, market participants would consider it reasonably assured that the lessee would exercise such options. Fair value estimates used in acquisition accounting, including the discount rate used, require the Company to consider various factors, including, but not limited to, market knowledge, demographics, age and physical condition of the property, geographic location, and size and location of tenant spaces within the acquired investment property.
The portion of the purchase price allocated to acquired in-place lease value intangibles is amortized on a straight-line basis over the life of the related lease as amortization expense. The Company incurred amortization expense pertaining to acquired in-place lease value intangibles of $2,253, $3,275 and $2,687 for the years ended December 31, 2017, 2016 and 2015, respectively.
The portion of the purchase price allocated to acquired above and below market lease intangibles is amortized on a straight-line basis over the life of the related lease as an adjustment to rental income. Amortization pertaining to above market lease intangibles of $226, $230 and $199 for the years ended December 31, 2017, 2016 and 2015, respectively, was recorded as a reduction to income from rental operations. Amortization pertaining to below market lease intangibles of $284, $331 and $231 for years ended December 31, 2017, 2016 and 2015, respectively, was recorded as an increase to income from rental operations.
Furniture and fixtures are stated at cost less accumulated depreciation. Expenditures for renewals and improvements that significantly add to the productive capacity or extend the useful life of an asset are capitalized. Expenditures for routine maintenance and repairs, which do not add to the value or extend useful lives, are charged to expense as incurred.
61
STERLING REAL ESTATE TRUST AND SUBSIDIARIES
NOTES TO CONSOLIDATED FINANCIAL STATEMENTS
DECEMBER 31, 2022, 2021 AND 2020
(Dollar amounts in thousands, except share and per share data)
Depreciation is provided for over the estimated useful lives of the individual assets using the straight-line method over the following estimated useful lives:
| | |
Buildings and improvements | 40 years | |
Furniture, fixtures and equipment |
| 5-9 years |
Depreciation expense for the years ended December 31, 2017, 2016 and 2015 totaled $19,057, $18,507 and $16,466 respectively.
The Company’s real estate investmentsTrust’s investment properties are reviewed for potential impairment at the end of each reporting period or whenever events or changes in circumstances indicate that the carrying value may not be recoverable. At the end of each reporting period, the CompanyTrust separately determines whether impairment indicators exist for each property.
Examples of situations considered to be impairment indicators include, but are not limited to:
| a substantial decline or negative cash flows; |
| o | continued low occupancy |
| continued difficulty in leasing space; |
| significant |
| a change in plan to sell a property prior to the end of its useful life or holding period; |
| a significant decrease in market price not in line with general market trends; and |
| any other quantitative or qualitative events or factors deemed significant by the |
80
STERLING REAL ESTATE TRUST AND SUBSIDIARIES
NOTES TO CONSOLIDATED FINANCIAL STATEMENTS
DECEMBER 31, 2017, 2016 AND 2015
(Dollar amounts in thousands, except share and per share data)
If the presence of one or more impairment indicators as described above is identified at the end of the reporting period or throughout the year with respect to a real estatean investment property, the asset is tested for recoverability by comparing its carrying value to the estimated future undiscounted cash flows. A real estateAn investment property is considered to be impaired when the estimated future undiscounted cash flows are less than its current carrying value. When performing a test for recoverability or estimating the fair value of an impaired real estate investment property, the CompanyTrust makes complex or subjective assumptions which include, but are not limited to:
| projected operating cash flows considering factors such as vacancy rates, rental rates, lease terms, tenant financial strength, demographics, holding period and property location; |
| projected capital |
| projected cash flows from the eventual disposition of an operating property using a property specific capitalization rate; |
| comparable selling prices; and |
| property specific discount rates for fair value estimates as necessary. |
To the extent impairment has occurred, the CompanyTrust will record an impairment charge calculated as the excess of the carrying value of the asset over its fair value for impairment of real estate investments.
Based on evaluation, management recorded athere were was one impairment loss on impairment of property of $412$561 during the year ended December 31, 2015.2022. There were no impairment losses during the years ended December 31, 2017 or 2016.2021 and 2020.
Properties Held for Sale
We account for our properties held for sale in accordance with ASC 360, Property, Plant and Equipment (“ASC 360”), which addresses financial accounting and reporting in a period in which a component or group of components of an entity either has been disposed of or is classified as held for sale.
In accordance with ASC 360, at such time as a property is held for sale, such property is carried at the lower of (1) its carrying amount or (2) fair value less costs to sell. In addition, a property being held for sale ceases to be depreciated. We classify operating properties as properties held for sale in the period in which all of the following criteria are met:
|
|
|
|
|
|
|
|
|
|
|
|
The results of operations of a component of an entity that either has been disposed of or is classified as held-for-sale under the requirements of ASC 360 is reported in discontinued operations in accordance with ASC 205, Presentation of Financial Statements (“ASC 205”) if such disposal or classification represents a strategic shift that has (or will have) a major effect on our operations and financial results.
There were no properties classified as held for sale at December 31, 2017. There was one retail property classified as held for sale at December 31, 2016. See Note 19.
81
STERLING REAL ESTATE TRUST AND SUBSIDIARIES
NOTES TO CONSOLIDATED FINANCIAL STATEMENTS
DECEMBER 31, 2017, 2016 AND 2015
(Dollar amounts in thousands, except share and per share data)
Construction in Progress
The Company capitalizes direct and certain indirect project costs incurred during the development period such as construction, insurance, architectural, legal, interest and other financing costs, and real estate taxes. At such time as the development is considered substantially complete, the capitalization of certain indirect costs such as real estate taxes and interest and financing costs cease and all project-related costs included in construction in process are reclassified to land and building and other improvements.
Cash and Cash Equivalents and Restricted Deposits
We classify highly liquid investments with a maturity of three months or less when purchased as cash equivalents. Restricted deposits include funds escrowed for tenant security deposits, real estate tax, insurance and mortgage escrows and escrow deposits required by lenders on certain properties to be used for future building renovations or tenant improvements. As of December 31, 2022 and December 31, 2021, the Trust did not hold any U.S. Treasury Bills ‘Securities’ in cash and cash equivalents. As of December 31, 2022, all U.S. Treasury Bills are classified as Level 1 investments in the fair value hierarchy.
Investments in U.S. Treasury Bills
62
STERLING REAL ESTATE TRUST AND SUBSIDIARIES
NOTES TO CONSOLIDATED FINANCIAL STATEMENTS
DECEMBER 31, 2022, 2021 AND 2020
(Dollar amounts in thousands, except share and per share data)
Treasury Bills are short-term debt obligations with maturities of one year or less issued by the U.S. Treasury Department and backed by the U.S. Government. Treasury Bills yield no interest, but are issued at a discount to the redemption price. We classify our investments in U.S. Treasury Bills as investments in securities. We use quoted market prices to determine the fair value of our investments in U.S. Treasury Bills.
Investment in Unconsolidated Affiliates
We account for unconsolidated affiliates using the equity method of accounting per guidance established under ASC 323, Investments – Equity Method and Joint Ventures (“ASC 323”). The equity method of accounting requires the investment to be initially recorded at cost and subsequently adjusted for our share of equity in the affiliates’ earnings (losses), contributions and distributions. We evaluate the carrying amount of the investments for impairment in accordance with ASC 323. Unconsolidated affiliates are reviewed for potential impairment if the carrying amount of the investment exceeds its fair value. An impairment charge is recorded when an impairment is deemed to be other-than-temporary. To determine whether impairment is other-than-temporary, we consider whether we have the ability and intent to hold the investment until the carrying amount is fully recovered. The evaluation of an investment in an affiliate for potential impairment can require our management to exercise significant judgments. No impairment losses were recorded related to the unconsolidated affiliates for the years ended December 31, 2017, 20162022, 2021 and 2015.2020.
We use the equity method to account for investments that qualify as variable interest entities where weOther Assets
Other assets are not the primary beneficiary and entities that we do not control or where we do not own a majoritycomprised of the economic interest but have the ability to exercise significant influence over the operations and financial policies of the investee. We will also use the equity method for investments that do not qualifyfollowing as variable interest entities and do not meet the control requirements for consolidation, as defined in ASC 810. For a joint venture accounted for under the equity method, our share of net earnings and losses is reflected in income when earned and distributions are credited against our investment in the joint venture as received.
In determining whether an investment in a limited liability company or tenant in common is a variable interest entity, we consider: the form of our ownership interest and legal structure; the size of our investment; the financing structure of the entity, including the necessity of subordinated debt; estimates of future cash flows; our and our partner’s ability to participate in the decision making related to acquisitions, dispositions, budgeting and financing on the entity; and obligation to absorb losses and preferential returns. We determined that neither of our tenant in common arrangements qualify as variable interest entities and do not meet the control requirements for consolidation, as defined in ASC 810 at each reporting period.
As of December 31, 20172022 and 2016,2021:
| | | | | | |
|
| December 31, 2022 |
| December 31, 2021 | ||
| | (in thousands) | ||||
Due from related party | | $ | 50 | | $ | 336 |
Accounts receivable, net | | | 5,821 | | | 5,342 |
Insurance claim receivable | | | 3,846 | | | 145 |
Fair value of interest rate swap | | | 13,782 | | | 698 |
Other assets | | | 181 | | | 192 |
Financing fees, less accumulated amortization | | | 86 | | | 18 |
Lease costs, less accumulated amortization | | | 1,799 | | | 2,065 |
Prepaid expenses | | | 1,747 | | | 1,506 |
Total other assets, net | | $ | 27,312 | | $ | 10,302 |
Note receivable,
Notes receivable are issued periodically and are secured and interest bearing. The Trust has one note receivable for a commercial tenant bearing a 6.5% per annum interest rate which matures in 2025.
Accrued Expenses and Other liabilities
Accrued Expenses and other liabilities are comprised of the unconsolidated affiliates held total assetsfollowing as of $23,466 and $26,140 and mortgage notes payable of $17,470 and $20,017, respectively.
The operating partnership previously owned a 40.26% interest as a tenant in common in a single asset limited liability company which owns a 144 unit residential, multifamily apartment complex in Bismarck, North Dakota. The property was encumbered by a first mortgage with a balance at December 31, 2016 of $2,190. As of May 1, 2017, there was a change in control over the real estate investment, with the operating partnership acquiring the other tenant in common’s 59.74% ownership interest in the property (see Note 20). We estimated the property had a fair value of approximately $10,080. The operating partnership assumed a loan of $1,2952022 and issued $4,727 of limited partnership units for a total purchase price of approximately $6,022. The Company accounted for this as a business combination and recognized a gain on change in control of real estate investment of $2,186 in the second quarter of 2017 as a result of remeasuring the carrying value to fair value.2021:
The operating partnership is a 50% owner of Grand Forks Marketplace Retail Center through 100% ownership in a limited liability company. Grand Forks Marketplace Retail Center has approximately 183,000 square feet of commercial space in Grand Forks, North
| | | | | | |
|
| December 31, 2022 |
| December 31, 2021 | ||
| | (in thousands) | ||||
Special assessments payable | | $ | 647 | | $ | 690 |
Due to related party | | | 1,408 | | | 473 |
Accounts payable - trade | | | 2,340 | | | 3,272 |
Retainage payable | | | 3 | | | 86 |
82
63
STERLING REAL ESTATE TRUST AND SUBSIDIARIES
NOTES TO CONSOLIDATED FINANCIAL STATEMENTS
DECEMBER 31, 2017, 20162022, 2021 AND 20152020
(Dollar amounts in thousands, except share and per share data)
Fair value of interest rate swap | | | — | | | 1,648 |
Deferred insurance proceeds | | | 2 | | | 476 |
Accrued interest expense | | | 1,318 | | | 1,323 |
Accrued real estate taxes | | | 7,275 | | | 6,653 |
Accrued unearned rent | | | 2,936 | | | 3,055 |
Other liabilities | | | 146 | | | 928 |
Total accrued expenses and other liabilities | | $ | 16,075 | | $ | 18,604 |
Dakota. The property is encumbered by a non-recourse first mortgage with a balance at December 31, 2017 and 2016 of $10,692 and $10,891, respectively. The Company is jointly and severally liable for the full mortgage balance.
The operating partnership owns a 66.67% interest as tenant in common in an office building with approximately 75,000 square feet of commercial rental space in Fargo, North Dakota. The property is encumbered by a first mortgage with a balance at December 31, 2017 and 2016 of $6,778 and $6,936 respectively. The Company is jointly and severally liable for the full mortgage balance.
The operating partnership previously owned an 82.50% interest as a tenant in common in a 61 unit residential, multifamily apartment complex in Fargo, North Dakota. The property was unencumbered at December 31, 2015. As of December 1, 2016, there was a change in control over the real estate investment, with the operating partnership acquiring the other tenant in common’s 17.50% ownership interest in the property (See Note 20). We estimated the property had a fair value of approximately $4,087. The operating partnership paid total cash consideration of approximately $193 before transaction costs and issued $448 of limited partnership units for a total purchase price of approximately $641. The company accounted for this as a business combination and recognized a gain on change in control of real estate investment of $550 in the fourth quarter of 2016 as a result of remeasuring the carrying value to fair value.
The operating partnership previously was a 99% owner of Michigan Street Transit Center, LLC (“Transit Center”) through 100% ownership in a limited liability company. The operating partnership had contributed approximately $644 in cash and $1,316 in property to the Transit Center in May and June 2014, respectively. The new parking ramp constructed on the site was fully operational in October 2016. The property was unencumbered at December 31, 2015. As of December 7, 2016, the operating partnership sold its 99% ownership interest in the Michigan Street Transit Center partnership for $2,600 and recognized a gain of $597.
Receivables
Receivables consist primarily of amounts due for rent and real estate taxes. The receivables are non-interest bearing. The carrying amount of receivables is reduced by an amount that reflects management’s best estimates of the amounts that will not be collected. As of December 31, 2017 and 2016, management determined no allowance was necessary for uncollectible receivables.
Financing and Lease Costs
Financing costs related to lines of credit have been capitalized and are being amortized over the life of the financing using the effective interest method. Unamortized financing costs are written off when debt is retired before the maturity date and included in amortization expense at that time.
Lease costs incurred in connection with new leases have been capitalized and are being amortized over the life of the lease using the straight-line method. We record the amortization of leasing costs in depreciation and amortization on the consolidated statements of operations and comprehensive income. If an applicable lease terminates prior to the expiration of its initial lease term, we write off the carrying amount of the costs to amortization expense.
Debt Issuance Costs
We amortize external debt issuance costs related to notes and mortgage notes using the effective interest rate method, over the estimated life term of the related debt. We record debt issuance costs net of amortization, on our consolidated balance sheets as an offset to their related debt. We record debt issuance costs related to revolving lines of credit on our consolidated balance sheets as financing fees in other assets, regardless of whether a balance on the line of credit is outstanding. We record the amortization of all debt issuance costs as interest expense.
Intangible Assets
Lease intangibles are a purchase price allocation recorded on property acquisition. The lease intangibles represent the estimated value of in-place leases and the value of leases with above or below market lease terms. Lease intangibles are amortized over the term of the related lease.
83
STERLING REAL ESTATE TRUST AND SUBSIDIARIES
NOTES TO CONSOLIDATED FINANCIAL STATEMENTS
DECEMBER 31, 2017, 2016 AND 2015
(Dollar amounts in thousands, except share and per share data)
The carrying amount of intangible assets is regularly reviewed for indicators of impairments in value. Impairment is recognized only if the carrying amount of the intangible asset is considered to be unrecoverable from its undiscounted cash flows and is measured as the difference between the carrying amount and the estimated fair value of the asset. Based on the review, management determined no impairment charges were necessary for the years ended December 31, 2017, 2016 and 2015.
Noncontrolling Interest
A noncontrolling interest in a subsidiary (minority interest) is in most cases an ownership interest in the consolidated entity that should be reported as equity in the consolidated financial statements and separate from the parent company’s equity. In addition, consolidated net income is required to be reported at amounts that include the amounts attributable to both the parent and the noncontrolling interest, and the amount of consolidated net income attributable to the parent and the noncontrolling interest are required to be disclosed on the face of the consolidated statements of operations and other comprehensive income.
Operating Partnership: Interests in Sterling Properties, LLLPthe operating partnership held by limited partners are represented by operating partnership units. Sterling Properties, LLLP’sThe operating partnership’s income is allocated to holders of units based upon the ratio of their holdings to the total units outstanding during the period. Capital contributions, distributions, syndication costs, and profits and losses are allocated to noncontrolling interests in accordance with the terms of the operating partnership agreement.
Partially Owned Properties: The CompanyTrust reflects noncontrolling interests in partially owned properties on the balance sheet for the portion of properties consolidated by the CompanyTrust that are not wholly owned by the Company.Trust. The earnings or losses from those properties attributable to the noncontrolling interests are reflected as noncontrolling interest in partially owned properties in the consolidated statementstatements of operations and other comprehensive income.
Syndication Costs
Syndication costs consist of costs paid to attorneys, accountants, and selling agents, related to the raising of capital. Syndication costs are recorded as a reduction to beneficial and noncontrolling interest.
Federal Income Taxes
We have elected to be taxed as a REIT under the Internal Revenue Code, as amended. A REIT calculates taxable income similar tolike other domestic corporations, with the major difference being a REIT is entitled to a deduction for dividends paid. A REIT is generally required to distribute each year at least 90% of its taxable income. If it chooses to retain the remaining 10% of taxable income, it may do so, but it will be subject to a corporate tax on such income. REIT shareholders are taxed on REIT distributions of ordinary income in the same manner as they are taxed on othersimilar to corporate distributions.
A summary of the tax characterization of the dividends paid to shareholders of the Company’s common stock for the years ended December 31, 2017, 20162022, 2021 and 20152020 follows:
| | | | | | | | | | | | | | | | | | |
| | Tax Year Ended December 31, | | |||||||||||||||
| | Dividend | | % | | | Dividend | | % | | | Dividend | | % | | |||
| | 2022 | | 2022 | | | 2021 | | 2021 | | | 2020 | | 2020 | | |||
Tax status | | | | | | | | | | | | | | | | | | |
Ordinary income | | $ | 0.6374 | | 55.43 | % | | $ | 0.9833 | | 92.76 | % | | $ | 0.8994 | | 84.95 | % |
Capital gain | | | — | | — | % | | | 0.0767 | | 7.24 | % | | | — | | — | % |
Return of capital | | | 0.5126 | | 44.57 | % | | | — | | — | % | | | 0.1593 | | 15.05 | % |
| | $ | 1.1500 | | 100.00 | % | | $ | 1.0600 | | 100.00 | % | | $ | 1.0587 | | 100.00 | % |
|
|
|
|
|
|
|
|
|
|
|
|
|
|
|
|
|
|
|
|
| Tax Year Ended December 31, |
| |||||||||||||||
|
| Dividend |
| % |
|
| Dividend |
| % |
|
| Dividend |
| % |
| |||
|
| 2017 |
| 2017 |
|
| 2016 |
| 2016 |
|
| 2015 |
| 2015 |
| |||
Tax status |
|
|
|
|
|
|
|
|
|
|
|
|
|
|
|
|
|
|
Ordinary income |
| $ | 0.8124 |
| 82.05 | % |
| $ | 0.8718 |
| 90.48 | % |
| $ | 0.8671 |
| 93.24 | % |
Capital Gain |
|
| 0.0015 |
| 0.16 | % |
|
| 0.0267 |
| 2.77 | % |
|
| 0.0098 |
| 1.05 | % |
Return of capital |
|
| 0.1761 |
| 17.79 | % |
|
| 0.0615 |
| 6.75 | % |
|
| 0.0531 |
| 5.71 | % |
|
| $ | 0.9900 |
| 100.00 | % |
| $ | 0.9600 |
| 100.00 | % |
| $ | 0.9300 |
| 100.00 | % |
64
STERLING REAL ESTATE TRUST AND SUBSIDIARIES
NOTES TO CONSOLIDATED FINANCIAL STATEMENTS
DECEMBER 31, 2022, 2021 AND 2020
(Dollar amounts in thousands, except share and per share data)
We intend to continue to qualify as a REIT and, provided we maintain such status, will not be taxed on the portion of the income that is distributed to shareholders. In addition, we intend to distribute all of our taxable income; therefore, no provisions or liabilities for income taxes have been recorded in the consolidated financial statements.
84
STERLING REAL ESTATE TRUST AND SUBSIDIARIES
NOTES TO CONSOLIDATED FINANCIAL STATEMENTS
DECEMBER 31, 2017, 2016 AND 2015
(Dollar amounts in thousands, except share and per share data)
Sterling conducts its business activity as an Umbrella Partnership Real Estate Investment Trust (“UPREIT”) through its Operating Partnership – Sterling Properties, LLLP. The Operating Partnership is organized as a limited liability limited partnership. Income or loss is allocated to the partners in accordance with the provisions of the Internal Revenue Code 704(b) and 704(c). UPREIT status allows non-recognition of gain by an owner of appreciated real estate if that owner contributes the real estate to a partnership in exchange for a partnership interest. The conversion of a partnership interest to shares of beneficial interest in the REIT will be a taxable event to the limited partner.
We follow ASC Topic 740, Income Taxes, to recognize, measure, present and disclose in our consolidated financial statements uncertain tax positions that we have taken or expect to take on a tax return. As of December 31, 20172022 and 20162021 we did not have any liabilities for uncertain tax positions that we believe should be recognized in our consolidated financial statements. We are no longer subject to Federal and State tax examinations by tax authorities for years before 2014.2019.
The operating partnership has elected to record related interest and penalties, if any, as income tax expense on the consolidated statements of operations and other comprehensive income.
Revenue Recognition
We derive over 95% of our revenues from tenant rents and other tenant-related activities. We lease multifamily units under operating leases with terms of one year or less. Rental income and other property revenues are recorded when due from tenants and are recognized monthly as earned pursuant to the terms of the underlying leases. Other property revenues consist primarily of laundry, application and other fees charged to tenants.
We lease commercial space primarily under long-term lease agreements. Commercial tenant rents include base rents, expense reimbursements (such as common area maintenance, real estate taxes and utilities), and a straight-line rent adjustment. We record base rents on a straight-line basis. The monthly base rent income according to the terms of our leases is adjusted sowith the purpose that an average monthly rent is recorded for each tenant over the term of its lease. The straight-line rent adjustment increased revenue by $246, $499$302 and $325$550 for the years ended December 31, 2017, 20162022 and 2015,2021, respectively. The straight-line receivable balance included in receivables on the consolidated balance sheets as of December 31, 20172022 and 20162021, was $3,586$3,756 and $3,362$3,569, respectively. We receive payments for expense reimbursements from substantially all our multi-tenant commercial tenants throughout the year based on estimates. Differences between estimated recoveriesestimated. The Trust is the lessor for its residential and commercial leases. Leases are analyzed on an individual basis to determine lease classification. As of December 31, 2022, all leases analyzed under the final billed amounts, which generally are immaterial, are recognized in the subsequent year.Trust’s lease classification process were determined to be operating leases.
Earnings per Common Share
Basic earnings per common share is computed by dividing net income available to common shareholders (the “numerator”) by the weighted average number of common shares outstanding (the “denominator”) during the period. Sterling had no dilutive potential common shares as of December 31, 2017, 20162022, 2021 and 20152020 and therefore, basic earnings per common share was equal to diluted earnings per common share for both periods. As the calculation does not include net income attributable to the Operating Partnership, Operating Partnership Units are not included in the calculation, and does not have any impact on earnings per share.
For the years ended December 31, 2017, 20162022, 2021 and 2015,2020, Sterling’s denominators for the basic and diluted earnings per common share were approximately 8,300,000, 7,844,000,10,632,000, 10,160,000, and 7,223,000,9,694,000, respectively.
Reclassifications
Certain reclassifications considered necessary for a fair presentation have been made to the prior period financial statements in order to conform to the current year’s presentation. These reclassifications have not changed the results of operations or equity.
Recent Accounting Pronouncements
In May 2014, the FASB and International Accounting Standards Board issued their final standard on revenue from contracts with customers, which was issued by the FASB as Accounting Standards Update 2014-09, Revenue from Contracts with Customers, or ASU 2014-09. ASU 2014-09, which establishes a single comprehensive model for entities to use in accounting for revenue arising from contracts with customers, supersedes most current GAAP applicable to revenue recognition and converges U.S. and international accounting standards in this area. The core principle of the new guidance is that revenue shall only be recognized when an entity has transferred control of goods or services to a customer and for an amount reflecting the consideration to which the entity expects to be entitled for such exchange. Additionally, lease contracts are specifically excluded from ASU 2014-09. In July 2015, the FASB decided
85
STERLING REAL ESTATE TRUST AND SUBSIDIARIES
NOTES TO CONSOLIDATED FINANCIAL STATEMENTS
DECEMBER 31, 2017, 2016 AND 2015
(Dollar amounts in thousands, except share and per share data)
to defer the effective date for annual reporting periods beginning after December 15, 2017. Early adoption is permitted beginning on the original effective date of periods beginning after December 15, 2016. Upon adoption, ASU 2014-09 allows for full retrospective adoption applied to all periods presented or modified retrospective adoption with the cumulative effect of initially applying the standard recognized at the date of initial application. We have performed a review of the requirements of the new guidance and have identified which of our revenue streams will be within the scope of ASU 2014-09. We have completed an adoption plan which included a review of transactions supporting each revenue stream to determine the impact of accounting treatment under ASU 2014-09, an evaluation of the method of adoption and assessing changes that might be necessary to information technology systems, processes and internal controls to capture new data and address changes in financial reporting. We will adopt this standard effective as of January 1, 2018 and have concluded that the adoption of this guidance will not have an impact on our financial position or results of operations. We concluded this standard will have an impact on the disclosure of gain/loss on sale of real estate investments upon the adoption of the update ASU 2016-02, Leases, but will not have an impact on “total real estate rental income.”
In February 2016, the FASB issued ASU No. 2016-02, Leases (Topic 842), which amends existing accounting standards for lease accounting, including by requiring lessees to recognize most leases on the balance sheet and making certain changes to lessor accounting. The standard will take effect for fiscal years, and interim periods within those fiscal years, beginning after December 15, 2018 with earlier application permitted. The Company is evaluating the impact of ASU No. 2016-02 on its financial position and results of operations. In January 2018, the FASB released an exposure draft to ASU No. 2016-02 that if issued in its current form would (1) simplify transition requirements for both lessees and lessors by adding an option that would permit an organization to apply the transition provisions of the new standard at its adoption date instead of at the earliest comparative period presented in its financial statements and, (2) provide a practical expedient for lessors that would permit lessors to not be required to separate nonlease components from the associated lease components if certain conditions are met.
In January 2017, the FASB issued a new standard which clarifies the definition of a business. The standard's objective is to add additional guidance that assists companies in determining whether transactions should be accounted for as an asset acquisition or a business combination. The new standard first requires an entity to evaluate if substantially all of the fair value of the gross assets acquired is concentrated in a single identifiable asset or a group of similar identifiable assets. If this threshold is met, the set is not a business. If this threshold is not met, the entity next evaluates whether the set meets the requirement that a business include, at a minimum, an input and a substantive process that together significantly contribute to the ability to create outputs. Among other differences, transaction costs associated with asset acquisitions are capitalized while those associated with business combinations are expensed as incurred. In addition, purchase price in an asset acquisition is allocated on a relative fair value basis while in a business combination it is generally measured at fair value. The Company early adopted the new standard as allowed effective July 1, 2017. The Company concluded that substantially all of its transactions will now be accounted for as asset acquisitions, which means transaction costs will largely be capitalized as noted above. The adoption of this pronouncement resulted in the Company’s acquisition of investment property subsequent to July 1, 2017 to qualify as asset acquisitions and as such, the related transaction costs of $258 were capitalized.
In November 2016, the FASB issued ASU No. 2016-18 to require that a statement of cash flows explain the change during the period in the total of cash, cash equivalents, and amounts generally described as restricted cash or restricted cash equivalents. Therefore, amounts generally described as restricted cash and restricted cash equivalents will be included with cash and cash equivalents when reconciling the beginning-of-period and end-of-period total amounts shown on the statement of cash flows. ASU 2016-18 is effective for fiscal years beginning after December 15, 2017, including interim periods within those fiscal years and early adoption is permitted. The pronouncement requires a retrospective transition method of adoption. Upon adoption, the Company will include amounts generally described as restricted cash within the beginning-of-period, change and end-of-period total amounts on the statement of cash flows rather than within an activity on the statement of cash flows.
In August 2016, the FASB issued ASU No. 2016-15 to provide guidance for areas where there is diversity in practice in how certain cash receipts and cash payments are presented and classified in the statement of cash flows. ASU 2016-15 is effective for fiscal years beginning after December 15, 2017, including interim periods within those fiscal years. The Company does not currently anticipate that the guidance will have a material impact on our consolidated financial statements.
Management does not believe that any other recently issued, but not yet effective accounting pronouncements, if adopted, would have a material effect on the accompanying Consolidated Financial Statements.
86
65
STERLING REAL ESTATE TRUST AND SUBSIDIARIES
NOTES TO CONSOLIDATED FINANCIAL STATEMENTS
DECEMBER 31, 2017, 20162022, 2021 AND 20152020
(Dollar amounts in thousands, except share and per share data)
NOTE 3 – segment reporting
We report our results in two reportable segments: residential and commercial properties. Our residential properties include multifamily properties. Our commercial properties include retail, office, industrial, restaurant and medical properties. We assess and measure operating results based on net operating income (“NOI”), which we define as total real estate segment revenues less real estate expenses (which consist of real estate taxes, property management fees, utilities, repairs and maintenance, insurance and direct administrative costs). We believe NOI is an important measure of operating performance even though it should not be considered an alternative to net income or cash flow from operating activities. NOI is unaffected by financing, depreciation, amortization, legal and professional fees and certain general and administrative expenses. The accounting policies of each segment are consistent with those described in Note 2 of this report.
Segment Revenues and Net Operating Income
The revenues and net operating income for the reportable segments (residential and commercial) are summarized as follows for the years ended December 31, 2017, 20162022, 2021 and 2015,2020, along with reconciliations to the consolidated financial statements. Segment assets are also reconciled to Total Assets as reported in the consolidated financial statements for the years ended December 31, 2017, 20162022 and 2015.2021.
| | | | | | | | | | | | | | | | | | | | | | | | | | | |
| | Year ended December 31, 2022 | | Year ended December 31, 2021 | | Year ended December 31, 2020 | |||||||||||||||||||||
|
| Residential |
| Commercial |
| Total |
| Residential |
| Commercial |
| Total |
| Residential |
| Commercial |
| Total | |||||||||
| | (in thousands) | | (in thousands) | | (in thousands) | |||||||||||||||||||||
Income from rental operations | | $ | 113,968 | | $ | 21,092 | | $ | 135,060 | | $ | 107,284 | | $ | 22,040 | | $ | 129,324 | | $ | 98,576 | | $ | 26,040 | | $ | 124,616 |
Expenses from rental operations | | | 64,647 | | | 6,491 | | | 71,138 | | | 57,454 | | | 7,315 | | | 64,769 | | | 52,686 | | | 6,883 | | | 59,569 |
Net operating income | | $ | 49,321 | | $ | 14,601 | | $ | 63,922 | | $ | 49,830 | | $ | 14,725 | | $ | 64,555 | | $ | 45,890 | | $ | 19,157 | | $ | 65,047 |
Depreciation and amortization | | | | | | | | | 24,679 | | | | | | | | | 22,203 | | | | | | | | | 21,214 |
Interest | | | | | | | | | 19,994 | | | | | | | | | 18,142 | | | | | | | | | 17,097 |
Administration of REIT | | | | | | | | | 5,247 | | | | | | | | | 4,381 | | | | | | | | | 4,217 |
Other income | | | | | | | | | (10,530) | | | | | | | | | (4,609) | | | | | | | | | (4,461) |
Net income | | | | | | | | $ | 24,532 | | | | | | | | $ | 24,438 | | | | | | | | $ | 26,980 |
|
|
|
|
|
|
|
|
|
|
|
|
|
|
|
|
|
|
|
|
|
|
|
|
|
|
|
|
|
| Year ended December 31, 2017 |
| Year ended December 31, 2016 |
| Year ended December 31, 2015 | |||||||||||||||||||||
|
| Residential |
| Commercial |
| Total |
| Residential |
| Commercial |
| Total |
| Residential |
| Commercial |
| Total | |||||||||
|
| (in thousands) |
| (in thousands) |
| (in thousands) | |||||||||||||||||||||
Income from rental operations |
| $ | 86,859 |
| $ | 27,439 |
| $ | 114,298 |
| $ | 80,497 |
| $ | 27,566 |
| $ | 108,063 |
| $ | 75,914 |
| $ | 21,268 |
| $ | 97,182 |
Expenses from rental operations |
|
| 47,284 |
|
| 7,458 |
|
| 54,742 |
|
| 43,766 |
|
| 6,924 |
|
| 50,690 |
|
| 39,898 |
|
| 4,809 |
|
| 44,707 |
Net operating income |
| $ | 39,575 |
| $ | 19,981 |
| $ | 59,556 |
| $ | 36,731 |
| $ | 20,642 |
| $ | 57,373 |
| $ | 36,016 |
| $ | 16,459 |
| $ | 52,475 |
Interest |
|
|
|
|
|
|
|
| 18,630 |
|
|
|
|
|
|
|
| 18,366 |
|
|
|
|
|
|
|
| 17,141 |
Depreciation and amortization |
|
|
|
|
|
|
|
| 21,544 |
|
|
|
|
|
|
|
| 22,145 |
|
|
|
|
|
|
|
| 19,574 |
Administration of REIT |
|
|
|
|
|
|
|
| 5,144 |
|
|
|
|
|
|
|
| 5,600 |
|
|
|
|
|
|
|
| 5,647 |
Loss on impairment of property |
|
|
|
|
|
|
|
| — |
|
|
|
|
|
|
|
| — |
|
|
|
|
|
|
|
| 412 |
Loss on lease terminations |
|
|
|
|
|
|
|
| 146 |
|
|
|
|
|
|
|
| 299 |
|
|
|
|
|
|
|
| — |
Other (income)/expense |
|
|
|
|
|
|
|
| (5,791) |
|
|
|
|
|
|
|
| (1,894) |
|
|
|
|
|
|
|
| (1,683) |
Net income |
|
|
|
|
|
|
| $ | 19,883 |
|
|
|
|
|
|
| $ | 12,857 |
|
|
|
|
|
|
| $ | 11,384 |
Segment Assets and Accumulated Depreciation
| | | | | | | | | |
As of December 31, 2022 |
| Residential |
| Commercial |
| Total | |||
| | (in thousands) | |||||||
Real estate investments | | $ | 779,424 | | $ | 191,724 | | $ | 971,148 |
Accumulated depreciation | | | (147,115) | | | (47,734) | | | (194,849) |
Total real estate investments, net | | $ | 632,309 | | $ | 143,990 | | $ | 776,299 |
Lease intangible assets, less accumulated amortization | | | 839 | | | 4,451 | | | 5,290 |
Cash and cash equivalents | | | | | | | | | 3,257 |
Restricted deposits | | | | | | | | | 9,323 |
Investment in securities | | | | | | | | | 29,371 |
Investment in unconsolidated affiliates | | | | | | | | | 29,423 |
Notes receivable | | | | | | | | | 8,448 |
Other assets, net | | | | | | | | | 27,312 |
Total Assets | | | | | | | | $ | 888,723 |
87
66
STERLING REAL ESTATE TRUST AND SUBSIDIARIES
NOTES TO CONSOLIDATED FINANCIAL STATEMENTS
DECEMBER 31, 2017, 20162022, 2021 AND 20152020
(Dollar amounts in thousands, except share and per share data)
| | | | | | | | | |
As of December 31, 2021 |
| Residential |
| Commercial |
| Total | |||
| | (in thousands) | |||||||
Real estate investments | | $ | 692,722 | | $ | 203,980 | | $ | 896,702 |
Accumulated depreciation | | | (133,100) | | | (46,055) | | | (179,155) |
Total real estate investments, net | | $ | 559,622 | | $ | 157,925 | | $ | 717,547 |
Lease intangible assets, less accumulated amortization | | | — | | | 6,246 | | | 6,246 |
Cash and cash equivalents | | | | | | | | | 51,507 |
Restricted deposits | | | | | | | | | 9,149 |
Investment in unconsolidated affiliates | | | | | | | | | 18,658 |
Notes receivable | | | | | | | | | 7,457 |
Other assets, net | | | | | | | | | 10,302 |
Total Assets | | | | | | | | $ | 820,866 |
NOTE 4 - RESTRICTED DEPOSITS AND FUNDED RESERVES
| | | | | | | | | |
| | | |
| As of December 31, | | As of December 31, | ||
| | | | | 2022 | | 2021 | ||
| | | | | (in thousands) | ||||
Tenant security deposits | | | | | $ | 6,242 | | $ | 5,165 |
Real estate tax and insurance escrows | | | | | | 1,336 | | | 1,355 |
Replacement reserves | | | | | | 1,745 | | | 1,791 |
Other funded reserves | | | | | | — | | | 838 |
| | | | | $ | 9,323 | | $ | 9,149 |
| | | | | | | | | |
NOTE 5 – Investment in unconsolidated affiliates
| | | | | | | | | | | | |
| | | | | | | | Total Investment in Unconsolidated Affiliates at | ||||
Unconsolidated Affiliates | | | Date Acquired | | | Trust Ownership Interest | | December 31, | | December 31, 2021 | ||
Banner Building | | | 2007 | | | 66.67% | | $ | (614) | | $ | 60 |
Grand Forks INREIT, LLC | | | 2003 | | | 50% | | | 4,961 | | | 2,493 |
SE Savage, LLC | | | 2019 | | | 60% | | | 1,660 | | | 2,946 |
SE Maple Grove, LLC | | | 2019 | | | 60% | | | 1,836 | | | 2,823 |
SE Rogers, LLC | | | 2020 | | | 60% | | | 2,413 | | | 2,986 |
ST Oak Cliff, LLC | | | 2021 | | | 70% | | | 9,098 | | | 4,324 |
SE Brooklyn Park, LLC | | | 2021 | | | 60% | | | 2,914 | | | 3,026 |
SE Fossil Creek, LLC | | | 2022 | | | 70% | | | 7,155 | | | - |
| | | | | | | | $ | 29,423 | | $ | 18,658 |
The operating partnership owns a 66.67% interest as tenant in common in an office building in Fargo, North Dakota. The property is encumbered by a first mortgage with a balance at December 31, 2022 and 2021 of $6,951 and $6,329, respectively. The Trust is jointly and severally liable for the full mortgage balance.
The operating partnership is a 50% owner of a tenant in common through 100% ownership in a limited liability company. The property is located in Grand Forks, North Dakota. The property is encumbered by a non-recourse first mortgage with a balance at December 31, 2022 and 2021 of $9,520 and $9,794, respectively. The Trust is jointly and severally liable for the full mortgage balance.
67
Segment Assets and Accumulated Depreciation
|
|
|
|
|
|
|
|
|
|
As of December 31, 2017 |
| Residential |
| Commercial |
| Total | |||
|
| (in thousands) | |||||||
Real estate investments |
| $ | 557,309 |
| $ | 202,394 |
| $ | 759,703 |
Accumulated depreciation |
|
| (76,404) |
|
| (34,622) |
|
| (111,026) |
|
| $ | 480,905 |
| $ | 167,772 |
|
| 648,677 |
Cash and cash equivalents |
|
|
|
|
|
|
|
| 12,490 |
Restricted deposits and funded reserves |
|
|
|
|
|
|
|
| 8,063 |
Investment in unconsolidated affiliates |
|
|
|
|
|
|
|
| 2,772 |
Receivables and other assets |
|
|
|
|
|
|
|
| 5,603 |
Financing and lease costs, less accumulated amortization |
|
|
|
|
|
|
|
| 737 |
Intangible assets, less accumulated amortization |
|
|
|
|
|
|
|
| 13,263 |
Total Assets |
|
|
|
|
|
|
| $ | 691,605 |
|
|
|
|
|
|
|
|
|
|
As of December 31, 2016 |
| Residential |
| Commercial |
| Total | |||
|
| (in thousands) | |||||||
Real estate investments |
| $ | 514,341 |
| $ | 200,959 |
| $ | 715,300 |
Accumulated depreciation |
|
| (63,148) |
|
| (29,177) |
|
| (92,325) |
|
| $ | 451,193 |
| $ | 171,782 |
|
| 622,975 |
Cash and cash equivalents |
|
|
|
|
|
|
|
| 12,034 |
Restricted deposits and funded reserves |
|
|
|
|
|
|
|
| 7,213 |
Investment in unconsolidated affiliates |
|
|
|
|
|
|
|
| 3,653 |
Receivables and other assets |
|
|
|
|
|
|
|
| 5,354 |
Financing and lease costs, less accumulated amortization |
|
|
|
|
|
|
|
| 950 |
Assets held for sale |
|
|
|
|
|
|
|
| 2,482 |
Intangible assets, less accumulated amortization |
|
|
|
|
|
|
|
| 15,852 |
Total Assets |
|
|
|
|
|
|
| $ | 670,513 |
note 4 – real estate investments
|
|
|
|
|
|
|
|
|
|
As of December 31, 2017 |
| Residential |
| Commercial |
| Total | |||
|
| (in thousands) | |||||||
Land and land improvements |
| $ | 73,109 |
| $ | 37,841 |
| $ | 110,950 |
Building and improvements |
|
| 457,443 |
|
| 163,087 |
|
| 620,530 |
Furniture, fixtures and equipment |
|
| 25,381 |
|
| 1,466 |
|
| 26,847 |
Construction in progress |
|
| 1,376 |
|
| — |
|
| 1,376 |
|
|
| 557,309 |
|
| 202,394 |
|
| 759,703 |
Less accumulated depreciation |
|
| (76,404) |
|
| (34,622) |
|
| (111,026) |
|
| $ | 480,905 |
| $ | 167,772 |
| $ | 648,677 |
88
STERLING REAL ESTATE TRUST AND SUBSIDIARIES
NOTES TO CONSOLIDATED FINANCIAL STATEMENTS
DECEMBER 31, 2017, 20162022, 2021 AND 20152020
(Dollar amounts in thousands, except share and per share data)
|
|
|
|
|
|
|
|
|
|
As of December 31, 2016 |
| Residential |
| Commercial |
| Total | |||
|
| (in thousands) | |||||||
Land and land improvements |
| $ | 67,384 |
| $ | 37,769 |
| $ | 105,153 |
Building and improvements |
|
| 419,120 |
|
| 161,724 |
|
| 580,844 |
Furniture, fixtures and equipment |
|
| 24,852 |
|
| 1,466 |
|
| 26,318 |
Construction in progress |
|
| 2,985 |
|
| — |
|
| 2,985 |
|
|
| 514,341 |
|
| 200,959 |
|
| 715,300 |
Less accumulated depreciation |
|
| (63,148) |
|
| (29,177) |
|
| (92,325) |
|
| $ | 451,193 |
| $ | 171,782 |
| $ | 622,975 |
The Operating Partnership owns a 60% interest in a limited liability company that holds a multifamily property. The property is encumbered by a first mortgage with a balance of $30,726 at December 31, 2022. The Trust is jointly and severally liable for the full mortgage balance. At December 31, 2021, the property was encumbered by a first mortgage of $26,210, and a second mortgage to Sterling Properties, LLLP of $6,129. Additionally, at December 31, 2022, SE Savage, LLC has an outstanding Promissory Note with Sterling Properties, LLLP, for $1,397, and is an unsecured obligation of SE Savage, LLC. The note is considered to be additional at-risk funds to the Operating Partnership, in SE Savage, LLC, and is included in Notes Receivable on the Consolidated Balance Sheet at December 31, 2022.
Construction
The Operating Partnership owns a 60% interest in progress asa limited liability company that holds a multifamily property. The entity is encumbered by a first mortgage with a balance at both December 31, 2022 and December 31, 2021 of $24,788. The property is also encumbered by a second mortgage to Sterling Properties, LLLP with a balance at December 31, 2022 and December 31, 2021 of $3,643 and $727, respectively.
The Operating Partnership owns a 60% interest in a limited liability company that is currently developing a multifamily property. The LLC holds land located in Rogers, Minnesota, with total assets of $32,864 and $22,847 at December 31, 2022 and December 31, 2021, respectively. The entity encumbered by a first mortgage has a balance of $25,742 and $15,688 at December 31, 2022 and December 31, 2021, respectively. The Company is jointly and severally liable for the full mortgage balance. The property is also encumbered by a second mortgage to Sterling Properties, LLLP with a balance at December 31, 2022 of $2,938.
The Operating Partnership owns a 70% interest in a limited liability company, with a related party. The entity is currently developing a multifamily property. As of December 31, 2017 consists primarily2022, the Operating Partnership has contributed $9,300 in cash to the entity. The entity holds land located in Dallas, Texas with total assets of development$40,404 and planning costs associated with phase III of a multifamily apartment community under construction in Bismarck, North Dakota and a project to rebuild a multifamily apartment building destroyed by fire in Omaha, Nebraska. Phase I and II of the Bismarck development are completed and Phase III is still in the planning stages and construction has not yet commenced. The Omaha project has commenced and will consist of one 18-unit building. We have a construction contract of $2,031 for the Omaha project, of which $179 has been completed to date, including $16 of retainage which is included in payables$7,394 at December 31, 2017.2022 and December 31, 2021, respectively. The projectentity is estimatedencumbered by a construction mortgage with a balance of $23,409 at December 31, 2022. There was no balance outstanding related to be substantially completedthe construction mortgage at December 31, 2021. The Company is jointly and severally liable for the full mortgage balance.
The Operating Partnership owns a 60% interest in a limited liability company, with an unrelated third party. The entity is currently developing a multifamily property. The entity is located in Brooklyn Park, Minnesota, with total assets of $30,490 and $5,478 at December 31, 2022 and December 31, 2021, respectively. The entity is encumbered by a first mortgage that has a balance of $24,448 at December 31, 2022. There was no balance outstanding related to the first mortgage at December 31, 2021. The Company is jointly and severally liable for the full mortgage balance.
During the second quarter of 2018.
NOTE 5 - RESTRICTED DEPOSITS AND FUNDED RESERVES
|
|
|
|
|
|
|
|
|
|
|
|
|
|
| 2017 |
| 2016 | ||
|
|
|
|
| (in thousands) | ||||
Tenant security deposits |
|
|
|
| $ | 3,995 |
| $ | 3,836 |
Real estate tax and insurance escrows |
|
|
|
|
| 1,664 |
|
| 1,836 |
Replacement reserves |
|
|
|
|
| 2,404 |
|
| 1,541 |
|
|
|
|
| $ | 8,063 |
| $ | 7,213 |
Tenant Security Deposits
We have set aside funds to repay tenant security deposits upon tenant move-out.
Real Estate Tax and Insurance Escrows
Pursuant2022, the Operating Partnership entered into a joint venture arrangement. Through the joint venture, the Operating Partnership owns a 70% interest in a limited liability company, with a related party. The entity is currently developing a multifamily property. As of December 31, 2022, the Operating Partnership has contributed $7,190 in cash to the termsentity. The entity holds land located in Fort Worth, Texas with total assets of certain mortgages, we have established and maintain real estate tax escrows and insurance escrows to pay real estate taxes and insurance. We are required to contribute to the account monthly an amount equal to 1/12$11,083 at December 31, 2022.
The following is a summary of the estimated real estate taxesfinancial position of the unconsolidated affiliates at December 31, 2022 and insurance premiums.2021.
Replacement Reserves
Pursuant to the terms of certain mortgages, we have established and maintain several replacement reserve accounts. We make monthly deposits into the replacement reserve accounts to be used for repairs and replacements on the property. Certain replacement reserve accounts require authorization from the mortgage company for withdrawals.
NOTE 6 – NOTES RECEIVABLE
Notes receivable primarily consisted of a $600 note to an unaffiliated party to provide working capital and for improvements on a residential property bearing interest at a rate of 6.5%. This note was personally guaranteed by the owner. Accrued interest was due monthly beginning until the note was paid in full. The principal plus accrued interest was originally due on August 31, 2016. On the original due date, the note was extended for an additional twelve months to August 31, 2017 with the same terms. The note was paid off on August 31, 2017.
| | | | | | |
|
| December 31, |
| December 31, 2021 | ||
| | (in thousands) | ||||
ASSETS | | | | | | |
Real estate investments | | $ | 218,747 | | $ | 134,839 |
Accumulated depreciation | | | (16,490) | | | (10,940) |
| | | 202,257 | | | 123,899 |
Cash and cash equivalents | | | 3,093 | | | 1,131 |
Restricted deposits | | | 1,034 | | | 650 |
Intangible assets, less accumulated amortization | | | 542 | | | 41 |
Other assets, net | | | 827 | | | 909 |
Total Assets | | $ | 207,753 | | $ | 126,630 |
89
68
STERLING REAL ESTATE TRUST AND SUBSIDIARIES
NOTES TO CONSOLIDATED FINANCIAL STATEMENTS
DECEMBER 31, 2017, 20162022, 2021 AND 20152020
(Dollar amounts in thousands, except share and per share data)
| | | | | | |
LIABILITIES | | | | | | |
Mortgage notes payable, net | | $ | 152,246 | | $ | 87,996 |
Tenant security deposits payable | | | 192 | | | 108 |
Accrued expenses and other liabilities | | | 8,217 | | | 8,029 |
Total Liabilities | | $ | 160,655 | | $ | 96,133 |
SHAREHOLDERS' EQUITY | | | | | | |
Total Shareholders' Equity | | $ | 47,098 | | $ | 30,497 |
| | | | | | |
Total liabilities and shareholders' equity | | $ | 207,753 | | $ | 126,630 |
The following is a summary of results of operations of the unconsolidated affiliates for the years ended the years ended December 31, 2022, 2021 and 2020.
| | | | | | | | | |
| | The year ended December 31, | |||||||
| | 2022 | | 2021 | | 2020 | |||
| | (in thousands) | |||||||
Income from rental operations | | $ | 9,545 | | $ | 4,746 | | $ | 3,001 |
Expenses from rental operations | | | 3,668 | | | 1,632 | | | 928 |
Net operating income | | $ | 5,877 | | $ | 3,114 | | $ | 2,073 |
Depreciation and Amortization | | | 5,678 | | | 1,248 | | | 688 |
Interest | | | 4,148 | | | 2,275 | | | 970 |
Other Income | | | (91) | | | - | | | (24) |
Net (loss) income | | $ | (3,858) | | $ | (409) | | $ | 439 |
NOTE 76 - Lease intangibles
The following table summarizes the net value of other intangible assets and liabilities and the accumulated amortization for each class of intangible:
| | | | | | | | | | |||||||||
| | Lease | | Accumulated | | Lease | ||||||||||||
As of December 31, 2022 |
| Intangibles |
| Amortization |
| Intangibles, net | ||||||||||||
|
|
|
|
|
|
|
|
|
| |||||||||
|
| Lease |
| Accumulated |
| Lease | ||||||||||||
As of December 31, 2017 |
| Intangibles |
| Amortization |
| Intangibles, net | ||||||||||||
Lease Intangible Assets |
| (in thousands) | | (in thousands) | ||||||||||||||
In-place leases |
| $ | 23,080 |
| $ | (11,797) |
| $ | 11,283 | | $ | 15,528 | | $ | (10,960) | | $ | 4,568 |
Above-market leases |
|
| 3,115 |
|
| (1,135) |
|
| 1,980 | | | 1,897 | | | (1,175) | | | 722 |
|
| $ | 26,195 |
| $ | (12,932) |
| $ | 13,263 | |||||||||
| | $ | 17,425 | | $ | (12,135) | | $ | 5,290 | |||||||||
Lease Intangible Liabilities |
|
|
|
|
|
|
|
|
| | | | | | | | | |
Below-market leases |
| $ | (3,162) |
| $ | 1,386 |
| $ | (1,776) | | $ | (2,379) | | $ | 1,733 | | $ | (646) |
| | | | | | | | | |
| | Lease | | Accumulated | | Lease | |||
As of December 31, 2021 |
| Intangibles |
| Amortization |
| Intangibles, net | |||
Lease Intangible Assets | | (in thousands) | |||||||
In-place leases | | $ | 15,455 | | $ | (10,381) | | $ | 5,074 |
Above-market leases | | | 2,617 | | | (1,445) | | | 1,172 |
| | $ | 18,072 | | $ | (11,826) | | $ | 6,246 |
Lease Intangible Liabilities | | | | | | | | | |
Below-market leases | | $ | (2,525) | | $ | 1,714 | | $ | (811) |
|
|
|
|
|
|
|
|
|
|
|
| Lease |
| Accumulated |
| Lease | |||
As of December 31, 2016 |
| Intangibles |
| Amortization |
| Intangibles, net | |||
Lease Intangible Assets |
| (in thousands) | |||||||
In-place leases |
| $ | 23,507 |
| $ | (9,860) |
| $ | 13,647 |
Above-market leases |
|
| 3,115 |
|
| (910) |
|
| 2,205 |
|
| $ | 26,622 |
| $ | (10,770) |
| $ | 15,852 |
Lease Intangible Liabilities |
|
|
|
|
|
|
|
|
|
Below-market leases |
| $ | (3,197) |
| $ | 1,122 |
| $ | (2,075) |
69
STERLING REAL ESTATE TRUST AND SUBSIDIARIES
NOTES TO CONSOLIDATED FINANCIAL STATEMENTS
DECEMBER 31, 2022, 2021 AND 2020
(Dollar amounts in thousands, except share and per share data)
The estimated aggregate amortization expense for each of the five succeeding fiscal years and thereafter is as follows:
|
|
|
|
|
|
|
|
| Intangible |
| Intangible | ||
Years ending December 31, |
| Assets |
| Liabilities | ||
|
| (in thousands) | ||||
2018 |
| $ | 2,237 |
| $ | 278 |
2019 |
|
| 1,932 |
|
| 269 |
2020 |
|
| 1,507 |
|
| 218 |
2021 |
|
| 1,210 |
|
| 189 |
2022 |
|
| 1,076 |
|
| 169 |
Thereafter |
|
| 5,301 |
|
| 653 |
|
| $ | 13,263 |
| $ | 1,776 |
| | | | | | |
| | Intangible | | Intangible | ||
Years ending December 31, |
| Assets |
| Liabilities | ||
| | (in thousands) | ||||
2023 | | $ | 1,597 | | $ | 151 |
2024 | | | 757 | | | 151 |
2025 | | | 757 | | | 151 |
2026 | | | 606 | | | 80 |
2027 | | | 498 | | | 42 |
Thereafter | | | 1,075 | | | 71 |
| | $ | 5,290 | | $ | 646 |
The weighted average amortization period for the intangible assets (in-place leases, above-market leases) and intangible liabilities (below-market leases) acquired as of December 31, 20172022 was 6.12.9 years.
The portion of the purchase price allocated to acquire above and below market lease intangibles is amortized on a straight-line basis over the life of the related lease as an adjustment to rental income. Amortization pertaining to above market lease intangibles of $145, $154, and $186 for the years ended December 31, 2022, 2021 and 2020, respectively, was recorded as a reduction to income from rental operations. Amortization pertaining to below market lease intangibles of $164, $183, and $213 for the years ended December 31, 2022, 2021 and 2020, respectively, was recorded as an increase to income from rental operations.
NOTE 87 – LINES OF CREDIT
We have a $27,000$4,915 variable rate (1-month LIBOR(floating SOFR plus 2.25%) line of credit agreement with Wells Fargo Bank, which expires in June 2018; a $6,315 variable rate (prime rate less 0.5%2.00%) line of credit agreement with Bremer Bank, which expires in November 2019;December 2026; and a $5,000 variable rate (1-month LIBOR(floating SOFR plus 2.04%2.00%) line of credit agreement with Bank of the West, which expires November 2020. The lines of credit are secured by properties in Duluth, Minnesota; Minneapolis/St. Paul, Minnesota; Austin, Texas; Bismarck/Mandan, North Dakota; Fargo, North Dakota; Edina, Minnesota, St. Cloud, Minnesota; Moorhead, Minnesota; and Grand Forks, North Dakota. We also have a $2,000 variable rate (prime rate less 0.5%) unsecured line of credit agreement with Bremer Bank, which expires October 2018.December 2026. The lines of credit are secured by specific properties. At December 31, 2017, there was no balance outstanding on2022, the linesBremer line of credit secures one letter of credit totaling $50, leaving $39,015$8,857 available and unused under the agreements. CertainThese operating lines are designed to enhance treasury management activities and more effectively manage cash balances. As of the variable linesDecember 31, 2022 and December 31, 2021, there was a balance of credit have limits on availability based on collateral specific criteria.$1,008 and $-, respectively.
On June 30, 2017, one of the retail properties that secured the Wells Fargo line of credit was sold. Wells Fargo has released the property as collateral, however, the bank is currently in process of determining the new available borrowing amount.
90
STERLING REAL ESTATE TRUST AND SUBSIDIARIES
NOTES TO CONSOLIDATED FINANCIAL STATEMENTS
DECEMBER 31, 2017, 2016 AND 2015
(Dollar amounts in thousands, except share and per share data)
Certain linelines of credit agreements include covenants that, in part, impose maintenance of certain debt service coverage, and debt to net worth ratios, and debt yield ratios. As of December 31, 2017, one residential property was2022 and 2021, no properties were out of compliancecompliance.
70
STERLING REAL ESTATE TRUST AND SUBSIDIARIES
NOTES TO CONSOLIDATED FINANCIAL STATEMENTS
DECEMBER 31, 2022, 2021 AND 2020
(Dollar amounts in thousands, except share and per share data)
NOTE 8 - NOTES PAYABLE
On December 29, 2022, the Trust entered into a $26,500 note payable. The note payable bears interest at a rate of one percentage point under the “Prime Rate” as published in the Wall Street Journal, with Bremer’s debt service coverage ratio requirementprincipal plus accrued and unpaid interest due and payable on an individual property basis. In addition, one commercial property was out of compliance with Wells Fargo’s loan constant requirement on an individual property basis. Annual waivers were received fromFebruary 1, 2023. The Borrower may prepay the lenders.New Promissory Note without penalty. As of December 31, 2016, one residential property was out of compliance with Bremer’s debt service coverage ratio requirement2021, the Trust did not have any outstanding balances on an individual property basis. A waiver was received from the lender.notes payable.
NOTE 9 - MORTGAGE NOTES PAYABLE
The following table summarizes the Company’s mortgage notes payable.
| | | | | | |
| | Principal Balance At | ||||
| | December 31, | | December 31, | ||
| | 2022 | | 2021 | ||
| | (in thousands) | ||||
Fixed rate mortgage notes payable (a) | | $ | 508,305 | | $ | 490,413 |
Variable rate mortgage notes payable | | | - | | | 5,237 |
Mortgage notes payable | | | 508,305 | | | 495,650 |
Less unamortized debt issuance costs | | | 2,138 | | | 2,508 |
| | $ | 506,167 | | $ | 493,142 |
|
|
|
|
|
|
|
|
| Principal Balance At | ||||
|
| December 31, |
| December 31, | ||
|
| 2017 |
| 2016 | ||
|
| (in thousands) | ||||
Fixed rate mortgage notes payable (a) |
| $ | 397,567 |
| $ | 393,511 |
Less unamortized debt issuance costs |
|
| 2,724 |
|
| 3,032 |
|
| $ | 394,843 |
| $ | 390,479 |
| (a) |
| Includes |
As of December 31, 2017,2022, we had 122115 fixed rate and no variable rate mortgage loansloan with effective interest rates ranging from 3.44%2.43% to 7.25%6.85% per annum, and a weighted average effective interest rate of 4.39%3.79% per annum.
As of December 31, 2016,2021, we had 116114 fixed rate and noone variable rate mortgage loansloan with effective interest rates ranging from 2.57%2.09% to 7.25%6.85% per annum, and a weighted average effective interest rate of 4.43%3.83% per annum.annum on fixed rate loans and 2.10% per annum on variable rate loans.
The majority of the Company’s mortgages payable require monthly payments of principal and interest. Certain mortgages require reserves for real estate taxes and certain other costs. Mortgages are secured by the respective properties, assignment of rents, business assets, deeds to secure debt, deeds of trust and/or cash deposits with the lender.
Certain Additionally, certain mortgage note agreements include covenants that, in part, impose maintenance of certain debt service coverage and debt to worth ratios. As of December 31, 2017, six2022, eight loans on residential properties were out of compliance due to various unit renovation and parking lotincreased repair and maintenance costs related to unit renovations and increased utility costs. The loans were secured by various properties located in Fargo and Grand Forks, North Dakota with a total outstanding balance of $8,392 at December 31, 2017.$17,687. Annual waivers have beenwere received from the lenders.lenders on all loans out of compliance as of December 31, 2022. As of December 31, 2016,2021, five loans on residential properties were out of compliance due to various unit renovation and parking lotincreased repair and maintenance costs.costs related to unit renovations, bad debt allowance, and increased vacancies in the North Dakota and Minnesota markets. The loans were secured by various properties located in Fargo and Bismarck, North Dakota with a total outstanding balance of $8,336 at December 31, 2016.$9,915. Annual waivers were received from the lenders. lenders on all loans out of compliance as of December 31, 2021.
91
STERLING REAL ESTATE TRUST AND SUBSIDIARIES
NOTES TO CONSOLIDATED FINANCIAL STATEMENTS
DECEMBER 31, 2017, 2016 AND 2015
(Dollar amounts in thousands, except share and per share data)
We are required to make the following principal payments on our outstanding mortgage notes payable for each of the five succeeding fiscal years and thereafter as follows:
| | | |
Years ending December 31, |
| Amount | |
| | (in thousands) | |
2023 | | $ | 53,341 |
2024 | | | 22,376 |
2025 | | | 53,130 |
2026 | | | 45,546 |
2027 | | | 77,845 |
Thereafter | | | 256,067 |
Total payments | | $ | 508,305 |
|
|
|
|
Years ending December 31, |
| Amount | |
|
| (in thousands) | |
2018 |
| $ | 15,593 |
2019 |
|
| 25,364 |
2020 |
|
| 28,045 |
2021 |
|
| 45,935 |
2022 |
|
| 31,210 |
Thereafter |
|
| 251,420 |
Total payments |
| $ | 397,567 |
71
STERLING REAL ESTATE TRUST AND SUBSIDIARIES
NOTES TO CONSOLIDATED FINANCIAL STATEMENTS
DECEMBER 31, 2022, 2021 AND 2020
(Dollar amounts in thousands, except share and per share data)
NOTE 109 – DERIVATIVES AND HEDGING ACTIVITIES
As part of our interest rate risk management strategy, we have used derivative instruments to minimize significant unanticipated earnings fluctuations that may arise from rising variable interest rate costs associated with two borrowings. To meet these objectives, we entered intoderivatives to manage our exposure to interest rate movements and add stability to interest expense. Interest rate swaps designated as cash flow hedges involve the receipt of variable rate amounts from a counterparty in exchange for the Trust making fixed rate payments over the life of the agreement without exchange of the underlying notional amount.
As of December 31, 2022, the Trust used 12 interest rate swaps into hedge the notional amount of $1,294 and $2,450 to provide a fixedvariable cash flows associated with variable rate of 7.25% and 2.57%, respectively. The first swap maturesdebt. Changes in April 2020.The secnd swap matured in December 2017. The swaps were issued at approximate market terms and thus no fair value adjustment was recorded at inception.
The carrying amount of the swaps have been adjusted to their fair values at the end of the quarter, which because of changes in forecasted levels of LIBOR, resulted in reporting a liability for the fair value of the future netderivatives that are designated and that qualify as cash flow hedges are recorded in “Accumulated other comprehensive (loss) income” and are reclassified into interest expense as interest payments forecasted underare made on the swaps. Company’s variable rate debt. During the next 12 months, the Trust estimates that an additional $2,311 will be reclassified as a decrease to interest expense.
The following table summarizes the Trust’s interest rate swaps are accounted fordesignated as effectivecash flow hedges in accordance with ASC 815-20 whereby they are recorded atas of December 31, 2022:
| | | | | | |
| | | | Fixed | | |
Effective Date | | Notional | | Interest Rate | | Maturity Date |
November 1, 2019 | $ | 6,575 | | 3.15% | | November 1, 2029 |
November 1, 2019 | $ | 4,572 | | 3.28% | | November 1, 2029 |
January 10, 2020 | $ | 2,979 | | 3.39% | | January 10, 2030 |
July 1, 2020 | $ | 4,743 | | 2.79% | | June 10, 2030 |
December 2, 2020 | $ | 12,362 | | 2.91% | | December 2, 2027 |
July 1, 2021 | $ | 25,678 | | 2.99% | | July 1, 2031 |
November 10, 2021 | $ | 28,047 | | 3.54% | | August 1, 2029 |
December 1, 2021 | $ | 10,813 | | 3.32% | | December 1, 2031 |
August 15, 2022 | $ | 1,491 | | 3.07% | | June 15, 2030 |
August 15, 2022 | $ | 2,888 | | 3.07% | | June 15, 2030 |
August 15, 2022 | $ | 1,614 | | 2.94% | | June 15, 2030 |
August 15, 2022 | $ | 4,271 | | 2.94% | | June 15, 2030 |
The following table summarizes the Company’s interest rate swaps that were designated as cash flow hedges of interest rate risk:
| | | | | | | | |
| | Number of Instruments | | Notional | ||||
Interest Rate Derivatives | | December 31, 2022 | | December 31, 2021 | | December 31, 2022 | | December 31, 2021 |
Interest rate swaps | | 12 | | 12 | $ | 106,033 | $ | 108,734 |
The table below presents the estimated fair value of the Company’s derivative financial instruments as well as their classification in the accompanying consolidated balance sheets. The valuation techniques are described in Note 10 to the consolidated financial statements.
| | | | | | | | |
Derivatives designated as | | December 31, 2022 | | December 31, 2021 | ||||
cash flow hedges: | | Balance Sheet Location | | Fair Value | | Balance Sheet Location | | Fair Value |
Interest rate swaps | | Other assets, net | $ | 13,782 | | Other assets, net | $ | 698 |
Interest rate swaps | | Accrued expenses and other liabilities | $ | — | | Accrued expenses and other liabilities | $ | 1,648 |
72
STERLING REAL ESTATE TRUST AND SUBSIDIARIES
NOTES TO CONSOLIDATED FINANCIAL STATEMENTS
DECEMBER 31, 2022, 2021 AND 2020
(Dollar amounts in thousands, except share and changesper share data)
The following table presents the effect of the Company’s derivative financial instruments on the accompanying consolidated statements of operations and other comprehensive income (loss) for the years ended December 31, 2022 and 2021:
| | | | | | |
| | | | | | |
| | | | Location of Gain | | |
| | Amount of (Gain)/Loss | | Reclassified from | | |
Derivatives in | | Recognized in Other | | Accumulated other | | Amount of (Gain)/Loss |
Cash Flow Hedging | | Comprehensive Income | | Comprehensive Income | | Reclassified from |
Relationships | | on Derivatives | | (AOCI) into Income | | AOCI into Income |
| | 2022 | | | | 2022 |
Interest rate swaps | $ | (14,732) | | Interest expense | $ | 94 |
| | 2021 | | | | 2021 |
Interest rate swaps | $ | (855) | | Interest expense | $ | 670 |
Credit-risk-related Contingent Features
The Trust has agreements with each of its derivative counterparties that contain a provision whereby if the Trust defaults on the related indebtedness, including default where repayment of the indebtedness has not been accelerated by the lender, then the Trust could also be declared in fair value are recorded to comprehensive income.default on its corresponding derivative obligation. As of December 31, 2017 and 2016, we have recorded2022, the termination value of derivatives in a liability position was $0 and accumulated other comprehensive lossthe termination value of $65 and $145, respectively.derivatives in an asset position was $13,782. As December 31, 2022, the Trust has pledged the properties related to the loans which are hedged as collateral.
NOTE 1110 - FAIR VALUE MEASUREMENT
The following table presents the carrying value and estimated fair value of the Company’s financial instruments:
| | | | | | | | | | | | |
| | December 31, 2022 | | December 31, 2021 | ||||||||
| | Carrying | | | | | Carrying | | | | ||
|
| Value |
| Fair Value |
| Value |
| Fair Value | ||||
| | (in thousands) | ||||||||||
Financial assets: | | | | | | | | | | | | |
Investment in securities | | $ | 29,371 | | $ | 29,371 | | $ | — | | $ | — |
Notes receivable | | $ | 8,448 | | $ | 9,789 | | $ | 7,457 | | $ | 9,840 |
Derivative assets | | $ | 13,782 | | $ | 13,782 | | $ | 698 | | $ | 698 |
| | | ||||||||||
Financial liabilities: | | | | | | | | | | | | |
Mortgage notes payable | | $ | 508,305 | | $ | 466,245 | | $ | 495,650 | | $ | 508,285 |
Derivative liabilities | | $ | — | | $ | — | | $ | 1,648 | | $ | 1,648 |
|
|
|
|
|
|
|
|
|
|
|
|
|
|
| December 31, 2017 |
| December 31, 2016 | ||||||||
|
| Carrying |
|
|
|
| Carrying |
|
|
| ||
|
| Value |
| Fair Value |
| Value |
| Fair Value | ||||
|
| (in thousands) | ||||||||||
Financial liabilities: |
|
|
|
|
|
|
|
|
|
|
|
|
Mortgage notes payable, net |
| $ | 394,843 |
| $ | 396,261 |
| $ | 390,479 |
| $ | 402,015 |
Fair value of interest rate swaps |
| $ | 65 |
| $ | 65 |
| $ | 145 |
| $ | 145 |
The carrying values shown in the table are included in the consolidated balance sheets under the captions indicated captions.
in Note 10. ASC 820-10 established a three-level valuation hierarchy for fair value measurement. Management uses these valuation techniques to establish the fair value of the assets at the measurement date. These valuation techniques are based upon observable and unobservable inputs. Observable inputs reflect market data obtained from independent sources, while unobservable inputs reflect management’s assumptions.
92
73
STERLING REAL ESTATE TRUST AND SUBSIDIARIES
NOTES TO CONSOLIDATED FINANCIAL STATEMENTS
DECEMBER 31, 2017, 20162022, 2021 AND 20152020
(Dollar amounts in thousands, except share and per share data)
These two types of inputs create the following fair value hierarchy:
| Level 1 – Quoted prices for identical instruments in active |
| Level 2 – Quoted prices for similar instruments in active markets; quoted prices for identical or similar instruments in markets that are not active; and model-derived valuations whose significant inputs are |
| Level 3 – Instruments whose significant inputs are unobservable. |
The guidance requires the use of observable market data, when available, in making fair value measurements. When inputs used to measure fair value fall within different levels of the hierarchy, the level within which the fair value measurement is categorized is based on the lowest level input that is significant to the fair value measurement.
Recurring Fair Value Measurements
The following table presents the Company’sTrust’s financial instruments, which are measured at fair value on a recurring basis, by the level in the fair value hierarchy within which those measurements fall. Methods and assumptions used to estimate the fair value of these instruments are described after the table.
| | | | | | | | | | | | |
|
| Level 1 |
| Level 2 |
| Level 3 |
| Total | ||||
| | (in thousands) | ||||||||||
December 31, 2022 | | | | | | | | | | | | |
Derivative assets | | $ | — | | $ | 13,782 | | $ | — | | $ | 13,782 |
| | | | | | | | | | | | |
December 31, 2021 | | | | | | | | | | | | |
Derivative assets | | $ | — | | $ | 698 | | $ | — | | $ | 698 |
Derivative liabilities | | $ | — | | $ | 1,648 | | $ | — | | $ | 1,648 |
| | | | | | | | | | | | |
|
|
|
|
|
|
|
|
|
|
|
|
|
|
| Level 1 |
| Level 2 |
| Level 3 |
| Total | ||||
|
| (in thousands) | ||||||||||
December 31, 2017 |
|
|
|
|
|
|
|
|
|
|
|
|
Fair value of interest rate swaps |
| $ | — |
| $ | 65 |
| $ | — |
| $ | 65 |
December 31, 2016 |
|
|
|
|
|
|
|
|
|
|
|
|
Fair value of interest rate swaps |
| $ | — |
| $ | 145 |
| $ | — |
| $ | 145 |
Fair value of interest rate swaps:Derivatives: The fair value of interest rate swaps is determined using a discounted cash flow analysis on the expected future cash flows of the derivative. This analysis utilizes observable market data including forward yield curves and implied volatilities to determine the market’s expectation of the future cash flows of the variable component. The fixed and variable components of the derivative are then discounted using calculated discount factors developed based on the LIBOR swap rate and are aggregated to arrive at a single valuation for the period. The Company also incorporates credit valuation adjustments to appropriately reflect both its own nonperformance risk and the respective counterparty’s nonperformance risk in the fair value measurements.
Although theThe Company has determined that the majority of the inputs used to value its derivatives fall within Level 2 of the fair value hierarchy, the credit valuation adjustments associated with its derivatives utilize Level 3 inputs, such as estimates of current credit spreads to evaluate the likelihood of default by itself and its counterparties. However, as of December 31, 2017 and 2016, the Company has assessed the significance of the impact of the credit valuation adjustments on the overall valuation of its derivative positions and has determined that the credit valuation adjustments are not significant to the overall valuation. As a result, the Company has determined that its derivative valuations in their entirety are classified within Level 2 of the fair value hierarchy. In adjusting the fair value of its derivative contracts for the effect of nonperformance risk, the Company has considered any applicable credit enhancements. The Company’s derivative instruments are further described in Note 10.
93
STERLING REAL ESTATE TRUST AND SUBSIDIARIES
NOTES TO CONSOLIDATED FINANCIAL STATEMENTS
DECEMBER 31, 2017, 2016 AND 2015
(Dollar amounts in thousands, except share and per share data)
Fair Value Disclosures
The following table presents the Company’s financial assets and liabilities, which are measured at fair value for disclosure purposes, by the level in the fair value hierarchy within which they fall. Methods and assumptions used to estimate the fair value of these instruments are described after the table.
|
|
|
|
|
|
|
|
|
|
|
|
|
|
| Level 1 |
| Level 2 |
| Level 3 |
| Total | ||||
|
| (in thousands) | ||||||||||
December 31, 2017 |
|
|
|
|
|
|
|
|
|
|
|
|
Mortgage notes payable, net |
| $ | — |
| $ | — |
| $ | 396,261 |
| $ | 396,261 |
December 31, 2016 |
|
|
|
|
|
|
|
|
|
|
|
|
Mortgage notes payable, net |
| $ | — |
| $ | — |
| $ | 402,015 |
| $ | 402,015 |
| | | | | | | | | | | | |
|
| Level 1 |
| Level 2 |
| Level 3 |
| Total | ||||
| | (in thousands) | ||||||||||
December 31, 2022 | | | | | | | | | | | | |
U.S. Treasury Bills | | $ | 29,371 | | $ | — | | $ | — | | $ | 29,371 |
Mortgage notes payable | | $ | — | | $ | — | | $ | 466,245 | | $ | 466,245 |
Notes receivable | | $ | — | | $ | — | | $ | 9,789 | | $ | 9,789 |
December 31, 2021 | | | | | | | | | | | | |
Mortgage notes payable | | $ | — | | $ | — | | $ | 508,285 | | $ | 508,285 |
Notes receivable | | $ | — | | $ | — | | $ | 9,840 | | $ | 9,840 |
U.S. Treasury Bills: The Trust estimates the fair value of its Treasury Bills by using quoted market prices.
74
STERLING REAL ESTATE TRUST AND SUBSIDIARIES
NOTES TO CONSOLIDATED FINANCIAL STATEMENTS
DECEMBER 31, 2022, 2021 AND 2020
(Dollar amounts in thousands, except share and per share data)
Mortgage notes payable: The CompanyTrust estimates the fair value of its mortgage notes payable by discounting the future cash flows of each instrument at rates currently offered to the CompanyTrust for similar debt instruments of comparable maturities by the Company’sTrust’s lenders. Judgment is used in determining the appropriate rate for each of the Company’s individual mortgages and notes payable based upon the specific terms of the agreement, including the term to maturity, the quality and nature of the underlying property and its leverage ratio. The rates used range from 4.20%5.75% to 4.52%6.00% and from 4.00%3.25% to 4.35% at 3.35% December 31, 20172022 and 2016,2021, respectively.
Notes receivable: The Trust estimates the fair value of its notes receivable by discounting future cash flows of each instrument at rates currently offered to the Trust for similar note instruments of comparable maturities by the Trust’s lenders. The fair value of the Company’s matured mortgage notes payable were determinedrate ranged from 3.25% to be equal to the carrying value of the properties because there is no market for similar debt instruments7.25% December 31, 2021 and the properties’ carrying value was determined to be the best estimate of fair value. The Company’s mortgage notes payable are further described in Note 9.2022, respectively.
NOTE 1211 – NONCONTROLLING INTEREST OF UNITHOLDERS IN OPERATING PARTNERSHIP
As of December 31, 20172022 and 2016,2021, outstanding limited partnership units totaled 17,517,00018,730,000 and 16,688,000,18,212,000, respectively. Total aggregate distributions per unit for the years ended December 31, 20172022, 2021 and 20162020 were $0.9900$1.1500, $1.0600 and $0.9600,$1.0587, respectively. The operating partnership declared fourth quarter distributions of $4,335$5,385 and $4,005 respectively,$4,827, to limited partners payable in January 20182023 and 2017,2022, respectively.
During the year ended December 31, 2017, Sterling exchanged 8,000 common shares for 8,0002022, there were no limited partnership units held by limited partners, pursuant to redemption requests. The aggregate value of these transactions was $133. During the year ended December 31, 2016, Sterlingoperating partnership exchanged 47,000for common shares for 47,000of the trust.
Provided the Trust’s redemption plan exists, and subject to the conditions and limitations contained in such redemption plan (including, without limitation, applicable holding periods and ownership limitations), and further subject to the conditions and limitations set forth in the LLLP Agreement of the Operating Partnership, a Limited Partner may request the redemption of its limited partnership units held by limited partners, pursuant to redemption requests. The aggregate valuefor cash (a “Redemption Request”) or the exchange of these transactions was $754. During the year ended December 31, 2015, Sterling exchanged 6,000 common shares for 6,000its limited partnership units held by limited partners, pursuant tofor Sterling common shares (an “Exchange Request”). Such request must be made in accordance with the redemption requests. The aggregate valueplan. Upon receipt of these transactions was $87.
Atany Redemption or Exchange Request, as the case may be, the Trust may, at its sole and absolute discretion, acting for itself or as General Partner of the limited partnership, and so long as a Redemption Plan exists,Limited Partners may request the operating partnershipOperating Partnership, elect to redeem theiror exchange such limited partnership units. The operating partnershipTrust may, choose to offer the Limited Partner: (i) cash forin its sole discretion, terminate, amend or suspend the redemption or, atplan if such action is determined to be in the requestbest interest of the Limited Partner, (2) offer shares in lieu of cash for the redemption on a basis of one limited partnership unit for one Sterling common share (the “Exchange Request”). The Exchange Request shall be exercised pursuant to a Notice of Exchange. If the issuance of Sterling common shares pursuant to an Exchange Request will cause the shareholder to exceed the ownership limitations, among other reasons, payment will be made to the Limited Partner in cash. No Limited Partner may exercise an Exchange Request more than twice during any calendar year, and Exchange Requests may not be made for less than 1,000 limited partnership units. If a Limited Partner owns less than 1,000 limited partnership units, all of the limited partnership units held by the Limited Partner must be exchanged pursuant to the Exchange Request.Operating Partnership.
NOTE 1312 – REDEMPTION PLANS
Our Board of Trustees has approved redemption plans that enable our shareholders to sell their common shares and the partners of our operating partnership to sell their limited partnership units to us, after they have held the securities for at least one year and subject to other conditions and limitations described in the plans.
94
STERLING REAL ESTATE TRUST AND SUBSIDIARIES
NOTES TO CONSOLIDATED FINANCIAL STATEMENTS
DECEMBER 31, 2017, 2016 AND 2015
(Dollar amounts in thousands, except share and per share data)
Our redemption plans currently provide that the maximum amount that can be redeemed under the plan is $30,000$55,000 worth of securities. As of December 31, 2022, there were $14,684 worth of securities left to be redeemed under the redemption plan. Currently, the fixed redemption price is $17.50$21.85 per share or unit under the plans which price became effective January 1, 2018.2022. Prior to January 1, 2018,2022, the redemption price was $15.50$19.00 per share or unit under the plan. Prior to January 1, 2021, the redemption price was $18.25 per share or unit under the plan.
We may redeem securities under the plans provided the aggregate total has not been exceeded if we have sufficient funds to do so. The plans will terminate in the event the shares become listed on any national securities exchange, the subject of bona fide quotes on any inter-dealer quotation system or electronic communications network or are the subject of bona fide quotes in the pink sheets. Additionally, the Board, in its sole discretion, may terminate, amend or suspend the redemption plans, either or both of them, if it determines to do so in its sole discretion.
During the years ended December 31, 2017, 20162022, 2021 and 2015,2020, the Company redeemed 72,000, 80,00053,000, 82,000 and 132,000127,000 common shares valued at $1,110, $1,194$1,155, $1,552 and $1,915,$2,321, respectively. In addition, during the years ended December 31, 2017, 20162022, 2021 and 2015,2020, the Company redeemed 83,000, 59,00042,000, 211,000 and 44,00066,000 units valued at $1,284, $868$922, $4,014 and $633,$1,216, respectively.
75
STERLING REAL ESTATE TRUST AND SUBSIDIARIES
NOTES TO CONSOLIDATED FINANCIAL STATEMENTS
DECEMBER 31, 2022, 2021 AND 2020
(Dollar amounts in thousands, except share and per share data)
NOTE 1413 – BENEFICIAL INTEREST
We are authorized to issue 100,000,000 common shares of beneficial interest with $0.01 par value and 50,000,000 preferred shares with $0.01 par value, which collectively represent the beneficial interest of Sterling. As of December 31, 20172022 and 2016,2021, there were 8,488,00010,810,000 and 8,001,00010,342,000 common shares outstanding. We had no preferred shares outstanding as of either date.
Dividends paid to holders of common shares were $0.9900$1.1500 per share, $0.9600$1.0600 per share and $0.9300$1.0587 per share for the years ended December 31, 2017, 20162022, 2021 and 2015,2020, respectively.
NOTE 1514 – DIVIDEND REINVESTMENT PLAN
Our Board of Trustees approved a dividend reinvestment plan to provide existing holders of our common shares with a convenient method to purchase additional common shares without payment of brokerage commissions, fees or service charges. On July 20, 2012, we registered with the Securities Exchange Commission 2,000,000 common shares to be issued under the plan on Form S-3D, which automatically became effective on July 20, 2012. On July 11, 2017, we registered with the Securities Exchange Commission an additional 2,000,000 common shares to be issued under the plan on Form S-3D, which automatically became effective on July 11, 2017. On November 3, 2020, we registered with the Securities Exchange Commission an additional 2,000,000 common shares to be issued under the plan on Form S-3D, which automatically became effective on November 3, 2020.
Under this plan, eligible shareholders canmay elect to have all or a portion (but not less than 25%) of the cash dividends they receive automatically reinvested in our common shares. If an eligible shareholder elects to reinvest cash dividends under the plan, the shareholder may also make additional optional cash purchases of our common shares, not to exceed $10 per fiscal quarter without our prior approval. The purchase price per common share under the plan equals 95% of the estimated value per common share for dividend reinvestments and equals 100% of the estimated value per common share for additional optional cash purchases, as determined by our Board of Trustees. In addition, participantseligible shareholders may not in any calendar year purchase or receive via transfer more than $40 inadditional optional cash purchases of Common Shares derived from the rights granted to Participants under this amendment.Shares.
The estimated value per common share was $16.50$23.00 and $16.00$20.00 at December 31, 20172022 and 2016,2021, respectively. See discussion of determination of estimated value in Note 20.
Therefore, the purchase price per common share for dividend reinvestments was $15.68$21.85 and $15.20$19.00 and for additional optional cash purchases was $16.50$23.00 and $16.00$20.00 at December 31, 20172022 and 2016,2021, respectively. The Board, in its sole discretion, may amend, suspend or terminate the plan at any time, without the consent of shareholders, upon a ten dayten-day notice to participants.
In the year ended December 31, 2017, 331,0002022, 342,000 shares were issued pursuant to dividend reinvestments and 216,000177,000 shares were issued pursuant to additional optional cash purchases under the plan. In the year ended December 31, 2016, 315,0002021, 363,000 shares were issued pursuant to dividend reinvestments and 136,000203,000 shares were issued pursuant to additional optional cash purchases under the plan. In the year ended December 31, 2015, 284,0002020, 356,000 shares were issued pursuant to dividend reinvestments and 116,000187,000 shares were issued pursuant to additional optional cash purchases under the plan.
NOTE 15 – RELATED PARTY TRANSACTIONS
Effective January 1, 2021, Trustmark Enterprises, Inc. was formed to act as the holding company for Sterling Management, LLC and GOLDMARK Property Management, Inc. In connection with this restructuring transaction, the owners of Trustmark Enterprises, Inc. indirectly own Sterling Management, LLC and GOLDMARK Property Management, Inc. Trustmark Enterprises, Inc. is owned in part by the Trust’s Chief Executive Officer and Trustee Mr. Kenneth P. Regan, by Trustee Mr. James S. Wieland, and by President Joel S.
95
76
STERLING REAL ESTATE TRUST AND SUBSIDIARIES
NOTES TO CONSOLIDATED FINANCIAL STATEMENTS
DECEMBER 31, 2017, 20162022, 2021 AND 20152020
(Dollar amounts in thousands, except share and per share data)
Thomsen. In addition, Mr. Regan serves as the Executive Chairman of the Advisor, and Messrs. Wieland, and Thomsen serve on the Board of Governors of both the Advisor and GOLDMARK Property Management, Inc.
NOTE 16 – RELATED PARTY TRANSACTIONSSterling Management, LLC (the “Advisor”), is a North Dakota limited liability company formed in November 2002. The Advisor is responsible for managing day-to-day affairs, overseeing capital projects, and identifying, acquiring, and disposing investments on behalf of the trust.
GOLDMARK Property Management, Inc., is a North Dakota corporation formed in 1981. GOLDMARK Property Management, Inc. performs property management services for the Trust.
We have a historical and ongoing relationship with Bell Bank. Bell Bank has provided the Trust certain financial services throughout the relationship. Mr. Wieland, a Trustee, also serves as a Board Member of Bell Bank. Mr. Wieland could have an indirect material interest in any such engagement and related transactions.
The Trust has a historical and ongoing relationship with Trumont Group and Trumont Construction. Trumont Group provides development services for current joint venture projects in which the Operating Partnership is an investor. Trumont Construction has been engaged to construct the properties associated with these joint ventures. Mr. Regan, Chief Executive Officer and trustee, is a partner in both Trumont Group and Trumont Construction and has a direct material interest in any engagement or related transaction, the Trust enters into, with these entities.
Property Management Fee
During the years ended December 31, 2017, 20162022, 2021 and 2015,2020, we paid property management and administrative fees to GOLDMARK Property Management, in an amount equal to approximatelyInc. of $13,833, $12,836, and $12,796, respectively. Management fees which approximate 5% of net collected rents, account for $5,499, $5,271, and $4,851 of the properties managed. GOLDMARK Property Management is owned in part by Kenneth Regan and James Wieland. Forthese fees during the years ended December 31, 2017, 20162022, 2021 and 2015, we paid management fees of $11,359, $9,929, and $9,304 respectively, to GOLDMARK Property Management.2020. In addition, during the years ended December 31, 2017, 20162022, 2021, and 2015,2020, we paid repair and maintenance related payrollexpenses, and payroll related expenses to GOLDMARK Property Management, Inc. totaling $5,030, $4,556$7,744, $6,536, and $3,961, respectively.$6,549, respectively
Board of Trustee Fees
We incurred Trustee fees of $56, $59 and $51 during the years ended December 31, 2017, 2016 and 2015, respectively. As of December 31, 2017, and 2016 we owed our Trustees $23 and $26 for unpaid board of trustee fees, respectively. There is no cash retainer paid to Trustees. Instead, we pay Trustees specific amounts of shares for meetings attended. Our Trustee Compensation Plan provides:
|
| ||
|
| ||
|
| ||
|
| ||
Common shares earned in accordance with the plan are calculated on an annual basis. Shares earned pursuant to the Trustee Compensation Plan are issued on or about July 15 for Trustees’ prior year of service. Non-independent Trustees are not compensated for their service on the Board or Committees.
Advisory Agreement
We are an externally managed trust and as such, although we have a Board of Trustees and executive officers responsible for our management, we have no paid employees. The following is a brief descriptionAdvisor may receive fees related to management of the currentTrust, acquiring, disposing, or developing real estate property, project management fees, and compensation that may be received by the Advisorfinancing fees related to lending relationships, under the Advisory Agreement, which must be renewed on an annual basis and approved by a majority of the independent trustees. The Advisory Agreement was approved by the Board of Trustees (including all the independent Trustees) on April 6, 2017,March 24, 2022, and is effective January 1, 2017. until March 31, 2023.
The below table summarizes the fees incurred to our Advisor.
Management Fee: 0.35% of our total assets (before depreciation and amortization), annually. Total assets are our gross assets (before depreciation and amortization) as reflected on our consolidated financial statements, taken as of the end of the fiscal quarter last preceding the date of computation. The management fee will be payable monthly in cash or our common shares, at the option of the Advisor, not to exceed one-twelfth of 0.35% of the total assets as of the last day of the immediately preceding month. The management fee calculation is subject to quarterly and annual reconciliations. The management fee may be deferred at the option of the Advisor, without interest.
| | | | | | | | | |
| | Year Ended December 31, | |||||||
| | 2022 | | 2021 | | 2020 | |||
| | (in thousands) | |||||||
Fee: | | | | | | | | | |
Advisory | | $ | 3,683 | | $ | 3,348 | | $ | 3,116 |
Acquisition | | $ | 1,321 | | $ | 375 | | $ | 708 |
Disposition | | $ | 703 | | $ | 146 | | $ | 319 |
Financing | | $ | 83 | | $ | 224 | | $ | 133 |
Project Management | | $ | 450 | | $ | 572 | | $ | 365 |
Acquisition Fee: For its services in investigating and negotiating acquisitions of investments for us, the Advisor receives an acquisition fee of 2.5% of the purchase price of each property acquired, capped at $375 per acquisition. The total of all acquisition fees and acquisition expenses cannot exceed 6% of the purchase price of the investment, unless approved by a majority of the trustees, including a majority of the independent trustees, if they determine the transaction to be commercially competitive, fair and reasonable to us.
Disposition Fee: For its services in the effort to sell any investment for us, the Advisor receives a disposition fee of 2.5% of the sales price of each property disposition, capped at $375 per disposition.
96
77
STERLING REAL ESTATE TRUST AND SUBSIDIARIES
NOTES TO CONSOLIDATED FINANCIAL STATEMENTS
DECEMBER 31, 2017, 20162022, 2021 AND 20152020
(Dollar amounts in thousands, except share and per share data)
Financing Fee: 0.25% of all amounts made available to us pursuant to any loan, refinance (excluding rate and/or term modifications of an existing loan withThe below table summarizes the same lender), line of credit or other credit facility. The finance fee shall be capped at $38 per loan, refinance, line of credit or other credit facility.
Development Fee: Based on regressive sliding scale (starting at 5% and decliningfees payable to 3%) of total project costs, excluding cost of land, for development services requested by us.
|
|
|
| ||||
|
|
|
| ||||
|
|
|
| ||||
|
|
|
| ||||
|
|
|
| ||||
|
|
|
| ||||
TC = Total Project Cost
Management Fees
During the years ended December 31, 2017, 2016 and 2015, we incurred advisory management fees of $2,830, $2,644 and $2,401 with Sterling Management, LLC, our Advisor. As of December 31, 2017 and 2016, we owed our Advisor $238 and $226, respectively, for unpaid advisory management fees. These fees cover the office facilities, equipment, supplies, and staff required to manage our day-to-day operations. In addition, during the years ended December 31, 2017, 2016 and 2015, we reimbursed the Advisor for operating costs such as travel and meals, legal and office supplies totaling $11, $37, and $22, respectively.
| | | | | | |
| | Payable at | ||||
| | December 31, | | December 31, | ||
| | 2022 | | 2021 | ||
| | (in thousands) | ||||
Fee: | | | | | | |
Advisory | | $ | 632 | | $ | 296 |
Acquisition | | $ | 387 | | $ | - |
Development | | $ | - | | $ | 79 |
Disposition | | $ | 72 | | $ | - |
Financing | | $ | - | | $ | 38 |
Project Management | | $ | 12 | | $ | 98 |
Acquisition Fees
During the years ended December 31, 2017, 2016 and 2015, we incurred acquisition fees of $727, $903, and $1,128 respectively, with our Advisor. There were no acquisition fees owed to our Advisor as of December 31, 2017. As of December 31, 2016, we owed our Advisor $223 for unpaid acquisition fees.
Financing Fees
During the year ended December 31, 2017 and 2016 and 2015, we incurred financing fees of $114, $68 and $270 with our Advisor for loan financing and refinancing activities. There were no financing fees owed to our Advisor as of December 31, 2017 and 2016.
Disposition Fees
During the years ended December 31, 2017, 2016 and 2015, we incurred disposition fees of $110, $100 and $36 with our Advisor. See Note 19. There were no disposition fees owed to our Advisor as of December 31, 2017 and 2016, respectively.
Development Fees
During the years ended December 31, 2017, 2016 and 2015, we incurred $235, $170 and $336 in development fees with our Advisor. As of December 31, 2017 and 2016, we owed our Advisor a total of $104 and $81 for unpaid development fees, of which $104 and $81 were unpaid development fees as part of a 10% hold back, respectively.
Operating Partnership Units Issued in Connection with Acquisitions
During the year ended December 31, 2017, we2022, 510,000 Operating Partnership units were issued directly or indirectly, 408,000 operating partnership (OP) units to entitiesan entity affiliated with Messrs. Regan Wieland, two of our trustees, and Messr. Swenson, a former officer in connection with the acquisition of various properties. The aggregate value of these units was $6,536.
97
STERLING REAL ESTATE TRUST AND SUBSIDIARIES
NOTES TO CONSOLIDATED FINANCIAL STATEMENTS
DECEMBER 31, 2017, 2016 AND 2015
(Dollar amounts in thousands, except share and per share data)
During the year ended December 31, 2016, we issued directly or indirectly, 551,000 operating partnership (OP) units to entities affiliated with Messrs. Regan, Wieland, two of our trustees, and Messr. Swenson, a former officer in connection with the acquisition of various properties. The aggregate value of these units was $8,650.
During the year ended December 31, 2015, we issued directly or indirectly, 242,000 operating partnership (OP) units to entities affiliated with Messrs. Regan, Wieland, two of our trustees, in connection with the acquisition of various properties. The aggregate value of these units was $3,754. $11,741.
CommissionsDuring the year ended December 31, 2021, there were no Operating Partnership units issued directly or indirectly, to affiliated entities.
During the year ended December 31, 2020, 208,000 Operating Partnership units were issued to an entity affiliated with Messrs. Regan and Wieland, two of our trustees, in connection with the acquisition of various properties. The aggregate value of these units was $4,671.
Commissions
During the years ended December 31, 2017, 20162022, 2021 and 2015,2020, we incurred real estate commissions of $572, $953,$567, $312, and $1,033$633, respectively, owed to GOLDMARK Commercial Real Estate, Services, Inc., in which is controlled by Messrs. Regan and Wieland. There were no outstanding commissions owed asWieland jointly own a controlling interest. As of December 31, 2017 or 2016. 2022, there were commissions of $183 payable to GOLDMARK Commercial Real Estate. As of December 2021 and 2020, there were no unpaid commissions to GOLDMARK Commercial Real Estate.
Rental Income
During the years ended December 31, 2017, 20162022, 2021 and 2015,2020, we incurred real estate commissions of $418, $217, and $308, respectively to GOLDMARK Property Management. As of December 31, 2022, there were commissions of $92 payable to GOLDMARK Property Management. As of December 31, 2021 and 2020 there were no unpaid commissions to GOLDMARK Property Management.
Rental Income
During the years ended December 31, 2022, 2021 and 2020, we received rental income of $223, $215$130, $106, and $215,$85, respectively, under an operating lease agreement with GOLDMARK Property Management.our Advisor.
During the years ended December 31, 2017, 20162022, 2021 and 2015,2020, we received no rental income, $54, $53$19, and $51,$57, respectively, under an operating lease agreement with GOLDMARK Commercial Real Estate, Services, Inc.
During the years ended December 31, 2017, 20162022, 2021 and 2015,2020, we received rental income of $45, $45$267, $294, and $43,$268, respectively, under operating lease agreements with our Advisor.GOLDMARK Property Management, Inc.
Construction CostsDuring the years ended December 31, 2022, 2021 and 2020, we received rental income of $859, $404, and $484, respectively, under operating lease agreements with Bell Bank.
78
STERLING REAL ESTATE TRUST AND SUBSIDIARIES
NOTES TO CONSOLIDATED FINANCIAL STATEMENTS
DECEMBER 31, 2022, 2021 AND 2020
(Dollar amounts in thousands, except share and per share data)
Other operational costs
During the years ended December 31, 2022, 2021 and 2020, the Trust incurred $207, $276, and $240, respectively, for general costs related to business operations as well as capital expenditures related to construction in progress that were paid to related parties. At December 31, 2022 and 2021, there were no operational outstanding liabilities and $128, respectively.
During the years ended December 31, 2022 and 2020, the Trust received did not receive related parties reimbursement for expenses paid that were associated with capital projects. During the year ended December 31, 2021, the Trust received $1,000 from related parties for reimbursement for expenses paid that were associated with capital projects. No reimbursements for operational receivables were received during the year ended December 31, 2022. At December 31, 2022, operational receivables outstanding due from related parties was $50 and $336, respectively.
Debt Financing
At December 31, 2022 and 2021, the Trust had $64,123 and $66,365, respectively, of outstanding principal on loans entered into with Bell Bank. During the years ended December 31, 2022, 2021 and 2020, the Trust incurred interest expense on debt held with Bell Bank of $2,480, $2,508, and $2,438, respectively. Accrued interest at December 31, 2022 and 2021, related to this debt was $130 and $148, respectively.
A December 31, 2022 and 2021, the Trust had $26,500 and $-, respectively, of outstanding principal on notes payable entered into with Bell Bank. During the years ended December 31, 2022, 2021 and 2020, the Trust did not incur interest expense on note payable held with Bell Bank.
Mezzanine Financing
The Trust offers mezzanine financing to joint ventures, see note 5 for investment in unconsolidated affiliates.
As of December 31, 2017, since Phase II2022 and 2021, Sterling issued $5,854 and $6,855, respectively, in second mortgage financing to related entities.
During the years ended December 31, 2022 and 2021, the Trust earned interest income of the Bismarck, North Dakota development project’s inception through its completion in August 2017, we incurred total costs of $8,997$350 and $212, respectively, related to the second mortgage financing. No interest income was earned during the year ended December 31, 2020.
Insurance Services
The Trust retains insurance services from Bell Insurance. Policies provided by these services provide insurance coverage for the Trust’s Commercial segment as well as Director and Officer general and liability coverage. At December 31, 2022, 2021, and 2020 total premiums incurred for this policy were $48, $166 and $118, respectively.
Tenant Improvement Arrangements
During the year ended December 31, 2021, the Trust paid $2,782 in tenant improvement costs associated with a lease agreement with Trustmark Enterprises, Inc. There were no tenant improvement costs incurred during the years ended December 31, 2022 and 2020. At December 31, 2022, no costs were owed to related parties for tenant improvement costs.
Development Arrangements
Effective August 25, 2021, The Trust purchased a 70% interest in ST Oak Cliff Dallas, LLC. The purpose of the entity is to develop and construct a 318-unit multifamily property located in Dallas, Texas. The partnering investee, TG Oak Cliff Dallas, LLC is owned in part by Kenneth P. Regan, the Trust’s Chief Executive Officer and Trustee. Mr. Regan is also a partner in Trumont Group, the developer
79
STERLING REAL ESTATE TRUST AND SUBSIDIARIES
NOTES TO CONSOLIDATED FINANCIAL STATEMENTS
DECEMBER 31, 2022, 2021 AND 2020
(Dollar amounts in thousands, except share and per share data)
engaged by ST Oak Cliff Dallas, LLC to oversee the development of the property. Further, Mr. Regan is also a partner in Trumont Construction, the company who was engaged to oversee the day-to-day construction operations of a clubhousethe property.
During the years ended December 31, 2022 and six 6-plex two-story townhomes2021, the Trust incurred and paid $411 and $256, respectively, in development fees to GOLDMARK Development, which is controlled by Messrs. ReganTrumont Group. No such fees were paid during the year ended December 31, 2020. At December 31, 2022 the Trust owed $- and Wieland. There was no retainage or unpaid$51, respectively, in development fees to Trumont Group.
During the years ended December 31, 2022 and 2021, the Trust incurred and paid $799 and $71, respectively, in construction fees to Trumont Construction. No such fees were paid during the year ended December 31, 2020. At December 31, 2022 the Trust owed $71 and $29, respectively, in construction fees to Trumont Construction.
During the years ended December 31, 2022 and 2021, the Trust incurred and paid $639 and $41, respectively, in general construction costs to Trumont Construction. No such fees were paid during the year ended December 31, 2020. At December 31, 2022 there was $81 of general construction costs were owed to GOLDMARK Development as ofTrumont Construction. At December 31, 2017. As of December 31, 2016, we2021, no general construction costs were owed GOLDMARK Development $288 for retainage and $398 for unpaid construction fees.to Trumont Construction.
NOTE 1716 - RENTALS UNDER OPERATING LEASES / RENTAL INCOME
Residential apartment units are rented to individual tenants with lease terms of one year or less. Gross revenues from residential rentals totaled $86,859, $80,497 and $75,914 for the years ended December 31, 2017, 2016 and 2015, respectively.
Commercial properties are leased to tenants under terms expiring at various dates through 2034.2038. Lease terms often include renewal options. For
As of December 31, 2022, we derived 84.4% of our revenues from residential leases that are generally for terms of one-year or less. The residential leases may include lease income related to such items as parking, storage and non-refundable deposits that we treat as a single lease component because amenities cannot be leased on their own and the timing and pattern of revenue recognition are the same. The collection of lease payments at lease commencement is probable and therefore we subsequently recognize lease income over the lease term on a straight-line basis. Residential leases are renewable upon consent of both parties on an annual or monthly basis.
As of December 31, 2022, we derived 15.6% of our revenues from commercial leases primarily under long-term lease agreements. Substantially all commercial leases contain fixed escalations, or, in some instances, changes based on the Consumer Price Index, which occur at specified times during the term of the lease. In certain commercial leases, variable lease income, such as percentage rent, is recognized when rents are earned. We recognize rental income and rental abatements from our commercial leases on a straight-line basis over the lease term. Recognition of rental income commences when control of the leased space has been transferred to the tenant.
We recognize variable income from pass-through expenses on an accrual basis over the periods in which the expenses were incurred. Pass-through expenses are comprised of real estate taxes, operating expenses and common area maintenance costs which are reimbursed by tenants in accordance with specific allowable costs per tenant lease agreements. When we pay pass-through expenses, subject to reimbursement by the tenant, they are included within operating expenses, excluding real estate taxes, and reimbursements are included within “real estate rental income” along with the associated base rent in the accompanying consolidated financial statements.
We record base rents on a straight-line basis. The monthly base rent income according to the terms of our leases is adjusted so that an average monthly rent is recorded for each tenant over the term of its lease. The straight-line rent adjustment increased revenue by $302 for the year ended December 31, 2022, and increased revenue by $550 for the year ended December 31, 2021. The straight-line receivable balance included in other assets on the consolidated balance sheets as of the years ended December 31, 2017, 20162022 and 2015, gross revenues2021 was $3,756 and $3,569 respectively. We receive payments for expense reimbursements from substantially all our multi-tenant commercial property rentals, including CAM income (common area maintenance) of $6,162, $6,178 and $3,852, respectively, totaled $27,439, $27,566 and $21,268, respectively.tenants throughout the year based on estimates.
98
80
STERLING REAL ESTATE TRUST AND SUBSIDIARIES
NOTES TO CONSOLIDATED FINANCIAL STATEMENTS
DECEMBER 31, 2017, 20162022, 2021 AND 20152020
(Dollar amounts in thousands, except share and per share data)
Lease income related to the Trust’s operating leases is comprised of the following:
| | | | | | | | | |
| | Year ended December 31, 2022 | |||||||
|
| Residential |
| Commercial |
| Total | |||
| | (in thousands) | |||||||
Lease income related to fixed lease payments | | $ | 109,769 | | $ | 16,091 | | $ | 125,860 |
Lease income related to variable lease payments | | | — | | | 4,510 | | | 4,510 |
Other (a) | | | (804) | | | 332 | | | (472) |
Lease Income (b) | | $ | 108,965 | | $ | 20,933 | | $ | 129,898 |
| (a) | For the year ended December 31, 2022, “Other” is comprised of revenue adjustments related to changes in collectability and amortization of above and below market lease intangibles and lease inducements. |
| (b) | Excludes other rental income for the year ended December 31, 2022, of $5,162, which is accounted for under the revenue recognition standard. |
| | | | | | | | | |
| | Year ended December 31, 2021 | |||||||
|
| Residential |
| Commercial |
| Total | |||
| | (in thousands) | |||||||
Lease income related to fixed lease payments | | $ | 103,039 | | $ | 16,490 | | $ | 119,529 |
Lease income related to variable lease payments | | | — | | | 4,576 | | | 4,576 |
Other (c) | | | (538) | | | 630 | | | 92 |
Lease Income (d) | | $ | 102,501 | | $ | 21,696 | | $ | 124,197 |
| (c) | For the year ended December 31, 2021, “Other” is comprised of revenue adjustments related to changes in collectability and amortization of above and below market lease intangibles and lease inducements. |
| (d) | Excludes other rental income for the year ended December 31, 2021, of $5,127, which is accounted for under the revenue recognition standard. |
Commercial space is rented under long-term agreements. Minimum future rentals on non-cancelable operating leases as of December 31, 20172022 are as follows:
|
|
|
|
Years ending December 31, |
| Amount | |
|
| (in thousands) | |
2018 |
| $ | 19,564 |
2019 |
|
| 18,918 |
2020 |
|
| 17,555 |
2021 |
|
| 13,718 |
2022 |
|
| 10,135 |
Thereafter |
|
| 54,639 |
|
| $ | 134,529 |
| | | |
Years ending December 31, |
| Amount | |
| | (in thousands) | |
2023 | | $ | 15,216 |
2024 | | | 14,940 |
2025 | | | 14,556 |
2026 | | | 13,156 |
2027 | | | 11,719 |
Thereafter | | | 42,734 |
| | $ | 112,321 |
NOTE 1817 - COMMITMENTS AND CONTINGENCIES
Environmental Matters
Federal law (and the laws of some states in which we own or may acquire properties) imposes liability on a landowner for the presence on the premises of hazardous substances or wastes (as defined by present and future federal and state laws and regulations). This liability is without regard to fault or knowledge of the presence of such substances and may be imposed jointly and severally upon all succeeding landowners. If such hazardous substance is discovered on a property acquired by us, we could incur liability for the removal of the substances and the cleanup of the property.
81
STERLING REAL ESTATE TRUST AND SUBSIDIARIES
NOTES TO CONSOLIDATED FINANCIAL STATEMENTS
DECEMBER 31, 2022, 2021 AND 2020
(Dollar amounts in thousands, except share and per share data)
There can be no assurance that we would have effective remedies against prior owners of the property. In addition, we may be liable to tenants and may find it difficult or impossible to sell the property either prior to or following such a cleanup.
Risk of Uninsured Property Losses
We maintain property damage, fire loss, and liability insurance. However, there are certain types of losses (generally of a catastrophic nature) which may be either uninsurable or not economically insurable. Such excluded risks may include war, earthquakes, tornados, certain environmental hazards, and floods. Should such events occur, (i) we might suffer a loss of capital invested, (ii) tenants may suffer losses and may be unable to pay rent for the spaces, and (iii) we may suffer a loss of profits which might be anticipated from one or more properties.
Litigation
The Company is subject, from time to time, to various legal proceedings and claims that arise in the ordinary course of business. While the resolution of such matters cannot be predicted with certainty, management believes, based on currently available information, that the final outcome of such matters will not have a material effect on the consolidated financial statements of the Company.Trust.
NOTE 1918 – DISPOSITIONS
During September 2016, the Company entered into a purchase agreement to sell a retail property located in Fargo, North Dakota. This property qualified for held for sale accounting treatment upon meeting all applicable GAAP criteria on or prior to September 30, 2016, at which time depreciation and amortization ceased. As such, the assets and liabilities associated with this property were separately classified as held for sale in the consolidated balance sheet as of December 31, 2016. During the second quarter ended June 30, 2017, the operating partnership sold the Fargo, North Dakota retail property for approximately $4,400 and recognized a gain of $2,072.
During the year ended December 31, 2016,2022, the operating partnershipOperating Partnership sold five properties. We sold a medicalretail property located in Eau Claire, WisconsinSavage, Minnesota for approximately $1,400a sale price of $2,700 and recognized a gain of $1,328 in March 2022. We sold a residential property located in Moorhead, Minnesota for a sale price of $6,400 and recognized a gain of $2,012 in May 2022. We sold an office property located in Edina, Minnesota for a sale price of $15,320 and recognized a gain of $6,728 in August 2022. We sold a residential property located in East Grand Forks, MN for a sale price of $1,200 and recognized a loss of $316.$171 in September 2022. We sold a retail property located in Bloomington, Minnesota for a sale price of $2,888 and recognized a gain of $1,193 in December 2022.
During the year ended December 31, 2021, the Operating Partnership sold two properties. We sold a retail property located in Waite Park, Minnesota, for a sale price of $900 and recognized a gain of $2 in April 2021. We sold a residential property located in Moorhead, Minnesota, for a sale price of $4,950 and recognized a gain of $1,708 in June 2021.
During the year ended December 31, 2020, the Operating Partnership sold three properties. We sold a retail property located in Apple Valley, Minnesota, for a sale price of $3,670 and recognized a gain of $1,456 in March 2020. We sold an office property located in St. Cloud, Minnesota, for a sale price of $2,050 and recognized a gain of $1 in May 2020. We sold an office property located in Bismarck, North Dakota for a sale price of $7,000 and recognized a gain of $1,926 in December 2020.
99
82
STERLING REAL ESTATE TRUST AND SUBSIDIARIES
NOTES TO CONSOLIDATED FINANCIAL STATEMENTS
DECEMBER 31, 2017, 20162022, 2021 AND 20152020
(Dollar amounts in thousands, except share and per share data)
The following table presents the assets and liabilities associated with the real estate investments held for sale:
|
|
|
|
|
|
|
|
| December 31, |
| December 31, | ||
|
| 2017 |
| 2016 | ||
|
| (in thousands) | ||||
ASSETS |
|
|
|
|
|
|
Real estate investments |
| $ | — |
| $ | 2,365 |
Restricted deposits and funded reserves |
|
| — |
|
| 22 |
Receivables |
|
| — |
|
| 25 |
Notes receivable |
|
| — |
|
| 42 |
Financing and lease costs, less accumulated amortization of $87 in 2016 |
|
| — |
|
| 28 |
|
|
|
|
|
|
|
Total Assets |
| $ | — |
| $ | 2,482 |
|
|
|
|
|
|
|
LIABILITIES |
|
|
|
|
|
|
Special assessments payable |
| $ | — |
| $ | 103 |
Tenant security deposits payable |
|
| — |
|
| 22 |
|
|
|
|
|
|
|
Total Liabilities |
| $ | — |
| $ | 125 |
NOTE 19 –ACQUISITIONS
NOTE 20 – BUSINESS COMBINATIONS AND ACQUISITIONS
The Company closed onacquired the following acquisitionsproperties during the year ended December 31, 2017:2022.
|
|
|
|
|
|
|
|
|
|
|
|
|
|
|
|
Date |
| Property Name |
| Location |
| Property Type |
|
| Units/ Square Footage/ Acres |
|
| Acquisition Price |
|
| Prorata Acquisition Price |
|
|
|
|
|
|
|
|
|
|
|
|
|
|
|
|
1/10/17 |
| Sargent Apartments |
| Fargo, ND |
| Apartment complex |
|
| 36 units |
| $ | 1,710 |
| $ | 1,710 |
1/11/17 |
| Arrowhead Apartments |
| Grand Forks, ND |
| Apartment complex |
|
| 82 units |
|
| 5,494 |
|
| 5,494 |
1/17/17 |
| West Oak Apartments |
| Fargo, ND |
| Apartment complex |
|
| 18 units |
|
| 777 |
|
| 777 |
1/17/17 |
| Carr Apartments |
| Fargo, ND |
| Apartment complex |
|
| 18 units |
|
| 828 |
|
| 828 |
5/1/17 |
| Plumtree Apartments |
| Fargo, ND |
| Apartment complex |
|
| 18 units |
|
| 907 |
|
| 907 |
5/1/17 |
| Sunchase Apartments |
| Fargo, ND |
| Apartment complex |
|
| 36 units |
|
| 1,765 |
|
| 1,765 |
6/1/17 |
| Essex Apartments |
| Fargo, ND |
| Apartment complex |
|
| 18 units |
|
| 858 |
|
| 858 |
6/1/17 |
| Jadestone Apartments |
| Fargo, ND |
| Apartment complex |
|
| 18 units |
|
| 809 |
|
| 809 |
6/1/17 |
| Park Circle Apartments |
| Fargo, ND |
| Apartment complex |
|
| 18 units |
|
| 903 |
|
| 903 |
7/3/17 |
| East Bridge Apartments (a) |
| Fargo, ND |
| Apartment complex |
|
| 58 units |
|
| 6,060 |
|
| 6,060 |
12/1/17 |
| Birchwood I Apartments |
| Fargo, ND |
| Apartment complex |
|
| 18 units |
|
| 401 |
|
| 401 |
12/1/17 |
| Birchwood II Apartments |
| Fargo, ND |
| Apartment complex |
|
| 48 units |
|
| 2,425 |
|
| 2,425 |
|
|
|
|
|
|
|
|
|
|
|
|
|
|
|
|
|
|
|
|
|
|
|
|
|
|
| $ | 22,937 |
| $ | 22,937 |
| | | | | | | | | | | | |
Date | | Property Name | | Location | | Property Type | | | Units/ Square Footage/ Acres | | Total Acquisition Cost | |
2/28/22 | | Deer Park | | Hutchinson, MN | | Apartment Complex | | | 138 units | | $ | 15,073 |
5/31/22 | | Desoto Estates | | Grand Forks, ND | | Apartment Complex | | | 68 units | | | 5,863 |
5/31/22 | | Desoto Townhomes | | Grand Forks, ND | | Townhomes | | | 24 units | | | 3,226 |
5/31/22 | | Desoto Apartments | | East Grand Forks, MN | | Apartment Complex | | | 24 units | | | 1,230 |
6/10/22 | | Diamond Bend | | Mandan, ND | | Apartment Complex | | | 78 units | | | 10,919 |
9/13/22 | | Newgate Apartments | | Bismarck, ND | | Apartment Complex | | | 46 units | | | 2,444 |
12/1/22 | | Chandler 1898 | | Grand Forks, ND | | Apartment Complex | | | 12 units | | | 498 |
12/29/22 | | Prose Fossil Creek | | Fort Worth, TX | | Apartment Complex | | | 270 units | | | 55,591 |
| | | | | | | | | | | | |
| | | | | | | | | | | $ | 94,844 |
|
|
|
|
The acquisition of Prose Fossil Creek was made utilizing a Reverse 1031 Like-Kind Exchange that was entered into at closing. As such, as of December 29, 2022, Prose Fossil Creek is in the possession of a qualified intermediary engaged to execute the Reverse 1031 Like-Kind Exchange until the sale transaction and the Reverse 1031 Like-Kind Exchange are completed. The Trust retains essentially all of the legal and economic benefits and obligations related to Prose Fossil Creek prior to the completion of the Reverse 1031 Like-Kind Exchange. Accordingly, Prose Fossil Creek is included in the Trust’s consolidated financial statements as a consolidated VIE until legal title is transferred to the Trust upon completion of the Reverse 1031 Like-Kind Exchange.
Total consideration given for acquisitions throughthe year ended December 31, 20172022 was completed through issuing approximately 625,000560,000 limited partnership units of the operating partnership valued at $16.00 and $16.50$23.00 per unit for an aggregate consideration of approximately $10,006, 1031 tax-deferred exchange funds of $4,278, new loans of $4,180, assumed liabilities of $132 and cash of $4,599.$12,870. The value of units issued in exchange for property is determined through a value established annually by our Board of Trustees and reflects the fair value at the time of issuance.
In addition, as of May 1, 2017, the operating partnership acquired the remaining 59.74% ownership interest in a 144 unit property which was previously held as tenant in common (See Note 2). We estimated the property had a fair value of approximately $10,080. The
100
STERLING REAL ESTATE TRUST AND SUBSIDIARIES
NOTES TO CONSOLIDATED FINANCIAL STATEMENTS
DECEMBER 31, 2017, 2016 AND 2015
(Dollar amounts in thousands, except share and per share data)
operating partnership assumed a loan of $1,295 and issued $4,727 of limited partnership units for a total purchase price of approximately $6,022. The Company accounted for this as a business combination and recognized a gain on change in control of real estate investment of $2,186 in the second quarter of 2017 as a result of remeasuring the carrying value to fair value. The total loan on this property was $2,167, thus in addition to the portion of the loan assumed from the other tenant in common, the Company also recorded an additional $872 in new financing related to this acquisition.
The Company closed onacquired the following acquisitionsproperties during the year ended December 31, 2016:2021.
|
|
|
|
|
|
|
|
|
|
|
|
|
|
|
|
Date |
| Property Name |
| Location |
| Property Type |
|
| Units/ Square Footage/ Acres |
|
| Acquisition Price |
|
| Prorata Acquisition Price |
|
|
|
|
|
|
|
|
|
|
|
|
|
|
|
|
1/29/16 |
| Titan Machinery |
| North Platte, NE |
| Implement dealership |
|
| 16,480 sq. ft. |
| $ | 1,769 |
| $ | 1,769 |
2/1/16 |
| Bristol Park Apartments |
| Grand Forks, ND |
| Apartment complex |
|
| 80 units |
|
| 5,050 |
|
| 5,050 |
2/1/16 |
| Redpath |
| White Bear Lake, MN |
| Office building |
|
| 25,817 sq. ft. |
|
| 4,000 |
|
| 4,000 |
3/1/16 |
| Eagle Sky I Apartments |
| Bismarck, ND |
| Apartment complex |
|
| 20 units |
|
| 1,525 |
|
| 1,525 |
3/1/16 |
| Eagle Sky II Apartments |
| Bismarck, ND |
| Apartment complex |
|
| 20 units |
|
| 1,525 |
|
| 1,525 |
5/4/16 |
| Garden Grove Apartments |
| Bismarck, ND |
| Apartment complex |
|
| 95 units |
|
| 7,072 |
|
| 7,072 |
5/4/16 |
| Washington Apartments |
| Grand Forks, ND |
| Apartment complex |
|
| 17 units |
|
| 667 |
|
| 667 |
8/1/16 |
| Roughrider |
| Grand Forks, ND |
| Apartment complex |
|
| 12 units |
|
| 582 |
|
| 582 |
8/29/16 |
| West 80 Development Land |
| Rochester, MN |
| Land |
|
| 18.8 acres |
|
| 900 |
|
| 900 |
9/13/16 |
| Amberwood Apartments |
| Grand Forks, ND |
| Apartment complex |
|
| 95 units |
|
| 3,942 |
|
| 3,942 |
12/19/16 |
| Bridgeport Apartments |
| Fargo, ND |
| Apartment complex |
|
| 120 units |
|
| 8,280 |
|
| 8,280 |
|
|
|
|
|
|
|
|
|
|
|
|
|
|
|
|
|
|
|
|
|
|
|
|
|
|
| $ | 35,312 |
| $ | 35,312 |
| | | | | | | | | | | | | |
Date | | Property Name | | Location | | Property Type | | | Units/ Square Footage/ Acres | | | Purchase Price | |
6/1/21 | | Flagstone | | Fargo, ND | | Apartment Complex | | | 120 units | | $ | 7,723 | |
6/1/21 | | Brownstone | | Fargo, ND | | Apartment Complex | | | 72 units | | | 4,362 | |
6/1/21 | | Briar Pointe | | Fargo, ND | | Apartment Complex | | | 30 units | | | 1,929 | |
7/1/21 | | Oxford | | Fargo, ND | | Apartment Complex | | | 144 units | | | 10,066 | |
7/1/21 | | Pinehurst | | Fargo, ND | | Apartment Complex | | | 210 units | | | 14,718 | |
| | | | | | | | | | | | | |
| | | | | | | | | | | $ | 38,798 | |
Total consideration given for acquisitions throughthe year ended December 31, 20162021 was completed through issuing approximately 1,466,000144,000 limited partnership units of the operating partnership valued at $15.50 per unit and $16.00$20.00 per unit for an aggregate consideration of approximately $23,020, new loans of $2,662, assumed liabilities $78, and cash of $9,552.$2,883. The value of units issued in exchange for property is determined through a value established annually by our Board of Trustees and reflects the fair value at the time of issuance.
In addition, as of December 1, 2016, the operating partnership acquired the remaining 17.5% ownership interest in a 61 unit property which was previously held as tenant in common (See Note 2). We estimated the property’s fair value of approximately $4,087. The Trust paid total cash consideration of approximately $193 before transaction costs and issued $448 of limited partnership units for a total purchase price of approximately $641. The Company accounted for this as a business combination and recognized a gain on change in control of real estate investment of $550 as a result of remeasuring the carrying value to fair value.
The Company closed onacquired the following acquisitionsproperties during the year ended December 31, 2015:2020.
|
|
|
|
|
|
|
|
|
|
|
|
|
|
|
|
Date |
| Property Name |
| Location |
| Property Type |
|
| Units/ Square Footage/ Acres |
|
| Acquisition Price |
|
| Prorata Acquisition Price |
|
|
|
|
|
|
|
|
|
|
|
|
|
|
|
|
1/13/15 |
| Valley Homes Duplexes |
| Grand Forks, ND |
| Duplex complex |
|
| 24 units |
| $ | 2,148 |
| $ | 2,148 |
1/28/15 |
| Titan Machinery |
| Bismarck, ND |
| Implement dealership |
|
| 22,293 sq. ft. |
|
| 3,416 |
|
| 3,416 |
2/3/15 |
| Quail Creek |
| Springfield, MO |
| Apartment complex |
|
| 164 units |
|
| 10,900 |
|
| 10,900 |
5/13/15 |
| Parkview Arms |
| Bismarck, ND |
| Apartment complex |
|
| 62 units |
|
| 4,464 |
|
| 4,464 |
6/16/15 |
| Development land |
| Mankato, MN |
| Land |
|
| 1.13 acres |
|
| 263 |
|
| 263 |
7/20/15 |
| Development land |
| Fargo, ND |
| Land |
|
| 1.95 acres |
|
| 500 |
|
| 500 |
8/4/15 |
| Huntington |
| Fargo, ND |
| Apartment complex |
|
| 10 units |
|
| 420 |
|
| 420 |
8/4/15 |
| Summerfield |
| Fargo, ND |
| Apartment complex |
|
| 18 units |
|
| 774 |
|
| 774 |
8/13/15 |
| Northland Plaza |
| Bloomington, MN |
| Office building |
|
| 296,967 sq. ft. |
|
| 52,500 |
|
| 36,750 |
9/1/15 |
| Columbine Apartments |
| Grand Forks, ND |
| Apartment complex |
|
| 12 units |
|
| 629 |
|
| 629 |
10/1/15 |
| Summit Point |
| Fargo, ND |
| Apartment complex |
|
| 87 units |
|
| 6,572 |
|
| 6,572 |
|
|
|
|
|
|
|
|
|
|
|
|
|
|
|
|
|
|
|
|
|
|
|
|
|
|
| $ | 82,586 |
| $ | 66,836 |
| | | | | | | | | | | | | |
Date | | Property Name | | Location | | Property Type | | | Units/ Square Footage/ Acres | | | Acquisition Price | |
| | | | | | | | | | | | | |
1/12/20 | | Wolf Creek | | Fargo, ND | | Apartment complex | | | 54 units | | $ | 5,227 | |
1/31/20 | | Columbia Park Village | | Grand Forks, ND | | Apartment complex | | | 12 units | | | 642 | |
3/1/20 | | Belmont East & West | | Bismarck, ND | | Apartment complex | | | 5,348 sq. ft. | | | 1,568 | |
101
83
STERLING REAL ESTATE TRUST AND SUBSIDIARIES
NOTES TO CONSOLIDATED FINANCIAL STATEMENTS
DECEMBER 31, 2017, 20162022, 2021 AND 20152020
(Dollar amounts in thousands, except share and per share data)
3/1/20 | | Eastbrook | | Bismarck, ND | | Apartment complex | | | 24 units | | | 1,358 | |
3/1/20 | | Hawn | | Fargo, ND | | Apartment complex | | | 48 units | | | 2,524 | |
3/1/20 | | Rosser | | Bismarck, ND | | Apartment complex | | | 24 units | | | 1,359 | |
8/28/20 | | Trustmark (a) | | Fargo, ND | | Office building | | | units | | | 6,588 | |
9/15/20 | | Foxtail Townhomes | | Fargo, ND | | Apartment complex | | | 30 units | | | 1,434 | |
12/17/20 | | Evergreen Terrace | | Omaha, NE | | Apartment complex | | | 144 units | | | 2,970 | |
| | | | | | | | | | | | | |
| | | | | | | | | | | $ | 23,670 | |
Total consideration given for acquisitions throughduring the year ended December 31, 20152020, was completed through issuing approximately 729,000535,000 limited partnership units of the operating partnership valued at $15.00 per unit and $15.50$19.25 per unit for an aggregate consideration of approximately $11,228, new loans of $45,830, assumed loans of $719, assumed liabilities $1,329, and cash of $23,480.$10,293. The value of units issued in exchange for property is determined through a value established annually by our Board of Trustees and reflects the fair value at the time of issuance.
Included in the Company’s consolidated statements of operations and other comprehensive income are the results of operations from Bell Plaza (FKA Northland Plaza), which was acquired and accounted for as a business combination, consisting of $3,163 in revenues and $2,356 in net loss attributableIn 2022, cash flows were reclassified to Sterling Real Estate Trust from the date of acquisition (August 13, 2015) through December 31, 2015.
updated presentation resulting prior period to be updated to align with reclassification. The following table summarizes the acquisition date fair values,allocation of the purchase price, before prorations, the Company recorded in conjunction with the acquisitions discussed above:
|
|
|
|
|
|
|
|
|
|
|
|
|
|
|
|
|
|
|
|
|
|
|
|
| Year Ended | ||||||
|
|
|
|
|
|
|
|
| December 31, | ||||||
|
|
|
|
|
|
|
|
| 2017 |
|
| 2016 |
|
| 2015 |
|
|
|
|
|
|
|
|
|
|
|
|
|
|
|
|
|
| Land, building, tenant improvements and FF&E |
|
|
|
|
| $ | 23,195 |
| $ | 34,102 |
| $ | 71,493 |
|
| Acquired lease intangible assets |
|
|
|
|
|
| - |
|
| 1,386 |
|
| 12,735 |
|
| Acquired lease intangible liabilities |
|
|
|
|
|
| - |
|
| (176) |
|
| (1,642) |
|
| Mortgages notes payable assumed |
|
|
|
|
|
| - |
|
| - |
|
| (719) |
|
| Other liabilities |
|
|
|
|
|
| (132) |
|
| (78) |
|
| (1,328) |
|
| Net assets acquired |
|
|
|
|
|
| 23,063 |
|
| 35,234 |
|
| 80,539 |
|
| Equity/limited partnership unit consideration |
|
|
|
|
|
| (10,006) |
|
| (23,020) |
|
| (11,228) |
|
| Restricted cash proceeds related to IRC Section 1031 tax-deferred exchange |
|
|
|
|
|
| (4,278) |
|
| - |
|
| - |
|
| New loans |
|
|
|
|
|
| (4,180) |
|
| (2,662) |
|
| (45,830) |
|
|
|
|
|
|
|
|
|
|
|
|
|
|
|
|
|
| Net cash consideration (a) |
|
|
|
|
| $ | 4,599 |
| $ | 9,552 |
| $ | 23,481 |
|
|
|
|
|
|
|
|
|
|
|
|
|
|
|
|
|
|
| | | | | | | | | | |
| | | Year Ended | | | | ||||
| | | December 31, | | | | ||||
| | | 2022 | | 2021 | | 2020 | |||
Real estate investment acquired | | | $ | 93,515 | | $ | 39,344 | | $ | 29,775 |
Acquired lease intangible assets | | | | 1,732 | | | - | | | 46 |
Assumed Assets | | | | 3 | | | 23 | | | 38 |
Total Assets Acquired | | | $ | 95,250 | | $ | 39,367 | | $ | 29,859 |
Other liabilities | | | | (406) | | | (569) | | | (6,189) |
Net assets acquired | | | | 94,844 | | | 38,798 | | | 23,670 |
Equity/limited partnership unit consideration | | | | (12,870) | | | (2,883) | | | (10,293) |
Net cash consideration | | | $ | 81,974 | | $ | 35,915 | | $ | 13,377 |
The acquisitions completed after July 1, 2017 were considered asset acquisitions and, as such, transaction costs were capitalized upon closing. For acquisitions prior to July 1, 2017, which were accounted for as business combinations, the transaction costs totaled $1,131, $1,972 and $2,198 for the years ended December 31, 2017, 2016 and 2015, respectively, are included in “Acquisition and disposition expenses” in the accompanying consolidated statements of operations and other comprehensive (loss) income.
Estimated Value of Units/Shares
The Board of Trustees determined an estimate of fair value for the trust shares in 2017, 2016 and 2015. In addition, the Board of Trustees, acting as general partner for the operating partnership, determined an estimate of fair value for the limited partnership units in 2017, 2016 and 2015. In determining this value, the Board relied upon their experience with, and knowledge about, the Trust’s real estate portfolio and debt obligations. The Board typically determines the share price on an annual basis. The trustees determine the price in their discretion and use data points to guide their determination which is typically based on a consensus of opinion. In addition, the Board considers how the price chosen will affect existing share and unit values, redemption prices, dividend coverage ratios, yield percentages, dividend reinvestment factors, and future UPREIT transactions, among other considerations and information.
Based on the results of the methodologies, the Board determined the fair value of the shares and limited partnership units to be $15.00 per share/unit for the first month of 2015. The Board determined the fair value of the shares and limited partnership units to be $15.50 per share/unit effective February 1, 2015. The Board determined the fair value of the shares and limited partnership units to be $16.00 per share/unit effective March 23, 2016. The Board determined the fair value of the shares and limited partnership units to be $16.50 per share/unit effective March 29, 2017. The Board determined the fair value of the shares and limited partnership units to be $18.50 per share/unit effective January 1, 2018.
102
STERLING REAL ESTATE TRUST AND SUBSIDIARIES
NOTES TO CONSOLIDATED FINANCIAL STATEMENTS
DECEMBER 31, 2017, 2016 AND 2015
(Dollar amounts in thousands, except share and per share data)
Determination of price is a matter within the Board’s sole discretion. The Trust does not determine price based on any rote formula or specific factors. At this time, no shares are held in street name accounts and the Trust is not subject to FINRA’s specific pricing requirements set out in Rule 2340 or otherwise. Thus, the Trust does not employ any specific valuation methodology or formula. Rather, the Board looks to available data and information, which is often adjusted and weighted to comport more closely with the assets held by the Trust at the time of valuation. The principal valuation methodology utilized is the NAV calculation/direct capitalization method. The information made available to the Board is assembled by the Trust’s Advisor.
As with any valuation methodology, the methodologies utilized by the Board in reaching an estimate of the value of the shares and limited partnership units are based upon a number of estimates, assumptions, judgments or opinions that may, or may not, prove to be correct. The use of different estimates, assumptions, judgments, or opinions would likely have resulted in significantly different estimates of the value of the shares and limited partnership units. In addition, the Board’s estimate of share and limited partnership unit value is not based on the book values of our real estate, as determined by GAAP, as our book value for most real estate is based on the amortized cost of the property, subject to certain adjustments.
Furthermore, in reaching an estimate of the value of the shares and limited partnership units, the Board applied a liquidity discount to one valuation scenario in order to reflect the fact that the shares and limited partnership units are not currently traded on a national securities exchange; a discount for debt that may include a prepayment obligation or a provision precluding assumption of the debt by a third party; or the costs that are likely to be incurred in connection with an appropriate exit strategy, whether that strategy might be a listing of the limited partnership units or common shares on a national securities exchange or a merger or sale of our portfolio.
Condensed Pro Forma Financial Information
The following unaudited condensed pro forma financial information is presented as if the Bell Plaza (FKA Northland Plaza) acquisition was completed as of January 1, 2014. We own 70% of this property. These pro forma results are for comparative purposes only and are not necessarily indicative of what the actual results of operations of the Company would have been had the acquisition occurred at the beginning of the period presented, nor are they necessarily indicative of future operating results.
The unaudited condensed pro forma financial information is as follows:
|
|
|
|
|
|
|
|
|
|
| Year Ended |
| |||||||
| December 31, |
| |||||||
| 2017 |
| 2016 |
| 2015 |
| |||
|
| (in thousands, except per share data) | |||||||
Total revenues | $ | 114,298 |
| $ | 108,063 |
| $ | 101,807 |
|
Net income | $ | 19,883 |
| $ | 12,857 |
| $ | 11,457 |
|
Net income attributable to Sterling Real Estate Trust | $ | 6,514 |
| $ | 4,425 |
| $ | 5,998 |
|
Earnings per common share, basic and diluted |
|
|
|
|
|
|
|
|
|
Net income per common share attributable to Sterling Real Estate Trust | $ | 0.78 |
| $ | 0.56 |
| $ | 0.83 |
|
Weighted average number of common shares outstanding - basic |
| 8,300 |
|
| 7,844 |
|
| 7,223 |
|
103
STERLING REAL ESTATE TRUST AND SUBSIDIARIES
NOTES TO CONSOLIDATED FINANCIAL STATEMENTS
DECEMBER 31, 2017, 2016 AND 2015
(Dollar amounts in thousands, except share and per share data)
NOTE 21 – QUARTERLY FINANCIAL INFORMATION (unaudited)
The following table sets forth selected quarterly consolidated financial data for the Company:
|
|
|
|
|
|
|
|
|
|
|
|
|
|
| Quarter (1) | ||||||||||
2017 |
|
| First |
|
| Second |
|
| Third |
|
| Fourth |
|
| (in thousands, except per share data) | ||||||||||
Income from rental operations |
| $ | 28,029 |
| $ | 28,513 |
| $ | 28,655 |
| $ | 29,101 |
Net Income |
| $ | 3,200 |
| $ | 8,290 |
| $ | 3,256 |
| $ | 5,137 |
Net Income attributable to Sterling Real Estate Trust |
| $ | 1,057 |
| $ | 2,682 |
| $ | 1,082 |
| $ | 1,693 |
Net Income per common share, basic and diluted |
| $ | 0.13 |
| $ | 0.33 |
| $ | 0.13 |
| $ | 0.19 |
Weighted average common shares outstanding |
|
| 8,117,000 |
|
| 8,227,000 |
|
| 8,356,000 |
|
| 8,498,000 |
|
|
|
|
|
|
|
|
|
|
|
|
|
|
| Quarter (1) | ||||||||||
2016 |
|
| First |
|
| Second |
|
| Third |
|
| Fourth |
|
| (in thousands, except per share data) | ||||||||||
Income from rental operations |
| $ | 26,688 |
| $ | 27,046 |
| $ | 26,888 |
| $ | 27,441 |
Net Income |
| $ | 3,374 |
| $ | 2,706 |
| $ | 2,523 |
| $ | 4,254 |
Net Income attributable to Sterling Real Estate Trust |
| $ | 1,273 |
| $ | 839 |
| $ | 885 |
| $ | 1,428 |
Net Income per common share, basic and diluted |
| $ | 0.17 |
| $ | 0.11 |
| $ | 0.11 |
| $ | 0.17 |
Weighted average common shares outstanding |
|
| 7,690,000 |
|
| 7,789,000 |
|
| 7,891,000 |
|
| 8,003,000 |
|
|
NOTE 2220 - SUBSEQUENT EVENTS
On January 16, 2018,1, 2023, Damon K. Gleave and Michael P. Carlson owned shares in Trustmark Enterprises, Inc.
On January 13, 2023, the Trust obtained financing on a residential property for $27,500.
On January 13, 2023, the Trust paid off a note for $26,500 with Bell Bank that was set to mature on February 1, 2023.
On January 17, 2023, we paid a dividend or distribution of $0.2475$0.2875 per share on our common shares of beneficial interest or limited partnership units, to common shareholders and limited unit holders of record on December 31, 2017.2022.
In March 2018,On February 24, 2023, Barry L. Schmeiss resigned as Chief Investment Officer of the operating partnership purchased a 57 unit apartment complex in Fargo, North Dakota for approximately $4,560. The purchase price was financed with the issuance of limited partnership units and cash.Trust.
Pending acquisitions and dispositions are subject to numerous conditions and contingencies and there are no assurances that the transactions will be completed.
We have evaluated subsequent events through the date of this filing. We are not aware of any other subsequent events which would require recognition or disclosure in the consolidated financial statements.
104
84
STERLING REAL ESTATE TRUST AND SUBSIDIARIES
SCHEDULE III – REAL ESTATE AND ACCUMULATED DEPRECIATION
DECEMBER 31, 20172022
(Dollar amounts in thousands)
| | | | | | | | | | | | | | | | | | | | | | | | | | | | | | | | | | | |
| | | | | | | | | | | | | | | | | | | | | | | | | | | | | | | | | Life on | ||
| | | | | | | | | | | | | | | | | | | | | | | | | | | | | | | | | which | ||
| | | | | | | | | Costs | | | | | | | | | | | | | | | | depreciation | ||||||||||
| | | | | | | | | capitalized | | | | | | | | | | | | | | Date of | | on latest | ||||||||||
| | | | | | | Initial cost | | subsequent | | Gross Amount at which | | | | | Construction | | income | |||||||||||||||||
Industrial | | | | | | | to company | | to acquisition (a) | | carried at close of period | | | | | or | | statement is | |||||||||||||||||
Property |
| Physical Location |
| Encumbrances |
| Land |
| Buildings |
| Land |
| Buildings |
| Land |
| Buildings |
| Total |
| Depreciation |
| Acquisition |
| computed | |||||||||||
Guardian Building Products | | Fargo, ND | | $ | 2,487 | | $ | 820 | | $ | 2,554 | | $ | 60 | | $ | (94) | | $ | 880 | | $ | 2,460 | | $ | 3,340 | | $ | 641 | | 08/29/2012 | | | 40 | |
Titan Machinery | | Bismarck, ND | | | 2,069 | | | 950 | | | 1,395 | | | 32 | | | — | | | 982 | | | 1,395 | | | 2,377 | | | 279 | | 01/28/2015 | | | 40 | |
Titan Machinery | | Dickinson, ND | | | 1,816 | | | 354 | | | 1,096 | | | 400 | | | — | | | 754 | | | 1,096 | | | 1,850 | | | 297 | | 07/30/2012 | | | 40 | |
Titan Machinery | | Fargo, ND | | | 2,471 | | | 781 | | | 1,947 | | | 515 | | | — | | | 1,296 | | | 1,947 | | | 3,243 | | | 499 | | 10/30/2012 | | | 40 | |
Titan Machinery | | Marshall, MN | | | 4,674 | | | 300 | | | 3,648 | | | 81 | | | — | | | 381 | | | 3,648 | | | 4,029 | | | 1,026 | | 11/01/2011 | | | 40 | |
Titan Machinery | | Minot, ND | | | — | | | 618 | | | 1,654 | | | — | | | — | | | 618 | | | 1,654 | | | 2,272 | | | 431 | | 08/01/2012 | | | 40 | |
Titan Machinery | | North Platte, NE | | | — | | | 325 | | | 1,269 | | | — | | | — | | | 325 | | | 1,269 | | | 1,594 | | | 223 | | 01/29/2016 | | | 40 | |
Titan Machinery | | Sioux City, IA | | | 3,699 | | | 315 | | | 2,472 | | | — | | | — | | | 315 | | | 2,472 | | | 2,787 | | | 572 | | 10/25/2013 | | | 40 | |
Total | | | | $ | 17,216 | | $ | 4,463 | | $ | 16,035 | | $ | 1,088 | | $ | (94) | | $ | 5,551 | | $ | 15,941 | | $ | 21,492 | | $ | 3,968 | | | | | | |
| | | | | | | | | | | | | | | | | | | | | | | | | | | | | | | | | | | |
| | | | | | | | | | | | | | | | | | | | | | | | | | | | | | | | | Life on | ||
| | | | | | | | | | | | | | | | | | | | | | | | | | | | | | | | | which | ||
| | | | | | | | | | | | | Costs | | | | | | | | | | | | | | | | depreciation | ||||||
| | | | | | | | | | | | | capitalized | | | | | | | | | | | | | | Date of | | on latest | ||||||
| | | | | | | Initial cost | | subsequent | | Gross Amount at which | | | | | Construction | | income | |||||||||||||||||
Land | | | | | | | to company | | to acquisition (a) | | carried at close of period | | | | | or | | statement is | |||||||||||||||||
Property |
| Physical Location |
| Encumbrances |
| Land |
| Buildings |
| Land |
| Buildings |
| Land |
| Buildings |
| Total |
| Depreciation |
| Acquisition |
| computed | |||||||||||
Taco Bell | | Denver, CO | | $ | 389 | | $ | 669 | | $ | — | | $ | — | | $ | — | | $ | 669 | | $ | — | | $ | 669 | | $ | — | | 06/14/2011 | | | | |
West 80 | | Rochester, MN | | | — | | | 1,364 | | | — | | | — | | | — | | | 1,364 | | | — | | | 1,364 | | | — | | 08/29/2016 | | | | |
Total | | | | $ | 389 | | $ | 2,033 | | $ | — | | $ | — | | $ | — | | $ | 2,033 | | $ | — | | $ | 2,033 | | $ | — | | | | | | |
85
|
|
|
|
|
|
|
|
|
|
|
|
|
|
|
|
|
|
|
|
|
|
|
|
|
|
|
|
|
|
|
|
|
|
|
|
|
|
|
|
|
|
|
|
|
|
|
|
|
|
|
|
|
|
|
|
|
|
|
|
|
|
|
|
|
|
|
|
| Life on | ||
|
|
|
|
|
|
|
|
|
|
|
|
|
|
|
|
|
|
|
|
|
|
|
|
|
|
|
|
|
|
|
|
| which | ||
|
|
|
|
|
|
|
|
| Costs |
|
|
|
|
|
|
|
|
|
|
|
|
|
|
| depreciation | ||||||||||
|
|
|
|
|
|
|
|
| capitalized |
|
|
|
|
|
|
|
|
|
|
|
|
| Date of |
| on latest | ||||||||||
|
|
|
|
|
|
| Initial cost |
| subsequent |
| Gross Amount at which |
|
|
|
| Construction |
| income | |||||||||||||||||
Industrial |
|
|
|
|
|
| to company |
| to acquisition (a) |
| carried at close of period |
| Accumulated |
| or |
| statement is | ||||||||||||||||||
Property |
| Physical Location |
| Encumbrances |
| Land |
| Buildings |
| Land |
| Buildings |
| Land |
| Buildings |
| Total |
| Depreciation |
| Acquisition |
| computed | |||||||||||
Guardian Building Products |
| Fargo, ND |
| $ | 2,845 |
| $ | 820 |
| $ | 2,554 |
| $ | 9 |
| $ | (94) |
| $ | 829 |
| $ | 2,460 |
| $ | 3,289 |
| $ | 334 |
| 08/29/2012 |
|
| 40 |
|
Titan Machinery |
| Bismarck, ND |
|
| 2,353 |
|
| 950 |
|
| 1,395 |
|
| 7 |
|
| — |
|
| 957 |
|
| 1,395 |
|
| 2,352 |
|
| 105 |
| 01/28/2015 |
|
| 40 |
|
Titan Machinery |
| Dickinson, ND |
|
| 860 |
|
| 354 |
|
| 1,096 |
|
| 400 |
|
| — |
|
| 754 |
|
| 1,096 |
|
| 1,850 |
|
| 160 |
| 07/30/2012 |
|
| 40 |
|
Titan Machinery |
| Fargo, ND |
|
| 1,010 |
|
| 781 |
|
| 1,947 |
|
| 510 |
|
| — |
|
| 1,291 |
|
| 1,947 |
|
| 3,238 |
|
| 255 |
| 10/30/2012 |
|
| 40 |
|
Titan Machinery |
| Marshall, MN |
|
| 1,986 |
|
| 300 |
|
| 3,648 |
|
| 81 |
|
| — |
|
| 381 |
|
| 3,648 |
|
| 4,029 |
|
| 570 |
| 11/01/2011 |
|
| 40 |
|
Titan Machinery |
| Minot, ND |
|
| — |
|
| 618 |
|
| 1,654 |
|
| — |
|
| — |
|
| 618 |
|
| 1,654 |
|
| 2,272 |
|
| 224 |
| 08/01/2012 |
|
| 40 |
|
Titan Machinery |
| North Platte, NE |
|
| — |
|
| 325 |
|
| 1,269 |
|
| — |
|
| — |
|
| 325 |
|
| 1,269 |
|
| 1,594 |
|
| 64 |
| 01/29/2016 |
|
| 40 |
|
Titan Machinery |
| Redwood Falls, MN |
|
| 1,497 |
|
| 333 |
|
| 3,568 |
|
| — |
|
| — |
|
| 333 |
|
| 3,568 |
|
| 3,901 |
|
| 439 |
| 01/31/2013 |
|
| 40 |
|
Titan Machinery |
| Sioux City, IA |
|
| 1,377 |
|
| 315 |
|
| 2,472 |
|
| — |
|
| — |
|
| 315 |
|
| 2,472 |
|
| 2,787 |
|
| 263 |
| 10/25/2013 |
|
| 40 |
|
Total |
|
|
| $ | 11,928 |
| $ | 4,796 |
| $ | 19,603 |
| $ | 1,007 |
| $ | (94) |
| $ | 5,803 |
| $ | 19,509 |
| $ | 25,312 |
| $ | 2,414 |
|
|
|
|
|
|
|
|
|
|
|
|
|
|
|
|
|
|
|
|
|
|
|
|
|
|
|
|
|
|
|
|
|
|
|
|
|
|
|
|
|
|
|
|
|
|
|
|
|
|
|
|
|
|
|
|
|
|
|
|
|
|
|
|
|
|
|
|
|
|
|
|
|
|
| Life on | ||
|
|
|
|
|
|
|
|
|
|
|
|
|
|
|
|
|
|
|
|
|
|
|
|
|
|
|
|
|
|
|
|
| which | ||
|
|
|
|
|
|
|
|
|
|
|
|
| Costs |
|
|
|
|
|
|
|
|
|
|
|
|
|
|
| depreciation | ||||||
|
|
|
|
|
|
|
|
|
|
|
|
| capitalized |
|
|
|
|
|
|
|
|
|
|
|
|
| Date of |
| on latest | ||||||
|
|
|
|
|
|
| Initial cost |
| subsequent |
| Gross Amount at which |
|
|
|
| Construction |
| income | |||||||||||||||||
Land |
|
|
|
|
|
| to company |
| to acquisition (a) |
| carried at close of period |
| Accumulated |
| or |
| statement is | ||||||||||||||||||
Property |
| Physical Location |
| Encumbrances |
| Land |
| Buildings |
| Land |
| Buildings |
| Land |
| Buildings |
| Total |
| Depreciation |
| Acquisition |
| computed | |||||||||||
Taco Bell |
| Denver, CO |
| $ | — |
| $ | 669 |
| $ | — |
| $ | — |
| $ | — |
| $ | 669 |
| $ | — |
| $ | 669 |
| $ | — |
| 06/14/2011 |
|
|
|
|
West 80 |
| Rochester, MN |
|
| — |
|
| 1,364 |
|
| — |
|
| — |
|
| — |
|
| 1,364 |
|
| — |
|
| 1,364 |
|
| — |
| 08/29/2016 |
|
|
|
|
Total |
|
|
| $ | — |
| $ | 2,033 |
| $ | — |
| $ | — |
| $ | — |
| $ | 2,033 |
| $ | — |
| $ | 2,033 |
| $ | — |
|
|
|
|
|
|
105
STERLING REAL ESTATE TRUST AND SUBSIDIARIES
SCHEDULE III – REAL ESTATE AND ACCUMULATED DEPRECIATION
DECEMBER 31, 20172022
(Dollar amounts in thousands)
| | | | | | | | | | | | | | | | | | | | | | | | | | | | | | | | | | | |
| | | | | | | | | | | | | | | | | | | | | | | | | | | | | | | | | Life on | ||
| | | | | | | | | | | | | | | | | | | | | | | | | | | | | | | | | which | ||
| | | | | | | | | | | | | Costs | | | | | | | | | | | | | | | | depreciation | ||||||
| | | | | | | | | | | | | capitalized | | | | | | | | | | | | | | Date of | | on latest | ||||||
| | | | | | | Initial cost | | subsequent | | Gross Amount at which | | | | | Construction | | income | |||||||||||||||||
Medical | | | | | | | to company | | to acquisition (a) | | carried at close of period | | | | | or | | statement is | |||||||||||||||||
Property |
| Physical Location |
| Encumbrances |
| Land |
| Buildings |
| Land |
| Buildings |
| Land |
| Buildings |
| Total |
| Depreciation |
| Acquisition |
| computed | |||||||||||
Bio-Life | | Bismarck, ND | | $ | 2,091 | | $ | 306 | | $ | 2,255 | | $ | 11 | | $ | 123 | | $ | 317 | | $ | 2,378 | | $ | 2,695 | | $ | 968 | | 01/03/2008 | | 9 | - | 40 |
Bio-Life | | Grand Forks, ND | | | 2,150 | | | 457 | | | 2,230 | | | 1 | | | 158 | | | 458 | | | 2,388 | | | 2,846 | | | 994 | | 01/03/2008 | | 10 | - | 40 |
Bio-Life | | Janesville, WI | | | 1,786 | | | 250 | | | 1,857 | | | — | | | 123 | | | 250 | | | 1,980 | | | 2,230 | | | 819 | | 01/03/2008 | | 9 | - | 40 |
Bio-Life | | Mankato, MN | | | 2,271 | | | 390 | | | 2,111 | | | 280 | | | 1,154 | | | 670 | | | 3,265 | | | 3,935 | | | 1,273 | | 01/03/2008 | | 11 | - | 40 |
Bio-Life | | Marquette, MI | | | — | | | 213 | | | 2,793 | | | — | | | 123 | | | 213 | | | 2,916 | | | 3,129 | | | 1,170 | | 01/03/2008 | | 9 | - | 40 |
Bio-Life | | Onalaska, WI | | | 1,723 | | | 208 | | | 1,853 | | | — | | | 323 | | | 208 | | | 2,176 | | | 2,384 | | | 880 | | 01/03/2008 | | 11 | - | 40 |
Bio-Life | | Oshkosh, WI | | | 1,773 | | | 293 | | | 1,705 | | | — | | | 146 | | | 293 | | | 1,851 | | | 2,144 | | | 785 | | 01/03/2008 | | 10 | - | 40 |
Bio-Life | | Sheboygan, WI | | | 2,022 | | | 623 | | | 1,611 | | | — | | | 248 | | | 623 | | | 1,859 | | | 2,482 | | | 768 | | 01/03/2008 | | 10 | - | 40 |
Bio-Life | | Stevens Point, WI | | | 1,935 | | | 119 | | | 2,184 | | | — | | | 123 | | | 119 | | | 2,307 | | | 2,426 | | | 941 | | 01/03/2008 | | 9 | - | 40 |
Total | | | | $ | 15,751 | | $ | 2,859 | | $ | 18,599 | | $ | 292 | | $ | 2,521 | | $ | 3,151 | | $ | 21,120 | | $ | 24,271 | | $ | 8,598 | | | | | | |
| | | | | | | | | | | | | | | | | | | | | | | | | | | | | | | | | | | |
| | | | | | | | | | | | | | | | | | | | | | | | | | | | | | | | | Life on | ||
| | | | | | | | | | | | | | | | | | | | | | | | | | | | | | | | | which | ||
| | | | | | | | | | | | | Costs | | | | | | | | | | | | | | | | depreciation | ||||||
| | | | | | | | | | | | | capitalized | | | | | | | | | | | | | | Date of | | on latest | ||||||
| | | | | | | Initial cost | | subsequent | | Gross Amount at which | | | | | Construction | | income | |||||||||||||||||
Residential | | | | | | | to company | | to acquisition (a) | | carried at close of period | | | | | or | | statement is | |||||||||||||||||
Property |
| Physical Location |
| Encumbrances |
| Land |
| Buildings |
| Land |
| Buildings |
| Land |
| Buildings |
| Total |
| Depreciation |
| Acquisition |
| computed | |||||||||||
Amberwood | | Grand Forks, ND | | $ | 2,376 | | $ | 426 | | $ | 3,304 | | $ | 3 | | $ | 178 | | $ | 429 | | $ | 3,482 | | $ | 3,911 | | $ | 552 | | 09/13/2016 | | 20 | - | 40 |
Arbor I/400 | | Bismarck, ND | | | 350 | | | 73 | | | 516 | | | 4 | | | 65 | | | 77 | | | 581 | | | 658 | | | 142 | | 06/04/2013 | | | 40 | |
Arbor II/404 | | Bismarck, ND | | | 358 | | | 73 | | | 538 | | | 6 | | | 43 | | | 79 | | | 581 | | | 660 | | | 128 | | 11/01/2013 | | | 40 | |
Arbor III/406 | | Bismarck, ND | | | 356 | | | 71 | | | 536 | | | 7 | | | 43 | | | 78 | | | 579 | | | 657 | | | 128 | | 11/01/2013 | | | 40 | |
Ashbury | | Fargo, ND | | | 2,287 | | | 314 | | | 3,774 | | | 26 | | | 25 | | | 340 | | | 3,799 | | | 4,139 | | | 578 | | 12/19/2016 | | | 40 | |
Auburn II | | Fargo, ND | | | 825 | | | 105 | | | 883 | | | 12 | | | 87 | | | 117 | | | 970 | | | 1,087 | | | 372 | | 03/23/2007 | | 20 | - | 40 |
Autumn Ridge | | Grand Forks, ND | | | 5,162 | | | 1,072 | | | 8,875 | | | 44 | | | 67 | | | 1,116 | | | 8,942 | | | 10,058 | | | 3,687 | | 08/16/2004 | | 9 | - | 40 |
Barrett Arms | | Crookston, MN | | | 723 | | | 37 | | | 1,001 | | | — | | | 177 | | | 37 | | | 1,178 | | | 1,215 | | | 241 | | 01/02/2014 | | | 40 | |
Bayview | | Fargo, ND | | | 2,350 | | | 284 | | | 3,447 | | | 59 | | | 2,020 | | | 343 | | | 5,467 | | | 5,810 | | | 1,455 | | 12/31/2007 | | 20 | - | 40 |
Belmont East and West | | Bismarck, ND | | | 742 | | | 167 | | | 1,424 | | | 2 | | | 8 | | | 169 | | | 1,432 | | | 1,601 | | | 102 | | 03/1/2020 | | | 40 | |
Berkshire | | Fargo, ND | | | 401 | | | 31 | | | 406 | | | 7 | | | 53 | | | 38 | | | 459 | | | 497 | | | 155 | | 03/31/2008 | | 20 | - | 40 |
Betty Ann | | Fargo, ND | | | 421 | | | 74 | | | 738 | | | 6 | | | 140 | | | 80 | | | 878 | | | 958 | | | 267 | | 08/31/2009 | | | 40 | |
Birchwood 1 | | Fargo, ND | | | 228 | | | 72 | | | 342 | | | 4 | | | 42 | | | 76 | | | 384 | | | 460 | | | 46 | | 12/01/2017 | | | 40 | |
Birchwood 2 | | Fargo, ND | | | 1,342 | | | 234 | | | 2,099 | | | 52 | | | 288 | | | 286 | | | 2,387 | | | 2,673 | | | 290 | | 12/01/2017 | | | 40 | |
Bradbury Apartments | | Bismarck, ND | | | 1,791 | | | 1,049 | | | 4,922 | | | — | | | 81 | | | 1,049 | | | 5,003 | | | 6,052 | | | 532 | | 10/24/2018 | | | 40 | |
Briar Pointe | | Fargo, ND | | | 1,283 | | | 384 | | | 1,551 | | | — | | | — | | | 384 | | | 1,551 | | | 1,935 | | | 61 | | 06/01/2021 | | | 40 | |
Bridgeport | | Fargo, ND | | | 4,839 | | | 613 | | | 7,676 | | | 14 | | | 61 | | | 627 | | | 7,737 | | | 8,364 | | | 1,174 | | 12/19/2016 | | | 40 | |
Bristol Park | | Grand Forks, ND | | | 2,801 | | | 985 | | | 3,976 | | | — | | | 779 | | | 985 | | | 4,755 | | | 5,740 | | | 804 | | 02/01/2016 | | | 40 | |
Brookfield | | Fargo, ND | | | 1,945 | | | 228 | | | 1,958 | | | 30 | | | 318 | | | 258 | | | 2,276 | | | 2,534 | | | 761 | | 08/01/2008 | | 20 | - | 40 |
86
|
|
|
|
|
|
|
|
|
|
|
|
|
|
|
|
|
|
|
|
|
|
|
|
|
|
|
|
|
|
|
|
|
|
|
|
|
|
|
|
|
|
|
|
|
|
|
|
|
|
|
|
|
|
|
|
|
|
|
|
|
|
|
|
|
|
|
|
| Life on | ||
|
|
|
|
|
|
|
|
|
|
|
|
|
|
|
|
|
|
|
|
|
|
|
|
|
|
|
|
|
|
|
|
| which | ||
|
|
|
|
|
|
|
|
|
|
|
|
| Costs |
|
|
|
|
|
|
|
|
|
|
|
|
|
|
| depreciation | ||||||
|
|
|
|
|
|
|
|
|
|
|
|
| capitalized |
|
|
|
|
|
|
|
|
|
|
|
|
| Date of |
| on latest | ||||||
|
|
|
|
|
|
| Initial cost |
| subsequent |
| Gross Amount at which |
|
|
|
| Construction |
| income | |||||||||||||||||
Medical |
|
|
|
|
|
| to company |
| to acquisition (a) |
| carried at close of period |
| Accumulated |
| or |
| statement is | ||||||||||||||||||
Property |
| Physical Location |
| Encumbrances |
| Land |
| Buildings |
| Land |
| Buildings |
| Land |
| Buildings |
| Total |
| Depreciation |
| Acquisition |
| computed | |||||||||||
Bio-Life |
| Bismarck, ND |
| $ | 1,202 |
| $ | 306 |
| $ | 2,255 |
| $ | 11 |
| $ | 123 |
| $ | 317 |
| $ | 2,378 |
| $ | 2,695 |
| $ | 639 |
| 01/03/2008 |
| 9 | - | 40 |
Bio-Life |
| Grand Forks, ND |
|
| 1,201 |
|
| 457 |
|
| 2,230 |
|
| 1 |
|
| 158 |
|
| 458 |
|
| 2,388 |
|
| 2,846 |
|
| 662 |
| 01/03/2008 |
| 10 | - | 40 |
Bio-Life |
| Janesville, WI |
|
| 1,202 |
|
| 250 |
|
| 1,857 |
|
| — |
|
| 123 |
|
| 250 |
|
| 1,980 |
|
| 2,230 |
|
| 536 |
| 01/03/2008 |
| 9 | - | 40 |
Bio-Life |
| Mankato, MN |
|
| 1,201 |
|
| 390 |
|
| 2,111 |
|
| 263 |
|
| 1,154 |
|
| 653 |
|
| 3,265 |
|
| 3,918 |
|
| 799 |
| 01/03/2008 |
| 11 | - | 40 |
Bio-Life |
| Marquette, MI |
|
| — |
|
| 213 |
|
| 2,793 |
|
| — |
|
| 123 |
|
| 213 |
|
| 2,916 |
|
| 3,129 |
|
| 768 |
| 01/03/2008 |
| 9 | - | 40 |
Bio-Life |
| Onalaska, WI |
|
| 1,202 |
|
| 208 |
|
| 1,853 |
|
| — |
|
| 323 |
|
| 208 |
|
| 2,176 |
|
| 2,384 |
|
| 565 |
| 01/03/2008 |
| 11 | - | 40 |
Bio-Life |
| Oshkosh, WI |
|
| 1,201 |
|
| 293 |
|
| 1,705 |
|
| — |
|
| 146 |
|
| 293 |
|
| 1,851 |
|
| 2,144 |
|
| 522 |
| 01/03/2008 |
| 10 | - | 40 |
Bio-Life |
| Sheboygan, WI |
|
| 1,202 |
|
| 645 |
|
| 1,611 |
|
| — |
|
| 248 |
|
| 645 |
|
| 1,859 |
|
| 2,504 |
|
| 492 |
| 01/03/2008 |
| 10 | - | 40 |
Bio-Life |
| Stevens Point, WI |
|
| 1,201 |
|
| 119 |
|
| 2,184 |
|
| — |
|
| 123 |
|
| 119 |
|
| 2,307 |
|
| 2,426 |
|
| 617 |
| 01/03/2008 |
| 9 | - | 40 |
Total |
|
|
| $ | 9,612 |
| $ | 2,881 |
| $ | 18,599 |
| $ | 275 |
| $ | 2,521 |
| $ | 3,156 |
| $ | 21,120 |
| $ | 24,276 |
| $ | 5,600 |
|
|
|
|
|
|
|
|
|
|
|
|
|
|
|
|
|
|
|
|
|
|
|
|
|
|
|
|
|
|
|
|
|
|
|
|
|
|
|
|
|
|
|
|
|
|
|
|
|
|
|
|
|
|
|
|
|
|
|
|
|
|
|
|
|
|
|
|
|
|
|
|
|
|
| Life on | ||
|
|
|
|
|
|
|
|
|
|
|
|
|
|
|
|
|
|
|
|
|
|
|
|
|
|
|
|
|
|
|
|
| which | ||
|
|
|
|
|
|
|
|
|
|
|
|
| Costs |
|
|
|
|
|
|
|
|
|
|
|
|
|
|
| depreciation | ||||||
|
|
|
|
|
|
|
|
|
|
|
|
| capitalized |
|
|
|
|
|
|
|
|
|
|
|
|
| Date of |
| on latest | ||||||
|
|
|
|
|
|
| Initial cost |
| subsequent |
| Gross Amount at which |
|
|
|
| Construction |
| income | |||||||||||||||||
Residential |
|
|
|
|
|
| to company |
| to acquisition (a) |
| carried at close of period |
| Accumulated |
| or |
| statement is | ||||||||||||||||||
Property |
| Physical Location |
| Encumbrances |
| Land |
| Buildings |
| Land |
| Buildings |
| Land |
| Buildings |
| Total |
| Depreciation |
| Acquisition |
| computed | |||||||||||
|
|
|
|
|
|
|
|
|
|
|
|
|
|
|
|
|
|
|
|
|
|
|
|
|
|
|
|
|
|
|
|
|
|
|
|
Amberwood |
| Grand Forks, ND |
| $ | 2,536 |
| $ | 426 |
| $ | 3,304 |
| $ | 3 |
| $ | 76 |
| $ | 429 |
| $ | 3,380 |
| $ | 3,809 |
| $ | 112 |
| 09/13/2016 |
| 20 | - | 40 |
Arbor I/400 |
| Bismarck, ND |
|
| 416 |
|
| 73 |
|
| 516 |
|
| 4 |
|
| 65 |
|
| 77 |
|
| 581 |
|
| 658 |
|
| 61 |
| 06/04/2013 |
|
| 40 |
|
Arbor II/404 |
| Bismarck, ND |
|
| 426 |
|
| 73 |
|
| 538 |
|
| 6 |
|
| 14 |
|
| 79 |
|
| 552 |
|
| 631 |
|
| 57 |
| 11/01/2013 |
|
| 40 |
|
Arbor III/406 |
| Bismarck, ND |
|
| 423 |
|
| 71 |
|
| 536 |
|
| 7 |
|
| 14 |
|
| 78 |
|
| 550 |
|
| 628 |
|
| 57 |
| 11/01/2013 |
|
| 40 |
|
Ashbury |
| Fargo, ND |
|
| — |
|
| 314 |
|
| 3,774 |
|
| 33 |
|
| — |
|
| 347 |
|
| 3,774 |
|
| 4,121 |
|
| 102 |
| 12/19/2016 |
|
| 40 |
|
Auburn II |
| Fargo, ND |
|
| 967 |
|
| 105 |
|
| 883 |
|
| 12 |
|
| 64 |
|
| 117 |
|
| 947 |
|
| 1,064 |
|
| 252 |
| 03/23/2007 |
| 20 | - | 40 |
Autumn Ridge |
| Grand Forks, ND |
|
| 5,778 |
|
| 1,072 |
|
| 8,875 |
|
| 44 |
|
| 19 |
|
| 1,116 |
|
| 8,894 |
|
| 10,010 |
|
| 2,574 |
| 08/16/2004 |
| 9 | - | 40 |
Barrett Arms |
| Crookston, MN |
|
| 891 |
|
| 37 |
|
| 1,001 |
|
| — |
|
| 55 |
|
| 37 |
|
| 1,056 |
|
| 1,093 |
|
| 101 |
| 01/02/2014 |
|
| 40 |
|
Bayview |
| Fargo, ND |
|
| 3,097 |
|
| 284 |
|
| 4,077 |
|
| 69 |
|
| 65 |
|
| 353 |
|
| 4,142 |
|
| 4,495 |
|
| 1,035 |
| 12/31/2007 |
| 20 | - | 40 |
Berkshire |
| Fargo, ND |
|
| (0) |
|
| 31 |
|
| 406 |
|
| 4 |
|
| 6 |
|
| 35 |
|
| 412 |
|
| 447 |
|
| 101 |
| 03/31/2008 |
| 20 | - | 40 |
Betty Ann |
| Fargo, ND |
|
| 529 |
|
| 74 |
|
| 738 |
|
| 2 |
|
| 60 |
|
| 76 |
|
| 798 |
|
| 874 |
|
| 162 |
| 08/31/2009 |
|
| 40 |
|
Birchwood 1 |
| Fargo, ND |
|
| 259 |
|
| 72 |
|
| 342 |
|
| — |
|
| — |
|
| 72 |
|
| 342 |
|
| 414 |
|
| 1 |
| 12/01/2017 |
|
| 40 |
|
Birchwood 2 |
| Fargo, ND |
|
| 1,528 |
|
| 234 |
|
| 2,266 |
|
| — |
|
| — |
|
| 234 |
|
| 2,266 |
|
| 2,500 |
|
| 5 |
| 12/01/2017 |
|
| 40 |
|
Bridgeport |
| Fargo, ND |
|
| 5,310 |
|
| 613 |
|
| 7,676 |
|
| 4 |
|
| 7 |
|
| 617 |
|
| 7,683 |
|
| 8,300 |
|
| 208 |
| 12/19/2016 |
|
| 40 |
|
Brighton Village |
| New Brighton, MN |
|
| 10,498 |
|
| 2,520 |
|
| 13,985 |
|
| — |
|
| 767 |
|
| 2,520 |
|
| 14,752 |
|
| 17,272 |
|
| 1,110 |
| 12/19/2014 |
| 5 | - | 40 |
Bristol Park |
| Grand Forks, ND |
|
| 3,265 |
|
| 985 |
|
| 3,976 |
|
| — |
|
| 404 |
|
| 985 |
|
| 4,380 |
|
| 5,365 |
|
| 200 |
| 02/01/2016 |
|
| 40 |
|
Brookfield |
| Fargo, ND |
|
| 712 |
|
| 228 |
|
| 1,958 |
|
| 3 |
|
| 200 |
|
| 231 |
|
| 2,158 |
|
| 2,389 |
|
| 480 |
| 08/01/2008 |
| 20 | - | 40 |
Cambridge (FKA 44th Street) |
| Fargo, ND |
|
| 1,674 |
|
| 333 |
|
| 1,845 |
|
| 6 |
|
| 95 |
|
| 339 |
|
| 1,940 |
|
| 2,279 |
|
| 229 |
| 02/06/2013 |
|
| 40 |
|
Candlelight |
| Fargo, ND |
|
| 2,016 |
|
| 613 |
|
| 1,221 |
|
| (337) |
|
| 416 |
|
| 276 |
|
| 1,637 |
|
| 1,913 |
|
| 205 |
| 11/30/2012 |
|
| 40 |
|
106
STERLING REAL ESTATE TRUST AND SUBSIDIARIES
SCHEDULE III – REAL ESTATE AND ACCUMULATED DEPRECIATION
DECEMBER 31, 20172022
(Dollar amounts in thousands)
Brownstone | | Fargo, ND | | | 2,891 | | | 780 | | | 3,610 | | | — | | | — | | | 780 | | | 3,610 | | | 4,390 | | | 143 | | 06/01/2021 | | | 40 | |
Cambridge (FKA 44th Street) | | Fargo, ND | | | 1,614 | | | 333 | | | 1,845 | | | 4 | | | 237 | | | 337 | | | 2,082 | | | 2,419 | | | 480 | | 02/06/2013 | | | 40 | |
Candlelight | | Fargo, ND | | | 1,583 | | | 613 | | | 1,221 | | | (326) | | | 589 | | | 287 | | | 1,810 | | | 2,097 | | | 412 | | 11/30/2012 | | | 40 | |
Carling Manor | | Grand Forks, ND | | | 498 | | | 69 | | | 656 | | | 1 | | | 61 | | | 70 | | | 717 | | | 787 | | | 250 | | 03/31/2008 | | | 40 | |
Carlton Place | | Fargo, ND | | | 5,885 | | | 703 | | | 7,070 | | | 96 | | | 714 | | | 799 | | | 7,784 | | | 8,583 | | | 2,576 | | 09/01/2008 | | 20 | - | 40 |
Carr | | Fargo, ND | | | 583 | | | 66 | | | 759 | | | 4 | | | 41 | | | 70 | | | 800 | | | 870 | | | 116 | | 01/17/2017 | | | 40 | |
Cedars 4 | | Fargo, ND | | | — | | | 134 | | | 1,068 | | | — | | | 29 | | | 134 | | | 1,097 | | | 1,231 | | | 111 | | 12/31/2018 | | | 40 | |
Chandler 1802 | | Grand Forks, ND | | | 613 | | | 133 | | | 1,114 | | | — | | | 108 | | | 133 | | | 1,222 | | | 1,355 | | | 256 | | 01/02/2014 | | | 40 | |
Chandler 1834 | | Grand Forks, ND | | | 399 | | | 112 | | | 552 | | | — | | | 39 | | | 112 | | | 591 | | | 703 | | | 61 | | 09/1/2018 | | | 40 | |
Chandler 1866 | | Grand Forks, ND | | | 318 | | | 31 | | | 270 | | | — | | | 59 | | | 31 | | | 329 | | | 360 | | | 130 | | 01/03/2005 | | 20 | - | 40 |
Chandler 1898 | | Grand Forks, ND | | | — | | | 114 | | | 357 | | | — | | | — | | | 114 | | | 357 | | | 471 | | | 1 | | 12/1/2022 | | | 40 | |
Cherry Creek (FKA Village) | | Grand Forks, ND | | | — | | | 173 | | | 1,435 | | | 1 | | | 274 | | | 174 | | | 1,709 | | | 1,883 | | | 534 | | 11/01/2008 | | | 40 | |
Cityside Apartments | | Fargo, ND | | | 676 | | | 192 | | | 1,129 | | | 6 | | | 62 | | | 198 | | | 1,191 | | | 1,389 | | | 126 | | 11/30/2018 | | | 40 | |
Columbia Park Village I | | Grand Forks, ND | | | 295 | | | 102 | | | 546 | | | — | | | — | | | 102 | | | 546 | | | 648 | | | 41 | | 01/31/2020 | | | 40 | |
Columbia West | | Grand Forks, ND | | | 2,379 | | | 294 | | | 3,367 | | | 1 | | | 591 | | | 295 | | | 3,958 | | | 4,253 | | | 1,298 | | 09/01/2008 | | 20 | - | 40 |
Country Club | | Fargo, ND | | | 1,006 | | | 252 | | | 1,252 | | | 2 | | | 240 | | | 254 | | | 1,492 | | | 1,746 | | | 410 | | 05/02/2011 | | 20 | - | 40 |
Countryside | | Fargo, ND | | | 593 | | | 135 | | | 677 | | | — | | | 68 | | | 135 | | | 745 | | | 880 | | | 203 | | 05/02/2011 | | | 40 | |
Courtyard | | St. Louis Park, MN | | | 2,865 | | | 2,270 | | | 5,681 | | | — | | | 794 | | | 2,270 | | | 6,475 | | | 8,745 | | | 1,466 | | 09/03/2013 | | 5 | - | 40 |
Dakota Manor | | Fargo, ND | | | 1,391 | | | 249 | | | 2,236 | | | 20 | | | 182 | | | 269 | | | 2,418 | | | 2,687 | | | 486 | | 08/07/2014 | | | 40 | |
Danbury | | Fargo, ND | | | 4,572 | | | 381 | | | 5,869 | | | 211 | | | 653 | | | 592 | | | 6,522 | | | 7,114 | | | 2,317 | | 12/31/2007 | | 20 | - | 40 |
Dellwood Estates | | Anoka, MN | | | 6,177 | | | 844 | | | 9,924 | | | — | | | 861 | | | 844 | | | 10,785 | | | 11,629 | | | 2,468 | | 05/31/2013 | | | 40 | |
Deer Park | | Hutchinson, MN | | | 8,838 | | | 1,784 | | | 12,545 | | | — | | | — | | | 1,784 | | | 12,545 | | | 14,329 | | | 287 | | 02/28/2022 | | | 40 | |
Desoto Estates | | Grand Forks, ND | | | 4,155 | | | 955 | | | 4,869 | | | — | | | — | | | 955 | | | 4,869 | | | 5,824 | | | 81 | | 05/31/2022 | | | 40 | |
Desoto Townhomes | | Grand Forks, ND | | | 1,589 | | | 464 | | | 2,767 | | | — | | | — | | | 464 | | | 2,767 | | | 3,231 | | | 46 | | 05/31/2022 | | | 40 | |
Diamond Bend | | Mandan, ND | | | 6,825 | | | 722 | | | 9,789 | | | — | | | — | | | 722 | | | 9,789 | | | 10,511 | | | 143 | | 06/10/2022 | | | 40 | |
Eagle Run | | West Fargo, ND | | | 3,659 | | | 576 | | | 5,787 | | | 128 | | | 180 | | | 704 | | | 5,967 | | | 6,671 | | | 1,822 | | 08/12/2010 | | | 40 | |
Eagle Sky I | | Bismarck, ND | | | 801 | | | 115 | | | 1,292 | | | — | | | 104 | | | 115 | | | 1,396 | | | 1,511 | | | 248 | | 03/01/2016 | | | 40 | |
Eagle Sky II | | Bismarck, ND | | | 801 | | | 135 | | | 1,279 | | | — | | | 173 | | | 135 | | | 1,452 | | | 1,587 | | | 245 | | 03/01/2016 | | | 40 | |
East Bridge | | Fargo, ND | | | 3,143 | | | 792 | | | 5,396 | | | 1 | | | 301 | | | 793 | | | 5,697 | | | 6,490 | | | 770 | | 07/03/2017 | | | 40 | |
Eastbrook | | Bismarck, ND | | | 639 | | | 145 | | | 1,233 | | | — | | | — | | | 145 | | | 1,233 | | | 1,378 | | | 87 | | 01/31/2020 | | | 40 | |
Echo Manor | | Hutchinson, MN | | | 911 | | | 141 | | | 875 | | | — | | | 118 | | | 141 | | | 993 | | | 1,134 | | | 215 | | 01/02/2014 | | 20 | - | 40 |
Emerald Court | | Fargo, ND | | | — | | | 66 | | | 830 | | | 11 | | | 180 | | | 77 | | | 1,010 | | | 1,087 | | | 340 | | 03/31/2008 | | 20 | - | 40 |
Essex | | Fargo, ND | | | 525 | | | 212 | | | 642 | | | — | | | 68 | | | 212 | | | 710 | | | 922 | | | 98 | | 06/01/2017 | | | 40 | |
Evergreen Terrace | | Omaha, NE | | | 5,060 | | | 820 | | | 7,573 | | | — | | | 84 | | | 820 | | | 7,657 | | | 8,477 | | | 399 | | 12/17/2020 | | | 40 | |
Fairview | | Bismarck, ND | | | 2,502 | | | 267 | | | 3,978 | | | 39 | | | 918 | | | 306 | | | 4,896 | | | 5,202 | | | 1,527 | | 12/31/2008 | | 20 | - | 40 |
Flagstone | | Fargo, ND | | | 5,110 | | | 1,535 | | | 6,258 | | | — | | | — | | | 1,535 | | | 6,258 | | | 7,793 | | | 248 | | 06/01/2021 | | | 40 | |
Flickertail | | Fargo, ND | | | 4,799 | | | 426 | | | 5,590 | | | 76 | | | 1,674 | | | 502 | | | 7,264 | | | 7,766 | | | 2,132 | | 12/31/2008 | | | 40 | |
Forest Avenue | | Fargo, ND | | | 324 | | | 61 | | | 637 | | | 8 | | | 64 | | | 69 | | | 701 | | | 770 | | | 166 | | 02/06/2013 | | | 40 | |
Foxtail Creek Townhomes | | Fargo, ND | | | — | | | 267 | | | 1,221 | | | — | | | — | | | 267 | | | 1,221 | | | 1,488 | | | 71 | | 09/15/2020 | | | 40 | |
Galleria III | | Fargo, ND | | | 667 | | | 118 | | | 681 | | | 2 | | | 292 | | | 120 | | | 973 | | | 1,093 | | | 237 | | 11/09/2010 | | | 40 | |
Garden Grove | | Bismarck, ND | | | 4,089 | | | 606 | | | 6,073 | | | — | | | 168 | | | 606 | | | 6,241 | | | 6,847 | | | 1,050 | | 05/04/2016 | | 5 | - | 40 |
Georgetown on the River | | Fridley, MN | | | 16,522 | | | 4,620 | | | 23,833 | | | 8 | | | 4,117 | | | 4,628 | | | 27,950 | | | 32,578 | | | 5,451 | | 12/19/2014 | | 5 | - | 40 |
Glen Pond | | Eagan, MN | | | 35,566 | | | 3,761 | | | 20,569 | | | 38 | | | 960 | | | 3,799 | | | 21,529 | | | 25,328 | | | 5,842 | | 12/02/2011 | | 20 | - | 40 |
Glen Pond Addition | | Eagan, MN | | | 6,056 | | | 876 | | | 15,408 | | | — | | | — | | | 876 | | | 15,408 | | | 16,284 | | | 899 | | 09/30/2020 | | | 40 | |
87
|
|
|
|
|
|
|
|
|
|
|
|
|
|
|
|
|
|
|
|
|
|
|
|
|
|
|
|
|
|
|
|
|
|
|
|
|
|
|
|
|
|
|
|
|
|
|
|
|
|
|
|
|
|
|
|
|
|
|
|
|
|
|
|
|
|
|
|
| Life on | ||
|
|
|
|
|
|
|
|
|
|
|
|
|
|
|
|
|
|
|
|
|
|
|
|
|
|
|
|
|
|
|
|
| which | ||
|
|
|
|
|
|
|
|
|
|
|
|
| Costs |
|
|
|
|
|
|
|
|
|
|
|
|
|
|
| depreciation | ||||||
|
|
|
|
|
|
|
|
|
|
|
|
| capitalized |
|
|
|
|
|
|
|
|
|
|
|
|
| Date of |
| on latest | ||||||
|
|
|
|
|
|
| Initial cost |
| subsequent |
| Gross Amount at which |
|
|
|
| Construction |
| income | |||||||||||||||||
Residential |
|
|
|
|
|
| to company |
| to acquisition (a) |
| carried at close of period |
| Accumulated |
| or |
| statement is | ||||||||||||||||||
Property |
| Physical Location |
| Encumbrances |
| Land |
| Buildings |
| Land |
| Buildings |
| Land |
| Buildings |
| Total |
| Depreciation |
| Acquisition |
| computed | |||||||||||
Carling Manor |
| Grand Forks, ND |
|
| 476 |
|
| 69 |
|
| 656 |
|
| 0 |
|
| 18 |
|
| 69 |
|
| 674 |
|
| 743 |
|
| 161 |
| 03/31/2008 |
|
| 40 |
|
Carlton Place |
| Fargo, ND |
|
| 6,979 |
|
| 703 |
|
| 7,207 |
|
| 14 |
|
| 69 |
|
| 717 |
|
| 7,276 |
|
| 7,993 |
|
| 1,669 |
| 09/01/2008 |
| 20 | - | 40 |
Carr |
| Fargo, ND |
|
| 571 |
|
| 66 |
|
| 759 |
|
| 1 |
|
| — |
|
| 67 |
|
| 759 |
|
| 826 |
|
| 19 |
| 01/17/2017 |
|
| 40 |
|
Chandler 1802 |
| Grand Forks, ND |
|
| 677 |
|
| 133 |
|
| 1,114 |
|
| — |
|
| 12 |
|
| 133 |
|
| 1,126 |
|
| 1,259 |
|
| 112 |
| 01/02/2014 |
|
| 40 |
|
Chandler 1866 |
| Grand Forks, ND |
|
| 339 |
|
| 31 |
|
| 270 |
|
| 0 |
|
| 28 |
|
| 31 |
|
| 298 |
|
| 329 |
|
| 92 |
| 01/03/2005 |
| 20 | - | 40 |
Cherry Creek (FKA Village) |
| Grand Forks, ND |
|
| 959 |
|
| 173 |
|
| 1,435 |
|
| 1 |
|
| 60 |
|
| 174 |
|
| 1,495 |
|
| 1,669 |
|
| 338 |
| 11/01/2008 |
|
| 40 |
|
Columbia West |
| Grand Forks, ND |
|
| 3,067 |
|
| 294 |
|
| 3,406 |
|
| 1 |
|
| 154 |
|
| 295 |
|
| 3,560 |
|
| 3,855 |
|
| 824 |
| 09/01/2008 |
| 20 | - | 40 |
Country Club |
| Fargo, ND |
|
| 263 |
|
| 252 |
|
| 1,252 |
|
| 3 |
|
| 133 |
|
| 255 |
|
| 1,385 |
|
| 1,640 |
|
| 221 |
| 05/02/2011 |
| 20 | - | 40 |
Countryside |
| Fargo, ND |
|
| 161 |
|
| 135 |
|
| 677 |
|
| — |
|
| 14 |
|
| 135 |
|
| 691 |
|
| 826 |
|
| 111 |
| 05/02/2011 |
|
| 40 |
|
Courtyard |
| St. Louis Park, MN |
|
| 3,829 |
|
| 2,270 |
|
| 5,681 |
|
| — |
|
| 592 |
|
| 2,270 |
|
| 6,273 |
|
| 8,543 |
|
| 643 |
| 09/03/2013 |
| 5 | - | 40 |
Dakota Manor |
| Fargo, ND |
|
| 1,759 |
|
| 249 |
|
| 2,236 |
|
| 27 |
|
| 49 |
|
| 276 |
|
| 2,285 |
|
| 2,561 |
|
| 192 |
| 08/07/2014 |
|
| 40 |
|
Danbury |
| Fargo, ND |
|
| 2,698 |
|
| 381 |
|
| 6,020 |
|
| 254 |
|
| 225 |
|
| 635 |
|
| 6,245 |
|
| 6,880 |
|
| 1,512 |
| 12/31/2007 |
| 20 | - | 40 |
Dellwood Estates |
| Anoka, MN |
|
| 7,369 |
|
| 844 |
|
| 9,966 |
|
| — |
|
| 382 |
|
| 844 |
|
| 10,348 |
|
| 11,192 |
|
| 1,166 |
| 05/31/2013 |
|
| 40 |
|
Eagle Run |
| West Fargo, ND |
|
| 4,208 |
|
| 576 |
|
| 5,787 |
|
| 111 |
|
| 97 |
|
| 687 |
|
| 5,884 |
|
| 6,571 |
|
| 1,078 |
| 08/12/2010 |
|
| 40 |
|
Eagle Sky I |
| Bismarck, ND |
|
| 938 |
|
| 115 |
|
| 1,292 |
|
| — |
|
| 74 |
|
| 115 |
|
| 1,366 |
|
| 1,481 |
|
| 62 |
| 03/01/2016 |
|
| 40 |
|
Eagle Sky II |
| Bismarck, ND |
|
| 938 |
|
| 135 |
|
| 1,279 |
|
| — |
|
| 77 |
|
| 135 |
|
| 1,356 |
|
| 1,491 |
|
| 61 |
| 03/01/2016 |
|
| 40 |
|
East Bridge |
| Fargo, ND |
|
| 3,618 |
|
| 792 |
|
| 5,477 |
|
| — |
|
| 158 |
|
| 792 |
|
| 5,635 |
|
| 6,427 |
|
| 70 |
| 07/03/2017 |
|
| 40 |
|
Echo Manor |
| Hutchinson, MN |
|
| 962 |
|
| 141 |
|
| 875 |
|
| — |
|
| 32 |
|
| 141 |
|
| 907 |
|
| 1,048 |
|
| 91 |
| 01/02/2014 |
| 20 | - | 40 |
Emerald Court |
| Fargo, ND |
|
| — |
|
| 66 |
|
| 830 |
|
| 2 |
|
| 87 |
|
| 68 |
|
| 917 |
|
| 985 |
|
| 216 |
| 03/31/2008 |
| 20 | - | 40 |
Essex |
| Fargo, ND |
|
| 567 |
|
| 212 |
|
| 642 |
|
| — |
|
| 10 |
|
| 212 |
|
| 652 |
|
| 864 |
|
| 9 |
| 06/01/2017 |
|
| 40 |
|
Fairview |
| Bismarck, ND |
|
| 2,951 |
|
| 267 |
|
| 3,978 |
|
| 39 |
|
| 813 |
|
| 306 |
|
| 4,791 |
|
| 5,097 |
|
| 916 |
| 12/31/2008 |
| 20 | - | 40 |
Flickertail |
| Fargo, ND |
|
| 5,485 |
|
| 426 |
|
| 5,632 |
|
| 90 |
|
| 137 |
|
| 516 |
|
| 5,769 |
|
| 6,285 |
|
| 1,287 |
| 12/31/2008 |
|
| 40 |
|
Forest Avenue |
| Fargo, ND |
|
| 412 |
|
| 61 |
|
| 637 |
|
| 4 |
|
| 22 |
|
| 65 |
|
| 659 |
|
| 724 |
|
| 79 |
| 02/06/2013 |
|
| 40 |
|
Galleria III |
| Fargo, ND |
|
| 557 |
|
| 118 |
|
| 681 |
|
| 1 |
|
| 23 |
|
| 119 |
|
| 704 |
|
| 823 |
|
| 122 |
| 11/09/2010 |
|
| 40 |
|
Garden Grove |
| Bismarck, ND |
|
| 4,562 |
|
| 606 |
|
| 6,073 |
|
| — |
|
| 83 |
|
| 606 |
|
| 6,156 |
|
| 6,762 |
|
| 259 |
| 05/04/2016 |
| 5 | - | 40 |
Georgetown on the River |
| Fridley, MN |
|
| 18,634 |
|
| 4,620 |
|
| 25,208 |
|
| — |
|
| 872 |
|
| 4,620 |
|
| 26,080 |
|
| 30,700 |
|
| 1,995 |
| 12/19/2014 |
| 5 | - | 40 |
Glen Pond |
| Eagan, MN |
|
| 15,074 |
|
| 3,761 |
|
| 20,569 |
|
| — |
|
| 561 |
|
| 3,761 |
|
| 21,130 |
|
| 24,891 |
|
| 3,161 |
| 12/02/2011 |
| 20 | - | 40 |
Granger Court I |
| Fargo, ND |
|
| 2,328 |
|
| 279 |
|
| 2,619 |
|
| 35 |
|
| 29 |
|
| 314 |
|
| 2,648 |
|
| 2,962 |
|
| 298 |
| 06/04/2013 |
|
| 40 |
|
Griffin Court |
| Moorhead, MN |
|
| 3,335 |
|
| 652 |
|
| 3,858 |
|
| 20 |
|
| 347 |
|
| 672 |
|
| 4,205 |
|
| 4,877 |
|
| 377 |
| 06/09/2014 |
| 5 | - | 40 |
Hannifin |
| Bismarck, ND |
|
| 479 |
|
| 81 |
|
| 607 |
|
| 5 |
|
| 52 |
|
| 86 |
|
| 659 |
|
| 745 |
|
| 65 |
| 11/01/2013 |
|
| 40 |
|
Highland Meadows |
| Bismarck, ND |
|
| 2,118 |
|
| 1,532 |
|
| 8,519 |
|
| — |
|
| 208 |
|
| 1,532 |
|
| 8,727 |
|
| 10,259 |
|
| 145 |
| 05/01/2017 |
| 5 | - | 40 |
Hunters Run I |
| Fargo, ND |
|
| 542 |
|
| 50 |
|
| 419 |
|
| 2 |
|
| (2) |
|
| 52 |
|
| 417 |
|
| 469 |
|
| 111 |
| 03/23/2007 |
|
| 40 |
|
Hunters Run II |
| Fargo, ND |
|
| 548 |
|
| 44 |
|
| 441 |
|
| 2 |
|
| — |
|
| 46 |
|
| 441 |
|
| 487 |
|
| 105 |
| 07/01/2008 |
|
| 40 |
|
Huntington |
| Fargo, ND |
|
| — |
|
| 86 |
|
| 309 |
|
| 0 |
|
| 15 |
|
| 86 |
|
| 324 |
|
| 410 |
|
| 19 |
| 08/04/2015 |
|
| 40 |
|
Islander |
| Fargo, ND |
|
| 869 |
|
| 98 |
|
| 884 |
|
| — |
|
| 53 |
|
| 98 |
|
| 937 |
|
| 1,035 |
|
| 147 |
| 07/01/2011 |
|
| 40 |
|
Jadestone |
| Fargo, ND |
|
| 538 |
|
| 212 |
|
| 595 |
|
| — |
|
| 11 |
|
| 212 |
|
| 606 |
|
| 818 |
|
| 9 |
| 06/01/2017 |
|
| 40 |
|
Kennedy |
| Fargo, ND |
|
| 449 |
|
| 84 |
|
| 588 |
|
| 10 |
|
| 47 |
|
| 94 |
|
| 635 |
|
| 729 |
|
| 73 |
| 02/06/2013 |
| 20 | - | 40 |
Library Lane |
| Grand Forks, ND |
|
| 2,294 |
|
| 301 |
|
| 2,401 |
|
| 12 |
|
| 121 |
|
| 313 |
|
| 2,522 |
|
| 2,835 |
|
| 639 |
| 10/01/2007 |
| 20 | - | 40 |
107
STERLING REAL ESTATE TRUST AND SUBSIDIARIES
SCHEDULE III – REAL ESTATE AND ACCUMULATED DEPRECIATION
DECEMBER 31, 20172022
(Dollar amounts in thousands)
Granger Court I | | Fargo, ND | | | 1,908 | | | 279 | | | 1,926 | | | 25 | | | 301 | | | 304 | | | 2,227 | | | 2,531 | | | 479 | | 06/04/2013 | | 20 | - | 40 |
Hannifin | | Bismarck, ND | | | 403 | | | 81 | | | 607 | | | 5 | | | 52 | | | 86 | | | 659 | | | 745 | | | 147 | | 11/01/2013 | | | 40 | |
Harrison and Richfield | | Grand Forks, ND | | | 4,904 | | | 756 | | | 6,346 | | | 7 | | | 321 | | | 763 | | | 6,667 | | | 7,430 | | | 2,578 | | 07/01/2007 | | 5 | - | 40 |
Hartford Apartments | | Fargo, ND | | | 833 | | | 154 | | | 1,233 | | | — | | | 14 | | | 154 | | | 1,247 | | | 1,401 | | | 132 | | 10/1/2018 | | | 40 | |
Hawn | | Fargo, ND | | | 1,491 | | | 280 | | | 2,277 | | | — | | | — | | | 280 | | | 2,277 | | | 2,557 | | | 161 | | 03/01/2020 | | | 40 | |
Highland Meadows | | Bismarck, ND | | | 5,440 | | | 1,532 | | | 8,513 | | | — | | | 457 | | | 1,532 | | | 8,970 | | | 10,502 | | | 1,271 | | 05/01/2017 | | 5 | - | 40 |
Hunters Run I | | Fargo, ND | | | 473 | | | 50 | | | 419 | | | 5 | | | (2) | | | 55 | | | 417 | | | 472 | | | 163 | | 03/23/2007 | | | 40 | |
Hunters Run II | | Fargo, ND | | | 430 | | | 44 | | | 441 | | | 2 | | | — | | | 46 | | | 441 | | | 487 | | | 160 | | 07/01/2008 | | | 40 | |
Huntington | | Fargo, ND | | | 314 | | | 86 | | | 309 | | | 4 | | | 15 | | | 90 | | | 324 | | | 414 | | | 60 | | 08/04/2015 | | | 40 | |
Islander | | Fargo, ND | | | 732 | | | 98 | | | 884 | | | 49 | | | 115 | | | 147 | | | 999 | | | 1,146 | | | 270 | | 07/01/2011 | | | 40 | |
Jadestone | | Fargo, ND | | | 498 | | | 212 | | | 554 | | | — | | | 127 | | | 212 | | | 681 | | | 893 | | | 90 | | 06/01/2017 | | | 40 | |
Kennedy | | Fargo, ND | | | 354 | | | 84 | | | 588 | | | 7 | | | 91 | | | 91 | | | 679 | | | 770 | | | 161 | | 02/06/2013 | | 20 | - | 40 |
Library Lane | | Grand Forks, ND | | | 2,006 | | | 301 | | | 2,332 | | | 16 | | | 189 | | | 317 | | | 2,521 | | | 2,838 | | | 937 | | 10/01/2007 | | 20 | - | 40 |
Madison | | Grand Forks, ND | | | 272 | | | 95 | | | 497 | | | — | | | 100 | | | 95 | | | 597 | | | 692 | | | 102 | | 09/01/2015 | | | 40 | |
Maple Ridge | | Omaha, NE | | | 7,749 | | | 766 | | | 5,608 | | | 59 | | | 3,715 | | | 825 | | | 9,323 | | | 10,148 | | | 2,582 | | 08/01/2008 | | 20 | - | 40 |
Maplewood | | Maplewood, MN | | | 8,556 | | | 3,120 | | | 11,655 | | | — | | | 2,411 | | | 3,120 | | | 14,066 | | | 17,186 | | | 2,537 | | 12/19/2014 | | 5 | - | 40 |
Maplewood Bend I, II, III. IV, V, VI, VII, VIII & Royale | | Fargo, ND | | | 4,235 | | | 783 | | | 5,839 | | | 1 | | | 491 | | | 784 | | | 6,330 | | | 7,114 | | | 1,899 | | 01/01/2009 | | 20 | - | 40 |
Martha Alice | | Fargo, ND | | | 421 | | | 74 | | | 738 | | | 6 | | | 183 | | | 80 | | | 921 | | | 1,001 | | | 279 | | 08/31/2009 | | 20 | - | 40 |
Mayfair | | Grand Forks, ND | | | — | | | 80 | | | 1,043 | | | 4 | | | 123 | | | 84 | | | 1,166 | | | 1,250 | | | 394 | | 07/01/2008 | | 20 | - | 40 |
Monticello | | Fargo, ND | | | 544 | | | 60 | | | 752 | | | 14 | | | 111 | | | 74 | | | 863 | | | 937 | | | 184 | | 11/08/2013 | | 20 | - | 40 |
Montreal Courts | | Little Canada, MN | | | 16,802 | | | 5,809 | | | 19,565 | | | 15 | | | 3,605 | | | 5,824 | | | 23,170 | | | 28,994 | | | 4,961 | | 10/02/2013 | | 5 | - | 40 |
Morningside Apartments | | Fargo, ND | | | 458 | | | 85 | | | 673 | | | — | | | 42 | | | 85 | | | 715 | | | 800 | | | 71 | | 11/30/2018 | | | 40 | |
Newgate | | Bismarck, ND | | | 1,503 | | | 538 | | | 1,755 | | | — | | | — | | | 538 | | | 1,755 | | | 2,293 | | | 15 | | 09/13/2022 | | | 40 | |
Oak Court | | Fargo, ND | | | 2,502 | | | 270 | | | 2,210 | | | 29 | | | 436 | | | 299 | | | 2,646 | | | 2,945 | | | 899 | | 04/30/2008 | | 28 | - | 40 |
Oakview Townhomes | | Grand Forks, ND | | | 3,473 | | | 822 | | | 4,698 | | | 1 | | | 471 | | | 823 | | | 5,169 | | | 5,992 | | | 767 | | 01/11/2017 | | | 40 | |
Oxford | | Fargo, ND | | | 6,679 | | | 1,655 | | | 8,563 | | | — | | | — | | | 1,655 | | | 8,563 | | | 10,218 | | | 321 | | 07/01/2021 | | | 40 | |
Pacific Park I | | Fargo, ND | | | 526 | | | 95 | | | 777 | | | 3 | | | 130 | | | 98 | | | 907 | | | 1,005 | | | 205 | | 02/06/2013 | | | 40 | |
Pacific Park II | | Fargo, ND | | | 450 | | | 111 | | | 865 | | | 4 | | | 140 | | | 115 | | | 1,005 | | | 1,120 | | | 225 | | 02/06/2013 | | | 40 | |
Pacific South | | Fargo, ND | | | 278 | | | 58 | | | 459 | | | 2 | | | 16 | | | 60 | | | 475 | | | 535 | | | 114 | | 02/06/2013 | | | 40 | |
Park Circle | | Fargo, ND | | | 547 | | | 196 | | | 716 | | | 7 | | | 17 | | | 203 | | | 733 | | | 936 | | | 102 | | 06/01/2017 | | | 40 | |
Parkview Arms | | Bismarck, ND | | | — | | | 373 | | | 3,845 | | | — | | | 365 | | | 373 | | | 4,210 | | | 4,583 | | | 784 | | 05/13/2015 | | 5 | - | 40 |
Parkwest Gardens | | West Fargo, ND | | | 3,010 | | | 713 | | | 5,712 | | | 39 | | | 1,390 | | | 752 | | | 7,102 | | | 7,854 | | | 1,396 | | 06/30/2014 | | 20 | - | 40 |
Parkwood | | Fargo, ND | | | — | | | 126 | | | 1,143 | | | 14 | | | 23 | | | 140 | | | 1,166 | | | 1,306 | | | 407 | | 08/01/2008 | | | 40 | |
Pebble Creek | | Bismarck, ND | | | 3,588 | | | 260 | | | 2,818 | | | 31 | | | (62) | | | 291 | | | 2,756 | | | 3,047 | | | 958 | | 03/19/2008 | | 20 | - | 40 |
Pinehurst | | Fargo, ND | | | 9,716 | | | 2,368 | | | 12,614 | | | — | | | — | | | 2,368 | | | 12,614 | | | 14,982 | | | 473 | | 07/01/2021 | | | 40 | |
Plumtree | | Fargo, ND | | | 516 | | | 100 | | | 782 | | | — | | | 29 | | | 100 | | | 811 | | | 911 | | | 114 | | 05/01/2017 | | | 40 | |
Prairiewood Courts | | Fargo, ND | | | — | | | 308 | | | 1,730 | | | 28 | | | 143 | | | 336 | | | 1,873 | | | 2,209 | | | 725 | | 09/01/2006 | | 20 | - | 40 |
Prairiewood Meadows | | Fargo, ND | | | 3,781 | | | 736 | | | 852 | | | 11 | | | 367 | | | 747 | | | 1,219 | | | 1,966 | | | 232 | | 09/30/2012 | | | 40 | |
Prose Fossil Creek | | Fort Worth, TX | | | — | | | 5,451 | | | 46,811 | | | — | | | — | | | 5,451 | | | 46,811 | | | 52,262 | | | 98 | | 12/29/2022 | | | 40 | |
Quail Creek | | Springfield, MO | | | 5,317 | | | 1,529 | | | 7,396 | | | — | | | 1,656 | | | 1,529 | | | 9,052 | | | 10,581 | | | 1,537 | | 02/03/2015 | | 5 | - | 40 |
Robinwood | | Coon Rapids, MN | | | 4,129 | | | 1,380 | | | 6,133 | | | — | | | 711 | | | 1,380 | | | 6,844 | | | 8,224 | | | 1,333 | | 12/19/2014 | | | 40 | |
Rosedale Estates | | Roseville, MN | | | 13,916 | | | 4,680 | | | 20,591 | | | — | | | 836 | | | 4,680 | | | 21,427 | | | 26,107 | | | 4,289 | | 12/19/2014 | | 5 | - | 40 |
Rosegate | | Fargo, ND | | | 2,888 | | | 251 | | | 2,978 | | | 49 | | | 132 | | | 300 | | | 3,110 | | | 3,410 | | | 1,136 | | 04/30/2008 | | 20 | - | 40 |
Rosser | | Bismarck, ND | | | 688 | | | 156 | | | 1,216 | | | — | | | 86 | | | 156 | | | 1,302 | | | 1,458 | | | 88 | | 03/01/2020 | | | 40 | |
88
|
|
|
|
|
|
|
|
|
|
|
|
|
|
|
|
|
|
|
|
|
|
|
|
|
|
|
|
|
|
|
|
|
|
|
|
|
|
|
|
|
|
|
|
|
|
|
|
|
|
|
|
|
|
|
|
|
|
|
|
|
|
|
|
|
|
|
|
| Life on | ||
|
|
|
|
|
|
|
|
|
|
|
|
|
|
|
|
|
|
|
|
|
|
|
|
|
|
|
|
|
|
|
|
| which | ||
|
|
|
|
|
|
|
|
|
|
|
|
| Costs |
|
|
|
|
|
|
|
|
|
|
|
|
|
|
| depreciation | ||||||
|
|
|
|
|
|
|
|
|
|
|
|
| capitalized |
|
|
|
|
|
|
|
|
|
|
|
|
| Date of |
| on latest | ||||||
|
|
|
|
|
|
| Initial cost |
| subsequent |
| Gross Amount at which |
|
|
|
| Construction |
| income | |||||||||||||||||
Residential |
|
|
|
|
|
| to company |
| to acquisition (a) |
| carried at close of period |
| Accumulated |
| or |
| statement is | ||||||||||||||||||
Property |
| Physical Location |
| Encumbrances |
| Land |
| Buildings |
| Land |
| Buildings |
| Land |
| Buildings |
| Total |
| Depreciation |
| Acquisition |
| computed | |||||||||||
Madison |
| Grand Forks, ND |
|
| 256 |
|
| 95 |
|
| 497 |
|
| 0 |
|
| 52 |
|
| 95 |
|
| 549 |
|
| 644 |
|
| 31 |
| 09/01/2015 |
|
| 40 |
|
Maple Ridge |
| Omaha, NE |
|
| 4,076 |
|
| 766 |
|
| 5,608 |
|
| — |
|
| 910 |
|
| 766 |
|
| 6,518 |
|
| 7,284 |
|
| 1,425 |
| 08/01/2008 |
| 20 | - | 40 |
Maplewood |
| Maplewood, MN |
|
| 9,652 |
|
| 3,120 |
|
| 12,122 |
|
| — |
|
| 337 |
|
| 3,120 |
|
| 12,459 |
|
| 15,579 |
|
| 953 |
| 12/19/2014 |
| 5 | - | 40 |
Maplewood Bend I, II, III. IV, V, VI, VII, VIII & Royale |
| Fargo, ND |
|
| 5,050 |
|
| 783 |
|
| 5,839 |
|
| — |
|
| 214 |
|
| 783 |
|
| 6,053 |
|
| 6,836 |
|
| 1,109 |
| 01/01/2009 |
| 20 | - | 40 |
Martha Alice |
| Fargo, ND |
|
| 529 |
|
| 74 |
|
| 738 |
|
| 2 |
|
| 83 |
|
| 76 |
|
| 821 |
|
| 897 |
|
| 170 |
| 08/31/2009 |
| 20 | - | 40 |
Mayfair |
| Grand Forks, ND |
|
| — |
|
| 80 |
|
| 1,043 |
|
| 0 |
|
| 26 |
|
| 80 |
|
| 1,069 |
|
| 1,149 |
|
| 252 |
| 07/01/2008 |
| 20 | - | 40 |
Monticello |
| Fargo, ND |
|
| 693 |
|
| 60 |
|
| 752 |
|
| 7 |
|
| 32 |
|
| 67 |
|
| 784 |
|
| 851 |
|
| 81 |
| 11/08/2013 |
| 20 | - | 40 |
Montreal Courts |
| Little Canada, MN |
|
| 18,739 |
|
| 5,809 |
|
| 19,565 |
|
| 15 |
|
| 764 |
|
| 5,824 |
|
| 20,329 |
|
| 26,153 |
|
| 2,175 |
| 10/02/2013 |
| 5 | - | 40 |
Oak Court |
| Fargo, ND |
|
| 2,851 |
|
| 270 |
|
| 2,354 |
|
| 13 |
|
| 300 |
|
| 283 |
|
| 2,654 |
|
| 2,937 |
|
| 605 |
| 04/30/2008 |
| 28 | - | 40 |
Oakview Townhomes |
| Grand Forks, ND |
|
| 3,648 |
|
| 822 |
|
| 4,698 |
|
| — |
|
| 182 |
|
| 822 |
|
| 4,880 |
|
| 5,702 |
|
| 120 |
| 01/11/2017 |
|
| 40 |
|
Pacific Park I |
| Fargo, ND |
|
| 669 |
|
| 95 |
|
| 777 |
|
| — |
|
| 42 |
|
| 95 |
|
| 819 |
|
| 914 |
|
| 99 |
| 02/06/2013 |
|
| 40 |
|
Pacific Park II |
| Fargo, ND |
|
| 572 |
|
| 111 |
|
| 865 |
|
| — |
|
| 37 |
|
| 111 |
|
| 902 |
|
| 1,013 |
|
| 110 |
| 02/06/2013 |
|
| 40 |
|
Pacific South |
| Fargo, ND |
|
| 353 |
|
| 58 |
|
| 459 |
|
| — |
|
| — |
|
| 58 |
|
| 459 |
|
| 517 |
|
| 56 |
| 02/06/2013 |
|
| 40 |
|
Park Circle |
| Fargo, ND |
|
| 591 |
|
| 196 |
|
| 716 |
|
| 9 |
|
| 12 |
|
| 205 |
|
| 728 |
|
| 933 |
|
| 11 |
| 06/01/2017 |
|
| 40 |
|
Parkview Arms |
| Bismarck, ND |
|
| — |
|
| 373 |
|
| 3,845 |
|
| — |
|
| 104 |
|
| 373 |
|
| 3,949 |
|
| 4,322 |
|
| 267 |
| 05/13/2015 |
| 5 | - | 40 |
Parkwest Gardens |
| West Fargo, ND |
|
| 3,862 |
|
| 713 |
|
| 5,825 |
|
| — |
|
| 444 |
|
| 713 |
|
| 6,269 |
|
| 6,982 |
|
| 548 |
| 06/30/2014 |
| 20 | - | 40 |
Parkwood |
| Fargo, ND |
|
| — |
|
| 126 |
|
| 1,143 |
|
| 7 |
|
| 16 |
|
| 133 |
|
| 1,159 |
|
| 1,292 |
|
| 261 |
| 08/01/2008 |
|
| 40 |
|
Pebble Creek |
| Bismarck, ND |
|
| 4,262 |
|
| 260 |
|
| 3,704 |
|
| — |
|
| (300) |
|
| 260 |
|
| 3,404 |
|
| 3,664 |
|
| 842 |
| 03/19/2008 |
| 20 | - | 40 |
Plumtree |
| Fargo, ND |
|
| 589 |
|
| 100 |
|
| 782 |
|
| — |
|
| 19 |
|
| 100 |
|
| 801 |
|
| 901 |
|
| 13 |
| 05/01/2017 |
|
| 40 |
|
Prairiewood Courts |
| Fargo, ND |
|
| — |
|
| 308 |
|
| 1,815 |
|
| 28 |
|
| 80 |
|
| 336 |
|
| 1,895 |
|
| 2,231 |
|
| 514 |
| 09/01/2006 |
| 20 | - | 40 |
Prairiewood Meadows |
| Fargo, ND |
|
| 2,187 |
|
| 736 |
|
| 2,514 |
|
| 11 |
|
| 16 |
|
| 747 |
|
| 2,530 |
|
| 3,277 |
|
| 336 |
| 09/30/2012 |
|
| 40 |
|
Quail Creek |
| Springfield, MO |
|
| 6,884 |
|
| 1,529 |
|
| 8,717 |
|
| — |
|
| 67 |
|
| 1,529 |
|
| 8,784 |
|
| 10,313 |
|
| 645 |
| 02/03/2015 |
| 5 | - | 40 |
Richfield/Harrison |
| Grand Forks, ND |
|
| 5,860 |
|
| 756 |
|
| 6,346 |
|
| 3 |
|
| 296 |
|
| 759 |
|
| 6,642 |
|
| 7,401 |
|
| 1,730 |
| 07/01/2007 |
| 5 | - | 40 |
Robinwood |
| Coon Rapids, MN |
|
| 4,657 |
|
| 1,138 |
|
| 6,133 |
|
| 242 |
|
| 277 |
|
| 1,380 |
|
| 6,410 |
|
| 7,790 |
|
| 479 |
| 12/19/2014 |
|
| 40 |
|
Rosedale Estates |
| Roseville, MN |
|
| 15,771 |
|
| 4,680 |
|
| 20,591 |
|
| — |
|
| 494 |
|
| 4,680 |
|
| 21,085 |
|
| 25,765 |
|
| 1,613 |
| 12/19/2014 |
| 5 | - | 40 |
Rosegate |
| Fargo, ND |
|
| 2,977 |
|
| 251 |
|
| 2,978 |
|
| 57 |
|
| 84 |
|
| 308 |
|
| 3,062 |
|
| 3,370 |
|
| 752 |
| 04/30/2008 |
| 20 | - | 40 |
Roughrider |
| Grand Forks, ND |
|
| 398 |
|
| 100 |
|
| 448 |
|
| — |
|
| 82 |
|
| 100 |
|
| 530 |
|
| 630 |
|
| 18 |
| 08/01/2016 |
| 5 | - | 40 |
Saddlebrook |
| West Fargo, ND |
|
| 980 |
|
| 148 |
|
| 1,262 |
|
| 13 |
|
| 89 |
|
| 161 |
|
| 1,351 |
|
| 1,512 |
|
| 289 |
| 12/31/2008 |
|
| 40 |
|
Sargent |
| Fargo, ND |
|
| 1,090 |
|
| 164 |
|
| 1,529 |
|
| — |
|
| — |
|
| 164 |
|
| 1,529 |
|
| 1,693 |
|
| 38 |
| 01/10/2017 |
|
| 40 |
|
Schrock |
| Fargo, ND |
|
| 513 |
|
| 71 |
|
| 626 |
|
| 3 |
|
| 6 |
|
| 74 |
|
| 632 |
|
| 706 |
|
| 72 |
| 06/04/2013 |
|
| 40 |
|
Sheridan Pointe |
| Fargo, ND |
|
| 2,037 |
|
| 292 |
|
| 2,424 |
|
| 21 |
|
| (60) |
|
| 313 |
|
| 2,364 |
|
| 2,677 |
|
| 251 |
| 10/01/2013 |
|
| 40 |
|
Sierra Ridge |
| Bismarck, ND |
|
| 5,435 |
|
| 754 |
|
| 8,795 |
|
| 151 |
|
| 2 |
|
| 905 |
|
| 8,797 |
|
| 9,702 |
|
| 1,853 |
| 09/01/2006 |
|
| 40 |
|
Somerset |
| Fargo, ND |
|
| 3,063 |
|
| 300 |
|
| 3,431 |
|
| 7 |
|
| (12) |
|
| 307 |
|
| 3,419 |
|
| 3,726 |
|
| 808 |
| 07/01/2008 |
|
| 40 |
|
Southgate |
| Fargo, ND |
|
| 2,733 |
|
| 803 |
|
| 5,299 |
|
| 15 |
|
| (45) |
|
| 818 |
|
| 5,254 |
|
| 6,072 |
|
| 1,363 |
| 07/01/2007 |
| 20 | - | 40 |
Southview III |
| Grand Forks, ND |
|
| 210 |
|
| 99 |
|
| 522 |
|
| — |
|
| 68 |
|
| 99 |
|
| 590 |
|
| 689 |
|
| 93 |
| 08/01/2011 |
|
| 40 |
|
Southview Villages |
| Fargo, ND |
|
| 2,717 |
|
| 268 |
|
| 2,519 |
|
| 15 |
|
| 164 |
|
| 283 |
|
| 2,683 |
|
| 2,966 |
|
| 671 |
| 10/01/2007 |
| 20 | - | 40 |
Spring |
| Fargo, ND |
|
| 546 |
|
| 76 |
|
| 822 |
|
| 6 |
|
| 15 |
|
| 82 |
|
| 837 |
|
| 919 |
|
| 103 |
| 02/06/2013 |
| 20 | - | 40 |
Stanford Court |
| Grand Forks, ND |
|
| — |
|
| 291 |
|
| 3,866 |
|
| — |
|
| 83 |
|
| 291 |
|
| 3,949 |
|
| 4,240 |
|
| 483 |
| 02/06/2013 |
| 20 | - | 40 |
108
STERLING REAL ESTATE TRUST AND SUBSIDIARIES
SCHEDULE III – REAL ESTATE AND ACCUMULATED DEPRECIATION
DECEMBER 31, 20172022
(Dollar amounts in thousands)
Roughrider | | Grand Forks, ND | | | 373 | | | 100 | | | 448 | | | — | | | 117 | | | 100 | | | 565 | | | 665 | | | 93 | | 08/01/2016 | | 5 | - | 40 |
Saddlebrook | | West Fargo, ND | | | 1,306 | | | 148 | | | 1,262 | | | 203 | | | 105 | | | 351 | | | 1,367 | | | 1,718 | | | 462 | | 12/31/2008 | | | 40 | |
Sage Park | | New Brighton, MN | | | 9,307 | | | 2,520 | | | 13,985 | | | — | | | 1,061 | | | 2,520 | | | 15,046 | | | 17,566 | | | 3,031 | | 12/19/2014 | | 5 | - | 40 |
Sargent | | Fargo, ND | | | 940 | | | 164 | | | 1,529 | | | 4 | | | 17 | | | 168 | | | 1,546 | | | 1,714 | | | 233 | | 01/10/2017 | | | 40 | |
Schrock | | Fargo, ND | | | 425 | | | 71 | | | 626 | | | 3 | | | 66 | | | 74 | | | 692 | | | 766 | | | 152 | | 06/04/2013 | | | 40 | |
Sheridan Pointe | | Fargo, ND | | | 1,976 | | | 292 | | | 2,387 | | | 21 | | | 39 | | | 313 | | | 2,426 | | | 2,739 | | | 547 | | 10/01/2013 | | | 40 | |
Sierra Ridge | | Bismarck, ND | | | 6,575 | | | 754 | | | 8,795 | | | 151 | | | 863 | | | 905 | | | 9,658 | | | 10,563 | | | 2,987 | | 09/01/2006 | | | 40 | |
Somerset | | Fargo, ND | | | — | | | 300 | | | 3,400 | | | 43 | | | 57 | | | 343 | | | 3,457 | | | 3,800 | | | 1,235 | | 07/01/2008 | | | 40 | |
Southgate | | Fargo, ND | | | 4,744 | | | 803 | | | 5,267 | | | 20 | | | 64 | | | 823 | | | 5,331 | | | 6,154 | | | 2,015 | | 07/01/2007 | | 20 | - | 40 |
Southview III | | Grand Forks, ND | | | — | | | 99 | | | 522 | | | 1 | | | 116 | | | 100 | | | 638 | | | 738 | | | 170 | | 08/01/2011 | | | 40 | |
Southview Villages | | Fargo, ND | | | 2,376 | | | 268 | | | 2,483 | | | 16 | | | 645 | | | 284 | | | 3,128 | | | 3,412 | | | 1,012 | | 10/01/2007 | | 20 | - | 40 |
Spring | | Fargo, ND | | | 429 | | | 76 | | | 822 | | | 75 | | | 24 | | | 151 | | | 846 | | | 997 | | | 210 | | 02/06/2013 | | 20 | - | 40 |
Stanford Court | | Grand Forks, ND | | | — | | | 291 | | | 3,866 | | | — | | | 454 | | | 291 | | | 4,320 | | | 4,611 | | | 997 | | 02/06/2013 | | 20 | - | 40 |
Stonefield-Phase I | | Bismarck, ND | | | 7,500 | | | 2,804 | | | 11,060 | | | 227 | | | 802 | | | 3,031 | | | 11,862 | | | 14,893 | | | 2,273 | | 08/01/2014 | | 20 | - | 40 |
Stonefield-Phase II | | Bismarck, ND | | | 4,766 | | | 1,201 | | | 3,678 | | | 486 | | | 5,754 | | | 1,687 | | | 9,432 | | | 11,119 | | | 1,345 | | 10/23/2014 | | | 40 | |
Stonefield-Phase III | | Bismarck, ND | | | — | | | 1,079 | | | — | | | 238 | | | — | | | 1,317 | | | — | | | 1,317 | | | — | | 10/23/2014 | | | | |
Stonybrook | | Omaha, NE | | | 6,124 | | | 1,439 | | | 8,003 | | | — | | | 1,574 | | | 1,439 | | | 9,577 | | | 11,016 | | | 3,088 | | 01/20/2009 | | 20 | - | 40 |
Summerfield | | Fargo, ND | | | 469 | | | 129 | | | 599 | | | 6 | | | 82 | | | 135 | | | 681 | | | 816 | | | 120 | | 08/04/2015 | | | 40 | |
Summit Point | | Fargo, ND | | | 3,284 | | | 681 | | | 5,434 | | | 22 | | | 449 | | | 703 | | | 5,883 | | | 6,586 | | | 1,020 | | 10/01/2015 | | 20 | - | 40 |
Sunchase | | Fargo, ND | | | 1,011 | | | 181 | | | 1,563 | | | 14 | | | 86 | | | 195 | | | 1,649 | | | 1,844 | | | 234 | | 05/01/2017 | | | 40 | |
Sunset Ridge | | Bismarck, ND | | | 10,813 | | | 1,759 | | | 9,560 | | | 36 | | | 145 | | | 1,795 | | | 9,705 | | | 11,500 | | | 3,234 | | 06/06/2008 | | 9 | - | 40 |
Sunview | | Grand Forks, ND | | | — | | | 144 | | | 1,578 | | | 2 | | | 241 | | | 146 | | | 1,819 | | | 1,965 | | | 587 | | 12/31/2008 | | 20 | - | 40 |
Sunwood | | Fargo, ND | | | 2,491 | | | 358 | | | 3,252 | | | 38 | | | 541 | | | 396 | | | 3,793 | | | 4,189 | | | 1,304 | | 07/01/2007 | | 20 | - | 40 |
Thunder Creek | | Fargo, ND | | | 2,645 | | | 633 | | | 4,063 | | | 1 | | | 551 | | | 634 | | | 4,614 | | | 5,248 | | | 525 | | 03/1/2018 | | 25 | - | 40 |
Twin Oaks | | Hutchinson, MN | | | 5,203 | | | 816 | | | 3,245 | | | — | | | 149 | | | 816 | | | 3,394 | | | 4,210 | | | 692 | | 10/01/2014 | | | 40 | |
Twin Parks | | Fargo, ND | | | — | | | 119 | | | 2,072 | | | 43 | | | 227 | | | 162 | | | 2,299 | | | 2,461 | | | 757 | | 10/01/2008 | | 20 | - | 40 |
Valley Homes Duplexes | | Grand Forks, ND | | | 998 | | | 356 | | | 1,668 | | | 1 | | | 418 | | | 357 | | | 2,086 | | | 2,443 | | | 390 | | 01/22/2015 | | | 40 | |
Valley View | | Golden Valley, MN | | | 4,107 | | | 1,190 | | | 6,076 | | | — | | | 458 | | | 1,190 | | | 6,534 | | | 7,724 | | | 1,274 | | 12/19/2014 | | 5 | - | 40 |
Village Park | | Fargo, ND | | | 609 | | | 219 | | | 1,932 | | | 51 | | | 80 | | | 270 | | | 2,012 | | | 2,282 | | | 725 | | 04/30/2008 | | | 40 | |
Village West | | Fargo, ND | | | 2,154 | | | 357 | | | 2,274 | | | 61 | | | 126 | | | 418 | | | 2,400 | | | 2,818 | | | 836 | | 04/30/2008 | | | 40 | |
Washington | | Grand Forks, ND | | | 350 | | | 74 | | | 592 | | | — | | | 75 | | | 74 | | | 667 | | | 741 | | | 108 | | 05/04/2016 | | | 40 | |
Westcourt | | Fargo, ND | | | 2,294 | | | 287 | | | 2,914 | | | 28 | | | 195 | | | 315 | | | 3,109 | | | 3,424 | | | 702 | | 01/02/2014 | | 5 | - | 40 |
West Oak | | Fargo, ND | | | 608 | | | 85 | | | 692 | | | 47 | | | 36 | | | 132 | | | 728 | | | 860 | | | 116 | | 01/17/2017 | | | 40 | |
Westside | | Hawley, MN | | | 456 | | | 59 | | | 360 | | | — | | | 99 | | | 59 | | | 459 | | | 518 | | | 127 | | 02/01/2010 | | | 40 | |
Westwind | | Fargo, ND | | | 561 | | | 49 | | | 455 | | | 1 | | | 95 | | | 50 | | | 550 | | | 600 | | | 206 | | 04/30/2008 | | 20 | - | 40 |
Westwood | | Fargo, ND | | | 3,108 | | | 597 | | | 6,341 | | | 91 | | | 764 | | | 688 | | | 7,105 | | | 7,793 | | | 2,378 | | 06/05/2008 | | 20 | - | 40 |
Willow Park | | Fargo, ND | | | 3,228 | | | 288 | | | 5,286 | | | 39 | | | 799 | | | 327 | | | 6,085 | | | 6,412 | | | 1,943 | | 12/31/2008 | | | 40 | |
Wolf Creek | | Fargo, ND | | | 2,979 | | | 1,082 | | | 4,210 | | | — | | | 28 | | | 1,082 | | | 4,238 | | | 5,320 | | | 319 | | 01/12/2020 | | | 40 | |
Woodland Pines | | Omaha, NE | | | 6,047 | | | 842 | | | 10,596 | | | — | | | 1,372 | | | 842 | | | 11,968 | | | 12,810 | | | 1,199 | | 11/30/2018 | | | 40 | |
Total | | | | $ | 400,085 | | $ | 93,455 | | $ | 588,087 | | $ | 3,013 | | $ | 57,599 | | $ | 96,468 | | $ | 645,686 | | $ | 742,154 | | $ | 122,246 | | | | | | |
89
|
|
|
|
|
|
|
|
|
|
|
|
|
|
|
|
|
|
|
|
|
|
|
|
|
|
|
|
|
|
|
|
|
|
|
|
|
|
|
|
|
|
|
|
|
|
|
|
|
|
|
|
|
|
|
|
|
|
|
|
|
|
|
|
|
|
|
|
| Life on | ||
|
|
|
|
|
|
|
|
|
|
|
|
|
|
|
|
|
|
|
|
|
|
|
|
|
|
|
|
|
|
|
|
| which | ||
|
|
|
|
|
|
|
|
|
|
|
|
| Costs |
|
|
|
|
|
|
|
|
|
|
|
|
|
|
| depreciation | ||||||
|
|
|
|
|
|
|
|
|
|
|
|
| capitalized |
|
|
|
|
|
|
|
|
|
|
|
|
| Date of |
| on latest | ||||||
|
|
|
|
|
|
| Initial cost |
| subsequent |
| Gross Amount at which |
|
|
|
| Construction |
| income | |||||||||||||||||
Residential |
|
|
|
|
|
| to company |
| to acquisition (a) |
| carried at close of period |
| Accumulated |
| or |
| statement is | ||||||||||||||||||
Property |
| Physical Location |
| Encumbrances |
| Land |
| Buildings |
| Land |
| Buildings |
| Land |
| Buildings |
| Total |
| Depreciation |
| Acquisition |
| computed | |||||||||||
Stonefield-Clubhouse |
| Bismarck, ND |
|
| — |
|
| 34 |
|
| 1,147 |
|
| — |
|
| 50 |
|
| 34 |
|
| 1,197 |
|
| 1,231 |
|
| 44 |
| 07/31/2016 |
|
| 40 |
|
Stonefield-Phase I |
| Bismarck, ND |
|
| 8,775 |
|
| 2,804 |
|
| 13,138 |
|
| 227 |
|
| 224 |
|
| 3,031 |
|
| 13,362 |
|
| 16,393 |
|
| 1,002 |
| 08/01/2014 |
| 20 | - | 40 |
Stonefield-Phase II |
| Bismarck, ND |
|
| — |
|
| 1,167 |
|
| 2,566 |
|
| 486 |
|
| 5,125 |
|
| 1,653 |
|
| 7,691 |
|
| 9,344 |
|
| 166 |
| 10/23/2014 |
|
| 40 |
|
Stonefield-Phase III |
| Bismarck, ND |
|
| — |
|
| 1,079 |
|
| — |
|
| 238 |
|
| — |
|
| 1,317 |
|
| — |
|
| 1,317 |
|
| — |
| 10/23/2014 |
|
| n/a |
|
Stonybrook |
| Omaha, NE |
|
| 7,280 |
|
| 1,439 |
|
| 8,003 |
|
| — |
|
| 1,274 |
|
| 1,439 |
|
| 9,277 |
|
| 10,716 |
|
| 1,863 |
| 01/20/2009 |
| 20 | - | 40 |
Summerfield |
| Fargo, ND |
|
| 108 |
|
| 129 |
|
| 599 |
|
| 1 |
|
| 50 |
|
| 130 |
|
| 649 |
|
| 779 |
|
| 38 |
| 08/04/2015 |
|
| 40 |
|
Summit Point |
| Fargo, ND |
|
| 3,822 |
|
| 681 |
|
| 5,510 |
|
| 21 |
|
| 63 |
|
| 702 |
|
| 5,573 |
|
| 6,275 |
|
| 314 |
| 10/01/2015 |
| 20 | - | 40 |
Sunchase |
| Fargo, ND |
|
| 1,155 |
|
| 181 |
|
| 1,563 |
|
| 18 |
|
| 5 |
|
| 199 |
|
| 1,568 |
|
| 1,767 |
|
| 26 |
| 05/01/2017 |
|
| 40 |
|
Sunset Ridge |
| Bismarck, ND |
|
| 8,457 |
|
| 1,759 |
|
| 11,012 |
|
| 36 |
|
| 38 |
|
| 1,795 |
|
| 11,050 |
|
| 12,845 |
|
| 2,373 |
| 06/06/2008 |
| 9 | - | 40 |
Sunview |
| Grand Forks, ND |
|
| 1,087 |
|
| 144 |
|
| 1,614 |
|
| 1 |
|
| 62 |
|
| 145 |
|
| 1,676 |
|
| 1,821 |
|
| 373 |
| 12/31/2008 |
| 20 | - | 40 |
Sunwood |
| Fargo, ND |
|
| 2,818 |
|
| 358 |
|
| 3,520 |
|
| 7 |
|
| 77 |
|
| 365 |
|
| 3,597 |
|
| 3,962 |
|
| 927 |
| 07/01/2007 |
| 20 | - | 40 |
Terrace on the Green |
| Moorhead, MN |
|
| 2,025 |
|
| 697 |
|
| 2,588 |
|
| — |
|
| 129 |
|
| 697 |
|
| 2,717 |
|
| 3,414 |
|
| 348 |
| 09/30/2012 |
|
| 40 |
|
Twin Oaks |
| Hutchinson, MN |
|
| 882 |
|
| 816 |
|
| 3,245 |
|
| — |
|
| 93 |
|
| 816 |
|
| 3,338 |
|
| 4,154 |
|
| 269 |
| 10/01/2014 |
|
| 40 |
|
Twin Parks |
| Fargo, ND |
|
| 2,178 |
|
| 119 |
|
| 2,072 |
|
| 50 |
|
| 15 |
|
| 169 |
|
| 2,087 |
|
| 2,256 |
|
| 478 |
| 10/01/2008 |
| 20 | - | 40 |
Valley Homes Duplexes |
| Grand Forks, ND |
|
| 1,040 |
|
| 356 |
|
| 1,668 |
|
| — |
|
| 171 |
|
| 356 |
|
| 1,839 |
|
| 2,195 |
|
| 130 |
| 01/22/2015 |
|
| 40 |
|
Valley View |
| Golden Valley, MN |
|
| 4,608 |
|
| 1,190 |
|
| 6,118 |
|
| — |
|
| 158 |
|
| 1,190 |
|
| 6,276 |
|
| 7,466 |
|
| 482 |
| 12/19/2014 |
| 5 | - | 40 |
Village Park |
| Fargo, ND |
|
| 770 |
|
| 219 |
|
| 1,932 |
|
| 59 |
|
| 34 |
|
| 278 |
|
| 1,966 |
|
| 2,244 |
|
| 473 |
| 04/30/2008 |
|
| 40 |
|
Village West |
| Fargo, ND |
|
| 2,519 |
|
| 357 |
|
| 2,274 |
|
| 74 |
|
| (0) |
|
| 431 |
|
| 2,274 |
|
| 2,705 |
|
| 537 |
| 04/30/2008 |
|
| 40 |
|
Washington |
| Grand Forks, ND |
|
| 443 |
|
| 74 |
|
| 592 |
|
| — |
|
| 35 |
|
| 74 |
|
| 627 |
|
| 701 |
|
| 26 |
| 05/04/2016 |
|
| 40 |
|
Westcourt |
| Fargo, ND |
|
| 584 |
|
| 287 |
|
| 3,028 |
|
| 34 |
|
| 41 |
|
| 321 |
|
| 3,069 |
|
| 3,390 |
|
| 323 |
| 01/02/2014 |
| 5 | - | 40 |
West Oak |
| Fargo, ND |
|
| 2,364 |
|
| 85 |
|
| 692 |
|
| — |
|
| 19 |
|
| 85 |
|
| 711 |
|
| 796 |
|
| 19 |
| 01/17/2017 |
|
| 40 |
|
Westside |
| Hawley, MN |
|
| 549 |
|
| 59 |
|
| 360 |
|
| — |
|
| 37 |
|
| 59 |
|
| 397 |
|
| 456 |
|
| 74 |
| 02/01/2010 |
|
| 40 |
|
Westwind |
| Fargo, ND |
|
| — |
|
| 49 |
|
| 455 |
|
| 1 |
|
| 83 |
|
| 50 |
|
| 538 |
|
| 588 |
|
| 131 |
| 04/30/2008 |
| 20 | - | 40 |
Westwood |
| Fargo, ND |
|
| 4,223 |
|
| 597 |
|
| 6,455 |
|
| 13 |
|
| 30 |
|
| 610 |
|
| 6,485 |
|
| 7,095 |
|
| 1,546 |
| 06/05/2008 |
| 20 | - | 40 |
Willow Park |
| Fargo, ND |
|
| 3,946 |
|
| 288 |
|
| 5,286 |
|
| 7 |
|
| 458 |
|
| 295 |
|
| 5,744 |
|
| 6,039 |
|
| 1,193 |
| 12/31/2008 |
|
| 40 |
|
Total |
|
|
| $ | 315,962 |
| $ | 70,716 |
| $ | 436,202 |
| $ | 2,392 |
| $ | 21,241 |
| $ | 73,108 |
| $ | 457,443 |
| $ | 530,551 |
| $ | 59,900 |
|
|
|
|
|
|
109
STERLING REAL ESTATE TRUST AND SUBSIDIARIES
SCHEDULE III – REAL ESTATE AND ACCUMULATED DEPRECIATION
DECEMBER 31, 20172022
(Dollar amounts in thousands)
| | | | | | | | | | | | | | | | | | | | | | | | | | | | | | | | | | | |
| | | | | | | | | | | | | | | | | | | | | | | | | | | | | | | | | Life on | ||
| | | | | | | | | | | | | | | | | | | | | | | | | | | | | | | | | which | ||
| | | | | | | | | | | | | Costs | | | | | | | | | | | | | | | | depreciation | ||||||
| | | | | | | | | | | | | capitalized | | | | | | | | | | | | | | Date of | | on latest | ||||||
| | | | | | | Initial cost | | subsequent | | Gross Amount at which | | | | | Construction | | income | |||||||||||||||||
Office | | | | | | | to company | | to acquisition (a) | | carried at close of period | | | | | or | | statement is | |||||||||||||||||
Property |
| Physical Location |
| Encumbrances |
| Land |
| Buildings |
| Land |
| Buildings |
| Land |
| Buildings |
| Total |
| Depreciation |
| Acquisition |
| computed | |||||||||||
32nd Avenue | | Fargo, ND | | $ | 4,763 | | $ | 635 | | $ | 3,298 | | $ | 87 | | $ | 1,226 | | $ | 722 | | $ | 4,524 | | $ | 5,246 | | $ | 1,651 | | 03/16/2004 | | 3 | - | 40 |
Bell Plaza | | Bloomington, MN | | | 30,662 | | | 6,912 | | | 34,672 | | | — | | | 4,635 | | | 6,912 | | | 39,307 | | | 46,219 | | | 11,707 | | 08/13/2015 | | 3 | - | 40 |
Trustmark | | Fargo, ND | | | 6,915 | | | 2,089 | | | 4,718 | | | 14 | | | 6,298 | | | 2,103 | | | 11,016 | | | 13,119 | | | 712 | | 08/28/2020 | | | 40 | |
First International Bank & Trust | | Moorhead, MN | | | — | | | 210 | | | 712 | | | 5 | | | 88 | | | 215 | | | 800 | | | 1,015 | | | 295 | | 05/13/2011 | | 10 | - | 40 |
Four Points | | Fargo, ND | | | — | | | 70 | | | 1,238 | | | — | | | 175 | | | 70 | | | 1,413 | | | 1,483 | | | 520 | | 10/18/2007 | | 5 | - | 40 |
Gate City | | Grand Forks, ND | | | — | | | 382 | | | 893 | | | 1 | | | 810 | | | 383 | | | 1,703 | | | 2,086 | | | 405 | | 03/31/2008 | | | 40 | |
Goldmark Office Park | | Fargo, ND | | | 12,362 | | | 1,160 | | | 11,788 | | | 65 | | | 8,832 | | | 1,225 | | | 20,620 | | | 21,845 | | | 5,289 | | 07/01/2007 | | 1 | - | 40 |
Great American Bldg | | Fargo, ND | | | 1,064 | | | 511 | | | 1,290 | | | 22 | | | 447 | | | 533 | | | 1,737 | | | 2,270 | | | 760 | | 02/01/2005 | | 28 | - | 40 |
Midtown Plaza | | Minot, ND | | | 1,103 | | | 30 | | | 1,213 | | | — | | | 97 | | | 30 | | | 1,310 | | | 1,340 | | | 565 | | 01/01/2004 | | 5 | - | 40 |
Parkway office building (FKA Echelon) | | Fargo, ND | | | 1,619 | | | 278 | | | 1,491 | | | 42 | | | 82 | | | 320 | | | 1,573 | | | 1,893 | | | 611 | | 05/15/2007 | | 9 | - | 40 |
Redpath | | White Bear Lake, MN | | | 2,849 | | | 1,195 | | | 1,787 | | | — | | | — | | | 1,195 | | | 1,787 | | | 2,982 | | | 309 | | 02/01/2016 | | | 40 | |
Wells Fargo Center | | Duluth, MN | | | — | | | 600 | | | 7,195 | | | (115) | | | 2,740 | | | 485 | | | 9,935 | | | 10,420 | | | 3,537 | | 07/11/2007 | | 4 | - | 40 |
Total | | | | $ | 61,337 | | $ | 14,072 | | $ | 70,295 | | $ | 121 | | $ | 25,430 | | $ | 14,193 | | $ | 95,725 | | $ | 109,918 | | $ | 26,361 | | | | | | |
90
|
|
|
|
|
|
|
|
|
|
|
|
|
|
|
|
|
|
|
|
|
|
|
|
|
|
|
|
|
|
|
|
|
|
|
|
|
|
|
|
|
|
|
|
|
|
|
|
|
|
|
|
|
|
|
|
|
|
|
|
|
|
|
|
|
|
|
|
| Life on | ||
|
|
|
|
|
|
|
|
|
|
|
|
|
|
|
|
|
|
|
|
|
|
|
|
|
|
|
|
|
|
|
|
| which | ||
|
|
|
|
|
|
|
|
|
|
|
|
| Costs |
|
|
|
|
|
|
|
|
|
|
|
|
|
|
| depreciation | ||||||
|
|
|
|
|
|
|
|
|
|
|
|
| capitalized |
|
|
|
|
|
|
|
|
|
|
|
|
| Date of |
| on latest | ||||||
|
|
|
|
|
|
| Initial cost |
| subsequent |
| Gross Amount at which |
|
|
|
| Construction |
| income | |||||||||||||||||
Office |
|
|
|
|
|
| to company |
| to acquisition (a) |
| carried at close of period |
| Accumulated |
| or |
| statement is | ||||||||||||||||||
Property |
| Physical Location |
| Encumbrances |
| Land |
| Buildings |
| Land |
| Buildings |
| Land |
| Buildings |
| Total |
| Depreciation |
| Acquisition |
| computed | |||||||||||
32nd Avenue |
| Fargo, ND |
| $ | — |
| $ | 635 |
| $ | 3,300 |
| $ | 9 |
| $ | 82 |
| $ | 644 |
| $ | 3,382 |
| $ | 4,026 |
| $ | 1,149 |
| 03/16/2004 |
| 3 | - | 40 |
Aetna |
| Bismarck, ND |
|
| — |
|
| 1,291 |
|
| 7,372 |
|
| 48 |
|
| 1,457 |
|
| 1,339 |
|
| 8,829 |
|
| 10,168 |
|
| 2,200 |
| 12/06/2006 |
| 20 | - | 40 |
Bell Plaza |
| Bloomington, MN |
|
| 34,229 |
|
| 6,912 |
|
| 36,520 |
|
| — |
|
| 662 |
|
| 6,912 |
|
| 37,182 |
|
| 44,094 |
|
| 5,119 |
| 08/13/2015 |
| 1 | - | 40 |
First International Bank & Trust |
| Moorhead, MN |
|
| — |
|
| 210 |
|
| 712 |
|
| 3 |
|
| 88 |
|
| 213 |
|
| 800 |
|
| 1,013 |
|
| 161 |
| 05/13/2011 |
| 10 | - | 40 |
Four Points |
| Fargo, ND |
|
| — |
|
| 70 |
|
| 1,238 |
|
| 0 |
|
| 23 |
|
| 70 |
|
| 1,261 |
|
| 1,331 |
|
| 317 |
| 10/18/2007 |
|
| 40 |
|
Gate City |
| Grand Forks, ND |
|
| 898 |
|
| 382 |
|
| 893 |
|
| 1 |
|
| 154 |
|
| 383 |
|
| 1,047 |
|
| 1,430 |
|
| 227 |
| 03/31/2008 |
|
| 40 |
|
Goldmark Office Park |
| Fargo, ND |
|
| 2,104 |
|
| 1,160 |
|
| 14,796 |
|
| 62 |
|
| 1,181 |
|
| 1,222 |
|
| 15,977 |
|
| 17,199 |
|
| 4,233 |
| 07/01/2007 |
| 1 | - | 40 |
Great American Bldg |
| Fargo, ND |
|
| 913 |
|
| 511 |
|
| 1,290 |
|
| 19 |
|
| 362 |
|
| 530 |
|
| 1,652 |
|
| 2,182 |
|
| 476 |
| 02/01/2005 |
| 28 | - | 40 |
Midtown Plaza |
| Minot, ND |
|
| 1,237 |
|
| 30 |
|
| 1,213 |
|
| — |
|
| — |
|
| 30 |
|
| 1,213 |
|
| 1,243 |
|
| 384 |
| 01/01/2004 |
|
| 40 |
|
Parkway office building (FKA Echelon) |
| Fargo, ND |
|
| 962 |
|
| 278 |
|
| 1,491 |
|
| 39 |
|
| 29 |
|
| 317 |
|
| 1,520 |
|
| 1,837 |
|
| 403 |
| 05/15/2007 |
| 20 | - | 40 |
Redpath |
| White Bear Lake, MN |
|
| 2,687 |
|
| 1,195 |
|
| 1,787 |
|
| — |
|
| — |
|
| 1,195 |
|
| 1,787 |
|
| 2,982 |
|
| 86 |
| 02/01/2016 |
|
| 40 |
|
Regis |
| Edina, MN |
|
| — |
|
| 2,991 |
|
| 7,633 |
|
| — |
|
| — |
|
| 2,991 |
|
| 7,633 |
|
| 10,624 |
|
| 1,724 |
| 01/01/2009 |
|
| 40 |
|
SSA |
| St Cloud, MN |
|
| — |
|
| 100 |
|
| 2,793 |
|
| — |
|
| 18 |
|
| 100 |
|
| 2,811 |
|
| 2,911 |
|
| 756 |
| 03/20/2007 |
| 20 | - | 40 |
Wells Fargo Center |
| Duluth, MN |
|
| — |
|
| 600 |
|
| 7,270 |
|
| (115) |
|
| 1,999 |
|
| 485 |
|
| 9,269 |
|
| 9,754 |
|
| 2,102 |
| 07/11/2007 |
| 4 | - | 40 |
Total |
|
|
| $ | 43,030 |
| $ | 16,365 |
| $ | 88,308 |
| $ | 66 |
| $ | 6,055 |
| $ | 16,431 |
| $ | 94,363 |
| $ | 110,794 |
| $ | 19,337 |
|
|
|
|
|
|
110
STERLING REAL ESTATE TRUST AND SUBSIDIARIES
SCHEDULE III – REAL ESTATE AND ACCUMULATED DEPRECIATION
DECEMBER 31, 20172022
(Dollar amounts in thousands)
| | | | | | | | | | | | | | | | | | | | | | | | | | | | | | | | | | | |
| | | | | | | | | | | | | | | | | | | | | | | | | | | | | | | | | Life on | ||
| | | | | | | | | | | | | | | | | | | | | | | | | | | | | | | | | which | ||
| | | | | | | | | | | | | Costs | | | | | | | | | | | | | | | | depreciation | ||||||
| | | | | | | | | | | | | capitalized | | | | | | | | | | | | | | Date of | | on latest | ||||||
| | | | | | | Initial cost | | subsequent | | Gross Amount at which | | | | | Construction | | income | |||||||||||||||||
Retail | | | | | | | to company | | to acquisition (a) | | carried at close of period | | | | | or | | statement is | |||||||||||||||||
Property |
| Physical Location |
| Encumbrances |
| Land |
| Buildings |
| Land |
| Buildings |
| Land |
| Buildings |
| Total |
| Depreciation |
| Acquisition |
| computed | |||||||||||
Applebees | | Coon Rapids, MN | | | — | | | 750 | | | 875 | | | 8 | | | — | | | 758 | | | 875 | | | 1,633 | | | 281 | | 03/09/2010 | | | 40 | |
Dairy Queen | | Apple Valley, MN | | | 1,898 | | | 845 | | | 828 | | | — | | | — | | | 845 | | | 828 | | | 1,673 | | | 90 | | 09/17/2018 | | | 40 | |
Dairy Queen | | Dickinson, ND | | | — | | | 329 | | | 658 | | | 1 | | | — | | | 330 | | | 658 | | | 988 | | | 181 | | 01/19/2012 | | | 40 | |
Dairy Queen | | Moorhead, MN | | | — | | | 243 | | | 787 | | | 2 | | | — | | | 245 | | | 787 | | | 1,032 | | | 230 | | 05/13/2011 | | | 20 | |
Family Dollar | | Mandan, ND | | | — | | | 166 | | | 649 | | | — | | | 54 | | | 166 | | | 703 | | | 869 | | | 198 | | 12/14/2010 | | | 40 | |
OReilly | | Mandan, ND | | | — | | | 115 | | | 449 | | | — | | | 27 | | | 115 | | | 476 | | | 591 | | | 138 | | 12/14/2010 | | | 40 | |
Walgreens | | Alexandria, LA | | | 548 | | | 1,090 | | | 2,973 | | | — | | | — | | | 1,090 | | | 2,973 | | | 4,063 | | | 969 | | 12/18/2009 | | 28 | - | 40 |
Walgreens | | Batesville, AR | | | 4,623 | | | 472 | | | 6,405 | | | — | | | — | | | 472 | | | 6,405 | | | 6,877 | | | 2,162 | | 07/09/2009 | | | 40 | |
Walgreens | | Denver, CO | | | 2,984 | | | 2,349 | | | 2,358 | | | — | | | — | | | 2,349 | | | 2,358 | | | 4,707 | | | 683 | | 06/14/2011 | | | 40 | |
Walgreens | | Fayetteville, AR | | | 3,474 | | | 636 | | | 4,732 | | | — | | | — | | | 636 | | | 4,732 | | | 5,368 | | | 1,597 | | 07/09/2009 | | | 40 | |
Walgreens | | Laurel, MS | | | — | | | 1,280 | | | 2,984 | | | — | | | — | | | 1,280 | | | 2,984 | | | 4,264 | | | 933 | | 07/30/2010 | | | 40 | |
Total | | | | $ | 13,527 | | $ | 8,275 | | $ | 23,698 | | $ | 11 | | $ | 81 | | $ | 8,286 | | $ | 23,779 | | $ | 32,065 | | $ | 7,462 | | | | | | |
Grand Totals | | | | $ | 508,305 | | $ | 125,157 | | $ | 716,714 | | $ | 4,525 | | $ | 85,537 | | $ | 129,682 | | $ | 802,251 | | $ | 931,933 | | $ | 168,635 | | | | | | |
91
|
|
|
|
|
|
|
|
|
|
|
|
|
|
|
|
|
|
|
|
|
|
|
|
|
|
|
|
|
|
|
|
|
|
|
|
|
|
|
|
|
|
|
|
|
|
|
|
|
|
|
|
|
|
|
|
|
|
|
|
|
|
|
|
|
|
|
|
| Life on | ||
|
|
|
|
|
|
|
|
|
|
|
|
|
|
|
|
|
|
|
|
|
|
|
|
|
|
|
|
|
|
|
|
| which | ||
|
|
|
|
|
|
|
|
|
|
|
|
| Costs |
|
|
|
|
|
|
|
|
|
|
|
|
|
|
| depreciation | ||||||
|
|
|
|
|
|
|
|
|
|
|
|
| capitalized |
|
|
|
|
|
|
|
|
|
|
|
|
| Date of |
| on latest | ||||||
|
|
|
|
|
|
| Initial cost |
| subsequent |
| Gross Amount at which |
|
|
|
| Construction |
| income | |||||||||||||||||
Retail |
|
|
|
|
|
| to company |
| to acquisition (a) |
| carried at close of period |
| Accumulated |
| or |
| statement is | ||||||||||||||||||
Property |
| Physical Location |
| Encumbrances |
| Land |
| Buildings |
| Land |
| Buildings |
| Land |
| Buildings |
| Total |
| Depreciation |
| Acquisition |
| computed | |||||||||||
Applebees |
| Apple Valley, MN |
| $ | — |
| $ | 560 |
| $ | 1,235 |
| $ | — |
| $ | — |
| $ | 560 |
| $ | 1,235 |
| $ | 1,795 |
| $ | 216 |
| 01/27/2011 |
|
| 40 |
|
Applebees |
| Bloomington, MN |
|
| — |
|
| 1,000 |
|
| 474 |
|
| 11 |
|
| — |
|
| 1,011 |
|
| 474 |
|
| 1,485 |
|
| 93 |
| 03/22/2010 |
|
| 40 |
|
Applebees |
| Coon Rapids, MN |
|
| — |
|
| 750 |
|
| 875 |
|
| — |
|
| — |
|
| 750 |
|
| 875 |
|
| 1,625 |
|
| 171 |
| 03/09/2010 |
|
| 40 |
|
Applebees |
| Savage, MN |
|
| — |
|
| 690 |
|
| 424 |
|
| — |
|
| — |
|
| 690 |
|
| 424 |
|
| 1,114 |
|
| 83 |
| 01/01/2010 |
|
| 40 |
|
Becker Furniture |
| Waite Park, MN |
|
| — |
|
| 150 |
|
| 2,065 |
|
| — |
|
| (637) |
|
| 150 |
|
| 1,428 |
|
| 1,578 |
|
| 594 |
| 07/12/2006 |
|
| 40 |
|
Buffalo Wild Wings |
| Austin, TX |
|
| — |
|
| 575 |
|
| 1,664 |
|
| — |
|
| — |
|
| 575 |
|
| 1,664 |
|
| 2,239 |
|
| 312 |
| 07/30/2010 |
|
| 40 |
|
Dairy Queen |
| Dickinson, ND |
|
| — |
|
| 329 |
|
| 658 |
|
| — |
|
| — |
|
| 329 |
|
| 658 |
|
| 987 |
|
| 99 |
| 01/19/2012 |
|
| 40 |
|
Dairy Queen |
| Moorhead, MN |
|
| — |
|
| 243 |
|
| 787 |
|
| 1 |
|
| — |
|
| 244 |
|
| 787 |
|
| 1,031 |
|
| 131 |
| 05/13/2011 |
|
| 20 |
|
Family Dollar |
| Mandan, ND |
|
| — |
|
| 167 |
|
| 649 |
|
| — |
|
| — |
|
| 167 |
|
| 649 |
|
| 816 |
|
| 115 |
| 12/14/2010 |
|
| 40 |
|
OReilly |
| Mandan, ND |
|
| — |
|
| 115 |
|
| 449 |
|
| — |
|
| — |
|
| 115 |
|
| 449 |
|
| 564 |
|
| 80 |
| 12/14/2010 |
|
| 40 |
|
Walgreens |
| Alexandria, LA |
|
| 1,505 |
|
| 1,090 |
|
| 2,973 |
|
| — |
|
| — |
|
| 1,090 |
|
| 2,973 |
|
| 4,063 |
|
| 596 |
| 12/18/2009 |
| 28 | - | 40 |
Walgreens |
| Batesville, AR |
|
| 5,780 |
|
| 473 |
|
| 6,405 |
|
| — |
|
| — |
|
| 473 |
|
| 6,405 |
|
| 6,878 |
|
| 1,362 |
| 07/09/2009 |
|
| 40 |
|
Walgreens |
| Denver, CO |
|
| 3,853 |
|
| 2,349 |
|
| 2,358 |
|
| — |
|
| — |
|
| 2,349 |
|
| 2,358 |
|
| 4,707 |
|
| 388 |
| 06/14/2011 |
|
| 40 |
|
Walgreens |
| Fayetteville, AR |
|
| 4,411 |
|
| 636 |
|
| 4,732 |
|
| — |
|
| — |
|
| 636 |
|
| 4,732 |
|
| 5,368 |
|
| 1,006 |
| 07/09/2009 |
|
| 40 |
|
Walgreens |
| Laurel, MS |
|
| 1,486 |
|
| 1,280 |
|
| 2,984 |
|
| — |
|
| — |
|
| 1,280 |
|
| 2,984 |
|
| 4,264 |
|
| 560 |
| 07/30/2010 |
|
| 40 |
|
Total |
|
|
| $ | 17,035 |
| $ | 10,407 |
| $ | 28,732 |
| $ | 12 |
| $ | (637) |
| $ | 10,419 |
| $ | 28,095 |
| $ | 38,514 |
| $ | 5,806 |
|
|
|
|
|
|
Grand Totals |
|
|
| $ | 397,567 |
| $ | 107,198 |
| $ | 591,444 |
| $ | 3,752 |
| $ | 29,086 |
| $ | 110,950 |
| $ | 620,530 |
| $ | 731,480 |
| $ | 93,057 |
|
|
|
|
|
|
|
|
|
|
|
|
|
|
|
|
|
|
|
|
|
|
|
|
|
|
|
|
|
|
|
|
|
|
|
|
|
|
|
|
|
|
Investments in Unconsolidated Affiliates: |
|
|
|
|
|
|
|
|
|
|
|
|
|
|
|
|
|
|
|
|
|
|
|
|
|
|
|
|
|
| Life on | ||||
|
|
|
|
|
|
|
|
|
|
|
|
|
|
|
|
|
|
|
|
|
|
|
|
|
|
|
|
|
|
|
|
| which | ||
|
|
|
|
|
|
|
|
|
|
| Costs |
|
|
|
|
|
|
|
|
|
|
|
|
|
|
| depreciation | ||||||||
|
|
|
|
|
|
|
|
|
|
|
|
| capitalized |
|
|
|
|
|
|
|
|
|
|
|
|
| Date of |
| on latest | ||||||
|
|
|
|
|
|
| Initial cost |
| subsequent |
| Gross Amount at which |
|
|
|
| Construction |
| income | |||||||||||||||||
|
|
|
|
|
|
| to company |
| to acquisition (a) |
| carried at close of period |
| Accumulated |
| or |
| statement is | ||||||||||||||||||
Property |
| Physical Location |
| Encumbrances |
| Land |
| Buildings |
| Land |
| Buildings |
| Land |
| Buildings |
| Total |
| Depreciation |
| Acquisition |
| computed | |||||||||||
Banner |
| Fargo, ND |
| $ | 6,778 |
| $ | 750 |
| $ | 8,016 |
| $ | 184 |
| $ | 311 |
| $ | 934 |
| $ | 8,327 |
| $ | 9,261 |
| $ | 2,167 |
| 03/15/2007 |
|
| 40 |
|
GF Marketplace |
| Grand Forks, ND |
|
| 10,692 |
|
| 4,259 |
|
| 15,801 |
|
| 208 |
|
| 1,031 |
|
| 4,467 |
|
| 16,832 |
|
| 21,299 |
|
| 5,493 |
| 07/01/2003 |
| 8 | - | 40 |
111
STERLING REAL ESTATE TRUST AND SUBSIDIARIES
SCHEDULE III – REAL ESTATE AND ACCUMULATED DEPRECIATION
DECEMBER 31, 20172022
(Dollar amounts in thousands)
Notes:
Notes:
(a) | The costs capitalized subsequent to acquisition is net of dispositions. |
(b) | The changes in total real estate investments for the years ended December 31, |
|
|
|
|
|
|
|
|
|
| |||||||||
|
| 2017 |
| 2016 |
| 2015 | ||||||||||||
| | | | | | | ||||||||||||
| | 2022 | | 2021 | | 2020 | ||||||||||||
Balance at January 1, |
| $ | 715,300 |
| $ | 669,484 |
| $ | 591,136 | | $ | 896,702 | | $ | 845,288 | | $ | 802,028 |
Purchase of real estate investments |
|
| 47,279 |
|
| 48,305 |
|
| 82,111 | | 103,252 | | 63,299 | | 57,799 | |||
Sale and disposal of real estate investment |
|
| (1,267) |
|
| (1,766) |
|
| (1,325) | | (26,960) | | (8,184) | | (15,467) | |||
Property held for sale |
|
| — |
|
| (3,234) |
|
| (2,058) | | — | | 1,578 | | (1,578) | |||
Provision for asset impairment |
|
| — |
|
| — |
|
| (412) | | (561) | | — | | — | |||
Construction in progress not yet placed in service |
|
| (1,609) |
|
| 2,511 |
|
| — | | | (1,285) | | | (5,279) | | | 2,506 |
Reallocation to intangible assets |
|
| — |
|
| — |
|
| 32 | |||||||||
Balance at December 31, |
| $ | 759,703 |
| $ | 715,300 |
| $ | 669,484 | | $ | 971,148 | | $ | 896,702 | | $ | 845,288 |
(c) | The changes in accumulated depreciation for the years ended December 31, |
|
|
|
|
|
|
|
|
|
| |||||||||
|
| 2017 |
| 2016 |
| 2015 | ||||||||||||
| | | | | | | ||||||||||||
| | 2022 | | 2021 | | 2020 | ||||||||||||
Balance at January 1, |
| $ | 92,325 |
| $ | 74,975 |
| $ | 58,873 | | $ | 179,155 | | $ | 160,575 | | $ | 146,316 |
Depreciation expense |
|
| 19,057 |
|
| 18,507 |
|
| 16,466 | | 22,161 | | 20,917 | | 19,770 | |||
Property held for sale |
|
| — |
|
| (867) |
|
| (342) | | — | | 749 | | (749) | |||
Sale and disposal of real estate investment |
|
| (356) |
|
| (290) |
|
| (22) | | | (6,467) | | | (3,086) | | | (4,762) |
Balance at December 31, |
| $ | 111,026 |
| $ | 92,325 |
| $ | 74,975 | | $ | 194,849 | | $ | 179,155 | | $ | 160,575 |
(d) | The aggregate cost of our real estate for federal income tax purposes is |
112
92
Exhibit Index
| | | | | | | | | | | | |
| | | | | | | | | | | | |
| | | | Filed | | Incorporated by reference | ||||||
Exhibit | | | | here | | | | Period | | | | Filing |
number |
| Exhibit Description |
| with |
| Form |
| ending |
| Exhibit |
| Date |
3.1 | | Articles of Organization of Sterling Real Estate Trust filed December 3, 2002 | | | | 10-12G | | | | 3.1 | | 03/10/11 |
3.2 | | Amendment to Articles of Organization of Sterling Real Estate Trust dated August 1, 2014 | | | | 8-K | | | | 5.02 | | 06/24/14 |
3.3 | | | | | 8-K | | | | 3.1 | | 06/03/20 | |
4.1 | | Sterling Third Amended and Restated Declaration of Trust dated June 23, 2016 | | | | 8-K | | | | 4.1 | | 06/29/16 |
4.2 | | Amended and Restated Share Redemption Plan effective January 1, 2021 | | | | 8-K | | | | 99.1 | | 09/29/21 |
4.3 | | Amended and Restated Unit Repurchase Plan effective January 1, 2021 | | | | 8-K | | | | 99.2 | | 09/29/21 |
4.4 | | | | 10-K | | 12/31/2019 | | 4.11 | | 03/13/20 | ||
10.1 | | | | | 8-K | | | | 5.04 | | 06/24/14 | |
10.2 | | Amended and Restated Dividend Reinvestment Plan effective June 25, 2020 | | | | 8-K | | | | 10.3 | | 06/30/20 |
10.3 | | | | | 8-K | | | | 5.03 | | 06/24/14 | |
10.4 | | Form of Secured Promissory Note (15-Year Note) dated as of December 19, 2014 | | | | 8-K | | | | 10.3 | | 12/23/14 |
10.5 | | Form of Secured Promissory Note (10-Year Note) dated as of December 19, 2014 | | | | 8-K | | | | 10.4 | | 12/23/14 |
10.6 | | Form of Mortgage, Security Agreement and Fixture Filing dated as of December 19, 2014 | | | | 8-K | | | | 10.5 | | 12/23/14 |
10.7 | | | | | 8-K | | | | 10.6 | | 12/23/14 | |
10.8 | | | | | 8-K | | | | 10.7 | | 12/23/14 | |
10.9 | | Form of Commercial Security Agreement dated as of December 19, 2014 | | | | 8-K | | | | 10.8 | | 12/23/14 |
10.10 | | | | | 8-K | | | | 10.1 | | 06/23/15 | |
10.11 | | | | | 8-K | | | | 10.2 | | 08/18/15 | |
10.12 | | Form of Mortgage, Security Agreement and Fixture Filing dated as of August 13, 2015 | | | | 8-K | | | | 10.3 | | 08/18/15 |
10.13 | | Amendment No. 1 to Amended and Restated Independent Trustee Stock Plan | | | | 8-K | | | | 99.3 | | 04/04/18 |
10.14 | | | | | 8-K | | | | 10.1 | | 03/31/21 | |
10.15 | | Eleventh Amended and Restated Advisory Agreement, dated April 1, 2022 | | | | 8-K | | | | 10.1 | | 03/29/22 |
10.16 | | | | | 8-K | | | | 10.1 | | 01/04/23 | |
16.1 | | Letter of Baker Tilly US, LLP dated March 31, 2021 to the SEC regarding statements in Item 4.01(a) | | | | 8-K | | | | 16.1 | | 03/31/21 |
21.1 | | | X | | | | | | | | | |
23.1 | | Consent of Independent Registered Public Accounting Firm - RSM, LLP | | X | | | | | | | | |
23.2 | | Consent of Independent Registered Public Accounting Firm - Baker Tilly US, LLP | | X | | | | | | | | |
31.1 | | | X | | | | | | | | | |
31.2 | | | X | | | | | | | | | |
32.1 | | Section 906 Certification of Chief Executive Officer and Chief Financial Officer | | X | | | | | | | | |
101 | | The following materials from Sterling Real Estate Trust’s Annual Report on Form 10-K for the year ended December 31, 2022, formatted in XBRL (eXtensible Business Reporting Language): (i) Consolidated Balance Sheets at December 31, 2022 and 2020; (ii) Consolidated Statements of Operations and Comprehensive Income for years ended December 31, 2022, 2021 and 2020; (iii) Consolidated Statements of Shareholders’ Equity for the years ended December 31, 2022, 2021 and 2020; (iv) Consolidated Statements of Cash Flows for the years ended December 31, 2022, 2021 and 2020, and; (v) Notes to Consolidated Financial Statements | | X | | | | | | | | |
104 | | Cover Page Interactive Data File, formatted in IXBRL and contained in Exhibit 101 | | X | | | | | | | | |
93
Exhibit Index
|
|
|
|
|
|
|
|
|
|
|
|
|
|
|
|
| Filed |
| Incorporated by reference | ||||||
Exhibit |
|
|
| here |
|
|
| Period |
|
|
| Filing |
number |
| Exhibit Description |
| with |
| Form |
| ending |
| Exhibit |
| date |
3.1 |
| Articles of Organization of Sterling Real Estate Trust filed December 3, 2002 |
|
|
| 10-12G |
|
|
| 3.1 |
| 03/10/11 |
3.2 |
| Amendment to Articles of Organization of Sterling Real Estate Trust dated August 1, 2014 |
|
|
| 8-K |
|
|
| 5.02 |
| 06/24/14 |
3.3 |
|
|
|
| 10-12G |
|
|
| 3.2 |
| 03/10/11 | |
3.4 |
|
|
|
| 8-K |
|
|
| 3.1 |
| 06/29/16 | |
4.1 |
| Declaration of Trust Sterling Real Estate Trust dated July 21, 2004 |
|
|
| 10-12G |
|
|
| 4.1 |
| 03/10/11 |
4.2 |
|
|
|
| 10-12G |
|
|
| 4.2 |
| 03/10/11 | |
4.3 |
| Sterling Third Amended and Restated Declaration of Trust dated March 27, 2014 |
|
|
| 8-K |
|
|
| 4.1 |
| 04/02/14 |
4.4 |
| Sterling Third Amended and Restated Declaration of Trust dated June 23, 2016 |
|
|
| 8-K |
|
|
| 4.1 |
| 06/29/16 |
4.5 |
| First Amended and Restated Declaration of Trust dated February 9, 2011 |
|
|
| 10-12G |
|
|
| 4.3 |
| 03/10/11 |
4.6 |
| Amendment No. 1 to First Amended and Restated Declaration of Trust dated August 1, 2014 |
|
|
| 8-K |
|
|
| 5.01 |
| 06/24/14 |
4.7 |
| Amended and Restated Share Repurchase Plan dated December 14, 2017 |
|
|
| 8-K |
|
|
| 99.1 |
| 12/19/17 |
4.8 |
| Amended and Restated Unit Repurchase Plan dated December 14, 2017 |
|
|
| 8-K |
|
|
| 99.2 |
| 12/19/17 |
10.1 |
|
|
|
| 10-12G |
|
|
| 10.2 |
| 03/10/11 | |
10.2 |
|
|
|
| 10-12G |
|
|
| 10.3 |
| 03/10/11 | |
10.3 |
|
|
|
| 10-12G |
|
|
| 10.4 |
| 03/10/11 | |
10.4 |
|
|
|
| 10-12G |
|
|
| 10.5 |
| 03/10/11 | |
10.5 |
|
|
|
| 10-K |
| 12/31/2011 |
| 10.6 |
| 03/30/12 | |
10.6 |
| Fourth Amended and Restated Advisory Agreement dated January 1, 2016 |
|
|
| 8-K |
|
|
| 10.1 |
| 03/25/16 |
10.7 |
| Fifth Amended and Restated Advisory Agreement dated January 1, 2017 |
|
|
| 8-K |
|
|
| 10.1 |
| 04/12/17 |
10.8 |
| Sixth Amended and Restated Advisory Agreement dated June 20, 2017 |
|
|
| 8-K |
|
|
| 10.1 |
| 06/26/17 |
10.9 |
|
|
|
| 8-K |
|
|
| 10.1 |
| 12/27/12 | |
10.10 |
|
|
|
| 8-K |
|
|
| 5.04 |
| 06/24/14 | |
10.11 |
|
|
|
| S-3D |
|
|
| A |
| 07/20/12 | |
10.12 |
| First Amendment to Dividend Reinvestment Plan dated September 26, 2013 |
|
|
| 8-K |
|
|
| 99.1 |
| 10/02/13 |
10.13 |
| Second Amendment to Dividend Reinvestment Plan dated December 14, 2016 |
|
|
| 8-K |
|
|
| 99.1 |
| 12/20/16 |
10.14 |
| Amended and Restated Dividend Reinvestment Plan dated July 11, 2017 |
|
|
| S-3D |
|
|
| A |
| 07/12/17 |
10.15 |
|
|
|
| 8-K |
|
|
| 5.03 |
| 06/24/14 | |
10.16 |
| Form of Purchase and Sale Agreement dated as of November 17, 2014 |
|
|
| 8-K |
|
|
| 10.1 |
| 12/23/14 |
10.17 |
| Form of Amendment to Purchase and Sale Agreement dated as of December 18, 2014 |
|
|
| 8-K |
|
|
| 10.2 |
| 12/23/14 |
10.18 |
| Form of Secured Promissory Note (15-Year Note) dated as of December 19, 2014 |
|
|
| 8-K |
|
|
| 10.3 |
| 12/23/14 |
10.19 |
| Form of Secured Promissory Note (10-Year Note) dated as of December 19, 2014 |
|
|
| 8-K |
|
|
| 10.4 |
| 12/23/14 |
10.20 |
| Form of Mortgage, Security Agreement and Fixture Filing dated as of December 19, 2014 |
|
|
| 8-K |
|
|
| 10.5 |
| 12/23/14 |
10.21 |
|
|
|
| 8-K |
|
|
| 10.6 |
| 12/23/14 | |
10.22 |
|
|
|
| 8-K |
|
|
| 10.7 |
| 12/23/14 | |
10.23 |
| Form of Commercial Security Agreement dated as of December 19, 2014 |
|
|
| 8-K |
|
|
| 10.8 |
| 12/23/14 |
10.24 |
|
|
|
| 8-K |
|
|
| 10.1 |
| 06/23/15 | |
10.25 |
| Form of Purchase and Sale Agreement dated as of July 1, 2015 |
|
|
| 8-K |
|
|
| 10.1 |
| 08/18/15 |
10.26 |
|
|
|
| 8-K |
|
|
| 10.2 |
| 08/18/15 | |
10.27 |
| Form of Mortgage, Security Agreement and Fixture Filing dated as of August 13, 2015 |
|
|
| 8-K |
|
|
| 10.3 |
| 08/18/15 |
21.1 |
|
| X |
|
|
|
|
|
|
|
| |
23.1 |
| Consent of Independent Registered Public Accounting Firm - Baker Tilly Virchow Krause, LLP |
| X |
|
|
|
|
|
|
|
|
31.1 |
|
| X |
|
|
|
|
|
|
|
| |
31.2 |
|
| X |
|
|
|
|
|
|
|
| |
32.1 |
| Section 906 Certification of Chief Executive Officer and Chief Accounting Officer |
| X |
|
|
|
|
|
|
|
|
99.1 |
|
|
|
| 8-K/A |
|
|
| 99.1 |
| 01/30/15 | |
|
|
|
|
|
|
|
|
|
|
|
| |
99.2 |
|
|
|
| 8-K/A |
|
|
| 99.2 |
| 01/30/15 | |
101 |
|
|
| X |
|
|
|
|
|
|
|
|
|
| The following materials from Sterling Real Estate Trust’s Annual Report on Form 10-K for the year ended December 31, 2017, formatted in XBRL (eXtensible Business Reporting Language): (i) Consolidated Balance Sheets at December 31, 2017 and 2016; (ii) Consolidated Statements of Operations and Comprehensive Income for years ended December 31, 2017, 2016 and 2015; (iii) Consolidated Statements of Shareholders’ Equity for the years ended December 31, 2017, 2016 and 2015; (iv) Consolidated Statements of Cash Flows for the years ended December 31, 2017, 2016 and 2015, and; (v) Notes to Consolidated Financial Statements. |
|
|
|
|
|
|
|
|
|
|
SIGNATURES
Pursuant to the requirements of Section 13 or 15(d) of the Securities Exchange Act of 1934, the registrant has duly caused the report to be signed on its behalf by the undersigned, thereunto duly authorized.
Dated: March 15, 20182023
|
| ||||
| STERLING REAL ESTATE TRUST | ||||
| |||||
| By: | /s/ | |||
| Kenneth P. Regan | ||||
| Chief Executive Officer (Principal Executive Officer) | ||||
Pursuant to the requirements of the Securities Exchange Act of 1934, this report has been signed below by the following persons on behalf of the registrant and in the capacities and on the dates indicated.
Signature |
| Title |
| Date | ||
|
|
| ||||
/s/ (Kenneth P. Regan) | Chief Executive Officer and Trustee | March 15, | ||||
/s/ ( | Chief | March 15, | ||||
/s/ ( | Chairman of the Board of Trustees | March 15, | ||||
/s/ ( | Trustee | March 15, | ||||
/s/ (Timothy | Trustee | March 15, | ||||
/s/ (Timothy | Trustee | March 15, | ||||
/s/ (Michelle L. Korsmo) | Trustee | March 15, | ||||
/s/ ( | Trustee | March 15, | ||||
/s/ (James S. Wieland) | Trustee | March 15, | ||||
|
|
| ||||
94