registrant held by non-affiliates of the registrant was $2.4 billion.
The Company’s definitive proxy statement relating to
which this Report relates.
| |||||||||
| Item 9C. | |||||||||
i
EXPLANATORY NOTE
Forward‑
|
|
|
|
|
|
|
|
|
|
|
|
|
|
|
|
|
|
|
|
|
|
|
|
|
|
|
|
|
|
|
|
ii
•availability and cost of skilled and qualified workers and our ability to recruit and retain employees and managers;
|
|
|
|
|
|
|
|
|
|
|
|
Should one or more of the risks or uncertainties described in this Annual Report occur, or should underlying assumptions prove incorrect, our actual results and plans could differ materially from those expressed in any forward‑looking statements.
Except as otherwise required by applicable law, we disclaim any duty to update any forward‑looking statements, all of which are expressly qualified by the statements in this section, to reflect events or circumstances after the date of this Annual Report.
EMERGING GROWTH COMPANY STATUS
We are an “emerging growth company” as defined in the Jumpstart Our Business Startups Act (the “JOBS Act”). For as long as we are an emerging growth company, unlike public companies that are not emerging growth companies under the JOBS Act, we will not be required to:
|
|
|
|
|
|
|
|
We will cease to be an emerging growth company upon the earliest of the:
|
|
|
|
|
|
|
|
In addition, Section 107 of the JOBS Act provides that an emerging growth company can take advantage of the extended transition period provided in Section 7(a)(2)(B) of the Securities Act of 1933, as amended (the “Securities Act”), for complying with new or revised accounting standards, but we have irrevocably opted out of the extended transition period and, as a result, we will adopt new or revised accounting standards on the relevant dates in which adoption of such standards is required for other public companies.
For a description of the qualifications and other requirements applicable to emerging growth companies and certain elections that we have made due to our status as an emerging growth company, see “Risk Factors—Risks Related to Our Class A Common Stock—For as long as we are an emerging growth company, we will not be required to comply with certain reporting requirements, including those relating to disclosure about our executive compensation, that apply to other public companies.”
iv
You should read this entire report carefully, including the risks described under Part 1, Item 1A. Risk Factors and our consolidated financial statements and the notes to those consolidated financial statements included elsewhere in this Annual Report on Form 10‑K. Except as otherwise indicated or required by the context, all references in this Annual Report to the “Company,” “Cactus,” “we,” “us” and “our” refer to (i) Cactus Wellhead, LLC (“Cactus LLC”) and its consolidated subsidiaries prior to the completion of our initial public offering and (ii) Cactus, Inc. (“Cactus Inc.”) and its consolidated subsidiaries (including Cactus LLC) following the completion of our initial public offering on February 12, 2018, unless we state otherwise or the context otherwise requires. References in this Annual Report to “Cadent” are to Cadent Energy Partners II, L.P., an affiliate of Cadent Energy Partners. References in this Annual Report to “Cactus WH Enterprises” are to Cactus WH Enterprises, LLC. Cadent, Cactus WH Enterprises and Mr. Lee Boquet are collectively referred to herein as the “Pre-IPO Owners.”
The following diagram indicates our simplified ownership Our Products Our innovative wellhead products and pressure control equipment are developed internally. We also conduct rental and field service operations in the Kingdom of Saudi Arabia. Our are the direct and indirect costs to manufacture and supply the product, including labor, materials, machine time, tariffs and duties, freight and lease expenses related to our facilities. The principal elements of cost of sales for rentals are the direct and indirect costs of supplying rental equipment, including We believe extended deliveries. Our production facility in China is configured to efficiently produce our range of pressure control products and components for less dependable deliveries. Patents currently have additional patent applications pending. We also rely on trade secret protection for our confidential and proprietary information. To protect our information, we customarily enter into confidentiality agreements with our employees and suppliers. There can be no assurance, however, that others will not independently obtain similar information or otherwise gain access to our trade secrets. Declines, as well as anticipated declines, in oil and gas prices could negatively affect the level of these activities and capital spending, which could adversely affect demand for our products and services and, in certain instances, result in the Hydraulic Fracturing. Although we do not conduct hydraulic fracturing, position. In addition, our business could be impacted by initiatives to address greenhouse gases and climate change and incentives to conserve energy or use alternative energy sources. For example, in August 2022, the Inflation Reduction Act good. Our Available Information gas and availability of capital. Declines, as well as anticipated declines, in oil and gas prices could negatively affect the level of these activities and capital spending, which could adversely affect demand for our products and services and, in certain instances, result in the cancellation, modification or rescheduling of existing and expected orders and the ability of our customers to pay us for our products and services. These factors could have an adverse effect on our The oil and gas industry is cyclical and has historically experienced periodic downturns, which have been characterized by diminished demand for regions in which we operate. We may be unable to employ a sufficient number of skilled and qualified workers to sustain or expand our current operations. cash flows. We are dependent on a relatively small number of customers in a single industry. The loss of an important customer could adversely affect our results of operations and financial condition. Our business, Additionally, the E&P industry is characterized by frequent consolidation activity. Changes in ownership of our customers may result in the loss of, or reduction in, business from those customers which could materially and adversely affect our business, results of operations and or other third parties. The requirements for such permits or authorizations vary depending on the location where such drilling and which could result in active price competition. Many contracts are awarded on a bid basis, which may further increase competition based primarily on price. In addition, adverse market conditions lower demand for well servicing equipment, which results in excess equipment and lower utilization rates. If market conditions in our New technology may cause us to become less competitive. Our operations are subject to hazards inherent in the oil and natural gas industry, which could expose us to substantial liability and cause us to lose customers and substantial revenue. business, results of operations and cash flows. impact on our ability to operate our business and on our results of operations. We have also experienced, and could continue to experience, disruption and volatility in our supply chain, which has resulted, and may continue to result, in increased costs for certain goods. The spread of COVID-19 has also disrupted and may continue to disrupt logistics necessary to import, export and deliver products to us and our customers. Further, we might experience temporary shortages of labor, making it difficult to provide field service technicians to install or service our equipment. The extent of the adverse impact of COVID-19 on general economic conditions and on our business, operations and results of operations remains uncertain. expenses and pay dividends to holders of our Class A Common Stock. In addition, our ability to pay dividends to holders of our Class A common stock depends on receipt of distributions from Cactus Companies. Our amended and restated certificate of incorporation and amended and restated bylaws, as well as Delaware law, contain provisions that could discourage acquisition bids or merger proposals, which may adversely affect the market price of our Class A common stock. In addition, certain change of control events have the effect of accelerating the payment due under the We cannot predict the size of future issuances of our Class A common stock. apply to the increase in tax basis, the amount and timing of taxable income we generate in the future and the U.S. federal income tax rates then applicable, and the portion of our payments under the TRA. TRA. member of Cactus funds legally available for such payments. We are was incorporated as a Delaware corporation on February 17, 2017 for the purpose of completing an initial public offering of equity (our “IPO”(“Cactus Inc.”) and related transactions. On February 12, 2018,its consolidated subsidiaries (the “Company,” “we,” “us,” “our” and “Cactus”), including Cactus Wellhead, LLC (“Cactus LLC”), are primarily engaged in connection with our IPO, Cactus Inc. became a holding company whose sole material assets are units in Cactus LLC (“CW Units”). Cactus Inc. became the managing member of Cactus LLCdesign, manufacture and is responsible for all operational, management and administrative decisions relating to Cactus LLC’s business.On February 12, 2018, we completed our initial public offering of 23,000,000 shares of Class A common stock, par value $0.01 per share (“Class A Common Stock”), at a price to the public of $19.00 per share. We received net proceeds of $405.8 million after deducting underwriting discounts and commissions and estimated offering expenses of our IPO. On February 14, 2018 we completed the sale of an additional 3,450,000 shares of Class A Common Stock pursuant to the exercise in full by the underwriters of their option to purchase additional shares of Class A Common Stock (the “Option”), resulting in $61.6 million of additional net proceeds. We contributed all of the net proceeds of the IPO to Cactus LLC in exchange for CW Units. Cactus LLC used (i) $251.0 million of the net proceeds to repay all of the borrowings outstanding under its term loan facility, including accrued interest and (ii) $216.4 million to redeem CW Units from certain direct and indirect owners of Cactus LLC.We design, manufacture, sell and rent a range of highly‑engineered wellheadswellhead and pressure control equipment. Our products are sold and rented principally for onshore unconventional oil and gas wells and are utilized during the drilling, completion (including fracturing) and production phases of our customers’ wells. In addition, weWe also provide field services for all of our products and rental items to assist with the installation, maintenance and handling of the wellhead and pressure control equipment.Organizational StructureIn connection with Additionally, we offer repair and refurbishment services. We operate through 15 U.S. service centers located in Texas, New Mexico, Pennsylvania, North Dakota, Louisiana, Oklahoma, Colorado, Utah and Wyoming as well as three service centers in Eastern Australia. We also provide rental and field service operations in the completionKingdom of Saudi Arabia. Our corporate headquarters are located in Houston, Texas. We also have manufacturing and production facilities in Bossier City, Louisiana and Suzhou, China.IPO,purpose of completing an initial public offering of equity and related transactions, which was completed on February 12, 2018 (our “IPO”). We began operating in August 2011 following the formation of Cactus LLC in part by Scott Bender and Joel Bender, who have owned or operated wellhead manufacturing businesses since the late 1970s. Cactus Inc. is a holding company whose only material asset is an equity interest consisting of units representing limited liability company interests in Cactus LLC (“CW Units”). Cactus Inc. became the sole managing member of Cactus LLC upon completion of our IPO and is responsible for all operational, management and administrative decisions relating to Cactus LLC’s business and consolidatesbusiness. Pursuant to the financial results of Cactus LLC and its subsidiaries. The Limited Liability Company Operating Agreement of Cactus LLC was amended and restated as the FirstSecond Amended and Restated Limited Liability Company Operating Agreement of Cactus LLC (the “Cactus Wellhead LLC Agreement”), owners of CW Units are entitled to among other things, admit Cactus Inc. as the sole managing memberredeem their CW Units for shares of Cactus LLC.1In connection with our IPO, we completed a seriesshares of reorganization transactions, including the following:(a)all of the membership interests in Cactus LLC were converted into a single class of CW Units;(b)Cactus Inc. contributed the net proceeds of the IPO to Cactus LLC in exchange for 23,000,000 CW Units;(c)Cactus LLC used the net proceeds of the IPO that it received from Cactus Inc. to repay the borrowings outstanding, plus accrued interest, under its term loan facility and to redeem 8,667,841 CW Units from the owners thereof;(d)Cactus Inc. issued and contributed 51,747,768 shares of its Class BClass A common stock, par value $0.01 per share (“Class B Common Stock”) equal to the number of outstanding CW Units held by the Pre-IPO Owners following the redemption described in (c) above to Cactus LLC;(e)Cactus LLC distributed to each of the Pre-IPO Owners that continued to own CW Units following the IPO one share of Class B Common Stock for each CW Unit such Pre-IPO Owner held following the redemption described in (c) above;(f)Cactus Inc. contributed the net proceeds from the exercise of the Option to Cactus LLC in return for 3,450,000 additional CW Units; and(g)Cactus LLC used the net proceeds from the Option to redeem 3,450,000 CW Units from the owners thereof, and Cactus Inc. canceled a corresponding number of shares of Class B Common Stock.In connection with the IPO, Cactus Inc. granted 0.7 million restricted stock unit awards, which will vest over one to three years, to certain directors, officers and employees of Cactus. In this Annual Report, weoutstanding. We refer to the owners of CW Units, other than Cactus Inc. (along with their permitted transferees), as “CW Unit Holders.” CW Unit Holders own one share of our Class B common stock, par value $0.01 per share (“Class B common stock”) for each CW Unit such CW Unit Holder owns. Holders of Class A common stock and Class B common stock vote together as a single class on all matters presented to our stockholders for their vote or approval, except as otherwise required by applicable law or our amended and restated certificate of incorporation. Cactus WH Enterprises, LLC (“Cactus WH Enterprises”) is the largest CW Unit Holder. Cactus WH Enterprises is a Delaware limited liability company owned by Scott Bender, Joel Bender, Steven Bender and certain other employees. Cadent Energy Partners II, L.P. (“Cadent”), an affiliate of Cadent Energy Partners LLC, owned more than 10% of issued and outstanding CW Units until March 2021, when it redeemed 4,111,250 of the CW Units (together with an equal number of shares of Class B common stock) owned by it in connection with the March 2021 offer and sale by certain selling stockholders of Class A common stock. Subsequently, in a series of additional transactions throughout 2021, Cadent and its affiliates transferred or redeemed the remainder of its CW Units. The redeemed CW Units were redeemed for Class A common stock, with such shares being distributed to their owners pro rata.CW Units (in thousands) CW Units held by legacy CW Unit Holders as of December 31, 2019 27,958 CW Unit redemptions (303) CW Units held by legacy CW Unit Holders as of December 31, 2020 27,655 Follow-on equity offering in March 2021 (6,273) Cadent redemption in June 2021 (3,292) Cadent redemption in September 2021 (715) Other CW Unit redemptions (701) CW Units held by legacy CW Unit Holders as of December 31, 2021 16,674 CW Unit redemptions (1,696) CW Units held by legacy CW Unit Holders as of December 31, 2022 14,978 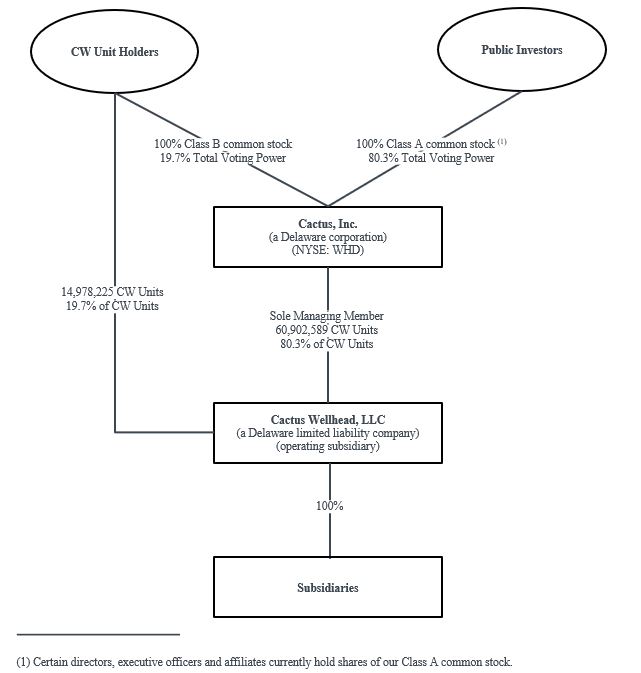
CWCC Unit such CWCC Unit Holders own. After giving effectHolder owns and Cactus Companies is the sole member of Cactus LLC. Pursuant to our IPO and the related transactions,Cactus Companies LLC Agreement, owners of CC Units are entitled to redeem their CC Units for shares of Cactus Inc. owns an approximate 35.3%’s Class A common stock on a one-for-one basis, which would result in a correspondingLLC,Companies and an increase in the CW Unit Holders own an approximate 64.7% interest in Cactus LLC. These ownership percentages are based on 26,450,000number of shares of Class A Common Stockcommon stock outstanding.48,439,772Class B common stock continue to vote together as a single class on all matters presented to our stockholders for their vote or approval, except as otherwise required by applicable law or our amended and restated certificate of incorporation. Cactus WH Enterprises remains the largest CC Unit Holder following the completion of the CC Reorganization.Common Stockcommon stock issued and outstandingoutstanding. Cactus WH Enterprises held approximately 16.9% of our voting power as of March 13, 2018.February 28, 2023.2structure.![]()
Our CompanyWe design, manufacture, sell and rentstructure immediately following the completion of the CC Reorganization: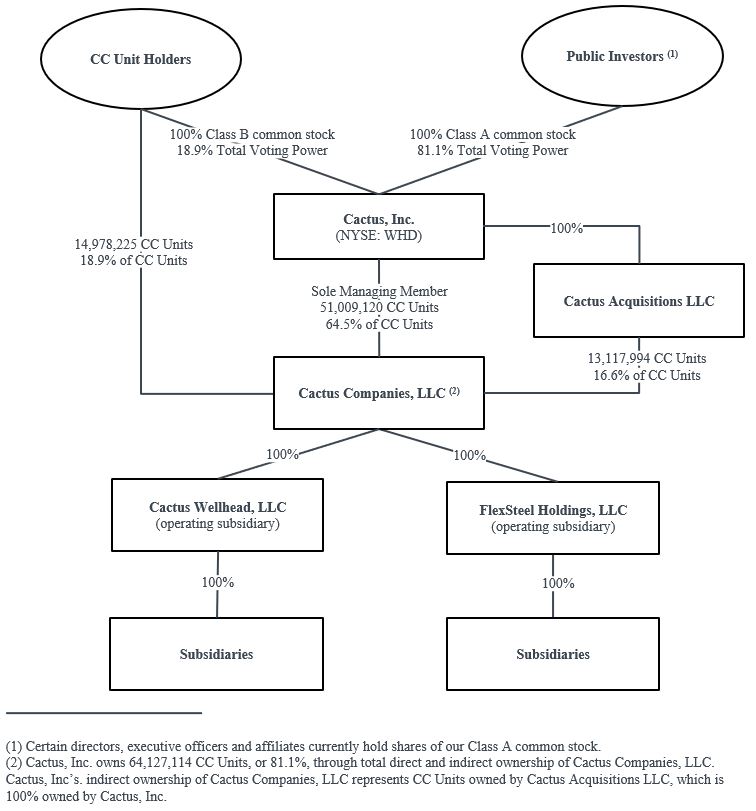
range of highly‑engineered wellheads and pressure control equipment. Our products are sold and rented principally for onshore unconventional oil and gas wells and are utilized during the drilling, completions (including fracturing) and production phasespart of our customers’ wells. In addition, we provide field services for all ofbusiness prior to December 31, 2022. Additional details on the business can be found in our products and rental items to assistForm 8-K filed with the installation, maintenanceSecurities and handlingExchange Commission (“SEC”) on January 3, 2023 announcing the signing of the wellhead and pressure control equipment.3
Merger Agreement.SafeDrill™SafeDrill® wellhead systems as well as frac stacks, our Cactus SafeLink® monobore, SafeClamp® and SafeInject® systems, zipper manifolds and production trees that we design and manufacture. Every oil and gas well requires a wellhead system, which is installed at the onset ofthroughout the drilling process and which remains with the well through its entire productive life. The Cactus SafeDrill™SafeDrill® wellhead systems employ technology which allows technicians to land and secure casing strings more safely from the rig floor, reducing the need to descend into the cellar. We believe we are a market leader in the application of such technology, with thousands of our products sold and installed across the United States since 2011. During the completion phase of a well, we rent frac stacks, zipper manifolds and other high‑pressurehigh-pressure equipment including our SafeLink®, SafeClamp® and SafeInject® systems that are used for well control and for managing the transmission of frac fluids and proppants during the hydraulic fracturing process. These severe service applications require robust and reliable equipment. Cactus, through its proprietary equipment, digital offerings and services, reduces the need for human intervention in the exclusion zone, minimizing non-productive time and leading to inherently safer and more environmentally responsible operations. For the subsequent production phase of a well, we sell production trees that regulate hydrocarbon production,and equipment which are installed on the wellhead after the frac treestack has been removed. In addition, we provide mission‑criticalmission-critical field services for all of our products and rental items, including 24‑hour24-hour service crews to assist with the installation, maintenance, repair and safe handling of the wellhead and pressure control equipment. Finally, we provide repair services for all of the equipment that we sell or rent.close relationship with our customers provides us with insight into the specific issues encountered in the drilling and completions processes, allowing usproducts, among other reasons, due to provide them with highly tailored product and service solutions. We have achieved significant market share, as measured by the percentage of total active U.S. onshore rigs that we follow (which we define as the number of active U.S. onshore drilling rigs to which we are the primary provider of wellhead products and corresponding services during drilling), and brand name recognition associated with respect to our engineered products, which we believe is due to our focus on safety, reliability, cost effectiveness and time saving features. We optimize our products for pad drilling (i.e.(i.e., the process of drilling multiple wellbores from a single surface location) to reduce rig time and provide operators with significant efficiencies that translate tointo increased safety, reduced environmental impact and cost savings at the wellsite.Our manufacturing and production facilities are located in Bossier City, Louisiana and Suzhou, China. While both facilities can produce our full range of products, our Bossier City facility has advanced capabilities and is designed to support time‑sensitive and rapid turnaround orders, while our facility in China is optimized for longer lead time orders and outsources its machining requirements. Both our United States and China facilities are licensed to the latest API 6A specification for both wellheads and valves and API Q1 and ISO9001:2015 quality management systems.14through service centers in the United States, which are strategically located in the key oil and gas producing regions, including the Permian, SCOOP/STACK, Marcellus, Utica, Haynesville, Eagle Ford, Bakken and SCOOP/STACK, among other active oil and gas regions in the United States. We also have one service centerStates, and in Eastern Australia. These service centers support our field services and provide equipment assembly and repair services.HistoryWe began operating in August 2011, following the formation of Cactus LLC by Scott Bendermanufacturing and Joel Bender, who have owned or operated wellhead manufacturing businesses since the late 1970s, and by Cadent, as its equity sponsor. We acquired our primary manufacturing facilityproduction facilities are located in Bossier City, Louisiana and Suzhou, China.onethree sources: products, rentals, and field service and other. Product revenues are primarily derived from the sale of wellhead systems and production trees. Rental revenues are primarily derived from the rental of equipment used during the completion process, the repair of such equipment and the rental of tools used during drilling operations. Field service and other revenues are primarily earned when we provide installation and other field services for both product sales and equipment rental. Additionally, other revenues are derived from providing repair and reconditioning services to customers that have previously purchased wellheads or production trees. Items sold or rented generally have an associated service component. As a result, there is a close correlation between field service and other revenues and revenues from product sales and rentals.Pre-IPO Ownerstotal revenues from the sale of our products, 14% from rental and 20% from field service and other. In 2021, we derived 64% of our total revenues from the sale of our products, 14% from rental and 22% from field service and other. In 2020, we derived 59% of our total revenues from the sale of our products, 19% from rental and 22% from field service and other. We have predominantly domestic operations, with a small amount of sales in September 2011select international markets.establishedservices are most often priced in accordance with a preapproved price list. The actual pricing of our other production facility, locatedproducts and services is impacted by a number of factors including competitive pricing pressure, the value perceived by our customers, the level of utilized capacity in Suzhou, China, in December 2013. Since we began operating, we have grown to 14 U.S.the oil service centers located in Texas, Louisiana, Colorado, Wyoming, New Mexico, Oklahoma, Pennsylvaniasector, cost of manufacturing the product, cost of providing the service and North Dakota. In July 2014, we formed Cactus Wellhead Australia Pty, Ltd and established a service center to develop thegeneral market conditions.in Eastern Australia.machining services.machined components. We purchase a majority of these items and services from over 250 vendors bothprimarily located in the United States, China, India and China.4For the three years in the period ended December 31, 2017, 2016 and 2015, approximately $33.4 million, $10.8 million and $18.1 million, respectively, of machined component purchases were made from a2022, no vendor located in China, representing approximately 22%, 20% and 27%, respectively,represented 10% or more of our total third partythird-party vendor purchases of raw materials, finished products, components, equipment, machining and other services. Although we have historically made purchases from this vendor pursuant to a long term contract, such contract expired at the end of 2016. We are currently purchasing from this vendor on terms substantially similar to those contained in the expired agreement. We expect to negotiate a new agreement with such vendor on terms similar to those in the expired agreement. Although our relationships with our existing vendors, including the Chinese vendor referred to above, are important to us, we do not believe that we are substantiallyoverly dependent on any individual vendor to supply our required materials or services. The materials and services essential to our business are normally readily available and, where we use one or a few vendors as a source of any particular materials or services, we believe that we can, within a reasonable period of time, make satisfactory alternative arrangements in the event of an interruption of supply from any vendor. that our materials and services vendors have the capacity to meet additional demand should we require it.Impact of Section 232 of the Trade Expansion Act of 1962 (“Section 232”)On March 8, 2018, the President of the United States issued two proclamations imposing tariffs on imports of certain steelit, although at higher costs and aluminum products, effective March 23, 2018. The decision was made in response to the Department of Commerce’s findings and recommendations in its reports of its investigations into the impact of imported steel and aluminum on the national security of the United States pursuant to Section 232. Specifically, the President has imposed a 25% global tariff on certain imported steel mill products and a 10% global tariff on certain imported aluminum products from all countries except Canada and Mexico. The tariffs could cause the cost of raw materials to increase, although the impact to us of Section 232 remains uncertain.CustomersWe serve over 200 customers representing major independent and other oil and gas companies with operations in the key U.S. oil and gas producing basins including the Permian, Marcellus Shale/Utica, the SCOOP/STACK, the Eagle Ford, the Bakken and other active oil and gas basins, as well as in Australia. For the year ended December 31, 2017, Pioneer Natural Resources represented 11% of our total revenue and no other customer represented 10% or more of our total revenue. For each of the years ended December 31, 2016 and 2015, Devon Energy Corporation represented 12% of our total revenue, and no other customer represented 10% or more of our total revenue.WhileAlthough both facilities can produce our full range of products, our Bossier City facility has advanced capabilities and is designed to support time‑sensitivetime-sensitive and rapid turnaround orders,of made-to-order equipment, while our facility in China is optimized for longer lead time orders and outsources its machining requirements. Both our U.S. and ChinaThe facilities are API certifiedlicensed to the APIlatest American Petroleum Institute (“API”) 6A specification for both wellheads and valves and API Q1 and ISO9001:ISO 9001:2015 quality management systems.Our Bossier City facility is configured to provide rapid‑response production of made‑to‑order equipment. Where typicaltraditional manufacturing facilities are designed to run in batches with different machining processes occurring in stages, thisour Bossier City facility uses highly‑capableadvanced computer numeric 5 Axis control (“CNC”) machines to perform substantially allmultiple machining of the product in a single step.operations with fewer set-ups. We believe eliminating the setup and queue times between machining processesoperations allows us to offer significantly shorter order‑to‑delivery time for equipment thanorder-to-delivery times compared to our competitors, albeit at higher costs than our facility in China. Responsiveness to urgent needs strengthens our relationship with key customers.5Our The Bossier City manufacturing facility also functions as a repair and testing facility with its API 6A PSL3 certification and full QA/QC department. The facility also has the ability to perform hydrostatic testing, phosphate and oiling,oil coating, copper coating and frac valverental equipment remanufacturing.time‑sensitive, higher‑volumetime-sensitive, higher-volume orders. All employees in ourThe Suzhou facility areassembles and tests finished and semi-finished machined components before shipment to the United States, Australia and other international locations. Our Suzhou subsidiary is wholly-owned, and its facility is staffed by Cactus employees, which we believe is a key factor in ensuring high quality. Our Suzhou facility currently assemblesquality and tests some machined components before shipment to the United States or Australia.Other Intellectual PropertyAdditionally,The Company has numerous trademarks registered with the SafeDrillTM trademark is complementaryU.S. Patent and Trademark Office and has also applied for registration status of several trademarks which are pending. Once registered, our trademarks can be renewed every 10 years as long as we are using them in commerce. We also seek to protect our technology through use of patents, which affords us 20 years of protection of our proprietary inventions and technology, although we do not deem patents to be critical to our marketing effortssuccess. We have been awarded several U.S. patents and brand recognition. These trademarks are registered in the United States.hashave historically been volatile, and by the availability of capital and the associated capital spending discipline imposedexercised by customers.clients’customers’ budget cycles.Our operationsdomestic (including U.S. federal, statestringent governmental laws and local) and international regulations, with regard to air, land and water qualityboth in the United States and other environmental matters. We believe we are in substantial compliance with these regulations. Laws and regulationscountries, pertaining to minimize and mitigate risks toprotection of the environment and to workplaceoccupational safety continue to be enacted. Changesand health. Compliance with environmental legal requirements in standards of enforcement of existing regulations, as well as the enactment and enforcement of new legislation,United States at the federal, state or local levels may require usacquiring permits to conduct regulated activities, incurring capital expenditures to limit or prevent emissions, discharges and our customersany unauthorized releases, and complying with stringent practices to modify, supplement or replace equipment or facilities or to change or discontinue present methodshandle, recycle and dispose of operation. Our environmental compliance expenditures, our capital costs for environmental control equipment,certain wastes. These laws and the market for our products may change accordingly.Hazardous Substances and Waste. The Resource Conservation and Recovery Act (“RCRA”) and comparable state statutes, regulate the generation, transportation, treatment, storage, disposal and cleanup of hazardous and non‑hazardous wastes. Under the auspices of the Environmental Protection Agency (“EPA”), the individual states6administer some or all of •the provisions of RCRA, sometimes in conjunction with their own, more stringent requirements. We are required to manage the transportation, storage and disposal of hazardous and non‑hazardous wastes generated by our operations in compliance with applicable laws, including RCRA.The Comprehensive Environmental Response, Compensation, and Liability Act (“CERCLA”), also known as the Superfund law, imposes joint and several liability, without regard to fault or legality of conduct, on classes of persons who are considered to be responsible for the release of a hazardous substance into the environment. These persons include the current and former owner or operator of the site where the release occurred, and anyone who disposed of or arranged for the disposal of a hazardous substance released at the site. We currently own, lease, or operate numerous properties used for manufacturing and other operations. We also contract with waste removal services and landfills. In the event of a release from these properties, under CERCLA, RCRA and analogous state laws, we could be required to remove substances and wastes, remediate contaminated property, or perform remedial operations to prevent future contamination even if the releases are not from our operations. In addition, neighboring landowners and other third parties may also file claims for personal injury and property damage allegedly caused by releases into the environment. Any obligations to undertake remedial operations in the future may increase our cost of doing business and may have a material adverse effect on our results of operations and financial condition.Water Discharges. The Federal Water Pollution Control Act (the “Clean Water Act”);analogous stateLiability Act;restrictin Australia, the People’s Republic of China and control the dischargeKingdom of pollutants into watersSaudi Arabia.United States. Dischargessame laws and regulations relating to water associated with our operations require appropriate permits from state agenciesenvironmental protection and may add material costs to our operations. The adoption of more stringent criteriaoccupational safety and health in the future may also increaseUnited States and in foreign countries where we operate. Consequently, to the extent these environmental compliance costs, pollution mitigation costs or remediation costs are incurred by our costs of operation. The Clean Water Actcustomers, those customers could elect to delay, reduce or cancel drilling, exploration or production programs, which could reduce demand for our products and analogous state laws provide for administrative, civilservices and, criminal penalties for unauthorized discharges and, together with the Oil Pollution Act of 1990, impose rigorous requirements for spill prevention and response planning, as well as substantial potential liability for the costs of removal, remediation, and damages in connection with any unauthorized discharges. In addition, in 2015 the EPA and U.S. Army Corps of Engineers (“Corps”) finalized a rule that expanded the scope of waters subject to Clean Water Act jurisdiction. If implemented, this rule mayresult, have a material adverse effect on our business, financial condition, results of operations, or cash flows. Consistent with our quality assurance and Health, Safety & Environment (“HSE”) principles, we have established proactive environmental and worker safety policies in the operation costsUnited States and foreign countries for the management, handling, recycling or disposal of customers, thereby potentially reducing demand forchemicals andproducts. The rule was stayed nationwide in late 2015, however, and the EPA and the Corps have proposed to repeal the rule and reinstate the pre‑2015 rule. In a separate rulemaking, the EPA and the Corps have also proposed to delay the implementation of the 2015 rule until 2019. Neither of these proposals has been finalized and the rule remains stayed by the Sixth Circuit.Employee Health and Safety. We are subject to a number of federal and state laws and regulations, including OSHA and comparable state statutes, establishing requirements to protect the health and safety of workers. In addition, the OSHA hazard communication standard, the EPA community right‑to‑know regulations under Title III of the federal Superfund Amendment and Reauthorization Act and comparable state statutes require that information be maintained concerning hazardous materials used or produced in our operations and that this information be provided to employees, state and local government authorities and the public.operations. Substantial fines and penalties can be imposed and orders or injunctions limiting or prohibiting certain operations may be issued in connection with any failure to comply with laws and regulations relating to worker health and safety.APIcertifiedlicensed by the API as beingto monogram manufactured products in complianceaccordance with API 6A, 21st Edition product specification for both wellheads and valves andwhile the quality management system is certified to API Q1, 9th Edition and ISO9001:2015 quality management systems.ISO 9001:2015. These standardslicenses and certifications expire every three years and are renewed upon successful completion of annual audits. Cactus has also developed an API Q2 program specific to our service business. At this time, we have also been incorporated into regulations adopted bynot yet applied for API Q2 certification, but we are implementing the BureauAPI Q2 Quality Management System at select service locations to reduce well site non-productive time, improve service tool reliability and enhance customer satisfaction and retention. Our current API licenses and certifications are published on our website under the “Quality Assurance & Control” section of Safety and Environmental Enforcement (“BSEE”) that apply to the oil and gas industries that operate on the outer continental shelf.our website at www.CactusWHD.com. API’s standards are subject to revision, however, and there is no guarantee that future amendments or substantive changes to the standards would not require us to modify our operations or manufacturing processes to meet the new standards. Doing so may materially affect our operationoperational costs. We also cannot guarantee that changes to the standards would not lead to the rescission of our licenses should we be unable to make the changes necessary to meet the new standards. Furthermore, these facilities are subjected to annual audits by the API. Loss of our API licenses could materially affect demand for these products.7Climate Change. International, national and state governments and agencies are currently evaluating and/or promulgating legislation and regulations that are focused on restricting emissions commonly referred to as greenhouse gas (“GHG”) emissions. These regulatory measures include, among others, adoption of cap and trade regimes, carbon taxes, increased efficiency standards and incentives or mandates for renewable energy. Consideration of further legislation or regulation may be impacted by the Paris Agreement, which was announced by the Parties to the United Nations Framework Convention on Climate Change in December 2015 and which calls on signatories to set progressive GHG emission reduction goals. Although the United States became a party to the Paris Agreement in April 2016, the Trump administration announced in June 2017 its intention to either withdraw from the Agreement or renegotiate more favorable terms. However, the Paris Agreement stipulates that participating countries must wait four years before withdrawing from the agreement. Despite the planned withdrawal, certain U.S. city and state governments have announced their intention to satisfy their proportionate obligations under the Paris Agreement. These commitments could further reduce demand and prices for fossil fuels produced by our customers. In the United States, the EPA has made findings under the Clean Air Act that GHG emissions endanger public health and the environment, resulting in the EPA’s adoption of regulations requiring construction and operating permit reviews of both existing and new stationary sources with major emissions of GHGs, which reviews require the installation of new GHG emission control technologies. However, in October 2017, the EPA announced a proposal to repeal its regulation of GHG emissions from existing stationary sources. The EPA has also promulgated rules requiring the monitoring and annual reporting of GHG emissions from certain sources, including onshore and offshore oil and natural gas production facilities and onshore oil and natural gas processing, transmission, storage and distribution facilities. In addition, in May 2016, the EPA finalized a rule that set additional emissions limits for volatile organic compounds and established new methane emission standards for certain new, modified or reconstructed equipment and processes in the oil and natural gas source category, including production, processing, transmission and storage activities. In June 2017, the EPA issued an administrative stay of key provisions of the rule, but was promptly ordered by the D.C. Circuit to implement the rule. The EPA also published proposed 60‑day and two‑year stays of certain provisions in June 2017 and published a Notice of Data Availability in November 2017 seeking comment and providing clarification regarding the agency’s legal authority to stay the rule.It is too early to determine whether, or in what form, further regulatory action regarding greenhouse gas emissions will be adopted or what specific impact a new regulatory action might have on us or our customers. Generally, the anticipated regulatory actions do not appear to affect us in any material respect that is different, or to any materially greater or lesser extent, than other companies that are our competitors. However, to the extent our customers are subject to these or other similar proposed or newly enacted laws and regulations, the additional costs incurred by our customers to comply with such laws and regulations could impact their ability or desire to continue to operate at current or anticipated levels, which would negatively impact their demand for our products and services. In addition, any new laws or regulations establishing cap‑and‑trade or that favor the increased use of non‑fossil fuels may dampen demand for oil and gas production and lead to lower spending by our customers for our products and services. Similarly, to the extent we are or become subject to any of these or other similar proposed or newly enacted laws and regulations, we expect that our efforts to monitor, report and comply with such laws and regulations, and any related taxes imposed on companies by such programs, will increase our cost of doing business and may have a material adverse effect on our financial condition and results of operations. Moreover, any such regulations could ultimately restrict the exploration and production of fossil fuels, which could adversely affect demand for our products.Many Most of our customers utilize hydraulic fracturing in their operations. Environmental concerns have been raised regarding the potential impact of hydraulic fracturing and the resulting wastewater disposal on underground water supplies.supplies and seismic activity. These concerns have led to several regulatory and governmental initiatives in the United States to restrict the hydraulic fracturing process, which could have an adverse impact on our customers’ completions or production activities. For example, in December 2016, the EPA released its final report on the potential impacts of hydraulic fracturing on drinking water resources, concluding that “water cycle” activities associated with hydraulic fracturing may impact drinking water resources “under some circumstances,” including water withdrawals for fracturing in times or areas of low water availability; surface spills during the management of fracturing fluids, chemicals or produced water; injection of fracturing fluids into wells with inadequate mechanical integrity; injection of fracturing fluids directly into8groundwater resources; discharge of inadequately treated fracturing wastewater to surface waters; and disposal or storage of fracturing wastewater in unlined pits. In other examples, the EPA has issued final regulations under the U.S. Clean Air Act governing performance standards, including standards for the capture of air emissions released during hydraulic fracturing, though the EPA is currently reconsidering these standards, and published in June 2016 a final rule prohibiting the discharge of wastewater from hydraulic fracturing operations to publicly owned wastewater treatment plants. Also, the U.S. Bureau of Land Management finalized rules in March 2015 that imposed new or more stringent standards for performing hydraulic fracturing on federal and American Indian lands. While the agency subsequently published a final rule rescinding the 2015 rule in December 2017, this decision could be subject to legal challenge. In addition, in some instances, states and local governments have enacted more stringent hydraulic fracturing restrictions or bans on hydraulic fracturing activities. These and other similar state and foreign regulatory initiatives, if adopted, would establish additional levels of regulation for our customers that could make it more difficult for our customers to complete natural gas and oil wells and could adversely affect the demand for our equipment and services, which, in turn, could adversely affect our results of operations, financial condition and cash flows.State and federal regulatory agencies have also recently focused on a possible connection between the operation of injection wells used for oil and gas waste disposal and seismic activity. Similar concerns have been raised that hydraulic fracturing may also contribute to seismic activity. When caused by human activity, such events are called induced seismicity. Developing research suggests that the link between seismic activity and wastewater disposal may vary by region, and that only a very small fraction of the tens of thousands of injection wells have been suspected to be, or have been, the likely cause of induced seismicity. In March 2016, the United States Geological Survey identified six states with the most significant hazards from induced seismicity, including Oklahoma, Kansas, Texas, Colorado, New Mexico, and Arkansas. In light of these concerns, some state regulatory agencies have modified their regulations or issued orders to address induced seismicity. Increased regulation and attention given to induced seismicity could lead to greater opposition to, and litigation concerning, oil and gas activities utilizing hydraulic fracturing or injection wells for waste disposal, which could indirectly impact our business, financial condition and results of operations. In addition, these concerns may give rise to private tort suits from individuals who claim they are adversely impacted by seismic activity they allege was induced. Such claims or actions could result in liability for property damage, exposure to waste and other hazardous materials, nuisance or personal injuries, and require our customers to expend additional resources or incur substantial costs or losses. This could in turn adversely affect the demand for our products.increasedour products are used in hydraulic fracturing. Increased regulation and attention given to the hydraulic fracturing process could lead to greater opposition to oil and gas production activities using hydraulic fracturing techniques. In December 2021, the Texas Railroad Commission, which regulates the state’s oil and gas industry, suspended the use of deep wastewater disposal wells in four oil-producing counties in West Texas. The suspension is intended to mitigate earthquakes thought to be caused by the injection of waste fluids, including saltwater, that are a byproduct of hydraulic fracturing into disposal wells. The ban will require oil and gas production companies to find other options to handle the wastewater, which may include piping or trucking it longer distances to other locations not under the ban. In addition, the Texas Railroad Commission has overseen the development of well-operator-led response plans to reduce injection volumes in other portions of West Texas in order to reduce seismicity in these areas. The adoption of new laws or regulations at the federal, state, local or foreign level imposing reporting obligations on, or otherwise limiting, delaying or banning, the hydraulic fracturing process or other processes on which hydraulic fracturing and subsequent hydrocarbon production relies, such as water disposal, could make it more difficult to complete oil and natural gas wells,wells. Further, it could increase our customers’ costs of compliance and doing business, and otherwise adversely affect the hydraulic fracturing services for which they perform,contract, which could negatively impact demand for our products.Offshore Drilling. Various new regulations intendedimprove offshore safety systemsevaluate, and in some instances adopt, climate-related legislation and other regulatory initiatives that would restrict emissions of greenhouse gases. Changes in environmental protection have been issued since 2010 that have increasedrequirements related to greenhouse gases, climate change and alternative energy sources may negatively impact demand for our services. For example, oil and natural gas exploration and production may decline as a result of environmental requirements, including land use policies responsive to environmental concerns. In January 2021, the complexityActing Secretary of the Department of the Interior issued an order suspending new leasing and drilling permit processpermits for fossil fuel production on federal lands and may limitwaters for 60 days. President Biden then issued an executive order indefinitely suspending new oil and natural gas leases on public lands or in offshore waters pending completion of a comprehensive review and reconsideration of federal oil and gas permitting and leasing practices. While the opportunityUnited States Department of the Interior announced in April 2022 that it would resume oil and gas leasing on public lands, the topic of oil and gas leasing on public land remains politically fraught, as the announcement indicated that federal land available for some operatorsoil and gas leasing will be significantly reduced due to continue deepwater drillingenvironmental and climate concerns. To the extent that these developments or other initiatives to reform federal leasing practices result in the U.S. Gulfdevelopment of Mexico, whichadditional restrictions on drilling, limitations on the availability of leases, or restrictions on the ability to obtain required permits, it could have an adverse impact on our customers’ activities. For example, in April 2016, BSEE published a final blowout preventer systems and well control rule that focuses on blowout preventer requirements and includes reforms in well design, well control, casing, cementing, real‑time well monitoring and subsea containment. Additionally, in July 2016, the Bureau of Ocean Energy Management issued a notice to lessees (“NTL”), effective September 30, 2016, setting out new financial assurance requirements for offshore leases intended to ensure that leaseholders will be able to cover the costs of decommissioning. In January 2017, the Bureau extended the NTL implementation timeline for certain leases by an additional six months. In May 2017, the Bureau began a review of the NTL to determine whether it should be implemented. If these new financial assurance requirements remain in place, they may increase our customers’ operating costs and impact our customers’ ability to obtain leases, thereby reducingopportunities and reduce demand for our products. Additional regulation includes a third‑party certification requirement promulgated by the Bureau of Safetyproducts and Environmental9Enforcement (“BSEE”) in September 2016 under which offshore operators must certify through an independent third party that their critical safety and pollution prevention equipment is operational and will function as designedservices in the most extreme conditions. However,aforementioned areas.BSEE published a proposed rule in December 2017 to rescind this requirement, allowing equipment to demonstrate its adequacy through various industry standards, such as those established by the API. Third‑party challenges to industry operations in the U.S. Gulflevel of Mexico may also serve to further delay or restrict activities. Although our operations are predominately onshore, if the new regulations, policies, operating procedures and possibility of increased legal liability are viewed by our current or future customers as a significant impairment to expected profitability on projects or an unjustifiable increase in risk, they could discontinue or curtail their offshore operations, thereby adversely affecting the demand for our equipment and services, which, in turn could adversely affect our results of operations, financial condition and cash flows.Chinese Environmental Law. As we have manufacturing operations in the People’s Republic of China (“PRC”), we are regulated by various PRC national and local environmental protection laws, regulations and policies. Chinese PRC environmental laws and regulations include national and local standards governing activities that may impact human health and the environment. These laws and regulations set standards for emissions control, discharges to surface and subsurface water, and the generation, handling, storage, transportation, treatment and disposal of waste materials. Although we believe that our operations are in substantial compliance with current environmental laws and regulations, we may not be able to comply with these regulations at all times as the PRC environmental legal regime is evolving and becoming more stringent. Therefore, if the PRC government imposes more stringent regulations in the future, we will have to incur additional and potentially substantial costs and expenses to comply with new regulations, which may negatively affect our results of operations. If we fail to comply with any of the present or future environmental regulations in any material aspects, we may suffer from negative publicity and may be required to pay substantial fines, suspend or even cease operations.Companies must register or file an environmental impact report with the appropriate environmental bureau before starting construction or any major expansion or renovation of a new production facility. Before commencing operations, the agency must inspect the new or renovated facility and determine that all necessary equipment has been installed as required by applicable environmental protection requirements.Chinese PRC authorities have the power to issue fines and penalties for non‑compliance and can also require violators to cease operations until compliance has been restored. We cannot currently predict the extent of future capital expenditures, if any, required for compliance with environmental laws and regulations, which may include expenditures for environmental control facilities.Insurance and Risk ManagementWe provide products and systems to customers involved in oil and gas exploration, development and production. We also provide parts, repair services and field services associated with installation at all of our facilities and service centers in the United States and at our facility in Australia, as well as at customer sites. Our operations are subject to hazards inherentactivity in the oil and natural gas industry, including accidents, blowouts, explosions, cratering, fires, oil spillsexisting or future laws, regulations, treaties or international agreements related to greenhouse gases and hazardous materials spills. These conditions can cause personal injury or loss of life, damage to or destruction of property, equipment, the environment and wildlife, and interruption or suspension of operations, among other adverse effects. In addition, claimsclimate change, may reduce demand for loss of oil and natural gas production and damage to formations can occur. If a serious accident were to occur at a location where our equipment and services are being used, it could result in our being named as a defendant to lawsuits asserting significant claims.We have suffered accidents in the past, and we anticipate that we could experience accidents in the future. In addition to the property and personal losses from these accidents, the frequency and severity of these incidents affect our operating costs and insurability, as well as our relationships with customers, employees and regulatory agencies. Any significant increase in the frequency or severity of these incidents, or the general level of compensation awards, could10adversely affect the cost of, or our ability to obtain, workers’ compensation and other forms of insurance and could have othera negative impact on our business. Likewise, such restrictions may result in additional compliance obligations that could have a material adverse effectseffect on our business, consolidated results of operations and consolidated financial condition.officersofficers’ insurance. We also maintain a partially self-insured medical plan that utilizes specific and aggregate stop loss limits. Our insurance includes various limits and deductibles or self‑insured retentions, which must be met prior to, or in conjunction with, recovery. To cover potential pollution risks, our commercial general liability policy is endorsed with sudden and accidental coverage and our excess liability policies provide additional limits of liability for covered sudden and accidental pollution losses.Employees2017,2022, we employed over 880 people. Our future success will depend partially on our ability to attract, retain1,200 people worldwide (not including employees of FlexSteel), of which approximately 1,000 were employed in the United States. FlexSteel employed 350 people as of December 31, 2022, with 340 employed in the United States and motivate qualified personnel.10 in Canada. We are not a party to any collective bargaining agreements and have not experienced any strikes or work stoppages. We consider our relations with our employeesworkforce to be satisfactory.Facilitiescorporate headquartersbusiness’s success depends mainly on our ability to attract, retain and motivate a diverse population of talented employees at all levels of our organization, including the individuals who comprise our global workforce, executive officers and other key personnel. To succeed in a competitive industry, we have developed key recruitment and retention strategies, objectives and measures which we focus on as part of the overall management of our business.located in Houston, Texas. Please see “Item 2. Properties”focused on attracting the best talent and rewarding their performance while developing and retaining them. When hiring, we utilize employee referrals, a variety of social media platforms, regional job fairs and partner with educational organizations across the United States to find diverse, qualified, motivated and responsible candidates. Additionally, we work with local workforce commissions to ensure we are attracting a diverse and qualified pool of candidates for information with respect to our other facilities. We believe that our facilities are adequate for our current operations.CompetitionThe marketseach region in which we operateoperate.highly competitive.dedicated to our employees’ training and development, especially those in field and branch operations. Our internal training focuses on safety, corporate and personal responsibility, product knowledge, behavioral development and ethical conduct. Cactus maintains an internal database to track training progress and completion for all of our associates, with a particular interest in tracking the training and skill sets of our field service technicians and managers. This tracking tool enables us to take a holistic view of our strengths by branch and job title, which helps us to manage our operations and assign jobs to associates with the proper skills, training and experience to safely and efficiently meet or exceed customer demand. Other training courses offered outside of the company are attended by employees with specialized skills, knowledge or certifications as needed for their ongoing success and professional development. We believe our continued focus on training and development translates into a safer work environment, opportunities to promote within the organization, improved employee morale and increased employee retention.weexpectations for safety program procedures and training are onebeing met. We also engage in third party conformity assessments of our HSE processes to determine adherence to our HSE management system and to global health and safety standards. We monitor our Occupational Safety and Health Administration Total Recordable Incident Rate (“TRIR”) to assess our operation’s health and safety performance. TRIR is defined as the largest suppliersnumber of wellheadsincidents per 100 full-time employees that have resulted in a recordable injury or illness in the United States.pertinent period. During fiscal year 2022, we had a TRIR of 1.35, which compares to 1.29 in 2021. We competehad no work-related fatalities in either year. Based on the most recent statistics available from the International Association of Drilling Contractors, our TRIR statistics are in line with divisionsthe industry average.Schlumberger, Baker Hughes a GE company, Weirour employees. We provide our employees and TechnipFMCtheir families access to various flexible and convenient health and wellness programs. These programs include benefits that offer protection and security to have peace of mind concerning events that may require time away from work or impact their financial well-being. These tools also support their physical and mental health by providing resources to improve or maintain their health status. In response to the COVID-19 pandemic, we implemented additional safety measures for employees performing critical on-site work as well as with a number of smaller companies. We believe that the wellhead market is relatively concentrated, with Cactus, Schlumbergeroffering vaccination clinics and Baker Hughes representing over 50% of the market. Similar to Cactus, each of Schlumberger, Baker Hughes and TechnipFMC manufacture their own engineered products.We believe that the rental market for frac stacks and related flow control equipment is more fragmented than the wellhead product market. Cactus does not believe that any individual company represents more than 10% of the market. As is the case in the wellhead market, Cactus, Schlumberger, Baker Hughes and TechnipFMC rent internally engineered and manufactured products. Other competitors generally rent foreign designed and manufactured generic products.We believe that the principal competitive factors in the markets we serve are technical features, equipment availability, work force competency, efficiency, safety record, reputation, experience and price. Additionally, projects are often awarded on a bid basis, which tends to create a highly competitive environment. While we seek to be competitive in our pricing, we believe many of our customers elect to work with us based on product features, safety, performance and quality of our crews, equipment and services. We seek to differentiate ourselves from our competitors11by delivering the highest‑quality services and equipment possible, coupled with superior execution and operating efficiency in a safe working environment.We are required to file annual, quarterly and current reports, proxy statements and certain other information with the SEC. Any documents filed by us with the SEC may be inspected without charge at the SEC’s Public Reference Room at 100 F Street, N.E., Washington, D.C. 20549. Copies of these materials may be obtained from such office upon payment of a duplicating fee. Please call the SEC at 1‑800‑SEC‑0330 for further information on the operation of the Public Reference Room.The SEC maintains a website at www.sec.gov that contains reports, proxy and information statements and other information regarding registrants that file electronically with the SEC. Any documents filed by us with the SEC, including this Annual Report, can be downloaded from the SEC’s website. Cobalt Center, 920 Memorial City Way, Suite 300, Houston, TX 77024, and our telephone number at that address is (713) 626‑8800. Our website address is www.CactusWHD.com. Our periodic reports and other information filed with or furnished to the SEC, including our Form 10-Ks, Form 10-Qs and Form 8-Ks, as well as amendments to such filings, are available free of charge through our website, as soon as reasonably practicable after those reports and other information are electronically filed with or furnished to the SEC. Information on our website or any other website is not incorporated by reference into this Annual Report and does not constitute a part of this Annual Report.Common Stockcommon stock involves risks. You should carefully consider the information in this Annual Report, including the matters addressed under “Cautionary NoteStatement Regarding Forward‑Looking Statements,” and the following risks before making an investment decision. Our business, financial condition, prospects and results of operations and financial condition could be materially and adversely affected by any of these risks. Additional risks or uncertainties not currently known to us, or that we deem immaterial, may also have an effect on our business, financial condition, prospects or results of operations.operations and financial condition. The trading price of our Class A Common Stockcommon stock could decline due to any of these risks, and you may lose all or part of your investment.gas. natural gas companies. Oil and gas activity is in turn heavily influenced by, among other factors, current and anticipated oil and natural gas prices locally and worldwide, which have historically been volatile.revenueresults of operations, financial condition and profitability.12Factors affecting the prices of oil and natural gas include, but are not limited to, the following:·demand for hydrocarbons, which is affected by worldwide population growth, economic growth rates and general economic and business conditions;·changes in sentiment on environmental matters;·costs of exploring for, producing and delivering oil and natural gas;·political and economic uncertainty and sociopolitical unrest;·available excess production capacity within the Organization of Petroleum Exporting Countries (“OPEC”) and the level of oil and gas production by non‑OPEC countries;·oil refining capacity and shifts in end‑customer preferences toward fuel efficiency and the use of natural gas;·technological advances affecting energy consumption;·potential acceleration of the development of alternative fuels;·access to capital and credit markets, which may affect our customers’ activity levels and spending for our products and services;·the relative strength of the U.S. dollar;·changes in laws and regulations related to hydraulic fracturing activities;·changes in environmental laws and regulations (including relating to the use of coal in power plants); and·natural disasters.oilfieldour products and services and downward pressure on the prices we charge. The last downturn in the oil and gas industry that began in mid‑2014 resulted in a reduction in demand for oilfield services and adversely affected our financial condition, resultsTheseour operating results to fluctuate.We derive our revenues from companies in the oil and natural gas exploration and production industry, a historically cyclical industry with levels of activity that are significantly affected by the levels and volatility of oil and natural gas prices. We have experienced and may in the future experience significant fluctuations in operating results as a result of the reactions of our customers to changes in oil and natural gas prices. For example, prolonged low commodity prices during 2015 and 2016, combined with adverse changes in the capital and credit markets, caused many exploration and productionE&P companies to reduce their capital budgets and drilling activity. This resultedAny future downturn or expected downturn could result in a significant decline in demand for oilfield services and adversely impacted the prices we could charge, particularly for rentals of frac equipment.13If oil prices or natural gas prices decline, the demand foraffect our products and services could be adversely affected.The demand for our products and services is primarily determined by current and anticipated oil and natural gas prices and the level of drilling activity and related general production spending in the areas in which we have operations. Volatility or weakness in oil prices or natural gas prices (or the perception that oil prices or natural gas prices will decrease) affects the spending patterns of our customers and may result in the drilling of fewer new wells or lower production spending on existing wells. When this occurs, exploration and production (“E&P”) companies move to significantly cut costs, both by decreasing drilling and completions activity and by demanding price concessions from their service providers. This results in lower demand for our products and services and may cause lower rates and lower utilization of our equipment. If oil prices decline or natural gas prices continue to remain low or decline further, or if there is a reduction in drilling activities, the demand for our products and services and ourbusiness, results of operations could be materially and adversely affected.Additionally, the commercial development of economically viable alternative energy sources (such as wind, solar, geothermal, tidal, fuel cells and biofuels) could reduce demand for our products and services and create downward pressure on the revenue we are able to derive from such products and services, as they are dependent on oil and natural gas prices.Anticipated growthcash flows.completionscompletion activity, and our ability to benefit from such anticipated growth, could be adversely affected by any significant constraints in pressure pumpingequipment, labor or takeaway capacity in the industry.completionscompletion activity may be impacted by, among other things, pressure pumpingthe availability and cost of oil country tubular goods (“OCTG”), pipeline capacity, and pricing, which,material and labor shortages. Should significant growth in turn, is impacted by, among other things, theactivity continue, there could be concerns over availability of fracturingthe equipment, demand for fracturing equipmentmaterials and fracturing intensity per active rig. Also, longer lateralslabor required to drill and higher intensity fracturing result in greater wear and tear to the industry’s fracturing equipment, which has caused and will continue to cause attrition in the supply of fracturing equipment and shortages in the availability of pressure pumping services. In addition, rising fracturing intensity per rig and an overall increase in completions activity has increased the demand for fracturing equipment. During the completion phase ofcomplete a well, we rent frac stacks, zipper manifolds and other high‑pressure equipment used during the hydraulic fracturing process. For the subsequent production phase of a well, we sell production trees, which are installed on the wellhead after the frac tree has been removed. Any significant additional constraints in the availability of pressure pumping services, fracturing equipment ortogether with the ability to move the produced oil and natural gas to market. Should significant constraints develop that materially impact the efficiency and economics of fracturing service providers to deliver fracturing servicesoil and gas producers, growth in U.S. drilling and completion activity could be adversely affected. This would have an adverse impact on the demand for the products we sell and rent, which could have a material adverse effect on our business, results of operations financial condition and cash flows.We design, manufacture, sell, rent and install equipment that is used in oil and gas exploration and production activities, which may subject us to liability, including claims for personal injury, property damage and environmental contamination should such equipment fail to perform to specifications.We provide products and systems to customers involved in oil and gas exploration, development and production. Some of our equipment is designed to operate in high‑temperature and/or high‑pressure environments, and some equipment is designed for use in hydraulic fracturing operations. We also provide parts, repair services and field services associated with installation at all of our facilities and service centers in the United States and at our facility in Australia, as well as at customer sites. Because of applications to which our products and services are exposed, particularly those involving high pressure environments, a failure of such equipment, or a failure of our customer to maintain or operate the equipment properly, could cause damage to the equipment, damage to the property of customers and others, personal injury and environmental contamination and could lead to a variety of claims against us that could have an adverse effect on our business and results of operations.We indemnify our customers against certain claims and liabilities resulting or arising from our provision of goods or services to them. In addition, we rely on customer indemnifications, generally, and third‑party insurance as part14of our risk mitigation strategy. However, our insurance may not be adequate to cover our liabilities. In addition, our customers may be unable to satisfy indemnification claims against them. Further, insurance companies may refuse to honor their policies, or insurance may not generally be available in the future, or if available, premiums may not be commercially justifiable. We could incur substantial liabilities and damages that are either not covered by insurance or that are in excess of policy limits, or incur liability at a time when we are not able to obtain liability insurance. Such potential liabilities could have a material adverse effect on our business, results of operations, financial condition and cash flows.the supply is limited, and the cost to attract and retain qualified personnel has increased. During industry downturns, skilled workers may leave the industry, reducing the availability of qualified workers when conditions improve. In addition, a significant increase in the wages paid by competing employers both within and outside of our industry could result in increases in the wage rates that we must pay. If we are not able to employ and retain skilled workers, our ability to respond quickly to customer demands or strong market conditions may inhibit our growth, which could have a material adverse effect on our business, results of operations and financial condition.a facilityfacilities in Australia that sellssell and rentsrent equipment as well as providesprovide parts, repair services and field services associated with installation. Additionally, we provide rental and field service operations in the Kingdom of Saudi Arabia. Instability and unforeseen changes in any of the markets in which we conduct business could have an adverse effect on the demand for, or supply of, our products and services, ourbusiness, results of operations and our financial condition. These factors include, but are not limited to, the following:
cash flows.·nationalization and expropriation;·potentially burdensome taxation;·inflationary and recessionary markets, including capital and equity markets;·civil unrest, labor issues, political instability, terrorist attacks, cyber‑terrorism, military activity and wars;·supply disruptions in key oil producing countries;·tariffs, trade restrictions, trade protection measures associated with Section 232 or price controls;·foreign ownership restrictions;·import or export licensing requirements;·restrictions on operations, trade practices, trade partners and investment decisions resulting from domestic and foreign laws and regulations;15·changes in, and the administration of, laws and regulations;·inability to repatriate income or capital;·reductions in the availability of qualified personnel;·foreign currency fluctuations or currency restrictions; and·fluctuations in the interest rate component of forward foreign currency rates.Australia.select international markets. Historically, we have been dependent on a relatively small number of customers for our revenues. For the year ended December 31, 2017, Pioneer Natural Resources represented 11% of our total revenue, and no other customer represented more than 10% of our total revenue. For each of the years ended December 31, 2016 and 2015, Devon Energy Corporation represented 12% of our total revenue, and no other customer represented more than 10% of our total revenue. financial condition, prospects and results of operations and financial position could be materially adversely affected if an important customer ceases to engage us for our services on favorable terms, or at all, or fails to pay or delays in paying us significant amounts of our outstanding receivables.financial condition.Customer credit risks could result in losses.The concentration of our customers in the energy industry may impact our overall exposure to credit risk as customers may be similarly affected by changes in economic and industry conditions. In addition, laws in some jurisdictions outside of the U.S. in which we operate could make collection difficult or time consuming. We perform ongoing credit evaluations of our customers and do not generally require collateral in support of our trade receivables. While we maintain reserves for potential credit losses, we cannot assure such reserves will be sufficient to meet write‑offs of uncollectible receivables or that our losses from such receivables will be consistent with our expectations.To the extent one or more of our key customers commences bankruptcy proceedings, our contracts with these customers may be subject to rejection under applicable provisions of the United States Bankruptcy Code, or may be renegotiated. Further, during any such bankruptcy proceeding, prior to assumption, rejection or renegotiation of such contracts, the bankruptcy court may temporarily authorize the payment of value for our services less than contractually required, which could also have a material adverse effect on our business, results of operations, financial condition and cash flows.In most states, ourcompletionscompletion activities, including hydraulic fracturing. Such permits or approvals are typically16completionscompletion activities will be conducted. As with most permitting and authorization processes, there is a degree of uncertainty as to whether a permit will be granted, the time it will take for a permit or approval to be issued and the conditions which may be imposed in connection with the granting of the permit. In some jurisdictions, such as New York State and within the jurisdiction of the Delaware River Basin Commission, certain regulatory authorities have delayed or suspended the issuance of permits or authorizations while the potential environmental impacts associated with issuing such permits can be studied and appropriate mitigation measures evaluated. In Texas, rural water districts have begun to impose restrictions on water use and may require permits for water used in drilling and completionscompletion activities. In addition, in January 2021, President Biden indefinitely suspended new oil and natural gas leases on public lands or in offshore waters pending completion of a comprehensive review and reconsideration of federal oil and gas permitting and leasing practices. While the United States Department of the Interior announced in April 2022 that it would resume oil and gas leasing on public lands, the topic of oil and gas leasing on public land remains politically fraught, as the announcement indicated that federal land available for oil and gas leasing will be significantly reduced due to environmental and climate concerns. The effects of these developments or other initiatives to reform the federal leasing process could result in additional restrictions or limitations on the issuance of federal leases and permits for drilling on public lands. Permitting, authorization or renewal delays, the inability to obtain new permits or the revocation of current permits could impact our customers’ operations and cause a loss of revenue and potentially have a materiallymaterial adverse effect on our business, results of operations and financial condition.We may lose money on fixed‑price contracts.From time to time, we agree to provide products and services under relatively short term fixed‑price contracts. Under these contracts, we are typically responsible for cost overruns. Our actual costs and any gross profit realized on these fixed‑price contracts may vary from the estimated amounts on which these contracts were originally based. There is inherent risk in the estimation process, including significant unforeseen technical and logistical challenges or longer than expected deployment times in the case of rentals. Depending on the size of a project, variations from estimated contract performance could have an adverse impact on our results of operations, financial condition and cash flows.Increased costs, or lack of availability, of raw materials and other components may result in increased operating expenses and adversely affect our results of operations and cash flows.Our ability to source low cost raw materials and components, such as steel castings and forgings, is critical to our ability to manufacture and sell our products and provide our services competitively. Our results of operations may be adversely affected by our inability to manage the rising costs and availability of raw materials and components used in our wide variety of products and systems. We cannot assure that we will be able to continue to purchase these raw materials on a timely basis or at commercially viable prices, nor can we be certain of the impact of Section 232. Further, unexpected changes in the size of regional and/or product markets, particularly for short lead‑time products, could affect our results of operations and cash flows. Should our current suppliers be unable to provide the necessary raw materials or components or otherwise fail to deliver such materials and components timely and in the quantities required, resulting delays in the provision of products or services to our customers could have a material adverse effect on our business.In accordance with Section 1502 of the Dodd‑Frank Act, the SEC’s rules regarding mandatory disclosure and reporting requirements by public companies of their use of “conflict minerals” (tantalum, tin, tungsten and gold) originating in the Democratic Republic of Congo and adjoining countries became effective in 2014. While the conflict minerals rule continues in effect as adopted, there remains uncertainty regarding how the conflict minerals rule, and our compliance obligations, will be affected in the future. Additional requirements under the rule could affect sourcing at competitive prices and availability in sufficient quantities of certain of the conflict minerals used in the manufacture of our products or in the provision of our services, which could have a material adverse effect on our ability to purchase these products in the future. The costs of compliance, including those related to supply chain research, the limited number of suppliers and possible changes in the sourcing of these minerals, could have a material adverse effect on our results of operations and cash flows.small companies capable of competing effectively in our markets, on a local basis, as well asincluding several large companies that possess substantially greater financial and other resources than we do. The amount of equipment available may exceed demand,17oil‑oriented operating areas were to deteriorate from current levels or if adverse market conditions in our natural gas‑oriented operating areas persist, the prices we are able to charge and utilization rates may decline. The competitive environment has intensified since late 2014 as a result of the industry downturn and oversupply of oilfield equipment and services. Any significant future increase in overall market capacity for the products, rental equipment or services that we offer could adversely affect our business, and results of operations.Our relationship with one of our vendors is important to us.We obtain certain important materials and machining services from one of our vendors located in China. For the years ended December 31, 2017, 2016 and 2015, approximately $33.4 million, $10.8 million and $18.1 million of purchases of machined components were made from this vendor, representing approximately 22%, 20% and 27%, respectively, of our total third party vendor purchases of raw materials, finished products, equipment, machining and other services. If we are not able to maintain our relationship with such vendor, our results of operations could be adversely impacted until we are able to find an alternative vendor.Conservation measures and technological advances could reduce demand for oil and natural gas and our services.Fuel conservation measures, alternative fuel requirements, increasing consumer demand for alternatives to oil and natural gas, technological advances in fuel economy and energy generation devices could reduce demand for oil and natural gas, resulting in reduced demand for oilfield services. The impact of the changing demand for oil and natural gas services and products may have a material adverse effect on our business, results of operations, financial condition and cash flows.Indebtedness and liquidity needs could restrict our operations and make us more vulnerable to adverse economic conditions.Indebtedness we may incur in the future, whether incurred in connection with acquisitions, operations or otherwise, may adversely affect our operations and limit our growth, and we may have difficulty making debt service payments on such indebtedness as payments become due. Our level of indebtedness may affect our operations in several ways, including the following:·increasing our vulnerability to general adverse economic and industry conditions should our business fail to generate sufficient cash flow to meet our debt obligations;·limiting our ability to borrow funds, dispose of assets, pay dividends and make certain investments due to the covenants that are contained in the agreements governing our indebtedness;·affecting our flexibility in planning for, and reacting to, changes in the economy and in our industry;·causing an event of default resulting from any failure to comply with the financial or other covenants of our debt, including covenants that impose requirements to maintain certain financial ratios; and·impairing our ability to obtain additional financing in the future for working capital, capital expenditures, acquisitions or other general corporate purposes.18We are subject to foreign currency fluctuation risk.We outsource certain of our wellhead equipment to suppliers in China, and our production facility in China assembles and tests these outsourced components, as we do not engage in machining operations in this facility. In addition, we have a service center in Australia that sells products, rents frac equipment and provides field services. To the extent either facility has net U.S. dollar denominated assets, our profitability is eroded when the U.S. dollar weakens against the Chinese Yuan and the Australian dollar. Our production facility in China generally has net U.S. dollar denominated assets, while our service center in Australia generally has net U.S. dollar denominated liabilities. The U.S. dollar translated profits and net assets of our facilities in China and Australia are eroded if the respective local currency value weakens against the U.S. dollar. We have not entered into any derivative arrangements to protect against fluctuations in currency exchange rates.financial condition,cash flows, including thea reduction in the value of assets replaced by new technologies.A failureinformation technology infrastructure could adversely impact us.We depend on our information technology (“IT”) systems for the efficient operationresults of our business. Accordingly, we rely upon the capacity, reliabilityoperations and security of our IT hardwarecash flows.software infrastructurecomponents, such as tube and bar stock, forgings and machined components is critical to our ability to expandsuccessfully compete. Due to a shortage of steel caused primarily by production disruptions during the pandemic and update this infrastructurethe conflict in responseUkraine as well as increased demand while economies rebounded, steel and assembled component prices have been elevated. Our results of operations may be adversely affected by our inability to manage higher costs and the availability of raw materials and components used in our wide variety of products and systems. Additionally, freight costs, specifically ocean freight costs, rose significantly during and following the pandemic. We cannot assure that we will be able to continue to purchase and move these materials on a timely basis or at commercially viable prices, nor can we be certain of the impact of changes to tariffs and future legislation that may impact trade with China or other countries. Further, unexpected changes in the size of regional and/or product markets, particularly for short lead‑time products, could affect our results of operations and cash flows. Should our current suppliers be unable to provide the necessary raw materials or components or otherwise fail to deliver such materials and components timely and in the quantities required, resulting delays in the provision of products or services to our changing needs. Despite our implementation of security measures, our systems are vulnerable to damages from computer viruses, natural disasters, incursions by intruders or hackers, failures in hardware or software, power fluctuations, cyber terrorists and other similar disruptions. Additionally, we rely on third parties to support the operation of our IT hardware and software infrastructure, and in certain instances, utilize web‑based applications. Although no such material incidents have occurred to date, the failure of our IT systems or those of our vendors to perform as anticipated for any reason or any significant breach of security could disrupt our business and result in numerous adverse consequences, including reduced effectiveness and efficiency of operations, inappropriate disclosure of confidential and proprietary information, reputational harm, increased overhead costs and loss of important information, whichcustomers could have a material adverse effect on our business, and results of operations. operations and cash flows.addition,2022, the United States experienced the highest inflation in decades primarily due to supply-chain issues, a shortage of labor and a build-up of demand for goods and services. Our business was impacted by increased freight, materials and vehicle-related costs as well as higher salaries and wages. While we believe that the rate of inflation is abating, we expect we will continue to experience inflationary pressures on portions of our cost structure. Our results of operations may be required to incur significantadversely affected by further rising costs to protect against damage caused by these disruptions or security breaches in the future.Our business is dependent on the continuing services of certain of our key managers and employees.We depend on key personnel. The loss of key personnel could adversely impact our business ifextent we are unable to implement certain strategies or transactionsrecoup them from our customers.their absence. The loss of qualified employees or an inabilityoil and gas E&P activities, which may subject us to retainliability, including claims for personal injury, property damage and motivate additional highly‑skilled employees required for the operationenvironmental contamination should such equipment fail to perform to specifications.expansionsystems to customers involved in oil and gas exploration, development and production. Some of our business could hinder our abilityequipment is designed to successfully maintainoperate in high‑temperature and/or high‑pressure environments, and expand our market share.19Equity interestssome equipment is designed for use in us are a substantial portion of the net worthhydraulic fracturing operations. We also provide parts, repair services and field services associated with installation at all of our executive officersfacilities and severalservice centers in the United States and Australia, as well as at customer sites, including sites in the Kingdom of our other senior managers. Following the completionSaudi Arabia. Because of the IPO, those executive officers and other senior managers have increased liquidity with respectapplications to their equity interests in us. As a result, those executive officers and senior managers may have less incentive to remain employed by us. After terminating their employment with us, some of them may become employed by our competitors.Adverse weather conditions could impact demand for our services or materially impact our costs.Our business could be materially adversely affected by adverse weather conditions. For example, unusually warm winters could adversely affect the demand forwhich our products and services by decreasingare exposed, particularly those involving high pressure environments, a failure of such equipment, or a failure of our customers to maintain or operate the demand for natural gas or unusually cold wintersequipment properly, could adversely affect our abilitycause damage to perform our services duethe equipment, damage to delays in the deliveryproperty of products that we need to provide our services. Our operations in arid regions can be affected by droughtscustomers and limited access to water used in hydraulic fracturing operations. Adverse weather can also directly impede our own operations. Repercussions of adverse weather conditions may include:·curtailment of services;·weather‑related damage to infrastructure, transportation, facilities and equipment, resulting in delays in operations;·inability to deliver equipment, personnel and products to job sites in accordance with contract schedules; and·loss of productivity.Competition among oilfield serviceothers, personal injury and equipment providers is affected by each provider’s reputation for safetyenvironmental contamination and quality.Our activities are subjectcould lead to a wide rangevariety of national, state and local occupational health and safety laws and regulations. In addition, customers maintain their own compliance and reporting requirements. Failure to comply with these health and safety laws and regulations, or failure to comply with our customers’ compliance or reporting requirements,claims against us that could tarnish our reputation for safety and quality and have a materialan adverse effect on our competitive position.Ourbusiness, results of operations require usand cash flows.comply with various domesticthem. In addition, we rely on customer indemnifications, generally, and international regulations, violationsthird‑party insurance as part of whichour risk mitigation strategy. However, our insurance may not be adequate to cover our liabilities. In addition, our customers may be unable to satisfy indemnification claims against them. Further, insurance companies may refuse to honor their policies, or insurance may not generally be available in the future, or if available, premiums may not be commercially justifiable. We could incur substantial liabilities and damages that are either not covered by customer indemnities or insurance or that are in excess of policy limits, or incur liability at a time when we are not able to obtain liability insurance. Such potential liabilities could have a material adverse effect on our results of operations, financial condition and cash flows.We are exposed to a variety of federal, state, local and international laws and regulations relating to matters such as environmental, workplace, health and safety, labor and employment, customs and tariffs, export and reexport controls, economic sanctions, currency exchange, bribery and corruption and taxation. These laws and regulations are complex, frequently change and have tended to become more stringent over time. They may be adopted, enacted, amended, enforced or interpreted in such a manner that the incremental cost of compliance could adversely impact our results of operations, financial condition and cash flows.Our operations outside of the United States require us to comply with numerous anti‑bribery and anti‑corruption regulations. The U.S. Foreign Corrupt Practices Act (“FCPA”), among others, applies to us and our operations. Our policies, procedures and programs may not always protect us from reckless or criminal acts committed by our employees or agents, and severe criminal or civil sanctions may be imposed as a result of violations of these laws. We are also subject to the risks that our employees and agents outside of the United States may fail to comply with applicable laws.20In addition, we import raw materials, semi‑finished goods, and finished products into the United States, China and Australia for use in such countries or for manufacturing and/or finishing for re‑export and import into another country for use or further integration into equipment or systems. Most movement of raw materials, semi‑finished or finished products involves imports and exports. As a result, compliance with multiple trade sanctions, embargoes and import/export laws and regulations pose a constant challenge and risk to us since a portion of our business, is conducted outside of the United States through our subsidiaries. Our failure to comply with these laws and regulations could materially affect our reputation, results of operations and financial condition.Compliance with environmental laws and regulations may adversely affect our business and results of operations.Environmental laws and regulations in the United States and foreign countries affect the equipment, systems and services we design, market and sell, as well as the facilities where we manufacture and produce our equipment and systems in the United States and China, and opportunities our customers pursue that create demand for our products. For example, we may be affected by such laws as the Resource Conservation and Recovery Act (“RCRA”), the Comprehensive Environmental Response, Compensation, and Liability Act (“CERCLA”), the Clean Water Act, and the Occupational Safety and Health Act (“OSHA”) of 1970. Further, our customers may be subject to a range of laws and regulations governing hydraulic fracturing, offshore drilling, and greenhouse gas emissions.We are required to invest financial and managerial resources to comply with environmental laws and regulations and believe that we will continue to be required to do so in the future. Failure to comply with these laws and regulations may result in the assessment of administrative, civil and criminal penalties, the imposition of remedial obligations, or the issuance of orders enjoining operations. These laws and regulations, as well as the adoption of other new laws and regulations affecting exploration and production of crude oil and natural gas by our customers, could adversely affect our business and operating results by increasing our costs, limiting the demand for our products and services or restricting our operations. Increased regulation or a move away from the use of fossil fuels caused by additional regulation could also reduce demand for our products and services. For additional information, please see “Item 1. Business—Environmental, Health and Safety Regulation.” The operations of the energy industry, including those undertaking hydraulic fracturing, are also subject to wildlife‑protection laws and regulations, such as the Migratory Bird Treaty Act (“MBTA”) or the Endangered Species Act, which may impact exploration, development, and production activities through regulations intended to protect certain species. For example, regulations under the MBTA sometimes require companies to cover reserve pits that are open for more than 90 days to prevent the taking of birds.Concerns over general economic, business or industry conditions may have a material adverse effect on our results of operations, financial condition and liquidity.Concerns over global economic conditions, energy costs, geopolitical issues, inflation, the availability and cost of credit and the European, Asian and the United States financial markets have contributed to increased economic uncertainty and diminished expectations for the global economy. These factors, combined with volatility in commodity prices, business and consumer confidence and unemployment rates, have precipitated an economic slowdown. Concerns about global economic growth have had a significant adverse impact on global financial markets and commodity prices. If the economic climate in the United States or abroad deteriorates, worldwide demand for petroleum products could diminish further, which could impact the price at which oil, natural gas and natural gas liquids can be sold, which could affect the ability of our customers to continue operations and ultimately adversely impact our results of operations, financial condition and liquidity.21condition.A terrorist attackcondition and cash flows.armed conflictinterpreted in such a manner that the incremental cost of compliance could harmadversely impact our business.occurrenceU.S. Foreign Corrupt Practices Act, among others, applies to us and our operations. Our policies, procedures and programs may not always protect us from reckless or threatcriminal acts committed by our employees or agents, and severe criminal or civil sanctions may be imposed as a result of terrorist attacksviolations of these laws. We are also subject to the risks that our employees and agents outside of the United States may fail to comply with applicable laws.or otherand foreign countries anti‑terrorist effortsaffect the equipment, systems and other armed conflicts involvingservices we design, market and sell, as well as the United States or other countries, including continued hostilitiesfacilities where we manufacture and produce our equipment and systems in the Middle East, may adversely affect the United States and global economiesChina, and could prevent us from meetingopportunities our customers pursue that create demand for our products. For example, we or our products may be affected by such laws as the Resource Conservation and Recovery Act, the Comprehensive Environmental Response, Compensation, and Liability Act, the Clean Water Act, the Clean Air Act and the Occupational Safety and Health Act of 1970. Further, our customers may be subject to a range of laws and regulations governing hydraulic fracturing, drilling and greenhouse gas emissions.obligations. If anynew laws and regulations affecting our operations or the exploration and production and transportation of these events occur,crude oil and natural gas by our customers, could adversely affect our business and operating results by increasing our costs of compliance, increasing the resulting political instabilitycosts of compliance and societal disruptioncosts of doing business for our customers, limiting the demand for our products and services or restricting our operations. Increased regulation or a move away from the use of fossil fuels caused by additional regulation could also reduce overalldemand for our products and services.gas, potentially putting downward pressuregas. Likewise, such laws or regulations may result in additional compliance obligations with respect to the release, capture, sequestration, and use of greenhouse gases. These additional obligations could increase our costs and have a material adverse effect on our business, results of operations, prospects, and financial condition. Additional compliance obligations could also increase costs of compliance and costs of doing business for our customers, thereby reducing demand for our servicesproducts and causingservices. Finally, increasing concentrations of greenhouse gases in the Earth’s atmosphere may produce climate changes that could have significant physical effects, such as increased frequency and severity of storms, droughts, floods and other climatic events; if such effects were to occur, they could have an adverse impact on our operations.reductionbyproduct of hydraulic fracturing into disposal wells. The ban will require oil and gas production companies to find other options to handle the wastewater, which may include piping or trucking it longer distances to other locations not under the ban. In addition, the Texas Railroad Commission has overseen the development of well-operator-led response plans to reduce injection volumes in our revenues. Oilother portions of West Texas in order to reduce seismicity in these areas. The adoption of new laws or regulations at the federal, state, local or foreign level imposing reporting obligations on, or otherwise limiting, delaying or banning, the hydraulic fracturing process or other processes on which hydraulic fracturing and subsequent hydrocarbon production relies, such as water disposal, could make it more difficult to complete oil and natural gas wells. Further, it could increase our customers’ costs of compliance and doing business, and otherwise adversely affect the hydraulic fracturing services they perform, which could negatively impact demand for our products.facilitiesto ESG in public discourse and the investment community. A number of advocacy groups, both domestically and internationally, have campaigned for governmental and private action to promote change at public companies related to ESG matters, including through the investment and voting practices of investment advisers, public pension funds, universities and other members of the investing community. These activities include increasing attention and demands for action related to climate change and energy rebalancing matters, such as promoting the use of substitutes to fossil fuel products and encouraging the divestment of fossil fuel equities, as well as pressuring lenders and other financial services companies to limit or curtail activities with fossil fuel companies. If this were to continue, it could have a material adverse effect on the valuation of our Class A common stock and our ability to access equity capital markets.direct targetsimpacted by initiatives to address greenhouse gases and climate change and public pressure to conserve energy or use alternative energy sources. State or federal initiatives to incentivize a shift away from fossil fuels could also reduce demand for hydrocarbons. For example, in August 2022, the Inflation Reduction Act was signed into law. The Inflation Reduction Act appropriates significant federal funding for the development of terrorist attacks,renewable energy, clean hydrogen, clean fuels, electric vehicles and supporting infrastructure and carbon capture and sequestration, amongst other provisions. In addition, the Inflation Reduction Act imposes the first ever federal fee on the emission of GHG through a methane emissions charge. The Inflation Reduction Act amends the federal Clean Air Act to impose a fee on the emission of methane from sources required to report their GHG emissions to the EPA, including those sources in the onshore petroleum and natural gas production categories. These developments could further accelerate the transition of the U.S. economy away from the use of fossil fuels towards lower- or zero-carbon emissions alternatives, which would reduce demand for our operations could be adversely impacted if infrastructure integral toproducts and services and negatively impact our customers’ operations is destroyedbusiness.damaged. Costs for insurance and other security may increase as a result of these threats, and some insurance coverage may become more difficult to obtain, if available at all.If we are unable to fully protect our intellectual property rights or trade secrets, we may suffer a loss in our competitive advantage or market share.We do not have patents relating to many of our key processes and technology. If we are not able to maintain the confidentiality of our trade secrets, or if our customers or competitors are able to replicate our technology or services, our competitive advantage would be diminished. We also cannot assure you that any patents we may obtainoutbreaks in the future would provide us with any significant commercial benefitmay have, an adverse impact on our business and operations.would allow ustemporary idling of certain of our manufacturing and service facilities due to preventa number of factors, including implementing additional safety measures, testing of our competitors from employing comparable technologies or processes.22
team members, team member absenteeism and governmental orders. A prolonged closure could have a material adversecompany. Ourcompany whose only material asset is our equity interest in Cactus LLC,Companies, and accordingly, we are dependent upon distributions from Cactus LLCCompanies to pay taxes, make payments under the Tax Receivable AgreementTRA and cover our corporate and other overhead expenses.LLC.Companies. We have no independent means of generating revenue. To the extent Cactus LLCCompanies has available cash and subject to the terms of any current or future credit agreements or debt instruments, we intend to cause Cactus LLCCompanies to make (i) generally pro rata distributions to its unitholders,unit holders, including us, in an amount at least sufficient to allow us to pay our taxes and to make payments under the Tax Receivable AgreementTRA and (ii) non‑pro rata payments to us to reimburse us for our corporate and other overhead expenses. To the extent that we need funds and Cactus LLCCompanies or its subsidiaries are restricted from making such distributions or payments under applicable law or regulation or under the terms of any future financing arrangements, or are otherwise unable to provide such funds, our financial condition and liquidity could be materially adversely affected.Tax Receivable AgreementTRA is dependent on the ability of Cactus LLCCompanies to make distributions to us in an amount sufficient to cover our obligations under the Tax Receivable Agreement.TRA. This ability, in turn, may depend on the ability of Cactus LLC’sCompanies’ subsidiaries to make distributions to it. The ability of Cactus LLC,Companies and its subsidiaries and other entities in which it directly or indirectly holds an equity interest to make such distributions will be subject to, among other things, (i) the applicable provisions of Delaware law (or other applicable U.S. and foreign jurisdictions) that may limit the amount of funds available for distribution and (ii) restrictions in relevant debt instruments issued by Cactus LLCCompanies or its subsidiaries and other entities in which it directly or indirectly holds an equity interest.subsidiaries. To the extent that we are unable to make payments under the Tax Receivable AgreementTRA for any reason, such payments will be deferred and will accrue interest until paid.The requirements of being a public company, including compliance with the reporting requirements of the Exchange Act, and the requirements of the Sarbanes‑Oxley Act, may strain our resources, increase our costs and distract management, and we may be unable to comply with these requirements in a timely or cost‑effective manner.As a public company, we need to comply with new laws, regulations and requirements, certain corporate governance provisions of the Sarbanes‑Oxley Act of 2002, related regulations of the SEC, including filing quarterly and annual financial statements, and the requirements of the NYSE, with which we were not required to comply as a private company. Complying with these statutes, regulations and requirements will occupy a significant amount of time of our board of directors and management and will significantly increase our costs and expenses. We need to:·institute a more comprehensive compliance function, including for financial reporting and disclosures;·comply with rules promulgated by the NYSE;·continue to prepare and distribute periodic public reports in compliance with our obligations under the federal securities laws;·enhance our investor relations function;·establish new internal policies, such as those relating to insider trading; and·involve and retain to a greater degree outside counsel and accountants in the above activities.23The changes necessitated by becoming a public company require a significant commitment of resources and management oversight that has increased, and may continue to increase, our costs and might place a strain on our systems and resources. Such costs could have a material adverse effect on our business, results of operations and financial condition.Furthermore, while we generally must comply with Section 404 of the Sarbanes‑Oxley Act of 2002 for our fiscal year ending December 31, 2018, we are not required to have our independent registered public accounting firm attest to the effectiveness of our internal controls until our first annual report subsequent to our ceasing to be an “emerging growth company” within the meaning of Section 2(a)(19) of the Securities Act. Accordingly, we may not be required to have our independent registered public accounting firm attest to the effectiveness of our internal controls until as late as our annual report for the fiscal year ending December 31, 2023, although this could be required earlier. Once it is required to do so, our independent registered public accounting firm may issue a report that is adverse in the event it is not satisfied with the level at which our controls are documented, designed, operated or reviewed. Compliance with these requirements may strain our resources, increase our costs and distract management, and we may be unable to comply with these requirements in a timely or cost‑effective manner.In addition, we expect that being a public company subject to these rules and regulations may make it more difficult and more expensive for us to obtain director and officer liability insurance, and we may be required to accept reduced policy limits and coverage or incur substantially higher costs to obtain the same or similar coverage. As a result, it may be more difficult for us to attract and retain qualified individuals to serve on our board of directors or as executive officers. We are currently evaluating these rules, and we cannot predict or estimate the amount of additional costs we may incur or the timing of such costs.In the past, we identified a material weakness in our internal control over financial reporting and may identify additional material weaknesses in the future. Material weaknesses could affect the reliability of our financial statements and may cause to us to fail to meet our reporting obligations or fail to prevent fraud, which would harm our business and could negatively impact the price of our Class A Common Stock.Effective internal control over financial reporting is necessary for us to provide reliable financial reports and prevent or detect fraud. If we cannot provide reliable financial reports or prevent fraud, our reputation and operating results would be harmed. A material weakness is a deficiency, or a combination of deficiencies, in internal control over financial reporting, such that there is a reasonable possibility that a material misstatement of our annual or interim financial statements will not be prevented or detected on a timely basis.In connection with the audit of the consolidated financial statements of Cactus LLC, our predecessor for accounting purposes, for the year ended December 31, 2016, we identified a material weakness in our internal control over financial reporting. We did not effectively operate controls in place over the review of the consolidated financial statements and related disclosures. This resulted in the identification of certain errors in the consolidated statement of cash flows that have been corrected as a revision of that statement. Please read “Item 9A. Remediation of Material Weakness in Internal Control Over Financial Reporting.” The material weakness described above or any newly identified material weakness could result in a material misstatement of our annual or interim consolidated financial statements that would not be prevented or detected.In addition, neither our management nor an independent registered public accounting firm has performed an evaluation of our internal control over financial reporting in accordance with the provisions of the Sarbanes‑Oxley Act because no such evaluation has been required. Had we or our independent registered public accounting firm performed an evaluation of our internal control over financial reporting in accordance with the provisions of the Sarbanes‑Oxley Act, additional material weaknesses may have been identified.24Material weaknesses could affect the reliability of our financial statements and may cause to us to fail to meet our reporting obligations or fail to prevent fraud, which would harm our business, and could negatively impact investor perceptions. This could negatively impact the price of our Class A Common Stock.Additionally, our reporting obligations as a public company will place a significant strain on our management, operational and financial resources and systems for the foreseeable future and may cause us to fail to timely achieve and maintain the adequacy of our internal control over financial reporting. Please see “—The requirements of being a public company, including compliance with the reporting requirements of the Exchange Act and the requirements of the Sarbanes‑Oxley Act, may strain our resources, increase our costs and distract management, and we may be unable to comply with these requirements in a timely or cost‑effective manner.”Our stock price may be volatile.The market price of our Class A Common Stock could fluctuate significantly as a result of a number of factors, some of which are beyond our control. In the event of a drop in the market price of our Class A Common Stock, you could lose a substantial part or all of your investment in our Class A Common Stock. The following factors could affect our stock price:·our operating and financial performance;·quarterly variations in the rate of growth of our financial indicators, such as net income per share, net income and revenues;·the public reaction to our press releases, our other public announcements and our filings with the SEC;·strategic actions by our competitors;·changes in revenue or earnings estimates, or changes in recommendations or withdrawal of research coverage, by equity research analysts;·speculation in the press or investment community;·the failure of research analysts to cover our Class A Common Stock;·sales of our Class A Common Stock by us or the perception that such sales may occur;·changes in accounting principles, policies, guidance, interpretations or standards;·additions or departures of key management personnel;·actions by our shareholders;·general market conditions, including fluctuations in commodity prices;·domestic and international economic, legal and regulatory factors unrelated to our performance; and·the realization of any risks described under this “Risk Factors” section.25The stock markets in general have experienced extreme volatility that has often been unrelated to the operating performance of particular companies. These broad market fluctuations may adversely affect the trading price of our Class A Common Stock. Securities class action litigation has often been instituted against companies following periods of volatility in the overall market and in the market price of a company’s securities. Such litigation, if instituted against us, could result in very substantial costs, divert our management’s attention and resources and harm our business, results of operations and financial condition.Cadent and Cactus WH Enterprises will haveLLC has the ability to direct the voting of a majoritysignificant percentage of the voting power of our common stock, and theirits interests may conflict with those of our other shareholders.Common Stockcommon stock and Class B Common Stockcommon stock vote together as a single class on all matters presented to our shareholdersstockholders for their vote or approval, except as otherwise required by applicable law or our amended and restated certificate of incorporation. Cadent ownsCactus WH Enterprises owned approximately 49.2% of our Class B common stock (representing 31.8%18% of our voting power) and Cactus WH Enterprises owns approximately 46.6%power as of our Class B common stock (representing 30.2% of our voting power).As a result, Cadent and Cactus WH Enterprises will be able to control matters requiring shareholder approval, including the election of directors, changes to our organizational documents and significant corporate transactions.December 31, 2022. This concentration of ownership makes it unlikely that any holder or group of holders of our Class A Common Stock will be ablemay limit a stockholder’s ability to affect the way we are managed or the direction of our business. The interests of Cadent and Cactus WH Enterprises with respect to matters potentially or actually involving or affecting us, such as future acquisitions, financings and other corporate opportunities and attempts to acquire us, may conflict with the interests of our other shareholders. Cadent and Cactus WH Enterprises would have to approve any potential acquisition of us. In addition, one of our directors is currently a partner of Cadent Energy Partners. This director’s duties as a partner of Cadent Energy Partners may conflict with his duties as our director, and the resolution of these conflicts may not always be in our or your best interest.stockholders. Furthermore, in connection with our IPO, we entered into a stockholders’ agreement with Cadent and Cactus WH Enterprises. Among other things, the stockholders’ agreement, as amended, provides each of Cadent and Cactus WH Enterprises with the right to designate a certain number of nominees to our board of directors so long as they and their respective affiliates collectively beneficially own at least 5% of the outstanding shares of our common stock. The existence of significant shareholdersstockholders and the stockholders’ agreement may have the effect of deterring hostile takeovers, delaying or preventing changes in control orshareholdersstockholders to approve transactions that they may deem to be in our best interests. Cadent and Cactus WH Enterprises’ concentration of stock ownership may also adversely affect the trading price of our Class A Common Stockcommon stock to the extent investors perceive a disadvantage in owning stock of a company with significant shareholders.Certain of our directors have significant duties with, and spend significant time serving, entities that may compete with us in seeking acquisitions and business opportunities and, accordingly, may have conflicts of interest in allocating time or pursuing business opportunities.Certain of our directors, who are responsible for managing the direction of our operations and acquisition activities, hold positions of responsibility with other entities (including Cadent and its affiliated entities) whose businesses are similar to our business. The existing positions held by these directors may give rise to fiduciary or other duties that are in conflict with the duties they owe to us. These directors may become aware of business opportunities that may be appropriate for presentation to us as well as to the other entities with which they are or may become affiliated. Due to these existing and potential future affiliations, they may present potential business opportunities to other entities prior to presenting them to us, which could cause additional conflicts of interest. They may also decide that certain opportunities are more appropriate for other entities with which they are affiliated, and as a result, they may elect not to present those opportunities to us. These conflicts may not be resolved in our favor.26Cadent and its affiliates are not limited in their ability to compete with us, and the corporate opportunity provisions in our amended and restated certificate of incorporation could enable Cadent to benefit from corporate opportunities that might otherwise be available to us.Our governing documents provide that Cadent and its affiliates (including portfolio investments of Cadent and its affiliates) are not restricted from owning assets or engaging in businesses that compete directly or indirectly with us. In particular, subject to the limitations of applicable law, our amended and restated certificate of incorporation, among other things:·permits Cadent and its affiliates, including any of our directors affiliated with Cadent, to conduct business that competes with us and to make investments in any kind of business, asset or property in which we may make investments; and·provides that if Cadent or its affiliates, including any of our directors affiliated with Cadent, becomes aware of a potential business opportunity, transaction or other matter, they will have no duty to communicate or offer that opportunity to us (unless such opportunity is expressly offered to such director in his capacity as one of our directors).Cadent and its affiliates, or our non‑employee directors, may become aware, from time to time, of certain business opportunities (such as, among other things, acquisition opportunities) and may direct such opportunities to other businesses in which they have invested, in which case we may not become aware of or otherwise have the ability to pursue such opportunity. Further, such businesses may choose to compete with us for these opportunities, possibly causing these opportunities to not be available to us or causing them to be more expensive for us to pursue. In addition, Cadent and its affiliates, or our non‑employee directors, may dispose of assets owned by them in the future, without any obligation to offer us the opportunity to purchase any of those assets. As a result, our renouncing our interest and expectancy in any business opportunity that may be from time to time presented to Cadent and its affiliates, or our non‑employee directors, could adversely impact our business or prospects if attractive business opportunities are procured by such parties for their own benefit rather than for ours.Cadent and its affiliates potentially have access to resources greater than ours, which may make it more difficult for us to compete with Cadent and its affiliates with respect to commercial activities as well as for potential acquisitions. We cannot assure you that any conflicts that may arise between us and our shareholders, on the one hand, and Cadent, on the other hand, will be resolved in our favor. As a result, competition from Cadent and its affiliates could adversely impact our results of operations.Common Stock.·limitations on the removal of directors;·limitations on the ability of our shareholders to call special meetings;27
•establishing advance notice provisions for shareholder proposals and nominations for elections to the board of directors to be acted upon at meetings of shareholders;
•establishing advance notice and certain information requirements for nominations for election to our board of directors or for proposing matters that can be acted upon by shareholders at shareholder meetings.·establishing advance notice provisions for shareholder proposals and nominations for elections to the board of directors to be acted upon at meetings of shareholders;·providing that the board of directors is expressly authorized to adopt, or to alter or repeal our bylaws; and·establishing advance notice and certain information requirements for nominations for election to our board of directors or for proposing matters that can be acted upon by shareholders at shareholder meetings.Tax Receivable Agreement,TRA, which could be substantial and accordingly serve as a disincentive to a potential acquirer of our company. Please see “—In certain cases, payments under the Tax Receivable Agreement may be accelerated and/or significantly exceed the actual benefits, if any, we realize in respect of the tax attributes subject to the Tax Receivable Agreement.”Our amended and restated certificate of incorporation designates the Court of Chancery of the State of Delaware as the sole and exclusive forum for certain types of actions and proceedings that may be initiated by our shareholders, which could limit our shareholders’ ability to obtain a favorable judicial forum for disputes with us or our directors, officers, employees or agents.Our amended and restated certificate of incorporation provides that, unless we consent in writing to the selection of an alternative forum, the Court of Chancery of the State of Delaware will, to the fullest extent permitted by applicable law, be the sole and exclusive forum for (i) any derivative action or proceeding brought on our behalf, (ii) any action asserting a claim of breach of a fiduciary duty owed by any of our directors, officers, employees or agents to us or our shareholders, (iii) any action asserting a claim arising pursuant to any provision of the Delaware General Corporation Law (the “DGCL”), our amended and restated certificate of incorporation or our bylaws, or (iv) any action asserting a claim against us that is governed by the internal affairs doctrine, in each such case subject to such Court of Chancery having personal jurisdiction over the indispensable parties named as defendants therein. Any person or entity purchasing or otherwise acquiring any interest in shares of our capital stock will be deemed to have notice of, and consented to, the provisions of our amended and restated certificate of incorporation described in the preceding sentence. This choice of forum provision may limit a shareholder’s ability to bring a claim in a judicial forum that it finds favorable for disputes with us or our directors, officers, employees or agents, which may discourage such lawsuits against us and such persons. Alternatively, if a court were to find these provisions of our amended and restated certificate of incorporation inapplicable to, or unenforceable in respect of, one or more of the specified types of actions or proceedings, we may incur additional costs associated with resolving such matters in other jurisdictions, which could adversely affect our business, results of operations and financial condition.Common Stockcommon stock in the public market, or the perception that such sales may occur, could reduce our stock price, and any additional capital raised by us through the sale of equity or convertible securities may dilute your ownership in us.CWCC Unit Holders may cause Cactus LLCCompanies to redeem their CWCC Units for shares of Class A Common Stockcommon stock (on a one‑for‑one basis, subject to conversion rate adjustments for stock splits, stock dividends and reclassification and other similar transactions) and then sell those shares of Class A Common Stock.common stock. Additionally, we may issue additional shares of Class A Common Stockcommon stock or convertible securities in subsequent public offerings. We have 26,450,000had 64,127,114 outstanding shares of Class A Common Stockcommon stock and 48,439,77214,978,225 outstanding shares of Class B Common Stock.common stock as of February 27, 2023. The CWCC Unit Holders own 48,439,772all outstanding shares of our Class B Common Stock,common stock, representing approximately 64.7%19% of our total outstanding common stock. All suchB Common Stock are restricted from immediate resale under the federal securities laws and are subject to the lock‑up agreements between such parties and the underwriters but may be sold into the market in the future. Cadent andA common stock owned by Cactus WH Enterprises, are party to a registration rights agreement between usLee Boquet and the Pre-IPO Owners, which will require us to effect the registrationcertain members of theirour board of directors. See “Item 13. Certain Relationships and Related Party Transactions, and Director Independence—Stockholders’ Agreement” for more information. 28shares in certain circumstances no earlier than the expiration of the lock‑up period contained in the underwriting agreement entered into in connection with our IPO.Common Stockcommon stock or securities convertible into Class A Common Stockcommon stock or the effect, if any, that future issuances and sales of shares of our Class A Common Stockcommon stock will have on the market price of our Class A Common Stock.common stock. Sales of substantial amounts of our Class A Common Stockcommon stock (including shares issued in connection with an acquisition), or the perception that such sales could occur, may adversely affect prevailing market prices of our Class A Common Stock.Under certain circumstances, redemptions of CW Units by CW Unit Holders will result in dilution to the holders of our Class A Common Stock.Redemptions of CW Units by CW Unit Holders in accordance with the terms of the Cactus Wellhead LLC Agreement will result in a corresponding increase in our membership interest in Cactus LLC, increase in the number of shares of Class A Common Stock outstanding and decrease in the number of shares of Class B Common Stock outstanding. In the event that CW Units are exchanged at a time when Cactus LLC has made cash distributions to CW Unit Holders, including Cactus Inc., and Cactus Inc. has accumulated such distributions and neither reinvests them in Cactus LLC in exchange for additional CW Units nor distributes them as dividends to the holders of Cactus Inc.’s Class A Common Stock, the holders of our Class A Common Stock would experience dilution with respect to such accumulated distributions.Tax Receivable AgreementTRA for certain tax benefits that we may claim, and the amounts of such payments could be significant.a Tax Receivable Agreement with the TRA Holders.with certain direct and indirect owners of Cactus LLC (the “TRA Holders”). Following completion of the CC Reorganization, the TRA Holders are certain direct and indirect owners of Cactus Companies and prior direct and indirect owners of Cactus LLC. This agreement will generally provideprovides for the payment by Cactus Inc. to theeach TRA HoldersHolder of 85% of the net cash savings, if any, in U.S. federal, state and local income tax and franchise tax that Cactus Inc. actually realizes or is deemed to realize in certain circumstances as a result of certain increases in tax basisTax Receivable AgreementTRA will continue until all tax benefits that are subject to the Tax Receivable AgreementTRA have been utilized or expired, unless we exercise our right to terminate the Tax Receivable AgreementTRA (or the Tax Receivable AgreementTRA is terminated due to other circumstances, including our breach of a material obligation thereunder or certain mergers or other changes of control)control relating to Cactus Companies), and we make the termination payment specified in the Tax Receivable Agreement.TRA. In addition, payments we make under the Tax Receivable AgreementTRA will be increased by any interest accrued from the due date (without extensions) of the corresponding tax return. InPayments under the TRA commenced in 2019, and in the event that the Tax Receivable AgreementTRA is not terminated, the payments under the Tax Receivable AgreementTRA are anticipated to commence in 2019 and to continue for 16approximately 20 years after the date of the last redemption of CWCC Units.Tax Receivable AgreementTRA are our obligations and not obligations of Cactus LLC,Companies, and we expect that the payments we will be required to make under the Tax Receivable AgreementTRA will be substantial. Estimating the amount and timing of payments that may become due under the Tax ReceivableTRA Agreement is by its nature imprecise. For purposes of the Tax Receivable Agreement,TRA, cash savings in tax generally are calculated by comparing our actual tax liability (determined by using the actual applicable U.S. federal income tax rate and an assumed combined state and local income tax rate) to the amount we would have been required to pay had we not been able to utilize any of the tax benefits subject to the Tax Receivable Agreement.TRA. The amounts payable, as well as the timing of any payments under the Tax Receivable Agreement,TRA, are dependent upon significant future events and assumptions, including the timing of the redemption of CWCC Units, the price of our Class A Common Stockcommon stock at the time of each redemption, the extent to which such redemptions are taxable transactions, the amount of the redeeming unit holder’s tax basis in its CWCC Units at the time of the relevant redemption, the depreciation and amortization periods that29Tax Receivable AgreementTRA that constitute imputed interest or give rise to depreciable or amortizable tax basis. The payments under the Tax Receivable Agreement willTRA are not be conditioned upon a holder of rights under the Tax Receivable AgreementTRA having a continued ownership interest in us.Tax Receivable AgreementTRA may be accelerated and/or significantly exceed the actual benefits, if any, we realize in respect of the tax attributes subject to the Tax Receivable Agreement.Tax Receivable AgreementTRA early or it is terminated early due to Cactus Inc.’s failure to honor a material obligation thereunder or due to certain mergers or other changes of control, our obligations under the Tax Receivable AgreementTRA would accelerate and we would be required to make an immediate payment equal to the present value of the anticipated future payments to be made by us under the Tax Receivable AgreementTRA (determined by applying a discount rate of one‑year LIBOR plus 150 basis points) and such payment is expected to be substantial. The calculation of anticipated future payments will be based upon certain assumptions and deemed events set forth in the Tax Receivable Agreement,TRA, including (i) the assumption that we have sufficient taxable income to fully utilize the tax benefits covered by the Tax Receivable AgreementTRA and (ii) the assumption that any CWCC Units (other than those held by Cactus Inc.) outstanding on the termination date are deemed to be redeemed on the termination date. Any early termination payment may be made significantly in advance of the actual realization, if any, of the future tax benefits to which the termination payment relates.Tax Receivable AgreementTRA that exceed our actual cash tax savings under the Tax Receivable Agreement.TRA. In these situations, our obligations under the Tax Receivable AgreementTRA could have a substantial negative impact on our liquidity and could have the effect of delaying, deferring or preventing certain mergers, asset sales, or other forms of business combinations or changes of control. If the TRA were terminated as of December 31, 2022, the estimated termination payments, based on the assumptions discussed above, would have been approximately $291.2 million (calculated using a discount rate equal to one-year LIBOR plus 150 basis points, applied against an undiscounted liability of approximately $456.6 million). The foregoing number is merely an estimate and the actual payment could differ materially. There can be no assurance that we will be able to finance our obligations under the Tax Receivable Agreement.Tax Receivable Agreement will beTRA are based on the tax reporting positions that we will determine. The TRA Holders will not reimburse us for any payments previously made under the Tax Receivable AgreementTRA if any tax benefits that have given rise to payments under the Tax Receivable AgreementTRA are subsequently disallowed, except that excess payments made to any TRA Holder will be netted against payments that would otherwise be made to such TRA Holder, if any, after our determination of such excess. As a result, in some circumstances, we could make payments that are greater than our actual cash tax savings, if any, and may not be able to recoup those payments, which could adversely affect our liquidity.LLCCompanies were to become a publicly traded partnership taxable as a corporation for U.S. federal income tax purposes, we and Cactus LLCCompanies might be subject to potentially significant tax inefficiencies, and we would not be able to recover payments previously made by us under the Tax Receivable AgreementTRA even if the corresponding tax benefits were subsequently determined to have been unavailable due to such status.LLCCompanies does not become a publicly traded partnership taxable as a corporation for U.S. federal income tax purposes. A “publicly traded partnership” is a partnership the interests of which are traded on an established securities market or are readily tradable on a secondary market or the substantial equivalent thereof. Under certain circumstances, redemptions of CWCC Units pursuant to the Redemption Right (oror our Call Right)Right (each as defined in Note 10 in the notes to the Consolidated Financial Statements) or other transfers of CWCC Units could cause Cactus LLCCompanies to be treated as a publicly traded partnership. Applicable U.S. Treasury regulations provide for certain safe harbors from treatment as a publicly traded partnership, and we intend to operate such that one or more such safe harbors shall apply. For example, we intend to limit the number of unitholdersunit holders of Cactus LLC,Companies, and the Cactus Wellhead LLC Agreement, which was entered into in connection with the closing of our IPO, provides for limitations on the ability of CWCC Unit Holders to transfer their CWCC Units and provides us, as managing30LLC,Companies, with the right to impose restrictions (in addition to those already in place) on the ability of unitholdersunit holders of Cactus LLCCompanies to redeem their CWCC Units pursuant to the Redemption Right to the extent we believe it is necessary to ensure that Cactus LLCCompanies will continue to be treated as a partnership for U.S. federal income tax purposes.LLCCompanies were to become a publicly traded partnership, significant tax inefficiencies might result for us and for Cactus LLC,Companies, including as a result of our inability to file a consolidated U.S. federal income tax return with Cactus LLC.Companies. In addition, we would no longer have the benefit of certain increases in tax basis covered under the Tax Receivable Agreement,TRA, and we would not be able to recover any payments previously made by us under the Tax Receivable Agreement,TRA, even if the corresponding tax benefits (including any claimed increase in the tax basis of Cactus LLC’sCompanies’ assets) were subsequently determined to have been unavailable.Cactus Inc.we fail to achieve some or all of the benefits expected to result from the Merger, or if such benefits are delayed, our business could be harmed.deemedbased upon preliminary estimates, to record the FlexSteel identifiable assets to be an investment companyacquired and liabilities to be assumed at fair value, and the resulting goodwill to be recognized. The purchase price allocation reflected was preliminary, and final allocation of the purchase price will be based upon the actual purchase price and the fair value of the assets acquired and liabilities assumed in the Merger. The unaudited pro forma condensed combined financial information was also based on a number of other estimates and assumptions, including estimates and assumptions of the type and terms of a portion of the debt to be incurred to finance a portion of the purchase price payable under the Investment Company ActMerger Agreement and pay fees and expenses related to the Merger and the related transactions. To the extent the type or terms of 1940,the new debt actually incurred differ materially from the estimates and assumptions set out in the unaudited pro forma condensed combined financial information, our actual results and financial condition after the completion of the Merger would differ materially from the results and financial condition contemplated by the unaudited pro forma condensed combined financial information.amended (the “1940 Act”),Exhibits 99.1 and 99.2 to our Form 8-K filed with the SEC on January 10, 2023 may not be indicative of the financial position or results of operations that the combined company will achieve in the future. FlexSteel’s operations are subject to many of the same risks as aour historical operations, any of which may also adversely affect the combined company’s business, operating results, financial condition and prospects.its ownershipmanagement, the loss of Cactus LLC, applicable restrictionskey employees from either company, the disruption of each company’s ongoing businesses, tax costs or inefficiencies, or inconsistencies in standards, controls, information technology systems, procedures and policies, any of which could make it impractical for Cactus Inc.adversely affect our ability to continue itsmaintain relationships with customers, employees or other third parties, or our ability to achieve the anticipated benefits of the Merger, and could harm our financial performance. If we are unable to successfully or timely integrate the operations of FlexSteel with our business, as contemplatedwe may incur unanticipated liabilities and be unable to realize the revenue growth and other anticipated benefits resulting from the Merger, and our business, results of operations and financial condition could be materially and adversely affected.its business.Under Sections 3(a)(1)(A)our business, financial condition and (C)results of the 1940 Act, a company generally will be deemedoperations. As we integrate FlexSteel into our operations, we may learn additional information about FlexSteel, such as unknown or contingent liabilities and issues relating to becompliance with applicable laws, that could potentially have an “investment company” for purposesadverse effect on our business, financial condition and results of the 1940 Act if (i) it is, or holds itself out as being, engaged primarily, or proposes to engage primarily, in the business of investing, reinvesting or trading in securities or (ii) it engages, or proposes to engage, in the business of investing, reinvesting, owning, holding or trading in securities and it owns or proposes to acquire investment securities having a value exceeding 40% of the value of its total assets (exclusive of U.S. government securities and cash items) on an unconsolidated basis. operations. do not believe that Cactus Inc. is an “investment company,” as such term is defined in either of those sections of the 1940 Act. As the sole managing member of Cactus LLC, Cactus Inc. will control and operate Cactus LLC. On that basis, we believe that Cactus Inc.’s interest in Cactus LLC is not an “investment security” as that term is used in the 1940 Act. However, if Cactus Inc. were to cease participation in the management of Cactus LLC, its interest in Cactus LLC could be deemed an “investment security” for purposes of the 1940 Act. Cactus Inc. and Cactus LLC intend to conduct their operations so that Cactus Inc. will not be deemed an investment company. However, if Cactus Inc. wereable to enforce claims with respect to the representations and warranties that the sellers of FlexSteel provided under the Merger Agreement.deemed an investment company, restrictions imposedable to enforce any claims against the sellers including any claims relating to breaches of such representations and warranties. The sellers’ liability with respect to breaches of their representations and warranties under the Merger Agreement is limited. To provide for coverage against certain breaches by the 1940 Act, including limitationssellers of its representations and warranties and certain pre-closing taxes of FlexSteel, we have obtained a representation and warranty insurance policy. The policy is subject to a retention amount, exclusions, policy limits and certain other customary terms and conditions.Inc.’s capital structureCompanies’ and each of its subsidiaries’ ability to, among other things, incur additional indebtedness and create liens, make investments or loans, merge or consolidate with other companies, sell assets, make certain restricted payments and distributions, and engage in transactions with affiliates. The obligations under the Amended ABL Credit Facility are guaranteed by certain subsidiaries of Cactus Companies and secured by a security interest in accounts receivable, inventory, equipment and certain other real and personal property assets of Cactus Companies and its subsidiaries. If Cactus Companies fails to perform its obligations under the Amended ABL Credit Facility, (i) the revolving commitments under the Amended ABL Credit Facility could be terminated, (ii) any outstanding borrowings under the Amended ABL Credit Facility may be declared immediately due and payable and (iii) the lenders may commence foreclosure or other actions against the collateral. The repayment and other obligations under the Amended ABL Credit Facility may also limit free cash flow available for other corporate purposes, including capital expenditures or paying dividends.transact with affiliates,expand and update this infrastructure in response to our changing needs. Despite our implementation of security measures, our systems are vulnerable to damage from computer viruses, natural disasters, incursions by intruders or hackers, failures in hardware or software, power fluctuations, cyber terrorists and other similar disruptions. Additionally, we rely on third parties to support the operation of our IT hardware and software infrastructure, and in certain instances, utilize web‑based applications. The failure of our IT systems or those of our vendors to perform as anticipated for any reason or any significant breach of security could make it impractical for Cactus Inc. to continue itsdisrupt our business as contemplated and result in numerous adverse consequences, including reduced effectiveness and efficiency of operations, inappropriate disclosure of confidential and proprietary information, reputational harm, increased overhead costs and loss of important information, which could have a material adverse effect on its business.Weour business and results of operations. In addition, we may issue preferred stock whose terms could adversely affectbe required to incur significant costs to protect against damage caused by these disruptions or security breaches in the voting power or valuefuture.Common Stock.Our amended and restated certificatecommon stock may not receive dividends on their Class A common stock. incorporation authorizes us to issue, without the approval of our shareholders, one or more classes or series of preferred stock having such designations, preferences, limitations and relative rights, including preferences over our Class A Common Stock respectingcommon stock are entitled to receive only such dividends and distributions, as our board of directors may determine. The termsdeclare out of one or more classes or series of preferred stock could adversely impact the voting power or value of our Class A Common Stock. For example, we might grant holders of preferred stock the right to elect some number of our directors in all events or on the happening of specified events or the right to veto specified transactions. Similarly, the repurchase or redemption rights or liquidation preferences we might assign to holders of preferred stock could affect the residual value of the Class A Common Stock.a “controlled company” within the meaning of the NYSE rulesincorporated in Delaware and as a result, will qualify for and intend to rely on exemptions from certain corporate governance requirements.Cadent and Cactus WH Enterprises beneficially own a majority of our outstanding voting interests. As a result, we are a “controlled company” within the meaning of the NYSE corporate governance standards. Under the NYSE rules, a company of which more than 50% of the voting power is held by another person or group of persons acting together is31a “controlled company” and may elect not to comply with certain NYSE corporate governance requirements, including the requirements that:·a majority of the board of directors consist of independent directors;·we have a nominating and governance committee that is composed entirely of independent directors with a written charter addressing the committee’s purpose and responsibilities;·we have a compensation committee that is composed entirely of independent directors with a written charter addressing the committee’s purpose and responsibilities; and·there be an annual performance evaluation of the nominating and governance and compensation committees.These requirements will not apply to us as long as we remain a controlled company. For at least some period, we intend to utilize these exemptions. Accordingly, you may not have the same protections afforded to shareholders of companies that are subject to all of the corporate governance requirements of the NYSE.For as long as we are an emerging growth company, we will not be required to comply with certain reporting requirements, including those relating to accounting standards and disclosure about our executive compensation, that apply to other public companies.We are classified as an “emerging growth company” under the JOBS Act. For as long as we are an emerging growth company, which may be up to five full fiscal years, unlike other public companies, we will not be required to, among other things: (i) provide an auditor’s attestation report on management’s assessment of the effectiveness of our system of internal control over financial reporting pursuant to Section 404(b) of the Sarbanes‑Oxley Act; (ii) comply with any new requirements adoptedgoverned by the PCAOB requiring mandatory audit firm rotationDelaware General Corporation Law (“DGCL”). The DGCL allows a corporation to pay dividends only out of a surplus, as determined under Delaware law or, a supplement toif there is no surplus, out of net profits for the auditor’s reportfiscal year in which the auditordividend was declared and for the preceding fiscal year. Under the DGCL, however, we cannot pay dividends out of net profits if, after we pay the dividend, our capital would be less than the capital represented by the outstanding stock of all classes having a preference upon the distribution of assets. We are not required to provide additional information aboutpay a dividend, and any determination to pay dividends and other distributions in cash, stock or property by us in the auditfuture (including determinations as to the amount of any such dividend or distribution) will be at the discretion of our board of directors and thewill be dependent on then-existing conditions, including business conditions, our financial statementscondition, results of the issuer; (iii) provide certain disclosure regarding executive compensation required of larger public companies;operations, liquidity, capital requirements, contractual restrictions, including restrictive covenants contained in debt agreements, and other factors.(iv)trade secrets or a third party attempts to enforce their intellectual property rights against us, we may suffer a loss in revenue or any competitive advantage or market share we hold, nonbinding advisory votes on executive compensation. We will remain an emerging growth company for up to five years, althoughor we will lose that status sooner ifmay incur costs in litigation defending intellectual property rights.more than $1.07 billion of revenues in a fiscal year,some patents and others pending, we do not have more than $700.0 million in market valuepatents relating to many of our Class A Common Stock held by non‑affiliates, or issue more than $1.0 billion of non‑convertible debt over a three‑year period.To the extent thatkey processes and technology. If we rely on any of the exemptions available to emerging growth companies, you will receive less information about our executive compensation and internal control over financial reporting than issuers that are not emerging growth companies. If some investors findable to maintain the confidentiality of our Class A Common Stocktrade secrets, or if our competitors are able to replicate our technology or services, our competitive advantage could be less attractive asdiminished. We also cannot provide any assurance that any patents we may obtain in the future would provide us with any significant commercial benefit or would allow us to prevent our competitors from employing comparable technologies or processes. We may initiate litigation from time to time to protect and enforce our intellectual property rights. In any such litigation, a result, theredefendant may assert that our intellectual property rights are invalid or unenforceable. Third parties from time to time may also initiate litigation against us by asserting that our businesses infringe, impair, misappropriate, dilute or otherwise violate another party’s intellectual property rights. We may not prevail in any such litigation, and our intellectual property rights may be a less active trading market forfound invalid or unenforceable or our Class A common stockproducts and our stock priceservices may be more volatile.32
Own/ Manufacturing Facility and Service Center Lease Manufacturing Own Service Center Lease Service Center / Land Own Service Center Lease Service Center / Land Production Facility Lease Item 6. Year Ended December 31, 2017 2016 2015 (in thousands, except per unit data) Consolidated Statements of Income Data: Total revenues $ 341,191 $ 155,048 $ 221,395 Total costs and expenses 252,328 144,433 179,190 Income from operations 88,863 10,615 42,205 Interest expense, net (20,767) (20,233) (21,837) Other income (expense), net — 2,251 1,640 Income (loss) before income taxes 68,096 (7,367) 22,008 Income tax expense(1) 1,549 809 784 Net income (loss) $ 66,547 $ (8,176) $ 21,224 Earnings (loss) per Class A unit: Basic and diluted $ 1,258.36 $ (224.00) $ 306.88 Weighted average Class A units outstanding: Basic and diluted 36.5 36.5 36.5 Consolidated Balance Sheets Data (at period end): Cash and cash equivalents $ 7,574 $ 8,688 $ 12,526 Total assets 266,456 165,328 177,559 Long-term debt, net 241,437 242,254 250,555 Members’ equity (deficit)(2) (36,217) (103,321) (93,167) Consolidated Statements of Cash Flows Data: Net cash provided by (used in): Operating activities $ 34,707 $ 23,975 $ 45,927 Investing activities (30,678) (17,358) (23,422) Financing activities (5,313) (10,171) (22,776) business. Demand for our products and services depends primarily upon the general level of activity in the oil and gas industry, including the number of active drilling rigs, 2021 Year Ended December 31, 2017 2016 $ Change % Change (in thousands) Revenues Product revenue $ 189,091 $ 77,739 $ 111,352 143.2 % Rental revenue 77,469 44,372 33,097 74.6 Field service and other revenue 74,631 32,937 41,694 126.6 Total revenues 341,191 155,048 186,143 120.1 Costs and expenses Cost of product revenue 124,030 62,766 61,264 97.6 Cost of rental revenue 40,519 33,990 6,529 19.2 Cost of field service and other revenue 60,602 28,470 32,132 112.9 Selling, general and administrative expenses 27,177 19,207 7,970 41.5 Total costs and expenses 252,328 144,433 107,895 74.7 Income from operations 88,863 10,615 78,248 737.1 Interest expense, net (20,767) (20,233) 534 2.6 Other income (expense), net — 2,251 (2,251) (100.0) Income (loss) before income taxes 68,096 (7,367) 75,463 nm Income tax expense 1,549 809 740 91.5 Net income (loss) $ 66,547 $ (8,176) $ 74,723 nm well as cost recovery measures. materials, freight and overhead. on our rental fleet. in 2022. 21% due to the fact that Cactus Inc. is only subject to federal and state income tax on its share of income from Cactus LLC. Income Year Ended December 31, 2016 2015 $ Change % Change (in thousands) Revenues Product revenue $ 77,739 $ 110,917 $ (33,178) (29.9) % Rental revenue 44,372 65,431 (21,059) (32.2) Field service and other revenue 32,937 45,047 (12,110) (26.9) Total revenues 155,048 221,395 (66,347) (30.0) Costs and expenses Cost of product revenue 62,766 84,604 (21,838) (25.8) Cost of rental revenue 33,990 39,251 (5,261) (13.4) Cost of field service and other revenue 28,470 33,200 (4,730) (14.2) Selling, general and administrative expenses 19,207 22,135 (2,928) (13.2) Total costs and expenses 144,433 179,190 (34,757) (19.4) Income from operations 10,615 42,205 (31,590) (74.8) Interest expense, net (20,233) (21,837) (1,604) (7.3) Other income (expense), net 2,251 1,640 611 37.3 Income (loss) before income taxes (7,367) 22,008 (29,375) nm Income tax expense(1) 809 784 25 3.2 Net income (loss) $ (8,176) $ 21,224 $ (29,400) nm Liquidity and Capital Resources Our ability to satisfy our long-term liquidity requirements, including cash distributions to We Year Ended December 31, 2017 2016 (in thousands) Net cash provided by operating activities $ 34,707 $ 23,975 Net cash used in investing activities (30,678) (17,358) Net cash used in financing activities (5,313) (10,171) Year Ended December 31, 2016 2015 (in thousands) Net cash provided by operating activities $ 23,975 $ 45,927 Net cash used in investing activities (17,358) (23,422) Net cash used in financing activities (10,171) (22,776) TRA. Predecessor Payments Due by Period For the Year Ending December 31, 2018 2019 2020 2021 2022 Thereafter Total (in thousands) Long-term debt, including current portion(1) $ 2,568 $ 2,568 $ 243,393 $ — $ — $ — $ 248,529 Interest on long-term debt(2) 18,322 18,135 10,474 — — — 46,931 Operating lease obligations(3) 5,506 4,083 3,752 3,077 2,031 4,713 23,162 Capital lease obligations(4) 5,296 5,394 3,475 — — — 14,165 Total $ 31,692 $ 30,180 $ 261,094 $ 3,077 $ 2,031 $ 4,713 $ 332,787 and expansion of our Bossier City location. Long‑Lived Assets Income Taxes blended tax rate used would decrease/increase the TRA liability recorded at December 31, 2022 by approximately $14.2 million. We Management’s Report on Internal Control Over Financial Reporting and Internal Control over Financial Reporting Also in our opinion, the Company maintained, in all material respects, effective internal control over financial reporting as of December 31, 2022, based on criteria established in Internal Control - Integrated Framework (2013) issued by the COSO. Opinions December 31, February 17, 2017 2017 (in thousands, except share data) Assets Cash and cash equivalents $ — $ — Total assets $ — $ — Liabilities and Stockholder's Equity Total liabilities $ — $ — Commitments and contingencies Stockholder's Equity Common stock, par value $0.01 per share, 1,000,000 shares authorized, none issued and outstanding — — Total stockholder's equity — — Total liabilities and stockholder's equity $ — $ — fraud, and whether effective internal control over financial reporting was maintained in all material respects. opinions. 1, 2023 CACTUS, December 31, December 31, 2017 2016 (in thousands, except unit data) Assets Current assets Cash and cash equivalents $ 7,574 $ 8,688 Accounts receivable-trade, net 84,173 32,289 Inventories 64,450 37,900 Prepaid expenses and other current assets 7,732 3,713 Total current assets 163,929 82,590 Property and equipment, net 94,654 74,870 Goodwill 7,824 7,824 Other noncurrent assets 49 44 Total assets $ 266,456 $ 165,328 Liabilities and Members' Equity Current liabilities Accounts payable-trade $ 35,080 $ 14,002 Accrued expenses and other 10,559 6,430 Capital lease obligations, current portion 4,667 1,134 Current maturities of long-term debt 2,568 2,568 Total current liabilities 52,874 24,134 Capital lease obligations, net of current portion 7,946 2,065 Deferred tax liability, net 416 196 Long-term debt, net 241,437 242,254 Total liabilities 302,673 268,649 Commitments and contingencies Members' equity (deficit) Class A, 36,500 units and 36,500 units issued and outstanding (35,055) (80,985) Class A-1, 520 units and 520 units issued and outstanding 802 148 Class B, 8,608 units and 8,608 units issued and outstanding (2,046) (22,009) Accumulated other comprehensive income (loss) 82 (475) Total members' equity (deficit) (36,217) (103,321) Total liabilities and members’ equity (deficit) $ 266,456 $ 165,328 CACTUS, Year Ended December 31, 2017 2016 2015 (in thousands, except unit and per unit data) Revenues Product revenue $ 189,091 $ 77,739 $ 110,917 Rental revenue 77,469 44,372 65,431 Field service and other revenue 74,631 32,937 45,047 Total revenues 341,191 155,048 221,395 Costs and expenses Cost of product revenue 124,030 62,766 84,604 Cost of rental revenue 40,519 33,990 39,251 Cost of field service and other revenue 60,602 28,470 33,200 Selling, general and administrative expenses 27,177 19,207 22,135 Total costs and expenses 252,328 144,433 179,190 Income from operations 88,863 10,615 42,205 Interest expense, net (20,767) (20,233) (21,837) Other income (expense), net — 2,251 1,640 Income (loss) before income taxes 68,096 (7,367) 22,008 Income tax expense 1,549 809 784 Net income (loss) $ 66,547 $ (8,176) $ 21,224 Earnings (loss) per Class A Unit—basic and diluted $ 1,258.36 $ (224.00) $ 306.88 Weighted average Class A Units outstanding—basic and diluted 36,500 36,500 36,500tables settable sets forth information with respect to our facilities.current principal facilities after the Merger with FlexSteel. We believe that our facilities are suitable and adequate for our current operations, taking into consideration the FlexSteel business.Location Type Approximate
LeaseLocationTypeLeaseSizeStatusUnited States:Manufacturing Facility, Service Center and Land Own Athens, PAService CenterLease6,500 sq. ft.ActiveLA(1)LA(1)38,000 sq. ft.ActiveLA(1)LA(1)Facility and Service Center74,000 sq. ft./5.7 acresActiveBossier City, LA(2)Land Adjacent to Manufacturing FacilityOwn10.0 acresUndevelopedBroussard, LA17,500 sq. ft.ActiveCarlsbad,Hobbs, NMService CenterLease5,000 sq. ft.ActiveCasper, WYService CenterLease5,000 sq. ft.ActiveCenter, TX(3)—Lease18,125 sq. ft.Idle / StorageDecatur, TXService CenterLease9,000 sq. ft.ActiveDonora, PAService CenterLease37,000 sq. ft.ActiveDuBois, PAService CenterLease20,580 sq. ft.ActiveDuBois, PALand Adjacent to Service CenterOwn5.1 acresUndevelopedGrand Junction, COService CenterLease7,200 sq. ft.ActiveHouston, TX(4)—Lease20,000 sq. ft.Idle / Sub-leased to third partyHouston, TXAdministrative HeadquartersLease23,125 sq. ft.ActiveKilgore, TX(4)—Lease24,000 sq. ft.Portions sub-leased to third party / StorageLaSalle, COService CenterLease6,800 sq. ft.ActiveMidland, TX(3)—Lease11,500 sq. ft.Sub-leased to third partyNew Waverly, TX21,000 sq. ft./8.7 acresActiveOdessa, TX63,750 sq. ft.ActiveOdessa,Houston, TXLandOwn9.1 acresUndevelopedOklahoma City, OKService CenterLease51,547 sq. ft.ActiveOklahoma City, OKService CenterLease20,200 sq. ft.Idle / VacantPleasanton, TXService CenterLease18,125 sq. ft.ActivePleasanton, TXLand Adjacent to Service CenterOwn5.4 acresStorageWilliston, NDService CenterLease22,825 sq. ft.ActiveWilliston, NDLand Adjacent to Service CenterOwn3.1 acresUndevelopedChina and Australia:Queensland, AustraliaLease15,000 sq. ft.ActiveService Center Lease Oklahoma City, OK Service Center Lease Pleasanton, TX Service Center Own Service Center Lease Service Center Lease China and Australia Queensland, Australia Service Centers and Offices / Land Lease Suzhou, China 89,535 sq. ft.Active
(1) Consists of various facilities adjacent to each other constituting our manufacturing facility, test and assembly facility, warehouse and service center.
(2) We also own land adjacent to these facilities.(1)Consists of various facilities adjacent to each other constituting our manufacturing facility and service center.(2)Consists of various parcels of contiguous land adjacent to our manufacturing facility.(3)Previously operated as a service center.(4)Previously operated as a manufacturing facility.Additional information about our properties is set forth in “Item 1. Business.”We are party to lawsuits arising in the ordinary course of our business. We cannot predict the outcome of any such lawsuits with certainty, but management believes it is remote that pending or threatened legal matters will have a material adverse impact on our financial condition. other routine litigation or subject to disputes or claims related to our business activities, including workers’ compensation claims and employment related disputes. In the opinion of our management, none of these otherthere is no pending litigation, disputesdispute or claimsclaim against us that, if decided adversely, will have a material adverse effect on our results of operations, financial condition or cash flows or results of operations.flows.33OurCommon Stock began trading on the NYSE under the symbol “WHD” on February 8, 2018. Prior to that, there was no publiccommon stock and Class B common stock. Holders of Class B common stock own a corresponding number of CC Units which may be redeemed for shares of Class A common stock. The principal market for our Class A Common Stock. As a result, we have not set forth quarterly information with respect tocommon stock is the high and low pricesNew York Stock Exchange (“NYSE”), where it is traded under the symbol “WHD.” No public trading market currently exists for our Class B common stock for thestock. As of December 31, 2022, there were two most recent fiscal years or provided a performance graph.On March 13, 2018, the closing priceholders of record of our Class A Common Stock as reported by the NYSE was $26.68 per share, and we had approximately one holder of record.common stock. This number excludes owners for whom Class A Common Stockcommon stock may be held in “street”“street name.Dividend PolicyWe do not anticipate declaring or paying any cash dividends to” As of December 31, 2022, there were six holders of record of our Class B common stock.Common Stockcommon stock as approved by our board of directors since December 2019. Dividends are not paid to our Class B common stock holders; however, a corresponding distribution up to the same amount per share as our Class A common stockholders is paid to our CW Unit Holders (or, for any dividends declared after the completion of the CC Reorganization, to the CC Unit holders) for any dividends declared on our Class A common stock. We have paid quarterly dividends uninterrupted since initiation of the cash dividend program and the approved dividend per share amount has increased from the initial amount of $0.09 per share to $0.10 per share in September 2021 to the foreseeable future. current amount of $0.11 per share of Class A common stock. In fiscal year 2022, the annual dividend rate for our Class A common stock was $0.44 per share compared to $0.38 per share in fiscal year 2021 and $0.36 per share in fiscal year 2020.retaincontinue paying the quarterly dividend at the current levels while retaining the balance of future earnings, if any, to finance the growth of our business. We would seek to increase the dividend in the future if our financial condition and results of operations permit. Our future dividend policy is within the discretion of our board of directors and will depend upon then-existing conditions, including our results of operations, financial condition, capital requirements, investment opportunities, statutory and contractual restrictions on our ability to pay dividends and other factors our board of directors may deem relevant. In addition,Credit Agreement restrictscommon stock to the S&P 500 Index, the S&P Oil & Gas Equipment & Services Index and the PHLX Oil Service Index from the date our abilitycommon stock began trading through December 31, 2022. The total shareholder return assumes $100 invested on February 7, 2018 in Cactus Inc., the S&P 500 Index, the S&P Oil & Gas Equipment & Services Index and the PHLX Oil Service Index. It also assumes reinvestment of all dividends. The following graph and related information shall not be deemed “soliciting material” or to pay cash dividends to holders of our Class A Common Stock.Securities Authorized for Issuance under Equity Compensation PlansThebe “filed” with the SEC, nor shall such information relating to our equity compensation plans required by Item 5 isbe incorporated by reference into any future filing under the Securities Act of 1933 or the Securities Exchange Act of 1934, except to the extent that Cactus Inc. specifically incorporates it by reference into such information as set forth in Item 12. “Security Ownershipfiling. 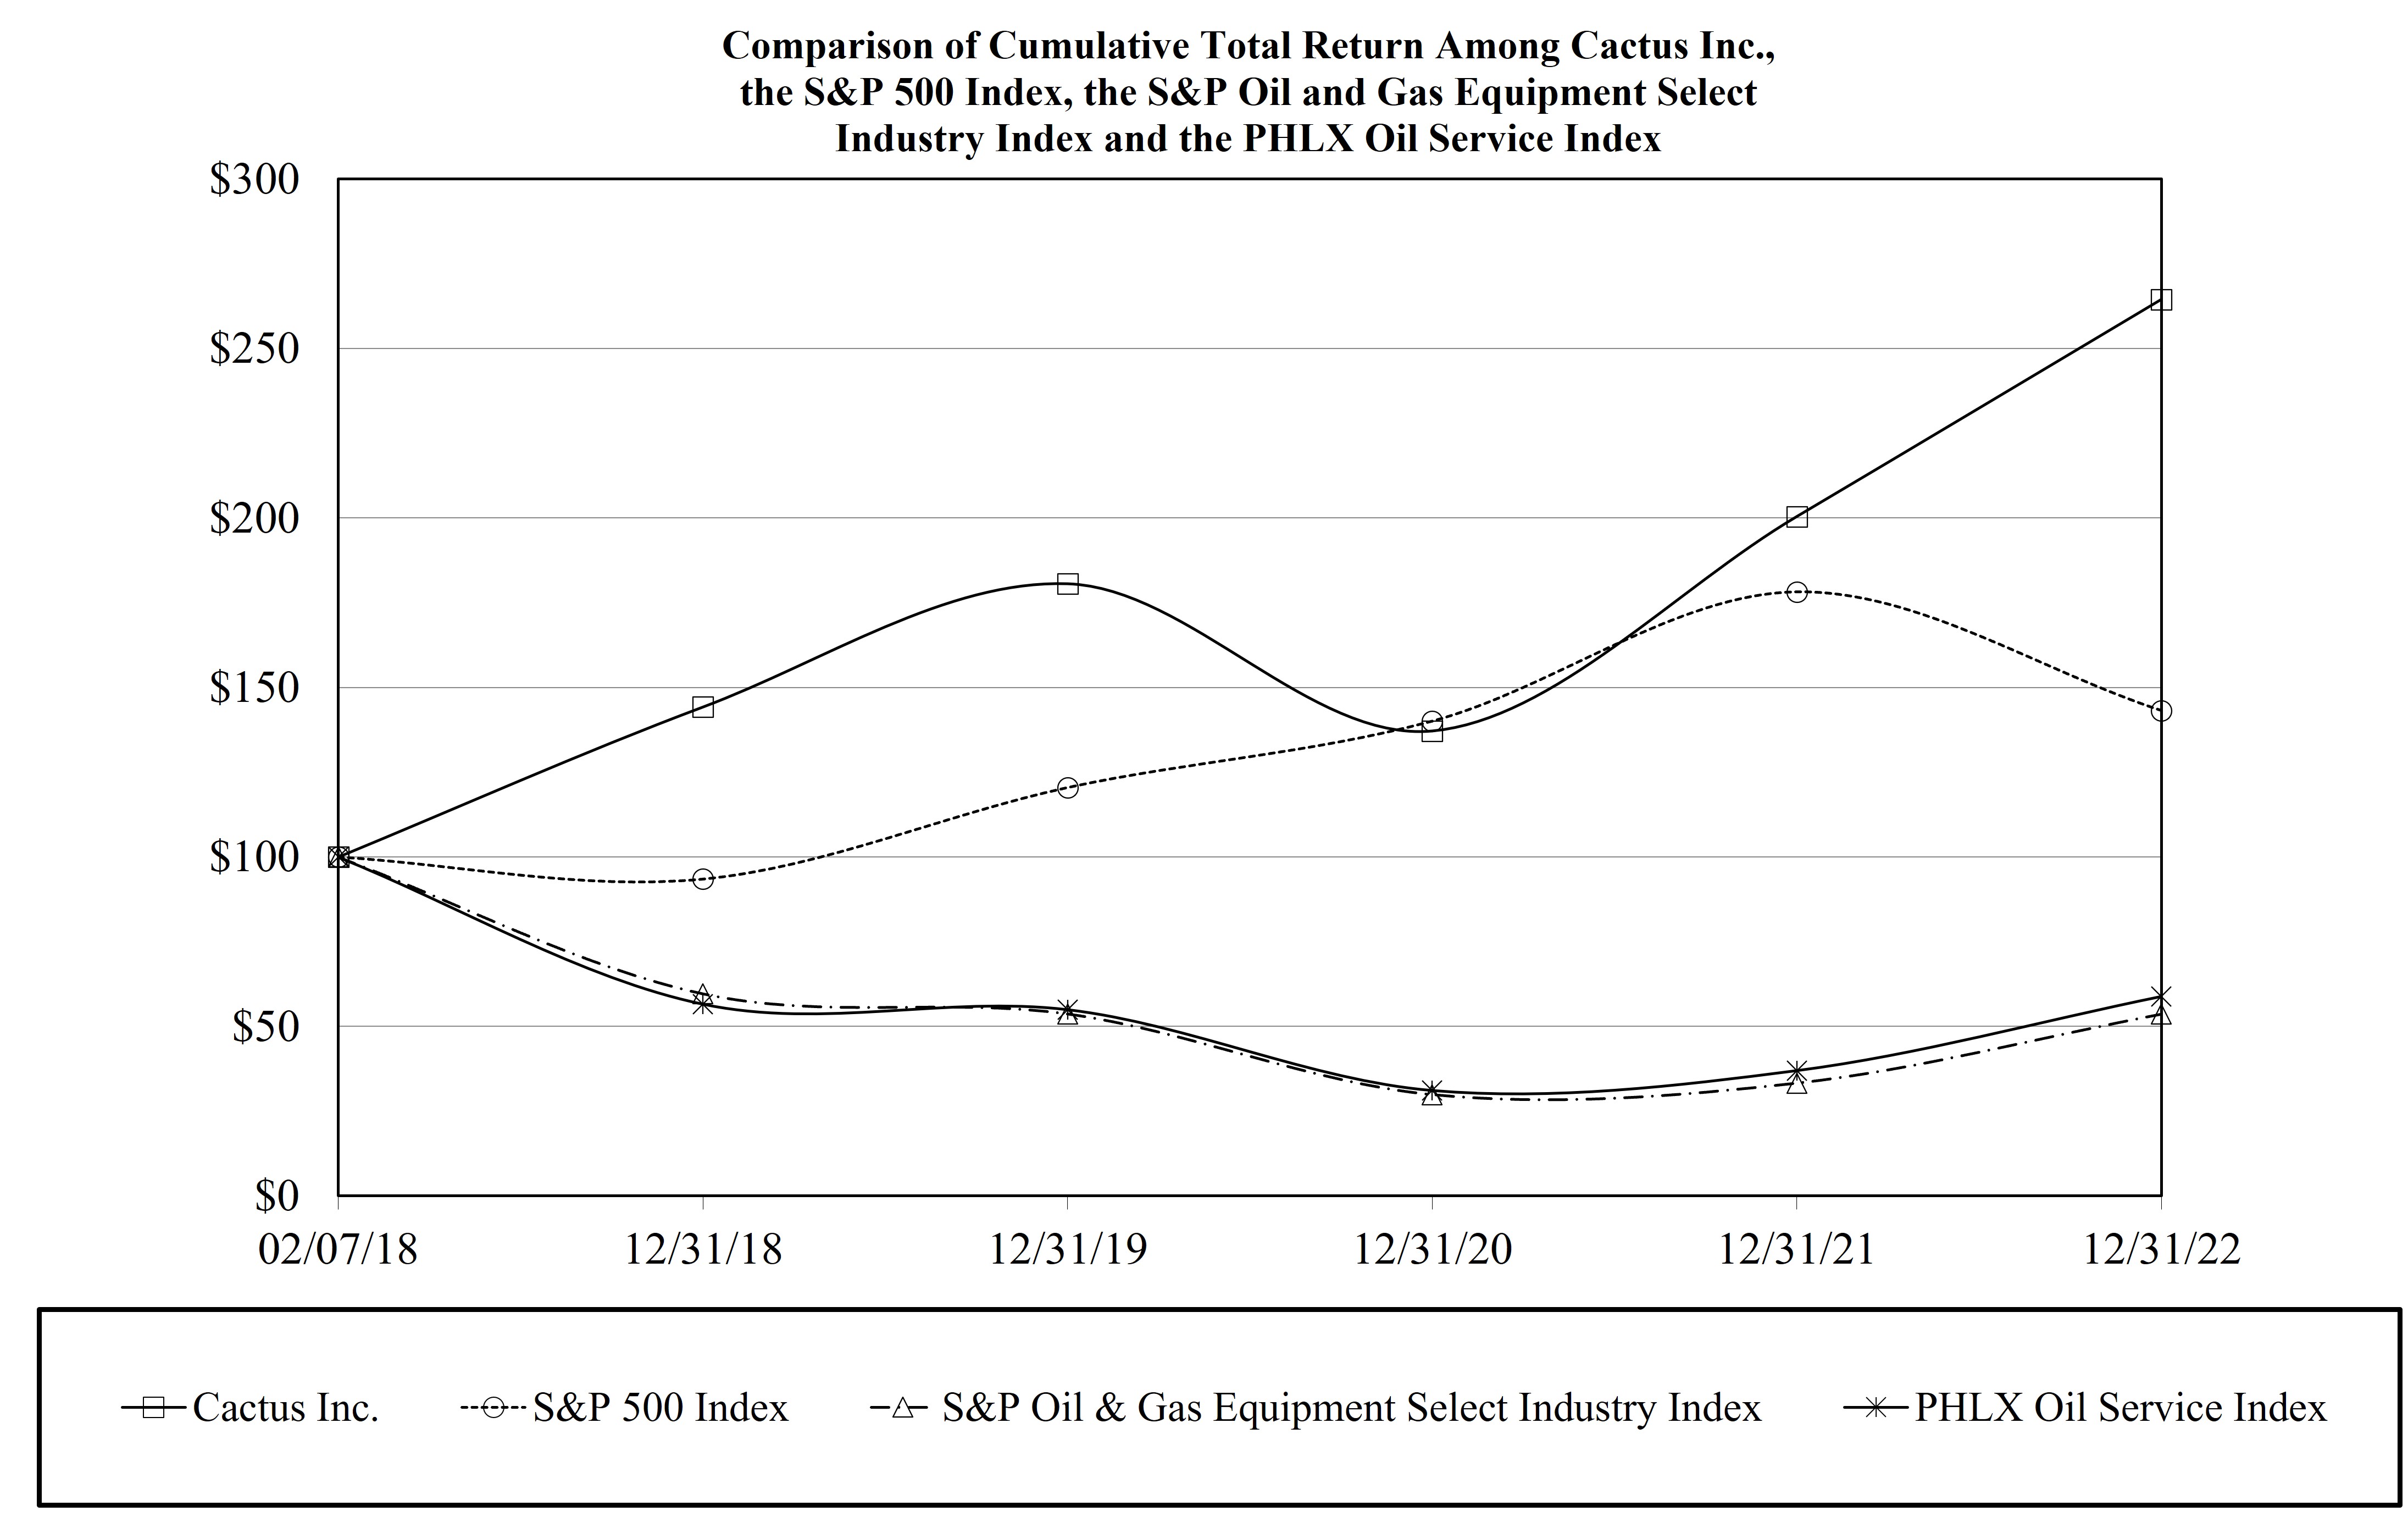
We did not purchase anyour equity securitiesClass A common stock during the quarterthree months ended December 31, 2017.Sales2022 (in whole shares).Period October 1-31, 2022 — $ — November 1-30, 2022 436 56.34 December 1-31, 2022 871 49.34 Total 1,307 $ 51.68 Unregistered Equity SecuritiesWe did not have any salesshares of unregistered equity securitiesClass A common stock repurchased from employees to satisfy tax withholding obligations related to restricted stock units that vested during the fiscal year ended December 31, 2017.34Selected Financial DataThe following tables show selected historical consolidated financial data, for the periods and as of the dates indicated, of Cactus LLC, our accounting predecessor. Our historical results are not necessarily indicative of future results. The following selected financial and operating data should be read in conjunction with “Item 7. Management’s Discussion and Analysis of Financial Condition and Results of Operations” and the consolidated financial statements and related notes, each of which is included in this report.(1)Cactus Inc. is a corporation and is subject to U.S. federal as well as state income tax for its share of ownership in Cactus LLC. Our predecessor, Cactus LLC, is not subject to U.S. federal income tax at an entity level. As a result, the consolidated net income (loss) in our historical financial statements does not reflect the tax expense we would have incurred if we were subject to U.S. federal income tax at an entity level during such periods. Cactus LLC is subject to entity‑level taxes for certain states within the United States. Additionally, our operations in both Australia and China are subject to local country income taxes.(2)In March 2014 and July 2014, Cactus LLC entered into an amendment and restatement of its then existing credit facility and a discount loan agreement, respectively, a portion of the proceeds from which were used to make a cash distribution to the Pre-IPO Owners. These transactions had the effect of creating a deficit in our total members’ equity.35Except as otherwise indicated or required by the context, all references in this Annual Report to the “Company,” “Cactus,” “we,” “us” and “our” refer to (i) Cactus Wellhead, LLC (“Cactus LLC”) and its consolidated subsidiaries prior to the completion of our initial public offering on February 12, 2018 and (ii) Cactus, Inc. (“Cactus Inc.”) and its consolidated subsidiaries (including Cactus LLC) following the completion of our initial public offering, unless we state otherwise or the context otherwise requires. above in “Cautionary Statement Regarding Forward-Looking Statements” and “Item 1A. Risk Factors” included elsewhere in this Annual Report, all of which are difficult to predict. In light of these risks, uncertainties and assumptions, the forward-looking events discussed may not occur. We assume no obligation to update any of these forward-looking statements except as otherwise required by law.Executive SummaryWe design, manufacture, sellrent a rangeAnalysis of highly‑engineered wellheadsFinancial Condition and pressure control equipment. Our products are sold and rented principally for onshore unconventional oil and gas wells and are utilized during the drilling, completions (including fracturing) and production phasesResult of Operations” of our customers’ wells. In addition, we provide field servicesAnnual Report on Form 10-K for allthe year ended December 31, 2021 filed with the Securities and Exchange Commission on February 28, 2022.rental items to assist with the installation, maintenance and handling of the wellhead and pressure control equipment.Our principal products include our Cactus SafeDrill™ wellhead systems, as well as frac stacks, zipper manifolds and production trees that we design and manufacture. Every oil and gas well requires a wellhead, which is installed at the onset of the drilling process and which remains with the well through its entire productive life. The Cactus SafeDrill™ wellhead systems employ technology which allows technicians to land and secure casing strings safely from the rig floor without the need to descend into the cellar. We believe we are a market leader in the application of such technology, with thousands of our products sold and installed across the United States since 2011. During the completion phase of a well, we rent frac stacks, zipper manifolds and other high‑pressure equipment that are used for well control and for managing the transmission of frac fluids and proppants during the hydraulic fracturing process. These severe service applications require robust and reliable equipment. For the subsequent production phase of a well, we sell production trees that regulate hydrocarbon production, which are installed on the wellhead after the frac tree has been removed. In addition, we provide mission‑critical field services for all of our products and rental items, including 24‑hour service crews to assist with the installation, maintenance and safe handling of the wellhead and pressure control equipment. Finally, we provide repair services for all of the equipment that we sell or rent.Our primary wellhead products and pressure control equipment are developed internally. We believe our close relationship with our customers provides us with insight into the specific issues encountered in the drilling and completions processes, allowing us to provide them with highly tailored product and service solutions. We have achieved significant market share, as measured by the percentage of total active U.S. onshore rigs that we follow (which we define as the number of active U.S. onshore drilling rigs to which we are the primary provider of wellhead products and corresponding services during drilling), and brand name recognition with respect to our engineered products, which we believe is due to our focus on safety, reliability, cost effectiveness and time saving features. We optimize our products for pad drilling (i.e., the process of drilling multiple wellbores from a single surface location) to reduce rig time and provide operators with significant efficiencies that translate to cost savings at the wellsite.Our manufacturing and production facilities are located in Bossier City, Louisiana and Suzhou, China. While both facilities can produce our full range of products, our Bossier City facility has advanced capabilities and is designed36to support time‑sensitive and rapid turnaround orders, while our facility in China is optimized for longer lead time orders and outsources its machining requirements. Both our United States and China facilities are licensed to the latest API 6A specification for both wellheads and valves and API Q1 and ISO9001:2015 quality management systems.We operate 14 service centers in the United States, which are strategically located in the key oil and gas producing regions, including the Permian, SCOOP/STACK, Marcellus, Utica, Eagle Ford, Bakken and other active oil and gas regions in the United States. We also have one service center in Eastern Australia. These service centers support our field services and provide equipment assembly and repair services.Market Factors and Trends in operation, the number of oil and gas wells being drilled, the depth and drilling conditionsworking pressure of these wells, the volume of production, the number of well completions, and the level of well remediation activity, the volume of production and the corresponding capital spending by oil and natural gas companies. Oil and gas activity is in turn heavily influenced by, among other factors, investor sentiment, availability of capital and oil and gas prices locally and worldwide, which have historically been volatile.The total U.S. onshore rig count for 2017 as reported by Baker Hughes based on a monthly average was 852 rigs, a material increase relative to the 2016 monthly average of 485 rigs. The December 2017, January 2018 and February 2018 monthly average was 909, 920 and 959 rigs, respectively.Oil and natural gas prices have historically been volatile. Ongoing compliance among OPEC producers on production cuts implemented in early 2017 and the extension of these production cuts through the end of 2018, combined with current geopolitical tension, have supported upward momentum for energy prices. We believe that recent increases in oil and natural gas prices, as well as moderate relief from the global oversupply of oil and domestic oversupply of natural gas, should increase demand for our products and services.factor offactors impacting our product sales isare the number of wells drilled and placed on production, as each well requires an individual wellhead assembly and, at some time after completion, the installation of an associated production tree. We measure our product sales activity levels versusagainst our competitors’competitors by the number of rigs that we are supporting on a monthly basis as a proxy forit is correlated to wells drilled. Each active drilling rig produces different levels of revenue based on the customer’s drilling plan,program and efficiencies, which includes factors such as the number of wells drilled per pad, the timing of rig moves, the time taken to drill each well, the number and size of casing strings, the working pressure, material selection and the complexity of the wellhead system chosen by the customer.customer and the rate at which production trees are eventually deployed. All of these factors aremay be influenced by the oil and gas region in which our customer iscustomers are operating. While these factors may lead to differing revenues per rig, they allow uswe have generally been able to forecast our product needs and anticipated revenue levels based on generalhistoric trends in a given region and with a specific customer.(i.e.(i.e., hydraulically fractured), the number of wells on a well pad, the number of fracture stages per well and the number of fracture stages completed per well. Rental revenues and prices are more dependent on overall industryday. Well completion activity levels ingenerally follows the short‑term than product sales. This islevel of drilling activity over time but can be delayed or accelerated due to the more competitivesuch factors as availability of drilling rigs, pressure pumping fleets and price‑sensitive nature of the rental market with more participants having access to completions‑focused rental equipment. Pricing had also been impacted with the move from dayrate pricing to stage‑based pricing in the hydraulic fracturing market. This had a follow‑on effect to the rental pricing of completions‑focused pressure control equipment, as problems experienced with rental equipment do not have as significant aOCTG, takeaway capacity, storage capacity, oil and gas prices, overall service cost impact as they did previously to the E&P operator under dayrate pricing. We believe that as the market increases in activity levelsinflation and as capacity becomes more constrained due to cannibalization of both rental and hydraulic fracturingbudget considerations. equipment, the pricing of completions‑focused pressure control rental equipment will improve due to a renewed focus on reliability and quality. Furthermore, we believe that the current number of Drilled But Uncompleted wells (“DUCs”) and any increases thereto could ultimately provide additional opportunities.37Service and other revenues are closely correlated to revenues from product sales and rentals, as items sold or rented oftenalmost always have an associated service component. Almost all service sales are offered in connection with a product sale or rental. Therefore, the market factors and trends of product sales and rental revenues similarly impact the associated levels of service and other revenues generated.How We Generate Our RevenuesOur revenues are derived from three sources: products, rentals, and field service and other. Product revenues are primarily derived from the sale of wellhead systems and production trees. Rental revenues are primarily derived from the rental of equipment used for well control during the completions process as well as the rental of drilling tools. Field service and other revenues are primarily earned when we provide installation and other field services for both product sales and equipment rental. Additionally, other revenues are derived from providing repair and reconditioning services to customers that have previously installed our products on their wellsite. Items sold or rented generally have an associated service component. Therefore, field service and other revenues closely correlategenerated.revenues from product salesholidays and rentals.In 2017,customers managing their budgets as the year closes out. This can lead to lower activity in our three revenue categories as well as lower margins, particularly in field services due to lower labor utilization.derived 55%completed the acquisition of our total revenuesFlexSteel, which designs, manufactures, sells and installs highly engineered spoolable pipe technologies. FlexSteel’s steel reinforced pipeline solutions are sold principally for onshore oil and gas wells and are utilized during the production phases of its customers’ wells. FlexSteel operates through service centers and pipe yards located throughout the United States and Canada, while also providing equipment and services in select international markets. FlexSteel’s manufacturing facility is located in Baytown, Texas.saleStrategic Petroleum Reserve and subsequent plans to replenish it, enacted and planned production cuts by OPEC+, fears of a global recession and easing COVID-19 restrictions in China. Oil prices reached their peak in March 2022 with West Texas Intermediate (“WTI”) prices increasing to over $123 per barrel. Prices dropped below $80 per barrel in late November 2022 and remained under $80 per barrel for the majority of December 2022 before ending the year at slightly above $80 per barrel. Oil prices dropped below $80 several days in early 2023, but remained above $73 per barrel and averaged approximately $78 per barrel through February 24, 2023. In mid-February 2023, the International Energy Agency raised its forecast for global crude oil demand for 2023, raising the projection for 2023 to two million barrels per day above 2022.products, 23% of our total revenues from rental and 22% of our total revenues from field service and other. In 2016, we derived 50% of our total revenues fromcustomers are primarily oil-focused, thus slightly moderating the sale of our products, 29% of our total revenues from rental and 21% of our total revenues from field service and other. In 2015, we derived 50% of our total revenues from the sale of our products, 30% of our total revenues from rental and 20% of our total revenues from field service and other. We have predominantly domestic operations, with 99% of our total sales in 2017, 98% of our total sales in 2016 and 99% of our total sales in 2015 earned from U.S. operations.Substantially all of our sales are made on a call‑out basis, wherein our clients issue requestsadverse impacts to demand for goods and/or services as their operations require. Such goods and/or services are most often priced in accordance with a preapproved price list.Generally, we attempt to raise prices as our costs increase or additional features are provided. However, the actual pricing of our products and services is impactedservices.a number of factors, including competitive pricing pressure, the level of utilized capacitycontinuing to cause uncertainty, not only in the oil service sector, maintenance of market share, and general market conditions.Costs of Conducting Our BusinessThe principal elements of cost of sales for products arenatural gas markets, but also in the directfinancial markets and indirect costsglobal supply chain. Such uncertainty could continue to manufactureresult in stock price volatility and supply chain disruptions as well as higher oil and natural gas prices which could cause higher inflation worldwide, impact consumer spending and negatively impact demand for our goods and services. Moreover, additional interest rate increases by the product, including labor, materials, machine time, lease expense relatedU.S. Federal Reserve to our facilities and freight.combat inflation could further increase the probability of a recession.principal elements of cost of salesweekly average U.S. onshore rig count for rentals are the direct and indirect costs of supplying rental equipment, including depreciation, repairs specifically performed on such rental equipment, lease expense and freight. The principal elements of cost of salesthree months ended December 31, 2022 was 757 rigs, a 39% increase as compared to 543 rigs for field service and other are labor, equipment depreciation and repair, equipment lease expense, fuel and supplies.Selling, general and administrative expense is comprised of costs such as sales and marketing, engineering expenses, general corporate overhead, business development expenses, compensation expense, IT expenses, safety and environmental expenses, legal and professional expenses and other related administrative functions.Interest expense, net is comprised primarily of interest expense associated with our term loan facility. A portion of the net proceeds of the IPO was used to repay the borrowings outstanding under our term loan facility.38
comparable period in 2021. U.S. onshore drilling activity has beenFactors Affectingrelatively stable during the Comparabilityfirst part of Our Financial Condition2023. As of February 24, 2023, the U.S. onshore rig count was 734, reflecting weakening natural gas prices in early 2023.ResultsIncreased CostsOperationsOur historical financial conditionfuel, raw materials, component parts, ocean freight charges and results of operations for the periods presented may not be comparable, either from period to period or going forward, for the following reasons:·Selling, General and Administrative Expenses. We expect to incur additional selling, general and administrative expenses as a result of becoming a publicly traded company. These costs include expenses associated with our annual and quarterly reporting, tax return preparation expenses, Sarbanes‑Oxley compliance expenses, audit fees, legal fees, directors and officers insurance, investor relations expenses, Tax Receivable Agreement administration expenses and registrar and transfer agent fees. These increases in selling, general and administrative expenses are not reflected in our historical financial statements, other than a portion of these costs incurred in 2017 in preparation of becoming a public company.·Corporate Reorganization. The historical consolidated financial statements are based on the financial statements of our accounting predecessor, Cactus LLC and its subsidiaries, prior to our reorganization in connection with our IPO. As a result, the historical consolidated financial data may not provide an accurate indication of what our actual results would have been if such transactions had been completed at the beginning of the periods presented or of what our future results of operations are likely to be. In addition, we entered into a Tax Receivable Agreement with the TRA Holders. This agreement generally provides for the payment by us to the TRA Holders of 85% of the net cash savings, if any, in U.S. federal, state and local income tax or franchise tax that we actually realize or are deemed to realize in certain circumstances as a result of certain increases in tax basis and imputed interest, as described below. We will retain the benefit of the remaining 15% of such net cash savings. For additional information regarding the Tax Receivable Agreement, see “Item 1A. Risk Factors—Risks Related to our Class A Common Stock.”We intend to account for any amounts payable under the Tax Receivable Agreementlabor in accordance with Accounting Standard Codification (“ASC”) Topic 450, Contingencies (“ASC 450”). We believe accounting for the Tax Receivable Agreement under the provisions of ASC 450 is appropriate, given the significant uncertainties regarding the amount and timing of payments, if any, to be made under the Tax Receivable Agreement.The tax benefits covered2022. Inflation, measured by the Tax Receivable Agreement include tax benefits expectedU.S. Consumer Price Index (“CPI”) as reported by the U.S. Bureau of Labor Statistics, increased substantially during 2022, rising to arisean average of 8.0% on a year-over-year basis in connection with2022 from an average of 4.7% on a year-over-year basis in 2021. While year-over-year inflation rates remained elevated relative to historical levels, the reorganizationrate of increases began to moderate late in 2022 and were reported at 6.5% in December 2022, the IPO, including (i) certain increaseslowest that figure has been in tax basis that occurmore than a year. Salaries and wages remain elevated as a result of Cactus Inc.’s acquisition (or deemed acquisition for U.S. federal income tax purposes)competitive labor markets, especially in certain key oil and gas producing areas, but also due to broader inflation trends and labor shortages. We expect we will continue to experience inflationary pressures on portions of CW Unitsour cost structure; however, tightness in overseas freight and transit times from the Pre-IPO OwnersChina have eased. Additionally, raw material and component costs are moderating due in connection with the IPO, (ii) certain increases in tax basis resulting from the repayment, in connection with the IPO, of borrowings outstanding under Cactus LLC’s term loan facility and (iii) imputed interest deemedpart to be paid by Cactus Inc. as a result of, and additional tax basis arising from, any payments Cactus Inc. makes under the Tax Receivable Agreement. Payments will generally be made under the Tax Receivable Agreement as we realize actual cash tax savings from such tax benefits (provided that if we experience a change of control or the Tax Receivable Agreement terminates early at our election or as a result of a breach, we could be required to make an immediate lump‑sum payment in advance of any actual cash tax savings).We will evaluate whether it is more likely than not that actual cash tax savings will be realized by Cactus Inc. from the tax benefits expected to arise in connection with the reorganization and the IPO. If it is determined that it is more likely than not that the tax benefits will be realized through actual cash tax savings, then the Tax Receivable Agreement would be expected to be probable of resulting in future payments and a liability would be recorded. On the other hand, if it is determined that it is more likely than not that the tax benefits will not be realized through actual cash tax savings, then no Tax Receivable39Agreement liability would be recorded, as future payments under the Tax Receivable Agreement would not be probable of occurring.The accounting for any exchanges of CW Units subsequent to the reorganization transaction will follow the same accounting described above.We will recognize subsequent changes to the measurement of the Tax Receivable Agreement liabilityimprovements in the income statement. Inglobal supply and demand dynamics for steel. Nonetheless, we cannot be confident that transit times or input prices will return or stabilize at the case of any changes resulting from changes to any valuation allowance associated with the underlying tax asset, given the inextricable link between the tax savings generated and the recognition of the Tax Receivable Agreement liability (i.e., one is recorded based on 85% of the other), and the explicit guidancelower levels experienced in ASC 740‑20‑45‑11(g) which requires that subsequent changes in a valuation allowance established against deferred tax assets that arose due to change in tax basis as a result of a transaction among or with shareholders to be recorded in the income statement as opposed to equity, we believe recording of the corollary adjustment to the Tax Receivable Agreement liability in the income statement would also be appropriate.To the extent Cactus LLC has available cash and subject to the terms of any current or future credit agreements or debt instruments, we intend to cause Cactus LLC to generally make pro rata distributions to its unitholders, including us, in an amount at least sufficient to allow us to pay our taxes and to make payments under the Tax Receivable Agreement. Except in cases where we elect to terminate the Tax Receivable Agreement early or it is otherwise terminated, we may generally elect to defer payments due under the Tax Receivable Agreement if we do not have available cash to satisfy our payment obligations under the Tax Receivable Agreement. Any such deferred payments under the Tax Receivable Agreement generally will accrue interest from the due date for such payment until the payment date.
prior years.·Income Taxes. Our accounting predecessor is a limited liability company that constitutes a partnership for U.S. federal income tax purposes, and therefore is not subject to U.S. federal income taxes. Accordingly, no provision for U.S. federal income taxes has been provided for in our historical results of operations because taxable income was passed through to Cactus LLC’s members. We do not expect to report any income tax benefit or expense attributable to U.S. federal income taxes until after the IPO. After the IPO, we will be taxed as a corporation under the Code and subject to U.S. federal income taxes (currently at a statutory rate of 21% of pretax earnings, as adjusted by the Code), as well as state income taxes, for Cactus Inc.’s share of ownership in Cactus LLC.·Long‑Term Incentive Plan. To incentivize individuals providing services to us or our affiliates, our board adopted a long‑term incentive plan prior to the completion of our IPO. The LTIP provides for the grant, from time to time, at the discretion of our board of directors or a committee thereof, of stock options, stock appreciation rights, restricted stock, restricted stock units, stock awards, dividend equivalents, other stock‑based awards, cash awards, substitute awards and performance awards. Any individual who is our officer or employee or an officer or employee of any of our affiliates, and any other person who provides services to us or our affiliates, including members of our board of directors, will be eligible to receive awards under the LTIP at the discretion of our board of directors. In connection with the IPO, we issued 737,493 restricted stock unit awards, which will vest over one to three years, to certain of our officers and directors. We will recognize equity compensation expenses aggregating up to $5.0 million per year, starting in 2018, over the one to three year vesting term related to this issuance.40Predecessor Consolidated Results of Operations20172022 Compared to Year Ended December 31, 2016 Year Ended December 31, 2022 2021 $ Change % Change (in thousands) Revenues Product revenue $ 452,615 $ 280,907 $ 171,708 61.1 % Rental revenue 100,453 61,629 38,824 63.0 Field service and other revenue 135,301 96,053 39,248 40.9 Total revenues 688,369 438,589 249,780 57.0 Costs and expenses Cost of product revenue 277,871 189,083 88,788 47.0 Cost of rental revenue 62,037 54,377 7,660 14.1 Cost of field service and other revenue 106,013 73,681 32,332 43.9 Selling, general and administrative expenses 67,700 46,021 21,679 47.1 Total costs and expenses 513,621 363,162 150,459 41.4 Income from operations 174,748 75,427 99,321 nm Interest income (expense), net Interest income (expense), net 3,714 (774) 4,488 nm Other income (expense), net (1,910) 492 (2,402) nm Income before income taxes Income before income taxes 176,552 75,145 101,407 nm (1)31,430 7,675 23,755 nm Net income Net income 145,122 67,470 77,652 nm Less: net income attributable to non-controlling interest Less: net income attributable to non-controlling interest 34,948 17,877 17,071 95.5 Net income attributable to Cactus Inc. Net income attributable to Cactus Inc. $ 110,174 $ 49,593 $ 60,581 nm
Revenues(1)Cactus Inc. is a corporation and is subject to U.S. federal as well as state income tax related to its ownership percentage in Cactus LLC. Our predecessor, Cactus LLC, is not subject to U.S. federal income tax at an entity level. As a result, the consolidated net (loss) income in our historical financial statements does not reflect the tax expense we would have incurred if we were subject to U.S. federal income tax at an entity level during such periods. Cactus LLC is subject to entity‑level taxes for certain states within the United States. Additionally, our operations in both Australia and China are subject to local country income taxes.Revenuesthe year ended December 31, 20172022 was $189.1$452.6 million ancompared to $280.9 million for 2021. The increase of $111.4$171.7 million, or 143%,representing a 61% increase from $77.7 million for the year ended December 31, 2016. The increase2021, was primarily attributabledue to accelerated U.S. land activity in 2017 associated with increased E&P drilling, completionshigher sales of wellhead and production which led to a higher onshore rig count in the United States,related equipment resulting infrom increased demand foractivity by our products and greater volume of product sales. Additionally, a change in mix toward higher value advanced wellheads has also contributed to the increase in revenues.Rental revenue for the year ended December 31, 2017 was $77.5 million, an increase of $33.1 million, or 75%, from $44.4 million for the year ended December 31, 2016. The increase was primarily attributable to increased drilling and completions activities, which led to increased demand for the rental of our equipment in 2017,customers as well as pricing improvementthe impact of cost recovery efforts.our rental fleet compared to 2016.41Field service and other revenue for the year ended December 31, 2017 was $74.6 million, an increase of $41.72022 increased $38.8 million, or 127%63%, from $32.9$61.6 million for the year ended December 31, 2016.in 2021. The increase was primarily attributable to higher demanddrilling and completion activity by our customers and associated repairs.these2022 was $135.3 million, an increase of $39.2 million, or 41%, from $96.1 million for 2021. The increase was attributable to increased customer activity, resulting in higher billable hours and ancillary services following the increase in our product and rental revenue, as field service is closely correlated with these activities.for the year ended December 31, 2017 was $124.0of $277.9 million an increase of $61.3in 2022 increased $88.8 million, or 98%47%, from $62.8$189.1 million for the year ended December 31, 2016.in 2021. The increase was largely attributable to increasedan increase in product sales volume as a result of higher demand for our products. Product margins benefited from price increases togetherand increased costs associated with a change in mix toward higher value advanced wellheads.the year ended December 31, 20172022 was $40.5$62.0 million, an increase of $6.5$7.7 million, or 19%14%, from $34.0$54.4 million for the year ended December 31, 2016.2021. The increase was primarily due to higher repair and equipment reactivation costs, scrap expense, freight costs and increased personnel, ancillary and branch expenses, partially offset by lower depreciation expense from capital additions and higher operating costs due to an increase in activity. Increased utilization and better pricing contributed to higher margins.the year ended December 31, 20172022 was $60.6$106.0 million, an increase of $32.1$32.3 million, or 113%44%, from $28.5$73.7 million for the year ended December 31, 2016.2021. The increase was mainly related to higher personnel costs resulting from an increase in the number of field and branch personnel and higher wages as well as higher fuel and third-party service costs associated with increased field service activity levels.payroll costs attributable to additional field personnel and higher operating costs due to activity increases.Selling, general and administrative expense for the year ended December 31, 2017 was $27.2 million, an increase of $8.0 million, or 42%,interest income earned on cash invested resulting from $19.2 million for the year ended December 31, 2016. The increase was primarily due to higher payroll and incentive compensation costs associated with the overall growth of Cactus. Also, we expensed $1.0 million of costs during 2017 related to preparing for being a public company.Interest expense, net. Interest expense, net for the year ended December 31, 2017 was $20.8 million, an increase of $0.5 million, or 3%, from $20.2 million for the year ended December 31, 2016. The increase was primarily due to higher averageincreased interest rates on borrowings under our credit facility and increased interest related to amounts on capital lease obligations.for 2016 relatesof $0.5 million in 2021 related to a $0.9 million non-cash gain on debt extinguishmentassociated with the revaluation of $2.3the liability related to the TRA and $0.4 million for professional fees and other expenses associated with the 2021 Secondary Offering.redemption2021 operations and $1.3 million expense resulting from a change in our forecasted state tax rate. This tax expense was partially offset by a $1.1 million benefit associated with permanent differences related to equity compensation and a $9.0 million tax benefit associated with the partial valuation allowance release in conjunction with 2021 redemptions of $7.5 millionCW Units.second quarterfederal statutory rate of 2016.tax expense. Although our operations haveallocated to the non-controlling interest is not been subject to U.S. federal income tax at an entity level, our operations are subject toor state taxes within the United States. In addition, Cactus LLC’s operations located in China and Australia are subject to local country income taxes. Income tax expense for the years ended December 31, 2017 and 2016 were $1.5 million and $0.8 million, respectively.42Year Ended December 31, 2016 Compared to Year Ended December 31, 2015The following table presents summary consolidated operating results for the periods presented:nm = not meaningful(1)Cactus Inc. is a corporation and is subject to U.S. federal as well as state income tax related to its ownership percentage in Cactus LLC. Our predecessor, Cactus LLC, is not subject to U.S. federal income tax at an entity level. As a result, the consolidated net (loss) income in our historical financial statements does not reflect the tax expense we would have incurred if we were subject to U.S. federal income tax at an entity level during such periods. Cactus LLC is subject to entity‑level taxes for certain states within the United States. Additionally, our operations in both Australia and China are subject to local country income taxes.RevenuesProduct revenue for the year ended December 31, 2016 was $77.7 million, a decrease of $33.2 million, or 30%, from $110.9 million for the year ended December 31, 2015. The decrease was primarily attributable to the decline in crude oil prices, which led to a lower onshore rig count in the United States, resulting in a lower demand for our products.Rental revenue for the year ended December 31, 2016 was $44.4 million, a decrease of $21.1 million, or 32%, from $65.4 million for the year ended December 31, 2015. The decrease was primarily attributable to the decline in oil prices, which reduced drilling and completions activities. These factors reduced demand for the rental of our equipment and put downward pressure on rental pricing.Field service and other revenue for the year ended December 31, 2016 was $32.9 million, a decrease of $12.1 million, or 27%, from $45.0 million for the year ended December 31, 2015. The decrease was primarily attributable to a reduction in demand for our services following the decline in crude oil prices, resulting in lower rig count.43Costs and expensesCost of product revenue for the year ended December 31, 2016 was $62.8 million, a decrease of $21.8 million, or 26%, from $84.6 million for the year ended December 31, 2015. The decrease was primarily attributable to reduced product sales volume as a result of lower demand for our products.Cost of rental revenue for the year ended December 31, 2016 was $34.0 million, a decrease of $5.3 million, or 13%, from $39.3 million for the year ended December 31, 2015. The decrease was primarily due to lower repair costs.Cost of field service and other revenue for the year ended December 31, 2016 was $28.5 million, a decrease of $4.7 million, or 14%, from $33.2 million for the year ended December 31, 2015. The decrease was primarily due to reduction in payroll costs and branch overhead costs.Selling, general and administrative expense for the year ended December 31, 2016 was $19.2 million, a decrease of $2.9 million, or 13%, from $22.1 million for the year ended December 31, 2015. The decrease was largely due to lower headcount costs and a reduction in the provision for doubtful accounts.Interest expense, net. Interest expense, net for the year ended December 31, 2016 was $20.2 million, a decrease of $1.6 million, or 7%, from $21.8 million for the year ended December 31, 2015. The decrease was primarily related to reduced interest expense due to less average debt outstanding under our credit agreement during 2016 from the early redemptions of this debt in 2016 and 2015.Other income (expense), net. The increase was due to a higher gain arising from the redemption of $7.5 million of the debt outstanding under our credit agreement during 2016 compared to the gain recognized during 2015 from the redemption of $10.0 million of the debt outstanding under our credit agreement.Income tax expense. Although our operations have not been subject to U.S. federal income tax at an entity level, our operations are subject to state taxes within the United States. In addition, Cactus LLC’s operations located in China and Australia are subject to local country income taxes. Income tax expense for the year ended December 31, 2016 and 2015 remained consistent at $0.8 million.In February 2018,completed our IPO. We received net proceeds of $467.4 million from the sale of 26,450,000 shares of Class A Common Stock in the IPO. We contributed all of the net proceeds of the IPO to Cactus LLC in exchange for CW Units. Cactus LLC used (i) $251.0had $344.5 million of the net proceeds to repay all of the borrowings outstanding, plus accrued interest, under its term loan facilitycash and (ii) $216.4 million to redeem CW Units from certain direct and indirect owners of Cactus LLC.We expect that ourcash equivalents. Our primary sources of liquidity and capital resources will beare cash on hand, cash flows generated by operating activities and, if necessary, borrowings under our revolving credit facility.ABL Credit Facility (as defined in Note 4 in the notes to the Consolidated Financial Statements). Depending upon market conditions and other factors, we may also have the ability to issue additional equity and debt if needed.Historically, As of December 31, 2022, we had no borrowings outstanding under our predecessor’s primary sourcesABL Credit Facility and $79.9 million of liquidityavailable borrowing capacity. We had $0.1 million in letters of credit outstanding at December 31, 2022 which reduced our available borrowing capacity. We were in compliance with the covenants of the ABL Credit Facility as of December 31, 2022.flowson hand, cash generated from operations and available borrowings under Cactus LLC’s credit agreement and equity provided byour ABL Credit Facility will be sufficient for the Pre-IPO Owners. Our predecessor’s primary use of capital has been fornext 12 months to meet working capital purposes,requirements, anticipated capital expenditures, expected TRA liability payments, anticipated tax liabilities and dividends to makeholders of our Class A common stock as well as pro rata cash distributions to holders of CW Units (or, in the Pre-IPO Owners and repay indebtedness. Priorcase of dividends declared after the completion of the CC Reorganization, to the repaymentholders of CC Units), other than Cactus Inc.conjunction with the IPO,Notes to the Consolidated Financial Statements.predecessor’s borrowings outstanding under Cactus LLC’s credit agreement were $248.5 million and $251.1 million atnet capital expenditures for the year ending December 31, 2017 and 2016, respectively. Borrowings were used primarily for working capital purposes,2023 will range from $35 million to make cash distributions$45 million, mostly related to rental fleet investments including drilling tools but also related to the Pre-IPO Ownerspotential purchase of a currently leased facility, international expansion and repay indebtedness.development of a newly-leased research and development facility in Houston, Texas. We continuously evaluate our capital expenditures, and the amount we ultimately spend will depend on a number of factors, including, among other things, demand for rental assets, available capacity in existing locations, prevailing economic conditions, market conditions in the E&P industry, customers’ forecasts, volatility and company initiatives.44the CWCC Unit Holders to fund their respective income tax liabilities relating to their share of taxesthe income of Cactus Companies and to fund liabilities related to the partnership,TRA, depends on our future operating performance, which is affected by, and subject to, prevailing economic conditions, market conditions in the E&P industry, availability and cost of raw materials, and financial, business and other factors, many of which are beyond our control.currently estimate that our capital expenditures for the year ending December 31, 2018 will range from $40 millionnot be able to $50 million, excluding acquisitions. We have begun expanding our investments in frac equipment in response to increasing opportunities and client demands, and we expect to expand our facilities. We continuously evaluate our capital expenditures, and the amount we ultimately spend will depend on a numberpredict or control many of these factors, including, among other things, demand for rental assets, prevailingsuch as economic conditions, market conditions in the E&P industry, customers’ forecasts, demand volatilitymarkets where we operate and company initiatives. We believe thatcompetitive pressures. If necessary, we could choose to further reduce our existingspending on capital projects and operating expenses to ensure we operate within the cash on hand, cashflow generated from operations and available borrowings under our revolving credit facility will be sufficient to meet working capital requirements, anticipated capital expenditures, expected cash distributions to the CW Unit Holders and anticipated tax liabilities for at least the next 12 months.At December 31, 2017 and December 31, 2016, we had approximately $7.6 million and $8.7 million, respectively, of cash and cash equivalents and approximately $50 million and $15 million, respectively, of available borrowing capacity under our revolving credit facility. As of December 31, 2017, there were no borrowings outstanding under the revolving credit facility and $50 million in available borrowing capacity thereunder. On January 21, 2018, the board of directors of Cactus LLC declared a cash distribution of $26.0 million, which was paid to the Pre-IPO Owners on January 25, 2018. Such distribution was funded by borrowing under the revolving credit facility. The purpose of the distribution was to provide funds to the Pre-IPO Owners to pay their federal and state tax liabilities associated with taxable income recognized by them as a result of their ownership interests in Cactus LLC prior to the completion of our IPO. As of March 13, 2018, we had $8.0 million outstanding under the revolving credit facility and approximately $11.0 million of cash and cash equivalents.Cash FlowsYear Ended December 31, 2017 Compared to Year Ended December 31, 2016The following table summarizes our cash flows for the periods indicated:Net cash provided by operating activities was $34.7 million and $24.0 million for the years ended December 31, 2017 and 2016, respectively. The primary reason for the change was the $74.7 million increase in net income and $3.2 million increase in non-cash items, offset by a $67.2 million increase in net working capital items due to the significant increase in business activity during the second half of 2017.Net cash used in investing activities was $30.7 million and $17.4 million for the years ended December 31, 2017 and 2016, respectively. The primary reason for the change was higher capital expenditures during 2017 related to the additional investments in our rental fleet as market activity improved significantly during 2017.Net cash used in financing activities was $5.3 million and $10.2 million for the years ended December 31, 2017 and 2016, respectively. The primary reason for the change was due to less debt service in 2017 as 2016 included a partial45redemption of principal under our term loan. Also, there were no distributions to members in 2017 compared to $2.1 million in 2016.Year Ended December 31, 2016 Compared to Year Ended December 31, 2015The following table summarizes our cash flows for the periods indicated:Net cash provided by operating activities was $24.0 million and $45.9 million for the years ended December 31, 2016 and 2015, respectively. The primary cause of the reduction was the $29.4 million reduction in net income, partially offset by an $8.9 million reduction in net working capital items.Net cash used in investing activities was $17.4 million and $23.4 million for the years ended December 31, 2016 and 2015, respectively. The primary reason for the change was a $3.6 million reduction in capital expenditures from 2015 to 2016 following a facility expansion and additional purchases of property and equipment in 2015.Net cash used in financing activities was $10.2 million and $22.8 million for the years ended December 31, 2016 and 2015, respectively. The primary reason for the change was lower distributions to members of $10.2 million in 2016 compared to 2015.Credit AgreementOn July 31, 2014, we entered into a credit agreement with Credit Suisse AG as administrative agent, collateral agent and issuing bank, and the other lenders party thereto (the “Credit Agreement”). The Credit Agreement provides for a term loan tranche in an aggregate principal amount of $275.0 million, the outstanding balance of which was repaid in full with the net proceeds of the IPO, and a revolving credit facility of up to $50.0 million with a $10.0 million sublimit for letters of credit. The revolving credit facility matures on July 31, 2019.As of December 31, 2017 and 2016, we had $248.5 million and $251.1 million, respectively, of borrowings outstanding under the term loan, no borrowings outstanding under the revolving credit facility and no outstanding letters of credit. In conjunction with our IPO, we repaid the $248.5 million outstanding under the term loan, plus accrued interest.On January 21, 2018, the board of directors of Cactus LLC declared a cash distribution of $26.0 million, which was paid to the Pre-IPO Owners on January 25, 2018. Such distribution was funded by a $26.0 million borrowing under the revolving credit facility. As of March 13, 2018, we had $8.0 million outstanding on the revolving credit facility.The Credit Agreement is secured by liens on substantially all of our properties and guarantees from Cactus LLC and any future subsidiaries of Cactus LLC that may become guarantors under the Credit Agreement. The Credit Agreement contains restrictive covenants that may limit our ability to, among other things:·incur additional indebtedness;·incur liens;46·enter into sale and lease‑back transactions;·make investments or dispositions;·make loans to others;·enter into mergers or consolidations;·enter into transactions with affiliates;·issue additional equity interests at the subsidiary level or issue disqualified equity interests; and·make or declare dividends.The Credit Agreement also requires us to maintain a total leverage ratio, as defined in the Credit Agreement, of not more than 5:00 to 1:00 as of the last day of any fiscal quarter, if the total aggregate principal amount of borrowings and letters of credit outstanding under the revolving credit facility (but excluding (x) undrawn letters of credit which have been cash collateralized by at least 103% of the undrawn amount of such letters of credit and (y) any other undrawn letters of credit up to $2.5 million in the aggregate as of the last day of such fiscal quarter) exceeds an amount equal to 30% of the aggregate revolving credit commitments as of such day.If an event of default occurs under the Credit Agreement, subject to certain cure rights with respect to certain of the events of default, the lenders will be able to accelerate the maturity of the Credit Agreement and all outstanding amounts thereunder, foreclose on the collateral and/or terminate their revolving loan commitments. The Credit Agreement contains customary events of default, such as, among other things:·inaccuracy of any representation and warranty;·failure to repay principal and interest when due and payable;·failure to comply with the financial covenant or other covenants;·cross‑default to certain other material indebtedness;·bankruptcy and other insolvency events;·the occurrence of certain litigation judgments; or·a change of control.As of December 31, 2017 and 2016, we were in compliance with all covenants under the Credit Agreement.Interest is payable quarterly for alternate base rate loans and at the end of the applicable interest period for Eurodollar loans (or quarterly if the applicable interest period is longer than three months). We have a choice of borrowing at an adjusted Eurodollar rate (subject to a 1.0% floor) plus an applicable margin or at the alternate base rate plus an applicable margin. The alternate base rate per annum is equal to the greatest of (i) the agent bank’s reference prime rate, (ii) the federal funds effective rate plus 0.5% and (iii) the adjusted LIBO rate for a one month interest period plus 1.0%. The applicable margin with respect to any Eurodollar revolving loan ranges from 2.75% to 3.75% and alternate base rate revolving loan ranges from 1.75% to 2.75% based on our total leverage ratio. During the continuance47of an event of default due to failure to pay interest or other amounts under the Credit Agreement, all overdue amounts under the Credit Agreement will bear interest at 2.0% plus the otherwise applicable interest rate.As of December 31, 2017 and 2016, borrowings under the Credit Agreement had a weighted average interest rate of 7.3% and 7.0%, respectively.Tax Receivable AgreementThe Tax Receivable Agreement that Cactus Inc. entered into with the(TRA) Holders in connection with our IPO generally provides for the payment by Cactus Inc. to the TRA Holders of 85% of the net cash savings, if any, in U.S. federal, state and local income tax orand franchise tax that Cactus Inc. actually realizes or is deemed to realize in certain circumstances. Cactus Inc. will retainretains the benefit of the remaining 15% of these net cash savings. To the extent Cactus LLCCompanies has available cash, we intend to cause Cactus LLCCompanies to make generally pro rata distributions to its unitholders,unit holders, including us,Cactus Inc., in an amount at least sufficient to allow us to pay our taxes and to make payments under the Tax Receivable Agreement.Tax Receivable AgreementTRA early, the Tax Receivable AgreementTRA is terminated early due to certain mergers, asset sales, or other forms of business combinations or changes of control relating to Cactus Companies or if we have available cash but fail to make payments when due under circumstances where we do not have the right to elect to defer the payment, wepayment. We may generally elect to defer payments due under the Tax Receivable AgreementTRA if we do not have available cash to satisfy our payment obligations under the Tax Receivable Agreement.TRA. Any such deferred payments under the Tax Receivable AgreementTRA generally will accrue interest. In certain cases, payments under the Tax Receivable Agreement TRATax Receivable Agreement.TRA. In these situations, our obligations under the Tax Receivable AgreementTRA could have a substantial negative impact on our liquidity. For further discussion regardingpotential acceleration of payments underrelevant tax law, we expect that if the Tax Receivable Agreement and its potential impact, please read “Item 1A. Risk Factors—Risks Related to Our Class A Common Stock.”Contractual ObligationsA summary of our predecessor’s contractual obligationsTRA were terminated as of December 31, 2017 is provided2022, the estimated termination payments, based on the assumptions discussed in Note 9 of the Notes to the Consolidated Financial Statements, would be approximately $291.2 million, calculated using a discount rate equal to one-year LIBOR plus 150 basis points, applied against an undiscounted liability of $456.6 million. A 10% increase in the price of our Class A common stock at December 31, 2022 would have increased the discounted liability by $10.8 million to $302.0 million (an undiscounted increase of $18.3 million to $474.9 million), and likewise, a 10% decrease in the price of our Class A common stock at December 31, 2022 would have decreased the discounted liability by $10.8 million to $280.4 million (an undiscounted decrease of $18.3 million to $438.3 million).table. Year Ended December 31, 2022 2021 (in thousands) Net cash provided by operating activities $ 117,884 $ 63,759 Net cash used in investing activities (25,536) (11,633) Net cash used in financing activities (47,382) (39,388) (1)Long‑term debt excludes interest payments on each obligation. The term loan was repaid in full in February 2018 in connection with our IPO.(2)Relates to our term loan. Interest on long‑term debt assumes no excess cash flow payments. Interest rate used for the calculation was 7.3%. The term loan, plus accrued interest, was repaid in full in February 2018 using the net proceeds from our IPO. As such, the entire interest expense reflected in the table will not be incurred.(3)Operating lease obligations relate to real estate, vehicles and equipment.(4)Capital lease obligations relate to vehicles used in our business.48The contractual obligations table does not include any Tax Receivable Agreement liabilityNet cash provided by operating activities was $117.9 million in 2022 compared to $63.8 million in 2021. Operating cash flows increased primarily due to an increase in income offset by an increase in working capital, largely related to the increase in inventory and increased accounts receivable associated with the redemptionshigher revenues, a $2.0 million increase in TRA payments and a $1.0 million increase in taxes paid, net of CW Units maderefunds.connectioninvesting activities was $25.5 million and $11.6 million for 2022 and 2021, respectively. The increase was primarily due to increased investments associated with our reorganizationrental fleet and IPOadditional investment in February 2018.The discussionanalysisassumptions that affect the accounting for and recognition and disclosure of assets, liabilities, equity, revenues and expenses. We must make these estimates and assumptions because certain information that we use is dependent on future events, cannot be calculated with a high degree of precision from available data or is not otherwise capable of being readily calculated based on generally accepted methodologies. In some cases, these estimates are particularly difficult to determine, and we must exercise significant judgment. Actual results could differ materially from the estimates and assumptions that we use in the preparation of our financial statements. We identify certain accounting policies as critical based on, among other things, their impact on the portrayal of our financial condition and results of operations are based upon our consolidated financial statements, which have been preparedand the degree of difficulty, subjectivity and complexity in accordance with GAAP. Thetheir deployment. Note 2 of the Notes to the Consolidated Financial Statements includes a summary of the significant accounting policies used in the preparation of our financial statements requires us to make estimates and assumptions that affect the reported amounts of assets, liabilities, revenues and expenses and related disclosure of contingent assets and liabilities. Certain accounting policies involve judgments and uncertainties to such an extent that there is reasonable likelihood that materially different amounts could have been reported under different conditions, or if different assumptions had been used. We evaluate our estimates and assumptions on a regular basis. We base our estimates on historical experience and various other assumptions that are believed to be reasonable under the circumstances, the results of which form the basis for making judgments about the carrying values of assets and liabilities that are not readily apparent from other sources. Actual results may differ from these estimates and assumptions used in preparation of ouraccompanying consolidated financial statements. See Note 2 in the notes to the audited consolidated financial statements of Cactus LLC for an expandedThe following is a brief discussion of our significantmost critical accounting policies and related estimates made by management.Accounts ReceivableWe extend credit to customers in the normal courseand assumptions. and weighted average methods.. Costs include an application of related direct labor and overhead cost. Net realizable value is the estimated selling price in the ordinary course of business, less reasonably predictable costs of completion, disposal and transportation. We evaluate the components of inventory on a regular basis for excess and obsolescence. Reserves are made for obsolete and slow‑moving items based on a range of factors, including age, usage and technological or market changes that may impact demand for those products. The amount of allowancereserve recorded is subjective and it may be that the level of provision required may be differentis susceptible to change from that initially recorded.The inventory obsolescence reserve as of December 31, 2017 was $5.9 million, comparedperiod to $4.8 million as of December 31, 2016, representing approximately 8.4% and 11.2%, respectively, of our consolidated gross inventories. A 10% increase in our inventory obsolescence reserve at December 31, 2017 would result in a change in reserves of approximately $0.6 million and a change in income before income taxes by the same amount. Currently, management does not believe that there is a reasonable likelihood that there will be a material change in the future estimates or assumptions that were used to calculate our inventory obsolescence reserve.49Actual impairment losses could vary from amounts estimated.GoodwillGoodwill represents the excessThe estimation of acquisition consideration paid over the fair value of identifiable net tangiblefuture cash flows and identifiable intangible assets acquired. Goodwill is not amortized, but is reviewed for impairment on an annual basis (or more frequently if impairment indicators exist). We have established December 31st as the date of our annual test for impairment of goodwill. We perform a qualitative assessment of the fair value of our reporting unit before calculating the fair value of the reporting unit in step one of the two‑step goodwill impairment model. If, through the qualitative assessment, we determine that it is more likely than not that the reporting unit’s fair value is greater than its carrying value, the remaining impairment steps would be unnecessary.If there are indicators that goodwill has been impairedhighly subjective and thus the two‑step goodwill impairment model is necessary, step one isinherently imprecise. Estimates can change materially from period to determine the fair value of the reporting unit and compare it to the reporting unit’s carrying value. Fair value is determinedperiod based on the present value of estimated cash flows using available information regarding expected cash flows of each reporting unit, discount rates and the expected long‑term cash flow growth rates. If the fair value of the reporting unit exceeds the carrying value, goodwill is not impaired and no further testing is performed. The second step is performedmany factors. Accordingly, if the carrying value exceeds the fair value. The implied fair value of the reporting unit’s goodwill must be determined and compared to the carrying value of the goodwill. If the carrying value of a reporting unit’s goodwill exceeds its implied fair value, an impairment loss equal to the difference will be recorded.Goodwill as of December 31, 2017 was $7.8 million, which is the same value as the year ended December 31, 2016. We performed our annual impairment analysis and concluded there was no impairment. A 10% decrease in the fair value of our reporting unit at December 31, 2017 would not result in an impairment. Currently, management does not believe that there is a reasonable likelihood that there will be a material change in the carrying value of goodwill.Product WarrantiesWe generally warrant our manufactured products 12 months from the date placed in service, although where product failures arise, they typically manifest themselves at the time of installation at the well site. Most failures are the result of installation errors rather than product defects and are addressed by not charging service time required to remedy such errors. In rare instances, our customers request compensation for non‑productive time at the well site. Any compensation provided is voluntarily granted to promote strong customer relationships, as our master service agreements include waivers of consequential damages.The accruals for product warranties as of December 31, 2017 were $0.3 million, compared to $0.1 million as of December 31, 2016, representing approximately 0.2% and 0.1% of our annualized product revenues for the respective periods. A 10% increase in our accruals for product warranties at December 31, 2017 would result in a change in accruals of less than $0.1 million and a change in income before income taxes by the same amount. Currently, management does not believe that there is a reasonable likelihood that there will be a materialconditions change in the future, estimates or assumptions that were usedwe may record impairment losses, which could be material to calculate our accruals for product warranties.50Cactus LLC is a limited liability company and files a U.S. Return of Partnership Income, which includes both U.S. and foreign operations. As a limited liability company, Cactus LLC is treated as a partnership, and the members of Cactus LLC are taxed individually on their share of our earnings for U.S. federal income tax purposes. Accordingly, no provision for U.S. federal income taxes has been made in the accompanying consolidated financial statements.We are subject to state taxes within the United States. However, the income generated by Cactus LLC flows through to the members’ individual state tax returns. Additionally, our operations in both Australia and China are subject to local country income taxes.We follow guidance issued by the Financial Accounting Standards Board (“FASB”), which clarifies accounting for uncertainty in income taxes by prescribing the minimum recognition threshold an income tax position is required to meet before being recognized in the consolidated financial statements and applies to all income tax positions. Each income tax position is assessed using a two‑step process. A determination is first made as to whether it is more likely than not that the income tax position will be sustained, based upon technical merits, upon examination by the taxing authorities. If the income tax position is expected to meet the more likely than not criteria, the benefit recorded in the consolidated financial statements equals the largest amount that is greater than 50% likely to be realized upon its ultimate settlement. effect for the year in which the differences are expected to reverse. The realizability of deferred tax assets are evaluated annually and a valuation allowance is provided if it is more likely than notWe assess the likelihood that theour deferred tax assets will not give risebe recovered through adjustments to future benefitstaxable income. To the extent we believe recovery is not likely, we establish a valuation allowance to reduce the asset to a value we believe will be recoverable based on our expectation of future taxable income. In evaluating our ability to recover our deferred tax assets, we consider all available positive and negative evidence, including scheduled reversals of deferred tax liabilities, projected future taxable income, tax planning strategies and results of recent operations. The assumptions about future taxable income require significant judgment and are consistent with the plans and estimates management is using to manage the underlying business. If the projected future taxable income changes materially, we may be required to reassess the amount of valuation allowance recorded against our deferred tax assets.returns.We intendbasis resulting from the repayment of borrowings outstanding under Cactus LLC’s term loan facility in connection with our IPO and (iii) imputed interest deemed to account forbe paid by Cactus Inc. as a result of, and additional tax basis arising from, any amounts payablepayments Cactus Inc. makes under the Tax Receivable AgreementTRA. We retain the remaining 15% of the cash savings. The TRA liability is calculated by determining the tax basis subject to TRA (“tax basis”) and applying a blended tax rate to the basis differences and calculating the iterative impact. The blended tax rate consists of the U.S. federal income tax rate and an assumed combined state and local income tax rate driven by the apportionment factors applicable to each state.accordance with ASC 450. We believe accounting foradjustments to the Tax Receivable Agreementtax basis of the tangible and intangible assets of Cactus LLC. These adjustments were allocated to Cactus Inc. Such adjustments to the tax basis of the tangible and intangible assets of Cactus LLC would not have been available to Cactus Inc. absent its acquisition or deemed acquisition of CW Units. In addition, the repayment of borrowings outstanding under the provisionsCactus LLC term loan facility resulted in adjustments to the tax basis of ASC 450the tangible and intangible assets of Cactus LLC, a portion of which was allocated to Cactus Inc. These basis adjustments are expected to increase (for tax purposes) Cactus Inc.’s depreciation and amortization deductions and may also decrease Cactus Inc.’s gains (or increase its losses) on future dispositions of certain assets to the extent tax basis is appropriate, givenallocated to those assets. Such increased deductions and losses and reduced gains may reduce the significant uncertainties regardingamount of tax that Cactus Inc. would otherwise be required to pay in the future. payments, if any, to be made under the Tax Receivable Agreement.U.S. Federal Income Tax ReformOn December 22, 2017,tax benefit is by its nature imprecise and the Presidentassumptions used in the estimates can change. The tax benefit is dependent upon future events and assumptions, the amount of the United States signed into law legislation informally known as the Tax Cuts and Jobs Act (the “Act”). The Act represents majorredeeming unit holders’ tax reform legislation that, among other provisions, reduces the U.S. corporate tax rate. As of December 31, 2017, since Cactus LLC is a pass-through entity, management considers that the abovementioned Act will have an immaterial impact. However, going forward, the Company will analyze the impact based on revised circumstances.Fair Value MeasuresFair value measurements—We record our financial assets and financial liabilities at fair value. Fair value is defined as the price that would be received to sell an asset or paid to transfer a liability (an exit price)basis in an orderly transaction between market participantsits CC Units (formerly CW Units) at the reporting date. The fair value framework requirestime of the categorization of assetsrelevant redemption, the depreciation and liabilities into three levels based uponamortization periods that apply to the assumptions (inputs) used to price the assets or liabilities, with the exception of certain assets and liabilities measured using the net asset value practical expedient, which are not required to be leveled. Level 1 provides the most reliable measure of fair value, whereas Level 3 generally requires significant management judgment. The three levels are defined as follows:·Level 1: Unadjusted quoted prices in active markets for identical assets and liabilities.51·Level 2: Observable inputs other than quoted prices included in Level 1. For example, quoted prices for similar assets or liabilities in active markets or quoted prices for identical assets or liabilities in inactive markets.·Level 3: Unobservable inputs reflecting management’s own assumptions about the assumptions market participants would use in pricing the asset or liability.Fair value of long‑lived, non‑financial assets—Long‑lived, non‑financial assets are measured at fair value on a non‑recurringincrease in tax basis, for the purposes of calculating potential impairment. The fair value measurements of our long‑lived, non‑financial assets measured on a non‑recurring basis are determined by estimating the amount and timing of nettaxable income we generate in the future cash flows, which are Level 3 unobservable inputs, and discounting them using a risk‑adjustedthe U.S. federal, state and local income tax rate then applicable, and the portion of interest. Significant increasesCactus Inc.’s payments under the TRA that constitute imputed interest or decreases in actual cash flows may result in valuation changes.Other fair value disclosures—give rise to depreciable or amortizable tax basis. The carrying amounts of cash and cash equivalents, receivables, accounts payable, short‑term debt, commercial paper, debt associated with our Credit Agreement as well as amountsmost critical estimate included in other current assets and other current liabilities that meetcalculating the definition of financial instruments, approximate fair value.Stock‑based CompensationWe recognize stock-based compensation expense using a fair value method. Fair value methods use a valuation modelTRA liability to theoretically value stock option grants even though they are not available for trading and are of longer duration. The Black‑Scholes‑Merton option‑pricing model that we use includesrecord is the input of certain variables that are dependent on future expectations, including the expected lives of the options from grant date to maturity date, the level of volatility of peer companies in our industry, risk‑free interestcombined U.S. federal income tax rate and an assumption that there will be no forfeitures or future distributions. Our estimates of these variables are made for the purpose of using the valuation model to determine an expense for each reporting periodassumed combined state and are not subsequently adjusted. These estimates are not considered highly complex or subjective. These estimates will not be necessarylocal income tax rate, to determine the fair value of new stock awards oncefuture benefit we will realize. A 100 basis point decrease/increase in the underlying shares begin trading.See Note 2the notes2022 and there are no new accounting pronouncements issued but not yet effective that are expected to the audited consolidated financial statements of Cactus LLC for discussion of recent accounting pronouncements.InflationInflation in the United States has been relatively low in recent years and did not have a material impact on our consolidated financial statements.operations for the years ended December 31, 2017, 2016 and 2015. Although the impact of inflation has been insignificant in recent years, it is still a factor inoperations. In 2022, the United States economy,experienced the highest inflation in decades primarily due to supply-chain issues, a shortage of labor and a build-up of demand for goods and services. The most noticeable adverse impact to our business was increased costs associated with freight, materials, vehicle-related costs and personnel expenses. While we tendhave seen some of these costs begin to experience inflationary pressure on wages and raw materials.Off‑Balance Sheet ArrangementsCurrently, neithermoderate, we nor our predecessor have off‑balance sheet arrangements.52outsource certain of our wellhead equipment to suppliershave subsidiaries with operations in China and our production facilityAustralia who conduct business in China assemblestheir local currencies (functional currencies) and tests these outsourced components, asare therefore subject to foreign currency exchange rate risk on cash flows related to sales, expenses, financing and investing transactions in currencies other than the U.S. dollar. Currently, we do not engagehave any open foreign currency forward contracts to hedge this risk.machining operationsU.S. dollars. Since this is not the functional currency of our subsidiaries in this facility.China and Australia, the changes in these balances are translated in our Consolidated Statements of Income, resulting in the recognition of a remeasurement gain or loss. In addition, we haveorder to provide a service center in Australia that sells products, rents frac equipment and provides field services. Tohedge against currency fluctuations on the extent either facility has net U.S. dollar denominated assets and liabilities held by our profitability is eroded when the U.S. dollar weakens against the Chinese Yuan and the Australian dollar. Our production facility in China generally has net U.S. dollar denominated assets, while our service center in Australia generally has net U.S. dollar denominated liabilities. The U.S. dollar translated profits and net assets of our facilities in China and Australia are eroded if the respective local currency value weakens against the U.S. dollar. We have not enteredforeign subsidiaries, we enter into any derivative arrangements to protect against fluctuations inmonthly foreign currency exchange rates.During 2015, we entered into an interest rate hedge withforward contracts (balance sheet hedges) to offset a duration of five years, expiring in July 2020, to manage our exposure under the term loan tranche of our Credit Agreement. Pursuant to the termsportion of the hedge contract, we are not liable for any interest arising from LIBOR exceeding 6% with respect to up to $200 million of our borrowings outstanding under our term loan.remeasurement gain or loss recorded. As of December 31, 2017, 2016 and 2015,2022, if the fairU.S. dollar strengthened or weakened 5%, the impact to the unrealized value of our forward contracts would be approximately $0.5 million. The gain or loss on the hedgeforward contracts would be largely offset by the gain or loss on the underlying transactions, and therefore, would have minimal impact on future earnings.$1,000, $68,000 and $88,000, respectively. In conjunction with1.25% plus the completionbase rate of our IPO and the repayment in fullone, three or six month SOFR plus 0.10%, subject to a floor rate of our outstanding term loan using the net proceeds from our IPO, we terminated the hedge contract for no value.0%.53555657Cactus Wellhead, LLC (Predecessor)54/s/ Scott Bender /s/ Stephen Tadlock President, Chief Executive Officer and Director Vice President, Chief Financial Officer and Treasurer Houston, Texas March 1, 2023 Opinion20172022 and February 17, 2017,2021, and the related consolidated statements of income, of comprehensive income, of stockholders’ equity and of cash flows for each of the three years in the period ended December 31, 2022, including the related notes (collectively referred to as the “financial“consolidated financial statements”). We also have audited the Company's internal control over financial reporting as of December 31, 2022, based on criteria established in Internal Control - Integrated Framework (2013) issued by the Committee of Sponsoring Organizations of the Treadway Commission (COSO). 20172022 and February 17, 20172021, and the results of its operations and its cash flows for each of the three years in the period ended December 31, 2022 in conformity with accounting principles generally accepted in the United States of America.Opinionare the responsibilityfor maintaining effective internal control over financial reporting, and for its assessment of the Company’s management.effectiveness of internal control over financial reporting, included in the accompanying Management's Report on Internal Control over Financial Reporting. Our responsibility is to express an opinionopinions on the Company’s consolidated financial statements and on the Company's internal control over financial reporting based on our audits. We are a public accounting firm registered with the Public Company Accounting Oversight Board (United States) (“PCAOB”)(PCAOB) and are required to be independent with respect to the Company in accordance with the U.S. federal securities laws and the applicable rules and regulations of the Securities and Exchange Commission and the PCAOB. of these financial statements in accordance with the standards of the PCAOB. Those standards require that we plan and perform the audit to obtain reasonable assurance about whether the financial statements are free of material misstatement, whether due to error or fraud.Our audits included performing procedures to assess the risks of material misstatement of the financial statements, whether due to error or fraud, and performing procedures that respond to those risks. Such procedures included examining, on a test basis, evidence regarding the amounts and disclosures in the financial statements. Our audits also included evaluating the accounting principles used and significant estimates made by management, as well as evaluating the overall presentation of the financial statements. We believe that our audits provide a reasonable basis for our opinion./s/ PricewaterhouseCoopers LLPHouston, TexasMarch 19, 2018We have served as the Company’s auditor since 2015.55CACTUS, INC.The accompanying notes are an integral part of this balance sheet.56CACTUS, INC.(in thousands, unless otherwise indicated)1. Organization and OperationsCactus, Inc. (the “Company”) is a Delaware corporation, incorporated on February 17, 2017. Pursuant to a reorganization and completion of the Company’s initial public offering on February 12, 2018 (the “IPO”), the Company became a holding corporation for Cactus Wellhead, LLC (“Cactus LLC”) and its subsidiaries. Following completion of the IPO, the Company’s sole material assets are units in Cactus LLC (“CW Units”). See note 4.2. Summary of Significant Accounting PoliciesBasis of PresentationThe Company’s balance sheet has been prepared in accordance with U.S. generally accepted accounting principles. Separate statements of income and comprehensive income, cash flows and changes in stockholder’s equity have not been presented because the Company has had no operations to date.3. Stockholder’s EquityAs of December 31, 2017, the Company was authorized to issue 1 million shares of common stock with a par value of $0.01 per share. The Board of Directors has the authority to issue one or more series of preferred stock without stockholder approval. In conjunction with the IPO, the Company amended its articles of incorporation to increase the number of authorized shares.4. Subsequent EventsOn February 12, 2018, in connection with the completion of the Company’s IPO, Cactus Inc. became the managing member of Cactus LLC and is responsible for all operational, management and administrative decisions relating to Cactus LLC’s business.Pursuant to the IPO, the Company issued 23,000,000 shares of Class A common stock, par value $0.01 per share (“Class A Common Stock”), at a price to the public of $19.00 per share. The Company received net proceeds of $405.8 million after deducting underwriting discounts and commissions and estimated offering expenses of the IPO. On February 14, 2018 the Company sold an additional 3,450,000 shares of Class A Common Stock pursuant to the exercise by the underwriters in full of their option to purchase additional shares of Class A Common Stock (the “Option”), resulting in $61.6 million of additional net proceeds after deducting underwriting discounts and commissions. The Company contributed all of the net proceeds of the IPO to Cactus LLC in exchange for CW Units. Cactus LLC used (i) $251.0 million of the net proceeds to repay all of the borrowings outstanding under its term loan facility, including accrued interest and (ii) $216.4 million to redeem CW Units from certain direct and indirect owners of Cactus LLC.57Report of Independent Registered Public Accounting FirmTo the Board of Directors and Unitholders of Cactus Wellhead, LLCOpinion on the Financial StatementsWe have audited the accompanying consolidated balance sheets of Cactus Wellhead, LLC and its subsidiaries (the “Company”) as of December 31, 2017 and 2016, and the related consolidated statements of income, comprehensive income, members’ equity (deficit) and cash flows for each of the three years in the period ended December 31, 2017, including the related notes (collectively referred to as the “consolidated financial statements”). In our opinion, the consolidated financial statements present fairly, in all material respects, the financial position of the Company as of December 31, 2017 and 2016, and the results of their operations and their cash flows for each of the three years in the period ended December 31, 2017 in conformity with accounting principles generally accepted in the United States of America.Basis for OpinionThese consolidated financial statements are the responsibility of the Company’s management. Our responsibility is to express an opinion on the Company’s consolidated financial statements based on our audits. We are a public accounting firm registered with the Public Company Accounting Oversight Board (United States) (“PCAOB”) and are required to be independent with respect to the Company in accordance with the U.S. federal securities laws and the applicable rules and regulations of the Securities and Exchange Commission and the PCAOB.We conducted our audits of these consolidated financial statements in accordance with the standards of the PCAOB. Those standards require that we plan and perform the audit to obtain reasonable assurance about whether the consolidated financial statements are free of material misstatement, whether due to error or fraud.opinion.19, 20182015.2015, which includes periods before the Company became subject to SEC reporting requirements.58WELLHEAD, LLCINC. AND SUBSIDIARIES December 31, 2022 2021 (in thousands, except per share data) Assets Current assets Cash and cash equivalents $ 344,527 $ 301,669 Accounts receivable, net of allowance of $1,060 and $741, respectively Accounts receivable, net of allowance of $1,060 and $741, respectively 138,268 89,205 Inventories 161,283 119,817 Prepaid expenses and other current assets 10,564 7,794 Total current assets 654,642 518,485 Property and equipment, net 129,998 129,117 Operating lease right-of-use assets, net Operating lease right-of-use assets, net 23,183 22,538 Goodwill 7,824 7,824 Deferred tax asset, net Deferred tax asset, net 301,644 303,074 Other noncurrent assets 1,605 1,040 Total assets $ 1,118,896 $ 982,078 Liabilities and Equity Liabilities and Equity Current liabilities Accounts payable Accounts payable $ 47,776 $ 42,818 Accrued expenses and other current liabilities Accrued expenses and other current liabilities 30,619 28,240 Current portion of liability related to tax receivable agreement Current portion of liability related to tax receivable agreement 27,544 11,769 Finance lease obligations, current portion Finance lease obligations, current portion 5,933 4,867 Operating lease liabilities, current portion Operating lease liabilities, current portion 4,777 4,880 Total current liabilities 116,649 92,574 Deferred tax liability, net 1,966 1,172 Liability related to tax receivable agreement, net of current portion Liability related to tax receivable agreement, net of current portion 265,025 269,838 Finance lease obligations, net of current portion Finance lease obligations, net of current portion 6,436 5,811 Operating lease liabilities, net of current portion Operating lease liabilities, net of current portion 18,375 17,650 Total liabilities 408,451 387,045 Commitments and contingencies Stockholders’ equity Stockholders’ equity Preferred stock, $0.01 par value, 10,000 shares authorized, none issued and outstanding Preferred stock, $0.01 par value, 10,000 shares authorized, none issued and outstanding — — Class A common stock, $0.01 par value, 300,000 shares authorized, 60,903 and 59,035 shares issued and outstanding Class A common stock, $0.01 par value, 300,000 shares authorized, 60,903 and 59,035 shares issued and outstanding 609 590 Class B common stock, $0.01 par value, 215,000 shares authorized, 14,978 and 16,674 shares issued and outstanding Class B common stock, $0.01 par value, 215,000 shares authorized, 14,978 and 16,674 shares issued and outstanding — — Additional paid-in capital Additional paid-in capital 310,528 289,600 Retained earnings Retained earnings 261,764 178,446 Accumulated other comprehensive income (loss) (984) 8 Total stockholders’ equity attributable to Cactus Inc. Total stockholders’ equity attributable to Cactus Inc. 571,917 468,644 Non-controlling interest Non-controlling interest 138,528 126,389 Total stockholders’ equity Total stockholders’ equity 710,445 595,033 Total liabilities and equity Total liabilities and equity $ 1,118,896 $ 982,078 59WELLHEAD, LLCINC. AND SUBSIDIARIES Year Ended December 31, 2022 2021 2020 (in thousands, except per share data) Revenues Product revenue $ 452,615 $ 280,907 $ 206,801 Rental revenue 100,453 61,629 66,169 Field service and other revenue 135,301 96,053 75,596 Total revenues 688,369 438,589 348,566 Costs and expenses Cost of product revenue 277,871 189,083 131,728 Cost of rental revenue 62,037 54,377 49,077 Cost of field service and other revenue 106,013 73,681 56,143 Selling, general and administrative expenses 67,700 46,021 39,715 Severance expenses Severance expenses — — 1,864 Total costs and expenses 513,621 363,162 278,527 Income from operations 174,748 75,427 70,039 Interest income (expense), net Interest income (expense), net 3,714 (774) 701 Other income (expense), net (1,910) 492 (555) Income before income taxes Income before income taxes 176,552 75,145 70,185 Income tax expense 31,430 7,675 10,970 Net income Net income $ 145,122 $ 67,470 $ 59,215 Less: net income attributable to non-controlling interest Less: net income attributable to non-controlling interest 34,948 17,877 24,769 Net income attributable to Cactus Inc. Net income attributable to Cactus Inc. $ 110,174 $ 49,593 $ 34,446 Earnings per Class A share - basic Earnings per Class A share - basic $ 1.83 $ 0.90 $ 0.73 Earnings per Class A share - diluted Earnings per Class A share - diluted $ 1.80 $ 0.83 $ 0.72 Weighted average Class A shares outstanding - basic Weighted average Class A shares outstanding - basic 60,323 55,398 47,457 Weighted average Class A shares outstanding - diluted Weighted average Class A shares outstanding - diluted 76,337 76,107 75,495
60
CACTUS, WELLHEAD, LLCINC. AND SUBSIDIARIES
|
|
|
|
|
|
|
|
|
|
|
| Year Ended December 31, | |||||||
|
| 2017 |
| 2016 |
| 2015 | |||
|
| (in thousands) | |||||||
Net income (loss) |
| $ | 66,547 |
| $ | (8,176) |
| $ | 21,224 |
Foreign currency translation |
|
| 557 |
|
| (284) |
|
| (215) |
Total comprehensive income (loss) |
| $ | 67,104 |
| $ | (8,460) |
| $ | 21,009 |
| Year Ended December 31, | |||||||||||||||||
| 2022 | 2021 | 2020 | |||||||||||||||
| (in thousands) | |||||||||||||||||
| Net income | $ | 145,122 | $ | 67,470 | $ | 59,215 | |||||||||||
| Foreign currency translation adjustments | (1,308) | (567) | 1,375 | ||||||||||||||
| Comprehensive income | 143,814 | 66,903 | 60,590 | ||||||||||||||
| Less: comprehensive income attributable to non-controlling interest | 34,632 | 17,632 | 25,362 | ||||||||||||||
| Comprehensive income attributable to Cactus Inc. | $ | 109,182 | $ | 49,271 | $ | 35,228 | |||||||||||
61
CACTUS, WELLHEAD, LLCINC. AND SUBSIDIARIES
|
|
|
|
|
|
|
|
|
|
|
|
|
|
| Accumulated |
| Total | ||
|
| Members' |
| Other |
| Members' | |||
|
| Equity |
| Comprehensive |
| Equity | |||
|
| (Deficit) |
| Income (Loss) |
| (Deficit) | |||
|
|
| (in thousands) | ||||||
Balances at December 31, 2014 |
| $ | (102,327) |
| $ | 24 |
| $ | (102,303) |
Member distributions |
|
| (12,232) |
|
| — |
|
| (12,232) |
Other comprehensive income (loss) |
|
| — |
|
| (215) |
|
| (215) |
Equity based compensation |
|
| 359 |
|
| — |
|
| 359 |
Net income |
|
| 21,224 |
|
| — |
|
| 21,224 |
Balances at December 31, 2015 |
|
| (92,976) |
|
| (191) |
|
| (93,167) |
Member distributions |
|
| (2,055) |
|
| — |
|
| (2,055) |
Other comprehensive income (loss) |
|
| — |
|
| (284) |
|
| (284) |
Equity based compensation |
|
| 361 |
|
| — |
|
| 361 |
Net loss |
|
| (8,176) |
|
| — |
|
| (8,176) |
Balances at December 31, 2016 |
|
| (102,846) |
|
| (475) |
|
| (103,321) |
Other comprehensive income (loss) |
|
| — |
|
| 557 |
|
| 557 |
Net income |
|
| 66,547 |
|
| — |
|
| 66,547 |
Balances at December 31, 2017 |
| $ | (36,299) |
| $ | 82 |
| $ | (36,217) |
| Class A Common Stock | Class B Common Stock | Additional Paid-In Capital | Retained Earnings | Accumulated Other Comprehensive Income (Loss) | Non-controlling Interest | Total Equity | |||||||||||||||||||||||||||||||||||||||||||||||
| (in thousands) | Shares | Amount | Shares | Amount | |||||||||||||||||||||||||||||||||||||||||||||||||
| Balance at December 31, 2019 | 47,159 | $ | 472 | 27,958 | $ | — | $ | 194,456 | $ | 132,990 | $ | (452) | $ | 188,929 | $ | 516,395 | |||||||||||||||||||||||||||||||||||||
| Member distributions | — | — | — | — | — | — | — | (16,304) | (16,304) | ||||||||||||||||||||||||||||||||||||||||||||
| Effect of CW Unit redemptions | 303 | 3 | (303) | — | 2,155 | — | — | (2,158) | — | ||||||||||||||||||||||||||||||||||||||||||||
| Tax impact of equity transactions | — | — | — | — | 284 | — | — | — | 284 | ||||||||||||||||||||||||||||||||||||||||||||
| Equity award vestings | 251 | 2 | — | — | (238) | — | — | (1,208) | (1,444) | ||||||||||||||||||||||||||||||||||||||||||||
| Other comprehensive income | — | — | — | — | — | — | 782 | 593 | 1,375 | ||||||||||||||||||||||||||||||||||||||||||||
| Stock-based compensation | — | — | — | — | 5,420 | — | — | 3,179 | 8,599 | ||||||||||||||||||||||||||||||||||||||||||||
| Cash dividends declared ($0.36 per share) | — | — | — | (17,350) | — | — | (17,350) | ||||||||||||||||||||||||||||||||||||||||||||||
| Net income | — | — | — | — | — | 34,446 | — | 24,769 | 59,215 | ||||||||||||||||||||||||||||||||||||||||||||
| Balance at December 31, 2020 | 47,713 | $ | 477 | 27,655 | $ | — | $ | 202,077 | $ | 150,086 | $ | 330 | $ | 197,800 | $ | 550,770 | |||||||||||||||||||||||||||||||||||||
| Member distributions | — | — | — | — | — | — | — | (9,742) | (9,742) | ||||||||||||||||||||||||||||||||||||||||||||
| Effect of CW Unit redemptions | 10,981 | 110 | (10,981) | — | 79,276 | — | — | (79,386) | — | ||||||||||||||||||||||||||||||||||||||||||||
| Tax impact of equity transactions | — | — | — | — | 2,998 | — | — | — | 2,998 | ||||||||||||||||||||||||||||||||||||||||||||
| Equity award vestings | 341 | 3 | — | — | (1,141) | — | — | (2,145) | (3,283) | ||||||||||||||||||||||||||||||||||||||||||||
| Other comprehensive loss | — | — | — | — | — | — | (322) | (245) | (567) | ||||||||||||||||||||||||||||||||||||||||||||
| Stock-based compensation | — | — | — | — | 6,390 | — | — | 2,230 | 8,620 | ||||||||||||||||||||||||||||||||||||||||||||
| Cash dividends declared ($0.38 per share) | — | — | — | (21,233) | — | — | (21,233) | ||||||||||||||||||||||||||||||||||||||||||||||
| Net income | — | — | — | — | — | 49,593 | — | 17,877 | 67,470 | ||||||||||||||||||||||||||||||||||||||||||||
| Balance at December 31, 2021 | 59,035 | $ | 590 | 16,674 | $ | — | $ | 289,600 | $ | 178,446 | $ | 8 | $ | 126,389 | $ | 595,033 | |||||||||||||||||||||||||||||||||||||
| Member distributions | — | — | — | — | — | — | — | (9,692) | (9,692) | ||||||||||||||||||||||||||||||||||||||||||||
| Effect of CW Unit redemptions | 1,696 | 17 | (1,696) | — | 13,690 | — | — | (13,707) | — | ||||||||||||||||||||||||||||||||||||||||||||
| Tax impact of equity transactions | — | — | — | — | 2,076 | — | — | — | 2,076 | ||||||||||||||||||||||||||||||||||||||||||||
| Equity award vestings | 172 | 2 | — | — | (3,306) | — | — | (1,257) | (4,561) | ||||||||||||||||||||||||||||||||||||||||||||
| Other comprehensive loss | — | — | — | — | — | — | (992) | (316) | (1,308) | ||||||||||||||||||||||||||||||||||||||||||||
| Stock-based compensation | — | — | — | — | 8,468 | — | — | 2,163 | 10,631 | ||||||||||||||||||||||||||||||||||||||||||||
| Cash dividends declared ($0.44 per share) | — | — | — | (26,856) | — | — | (26,856) | ||||||||||||||||||||||||||||||||||||||||||||||
| Net income | — | — | — | — | — | 110,174 | — | 34,948 | 145,122 | ||||||||||||||||||||||||||||||||||||||||||||
| Balance at December 31, 2022 | 60,903 | $ | 609 | 14,978 | $ | — | $ | 310,528 | $ | 261,764 | $ | (984) | $ | 138,528 | $ | 710,445 | |||||||||||||||||||||||||||||||||||||
62
CACTUS, WELLHEAD, LLCINC. AND SUBSIDIARIES
|
|
|
|
|
|
|
|
|
| |||||||||||||||||
|
| Year Ended December 31, | Year Ended December 31, | |||||||||||||||||||||||
|
| 2017 |
| 2016 |
| 2015 | 2022 | 2021 | 2020 | |||||||||||||||||
|
| (in thousands) | (in thousands) | |||||||||||||||||||||||
Cash flows from operating activities |
|
|
|
|
|
|
|
|
| Cash flows from operating activities | ||||||||||||||||
Net income (loss) |
| $ | 66,547 |
| $ | (8,176) |
| $ | 21,224 | |||||||||||||||||
Reconciliation of net income (loss) to net cash provided by operating activities |
|
|
|
|
|
|
|
|
| |||||||||||||||||
| Net income | Net income | $ | 145,122 | $ | 67,470 | $ | 59,215 | |||||||||||||||||||
| Reconciliation of net income to net cash provided by operating activities: | Reconciliation of net income to net cash provided by operating activities: | |||||||||||||||||||||||||
Depreciation and amortization |
|
| 23,271 |
|
| 21,241 |
|
| 20,580 | Depreciation and amortization | 34,124 | 36,308 | 40,520 | |||||||||||||
Debt discount and deferred loan cost amortization |
|
| 1,752 |
|
| 1,777 |
|
| 1,913 | |||||||||||||||||
| Deferred financing cost amortization | Deferred financing cost amortization | 165 | 168 | 168 | ||||||||||||||||||||||
Stock-based compensation |
|
| — |
|
| 361 |
|
| 359 | Stock-based compensation | 10,631 | 8,620 | 8,599 | |||||||||||||
Provision for (recovery of) bad debts |
|
| (100) |
|
| (357) |
|
| 250 | |||||||||||||||||
| Provision for expected credit losses | Provision for expected credit losses | 406 | 310 | 342 | ||||||||||||||||||||||
Inventory obsolescence |
|
| 1,259 |
|
| 1,851 |
|
| 2,343 | Inventory obsolescence | 2,739 | 3,490 | 4,840 | |||||||||||||
Loss on disposal of assets |
|
| 534 |
|
| 950 |
|
| 402 | |||||||||||||||||
| Gain on disposal of assets | Gain on disposal of assets | (1,391) | (1,386) | (2,480) | ||||||||||||||||||||||
Deferred income taxes |
|
| 220 |
|
| 132 |
|
| 64 | Deferred income taxes | 25,299 | 4,829 | 6,948 | |||||||||||||
Gain on debt extinguishment |
|
| — |
|
| (2,251) |
|
| (1,640) | |||||||||||||||||
Changes in operating assets and liabilities |
|
|
|
|
|
|
|
|
| |||||||||||||||||
Accounts receivable-trade |
|
| (50,094) |
|
| 509 |
|
| 12,829 | |||||||||||||||||
| (Gain) loss from revaluation of liability related to tax receivable agreement | (Gain) loss from revaluation of liability related to tax receivable agreement | 1,910 | (898) | 555 | ||||||||||||||||||||||
| Changes in operating assets and liabilities: | Changes in operating assets and liabilities: | |||||||||||||||||||||||||
| Accounts receivable | Accounts receivable | (49,349) | (45,492) | 44,829 | ||||||||||||||||||||||
Inventories |
|
| (28,279) |
|
| 4,126 |
|
| 10,563 | Inventories | (44,891) | (36,083) | 18,201 | |||||||||||||
Prepaid expenses and other assets |
|
| (4,012) |
|
| 1,080 |
|
| 127 | Prepaid expenses and other assets | (3,108) | (2,789) | 6,177 | |||||||||||||
Accounts payable-trade |
|
| 19,505 |
|
| 5,014 |
|
| (18,703) | |||||||||||||||||
| Accounts payable | Accounts payable | 5,803 | 22,281 | (19,434) | ||||||||||||||||||||||
Accrued expenses and other liabilities |
|
| 4,104 |
|
| (2,282) |
|
| (4,384) | Accrued expenses and other liabilities | 2,090 | 16,628 | (10,893) | |||||||||||||
| Payments pursuant to tax receivable agreement | Payments pursuant to tax receivable agreement | (11,666) | (9,697) | (14,207) | ||||||||||||||||||||||
Net cash provided by operating activities |
|
| 34,707 |
|
| 23,975 |
|
| 45,927 | Net cash provided by operating activities | 117,884 | 63,759 | 143,380 | |||||||||||||
|
|
|
|
|
|
|
|
|
| |||||||||||||||||
Cash flows from investing activities |
|
|
|
|
|
|
|
|
| Cash flows from investing activities | ||||||||||||||||
Capital expenditures |
|
| (32,074) |
|
| (21,677) |
|
| (25,281) | |||||||||||||||||
Patent expenditures |
|
| (8) |
|
| (44) |
|
| — | |||||||||||||||||
| Capital expenditures and other | Capital expenditures and other | (28,291) | (13,939) | (24,493) | ||||||||||||||||||||||
Proceeds from sale of assets |
|
| 1,404 |
|
| 4,363 |
|
| 1,859 | Proceeds from sale of assets | 2,755 | 2,306 | 6,346 | |||||||||||||
Net cash used in investing activities |
|
| (30,678) |
|
| (17,358) |
|
| (23,422) | Net cash used in investing activities | (25,536) | (11,633) | (18,147) | |||||||||||||
|
|
|
|
|
|
|
|
|
| |||||||||||||||||
Cash flows from financing activities |
|
|
|
|
|
|
|
|
| Cash flows from financing activities | ||||||||||||||||
Principal payments on long-term debt |
|
| (2,569) |
|
| (7,908) |
|
| (10,525) | |||||||||||||||||
Payments on capital leases |
|
| (2,744) |
|
| (208) |
|
| — | |||||||||||||||||
Payments for deferred loan costs |
|
| — |
|
| — |
|
| (19) | |||||||||||||||||
| Payment of deferred financing costs | Payment of deferred financing costs | (353) | — | — | ||||||||||||||||||||||
| Payments on finance leases | Payments on finance leases | (6,055) | (5,205) | (5,317) | ||||||||||||||||||||||
| Dividends paid to Class A common stock shareholders | Dividends paid to Class A common stock shareholders | (26,719) | (21,158) | (17,140) | ||||||||||||||||||||||
Distributions to members |
|
| — |
|
| (2,055) |
|
| (12,232) | Distributions to members | (9,692) | (9,742) | (16,304) | |||||||||||||
| Repurchases of shares | Repurchases of shares | (4,563) | (3,283) | (1,445) | ||||||||||||||||||||||
Net cash used in financing activities |
|
| (5,313) |
|
| (10,171) |
|
| (22,776) | Net cash used in financing activities | (47,382) | (39,388) | (40,206) | |||||||||||||
|
|
|
|
|
|
|
|
|
| |||||||||||||||||
Effect of exchange rate changes on cash and cash equivalents |
|
| 170 |
|
| (284) |
|
| (128) | Effect of exchange rate changes on cash and cash equivalents | (2,108) | 272 | 1,029 | |||||||||||||
|
|
|
|
|
|
|
|
|
| |||||||||||||||||
Net increase (decrease) in cash and cash equivalents |
|
| (1,114) |
|
| (3,838) |
|
| (399) | |||||||||||||||||
| Net increase in cash and cash equivalents | Net increase in cash and cash equivalents | 42,858 | 13,010 | 86,056 | ||||||||||||||||||||||
|
|
|
|
|
|
|
|
|
| |||||||||||||||||
Cash and cash equivalents |
|
|
|
|
|
|
|
|
| Cash and cash equivalents | ||||||||||||||||
Beginning of period |
|
| 8,688 |
|
| 12,526 |
|
| 12,925 | Beginning of period | 301,669 | 288,659 | 202,603 | |||||||||||||
End of period |
| $ | 7,574 |
| $ | 8,688 |
| $ | 12,526 | End of period | $ | 344,527 | $ | 301,669 | $ | 288,659 | ||||||||||
63
CACTUS, WELLHEAD, LLCINC. AND SUBSIDIARIES
Cactus LLC, Suzhou and CWA (collectively, “Cactus”, “we”, “us” and “our”) are primarily engaged in the design, manufacture and saleDecember 31, 2022. The post-acquisition results of wellheads and pressure control equipment. In addition, we maintain a fleet of frac trees and ancillary equipment for short‑term rental, we offer repair and refurbishment services and we provide service crews to assist in the installation and operations of pressure control systems atFlexSteel will first be included in our consolidated results for the wellhead. We operate through 14 U.S. service centers principally locatedperiod ending March 31, 2023. See further discussion of the acquisition in Texas, Oklahoma, New Mexico, Louisiana, Pennsylvania, North Dakota, Wyoming, Colorado, and one service center in Australia, with our corporate headquarters located in Houston, Texas.
On February 12, 2018, Cactus, Inc. (“Cactus Inc.”) completed the initial public offering of Class A common stock (the “IPO”)Note 15. “Subsequent Events”. Pursuant to a reorganization and the IPO, Cactus Inc. became a holding corporation for Cactus LLC. See note 13.
Reclassifications
Certain prior period amounts have been reclassified to conform to
Limitation of Members’ Liability
Under the terms of the Amended and Restated Limited Liability Company Operating Agreement, dated as of May 31, 2016,sole managing member of Cactus LLC, (the “Agreement”),Cactus Inc. operates and controls all of the members are not obligated for debt, liabilities, contracts or other obligationsbusiness and affairs of Cactus LLC. ProfitsLLC and lossesconducts its business through Cactus LLC and its subsidiaries. As a result, Cactus Inc. consolidates the financial results of Cactus LLC and its subsidiaries and reports a non-controlling interest related to the portion of CW Units not owned by Cactus Inc., which reduces net income attributable to holders of Cactus Inc.’s Class A common stock.
preparation of our consolidated financial statements.
64
Significant Customers and ConcentrationConcentrations of Credit Risk
We had one customer representing 11% of total revenues in 2017 and one customer representing 12% of total revenues in both 2016 and 2015. There were no other customers representing 10% or more of total revenues in 2017, 2016 or 2015.
We also control our exposure associated with trade receivables by discontinuing sales and service to non-paying customers. For the year ended December 31, 2022, we had no customers representing more than 10% of total revenues. For the year ended December 31, 2021, one customer represented approximately 12% of total revenues. No customer represented 10% or more of total revenues for the year ended December 31, 2020.
Use See Note 9 for further details on the TRA liability.
The preparationour revenues are derived from short-term contracts for fixed consideration or in the case of consolidated financial statementsfrac equipment rentals, for a fixed charge per day while the equipment is in conformity with GAAP requires managementuse by the customer. Product sales generally do not include right of return or other significant post-delivery obligations. A contract’s transaction price is allocated to make estimateseach distinct performance obligation and assumptions that affectrecognized as revenue when, or as, the reported amounts of assets and liabilities and disclosure of contingent assets and liabilities at the dateperformance obligation is satisfied. Revenues are recognized when we satisfy a performance obligation by transferring control of the consolidated financial statementspromised goods or providing services to our customers at a point in time, in an amount specified in the contract with our customer and that reflects the reported amountsconsideration to which we expect to be entitled in exchange for those goods or services. The majority of revenues and expenses duringour contracts with customers contain a single performance obligation to provide agreed upon products or services. For contracts with multiple performance obligations, we allocate revenue to each performance obligation based on its relative standalone selling price. We do not assess whether promised goods or services are performance obligations if they are immaterial in the reporting period. Such estimates include but are not limited to estimated losses on accounts receivables, estimated realizable value on excess and obsolete inventory, useful lives of equipment and estimates related to fair value of reporting units for purposes of assessing goodwill for impairment. Actual results could differ from those estimates.
Revenue Recognition
Revenue is recognized when allcontext of the following criteria have been met: (i) evidencecontract with the customer. We do not incur any material costs of an arrangement exists; (ii) deliveryobtaining contracts.
an expense in cost of sales. Our revenues are derived from three sources: products, rentals, and field service and other:
products.
period, which tends to be short-term in nature with most equipment on site for less than 90 days.
65
From time to time certain of our contracts include multiple deliverables. The pricing of each of our products and services is individually negotiated and agreed with our customers. The hierarchy for determining the selling price of a deliverable includes (a) vendor‑specific objective evidence, if available, (b) third‑party evidence, if vendor‑specific evidence is not available, and (c) our best estimate of selling price, if neither vendor‑specific nor third‑party evidence is available. Our revenues for multi‑element arrangements are based on vendor‑specific evidence as most of our products, rentals and field services are sold on an individual basis.
Foreign Currency Translation
Transaction gains and losses that arise from exchange rate fluctuations on transactions denominated in a currency other than the functional currency are included in theour consolidated resultsstatements of operationsincome as incurred.
Stock‑based
Income Taxes
Cactus LLC is a limited liability companytrading high and files a U.S. Return of Partnership Income, which includes both our U.S. and foreign operations. As a limited liability company, Cactus LLC is treated as a partnership, and the members of Cactus LLC are taxed individually on their sharetrading low of our earnings for U.S. federal income tax purposes. Accordingly, no provision for U.S. federal income taxes has been made inClass A common stock on the consolidated financial statements.
Cactus LLC is subject to state taxes within the United States. However, the income generated by Cactus LLC flows through to the members’ individual state tax returns. Additionally, our operations in both Australia and China are subject to local country income taxes.
grant date.
We account for uncertainty in income taxes by prescribing the minimum recognition threshold an income tax position is required to meet before being recognized in the consolidated financial statements. Each income tax position is assessed using a two‑step process. A determination is first made as to whether it is more likely than not that the income tax position will be sustained, based upon technical merits, upon examination by the taxing authorities. If the income tax position is expected to meet the more likely than not criteria, the benefit recorded in the consolidated financial statements equals the largest amount that is greater than 50% likely to be realized, upon its ultimate settlement.
66
We recordCactus Inc. is a corporation and is subject to U.S. federal as well as state income tax related interest and penalties, if any, as a componentto its ownership percentage in the provision for income tax expense.
U.S. Federal Income Tax Reform
On December 22, 2017, the President of the United States signed into law legislation informally known as the Tax Cuts and Jobs Act (the “Act”). The Act represents major tax reform legislation that, among other provisions, reduces the U.S. corporate tax rate. As of December 31, 2017, sinceCactus LLC. Cactus LLC is a pass-through entity, management considers thatlimited liability company treated as a partnership for U.S. federal income tax purposes and files a U.S. Return of Partnership Income, which includes both our U.S. and foreign operations. Consequently, the abovementioned Act will have an immaterial impact.
Texas Margins Tax. Additionally, our operations in China, Australia and Saudi Arabia are subject to local country income taxes. See Note 5 “Income Taxes” for additional information regarding income taxes.
We consider all highly liquid instruments purchased
and Allowance for Credit Losses
credit losses. The following is a rollforward of our allowance for doubtful accounts:
|
|
|
|
|
|
|
|
|
|
|
|
|
|
|
|
|
| Balance at |
|
|
|
|
|
|
|
|
|
| Balance at | ||
|
| Beginning of |
| Expense |
|
|
|
|
|
|
| End of | |||
|
| Period |
| (recovery) |
| Write off |
| Other |
| Period | |||||
Year Ended December 31, 2017 |
| $ | 851 |
| $ | (100) |
| $ | (3) |
| $ | (8) |
| $ | 740 |
Year Ended December 31, 2016 |
|
| 1,208 |
|
| (357) |
|
| — |
|
| — |
|
| 851 |
Year Ended December 31, 2015 |
|
| 1,024 |
|
| 250 |
|
| (66) |
|
| — |
|
| 1,208 |
| Balance at Beginning of Period | Expense | Write off | Translation Adjustments | Balance at End of Period | |||||||||||||||||||||||||
| Year Ended December 31, 2022 | $ | 741 | $ | 406 | $ | (86) | $ | (1) | $ | 1,060 | |||||||||||||||||||
| Year Ended December 31, 2021 | 598 | 310 | (167) | — | 741 | ||||||||||||||||||||||||
| Year Ended December 31, 2020 | 837 | 342 | (581) | — | 598 | ||||||||||||||||||||||||
67
The following is a rollforward of our inventory obsolescence reserve:
|
|
|
|
|
|
|
|
|
|
|
|
|
|
|
|
|
| Balance at |
|
|
|
|
|
|
|
|
|
| Balance at | ||
|
| Beginning of |
| Expense |
|
|
|
|
|
|
| End of | |||
|
| Period |
| (recovery) |
| Write off |
| Other |
| Period | |||||
Year Ended December 31, 2017 |
| $ | 4,770 |
| $ | 1,259 |
| $ | (103) |
| $ | (41) |
| $ | 5,885 |
Year Ended December 31, 2016 |
|
| 3,184 |
|
| 1,851 |
|
| (265) |
|
| — |
|
| 4,770 |
Year Ended December 31, 2015 |
|
| 841 |
|
| 2,343 |
|
| — |
|
| — |
|
| 3,184 |
| Balance at Beginning of Period | Expense | Write off | Translation Adjustments | Balance at End of Period | |||||||||||||||||||||||||
| Year Ended December 31, 2022 | $ | 18,012 | $ | 2,739 | $ | (202) | $ | (61) | $ | 20,488 | |||||||||||||||||||
| Year Ended December 31, 2021 | 14,637 | 3,490 | (62) | (53) | 18,012 | ||||||||||||||||||||||||
| Year Ended December 31, 2020 | 9,772 | 4,840 | (53) | 78 | 14,637 | ||||||||||||||||||||||||
|
| ||||||||||||||||||||||||||||||||||||||||||||||||||||||||||||||||||||||||||||||||||||||||||||||||||||||||||||||||||||||||||
|
|
| |||||||||||||||||||||||||||||||||||||||||||||||||||||||||||||||||||||||||||||||||||||||||||||||||||||||||||||||||||||||||
|
|
| |||||||||||||||||||||||||||||||||||||||||||||||||||||||||||||||||||||||||||||||||||||||||||||||||||||||||||||||||||||||||
|
| ||||||||||||||||||||||||||||||||||||||||||||||||||||||||||||||||||||||||||||||||||||||||||||||||||||||||||||||||||||||||||
|
|
| |||||||||||||||||||||||||||||||||||||||||||||||||||||||||||||||||||||||||||||||||||||||||||||||||||||||||||||||||||||||||
|
| ||||||||||||||||||||||||||||||||||||||||||||||||||||||||||||||||||||||||||||||||||||||||||||||||||||||||||||||||||||||||||
|
|
| |||||||||||||||||||||||||||||||||||||||||||||||||||||||||||||||||||||||||||||||||||||||||||||||||||||||||||||||||||||||||
Property and equipment as of December 31, 20172022 and 20162021 consists of the following:
|
|
|
|
|
|
| |||||||||||
|
| December 31, | December 31, | ||||||||||||||
|
| 2017 |
| 2016 | 2022 | 2021 | |||||||||||
Land |
| $ | 2,241 |
| $ | 2,241 | Land | $ | 5,302 | $ | 3,203 | ||||||
Buildings and improvements |
|
| 11,657 |
|
| 11,169 | Buildings and improvements | 25,480 | 22,532 | ||||||||
Machinery and equipment |
|
| 43,528 |
|
| 38,429 | Machinery and equipment | 57,883 | 56,937 | ||||||||
Vehicles under capital lease |
|
| 15,557 |
|
| 2,616 | |||||||||||
| Vehicles under finance lease | Vehicles under finance lease | 29,045 | 23,450 | ||||||||||||||
Rental equipment |
|
| 85,292 |
|
| 75,437 | Rental equipment | 194,088 | 180,704 | ||||||||
Furniture and fixtures |
|
| 1,110 |
|
| 984 | Furniture and fixtures | 1,759 | 1,755 | ||||||||
Computers and software |
|
| 2,636 |
|
| 2,429 | Computers and software | 3,068 | 3,495 | ||||||||
|
|
| 162,021 |
|
| 133,305 | |||||||||||
Less: Accumulated depreciation and amortization |
|
| 72,917 |
|
| 62,381 | |||||||||||
|
|
| 89,104 |
|
| 70,924 | |||||||||||
| Gross property and equipment | Gross property and equipment | 316,625 | 292,076 | ||||||||||||||
| Less: Accumulated depreciation | Less: Accumulated depreciation | (200,573) | (175,992) | ||||||||||||||
| Net property and equipment | Net property and equipment | 116,052 | 116,084 | ||||||||||||||
Construction in progress |
|
| 5,550 |
|
| 3,946 | Construction in progress | 13,946 | 13,033 | ||||||||
Total property and equipment, net |
|
| 94,654 |
|
| 74,870 | Total property and equipment, net | $ | 129,998 | $ | 129,117 | ||||||
68
| Year Ended December 31, | |||||||||||||||||
| 2022 | 2021 | 2020 | |||||||||||||||
| Cost of product revenue | $ | 3,022 | $ | 3,176 | $ | 3,506 | |||||||||||
| Cost of rental revenue | 23,663 | 25,812 | 28,063 | ||||||||||||||
| Cost of field service and other revenue | 6,986 | 6,863 | 8,075 | ||||||||||||||
| Selling, general and administrative expenses | 453 | 457 | 876 | ||||||||||||||
| Total depreciation and amortization | $ | 34,124 | $ | 36,308 | $ | 40,520 | |||||||||||
Impairment of Long‑Lived Assets
2021. Due to reduced sales and cash flows in 2020, we assessed the recoverability of our long-lived assets at each interim period of 2020 and as of December 31, 2020. No impairments were recognized in 2020 as a result of these assessments.
If there are indicators that goodwill has been impaired and thus the two‑step goodwill impairment model is necessary, step one is to determine the fair value of the reporting unit and compare itis less than its carrying amount or we elect not to perform a qualitative assessment, the reporting unit’s carrying value. Fair valuequantitative assessment of goodwill test is determined based on the present value of estimated cash flows using available information regarding expected cash flows of each reporting unit, discount rates and the expected long‑term cash flow growth rates. If the fair value of the reporting unit exceedsperformed. The goodwill impairment test is also performed whenever events or changes in circumstances indicate that the carrying value may not be recoverable. If it is necessary to perform the quantitative assessment to determine if our goodwill is not impaired, we typically utilize a discounted cash flow analysis using management’s projections that are subject to various risks and no further testing is performed. The second step is performed if the carryinguncertainties of revenues, expenses and cash flows as well as assumptions regarding discount rates, terminal value exceeds the fair value. The impliedand control premiums. Estimates of future cash flows and fair value ofare highly subjective and inherently imprecise. These estimates can change materially from period to period based on many factors. Accordingly, if conditions change in the future, we may record impairment losses, which could be material to any particular reporting unit’s goodwill must be determined and compared to the carrying value of the goodwill. If the carrying value of a reporting unit’s goodwill exceeds its implied fair value, anperiod.
Debt Discounttest using management’s current projections of revenues, expenses and Deferred Loan Costs
Long‑term debt is presented incash flows as of March 31, 2020 calculated significant cushion and no impairment was recognized as a result of this assessment. Actual results during the consolidated balance sheets net of an original issue discount as well as deferred loan costs, which are both amortized to interest expense over the liferemainder of the debt. The original issue discountyear were consistent with expectations and our forecasts had not materially changed; therefore, we concluded that our goodwill was $5.5 million. The amortizationnot impaired at each subsequent interim period of the discount totaled $0.8 million, $0.8 million2020 and $0.9 million for 2017, 2016 and 2015, respectively, and is included in interest expense in the consolidated statements of income.
Deferred loan costs are amortized to interest expense over the term of the related debt agreement using methods which approximate the effective interest method. We capitalized $6.0 million in connection with our long-term debt. The amortization of the deferred loan costs for 2017, 2016 and 2015 totaled $0.9 million, $0.9 million and $1.0 million, respectively.
When the related debt instrument is retired, any remaining unamortized costs of the original issue discount and deferred loan costs are included in the determination of the gain or loss on the extinguishment of the debt.
69
Asas of December 31, 2017 and 2016, the unamortized balance of debt discount and deferred loan costs was $4.5 million and $6.3 million, respectively. In conjunction with the IPO and repayment in full of our term loan, the unamortized balance of debt discount and deferred loan costs will be written off to loss on debt extinguishment.
2020.
Current Liabilities
|
|
|
|
|
|
|
|
| December 31, | ||||
|
| 2017 |
| 2016 | ||
Payroll, payroll taxes and benefits |
| $ | 4,033 |
| $ | 2,722 |
Income based tax payable |
|
| 526 |
|
| 641 |
Taxes other than income |
|
| 1,375 |
|
| 1,271 |
Deferred revenue |
|
| 765 |
|
| 565 |
Product warranties |
|
| 343 |
|
| 95 |
Accrued insurance |
|
| 1,059 |
|
| — |
Accrued interest |
|
| 161 |
|
| 50 |
Other |
|
| 2,297 |
|
| 1,086 |
Total |
| $ | 10,559 |
| $ | 6,430 |
| December 31, | |||||||||||
| 2022 | 2021 | ||||||||||
| Payroll, incentive compensation, payroll taxes and benefits | $ | 9,484 | $ | 7,030 | |||||||
| Accrued professional fees and other | 7,347 | 1,078 | |||||||||
| Accrued international freight and tariffs | 5,887 | 14,794 | |||||||||
| Taxes other than income | 2,728 | 1,641 | |||||||||
| Income based tax payable | 2,537 | 1,182 | |||||||||
| Deferred revenue | 1,450 | 1,764 | |||||||||
| Accrued workers’ compensation insurance | 576 | 269 | |||||||||
| Accrued dividends | 484 | 346 | |||||||||
| Product warranties | 126 | 136 | |||||||||
| Total accrued expenses and other current liabilities | $ | 30,619 | $ | 28,240 | |||||||
Deferred Revenue
Deferred revenue represents cash received
benefits in the table above and were $1.4 million and $1.1 million as of December 31, 2022 and 2021, respectively.
The estimated liability for product warranties is based on historical and current claims experience.
FairMeasurements
|
|
|
|
|
|
Fair value of long‑lived, non‑financial assets—Long‑lived, non‑financial assets are measured at fair value on a non‑recurring basis for the purposes of calculating impairment. The fair value measurements of our long‑lived,
70
non‑financial assets measured on a non‑recurring basis are determined by estimating the amount and timing of net future cash flows, which are Level 3 unobservable inputs and discounting them using a risk‑adjusted rate of interest. Significant increases or decreases in actual cash flows may result in valuation changes.
Fair value of debt—The fair value, based on Level 2, of our term loan facility due 2020 approximated the face value of the debt of $248.5 million as of December 31, 2017. The fair value was approximately $231 million as of December 31, 2016 compared to the $251.1 million face value of the debt as of December 31, 2016.
Other fair value disclosures—(Level 3 inputs). The carrying amountsvalue of cash and cash equivalents, receivables, accounts payable as well as amounts included in other current assets and other current liabilities that meet the definition of financial instruments, approximateaccrued expenses approximates fair value.
Recent Accounting Pronouncements
Standards Adopted
In July 2015, the Financial Accounting Standards Board (“FASB”) issued Accounting Standards Update (“ASU”) No. 2015‑11, Simplifying the Measurement of Inventory, which requires companies to measure inventory at the lower of cost or net realizable value rather than at the lower of cost or market. Net realizable value is the estimated selling price in the ordinary course of business, less reasonably predictable costs of completion, disposal and transportation. We adopted this ASU on January 1, 2017. The adoption of this pronouncement did not have any material impact on the consolidated financial statements.
In March 2016, the FASB issued ASU No. 2016‑09, Improvements to Employee Share‑Based Payment Accounting. This new guidance includes provisions intended to simplify how share based payments are accounted for and presented in the financial statements, including: a) all excess tax benefits and tax deficiencies should be recognized as income tax expense or benefit in the income statement; b) excess tax benefits should be classified along with other income tax cash flows as an operating activity; c) an entity can make an entity wide accounting policy election to either estimate the number of awards that are expected to vest or account for forfeitures when they occur; d) the threshold to qualify for equity classification permits withholding up to the maximum statutory tax rates in the applicable jurisdictions; e) cash paid by an employer should be classified as a financing activity when shares are directly withheld for tax withholding purposes. We adopted this ASU on January 1, 2017. The adoption of this pronouncement did not have any material impact on the consolidated financial statements.
Standards Not Yet Adopted
In May 2014, the FASB issued ASU No. 2014‑09, Revenue from Contracts with Customers, which supersedes the current revenue recognition guidance. The ASU is based on the principle that revenue is recognized to depict the transfershort-term nature of goods and services to customers in the amount that reflects the consideration to which the entity expects to be entitled in exchange for those goods or services.these accounts. The ASU also requires additional disclosure about the nature, amount, timing, and uncertainty of revenue and cash flows arising from customer contracts, including significant judgments and changes in judgments and assets recognized from costs incurred to obtain or fulfill a contract. The new standard will be effective for public companies for the fiscal years beginning after December 31, 2017 using one of two retrospective application methods. We adopted this pronouncement on January 1, 2018 using the modified retrospective method. Based on the assessment performed, the adoption of this pronouncement will not have a material impact on the consolidated financial statements. We are continuing our assessment of potential changes to our disclosures under the new standard. We will provide additional disclosures, if any, regarding material differences in reported financial statement line items in 2018 when compared to the amounts that would have been reported under legacy accounting guidance.
71
In February 2016, the FASB issued ASU No. 2016‑02, Leases (Topic 842), to increase transparency and comparability among organizations by recognizing lease assets and lease liabilities on the balance sheet and disclosing key information about leasing arrangements. Upon adoption of the new guidance, lessees are required to recognize and measure leases at the beginning of the earliest period presented using a modified retrospective approach. The new guidance will be effective for fiscal years beginning after December 15, 2018. We are currently evaluating the impact this pronouncement will have on the consolidated financial statements.
In January 2017, the FASB issued ASU No. 2017‑01, Business Combinations (Topic 805): Clarifying the Definition of a Business, in an effort to clarify the definition of a business with the objective of adding guidance to assist entities with evaluating whether transactions should be accounted for as acquisitions (or disposals) of assets or businesses. The amendments in this standard provide a screen to determine when an integrated set of assets and activities is not a business. The screen requires that when substantially all of the fair value of our foreign currency forwards is determined using market observable inputs including forward and spot prices (Level 2 inputs). We had no long-term debt outstanding as of December 31, 2022 or 2021.
In January 2017, the FASB issued ASU 2017‑04, Intangibles‑Goodwillgross pay contributed by each employee and Other, which simplifies the accounting for goodwill impairment by eliminating Step 250% of the current goodwill impairment test. In computing the implied fair valuenext 4% of goodwill under Step 2, an entity had to perform procedures to determine the fair valuegross pay contributed by each employee and we may also make additional non‑elective employer contributions at the impairment testing date of its assets and liabilities (including unrecognized assets and liabilities) following the procedure that would be required in determining the fair value of assets acquired and liabilities assumed in a business combination. Instead,our discretion under the new standard, an entity should perform its annual, or interim, goodwill impairment test by comparingplan. Due to the fair value of a reporting unit with its carrying amount. An entity should recognize an impairment charge fordifficult economic environment at that time, the amount by which401(k) match was temporarily suspended in the carrying amount exceeds the reporting unit’s fair value; however, the loss recognized should not exceed the total amount of goodwill allocated to that reporting unit. An entity still has the option to perform the qualitative assessment for a reporting unit to determine if the quantitative impairment test is necessary. The new guidance should be adopted for annual or any interim goodwill impairment testsU.S. in fiscal years beginning after December 15, 2019. Early adoption is permitted for interim or annual goodwill impairment tests performed on testing dates after January 1, 2017. We do not expect the adoption of this pronouncement to have a material impact on the consolidated financial statements.
InJune 2020 and reinstated in August 2016, the FASB issued ASU No. 2016‑15, Cash Flow Statement (Topic 250). This new guidance addresses eight specific cash flow issues with the objective of reducing the existing diversity in practice, including: debt prepayment or debt extinguishment costs, settlement of zero coupon debt instruments or other debt instruments, contingent consideration payments made after a business combination, proceeds from the settlement of insurance claims, proceeds from the settlement of corporate owned life insurance policies, distributions received from equity method investees, beneficial interests in securitization transactions,2021. During 2022, 2021 and separately identifiable cash flows2020, employer matching contributions totaled $4.2 million, $1.2 million and application of the predominance principle. ASU 2016‑15 is effective for public business entities for fiscal years beginning after December 15, 2017, and interim periods within those fiscal years. Early adoption is permitted, including adoption in an interim period. We do not expect that the adoption of this pronouncement will have a material impact on the consolidated financial statements.
72
3.Inventories
3. Inventories
Inventories consist of the following:
|
|
|
|
|
|
| |||||||||||
|
| December 31, | December 31, | ||||||||||||||
|
| 2017 |
| 2016 | 2022 | 2021 | |||||||||||
Raw materials |
| $ | 1,532 |
| $ | 1,543 | Raw materials | $ | 3,150 | $ | 1,870 | ||||||
Work-in-progress |
|
| 3,590 |
|
| 4,585 | Work-in-progress | 5,444 | 4,288 | ||||||||
Finished goods |
|
| 59,328 |
|
| 31,772 | Finished goods | 152,689 | 113,659 | ||||||||
|
| $ | 64,450 |
| $ | 37,900 | |||||||||||
| Total inventories | Total inventories | $ | 161,283 | $ | 119,817 | ||||||||||||
Long‑term
|
|
|
|
|
|
|
|
| December 31, | ||||
|
| 2017 |
| 2016 | ||
Term Loan |
| $ | 248,529 |
| $ | 251,098 |
Less: |
|
|
|
|
|
|
Current portion |
|
| (2,568) |
|
| (2,568) |
Unamortized debt discount and deferred loan costs |
|
| (4,524) |
|
| (6,276) |
Long-term debt, net |
| $ | 241,437 |
| $ | 242,254 |
On JulyABL Credit Facility (as defined below) as of December 31, 2014, we2022.
In conjunction with the IPO, we repaid the Term Loan in full. Asa commitment fee of December 31, 2017, prior to the repayment resulting from the IPO, the future maturities of long‑term debt were as follows:
|
|
|
|
Years Ending December 31, |
|
|
|
2018 |
| $ | 2,568 |
2019 |
|
| 2,568 |
2020 |
|
| 243,393 |
|
| $ | 248,529 |
The ABL Credit AgreementFacility contains various covenants and restrictive covenantsprovisions that may limit ourCactus LLC’s and each of its subsidiaries’ ability to, among other things, incur additional indebtedness and create liens, make investments or declare dividends,loans, merge or enter intoconsolidate with other companies, sell assets, make certain restricted payments and distributions, and engage in transactions with affiliates. The obligations under the ABL Credit Facility are guaranteed by certain subsidiaries of Cactus LLC and containssecured by a total leverage
73
financial covenant related onlyCactus LLC and the guarantors. The ABL Credit Facility also requires Cactus LLC to the Revolving Loans oncemaintain a totalfixed charge coverage ratio of $15.0 million or more has been drawn1.0 to 1.0 based on the Revolving Loans. Based on this total leverage financial covenant,ratio of EBITDA (as defined therein) minus Unfinanced Capital Expenditures (as defined therein) to Fixed Charges (as defined therein) during certain periods, including when availability under the revolving credit facility canABL Credit Facility is under certain levels. If Cactus LLC fails to perform its obligations under the ABL Credit Facility, (i) the commitments under the ABL Credit Facility could be limited to $15.0 million. terminated, (ii) any outstanding borrowings under the ABL Credit Facility may be declared immediately due and payable and (iii) the lenders may commence foreclosure or other actions against the collateral.
At December 31, 2017Facility”). The Amended ABL Credit Facility provides for a term loan of $125.0 million and 2016, the weighted average interest rate for borrowingsup to $225.0 million in revolving commitments. The term loan under the Amended ABL Credit Agreement was 7.3%Facility matures on February 27, 2026 and 7.0%, respectively.
Gainany revolving loans under the Amended ABL Credit Facility mature on debt extinguishment
In accordance with the provisionsJuly 26, 2027. See further discussion of the Amended ABL Credit Agreement, we redeemed $7.5 million and $10.0 million of the Term Loan at a price of 65% and 79% of the principal amountFacility in 2016 and 2015, respectively. We paid $4.9 million and $7.9 million for such redemptions, including fees, in 2016 and 2015, respectively. We recorded a gain on debt extinguishment of $2.3 million and $1.6 million in 2016 and 2015, respectively, on the redemptions. The gain consists of the tender discount on the Term Loan amount redeemed, partially offset by transaction fees and the write‑off of $0.3 million and $0.2 million of the unamortized debt discount and deferred loan costs in 2016 and 2015, respectively. The gain on debt extinguishment is included under other income, net, in the consolidated statements of income.
Note 15.
|
|
|
|
|
|
|
|
|
|
|
| Year Ended December 31, | |||||||
|
| 2017 |
| 2016 |
| 2015 | |||
Interest under Credit Agreement |
| $ | 18,627 |
| $ | 18,414 |
| $ | 19,682 |
Debt discount and deferred loan costs amortization |
|
| 1,752 |
|
| 1,777 |
|
| 1,913 |
Capital lease interest |
|
| 311 |
|
| 24 |
|
| — |
Other |
|
| 82 |
|
| 20 |
|
| 253 |
Interest (income) |
|
| (5) |
|
| (2) |
|
| (11) |
Interest expense, net |
| $ | 20,767 |
| $ | 20,233 |
| $ | 21,837 |
| Year Ended December 31, | |||||||||||||||||
| 2022 | 2021 | 2020 | |||||||||||||||
| Interest under bank facilities | $ | 268 | $ | 313 | $ | 317 | |||||||||||
| Deferred financing cost amortization | 165 | 168 | 168 | ||||||||||||||
| Finance lease interest | 628 | 520 | 639 | ||||||||||||||
| Other | 167 | 126 | 3 | ||||||||||||||
| Interest income | (4,942) | (353) | (1,828) | ||||||||||||||
| Interest (income) expense, net | $ | (3,714) | $ | 774 | $ | (701) | |||||||||||
Components of income (loss) before income taxes—
|
|
|
|
|
|
|
|
|
|
|
| Year Ended December 31, | |||||||
|
| 2017 |
| 2016 |
| 2015 | |||
Domestic |
| $ | 65,023 |
| $ | (8,558) |
| $ | 21,791 |
Foreign |
|
| 3,073 |
|
| 1,191 |
|
| 217 |
Income (loss) before income taxes |
| $ | 68,096 |
| $ | (7,367) |
| $ | 22,008 |
74
| Year Ended December 31, | |||||||||||||||||
| 2022 | 2021 | 2020 | |||||||||||||||
| Domestic | $ | 155,380 | $ | 64,139 | $ | 61,028 | |||||||||||
| Foreign | 21,172 | 11,006 | 9,157 | ||||||||||||||
| Income before income taxes | $ | 176,552 | $ | 75,145 | $ | 70,185 | |||||||||||
Provision for income tax—The provision for income taxes consisted of:
|
|
|
|
|
|
|
|
|
| |||||||||||||||||
|
| Year Ended December 31, | Year Ended December 31, | |||||||||||||||||||||||
|
| 2017 |
| 2016 |
| 2015 | 2022 | 2021 | 2020 | |||||||||||||||||
Current: |
|
|
|
|
|
|
|
|
| Current: | ||||||||||||||||
Federal |
| $ | — |
| $ | — |
| $ | — | Federal | $ | — | $ | — | $ | (786) | ||||||||||
State |
|
| 594 |
|
| 229 |
|
| 474 | State | 1,231 | 348 | 597 | |||||||||||||
Foreign |
|
| 735 |
|
| 448 |
|
| 246 | Foreign | 4,900 | 2,497 | 4,211 | |||||||||||||
Total current income taxes |
|
| 1,329 |
|
| 677 |
|
| 720 | Total current income taxes | 6,131 | 2,845 | 4,022 | |||||||||||||
Deferred—foreign |
|
| 220 |
|
| 132 |
|
| 64 | |||||||||||||||||
| Deferred: | Deferred: | |||||||||||||||||||||||||
| Federal | Federal | 23,945 | 2,658 | 8,040 | ||||||||||||||||||||||
| State | State | 514 | 1,516 | (253) | ||||||||||||||||||||||
| Foreign | Foreign | 840 | 656 | (839) | ||||||||||||||||||||||
| Total deferred income taxes | Total deferred income taxes | 25,299 | 4,830 | 6,948 | ||||||||||||||||||||||
Total provision for income taxes |
| $ | 1,549 |
| $ | 809 |
| $ | 784 | Total provision for income taxes | $ | 31,430 | $ | 7,675 | $ | 10,970 | ||||||||||
Year Ended December 31, 2017 2016 2015 Income taxes at 35% statutory tax rate $ 23,834 $ (2,578) $ 7,703 Net difference resulting from: Profit and loss of Cactus LLC not subject to U.S. federal tax (22,758) 2,990 (7,627) Foreign earnings subject to different tax rates (302) (122) (50) State income taxes 594 229 474 Foreign withholding taxes 220 132 64 Change in valuation allowance (39) 158 220 Total provision for income taxes $ 1,549 $ 809 $ 784 December 31, 2017 2016 Foreign withholding taxes $ 416 $ 196 Foreign loss carryforwards (489) (528) Valuation allowance 489 528 Total deferred tax liability, net $ 416 $ 196 December 31, 2017 2016 Units Class A 36,500 36,500 Class A-1 520 520 Class B 8,608 8,608 Year Ended December 31, 2016 2015 Amount Per Unit Amount Per Unit Distributions Class A $ 2,055 $ 56 $ 8,928 $ 245 Class A-1 — — 3 7 Class B — — 3,301 528 Total distributions $ 2,055 $ 12,232 canceled and Cactus Inc. issued 3.3 million new shares of Class A common stock to Cadent, which then distributed such shares to its limited partners. Cactus received no proceeds from these events, and there was no change in the combined number of Cactus Inc. voting shares outstanding. December 31, 2016 2015 Expected term in years 3.5 years 3.5 years Expected volatility 33 % 33 % Risk‑free interest rate 0.98 % 0.98 % December 31, 2017 2016 Cost $ 15,557 $ 2,616 Accumulated depreciation (2,672) (171) Net $ 12,885 $ 2,445 Operating Leases Capital Leases Total 2018 $ 5,506 $ 5,296 $ 10,802 2019 4,083 5,394 9,477 2020 3,752 3,475 7,227 2021 3,077 — 3,077 2022 2,031 — 2,031 Thereafter 4,713 — 4,713 $ 23,162 $ 14,165 $ 37,327 We are involved in various disputes arising in the ordinary course of business. Management does not believe the outcome of these disputes will have a material adverse effect on our consolidated financial position or consolidated results of operations. Year Ended December 31, 2017 2016 2015 Numerator: Net income (loss) $ 66,547 $ (8,176) $ 21,224 Participating securities: Dividends — — (3,303) Income allocation (20,617) — (6,720) Net income (loss) available to Class A Units $ 45,930 $ (8,176) $ 11,201 Denominator: Weighted average Class A Units—basic and diluted 36,500 36,500 36,500 Earnings (loss) per Class A Unit—basic and diluted $ 1,258.36 $ (224.00) $ 306.88 Year Ended December 31, 2017 2016 2015 Property and equipment acquired under capital lease $ 12,941 $ 2,616 $ — Property and equipment in payables 1,553 243 276 Year Ended December 31, 2017 2016 2015 Cash paid for interest $ 18,826 $ 19,946 $ 21,391 Cash paid for income taxes, net 1,535 583 370 2017 Quarters Total Fourth Third Second First Total revenues $ 341,191 $ 104,784 $ 96,027 $ 81,877 $ 58,503 Income from operations 88,863 28,737 28,059 22,073 9,994 Net income 66,547 22,814 22,301 16,578 4,854 Earnings per Class A Unit—basic and diluted 1,258.36 431.40 421.70 312.79 92.47 2016 Quarters Total Fourth Third Second First Total revenues $ 155,048 $ 49,547 $ 36,755 $ 32,863 $ 35,883 Income from operations 10,615 6,162 2,112 1,218 1,123 Net income (loss) (8,176) 1,346 (3,167) (1,833) (4,522) Earnings (loss) per Class A Unit—basic and diluted (224.00) 36.88 (86.77) (50.22) (123.89) tax-free reorganization for United States federal income tax purposes. In connection with the Merger, Cactus recognized approximately $8.4 million of transaction costs for the year ended December 31, 2022. These fees primarily related to legal, accounting and consulting fees and are included in selling, general and administrative expenses in the statements of income. business for the period from completion of our IPO until the CC Reorganization and relating to Cactus Companies’ business for periods after the CC Reorganization. Pursuant to the Cactus Companies LLC Agreement, each holder Changes in Internal Control over Financial Reporting Exhibit No. Description 10.1 31.1* herewith. Cactus, Inc. By: /s/ Scott Bender Scott Bender President, Chief Executive Officer and Director Signature Title /s/ Scott Bender President, Chief Executive Officer and Director (Principal Executive Scott Bender /s/ Vice President, Chief Financial Officer and Treasurer (Principal Financial Officer) /s/ Chief Accounting Officer (Principal Accounting Officer) /s/ Bruce Rothstein Chairman Bruce Rothstein /s/ Joel Bender Senior Vice President, Chief Operating Officer and Director Joel Bender /s/ Melissa Law Director John (Andy) O’Donnell /s/ Director /s/ Alan Semple Director Alan Semple /s/ Director Effective income tax rate reconciliation— Year Ended December 31, 2022 2021 2020 Income taxes at 21% statutory tax rate Income taxes at 21% statutory tax rate $ 37,076 $ 15,780 $ 14,739 Net difference resulting from: Profit of non-controlling interest not subject to U.S. federal tax Profit of non-controlling interest not subject to U.S. federal tax (7,339) (3,754) (5,508) Foreign income taxes (net of foreign tax credit) Foreign income taxes (net of foreign tax credit) 2,104 2,423 269 State income taxes (excluding rate change) State income taxes (excluding rate change) 2,910 1,348 883 Impact of change in forecasted state income tax rate Impact of change in forecasted state income tax rate (1,739) 1,347 (1,216) Foreign withholding taxes 1,225 730 462 Change in valuation allowance (1,381) (8,977) 2,840 Adjustments of prior year taxes Adjustments of prior year taxes (120) 79 (1,663) Stock compensation Stock compensation (1,743) (1,096) (34) Other Other 437 (205) 198 Total provision for income taxes $ 31,430 $ 7,675 $ 10,970 Deferredcomponents—rate was 17.8%, 10.2% and 15.6% for the years ended December 31, 2022, 2021 and 2020, respectively. Our effective tax rate is typically lower than the federal statutory rate of 21% due to the fact that Cactus Inc. is only subject to federal and state income tax on its share of income from Cactus LLC. Income allocated to the non-controlling interest is not subject to U.S. federal or state tax. December 31, 2022 2021 Investment in Cactus LLC Investment in Cactus LLC $ 299,253 $ 292,956 Imputed interest Imputed interest 12,982 12,297 Tax credits Tax credits 6,158 3,713 Net operating loss carryforwards Net operating loss carryforwards 855 11,198 Other Other — 152 Deferred tax assets Deferred tax assets 319,248 320,316 Valuation allowance Valuation allowance (17,604) (17,242) Deferred tax asset, net Deferred tax asset, net 301,644 303,074 Foreign withholding taxes 1,323 854 Other Other 643 318 Deferred tax liability, net Deferred tax liability, net $ 1,966 $ 1,172 foreign net operating lossesdetermined it is more-likely-than-not that we will be able to utilize all of $1.8 million, $1.9 million and $1.3 million for 2017, 2016 and 2015, respectively. The foreign net operating losses have an indefinite carryforward period. Weour tax basis subject to the TRA; therefore, we have recorded a fullliability related to the TRA for the tax savings we may realize from certain increases in tax basis and certain tax benefits attributable to imputed interest as a result of our acquisition (or deemed acquisition for United States federal income tax purposes) of CW Units. If we determine the utilization of this tax basis is not more-likely-than-not in the future, our estimate of amounts to be paid under the TRA would be reduced. In this scenario, the reduction of the liability under the TRA would result in a benefit to our pre-tax consolidated results of operations in conjunction with an increase to the valuation allowance againstand an offsetting adjustment to tax expense.associated with the foreignfor imputed interest, certain tax credits and net operating loss carryforwardscarryforwards. As of December 31, 2022, we have a valuation allowance of $5.4 million against these deferred tax assets, primarily associated with our portion of Cactus LLC’s accrued foreign taxes and state tax credits, due to the uncertainty of realization.Taxing Authority Examinations—The Texas Franchise state tax returns for the years ended20142022, we have deferred tax assets on U.S. federal and 2015 are currently under examination bystate net operating loss (“NOL”) carryforwards of approximately $0.8 million and $0.1 million, respectively, which can be used to offset U.S. federal and state taxes payable in future years. The U.S. federal NOL carryforwards have no expiration date whereas the taxing authorities. Management believes that the resultU.S. state NOL carryforwards generally will expire in periods beginning in 2040.the examination will not have a material impact on the financial statements. December 31, 2022 and 2021, we had no uncertain tax positions. otherfederal or state income tax returns are currently under examination by state taxing authorities.75
6.Stock-Based Compensation6. Members’ EquityMember units outstanding were as follows:There were no distributions for 2017. Distributions by Unit class are as follows for 2016 and 2015:Distributions and income are defined in accordance with a waterfall calculation which allocates distributions and incometo receive awards under the LTIP. Stock-based awards granted pursuant to the Class A‑1 and Class B Unit holders based upon theLTIP are expected to be settled in shares of our Class A Unit holders’ return on investment thresholds. Under the terms of its operating agreement, Cactus LLC is obligated to make distributions to its members to enable them to settle tax liabilities that arise from their investment in Cactus LLC. These distributions are recorded in the period during which payment is made. Cactus LLC wascommon stock if they vest. Our stock-based awards do not required to make any distributions related to member tax liabilities that arose in 2017 from their investment in Cactus LLC until 2018. In January 2018, Cactus LLC made a distribution of $26.0 million to its members related to tax liabilities incurredhave voting rights prior to vesting. Dividends declared are accumulated and paid upon vesting. We account for forfeitures when they occur and recognize the IPO. Voting rights are limitedimpact to Class A Unit holders.There were no Class A or Class B Units issued during 2017, 2016 or 2015. From time to time, Cactus LLC issues Class A‑1 Units to Directors and key employees. There were no new Class A‑1 Units issued during 2017. During 2016 and 2015, Cactus LLC issued 120 and 125 Class A‑1 Units, respectively, and recordedstock-based compensation expense at that time. We recorded $10.6 million of $0.4stock-based compensation expense during the year ended December 31, 2022 and $8.6 million during each of the years ended December 31, 2021 and $0.4 million, respectively. The Class A‑1 Units were fully vested as of grant date and as such all equity2020. Stock-based compensation was expensed immediately. The equity compensationexpense is includedprimarily recorded in selling, general and administrative expenses. We recognized $1.7 million, $1.1 million and $34 thousand in tax benefits for tax deductions from the vesting of stock-based awards benefits during the years ended December 31, 2022, 2021 and 2020, respectively. As of December 31, 2022, 1.1 million stock awards were available for grant. No. of RSUs Weighted Average Grant Date Fair Value ($) Nonvested as of December 31, 2021 476 $ 24.29 Granted 151 55.06 Vested (253) 25.37 Forfeited (24) 31.75 Nonvested as of December 31, 2022 350 $ 36.27 No. of PSUs Weighted Average Grant Date Fair Value ($) Nonvested as of December 31, 2021 198 $ 20.80 Granted 68 55.02 Vested (96) 13.66 Forfeited (42) 23.26 Nonvested as of December 31, 2022 128 $ 43.63 Year Ended December 31, 2022 2021 2020 Product revenue $ 452,615 $ 280,907 $ 206,801 Rental revenue 100,453 61,629 66,169 Field service and other revenue 135,301 96,053 75,596 Total revenue $ 688,369 $ 438,589 $ 348,566 Year Ended December 31, 2022 2021 Finance lease cost: Amortization of right-of-use assets $ 5,516 $ 4,906 Interest expense 628 520 Operating lease cost 6,564 6,638 Short-term lease cost 1,515 1,894 Sublease income (353) (265) Total lease cost $ 13,870 $ 13,693 Year Ended December 31, 2022 2021 Cash paid for amounts included in the measurement of lease liabilities: Operating cash flows from finance leases $ 628 $ 520 Operating cash flows from operating leases 6,524 5,398 Financing cash flows from finance leases 6,055 5,205 Total $ 13,207 $ 11,123 Right-of-use assets obtained in exchange for new lease obligations: Operating leases $ 6,565 $ 5,342 Finance leases 7,941 9,941 Total $ 14,506 $ 15,283 Operating Finance 2023 $ 5,431 $ 6,442 2024 4,420 4,963 2025 3,458 2,117 2026 2,711 111 2027 2,640 — Thereafter 7,410 — Total undiscounted lease payments 26,070 13,633 Less: effects of discounting (2,918) (1,264) Present value of lease payments $ 23,152 $ 12,369 Year Ended December 31, 2022 2021 Weighted average remaining lease term: Finance leases 2.0 years 2.1 years Operating leases 6.5 years 5.8 years Weighted average discount rate Finance leases 11.97 % 8.58 % Operating leases 2.96 % 3.01 % CW Units (in thousands) CW Units held by legacy CW Unit Holders as of December 31, 2019 27,958 CW Unit redemptions (303) CW Units held by legacy CW Unit Holders as of December 31, 2020 27,655 March 2021 Secondary Offering (6,273) Cadent redemption in June 2021 (3,292) Cadent redemption in September 2021 (715) Other CW Unit redemptions (701) CW Units held by legacy CW Unit Holders as of December 31, 2021 16,674 CW Unit redemptions (1,696) CW Units held by legacy CW Unit Holders as of December 31, 2022 14,978 Class A‑1 Unit holders are allocated pari passuThere was no change in the combined number of Cactus Inc. voting shares outstanding as a result of the 2021 Secondary Offering.all Class A and Class A‑1 Unit holders provided Cactus LLC’s Enterprise Value exceeds the amount detailed in their individual Subscription and Investment Agreement.The following is a rollforwardcorresponding number of shares of Class A‑1 Units:Units at December 31, 2014275Units issued in 2015125Units at December 31, 2015400Units issued in 2016120Units at December 31, 2016520Units issued in 2017 —Units at December 31, 201752076
B common stock, to its general partner, Cadent Energy Partners II - GP, L.P., (“Cadent GP”), and its manager, Cadent Management Services, LLC (“Cadent Management”). Cadent then redeemed its remaining 3.3 million CW Units, together with a corresponding number of shares of Class B common stock, as provided in the Cactus Wellhead LLC Agreement. The redeemed CW Units (and the corresponding shares of Class B common stock) wereA‑1B common stock, thus liquidating its ownership in Cactus Wellhead, LLC. These transactions were in accordance with the Cactus Wellhead LLC Agreement. The redeemed CW Units (and the corresponding shares of Class B common stock) were valued usingcanceled and Cactus Inc. issued 715,215 new shares of Class A common stock. Cactus received no proceeds from these events, and there was no change in the Black Scholes valuation model. Volatility was estimated basedcombined number of Cactus Inc. voting shares outstanding.averagedate of record and are paid upon vesting. Dividends are not paid to our Class B common stock holders; however, a corresponding distribution up to the same amount per share as our Class A common stockholders is paid to our CW Unit Holders for any dividends declared on our Class A common stock. See Note 11 “Related Party Transactions” for further discussion of distributions made by Cactus LLC.volatilityCactus Wellhead LLC Agreement, the members of peer group companies in Cactus LLC’s industry. No forfeituresLLC are not obligated for debt, liabilities, contracts or expected future distributions were assumed. No Class A‑1 Units were issued in 2017. The key assumptions for 2016other obligations of Cactus LLC. Profits and 2015losses are as follows:The key assumptions were unchanged between 2016 and 2015 as the Class A‑1 Units were issued within a two month period of time (January 1, 2016 and November 1, 2015) and management believes that there were no factors during the two monthsallocated to change the assumptions.7. Related Party TransactionsWe entered into a management services agreement with two of our members whereby we must pay an annual management fee totaling approximately $0.3 million, payable in four installments, each to be paid quarterly in advance, prorated for any partial year. The agreement shall terminate upon the consummation of a change of control sale, as defined in our operating agreement. Management fee expense totaled $0.3 million for each of 2017, 2016 and 2015. There were no outstanding balances due as of December 31, 2017 and 2016the Cactus Wellhead LLC Agreement.the management services agreement. In conjunction with our IPO, the management services agreements terminated.During 2016 and 2015, we rented certain equipmentdry-lease from a company owned by a member of Cactus LLC. These transactions wereare under short‑termshort-term rental arrangements.arrangements and the agreement governing these transactions does not qualify as a lease. Effective January 1, 2022, we pay a base hourly rent of $2,500 per flight hour of use (increased from $1,750 per flight hour) of the aircraft, payable monthly, for the hours of aircraft operation. During 2017, 2016each of the years ended December 31, 2022 and 2015,2021, expense recognized in connection with these rentals totaled $0.3 million, $0.2 million and $0.3as compared to $0.1 million respectively.during the year ended December 31, 2020. As of December 31, 20172022 and 2016,2021, we owed less than $0.1 million respectively, to thisthe related party which are included in accounts payable in the consolidated balance sheets.8. Commitments and ContingenciesOperating Leases and Capital LeasesWe lease certain facilities, vehicles, equipment, office and manufacturing space under noncancelable operating leases which expire at various dates through 2029. We are also partyresponsible for employing pilots and fuel expenses. Our Chief Executive Officer and Chief Operating Officer reimburse the Company up to a significant number$2,350 per day for their personal use of month‑to‑month leasesthe pilots employed by the Company, depending on how many company pilots are utilized for the day.can be canceled at any time. Total rent expense relatedCactus Inc. actually realizes or is deemed to operating leasesrealize in certain circumstances. The total liability from the TRA as of December 31, 2022 was $292.6 million. We pay professional fees to assist with maintenance of the TRA and composite tax payments in advance of the state tax return filings which are reimbursable from the TRA Holders. As of December 31, 2022 and 2021, amounts due from the TRA Holders for 2017, 2016fees and 2015 amounted to $7.1 million, $7.3estimated state tax payments made on their behalf totaled $0.1 million and $7.9$0.2 million, respectively.We also lease vehicles under capital leases. These leases The balances are typically threeincluded in accounts receivable, net in the consolidated balance sheets.in durationended December 31, 2022, 2021 and have no guaranteed residual values. Amounts included within property2020, Cactus LLC distributed $38.6 million, $30.6 million and equipment under capital leases are$27.8 million, respectively, to Cactus Inc. to fund its dividend, TRA liability and estimated tax payments. During the years ended December 31, 2022 and 2021, Cactus LLC made pro rata distributions to the other members totaling $9.7 million, respectively as follows:77Future minimum annual lease payments, including executory costs12.Commitments and interest, for years subsequent to December 31, 2017 are approximately as follows:Legal Contingencies9. Employee Benefit Plans401K PlanOur employees withinUnited States are eligiblenet income attributable to participate in a 401(k) plan sponsored by us. These employees are eligible to participate upon employment hire date and obtainingCactus Inc. during the age of eighteen. All eligible employees may contribute a percentage of their compensation subject to a maximum imposedperiod by the Internal Revenue Code. During 2017, we matched 100%weighted average number of shares of Class A common stock outstanding during the first 3%same period. Diluted earnings per share of gross pay contributedClass A common stock is calculated by each employee and 50%dividing the net income attributable to Cactus Inc. during that period by the weighted average number of common shares outstanding assuming all potentially dilutive shares were issued.next 4%if-converted method to determine the potential dilutive effect of gross pay contributed by each employee. We may also make additional non‑elective employer contributions at its discretion under the plan. Similar benefit plans exist for employeesoutstanding CW Units (and corresponding shares of our foreign subsidiaries. During 2017, 2016 and 2015, employer matching contributions totaled $2.2 million, $1.2 million and $1.5 million, respectively. We have not made non‑elective employer contributions under the plan.10. Earnings (loss) Per UnitClass A‑1 Units andoutstanding Class B Units are entitledcommon stock), the treasury stock method to allocationsdetermine the potential dilutive effect of distributions and income based uponunvested restricted stock units assuming that the proceeds will be used to purchase shares of Class A Unit holder’s return on investment thresholds. The Class A‑1 Unitscommon stock and the Class B Units are considered participating securitiescontingently issuable share method to determine the potential dilutive effect of unvested performance stock units.are required to be includeddiluted earnings per share calculations: Year Ended December 31, 2022 2021 2020 Numerator: Net income attributable to Cactus Inc.—basic $ 110,174 $ 49,593 $ 34,446 27,235 13,744 19,934 $ 137,409 $ 63,337 $ 54,380 Denominator: Weighted average Class A shares outstanding—basic 60,323 55,398 47,457 Effect of dilutive shares 16,014 20,709 28,038 Weighted average Class A shares outstanding—diluted 76,337 76,107 75,495 Earnings per Class A share—basic $ 1.83 $ 0.90 $ 0.73 $ 1.80 $ 0.83 $ 0.72 basic earnings (loss) per Unit using the two‑class method. The two‑class method of computingdiluted earnings per Unit is an earnings allocation formula that determines earnings per Unit for each class of Unit accordingshare under the if-converted method to dividends declared and participation rights in78undistributed earnings. Basic earnings (loss) per Unit is calculated based on the weighted‑average number of the Class A Units outstanding during the periods presented. The following is a summary of earnings per Unit:Losses were not allocatedinclude net income attributable to the participating Units in 2016non-controlling interest calculated as its pre-tax income adjusted for a corporate effective tax rate of 25.0%, 27.0% and 24.0% for the participating securities are not contractually obligated to fund losses.11. years ended December 31, 2022, 2021 and 2020, respectively. Year Ended December 31, 2022 2021 2020 Right-of-use assets obtained in exchange for new lease obligations $ 14,506 $ 15,283 $ 4,302 Property and equipment in accounts payable 1,369 405 197 Year Ended December 31, 2022 2021 2020 Cash paid for interest $ 1,063 $ 959 $ 959 Cash paid for income taxes, net 5,502 4,542 1,600 12. Quarterly Financial Information (Unaudited)Summarized quarterly financial data for20172022, 2021 and 2016 are presented in the following tables. In the following tables, the sum of basic2020, we issued 1.7 million, 11.0 million and diluted earnings per unit for the four quarters may differ from the annual amounts due to the required method of computing weighted average number of shares in the respective79periods. Additionally, due to the effect of rounding, the sum of the individual quarterly earnings per share amounts may not equal the calculated year earnings per share amount.13. Subsequent EventsOn February 12, 2018, Cactus Inc. completed its IPO. Pursuant to the IPO, Cactus Inc. issued 23,000,0000.3 million shares of Class A common stock, par value $0.01 per sharerespectively, pursuant to redemptions of CW Units by holders thereof.Common Stock”),common stock at a price to the publicunderwriters of $19.00$51.36 per share. Cactus Inc. receivedshare for net proceeds of $405.8$165.6 million after deducting(net of $6.9 million of underwriting discounts and commissions and estimatedcommissions). Following the offering, expenses of the IPO. On February 14, 2018 Cactus Inc. completed the saleowned 81.1% and CW Unit Holders owned 18.9% of an additional 3,450,000Cactus LLC, which was based on 64.1 million shares of Class A Common Stock pursuant to the exercise in full by the underwriters of their option (the “Option”) to purchase additionalcommon stock issued and outstanding and 15.0 million shares of Class A Common Stock, resultingB common stock issued and outstanding.$61.6 million of additional net proceeds.FlexSteel Holdings, Inc. Subsequent to the Merger, FlexSteel Holdings, Inc. was converted into a limited liability company, now named FlexSteel Holdings, LLC (previously defined as “FlexSteel”). Also subsequent to the Merger, Cactus Inc. contributed HighRidge to Cactus Acquisitions LLC, a newly created entity, whereby HighRidge was converted into a limited liability company. Finally, Cactus Acquisitions LLC contributed FlexSteel to Cactus Companies, LLC who acquired all of the net proceedsoutstanding units of the IPO to Cactus LLC in exchange for CW Units. Cactus LLC used (i) $251.0an equal number CC Units (as defined below) prior to the Merger closing. We acquired FlexSteel on a cash-free, debt-free basis, for a purchase price of approximately $621.2 million, subject to certain working capital, debt and other customary adjustments set forth in the Merger Agreement. In addition to the upfront consideration, there is a potential future earn-out payment of up to $75 million to be paid no later than the third quarter of 2024, if certain revenue growth targets are met by FlexSteel. We funded the upfront purchase price using a combination of $165.6 million of the net proceeds received from the public offering of shares of our Class A common stock completed on January 13, 2023, borrowings under the Amended ABL Credit Facility and available cash on hand at the time of closing.repay allthe E&P industry and expands our reach further downstream. We also believe FlexSteel’s products are highly complementary to Cactus’ equipment at the wellsite and provides meaningful growth potential for Cactus. The acquisition is being accounted for using the acquisition method of accounting, with Cactus being treated as the accounting acquirer. Under the acquisition method of accounting, the assets and liabilities will be recorded at their respective fair values as of the borrowings outstanding under its term loan facility, including accrued interestdate of the completion of the Merger. The preliminary purchase price allocation is not complete as of the date of this report and (ii) $216.4 millionwill be an ongoing process for up to redeem CW Units from certain direct and indirect owners of Cactus LLC. After the IPO, the amount of debt outstanding for Cactus LLC significantly decreased. Withone year subsequent to the closing date of the IPO, we will write off $2.2 milliontransaction. Determining the fair value of deferred IPO coststhe assets and liabilities of FlexSteel requires judgment and certain assumptions to be made. The Merger was structured as a charge to additional paid in capital that are included in prepaid expenses in the consolidated balance sheet as of December 31, 2017.IPO,CC Reorganization, CW Unit Holders ceased to be holders of CW Units and, instead, became holders of a number of CC Units equal to the number of CW Units such CW Unit Holders held immediately prior to the completion of the CC Reorganization. Following the completion of the CC Reorganization, CC Unit Holders own one share of our Class B Common Stock for each CC Unit such CC Unit Holder owns. Cactus Inc. is a holding company whose only material asset is an equity interest consisting of CC Units, following the completion of the CC Reorganization, and was CW Units from the IPO until the CC Reorganization. Cactus Inc. was the sole managing member of Cactus LLC upon completion of our IPO until the CC Reorganization and became the sole managing member of Cactus LLCCompanies upon completion of the CC Reorganization.is responsible for all operational, management and administrative decisions relating to Cactus LLC’s business and will consolidate the financial resultsowners of Cactus LLC and its subsidiaries. TheCC Units entered into the Limited Liability Company Operating Agreement of Cactus Companies (the “Cactus Companies LLC was amendedAgreement”), which contains substantially the same terms and restatedconditions as the FirstSecond Amended and Restated Limited Liability Company Operating Agreement of Cactus LLC (the “Cactus Wellhead LLC Agreement”) to, among other things, admit Cactus Inc. as, which was the sole managing member of Cactus LLC.80In connection with the IPO, Cactus completed a series of reorganization transactions, including the following:(a)all of the membership interests in Cactus LLC were converted into a single class of CW Units;(b)Cactus Inc. contributed the net proceeds of the IPO to Cactus LLC in exchange for 23,000,000 CW Units;(c)Cactus LLC used the net proceeds of the IPO that it received from Cactus Inc. to repay the borrowings outstanding, plus accrued interest, under its term loan facility and to redeem 8,667,841 CW Units from the owners thereof;(d)Cactus Inc. issued and contributed 51,747,768 shares of its Class B common stock, par value $0.01 per share (“Class B Common Stock”) equal to the number of outstanding CW Units held by the Pre-IPO Owners following the redemption described in (c) above to Cactus LLC;(e)Cactus LLC distributed to each of the Pre-IPO Owners that continued to own CW Units following the IPO one share of Class B Common Stock for each CW Unit such Pre-IPO Owner held following the redemption described in (c) above;(f)Cactus Inc. contributed the net proceeds from the exercise of the Option to Cactus LLC in return for 3,450,000 additional CW Units; and(g)Cactus LLC used the net proceeds from the Option to redeem 3,450,000 CW Units from the owners thereof, and Cactus Inc. canceled a corresponding number of shares of Class B Common Stock.Additionally, in connection with the IPO, Cactus Inc. granted 0.7 million restricted stock unit awards, which will vest over one to three years, to certain directors, officers and employees of Cactus. Stock-based compensation expense associated with these awards will be recognized over the vesting term.The owners of CW Units (along with their permitted transferees) are referred to as “CW Unit Holders.” CW Unit Holders also own one share of our Class B Common Stock for each CW Unit such CW Unit Holders own. After giving effect to the IPO and the related transactions, Cactus Inc. owns an approximate 35.3% interest in Cactus LLC, and the CW Unit Holders own an approximate 64.7% interest in Cactus LLC. These ownership percentages are based on 26,450,000 shares of Class A Common Stock and 48,439,772 shares of Class B Common Stock issued and outstanding as of March 13, 2018.The shares of Class B common stock are not considered participating securities because they do not participate in the earnings of Cactus Inc. The noncontrolling interest owners own shares of Class B common stock. The noncontrolling interest owners have redemption rights which enable the noncontrolling interest owners to redeem CW Units (and corresponding shares of Class B common stock) for shares of Class A common stock on a one for one basis or, at Cactus Inc.’s or Cactus LLC’s election, an equivalent amount of cash.Cactus Inc.’s sole material assets are CW Units in Cactus LLC. On February 12, 2018, in connection with the IPO, Cactus Inc. became the managing memberlimited liability company operating agreement of Cactus LLC and isprior to the CC Reorganization. Cactus Inc. was responsible for all operational, management and administrative decisions relating to Cactus LLC’s business.will be(instead of Cactus Companies) has the right to acquire each tendered CC Unit directly from the exchanging CC Unit Holder for, at its election, (x) one share of Class A common stock, subject to federal income taxes related to its shareconversion rate adjustments for stock splits, stock dividends and reclassifications and other similar transactions, or (y) an equivalent amount of income in Cactus LLC.cash. In connection with the IPO, Cactus Inc. entered into the Tax Receivable Agreement (“TRA”) with certain direct and indirect ownersany redemption of Cactus LLC (each such person, a “TRA Holder”)CC Units pursuant to which Cactus Inc. will paysuch redemption right or our alternative right to acquire each tendered CC Unit, the TRA Holders 85%corresponding number of the amountshares of net cash savings, if any, in U.S. federal, state and local income tax or franchise tax that Cactus Inc. actually realizes (or is deemed to realize in certain circumstances) in periods after the IPO as a result of (i) certain increases in taxClass B common stock would be canceled.81basis that occur as a result of Cactus Inc.’s acquisition (or deemed acquisition for U.S. federal income tax purposes) of all or a portion of such TRA Holders’ CW UnitsOn February 28, 2023, in connection with the IPO or pursuant toMerger, Cactus Companies assumed the exerciserights and obligations of Cactus LLC as Borrower under the ABL Credit Facility and the ABL Credit Facility was amended and restated in its entirety (the “Amended ABL Credit Facility”). The Amended ABL Credit Facility provides for a term loan of $125.0 million, the full amount of which was borrowed at closing of the redemption right orAmended ABL Credit Facility to fund a portion of the call rightMerger, and up to $225.0 million in revolving commitments, up to $20.0 million of which is available for the issuance of letters of credit. Subject to certain terms and conditions set forth in the TRA, (ii) certain increasesAmended ABL Credit Facility, Cactus Companies LLC may request additional revolving commitments in tax basis resulting from the repayment,an amount not to exceed $50.0 million, for a total of up to $275.0 million in connection with the IPO, of borrowings outstanding under Cactus LLC’srevolving commitments. The term loan facility,under the Amended ABL Credit Facility matures on February 27, 2026 and any revolving loans under the Amended ABL Credit Facility mature on July 26, 2027. The maximum amount that Cactus Companies may borrow under the Amended ABL Credit Facility is subject to a borrowing base, which is based on a percentage of eligible accounts receivable and eligible inventory, subject to reserves and other adjustments.imputed interest deemed to be paid by Cactus Inc. as a result of, and additional tax basis arising from, any payments Cactus Inc. makes under the TRA. Cactus Inc. will retainlenders may commence foreclosure or other actions against the benefit of the remaining 15% of these net cash savings.On January 21, 2018, the board of directors of Cactus LLC declared a cash distribution of $26.0 million, which was paid to the Pre-IPO Owners on January 25, 2018. Such distribution was funded by borrowing under the revolving credit facility. The purpose of the distribution was to provide funds to the Pre-IPO Owners to pay their federal and state tax liabilities associated with taxable income recognized by them as a result of their ownership interests in Cactus LLC prior to the completion of our IPO.82In accordance with Exchange Act Rules 13a‑15 and 15d‑15, we our management, including our principal executive officer and principal financial officer, the effectiveness of the design and operation of our disclosure controls and procedures (as defined inAct)Act as amended) as of December 31, 2017.2022. Based upon that evaluation, our principal executive officer and principal financial officer concluded that our disclosure controls and procedures were effective at the reasonable assurance level as of such date. Our disclosure controls and procedures are designed to provide reasonable assurance that the information required to be disclosed by us in reports that we file or submit under the Exchange Act is accumulated and communicated to our management, including our principal executive officer and principal financial officer, as appropriate to allow timely decisions regarding required disclosure and is recorded, processed, summarized and reported within the time periods specified in the rules and forms of the SEC. Based upon that evaluation, our principal executive officer and principal financial officer concluded that our disclosure controls and procedures were effective as of December 31, 2017 at the reasonable assurance level.Management’s Annual Report on Internal Control over Financial Reporting and Attestation Report of the Registered Public Accounting FirmThis annual report does not include a report of management’s assessment regarding internal control over financial reporting or an attestation report of our registered public accounting firm due to a transition period established by the rules of the SEC for newly public companies. However, a report of management’s assessment regarding internal control over financial reporting will be required for the 2018 annual report.Remediation of Material Weakness in Internal Control Over Financial ReportingIn connection with the audit of the consolidated financial statements of Cactus Wellhead, LLC, our predecessor for accounting purposes, for the year ended December 31, 2016, we identified a material weakness in our internal control over financial reporting. A material weakness is a deficiency, or a combination of deficiencies, in internal control over financial reporting, such that there is a reasonable possibility that a material misstatement of our annual or interim financial statements will not be prevented or detected on a timely basis.We did not effectively operate controls in place over the review of the consolidated financial statements and related disclosures for 2016. This resulted in the identification of certain errors in the 2016 consolidated statement of cash flows that have been corrected as a revision of that statement.Changes were made to our controls and procedures during the quarter ended June 30, 2017, in an effort to remediate these deficiencies. Activities to remediate the previously identified material weakness include hiring additional experienced resources to manage the preparation of the consolidated financial statements and disclosures to allow more timely review of these consolidated financial statements and disclosures by management. With this change, we also added new controls and procedures related to the preparation of the consolidated financial statements and disclosures. In connection with these efforts, we documented the internal controls with respect to the preparation of the consolidated financial statements and disclosures and performed those controls in the preparation of the consolidated financial statements and disclosures.Neither our management nor an independent registered public accounting firm has performed an evaluation of our internal control over financial reporting in accordance with the provisions of the Sarbanes‑Oxley Act because no83such evaluation has been required. However, based on the actions described above, we have concluded that the previously identified and disclosed material weakness no longer exists as of December 31, 2017.hashave been no changechanges in our internal control over financial reporting during the quarter ended December 31, 20172022 that hashave materially affected, or isare reasonably likely to materially affect, our internal control over financial reporting.84
Item 9C. Disclosure Regarding Foreign Jurisdictions that Prevent InspectionsItem 10 will be set forth in theour Definitive Proxy Statement for theour 2023 Annual Meeting of Shareholders to be held on June 20, 2018 (the “Annual Meeting”) and is incorporated herein by reference.Our boardfiled with the SEC within 120 days of directors has adopted a Code of Business Conduct and Ethics applicable to all of our officers, directors and employees, including our principal executive officer, principal financial officer, principal accounting officer and controller, or persons performing similar functions and is available on our website at www.CactusWHD.com under “Corporate Governance” within the “Investors” section. We will provide a copy of this document to any person, without charge, upon request, by writing to us at Cactus, Inc., Investor Relations, Cobalt Center, 920 Memorial City Way, Suite 300, Houston, Texas 77024. We intend to satisfy the disclosure requirement under Item 406(b) of Regulation S-K regarding amendments to, or waivers from, provisions of our Code of Business Conduct and Ethics by posting such information on our website at the address and the location specified above.Information as to Item 11 will be set forth in the Proxy Statement for the Annual Meeting andherein by reference.reference to our Proxy Statement.Information as to Item 12 will be set forth in the Proxy Statement for the Annual Meeting andherein by reference.reference to our Proxy Statement.Information as to Item 13 will be set forth in the Proxy Statement for the Annual Meeting andherein by reference.reference to our Proxy Statement.AccountingAccountant Fees and ServicesInformation as to Item 14 will be set forth in the Proxy Statement for the Annual Meeting andherein by reference.reference to our Proxy Statement.85Cactus Wellhead, LLC and Subsidiaries and the ReportsReport of Independent Registered Public Accounting Firm are included in Part II, Item 88. of this report.Annual Report. Reference is made to the accompanying Index to Consolidated Financial Statements.3.13.1 3.2 3.2*4.1 10.2† 10.2†10.3† 10.3†10.5† 10.6† 10.4†10.8† 10.9† 10.5†10.10† 10.6†10.11†* 86Exhibit No.Description10.7†10.8†10.9†10.10†10.11†10.12†10.13†10.14†10.15†10.16†10.1710.13 10.1810.1910.14† 10.2010.2110.15† 87Exhibit No.Description10.22†10.17† 10.23†Exhibit No. Description 21.1*10.19† 10.20† 10.21† 10.22† 10.23† 10.24† 10.25† 10.26† 10.27†* 21.1* 23.1* 31.2* 31.2*32.1** 32.1**32.2** 32.2**101.INS* XBRL Instance Document - the instance document does not appear in the Interactive Data File because XBRL tags are embedded within the Inline XBRL document 101.SCH* XBRL Inline Taxonomy Extension Schema Document 101.CAL* XBRL Inline Taxonomy Calculation Linkbase Document 101.LAB* XBRL Inline Taxonomy Label Linkbase Document 101.PRE* XBRL Inline Taxonomy Presentation Linkbase Document 101.DEF* XBRL Inline Taxonomy Definition Document 104 Cover Page Interactive Data File (formatted as Inline XBRL and contained in Exhibit 101) herewith Pursuant to SEC Release No. 33‑8212, this certification will be treated as “accompanying” this Annual Report and not “filed” as part of such report for purposes of Section 18 of the Exchange Act or otherwise subject to the liability of Section 18 of the Exchange Act, and this certification will not be deemed to be incorporated by reference into any filing under the Securities Act, except to the extent that the registrant specifically incorporates it by reference.88Date: March 1, 2023 Date: March 19, 2018indicatedand on March 19, 2018.the dates indicated.Date March 1, 2023 Officer)Brian SmallMarch 1, 2023 Brian SmallIke SmithMarch 1, 2023 Ike SmithMarch 1, 2023 March 1, 2023 Director March 1, 2023 Melissa Law /s/ Michael McGovern Director March 1, 2023 Michael McGovern /s/ John (Andy) O’Donnell March 1, 2023 Michael McGovernMarch 1, 2023 Michael McGovernMarch 1, 2023 Gary RosenthalMarch 1, 2023 Gary Rosenthal89