engagement of consultants and advisors to analyze particular opportunities, our analysis of technical, financial, legal and other
1
confidential information,particular opportunities, submission of indications of interest and term sheets, participation in preliminary discussions and negotiations and involvement as a bidder in competitive processes.
As discussed in further detail throughout this report, some significant developments tohighlights of our business during fiscal year 20182020 were as follows:
| Our revenue increased |
| We |
| We increased our calendar year dividend to |
Certain Definitions
Dollar or “$”: Unless we have indicated otherwise, or the context otherwise requires, references in this Annual Report on Form 10‑K Refers to “$” or “dollar” are to the currency of the United States.U.S. dollars. We refer to Canadian dollars as C$.
Gold equivalent ounces (GEOs): GEOs are calculated as Royal Gold’s revenue divided by the average gold price for the period.
Gross smelter return (GSR) royalty: A defined percentage of the gross revenue from a resource extraction operation, less, if applicable, certain contract‑definedcontract-defined costs paid by or charged to the operator.
Metal stream: A purchase agreement that provides, in exchange for an upfront deposit payment, the right to purchase all or a portion of one or more metals produced from a mine, at a price determined for the life of the transaction by the purchase agreement.
Mineralized material: That part of a mineral system that has potential economic significance, but is not included in the proven and probable reserve estimates until further drilling and metallurgical work is completed, and until other economic and technical feasibility factors based on such work have been resolved.
Net revenue: Net revenue is calculated as Royal Gold’s Revenue minus Cost of sales.
Net smelter return (NSR) royalty: A defined percentage of the gross revenue from a resource extraction operation less a proportionate share of incidental transportation, insurance, refining and smelting costs.
Net value royalty (NVR): A defined percentage of the gross revenue from a resource extraction operation less certain contract‑definedcontract-defined costs.
Probable reserves: Ore reserves Reserves for which the quantity and grade and/or quality are computed from information similar to that used for proven reserves, but the sites for inspection, sampling and measurement are farther apart or are otherwise less adequately spaced. The degree of assurance, of probable reserves, although lower than that for proven reserves, is high enough to assume geological continuity between points of observation.
Proven reserves: Ore reserves Reserves for which (a) the quantity is computed from dimensions revealed in outcrops, trenches, workings or drill holes, and the grade isand/or quality are computed from the results of detailed sampling, and (b) the sites for inspection, sampling and measurement are spaced so closely and the geologic character is so well defined that the size, shape, depth and mineral content of reserves are well established.
Payable metal: Ounces or pounds of metal in concentrate after deduction of a percentage of metal in concentrate by a third‑partythird-party smelter pursuant to smelting contracts.
2
3
Reserve: That part of a mineral deposit whichthat could be economically and legally extracted or produced at the time of the reserve determination.
Royalty: The right to receive a percentage or other denomination of mineral production from a mining operation.
Ton: A unit of weight equal to 2,000 pounds or 907.2 kilograms.
Tonne: A unit of weight equal to 2,204.6 pounds or 1,000 kilograms.
Fiscal 20182020 Business Developments
Please refer to Item 7, MD&A, for discussion on recent liquidity and capital resource developments.
U.S. Tax LegislationAlturas royalty acquisition
On December 22, 2017, H.R. 1, originally knownJanuary 29, 2020, we entered into an agreement with various private individuals for the acquisition of an NSR royalty of up to 1.06% (gold) and up to 1.59% (copper) on mining concessions included as the Tax Cuts and Jobs Act (the “Act”), was enacted and is effective for tax years including January 1, 2018. The effectspart of the Act were recognized inAlturas project, which is located within the periodCoquimbo Region of enactment, orChile and held by Compañia Minera Salitrales Limitada, a subsidiary of Barrick Gold Corporation (“Barrick”). Total consideration for the period ending December 31, 2017. Certain other aspectsroyalty is up to $41 million, of which $11 million was paid on January 29, 2020. A future payment of up to $20 million is conditioned based on a project construction decision by Barrick and the size of the Act are not effectiveminable mineralized material on the date of the construction decision. A further future payment of up to $10 million will be made upon first production from the mining concessions.
Castelo de Sonhos royalty acquisition
In August 2019, we entered into an agreement with TriStar Gold Inc. and its subsidiaries (together “TriStar”) to acquire (i) up to a 1.5% NSR royalty on the Castelo de Sonhos gold project (“CDS”), located in Brazil, and (ii) warrants to purchase up to 19,640,000 common shares of TriStar. Total consideration was $7.5 million, of which $4.5 million was paid in August 2019, $1.5 million was paid in November 2019, and $1.5 million was paid in March 2020.
Aggregate funds we invested with TriStar will be used primarily to advance CDS to the feasibility stage, including advancing permitting activities. A preliminary economic assessment for fiscal June 30 companies until July 1, 2018.
The Act, among other things, reduced the U.S. corporate income tax rate to 21% starting January 1, 2018. AsCDS was prepared by TriStar in calendar 2018 and was based on a United States domiciled company, we expect that the Act will have a positive long-term impact on Royal Gold’s future financial results through the reduction in the U.S. corporate tax rate from 35% to 21% and by allowing us to efficiently repatriate future earnings from our foreign subsidiaries. As the Company is a fiscal year taxpayer, we applied a blended U.S. federal income tax ratetotal of 2.0 million ounces of mineralized material at an average gold grade of approximately 28.1% for1.0 gram per tonne. Since August 2019, TriStar has completed reverse circulation drilling, which will support the fiscal year ending June 30, 2018. The blended percentage was calculated onpreparation of a pro-rata percentage of the number of days before and after January 1, 2018. The Company’s U.S. statutory federal corporate income tax rate will be 21% for the fiscal year commencing on July 1, 2018 and all future years.
preliminary feasibility study. Refer to Note 103 of our notes to consolidated financial statements for further discussiondiscussion.
Covid-19 and current economic environment
Several of our operating counterparties previously announced temporary operational curtailments or the withdrawal or review of previously disclosed guidance due to the ongoing COVID-19 pandemic. The economic and societal impacts associated with COVID-19 are fluid and changing rapidly, and we are currently unable to predict the nature or extent of any impacts on our results of operations and financial condition. We will continue to monitor any further developments that the income tax accounting considerations for the Act.COVID-19 pandemic may have on stream or royalty interests as part of our regular asset impairment analysis.
Recent TransactionsLeadership changes
On June 28, 2018, Royal Gold acquired 682,556 sharesWe made several key leadership changes as a result of common stockour ongoing management succession planning. After a thorough search process, our Board of Contango ORE, Inc. (“CORE”) for consideration of $26 per share from certain individual stockholders of CORE.
On June 29, 2018, Royal Gold, throughDirectors appointed William Heissenbuttel as our President and Chief Executive Officer and a wholly-owned subsidiary, acquired an additional 1.75% NSR royalty interest on Amarillo Gold’s Mara Rosa gold project in Goias State, Brazil for $10.8 million.
On June 29, 2018, a subsidiary of Golden Star repaid its $20 million term loan facility, plus accrued interest, to Royal Gold.
See Note 3member of the notes to consolidated financial statements for more information regarding these transactionsBoard of Directors, effective January 2, 2020. Mr. Heissenbuttel most recently served as our Chief Financial Officer and Vice President Strategy. In addition, the Board of Directors promoted the following executives effective January 2, 2020: Mark Isto, Executive Vice President and Chief Operating Officer; Paul Libner, Chief Financial Officer and Treasurer; and Randy Shefman, Vice President and General Counsel.
3
4
Our Operational Information
Reportable Segments Geographical and Financial Information
The Company manages itsWe manage our business under two reportable segments, consisting of the acquisition and management of stream interests and the acquisition and management of royalty interests. Royal Gold’s long‑livedlong-lived assets (stream and royalty interests, net) are geographically distributed as shown in the following table:table (amounts are in thousands):
|
|
|
|
|
|
|
|
|
|
|
|
|
|
|
|
|
|
|
|
|
|
|
|
| ||||||||||||||||||
|
| As of June 30, 2018 |
| As of June 30, 2017 | ||||||||||||||||||||||||||||||||||||||
|
|
|
|
|
|
|
|
|
|
| Total stream |
|
|
|
|
|
|
|
|
|
| Total stream | ||||||||||||||||||||
|
| Stream |
| Royalty |
|
|
|
| and royalty |
| Stream |
| Royalty |
|
|
|
| and royalty | ||||||||||||||||||||||||
|
| interest |
| interest |
| Impairments |
| interests, net |
| interest |
| interest |
| Impairments |
| interests, net | ||||||||||||||||||||||||||
| | | | | | | | | | | | | | | | | | | ||||||||||||||||||||||||
| | As of June 30, 2020 | | As of June 30, 2019 | ||||||||||||||||||||||||||||||||||||||
| | | | | | | | Total stream | | | | | | | | Total stream | ||||||||||||||||||||||||||
| | Stream | | Royalty | | and royalty | | Stream | | Royalty | | and royalty | ||||||||||||||||||||||||||||||
|
| interest |
| interest |
| interests, net |
| interest |
| interest |
| interests, net | ||||||||||||||||||||||||||||||
Canada |
| $ | 809,500 |
| $ | 214,562 |
| $ | (284) |
| $ | 1,023,778 |
| $ | 852,035 |
| $ | 221,618 |
| $ | — |
| $ | 1,073,653 | | $ | 702,732 | | $ | 189,855 | | $ | 892,587 | | $ | 767,749 | | $ | 200,251 | | $ | 968,000 |
Dominican Republic |
|
| 495,460 |
|
| — |
|
| — |
|
| 495,460 |
|
| 543,256 |
|
| — |
|
| — |
|
| 543,256 | | | 406,469 | | | — | | | 406,469 | | | 451,585 | | | — | | | 451,585 |
Chile |
|
| 328,331 |
|
| 453,306 |
|
| (239,080) |
|
| 542,557 |
|
| 348,778 |
|
| 453,369 |
|
| — |
|
| 802,147 | | | 277,661 | | | 223,922 | | | 501,583 | | | 301,507 | | | 214,226 | | | 515,733 |
Africa |
|
| 104,874 |
|
| 502 |
|
| — |
|
| 105,376 |
|
| 123,760 |
|
| 572 |
|
| — |
|
| 124,332 | | | 215,463 | | | 321 | | | 215,784 | | | 89,556 | | | 321 | | | 89,877 |
Mexico |
|
| — |
|
| 93,277 |
|
| — |
|
| 93,277 |
|
| — |
|
| 105,889 |
|
| — |
|
| 105,889 | | | — | | | 75,951 | | | 75,951 | | | — | | | 83,748 | | | 83,748 |
United States |
|
| — |
|
| 165,543 |
|
| — |
|
| 165,543 |
|
| — |
|
| 168,378 |
|
| — |
|
| 168,378 | | | — | | | 159,445 | | | 159,445 | | | — | | | 163,398 | | | 163,398 |
Australia |
|
| — |
|
| 34,254 |
|
| — |
|
| 34,254 |
|
| — |
|
| 37,409 |
|
| — |
|
| 37,409 | | | — | | | 30,006 | | | 30,006 | | | — | | | 31,944 | | | 31,944 |
Other |
|
| 12,039 |
|
| 28,833 |
|
| — |
|
| 40,872 |
|
| 12,030 |
|
| 25,162 |
|
| — |
|
| 37,192 | ||||||||||||||||||
Rest of world | | | 12,038 | | | 25,050 | | | 37,088 | | | 12,038 | | | 22,993 | | | 35,031 | ||||||||||||||||||||||||
Total |
| $ | 1,750,204 |
| $ | 990,277 |
| $ | (239,364) |
| $ | 2,501,117 |
| $ | 1,879,859 |
| $ | 1,012,397 |
| $ | — |
| $ | 2,892,256 | | $ | 1,614,363 | | $ | 704,550 | | $ | 2,318,913 | | $ | 1,622,435 | | $ | 716,881 | | $ | 2,339,316 |
The Company’s revenue, costsOur reportable segments for purposes of sales and net revenue by reportable segmentassessing performance for our fiscal years ended June 30, 2018, 20172020, and 20162019 are geographically distributed as shown below (amounts are in the following table:thousands):
| | | | | | | | | | | | | | | |
| | Year Ended June 30, 2020 | |||||||||||||
|
| Revenue |
| Cost of sales (1) |
| Production taxes |
| Depletion (2) |
| Segment gross profit(3) | |||||
Stream interests | | $ | 359,868 | | $ | 83,890 | | $ | — | | $ | 144,678 | | $ | 131,300 |
Royalty interests | | | 138,951 | | | — | | | 3,824 | | | 30,369 | | | 104,758 |
Total | | $ | 498,819 | | $ | 83,890 | | $ | 3,824 | | $ | 175,047 | | $ | 236,058 |
| | | | | | | | | | | | | | | |
| | Year Ended June 30, 2019 | |||||||||||||
|
| Revenue |
| Cost of sales |
| Production taxes |
| Depletion |
| Segment gross profit | |||||
Stream interests | | $ | 305,824 | | $ | 77,535 | | $ | — | | $ | 127,770 | | $ | 100,519 |
Canada | | $ | 81,021 | | $ | 23,393 | | $ | — | | $ | — | | $ | 57,628 |
Dominican Republic | | | 37,717 | | | 17,675 | | | — | | | — | | | 20,042 |
Chile | | | 35,378 | | | 7,684 | | | — | | | — | | | 27,694 |
Africa | | | 17,611 | | | 5,012 | | | — | | | — | | | 12,599 |
Total stream interests | | | 171,727 | | | 53,764 | | | — | | | - | | | 117,963 |
| | | | | | | | | | | | | | | |
Royalty interests | | | 117,232 | | | — | | | 4,112 | | | 35,086 | | | 78,034 |
Canada | | $ | 17,717 | | $ | — | | $ | — | | $ | $- | | $ | 17,717 |
United States | | | 14,340 | | | — | | | — | | | — | | | 14,340 |
Mexico | | | 15,833 | | | — | | | — | | | — | | | 15,833 |
Australia | | | 6,217 | | | — | | | — | | | — | | | 6,217 |
Africa | | | 1,024 | | | — | | | — | | | — | | | 1,024 |
Chile | | | $- | | | — | | | — | | | — | | | - |
Rest of world | | | 4,738 | | | — | | | — | | | — | | | 4,738 |
Total royalty interests | | | 59,869 | | | — | | | - | | | - | | | 59,869 |
Total | | $ | 423,056 | | $ | 77,535 | | $ | 4,112 | | $ | 162,856 | | $ | 178,553 |
|
|
|
|
|
|
|
|
|
|
|
|
|
|
|
|
|
|
|
|
| Year Ended June 30, 2018 |
| Year Ended June 30, 2017 | ||||||||||||||
|
| Revenue |
| Cost of sales |
| Net revenue |
| Revenue |
| Cost of sales |
| Net revenue | ||||||
Streams: |
|
|
|
|
|
|
|
|
|
|
|
|
|
|
|
|
|
|
Canada |
| $ | 142,244 |
| $ | 40,766 |
| $ | 101,478 |
| $ | 136,736 |
| $ | 45,954 |
| $ | 90,782 |
Dominican Republic |
|
| 95,055 |
|
| 28,496 |
|
| 66,559 |
|
| 91,589 |
|
| 27,191 |
|
| 64,398 |
Chile |
|
| 57,413 |
|
| 8,614 |
|
| 48,799 |
|
| 60,251 |
|
| 9,037 |
|
| 51,214 |
Africa |
|
| 29,804 |
|
| 5,963 |
|
| 23,841 |
|
| 25,435 |
|
| 5,083 |
|
| 20,352 |
Total streams |
| $ | 324,516 |
| $ | 83,839 |
| $ | 240,677 |
| $ | 314,011 |
| $ | 87,265 |
| $ | 226,746 |
|
|
|
|
|
|
|
|
|
|
|
|
|
|
|
|
|
|
|
Royalties: |
|
|
|
|
|
|
|
|
|
|
|
|
|
|
|
|
|
|
Mexico |
| $ | 42,959 |
| $ | — |
| $ | 42,959 |
| $ | 41,945 |
| $ | — |
| $ | 41,945 |
United States |
|
| 39,496 |
|
| — |
|
| 39,496 |
|
| 35,282 |
|
| — |
|
| 35,282 |
Canada |
|
| 24,254 |
|
| — |
|
| 24,254 |
|
| 23,208 |
|
| — |
|
| 23,208 |
Australia |
|
| 13,710 |
|
| — |
|
| 13,710 |
|
| 12,943 |
|
| — |
|
| 12,943 |
Africa |
|
| 2,098 |
|
| — |
|
| 2,098 |
|
| 3,131 |
|
| — |
|
| 3,131 |
Chile |
|
| 473 |
|
| — |
|
| 473 |
|
| 1,648 |
|
| — |
|
| 1,648 |
Other |
|
| 11,536 |
|
| — |
|
| 11,536 |
|
| 8,646 |
|
| — |
|
| 8,646 |
Total royalties |
| $ | 134,526 |
| $ | — |
| $ | 134,526 |
| $ | 126,803 |
| $ | — |
| $ | 126,803 |
Total streams and royalties |
| $ | 459,042 |
| $ | 83,839 |
| $ | 375,203 |
| $ | 440,814 |
| $ | 87,265 |
| $ | 353,549 |
| (1) | Excludes depreciation, depletion and amortization. |
4
5
| (2) | Depletion amounts are included within Depreciation, depletion and amortization on our consolidated statements of operations and comprehensive income (loss). |
| (3) | Refer to Note 14 to consolidated financial statements for a reconciliation of total segment gross profit to consolidated income (loss) before income taxes. |
|
|
|
|
|
|
|
|
|
|
|
|
|
|
|
|
|
|
|
|
| Fiscal Year Ended June 30, 2017 |
| Fiscal Year Ended June 30, 2016 | ||||||||||||||
|
| Revenue |
| Cost of sales |
| Net revenue |
| Revenue |
| Cost of sales |
| Net revenue | ||||||
Streams: |
|
|
|
|
|
|
|
|
|
|
|
|
|
|
|
|
|
|
Canada |
| $ | 136,736 |
| $ | 45,954 |
| $ | 90,782 |
| $ | 125,755 |
| $ | 47,417 |
| $ | 78,338 |
Dominican Republic |
|
| 91,589 |
|
| 27,191 |
|
| 64,398 |
|
| 39,684 |
|
| 11,625 |
|
| 28,059 |
Chile |
|
| 60,251 |
|
| 9,037 |
|
| 51,214 |
|
| 49,243 |
|
| 7,280 |
|
| 41,963 |
Africa |
|
| 25,435 |
|
| 5,083 |
|
| 20,352 |
|
| 23,346 |
|
| 4,657 |
|
| 18,689 |
Total streams |
| $ | 314,011 |
| $ | 87,265 |
| $ | 226,746 |
| $ | 238,028 |
| $ | 70,979 |
| $ | 167,049 |
Royalties: |
|
|
|
|
|
|
|
|
|
|
|
|
|
|
|
|
|
|
Mexico |
| $ | 41,945 |
| $ | — |
| $ | 41,945 |
| $ | 35,267 |
| $ | — |
| $ | 35,267 |
United States |
|
| 35,282 |
|
| — |
|
| 35,282 |
|
| 35,483 |
|
| — |
|
| 35,483 |
Canada |
|
| 23,208 |
|
| — |
|
| 23,208 |
|
| 30,676 |
|
| — |
|
| 30,676 |
Australia |
|
| 12,943 |
|
| — |
|
| 12,943 |
|
| 10,462 |
|
| — |
|
| 10,462 |
Africa |
|
| 3,131 |
|
| — |
|
| 3,131 |
|
| 1,868 |
|
| — |
|
| 1,868 |
Chile |
|
| 1,648 |
|
| — |
|
| 1,648 |
|
| 84 |
|
| — |
|
| 84 |
Other |
|
| 8,646 |
|
| — |
|
| 8,646 |
|
| 7,922 |
|
| — |
|
| 7,922 |
Total royalties |
| $ | 126,803 |
| $ | — |
| $ | 126,803 |
| $ | 121,762 |
| $ | — |
| $ | 121,762 |
Total streams and royalties |
| $ | 440,814 |
| $ | 87,265 |
| $ | 353,549 |
| $ | 359,790 |
| $ | 70,979 |
| $ | 288,811 |
Please see “Operations in foreign countries or other sovereign jurisdictions are subject to many risks, which could decrease our revenues,” under Part I, Item 1A, Risk Factors, of this report for a description of the risks attendant to foreign operations.
Our financial results are primarily tied to the price of gold and, to a lesser extent, the priceprices of silver and copper, together with the amounts of production from our producing stageproducing-stage stream and royalty interests. During the fiscal year ended June 30, 2018, Royal Gold2020, we derived approximately 86%88% of itsour revenue from precious metals (including 77%79% from gold and 9% from silver), 11%9% from copper, and 3% from other minerals. The priceprices of gold, silver, copper, and other metals have fluctuated widely in recent years. The marketability and the price of metals are influenced by numerous factors beyond the control of the Company and significantour control. Significant declines in the priceprices of gold, silver, or copper could have a material and adverse effect on the Company’sour results of operations and financial condition.
Competition
The mining industry in general, and streaming and royalty segments in particular, are very competitive. We compete with other streaming and royalty companies, mine operators, and financial buyers in efforts to acquire existing streaming and royalty interests, andinterests. We also compete with the lenders, investors, and streaming and royalty companies providing financing to operators of mineral properties in our efforts to create new streaming and royalty interests. Our competitors may be larger than we are and may have greater resources and access to capital than we have. Key competitive factors in the stream and royalty acquisition and financing business include the ability to identify and evaluate potential opportunities, transaction structure and consideration, and access to capital.
Regulation
Operators of the mines that are subject to our stream and royalty interests must comply with numerous environmental, mine safety, land use, waste disposal, remediation and public health laws and regulations promulgated by federal, state, provincial and local governments in the United States, Canada, Chile, Ghana, Mexico, the Dominican Republic, Ghana, Mexico, Botswana, Australia and other countries where we hold interests. Although we, are not responsible as a stream or royalty interest owner, are not responsible for ensuring compliance with these laws and regulations, failure by the operators of the mines on which we have stream and royalty interests to comply with applicable laws, regulations and permits can result in injunctive action, orders to suspend or cease operations, damages, and civil and criminal penalties on the operators.
5
operations and financial condition.
Corporate Information
We were incorporated under the laws of the State of Delaware on January 5, 1981. Our executive offices are located at 1660 Wynkoop1144 15th Street, Suite 1000,2500, Denver, Colorado 80202. Our telephone number is (303) 573‑1660.573-1660.
Available InformationSEC Filings
Royal Gold maintains a website at www.royalgold.com. Royal Gold makesWe file periodic and current reports, proxy statements, and other information with the SEC. This includes our Annual Reports on Form 10-K, Quarterly Reports on Form 10-Q, Current Reports on Form 8-K, and any amendments to those forms. These reports are available free of charge through the Investor Relations section of itson our website its Annual Reports on Form 10‑K, Quarterly Reports on Form 10‑Q, Current Reports on Form 8‑K, and all amendments to those reports filed or furnished pursuant to Section 13(a) or 15(d) of the Exchange Act,at www.royalgold.com as soon as reasonably practicable after such material isthey are electronically filed with or furnished to the SEC. Our SEC filings are available fromThese reports also can be obtained on the SEC’s website at www.sec.gov which contains reports, proxy and information statements and other information regarding issuers that file electronically. These reports, proxy statements and other information may also be inspected and copied at the SEC’s Public Reference Room at 100 F Street, NE, Washington, D.C. 20549. Please call the SEC at 1‑800‑SEC‑0330 for further information on the operation of the Public Reference Room. The charters of Royal Gold’s key committees of the Board of Directors and Royal Gold’s Code of Business Conduct and Ethics are also available on the Company’s website. Any of the foregoing information is available in print to any stockholder who requests it by contacting our Investor Relations Department at (303) 573‑1660.www.sec.gov. The information on the Company’sour website is not and shall not be deemed to be, a part hereof or incorporated intoof this or any of our other filingsreport filed with or furnished to the SEC.
Company PersonnelEmployees
We currently have 2327 employees, 17 located18 of which work out of our office in Denver, Colorado and theColorado. The remainder locatedwork out of our offices in our Zug,Lucerne, Switzerland, Vancouver, Canada, and Toronto, Canada offices.Canada. Our employees are not subject to a labor contract or a collective bargaining agreement. We consider our overall employee relations to be good.
We also retain independent contractors6
Our global offices are adhering by the guidelines provided to provide consulting services, relating primarilythe local health authorities during the COVID-19 pandemic. The adoption of a remote work environment has not caused any material interruptions to geologic and geophysical interpretations and also relating to such metallurgical, engineering, environmental, and other technical matters as may be deemed useful in the operationday-to-day activities of our business.the Company.
ITEM 1A. RISK FACTORS
You should carefully consider the risks described below before making an investment decision.in this section. Our future performance is subject to risks and uncertainties that could have a material adverse effect on our business, financial condition, results of operations, and cash flows could be materially adversely affected by any of these risks. The market orfinancial condition and the trading price of our securities could decline duecommon stock. We may be subject to any of these risks.other risks and uncertainties not presently known to us. In addition, please see our note about forward-looking statements included in Part II, Item 7, MD&A of this Annual Report on Form 10-K. Please note that additional risks not presently known to us or that we currently deem immaterial may also impair our business, operations and stock price.
Risks RelatedRelating to our Business
Volatility
Our revenue is subject to volatility in metal prices, which could negatively affect our results of operations or cash flow.
Market prices for gold, silver, copper, nickel, and other metal prices may have an adverse impact on the value of our stream and royalty interests and may reduce our revenues. Certain contracts governing our stream and royalty interests have features that may amplify the negative effects of a drop in metals prices.
The profitability of our stream and royalty interests is directly related to the market price of gold, silver, copper, nickel and other metals. Our revenue is particularly sensitive to changes in the price of gold, as we derive a majority of our revenue from gold stream and royalty interests. Market prices may fluctuate widely over time and are affected by numerous factors beyond the control of Royal Gold or any mining company, includingour control. These factors include metal supply and demand, industrial and jewelry fabrication, investment demand, central banking economic policy,actions, inflation expectations, with respect to the rate of inflation, the relative strength of the dollar and other currencies,currency values, interest rates, gold purchases, sales and loans by central banks, forward sales by metal producers, global or regionaland political, trade, economic, or banking conditions, and a number of other factors.conditions.
6
Volatility in gold, silver, copper and nickel pricesOur revenue is demonstrated by the annual high and low prices for those metals over the past decade as reported by, in the case of gold and silver, the London Bullion Market Association, and in the case of copper and nickel, the London Metal Exchange:
|
|
|
|
|
|
|
|
|
|
|
|
|
|
|
|
|
|
|
|
|
|
|
|
|
|
| Gold |
| Silver |
| Copper |
| Nickel | ||||||||||||||||
|
| ($/ounce) |
| ($/ounce) |
| ($/pound) |
| ($/pound) | ||||||||||||||||
Calendar Year |
|
| High |
|
| Low |
|
| High |
|
| Low |
|
| High |
|
| Low |
|
| High |
|
| Low |
2008 - 2009 |
| $ | 1,213 |
| $ | 713 |
| $ | 20.92 |
| $ | 8.88 |
| $ | 4.08 |
| $ | 1.26 |
| $ | 15.10 |
| $ | 4.00 |
2010 - 2011 |
| $ | 1,895 |
| $ | 1,058 |
| $ | 48.70 |
| $ | 15.14 |
| $ | 4.60 |
| $ | 2.76 |
| $ | 13.17 |
| $ | 7.68 |
2012 - 2013 |
| $ | 1,792 |
| $ | 1,192 |
| $ | 37.23 |
| $ | 18.61 |
| $ | 3.93 |
| $ | 3.01 |
| $ | 9.90 |
| $ | 5.97 |
2014 - 2015 |
| $ | 1,385 |
| $ | 1,049 |
| $ | 22.05 |
| $ | 13.71 |
| $ | 3.37 |
| $ | 2.05 |
| $ | 9.62 |
| $ | 3.70 |
2016 - 2017 |
| $ | 1,366 |
| $ | 1,077 |
| $ | 20.71 |
| $ | 13.58 |
| $ | 3.27 |
| $ | 1.96 |
| $ | 5.82 |
| $ | 3.50 |
2018 to-date (August 1, 2018) |
| $ | 1,355 |
| $ | 1,218 |
| $ | 17.52 |
| $ | 15.26 |
| $ | 3.29 |
| $ | 2.95 |
| $ | 7.14 |
| $ | 5.63 |
Declines in market prices could cause an operatordirectly tied to reduce, suspend or terminate production from an operating project or construction work at a development project, which may result in a temporary or permanent reduction or cessation of revenue from those projects, and may prevent us from being able to recover the initial investment inmetal prices. Under our stream and royalty interests. Our streaming agreements, provide us the right towe purchase metals eithermetal at a fixed price per ounce or a specifiedstated percentage of the spot price. Our margin betweenmarket price and then sell the price at which we can purchase metals pursuant to streaming agreements and the price at which we sell metalsmetal in the open market. If market will vary as metal prices vary; in the event of metal price declines, we would generate lowerdecline, our revenue and cash flow or earnings, or possibly losses. Further,from metal sales decline. A price decline can also impact our sliding‑scale royalties, suchrevenue under certain sliding-scale royalty agreements as Cortez, Holt, Mulatos and other properties, amplify the effect of declines in market prices for metals becausewe may receive a lower royalty rate when prices fall below price thresholds specified in a sliding‑scale royalty, a lower royalty rate will apply. A price decline may result in a material and adverse effect on our business, resultsthresholds. In addition, some of operations and financial condition.
Metal price fluctuations between the time that decisions about development and construction of a mine are made and the commencement of production can have a material adverse effect on the economics of a mine and can eliminate or have a material adverse impact on the value of stream and royalty interests on the property.
Where gold and silver are produced as co-products or by‑products at the properties where we hold stream and royalty interests, an operator’s production decisions and the economic cut‑off applied to its reporting of gold and silver reserves and resources may be influenced by changes in the commodity prices of the principal metals produced at the mines.
Moreover, certain agreements governing our royalty interests, such as those relating to our royalty interests in the Robinson and Peñasquito properties,agreements are based on the operator’s concentrate sales to smelters which includeand allow for price adjustments between the operator and the smelter based on metals prices aton a laterfuture date, typically three to five months after shipment of concentrate. These price adjustments can decrease our revenue in future periods if metal prices decline following shipment.
Price declines could cause an operator to reduce, suspend, or terminate production or development at a project, which would impact our future revenue from the project. These production or development decisions could prevent us from recovering our initial investment in the project or result in an impairment to the smelter. In such cases,value of our payments from the operator include a component of these later price adjustments, which can result in decreased revenue in later periods if metals prices have fallen.initial investment.
We own passive interests in mining properties and it is difficult or impossible for us tocannot ensure properties are developed or operated in our best interest.interests.
All of our current
Our revenue is derived entirely from stream and royalty interests onin properties owned and operated by third parties. The holder of a stream or royalty interest typically hasIn general, we have no decision-making authority regarding the development or operation of athe mineral property. Therefore, we typically are not in control of decisions regarding development or operation of any of the properties on which we hold a stream or royalty interest, and we have limited legal rights to influence those decisions.
Our strategy of acquiring and holdingunderlying our stream and royalty interests on properties operated by third parties puts us generally at risk to theinterests. Operators make all development and operating decisions, of others regarding all operating matters, including decisions about permitting, feasibility analysis, mine design and operation, processing, plant and equipment matters, and temporary or permanent suspension of operations. We generally are not entitled to compensation if operations among others. As a result, our revenue is dependent upon the activities of third parties, whichare shut down. This creates the risk thatfor us because operators may at any time those third parties may: (i)times have business interests that are inconsistent with ours, (ii) take actionour interests or may act contrary to our interests, policies or objectives, or (iii) be unable or unwilling to fulfill their obligations under their agreements with us. At any time, any of the operators of our mining properties may decide to suspend or discontinue operations. Except in limited circumstances,
7interests.
we will not be entitled to material compensation if operations are shut down, suspended or discontinued on a temporary or permanent basis. Although we attempt to secure contractual rights when we create new stream or royalty interests, such as audit or access rights, that will permit us to protect our interests to a degree, there can be no assurance that such rights will always be available or sufficient, or that our efforts will be successful in achieving timely or favorable results or in affecting the operation of the properties in which we have a stream or royalty interest in ways that would be beneficial to our stockholders.
Our revenues arerevenue is subject to operational and other risks faced by operators of our mining properties.the properties in which we hold stream or royalty interests.
Although we
We generally are not required to pay capital or operating costs on projects onin which we hold stream or royalty interests (except for transactions where we finance mine development or actively fund or participate in exploration),interests. However, our financial resultsrevenue and the value of our investments are indirectly subject to hazards and risks normally associated with developing and operating mining properties, where we hold stream and royalty interests. Some of these risks include:including the following:
•insufficient ore reserves;
•increases in capital or operating costs incurred by operators or third parties that may impact the amount of reserves available to be mined, cause an operator to delay or curtail mining development and operations, or render mining of ore uneconomical and cause an operator to suspend or close operations;
•declines in the price of gold, silver, copper, nickel and other metals;
•mine operating and ore processing facility problems;
•significant permitting, environmental and other regulatory requirements and restrictions and any changes in those regulations or their enforcement;
•challenges by non‑mining interests, including by local communities, indigenous populations and non‑governmental organizations, to existing permits and mining rights, and to applications for permits and mining rights;
•community or civil unrest;
•labor shortage of miners, geologists and mining experts, changes in labor laws, increased labor costs, and labor disputes, strikes or work stoppages at mines;
•unavailability of mining, drilling and related equipment;
•unanticipated geological conditions or metallurgical characteristics;
•unanticipated ground or water conditions, including lack of access to sufficient quantities of water for operations;
•pit wall or tailings dam failures or any underground stability issues;
•fires, explosions and other industrial accidents;
•environmental hazards and natural catastrophes such as droughts, floods,hurricanes or earthquakes;
•injury to persons, property or the environment;
•the ability of operators to maintain or increase production or to replace reserves as properties are mined;
•potential increased operating costs arising from climate change initiatives and their impact on energy and other costs in the U.S. and foreign jurisdictions;
•uncertain domestic and foreign political and economic environments;
•economic downturns and operators’ insufficient financing;
•default by an operator on its obligations to us or its other creditors;
•insolvency, bankruptcy or other financial difficulty of the operator; and
8
7
| ● | insufficient ore reserves |
| ● | increased capital or operating costs |
| ● | declines in the price of gold, silver, copper, nickel, or other metals |
| ● | construction or development delays |
| ● | operational disruptions, including those caused by pandemics or other global or local health crises |
| ● | inability to obtain or maintain necessary permits |
| ● | inability to replace or increase reserves as properties are mined |
| ● | inability to maintain, or challenges to, exploration or mining rights |
| ● | changes in mining taxes and royalties payable to governments |
| ● | significant changes to environmental, permitting, or other regulatory requirements |
| ● | challenges to operations, permits, or mining rights by local communities, indigenous populations, non-government organizations, or others |
| ● | litigation between operators and third parties relating to the properties |
| ● | community or civil unrest, including protests and blockades |
| ● | labor shortages, increased labor costs, labor disputes, strikes, or work stoppages |
| ● | unavailability of mining, drilling, or other equipment |
| ● | unanticipated geological conditions or metallurgical characteristics |
| ● | unanticipated ground or water conditions, including lack of access to sufficient water |
| ● | inadequate supplies of power or other raw materials |
| �� | pit wall or tailings dam failures or underground stability issues |
| ● | fires, explosions, or other industrial accidents |
| ● | injuries to humans, property, or the environment |
| ● | natural catastrophes and environmental hazards such as earthquakes, droughts, floods, forest fires, hurricanes, weather, or climate events |
| ● | physical effects of climate change and regulatory changes designed to reduce the effects of climate change; |
| ● | uncertain political and economic environments |
| ● | economic downturns |
| ● | insufficient financing or inability to obtain financing |
| ● | default by an operator on its obligations to us or its other creditors |
| ● | insolvency, bankruptcy, or other financial difficulty of the operator |
| ● | changes in laws or regulations or the enforcement of laws or regulations |
•changes in laws or regulations, including changes implemented by new political administrations.
The occurrence of any of the above mentioned risks or hazards, among others,these events could result in an interruption, suspension or termination ofnegatively impact operations or development work at any of the properties in which we hold a stream or royalty interest and have a material adverse effect on our business, results of operations, cash flows and financial condition.
Many of our stream and royalty interests, are important to us and any adverse development related to these properties could adversely affect our revenues and financial condition.
Our investmentswhich in the Mount Milligan, Andacollo, Pueblo Viejo, Wassa and Prestea and Peñasquito properties generated approximately $341.7 million in revenue in fiscal year 2018, or 74% of our revenue for the period. We expect these properties and others to be important to us in fiscal year 2019 and beyond. Any adverse development affecting the operation of or production from any of these propertiesturn could have a material adverse effect on our business, results ofrevenue and cash flow.
The current COVID-19 pandemic has adversely affected, and may continue to adversely affect, operations cash flows and financial condition. Any adverse decision made by the operators, such as changes to mine plans, production schedules, metallurgical processesat some properties in which we have stream or royalty calculation methodologies, may materially and adversely impact the timing and amount of revenue that we receive.
Problems concerning the existence, validity, enforceability, terms or geographic extent of our stream and royalty interests, could adversely affect our business and revenues, and our interests may similarly be materially and adversely impacted by change of control, bankruptcy or the insolvency of operators.
Defects in or disputes relating to the stream and royalty interests we hold or acquire may prevent us from realizing the anticipated benefits from these interests, andwhich could have a material adverse effect on our business, results of operations cash flows and financial condition. Material changes
The world is currently experiencing a deadly outbreak of the coronavirus disease 2019, or COVID-19. Public health and government authorities have recommended and mandated precautions to mitigate the spread of COVID-19, including in some cases quarantines, shelter-in-place orders, and restrictions on mining-related activities. As a result, several of our operating counterparties, including at our principal properties, have had temporary operational curtailments. There may be additional curtailments. The COVID-19 pandemic could also occur thatdisrupt operators’ supply or distribution chains or access to workers, which in turn could adversely impact their production or sales. In addition, development and exploration activities at some properties may be delayed or suspended. Any of these events could have a material adverse impact on our results of operations and financial condition in future periods. We are unable to predict the nature or extent of any impact the COVID-19 pandemic may have on our future results of operations and financial condition.
The current COVID-19 pandemic has significantly impacted the global economy and markets over the past several months and may continue to do so, which could adversely affect management’s estimateour business or the trading price of our stock.
8
The global economy, metal prices, and financial markets have experienced significant volatility and uncertainty due to COVID-19. Our revenue is directly related to the market price of gold and other metals. Metal price volatility causes our revenue to fluctuate from period to period. This price volatility could also cause operators or developers to defer or forgo projects, which could adversely impact our future revenue. Moreover, in the ordinary course of business, we review opportunities to acquire new stream and royalty interests and currently have acquisition opportunities at various stages of review. Reduced economic and travel activities or illness among our management team as a result of COVID-19 could limit or delay acquisition opportunities or other business activities. In addition, economic volatility, disruptions in the financial markets, or severe price declines for gold or other metals could adversely affect our ability to obtain future debt or equity financing for acquisitions on acceptable terms. Government efforts to counter the economic effects of COVID-19 through liquidity and stimulus programs may be insufficient or ineffective in preventing or reducing the effects of a recession. It is difficult to determine the extent of the carrying valueeconomic and market impacts from COVID-19 and the many ways in which they may negatively affect our business and the trading price of our stock.
A significant portion of our revenue comes from a small number of operating properties, which means that adverse developments at these properties could have a more significant or lasting impact on our results of operations than if our revenue was less concentrated.
Approximately 75% of our revenue for fiscal year 2020 came from six properties: Mount Milligan, Andacollo, Pueblo Viejo, Wassa, Peñasquito, and Cortez. We expect these properties to continue to represent a significant portion of revenue going forward. This concentration of revenue could mean that adverse developments, including any adverse decisions made by the operators, at one or more of these properties could have a more significant or longer-term impact on our results of operations than if our revenue was less concentrated.
Operators may fail to comply with their contractual arrangements with us or may interpret their obligations in a manner adverse to us, which could decrease our revenue or increase our costs.
At times, operators may be unable or unwilling to fulfill their contractual obligations to us. In addition, we often rely on the operators for the calculation of our stream deliveries or royalty payments. When we enter into new stream or royalty interests, we attempt to secure contractual rights that allow us to monitor operators’ compliance with their obligations to us, such as audit or access rights. However, these rights may not be sufficient to ensure compliance. In addition, our stream and royalty agreements are often complex and may be subject to interpretation or uncertainties. Operators and other counterparties may interpret our interests in a manner adverse to us. For these or other reasons, we could be forced to expend resources or take legal action to enforce our contractual rights. We may not be successful in enforcing our contractual rights. As a result, our revenue relating to the disputed interests could be adversely affected. We may also need to expend significant monetary and human resources to defend our position, which could adversely affect our results of operations. In addition, we may be required to make retroactive revenue adjustments in future periods relating to past period revenue as a result of information that we learn through audit or access rights.
We often have limited access to data about operating properties, which may make it difficult for us to project or assess the performance of our stream and royalty interests and could result in impairment charges. While we seek to confirm the existence, validity, enforceability, terms and geographic extent of the stream and royalty interests we acquire, there can be no assurance that disputes or other problems concerning these and other matters or other problems will not arise. Confirming these matters is complex and is subject to the application of the laws of each jurisdiction to the particular circumstances of each parcel of mining property and to the documents reflecting the stream or royalty interest. Similarly, stream interests and, in many jurisdictions, royalty interests are contractual in nature, rather than interests in land, and therefore may be subject to change of control, bankruptcy or insolvency of operators, and our stream or royalty interests could be materially restricted or set aside through judicial or administrative proceedings. We often do not have the protection of security interests that could help us recover all or part of our investment in a stream or royalty interest.interests.
We have limited access to data and disclosure regarding the operation of the properties on which we have stream and royalty interests, which may limit our ability to assess the performance of a stream or royalty interest.
Although certain agreements governing our stream and royalty interests require the operators to provide us with production, operating and other information, weoften do not have the contractual right to receive such information for allproduction, operating, and other data from the operators of ourthe properties in which we hold stream and royalty interests. As a result, weit may have limited accessbe difficult for us to data about the operations and the properties themselves, which could affect our ability toproject or assess the performance of a stream or royalty interest. This could result in delays in, or reductions of, our cash flow from the amounts that we anticipate based on the stage of development of or production from the properties, which could have an adverse impact on our business, results of operations cash flows andor financial condition.
Acquired
Our stream and royalty interests particularly on development stage properties, are subject to the risk that they may not produceresult in the anticipated revenues.
The stream and royalty interests we acquirereturns or may not produce anticipated revenues. The success ofotherwise ultimately benefit our acquisitions of stream and royalty interests is based on our abilitybusiness.
We are continually reviewing opportunities to make accurate assumptions regarding the valuation, timing and amount of revenues to be derived from our stream and royalty interests, the geological, metallurgical and other technical aspects of the project, and, for development projects, the costs, timing and conduct of development. If an operator does not bring a property into production and operate in accordance with feasibility studies, technical or reserve reports or mine and other plans due to lack of capital, inexperience, unexpected problems, delays, or otherwise, then the acquired stream or royalty interest may not yield sufficient revenues to be profitable for us. Furthermore, operators of properties at all
9
stages must obtain and maintain all necessary environmental permits and access to adequate supplies of water, power and other raw materials, as well as financing, necessary to begin or sustain development or production, and there can be no assurance that operators will be able to do so.
The failure of any of our principal properties to produce anticipated revenues on schedule or at all would have a material adverse effect on our asset carrying values or the other benefits we expect to realize from the acquisition ofacquire new stream and royalty interests, and potentially our business, results of operations, cash flows and financial condition.
For example, we experienced an impairment charge of $239.1millionfor the Pascua-Lama mining project during our third quarter of fiscal 2018 after Barrick Gold Corporation (“Barrick”), the owner of the project, reclassified the proven and probable reserves for the Chilean portion of the project, to which our royalty interest relates, and, ultimately, suspended further development of the project, in response to sanctions by the Chilean government. See Note 4 of the notes to consolidated financial statements for more information. Further, as mines on which we have stream and royalty interests mature, we can expect overall declines in production unless operators are able to replace reserves that are mined through mine expansion or successful new exploration. There can be no assurance that the operators of properties where we hold stream and royalty interests will be able to maintain or increase production or replace reserves as they are mined.
Operators may interpret our stream and royalty interests in a manner adverse to us or otherwise may not abide by their contractual obligations, and we could be forced to take legal action to enforce our contractual rights.
Our stream and royalty interests generally are subject to uncertainties and complexities arising from the application of contract and property laws in the jurisdictions where the mining projects are located. Operators and other parties to the agreements governing our stream and royalty interests may interpret our interests in a manner adverse to us or otherwise may not abide by their contractual obligations, and we could be forced to take legal action to enforce our contractual rights. We may or may not be successful in enforcing our contractual rights, and our revenues relating to any challenged stream or royalty interests may be delayed, curtailed or eliminated during the pendency of any such dispute or in the event our position is not upheld, which could have a material adverse effect on our business, results of operations, cash flows and financial condition. Disputes could arise challenging, among other things, methods for calculating the stream or royalty interest, various rights of the operator or third parties in or to the stream or royalty interest or the underlying property, the obligations of a current or former operator to make payments on stream and royalty interests, and various defects or ambiguities in the agreement governing a stream or royalty interest.
For example, on October 6, 2017, the Labrador Nickel Royalty Limited Partnership (“LNRLP”), of which the Company is the indirect majority owner, filed amendments to its original October 2009 statement of claim against Vale and certain subsidiaries of Vale. LNRLP alleges that Vale has been calculating LNRLP’s 3% NSR royalty on nickel, copper and cobalt produced from the Voisey’s Bay mine incorrectly since production began in late 2005, and since Vale began processing Voisey’s Bay concentrates at its new Long Harbour Processing facility, and that Vale has breached its contractual duties of good faith. Royal Gold strongly disagrees with Vale’s position that full operating costs, depreciation and cost of capital are permissible net smelter return deductions pursuant to the royalty agreement and is aggressively pursuing its legal remedies.
Potential litigation affecting the properties that we have stream and royalty interests in could have a material adverse effect on us.
Potential litigation may arise between the operators of properties on which we have stream and royalty interests and third parties. For example, Barrick’s Pascua‑Lama mining project has been the subject of litigation by local farmers and indigenous communities alleging that the project’s water management system is not in compliance with environmental permits and that the project has damaged glaciers located in the Pascua‑Lama project area. As a holder of stream and royalty interests, we generally will not have any influence on litigation such as this and generally will not have access to non‑public information concerning such litigation. Any such litigation that results in the reduction, suspension or termination of a project or production from a property, whether temporary or permanent, could have a material adverse effect on our business, results of operations, cash flows and financial condition.
10
We may enter into acquisitions or other material transactions at any time.
In the ordinary course of business, we engage in a continual review of opportunities to acquire existing stream and royalty interests, to establish new streams and royalties on operating mines, to create new stream and royalty interests through financing mine development or exploration, or to acquire companies that hold stream and royalty interests. We currently, and generally at any time, have acquisition opportunities inat various stages of active review, including, for example, our engagement of consultants and advisors to analyze particular opportunities, analysis of technical, financial, legal and other confidential information, submission of indications of interest and term sheets, participation in preliminary discussions and negotiations and involvement as a bidder in competitive processes. We also consider obtaining debt commitments for acquisition financing. In the event that we choose to raise debt capital to finance any acquisition, our leverage may be increased. We also could issue common stock to fund our acquisitions. Issuances of common stock could dilute existing stockholders and may reduce some or all of our per share financial measures.
review. Any such acquisition could be material to us. All transactions include risks associated with our ability to negotiate acceptable terms with counter-parties. In addition, any such acquisition or other transaction may have other transaction specific risks associated with it, including risks related to the completion of the transaction, the project, its operators, or the jurisdictions in which the project is located and other risks discussed in this Annual Report on Form 10-K. There can be no assurance that any acquisitions completed will ultimately benefit the Company.
In addition,At times, we mayalso consider opportunities to restructure our existing stream or royalty interests where we believe suchthe restructuring would provide a long‑termlong-term benefit to the Company,us, even though such restructuring mayit could reduce near‑termnear-term revenues or result in the incurrence of transaction‑relatedtransaction-related costs. The success
9
of our stream and royalty interests is based in part on our ability to make accurate assumptions at the time of acquisition about the amount and timing of revenue to be derived from those interests. These assumptions are based on a variety of factors, including the geological, metallurgical, permitting, environmental, and other aspects of the project. For development projects, we also make assumptions about the cost, timing, and conduct of development. If an operator fails to bring a project into production as expected or if actual performance otherwise falls short of our assumptions, our revenue derived from the project may not be sufficient to yield an adequate, or any, return on our investment. In addition, we could be required to decrease the carrying value of our investment, which could have a material adverse effect on our results of operations or financial condition. We could enter into one or morecannot ensure that any acquisition or restructuring transactions at any time.other transaction will ultimately benefit Royal Gold.
We may not be unableable to successfully acquire additional stream or royalty interests at appropriate valuations.
Our future success depends largely depends uponon our ability to acquire additional stream and royalty interests at appropriate valuations, including through royalty, stream and corporate acquisitions and other financing transactions. There can be no assurance that we willvaluations. We may not be able to identify and complete the acquisitionacquisitions of such stream and royalty interests or businesses that own desirableadditional interests at reasonableappropriate prices or on favorable terms,terms. We may not have sufficient liquidity or if necessary, that we will have ormay not be able to obtain sufficient financing on reasonable terms to complete such acquisitions. Economic volatility, credit crises, or severe declines in market prices for gold, silver, copper, nickel and certain other metals, could adversely affect our ability to obtain debt or equity financing for acquisitions.to fund acquisitions due to economic volatility, credit crises, declines in metal prices, or other reasons. Certain of our competitors are larger and have greater financial resources than we do, and we may not be able to compete effectively against them. In addition, changes to tax rules, accounting policies, or the treatment of stream interests by ratings agencies could make royalties, streams or other investments by the Companyroyalties less attractive to counterparties. Such changesAny of these factors could adversely affect our ability to acquire new stream or royalty interests.
We also have competitors that are engaged in the acquisition of stream and royalty interests, and companies holding such interests, including competitors with greater financial resources, and we may not be able to compete successfully against these companies in new acquisitions. If we are unable to successfully acquire additional stream or royalty interests, the reserves subject towhich would adversely affect our stream and royalty interests may decline as the producing properties on which we have such stream and royalty interests are mined or payment or production caps on certain of our royalty interests are met. We also may experience negative reactions from the financial markets or operators of properties on which we seek stream and royalty interests if we are unable to successfully complete acquisitions of such interests or complete them at satisfactory rates of return. Each of these factors could have a material adverse effect on our business,future results of operations cash flows and financial condition.
We depend on our operators for the calculation of payments of our stream and royalty interests. We may not be able to detect errors and later payment calculations may call for retroactive adjustments.
The deliveries and payments under our stream and royalty interests are calculated by the operators of the properties on which we have stream and royalty interests based on their reported production. Each operator’s calculation of deliveries and payments is subject to and dependent upon the adequacy and accuracy of its production and accounting functions, and, given the complex nature of mining and ownership of mining interests, errors may occur from time to time in the allocation of production and the various other calculations made by an operator. Any of these errors may render such
11
calculations inaccurate. Certain agreements governing our stream and royalty interests require the operators to provide us with production and operating information that may, depending on the completeness and accuracy of such information, enable us to detect errors in deliveries under metal streams and in the calculation of payments of royalties. We do not, however, have the contractual right to receive production information for all of our royalty interests. As a result, our ability to detect payment errors through our stream and royalty monitoring program and its associated internal controls and procedures is limited, and the possibility exists that we will need to make retroactive revenue adjustments. Some contracts governing our stream and royalty interests provide us the right to audit the operational calculations and production data for the associated stream deliveries and royalty payments; however, such audits may occur many months following our recognition of the revenue and we may be required to adjust our revenue in later periods, which could require us to restate our financial statements.
Development and operation of mines is very capital intensive and any inability of the operators of properties where we hold stream and royalty interests to meet liquidity needs, obtain financing or operate profitably could have material adverse effects on the value of and revenue from our stream and royalty interests.
If operators of properties where we hold stream and royalty interests do not have the financial strength or sufficient credit or other financing capability to cover the costs of developing or operating a mine, the operator may curtail, delay or cease development or operations at a mine site, or enter into bankruptcy proceedings. An operator’s ability to raise and service sufficient capital may be affected by, among other things, macroeconomic conditions, future commodity prices of metals to be mined, or further economic volatility in the U.S. and global financial markets. If certain of the operators of the properties on which we have stream and royalty interests suffer these material adverse effects, then our stream and royalty interests, including the value of and revenue from them, and the ability of operators to obtain debt or equity financing for the exploration, development and operation of their properties may be materially adversely affected.
Certain of the agreements governing our stream and royalty interests contain terms that reduce or cap the revenuesrevenue generated from thethose interests.
Revenue from some of our stream and royalty interests will stopdecreases or decreasestops after threshold production, delivery, or payment milestones are achieved. For example, our gold stream interests at Pueblo Viejo, decreases from 7.5% of Barrick’s interest in gold produced at Pueblo Viejo to 3.75% after 990,000 ounces of gold have been delivered. Similarly, our silver stream at Pueblo Viejo decreases from 75% of Barrick’s interest in silver produced at Pueblo Viejo to 37.50% after 50.00 million ounces of silver have been delivered. Our stream interests atAndacollo, Wassa, and Prestea, Andacollo, and Rainy RiverKhoemacau, and certain of our royalty interests at other properties, are subject to similar limitations, and therefore currentcontain these types of limitations. As a result, past production and revenue results from ourrelating to these interests may not be indicative of future results.
Estimates of reserves and other mineralized material by
If the operators of mines in which we have stream and royalty interests are subject to significant revision.
There are numerous uncertainties inherent in estimating proven and probable reserves and mineralized material, including many factors beyond our control and the control of the operators of properties in which we have stream and royalty interests. Reserve estimates for our stream and royalty interests are prepared by the operators of the mining properties. We do not participate in the preparation or verification of such reports and have not independently assessed or verified the accuracy of such information.
The estimation of reserves and of other mineralized material is a subjective process, and the accuracy of any such estimate is a function of the quality of available data and of engineering and geological interpretation and judgment. Results of drilling, metallurgical testing andassumptions underlying operators’ production, and the evaluation of mine plans subsequent to the date of any estimate, may cause a revision of such estimate. The volume and grade of reserves recovered and rates of production may be less than anticipated. Assumptions about gold and other precious metal prices are subject to great uncertainty, and such prices have fluctuated widely in the past. Declines in the market price of gold, silver, copper, nickel or other metals also may render reservesreserve, or mineralized material containing relatively lower ore grades uneconomical to exploit. Changes in operating costs and other factors including short‑term operating factors, the processing of new or different ore grades, geotechnical characteristics and metallurgical recovery, may materially and adversely affect reserves.
12
Mineral resources as reported by some operators do not constitute mineral reserves and do not have demonstrated economic viability. Due to the uncertainty of mineral resources, there can be no assurance that such resources will be upgraded to proven and probable mineral reserves as a result of continued exploration. It should not be assumed that any part or all of mineral resources on properties where we hold stream and royalty interests constitute or will be converted into mineral reserves.
Estimates of production by the operators of mines in which we have stream and royalty interests are subject to change, and actual production may vary materially from such estimates.
Production estimates are prepared byinaccurate or if future events cause operators to negatively adjust their previous estimates, our future revenue or the operatorsvalue of mining properties. There are numerous uncertainties inherent in estimating anticipated production attributable to our stream and royalty interests, including many factors beyond our control and the control of theinvestments could be adversely affected.
The operators of the properties in which we have stream and royalty interests. We do not participate in the preparation or verification of production estimates and have not independently assessed or verified the accuracy of such information. The estimation of anticipated production is a subjective process and the accuracy of any such estimates is a function of the quality of available data, reliability of production history, variability in grade encountered, mechanical or other problems encountered, engineering and geological interpretation and operator judgment. Actual rates of production may be less than expected. Results of drilling, metallurgical testing and production, changes in commodity prices, and the evaluation of mine plans subsequent to the date of any estimate may cause actual production to vary materially from such estimates.
If title to mining claims, concessions, licenses or leases from governments on mine properties is not properly maintained by the operators, or is successfully challenged by third parties, ourhold stream and royalty interests generally prepare production and reserve estimates for the properties. We do not independently prepare or verify this information. There are numerous uncertainties inherent in these estimates, many of which are outside the operators’ control. As a result, production and reserve estimates are subjective and necessarily depend upon a number of assumptions, including, among others, reliability of historical data, geologic and mining conditions, metallurgical recovery, metal prices, operating costs, capital expenditures, development and reclamation costs, mining technology improvements, and the effects of government regulation. If any of the assumptions that operators make in connection with production or reserve estimates are incorrect, actual production could be foundsignificantly lower than the production or reserve estimates, which could adversely affect our future revenue and the value of our investments. In addition, if operators’ estimates with respect to be invalid.the timing of production are incorrect, we may experience variances in expected revenue from period to period.
Our business includes
Some operators also report publicly or to us estimates of mineralized material. The term “mineralized material” does not indicate proven or probable reserves as defined by the risk that operators of mining projects and holders of exploration or mining claims, tenements, concessions, licenses or other interests in land and minerals may lose their exploration or mining rights, or have their rightsSEC. Mineralized material is subject to explore and mine properties contested by private parties or the government. Internationally,future exploration and mining tenuresdevelopment and associated risks and may never convert to future reserves. In addition, estimates of mineralized material are subject to loss for many reasons, including expiration, failuresimilar uncertainties and assumptions as discussed above with respect to mineral reserves.
Our disclosures relating to operating properties will change as a result of the holdernew SEC disclosure rules, and we continue to meet specific legal qualifications, failure to pay maintenance fees or meet expenditure or work requirements, reduction in geographic extent upon passageface uncertainty around how some of time or upon conversion from an exploration tenurethese rules apply to a mining tenure, failure of title, expropriation and similar risks. If title to exploration or mining tenures subject to our streamstreaming and royalty interests have not been properly established or not properly maintained, or are successfully contested, our streamcompany.
10
In 2018, the SEC adopted amendments to its disclosure requirements for mining companies, including streaming and royalty interests couldcompanies. We are required to comply with the new rules for our fiscal year beginning on July 1, 2021. Our disclosures about operating properties will change under the new rules, and, in some cases, we may be adversely affected.required to disclose in our SEC filings more or less information than we currently disclose about these properties. There continues to be uncertainty about how the rules will apply to a streaming and royalty company with significant investments in properties run by international operators that are not required to report under SEC rules.
Operations
Most of our revenue is derived from properties outside the United States, and risks associated with conducting business in foreign countries or other sovereign jurisdictions are subject to many risks, which could decreaseadversely affect our revenues.results of operations or financial condition.
We derived approximately 91%
Over 90% of our revenuesrevenue comes from non-U.S. sources during fiscal year 2018, compared to approximately 92% in fiscal year 2017 and approximately 90% in fiscal year 2016. Our principal producing stream and royalty interests on properties outside of the United States, and many of our operators are located in Canada, Chile,organized outside of the Dominican Republic, GhanaUnited States. Within the United States and Mexico. We currently have stream and royalty interests in mines and projects in other countries, including Argentina, Australia, Bolivia, Brazil, Burkina Faso, Guatemala, Honduras, Macedonia, Nicaragua, Peru, Russia, Spain and Tunisia. Various indigenous peoplespeople may be recognized as sovereign entities and may enforce their own laws and regulations within the United States, Canadaregulations. Our and other countries. In addition, future acquisitions may expose us to new jurisdictions. Ouroperators’ activities and those of the operators of properties on which we hold stream and royalty interests are subject to the risks normally associated with conducting business in foreign countries or within the jurisdiction of indigenous people that may be recognized asother sovereign entities in the United States and elsewhere. These risks may impact or our operators, depending on the jurisdiction, and include such things as:
•expropriation or nationalization of mining property;
•seizure of mineral production;
•exchange and currency controls and fluctuations;
•limitations on foreign exchange and repatriation of earnings;
13
•restrictions on mineral production and price controls;
•import and export regulations, including restrictions on the export of gold, silver, copper, nickel or other metals;
•changes in legislation and government policies, including changes related to taxation, government royalties, imports, exports, duties, currency, foreign ownership, foreign trade, foreign investment and other forms of government take, including any such changes as may be made in response to U.S. laws or foreign policies;
•challenges to mining, processing and related permits and licenses, or to applications for permits and licenses, by or on behalf of regulatory authorities, indigenous populations, non‑governmental organizations or other third parties;
•changes in economic, trade, diplomatic and other relationships between countries, and the effect on global and economic conditions, the stability of global financial markets, and the ability of key market participants to operate in certain financial markets;
•high rates of inflation;
•labor practices and disputes;
•enforcement of unfamiliar or uncertain foreign real estate, mineral tenure, contract, water use, mine safety and environmental laws and policies;
•renegotiation, nullification or forced modification of existing contracts, licenses, permits, approvals, concessions or the like;
•war, crime, terrorism, sabotage, civil unrest and uncertain political and economic environments;
•corruption;
•exposure to liabilities under anti‑corruption and anti‑money laundering laws,jurisdictions, including the U.S. Foreign Corrupt Practices Act and similar laws and regulations in other jurisdictions to which we, but not necessarily our competitors, may be subject;following:
•suspension of the enforcement of creditors’ rights and stockholders’ rights; and
| ● | expropriation or nationalization of mining property or other government takings |
| ● | seizure of mineral production |
| ● | exchange and currency controls and fluctuations |
| ● | limitations on foreign exchange or repatriation of earnings |
| ● | restrictions on mineral production or price controls |
| ● | import or export regulations, including trade wars and sanctions and restrictions on metal exports |
| ● | changes in government taxation, royalties, tariffs, or duties |
| ● | changes in economic, trade, diplomatic, or other relationships between countries or the effects on global and economic conditions, the stability of global financial markets, or the ability of key market participants to operate in certain financial markets |
| ● | high rates of inflation |
| ● | unfamiliar or uncertain foreign real estate, mineral tenure, safety, or environmental rules |
| ● | war, crime, terrorism, sabotage, blockades, or other forms of civil unrest |
| ● | uncertain political or economic environments |
| ● | corruption |
| ● | exposure to liabilities under anti-corruption or anti-money laundering laws |
| ● | suspension of the enforcement of creditors’ or stockholders’ rights |
| ● | loss of access to government-controlled infrastructure, such as roads, bridges, rails, ports, power sources, and water supplies |
•loss of access to government controlled infrastructure, such as roads, bridges, rails, ports, power sources and water supply.
In addition, many of our operators are organized outside of the United States. Our stream and royalty interests may be subject to the application of foreign laws to our operators, and their stockholders, including laws relating to foreign ownership structures, corporate transactions, creditors’ rights, bankruptcy and liquidation. Foreign operations also could be adversely impacted by laws and policies of the United States affecting foreign trade, investment and taxation.
These risks may limit or disrupt operating minesthe development or projects onoperation of properties in which we hold stream and royalty interests restrict the movement of funds, or result in the deprivation of contractimpair our rights or the takinginterests in these properties, which could adversely affect our results of property by nationalizationoperations or expropriation without fair compensation,financial condition.
We and our operating properties may be subject to environmental risks, including risks associated with climate change, which could have a material adverse effect on our business, resultsfinancial condition or the value of operations, cash flows and financial condition.our investments.
Opposition from indigenous people may delay or suspend development or
Mining operations at the properties where we hold stream and royalty interests, which could decrease our revenues.
Various international and national, state and provincial laws, rules, regulations and other practices relate to the rights of indigenous peoples. Some of the properties where we hold stream and royalty interests are located in areas presently or previously inhabited or used by indigenous peoples. Many of these laws impose obligations on governments to respect the rights of indigenous people. Some mandate that governments consult with indigenous people regarding government actions which may affect indigenous people, including actions to approve or grant mining rights or permits. One or more groups of indigenous people may oppose continued operation, further development, or new development of the properties where we hold stream and royalty interests. Such opposition may be directed through legal or administrative proceedings or protests, roadblocks or other forms of public expression, and claims and protests of indigenous peoples may disrupt or
14
delay activities of the operators of the properties. For example, the Pascua‑Lama project has been challenged by Chilean indigenous groups and other third parties. During the fourth calendar quarter of 2013, Barrick suspended construction activities at the Pascua‑Lama project, except for those activities required for environmental and regulatory compliance. Subsequently, in the first calendar quarter of 2018, Barrick reclassified the proven and probable reserves for the Chilean portion of the project, to which our royalty interest relates, and, ultimately, suspended further development of the project, in response to sanctions by the Chilean government.
Changes in mining taxes and royalties payable to governments could decrease our revenues.
Changes in mining and tax laws in any of the United States, Canada, Chile, the Dominican Republic, Ghana, Mexico or any other country in which we have stream and royalty interests in mines or projects could affect mine development and expansion, significantly increase regulatory obligations and compliance costs with respect to mine development and mine operations, increase the cost of holding mining tenures or impose additional taxes on mining operations, all of which could adversely affect our revenue from such properties. A number of properties where we hold royalty interests are located on U.S. public lands that are subject to federal mining and other public land laws. In recent years, the United States Congress has considered a number of proposed major revisions to the General Mining Law of 1872, and otherextensive laws which govern the creation, maintenance and possession of mining claims and related activities on public lands in the United States. Congress also has recently considered bills, which if enacted, would impose a royalty payable to the government on hardrock production, increase land holding fees, impose federal reclamation fees and financial assurances, impose additional environmental operating standards and afford greater public involvement and regulatory discretion in the mine permitting process. Such legislation, if enacted, or similar legislation in other countries, could adversely affect the development of new mines and the expansion of existing mines, as well as increase the cost of all mining operations, and could materially and adversely affect mine operators and our revenue.
The mining industry is subject to environmental risks in the U.S. and in the foreign jurisdictions where our interests are located, including risk associated with climate change.
Mining is subject to potential risks and liabilities associated with pollution of the environment and the disposal of waste products occurring as a result of mineral exploration and production. Laws and regulations in the United Statesgoverning land use and abroad intended to ensure the protection of the environment are constantly changing and evolving in a manner expected to result in stricter standards and enforcement, larger fines and liability, and potentially increased capital expenditures and operating costs. Furthermore, mining may be subject to significant environmental and other permitting requirements regarding the use of raw materials needed for operations, particularly water and power.environment. In addition, concerns with regardmany countries have implemented laws and regulations designed to address the effects of climate change, in the United States and abroad have resulted in international, national and local treaties, legislation and initiatives that affect mineral exploration and production, including those intendedrules to reduce industrial emissions and increase energy efficiency. Compliance with all suchThese laws and regulations treaties and initiatives (“Laws”) could increase permitting requirements,are constantly evolving in a manner generally expected to result in stricter standards, more liability, and enforcement,increased costs. Compliance with these laws and require significant increases in capital expendituresregulations can impose substantial costs and operating costs byburdens on operators of properties subject to our interests. Further, breach of a Law may result in the imposition of fines and penalties or other adverse impacts on operators and their properties, which may be material. IfIn addition, an operator is forced to incur significant costsoperator’s failure to comply with Lawsthese laws and regulations could result in injunctive action, orders to
11
suspend or becomes subject to related restrictions that limit its ability to continuecease operations, damages, or expand operations,civil or if an operatorcriminal penalties on the operator. If any of these events were to lose its right to useoccur, our revenue or access power, water or other raw materials necessary to operate a mine, or if the costs to comply with Laws materially increased the capital or operating costs on the properties where we hold streams and royalties,value of our revenuesinvestment could be reduced, delayed or eliminated. These risks are also salient with regardadversely affected.
Further, due to our development stage properties where permitting may not be complete and/or where new legislation and regulation could lead to delays, interruptions and significant unexpected cost burdens for mine operators. For example, Argentina passed a federal glacier protection law in 2010 that could restrict mining activities in areas on or near the nation’s glaciers. We have royalties on the Chilean side of the Pascua‑Lama project, which straddles the border between Chile and Argentina and the glacier law could impact some aspects of the design, development and operation of the project. Further, to the extentexpansive environmental laws, it is possible that we could become subject to environmental liabilities for any historic periodperiods during which we owned or operated properties or relative to our current ownership interests in the lease and underlying unpatented mining claims acquired at Cortez or the lease, unpatented mining claims and exploration activities associated with the Peak Gold JV, the satisfaction of anyclaims. These liabilities would reduce funds otherwise available to us and could have a material adverse effect on our business, results of operations cash flows andor financial condition.
15
TableUnknown defects in our stream or royalty interests or the bankruptcy or insolvency of Contentsan operator could have a material adverse effect on the value of our investments.
Despite our due diligence practices, it is possible that unknown defects or problems will exist relating to the existence, validity, enforceability, terms, or geographic extent of our stream and royalty interests. Similarly, stream interests and, in many jurisdictions, royalty interests are contractual in nature, rather than interests in land. As a result, these interests may not survive a bankruptcy or insolvency of an operator. We are dependent upon information technology systems, which are subject to cyber threats, disruption, damage and failure.
Information systems and other technologies, including those related to our financial and operational management, are an integraloften do not have the protection of security interests that could help us recover all or part of our business activities. Network and information systems‑related events, such as computer hackings, cyber‑attacks, ransomware, computer viruses, wormsinvestment in a stream or other destructive or disruptive software, process breakdowns, denial of service attacks, malicious social engineering or other malicious activities, or any combination of the foregoing, or power outages, natural disasters, terrorist attacks or other similar events, could result in damage to our property, equipment and data, affect our ability to maintain ongoing operations, and result in significant expenditures to repair or replace the damaged property or information systems, reacquire access to networks and information systems, or to protect them from similar eventsroyalty interest in the future. In addition, any security breaches, such as misappropriation, misuse, leakage, falsificationevent of an operator’s bankruptcy or accidental releaseinsolvency. If our stream or loss of information maintained in our information technology systems (or thoseroyalty interests were set aside through judicial or administrative proceedings, the value of our third party service providers), including information about our company or our employees, third party information in our possession,investments could be adversely affected.
Anti-corruption laws and other data,regulations could damage our reputation, exposesubject us to legal liability and require us to expend significant capitalincur costs.
We are subject to the U.S. Foreign Corrupt Practices Act (the "FCPA") and other resourceslaws that prohibit improper payments or offers of payments to remedy any such security breach. Despite security measuresthird parties, including foreign governments and their officials, for the purpose of obtaining or retaining business. In some cases, we invest in mining operations in jurisdictions that have implemented and other measures we may implementexperienced corruption in the future, and despitepast. Our international investment activities create the fact that, to date,risk of unauthorized payments or offers of payments in violation of the Company has not experienced any material losses relating to cyber-attacksFCPA or other information security breaches, there can be no assurance thatanti-corruption laws by one of our employees or agents in violation of our policies. In addition, the operators of the properties in which we own stream and royalty interests may fail to comply with anti-corruption laws and regulations. Although we are passive investors in these eventsproperties, enforcement authorities could deem us to have some culpability for the operators’ actions. Any violations of the FCPA or other anti-corruption laws could result in significant civil or criminal penalties to us and security breaches will not occur in the future or notcould have an adverse effect on our business. Furthermore, new and evolving requirements relating to cybersecurity are applicable or may in the future applyreputation.
A significant disruption to our information technology systems could adversely affect our business including requirements relatingand operating results.
We rely on a variety of information technology and automated operating systems to protection ofmanage and support our operations. For example, we depend on our information technology systems for financial reporting, operational and investment management, and email. These systems contain our proprietary business information and personally identifiable information. Compliance with such requirementsinformation of our employees. The proper functioning of these systems and the security of this data is critical to the efficient operation and management of our business. In addition, these systems could require modifications or upgrades as a result of technological changes or growth in our business. These changes could be costly and disruptive to our operations and could impose substantial demands on management time. Our systems, and those of third-party providers, could be vulnerable to damage or disruption caused by catastrophic events, power outages, natural disasters, computer system or network failures, viruses or malware, physical or electronic break-ins, unauthorized access, or cyber-attacks. Any security breach could compromise our networks, and the information stored on them could be improperly accessed, disclosed, lost, or stolen. The steps that we have taken to secure our systems and electronic information may not be adequate to prevent a disruption. Any unauthorized activities could disrupt our operations, damage our reputation, or result in additionallegal claims or increased compliance costs and exposure to legal liability.proceedings, any of which could adversely affect our business, reputation, or operating results.
We depend on the services of our President and Chief Executive Officerexecutives and other key employees.employees, and the loss of one or more members of our management team could harm our business.
12
We believe that our success depends on the continued service of our key executive management personnel. Tony Jensen has served as our Presidentretaining qualified executives and Chief Executive Officer since July 2006. Mr. Jensen’s extensive commercial experience, mine operations background and industry contacts give us an important competitive advantage. The loss of the services of Mr. Jensen, other key members ofemployees. Our management team has significant industry and company-specific experience. If we are unsuccessful at retaining or other key employeesattracting qualified personnel, our business could jeopardizebe disrupted and our ability to maintain our competitive position in the industry. From time to time, we may also need to identify and retain additional skilled management and specialized technical personnel to efficiently operate our business. The number of persons skilled in the acquisition, exploration and development of stream and royalty interests is limited and there is competition for such persons. Recruiting and retaining qualified personnel is critical to our success and there can be no assurance of such success. If we are not successful in attracting and retaining qualified personnel, our ability to executeachieve our business modelobjectives and growth strategygrow effectively could be affected, which could have a material adverse effect on our business, results of operations, cash flows and financial condition.jeopardized. We currently do not havecurrently maintain key person life insurance foron any of our officersdirectors or directors.employees.
Our disclosure controls
Current and internal control overfuture indebtedness could adversely affect our financial reporting are subject to inherent limitations.
Management has concluded that as of June 30, 2018, our disclosure controlscondition and procedures and our internal control over financial reporting were effective. Such controls and procedures, however, may not be adequate to prevent or identify existing or future internal control weaknesses due to inherent limitations therein, which may be beyond our control, including, but not limited to, our dependence on operators for the calculation of royalty payments and deliveries of metal streams that translate to our revenues as discussed above in “We depend on our operators for the calculation of payments of our stream and royalty interests. We may not be able to detect errors and later payment calculations may call for retroactive adjustments”. Given our dependence on third party calculations, there is a risk that material misstatements in results of operations and financial condition may not be prevented or detected on a timely basis by our internal controls over financial reporting and may require us to restate our financial statements.
16
We have incurred indebtedness in connection with our business and may in the future incur additional indebtedness that could limit cash flow available for our operations, limitimpair our ability to borrow additional funds and, if we were unable to repayoperate our debt when due, would have a material adverse effect on our business, results of operations, cash flows and financial condition.business.
As of June 30, 2018,2020, we had $370$305 million aggregate principal amount of our 2.875% convertible senior notes due 2019 (the “2019 Notes”) outstanding which we incurred in June 2012. In addition, we may incur additional indebtedness in connection with financing acquisitions, strategic transactions or for other purposes. As of June 30, 2018, there was $1.0 billionand $695 million available and no amounts outstanding under our revolving credit facility. We are also subject tomay incur additional indebtedness in the risks normally associated with debt obligations,future. Current and future indebtedness could have important consequences, including the risk that our cash flows may be insufficient to meet required principal and interest payments and the risk that we will be unable to refinance our indebtedness when it becomes due, or that the terms of such refinancing will not be as favorable as the terms of our indebtedness. We may seek additional debt or equity financing in the future.following:
Indebtedness could have a material adverse effect on our business, results of operations, cash flows and financial condition. For example, it could:
| ● | require us to dedicate a substantial portion of our cash flow from operations to service indebtedness, thereby reducing the availability of cash flow to fund acquisitions, working capital, or dividends |
| ● | limit our flexibility in planning for, or reacting to, changes in our business |
| ● | restrict us from exploiting business opportunities |
| ● | make us more vulnerable to a downturn in our business or the economy |
| ● | place us at a competitive disadvantage compared to our competitors with less indebtedness |
| ● | require the consent of our existing lenders to incur additional indebtedness |
| ● | limit our ability to borrow additional funds for acquisitions, working capital, or debt-service requirements |
•require us to dedicate a substantial portion of our cash flow from operations to service our indebtedness, thereby reducing the availability of our cash flow to fund acquisitions of stream and royalty interests, working capital, pay dividends and other general corporate purposes;
•limit our flexibility in planning for, or reacting to, changes in our business and the industry in which we operate;
•restrict us from exploiting business opportunities;
•place us at a competitive disadvantage compared to our competitors that have less indebtedness;
•dilute our existing stockholders if we elect to issue common stock instead of paying cash in the event the holders convert the 2019 Notes, or any other convertible securities issued in the future;
•require the consent of our existing lenders to borrow additional funds, as was required in connection with the issuance of the 2019 Notes; and
•limit our ability to borrow additional funds for working capital, capital expenditures, acquisitions, debt service requirements, execution of our business strategy or other general corporate purposes.
In addition, the agreement governing our revolvingOur credit facility contains and the agreements that may govern any future indebtedness that we may incur may contain, financial and other restrictive covenants. For example, the agreement includes financial covenants that willrequire us to maintain a maximum leverage ratio and a minimum interest coverage ratio (as these terms are defined under the agreement). These covenants could limit our ability to engage in activities that may beare in our long‑termlong-term best interests. Among other restrictions, the agreement governing our revolving credit facility contains covenants limiting our ability to make certain investments, consummate certain mergers, incur certain debt or liens and dispose of certain assets.
If we are unable to maintain cash reserves or generate sufficient cash flow or otherwise obtain funds necessary to make required payments, or if we failOur failure to comply with the variousthese covenants and requirements of the 2019 Notes, our revolving credit facility or any indebtedness which we may incurwould result in the future, an event of default could occur that, if not cured or waived, could result in the acceleration of all outstanding indebtedness. Our credit facility expires in June 2024. In the future, we may be unable to obtain new financing or refinancing on acceptable terms.
The proposed phase out of the London Interbank Offered Rate ("LIBOR") could adversely affect our debt. Any defaultresults of operations or financial condition.
In 2017, the United Kingdom's Financial Conduct Authority (the authority that regulates LIBOR) announced that it intends to phase out LIBOR by the end of calendar 2021. The Federal Reserve Board has convened a group of private-market participants to identify a proposed alternative rate and address the transition from LIBOR to an alternative rate. In 2019, the FASB proposed guidance that would help facilitate the market transition from existing reference rates to alternative rates. Borrowings under the 2019 Notes, our revolving credit facility or any indebtedness whichbear interest at LIBOR plus an applicable margin. Under the agreement governing the facility, if LIBOR is phased out, we may incurare required to negotiate in good faith to establish an alternative rate under the facility. There is currently no definitive information regarding the future could haveuse of LIBOR or a material adverse effect onreplacement rate. We are unable to predict whether and to what extent a LIBOR change would impact our business,future results of operations cash flows and financial condition.
Risks Related to our Common Stock
Our stock price may continue to be volatile, and you could decline.lose all or part of your investment.
The market price of our common stock has fluctuated in the past and may declinecontinue to do so in the future. The high and low sale prices of our common stock on the Nasdaq Global Select Market were $72.04 and $24.68 for theFor example, during fiscal year ended June 30, 2016, $87.74 and $60.21 for the fiscal year ended June 30, 2017 and $94.39 and $76.15 for the fiscal year ended June 30, 2018. The
17
fluctuation of2020, the market price of our common stock has been affected by many ranged from a low of $59.78 to a high of $139.63. Many
13
factors that are beyond our control, including:
•market prices of gold, silver, copper, nickel and other metals;
•Central bank interest rates;
•expectations regarding inflation;
•ability of operatorsunrelated to service their financial obligations, advance development projects, produce precious metals and develop new reserves;
•currency values;
•credit market conditions;
•general stock market conditions; and
•global and regional political and economic conditions.
Additional issuances of equity securities by us could dilute our existing stockholders, reduce some or all of our per share financial measures, reduce the trading price of our common stock or impede our abilityoperating performance can contribute to raise future capital. Substantial sales of shares may negatively impactvolatility in the market price of our common stock, including the following:
| ● | economic, market, or political conditions, including the effects of COVID-19 |
| ● | market prices of gold, silver, copper, nickel, and other metals |
| ● | developments relating to operating properties |
| ● | interest rates and expectations about inflation |
| ● | currency values |
| ● | credit market conditions |
These market fluctuations, regardless of cause, may materially and adversely affect our stock price. As a result, you could lose all or part of your investment.
We may issue additional equity securities, which would dilute our existing stockholders and reduce our per-share financial measures and could reduce the market price of our common stock.
We may issue additional equity in the future in connection with acquisitions, strategic transactions, or for other purposes. To the extentIf we issue additional equity securities, our existing stockholders couldwould be diluted and some or all of our per shareper-share financial measures couldwould be reduced. In addition, the shares of common stock that we issue in connection with an acquisition may not be subject to resale restrictions. The market price of our common stock could decline if our stockholders sell substantial amounts of our common stock including shares issued upon the conversion of the outstanding 2019 Notes or are perceived by the market as intending to sell these shares other than in an orderly manner.
Conversion of the 2019 Notes may dilute the ownership interest of existing stockholders.
At our election, we may settle the 2019 Notes tendered for conversion entirely or partly in shares of our common stock. An aggregate of approximately 3.5 million shares of our common stock are issuable upon conversion of the outstanding 2019 Notes at the initial conversion rate of 9.4955 shares of common stock per $1,000 principal amount of notes (equivalent to an initial conversion price of approximately $105.31 per share of common stock). In addition, the number of shares of common stock issuable upon conversion of the 2019 Notes, and therefore the dilution of existing common stockholders, could increase under certain circumstances described in the indenture under which the 2019 Notes are governed. We may issue all of these shares without any action or approval by our stockholders. As a result, the conversion of some or all of the 2019 Notes may dilute the ownership interests of existing stockholders. Any sales in the public market of the common stock issuable upon such conversion could adversely affect prevailing market prices of our common stock.
We may change our practice of paying dividends.dividends, which could reduce the value of your investment.
We have paid a cash dividend on our common stock for each fiscal year beginning in fiscalsince calendar year 2000. Our board of directors has discretion in determining whether to declare a dividend based on a number of factors, including prevailing gold and other metal prices, economic or market conditions, future earnings, cash flows,flow, financial condition, and funding requirements for future opportunities or operations. In addition, there may be corporate law limitations or future contractual restrictions oncould limit our ability to pay dividends.dividends in the future. If our board of directors declinesreduces or is unable to declareeliminates future dividends, in the future or reduces the current dividend level, our stock price could fall, and the success of anyour investment in our common stock would depend largely uponon any future stock price appreciation. We have increased our dividendsdividend in prior years. There can be no assurance, however, that we will continue to do so or that we will pay any dividends at all.dividends.
18
TableProvisions of ContentsDelaware law and our organizational documents could delay or prevent a third party from acquiring us.
CertainThe anti-takeover provisions of Delaware law our organizational documents, andimpose barriers to the indenture governing the 2019 Notes could impede, delay or prevent an otherwise beneficial takeover or takeover attemptability of us.
Certain provisions of Delaware law, our organizational documents, and the indenture governing the 2019 Notes could make it more difficult or more expensive for a third party to acquire control of us, even if a change of control would be beneficial to our existing stockholders. By default, Delaware law prohibits, subject to certain exceptions, a Delaware corporation from engaging in any business combination with any “interested stockholder,” which is generally defined as a stockholder who becomes a beneficial owner of 15% or more of a Delaware corporation’s voting stock, for a period of three years following the date that the stockholder became an interested stockholder. Additionally,In addition, our certificate of incorporation and bylaws contain provisions that could similarly delay, defer or discourage a change in control of us or our management. These provisions could also discourage a proxy contest andmay make it more difficult for stockholdersa third party to elect directors and takeacquire control of us without the approval of our board of directors. These provisions may make it more difficult or expensive for a third party to acquire a majority of our outstanding common stock. Among other corporate actions. Suchthings, these provisions provide for the following, among other things: (i) the ability of our board of directors to issue shares of common stock and preferred stock without stockholder approval, (ii) the ability of our board of directors to establish the rights and preferences of authorized and unissued preferred stock, (iii) a board of directors divided into three classes of directors serving staggered three year terms, (iv) permitting only the chairman of the board of directors, chief executive officer, president or board of directors to call a stockholders’ meeting and (v) requiring advance notice of stockholder proposals and related information. In addition, if an acquisition event constitutes a fundamental change, holders of the 2019 Notes will have the right to require us to purchase their 2019 Notes in cash. If an acquisition event constitutes a make‑whole fundamental change, we may be required to increase the conversion rate for holders who convert their 2019 Notes in connection with such make‑whole fundamental change. following:
| ● | allow our board of directors to issue shares of common stock and preferred stock without stockholder approval, except as may be required by Nasdaq rules |
| ● | allow our board of directors to establish the rights and preferences of authorized and unissued preferred stock |
| ● | provide for a classified board, whereby our board of directors is divided into three classes of directors serving staggered three-year terms |
| ● | prohibit stockholders from calling special meetings of stockholders |
| ● | require advance notice of stockholder proposals and related information |
| ● | require vacancies and newly created directorships on the board of directors to be filled only by affirmative vote of a majority of the directors then serving on the board |
These provisions could increase the cost of acquiring us or otherwise discourage a third party from acquiring us or removing incumbent management, which may causecould decrease the market pricevalue of our common stock to decline.your investment.
14
ITEM 1B. UNRESOLVED STAFF COMMENTS
None.
We do not own or operate the properties inon which we havehold stream or royalty interests, except for our interest in the Peak Gold JV, and therefore much of the information disclosed in this Form 10‑K10-K regarding these properties is provided to us by the operators. For example, the operators of the variouscertain properties provide us information regarding metals production, estimates of mineral reserves and additional mineralized material and production estimates. A list of our producing and development stage streams and royalties, as well their respective reserves, are summarized below in Table 1 “Operators’ Estimated Proven and Probable Gold Reserves” below within this Item 2. More information is available to the public regarding certain properties in which we have stream or royalty interests, including reports filed with the SEC or with the Canadian securities regulatory agencies available at www.sec.gov or www.sedar.com, respectively.
The Company manages itsWe manage our business under two reportable segments, consisting of the acquisition and management of stream interests and the acquisition and management of royalty interests. The description of our principal streams and royalties set forth below includes the location, operator, stream or royalty rate, access and any material current developments at the property. For any reported production amounts discussed below, the Company considerswe consider reported production to relate to the amount of metal sales subject to our stream and royalty interests. Please refer to Item 7, MD&A, for discussion on production estimates, historical production and revenue for our principal properties. The map below illustrates the location of our principal producing stage properties.
Principal Producing Properties
The Company considersWe consider both historical and future potential revenues in determiningto determine which stream and royalty interests in our portfolio are principal to our business. Estimated future potential revenues from producing properties are based on a number of factors, including reserves subject to our stream and royalty interests, production estimates, feasibility studies, technical reports, metal price assumptions, mine life, legal status and other factors and assumptions, any of which could change and could cause the Companyus to conclude that one or more of such stream and royalty interests are no longer principal to our business.
19
Currently, the Company considerswe consider the properties discussed below (listed alphabetically by stream and royalty interest) to be principal to our business. Based on the factors discussed above, we no longer consider Rainy River to be a principal property.
15
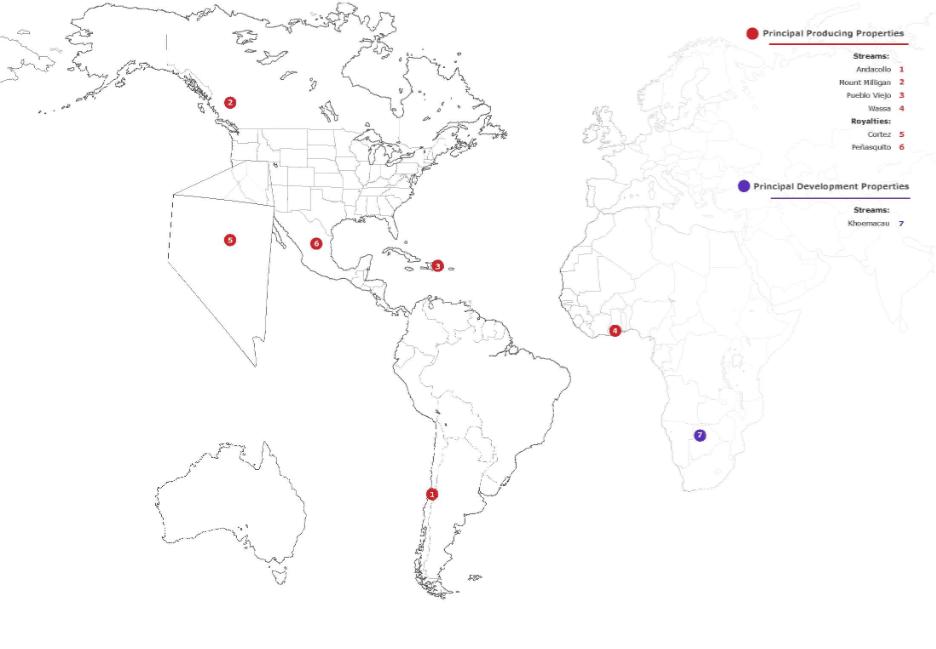
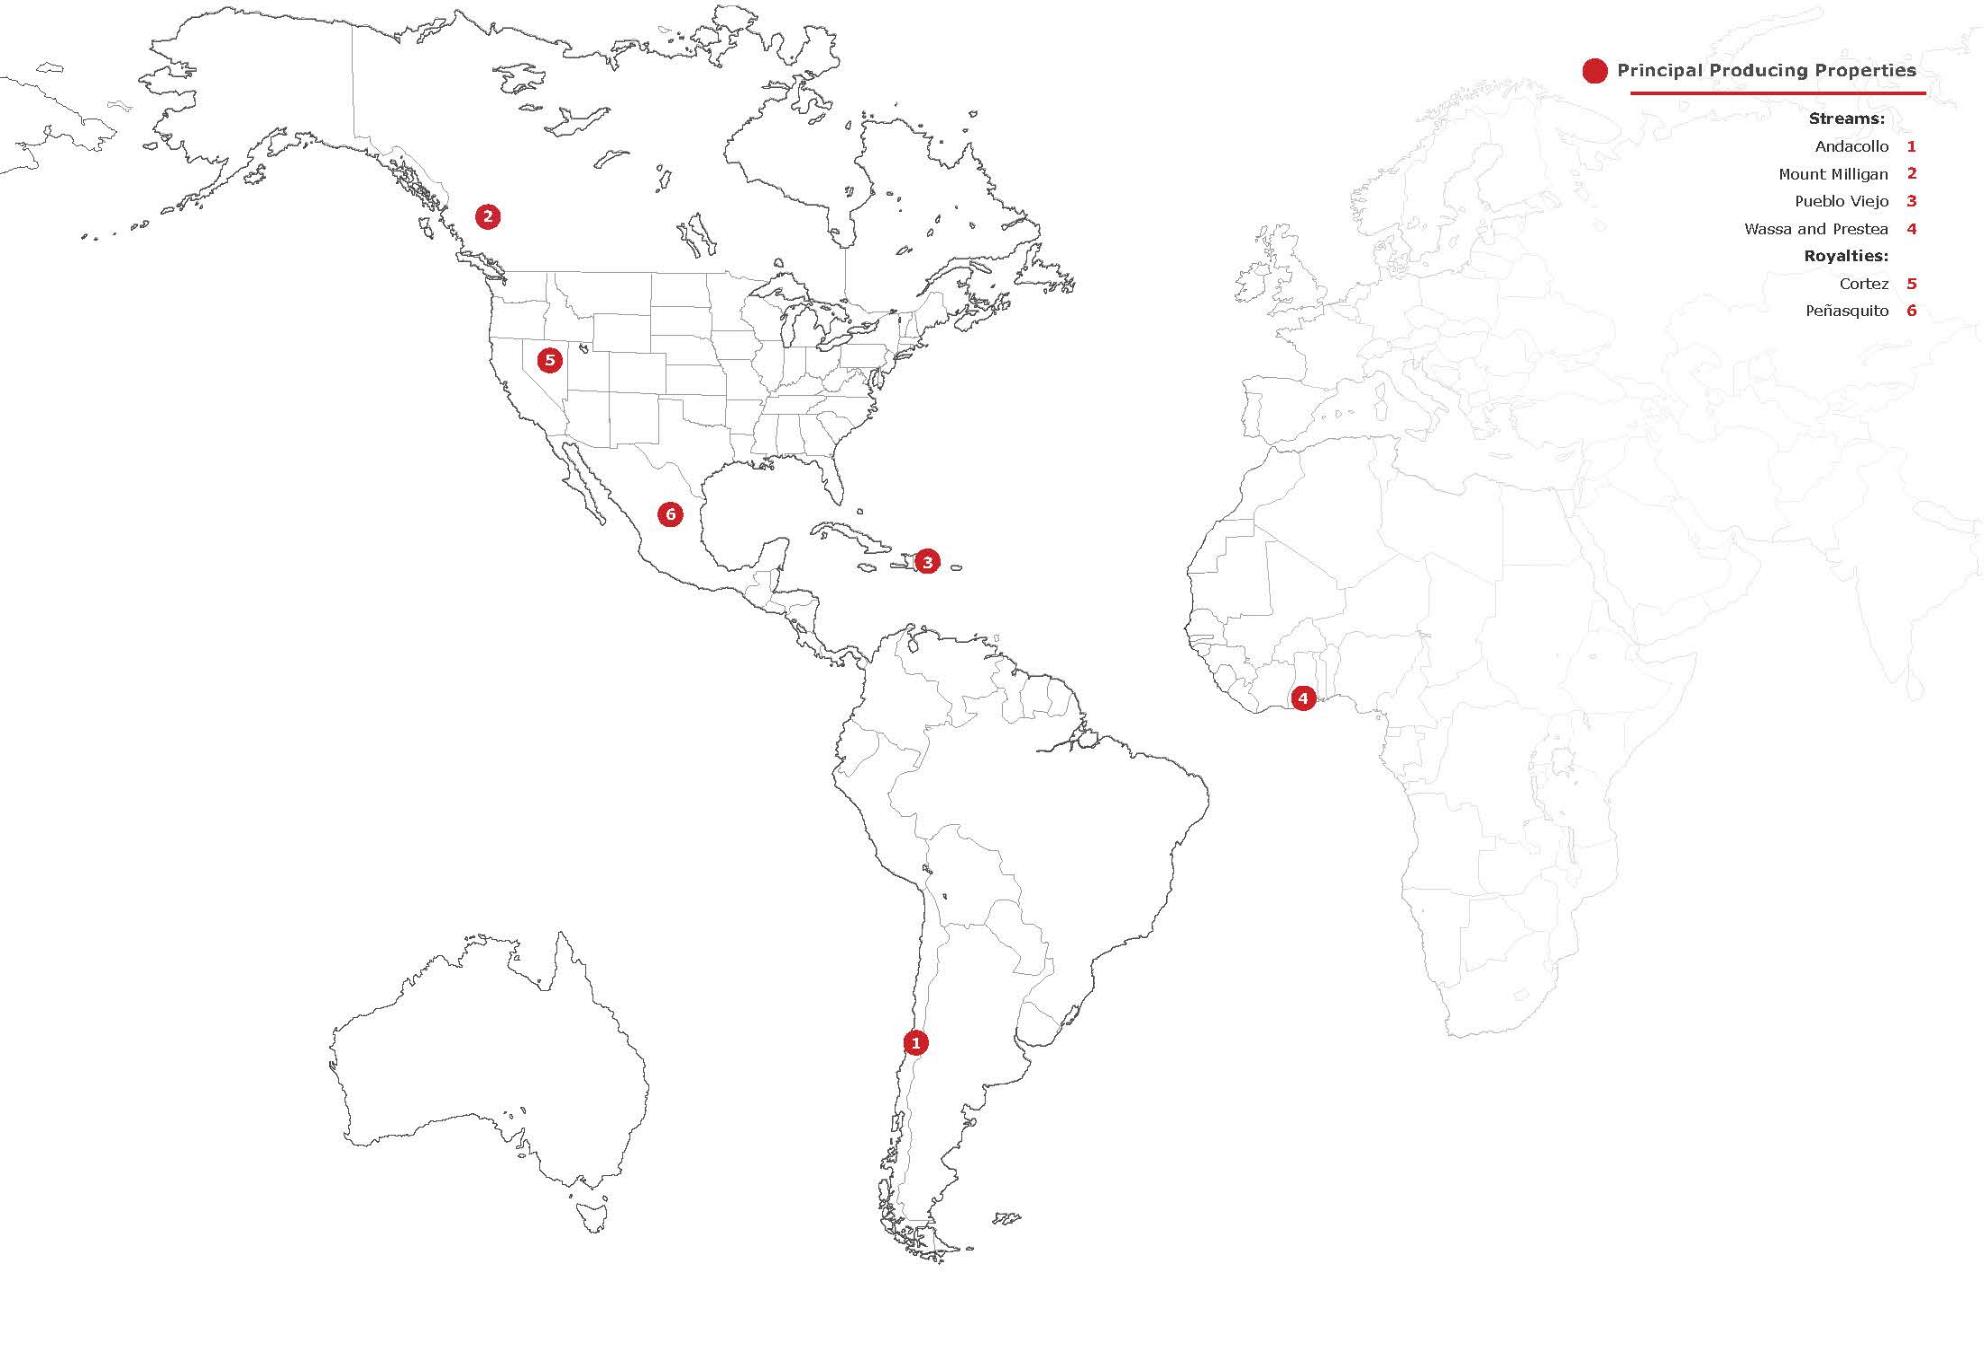
Stream Interests
Andacollo (Region IV, Chile)
The Company’s wholly owned subsidiary, RGLD Gold AG (“RGLD Gold”), a wholly-owned subsidiary of the Company, owns the right to purchase 100% of the gold produced from the Andacollo copper‑goldcopper-gold mine until 900,000 ounces of payable gold have been delivered, and 50% thereafter. The cash purchase price equals 15% of the monthly average gold price for the month preceding the delivery date for all gold purchased. As of June 30, 2018,2020, approximately 142,000237,100 ounces of payable gold have been delivered to RGLD Gold.
Andacollo is an open‑pitopen-pit mine and milling operation located in central Chile, Region IV in the Coquimbo Province and is operated by Compañía Minera Teck Carmen de Andacollo (“CMCA”), a 90% owned subsidiary of Teck Resources Limited (“Teck”). The Andacollo mine is located in the foothills of the Andes Mountains approximately 1.5 miles southwest of the town of Andacollo. The regional capital of La Serena and the coastal city of Coquimbo are approximately 34 miles northwest of the Andacollo mine by road, and Santiago is approximately 215 miles south by air. Access to the mine is provided by Route 43 (R‑43)(R-43) south from La Serena to El Peñon. From El Peñon, D‑51D-51 is followed east and eventually curves to the south to Andacollo. Both R‑43R-43 and D‑51D-51 are paved roads.
Stream deliveries from Andacollo were approximately 51,70043,900 ounces of gold during the fiscal year ended June 30, 2018,2020, compared to approximately 47,90051,900 ounces forof gold during the fiscal year ended June 30, 2017. 2019. Stream deliveries decreased as a result of the temporary suspension of operations during the quarter ended December 31, 2019, due to a workers’ strike from October 14, 2019 through December 5, 2019, which was resolved with the ratification of a new 36-month collective agreement.
16
Teck indicated that they expect gradually decliningexpects grades to be offset largely by planned throughput improvementscontinue to decline towards reserve grades in the mill.calendar year 2020 and future years. The current life of mine
20
for Andacollo is expected to continue until 2036.calendar year 2035. Additional permittingpermits or permit amendments to existing permits will be required to execute the life of mine plan.
Khoemacau Project (Botswana)
In February 2019, RGLD Gold entered into a silver stream with Khoemacau Copper Mining (Pty.) Limited (“KCM”) for the purchase of silver produced from the Khoemacau Project (“Khoemacau”). Under the purchase and sale agreement, subject to the satisfaction of certain conditions, RGLD Gold will make advance payments totaling $212 million toward the purchase of 80% of the silver produced from Khoemacau until certain delivery thresholds are met (the “Base Silver Stream”). At KCM’s option and subject to various conditions, RGLD Gold will make up to an additional $53 million in advance payments for up to the remaining 20% of the silver produced from Khoemacau (the “Option Silver Stream”). The stream rate will drop to 40% of silver produced from Khoemacau following delivery to RGLD Gold of 32 million silver ounces under the Base Silver Stream, or to 50% of the silver produced from Khoemacau following delivery of 40 million silver ounces to RGLD Gold should KCM exercise the entire Option Silver Stream. RGLD Gold will pay a cash price equal to 20% of the spot silver price for each ounce delivered under the Base Silver Stream and Option Silver Stream; however, if KCM achieves mill expansion throughput levels above 13,000 tonnes per day (30% above current mill design capacity), RGLD Gold will pay a higher ongoing cash price under the Base Silver Stream and Option Silver Stream for silver ounces delivered in excess of specific annual thresholds.
Khoemacau is a copper-silver development project located within the North West and Ghanzi Districts of Botswana owned by KCM. The license area is generally southwest of the town of Maun and northeast of the town of Ghanzi. Khoemacau is accessed from the city of Maun, approximately 40 miles southwest to the town of Toteng on a major travel route, Botswana’s A3 highway, a paved road and then approximately 16 miles on gravel road to reach the Boseto plant site. The Zone 5 mining area is connected to the Boseto plant by a 20-mile gravel road.
According to KCM, progress continued at Khoemacau during the June 2020 quarter and the project reached approximately 54% of construction completion as of June 30, 2020 with 81% of the capital committed. According to KCM, activities are focused on refurbishment of the Boseto mill, underground development, completion of accommodation, power and water infrastructure at Zone 5 and completing construction of the haul road between Zone 5 and the Boseto mill. Also, according to KCM, underground development has cumulatively advanced 2,360 meters in the five declines, which is in line with planned development rates.
On July 5, 2020, RGLD Gold made its fourth advance payment of $11.1 million, which brings the total contribution to $146.8 million. RGLD Gold expects to commit approximately $35 - $45 million during the remainder of calendar year 2020, and assuming the midpoint of this range, the total remaining commitment in calendar year 2021 is expected to range from approximately $25 million for the Base Silver Stream up to approximately $78 million should KCM elect to fully exercise the Option Silver Stream. Further payments are subject to certain conditions and are scheduled to be made on a quarterly basis using an agreed formula and certification process as project spending progresses.
According to KCM, although a six-month state of emergency has been declared by the Government of Botswana to help prevent the spread of COVID-19, mining has been designated an “essential service” and general development activity at Khoemacau is continuing. However, due to the impacts experienced from travel restrictions, some activities have been slowed or rescheduled. Barring any potential further impacts caused by COVID-19 considerations, we now expect the first shipment of concentrate to occur late in the third calendar quarter of 2021.
Mount Milligan (British Columbia, Canada)
RGLD Gold owns the right to purchase 35% of the payable gold and 18.75% of the payable copper produced from the Mount Milligan copper‑gold projectcopper-gold mine in British Columbia, Canada, which is operated by an indirect subsidiary of Centerra Gold Inc. (“Centerra”). The cash purchase price for gold is equal to the lesser of $435 per ounce, with no inflation adjustment, or the prevailing market price when purchased. The cash purchase price for copper is 15% of the spot price. As of June 30, 2020, approximately 516,500 ounces of payable gold and 34.71 million pounds of payable copper have been delivered to RGLD Gold.
The 17
Mount Milligan project is an open‑pitopen-pit mine and is located within the Omenica Mining Division in North Central British Columbia, approximately 96 miles northwest of Prince George, 53 miles north of Fort St. James, and 59 miles west of Mackenzie. The Mount Milligan project is accessible by commercial air carrier to Prince George, British Columbia, then by vehicle from the east via Mackenzie on the Finlay Philip Forest Service Road and the North Philip Forest Service Road, and from the west via Fort St. James on the North Road and Rainbow Forest Service Road. Road travel to the Mount Milligan property site is 482 miles from Prince Rupert and 158 miles from Prince George.
Gold stream deliveries from Mount Milligan were approximately 78,00059,900 ounces of gold during the fiscal year ended June 30, 2018,2020, compared to approximately 96,00068,500 ounces of gold during the fiscal year ended June 30, 2017.2019. The decrease was primarily due to the changereflects differences in the timing of shipments and settlements during the periods, in addition to lower gold stream rate from 52.25% to 35%. RGLD Gold began receivinggrades processed and lower gold deliveries reflecting the lower stream percentage in April 2017. recovery, slightly offset by increased tonnage processed.
Copper stream deliveries from Mount Milligan were approximately 10.35 million pounds of copper during the fiscal year ended June 30, 2018, compared to approximately 2.5712.7 million pounds during the fiscal year ended June 30, 2017. Copper stream deliveries began during our June 2017 quarter. The decrease was also partially a result of the mill processing operations at the mine being temporarily suspended for 39 days beginning on December 27, 2017, due to insufficient water. For the June 2018 quarter, mill throughput 47,000 tonnes per calendar day,2020, compared to 52,000 tonnes per calendar dayapproximately 9.1 million pounds during the June 2017 quarter.
On December 27, 2017, Centerra temporarily suspended mill operations at Mount Milligan due to insufficient fresh water. Centerra provided a further update on May 1, 2018 that Mount Milligan was operating at an average throughput of approximately 40,000 tonnes per day, and that once the spring snow melt is underway, throughput is expected to increase to a targeted average of 55,000 tonnes per day for the second half of the calendar year. Our fourth quarter fiscal year 2018 results were not impacted by the temporary shutdown of the mill processing facility. Due toended June 30, 2019. Increased deliveries resulted from differences in the timing of shipments and deliveriessettlements during the periods, in addition to higher tonnage and higher copper grades processed, slightly offset by lower copper recovery.
On March 26, 2020, Centerra published an updated National Instrument 43-101 (“NI 43-101”) technical report for the Mount Milligan mine, which provided a detailed update to the life of mine plan contained in the previous NI 43-101 report for Mount Milligan published by Centerra in calendar 2017.
Centerra reported a reduction in proven and probable reserves due to increased costs, lower expected productivities, and lower process plant throughput compared to their calendar 2017 technical report, as well as an update to the resource model and re-estimation of metallurgical recoveries. Details for the reserves and updated mine plan, which does not contemplate any growth capital or inclusion of additional mineralized material, were reported by Centerra as follows:
| ● | Reserves as of December 31, 2019 containing 2.4 million ounces of gold and 959 million pounds of copper (comprised of 191.0 million tonnes grading 0.39 grams per tonne of gold and 0.23% of copper). Reserves were calculated using a gold price of $1,250 per ounce, a copper price of $3.00 per pound, and an exchange rate of US$ 1.00 to C$ 1.25; |
| ● | Production based on a 9-year reserve life through calendar 2028; |
| ● | Average life of mine recoveries of 61.8% for gold and 80.6% for copper; |
| ● | Life of mine payable gold production of 1.45 million ounces, or an average of 161,000 ounces per year; |
| ● | Life of mine payable copper production of 735.6 million pounds, or an average of 81.7 million pounds per year; and |
| ● | Average life of mine all-in sustaining cost of $704 per ounce of gold sold on a by-product basis, which includes sustaining capital and copper revenue credits (assuming a copper price of $3.00 per pound and an exchange rate of US$ 1.00 to C$ 1.25). |
Significant reductions in proven and probable reserves or mineralized material are indicators of potential impairment for our stream and royalty interests. As part of our regular asset impairment analysis during the quarter ended March 31, 2020, we determined that an impairment of our stream interest at Mount Milligan was not necessary as (i) the earlier financial impairment taken by Centerra does not impact the mine operating performance, and (ii) the reduction in reserves and mineralized material at Mount Milligan resulted in updated gold and copper depletion rates that remain well below current and long-term consensus gold and copper prices. Due to the reduction in gold and copper reserves, as reported by Centerra, the depletion rate of our investment at Mount Milligan increased from $402 to $764 per ounce of gold and copper, we expectfrom $0.81 to $1.48 per pound of copper.
On April 1, 2020, Centerra announced that reductions of manpower and throughput at Mount Milligan would occur as a result of actions implemented to combat the impactCOVID-19 pandemic. Centerra has since reported that workforce numbers returned to normal over the month of May resulting in mining and plant tonnages returning to planned levels. According to Centerra, process plant throughput averaged approximately 60% of target levels and mining operations experienced a four week partial shutdown during the reduction period, and during April, the process plant was shut down for eleven days to perform routine maintenance and reline the SAG mill.
18
Centerra also reported that stored water inventory at Mount Milligan, which is critical to the ability to process ore through the mill on a sustainable basis, was in excess of six million cubic meters as at June 30, 2020. Centerra reported that spring water pumping started in April, and substantial snowpack and a wet spring led to volumes pumped as of the temporary shutdown to be reflected in Royal Gold’s first fiscal quarter 2019 results, as someend of June that exceeded those of the deliveries of gold and copper that were expected in the June through August 2018 period have been deferred to a later date.
On August 1, 2018,entire 2019 pumping season. In addition, Centerra reported that Mount Milligan continued to access ground water from the Lower Rainbow Valley wellfield and other groundwater wells near the tailings storage facility during the quarter ended June 30, 2020. Centerra also reported that it continued exploration activities focused on extending the groundwater capacity in the vicinity of the existing infrastructure, and these activities will continue for the remainder of 2020. Further, Centerra reported that it continues to face potential limitations duepursue a longer-term solution to its water supply, a situation exacerbated by minimal inflow from snow melt and less than expected precipitation experienced in calendar 2018.requirements at Mount Milligan.
On July 31, 2020, Centerra announced they filedconfirmed that there is no change to the previously issued production guidance for an amendment to their environmental assessment certificate to provide additional short-term water sources through 2020, and to initiate the development of a longer term water supply plan for subsequent years.
According to Centerra, if regulatory approvals to access water sources are not received, the Mount Milligan mill would needfor calendar year 2020 of 140,000 to operate only one ball mill to conserve water and throughput would be reduced to approximately 30,000 tonnes per day for the December 2018 quarter. In addition to these water matters, throughput in the September 2018 quarter will be reduced as a result of a recent (July 2018) 10-day unscheduled shutdown of the primary crusher for maintenance and a scheduled five-day maintenance shutdown in September 2018. Considering these factors, Centerra reduced their calendar 2018 production guidance at Mount Milligan to 175,000-195,000160,000 payable ounces of gold and 40-4780 to 90 million payable pounds of copper. If Centerra receives approval to access short-term water sources in the fourth quarter of calendar 2018, second half calendar 2018 throughput could be increased.
21
Pueblo Viejo (Sanchez Ramirez, Dominican Republic)
RGLD Gold owns the right to purchase 7.5% of Barrick’s interest in the gold produced from the Pueblo Viejo mine until 990,000 ounces of gold have been delivered, and 3.75% thereafter. The cash purchase price for gold is 30% of the spot price of gold per ounce delivered until 550,000 ounces of gold have been delivered, and 60% of the spot price of gold per ounce delivered thereafter. RGLD Gold also owns the right to purchase 75% of Barrick’s interest in the silver produced from the Pueblo Viejo mine, subject to a minimum silver recovery of 70%, until 50 million ounces of silver have been delivered, and 37.5% thereafter. The cash purchase price for silver is 30% of the spot price of silver per ounce delivered until 23.1 million ounces of silver have been delivered, and 60% of the spot price of silver per ounce delivered thereafter. As of June 30, 2020, approximately 226,400 ounces of payable gold and 7.9 million ounces of payable silver have been delivered to RGLD Gold.
The Pueblo Viejo mine is located in the province of Sanchez Ramirez, Dominican Republic, approximately 60 miles northwest of Santo Domingo, and is owned by a joint venture in which Barrick holds a 60% interest and is responsible for operations, and in which GoldcorpNewmont Corporation holds a 40% interest. Pueblo Viejo is accessed from Santo Domingo by traveling northwest on Autopista Duarte, Highway #1, approximately 48 miles to Piedra Blanca and proceeding east for approximately 14 miles on Highway #17 to the gatehouse for Pueblo Viejo. Both Highway #1 and Highway #17 are paved.
Gold stream deliveries from Pueblo Viejo were approximately 45,40045,000 ounces of gold during the fiscal year ended June 30, 2018,2020, compared to approximately 52,60041,200 ounces of gold during the fiscal year ended June 30, 2017.
2019. Silver stream deliveries were approximately 1.891.7 million ounces of silver during the fiscal year ended June 30, 2018,2020, compared to approximately 1.782.0 million ounces of silver during the fiscal year ended June 30, 2017. 2019.
Barrick reportedreports that it continues to advance engineering and evaluation work towards a decrease in production at Pueblo Viejo during the June 2018 quarter due to lower head grade resulting from the expected decline in pit ore gradesfeasibility study for the periodprocess plant expansion and delays in transitioning to higher grade ore benches in Moore Pit Phases 5 and 6. Lower throughput duringproposed tailings storage facility that could extend the June 2018 quarter resulted from the first of two-annual planned autoclave and mill shutdowns. Barrick expects production to increase in the September 2018 quarter as Pueblo Viejo transitions to higher grades in Moore Pit Phases 5 and 6. Barrick expects September 2018 quarter throughput to remain in line with the June 2018 quarter as scheduled maintenance of the second autoclave will be completed. Barrick also anticipates higher gradesmine life at Pueblo Viejo to persist intobeyond calendar year 2040. Barrick estimates that the December 2018 quarter, with higher throughput.
Barrick is advancing prefeasibility level studies for aprocess plant and tailings expansion at Pueblo Viejo that wouldproject could significantly increase throughput by 50% to 12 million tonnes per year, allowingand allow the mine to maintain average annual gold production of approximately 800,000 ounces after calendar year 2022 (on a 100% basis). The project involves, and that the addition of a pre-oxidation heap leach pad with aincrease in tailings storage capacity of eight million tonnes per year, a new mill and flotation concentrator with a capacity of four million tonnes per year, and additional tailings capacity. The project has the potential to convert roughly sevenapproximately 11 million ounces of mineralized material to proven and probable reserves (on a 100% basis). In support
Barrick expects the proportion of lower grade stockpile ore in the feed blend to steadily increase until the mine expansion pits are fully developed as part of the prefeasibility study,decision on the proposed plant and tailings expansion project. Barrick completedalso reported lower gold production during the constructionJune 2020 quarter as a result of a pilot pre-oxidation heap leach padplanned maintenance shutdown. For calendar year 2020, Barrick indicated production attributable to test metallurgytheir interest at Pueblo Viejo is expected to be between 530,000 and recoveries, and is now irrigating ore. Civil works for the pilot flotation circuit have also commenced, and a tender process for structural, mechanical, and electrical contracts is now underway. 580,000 ounces of gold.
Wassa and Prestea (Western Region, Ghana)
RGLD Gold owns the right to purchase 10.50%10.5% of the gold produced from the Wassa, Prestea and Prestea projects,Bogoso mines, operated by Golden Star Resources Ltd. (“Golden Star”), until an aggregate 240,000 ounces have been delivered. Once the applicable delivery threshold is met, the stream percentage will decrease to 5.5%. The cash purchase price for the remaining term gold is 20%
19
of the transaction.spot price per ounce delivered until 240,000 ounces of gold have been delivered, and 30% of the spot price per ounce delivered thereafter. As of June 30, 2020, approximately 110,500 ounces of payable gold have been delivered from Wassa, Prestea and Bogoso mines, of that 69,700 ounces of payable gold have been delivered from Wassa to RGLD Gold.
The Wassa underground mine and oxide ore mill are located near the village of Akyempim in the Wassa East District, in the Western Region of Ghana, approximately 50 miles north of Cape Coast and 93 miles west of the capital Accra. The main access to the site is from the east, via the Cape Coast to Twifo‑PrasoTwifo-Praso road, then over the combined road‑railroad-rail bridge on the Pra River. There is also an access road from Takoradi in the south via Mpohor. An airport at Takoradi is capable of handling jet aircraft and is serviced by several commercial flights each day.
Prestea currently produces from both open pits and an underground operation producing oxide ore located in the Ashanti gold district in the central eastern section of the Western Region of Ghana, approximately 6 miles south of the town of Bogoso. Access to the property is by commercial air carrier to Accra and then by vehicle on a paved and gravel road.
22
Stream deliveries from Wassa and Prestea were approximately 25,90016,500 ounces of gold during the fiscal year ended June 30, 2018,2020, compared to approximately 19,90016,600 ounces of gold during the fiscal year ended June 30, 2017.2019.
On March 27, 2020, Golden Star reported that deep drilling in calendar year 2019 successfully extended the increase in productionmineralization at Wassa by approximately 700 feet to the south where the deposit remains open to the south and down dip. Golden Star further reported that the exploration strategy during calendar year 2020 would transition away from growth of the currentoverall resource to infill drilling to help define the potential mine plans for the southern extension of the operation. According to Golden Star, as of December 31, 2019 the proven mineral reserve at Wassa increased 87% over the prior year period was primarily due to improved grade1.4 million ounces of gold, and tonnestotal underground mineralized material at the Wassa underground mine. Ascontained approximately 11.2 million ounces of February 1, 2018, Wassa became an underground-only mining operation, however, stock piled ore continued to be processed throughout the current period. At Prestea,gold.
On July 27, 2020, Golden Star announced that it had signed a binding agreement with Future Global Resources Limited (“FGR”) for the sale of the Prestea and Bogoso mines. This transaction will require the separation of the RGLD Gold stream agreement into separate stream agreements for each of Wassa and Prestea/Bogoso, which is conditional on, among other things, the approval of the board of directors of Royal Gold. Further, on July 28, 2020, Golden Star announced that, if approved, the separated Wassa stream agreement would require Golden Star to deliver 10.5% of the gold produced from Wassa in return for a cash purchase price for gold of 20% of the spot price per ounce delivered, until the delivery of 240,000 ounces, after which the obligation would decrease to 5.5% of the gold produced from Wassa in return for a cash purchase price for gold of 30% of the spot price per ounce delivered.
On July 28, 2020, Golden Star reported calendar year 2020 gold production decreased during the current period primarily dueguidance for Wassa of between 165,000 to the planned reduction170,000 ounces, up from the Prestea open-pits and the slower than expected ramp-up at the Prestea underground mine. previous guidance range of 155,000 to 165,000 ounces.
Golden Star indicated that they remain on track to achieve their consolidated calendar year 2018 production guidance, and that they expect production to be weighted to the second half of calendar 2018.
Royalty Interests
Cortez (Nevada, USA)
Cortez is a series of large open‑pitopen-pit and underground mines, utilizing mill and heap leach processing, which are operated by subsidiaries of Barrick.Nevada Gold Mines LLC (“NGM”), a joint venture between Barrick and Newmont Corporation (“Newmont”) with respect to their Nevada operations. The operation is located approximately 60 air miles southwest of Elko, Nevada, in Lander County. The site is reached by driving west from Elko on Interstate 80 approximately 46 miles and proceeding south on State Highway 306 approximately 23 miles. Our royalty interest at Cortez applies to the Pipeline and South Pipeline deposits, part of the Gap pit and the Crossroads deposit.
The royalty interests we hold at Cortez include:
|
|
|
|
|
|
20
indexing for inflation or deflation. The GSR2 royalty rate is 5.0% at a gold price of $470 per ounce and higher. (c)Reserve and GAS Claims Fixed Royalty (“GSR3”). The GSR3 royalty is a fixed rate GSR royalty of 0.7125% and covers the same cumulative area as is covered by our two sliding-scale GSR royalties, GSR1 and GSR2, except mining claims that comprise the undeveloped Crossroads deposit. (d)Net Value Royalty (“NVR1”) and Net Value Royalty (Crossroads) (“NVR1C”). The NVR1 royalty is a fixed royalty of 4.91% NVR that covers the area of the GAS Claims, excluding the majority of the Crossroads deposit. The NVR1C royalty, which covers the majority of the Crossroads deposit, is a fixed royalty of 4.52% NVR. On average, above a gold price of $470 per ounce after the relevant deductions, the combined royalty interests of GSR1, GSR2, GSR3, NVR1 and NVR1C are equivalent to an approximate 8.2% gross smelter return royalty to Royal Gold. |
|
|
We also own three other royalties in the Cortez area where there is currently no production and no reserves attributed to these royalty interests.
Production attributable to our royalty interest at Cortez increased approximately 21% when compared to 173,300 ounces of gold over the prior fiscal year ended June 30, 2017. Waste strippingof 96,700 ounces of gold, as a result of production ramping up at the Crossroads deposit, which is subject to our NVR1 (Crossroads) and GSR2 royalty interests is currently ongoing. Production from Crossroads, which contains 3.2and portions of the NVR1 and GSR3 royalty interests.
During the quarter ended March 31, 2020, Barrick provided us with an updated reserve statement and life of mine plan for Cortez. According to Barrick, as of December 31, 2019, total proven and probable reserves subject to our royalty interests contained 3.5 million ounces of gold (consisting of 87.0 million tonnes of ore at a grade of 1.26 grams per tonne). Reserves were calculated at a gold price of $1,200 per ounce.
Further according to Barrick, total gold production at Cortez from the regions subject to our interests is expected to beginbe approximately 175,000 ounces in late calendar 2018.year 2020, increasing to an approximate average of 425,000 ounces from calendar 2021 through calendar 2026. The expected production increase from calendar year 2020 to calendar year 2021 is primarily due to higher contribution from the Crossroads deposit, which is expected to ramp up through calendar year 2023 and offset declining production from the other royalty regions.
Peñasquito (Zacatecas, Mexico)
We own a production payment equivalent to a 2.0% NSR royalty on all metal production from the Peñasquito open‑pitopen-pit mine, located in the State of Zacatecas, Mexico, and operated by a subsidiary of Goldcorp Inc. (“Goldcorp”).Newmont. The