UNITED STATES
SECURITIES AND EXCHANGE COMMISSION
Washington, D.C. 20549
FORM 10‑K10-K
| ☒ | ANNUAL REPORT PURSUANT TO SECTION 13 OR 15(d) OF THE SECURITIES EXCHANGE ACT OF 1934 |
☒ANNUAL REPORT PURSUANT TO SECTION 13 OR 15(d) OF THE SECURITIES EXCHANGE ACT OF 1934
For the fiscal year ended December 31 2018, 2021
Or
| ☐ | TRANSITION REPORT PURSUANT TO SECTION 13 OR 15(d) OF THE SECURITIES EXCHANGE ACT OF 1934 |
☐TRANSITION REPORT PURSUANT TO SECTION 13 OR 15(d) OF THE SECURITIES EXCHANGE ACT OF 1934
Commission file number 001‑11499001-11499
WATTS WATER TECHNOLOGIES, INC.
(Exact name of registrant as specified in its charter)
| |
Delaware | 04‑291653604-2916536
|
(State or Other Jurisdiction of | (I.R.S. Employer |
Incorporation or Organization) | Identification No.) |
| |
815 Chestnut Street, North Andover, MA | 01845 |
(Address of Principal Executive Offices) | (Zip Code) |
Registrant’s telephone number, including area code: (978) 688‑1811(978) 688-1811
Securities registered pursuant to Section 12(b) of the Act:
| | |
Title of Each Classeach class | Trading Symbol(s) | Name of Each Exchangeeach exchange on Which Registeredwhich registered |
Class A common stock, par value $0.10 per share | WTS | New York Stock Exchange |
Securities registered pursuant to Section 12(g) of the Act: None
Indicate by check mark if the registrant is a well‑knownwell-known seasoned issuer, as defined in Rule 405 of the Securities Act. Yes ☒⌧ No ☐◻
Indicate by check mark if the registrant is not required to file reports pursuant to Section 13 or Section 15(d) of the Exchange Act. Yes ☐ ◻No ☒⌧
Indicate by check mark whether the registrant (1) has filed all reports required to be filed by Section 13 or 15(d) of the Securities Exchange Act of 1934 during the preceding 12 months (or for such shorter period that the registrant was required to file such reports), and (2) has been subject to such filing requirements for the past 90 days. Yes ☒⌧ No ☐◻
Indicate by check mark whether the registrant has submitted electronically every Interactive Data File required to be submitted pursuant to Rule 405 of Regulation S‑TS-T during the preceding 12 months (or for such shorter period that the registrant was required to submit and post such files). Yes ☒⌧ No ☐◻
Indicate by check mark if disclosure of delinquent filers pursuant to Item 405 of Regulation S‑K is not contained herein, and will not be contained, to the best of registrant’s knowledge, in definitive proxy or information statements incorporated by reference in Part III of this Form 10‑K or any amendment to this Form 10‑K. ☐
Indicate by check mark whether the registrant is a large accelerated filer, an accelerated filer, a non‑non-accelerated filer, a smaller reporting company, or an emerging growth company. See the definitions of “large accelerated filer,” “accelerated filer,” “smaller reporting company,” and “emerging growth company” in Rule 12b‑212b-2 of the Exchange Act.
Large accelerated filer ☒ | Accelerated filer ☐ | Non-accelerated filer ☐ | Smaller reporting company ☐ |
| | | Emerging growth company ☐ |
| | | |
If an emerging growth company, indicate by check mark if the registrant has elected not to use the extended transition period for complying with any new or revised financial accounting standards provided pursuant to Section 13(a) of the Exchange Act. ☐ ◻
Indicate by check mark whether the registrant has filed a report on and attestation to its management’s assessment of the effectiveness of its internal control over financial reporting under Section 404(b) of the Sarbanes-Oxley Act (15 U.S.C. 7262(b)) by the registered public accounting firm that prepared or issued its audit report. ⌧
Indicate by check mark whether the registrant is a shell company (as defined in Rule 12b‑212b-2 of the Exchange Act). Yes ☐ No ☒
As of June 29, 2018,25, 2021, the aggregate market value of the registrant’s common stock held by non‑affiliatesnon-affiliates of the registrant was approximately $2,164,731,408$3,885,336,411 based on the closing sale price as reported on the New York Stock Exchange.
Indicate the number of shares outstanding of each of the issuer’s classes of common stock, as of the latest practicable date.
| | |
Class |
| Outstanding at January 27, 201923, 2022 |
Class A common stock, $0.10 par value per share | | 27,623,44527,580,055 shares
|
Class B common stock, $0.10 par value per share | | 6,329,2906,024,290 shares
|
DOCUMENTS INCORPORATED BY REFERENCE
Portions of the Registrant’s definitive Proxy Statement for its Annual Meeting of Stockholders to be held on May 17, 201911, 2022 are incorporated by reference into Part III of this Annual Report on Form 10‑K.10-K.
PART I
Item 1. BUSINESS.
This Annual Report on Form 10‑K10-K contains statements that are not historical facts and are considered forward‑lookingforward-looking within the meaning of the Private Securities Litigation Reform Act of 1995. These forward‑lookingforward-looking statements contain projections of our future results of operations or our financial position or state other forward‑lookingforward-looking information. In some cases, you can identify these forward‑lookingforward-looking statements by words such as “anticipate,” “believe,” “could,” “estimate,” “expect,” “intend,” “may,” “should,” and “would” or similar words. You should not rely on forward‑lookingforward-looking statements because they involve known and unknown risks, uncertainties and other factors, some of which are beyond our control. These risks, uncertainties and other factors may cause our actual results, performance or achievements to differ materially from the anticipated future results, performance or achievements expressed or implied by the forward‑lookingforward-looking statements. Some of the factors that might cause these differences are described under Item 1A—“Risk Factors.” You should carefully review all of these factors, and you should be aware that there may be other factors that could cause these differences. These forward‑lookingforward-looking statements were based on information, plans and estimates at the date of this report, and, except as required by law, we undertake no obligation to update any forward‑lookingforward-looking statements to reflect changes in underlying assumptions or factors, new information, future events or other changes.
In this Annual Report on Form 10‑K,10-K, references to “the Company,” “Watts Water,” “Watts,” “we,” “us” or “our” refer to Watts Water Technologies, Inc. and its consolidated subsidiaries.
Overview
Watts Regulator Co. was founded by Joseph E. Watts in 1874 in Lawrence, Massachusetts. Watts Regulator Co. started as a small machine shop supplying parts to the New England textile mills of the 19th century and grew into a global manufacturer of products and systems focused on the control, conservation and quality of water and the comfort and safety of the people using it. Watts Water Technologies, Inc. was incorporated in Delaware in 1985 and is the parent company of Watts Regulator Co.
Our strategy is to be the preferred supplier of differentiated products, solutions and systems that manage and conserve the flow of fluids and energy into, through and out of buildings in the commercial and residential markets of the Americas, Europe, and Asia-Pacific, Middle East and Africa (“APMEA”), our three geographic segments. Within this framework, we focus upon three themes: safety &and regulation, energy efficiency and water conservation. This strategy enablesprovides us to continuewith a platform to increase our earnings via sales growth, both organic and inorganic, and the systematic reduction of manufacturing costs and operational expenses.
We intend to continueOur strategy is to expand organically by introducing new complementary products and solutions in existing markets, by enhancing our preferred brands, by promoting plumbing code development to drive the need for safety and quality products and by continually improving merchandising in our wholesale distribution channels. We focus on selling solutions to our customers that integrate a variety of our product offerings. We target selected new products and geographic markets based on growth potential, including our ability to leverage our existing distribution channels. Additionally, we leverage our distribution channels through the introduction of new products and solutions, as well as the integration of products of our acquired companies.
The Internet of Things “IoT”(“IoT”) has allowed companies to transform components and products into smart and connected devices. Over the last few years we have been buildingWe remain committed to enhancing our smart and connected foundationcapabilities by expanding our internal capabilitiescompetencies and making strategic acquisitions. In 2018, we began acceleratingWe continue to focus our efforts and initiatives related to our Smartsmart and Connectedconnected strategy by investing in IoT architecture development, enhancing digital tools used by our customers, and launching our newincluding Watts’ website, and severalinvesting in new smart and connected product development projects. Our strategy is to deliver superior customer value through smart and connected products and solutions. The strategy we will focusfocuses on has three dimensions: Connect, Control and Conserve. We intendhave introduced and plan to introducecontinue offering new products that will connect our customers with smart systems, control systems for optimal performance, and conserve critical resources by increasing operability, efficiency and safety. Our goal is to derive 25 percent25% of our revenue from smart and connected products by 2023.
We continue to focus on sustainability by taking steps to reduce the negative impact our operations have on the environment while generating economic value by manufacturing and selling products, solutions and technologies that
enable our customers to reduce the negative impact they have on the environment. As a leading global water technology company, we address some of the world's most important sustainability priorities – the conservation, control and safe use of water. Our smart and connected strategy is anchored by a commitment to connect our customers to smart systems, control those systems for optimal performance, and conserve critical water and other resources by increasing operability, efficiency, and safety. Internally, we have reduced our global water consumption and greenhouse gas emissions, improved our safety performance, made our work environment more diverse, equitable and inclusive, and maintained robust ethics and compliance programs to help ensure we do business with integrity and in accordance with high ethical standards.
We intend to continue to generate incremental growth by targeting selectedselect acquisitions, both in our core markets as well asand in new complementary markets. We have completed 1112 acquisitions in the last decade.since 2012. Our acquisition strategy focuses
on businesses that manufacture preferred brand name products that address our themes of safety &and regulation, energy efficiency and water conservation in our primary or related complementary markets.conservation. We target businesses that will provide us with one or more of the following: an entry into new markets, an increase in shelf space with existing customers, strong brand names, a new improved channel access, unique and/or improved technologyproprietary technologies, advanced production capabilities or an expansion of the breadth of our product andcomplementary solution offerings.
We are committed to reducing our manufacturing and operating costs using Lean methodologies to drive improvement across all key processes. We have a number of manufacturing facilities in lower‑costlower-cost regions. In recent years, we have announced global restructuring plans which reduced our manufacturing and distribution footprint in order to reduce our costs and to realize incremental operating efficiencies.
Additionally, a majority of our manufacturing facilities are ISO 9000, 9001 or 9002 certified by the International Organization for Standardization.
The majority of our sales are for products that have been approved under regulatory standards incorporated into state and municipal plumbing, heating, building and fire protection codes in the Americas, Europe, and certain countries within APMEA. We have consistently advocated for the development and enforcement of plumbing codes and are committed to providing products to meet these standards.
ProductsCOVID-19 Pandemic and Supply Chain Disruptions
The COVID-19 pandemic and its widespread global impact presented new and unique challenges for us, affecting our employees, operations and how we safely work, as well as impacting our customers, supply chain, channels and distribution partners. Many of our products qualify as “essential products” under local, state and national guidelines and orders. Throughout 2020, we experienced temporary shutdowns of a few of our facilities in Europe and temporarily reduced capacity at other facilities, but otherwise we were able to keep most of our facilities open and employees working, manage our supply chain and continue to make our products available to our customers. Our operations in China were impacted beginning early in the first quarter of 2020, followed by our Europe and then Americas segments, which experienced the initial impact of the pandemic late in the first quarter of 2020. Temporary closures, lockdowns and other restrictions mandated by various government authorities intended to combat the COVID-19 pandemic negatively impacted our business at varying levels within each of our operating segments as customers curtailed and reduced overall spending in response to the protective measures implemented and the resulting economic impacts. We implemented cost management and capital preservation actions early in 2020 in response to these impacts. As the second half of 2020 progressed and government-imposed restrictions subsided, we noted market activity levels increasing with sales and profits improving sequentially from the second to fourth quarters. Profits improved in part from better volumes and in part from the cost actions we executed in response to the pandemic. Results in 2021 continued that trend of improved top line growth and profit performance. However, as worldwide economies recover from the pandemic, increased market demand is straining suppliers’ ability to fill orders. This has been compounded by logistical issues throughout the supply chain. Labor shortages and other workforce disruptions have affected our manufacturing and distribution processes, as well as our suppliers, including higher absenteeism caused by illness from virus variants or quarantine measures. Our operating response and mitigation actions are discussed within Item. 7 “Management’s Discussion and Analysis of Financial Condition and Results of Operations.” Despite these ongoing challenges, we continued to invest in our business, including new products, our connected solutions and our growth and productivity initiatives. We achieved record performance for 2021 despite the impact of the COVID-19 pandemic and the supply chain disruption, while committing to the safety of our employees, meeting our customers’ needs and continuing to invest in our long-term strategy.
Products
We have a broad range of products in terms of design distinction, size and configuration. We classify our many products into four global product lines. These product lines are:
| ·
● | | Residential & commercial flow control products—includes products typically sold into plumbing and hot water applications such as backflow preventers, water pressure regulators, temperature and pressure relief valves, and thermostatic mixing valves.valves and leak detection products. Residential & commercial flow control products accounted for approximately 53% of our total net sales in 2021, and 52% of our total net sales in 20182020 and 2017, and 56% of our total sales in 2016. 2019. |
| ·
● | | HVAC & gas products—includes commercial high‑efficiencyhigh-efficiency boilers, water heaters and heatingcustom heat and hot water solutions, hydronic and electric heating systems for under‑floorunder-floor radiant applications, custom heat and hot water solutions, hydronic pump groups for boiler manufacturers and alternative energy control packages, and flexible stainless steel connectors for natural and liquid propane gas in commercial food service and residential applications. HVAC & gas products accounted for approximately 32%31% of our total net sales in 2018 and 2017, and 29%2021, 30% of our total net sales in 2016.2020, and 31% of our total net sales in 2019. HVAC is an acronym for heating, ventilation and air conditioning. |
| ·
● | | Drainage & water re‑usere-use products—includes drainage products and engineered rain water harvesting solutions for commercial, industrial, marine and residential applications. Drainage & water re‑usere-use products accounted for approximately 10% of our total net sales in 20182021, and 2017, and 9%11% of our total net sales in 2016. 2020 and 2019. |
| ·
● | | Water quality products—includes point‑of‑usepoint-of-use and point‑of‑entrypoint-of-entry water filtration, conditioning and scale prevention systems and monitoring and metering products for both commercial, marine and residential applications. Water quality products accounted for approximately 6% of our total net sales in 2018, 20172021, 7% of our total net sales in 2020, and 2016. 6% of our total net sales in 2019. |
Commercial and Operational Excellence
We strive to invest in product innovation that meets the wants and needs of our customers. Our focus is on differentiated products and solutions that will provide greater opportunity to distinguish and defend ourselves in the market place.marketplace. Conversely, we continue to migrate away from commoditized products where we cannotit is more difficult to add value. Our goal is to be a solutions provider, not merely a components supplier. We refer to this customer‑facingcustomer-facing mindset as commercial excellence, and we are continually looking for strategic opportunities to invest or divest, where necessary, in order to meet those objectives. In conjunction with this customer‑centriccustomer-centric focus, we continually review our operations to ensure we can efficiently and effectively produce and deliver products to customers. We are also striving to simplify our administrative operations as well to drive further efficiencies. We call this aspect of our business operational excellence.
Customers and Markets
We sell our products to plumbing, heating and mechanical wholesale distributors and dealers, original equipment manufacturers (OEMs), specialty product distributors, and major DIYdo-it-yourself (DIY) and retail chains.
Wholesalers. Approximately 61%, 63%,60% and 57%61% of our net sales in 2018, 2017,2021, 2020 and 2016,2019, respectively, were to wholesale distributors for commercial and residential applications.
OEMs. Approximately 15%, 16%, and 21% of our net sales in 2018, 2017,2021 and 2016, respectively,2020, and 14% of our net sales in 2019 were to OEMs. In the Americas, our typical OEM customers are water heater manufacturers and equipment and water systems manufacturers needing flow control devices and other products. Our sales to OEMs in Europe are primarily to boiler manufacturers and radiant system manufacturers. Our sales to OEMs in APMEA are primarily to water heater, air conditioning, and appliance manufacturers.
Specialty. Approximately 20%, 17%, and 18%,19% of our net sales in 2018, 2017,2021 and 2016, respectively,2020, and 21% of our net sales in 2019 were through our specialty channel. The specialty channel primarily includes sales related to high-efficiency boilers and water heaters,
water filtration and conditioning products, specialty floor and tile products, and food service products and leak detection products.
DIY Chains. Approximately 5% of our net sales in 2021 and 2020, and 4% of our net sales in 2018, 2017, and 20162019 were to DIY chains. The DIY channel primarily includes sales related to ball valvevalves and a portion of our water quality products.
In 2018, 20172021, 2020 and 2016,2019, no customer accounted for more than 10% of our total net sales. Our top ten customers accounted for approximately $329.5$371.5 million, or 21.1%20.5%, of our total net sales in 2018; $300.62021; $344.1 million, or 21%22.8%, of our total net sales in 2017;2020; and $275.2$359.1 million, or 20%22.4%, of our total net sales in 2016.2019. Thousands of other customers constituted the balance of our net sales in each of those years.
Marketing and Sales
For product sales in the Americas, we rely primarily on commissioned manufacturers’ representatives to market our product lines, some of which maintain a consigned inventory of our products. These representatives sell primarily to plumbing and heating wholesalers and contractors or supply DIY stores. Our specialty channel products in the Americas are sold through independent representatives, dealers and distributors. We also sell products directly to wholesalers, OEMs and private label accounts primarily in Europe and APMEA, and, to a lesser extent, in the Americas.
Manufacturing
Manufacturing
We have integrated and automated manufacturing capabilities, including a statestate-of-the-art foundry dedicated exclusively to the production of products that qualify as “lead-free” under the art lead-free foundryU.S. Safe Drinking Water Act; and a traditional brass and bronze foundry, machining capabilities, plastic extrusion, and injection molding and assembly operations. Our foundry operations include metal pouring systems, automatic core making, and brass and bronze die‑castings.die-castings. Our machining operations feature computer‑controlledcomputer-controlled machine tools, high‑high-speed chucking machines with robotics, robotic assembly capability, laser cutting technology, and automatic screw machines for machining bronze, brass and steel components. Our heating and hot water product manufacturing capabilities include all phases of light and heavy gagegauge metal fabrication, including laser cutting andincorporating the latest technology for welding and brazing, processes includingas well as laser cutting; automated and robotic applications, as well asapplications; and metal finishing, includingwhich includes chemical passivation of stainless steel. We have invested in recent years to expand our manufacturing capabilities and to adopt the most efficient and productive equipment. We are committed to maintaining our manufacturing equipment at a level consistent with current technology in order to maintain high levels of quality and manufacturing efficiencies. In 2018,2021, we continued to invest in our systems and in our manufacturing facilitiesand training facilities.our commercial and operational excellence initiatives.
Capital expenditures and depreciation for each of the last three years were as follows:
| | | | | | | | | | |
| | | Years Ended December 31, |
| | | 2021 | | 2020 | | 2019 |
| | | | | | | | | | |
| | Years Ended December 31, | |
| | 2018 | | 2017 | | 2016 | |
| | (in millions) | |
| | | (in millions) |
Capital expenditures | | $ | 35.9 | | $ | 29.4 | | $ | 36.0 | | $ | 26.7 | | $ | 43.8 | | $ | 29.2 |
Depreciation | | $ | 28.9 | | $ | 29.7 | | $ | 30.4 | | $ | 31.4 | | $ | 31.3 | | $ | 31.0 |
Purchased Raw Materials and Components
We require substantial amounts ofOur products are made using various purchased components and raw materials, to produce our products, including primarily bronze, brass, cast iron, stainless steel, steel, plastic, and other materials used in our products.plastic. Substantially all of the raw materials we require to manufacture our products are purchased from outside sources. The commodity markets have experienced tremendous volatility over the past several years, including the imposition of tariffs, particularly with respect to copper and stainless steel.steel, and currently we are experiencing high inflationary pressures in these markets. Tariffs could increaseimpact the total cost of our products and the components and raw materials that go into manufacturing them. These increasedIncreased tariff costs could adversely impact the gross margin we earn on our products. Because we internationally source a significant amount of raw materials and components, several months of raw materials and work in process are moving through our supply chain at any point in time. We are not able to predict whether component costs or commodity costs, including copper and stainless steel, will significantly increase or decrease in the future. If component costs or commodity costs increase in the future and we are not able to reduce or eliminate the effect of the cost increases by reducing production costs or implementing price increases, our profit margins could decrease. If component costs or commodity costs were to decline, we may experience pressurespressure from
customers to reduce our selling prices. The timing of any price reductions and decreases in commodity costs may not align. As a result, our margins could be affected.
With limited exceptions, we have multiple suppliers for our commoditiescomponents and other raw materials. We believe our relationships with our key suppliers are good and that an interruption in supply from any one supplier would not materially affect our ability to meet our immediate demands while another supplier is qualified. We regularly review our suppliers to evaluate their strengths. If a supplier is unable to meet our demands, we believe that in most cases our inventory of components and raw materials will allow for sufficient time to identify and obtain the necessary commodities and other raw materials from an alternate source. We believe that the nature of the commoditiescomponents and other raw materials used in our business are such that multiple sources are generally available in the market. However, our current and alternative suppliers are largely concentrated in China. The occurrence of natural disasters, public health crises such as pandemics or epidemics, political crises such as war, terrorism or political instability, or other events that result in widespread business or supply chain disruptions in China could have a material adverse effect on our ability to obtain necessary components and raw materials and our business and operating results could suffer.
The current global supply chain disruptions are impacting our supply of raw materials and purchased components. Refer to Item. 1A “Risk Factors” for risks related to the impact of supply chain and logistic disruptions and Item. 7 “Management’s Discussion and Analysis of Financial Condition and Results of Operations” for additional disclosure.
Code Compliance
Products representing a majority of our sales are subject to regulatory standards and code enforcement, which typically require that these products meet stringent performance criteria. StandardsCodes and standards in the Americas are established by such industry test and certificationgovernment organizations such as the American Society of Mechanical Engineers (ASME), the America Water Works Association (AWWA), the Canadian Standards Association (CSA), the American Society of Sanitary Engineering (ASSE), the American National Standards Institute—Leadership in Energy & Environmental Design (LEED), the University of Southern California Foundation for Cross‑Connection Control and Hydraulic Research (USC FCCC & HR), FM Global (FM), NSF International (NSF) and Underwriters Laboratories (UL), the National Board (NB), the Environmental Protection Agency (EPA), and the Californian Energy Commission (CEC). International standards are established by such organizations as, the International Code Council (ICC) and the International Association of Plumbing and Mechanical Officials (IAPMO). Many of thesethe codes and standards are incorporated into state and municipal plumbing and heating, building and fire protection codes.
National regulatory standards in Europe vary by country. The major standards and/or guidelines that our products must meet are AFNOR (France), DVGW (Germany), UNI/ICIM (Italy), KIWA (Netherlands), SVGW (Switzerland), SITAC (Sweden), WRAS (United Kingdom) and CEN (Denmark). Further, there are local regulatory standards requiring compliance as well.
We have consistently advocatedadvocate for the development and enforcement of plumbing codes. We maintain stringent quality controlcodes and testing procedures at each of our manufacturing facilities in order to manufacture products that comply with code requirements. We believe that product‑testing capability and investment in plant and equipment are needed to manufacture products that comply with code requirements.standards. Our product-testing capabilities and dedicated investments are areas of strength for us. Manufacturing operations consistently maintain stringent quality control and testing procedures, thus ensuring products remain in continuous compliance with all requirements. Investment in product-testing capability and in plant and equipment also ensures ongoing continuous product compliance. Additionally, a majority of our manufacturing facilities are ISO 9000, 9001 or 9002 certified by the International Organization for Standardization.
Watts also proactively monitors and participates in regulatory, codes and standards development activities with the various aforementioned entities and others. We are a primary participating member of the U.S.-based voluntary industry association American Supply Association (ASA), which provides its members with industry information and coordinates resources for addressing regulatory issues and developing and maintaining codes and standards. Watts is also a member of the Canadian Institute of Plumbing and Heating (CIPH), which provides a similar function and benefit as ASA by monitoring and advocating on behalf of its members on various legislative and regulatory issues.
New Product Development and Engineering
We retain our own product development staff, design teams, and testing laboratories in the Americas, Europe and APMEA that work to enhance our existing products and develop new products and solutions with a focus on sustainable customer-centric technological innovation and smart and connected solutions. We maintain sophisticated product development and testing laboratories and are committedcontinue to investing moreinvest in this area.our smart and connected product pipeline. We haveemploy a global new-product development programprocess that is used globally to drive, manageprioritize, guide and invest in innovation and product offerings. In 2016 and 2017,support new projects. Over the years, we have continued to drivebring innovation to our markets, includingwith the successful roll outcontinued expansion of our IntelliStation® smart mixing system with the new Connected IntelliStation Junior enhancing energy savings and safety. We also continue to focus on
smart leak detection and prevention solutions for both residential and commercial applications and recently launched our Connected IntelliFlow® Washing Machine flood prevention system and ACV Assure™ Municipal Water Monitoring System solution. Our new Lync® brand offers expertly designed and pre-assembled commercial water technology system solutions improving efficiency, safety and water quality while minimizing planning, design and installation time. Our Aegis® brand delivers natural, non-toxic refrigerant-grade CO2, making Lync’s Aegis electric heat pumps one of the IntelliStation™ smart
mixingthe world’s first hot water wellness solutions with multi-barrier pathogen mitigation. We have expanded our sustainability focused product offerings in Europe, driving energy efficiency with the launch of our Vision® wired and recirculation systemwireless thermostats. As we continue to expand development in APMEA, we launched a Chinese version of our successful IntelliStation Senior, significantly enhancing user experience and providing a competitive advantage in the AERCO Benchmark® Platinum boiler.China market. In 2018Australia, we launched the IntelliStation Jr™ digital mixing valveSS009 backflow to further our digital mixinghelp grow the strategic commercial market.
In 2021, we launched 21 new smart and connected product lines as well as a number of new drains products (cast iron and stainless steel).offerings. We continuedwill continue to focus on and invest in our global new product development program to leverage new technologies, inhouse expertise and our electronics capabilities to driveexpand our Smartsmart and Connected Strategy.connected strategy.
Competition
The domestic and international markets for energy efficient products, water conservation devices, and products that address the safety &and regulation for the flow of fluids, are intensely competitive and require us to compete against some companies possessing greater financial, marketing and other resources than ours. Due to the breadth of our product offerings, the number and identities of our competitors vary by product line and market. We consider quality, brand preference, delivery times, engineering specifications, plumbing code requirements, price, technological expertise, breadth of product offerings and integratedsmart and connected products and solutions offerings to be the primary competitive factors. We believe that new product development and product engineering are also important to success in the water industry and that our position in the industry is attributable in part to our ability to develop new and innovative products quickly and to adapt and enhance existing products. We continue to develop new and innovative products to enhanceexpand our market position and are continuing to implementimplementing manufacturing and design programs to reduce costs. We cannot be certain that our efforts to develop new products will be successful or that our customers will accept our new products. Although we own certain patents and trademarks that we consider to be of importance, we do not believe that our business and competitiveness as a whole are dependent on any one of our patents or trademarks or on patent or trademark protection generally.
BacklogHuman Capital Management
Backlog was approximately $103.2 million at January 27, 2019 and approximately $86.3 million at January 28, 2018. We do not believe that our backlog at any point in time is indicative of future operating results and we expectemployees are our entire current backlog to be converted to sales in 2019.
Employees
greatest asset. As of December 31, 2018,2021, we employed approximately 4,800 people worldwide. With the exception of two subsidiaries, one in Canada and the other in New York, none of ourhad 4,597 employees globally, including 2,063 in the Americas, or APMEA2,239 in Europe and 295 in APMEA. At Watts, hiring the right talent is only the beginning. By developing and promoting our talented people, we are covered by collective bargaining agreements. In some European countries,creating value for our customers and shareholders today, while advancing our Environmental, Social, and Corporate Governance (“ESG”) goals. As the economy and our business grow, so does the need for qualified candidates; hence we are always competing for talent in an environment of increasingly challenged supply. To that end, we have developed, and continue to enhance and refine, a robust and comprehensive talent management strategy that spans from talent attraction to performance management, career development and retention of our top talent and, ultimately, to succession planning across our organization. We continually strive to cultivate and support a highly engaged and productive workforce.
Talent Acquisition
| ● | Recruitment efforts follow a defined Talent Acquisition process. |
| ● | We provide a robust college internship program to identify and potentially cultivate an early career pipeline of talent. |
| ● | We are actively engaging with a select group of historically Black colleges and universities to help attract and recruit diverse professionals. |
| ● | We engage with external professional recruiting firms to supplement our internal recruiting efforts as needed. |
Professional Development
| ● | iLead Program. The iLead Program is our flagship program designed to build the skills of our manager level employees. It includes a series of training programs tailored to reach and serve a broad range of current and potential leaders across the organization. |
| ● | One Watts Performance System (OWPS) Training Program.We want to make sure all employees are aligned with our operating philosophies and principles. Alignment helps us identify and eliminate waste and simplify and standardize our work, resulting in more productivity to fund our future. We have launched a global training program educating all employees on our philosophies and principles, empowering them to use OWPS tools in their daily work. |
| ● | LinkedIn Learning Curriculum.We provide a comprehensive suite of online LinkedIn Learning courses to supplement our management development training by providing employees with relevant training on specialized topics to fill in knowledge and experience gaps. |
Engagement and Performance Management
| ● | Senior Leader Communication and Transparency.We actively seek opportunities for regular engagement and communication by our CEO and other senior executive leaders with our broader employee population. For example, we hold a Quarterly Connect Meeting that follows the release of our quarterly earnings and is accessible to thousands of employees across the Company. |
| ● | Employee Engagement Surveys.We periodically conduct confidential company-wide employee engagement surveys. Feedback from these surveys provides our management team with valuable information about our workplace culture. Survey results are also reviewed with our Board and used to develop and refine other aspects of our overall human capital management and other growth strategies. During 2021, 82% of our employees participated in our global employee engagement survey, providing us with valuable feedback that we have used to create action plans for improving our workplace environment. |
| ● | Performance Management Framework.We maintain a robust annual performance management process across the organization. Together with their managers, employees start the process by setting goals; year-end activities begin with employee self-assessments and conclude with a conversation led by the manager on goal accomplishment and defined core competencies. |
| ● | Safety. Employee safety is one of our highest priorities and we strive for zero hazards and zero injuries by educating and training employees on safety best practices through awareness campaigns and related engagement initiatives. |
Diversity, Equity & Inclusion
An integral part of our mission to build a high performance, values-driven culture is creating an inclusive culture that welcomes and celebrates diversity. Our path to innovation starts and ends with our employees, who are subjectfundamental to traditional national collective bargaining agreements. the vibrancy and success of Watts. Everything we accomplish depends on creating an environment that is engaging and supportive and enables employees to perform to their potential. This is why we have initiated a comprehensive approach to diversity, equity and inclusion focusing on awareness and education programs for our leaders and employees; monitoring engagement through employee survey feedback; creating awareness with our employees about diversity, equity and inclusion topics through our company intranet, in employee meetings and on our public website; and improving our hiring and leadership development processes to increase diversity, equity and inclusion at all levels at Watts. We have also encouraged the visibility of diverse employees through the recent formation of employee resource groups, which are voluntary employee-led groups that provide a forum for employees to share common interests and experiences, gain professional development support, engage with our leadership teams, and drive initiatives to improve diversity, equity and inclusion at Watts.
Sustainability
Commitment to Sustainability
We have demonstrated our commitment to environmental sustainability by reducing our impact on the environment in multiple areas of our global business and by providing innovative products and solutions that enable our customers to reduce their impact on the environment. We are also focused on building a sustainable company by adhering to
responsible business practices, prioritizing employee safety and providing our employees with opportunities for personal and professional growth, including through programs and initiatives to promote diversity, equity and inclusion. We also strive to have a positive impact on the communities in which we live and work and other communities in need through community involvement, educational partnerships and charitable giving.
Sustainability Leadership
Our Board of Directors has overall authority and responsibility for our sustainability efforts, as set forth in our Corporate Governance Guidelines. In addition to general Board oversight, our Nominating and Corporate Governance Committee is primarily responsible for oversight of governance matters, the Compensation Committee is responsible for oversight of human capital issues and the Audit Committee is responsible for oversight of our corporate ethics and compliance program. At the management level, our General Counsel and Chief Sustainability Officer, who reports directly to our Chief Executive Officer, has general oversight responsibility for all sustainability matters. Our General Counsel and Chief Sustainability Officer also chairs our global Sustainability Steering Committee, which is made up of senior company leaders and is responsible for formulating our sustainability strategy and overseeing the execution of our environmental, social and governance initiatives.
Sustainability Strategy
The materiality principle is one of the core principles of the Global Reporting Initiative (GRI). In order to address the principle of materiality, a company should undertake a process of identifying its key material topics that have the greatest financial, environmental and social impact on its business, as well as those topics regarded as highly important by its key internal and external stakeholder groups. In 2021, we conducted a sustainability materiality assessment with the assistance of an external consultant. The results of that assessment were used by the Sustainability Steering Committee to identify our key focus areas and from there to build a strategy to address the material environmental, social and governance topics identified by the materiality assessment.
Environmental Stewardship
We have made substantial progress in minimizing the environmental impact of our operations. Recent initiatives have resulted in a reduction on our global water consumption and our greenhouse gas emissions, including through the implementation of smart monitoring systems in many of our high water use facilities to promote early leak and surge detection and investments in various energy reduction projects. With respect to our product handprint, we provide a portfolio of products, components and systems that conserve water, save energy, reduce waste and preserve water quality and safety. In addition, our goal is to embed sustainability throughout the lifecycle of our products with our goal being to create safe, efficient, long-lasting products made with high-recycling-value materials wherever possible.
Social Responsibility
We are committed to creating both economic and social value and strive to have a positive impact on our global community. During 2021, we supported those in need through donations of money and products to several non-profit charitable organizations and through the volunteer efforts of our employees. One example was our ongoing partnership with the Planet Water Foundation. During 2021, we worked with Planet Water to fund the construction of six AquaTowers and AquaSan systems, which provide clean, safe drinking water for up to 10,800 people in Cambodia, India, Mexico, the Philippines and Vietnam.
Governance, Business Ethics, and Compliance
We believe that good corporate governance and an environment of high ethical standards are important for us to achieve business success and to create value for our employee relations are good.stockholders. Our Board is committed to high governance standards and continually works to improve them. We periodically review our corporate governance policies and practices and compare them to those suggested by various authorities on corporate governance and employed by other public companies and consider changes to our corporate governance policies and practices in light of such guidance and interpretations. We have adopted a Code of Business Conduct applicable to all officers, employees and Board members worldwide that serves as the foundation for our ethics and compliance program, and drives policy development, training initiatives, and reinforcement of our values throughout the global organization.
Recognition
In 2021, we were recognized for the third year in a row as one of Newsweek’s Most Responsible Companies. We placed 100th overall in the Newsweek rankings and 5th within our industry classification.
More information about our sustainability efforts is included in our latest Sustainability Report, available at https://investors.wattswater.com/sustainability. The material in our Sustainability Report is for informational purposes only and is not included as part of, or incorporated by reference into, this Annual Report on Form 10-K.
Product Liability, Environmental and Other Litigation Matters
We are subject to a variety of potential liabilities connected with our business operations, including potential liabilities and expenses associated with possible product defects or failures and compliance with environmental laws. We maintain product liability and other insurance coverage, which we believe to be generally in accordance with industry practices. Nonetheless, such insurance coverage may not be adequate to protect us fully against substantial damage claims. See “Item 1A. Risk Factors” and Note 1615 of the Notes to the Consolidated Financial Statements, both of which are incorporated herein by reference.
Environmental Remediation
We have been named as a potentially responsible party with respect to a limited number of identified contaminated sites. The levels of contamination vary significantly from site to site as do the related levels of remediation efforts. Environmental liabilities are recorded based on the most probable cost, if known, or on the estimated minimum cost of remediation. Accruals are not discounted to their present value, unless the amount and timing of expenditures are fixed and reliably determinable. We accrue estimated environmental liabilities based on assumptions, which are subject to a number of factors and uncertainties. Circumstances that can affect the reliability and precision of these estimates include identification of additional sites, environmental regulations, level of clean‑upclean-up required, technologies available, number and financial condition of other contributors to remediation and the time period over which remediation may occur. We recognize changes in estimates as new remediation requirements are defined or as new information becomes available. See Note 16 of the Notes to the Consolidated Financial Statements. See “Item 1A. Risk Factors” and Note 1615 of the Notes to the Consolidated Financial Statements, both of which are incorporated herein by reference.
Asbestos Litigation
We are defending approximately 300400 lawsuits in different jurisdictions, alleging injury or death as a result of exposure to asbestos. The complaints in these cases typically name a large number of defendants and do not identify any of our particular products as a source of asbestos exposure. To date, discovery has failed to yield evidence of substantial exposure to any of our products and no judgments have been entered against us.
Other Litigation
Other lawsuits and proceedings or claims, arising from the ordinary course of operations, are also pending or threatened against us.
Available Information
We maintain a website with the address www.wattswater.com. The information contained on our website is not included as a part of, or incorporated by reference into, this Annual Report on Form 10‑K.10-K. Other than an investor’s own internet access charges, we make available free of charge through our website our Annual Report on Form 10‑K,10-K, quarterly reports on Form 10‑Q10-Q and current reports on Form 8‑K,8-K, and amendments to these reports, as soon as reasonably practicable after we have electronically filed such material with, or furnished such material to, the Securities and Exchange Commission (SEC).
Information about Our Executive Officers and Directors
Set forth below are the names of our executive officers and directors, their respective ages and positions with our Company and a brief summary of their business experience for at least the past five years:
| | | | |
Executive Officers |
| Age |
| Position |
Robert J. Pagano, Jr. | | 5659
| | Chief Executive Officer, President, Chairperson of the Board and Director |
Shashank Patel | | 5861
| | Chief Financial Officer |
Jennifer L. CongdonMonica Barry
| | 4951
| | Chief Human Resources Officer |
Kenneth R. Lepage | | 4851
| | General Counsel, Executive Vice PresidentChief Sustainability Officer & Secretary |
Elie A. Melhem | | 5558
| | President, Asia‑Pacific,Asia-Pacific, the Middle East & Africa |
Munish Nanda | | 5457
| | President, Americas & Europe |
Non‑EmployeeNon-Employee Directors
| | | | |
Christopher L. Conway(2)(3) | | 6366
| | Director |
Michael J. Dubose(2)(3) | | 66 | | Director |
David A. Dunbar(1)(3) | | 5760
| | Director |
Louise K. Goeser(2)(3) | | 6568
| | Director |
Jes Munk Hansen(2)(3) | | 5154
| | Director |
W. Craig Kissel(3) | | 6871
| | Chairman of the Board andLead Independent Director
|
Joseph T. Noonan | | 3740
| | Director |
Merilee Raines(1)(3) | | 6366
| | Director |
Joseph W. Reitmeier(1)(3) | | 5457
| | Director |
| (1) | (1)
| | Member of the Audit Committee |
| (2) | (2)
| | Member of the Compensation Committee |
| (3) | (3)
| | Member of the Nominating and Corporate Governance Committee |
Robert J. Pagano, Jr. has served as Chief Executive Officer, President and a director of our Company since May 2014.2014 and as Chairperson of the Board of Directors since February 2022. He also served as interim Chief Financial Officer from October 2014 to April 2015 and from April 2018 to July 2018. Mr. Pagano previously served as Senior Vice President of ITT Corporation and President, ITT Industrial Process from April 2009 to May 2014. Mr. Pagano originally joined ITT in 1997 and served in several additional management roles during his career at ITT, including as Vice President Finance, Corporate Controller, and President of Industrial Products.
ITT Corporation is a diversified manufacturer of highly engineered critical components and customized technology solutions for the energy, transportation and industrial markets. Prior to joining ITT, Mr. Pagano worked at KPMG LLP. Mr. Pagano is a Certified Public Accountant. Mr. Pagano has also served as a member of the Board of Directors of Applied Industrial Technologies, Inc. since August 2017. Applied Industrial Technologies is a distributor of bearings, power transmission products, fluid power components and other industrial supplies and provides engineering, design and systems integration for industrial and fluid power applications, as well as customized mechanical, fabricated rubber and fluid power shop services.
Shashank Patel has served as Chief Financial Officer of our Company since July 2018. Mr. Patel previously worked at Xylem Inc. from the time of its spin-off from ITT Corporation in 2011 until June 2018. While at Xylem, Mr. Patel served as Vice President, Finance for Xylem Applied Water Systems, Dewatering and the America’s Commercial Team from July 2017 to June 2018, Integration Leader for the Sensus business from August 2016 to June 2017, Vice President, Finance for Global Operations from April 2016 to July 2016, Interim Chief Financial Officer of Xylem from July 2015 to March 2016, and Vice President, Finance for the Applied Water Systems division from 2011 to July 2015. Mr. Patel also served in several leadership roles in finance, operations and engineering at ITT from 1996 until the spin-off of Xylem in 2011. Xylem is a global designer, manufacturer and equipment and service provider for water and wastewater applications. Mr. Patel has served as a member of the Board of Directors of Federal Signal Corporation since October 2021. Federal Signal Corporation designs, manufactures and supplies a suite of products and integrated solutions for municipal, governmental, industrial and commercial customers.
Monica Barry has served as Chief Human Resources Officer since December 2016.October 2021. Ms. CongdonBarry previously served as Vice President, Talent Management, Organizational Development and Corporate Human Resources Applied Water Systems and Business Transformation and Continuous ImprovementPartner with Xylem Inc.Colfax Corporation from August 2012February 2020 to December 2016. XylemSeptember 2021. Colfax is a global designer, manufacturerdiversified technology company that provides specialty medical technologies and equipmentfabrication technology products and service provider for waterservices. Ms. Barry served as Vice President, Global Talent, Learning & Development and wastewater applications. From 2010Inclusion from July 2015 to August 2012, Ms. Congdon servedJanuary 2020 and as Vice President, Human Resources, Power TransmissionHealth Sector from August 2012 to October 2015 for Rexnord Corporation. Rexnord CorporationJohnson Matthey, PLC. Johnson Matthey is a multi-industry manufacturerprovider of catalyst systems for emission control within vehicles, products and marketerprocessing services for the efficient use and transformation of highly engineered mechanical power transmission componentsnatural resources, active pharmaceutical ingredients for a variety of treatments and water management products.drugs, and emerging opportunities in battery materials and fuel cells. From 20042010 to 2012, Ms. Barry served as Director Human Resources, North America Supply Chain & Labor Relations for The Campbell Soup Company. Prior to 2010, Ms. CongdonBarry held several human resources and operations management positions of increasing responsibility with Honeywell International Inc. Prior to joining Honeywell, Ms. Congdon was a Human Resources Manager with Cisco Systems, Inc. and worked as a human resources consultant.FMC Corporation.
Kenneth R. Lepage has served as General Counsel Executive Vice President and Secretary of the Company since August 2008. He2008 and as Chief Sustainability Officer since May 2021. Mr. Lepage also previously served as Executive Vice PresidentChief Human Resources Officer of Human Resourcesthe Company from April 2020 to October 2021 and from December 2009 to October 2015. Mr. Lepage originally joined ourthe Company in September 2003 as Assistant General Counsel and Assistant Secretary. Prior to joining ourthe Company, heMr. Lepage was a junior partnerJunior Partner at the law firm of Hale and Dorr LLP (now Wilmer Cutler Pickering Hale and Dorr LLP).
Elie A. Melhem has served as President, Asia Pacific, Middle East & Africa since February 2016. Mr. Melhem originally joined our Company in July 2011 as President, Asia Pacific. Mr. Melhem was previously the Managing Director of China for Ariston Thermo Group, a global manufacturer of heating and hot water products, from 2008 to July 2011. Prior to joining Ariston, Mr. Melhem spent eleven years with ITT Industries in China where he held several management positions, including serving as President of ITT’s Residential and Commercial Water Group in China and President of ITT’s Water Technology Group in Asia.
Munish Nanda has served as President, Americas & Europe since February 2016. Mr. Nanda originally joined our Company in April 2015 as President, Americas. Mr. Nanda previously served as President of Control Technologies for ITT Corporation from April 2011 to March 2015. Mr. Nanda also served as Group Vice President of ITT Corporation’s Fluid and Motion Control Group from April 2008 to April 2011. ITT Corporation is a diversified manufacturer of highly engineered critical components and customized technology solutions for the energy, transportation and industrial markets. Prior to joining ITT Corporation, Mr. Nanda held several operating leadership and general management positions with Thermo Fisher Scientific Corporation and Honeywell International Inc. Mr. Nanda has also served as a member of the Board of Directors of CECO Environmental Corp. since June 2018. CECO Environmental provides air quality and fluid handling products and solutions serving the energy, industrial and other niche markets.
Christopher L. Conway has served as a director of our Company since June 2015. Mr. Conway was President, Chief Executive Officer and Chairman of the Board of CLARCOR Inc. from December 2011 until it was acquired in February 2017. Mr. Conway is now retired. Mr. Conway originally joined CLARCOR in 2006 and served in several senior management roles prior to becoming President and Chief Executive Officer, including Chief Operating Officer, President of CLARCOR’s PECOFacet division, President of Facet USA, Inc., an affiliate of CLARCOR, and Vice President of Manufacturing of Baldwin Filters, Inc., another affiliate of CLARCOR. CLARCOR was a diversified
marketer and manufacturer of mobile, industrial and environmental filtration products sold in domestic and international markets. Prior to joining CLARCOR, Mr. Conway served for two years as the Chief Operating Officer of Cortron Corporation, Inc., a manufacturing start-up based in Minneapolis, Minnesota. Mr. Conway also served for seven years in various management positions at Pentair, Inc., an international provider of products, services, and solutions for its customers' diverse needs in water and other fluids, thermal management, and equipment protection.protection.
Michael J. Dubose has served as a director of our Company since December 2020. Mr. Dubose has served as President of the Fisher Healthcare Division of Thermo Fisher Scientific Inc. since March 2019. Thermo Fisher Scientific engages in the provision of analytical instruments, equipment, reagents and consumables, software and services for research, analysis, discovery, and diagnostics. Mr. Dubose previously served as Vice President of National Accounts and Cross Border Business Globally for W.W. Grainger, Inc. from 2010 to March 2019. W. W. Grainger is a leading broad line supplier of maintenance, repair and operating (MRO) products, with operations primarily in North America, Japan and Europe. Prior to this position, he served as a Regional Vice President of Staples, Inc. from 2008 to 2010. Prior to 2008, Mr. Dubose held senior management positions with Corporate Express Inc., Alliant Foodservice Inc. and Baxter International Inc.
David A. Dunbar has served as a director of our Company since February 2017. Mr. Dunbar has served as President and Chief Executive Officer and a member of the Board of Directors of Standex International Corporation since January 2014, and as Chairman since October 2016. Standex is a global, multi-industry manufacturer incomprised of five broad business segments: Food Service Equipment Group,segments of Electronics, Engraving, Scientific, Engineering Technologies Group, Engraving Group, Electronics Group, and Hydraulics Group.Specialty Solutions. Mr. Dunbar previously served as President of the valves and controls global business unit of Pentair Ltd. from October 2009 to December 2013. The unit was initially owned by Tyco Flow Control and Tyco Flow Control and Pentair merged in 2012. Pentair is a global provider of products and services relating to energy, water, thermal management and equipment protection. Prior to his tenure at Pentair, Mr. Dunbar held a number of senior positions at Emerson Electric Co., including President of each of the following: Emerson Process Management Europe; Machinery Health Management; and Emerson Climate Technologies Refrigeration.
Louise K. Goeser
has served as a director of our Company since March 2018. Ms. Goeser served as President and Chief Executive Officer of Grupo Siemens S.A. de C.V. from March 2009 until her retirement in May 2018. In this position, Ms. Goeser was responsible for Siemens Mesoamérica, which is the Mexican, Central American and Caribbean unit of multinational Siemens AG, a global engineering company operating in the industrial, energy and healthcare sectors. Ms. Goeser previously served as President and Chief Executive Officer of Ford of Mexico from January 2005 to November 2008. Prior to this position, she served as Vice President, Global Quality for Ford Motor Company from 1999 to 2005. Prior to 1999, Ms. Goeser served as General Manager, Refrigeration and Vice President, Corporate Quality at Whirlpool Corporation and held various leadership positions with Westinghouse Electric Corporation. Ms. Goeser has served as a member of the Board of Directors of MSC Industrial Direct Co., Inc. since December 2009. MSC is a North American distributor of metal working and maintenance, repair, and operations products and services. Ms. Goeser previously served as a member of the boards of directors of Talen Energy from June 2015 to December 2016, PPL Corporation from March 2003 to June 2015, and Witco Corporation from 1997 to 1999.
Jes Munk Hansen has served as a director of our Company since February 2017. He most recentlyMr. Hansen joined Terma A/S in April 2019 and became President and Chief Executive Officer of Terma on June 1, 2019. Terma develops and manufactures mission-critical products and solutions for the aerospace, defense and security sectors. Prior to Terma, Mr. Hansen served as Chief Executive Officer of OSRAM USA and Head of Global Sales for OSRAM GmbH from July 2018 to January 2019. OSRAM is a global lighting manufacturer with a portfolio ranging from high-tech applications based on semiconductor technology to smart and connected lighting solutions in buildings and cities. It has been announced that Mr. Hansen will join Terma A/S on April 1, 2019 and become President and Chief Executive Officer of Terma effective June 1, 2019. Terma develops and manufactures mission-critical products and solutions for the aerospace, defense and security sectors. Mr. Hansen previously served as Chief Executive Officer of LEDVANCE GmbH from July 2015 to December 2017. LEDVANCE is the general lighting lamps business unit of OSRAM GmbH. Prior to his tenure at LEDVANCE, Mr. Hansen served as Chief Executive Officer of the classical lamps and ballast business unit of OSRAM from January 2015 to July 2015 and as Chief Executive Officer of OSRAM Americas and President of OSRAM Sylvania from October 2013 to January 2015. Prior to his tenure at OSRAM, Mr. Hansen served in several senior management roles with Grundfos from 2000 to October 2013, including as Chief Executive Officer and President of Grundfos North America from 2007 to October 2013. Grundfos is a leading global manufacturer of pumps as well as motors and electronics for monitoring and controlling pumps.
W. Craig Kissel has served as a director of our Company since October 2011. Mr. Kissel has served as Lead Independent Director of our Board of Directors since February 2022 and served as the Chairperson of our Board of Directors from October 2014 to February 2022. Mr. Kissel previously was employed by American Standard Companies Inc. from 1980 until his retirement in September 2008. American Standard was a leading worldwide supplier of air conditioning and heating systems, vehicle control systems, and bathroom china and faucet ware. During his time at American Standard, Mr. Kissel served as President of Trane Commercial Systems from 2004 to June 2008, President of WABCO Vehicle Control Systems from 1998 to 2003, President of the Trane North American Unitary Products Group from 1994 to 1997, Vice President of Trane Marketing of the North American Unitary Products Group from 1992 to 1994 and held various other management positions at Trane from 1980 to 1991. From 2001 to 2008, Mr. Kissel served as Chairman of American Standard’s Corporate Ethics and Integrity Council, which was responsible for developing the company’s ethical business standards. Mr. Kissel also served in the U.S. Navy from 1973 to 1978. Mr. Kissel served as a director of Chicago Bridge & Iron Company from May 2009 until its merger with McDermott International, Inc. in May 2018 and then Mr. Kissel has served as a member of the board of directors of
McDermott International since the merger.until June 2020. McDermott International is a global provider of technology, engineering and construction solutions for the energy industry.
Joseph T. Noonan
has served as a director of our Company since May 2013. Mr. Noonan is currently an active entrepreneur,angel investor and start-up advisor. advisor to consumer, software and technology-enabled companies. Mr. Noonan served as Founder and Chief Executive Officer of Linger Home, Inc., a direct-to-consumer home textile brand, from August 2018 to January 2020.
From November 2013 to January 2018, Mr. Noonan served as Chief Executive Officer of Homespun Design, Inc., an online marketplace for American-made furniture and home accents. Mr. Noonan previously worked as an independent digital strategy consultant from November 2012 to November 2013. Mr. Noonan was employed by Wayfair LLC from April 2008 to November 2012. During his time at Wayfair, Mr. Noonan served as Senior Director of Wayfair International from June 2011 to November 2012, Director of Category Management and Merchandising from February 2009 to June 2011 and Manager of Wayfair’s Business-to-Business Division from April 2008 to February 2009. Wayfair is an online retailer of home furnishings, décor and home improvement products. Prior to joining Wayfair, Mr. Noonan worked as a venture capitalist at Polaris Partners and as an investment banker at Cowen & Company.
Merilee Raines has served as a director of our Company since February 2011. Ms. Raines served as Chief Financial Officer of IDEXX Laboratories, Inc. from October 2003 until her retirement in May 2013. Prior to becoming Chief Financial Officer, Ms. Raines held several management positions with IDEXX Laboratories, including Corporate Vice President of Finance, Vice President and Treasurer of Finance, Director of Finance, and Controller. IDEXX Laboratories develops, manufactures and distributes diagnostic and information technology basedtechnology-based products and services for companion animals, livestock, poultry, water quality and food safety, and human point of care diagnostics. Ms. Raines served as a member of the Board of Directors of Affymetrix, Inc., a provider of life science and molecular diagnostic products that enable analysis of biological systems at the gene, protein and cell level, from January 2015 until it was acquired in March 2016. Ms. Raines is currentlyalso served as a member of the Board of Directors of Aratana Therapeutics, Inc., a pet therapeutics company focused on licensing, developing and commercializing biopharmaceutical products for companion animals.animals, from February 2014 until it was acquired in July 2019. Ms. Raines also servesserved as a member of the Board of Directors of Benchmark Electronics, Inc., a worldwide provider of engineering services, integrated technology solutions and electronic manufacturing services.services from May 2018 to June 2021. Ms. Raines has served as a member of the Board of Directors of TransMedics Group, Inc., a medical technology company providing novel systems for the preservation and transport of organs to be used for transplant, since January 2021. Ms. Raines has also served as a member of the Board of Directors of Ocular Therapeutix, Inc., a biopharmaceutical company focused on the formulation, development and commercialization of innovative therapies for diseases and conditions of the eye, since September 2021.
Joseph W. Reitmeier has served as a director of our Company since February 2016. Mr. Reitmeier has served as Executive Vice President & Chief Financial Officer of Lennox International Inc. since July 2012. Mr. Reitmeier had served as Vice President of Finance for the LII Commercial business segment of Lennox International from 2007 to July 2012 and as Director of Internal Audit from 2005 to 2007. Lennox International is a leading global provider of climate control solutions and designs, manufactures and markets a broad range of products for the heating, ventilation, air conditioning and refrigeration markets. Before joining Lennox International, Mr. Reitmeier held financial leadership roles at Cummins Inc. and PolyOne Corporation.
Item 1A. RISK FACTORS.FACTORS.
Industry Risk Factors
Economic cycles, particularly those involving reduced levels of commercial and residential starts and remodeling, may have adverse effects on our revenues and operating results.
We have experienced and expect to continue to experience fluctuations in revenues and operating results due to economic and business cycles. The businesses of most of our customers, particularly plumbing and heating wholesalers and OEM manufacturers, are cyclical. Therefore, the level of our business activity has been cyclical, fluctuating with economic cycles. An economic downturn may also affect the financial stability of our customers, which could affect their ability to pay amounts owed to their vendors, including us. We also believe our level of business activity is influenced by commercial and residential starts and renovation and remodeling, which are, in turn, heavily influenced by interest rates, consumer debt levels, changes in disposable income, employment growth and consumer confidence. Credit market conditions may prevent commercial and residential builders or developers from obtaining the necessary capital to continue existing projects or to start new projects. This may result in the delay or cancellation of orders from our customers or potential customers and may adversely affect our revenues and our ability to manage inventory levels, collect customer receivables and maintain profitability. If economic conditions worsen in the future, or if economic recovery were to dissipate, our revenues and profits could decrease or trigger additional goodwill, indefinite‑livedindefinite-lived intangible assets, or long‑livedlong-lived asset impairments and could have a material effect on our financial condition and results of operations.
11The COVID-19 pandemic has adversely affected, and may continue to adversely affect, our business, financial condition, results of operations and prospects.
Future sales expansion or contraction may be dependent on the duration and severity of the evolving COVID-19 pandemic as well as a number of macroeconomic challenges caused by the pandemic, which could have a material adverse effect on our business, financial condition and results of operations. Global health concerns pertaining to COVID-19 and related government actions taken to reduce the spread of the virus continue to impact the economic environment and significantly increase economic uncertainty. The pandemic has caused governmental authorities to implement numerous measures to try to contain the virus, including ongoing travel restrictions, quarantines, and business limitations and shutdowns. The health and safety measures we’ve adopted to slow and limit the spread of the COVID-19 pandemic have resulted in reduced production capacity and, in some cases, required temporary closures of certain of our facilities, among other impacts. The duration of these measures is unknown, and they may be lifted, extended, or reinstated, and additional measures may be imposed due to new outbreaks and variants of COVID-19 in various regions. The measures imposed have resulted in supply chain disruption, volatility in demand and higher absenteeism in our manufacturing facilities. There remains a risk of future employee health concerns, and we cannot predict whether any of our manufacturing facilities will experience disruptions or how long such disruptions would last. While we are unable to predict the magnitude of such impact at this time, the loss of, or significant reduction in, purchases by our customers could materially impair our business, operating results, prospects and financial condition.
The reopening of global economies in 2021 created supply chain disruptions and inflationary pressures, and virus variants have caused labor shortages and the need for additional health and safety measures. These challenges could cause economic disruption and could have a material adverse effect on our business if customers reduce capital or overall spending and if the supply chain disruptions continue. The severity of the impact of the COVID-19 pandemic on our business will depend on a number of factors, including, but not limited to, the duration and severity of the pandemic and the extent and severity of the impact on our facilities, customers and suppliers, as well as the time it takes for normal economic and business conditions to resume, all of which are uncertain and cannot be predicted. We may also incur additional costs to remedy damages caused by business disruptions, performance delays or interruptions, payment delays, and defaults or bankruptcy of our third-party customers and suppliers, which could adversely affect our consolidated financial condition, liquidity and results of operations. The impact of the COVID-19 pandemic may also have the effect of heightening many of the other risks and uncertainties described in this “Risk Factors” section.
The extent of the effects of the COVID-19 pandemic on us remains uncertain and will depend on future developments, and such effects could exist for an extended period of time even after the pandemic ends. There is no guarantee that our efforts to mitigate the impact of COVID-19 will be effective.
The impact of supply chain and logistics disruptions may adversely affect our business and operations. Changes in the costs of raw materials and purchased components, including imposition of or changes in tariff rates, could reduce our profit margins. Reductions or interruptions in the supply of raw materials, components or finished goods from supply sources could adversely affect our ability to meet our customer delivery commitments.
Our products are made using various purchased components and raw materials, including primarily bronze, brass, cast iron, stainless steel, steel and plastic. Substantially all of the raw materials we require to manufacture our products are purchased from outside sources. The costs and availability of raw materials and components may be subject to change due to, among other things, interruptions in production by suppliers, changes in worldwide price, demand levels, exchange rates and imposition of or changes in tariff rates. We typically do not enter into long-term supply agreements. Our inability to obtain supplies of raw materials and purchased components for our products at favorable costs could have a material adverse effect on our business, financial condition or results of operations by decreasing our profit margins. Commodity prices, particularly copper and stainless-steel prices, have experienced tremendous volatility over the past several years. Should commodity costs or purchased component costs increase substantially, we may not be able to recover such costs, through selling price increases to our customers or other product cost reductions, which would have a negative effect on our financial results. If commodity costs or purchased component costs decline, we may experience pressure from customers to reduce our selling prices. Additionally, we continue to purchase components and finished goods from international sources. In limited cases, these components or finished goods are single-sourced. The availability of components and finished goods from international sources could be adversely impacted by, among other things, interruptions in production by suppliers including due to pandemics or other public health crises, suppliers’ allocations to other purchasers and new laws, tariffs or regulations.
As a global manufacturer and distributor, we are facing additional risks related to ongoing disruptions and increased costs in our supply chain and logistics, including:
| ● | Short-term or sustained increases in market demand may exceed our suppliers’ production capacity or otherwise strain our supply chain. Our failure or our suppliers’ failure to meet the demand for raw materials and components could adversely affect our business and results of operations. |
| ● | We are currently experiencing supply shortages and inflationary pressures for certain components and raw materials, including but not limited to stainless steel and electronic components, such as semiconductors, that are important to our manufacturing processes. When facing supply-related challenges, we may increase our inventories and purchase commitments to shorten lead times and to help maintain adequate inventories to meet customer expectations. |
| ● | There is the possibility of supply chain normalization in 2022 which could result in inventory destocking in the channels we sell through. If destocking were to happen, it could adversely impact our financial results. |
| ● | Logistical disruptions with respect to container capacity on ships, port congestion and in-road trucking delays in shipping may cause us to have to use more expensive expedited freight or other costly methods to ship our products, as well as result in longer lead times for our customers. |
| ● | Illness, labor shortages, absenteeism, or other workforce disruptions could negatively affect our supply chain, manufacturing, distribution, or other business processes. We and our suppliers may face additional production disruptions in the future, which may place constraints on our ability to produce products in a timely manner or increase our costs. |
We face intense competition and, if we are not able to respond to competition in our markets, our revenues and profits may decrease.
Competitive pressures in our markets could adversely affect our competitive position, leading to a possible loss of market share or a decrease in prices, either of which could result in decreased revenues and profits. We encounter intense competition in all areas of our business. Additionally, we believe our customers are attempting to reduce the number of vendors from which they purchase in order to reduce the size and diversity of their inventories and their transaction costs. To remain competitive, we will need to invest continually in manufacturing, product development, marketing, customer service and support and our distribution networks. We may not have sufficient resources to continue to make such investments and we may be unable to maintain our competitive position. In addition, we may have to reduce the prices of some of our products to stay competitive, potentially resulting in a reduction in the profit margin for, and inventory valuation of, these products. Some of our competitors are based in foreign countries and have cost structures and prices in foreign currencies. Accordingly, currency fluctuations could cause our U.S. dollar costed products to be less competitive than our competitors’ products costed in other currencies.
Changes in the costs of raw materials, including the imposition of tariffs, could reduce our profit margins. Reductions or interruptions in the supply of components or finished goods from international sources could adversely affect our ability to meet our customer delivery commitments.
We require substantial amounts of raw materials, including bronze, brass, cast iron, stainless steel and plastic, and substantially all of the raw materials we require are purchased from outside sources. The costs of raw materials may be subject to change due to, among other things, interruptions in production by suppliers, changes in exchange rates, imposition of tariffs, and worldwide price and demand levels. We typically do not enter into long‑term supply agreements. Our inability to obtain supplies of raw materials for our products at favorable costs could have a material adverse effect on our business, financial condition or results of operations by decreasing our profit margins. The commodity markets have experienced tremendous volatility over the past several years, including the imposition of tariffs, particularly copper and stainless-steel. Should commodity costs increase substantially, we may not be able to recover such costs, through selling price increases to our customers or other product cost reductions, which would have a negative effect on our financial results. If commodity costs decline, we may experience pressure from customers to reduce our selling prices. Additionally, we continue to purchase increased levels of components and finished goods from international sources. In limited cases, these components or finished goods are single‑sourced. The availability of components and finished goods from international sources could be adversely impacted by, among other things, interruptions in production by suppliers, suppliers’ allocations to other purchasers and new laws, tariffs, or regulations.
We are subject to risks associated with changing technology, manufacturing techniques, distribution channels and business continuity, which could place us at a competitive disadvantage.
The successful implementation of our business strategy requires us to continually evolve our existing products and introduce new products to meet customers’ needs in the industries we serve. Ourserve, as evidenced by our investments in our smart and connected strategy. Many of our products are characterized by stringent performance and specification requirements that mandate a high degree of manufacturing, engineering, and engineeringtechnological expertise. If we fail to meet these requirements, or if our product offerings, including our smart and connected products, are not accepted by the market, our business could be at risk. We believe that our customers rigorously evaluate their suppliers on the basis of a number of factors, including product quality, price competitiveness, technical and manufacturing expertise, development and product design capability, new product innovation, reliability and timeliness of delivery, operational flexibility, customer service and overall management. Our success will depend on our ability to continue to meet customers’ changing specifications with respect to these criteria. We cannot ensure that we will be able to address technological advances or introduce new products that may be necessary to remain competitive within our business. We cannot ensure that we can adequately protect any of our technological developments to produce a sustainable competitive advantage. Furthermore, we may be subject to business continuity risk in the event of an unexpected loss of a material facility or operation. We cannot ensure that we adequately protect against such loss.
Economic and other risks associated with international sales and operations could adversely affect our business and future operating results.
Since we sell and manufacture our products worldwide, our business is subject to risks associated with doing business internationally. Our business and future operating results could be harmed by a variety of factors, including:
| ● | unexpected geo-political events in foreign countries in which we operate, which could adversely affect manufacturing and our ability to fulfill customer orders; |
| ● | our failure to comply with anti-corruption laws and regulations of the U.S. government and various international jurisdictions, such as the U.S. Foreign Corrupt Practices Act and the United Kingdom’s Bribery Act of 2010; |
| ● | trade protection measures and import or export duties or licensing requirements, which could increase our costs of doing business internationally; |
| ● | potentially negative consequences from changes in tax laws, which could have an adverse impact on our profits; |
| ● | difficulty in staffing and managing widespread operations, which could reduce our productivity; |
| ● | costs of compliance with differing labor regulations, especially in connection with restructuring our overseas operations; |
| ● | laws of some foreign countries, which may not protect our intellectual property rights to the same extent as the laws of the U.S.; |
| ● | unexpected changes in regulatory requirements, which may be costly and require time to implement; and |
| ● | foreign exchange rate fluctuations, which could also materially affect our reported results. A portion of our net sales and certain portions of our costs, assets and liabilities are denominated in currencies other than U.S. dollars. Approximately 38% of our net sales during the years ended December 31, 2021, and 37% of our net sales during the years ended December 31, 2020 and 2019 were from sales outside of the U.S. We cannot predict whether currencies such as the euro, Canadian dollar, Chinese yuan, or other currencies in which we transact will appreciate or depreciate against the U.S. dollar in future periods or whether future foreign exchange rate fluctuations will have a positive or negative impact on our reported results. |
Company Risk Factors
Our business and financial performance may be adversely affected by information technology and other business disruptions.
Our business may be impacted by disruptions, including information technology attacks or failures, threats to physical security, as well as damaging weather or other acts of nature, pandemics or other public health crises. nature. Our information technology risks relate to cyber security attacks and disruptions caused by potential failures in the performance of our primary enterprise resource planning (ERP) system.
Cyber security attacks, in particular, are evolving and include, but are not limited to, malicious software, attempts to gain unauthorized access to data, and other electronic security breaches that could lead to disruptions in systems, unauthorized release of
confidential or otherwise protected information and corruption of data. Cyber security may also be breached due to employee error, malfeasance, system errors or vulnerabilities, including vulnerabilities of our customers, distributors, vendors, suppliers, and their products. We currently have a larger percentage of our workforce working remotely due to the COVID-19 pandemic, which may heighten these risks. In addition, we have designed products and services that connect to and are part of the “Internet of Things” which may also be vulnerable to cyber security breaches. We attempt to provide adequate security measures to safeguard our products from cyber security attacks, however the potential for a breach remains. We have experienced cyber security attacks and may continue to experience them going forward, potentially with more frequency. In addition, cybersecurity and data privacy and protection laws and regulations are evolving and present increasing compliance challenges, which may increase our costs, affect our competitiveness and expose us to substantial fines or other penalties.
We also may experience unplanned system interruptions or outages of our primary ERP system as it continues to age, which may affect our ability to support and maintain the system in an effective manner. Any disruptions, delays or deficiencies related to our primary ERP system could lead to substantial business interruption, including our ability to perform routine business transactions, which could have a material adverse effect on our financial results.
Given the unpredictability of the timing, nature and scope of such disruptions, we could potentially be subject to production downtimes, operational delays, other detrimental impacts on our operations or ability to provide products to our customers, the compromising of confidential or otherwise protected information, misappropriation, destruction or corruption of data, security breaches, other manipulation or improper use of our systems, networks or our products, financial losses from remedial actions, loss of business or potential liability, and/or damage to our reputation, any of which could have a material adverse effect on our competitive position, results of operations, cash flows or financial condition.
We are currently a decentralized company, which presents certain risks.
We are currently a decentralized company, which sometimes places significant control and decision‑making powers in the hands of local management. This presents various risks such as the risk of being slower to identify or react to problems affecting a key business. Additionally, we are implementing in a phased approach a company‑wide initiative to standardize and upgrade our enterprise resource planning (ERP) systems. This initiative could be more challenging and costly to implement because divergent legacy systems currently exist. Further, if the ERP updates are not successful, we could incur substantial business interruption, including our ability to perform routine business transactions, which could have a material adverse effect on our financial results.
Changes in regulations or standards could adversely affect our business.
Our products and business are subject to a wide variety of statutory, regulatory and industry standards and requirements. A significant change to regulatory requirements, whether federal, foreign, state or local, or to industry standards, could substantially increase manufacturing costs, impact the size and timing of demand for our products, or put us at a competitive disadvantage, any of which could harm our business and have a material adverse effect on our financial condition, results of operations and cash flow.
Implementation of our acquisition strategy may not be successful, which could affect our ability to increase our revenues or our profitability.
One of our strategies is to increase our revenues and profitability and expand our business through acquisitions that will provide us with complementary products and solutions and increase market share for our existing product lines. We cannot be certain that we will be able to identify, acquire or profitably manage additional companies or successfully integrate such additional companies without substantial costs, delays or other problems. Also, companies acquired recently and in the future may not achieve anticipated revenues, cost synergies, profitability or cash flows that justify our investment in them. We have faced increasing competition for acquisition candidates, which has resulted in significant increases in the purchase prices of many acquisition candidates. This competition, and the resulting purchase price increases, may limit the number of acquisition opportunities available to us, possibly leading to a decrease in the rate of growth of our revenues and profitability. In addition, acquisitions may involve a number of risks, including, but not limited to:
| ·
● | | inadequate internal controlscontrol over financial reporting and our ability to bring such controls into compliance with the requirements of Section 404 of the Sarbanes‑OxleySarbanes-Oxley Act of 2002 in a timely manner; |
| ·
● | | adverse short‑termshort-term effects on our reported operating results; |
| ·
● | | diversion of management’s attention; |
| ·
● | | investigations of, or challenges to, acquisitions by competition authorities; |
| ·
● | | loss of key personnel at acquired companies; |
| ·
● | | unanticipated management or operational problems or legal liabilities; and |
| ·
● | | potential goodwill, indefinite‑livedindefinite-lived intangible assets, or long‑long- lived asset impairment charges. |
We are subject to risks related to product defects, which could result in product recalls and could subject us to warranty claims in excess of our warranty provisions or which are greater than anticipated due to the unenforceability of liability limitations.
We cannot be certain that our quality controls and procedures, including the testing of raw materials and safety testing of selected finished products, will reveal latent defects in our products or the materials from which they are made, which may not become apparent until after the products have been sold into the market. We also cannot be certain that our suppliers will always eliminate latent defects in products we purchase from them. Accordingly, there is a risk that product defects will occur, which could require a product recall. Product recalls can be expensive to implement and, if a product recall occurs during the product’s warranty period, we may be required to replace the defective product. In addition, a product recall may damage our relationship with our customers and we may lose market share with our customers. Our insurance policies may not cover the costs of a product recall.
Our standard warranties contain limits on damages and exclusions of liability for consequential damages and for misuse, improper installation, alteration, accident or mishandling while in the possession of someone other than us. We may incur additional operating expenses if our warranty provision does not reflect the actual cost of resolving issues related to defects in our products. If these additional expenses are significant, it could adversely affect our business, financial condition and results of operations.
We face risks from product liability and other lawsuits, which may adversely affect our business.
We have been and expect to continue to be subject to various product liability claims or other lawsuits, including, among others, that our products include inadequate or improper instructions for use or installation, inadequate warnings concerning the effects of the failure of our products, alleged manufacturing or design defects, or allegations that our products containedcontain asbestos. If we do not have adequate insurance or contractual indemnification, damages from these claims would have to be paid from our assets and could have a material adverse effect on our results of operations, liquidity and financial condition. Like other manufacturers and distributors of products designed to control and regulate fluids and gases, we face an inherent risk of exposure to product liability claims and other lawsuits in the event that the use of our products results in personal injury, property damage or business interruption to our customers. We cannot be certain that our products will be completely free from defect. In addition, in certain cases, we rely on third‑partythird-party manufacturers for our products or components of our products. We cannot be certain that our insurance coverage will continue to be available to us at a reasonable cost, or, if available, will be adequate to cover any such liabilities. For more information, see Item 1. Business—“Business—Product Liability, Environmental and Other Litigation Matters” and Note 1615 of the Notes to the Consolidated Financial Statements, both of which are incorporated herein by reference.
We face risks from costs for environmental compliance and/or to address potential liabilities under environmental laws and regulations.
Our operations and facilities worldwide are subject to laws and regulations related to pollution and the protection of the environment, health and safety, including, but not limited to those governing air emissions, discharges to water, the generation, handling, storage, treatment and disposal of hazardous wastes and other materials, and the remediation of contaminated sites. A failure by us to comply with applicable requirements or maintain the permits required for our operations could result in civil or criminal fines, penalties, enforcement actions, third-party claims for property damage and personal injury, requirements to clean up property or to pay for the costs of cleanup or regulatory or judicial orders enjoining or curtailing operations or requiring corrective measures, including the installation of pollution control equipment or remedial actions.
Certain environmental laws and regulations impose on present and former owners and operators of facilities and sites, and on potentially responsible parties (“PRPs”) for sites to which such parties may have sent waste for disposal, requirements to investigate and remediate contamination. Such liability can be imposed without regard to fault and, under certain circumstances, may be joint and several, resulting in one PRP being held responsible for the entire obligation. Liability may also include damages to natural resources. On occasion we are involved in such investigations and/or cleanup, and also have been orand could continue to be named as a PRP in environmental matters.
The discovery of additional contamination, including at acquired facilities, the imposition of more stringent environmental, health and safety laws and regulations, including cleanup requirements, or the insolvency, or other grounds for refusing to participate, of other responsible parties could require us to incur capital expenditures or operating costs materially in excess of our accruals. Future investigations we undertake may lead to discoveries of contamination that must be remediated, and decisions to close facilities may trigger remediation requirements that are not currently applicable. We may also face liability for alleged personal injury or property damage due to exposure to hazardous substances used or disposed of by us, contained within our current or former products, or present in the soil or groundwater at our current or former facilities. We could incur significant costs in connection with such liabilities. See Item 1. Business—“Business—Product Liability, Environmental and Other Litigation MattersMatters” and Note 1615 of the Notes to the Consolidated Financial Statements, both of which are incorporated herein by reference.
Climate change, and legislation or regulations addressing climate change, may have an adverse impact on our business and results of operations.
Economic
The impacts of climate change are highly unpredictable and vary depending on geographical location, but could include changing temperatures, droughts, water shortages, wildfires, changes in weather and rainfall patterns, changes in sea levels, and changing storm patterns and intensities. These impacts present several potential challenges to water and energy related products, such as potential degradation of water quality and changes in water conservation or energy efficiency requirements, particularly during periods of increased precipitation, flooding, or water shortages. Inclement weather and extreme weather events may have varying impacts on our business. Certain events may disrupt the operations of our customers, creating customer shutdowns that prevent or defer sales of our product, while other risks associated with international salesevents may drive increased demand for our products, which may create volatility in our financial results. Additionally, these events may disrupt our own operations and the operations couldof our suppliers, including the operation of manufacturing plants, the transportation of raw materials from our suppliers, and the transportation of products to our customers, any of which may increase our costs, reduce our productivity and adversely affect our business, financial condition, results of operations and future operating results.
Since we sellprospects. Additionally, concern over climate change may result in new or increased legal and manufactureregulatory requirements to reduce or mitigate the effects of climate change, including limitations on greenhouse gas emissions, which could increase our costs or require additional investments in our facilities and equipment. New legislation and regulatory requirements may also impact our customers and suppliers, which could affect demand for our products worldwide,or our ability to source key materials. In addition, our customers and suppliers may impose their own requirements with respect to climate change and greenhouse gas emissions. Any failure to comply with those requirements may also affect demand for our products or our ability to source key materials. Any failure to achieve our own goals with respect to reducing our impact on the environment, or any perception of a failure to act responsibly with respect to the environment or to effectively respond to regulatory requirements concerning climate change can lead to adverse publicity, resulting in an adverse effect on our business is subjector damage to risks associated with doing business internationally. Our business and future operating results could be harmed by a variety of factors, including:our reputation.
| ·
| | unexpected geo‑political events in foreign countries in which we operate, which could adversely affect manufacturing and our ability to fulfill customer orders;
|
| ·
| | our failure to comply with anti‑corruption laws and regulations of the U.S. government and various international jurisdictions, such as the U.S. Foreign Corrupt Practices Act and the United Kingdom’s Bribery Act of 2010;
|
| ·
| | trade protection measures and import or export duties or licensing requirements, which could increase our costs of doing business internationally;
|
| ·
| | potentially negative consequences from changes in tax laws, including the Tax Cuts and Jobs Act of 2017 (“2017 Tax Act”), which could have an adverse impact on our profits;
|
| ·
| | difficulty in staffing and managing widespread operations, which could reduce our productivity;
|
| ·
| | costs of compliance with differing labor regulations, especially in connection with restructuring our overseas operations;
|
| ·
| | laws of some foreign countries, which may not protect our intellectual property rights to the same extent as the laws of the U.S.;
|
| ·
| | unexpected changes in regulatory requirements, which may be costly and require time to implement; and
|
| ·
| | foreign exchange rate fluctuations, which could also materially affect our reported results. A portion of our sales and certain portions of our costs, assets and liabilities are denominated in currencies other than U.S. dollars. Approximately 38% of our sales during the year ended December 31, 2018 were from sales outside of the U.S. compared to 39% and 40% for the years ended December 31, 2017 and 2016, respectively. We cannot predict whether currencies such as the euro, Canadian dollar, Chinese yuan, or other currencies in which we transact will appreciate or depreciate against the U.S. dollar in future periods or whether future foreign exchange rate fluctuations will have a positive or negative impact on our reported results.
|
Our ability to achieve savings through our restructuring and business transformation activities may be adversely affected by management’s ability to fully execute the plans as a result of local regulations, geo‑politicalgeo-political risk or other factors within or beyond the control of management.
We have implemented a number of restructuring and business transformation activities, which include steps that we believe are necessary to enhance the value and performance of the Company, including reducing operating costs and increasing efficiencies throughout our manufacturing, sales and distribution footprint. Factors within or beyond the control of management, or factors beyond management’s control such as local labor regulations or legal or political intervention, may change the total estimated costs or the timing of when the savings will be achieved under the plans. Further, if we are not successful in completing the restructuring or business transformation activities timely or
if additional or unanticipated issues such as labor disruptions, inability to retain key personnel during and after the transformation or higher exit costs arise, our expected cost savings may not be met and our operating results could be negatively affected. In addition, our restructuring and transformation activities may place substantial demands on our management, which could lead to diversion of management’s attention from other business priorities and result in a reduced customer focus.
Our operating results could be negatively affected by changes in tax rates, the adoption of new tax legislation, or exposure to additional tax liabilities.
As a global company, we are subject to taxation in numerous countries, states and other jurisdictions. As a result, our effective rate is derived from a combination of applicable tax rates in the various places that we operate. Our future taxes could be affected by numerous factors including changes in the mix of our profitability from country to country, the results of examinations and audits of our tax filings, adjustments to our uncertain tax positions, changes in accounting for income taxes and changes in tax laws.
In the ordinary course of our business, there are many transactions and calculations where the ultimate tax determination is uncertain. Significant judgment is required in determining our global provision for income taxes, deferred tax assets or liabilities, and in evaluating our tax positions. Although we believe our estimates are reasonable, our tax filings are regularly under audit by tax authorities and the ultimate tax outcome may differ from the amounts recorded and may materially affect our financial results in the period or periods for which such determination is made.
The U.S. federal government enacted the 2017 Tax Act on December 22, 2017. The 2017 Tax Act has resulted in significant changes to the U.S. corporate income tax system. These changes include lowering the corporate tax rate, implementing a territorial tax system, and imposing a one-time deemed repatriation Toll Tax on cumulative undistributed foreign earnings.
Due to the timing of the enactment and the complexity involved applying the provisions of the 2017 Tax Act, we made reasonable estimates of the effects and recorded provisional amounts in our financial statements as of December 31, 2017. These provisional amounts were finalized as of December 31, 2018. If additional regulatory guidance is issued by the applicable taxing authorities or if certain accounting interpretations are issued, these developments could affect our tax obligations and effective tax rate in the period or periods in which the guidance changes.
We identified a material weakness in our internal control over financial reporting relating to our accounting for the implementation of the 2017 Tax Act which, if not remediated appropriately or timely, could result in loss of investor confidence and adversely affect our stock price.
As disclosed in Part II, Item 9A, during the fourth quarter of fiscal 2018, management identified a material weakness in internal controls related to our accounting for the implementation of the 2017 Tax Act. We did not have an effective risk assessment process to identify all relevant risks within the process we implemented to account for changes resulting from the recently enacted 2017 Tax Act. As a consequence, we did not design and implement an effective process level control activity over the impact of foreign tax credits on the accounting for the tax liabilities associated with the mandatory repatriation provisions of the 2017 Tax Act. As a result, management concluded that our internal control over financial reporting was not effective as of December 31, 2018. We are implementing remedial measures and, while there can be no assurance that our efforts will be successful, we plan to remediate the material weakness prior to the end of fiscal 2019. If we are unable to remediate the material weakness, or are otherwise unable to maintain effective internal control over financial reporting or disclosure controls and procedures, our ability to record, process and report financial information accurately, and to prepare financial statements within required time periods, could be adversely affected, which could subject us to litigation or investigations requiring management resources and payment of legal and other expenses, negatively affect investor confidence in our financial statements and adversely affect our stock price.
The requirements to evaluate goodwill, indefinite‑livedindefinite-lived intangible assets and long‑livedlong-lived assets for impairment may result in a write‑offwrite-off of all or a portion of our recorded amounts, which would negatively affect our operating results and financial condition.
As of December 31, 2018,2021, our balance sheet included goodwill, indefinite‑livedindefinite-lived intangible assets, amortizable intangible assets and property, plant and equipment of $544.8$600.7 million, $36.2$35.9 million, $129.0$92.7 million and $201.9$200.7 million, respectively. In lieu of amortization, we are required to perform an annual impairment review of both goodwill and
indefinite‑lived indefinite-lived intangible assets. In 2018, 2017,2021, 2020 and 2016,2019, none of our goodwill reporting units were impaired. In 2018 and 2017, none ofor our indefinite-livedindefinite lived tradenames were impaired. In performing our annual review in 2016, we recognized a pre‑tax non‑cash indefinite‑lived intangible asset impairment charge of approximately $0.4 million. We are also required to perform an impairment review of our long‑livedlong-lived assets if indicators of impairment exist. In 2018,2020, we recognized a pre-tax non-cash impairment charge of $1.4 million related to a long-lived asset and a technology intangible asset in which market value expectations indicated the carrying amounts of these assets were in excess of the fair value. In 2021 and 2019, none of our long-lived assets were impaired. In 2017 and 2016, we recognized pre‑tax non‑cash charges of $1.0 million and $0.1 million, respectively.
There can be no assurances that future goodwill, indefinite‑livedindefinite-lived intangible assets or other long‑livedlong-lived asset impairments will not occur. We perform our annual test for indications of goodwill and indefinite‑livedindefinite-lived intangible assets impairment in the fourth quarter of our fiscal year or sooner if indicators of impairment exist.
The loss or financial instability of major customers could have an adverse effect on our results of operations.
In 2018,2021, our top ten customers accounted for approximately 21% of our total net sales with no one customer accounting for more than 10% of our total net sales. Our customers generally are not obligated to purchase any minimum volume of products from us and are able to terminate their relationships with us at any time. In addition, increases in the prices of our products could result in a reduction in orders from our customers. A significant reduction in orders from, or change in terms of contracts with, any significant customers could have a material adverse effect on our future results of operations.
Certain indebtednessOur credit facility may limit our ability to pay dividends, incur additional debt and make acquisitions and other investments.
Our revolving credit facility and other senior indebtedness containcontains operational and financial covenants that restrict our ability to make distributions to stockholders, incur additional debt and make acquisitions and other investments unless we satisfy certain financial tests and comply with various financial ratios. If we do not maintain compliance with these covenants, our creditors could declare a default under our revolving credit facility, or senior notes and our indebtedness could be declared immediately due and payable. Our ability to comply with the provisions of our indebtedness may be affected by changes in economic or business conditions beyond our control. Further, one of our strategies is to increase our revenues and profitability and expand our business through acquisitions. We may require capital in excess of our available cash and the unused portion of our revolving credit facility to make large acquisitions, which we would generally obtain from access to the credit markets. There can be no assurance that if a large acquisition is identified that we would have access to sufficient capital to complete such acquisition. Should we require additional debt financing above our existing credit limit, we cannot be assured such financing would be available to us or available to us on reasonable economic terms.terms
Our inability to attract and retain key personnel may adversely affect our business.
Our success depends on our ability to recruit, retain and develop highly-skilled management and key personnel. Competition for these individuals in our industry is intense and we may not be able to successfully recruit, train or retain qualified personnel, or to effectively implement successions to existing personnel. If we fail to retain and recruit the necessary personnel or arrange for successors to key personnel, our business could materially suffer.
Investment Risk Factors
One of our stockholders can exercise substantial influence over our Company.
As of December 31, 2018,2021, Timothy P. Horne beneficially owned 6,329,2906,004,290 shares of Class B common stock. Our Class B common stock entitles its holders to ten votes for each share, and our Class A common stock entitles its holders to one vote per share. As of December 31, 2018,2021, Timothy P. Horne beneficially owned approximately 18.5%17.9% of our outstanding shares of Class A common stock (assuming conversion of all shares of Class B common stock beneficially owned by Mr. Horne into Class A common stock) and approximately 99.2%99.7% of our outstanding shares of Class B common stock, which represents approximately 69.1%68.4% of the total outstanding voting power. As long as Mr. Horne controls shares representing at least a majority of the total voting power of our outstanding stock, Mr. Horne will be able to unilaterally determine the outcome of most stockholder votes, and other stockholders will not be able to affect the outcome of any such votes.
Conversion and subsequent sale of a significant number of shares of our Class B common stock could adversely affect the market price of our Class A common stock.
As of December 31, 2018,2021, there were outstanding 27,646,46527,584,525 shares of our Class A common stock and 6,329,2906,024,290 shares of our Class B common stock. Shares of our Class B common stock may be converted into Class A common stock at any time on a one for one basis. Under the terms of a registration rights agreement with respect to outstanding shares of our Class B common stock, the holders of our Class B common stock have rights with respect to the registration of the underlying Class A common stock. Under these registration rights, the holders of Class B common stock may require, on up to two occasions that we register their shares for public resale. If we are eligible to use Form S‑3S-3 or a similar
short‑form short-form registration statement, the holders of Class B common stock may require that we register their shares for public resale up to two times per year. If we elect to register any shares of Class A common stock for any public offering, the holders of Class B common stock are entitled to include shares of Class A common stock into which such
shares of Class B common stock may be converted in such registration. However, we may reduce the number of shares proposed to be registered in view of market conditions. We will pay all expenses in connection with any registration, other than underwriting discounts and commissions. If all of the available registered shares are sold into the public market the trading price of our Class A common stock could decline.
General Risk Factors
Changes in regulations or standards could adversely affect our business.
Our products and business are subject to a wide variety of statutory, regulatory and industry standards and requirements. A significant change to regulatory requirements, whether federal, foreign, state or local, or to industry standards, could substantially increase manufacturing costs, impact the size and timing of demand for our products, or put us at a competitive disadvantage, any of which could harm our business and have a material adverse effect on our financial condition, results of operations and cash flow.
Our operating results could be negatively affected by changes in tax rates, the adoption of new tax legislation, or exposure to additional tax liabilities.
As a global company, we are subject to taxation in numerous countries, states and other jurisdictions. As a result, our effective rate is derived from a combination of applicable tax rates in the various places that we operate. Our future taxes could be affected by numerous factors, including changes in the mix of our profitability from country to country, the results of examinations and audits of our tax filings, adjustments to our uncertain tax positions, changes in accounting for income taxes and changes in tax laws.
In the ordinary course of our business, there are many transactions and calculations where the ultimate tax determination is uncertain. Significant judgment is required in determining our global provision for income taxes, deferred tax assets or liabilities, and in evaluating our tax positions. Our tax filings are regularly under audit by tax authorities and the ultimate tax outcome may differ from the amounts recorded and may materially affect our financial results in the period or periods for which such determination is made.
Item 1B. UNRESOLVED STAFF COMMENTS.
None.
Item 2. PROPERTIES.
We maintain 3132 principal manufacturing, warehouse and distribution centers worldwide, including our corporate headquarters located in North Andover, Massachusetts. Additionally, we maintain numerous sales offices and other smaller manufacturing facilities and warehouses. The principal properties in each of our three geographic segments and their location, principal use and ownership status are set forth below:
Americas:
Americas:
| | | | |
Location |
| Principal Use |
| Owned/Leased |
North Andover, MA | | Corporate Headquarters | | Owned |
Burlington, ON, Canada | | Distribution Center | | Owned |
Export, PA | | Manufacturing | | Owned |
Franklin, NH | | Manufacturing/Distribution | | Owned |
St. Pauls, NC | | Manufacturing | | Owned |
San Antonio, TX | | Warehouse/Distribution | | Owned |
Spindale, NC | | Distribution Center | | Owned |
Fort Worth, TX | | Manufacturing/Distribution | | OwnedLeased
|
San Antonio, TXFort Myers, FL
| | Warehouse/Manufacturing/Distribution
| | Owned
|
Spindale, NC
| | Distribution Center
| | OwnedLeased
|
Blauvelt, NY | | Manufacturing/Distribution | | Leased |
Peoria, AZ
| | Manufacturing/Distribution
| | Leased
|
Reno,Sparks, NV
| | Distribution Center | | Leased |
Vernon, BC, Canada | | Manufacturing/Distribution | | Leased |
Woodland, CA | | Manufacturing | | Leased |
Groveport, OH | | Distribution Center | | Leased |
Europe:
Europe
Location |
| Principal Use |
| |
Location
| | Principal Use
| | Owned/Leased |
Biassono, Italy | | Manufacturing/Distribution | | Owned |
Hautvillers, France | | Manufacturing | | Owned |
Landau, Germany | | Manufacturing/Distribution | | Owned
|
Méry, France
| | Manufacturing
| | Owned |
Plovdiv, Bulgaria | | Manufacturing | | Owned |
Sorgues, France | | Distribution Center | | Owned |
Vildbjerg, Denmark | | Manufacturing/Distribution | | Owned |
Virey‑le‑Grand,Virey-le-Grand, France
| | Manufacturing/Distribution | | Owned |
Amsterdam, Netherlands
| | Europe Headquarters
| | Leased
|
Gardolo, Italy
| | Manufacturing
| | Leased
|
Monastir, Tunisia
| | Manufacturing
| | Leased
|
Rosières, France | | Manufacturing/Distribution | | Owned |
Gardolo, Italy | | Manufacturing | | Owned |
Monastir, Tunisia | | Manufacturing | | Leased |
St. Neots, United Kingdom | | Manufacturing/Distribution
| | Leased |
Asia‑Pacific,Asia-Pacific, Middle East, and Africa:
| | | | |
Location |
| Principal Use |
| Owned/Leased |
Ningbo, Beilun, China | | Manufacturing | | Owned |
Shanghai, China | | Asia‑PacificAPMEA Headquarters
| | Leased |
Ningbo, Beilun District, China | | Distribution Center | | Leased |
Auckland, New Zealand | | Manufacturing/Distribution | | Leased |
Dubai, United Arab Emirates | | Distribution | | Leased |
Perth, Australia | | Distribution | | Leased |
Melbourne, Australia | | Distribution | | Leased |
Certain of our facilities are subject to capital lease arrangements and collateral assignments under loan agreements with long‑term lenders. In general, weWe believe that our properties, including machinery, tools and equipment, are in good condition, well maintained and adequate and suitable for their intended uses.
Item 3. LEGAL PROCEEDINGS.
We are from time to time involved in various legal and administrative proceedings. See Item 1. “Business—Product Liability, Environmental and Other Litigation Matters,” and Note 1615 of the Notes to Consolidated Financial Statements, both of which are incorporated herein by reference.
Item 4. MINE SAFETY DISCLOSURES.
Not applicable.
PART II
Item 5.MARKET FOR REGISTRANT’S COMMON EQUITY, RELATED STOCKHOLDER MATTERS AND ISSUER PURCHASES OF EQUITY SECURITIES.
Our Class A common stock is traded on the New York Stock Exchange under the trading symbol “WTS.”
There is no established public trading market for our Class B common stock, which is held by members of the Horne family. The principal holders of such stock are subject to restrictions on transfer with respect to their shares. Each share of our Class B common stock (10 votes per share) is convertible into one share of Class A common stock (1 vote per share).
The number of record holders of our Class A common stock as of January 27, 201923, 2022 was 178.63. The number of record holders of our Class B common stock as of January 27, 201923, 2022 was 11.10.
Aggregate common stock dividend payments in 20182021 were $28.3$34.3 million, which consisted of $23.1$28.2 million and $5.2$6.1 million for Class A shares and Class B shares, respectively. Aggregate common stock dividend payments in 20172020 were $25.9$31.4 million, which consisted of $21.1$25.7 million and $4.8$5.7 million for Class A shares and Class B shares, respectively. While we presently intend to continue to pay comparable cash dividends, the payment of future cash dividends depends upon the Board of Directors’ assessment of our earnings, financial condition, capital requirements and other factors.
We satisfy the minimum withholding tax obligation due upon the vesting of shares of restricted stock and the conversion of restricted stock units into shares of Class A common stock by automatically withholding from the shares being issued a number of shares with an aggregate fair market value on the date of such vesting or conversion that would satisfy the withholding amount due.
The following table includes information with respect to shares of our Class A common stock withheld to satisfy withholding tax obligations during the quarter ended December 31, 2018.2021.
| | | | | | | | | |
| | Issuer Purchases of Equity Securities |
| | | | | | | | | (d) Maximum Number (or |
| | (a) Total | | | | | (c) Total Number of | | Approximate Dollar |
| | Number of | | | | | Shares (or Units) | | Value) of Shares (or |
| | Shares (or | | (b) Average | | Purchased as Part of | | Units) that May Yet Be |
| | Units) | | Price Paid per | | Publicly Announced | | Purchased Under the |
Period | | Purchased | | Share (or Unit) | | Plans or Programs | | Plans or Programs |
September 27, 2021 – October 24, 2021 | | — | | $ | — | | — | | — |
October 25, 2021 – November 21, 2021 | | — | | $ | — | | — | | — |
November 22, 2021 - December 31, 2021 | | 239 | | $ | 193.96 | | — | | — |
Total | | 239 | | $ | 193.96 | | — | | — |
| | | | | | | | | |
| | Issuer Purchases of Equity Securities |
| | | | | | | | | (d) Maximum Number (or |
| | (a) Total | | | | | (c) Total Number of | | Approximate Dollar |
| | Number of | | | | | Shares (or Units) | | Value) of Shares (or |
| | Shares (or | | (b) Average | | Purchased as Part of | | Units) that May Yet Be |
| | Units) | | Price Paid per | | Publicly Announced | | Purchased Under the |
Period | | Purchased | | Share (or Unit) | | Plans or Programs | | Plans or Programs |
October 1, 2018 – October 28, 2018 | | 1,623 | | $ | 78.44 | | — | | — |
October 29, 2018 – November 25, 2018 | | 55 | | $ | 72.87 | | — | | — |
November 26, 2018 - December 31, 2018 | | 422 | | $ | 71.12 | | — | | — |
Total | | 2,100 | | $ | 76.82 | | — | | — |
The following table includes information with respect to repurchases of our Class A common stock during the three‑monththree-month period ended December 31, 20182021 under our stock repurchase program.
| | | | | | | | | | |
| | Issuer Purchases of Equity Securities (1) |
| | | | | | | | | (d) Maximum Number (or |
| | (a) Total | | | | | (c) Total Number of | | Approximate Dollar |
| | Number of | | (b) Average | | Shares (or Units) | | Value) of Shares (or |
| | Shares (or | | Price Paid | | Purchased as Part of | | Units) that May Yet Be |
| | Units) | | per Share | | Publicly Announced | | Purchased Under the |
Period | | Purchased(1) | | (or Unit) | | Plans or Programs | | Plans or Programs |
September 27, 2021 – October 24, 2021 | | 7,040 | | $ | 173.72 | | 7,040 | | $ | 100,400,573 |
October 25, 2021 – November 21, 2021 | | 6,559 | | $ | 196.48 | | 6,559 | | $ | 99,111,847 |
November 22, 2021 - December 31, 2021 | | 8,954 | | $ | 192.83 | | 8,954 | | $ | 97,385,284 |
Total | | 22,553 | | $ | 187.90 | | 22,553 | | | |
| | | | | | | | | | |
| | Issuer Purchases of Equity Securities |
| | | | | | | | | (d) Maximum Number (or |
| | (a) Total | | | | | (c) Total Number of | | Approximate Dollar |
| | Number of | | (b) Average | | Shares (or Units) | | Value) of Shares (or |
| | Shares (or | | Price Paid | | Purchased as Part of | | Units) that May Yet Be |
| | Units) | | per Share | | Publicly Announced | | Purchased Under the |
Period | | Purchased(1) | | (or Unit) | | Plans or Programs | | Plans or Programs |
October 1, 2018 – October 28, 2018 | | 17,120 | | $ | 76.15 | | 17,120 | | $ | 170,975,854 |
October 29, 2018 – November 25, 2018 | | 22,245 | | $ | 72.91 | | 22,245 | | $ | 169,353,910 |
November 26, 2018 - December 31, 2018 | | 104,951 | | $ | 71.99 | | 104,951 | | $ | 161,798,336 |
Total | | 144,316 | | $ | 72.63 | | 144,316 | | | |
| (1) | (1)
| | On July 27, 2015,February 7, 2019, we announced that the Board of Directors authorizedhad approved a stock repurchase program of up to $100$150 million of the Company’sour Class A common stock, to be purchased from time to time on the open market or in privately negotiated transactions. On February 6, 2019, the Board of Directors authorized an additional stock repurchase program of up to $150 million of the Company’s Class A common stock to be purchased from time to time on the open market or in privately negotiated transactions. The $150 million has been reflected in the maximum dollar value of shares that may yet be purchased in column (d) above. The timing and number of shares repurchased will be determined by the Company’s management based on its evaluation of market conditions and other factors. |
Performance Graph
Set forth below is a line graph comparing the cumulative total shareholder return on our Class A common stock for the last five years with the cumulative return of companies on the Standard & Poor’s 500 Stock Index and the Russell 2000 Index. We chose the Russell 2000 Index because it represents companies with a market capitalization similar to that of
Watts Water. The graph assumes that the value of the investment in our Class A common stock and each index was $100 at December 31, 20132016 and that all dividends were reinvested.
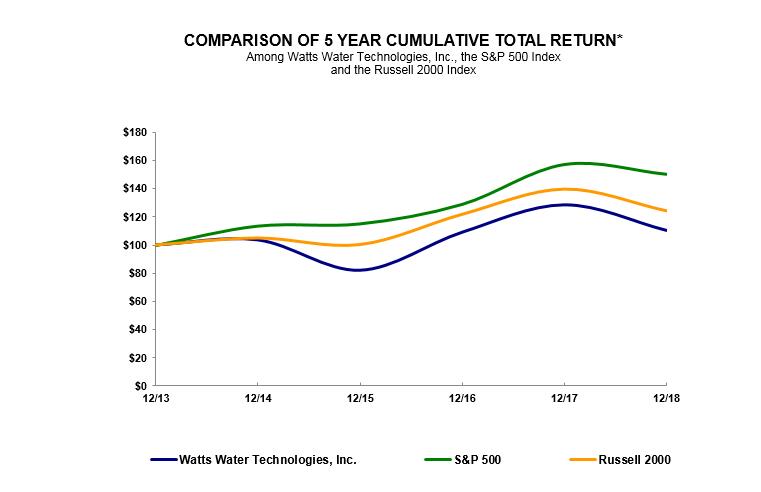
*$100 invested on 12/31/13 in stock or index, including reinvestment of dividends. Fiscal year ending December 31.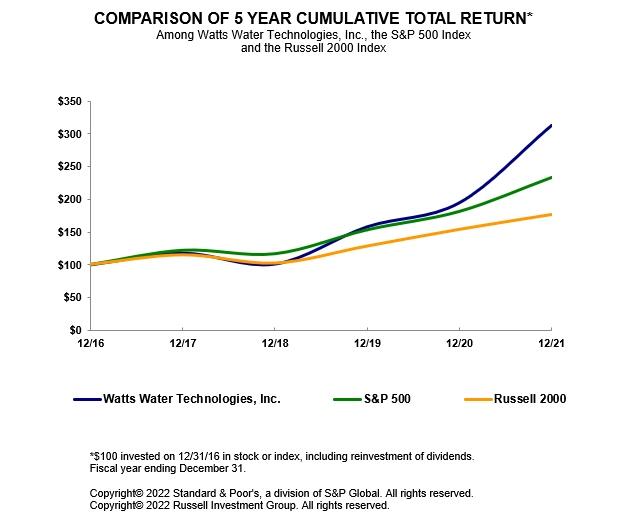
Cumulative Total Return
| | | | | | | | | | | | | |
| | 12/31/13 | | 12/31/14 | | 12/31/15 | | 12/31/16 | | 12/31/17 | | 12/31/18 | |
| | | | | | | | | | | | | |
| | | 12/31/16 | | 12/31/17 | | 12/31/18 | | 12/31/19 | | 12/31/20 | | 12/31/21 |
Watts Water Technologies, Inc. | | 100.00 | | 103.55 | | 82.04 | | 108.98 | | 128.41 | | 110.28 | | 100.00 | | 117.84 | | 101.20 | | 158.06 | | 194.67 | | 312.71 |
S & P 500 | | 100.00 | | 113.69 | | 115.26 | | 129.05 | | 157.22 | | 150.33 | | 100.00 | | 121.83 | | 116.49 | | 153.17 | | 181.35 | | 233.41 |
Russell 2000 | | 100.00 | | 104.89 | | 100.26 | | 121.63 | | 139.44 | | 124.09 | | 100.00 | | 114.65 | | 102.02 | | 128.06 | | 153.62 | | 176.39 |
The above Performance Graph and related information shall not be deemed “soliciting material” or to be “filed” with the Securities and Exchange Commission, nor shall such information be incorporated by reference into any future filing under the Securities Act of 1933 or Securities Exchange Act of 1934, each as amended, except to the extent that we specifically incorporate it by reference into such filing.
Item 6. SELECTED FINANCIAL DATA.
The selected financial data set forth below should be read in conjunction with our consolidated financial statements, related Notes thereto and “Management’s Discussion and Analysis of Financial Condition and Results of Operations” included herein.
Item 6. [Reserved]
FIVE‑YEAR FINANCIAL SUMMARY
Not applicable.
(Amounts in millions, except per share and cash dividend information)
| | | | | | | | | | | | | | | |
| | Year Ended | | Year Ended | | Year Ended | | Year Ended | | Year Ended |
| | 12/31/18(1) | | 12/31/17(2) | | 12/31/16(3) | | 12/31/15(4) | | 12/31/14(5) |
Statement of operations data: | | | | | | | | | | | | | | | |
Net sales | | $ | 1,564.9 | | $ | 1,456.7 | | $ | 1,398.4 | | $ | 1,467.7 | | $ | 1,513.7 |
Net income (loss) | | | 128.0 | | | 73.1 | | | 84.2 | | | (112.9) | | | 50.3 |
DILUTED EPS | | | | | | | | | | | | | | | |
Net income (loss) per share: | | | 3.73 | | | 2.12 | | | 2.44 | | | (3.24) | | | 1.42 |
Cash dividends declared per common share | | $ | 0.82 | | $ | 0.75 | | $ | 0.71 | | $ | 0.66 | | $ | 0.58 |
Balance sheet data (at year end): | | | | | | | | | | | | | | | |
Total assets | | $ | 1,653.7 | | $ | 1,736.5 | | $ | 1,763.2 | | $ | 1,692.8 | | $ | 1,948.0 |
Long-term debt, net of current portion | | | 323.4 | | | 474.6 | | | 511.3 | | | 576.2 | | | 577.8 |
| (1)
| | For the year ended December 31, 2018, net income includes pre-tax restructuring charges of $3.4 million, or $2.5 million net after-tax cost. Net income also includes a tax benefit of $3.7 million related to the finalization of the impact of the 2017 Tax Act.
|
| (2)
| | For the year ended December 31, 2017, net income includes the following pre-tax costs: long-lived asset impairment charges of $1.0 million, deployment costs related to the Americas and Europe transformation programs of $2.9 million, restructuring charges of $6.8 million, and acquisition costs of $0.2 million. The net after‑tax cost of these items was $7.3 million. Net income also includes a tax charge of $25.1 million related to the provisional impact of the 2017 Tax Act.
|
| (3)
| | For the year ended December 31, 2016, net income includes the following net pre‑tax costs: long-lived asset impairment charges of $0.5 million, acquisition costs of $2.0 million, purchase accounting adjustments of $2.0 million, restructuring charges of $4.7 million, deployment costs related to the Americas, APMEA, and Europe transformation programs of $14.2 million, and debt issuance costs of $0.3 million. Net income also includes a pre-tax gain of $8.7 million related to the disposition of a subsidiary in China. The net after‑tax cost of these items was $6.2 million.
|
| (4)
| | For the year ended December 31, 2015, net loss includes the following net pre‑tax costs: goodwill and other long‑lived asset impairment of $130.5 million, acquisition related costs of $1.6 million, restructuring related costs of $21.4 million, Americas, APMEA, and Europe transformation deployment costs of $14.3 million, a $3.5 million charge for a settlement in principle relating to two class action lawsuits, a $2.5 million charge related to the resolution of certain product liability legacy claims for non-core products which we have exited, and long‑term obligations settlements, including our pension plan and supplemental employee retirement plan obligations of $64.7 million. The net after‑tax cost of these items was $197.3 million.
|
| (5)
| | For the year ended December 31, 2014, net income includes the following net pre‑tax costs: goodwill and other long‑lived asset impairment of $14.2 million, acquisition related costs of $5.8 million, restructuring and severance related costs of $16.4 million, Europe and Americas transformation deployment costs of $9.3 million, and customs settlement costs of $1.9 million. The net after‑tax cost of these items was $38.5 million.
|
Item 7. MANAGEMENT’S DISCUSSION AND ANALYSIS OF FINANCIAL CONDITION AND RESULTS OF OPERATIONS.
Overview
We are a leading supplier of products, solutions and solutionssystems that conserve watermanage and manageconserve the flow of fluids and energy into, through and out of buildings in the commercial and residential markets ofin the Americas, Europe and APMEA.Asia-Pacific, Middle East and Africa (“APMEA”). For over 140 years, we have designed and produced valve systems that safeguard and regulate water systems, energy efficient heating and hydronic systems, drainage systems and water filtration technology that helps purify and conserve water. We earn revenue and income almost exclusively from the sale of our products. Our principal product lines include:
| ·
● | | Residential & commercial flow control products—includes products typically sold into plumbing and hot water applications such as backflow preventers, water pressure regulators, temperature and pressure relief valves, and thermostatic mixing valves. valves and leak detection products. |
| ·
● | | HVAC & gas products—includes commercial high‑efficiencyhigh-efficiency boilers, water heaters and heatingcustom heat and hot water solutions, hydronic and electric heating systems for under‑floorunder-floor radiant applications, custom heat and hot water solutions, hydronic pump groups for boiler manufacturers and alternative energy control packages, and flexible stainless steel connectors for natural and liquid propane gas in commercial food service and residential applications. HVAC is an acronym for heating, ventilation and air conditioning. |
| ·
● | | Drainage & water re‑usere-use products—includes drainage products and engineered rain water harvesting solutions for commercial, industrial, marine and residential applications. |
| ·
● | | Water quality products—includes point‑of‑usepoint-of-use and point‑of‑entrypoint-of-entry water filtration, conditioning and scale prevention systems for both commercial, marine and residential applications. |
Our business is reported in three geographic segments: Americas, Europe, and APMEA. We distribute our products through four primary distribution channels: wholesale, original equipment manufacturers (OEMs), specialty, and do-it-yourself (DIY).
We believe that the factors relating to our future growth include continued product innovation that meets the needs of our customers and our end markets, including smart and connected products and solutions;markets; our ability to continue to make selective acquisitions, both in our core markets as well as in new complementary markets; regulatory requirements relating to the quality and conservation of water and the safe use of water; increased demand for clean water; and continued enforcement of plumbing and building codes; and a healthy economic environment.codes. We have completed 1112 acquisitions in the last decade.since 2012. Our acquisition strategy focuses on businesses that promote our key macro themes around safety &and regulation, energy efficiency and water conservation. We target businesses that will provide us with one or more of the following: an entry into new markets and/or new geographies, improved channel access, unique and/or proprietary technologies, advanced production capabilities or complementary solution offerings.
Our innovation strategy is focused on differentiated products and solutions that will provide greater opportunity to distinguish ourselves in the market place.marketplace. Conversely, we continue to migrate away from commoditized products where we cannot add value. Our goal is to be a solutions provider, not merely a components supplier. We continually look for strategic opportunities to invest in new products and markets or divest existing product lines where necessary in order to meet those objectives.
The Internet of Things has allowed companies to transform components into smart and connected devices. Over the past several years we have been building our smart and connected foundation by expanding our internal capabilities and making strategic acquisitions. Our strategy is to deliver superior customer value through smart and connected products and solutions. This strategy focuses on three dimensions: Connect, Control and Conserve. We intend to introduce
products that will connect our customers with smart systems, control systems for optimal performance, and conserve critical resources by increasing operability, efficiency and safety.
Products representing a majority of our sales are subject to regulatory standards and code enforcement, which typically require that these products meet stringent performance criteria. We have consistently advocated for the development and enforcement of such plumbing codes. We are focused on maintaining stringent quality control and testing procedures at each of our manufacturing facilities in order to manufacture products in compliance with code requirements and take advantage of the resulting demand for compliant products. We believe that the product development, product testing capability and investment in plant and equipment needed to manufacture products in compliance with code requirements, represent a competitive advantage for us.us.
In 2018,
COVID-19 Pandemic and Supply Chain Disruptions
The COVID-19 pandemic materially impacted our operating results in 2020. The impact was most pronounced during the second quarter of 2020, which was shortly after the World Health Organization declared COVID-19 a global pandemic and government authorities around the world imposed lockdowns and restrictions. However, as the second half of 2020 progressed and government-imposed restrictions subsided, we noted market activity levels increasing with sales and profits improving sequentially from the second to fourth quarters. Profits improved in part from better volumes and in part from the cost actions we executed in response to the pandemic. Results in 2021 continued that trend of improved top line growth and profit performance. However, there are still end markets we serve that may take time to recover, and potential regional COVID-19 outbreaks and associated restrictions may occur that could further impact our operating results.
We remain diligent as a Company to mitigate potential future outbreaks in our facilities by taking precautions to reduce the spread of COVID-19 while maintaining our production capabilities. We continue to focus on the health and safety of our employees by maintaining continuous adherence to social distancing guidelines, temperature monitoring, encouraging vaccinations, enabling remote work and hybrid work schedules where feasible, providing personal protective equipment and providing COVID-19 information, which includes the latest CDC and other government protocols and our Pandemic Plan.
Further, we believe the actions we have taken over the last several years to strengthen our portfolio and increase customer focus, along with aggressively paying down debt, have put us in a strong financial performance wasposition. We maintain ample liquidity to work through these uncertain times, including the refinancing of our credit facility in the second quarter of 2021, and we continue to invest for the future. Our experienced management team is proactively managing this situation and we are well positioned to respond to challenges presented by the COVID-19 pandemic as they arise.
Our revenues improved in all three geographic segments for 2021 as compared to 2020, primarily driven by strong organicthe global economic recovery, as well as from incremental price increases. Although, we continue to see recovery in certain markets, future sales growthexpansion or contraction is dependent on the duration and severity of the evolving COVID-19 pandemic. Factors affecting our results include supply chain disruptions, the construction lending markets, investments and capital spending in building services construction markets, labor shortages, additional governmental actions that may or may not be taken, and numerous other uncertainties, including COVID-19 vaccination rates, the Americasimpact of virus variants and modest growthvaccination efficacy.
As worldwide economies recover from the pandemic, increased market demand is straining suppliers’ ability to fill orders. This has been compounded by logistical issues with respect to container capacity on ships, port congestion and in-road trucking. The global shortage of electronic components like semiconductors and other raw materials continues to challenge our supply chain. We are also experiencing higher transportation costs, including expedited freight cost, as well as rising prices for commodities and other raw materials. Labor shortages and other workforce disruptions have primarily affected our supply chain, manufacturing and distribution processes, as well as our suppliers, including higher absenteeism caused by illness from virus variants or quarantine measures. While we were able to effectively manage these issues during 2021, we cannot predict how supply chain disruptions and related costs may impact our ability to service our customers or the potential impact on our profit margins.
Due to the above circumstances and as described generally in Europethis Form 10-K, our results of operations for the year ended December 31, 2021 are not necessarily indicative of future results. Management cannot predict the full impact of the COVID-19 pandemic on our sales, supply chain disruptions, manufacturing and APMEA. We continued to drive margin expansion through higher sales price, volume, productivity initiativesdistribution or on economic conditions generally, including effects on customer spending. The extent of the effects of the COVID-19 pandemic on us
remains uncertain and restructuring savings while simultaneously reinvesting inwill depend on future developments, and such effects could exist for an extended period of time even after the business. We continued to drive commercialpandemic ends. For further information regarding the impact of COVID-19 pandemic and operational excellence, and invest in product innovation as we strive to meet the needs of our customers.supply chain disruptions on us, see Item 1A, “Risk Factors.”
Overall, reportedFinancial Overview
Net sales for 20182021 increased 7.4%19.9%, or $108.2$300.6 million, on a reported basis and 17.3%, or $260.1 million, on an organic basis, compared to 2020, primarily driven by strong organic sales growth of 6.1%, or $88.9 million, primarily within the Americas. Foreign exchange contributed $19.3 million, or 1.3%, of sales growth, primarily related to the appreciation of the euro against the U.S dollar year over year. Reported sales by region in the Americas, Europe, and APMEA increased by 8.4%, 6.1%, and 2.0%, respectively, compared to 2017. Organic sales by region in the Americas, Europe, and APMEA increased 8.4%, 1.8%, and 1.6%, respectively, compared to 2017. The increase in organic sales was due to higher sales volume and increased priceglobal economic recovery across all of our regions. Operating incomeoperating segments, as well as incremental price increases. The reported sales increase included the impact of $188.4foreign exchange movements of 2.0%, or $29.9 million, increased by $26.1 million, or 16.1% compared to 2017. This increase wasprimarily driven by increased price,
higher sales volume, and productivity initiatives, partially offset by higher material costs, investments in strategic growth initiatives, and general inflation.
$10.6 million. Organic sales is a non-GAAP financial measure that excludes the impacts of acquisitions, divestitures and foreign exchange from year-over-year comparisons. Divested sales includes the exit of our non-core products through sale and through the discontinuation of product lines. Management believes reporting organic sales growth provides useful information to investors, potential investors and others, because it allows for a more complete understanding ofadditional insight into underlying sales trends by providing sales growth on a consistent basis. We reconcile the change in organic sales to our reported sales for each region within our results below. Operating income of $239.6 million increased by $58.5 million, or 32.3%, in 2021 compared to 2020. This increase was primarily driven by higher sales volume, price, savings from productivity and restructuring actions, partially offset by higher inflation including logistic and freight costs, investments, incentives and the return of expenses related to business normalization.
The 2017 Tax Act resulted
Despite the challenges presented by the COVID-19 pandemic and supply chain disruptions in significant changes2021, we continued to drive commercial and operational excellence, invest in our business through capital expenditures, the U.S. corporate income tax system and was enacted on December 22, 2017. These changes include a federal statutory rate reduction from 35% to 21% effective on January 1, 2018, the elimination or reduction of certain domestic deductions and credits, and limitations on the deductibility of interest expense and executive compensation. The 2017 Tax Act transitions international taxation from a worldwide system to a modified territorial system and includes base erosion prevention measures on non-U.S. earnings. The 2017 Tax Act also includes a one-time mandatory deemed repatriation tax on accumulated foreign subsidiaries' previously untaxed foreign earnings (“Toll Tax”).
Changes in tax rates and tax laws are accounted foracquisition discussed in the periodsection below, and invest in product innovation, technology, including our smart and connected products and solutions, and commercial excellence, as we strove to meet the needs of enactmentour customers.
Management’s discussion and deferred tax assetsanalysis of our financial condition, results of operations and liabilities are measured at the enacted tax rate. Therefore, duringcash flows as of and for the year ended December 31, 2017, we recorded a charge totaling $25.1 million related to2019 can be found in Item 7 of Part II, “Management’s Discussion and Analysis of Financial Condition and Results of Operations,” in our estimate of the provisions of the 2017 Tax Act, including an estimated $23.3 million expense under the Toll Tax. DuringAnnual Report on Form 10-K for the year ended December 31, 20182020.
Acquisitions
On September 30, 2021, we finalizedacquired Sentinel Hydrosolutions, LLC (“Sentinel”) in an all-cash merger transaction. Sentinel is based in Escondido, California, and specializes in the impactdesign, marketing and assembly of leak detection products, primarily sold into high-end residential settings. The acquisition of Sentinel expands our product offering in the 2017 Tax Act and recorded a benefitleak detection market. The acquisition of $3.7 million, reducing the net impactSentinel was deemed not to $21.4 million and increasing the Toll Tax to $33.5 million. The Toll Tax is being paid over an eight-year period, starting in 2018, and will not accrue interest. be material.
Recent Developments
On February 6, 2019,4, 2022, Munish Nanda, President of Americas and Europe, provided notice of his intention to retire from the Company. Mr. Nanda has agreed to remain in his current role as President of Americas and Europe until a successor is in place. Mr. Nanda has further agreed that after he has transferred his responsibilities as President of Americas and Europe to a successor, he will remain employed in a different role until May 2023 to assist with the transition and provide advisory services. We expect to enter into a transition and retention agreement with Mr. Nanda to document these arrangements.
On February 7, 2022, the Board of Directors voted unanimously to name Robert J. Pagano, Jr., the Company’s Chief Executive Officer, as the new Chairperson of the Board effective immediately. The Board also voted unanimously to name the former Chairperson of the Board, W. Craig Kissel, as Lead Independent Director. The Company’s Corporate Governance Guidelines prevent any Board member from being renominated for election to the Board after their 72nd birthday, and as such Mr. Kissel will not be eligible to stand for reelection at the 2023 Annual Meeting of Stockholders. The Board decided to make this change now in order to have an orderly transition of responsibilities.
On February 7, 2022, we declared a quarterly dividend of twenty-onetwenty-six cents ($0.21)0.26) per share on each outstanding share of Class A common stock and Class B common stock payable on March 15, 20192022 to stockholders of record on March 1, 2019.2022.
On February 6, 2019, the Board30
Results of Operations
Year Ended December 31, 20182021 Compared to Year Ended December 31, 20172020
Net Sales. Our business is reported in three geographic segments: Americas, Europe and APMEA. Our net sales in each of these segments for the years ended December 31, 20182021 and December 31, 20172020 were as follows:
| | | | | | | | | | | | | | | | | |
| | | Year Ended | | Year Ended | | | | | % Change to | |
| | | December 31, 2021 | | December 31, 2020 | | | | | Consolidated | |
| | | Net Sales | | % Sales | | Net Sales | | % Sales | | Change | | Net Sales | |
| | | | | | | | | | | | | | | | | |
| | Year Ended | | Year Ended | | | | | % Change to | | |
| | December 31, 2018 | | December 31, 2017 | | | | | Consolidated | | |
| | Net Sales | | % Sales | | Net Sales | | % Sales | | Change | | Net Sales | | |
| | (dollars in millions) | | |
| | | (dollars in millions) | |
Americas | | $ | 1,032.1 | | 66.0 | % | $ | 951.9 | | 65.4 | % | $ | 80.2 | | 5.5 | % | | $ | 1,207.2 | | 66.7 | % | $ | 1,025.7 | | 68.0 | % | $ | 181.5 | | 12.0 | % |
Europe | | | 467.0 | | 29.8 | | | 440.3 | | 30.2 | | | 26.7 | | 1.8 | | | | 517.4 | | 28.6 | | | 424.9 | | 28.2 | | | 92.5 | | 6.1 | |
APMEA | | | 65.8 | | 4.2 | | | 64.5 | | 4.4 | | | 1.3 | | 0.1 | | | | 84.6 | | 4.7 | | | 58.0 | | 3.8 | | | 26.6 | | 1.8 | |
Total | | $ | 1,564.9 | | 100.0 | % | $ | 1,456.7 | | 100.0 | % | $ | 108.2 | | 7.4 | % | | $ | 1,809.2 | | 100.0 | % | $ | 1,508.6 | | 100.0 | % | $ | 300.6 | | 19.9 | % |
The change in net sales was attributable to the following:
| | | | | | | | | | | | | | | | | | | | | | | | | | | | |
| | | | | | | | | | | | | | | Change As a % | | Change As a % | |
| | | | | | | | | | | | | | | of Consolidated Net Sales | | of Segment Net Sales | |
| | | | | | | | | | | | | | | | | | | | | | | | | | | |
| | | Americas | | Europe | | APMEA | | Total | | Americas | | Europe | | APMEA | | Total | | Americas | | Europe | | APMEA | |
| | | | | | | | | | | | | | | | | | | | | | | | | | | | |
| | | | | | | | | | | | | | Change As a % | | Change As a % | | |
| | | | | | | | | | | | | | of Consolidated Net Sales | | of Segment Net Sales | | |
| | | | | | | | | | | | | | | | | | | | | | | | | | | |
| | Americas | | Europe | | APMEA | | Total | | Americas | | Europe | | APMEA | | Total | | Americas | | Europe | | APMEA | | |
| | (dollars in millions) | | |
| | | (dollars in millions) | |
Organic | | $ | 80.2 | | $ | 7.7 | | $ | 1.0 | | $ | 88.9 | | 5.5 | % | 0.5 | % | 0.1 | % | 6.1 | % | 8.4 | % | 1.8 | % | 1.6 | % | | $ | 170.7 | | $ | 71.9 | | $ | 17.5 | | $ | 260.1 | | 11.3 | % | 4.8 | % | 1.2 | % | 17.3 | % | 16.7 | % | 17.0 | % | 31.5 | % |
Foreign exchange | | | — | | | 19.0 | | | 0.3 | | | 19.3 | | — | | 1.3 | | — | | 1.3 | | — | | 4.3 | | 0.4 | | | | 5.5 | | | 20.6 | | | 3.8 | | | 29.9 | | 0.4 | | 1.3 | | 0.3 | | 2.0 | | 0.5 | | 4.8 | | 6.5 | |
Acquired/divested, net | | | | 5.3 | | | — | | | 5.3 | | | 10.6 | | 0.3 | | — | | 0.3 | | 0.6 | | 0.5 | | — | | 7.9 | |
Total | | $ | 80.2 | | $ | 26.7 | | $ | 1.3 | | $ | 108.2 | | 5.5 | % | 1.8 | % | 0.1 | % | 7.4 | % | 8.4 | % | 6.1 | % | 2.0 | % | | $ | 181.5 | | $ | 92.5 | | $ | 26.6 | | $ | 300.6 | | 12.0 | % | 6.1 | % | 1.8 | % | 19.9 | % | 17.7 | % | 21.8 | % | 45.9 | % |
Our products are sold to wholesalers, OEMs, DIY chains, and through various specialty channels. The change in organic net sales by channel was attributable to the following:
| | | | | | | | | | | | | | | | | | | | | | | | | |
| | | | | | | | | | | | | | | | | | Change As a % | |
| | | | | | | | | | | | | | | | | | of Prior Year Sales | |
| | | Wholesale | | OEMs | | DIY | | Specialty | | Total | | Wholesale | | OEMs | | DIY | | Specialty | |
| | | | | | | | | | | | | | | | | | | | | | | | | |
| | | | | | | | | | | | | | | | | Change As a % | | |
| | | | | | | | | | | | | | | | | of Prior Year Sales | | |
| | Wholesale | | OEMs | | DIY | | Specialty | | Total | | Wholesale | | OEMs | | DIY | | Specialty | | |
| | (dollars in millions) | | |
| | | (dollars in millions) | |
Americas | | $ | 44.0 | | $ | 4.3 | | $ | 7.1 | | $ | 24.8 | | $ | 80.2 | | 8.2 | % | 5.7 | % | 12.8 | % | 8.6 | % | | $ | 110.6 | | $ | 19.6 | | $ | 7.8 | | $ | 32.7 | | $ | 170.7 | | 19.1 | % | 25.8 | % | 9.6 | % | 11.3 | % |
Europe | | | 7.8 | | | 1.1 | | | (1.2) | | | — | | | 7.7 | | 2.7 | | 0.8 | | (31.1) | | — | | | | 40.2 | | | 31.4 | | | 0.3 | | | — | | | 71.9 | | 14.4 | | 21.9 | | 11.5 | | — | |
APMEA | | | 4.0 | | | (1.9) | | | — | | | (1.1) | | | 1.0 | | 7.1 | | (56.2) | | — | | (19.6) | | | | 17.1 | | | 0.5 | | | — | | | (0.1) | | | 17.5 | | 32.4 | | 16.1 | | — | | — | |
Total | | $ | 55.8 | | $ | 3.5 | | $ | 5.9 | | $ | 23.7 | | $ | 88.9 | | | | | | | | | | | $ | 167.9 | | $ | 51.5 | | $ | 8.1 | | $ | 32.6 | | $ | 260.1 | | | | | | | | | |
The increase in Americas organicOrganic net sales wasin the Americas increased primarily due to higher sales volume and increased pricingprice in all of our valve, drainage, and water quality products, which are sold primarily through the Wholesale, OEM and DIYs channels, andchannels. The higher volume in heating2021 was primarily supported by the global economic recovery, as well as strong repair and hot water products, which are sold throughreplacement activity and the specialty channel.positive impact on our wholesale and DIY channels from the February 2021 severe weather freeze in the South-Central U.S. We estimate the impact of the severe weather freeze drove approximately 3% of incremental sales for the region in 2021.
Organic net sales in Europe increased $7.7 million primarily due to higher volume and increased pricing. The higher salesprice, with volume wasgrowth in most regions in 2021 driven by the global economic recovery. More specifically, net sales increased due to higher demand in our plumbing products within the French wholesale market, in our HVAC products within the Italy and Germany OEM markets driven by government energy incentives, and due to the recovery in our marine-based drains electronics products and certain water and plumbing products sold through the wholesale channel. This was partially offset by ongoing product rationalization, especially in the DIY channel, as we continue to focus on our core product lines.second half of 2021.
Organic net sales in APMEA increased $1.0 million primarily due to increased saleshigher volumes in China, Australia, New Zealand and the Middle East, Australia, and New Zealand. These increases were partially offset by softnessprimarily from the global economic recovery. The sales growth in China and Korea, and product rationalization in the OEM channel.was primarily driven by higher demand for commercial valves within data centers.
The net increase in sales due to foreign exchange was mainlyprimarily due to the appreciation of the euro against the U.S. dollar in 2018.2021. We cannot predict whether foreign currencies will appreciate or depreciate against the U.S. dollar in future periods or whether future foreign exchange rate fluctuations will have a positive or negative impact on our net sales.
The change in net sales due to acquisitions/divestitures relates to three immaterial acquisitions, one in the APMEA segment in the third quarter of 2020, one in the Americas segment in the fourth quarter of 2020 and one in the Americas segment in the fourth quarter of 2021, partially offset by an immaterial divestiture in our APMEA segment during the third quarter of 2020.
Gross Profit. Gross profit and gross profit as a percent of net sales (gross margin) for 20182021 and 20172020 were as follows:
| | | | | | | | |
| | | Year Ended December 31, | |
| | | 2021 | | 2020 | |
| | | | | | | | |
| | Year Ended | | |
| | December 31, | | |
| | 2018 | | 2017 | | |
| | (dollars in millions) | | |
| | | (dollars in millions) | |
Gross profit | | $ | 656.5 | | $ | 602.4 | | | $ | 767.1 | | $ | 625.4 | |
Gross margin | | | 42.0 | % | | 41.4 | % | | | 42.4 | % | | 41.5 | % |
Gross profit and gross margin percentage increased compared to 2017, due to increased pricing,primarily from higher sales volume, price and productivity initiatives, and restructuring savings, which were partially offset by material and labor costs inflation, higher materiallogistic and freight costs mainly due to increased copperexpedite components and stainless steel commodity costs, as well as higher inbound transportation costsproduct, and general inflation.the return of expenses related to business normalization.
Selling, General and Administrative Expenses. Selling, general and administrative, or SG&A, expenses increased $32.4$75.8 million, or 7.5%17.5%, in 20182021 compared to 2017.2020. The increase in SG&A expenses was attributable to the following:
| | | | | | | |
| | (in millions) | | % Change | | |
| | | | | | | |
| | | (in millions) | | % Change | |
Organic | | $ | 27.3 | | 6.3 | % | | $ | 62.0 | | 14.3 | % |
Foreign exchange | | | 5.1 | | 1.2 | | | | 7.3 | | 1.7 | |
Acquired/divested, net | | | | 6.5 | | 1.5 | |
Total | | $ | 32.4 | | 7.5 | % | | $ | 75.8 | | 17.5 | % |
The organic increase was primarily related to investments in strategic growth initiatives of $16.7 million, including investments in research and development for new product initiatives, commercial excellence, and technology and information systems. The organic increase was also due to higher variable costs from the higher sales volume of $21.3 million, an increase in short-term and long-term compensation costs of $20.1 million based on expected attainment levels, an increase in investments of $17.8 million, including new products, commercial excellence, and technology, the return of expenses related to business normalization of $10.8 million, increased sales volume totaling $12.2 million, andgeneral inflation of $4.4$5.5 million, primarily relatedas well as product liability and insurance costs of $3.1 million compared to transportation costs.2020. These increases were partially offset by $18.2 million due to productivity and restructuring savings within the Americas and Europe of $3.6 million, as well as a decrease in amortization costs of $3.2 million for certain intangible assets that reached the end of their useful lives.savings. The increase in foreign exchange was mainly due to the appreciation of the euro against the U.S. dollar. The acquired/divested, net SG&A costs related to three immaterial acquisitions, partially offset by SG&A costs related to an immaterial divestiture. Total SG&A expenses, as a percentage of sales, were 29.7%28.1% in 2018 and 2017.2021 compared to 28.7% in 2020.
Restructuring.In 2018,2021, we recorded a net restructuring charge of $3.4 $19.3 million, primarily for costs related to a 2021 French restructuring actions associated with our European headquarters and cost savings initiatives within certain manufacturing facilitiesprogram that was approved in Europe, as compared to a net chargethe second quarter of $6.8 million in 2017. 2021. For a more detailed description of our current restructuring plans, see Note 3 of Notes to Consolidated Financial Statements in this Annual Report Form 10-K.
Other Long‑Lived Asset Impairment Charges.long-lived asset impairment charges.In 2017,2020, we recorded an impairment charges of $1.4 million in our Americas segment, primarily relating to $1.0 million primarilyfor a long-lived asset impairment charge and $0.4 million related to a technology intangible asset in which market value expectations indicated the Americas operating segment. See Note 7carrying amounts of Notes to Consolidated Financial Statementsthese assets were in this Annual Report on Form 10‑K for additional information regarding this impairment.excess of the fair value.
Operating Income (Loss). Operating income (loss) by geographic segment for 20182021 and 20172020 was as follows:
| | | | | | | | | | | | | |
| | | | | | | | | | | | | |
| | | | | | | | % Change to | |
| | | | | | | | Consolidated | |
| | | Year Ended December 31, | | | | | Operating | |
| | | 2021 | | 2020 | | Change | | Income | |
| | | | | | | | | | | | | |
| | | | | | | | | | | % Change to | | |
| | | | | | | | | | | Consolidated | | |
| | Year ended | | | | | Operating | | |
| | December 31, 2018 | | December 31, 2017 | | Change | | Income | | |
| | (dollars in millions) | | | | |
| | | (dollars in millions) | | | |
Americas | | $ | 171.1 | | $ | 146.8 | | $ | 24.3 | | 15.0 | % | | $ | 211.0 | | $ | 166.3 | | $ | 44.7 | | 24.7 | % |
Europe | | | 49.8 | | | 47.6 | | | 2.2 | | 1.4 | | | | 63.6 | | | 50.2 | | | 13.4 | | 7.4 | |
APMEA | | | 7.2 | | | 4.7 | | | 2.5 | | 1.5 | | | | 14.4 | | | 3.5 | | | 10.9 | | 6.0 | |
Corporate | | | (39.7) | | | (36.8) | | | (2.9) | | (1.8) | | | | (49.4) | | | (38.9) | | | (10.5) | | (5.8) | |
Total | | $ | 188.4 | | $ | 162.3 | | $ | 26.1 | | 16.1 | % | | $ | 239.6 | | $ | 181.1 | | $ | 58.5 | | 32.3 | % |
The increase (decrease) in operating income (loss) is attributable to the following:
| | | | | | | | | | | | | | | | | | | | | | | | | | | | | | | | | | | |
| | | | | | | | | | | | | | | | | | Change As a % of | | Change As a % of | |
| | | | | | | | | | | | | | | | | | Consolidated Operating Income | | Segment Operating Income | |
| | | | | | | | | | | | | | | | | | | | | | | | | | | | | | | | | | |
| | | Americas | | Europe | | APMEA | | Corporate | | Total | | Americas | | Europe | | APMEA | | Corporate | | Total | | Americas | | Europe | | APMEA | | Corporate | |
| | | | | | | | | | | | | | | | | | | | | | | | | | | | | | | | | | | |
| | | | | | | | | | | | | | | | | Change As a % of | | Change As a % of | | |
| | | | | | | | | | | | | | | | | Consolidated Operating Income | | Segment Operating Income | | |
| | | | | | | | | | | | | | | | | | | | | | | | | | | | | | | | | | |
| | Americas | | Europe | | APMEA | | Corporate | | Total | | Americas | | Europe | | APMEA | | Corporate | | Total | | Americas | | Europe | | APMEA | | Corporate | | |
| | (dollars in millions) | | |
| | | (dollars in millions) | |
Organic | | $ | 20.2 | | $ | 0.5 | | $ | 2.1 | | $ | (2.9) | | $ | 19.9 | | 12.5 | % | 0.3 | % | 1.3 | % | (1.8) | % | 12.3 | % | 13.8 | % | 1.1 | % | 44.7 | % | (7.9) | % | | $ | 36.7 | | $ | 28.2 | | $ | 7.2 | | $ | (10.6) | | $ | 61.5 | | 20.3 | % | 15.5 | % | 4.0 | % | (5.9) | % | 33.9 | % | 22.1 | % | 56.2 | % | — | % | 27.3 | % |
Foreign exchange | | | — | | | 1.9 | | | (0.1) | | | — | | | 1.8 | | — | | 1.2 | | (0.1) | | — | | 1.1 | | — | | 4.0 | | (2.1) | | — | | | | 0.9 | | | 3.4 | | | 0.6 | | | — | | | 4.9 | | 0.5 | | 1.9 | | 0.3 | | — | | 2.7 | | 0.5 | | 6.8 | | — | | — | |
Acquired | | | | (0.7) | | | — | | | 0.8 | | | — | | | 0.1 | | (0.4) | | — | | 0.4 | | — | | — | | (0.4) | | — | | — | | — | |
Restructuring, impairment charges | | | 4.1 | | | (0.2) | | | 0.5 | | | — | | | 4.4 | | 2.5 | | (0.1) | | 0.3 | | — | | 2.7 | | 2.7 | | (0.4) | | 10.6 | | — | | | | 7.8 | | | (18.2) | | | 2.3 | | | 0.1 | | | (8.0) | | 4.3 | | (10.0) | | 1.3 | | 0.1 | | (4.3) | | 4.7 | | (36.3) | | — | | (0.3) | |
Total | | $ | 24.3 | | $ | 2.2 | | $ | 2.5 | | $ | (2.9) | | $ | 26.1 | | 15.0 | % | 1.4 | % | 1.5 | % | (1.8) | % | 16.1 | % | 16.5 | % | 4.7 | % | 53.2 | % | (7.9) | % | | $ | 44.7 | | $ | 13.4 | | $ | 10.9 | | $ | (10.5) | | $ | 58.5 | | 24.7 | % | 7.4 | % | 6.0 | % | (5.8) | % | 32.3 | % | 26.9 | % | 26.7 | % | — | % | 27.0 | % |
OrganicThe increase in organic operating income increased $19.9 million in 2018 compared to 2017, mainlywas due to increased pricing, higher sales volume, price, savings from productivity initiatives operating savings fromand restructuring actions and reduced transformation and restructuring costs. This increase in operating income wasresponse to the COVID-19 pandemic. These increases were partially offset by material and labor costs inflation, higher materiallogistics and freight costs, duethe return of expenses related to increases in the price of copperbusiness normalization, compensation costs and stainless steel, investments in strategic growth initiatives and general inflation.investments.
Interest Expense.Interest expense decreased $2.8$7.0 million, or 14.7%52.6%, in 20182021 as compared 2017to 2020 primarily due to a decline in interest rates as well as a reduction in ourthe principal balance of debt outstanding. As a result of the 2017 Tax Act, we repatriated approximately $127 million of undistributed foreign earnings and used the majority of that cash to reduce our outstanding debt. The impact of the lower
outstanding principal balance was partially offset by increased interest rates in 2018 compared to 2017. Refer to Note 1211 of Notes to
Consolidated Financial Statements in this Annual Report on Form 10‑K Form10-K for further details.
Other (income) expense, net.Other (income) expense increased $2.8$1.8 million to a net otheran income balance of $1.7$0.8 million compared to 2017.2020. The increase was primarily due to more favorable net foreign currency gains.transaction gains.
Income Taxes.Our effective income tax rate changeddecreased to 26.7%29.2% in 2018,2021, from 48.9%31.6% in 2017.2020. The tax rate decreased primarily due to finalizingbecause the impactinclusion of the 2017 Tax Actan increase in the fourth quartervaluation allowance in the prior year income tax rate as a result of 2018,2020 final tax regulations, which was enacted on December 22, 2017, and resulted in significant changespartially offset by the net tax adjustment related to the U.S. corporate income tax system. These changes include lowering the corporate tax rate from 35% to 21% in 2018, implementing a territorial tax system, and imposing a one-time deemed repatriation Toll Tax on cumulative undistributed foreign earnings.restructuring of our Mexican manufacturing supply chain operations.
During the year ended December 31, 2017, we recorded a provisional charge of $25.1 million related to our current estimate of the provisions of the 2017 Tax Act, including an estimated $23.3 million expense under the Toll Tax. During the year ended December 31, 2018 we finalized the impact of the 2017 Tax Act and recorded a benefit of $3.7 million, reducing the net impact of the 2017 Tax Act to $21.4 million, and increasing the Toll Tax to $33.5 million.
Net Income.Net income for 20182021 was $128.0$165.7 million, or $3.73$4.88 per common share on a diluted basis, compared to $73.1$114.3 million, or $2.12$3.36 per common share on a diluted basis, for 2017. 2020. Results for 20182021 include $3.7 million, or $0.11 per common share, in a tax benefit related to the finalization of the 2017 Tax Act, partially offset by an after-tax charge of $2.5$14.1 million, or $0.07$0.42 per common share, for restructuring and other tax adjustments of $1.5$7.2 million, or $0.04 per common share.
Results for 2017 include a charge of $25.1 million within income tax expense, or $0.73 per common share, related to the estimated impact of the 2017 Tax Act, $1.9 million, or $0.06$0.22 per common share, for an income tax adjustment related to the Europe and Americas transformation costs; $4.7restructuring of our Mexican manufacturing supply chain operations.
Results for 2020 include an after-tax charge of $7.4 million, or $0.14$0.22 per common share, for restructuring charges; $0.6restructuring; $9.7 million, or $0.02$0.28 per common share, for long-lived asset impairment charges, partially offset by $1.6 million or $0.05 per common sharechanges in tax benefits.
Year Ended December 31, 2017 Compared to Year Ended December 31, 2016
Prior to 2017, our Europe segment was formerly referred to as EMEA (Europe, Middle East, and Africa) and our APMEA segment was formerly referred to as Asia-Pacific. As of January 1, 2017, we began reporting the results of Watts Industries Middle East, an indirect, wholly owned subsidiary, within our APMEA segment to align with internal operating changes. These results had previously been reported within our former EMEA segment. This change did not affect our reportable segments but represented only a change in composition that better aligned with the structure of our internal organization. The 2016 results by segment have been retrospectively revised for comparative purposes.
Net Sales. Our business is reported in three geographic segments: Americas, Europe and APMEA. Our net sales in each of these segments for the years ended December 31, 2017 and 2016 were as follows:
| | | | | | | | | | | | | | | | |
| | Year Ended | | Year Ended | | | | | % Change to | |
| | December 31, 2017 | | December 31, 2016 | | | | | Consolidated | |
| | Net Sales | | % Sales | | Net Sales | | % Sales | | Change | | Net Sales | |
| | (dollars in millions) | |
Americas | | $ | 951.9 | | 65.4 | % | $ | 900.9 | | 64.5 | % | $ | 51.0 | | 3.6 | % |
Europe | | | 440.3 | | 30.2 | | | 431.3 | | 30.8 | | | 9.0 | | 0.7 | |
APMEA | | | 64.5 | | 4.4 | | | 66.2 | | 4.7 | | | (1.7) | | (0.1) | |
Total | | $ | 1,456.7 | | 100.0 | % | $ | 1,398.4 | | 100.0 | % | $ | 58.3 | | 4.2 | % |
The change in net sales was attributable to the following:
| | | | | | | | | | | | | | | | | | | | | | | | | | | |
| | | | | | | | | | | | | | Change as a % | | Change as a % | |
| | | | | | | | | | | | | | of Consolidated Net Sales | | of Segment Net Sales | |
| | | | | | | | | | | | | | | | | | | | | | | | | | |
| | Americas | | Europe | | APMEA | | Total | | Americas | | Europe | | APMEA | | Total | | Americas | | Europe | | APMEA | |
| | (dollars in millions) | |
Organic | | $ | 7.4 | | $ | 2.5 | | $ | (2.9) | | $ | 7.0 | | 0.5 | % | 0.2 | % | (0.2) | % | 0.5 | % | 0.8 | % | 0.6 | % | (4.6) | % |
Foreign exchange | | | 1.4 | | | 6.5 | | | (0.1) | | | 7.8 | | 0.1 | | 0.5 | | — | | 0.6 | | 0.1 | | 1.5 | | — | |
Divested | | | (3.5) | | | — | | | — | | | (3.5) | | (0.3) | | — | | — | | (0.3) | | (0.4) | | — | | — | |
Acquisitions | | | 45.7 | | | — | | | 1.3 | | | 47.0 | | 3.3 | | — | | 0.1 | | 3.4 | | 5.1 | | — | | 2.0 | |
Total | | $ | 51.0 | | $ | 9.0 | | $ | (1.7) | | $ | 58.3 | | 3.6 | % | 0.7 | % | (0.1) | % | 4.2 | % | 5.6 | % | 2.1 | % | (2.6) | % |
The change in organic net sales as a percentage of consolidated net sales and of segment net sales in the Americas excludes divested sales for both periods presented.
Our products are sold to wholesalers, OEMs, DIY chains and through various specialty channels. The change in organic net sales by channel was attributable to the following:
| | | | | | | | | | | | | | | | | | | | | | | | |
| | | | | | | | | | | | | | | | | Change As a % |
| | | | | | | | | | | | | | | | | of Prior Year Sales |
| | Wholesale | | OEMs | | DIY | | Specialty | | Total | | Wholesale | | OEMs | | DIY | | Specialty | |
| | (dollars in millions) | |
Americas | | $ | 19.9 | | $ | 1.9 | | $ | (5.0) | | $ | (9.4) | | $ | 7.4 | | 3.9 | % | 2.6 | % | (8.4) | % | (3.7) | % |
Europe | | | 7.6 | | | (3.3) | | | (1.8) | | | — | | | 2.5 | | 2.7 | | (2.3) | | (32.9) | | — | |
APMEA | | | 2.0 | | | (4.9) | | | — | | | — | | | (2.9) | | 3.4 | | (59.6) | | — | | — | |
Total | | $ | 29.5 | | $ | (6.3) | | $ | (6.8) | | $ | (9.4) | | $ | 7.0 | | | | | | | | | |
The organic sales increase of $7.0 million was partially muted by the $15.1 million impact of our ongoing product rationalization efforts across our regions, as we continue to focus on our core product lines. The product rationalization mainly affected our DIY and OEM channels.
Organic net sales in the Americas increased $7.4 million mainly from growth in the wholesale channel, driven by valve, HVAC, and drainage products. This increase was partially offset by declines in the specialty channels, where we experienced weakness in our tankless water heater and condensing boiler products. There was also a decrease in the DIY channel due to the product rationalization discussed above.
Organic net sales in Europe increased $2.5 million primarily due to growth in the wholesale channel from increased sales of our drains products. This increase was also due to higher demand for our electronics products in Germany. These increases were partially offset by product rationalization and reduced demand for our HVAC products in Italy.
Organic net sales in APMEA decreased $2.9 million driven primarily by the impact of product rationalization. This decrease was offset partly by higher demand in China for our residential underfloor heating products and commercial valves products, as well as growth in South Korea from an expanded product offering.
The net increase in sales due to foreign exchange was primarily due to the appreciation of the euro and the Canadian dollar against the U.S. dollar in 2017. We cannot predict whether foreign currencies will appreciate or depreciate against the U.S. dollar in future periods or whether future foreign exchange rate fluctuations will have a positive or negative impact on our net sales.
The decrease in total net sales due to divested products of $3.5 million relates to the discontinuation of product lines we divested by the end of the first quarter of 2016 in the Americas segment as part of our Americas transformation program.
The increase in net sales from acquisitions in the Americas and APMEA segments are related to the fourth quarter 2016 acquisition of PVI and the first quarter 2016 acquisition of Watts Korea, respectively.
Gross Profit. Gross profit and gross profit as a percent of net sales (gross margin) for 2017 and 2016 were as follows:
| | | | | | | |
| | Year Ended | |
| | December 31, 2017 | | December 31, 2016 | |
| | (dollars in millions) | |
Gross profit | | $ | 602.4 | | $ | 565.6 | |
Gross margin | | | 41.4 | % | | 40.5 | % |
The increase in gross margin percentage is attributable to increased volume, manufacturing productivity, changes to our product mix, and incremental savings from our transformation and restructuring programs primarily within the Americas and Europe.
Selling, General and Administrative Expenses.Selling, general and administrative, or SG&A, expenses increased $8.2 million, or 1.9%, in 2017 compared to 2016. The increase in SG&A expenses was attributable to the following:
| | | | | | |
| | (in millions) | | % Change | |
Organic | | $ | (7.3) | | (1.7) | % |
Foreign exchange | | | 1.7 | | 0.4 | |
Acquisitions | | | 13.8 | | 3.2 | |
Total | | $ | 8.2 | | 1.9 | % |
SG&A expenses increased primarily as a result of our 2016 acquisitions of PVI and Watts Korea, as well as increases in foreign exchange primarily from the appreciation of the euro and the Canadian dollar against the U.S. dollar compared to 2016. Organically SG&A expenses decreased $7.3 million compared to 2016, primarily related to a decline in product liability costs of $9.4 million, lower transformation costs of $8.1 million as we completed our transformation program in 2017, and lower property tax and other tax charges of $1.1 million. The decline in product liability costs was primarily due to the resolution of the class action lawsuits related to certain legacy claims for undifferentiated products which we have exited, and the associated reduction in reported claims. The organic decrease was partially offset by $8.2 million for investments in strategic initiatives, which includes $2.5 million in research and development costs, and $4.2 million of higher distribution and freight costs. Total SG&A expenses, as a percentage of sales, were 29.7% in 2017 compared to 30.3% in 2016.
Restructuring.In 2017, we recorded a net charge of $6.8 million, primarily for the transformation of our Americas business, involuntary terminations and other costs incurred as part of our restructuring initiatives, as compared to a net charge of $4.7 million in 2016. For a more detailed description of our current restructuring plans, see Note 3 of Notes to Consolidated Financial Statements in this Annual Report Form 10-K.
Other Long‑Lived Asset Impairment Charges.In 2017, we recorded an impairment of $1.0 million, primarily related to a technology asset in the Americas operating segment. In 2016, we recorded impairment charges of $0.5 million, primarily related to an indefinite lived tradename in the Europe operating segment. See Note 7 of Notes to Consolidated Financial Statements in this Annual Report on Form 10‑K for additional information regarding these impairments.
Gain on disposition. In the second quarter of 2016, we recorded a pre-tax gain of $8.7 million related to the sale of a China subsidiary that was dedicated to the production of non-core products and part of the transformation of our Americas and APMEA businesses. The pre-tax gain included a non-cash accumulated currency translation adjustment of $7.3 million.
Operating Income (loss). Operating income (loss) by geographic segment for 2017 and 2016 was as follows:
| | | | | | | | | | | | |
| | | | | | | | | | | % Change to | |
| | Year Ended | | | | | Consolidated | |
| | December 31, | | December 31, | | | | | Operating | |
| | 2017 | | 2016 | | Change | | Income | |
| | (Dollars in millions) | |
Americas | | $ | 146.8 | | $ | 127.1 | | $ | 19.7 | | 13.6 | % |
Europe | | | 47.6 | | | 40.0 | | | 7.6 | | 5.2 | |
APMEA | | | 4.7 | | | 15.1 | | | (10.4) | | (7.2) | |
Corporate | | | (36.8) | | | (37.2) | | | 0.4 | | 0.3 | |
Total | | $ | 162.3 | | $ | 145.0 | | $ | 17.3 | | 11.9 | % |
The increase (decrease) in operating income (loss) is attributable to the following:
| | | | | | | | | | | | | | | | | | | | | | | | | | | | | | | | | | |
| | | | | | | | | | | | | | | | | Change as a % of | | Change as a % of | |
| | | | | | | | | | | | | | | | | Consolidated Operating Income | | Segment Operating Income | |
| | | | | | | | | | | | | | | | | | | | | | | | | | | | | | | | | |
| | Americas | | Europe | | APMEA | | Corporate | | Total | | Americas | | Europe | | APMEA | | Corporate | | Total | | Americas | | Europe | | APMEA | | Corporate | |
| | (Dollars in millions) | |
Organic | | $ | 19.1 | | $ | 6.5 | | $ | (1.4) | | $ | 1.0 | | $ | 25.2 | | 13.2 | % | 4.5 | % | (1.0) | % | 0.7 | % | 17.4 | % | 15.0 | % | 16.3 | % | (9.3) | % | 2.7 | % |
Foreign exchange | | | 0.2 | | | 0.4 | | | — | | | — | | | 0.6 | | 0.1 | | 0.3 | | — | | — | | 0.4 | | 0.2 | | 1.0 | | — | | — | |
Acquisitions | | | 2.9 | | | — | | | — | | | — | | | 2.9 | | 2.0 | | — | | — | | — | | 2.0 | | 2.3 | | — | | — | | — | |
Gain on disposition | | | — | | | — | | | (8.7) | | | — | | | (8.7) | | — | | — | | (6.0) | | — | | (6.0) | | — | | — | | (57.6) | | — | |
Restructuring | | | (2.5) | | | 0.7 | | | (0.3) | | | (0.6) | | | (2.7) | | (1.7) | | 0.4 | | (0.2) | | (0.4) | | (1.9) | | (2.0) | | 1.7 | | (2.0) | | (1.6) | |
Total | | $ | 19.7 | | $ | 7.6 | | $ | (10.4) | | $ | 0.4 | | $ | 17.3 | | 13.6 | % | 5.2 | % | (7.2) | % | 0.3 | % | 11.9 | % | 15.5 | % | 19.0 | % | (68.9) | % | 1.1 | % |
The increase in consolidated operating income was primarily driven by increased volume and gross margin improvements in the Americas, as well as savings from our restructuring initiatives in Europe. The increase in operating income was also driven by reduced transformation costs compared to 2016 in the Americas and APMEA as our transformation program was completed in 2017. Contributing to the increase in consolidated operating income was $2.9 million from the acquisition of PVI. Included in operating income in 2016 was an $8.7 million gain on a disposition of a China subsidiary.
Interest Expense.Interest expense decreased $3.5 million, or 15.5%, in 2017 from 2016 as we repaid over $150 million in outstanding debt during 2017. Further, our weighted average interest rate decreased marginally year to year as we retired higher cost private placement debt in the middle of 2016, and replaced it with lower cost revolver debt. We also replaced certain U.S. based revolver debt with lower cost euro denominated debt in late 2016. Refer to Note 12 of the Notes to Consolidated Financial Statements in this Annual Report on Form 10-K for further details.
Other expense (income), net. Other expense (income), net, decreased $5.5 million to a net expense balance of $1.1 million in 2017 as compared to a net other income balance of ($4.4) million in 2016. Included in other income in 2016 was a $1.7 million non-cash gain recognized on the acquisition of Watts Korea. The remaining decrease is primarily due to net foreign currency transaction losses in 2017.
Income Taxes.Our effective income tax rate changed to 48.9% in 2017, from 34.1% in 2016. The tax rate increased primarily due to the impact of the 2017 Tax Act, which was enacted on December 22, 2017, and has resulted in significant changes to the U.S. corporate income tax system. These changes include lowering the corporate tax rate from 35% to 21% in 2018, implementing a territorial tax system, and imposing a one-time deemed repatriation Toll Tax on cumulative undistributed foreign earnings.
Net Income. Net income for 2017 was $73.1 million, or $2.12 per common share, compared to $84.2 million, or $2.44 per common share, for 2016. Results for 2017 include a charge of $25.1 million within income tax expense, or $0.73 per common share, related to the impact of the 2017 Tax Act, $1.9 million, or $0.06 per common share, for the Europe and Americas transformation costs; $4.7 million, or $0.14 per common share, for restructuring charges; $0.6 million, or $0.02 per common share for long-lived asset impairment charges, partially offset by $1.6 million or $0.05 per common share in tax benefits.
Results for 2016 include after-tax benefits of $8.3 million, or $0.24 per common share, for a gain on disposition andregulations; $1.0 million, or $0.03 per common share, for a gain on acquisition of Watts Korea, offset by an after-tax charge of $8.8 million, or $0.26 per common share, for the Europe and Americas transformation deployment costs; $3.2 million, or
$0.09 per common share, for restructuringother long-lived asset impairment charges; $1.3 million, or $0.04 per common share, for purchase accounting adjustments related to our acquisitions in 2016; $1.2$1.0 million, or $0.03 per common share, for acquisition costs in 2016; and $2.6related costs; $0.8 million, or $0.08$0.02 per common share, for other items, primarily related to tax charges related tofootprint optimization; partially offset by a $1.5 million benefit, or $0.04 per share for the transformation.elimination of an earnout from a prior immaterial acquisition in our Americas segment, and $0.7 million, or $0.02 per common share of a net gain on disposal.
Liquidity and Capital Resources
20182021 Cash Flows
We generated $169.4$180.8 million of net cash from operating activities in 20182021 as compared to $155.9$228.8 million of netin 2020. The decrease in cash generated from operating activities in 2017. The increase was primarily relateddue to higher net incomea proactive decision to increase inventory in response to a combination of strong market demand and disrupted supply chains, partially offset by the timing of working capital fluctuations, additional tax payments, including payments made for the Toll Tax and withholdings on repatriated cash as a result of the 2017 Tax Act.higher net income.
We used $35.9$30.7 million of net cash for investing activities in 20182021 compared to $27.3$54.8 million used in 2017.2020. We used $6.5spent $17.1 million more cashless on capital expenditures and $6.1 million less for acquisitions in 20182021 compared to purchase capital equipment and used $1.6 million for immaterial acquisitions and other investments. 2020. We received $1.1$5.1 million less in cash proceeds from the sale of assets and property, plant and equipment compared to 2017. We anticipate investing between $35 million to $40 million in capital equipment in 2019 to improve our manufacturing capabilities.2021.
We used $202.9$118.6 million of net cash from financing activities in 20182021 primarily due to payments of long-term debt repayments of $194.5$95.0 million, dividend payments of $28.3$34.3 million, tax withholding payments on vested stock awards of $9.6 million and payments of $16.0 million to repurchase approximately 340,000110,000 shares of Class A common stock at a cost of $26.0 million. This wasstock. These payments were partially offset by proceeds from additional drawdowns on our line of credit totaling $40.0 million.
On March 30, 2021, we and certain of $50.0our subsidiaries entered into a Second Amended and Restated Credit Agreement (the “Second Amended Credit Agreement”) with JPMorgan Chase Bank, N.A., as administrative agent. The Second Amended Credit Agreement amends and restates the Amended Credit Agreement (defined below) to extend the maturity date of the $800 million during 2018.
Onsenior unsecured revolving credit facility from February 12, 2016,2022 to March 30, 2026. Among other changes, the Second Amended Credit Agreement increases our maximum consolidated leverage ratio (including both the base ratio and the ratio permitted during temporary step-ups following certain acquisitions), adjusts certain fees to reflect market conditions and reduces the 1.00% floor on the adjusted LIBOR rate to 0.00%.The senior unsecured revolving credit facility under the Second Amended Credit Agreement (the " New Revolving Credit Facility") also includes sublimits of $100 million for letters of credit and $15 million for swing line loans. As of December 31, 2021, we had drawn down $145.0 million on this line of credit and had $14.0 million in letters of credit outstanding, which resulted in $641.0 million of unused and available credit under the New Revolving Credit Facility. Borrowings outstanding under the New Revolving Credit Facility bear interest at a fluctuating rate per annum equal to an applicable percentage defined as (i) in the case of Eurocurrency rate loans, the adjusted British Bankers Association LIBOR rate plus an applicable percentage, ranging from 1.075% to 1.325%, determined by reference to our consolidated leverage ratio, or (ii) in the case of alternate base rate loans and swing line loans, interest (which at all times will not be less than 1.00%) at the greatest of (a) the Prime Rate in effect on such day, (b) the FRBNY Rate in effect on such day plus 0.50% and (c) the adjusted LIBOR rate plus 1.00% for a one month interest period in dollars. The weighted average interest rate on debt outstanding under the New Revolving Credit Facility as of December 31, 2021 was 1.17%. The weighted average interest rate on debt outstanding inclusive of the interest rate swap discussed in Note 5 of the Notes to Consolidated Financial Statements and interest rates under the New Revolving Credit Facility as of December 31, 2021 was 1.82%. In addition to paying interest under the Second Amended Credit Agreement, we are also required to pay certain fees in connection with the New Revolving Credit Facility, including, but not limited to, an unused facility fee and letter of credit fees. The Second Amended Credit Agreement matures on March 30, 2026, subject to extension under certain circumstances and subject to the terms of the Second Amended Credit Agreement. We may repay loans outstanding under the Second Amended Credit Agreement from time to time without premium or penalty, other than customary breakage costs, if any, and subject to the terms of the Second Amended Credit Agreement. As of December 31, 2021, we were in compliance with all covenants related to the Second Amended Credit Agreement.
On April 24, 2020, we and certain of our subsidiaries entered into the Amended and Restated Credit Agreement among the Company, certain subsidiaries of the Company who become borrowers under the Credit Agreement,with JPMorgan Chase Bank, N.A., as Administrative Agent, Swing Line Lender and Letter of Credit Issuer, and the other lenders referred to therein.therein (the “Amended Credit Agreement”). The Amended Credit Agreement provides for aamended and restated the previous Credit Agreement (the “Prior Credit Agreement”) in its entirety while increasing the amount of revolving credit available from $500 million five‑to $800 million and extending the maturity by one additional year to February 2022. The senior unsecured revolving credit facility (the “Revolving Credit Facility”) with a sublimitalso included sublimits of up to $100 million infor letters of credit.credit and $15 million for swing line loans. The Credit Agreement also provided for a $300 million, five‑year, term loan facility (the “Term Loan Facility”) available to us in a single draw. Theunder the Prior Credit Agreement matureswas terminated and paid off effective April 24, 2020. Borrowings outstanding under the Revolving Credit Facility bore interest at a fluctuating rate per annum equal to an applicable percentage defined as (i) in the case of Eurocurrency rate loans, the adjusted British Bankers Association LIBOR rate (which at all times was not less than 1.00%) plus an applicable percentage, ranging from 1.50% to 2.10%, determined by reference to our consolidated leverage ratio, or (ii) in the case of alternate base rate loans and swing line loans, interest (which at all times was not less than 2.00%) at the
greatest of (a) the Prime Rate in effect on February 12, 2021, subject to extension under certain circumstancessuch day, (b) the FRBNY Rate in effect on such day plus 0.50% and subject to(c) the terms of the Credit Agreement. adjusted LIBOR rate plus 1.00% for a one month interest period in dollars.
As of December 31, 2018, we had $255.0 million of borrowings outstanding on the Term Loan Facility and $25.0 million drawn on the Revolving Credit Facility; had $25.8 million of stand-by letters of credit outstanding and had $449.2 million of unused and available credit under the Revolving Credit Facility.
We have historically financed our operating and capital needs primarily through cash flows generated by our operations. We expect to continue funding future operating requirements principally through our cash flows from operations, in addition to existing cash resources. We believe that our existing funds, when combined with cash generated from operations and our ability to access additional financing resources, if needed, are sufficient to satisfy our operating, working capital, strategic initiatives, capital expenditure and debt service requirements for the foreseeable future. In addition, we may choose to opportunistically return cash to shareholders and pursue other business initiatives, including acquisition activities. We may, from time to time, also seek additional funding through a combination of equity and debt financings should we identify a significant new opportunity.
As of December 31, 2018,2021, we held $204.1$242.0 million in cash and cash equivalents. Of this amount, $164.4$195.9 million of cash and cash equivalents werewas held by foreign subsidiaries. The 2017 Tax Act requires us to pay a one-time deemed repatriation toll charge on cumulative undistributed foreign earnings as of December 31, 2017, for which we had not previously recorded U.S. taxes. Cumulative earnings in the form of cash and cash equivalents, as defined in the 2017 Tax Act, were taxed at a rate of 15.5% and all other earnings were taxed at a rate of 8.0%. Our obligation associated with this one-time deemed repatriation toll charge is $33.5 million, which is being paid in installments over eight years, starting in 2018, and will not accrue interest. We have paid $14.6 million of the Toll Tax as of December 31, 2018. During 2018, we repatriated approximately $127 million of cash back to the U.S. on cumulative undistributed foreign earnings as of December 31, 2017, and have used the majority of that cash to reduce our outstanding debt. Our U.S. operations typically generate sufficient cash flows to meet our domestic obligations. However, if we did have to borrow to fund some or all of our expected cash outlay,outlays, we can do so at reasonable interest rates by utilizing the uncommittedundrawn borrowings under our New Revolving Credit Facility. We believe that our financial resources allow us to manage the anticipated impacts of the COVID-19 pandemic on our business operations for the foreseeable future. We anticipate the impacts of COVID-19 will continue to evolve, and, as a result we will continue to evaluate our financial position as additional information becomes available, particularly relating to COVID-19. Subsequent to recording the Toll Tax as part of the Tax Cuts and Jobs Act of 2017, our intent is to permanently
reinvest undistributed earnings of foreign subsidiaries, and we do not have any current plans to repatriate post-Toll Tax foreign earnings to fund operations in the United States. However, if amounts held by foreign subsidiaries were needed to fund operations in the United States, we could be required to accrue and pay taxes to repatriate these funds. Such charges may include potential state income taxes and other tax charges.
Covenant complianceCompliance
Under the Second Amended Credit Agreement, we are required to satisfy and maintain specified financial ratios and other financial condition tests as of December 31, 2018.2021. The financial ratios includedinclude a consolidated interest coverage ratio based on consolidated earnings before income taxes, interest expense, depreciation, and amortization (Consolidated EBITDA) to consolidated interest expense, as defined in the Second Amended Credit Agreement. OurThe Second Amended Credit Agreement defineddefines Consolidated EBITDA to exclude unusual or non‑recurringnon-recurring charges and gains. We wereare also required to maintain a consolidated leverage ratio of consolidated funded debt to Consolidated EBITDA. Consolidated funded debt, as defined in the Second Amended Credit Agreement, includedincludes all long and short‑termshort-term debt, capitalfinance lease obligations and any trade letters of credit that are outstanding, less cash and cash equivalents on the balance sheet that exceeded $50 million.sheet.
As of December 31, 2018,2021, our actual financial ratios calculated in accordance with ourthe Second Amended Credit Agreement compared to the required levels under the Second Amended Credit Agreement were as follows:
| | | | |
|
| ActualRatio |
| Required Level |
| | ActualRatio
| | Required Level
|
| | | | Minimum level |
Interest Charge Coverage Ratio | | 15.6851.4 to 1.00
| | 3.50 to 1.00 |
| | | | Maximum level |
Leverage Ratio | | 0.800.00 to 1.00
| | 3.253.50 to 1.00
|
As of December 31, 2018,2021, we were in compliance with all covenants related to the Second Amended Credit Agreement.
We have one senior note agreement as further detailed in Note 12 of Notes to Consolidated Financial Statements in this Annual Report Form 10-K. This senior note agreement requires us to maintain a fixed charge coverage ratio of consolidated EBITDA plus consolidated rent expense during the period to consolidated fixed charges. Consolidated fixed charges are the sum of consolidated interest expense for the period and consolidated rent expense.
As of December 31, 2018, our actual fixed charge coverage ratio calculated in accordance with our senior note agreements compared to the required ratio therein was as follows:
| | | | |
| | Actual Ratio
| | Required Level
|
| | | | Minimum level
|
Fixed Charge Coverage Ratio
| | 8.03 to 1.00
| | 2.00 to 1.00
|
In addition to financial ratios, the Second Amended Credit Agreement and senior note agreement containcontains affirmative and negative covenants that include limitations on disposition or sale of assets, prohibitions on assuming or incurring any liens on assets with limited exceptions and limitations on making investments other than those permitted by the agreements.agreement.
Working capital (defined as current assets less current liabilities) as of December 31, 20182021 was $372.6$453.0 million compared to $456.2$396.7 million as of December 31, 2017.2020. The ratio of current assets to current liabilities was 2.1 to 1 as of December 31, 20182021 compared to 2.42.3 to 1 as of December 31, 2017.2020. The decreaseincrease in working capital is primarily related to a reductionthe increase in cash and cash equivalentsinventory as a result of using repatriatedthe supply chain disruptions.
Material Cash Requirements
We expect existing cash and cash equivalents and cash flows from operations and financing activities to reducebe sufficient to meet our outstanding debt.cash needs for the next 12 months and thereafter for the foreseeable future.
2017 Cash FlowsWe anticipate investing between $40 million to $50 million in capital expenditures in the next 12 months to improve our manufacturing capabilities and invest in technology and other commercial and operational excellence initiatives.
We generated $155.9anticipate spending approximately $15 million of net cash from operating activities in 2017 as compared to $138.1 million of net cash generated from operating activities in 2016. The increase was primarilythe next 12 months related to higher net income after excluding the non-cash effectFrench restructuring program that was approved in 2021. For a more detailed description of the 2017 Tax Act and the impactour current restructuring plans, see Note 3 of non-cash adjustments, partially offset by the timing of working capital fluctuations comparedNotes to 2016. We generated $126.9 million of free cash flow (a non‑GAAP financial measure, which we reconcile below, defined as net cash provided by operating activities minus capital expenditures plus proceeds from sale of assets), compared to free cash flow of $102.2 millionConsolidated Financial Statements in 2016. this Annual Report Form 10-K.
We used $27.3 million of net cash for investing activities in 2017 comparedintend to $114.0 million in 2016. We used $88.1 million less cash in 2017 for acquisitions as 2016 included the acquisition of PVI and Watts Korea. We used $6.6 million less cash for purchases of capital equipment comparedcontinue to 2016. The decrease in cash used for investing activities was partially offset by a $1.5 million purchase of additional intangible assets, and $6.8 million less cash generated from the sale of assets in 2017.
We used $205.3 million of net cash from financing activities in 2017 primarily due to payments of long-term debt of $178.0 million, dividend payments of $25.9 million, and payments to repurchase approximately 278,000 shares of Class A common stock at a costconsistent with prior years. The repurchases are executed from time to time on the open market or in privately negotiated transactions. The timing and number of $18.2 million. This was partially offset by proceeds from an additional drawshares repurchased will be determined based on our lineevaluation of market conditions and other factors, see Note 12 of Notes to Consolidated Financial Statements in this Annual Report Form 10-K.
While we presently intend to continue to pay comparable quarterly cash dividends on both Class A and B common stock, the payment of future cash dividends depends upon the Board of Directors’ assessment of our earnings, financial condition, capital requirements and other factors.
We maintain letters of credit that guarantee our performance or payment to third parties in accordance with specified terms and conditions. Amounts outstanding were approximately $14.0 million as of $20.0December 31, 2021 and $16.2 million during 2017. In 2016, we generated $27.7 millionas of netDecember 31, 2020. Our letters of credit are primarily associated with insurance coverage and, to a lesser extent, foreign purchases and generally expire within one year of issuance. These instruments may exist or expire without being drawn down; therefore, they do not necessarily represent future cash from financing activities, primarilyflow obligations.
Our contractual obligations as of December 31, 2021 are presented in the following table:
| | | | | | | | | |
| | | | | Next | | Beyond |
Contractual Obligations | | Total | | 12 Months | | 12 Months |
|
| | (in millions) |
Long-term debt obligations, including current maturities(a) | | $ | 145.0 | | $ | — | | $ | 145.0 |
Operating lease obligations(b) | | | 60.0 | | | 10.4 | | | 49.6 |
Finance lease obligations(c) | | | 3.6 | | | 1.4 | | | 2.2 |
Pension contributions(d) | | | 9.2 | | | 0.5 | | | 8.7 |
Interest(e) | | | 17.1 | | | 5.0 | | | 12.1 |
2017 Tax Act Toll Tax payable(f) | | | 18.7 | | | — | | | 18.7 |
Capital expenditures(g) | | | 6.8 | | | 6.8 | | | — |
Other(h) | | | 66.4 | | | 59.9 | | | 6.5 |
Total | | $ | 326.8 | | $ | 84.0 | | $ | 242.8 |
| (a) | Relates to the drawdown on the line of credit under the Second Amended Credit Agreement as recognized in the consolidated balance sheet. See Note 11 of Notes to the Consolidated Financial Statements in this Annual Report for further disclosures. |
| (b) | Relates to the lease liabilities recognized for right-of-use assets of operating leases with a lease term longer than twelve months. See Note 5 of Notes to the Consolidated Financial Statements in this Annual Report for further disclosures. |
| (c) | Relates to the lease liabilities recognized for right-of-use assets of financing leases with a lease term longer than twelve months. See Note 5 of Notes to the Consolidated Financial Statements in this Annual Report for further disclosures. |
| (d) | Relates to estimated future obligations for the Europe pension plans. See Note 14 of Notes to the Consolidated Financial Statements in this Annual Report for further disclosures. |
| (e) | Represents the current estimate of future interest payments due on the current drawdown on the line of credit under the Second Amended Credit Agreement referenced above at (a). |
| (f) | Relates to the 2017 Tax Act one time transition tax on accumulated foreign subsidiary earnings not previously subject to U.S. income tax which was payable over a number of years. |
| (g) | Relates to capital expenditure obligations included in investment totals of $40 million to $50 million discussed above. |
| (h) | The majority relates to commodity commitments, as well as the contingent consideration related to two immaterial acquisitions. |
We have no off-balance sheet arrangements that have or are reasonably likely to net proceeds from long-term borrowingshave a current or future effect on our financial condition, changes in financial condition, revenues or expenses, results of $74.4 million, offset by dividend payments of $24.5 million, and paymentsoperations, liquidity, capital expenditures or capital resources that are material to repurchase Class A common stock at a cost of $26.8 millioninvestors.
On December 16, 2016, Watts International Holdings Limited (“Watts International”), a wholly owned subsidiary of the Company, entered into a Facility Agreement (the “Facility Agreement”) among Watts International, as original borrower and original guarantor, Watts Water Technologies EMEA B.V., a wholly owned subsidiary of the Company (“Watts EMEA”), as original guarantor, JPMorgan Chase Bank, N.A., as sole bookrunner and sole lead arranger (“JP Morgan Chase Bank”), J.P. Morgan Europe Limited, as agent to the financial parties, and the other lenders referred to therein. The Facility Agreement provided for a €110 million, 364 day, term loan facility available to the Company in a single draw. On December 20, 2016, Watts International borrowed the full amount available for borrowing under the Facility Agreement. The loan included interest at a rate per annum equal to (i) the Euro InterBank Offered Rate (EURIBOR), provided that if such rate is less than zero, then EURIBOR shall be deemed to be zero, plus (ii) a margin of 1.875%, provided that if no event of default is continuing and Watts International’s consolidated leverage ratio was at a specified level, the margin shall decrease to 1.50%.Substantially all of the proceeds of the borrowings made on December 20, 2016 under the Facility Agreement were used to pay down $113 million outstanding under the Revolving Credit Facility. As of the third quarter of 2017, we had repaid in full the Facility Agreement.
Non‑GAAPNon-GAAP Financial Measures
In accordance with the SEC's Regulation G and itemItem 10(e) of Regulation S-K, the following provides definitions of the non-GAAP measures used by management. We believe that these measures provide for a more complete perspectiveenhance the overall understanding of underlying business results and trends. These non-GAAP measures are not intended to be considered by the user in place of the related GAAP measure, but rather as supplemental information to more fully understand our business results. These non-GAAP measures may not be the same as similar measures used by other companies due to possible differences in method and in the items or events being adjusted.
Organic net sales growth is a non-GAAP measure of net sales growth that excludes the impacts of acquisitions, divestitures and foreign exchange from period-over-period comparisons. A reconciliation to the most closely related U.S.GAAPU.S. GAAP measure, net sales, has been included in our discussion within “Results of Operations” above. Organic net sales should be considered in addition to, and not as a replacement for or as a superior measure to net sales. Management believes reporting organic sales growth provides useful information to investors, potential investors and others, by facilitating easier comparisons of our revenue performance with prior and future periods.
Adjusted operating income, adjusted operating margins, adjusted net income, and adjusted earnings per share are non-GAAP measures that exclude certain expenses incurred and benefits and expensesrecognized in the periods presented that relate primarily to our global restructuring programs, transformation costs,other long-lived asset impairment charges, professional fees, acquisition related costs, gainfootprint optimization costs, an earnout adjustment, loss on acquisitions, other long-lived asset impairments,disposal, and the related income tax impacts on these items and other tax adjustments, including the impact of the 2017 Tax Act.adjustments. Management believes reporting these financial measures provides useful information to investors, potential investors and others, by facilitating easier comparisons of our performance with prior and future periods.
A reconciliation of U.S. GAAP results to these adjusted non-GAAP measures is provided below:below (dollars in millions, except per share amounts):
| | | | | | |
| | | | | | |
| | Year Ended |
| | December 31, | | December 31, |
| | 2021 | | 2020 |
| | | | | | |
Net sales | | $ | 1,809.2 | | $ | 1,508.6 |
| | | | | | |
Operating income - as reported | | | 239.6 | | | 181.1 |
Operating margin % | | | 13.2% | | | 12.0% |
| | | | | | |
Adjustments for special items: | | | | | | |
Restructuring | | | 19.3 | | | 9.9 |
Footprint optimization | | | — | | | 1.1 |
| | | | | | |
Acquisitions / divesture costs / adjustments: | | | | | | |
- Other long-lived asset impairment charge | | | — | | | 1.4 |
- Acquisition related costs | | | — | | | 1.3 |
- Loss on disposal | | | — | | | 0.6 |
- Earnout adjustment | | | — | | | (1.5) |
Total acquisitions / divesture costs / adjustments | | | — | | | 1.8 |
| | | | | | |
Total adjustments for special items | | $ | 19.3 | | $ | 12.8 |
| | | | | | |
Operating income - as adjusted | | $ | 258.9 | | $ | 193.9 |
Adjusted operating margin % | | | 14.3% | | | 12.9% |
| | | | | | |
Net income - as reported | | $ | 165.7 | | $ | 114.3 |
| | | | | | |
Adjustments for special items - tax effected: | | | | | | |
Restructuring | | | 14.1 | | | 7.4 |
Footprint optimization | | | — | | | 0.8 |
Tax adjustments | | | 7.2 | | | 9.7 |
| | | | | | |
Acquisitions / divesture costs / adjustments: | | | | | | |
- Other long-lived asset impairment charge | | | — | | | 1.0 |
- Acquisition related costs | | | — | | | 1.0 |
- Net gain on disposal | | | — | | | (0.7) |
- Earnout adjustment | | | — | | | (1.5) |
Total acquisitions / divesture costs / adjustments | | | — | | | (0.2) |
| | | | | | |
Total adjustments for special items - tax effected: | | $ | 21.3 | | $ | 17.7 |
| | | | | | |
Net income as adjusted | | $ | 187.0 | | $ | 132.0 |
| | | | | | |
Diluted earnings per share - as reported | | $ | 4.88 | | $ | 3.36 |
Adjustments for special items | | | 0.64 | | | 0.52 |
Diluted earnings per share - as adjusted | | $ | 5.52 | | $ | 3.88 |
| | | | | | |
| | | | | | |
| | Year Ended |
| | December 31, | | December 31, |
| | 2018 | | 2017 |
| | | | | | |
Net sales | | $ | 1,564.9 | | $ | 1,456.7 |
| | | | | | |
Operating income - as reported | | | 188.4 | | | 162.3 |
Operating margin % | | | 12.0% | | | 11.1% |
| | | | | | |
Adjustments for special items: | | | | | | |
Impairment charges and other costs | | | — | | | 1.2 |
Restructuring | | | 3.4 | | | 6.8 |
Transformation costs | | | — | | | 2.9 |
Total adjustments for special items | | $ | 3.4 | | $ | 10.9 |
| | | | | | |
Operating income - as adjusted | | $ | 191.8 | | $ | 173.2 |
Adjusted operating margin % | | | 12.3% | | | 11.9% |
| | | | | | |
Net income - as reported | | $ | 128.0 | | $ | 73.1 |
| | | | | | |
Adjustments for special items - tax effected: | | | | | | |
Impairment charges and other costs | | | — | | | 0.7 |
Restructuring | | | 2.5 | | | 4.7 |
Transformation costs | | | — | | | 1.9 |
Other tax items | | | 1.5 | | | — |
The 2017 Tax Act | | | (3.7) | | | 23.5 |
Total adjustments for special items - tax effected: | | $ | 0.3 | | $ | 30.8 |
| | | | | | |
Net income as adjusted | | $ | 128.3 | | $ | 103.9 |
| | | | | | |
Diluted earnings per share - as reported | | | 3.73 | | | 2.12 |
Adjustments for special items | | | 0.01 | | | 0.90 |
Diluted earnings per share - as adjusted | | $ | 3.74 | | $ | 3.02 |
Free cash flow is a non-GAAP measure that does not represent cash generated from operating activities in accordance with U.S. GAAP. Therefore, it should not be considered an alternative to net cash provided by operating activities as an indication of our performance. The cash conversion rate of free cash flow to net income is also a measure of our performance in cash flow generation. We believe free cash flow to be an appropriate supplemental measure of our operating performance because it provides investors with a measure of our ability to generate cash, repay debt, pay dividends, repurchase stock and fund acquisitions.
A reconciliation of net cash provided by operating activities to free cash flow and calculation of our cash conversion rate is provided below:
| | | | | | | | |
| | | Year Ended December 31, |
| | | 2021 | | 2020 | |
| | | | | | | | | | | |
| | Year Ended December 31, | | |
| | 2018 | | 2017 | | 2016 | | |
| | (in millions) | | |
| | | (in millions) |
Net cash provided by operating activities | | $ | 169.4 | | $ | 155.9 | | $ | 138.1 | | | $ | 180.8 | | $ | 228.8 | |
Less: additions to property, plant, and equipment | | | (35.9) | | | (29.4) | | | (36.0) | | | | (26.7) | | | (43.8) | |
Plus: proceeds from the sale of property, plant, and equipment | | | 2.2 | | | 0.4 | | | 0.1 | | | | 5.1 | | | 2.2 | |
Free cash flow | | $ | 135.7 | | $ | 126.9 | | $ | 102.2 | | | $ | 159.2 | | $ | 187.2 | |
Net income —as reported | | $ | 128.0 | | $ | 73.1 | | $ | 84.2 | | | $ | 165.7 | | $ | 114.3 | |
Cash conversion rate of free cash flow to net income | | | 106.0 | % | | 173.6 | % | | 121.4 | % | | | 96.1 | % | | 163.8 | % |
Our free cash flow increaseddeclined in 20182021 when compared to 20172020 primarily duedriven by a proactive decision to an increase inventory in cash flows provided by operations, response to a combination of strong market demand and disrupted supply chains, partially offset byhigher net income and lower net capital investment spending in 2018.expenditures.
Our net debt to capitalization ratio, a non‑GAAPnon-GAAP financial measure used by management, decreasedat December 31, 2021 was (9.3)% for 2021 compared to 14.3% for 2018 from 20.7%(2.0)% in 2017.2020. The decrease was driven by a decreasean increase in net cash outstanding of $23.1 million and a reduction of debt outstanding of $56.3 million at December 31, 2018, primarily due2021 compared to paying down approximately $120 million of our Revolving Credit Facility as well as approximately $22 million on our outstanding Term Loan Facility. These decreases in net debt were partially offset by $50.0 million of additional drawdowns on our Revolving Credit Facility.December 31, 2020. Management believes the net debt to capitalization ratio is an appropriate supplemental measure because it helps investors understand our ability to meet our financing needs and serves as a basis to evaluate our financial structure. Our computation may not be comparable to other companies that may define their net debt to capitalization ratios differently.
A reconciliation of long‑termlong-term debt (including current portion) to net debt and our net debt to capitalization ratio is provided below:
| | | | | | | |
| | | December 31, |
| | | 2021 | | 2020 |
| | | | | | | |
| | December 31, | | December 31, | |
| | 2018 | | 2017 | |
| | (in millions) | |
| | | (in millions) |
Current portion of long‑term debt | | $ | 30.0 | | $ | 22.5 | | $ | — | | $ | — |
Plus: long-term debt, net of current portion | | | 323.4 | | | 474.6 | | | 141.9 | | | 198.2 |
Less: cash and cash equivalents | | | (204.1) | | | (280.2) | | | (242.0) | | | (218.9) |
Net debt | | $ | 149.3 | | $ | 216.9 | | $ | (100.1) | | $ | (20.7) |
A reconciliation of capitalization is provided below:
| | | | | | | | |
| | | December 31, | |
| | | 2021 | | 2020 | |
| | | | | | | | |
| | December 31, | | December 31, | | |
| | 2018 | | 2017 | | |
| | (in millions) | | |
| | | (in millions) | |
Net debt | | $ | 149.3 | | $ | 216.9 | | | $ | (100.1) | | $ | (20.7) | |
Total stockholders’ equity | | | 891.3 | | | 829.0 | | | | 1,173.2 | | | 1,069.8 | |
Capitalization | | $ | 1,040.6 | | $ | 1,045.9 | | | $ | 1,073.1 | | $ | 1,049.1 | |
Net debt to capitalization ratio | | | 14.3 | % | | 20.7 | % | | | (9.3) | % | | (2.0) | % |
Contractual Obligations
Our contractual obligations as of December 31, 2018 are presented in the following table:
| | | | | | | | | | | | | | | |
| | Payments Due by Period |
| | | | | Less than | | | | | | | | More than |
Contractual Obligations | | Total | | 1 year | | 1‑3 years | | 4‑5 years | | 5 years |
| | (in millions) |
Long-term debt obligations, including current maturities(a)(c) | | $ | 355.0 | | $ | 30.0 | | $ | 325.0 | | $ | — | | $ | — |
Operating lease obligations | | | 35.7 | | | 10.7 | | | 14.3 | | | 5.8 | | | 4.9 |
Capital lease obligations(a) | | | 4.5 | | | 1.8 | | | 2.3 | | | 0.4 | | | — |
Pension contributions | | | 10.5 | | | 0.8 | | | 0.9 | | | 1.4 | | | 7.4 |
Interest | | | 19.1 | | | 11.5 | | | 7.6 | | | — | | | — |
Redeemable financial instrument(a) | | | 2.8 | | | 2.8 | | | — | | | — | | | — |
2017 Tax Act Toll Tax payable | | | 18.9 | | | — | | | — | | | 10.6 | | | 8.3 |
Other(b) | | | 31.9 | | | 31.9 | | | — | | | — | | | — |
Total | | $ | 478.4 | | $ | 89.5 | | $ | 350.1 | | $ | 18.2 | | $ | 20.6 |
| (a)
| | as recognized in the consolidated balance sheet.
|
| (b)
| | the majority relates to commodity and capital commitments at December 31, 2018.
|
| (c)
| | the payment in less than one year represents the third year of amortization of the term loan under the Credit Agreement. See Note 12 of Notes to Consolidated Financial Statements in this Annual Report on Form 10‑K for
|
further details of our financing arrangements.
|
We maintain letters of credit that guarantee our performance or payment to third parties in accordance with specified terms and conditions. Amounts outstanding were approximately $25.8 million as of December 31, 2018 and $25.7 million as of December 31, 2017. Our letters of credit are primarily associated with insurance coverage and, to a lesser extent, foreign purchases and generally expire within one year of issuance. These instruments may exist or expire without being drawn down; therefore they do not necessarily represent future cash flow obligations and are not included in the table above.
Off‑Balance Sheet Arrangements
Except for operating lease commitments, we have no off‑balance sheet arrangements that have or are reasonably likely to have a current or future effect on our financial condition, changes in financial condition, revenues or expenses, results of operations, liquidity, capital expenditures or capital resources that is material to investors.
Application of Critical Accounting Policies and Key Estimates
The preparation of our consolidated financial statements in accordance with U.S. GAAP requires management to make judgments, assumptions and estimates that affect the amounts reported. A critical accounting estimate is an assumption about highly uncertain matters and could have a material effect on the consolidated financial statements if another, also reasonable, amount were used, or, a change in the estimate is reasonably likely from period to period. We base our assumptions on historical experience and on other estimates that we believe are reasonable under the circumstances. Actual results could differ significantly from these estimates. There were no significant changes in our accounting policies or significant changes in our accounting estimates during 2018, with the exception of the change in our revenue recognition accounting policy resulting from the adoption of ASC 606 as described in Note 4 in the Notes to the Consolidated Financial Statements in this Annual Report on Form 10-K.2021.
We periodically discuss the development, selection and disclosure of the estimates with our Audit Committee. Management believes the following critical accounting policies reflect our more significant estimates and assumptions.
Revenue recognition
We recognize revenue under the core principle to depict the transfer of control to our customers in an amount reflecting the consideration to which we expect to be entitled. In order to achieve that core principle, we apply the following five-step approach: (1) identify the contract with a customer, (2) identify the performance obligations in the contract, (3) determine the transaction price, (4) allocate the transaction price to the performance obligations in the contract, and (5) recognize revenue when a performance obligation is satisfied. When determining the transaction price of each contract, we consider contractual consideration payable by the customer and variable consideration that may affect the total transaction price. Variable consideration, consisting of early payment discounts, rebates and other sources of price variability, are included in the estimated transaction price based on both customer-specific information as well as historical experience. We regularly review our estimates of variable consideration on the transaction price and recognize changes in estimates on a cumulative catch-up basis as if the most current estimate of the transaction price adjusted for variable consideration had been known as of the inception of the contract.
Our revenue for product sales is recognized on a point in time model, at the point control transfers to the customer, which is generally when products are shipped from the Company’s manufacturing or distribution facilities or when delivered to the customer’s named location. Sales tax, value-added tax, or other taxes collected concurrent with revenue producing activities are excluded from revenue. Freight costs billed to customers for shipping and handling activities are included in revenue with the related cost included in selling, general and administrative expenses. See Note 4 of Notes to Consolidated Financial Statements in this Annual Report on Form 10-K for further disclosures and detail regarding revenue recognition.
Inventory valuation
Inventories are stated at the lower of cost or net realizable value with costs determined primarily on a first‑in first‑outfirst-in first-out basis. We evaluate the need to record adjustments for excess or obsolete inventory at least quarterly.We utilize both specific product identification and historical product demand as the basis for determiningestimating our excess or obsolete inventory reserve. We identify all inventories that exceed a range of one to three years in sales.sales to calculate inventory on hand that exceeds estimated demand. This is determined by comparing the current inventory balance against unit sales for the trailing twelve months. New products added to inventory within the past twelve months are excluded from this analysis. A portion of our products contain recoverable materials, therefore the excess and obsolete reserve is established net of any estimated recoverable amounts.amounts based on historical experience. Changes in market conditions, lower‑than‑lower-than- expected customer demand or changes in technology or features could result in additional excess or obsolete inventory that is not saleable and could require additional inventory reserve provisions.
In certain countries, additional inventory reserves are maintained for potential shrinkage experienced in the manufacturing process. The reserve is established based on the prior year’s inventory losses adjusted for any change in the gross inventory balance.
Goodwill and other intangibles
We have made numerous acquisitions over the years and have recognized a significant amount of goodwill. Goodwill is tested for impairment annually or more frequently if an event or circumstance indicates that an impairment loss may have been incurred. Application of the goodwill impairment test requires judgment, including the identification of reporting units, assignment of assets and liabilities to reporting units, and determination of the fair value of each reporting unit.unit when a quantitative analysis is performed. We estimate the fair value of our reporting units using an income approach based on the present value of estimated future cash flows, and when appropriate, guideline public company and guideline transaction market approaches.
Accounting guidance allows us to reviewassess goodwill for impairment utilizing either qualitative or quantitative analyses. We have the option to first assess qualitative factors to determine whether the existence of events or circumstances leads to a determination that it is more likely than not that the fair value of a reporting unit is less than its carrying amount. If, after assessing the totality of events and circumstances, we determine it is more likely than not that the fair value of a reporting unit is greater than its carrying amount, then performing the quantitative impairment test is unnecessary.
We first identify those reporting units that we believe could pass a qualitative assessment to determine whether further impairment testing is necessary. For each reporting unit identified, our qualitative analysis includes:
| 1) | | A review of the most recent fair value calculation to identify the extent of the cushion between fair value and carrying amount, to determine if a substantial cushion existed. |
| 2) | | A review of events and circumstances that have occurred since the most recent fair value calculation to determine if those events or circumstances would have affected our previous fair value assessment. Items identified and reviewed include macroeconomic conditions, industry and market changes, cost factor changes, events that affect the reporting unit, and financial performance against expectations and the reporting unit’s performance relative to peers. |
We then compile this information and make our assessment of whether it is more likely than not that the fair value of the reporting unit is less than its carrying amount. If we determine it is not more likely than not, then no further quantitative analysis is required.
In 2018,2021, we had eightseven reporting units. One of these reporting units, Water Quality, had no goodwill. We performed a qualitative analysis for each of the sevensix remaining reporting units, which include Blücher, Dormont, US Drains, Europe, Residential and Commercial,Fluid Solutions-Europe, Fluid Solutions-Americas, Heating and Hot Water Solutions (“HHWS”), and APMEA.
As of our October 28, 201824, 2021 testing date, we had $544.3$605.8 million of goodwill on our balance sheet. As a result of our qualitative analyses, we determined that the fair values of the sevensix reporting units noted above were more likely than not greater than the carrying amounts. In 2018,2021, we did not need to proceed beyond the qualitative analysis, and no goodwill impairments were recorded.
In 2017, we performed a quantitative impairment analysis forChanges in macroeconomic, industry or market conditions, or our inability to achieve projected results that were used to complete the HHWS reporting unitqualitative analyses could result in connection with the annual strategic plan and due to underperformance to budget, primarily caused by continuing softness in the condensing boiler market, weakness in our tankless water heater products and competitive pricing pressure. We estimated the fair value of the reporting unit using a weighted calculation of the income approach and the market approach. Inherent in our development of the fair value of the reporting unit are the assumptions and estimates used in the income, and where appropriate, market approaches. The income approach calculates the present value of future cash flow projections based on assumptions and estimates derived from a review of our operating results, business plans, expected growth rates, the appropriate revenue and EBITDA multiples, and discount rates. We also made certain assumptions about future economic conditions and market data. We developed our assumptions based on our historical results, including sales growth, operating profits, working capital levels and income tax rates. The market approach calculates the estimated fair value based on valuation multiples derived from stock prices and enterprise values of publicly traded companies that are comparable to the reporting unit and based on valuation multiples are derived from actual transactions for comparable public companies when appropriate. The estimated fair value of the reporting unit exceedednot exceeding the carrying value in 2017amounts and therefore, no impairment was recorded.could lead to impairment.
Intangible assets such as trademarks and trade names are generally recorded in connection with a business acquisition.acquisition and we have recorded certain trademarks and trade names as indefinite-lived intangible assets. Values assigned to intangible assets are typically determined by an independent valuation firm based on our estimates and judgments regarding expectations of the success and life cycle of products and technology acquired. Accounting guidance allows us to perform a qualitative impairment assessment of indefinite‑livedindefinite-lived intangible assets consistent with the goodwill guidance noted previously. For our 20182021 impairment assessment, which occurred as of October 28, 2018,24, 2021, we performed quantitative assessmentsa qualitative assessment for all indefinite‑livedtrademarks and tradenames as each intangible assets. Theasset’s fair value significantly exceeded the carrying value in the previous quantitative assessment performed, each had sales growth in 2021, sales growth is expected in the trademark or tradename in 2022, and no other indicators of impairment were present. As a result of our qualitative analyses, we determined that the fair values of the indefinite-lived intangibles assets were more likely than not greater than the carrying amounts. If we were to perform a quantitative assessment, the methodology we employed wasemploy is the relief from royalty method, a subset of the income approach. During 20182021, 2020, and 2017,2019, no impairment was recognized on our indefinite-lived intangible assets. In 2016, we recognized a non‑cash pre‑tax charge of approximately $0.4 million relatedChanges in macroeconomic, industry or market conditions, or our inability to an indefinite lived tradenameachieve projected results that were used to complete the qualitative analyses could result in our Europe reporting unit.the trademark’s or trade name’s fair value not exceeding its carrying amount and could lead to impairment.
Product liability
Because of retention requirements associated with our insurance policies, we are generally self‑insuredself-insured for potential product liability claims. We are subject to a variety of potential liabilities in connection with product liability cases, and for our most significant volume of liability matters, we maintain a high self‑insuredself-insured retention limit within our product liability and general liability coverage, which we believe to be generally in accordance with industry practices. Management establishes its product liability accrual, which includes legal costs associated with accrued claims, by utilizing third‑party actuarial valuations which incorporate historical trend factors and our specific claims experience derived from loss reports provided by third‑party administrators. We maintain excess liability insurance to minimize our risks related to claims in excess of our primary insurance policies. The product liability accrual is established after considering any applicable insurance coverage.
For our product liability cases in the U.S., we establish a product liability accrual, which includes estimated legal costs associated with accrued claims. For our most significant volume of liability matters, we utilize third-party actuarial valuations which incorporate historical trend factors including, but not limited to, claim frequency and loss severity, and our specific claims experience derived from loss reports provided by third-party claims administrators to establish our product liability accrual. The product liability accrual represents the estimated ultimate losses for all reported and
incurred but not reported claims. For the remainder of our operationsproduct liability accrual, where we do not utilize third-party actuarial valuations, we maintain insurance and calculate potential product liability accruals which includes legal costs associated with the accrued claims on a case by case basis. Changes in the nature and volume of product liability claims, legal costs, or the actual settlement amounts could affect the adequacy of the estimates and require changes to the accrual. Because the liability is an estimate, the ultimate liability may be more or less than reported.
We determine the trend factors for product liability based on consultation with outside actuaries. Any material change in the aforementioned factors could have an adverse impact on our operating results.results for any particular period depending, in part, upon the operating results for such period.
Legal contingencies
We are a defendant in numerous legal matters including those involving environmental issues and product liability as discussed in more detail in Part I, Item 1. “Business—Product Liability, Environmental and Other Litigation Matters” and Note 16.15 of Notes to Consolidated Financial Statements in this Annual Report on Form 10-K. As required by GAAP, we determine whether an estimated loss from a loss contingency should be accrued by assessing whether a loss is deemed probable and the loss amount can be reasonably estimated. When it is possible to estimate reasonably possible loss or range of loss above the amount accrued, that estimate is aggregated and disclosed. Estimates of potential outcomes of these contingencies are often developed in consultation with outside counsel. While this assessment is based upon all available information, litigation is inherently uncertain and the actual liability to fully resolve litigation cannot be predicted with any assurance of accuracy. In the event of an unfavorable outcome in one or more legal matters, the ultimate liability may be in excess of amounts currently accrued, if any, and may be material to our operating results or cash flows for a particular quarterly or annual period. However, based on information currently known to us, management believes that the ultimate outcome of all legal contingencies, as they are resolved over time, is not likely to have a material adverse effect on our financial condition, though the outcome could be material to our operating results for any particular period depending, in part, upon the operating results for such period.
Income taxes
We are subject to income taxes in the U.S. (federal and state) and foreign jurisdictions. Significant judgment is required in evaluating our uncertain tax positions and determining our provision for income taxes, and evaluating the impact of the 2017 Tax Act.taxes.
We estimate and use our expected annual effective income tax rates to accrue income taxes. Effective tax rates are determined based on budgeted earnings before taxes, including our best estimate of permanent items that will affect the effective rate for the year. Management periodically reviews these rates with outside tax advisors and changes are made if material variances from expectations are identified.
Income taxes are accounted for under the asset and liability method. Deferred tax assets and liabilities are recognized for the future tax consequences attributable to differences between the financial statement carrying amounts of existing
assets and liabilities and their respective tax basis and operating loss and tax credit carry forwards. Deferred tax assets and liabilities are measured using enacted tax rates expected to apply to taxable income in the years in which those temporary differences are expected to be recovered or settled. The effect on deferred tax assets and liabilities of a change in tax rates is recognized in income in the period that includes the enactment date.
A valuation allowance is provided to offset any net deferred tax assets if, based upon the available evidence, it is more likely than not that some or all of the deferred tax assets will not be realized. We consider estimated future taxable income, and future reversals of the deferred tax liabilities, and tax planning strategies, in assessing the need for a valuation allowance.
The 2017 Tax Act was enacted on December 22, 2017 and introduced significant changes to U.S. Changes in the relevant facts, including the accuracy of our estimated future taxable income, tax law. Effective in 2018,can significantly impact the 2017 Tax Act reducedjudgment or need for valuation allowances. In the U.S. statutory tax rate from 35% to 21% and created new taxes on certain foreign-sourced earnings and certain related-party payments, which are referred toevent we change our determination as the global intangible low-taxed income tax and the base erosion tax, respectively. In addition, in 2017 we were subject to the Toll Tax,amount of deferred tax assets that can be realized, we will adjust our valuation allowance with a one-time transition tax on accumulated foreign subsidiary earnings not previously subjectcorresponding impact to U.S.the provision for income tax. Accounting for the income tax effects of the 2017 Tax Act at December 31, 2017 required significant judgments and estimates in the interpretation and calculations of the provisions of the 2017 Tax Act.
We are required to recognize the effect of the tax law changestaxes in the period in which such determination is made.
As of enactment, such as determining the Toll Tax, remeasuring our U.S. deferred tax assets and liabilities as well as reassessing the net realizabilityDecember 31, 2021, we released $22.1 million of our deferredvaluation allowance on foreign tax assets and liabilities. Duecredits related to the timingadditional foreign source income resulting from our restructured Mexican manufacturing supply chain operations. See Note 9 of the enactment and the complexity involved in applying the provisions of the 2017 Tax Act, we made reasonable estimates of the effects and recorded provisional amounts in our financial statements for the year ended December 31, 2017. In December 2017, the SEC staff issued Staff Accounting Bulletin No. 118, Income Tax Accounting Implications of the Tax Cuts and Jobs Act (SAB 118), which allows usNotes to record provisional amounts during a measurement period not to extend beyond one year of the enactment date. December 22, 2018 marked the end of the measurement period for purposes of SAB 118. As such, we have completed the analysis based on legislative updates relating to the Act currently available, which resulted in an additional tax benefit of $3.7 million in the fourth quarter of 2018 and a final total tax charge of $21.4 million related to implementation of the 2017 Tax Act.
New Accounting Standards
A discussion of recent accounting pronouncements is included in Note 2 of the Notes to Consolidated Financial Statements in this Annual Report on Form 10‑K.for further disclosures.
Item 7A. QUANTITATIVE AND QUALITATIVE DISCLOSURES ABOUT MARKET RISK.
We use derivative financial instruments primarily to reduce exposure to adverse fluctuations in foreign exchange rates, interest rates and costs of certain raw materials used in the manufacturing process. We do not enter into derivative financial instruments for trading purposes. As a matter of policy, all derivative positions are used to reduce risk by hedging underlying economic exposure. The derivatives we use are instruments with liquid markets. See Note 1716 of Notes to the Consolidated Financial Statements for further details.
Our consolidated earnings, which are reported in United States dollars, are subject to translation risks due to changes in foreign currency exchange rates. This risk is concentrated in the exchange rate between the U.S. dollar and the euro; the U.S. dollar and the Canadian dollar; and the U.S. dollar and the Chinese yuan.
Our non-U.S. subsidiaries transact most business, including certain intercompany transactions, in foreign currencies. Such transactions are principally purchases or sales of materials and are denominated in European currencies, the Chinese yuan or the U.S. or Canadian dollar. We use foreign currency forward exchange contracts from time to time to manage the risk related to intercompany loans, intercompany purchases and intercompany sales that occur during the course of a year, and certain open foreign currency denominated commitments to sell products to third parties. Beginning in the first quarter of 2018, weWe have entered into forward exchange contracts that settle quarterly and which hedge approximately 70%80% to 85% of the forecasted intercompany purchases between one of our Canadian subsidiaries and our U.S. operating subsidiaries over a rolling twelve-month period.for the next twelve months. We also entered into forward exchange contracts which hedge up to 60% of the forecasted intercompany sales transactions between one of our Chinese subsidiaries and one of our U.S. operating subsidiaries for the next twelve months. We record the effective portion of the designated foreign currency hedge contracts in other comprehensive income until inventory turns and is sold to a third-party. Once the third-party transaction occurs associated with the hedged forecasted transaction occurs, the effective portion of any related gain or loss on the designated foreign currency hedge will beis reclassified into cost of goods sold within earnings. The fair value of our designated foreign hedge contracts outstanding as of December 31, 20182021 was $0.3a liability balance of less than $0.1 million.
For each facility underUnder the Second Amended Credit Agreement, we can choose either an Adjusted LIBOR or Alternative Base Rate (“ABR”). Accordingly, the Company’sour earnings and cash flows are exposed to interest rate risk from changes in Adjusted LIBOR. In order to manage our exposure to changes in cash flows attributable to fluctuations in LIBOR-indexed interest payments related to our floating rate debt, in February 2016,debt. In order to manage our exposure, we entered into two interest rate swaps. For eachan interest rate swap on March 30, 2021. Under the interest rate swap agreement, we receive the three-monthone-month USD-LIBOR subject to a 0%0.00% floor, and we pay a fixed rate of 1.31375%1.02975% on a notional amount of $225.0$100.0 million. The swap matures on March 30, 2026. Information about our long‑termlong-term debt including principal amounts and related interest rates appears in Note 1211 of Notes to the Consolidated Financial Statements, and information on our interest rate swaps appears in Note 16 of the Notes to the Consolidated Financial Statements.
We purchase significant amounts of bronze ingot, brass rod, cast iron, stainless steel and plastic, which are utilized in manufacturing our many product lines. Our operating results can be adversely affected by changes in commodity prices if we are unable to pass on related price increases to our customers. We manage this risk by monitoring related market prices, working with our suppliers to achieve the maximum level of stability in their costs and related pricing, seeking alternative supply sources when necessary and passing increases in commodity costs to our customers, to the maximum extent possible, when they occur.
Item 8. FINANCIAL STATEMENTS AND SUPPLEMENTARY DATA.
The financial statements listed in section (a) (1) of “Part IV, Item 15. Exhibits, Financial Statement Schedules” of this Annual Report are incorporated herein by reference.
Item 9. CHANGES IN AND DISAGREEMENTS WITH ACCOUNTANTS ON ACCOUNTING AND FINANCIAL DISCLOSURE.
None.
Item 9A. CONTROLS AND PROCEDURES.
Evaluation of Disclosure Controls and Procedures
As required by Rule 13a‑15(b)13a-15(b) under the Securities Exchange Act of 1934, as amended, or Exchange Act, as of the end of the period covered by this report, we carried out an evaluation under the supervision and with the participation of our management, including our Chief Executive Officer and Chief Financial Officer, of the effectiveness of our disclosure controls and procedures. In designing and evaluating our disclosure controls and procedures, we recognize that any controls and procedures, no matter how well designed and operated, can provide only reasonable assurance of achieving the desired control objectives, and our management necessarily applies its judgment in evaluating and implementing possible controls and procedures. The effectiveness of our disclosure controls and procedures is also necessarily limited by the staff and other resources available to us and the geographic diversity of our operations. Based upon that evaluation, the Chief Executive Officer and Chief Financial Officer concluded that, as of the end of the period covered by this report, our disclosure controls and procedures were not effective, duein that they provided reasonable assurance that information required to a material weaknessbe disclosed by us in internal control over financial reporting discussed belowthe reports we file or submit under the Exchange Act is recorded, processed, summarized and reported within the time periods specified in Management’s Annual Report on Internal Control Overthe Securities and Exchange Commission’s rules and forms and in that such controls are designed to ensure that information required to be disclosed by us in the reports that we file or submit under the Exchange Act is accumulated and communicated to our management, including our Chief Executive Officer and Chief Financial Reporting.Officer, as appropriate to allow timely decisions regarding required disclosure.
Management’s Annual Report on Internal Control Over Financial Reporting
Management of the Company is responsible for establishing and maintaining adequate internal control over financial reporting as defined in Rules 13a‑15(f)13a-15(f) and 15d‑15(f)15d-15(f) under the Securities Exchange Act of 1934. The Company’s internal control over financial reporting is designed to provide reasonable assurance regarding the reliability of financial reporting and the preparation of financial statements for external purposes in accordance with generally accepted accounting principles. The Company’s internal control over financial reporting includes those policies and procedures that:
| (i) | | pertain to the maintenance of records that, in reasonable detail, accurately and fairly reflect the transactions and dispositions of the assets of the Company; |
| (ii) | | provide reasonable assurance that transactions are recorded as necessary to permit preparation of financial statements in accordance with generally accepted accounting principles, and that receipts and |
expenditures of the Company are being made only in accordance with authorizations of management and directors of the Company; and |
| (iii) | | provide reasonable assurance regarding prevention or timely detection of unauthorized acquisition, use or disposition of the Company’s assets that could have a material effect on the financial statements. |
Because of its inherent limitations, internal control over financial reporting may not prevent or detect misstatements. Also, projections of any evaluation of effectiveness to future periods are subject to the risk that controls may become inadequate because of changes in conditions, or that the degree of compliance with the policies or procedures may deteriorate.
A material weakness is a deficiency, or a combination of deficiencies, in internal control over financial reporting, such that there is a reasonable possibility that a material misstatement of our annual or interim financial statements will not be prevented or detected on a timely basis.
Management, including our Chief Executive Officer and Chief Financial Officer, assessed the effectiveness of the Company’s internal control over financial reporting as of December 31, 2018.2021. In making this assessment, management used the criteria set forth by the Committee of Sponsoring Organizations of the Treadway Commission (COSO) in Internal Control—Integrated Framework (2013).
Based on this assessment, management has concluded that our internal control over financial reporting was not effective as of December 31, 2018, due to the material weakness in our internal control over financial reporting discussed below. 2021.
We did not have an effective risk assessment process to identify all relevant risks within the process we implemented to account for changes resulting from the recently enacted Tax Cuts and Jobs Act of 2017 (“Tax Act”). As a consequence, we did not design and implement an effective process level control activity over the impact of foreign tax credits on the accounting for the tax liabilities associated with the mandatory repatriation provisions of the Tax Act.
The material weakness resulted in a material misstatement in the accrued tax liability and provision for income taxes balances that was corrected prior to the issuance of the 2018 consolidated financial statements included in this Form 10-K. The material weakness created a reasonable possibility that a material misstatement of our annual or interim consolidated financial statements would not be prevented or detected on a timely basis. Therefore, we concluded that our internal control over financial reporting was not effective as of December 31, 2018.
The independent registered public accounting firm that audited the Company’s consolidated financial statements included elsewhere in this Annual Report on Form 10‑K10-K has issued an adverse opinion onalso audited the effectiveness of the Company’s internal control over financial reporting. That report appears immediately followingreporting as of December 31, 2021, as stated in this report.Annual Report on Form 10-K under the heading, “Report of Independent Registered Public Accounting Firm.”
Remediation
Management has begun implementing a remediation plan to address the control deficiency that led to the material weakness. The remediation plan includes enhancing our risk assessment process over the judgments and estimates included in new and emerging financial reporting matters. Based on certain outcomes of future risk assessments, we may involve external experts and internal audit may assist in the design of process level control activities. As the Tax Act was a one-time change, there is no remediation required relating to the Tax Act risk assessment process.
We currently plan to have our enhanced risk assessment process in place and operating in the first quarter of 2019. Our goal is to remediate this material weakness by the end of 2019.
Changes in Internal Control Over Financial Reporting
Except for the control deficiency discussed above that has been assessed as a material weakness as of December 31, 2018, and except for theThere was no change in our revenue recognition controls resulting from the adoption of ASC 606 as described in Note 2 in the Notes to Consolidated Financial Statements, there were no changes in our internal control over financial reporting that occurred during the quarter ended December 31, 2018,2021, that has materially affected, or is reasonably likely to materially affect, our internal control over financial reporting. Although the new revenue standard is expected to have an immaterial impact on our ongoing revenue recognition, we did implement changes to our processes related to revenue recognition and control activities within them. These included the development of new policies based on the five-step model provided in the new revenue standard, employee training, ongoing contract review and certification requirements, and gathering information provided for disclosures. We will continue to review and document our disclosure controls and procedures, including our internal control over financial reporting, and may from time to time make changes aimed at enhancing their effectiveness and to ensure that our systems evolve with our business.
Item 9B. OTHER INFORMATION.
None.
Item 9C. DISCLOSURE REGARDING FOREIGN JURISDICTIONS THAT PREVENT INSPECTIONS.
Not applicable.
PART III
Item 10. DIRECTORS, EXECUTIVE OFFICERS AND CORPORATE GOVERNANCE.
Information with respect to the executive officers of the Company is set forth in Part I, Item 1 of this Report under the caption “Information about Our Executive Officers and Directors” and is incorporated herein by reference. The information provided under the captions “Information as to Nominees for Director,” “Corporate Governance” and “Delinquent Section 16(a) Reports” in our definitive Proxy Statement for our 2022 Annual Meeting of Stockholders to be held on May 11, 2022 is incorporated herein by reference.
We have adopted a Code of Business Conduct applicable to all officers, employees and Board members. The Code of Business Conduct is posted in the Investors section of our website, www.wattswater.com. We will provide you with a print copy of our Code of Business Conduct free of charge on written request to our Corporate Secretary, Watts Water Technologies, Inc., 815 Chestnut Street, North Andover, MA 01845. Any amendments to, or waivers of, the Code of Business Conduct which apply to our Chief Executive Officer, Chief Financial Officer, Corporate Controller or any person performing similar functions will be disclosed on our website promptly following the date of such amendment or waiver.
Item 11. EXECUTIVE COMPENSATION.
The information provided under the captions “Director Compensation,” “Corporate Governance,” “Compensation Discussion and Analysis,” “Executive Compensation,” “Compensation Committee Interlocks and Insider Participation,” and “Compensation Committee Report” in our definitive Proxy Statement for our 2022 Annual Meeting of Stockholders to be held on May 11, 2022 is incorporated herein by reference.
The “Compensation Committee Report” contained in our Proxy Statement shall not be deemed “soliciting material” or “filed” with the Securities and Exchange Commission or otherwise subject to the liabilities of Section 18 of the Securities Exchange Act of 1934, nor shall it be deemed incorporated by reference in any filings under the Securities Act of 1933 or the Exchange Act, except to the extent we specifically request that such information be treated as soliciting material or specifically incorporate such information by reference into a document filed under the Securities Act or Exchange Act.
Item 12. SECURITY OWNERSHIP OF CERTAIN BENEFICIAL OWNERS AND MANAGEMENT AND RELATED STOCKHOLDER MATTERS.
The information appearing under the caption “Principal Stockholders” in our definitive Proxy Statement for our 2022 Annual Meeting of Stockholders to be held on May 11, 2022 is incorporated herein by reference.
Securities Authorized for Issuance Under Equity Compensation Plans
The following table provides information as of December 31, 2021, about the shares of Class A common stock that may be issued upon the exercise of stock options, settlement of performance stock awards and vesting of deferred stock awards issued under the Company’s Second Amended and Restated 2004 Stock Incentive Plan, and the settlement of restricted stock units granted under our Management Stock Purchase Plan as well as the number of shares remaining for future issuance under our Second Amended and Restated 2004 Stock Incentive Plan and Management Stock Purchase Plan.
| | | | | | | | |
| | Equity Compensation Plan Information | |
| | | | | | | Number of securities remaining | |
| | Number of securities to be | | | | | available for future issuance | |
| | issued upon exercise of | | Weighted‑average exercise | | under equity compensation | |
| | outstanding options, | | price of outstanding options, | | plan (excluding securities | |
| | warrants and rights | | warrants and rights | | reflected in column (a)) | |
Plan Category | | (a) | | (b) | | (c) | |
Equity compensation plans approved by security holders | | 398,190 | (1) | $ | 52.92 | (2) | 1,758,892 | (3) |
Equity compensation plans not approved by security holders | | None | | | None | | None | |
Total | | 398,190 | (1) | $ | 52.92 | (2) | 1,758,892 | (3) |
| (1) | Represents 3,756 outstanding options, 178,250 performance stock awards and 131,582 deferred stock awards under the Second Amended and Restated 2004 Stock Incentive Plan, and 84,602 outstanding restricted stock units under the Management Stock Purchase Plan. |
| (2) | Represents the weighted-average exercise price of the 3,756 outstanding options. |
| (3) | Includes 1,038,783 shares available for future issuance under the Second Amended and Restated 2004 Stock Incentive Plan, and 720,109 shares available for future issuance under the Management Stock Purchase Plan. |
Item 13. CERTAIN RELATIONSHIPS AND RELATED TRANSACTIONS, AND DIRECTOR INDEPENDENCE.
The information provided under the captions “Corporate Governance” and “Certain Relationships and Related Transactions” in our definitive Proxy Statement for our 2022 Annual Meeting of Stockholders to be held on May 11, 2022 is incorporated herein by reference.
Item 14. PRINCIPAL ACCOUNTANT FEES AND SERVICES.
The information provided under the caption “Ratification of Independent Registered Public Accounting Firm” in our definitive Proxy Statement for our 2022 Annual Meeting of Stockholders to be held on May 11, 2022 is incorporated herein by reference.
PART IV
Item 15. EXHIBITS, FINANCIAL STATEMENT SCHEDULES.
(a)(1) Financial Statements
The following financial statements are included in a separate section of this Report commencing on the page numbers specified below:
| |
Report of Independent Registered Public Accounting Firm (KPMG LLP, Boston, MA, PCAOB ID: 185) | 48 |
Consolidated Statements of Operations for the years ended December 31, 2021, 2020 and 2019 | 50 |
Consolidated Statements of Comprehensive Income for the years ended December 31, 2021, 2020 and 2019 | 51 |
Consolidated Balance Sheets as of December 31, 2021 and 2020 | 52 |
Consolidated Statements of Stockholders’ Equity for the years ended December 31, 2021, 2020 and 2019 | 53 |
Consolidated Statements of Cash Flows for the years ended December 31, 2021, 2020 and 2019 | 54 |
Notes to Consolidated Financial Statements | 55 |
(a)(2) Schedules
All other required schedules for which provision is made in the applicable accounting regulations of the Securities and Exchange Commission are included in the Notes to the Consolidated Financial Statements.
(a)(3) Exhibits
The exhibits listed in the Exhibit Index immediately preceding the signature page hereto are filed as part of this Annual Report on Form 10-K.
Item 16. FORM 10-K SUMMARY.
None.
Report of Independent Registered Public Accounting Firm
To the Stockholders and Board of Directors
Watts Water Technologies, Inc.:
OpinionOpinions on the Consolidated Financial Statements and Internal Control Over Financial Reporting
We have audited the accompanying consolidated balance sheets of Watts Water Technologies, Inc. and subsidiaries (the Company) internal control over financial reporting as of December 31, 2018, based on criteria established in Internal Control – Integrated Framework (2013) issued by the Committee of Sponsoring Organizations of the Treadway Commission. In our opinion, because of the effect of the material weakness, described below, on the achievement of the objectives of the control criteria, the Company has not maintained effective internal control over financial reporting as of December 31, 2018, based on criteria established in Internal Control – Integrated Framework (2013) issued by the Committee of Sponsoring Organizations of the Treadway Commission.
We also have audited, in accordance with the standards of the Public Company Accounting Oversight Board (United States) (PCAOB), the consolidated balance sheets of the Company as of December 31, 20182021 and 2017,2020, the related consolidated statements of operations, comprehensive income, stockholders’ equity, and cash flows for each of the years in the three-year period ended December 31, 2018,2021, and the related notes and financial statement Schedule II –- Valuation and Qualifying Accounts (collectively, the “consolidated financial statements”), and our report dated February 22, 2019 expressed an unqualified opinion on those consolidated financial statements.
A material weakness is a deficiency, or a combination of deficiencies, instatements). We also have audited the Company’s internal control over financial reporting such that there is a reasonable possibility that a material misstatementas of December 31, 2021, based on criteria established in Internal Control – Integrated Framework (2013) issued by the Committee of Sponsoring Organizations of the company’s annual or interim financial statements will not be prevented or detected on a timely basis. A material weakness related to ineffective risk assessment and ineffective process level control activities overTreadway Commission.
In our opinion, the accounting for tax liabilities associated with the Tax Cuts and Jobs Act of 2017 has been identified and included in management’s assessment. The material weakness was considered in determining the nature, timing, and extent of audit tests applied in our audit of the 2018 consolidated financial statements referred to above present fairly, in all material respects, the financial position of the Company as of December 31, 2021 and this report does not affect2020, and the results of its operations and its cash flows for each of the years in the three-year period ended December 31, 2021, in conformity with U.S. generally accepted accounting principles. Also in our reportopinion, the Company maintained, in all material respects, effective internal control over financial reporting as of December 31, 2021 based on those consolidated financial statements.criteria established in Internal Control – Integrated Framework (2013) issued by the Committee of Sponsoring Organizations of the Treadway Commission.
Basis for OpinionOpinions
The Company’s management is responsible for these consolidated financial statements, for maintaining effective internal control over financial reporting, and for its assessment of the effectiveness of internal control over financial reporting, included in the accompanying Management’sManagement's Annual Report on Internal Control Over Financial Reporting. Our responsibility is to express an opinion on the Company’s consolidated financial statements and an opinion on the Company’s internal control over financial reporting based on our audit.audits. We are a public accounting firm registered with the PCAOBPublic Company Accounting Oversight Board (United States) (PCAOB) and are required to be independent with respect to the Company in accordance with the U.S. federal securities laws and the applicable rules and regulations of the Securities and Exchange Commission and the PCAOB.
We conducted our auditaudits in accordance with the standards of the PCAOB. Those standards require that we plan and perform the auditaudits to obtain reasonable assurance about whether the consolidated financial statements are free of material misstatement, whether due to error or fraud, and whether effective internal control over financial reporting was maintained in all material respects.
Our audits of the consolidated financial statements included performing procedures to assess the risks of material misstatement of the consolidated financial statements, whether due to error or fraud, and performing procedures that respond to those risks. Such procedures included examining, on a test basis, evidence regarding the amounts and disclosures in the consolidated financial statements. Our audits also included evaluating the accounting principles used and significant estimates made by management, as well as evaluating the overall presentation of the consolidated financial statements. Our audit of internal control over financial reporting included obtaining an understanding of internal control over financial reporting, assessing the risk that a material weakness exists, and testing
and evaluating the design and operating effectiveness of internal control based on the assessed risk. Our auditaudits also included performing such other procedures as we considered necessary in the circumstances. We believe that our audit providesaudits provide a reasonable basis for our opinion.opinions.
Definition and Limitations of Internal Control Over Financial Reporting
A company’s internal control over financial reporting is a process designed to provide reasonable assurance regarding the reliability of financial reporting and the preparation of financial statements for external purposes in accordance with generally accepted accounting principles. A company’s internal control over financial reporting includes those policies and procedures that (1) pertain to the maintenance of records that, in reasonable detail, accurately and fairly reflect the
transactions and dispositions of the assets of the company; (2) provide reasonable assurance that transactions are recorded as necessary to permit preparation of financial statements in accordance with generally accepted accounting principles, and that receipts and expenditures of the company are being made only in accordance with authorizations of management and directors of the company; and (3) provide reasonable assurance regarding prevention or timely detection of unauthorized acquisition, use, or disposition of the company’s assets that could have a material effect on the financial statements.
Because of its inherent limitations, internal control over financial reporting may not prevent or detect misstatements. Also, projections of any evaluation of effectiveness to future periods are subject to the risk that controls may become inadequate because of changes in conditions, or that the degree of compliance with the policies or procedures may deteriorate.
/s/ KPMG LLP
Boston, Massachusetts
February 22, 2019
Item 9B. OTHER INFORMATION.
None.
PART III
Item 10. DIRECTORS, EXECUTIVE OFFICERS AND CORPORATE GOVERNANCE.
Information with respect to the executive officers of the Company is set forth in Part I, Item 1 of this Report under the caption “Executive Officers and Directors” and is incorporated herein by reference. The information provided under the captions “Information as to Nominees for Director,” “Corporate Governance,” and “Section 16(a) Beneficial Ownership Reporting Compliance” in our definitive Proxy Statement for our 2019 Annual Meeting of Stockholders to be held on May 17, 2019 is incorporated herein by reference.
We have adopted a Code of Business Conduct applicable to all officers, employees and Board members. The Code of Business Conduct is posted in the Investors section of our website, www.wattswater.com. We will provide you with a print copy of our Code of Business Conduct free of charge on written request to our Corporate Secretary, Watts Water Technologies, Inc., 815 Chestnut Street, North Andover, MA 01845. Any amendments to, or waivers of, the Code of Business Conduct which apply to our Chief Executive Officer, Chief Financial Officer, Corporate Controller or any person performing similar functions will be disclosed on our website promptly following the date of such amendment or waiver.
Item 11. EXECUTIVE COMPENSATION.
Critical Audit Matter
The information provided undercritical audit matter communicated below is a matter arising from the captions “Director Compensation,” “Corporate Governance,” “Compensation Discussion and Analysis,” “Executive Compensation,” “Compensation Committee Interlocks and Insider Participation,” and “Compensation Committee Report” in our definitive Proxy Statement for our 2019 Annual Meeting of Stockholders to be held on May 17, 2019 is incorporated herein by reference.
The “Compensation Committee Report” contained in our Proxy Statement shall not be deemed “soliciting material” or “filed” with the Securities and Exchange Commission or otherwise subject to the liabilities of Section 18 of the Securities Exchange Act of 1934, nor shall it be deemed incorporated by reference in any filings under the Securities Act of 1933 or the Exchange Act, except to the extent we specifically request that such information be treated as soliciting material or specifically incorporate such information by reference into a document filed under the Securities Act or Exchange Act.
Item 12. SECURITY OWNERSHIP OF CERTAIN BENEFICIAL OWNERS AND MANAGEMENT AND RELATED STOCKHOLDER MATTERS.
The information appearing under the caption “Principal Stockholders” in our definitive Proxy Statement for our 2019 Annual Meeting of Stockholders to be held on May 17, 2019 is incorporated herein by reference.
Securities Authorized for Issuance Under Equity Compensation Plans
The following table provides information as of December 31, 2018, about the shares of Class A common stock that may be issued upon the exercise of stock options, settlement of performance stock awards and vesting of deferred stock awards issued under the Company’s Second Amended and Restated 2004 Stock Incentive Plan, and the settlement of restricted stock units granted under our Management Stock Purchase Plan as well as the number of shares remaining for future issuance under our Second Amended and Restated 2004 Stock Incentive Plan and Management Stock Purchase Plan.
| | | | | | | | |
| | Equity Compensation Plan Information | |
| | | | | | | Number of securities remaining | |
| | Number of securities to be | | | | | available for future issuance | |
| | issued upon exercise of | | Weighted‑average exercise | | under equity compensation | |
| | outstanding options, | | price of outstanding options, | | plan (excluding securities | |
| | warrants and rights | | warrants and rights | | reflected in column (a)) | |
Plan Category | | (a) | | (b) | | (c) | |
Equity compensation plans approved by security holders | | 475,298 | (1) | $ | — | | 1,982,558 | (2) |
Equity compensation plans not approved by security holders | | None | | | None | | None | |
Total | | 475,298 | (1) | $ | — | | 1,982,558 | (2) |
| (1)
| | Represents 48,751 outstanding options, 248,832 performance stock awards and 23,542 deferred stock awards under the Second Amended and Restated 2004 Stock Incentive Plan, and 154,173 outstanding restricted stock units under the Management Stock Purchase Plan.
|
| (2)
| | Includes 1,232,137 shares available for future issuance under the Second Amended and Restated 2004 Stock Incentive Plan, and 750,421 shares available for future issuance under the Management Stock Purchase Plan.
|
Item 13. CERTAIN RELATIONSHIPS AND RELATED TRANSACTIONS, AND DIRECTOR INDEPENDENCE.
The information provided under the captions “Corporate Governance” and “Certain Relationships and Related Transactions” in our definitive Proxy Statement for our 2019 Annual Meeting of Stockholders to be held on May 17, 2019 is incorporated herein by reference.
Item 14. PRINCIPAL ACCOUNTING FEES AND SERVICES.
The information provided under the caption “Ratification of Independent Registered Public Accounting Firm” in our definitive Proxy Statement for our 2019 Annual Meeting of Stockholders to be held on May 17, 2019 is incorporated herein by reference.
PART IV
Item 15. EXHIBITS, FINANCIAL STATEMENT SCHEDULES.
(a)(1) Financial Statements
The following financial statements are included in a separate section of this Report commencing on the page numbers specified below:
(a)(2) Schedules
All other required schedules for which provision is made in the applicable accounting regulations of the Securities and Exchange Commission are included in the Notes to the Consolidated Financial Statements.
(a)(3) Exhibits
The exhibits listed in the Exhibit Index immediately preceding the signature page hereto are filed as part of this Annual Report on Form 10‑K.
Item 16. FORM 10-K SUMMARY.
None.
Report of Independent Registered Public Accounting Firm
To the Stockholders and Board of Directors
Watts Water Technologies, Inc.:
Opinion on the ConsolidatedFinancial Statements
We have audited the accompanying consolidated balance sheets of Watts Water Technologies, Inc. and subsidiaries (the Company) as of December 31, 2018 and 2017, the related consolidated statements of operations, comprehensive income, stockholders’ equity, and cash flows for each of the years in the three‑yearcurrent period ended December 31, 2018, and the related notes and financial statement Schedule II – Valuation and Qualifying Accounts (collectively, the “consolidated financial statements”). In our opinion, the consolidated financial statements present fairly, in all material respects, the financial position of the Company as of December 31, 2018 and 2017, and the results of its operations and its cash flows for each of the years in the three‑year period ended December 31, 2018, in conformity with U.S. generally accepted accounting principles.
We also have audited, in accordance with the standards of the Public Company Accounting Oversight Board (United States) (PCAOB), the Company’s internal control over financial reporting as of December 31, 2018, based on criteria established in Internal Control – Integrated Framework (2013) issued by the Committee of Sponsoring Organizations of the Treadway Commission, and our report dated February 22, 2019 expressed an adverse opinion on the effectiveness of the Company’s internal control over financial reporting.
Basis for Opinion
These consolidated financial statements are the responsibility of the Company’s management. Our responsibility is to express an opinion on these consolidated financial statements based on our audits. We are a public accounting firm registered with the PCAOB and are required to be independent with respect to the Company in accordance with the U.S. federal securities laws and the applicable rules and regulations of the Securities and Exchange Commission and the PCAOB.
We conducted our audits in accordance with the standards of the PCAOB. Those standards require that we plan and perform the audit to obtain reasonable assurance about whether the consolidated financial statements are free of material misstatement, whether due to error or fraud. Our audits included performing procedures to assess the risks of material misstatement of the consolidated financial statements whether duethat was communicated or required to errorbe communicated to the audit committee and that: (1) relates to accounts or fraud, and performing proceduresdisclosures that respondare material to those risks. Such procedures included examining, on a test basis, evidence regarding the amounts and disclosures in the consolidated financial statements. Our audits also included evaluatingstatements and (2) involved our especially challenging, subjective, or complex judgments. The communication of a critical audit matter does not alter in any way our opinion on the accounting principlesconsolidated financial statements, taken as a whole, and we are not, by communicating the critical audit matter below, providing a separate opinion on the critical audit matter or on the accounts or disclosures to which it relates.
Product liability accrual
As discussed in Notes 10 and 15 to the consolidated financial statements, the Company’s product liability accrual as of December 31, 2021 was $22.2 million. The Company is generally self-insured for potential product liability claims. For its most significant volume of liability matters, the Company uses third-party actuarial valuations, which incorporate historical trend factors and its specific claims experience derived from loss reports provided by third-party claims administrators, to establish its product liability accrual.
We identified the evaluation of the product liability accrual as a critical audit matter. A high degree of auditor judgment and actuarial professionals with specialized skills and knowledge were required to (1) assess the actuarial methods used, and significant estimates made by management,(2) evaluate the estimated ultimate losses on claims that are based on application of loss development factors to historical claims experience.
The following are the primary procedures we performed to address this critical audit matter. We evaluated the design and tested the operating effectiveness of internal controls related to the product liability accrual, which included controls over the review of the actuarial valuations and selection of estimated ultimate losses, as well as evaluatingcompleteness and accuracy of claims data used in the overall presentationactuarial valuations. We tested current year claims data used to estimate the product liability accrual by selecting certain claims and comparing them to relevant underlying claim information, including documentation of the consolidated financial statements.claim payments. We believe that our audits provide a reasonable basis for our opinion.involved an actuarial professional with specialized skills and knowledge, who assisted in:
| ● | assessing the actuarial methods used to calculate the product liability accrual for consistency with generally accepted actuarial standards; |
| ● | assessing the loss development factors by comparing them to historical loss development factors and industry loss development trends; |
| ● | evaluating the weighting of actuarial methods used to derive ultimate losses. |
/s//s/ KPMG LLP
We have served as the Company’s auditor since 1997.
Boston, Massachusetts
February 22, 20192022
Watts Water Technologies, Inc. and Subsidiaries
Consolidated Statements of Operations
(Amounts in millions, except per share information)
| | | | | | | | | |
| | Year Ended December 31, |
| | 2018 | | 2017 | | 2016 |
Net sales | | $ | 1,564.9 | | $ | 1,456.7 | | $ | 1,398.4 |
Cost of goods sold | | | 908.4 | | | 854.3 | | | 832.8 |
GROSS PROFIT | | | 656.5 | | | 602.4 | | | 565.6 |
Selling, general and administrative expenses | | | 464.7 | | | 432.3 | | | 424.1 |
Restructuring | | | 3.4 | | | 6.8 | | | 4.7 |
Other long-lived asset impairment charges | | | — | | | 1.0 | | | 0.5 |
Gain on disposition | | | — | | | — | | | (8.7) |
OPERATING INCOME | | | 188.4 | | | 162.3 | | | 145.0 |
Other (income) expense: | | | | | | | | | |
Interest income | | | (0.8) | | | (1.0) | | | (1.0) |
Interest expense | | | 16.3 | | | 19.1 | | | 22.6 |
Other (income) expense, net | | | (1.7) | | | 1.1 | | | (4.4) |
Total other expense | | | 13.8 | | | 19.2 | | | 17.2 |
INCOME BEFORE INCOME TAXES | | | 174.6 | | | 143.1 | | | 127.8 |
Provision for income taxes | | | 46.6 | | | 70.0 | | | 43.6 |
NET INCOME | | $ | 128.0 | | $ | 73.1 | | $ | 84.2 |
Basic EPS | | | | | | | | | |
NET INCOME PER SHARE | | $ | 3.73 | | $ | 2.12 | | $ | 2.45 |
Weighted average number of shares | | | 34.3 | | | 34.4 | | | 34.4 |
Diluted EPS | | | | | | | | | |
NET INCOME PER SHARE | | $ | 3.73 | | $ | 2.12 | | $ | 2.44 |
Weighted average number of shares | | | 34.3 | | | 34.4 | | | 34.5 |
Dividends declared per share | | $ | 0.82 | | $ | 0.75 | | $ | 0.71 |
| | | | | | | | | |
| | Year Ended December 31, |
| | 2021 | | 2020 | | 2019 |
Net sales | | $ | 1,809.2 | | $ | 1,508.6 | | $ | 1,600.5 |
Cost of goods sold | | | 1,042.1 | | | 883.2 | | | 923.0 |
GROSS PROFIT | | | 767.1 | | | 625.4 | | | 677.5 |
Selling, general and administrative expenses | | | 508.2 | | | 432.4 | | | 476.1 |
Restructuring | | | 19.3 | | | 9.9 | | | 4.3 |
Other long-lived asset impairment charge | | | — | | | 1.4 | | | — |
Loss on disposition | | | — | | | 0.6 | | | — |
OPERATING INCOME | | | 239.6 | | | 181.1 | | | 197.1 |
Other (income) expense: | | | | | | | | | |
Interest income | | | — | | | (0.2) | | | (0.4) |
Interest expense | | | 6.3 | | | 13.3 | | | 14.1 |
Other (income) expense, net | | | (0.8) | | | 1.0 | | | (0.5) |
Total other expense | | | 5.5 | | | 14.1 | | | 13.2 |
INCOME BEFORE INCOME TAXES | | | 234.1 | | | 167.0 | | | 183.9 |
Provision for income taxes | | | 68.4 | | | 52.7 | | | 52.4 |
NET INCOME | | $ | 165.7 | | $ | 114.3 | | $ | 131.5 |
Basic EPS | | | | | | | | | |
NET INCOME PER SHARE | | $ | 4.90 | | $ | 3.37 | | $ | 3.86 |
Weighted average number of shares | | | 33.8 | | | 33.9 | | | 34.1 |
Diluted EPS | | | | | | | | | |
NET INCOME PER SHARE | | $ | 4.88 | | $ | 3.36 | | $ | 3.85 |
Weighted average number of shares | | | 33.9 | | | 34.0 | | | 34.2 |
Dividends declared per share | | $ | 1.01 | | $ | 0.92 | | $ | 0.90 |
The accompanying notes are an integral part of these consolidated financial statements.
Watts Water Technologies, Inc. and Subsidiaries
Consolidated Statements of Comprehensive Income
(Amounts in millions)
| | | | | | | | | |
| | Year Ended December 31, |
| | 2018 | | 2017 | | 2016 |
Net income | | $ | 128.0 | | $ | 73.1 | | $ | 84.2 |
Other comprehensive (loss) income, net of tax: | | | | | | | | | |
Foreign currency translation adjustments | | | (23.7) | | | 51.1 | | | (32.4) |
Reversal of foreign currency translation for sale of foreign entity, net of tax | | | — | | | — | | | 6.9 |
Cash flow hedges | | | 1.7 | | | 0.6 | | | 2.9 |
Other comprehensive (loss) income | | | (22.0) | | | 51.7 | | | (22.6) |
Comprehensive income | | $ | 106.0 | | $ | 124.8 | | $ | 61.6 |
| | | | | | | | | |
| | Year Ended December 31, |
| | 2021 | | 2020 | | 2019 |
Net income | | $ | 165.7 | | $ | 114.3 | | $ | 131.5 |
Other comprehensive (loss) income net of tax: | | | | | | | | | |
Foreign currency translation adjustments | | | (28.0) | | | 31.4 | | | (5.0) |
Cash flow hedges | | | 0.7 | | | (0.6) | | | (4.7) |
Other comprehensive (loss) income | | | (27.3) | | | 30.8 | | | (9.7) |
Comprehensive income | | $ | 138.4 | | $ | 145.1 | | $ | 121.8 |
The accompanying notes are an integral part of these consolidated financial statements.
Watts Water Technologies, Inc. and Subsidiaries
Consolidated Balance Sheets
(Amounts in millions, except share information)
| | | | | | |
| | December 31, |
| | 2018 | | 2017 |
ASSETS | | | | | | |
CURRENT ASSETS: | | | | | | |
Cash and cash equivalents | | $ | 204.1 | | $ | 280.2 |
Trade accounts receivable, less allowance for doubtful accounts of $15.0 million at December 31, 2018 and $14.3 million at December 31, 2017 | | | 205.5 | | | 216.1 |
Inventories, net | | | 286.8 | | | 259.1 |
Prepaid expenses and other current assets | | | 24.9 | | | 26.7 |
Assets held for sale | | | — | | | 1.5 |
Total Current Assets | | | 721.3 | | | 783.6 |
PROPERTY, PLANT AND EQUIPMENT | | | | | | |
Property, plant and equipment, at cost | | | 537.4 | | | 525.8 |
Accumulated depreciation | | | (335.5) | | | (327.3) |
Property, plant and equipment, net | | | 201.9 | | | 198.5 |
OTHER ASSETS: | | | | | | |
Goodwill | | | 544.8 | | | 550.5 |
Intangible assets, net | | | 165.2 | | | 185.2 |
Deferred income taxes | | | 1.6 | | | 1.6 |
Other, net | | | 18.9 | | | 17.1 |
TOTAL ASSETS | | $ | 1,653.7 | | $ | 1,736.5 |
LIABILITIES AND STOCKHOLDERS’ EQUITY | | | | | | |
CURRENT LIABILITIES: | | | | | | |
Accounts payable | | $ | 127.2 | | $ | 123.8 |
Accrued expenses and other liabilities | | | 130.6 | | | 125.8 |
Accrued compensation and benefits | | | 60.9 | | | 55.3 |
Current portion of long-term debt | | | 30.0 | | | 22.5 |
Total Current Liabilities | | | 348.7 | | | 327.4 |
LONG-TERM DEBT, NET OF CURRENT PORTION | | | 323.4 | | | 474.6 |
DEFERRED INCOME TAXES | | | 38.5 | | | 55.2 |
OTHER NONCURRENT LIABILITIES | | | 51.8 | | | 50.3 |
STOCKHOLDERS’ EQUITY: | | | | | | |
Preferred Stock, $0.10 par value; 5,000,000 shares authorized; no shares issued or outstanding | | | — | | | — |
Class A common stock, $0.10 par value; 80,000,000 shares authorized; 1 vote per share; issued and outstanding, 27,646,465 shares at December 31, 2018 and 27,724,192 shares at December 31, 2017 | | | 2.8 | | | 2.8 |
Class B common stock, $0.10 par value; 25,000,000 shares authorized; 10 votes per share; issued and outstanding, 6,329,290 shares at December 31, 2018 and 6,379,290 shares at December 31, 2017 | | | 0.6 | | | 0.6 |
Additional paid-in capital | | | 568.3 | | | 551.8 |
Retained earnings | | | 440.7 | | | 372.9 |
Accumulated other comprehensive loss | | | (121.1) | | | (99.1) |
Total Stockholders’ Equity | | | 891.3 | | | 829.0 |
TOTAL LIABILITIES AND STOCKHOLDERS’ EQUITY | | $ | 1,653.7 | | $ | 1,736.5 |
| | | | | | |
| | December 31, |
| | 2021 | | 2020 |
ASSETS | | | | | | |
CURRENT ASSETS: | | | | | | |
Cash and cash equivalents | | $ | 242.0 | | $ | 218.9 |
Trade accounts receivable, less reserve allowances of $10.3 million at December 31, 2021 and $11.1 million at December 31, 2020 | | | 220.9 | | | 197.6 |
Raw materials | | | 119.4 | | | 79.6 |
Work in process | | | 20.4 | | | 16.1 |
Finished goods | | | 230.9 | | | 167.9 |
Total Inventories | | | 370.7 | | | 263.6 |
Prepaid expenses and other current assets | | | 27.9 | | | 29.4 |
Total Current Assets | | | 861.5 | | | 709.5 |
PROPERTY, PLANT AND EQUIPMENT | | | | | | |
Property, plant and equipment, at cost | | | 608.8 | | | 608.6 |
Accumulated depreciation | | | (408.1) | | | (396.3) |
Property, plant and equipment, net | | | 200.7 | | | 212.3 |
OTHER ASSETS: | | | | | | |
Goodwill | | | 600.7 | | | 602.4 |
Intangible assets, net | | | 128.6 | | | 141.8 |
Deferred income taxes | | | 3.5 | | | 4.4 |
Other, net | | | 60.6 | | | 67.8 |
TOTAL ASSETS | | $ | 1,855.6 | | $ | 1,738.2 |
LIABILITIES AND STOCKHOLDERS’ EQUITY | | | | | | |
CURRENT LIABILITIES: | | | | | | |
Accounts payable | | $ | 143.4 | | $ | 110.1 |
Accrued expenses and other liabilities | | | 186.9 | | | 137.4 |
Accrued compensation and benefits | | | 78.2 | | | 65.3 |
Total Current Liabilities | | | 408.5 | | | 312.8 |
LONG-TERM DEBT | | | 141.9 | | | 198.2 |
DEFERRED INCOME TAXES | | | 40.5 | | | 51.1 |
OTHER NONCURRENT LIABILITIES | | | 91.5 | | | 106.3 |
STOCKHOLDERS’ EQUITY: | | | | | | |
Preferred Stock, $0.10 par value; 5,000,000 shares authorized; 0 shares issued or outstanding | | | — | | | — |
Class A common stock, $0.10 par value; 120,000,000 shares authorized; 1 vote per share; issued and outstanding, 27,584,525 shares at December 31, 2021 and 27,478,512 shares at December 31, 2020 | | | 2.8 | | | 2.8 |
Class B common stock, $0.10 par value; 25,000,000 shares authorized; 10 votes per share; issued and outstanding, 6,024,290 shares at December 31, 2021 and 6,144,290 shares at December 31, 2020 | | | 0.6 | | | 0.6 |
Additional paid-in capital | | | 631.2 | | | 606.3 |
Retained earnings | | | 665.9 | | | 560.1 |
Accumulated other comprehensive loss | | | (127.3) | | | (100.0) |
Total Stockholders’ Equity | | | 1,173.2 | | | 1,069.8 |
TOTAL LIABILITIES AND STOCKHOLDERS’ EQUITY | | $ | 1,855.6 | | $ | 1,738.2 |
The accompanying notes are an integral part of these consolidated financial statements.
Watts Water Technologies, Inc. and Subsidiaries
Consolidated Statements of Stockholders’ Equity
(Amounts in millions, except share information)
| | | | | | | | | | | | | | | | | | | | | | |
| | | | | | | | | | | | | | | | | | Accumulated | | | |
| | Class A | | Class B | | Additional | | | | | Other | | Total |
| | Common Stock | | Common Stock | | Paid-In | | Retained | | Comprehensive | | Stockholders’ |
| | Shares | | Amount | | Shares | | Amount | | Capital | | Earnings | | Income (Loss) | | Equity |
Balance at December 31, 2015 | | 28,049,908 | | $ | 2.8 | | 6,379,290 | | $ | 0.6 | | $ | 512.0 | | $ | 317.7 | | $ | (128.2) | | $ | 704.9 |
Net loss | | — | | | — | | — | | | — | | | — | | | 84.2 | | | — | | | 84.2 |
Other comprehensive loss | | — | | | — | | — | | | — | | | — | | | — | | | (22.6) | | | (22.6) |
Comprehensive loss | | | | | | | | | | | | | | | | | | | | | | 61.6 |
Shares of Class A common stock issued upon the exercise of stock options | | 217,030 | | | — | | — | | | — | | | 8.2 | | | — | | | — | | | 8.2 |
Stock-based compensation | | — | | | — | | — | | | — | | | 13.4 | | | — | | | — | | | 13.4 |
Stock repurchase | | (501,229) | | | — | | — | | | — | | | — | | | (26.8) | | | — | | | (26.8) |
Issuance of shares of restricted Class A common stock | | 53,714 | | | — | | — | | | — | | | — | | | (1.6) | | | — | | | (1.6) |
Net change in restricted stock units | | 11,590 | | | — | | — | | | — | | | 1.6 | | | (0.5) | | | — | | | 1.1 |
Common stock dividends | | — | | | — | | — | | | — | | | — | | | (24.5) | | | — | | | (24.5) |
Balance at December 31, 2016 | | 27,831,013 | | $ | 2.8 | | 6,379,290 | | $ | 0.6 | | $ | 535.2 | | $ | 348.5 | | $ | (150.8) | | $ | 736.3 |
Share based payment change in accounting principle | | — | | | — | | — | | | — | | | — | | | (0.5) | | | — | | | (0.5) |
Net income | | — | | | — | | — | | | — | | | — | | | 73.1 | | | — | | | 73.1 |
Other comprehensive income | | — | | | — | | — | | | — | | | — | | | — | | | 51.7 | | | 51.7 |
Comprehensive income | | | | | | | | | | | | | | | | | | | | | | 124.8 |
Shares of Class A common stock issued upon the exercise of stock options | | 31,377 | | | — | | — | | | — | | | 1.7 | | | — | | | — | | | 1.7 |
Stock-based compensation | | — | | | — | | — | | | — | | | 13.9 | | | — | | | — | | | 13.9 |
Stock repurchase | | (277,886) | | | — | | — | | | — | | | — | | | (18.2) | | | — | | | (18.2) |
Issuance of net shares of restricted Class A common stock | | 87,443 | | | — | | — | | | — | | | — | | | (2.4) | | | — | | | (2.4) |
Net change in restricted stock units | | 52,245 | | | — | | — | | | — | | | 1.0 | | | (1.7) | | | — | | | (0.7) |
Common stock dividends | | — | | | — | | — | | | — | | | — | | | (25.9) | | | — | | | (25.9) |
Balance at December 31, 2017 | | 27,724,192 | | $ | 2.8 | | 6,379,290 | | $ | 0.6 | | $ | 551.8 | | $ | 372.9 | | $ | (99.1) | | $ | 829.0 |
Reporting Comprehensive Income change in accounting principle (ASU 2018-02) | | — | | | — | | — | | | — | | | — | | | (0.7) | | | — | | | (0.7) |
Net income | | — | | | — | | — | | | — | | | — | | | 128.0 | | | — | | | 128.0 |
Other comprehensive income | | — | | | — | | — | | | — | | | — | | | — | | | (22.0) | | | (22.0) |
Comprehensive income | | | | | | | | | | | | | | | | | | | | | | 106.0 |
Shares of Class B common stock converted to Class A common stock | | 50,000 | | | — | | (50,000) | | | — | | | — | | | — | | | — | | | — |
Shares of Class A common stock issued upon the exercise of stock options | | 45,939 | | | — | | — | | | — | | | 2.5 | | | — | | | — | | | 2.5 |
Stock-based compensation | | — | | | — | | — | | | — | | | 13.8 | | | — | | | — | | | 13.8 |
Stock repurchase | | (340,106) | | | — | | — | | | — | | | — | | | (26.0) | | | — | | | (26.0) |
Issuance of net shares of restricted Class A common stock | | 115,120 | | | — | | — | | | — | | | — | | | (3.1) | | | — | | | (3.1) |
Net change in restricted stock units | | 51,320 | | | — | | — | | | — | | | 0.2 | | | (2.1) | | | — | | | (1.9) |
Common stock dividends | | — | | | — | | — | | | — | | | — | | | (28.3) | | | — | | | (28.3) |
Balance at December 31, 2018 | | 27,646,465 | | $ | 2.8 | | 6,329,290 | | $ | 0.6 | | $ | 568.3 | | $ | 440.7 | | $ | (121.1) | | | 891.3 |
| | | | | | | | | | | | | | | | | | | | | | |
| | | | | | | | | | | | | | | | | | Accumulated | | | |
| | Class A | | Class B | | Additional | | | | | Other | | Total |
| | Common Stock | | Common Stock | | Paid-In | | Retained | | Comprehensive | | Stockholders’ |
| | Shares | | Amount | | Shares | | Amount | | Capital | | Earnings | | Loss | | Equity |
Balance at December 31, 2018 | | 27,646,465 | | $ | 2.8 | | 6,329,290 | | $ | 0.6 | | $ | 568.3 | | $ | 440.7 | | $ | (121.1) | | $ | 891.3 |
Net income | | — | | | — | | — | | | — | | | — | | | 131.5 | | | — | | | 131.5 |
Other comprehensive loss | | — | | | — | | — | | | — | | | — | | | — | | | (9.7) | | | (9.7) |
Comprehensive income | | | | | | | | | | | | | | | | | | | | | | 121.8 |
Shares of Class B common stock converted to Class A common stock | | 50,000 | | | — | | (50,000) | | | — | | | — | | | — | | | — | | | — |
Shares of Class A common stock issued upon the exercise of stock options | | 38,288 | | | — | | — | | | — | | | 2.1 | | | — | | | — | | | 2.1 |
Stock-based compensation | | — | | | — | | — | | | — | | | 17.8 | | | — | | | — | | | 17.8 |
Stock repurchase | | (227,620) | | | — | | — | | | — | | | — | | | (19.5) | | | — | | | (19.5) |
Net change in restricted stock units | | 79,283 | | | — | | — | | | — | | | 3.3 | | | (7.4) | | | — | | | (4.1) |
Common stock dividends | | — | | | — | | — | | | — | | | — | | | (31.4) | | | — | | | (31.4) |
Balance at December 31, 2019 | | 27,586,416 | | $ | 2.8 | | 6,279,290 | | $ | 0.6 | | $ | 591.5 | | $ | 513.9 | | $ | (130.8) | | $ | 978.0 |
Net income | | — | | | — | | — | | | — | | | — | | | 114.3 | | | — | | | 114.3 |
Other comprehensive income | | — | | | — | | — | | | — | | | — | | | — | | | 30.8 | | | 30.8 |
Comprehensive income | | | | | | | | | | | | | | | | | | | | | | 145.1 |
Shares of Class B common stock converted to Class A common stock | | 135,000 | | | — | | (135,000) | | | — | | | — | | | — | | | — | | | — |
Shares of Class A common stock issued upon the exercise of stock options | | 4,666 | | | — | | — | | | — | | | 0.4 | | | — | | | — | | | 0.4 |
Stock-based compensation | | — | | | — | | — | | | — | | | 12.7 | | | — | | | — | | | 12.7 |
Stock repurchase | | (331,531) | | | — | | — | | | — | | | — | | | (28.9) | | | — | | | (28.9) |
Net change in restricted stock units | | 83,961 | | | — | | — | | | — | | | 1.7 | | | (7.8) | | | — | | | (6.1) |
Common stock dividends | | — | | | — | | — | | | — | | | — | | | (31.4) | | | — | | | (31.4) |
Balance at December 31, 2020 | | 27,478,512 | | $ | 2.8 | | 6,144,290 | | $ | 0.6 | | $ | 606.3 | | $ | 560.1 | | $ | (100.0) | | $ | 1,069.8 |
Net income | | — | | | — | | — | | | — | | | — | | | 165.7 | | | — | | | 165.7 |
Other comprehensive loss | | — | | | — | | — | | | — | | | — | | | — | | | (27.3) | | | (27.3) |
Comprehensive income | | | | | | | | | | | | | | | | | ��� | | — | | | 138.4 |
Shares of Class B common stock converted to Class A common stock | | 120,000 | | | — | | (120,000) | | | — | | | — | | | — | | | — | | | — |
Shares of Class A common stock issued upon the exercise of stock options | | 1,440 | | | — | | — | | | — | | | 0.1 | | | — | | | — | | | 0.1 |
Stock-based compensation | | — | | | — | | — | | | — | | | 22.9 | | | — | | | — | | | 22.9 |
Stock repurchase | | (109,998) | | | — | | — | | | — | | | — | | | (16.0) | | | — | | | (16.0) |
Net change in restricted stock units | | 94,571 | | | — | | — | | | — | | | 1.9 | | | (9.6) | | | — | | | (7.7) |
Common stock dividends | | — | | | — | | — | | | — | | | — | | | (34.3) | | | — | | | (34.3) |
Balance at December 31, 2021 | | 27,584,525 | | $ | 2.8 | | 6,024,290 | | $ | 0.6 | | $ | 631.2 | | $ | 665.9 | | $ | (127.3) | | | 1,173.2 |
The accompanying notes are an integral part of these consolidated financial statements.
Watts Water Technologies, Inc. and Subsidiaries
Consolidated Statements of Cash Flows
(Amounts in millions)
| | | | | | | | | |
| | Year Ended December 31, |
| | 2018 | | 2017 | | 2016 |
OPERATING ACTIVITIES | | | | | | | | | |
Net income | | $ | 128.0 | | $ | 73.1 | | $ | 84.2 |
Adjustments to reconcile net income to net cash provided by operating activities: | | | | | | | | | |
Depreciation | | | 28.9 | | | 29.7 | | | 30.4 |
Amortization of intangibles | | | 19.6 | | | 22.5 | | | 20.8 |
Loss on disposal and impairment of intangibles, property, plant and equipment and other | | | 0.2 | | | 2.1 | | | 3.7 |
Gain on disposition | | | — | | | — | | | (8.6) |
Gain on acquisition | | | — | | | — | | | (1.7) |
Stock-based compensation | | | 13.8 | | | 13.9 | | | 13.4 |
Deferred income tax | | | (15.3) | | | 6.4 | | | 3.5 |
Changes in operating assets and liabilities, net of effects from business acquisitions and divestures: | | | | | | | | | |
Accounts receivable | | | 6.0 | | | (7.5) | | | (7.1) |
Inventories | | | (34.5) | | | (8.4) | | | 9.8 |
Prepaid expenses and other assets | | | 0.6 | | | 14.7 | | | 4.9 |
Accounts payable, accrued expenses and other liabilities | | | 22.1 | | | 9.4 | | | (15.2) |
Net cash provided by operating activities | | | 169.4 | | | 155.9 | | | 138.1 |
INVESTING ACTIVITIES | | | | | | | | | |
Additions to property, plant and equipment | | | (35.9) | | | (29.4) | | | (36.0) |
Proceeds from the sale of property, plant and equipment | | | 2.2 | | | 0.4 | | | 0.1 |
Net proceeds from the sale of assets, and other | | | 0.2 | | | 3.1 | | | 9.9 |
Purchase of intangible assets | | | (0.7) | | | (1.5) | | | — |
Business acquisitions, net of cash acquired and other | | | (1.7) | | | 0.1 | | | (88.0) |
Net cash used in investing activities | | | (35.9) | | | (27.3) | | | (114.0) |
FINANCING ACTIVITIES | | | | | | | | | |
Proceeds from long-term borrowings | | | 50.0 | | | 20.0 | | | 688.8 |
Payments of long-term debt | | | (194.5) | | | (178.0) | | | (614.4) |
Payment of capital leases and other | | | (6.6) | | | (4.9) | | | (1.5) |
Proceeds from share transactions under employee stock plans | | | 2.5 | | | 1.7 | | | 8.2 |
Payments to repurchase common stock | | | (26.0) | | | (18.2) | | | (26.8) |
Debt issuance costs | | | — | | | — | | | (2.1) |
Dividends | | | (28.3) | | | (25.9) | | | (24.5) |
Net cash (used in) provided by financing activities | | | (202.9) | | | (205.3) | | | 27.7 |
Effect of exchange rate changes on cash and cash equivalents | | | (6.7) | | | 18.5 | | | (9.6) |
(DECREASE) INCREASE IN CASH AND CASH EQUIVALENTS | | | (76.1) | | | (58.2) | | | 42.2 |
Cash and cash equivalents at beginning of year | | | 280.2 | | | 338.4 | | | 296.2 |
CASH AND CASH EQUIVALENTS AT END OF YEAR | | $ | 204.1 | | $ | 280.2 | | $ | 338.4 |
NON CASH INVESTING AND FINANCING ACTIVITIES | | | | | | | | | |
Acquisition of businesses: | | | | | | | | | |
Fair value of assets acquired | | $ | 4.1 | | $ | — | | $ | 112.6 |
Cash paid, net of cash acquired | | | 1.7 | | | — | | | 88.0 |
Gain on acquisition | | | — | | | (0.1) | | | 1.7 |
Liabilities assumed | | $ | 2.4 | | $ | — | | $ | 22.9 |
Issuance of stock under management stock purchase plan | | $ | 1.9 | | $ | 0.9 | | $ | 0.7 |
CASH PAID FOR: | | | | | | | | | |
Interest | | $ | 19.1 | | $ | 18.8 | | $ | 20.2 |
Income taxes | | $ | 55.3 | | $ | 39.4 | | $ | 33.5 |
| | | | | | | | | |
| | Year Ended December 31, |
| | 2021 | | 2020 | | 2019 |
OPERATING ACTIVITIES | | | | | | | | | |
Net income | | $ | 165.7 | | $ | 114.3 | | $ | 131.5 |
Adjustments to reconcile net income to net cash provided by operating activities: | | | | | | | | | |
Depreciation | | | 31.4 | | | 31.3 | | | 31.0 |
Amortization of intangibles | | | 13.7 | | | 15.2 | | | 15.6 |
Loss on disposal and impairment of property, plant and equipment and other | | | 1.4 | | | 4.0 | | | 0.8 |
Stock-based compensation | | | 22.9 | | | 12.7 | | | 17.8 |
Deferred income tax | | | (8.2) | | | 7.0 | | | 1.3 |
Changes in operating assets and liabilities, net of effects from business acquisitions and divestitures: | | | | | | | | | |
Accounts receivable | | | (30.2) | | | 32.2 | | | (15.0) |
Inventories | | | (113.7) | | | 18.7 | | | 17.0 |
Prepaid expenses and other assets | | | (0.8) | | | 0.7 | | | (1.6) |
Accounts payable, accrued expenses and other liabilities | | | 98.6 | | | (7.3) | | | (4.4) |
Net cash provided by operating activities | | | 180.8 | | | 228.8 | | | 194.0 |
INVESTING ACTIVITIES | | | | | | | | | |
Additions to property, plant and equipment | | | (26.7) | | | (43.8) | | | (29.2) |
Proceeds from the sale of property, plant and equipment | | | 5.1 | | | 2.2 | | | 0.1 |
Proceeds from the sale of business, and other | | | — | | | 2.0 | | | — |
Business acquisitions, net of cash acquired | | | (9.1) | | | (15.2) | | | (42.7) |
Net cash used in investing activities | | | (30.7) | | | (54.8) | | | (71.8) |
FINANCING ACTIVITIES | | | | | | | | | |
Proceeds from long-term borrowings | | | 40.0 | | | 407.5 | | | 82.0 |
Payments of long-term debt | | | (95.0) | | | (517.5) | | | (127.0) |
Payments for withholding taxes on vested awards | | | (9.6) | | | (7.8) | | | (7.4) |
Payments for finance leases and other | | | (1.4) | | | (2.1) | | | (1.6) |
Payments on contractual call option | | | — | | | — | | | (2.8) |
Proceeds from share transactions under employee stock plans | | | 0.1 | | | 0.5 | | | 2.1 |
Debt issuance costs | | | (2.4) | | | (2.2) | | | — |
Payments to repurchase common stock | | | (16.0) | | | (28.9) | | | (19.5) |
Dividends | | | (34.3) | | | (31.4) | | | (31.4) |
Net cash used in financing activities | | | (118.6) | | | (181.9) | | | (105.6) |
Effect of exchange rate changes on cash and cash equivalents | | | (8.4) | | | 7.1 | | | (1.0) |
INCREASE (DECREASE) IN CASH AND CASH EQUIVALENTS | | | 23.1 | | | (0.8) | | | 15.6 |
Cash and cash equivalents at beginning of year | | | 218.9 | | | 219.7 | | | 204.1 |
CASH AND CASH EQUIVALENTS AT END OF YEAR | | $ | 242.0 | | $ | 218.9 | | $ | 219.7 |
| | | | | | | | | |
SUPPLEMENTAL CASH FLOW DISCLOSURE: | | | | | | | | | |
Acquisition of businesses: | | | | | | | | | |
Fair value of assets acquired | | $ | 12.1 | | $ | 20.4 | | $ | 43.3 |
Cash paid, net of cash acquired | | | 9.1 | | | 15.2 | | | 42.7 |
Liabilities assumed | | $ | 3.1 | | $ | 5.2 | | $ | 0.6 |
Issuance of stock under management stock purchase plan | | $ | 0.6 | | $ | 0.6 | | $ | 1.8 |
CASH PAID FOR: | | | | | | | | | |
Interest | | $ | 6.9 | | $ | 12.2 | | $ | 17.1 |
Income taxes | | $ | 73.0 | | $ | 45.6 | | $ | 50.8 |
The accompanying notes are an integral part of these consolidated financial statements.
Watts Water Technologies, Inc. and Subsidiaries
Notes to Consolidated Financial Statements
(1) Description of Business
Watts Water Technologies, Inc. (the Company) is a leading supplier of products, solutions and solutionssystems that conserve watermanage and manageconserve the flow of fluids and energy into, through and out of buildings in the commercial and residential markets of the Americas, Europe, and Asia-Pacific, Middle East, and Africa (APMEA). For over 140 years, the Company has designed and produced valve systems that safeguard and regulate water systems, energy efficient heating and hydronic systems, drainage systems and water filtration technology that helps purify and conserve water.
(2) Accounting Policies
Principles of Consolidation
The consolidated financial statements include the accounts of the Company and its majority and wholly ownedwholly-owned subsidiaries. Upon consolidation, all intercompany accounts and transactions are eliminated.
Cash Equivalents
Cash equivalents consist of instruments with remaining maturities of three months or less at the date of purchase and consist primarily of money market funds, for which the carrying amount is a reasonable estimate of fair value.
Allowance for Doubtful AccountsCredit Losses
The allowance for doubtful accountscredit losses is established to represent the Company’s best estimate of the net realizable value of the outstanding accounts receivable.amount of receivables that it will be unable to collect. The Company developed financial asset pools that consist of business or legal entities with similar risk and economic characteristics, including types of products and customers, trade receivable characteristics, and history of credit losses on trade receivables. The development of the Company’s allowance for doubtful accountscredit losses varies by regionasset pool but in general is based on a review of past due amounts, historical write‑offwrite-off experience, as well as aging trends affecting specific accounts, andchanges in customer payment terms, general operational factors affecting all accounts.accounts and as applicable current economic conditions and reasonable and supportable forecasted economic conditions that affect collectability. In addition, factors are developed in certain regions utilizing historical trends of sales and returns and allowances and cash discount activities to derive a reserve for returns and allowances and cash discounts.
The Company uniformly considers current economic trends and changes in customer payment terms when evaluating the adequacy of the allowance for doubtful accounts. The Company also aggressively monitors the creditworthiness of the Company’s largest customers and periodically reviews customer credit limits to reduce risk. If circumstances relating to specific customers change or unanticipated changes occur in the general business environment, the Company’s estimates of the recoverability of receivables could be further adjusted.
Concentration of Credit
The Company sells products to a diversified customer base and, therefore, has no significant concentrations of credit risk. In 2018, 2017,2021, 2020 and 2016,2019, no customer accounted for 10% or more of the Company’s total sales or accounts receivable.
Inventories
Inventories are stated at the lower of cost or market, using the first‑in, first‑outfirst-in, first-out method. Market value is determined by replacement cost or net realizable value. Historical usage is usedThe Company utilizes both specific product identification and historical product demand as the basis for determining the reserve forestimating its excess or obsolete inventories.inventory reserve, which is evaluated at least quarterly. The Company identifies all inventories that exceed a range of one to three years in sales to calculate inventory on hand that exceeds estimated demand. This is determined by comparing the current inventory balance against unit sales for the trailing twelve months. New products added to inventory within the past twelve months are excluded from this analysis. A portion of the Company’s products contain recoverable materials, therefore the excess and obsolete reserve is established net of any estimated recoverable amounts based on historical experience. Changes in market conditions,
lower-than-expected customer demand or changes in technology or features could result in additional excess or obsolete inventory that is not saleable and could require additional inventory reserve provisions.
Goodwill and Other Intangible Assets
Goodwill is recorded when the consideration paid for acquisitions exceeds the fair value of net tangible and intangible assets acquired. Goodwill and other intangible assets with indefinite useful lives are not amortized, but rather are tested for impairment at least annually or more frequently if events or circumstances indicate that it is “more likely than not”
that they might be impaired, such as from a change in business conditions. The Company performs its annual goodwill and indefinite-lived intangible assets impairment assessment in the fourth quarter of each year.
Long-Lived Assets
Intangible assets with estimable lives and other long‑livedlong-lived assets are reviewed for indicators of impairment at least quarterly or more frequently if events or changes in circumstances indicate that the carrying amount of an asset or asset group may not be recoverable.
Property, Plant and Equipment
Property, plant and equipment are recorded at cost. Depreciation is provided on a straight‑linestraight-line basis over the estimated useful lives of the assets, which range from 10 to 40 years for buildings and improvements and 3 to 15 years for machinery and equipment. Leasehold improvements are depreciated over the lesser of the economic useful life of the asset or the remaining lease term.
Leases
The Company has leases for the following classes of underlying assets: real estate, automobiles, manufacturing equipment, facility equipment, office equipment and certain service arrangements that are dependent on an identified asset. The Company determines if an arrangement qualifies as a lease at its inception. The Company, as the lessee, recognizes in the consolidated balance sheets a liability to make lease payments and a right-of-use asset (“ROU”) representing the right to use the underlying asset for both finance and operating leases with a lease term longer than twelve months. The Company elected the short-term lease recognition exemption for all leases that qualify and does not recognize ROU assets or lease liabilities for short-term leases. The Company recognizes short-term lease payments on a straight-line basis over the lease term in the consolidated statements of operations. The Company determines the initial classification and measurement of its ROU assets and lease liabilities at the lease commencement date and thereafter if modified.
For operating leases, the lease liability is initially and subsequently measured at the present value of the unpaid lease payments at the lease commencement date. For finance leases, the lease liability is initially measured in the same manner and date as operating leases and is subsequently measured at amortized cost using the effective interest method.
Measuring the lease liability requires certain estimates and judgments. These estimates and judgments include how the Company determines 1) the discount rate it uses to discount the unpaid lease payments to present value; 2) lease term; and 3) lease payments.
| ● | The present value of lease payments is determined using the interest rate implicit in the lease, if that rate is readily determinable; otherwise, the Company uses its incremental borrowing rate. Generally, the Company cannot determine the interest rate implicit in the lease because it does not have access to the lessor’s estimated residual value or the amount of the lessor’s deferred initial direct costs. Therefore, the Company uses the incremental borrowing rate as the discount rate for the lease. The Company’s incremental borrowing rate for a lease is the rate of interest it would have to pay on a collateralized basis to borrow an amount equal to the lease payments under a similar term. The Company’s incremental borrowing rate is determined by using a portfolio approach by geographic region, considering many factors, such as the Company’s specific credit risk, the amount of the lease payments, collateralized nature of the lease, both borrowing term and the lease term, and geographical economic considerations. |
| ● | The lease term for all of the Company’s leases includes the fixed, noncancelable term of the lease plus (a) all periods, if any, covered by options to extend the lease if the Company is reasonably certain to exercise that |
| | option, (b) all periods, if any, covered by an option to terminate the lease if the Company is reasonably certain not to exercise that option, and (c) all periods, if any, covered by an option to extend (or not to terminate) the lease in which exercise of the option is controlled by the lessor. When determining if a renewal option is reasonably certain of being exercised, the Company considers several economic factors, including but not limited to, the significance of leasehold improvements incurred on the property, whether the asset is difficult to replace, underlying contractual obligations, or specific characteristics unique to that particular lease that would make it reasonably certain to exercise such option. |
| ● | Lease payments included in the measurement of the lease liability include the following: |
| o | Fixed payments, including in-substance fixed payments, owed over the lease term (which includes termination penalties the Company would owe if the lease term assumes Company exercise of a termination option), less any lease incentives paid or payable to the Company; |
| o | Variable lease payments that depend on an index or rate initially measured using the index or rate at the commencement date; |
| o | Amounts expected to be payable under a Company-provided residual value guarantee; and |
| o | The exercise price of a Company option to purchase the underlying asset if the Company is reasonably certain to exercise that option. |
The ROU asset is initially measured at cost, which comprises the initial amount of the lease liability adjusted for the lease payments made at or before the lease commencement date, plus any initial direct costs incurred less any lease incentives received.
For operating leases, the ROU asset is subsequently measured throughout the lease term at the carrying amount of the lease liability, plus initial direct costs, plus (minus) any prepaid (accrued) lease payments, less the unamortized balance of lease incentives received. Lease expense for operating leases is recognized on a straight-line basis over the reasonably assured lease term based on the total lease payments and is included in cost of goods sold or within selling, general and administrative expenses in the consolidated statements of operations, based on the primary use of the ROU asset.
For finance leases, the Company recognizes the amortization of the ROU asset on a straight-line basis from the lease commencement date to the earlier of the end of the useful life or the end of the lease term unless the lease transfers ownership of the underlying asset to the Company or the Company is reasonably certain to exercise an option to purchase the underlying asset. In those cases, the ROU asset is amortized over the useful life of the underlying asset. Amortization of the ROU asset is recognized in depreciation in the consolidated statements of operations. The interest expense related to finance leases is recognized using the effective interest method and is included within interest expense.
Variable lease payments associated with the Company’s leases are recognized in the period when the event, activity, or circumstance in the lease agreement on which those payments are assessed occurs and are included in cost of goods sold or within selling, general and administrative expenses in the consolidated statements of operations, based on the primary use of the ROU asset.
ROU assets for operating and finance leases are assessed for impairment at least quarterly or more frequently if events or changes in circumstances indicate that the carrying amount of an asset or asset group may not be recoverable. The Company uses the long-lived assets impairment guidance in ASC Subtopic 360-10, Property, Plant, and Equipment- Overall, to determine whether an ROU asset is impaired, and if so, the amount of the impairment loss to recognize.
The Company monitors for events or changes in circumstances that require a reassessment of one of its leases. When a reassessment results in a remeasurement of a lease liability, a corresponding adjustment is made to the carrying amount of the corresponding ROU asset unless doing so would reduce the carrying amount of the ROU asset to an amount less than zero. In that case, the amount of the adjustment that would result in a negative ROU asset balance is recorded in the consolidated statements of operations.
Taxes, Other than Income Taxes
Taxes assessed by governmental authorities on sale transactions are recorded on a net basis and excluded from sales in the Company’s consolidated statements of operations.
Income Taxes
Income taxes are accounted for under the asset and liability method. Deferred tax assets and liabilities are recognized for the future tax consequences attributable to differences between the financial statement carrying amounts of existing assets and liabilities and their respective tax bases and operating loss and tax credit carry forwards. Deferred tax assets and liabilities are measured using enacted tax rates expected to apply to taxable income in the years in which those temporary differences are expected to be recovered or settled. The effect on deferred tax assets and liabilities of a change in tax rates is recognized in income in the period that includes the enactment date.
The Company recognizes tax benefits when the item in question meets the more–likely–than‑notthan-not (greater than 50% likelihood of being sustained upon examination by the taxing authorities) threshold.
As of December 31, 2018, the Company had gross unrecognized tax benefits of approximately $10.2 million, approximately $4.5 million of which, if recognized, would affect the effective tax rate. The difference between the amount of unrecognized tax benefits and the amount that would affect the effective tax rate consists of the federal tax benefit of state income tax items and allowable correlative adjustments that are available for certain jurisdictions.
A reconciliation of the beginning and ending amount of unrecognized tax is as follows:
| | | |
| | (in millions) |
Balance at January 1, 2018 | | $ | 7.7 |
Increases related to prior year tax positions | | | 2.5 |
Increases related to current year tax provisions | | | 2.5 |
Settlements | | | (2.1) |
Currency movement | | | (0.4) |
Balance at December 31, 2018 | | $ | 10.2 |
The Company estimates that it is reasonably possible that the balance of unrecognized tax benefits as of December 31, 2018 may decrease by approximately $0.5 million in the next twelve months, as a result of lapses in statutes of limitations and settlements of open audits.
In February 2018, the United States Internal Revenue Service concluded an audit of the Company’s 2015 and 2016 tax years. There were no material adjustments as a result of the audit. The Company conducts business in a variety of locations throughout the world resulting in tax filings in numerous domestic and foreign jurisdictions. The Company is subject to tax examinations regularly as part of the normal course of business. The Company’s major jurisdictions are the U.S., France, Germany, Canada, and the Netherlands. The statute of limitations in the U.S. is subject to tax examination
for 2015 and later; France, Germany, Canada and the Netherlands are subject to tax examination for 2012-2014 and later. All other jurisdictions, with few exceptions, are no longer subject to tax examinations in state, local or international jurisdictions for tax years before 2013.
The Company accounts for interest and penalties related to uncertain tax positions as a component of income tax expense.
Foreign Currency Translation
The functional currency for most of the Company’s foreign subsidiaries is their local currency. For non-U.S. subsidiaries that transact in a functional currency other than the U.S. dollar, assets and liabilities are translated at current rates of exchange at the balance sheet date. Income and expense items are translated at the average foreign currency exchange rates for the period. Adjustments resulting from the translation of the financial statements of foreign operations into U.S. dollars are excluded from the determination of net income and are recorded in accumulated other comprehensive income, a separate component of equity. Transaction gains and losses are included in other (income) expense, net in the consolidated statements of operations. For subsidiaries where the functional currency of the assets and liabilities differs from the local currency, non-monetary assets and liabilities are translated at the rate of exchange in effect on the date assets were acquired while monetary assets and liabilities are translated at current rates of exchange as of the balance sheet date. Income and expense items are translated at the average foreign currency rates for the period. Translation adjustments offor these subsidiaries are included in other (income) expense, net in the consolidated statements of operations.
Stock‑BasedStock-Based Compensation
The Company records compensation expense in the financial statements for share‑basedshare-based awards based on the grant date fair value of those awards for restricted stock awards and deferred stock awards. Stock‑basedStock-based compensation expense for restricted stock awards and deferred stock awards is recognized over the requisite service periods of the awards on a straight‑linestraight-line basis, which is generally commensurate with the vesting term. The performance stock units offered by the Company to employees are amortized to expense over the vesting period, and based on the Company’s performance relative to the performance goals, may be adjusted. Changes to the estimated shares expected to vest will result in adjustments to the related share-based compensation expense that will be recorded in the period of change. In March 2016, the FASB issued ASU 2016-09, “Improvements to Employee Share-Based Payment Accounting,” and theThe Company adopted this standard in the first quarter of 2017 with an immaterial change to retained earnings. As part of the adoption of this standard, the Company elected to accountaccounts for forfeitures as they occur, rather than estimate expected forfeitures over the vesting period of the respective grant. The Company also no longer reclassifiesdoes not reclassify the benefits associated with tax deductions in excess of recognized compensation cost from operating activities to financing activities in the Consolidated Statementconsolidated statements of Cash Flows. cash flows.
At December 31, 2018, the Company had one stock‑based compensation plan with total unrecognized compensation costs related to unvested stock‑based compensation arrangements of approximately $17.4 million and a total weighted average remaining term of 1.61 years. For 2018, 2017 and 2016, the Company recognized compensation costs related to stock‑based programs of approximately $13.8 million, $13.9 million and $13.4 million, respectively. For 2018, 2017 and 2016 stock compensation expense, $0.9 million, $0.8 million and $0.9 million, respectively, was recorded in cost of goods sold and $12.9 million, $13.1 million and $12.5 million, respectively, was recorded in selling, general and administrative expenses. For 2017 and 2016, the Company recorded approximately $0.1 million and $0.8 million, respectively, of tax benefits for the compensation expense relating to its stock options. For 2018, 2017 and 2016, the Company recorded approximately $2.8 million, $3.9 million and $2.8 million, respectively, of tax benefit for its other stock‑based plans. For 2018, 2017 and 2016, the recognition of total stock‑based compensation expense impacted both basic and diluted net income per common share by $0.32, $0.28 and $0.29, respectively.
Net Income Per Common Share
Basic net income per common share is calculated by dividing net income by the weighted average number of common shares outstanding. The calculation of diluted net income per share assumes the conversion of all dilutive securities.
Net income and the number of shares used to compute net income per share, basic and assuming full dilution, are reconciled below:
| | | | | | | | | | | | | | | | | | | | | | | | |
| | Year Ended December 31, |
| | 2018 | | 2017 | | 2016 |
| | | | | | | Per | | | | | | | Per | | | | | | | Per |
| | Net | | | | Share | | Net | | | | Share | | Net | | | | Share |
| | Income | | Shares | | Amount | | Income | | Shares | | Amount | | Income | | Shares | | Amount |
| | (Amounts in millions, except per share information) |
Basic EPS | | $ | 128.0 | | 34.3 | | $ | 3.73 | | $ | 73.1 | | 34.4 | | $ | 2.12 | | $ | 84.2 | | 34.4 | | $ | 2.45 |
Dilutive securities, principally common stock options | | | — | | — | | | — | | | — | | — | | | — | | | — | | 0.1 | | | (0.01) |
Diluted EPS | | $ | 128.0 | | 34.3 | | $ | 3.73 | | $ | 73.1 | | 34.4 | | $ | 2.12 | | $ | 84.2 | | 34.5 | | $ | 2.44 |
The computation of diluted net income per share for the year ended December 31, 2016 excludes the effect of the potential exercise of options to purchase approximately 0.1 million shares because the exercise price of the option was greater than the average market price of the Class A common stock and the effect would have been anti‑dilutive.
Financial Instruments
In the normal course of business, the Company manages risks associated with commodity prices, foreign exchange rates and interest rates through a variety of strategies, including the use of hedging transactions, executed in accordance with the Company’s policies. The Company’s hedging transactions include, but are not limited to, the use of various derivative financial and commodity instruments. As a matter of policy, the Company does not use derivative instruments unless there is an underlying exposure. Any change in value of the derivative instruments would be substantially offset by an opposite change in the value of the underlying hedged items. The Company does not use derivative instruments for trading or speculative purposes.
Derivative instruments may be designated and accounted for as either a hedge of a recognized asset or liability (fair value hedge) or a hedge of a forecasted transaction (cash flow hedge). For a fair value hedge, both the effective and ineffective portions of the change in fair value of the derivative instrument, along with an adjustment to the carrying amount of the hedged item for fair value changes attributable to the hedged risk, are recognized in earnings. For a cash flow hedge, changes in the fair value of the derivative instrument that are highly effective are deferred in accumulated other comprehensive income or loss until the underlying hedged item is recognized in earnings. The Company has twohad an interest rate swaps designated as cash flow hedges as of December 31, 2018swap and 2017. The Company also has foreign exchange hedges designated as cash flow hedges as of December 31, 2018.2021. Refer to Note 1716 for further details.
If a fair value or cash flow hedge were to cease to qualify for hedge accounting or be terminated, it would continue to be carried on the balance sheet at fair value until settled, but hedge accounting would be discontinued prospectively. If a forecasted transaction were no longer probable of occurring, amounts previously deferred in accumulated other comprehensive income would be recognized immediately in earnings. On occasion, the Company may enter into a derivative instrument that does not qualify for hedge accounting because it is entered into to offset changes in the fair value of an underlying transaction which is required to be recognized in earnings (natural hedge). These instruments are reflected in the Consolidated Balance Sheetsconsolidated balance sheets at fair value with changes in fair value recognized in earnings.
Portions of the Company’s outstanding debt are exposed to interest rate risks. The Company monitors its interest rate exposures on an ongoing basis to maximize the overall effectiveness of its interest rates.
Fair Value Measurements
Fair value is defined as the exchange price that would be received for an asset or paid to transfer a liability (an exit price) in the principal or most advantageous market for the asset or liability in an orderly transaction between market participants on the measurement date. An entity is required to maximize the use of observable inputs, where available, and minimize the use of unobservable inputs when measuring fair value.
The Company has certain financial assets and liabilities that are measured at fair value on a recurring basis and certain nonfinancial assets and liabilities that may be measured at fair value on a nonrecurring basis. The fair value disclosures of these assets and liabilities are based on a three‑levelthree-level hierarchy, which is defined as follows:
Level 1 | Quoted prices in active markets for identical assets or liabilities that the entity has the ability to access at the measurement date. |
| |
Level 2 | Observable inputs other than Level 1 prices, such as quoted prices for similar assets or liabilities, quoted prices in markets that are not active or other inputs that are observable or can be corroborated by observable market data for substantially the full term of the assets or liabilities. |
| |
Level 3 | Unobservable inputs that are supported by little or no market activity and that are significant to the fair value of the assets or liabilities. |
Assets and liabilities subject to this hierarchy are classified in their entirety based on the lowest level of input that is significant to the fair value measurement. The Company’s assessment of the significance of a particular input to the fair value measurement in its entirety requires judgment and considers factors specific to the asset or liability. Refer to Note 1716 for further details.
Shipping and Handling
Shipping and handling costs included in selling, general and administrative expense amounted to $56.3$69.4 million, $52.1$55.0 million and $47.9$57.6 million for the years ended December 31, 2018, 20172021, 2020 and 2016,2019, respectively.
Research and Development
Research and development costs included in selling, general, and administrative expense amounted to $34.5$45.6 million, $29.0$42.2 million and $26.5$39.6 million for the years ended December 31, 2018, 20172021, 2020 and 2016,2019, respectively.
Revenue Recognition
The Company recognizes revenue under the core principle to depict the transfer of control to the Company’s customers in an amount reflecting the consideration to which the Company expects to be entitled. In order to achieve that core principle, the Company applies the following five-step approach: (1) identify the contract with a customer, (2) identify the performance obligations in the contract, (3) determine the transaction price, (4) allocate the transaction price to the performance obligations in the contract, and (5) recognize revenue when a performance obligation is satisfied. When determining the transaction price of each contract, we consider contractual consideration payable by the customer and
variable consideration that may affect the total transaction price. Variable consideration, consisting of early payment discounts, rebates and other sources of price variability, are included in the estimated transaction price based on both customer-specific information as well as historical experience. The Company regularly reviews its estimates of variable consideration on the transaction price and recognizes changes in estimates on a cumulative catch-up basis as if the most current estimate of the transaction price adjusted for variable consideration had been known as of the inception of the contract.
The Company’s revenue for product sales is recognized on a point in time model, at the point control transfers to the customer, which is generally when products are shipped from the Company’s manufacturing or distribution facilities or when delivered to the customer’s named location. Sales tax, value-added tax, or other taxes collected concurrent with revenue producing activities are excluded from revenue. Freight costs billed to customers for shipping and handling activities are included in revenue with the related cost included in selling, general and administrative expenses. See Note 4 for further disclosures and detail regarding revenue recognition.
Basis of PresentationEstimates
Certain amounts in the 2017 and 2016 consolidated financial statements have been reclassified to permit comparison with the 2018 presentation, including from adoption of recent accounting standards. These reclassifications had no effect on reported results of operations or stockholders' equity.
Estimates
The preparation of financial statements in conformity with accounting principles generally accepted in the United States requires management to make estimates and assumptions that affect the reported amounts of assets and liabilities and disclosure of contingent assets and liabilities at the date of the financial statements and the reported amounts of revenues and expenses during the reporting period. The worldwide spread of COVID-19 has created uncertainty in the global economy. There have been no comparable recent events that provide guidance as to the effect COVID-19 as a global pandemic may have, and, as a result, the ultimate impact of COVID-19 and the extent to which COVID-19 continues to impact the Company’s business, results of operations and financial condition will depend on future developments, which are uncertain and difficult to predict. The use of estimates in specific accounting policies is described further below as appropriate. Actual results could differ from those estimates.
Recently Adopted Accounting Standards
In February 2018,December 2019, the FASBFinancial Accounting Standards Board (“FASB”) issued accounting standards update (“ASU”) No. 2019-12, “Income Taxes (Topic 740): Simplifying the Accounting for Income Taxes.” This ASU 2018-02 “Income Statement-Reporting Comprehensive Income.” ASU 2018-02 providessimplifies the accounting for income taxes by clarifying and amending existing guidance onrelated to the reclassificationrecognition of certainfranchise tax, effects from the 2017 Tax Cuts and Jobs Act (“2017 Tax Act”) from accumulated other comprehensive income. Current generally accepted accounting principles requires deferred tax liabilities and deferred tax assets to be adjusted for the effectevaluation of a changestep up in the tax basis of goodwill, and the effects of enacted changes in tax laws or tax rates with that effect included in income from operations in the period of enactment. This included the incomeeffective tax effects of items in accumulatedrate computation, among other comprehensive income. This guidance allows a reclassification from accumulated other comprehensive income to retained earningsclarifications. The effective date for the tax effects on items in accumulated other comprehensive income related to the change in tax rates from the 2017 Tax Act. This standard is effective for all entities for fiscal years beginning after December 15, 2018, including interim periods within that reporting period. Early adoption of this standardASU is the calendar year beginning January 1, 2021 with early adoption permitted. The Company adopted this standard in the first quarter of 2018,2021, and it did not have a material impact on the Company’s financial statements.
On January 1, 2018, the Company adopted the accounting standard ASC 606, Revenue from Contracts with Customers and all the related amendments (“new revenue standard” or “ASU 2014-09”) to all contracts using the modified retrospective method. The adoption of ASU 2014-09 was not material to the Company and as such, there was no cumulative effect upon the January 1, 2018 adoption date. As the impact of the new revenue standard is not material to the Company, there is no pro-forma disclosure presented for the year ended December 31, 2018. The Company expects the impact of the adoption of the new standardto be immaterial to the Company’s financial statements on an ongoing basis. See “Revenue Recognition” within this Note 2 and Note 4 of Notes to Consolidated Financial Statements in this Annual Report Form 10-K for further details.
In October 2016,March 2020, the FASB issued ASU 2016-16 “Intra-Entity Transfers2020-04, “Reference Rate Reform (Topic 848): Facilitation of Assets Other than Inventory.the Effects of Reference Rate Reform on Financial Reporting.” ASU 2016-16The amendments provide optional guidance for a limited time to ease the potential burden in accounting for reference rate reform. The new guidance provides guidanceoptional expedients and exceptions for applying U.S. GAAP to contracts, hedging relationships and other transactions affected by reference rate reform if certain criteria are met. The amendments apply only to contracts and hedging relationships that reference LIBOR or another reference rate expected to be discontinued due to reference rate reform. These amendments are effective immediately and may be applied prospectively to contract modifications made and hedging relationships entered into or evaluated on the timing of recognition of tax consequences of an intra-entity transfer of an asset other than inventory.or before December 31, 2022. The Company adopted this standard in the provision of this ASU during the firstsecond quarter of 2018, using the modified retrospective approach through a cumulative-effect adjustment to retained earnings as of the beginning of the quarter. The adoption of this guidance2021, and it did not have a material impact on the Company’s financial statements.
Accounting Standards Updates
In August 2018, the FASB issued ASU 2018-15 “Intangibles-Goodwill and Other-Internal-Use Software (Subtopic 350-40)-Customer’s Accounting for Implementation Costs Incurred in a Cloud Computing Arrangement that is a Service Contract.” ASU 2018-15 aligns the requirements for capitalizing implementation costs incurred in a hosting arrangement that is a service contract with the requirements for capitalizing implementation costs incurred to develop or obtain internal-use software. This guidance requires an entity in a hosting arrangement that is a service contract to follow the guidance in Subtopic 350-40 to determine which implementation costs to capitalize as an asset related to the service contract and which costs to expense. This standard is effective for fiscal years beginning after December 15, 2019, including interim periods within that reporting period. The Company is currently evaluating the impact of this guidance on the Company’s financial statements, and does not expect the adoption of this guidance to have a material impact on the Company’s financial statements.
In August 2018, the FASB issued ASU 2018-13 “Fair Value Measurement (Topic 820)-Disclosure Framework- Changes to the Disclosure Requirements for Fair Value Measurement.” ASU 2018-13 modifies the disclosure requirements on fair value measurements under Topic 820. This standard is effective for fiscal years beginning after December 15, 2019, including interim periods within that reporting period. The Company is currently evaluating the impact of this guidance on the Company’s disclosures; however, this guidance does not impact the Company’s financial statements.
In August 2017, the FASB issued ASU 2017-12 “Derivatives and Hedging (Topic 815)-Targeted Improvements to Accounting for Hedging Activities.” ASU 2017-12 amends the hedge accounting guidance to improve the financial reporting of hedging relationships to better portray the economic results of an entity’s risk management activities in the financial statements. This guidance permits hedge accounting for risk components in hedging relationships that involve nonfinancial risk, reduces complexity in hedging for fair value hedges of interest rate risk, eliminates the requirement to separately measure and report hedging ineffectiveness, and simplifies certain hedge effectiveness assessment requirements. This standard is effective for fiscal years beginning after December 15, 2018, including interim periods within that reporting period. The Company is currently evaluating the impact of this guidance, including transition
elections and required disclosures, on its financial statements, and does not expect the adoption of this guidance to have a material impact on the Company’s financial statements.
In February 2016, the FASB issued ASU 2016-02, “Leases (Topic 842).” ASU 2016‑02 requires a lessee to recognize in the statement of financial position a liability to make lease payments and a right-of-use asset representing the right to use the underlying asset for the lease term for both finance and operating leases with a term longer than twelve months. Topic 842 was subsequently amended by ASU 2018-01, “Land Easement Practical Expedient for Transition to Topic 842,” ASU 2018-10, “Codification Improvements to Topic 842, Leases,” and ASU 2018-11 “Targeted Improvements.” ASU 2016-02 is effective for financial statements issued for annual periods beginning after December 15, 2018 and all interim periods thereafter. Early adoption is permitted for all entities. A modified retrospective transition approach is required, applying the new standard to all leases existing at the date of initial application. The Company may choose to use either 1) the effective date of the standard or 2) the beginning of the earliest comparable period presented in the financial statements as the date of initial application. The Company adopted the new standard on January 1, 2019 and used the effective date of the standard as the date of the Company’s initial application. By electing this approach, the financial information and the disclosures required under the new standard will not be provided for dates and periods before January 1, 2019.
The new standard provides a number of optional practical expedients throughout the transition. The Company elected the “package of practical expedients,” which permits the Company to not reassess under the new standard the Company’s prior conclusions about lease identification, lease classification, and initial direct costs. The Company did not elect the use-of-hindsight or the practical expedient pertaining to land easements, the latter not being applicable to the Company.
The new standard also provides practical expedients for an entity’s ongoing accounting. The Company elected the short-term lease recognition exemption for all leases that qualify. This means, for those leases that qualify, the Company will not recognize right-of-use assets or lease liabilities, and this includes not recognizing right-of-use assets or lease liabilities for existing short-term leases of those assets in transition. The Company also elected the practical expedient not to separate lease and non-lease components for all of the Company’s leases.
The Company completed its analysis of the impacts of the new lease standard, and has designed the necessary changes to its existing processes and configured all system requirements that are required to implement this new standard. The Company has a variety of categories of lease arrangements, including real estate, automobiles, manufacturing equipment, facility equipment, office equipment and certain service arrangements. The Company has reviewed its leasing arrangements in order to evaluate the impact of this standard on the Company’s financial statements, and expects to record a right-of-use asset in the range of $25-40 million and a lease liability in the range of $25-40 million related to the recognition, on a discounted basis, of the Company’s minimum commitments under non-cancelable operating leases on its consolidated balance sheets in the first quarter of 2019. The Company currently does not expect ASC 842 to have a material effect on either its consolidated statement of operations or its consolidated statement of cash flow.
(3) Restructuring and Other Charges, Net
The Company’s Board of Directors approves all major restructuring programs that may involve the discontinuance of significant product lines or the shutdown of significant facilities. From time to time, the Company takes additional restructuring actions, including involuntary terminations that are not part of a major program. The Company accounts for these costs in the period that the liability is incurred. These costs are included in restructuring charges in the Company’s consolidated statements of operations.
A summary of the pre‑taxpre-tax cost by restructuring program is as follows:
| | | | | | | | | | |
| | | Year Ended December 31, |
| | | 2021 | | 2020 | | 2019 |
| | | | | | | | | | |
| | Year Ended December 31, | |
| | 2018 | | 2017 | | 2016 | |
| | (in millions) | |
| | | (in millions) |
Restructuring costs: | | | | | | | | | | | | | | | | | | |
2015 Actions | | $ | — | | $ | 2.4 | | $ | 2.1 | |
2021 France Actions | | | $ | 19.7 | | $ | — | | $ | — |
Other Actions | | | 3.4 | | | 4.4 | | | 2.6 | | | (0.4) | | | 9.9 | | | 4.3 |
Total restructuring charges | | $ | 3.4 | | $ | 6.8 | | $ | 4.7 | | $ | 19.3 | | $ | 9.9 | | $ | 4.3 |
The Company recorded pre‑taxpre-tax restructuring in its business segments as follows:
| | | | | | | | | | |
| | | Year Ended December 31, |
| | | 2021 | | 2020 | | 2019 |
| | | | | | | | | | |
| | Year Ended December 31, | |
| | 2018 | | 2017 | | 2016 | |
| | (in millions) | |
| | | (in millions) |
Americas | | $ | — | | $ | 3.1 | | $ | 1.6 | | $ | (0.3) | | $ | 6.1 | | $ | — |
Europe | | | 3.4 | | | 3.3 | | | 3.4 | | | 19.5 | | | 1.3 | | | 4.3 |
APMEA | | | — | | | 0.4 | | | 0.2 | | | 0.1 | | | 2.4 | | | — |
Corporate | | | — | | | — | | | (0.5) | | | — | | | 0.1 | | | — |
Total | | $ | 3.4 | | $ | 6.8 | | $ | 4.7 | | $ | 19.3 | | $ | 9.9 | | $ | 4.3 |
2021 France Actions
On June 25, 2021, the Board of Directors approved a restructuring program with respect to the Company’s operating facilities in France, within its Europe operating segment. The restructuring program includes the shutdown of the Company’s manufacturing facility in Méry, France and the consolidation of that facility’s operations primarily into the Company’s facilities in Virey-le-Grand and Hautvillers, France. The program is expected to include pre-tax charges totaling approximately $26.3 million, including costs for severance, relocation, clean-up and certain asset write-downs, and result in the elimination of approximately 80 positions at the Méry, France facility. As a result of the facility consolidations, the net headcount reduction in France is expected to be approximately 40 positions. Total net after-tax charges for this restructuring program are expected to be approximately $19.0 million (including approximately $2.0 million in non-cash charges), with costs being incurred through the second half of 2022, at which time the restructuring program is expected to be completed. The Company expects to spend approximately $0.7 million in capital expenditures to consolidate operations, of which $0.6 million was spent as of December 31, 2021. Annual cash savings, net of tax, are estimated to be approximately $3.0 million, which the Company expects to fully realize by 2023.
The following table summarizes by type, the total expected, incurred and remaining pre-tax restructuring costs for the Company’s restructuring program related to the 2021 France Actions:
| | | | | | | | | | | | | | | |
| | | | | | | | | | | Facility | | | |
| | | | | Legal and | | Asset | | exit | | | |
| | Severance | | consultancy | | write-downs | | and other | | Total |
|
| | (in millions) |
Costs incurred — 2021 | | $ | 16.9 | | $ | 0.9 | | $ | 0.9 | | $ | 1.0 | | $ | 19.7 |
Remaining costs to be incurred | | | 4.5 | | | — | | | 0.9 | | | 1.2 | | | 6.6 |
Total expected restructuring costs | | $ | 21.4 | | $ | 0.9 | | $ | 1.8 | | $ | 2.2 | | $ | 26.3 |
Details of the restructuring reserve activity for the Company’s 2021 France Actions for the year ended December 31, 2021 are as follows:
| | | | | | | | | | | | | | | |
| | | | | | | | | | Facility | | |
| | | | | Legal and | | Asset | | exit | | | |
| | Severance | | consultancy | | write-downs | | and other | | Total |
|
| | (in millions) |
Balance at December 31, 2020 | | $ | — | | $ | — | | $ | — | | $ | — | | $ | — |
Net pre-tax restructuring charges | | | 16.9 | | | 0.9 | | | 0.9 | | | 1.0 | | | 19.7 |
Utilization and foreign currency impact | | | (7.0) | | | (0.7) | | | (0.9) | | | (0.5) | | | (9.1) |
Balance at December 31, 2021 | | $ | 9.9 | | $ | 0.2 | | $ | — | | $ | 0.5 | | $ | 10.6 |
Other Actions
The Company periodically initiates other actions which are not part of a major program. Total “Other Actions” pre-tax restructuring charges was a credit of $0.4 million and expense was $3.4of $9.9 million and $4.3 million for the years ended December 31, 2021, 2020 and 2019, respectively.
Included in “Other Actions” for the year ended December 31, 2018. Included2020, were actions taken in “Other Actions” are European restructuring activities initiatedthe Americas, Europe and APMEA segments and Corporate primarily in 2018 and 2017, as well as certain other minor initiatives, for whichresponse to the Company incurred restructuring expenses or adjusted prior restructuring reserves inCOVID-19 pandemic. For the year ended December 31, 2018.
In the third quarter of 2018, management initiated restructuring actions primarily associated with the European headquarters as well as cost savings initiatives at certain European manufacturing facilities. These actions included reductions in force and other related costs within the Company’s Europe segment. The2021 total pre-tax charges for the year ended2020 “Other Actions” were reduced by approximately $0.8 million due to revised estimates for severance costs, health benefits and outplacement support. This resulted in total expected program restructuring charges of approximately $9.7 million, of which $9.5 million has been incurred through December 31, 2018 were approximately $4.0 million2021. The remaining expected costs relate to facility exit and primarily included severance benefits. The total restructuring charges associated with the programother exit costs and are estimated to be approximately $5.0 million with costs expected to be fully incurred withincompleted in the year ending December 31, 2019.first half of 2022. The restructuring reserve associated with these actions is approximately $2.2 million as of December 31, 2018,2021 was approximately $0.9 million and primarily relatesrelated to severance benefits.
In the fourth quarter of 2017, management initiated certain restructuring actions related to reductionsAlso included in force within the Company’s Europe segment. The restructuring activities primarily included severance benefits. The total pre-tax charges associated with the Europe restructuring activities were initially expected to be approximately $4.1 million with costs being fully incurred in 2017. The company reduced its total pre-tax charges for the program to approximately $3.4 million as of September 30, 2018, primarily related to reduced severance costs. The restructuring reserve associated with these actions is approximately $0.2 million as of December 31, 2018, and relates to severance benefits.
In the fourth quarter of 2015, management initiated certain restructuring actions and strategic initiatives with respect to the Company’s Europe segment in response to the ongoing economic challenges in Europe and additional product rationalization. The restructuring actions included severance benefits and limited costs relating to asset write-offs, professional fees and relocation. The total pre-tax charge for the Europe 2015 restructuring initiatives was $7.7 million.
The following table summarizes total expected, incurred and remaining pre-tax restructuring costs for the Europe 2015 restructuring actions:
| | | | | | | | | | | | |
| | | | | | | | Facility | | | |
| | | | | Legal and | | Exit | | | |
| | Severance | | consultancy | | and other | | Total |
| | (in millions) |
Costs incurred—2015 | | $ | 6.6 | | $ | — | | $ | 0.3 | | $ | 6.9 |
Costs incurred—2016 | | | 1.3 | | | 0.5 | | | — | | | 1.8 |
Adjustments to restructuring costs—2017 | | | (1.0) | | | — | | | — | | | (1.0) |
Total restructuring costs | | $ | 6.9 | | $ | 0.5 | | $ | 0.3 | | $ | 7.7 |
Details of the Company’s Europe 2015 restructuring reserve activity“Other Actions” for the year ended December 31, 2018 are as follows:
| | | | | | | | | | | | |
| | | | | Legal and | | Facility exit | | | |
| | Severance | | Consultancy | | and other | | Total |
| | (in millions) |
Balance at December 31, 2015 | | $ | 6.4 | | $ | — | | $ | — | | $ | 6.4 |
Net pre-tax restructuring charges | | | 1.3 | | | 0.5 | | | — | | | 1.8 |
Utilization and foreign currency impact | | | (2.9) | | | (0.5) | | | — | | | (3.4) |
Balance at December 31, 2016 | | $ | 4.8 | | $ | — | | $ | — | | $ | 4.8 |
Net pre-tax restructuring charges | | | (1.0) | | | — | | | — | | | (1.0) |
Utilization and foreign currency impact | | | (2.8) | | | — | | | — | | | (2.8) |
Balance at December 31, 2017 | | $ | 1.0 | | $ | — | | $ | — | | $ | 1.0 |
Net pre-tax restructuring adjustments | | | — | | | — | | | — | | | — |
Utilization and foreign currency impact | | | (0.9) | | | — | | | — | | | (0.9) |
Balance at December 31, 2018 | | $ | 0.1 | | $ | — | | $ | — | | $ | 0.1 |
2015 Actions2021 were $0.4 million of charges related to an asset retirement obligation at one of our facilities. An additional $1.6 million of facility exit charges related to the decommissioning of machinery at this facility is expected to be incurred in the Americas and APMEAfirst half of 2022.
In 2015, the Board of Directors of the Company approved a transformation program relating to the Company’s Americas and APMEA businesses, which primarily involved the exit of low-margin, non-core product lines, and enhancing global sourcing capabilities (“phase one”). The Company eliminated approximately $165 million of the combined Americas and APMEA net sales primarily within the Company’s do-it-yourself (DIY) distribution channel. As part of the exit of non-core product lines, the Company entered into an agreement to sell an operating subsidiaryIncluded in China that was dedicated exclusively to the manufacturing of products being discontinued. The sale was finalized in the second quarter of 2016, and the Company recognized a pre-tax gain of $8.7 million and received proceeds from the sale of $8.4 million.
The second phase of the program involved the consolidation of manufacturing facilities and distribution center network optimization, including reducing the square footage of the Company’s Americas facilities, which together with phase one, reduced the Americas net operating footprint by approximately 30%. This phase of the program was designed to improve the utilization of the Company’s remaining facilities, better leverage its cost structure, reduce working capital, and improve execution of customer delivery requirements. As of December 31, 2017, the second phase was complete.
On a combined basis, the total pre-tax cost for the Company’s transformation program related to its Americas and APMEA businesses was $59.8 million, including restructuring costs of $18.1 million, goodwill and intangible asset impairments of $13.5 million and other transformation and deployment costs of approximately $28.2 million. The other transformation and deployment costs included consulting and project management fees, inventory write-offs, and other associated costs. All costs associated with the Americas and APMEA transformation program were incurred as of December 31, 2017.
The following table summarizes by type, the total incurred pre-tax restructuring costs for the Company’s transformation program related to its Americas and APMEA businesses (phase one and phase two combined):
| | | | | | | | | | | | | | | |
| | | | | | | | | | | Facility | | | |
| | | | | Legal and | | Asset | | exit | | | |
| | Severance | | consultancy | | write-downs | | and other | | Total |
| | (in millions) |
Costs incurred—2015 | | $ | 8.5 | | $ | 0.7 | | $ | 1.6 | | $ | 2.8 | | $ | 13.6 |
Costs incurred—2016 | | | (1.5) | | | 0.2 | | | 2.9 | | | 0.5 | | | 2.1 |
Costs incurred—2017 | | | — | | | — | | | 2.2 | | | 0.2 | | | 2.4 |
Total restructuring costs | | $ | 7.0 | | $ | 0.9 | | $ | 6.7 | | $ | 3.5 | | $ | 18.1 |
Details of the restructuring reserve activity for the Company’s Americas and APMEA 2015 transformation program“Other Actions” for the year ended December 31,2019 were European restructuring activities that were initiated in 2018 are as follows:and extended through 2019.
| | | | | | | | | | | | | | | |
| | | | | | | | | | Facility | | |
| | | | | Legal and | | Asset | | exit | | | |
| | Severance | | consultancy | | write-downs | | and other | | Total |
| | (in millions) |
Balance at December 31, 2015 | | $ | 5.0 | | $ | 0.4 | | $ | — | | $ | 1.0 | | $ | 6.4 |
Net pre-tax restructuring charges | | | (1.5) | | | 0.2 | | | 2.9 | | | 0.5 | | | 2.1 |
Utilization and foreign currency impact | | | (2.3) | | | (0.6) | | | (2.9) | | | (1.5) | | | (7.3) |
Balance at December 31, 2016 | | $ | 1.2 | | $ | — | | $ | — | | $ | — | | $ | 1.2 |
Net pre-tax restructuring charges | | | — | | | — | | | 2.2 | | | 0.2 | | | 2.4 |
Utilization and foreign currency impact | | | (1.0) | | | — | | | (2.2) | | | (0.2) | | | (3.4) |
Balance at December 31, 2017 | | $ | 0.2 | | $ | — | | $ | — | | $ | — | | $ | 0.2 |
Net pre-tax restructuring charges | | | — | | | — | | | — | | | — | | | — |
Utilization and foreign currency impact | | | (0.2) | | | — | | | — | | | — | | | (0.2) |
Balance at December 31, 2018 | | $ | — | | $ | — | | $ | — | | $ | — | | $ | — |
(4) Revenue Recognition
The Company is a leading supplier of products that manage and conserve the flow of fluids and energy into, through and out of buildings in the commercial and residential markets. TheFor over 140 years, the Company has designed and produced valve systems that safeguard and regulate water systems, energy efficient heating and hydronic systems, drainage systems and water filtration technology that helps purify and conserve water.
The Company distributes products through four4 primary distribution channels: wholesale, original equipment manufacturers (OEMs), specialty, and do-it-yourself (DIY). The Company operates in three3 geographic segments: Americas, Europe, and APMEA. Each of these segments sells similar products, which are comprised of the following principal product lines:
| ·
● | | Residential & commercial flow control products—includes products typically sold into plumbing and hot water applications such as backflow preventers, water pressure regulators, temperature and pressure relief valves, and thermostatic mixing valves. valves and leak detection products. |
| ·
● | | HVAC & gas products—includes commercial high-efficiencyhigh-efficiency boilers, water heaters and heatingcustom heat and hot water solutions, hydronic and electric heating systems for under‑floorunder-floor radiant applications, custom heat and hot water solutions, hydronic pump groups for boiler manufacturers and alternative energy control packages, and flexible stainless steel connectors for natural and liquid propane gas in commercial food service and residential applications. HVAC is an acronym for heating, ventilation and air conditioning. |
| ·
● | | Drainage & water re‑usere-use products—includes drainage products and engineered rain water harvesting solutions for commercial, industrial, marine and residential applications. |
| ·
● | | Water quality products—includes point‑of‑usepoint-of-use and point‑of‑entrypoint-of-entry water filtration, conditioning and scale prevention systems for both commercial, marine and residential applications. |
The following table disaggregates revenue, which is presented as net sales in the financial statements, for each reportable segment, by distribution channel and principal product line:
| | | | | | | | | | | | | |
| | Year ended December 31, 2018 | |
| | | | (in millions) | | | |
| | | | | | | | | | | | | |
| | | Year ended December 31, 2021 |
| | | | | (in millions) | | |
Distribution Channel | | Americas | | Europe | | APMEA | | Consolidated | | Americas | | Europe | | APMEA | | Consolidated |
Wholesale | | $ | 578.8 | | $ | 314.2 | | $ | 59.9 | | $ | 952.9 | | $ | 694.4 | | $ | 332.9 | | $ | 78.8 | | $ | 1,106.1 |
OEM | | | 79.0 | | | 150.0 | | | 1.4 | | | 230.4 | | | 96.5 | | | 181.5 | | | 5.5 | | | 283.5 |
Specialty | | | 312.1 | | | — | | | 4.5 | | | 316.6 | | | 337.7 | | | — | | | 0.3 | | | 338.0 |
DIY | | | 62.2 | | | 2.8 | | | — | | | 65.0 | | | 78.6 | | | 3.0 | | | — | | | 81.6 |
Total | | $ | 1,032.1 | | $ | 467.0 | | $ | 65.8 | | $ | 1,564.9 | | $ | 1,207.2 | | $ | 517.4 | | $ | 84.6 | | $ | 1,809.2 |
| | | | | | | | | | | | | |
| | Year ended December 31, 2018 | |
| | | | (in millions) | | | |
| | | | | | | | | | | | | |
| | | Year ended December 31, 2021 |
| | | | | (in millions) | | |
Principal Product Line | | Americas | | Europe | | APMEA | | Consolidated | | Americas | | Europe | | APMEA | | Consolidated |
Residential & Commercial Flow Control | | $ | 582.0 | | $ | 176.2 | | $ | 46.2 | | $ | 804.4 | | $ | 697.4 | | $ | 188.0 | | $ | 67.6 | | $ | 953.0 |
HVAC and Gas Products | | | 289.2 | | | 201.6 | | | 16.2 | | | 507.0 | | | 308.6 | | | 237.0 | | | 12.9 | | | 558.5 |
Drainage and Water Re-use Products | | | 73.1 | | | 87.8 | | | 2.2 | | | 163.1 | | | 92.8 | | | 87.8 | | | 2.8 | | | 183.4 |
Water Quality Products | | | 87.8 | | | 1.4 | | | 1.2 | | | 90.4 | | | 108.4 | | | 4.6 | | | 1.3 | | | 114.3 |
Total | | $ | 1,032.1 | | $ | 467.0 | | $ | 65.8 | | $ | 1,564.9 | | $ | 1,207.2 | | $ | 517.4 | | $ | 84.6 | | $ | 1,809.2 |
| | | | | | | | | | | | |
| | Year ended December 31, 2020 |
| | | | (in millions) | | |
Distribution Channel | | Americas | | Europe | | APMEA | | Consolidated |
Wholesale | | $ | 580.3 | | $ | 279.0 | | $ | 52.8 | | $ | 912.1 |
OEM | | | 75.9 | | | 143.3 | | | 3.1 | | | 222.3 |
Specialty | | | 288.5 | | | — | | | 2.1 | | | 290.6 |
DIY | | | 81.0 | | | 2.6 | | | — | | | 83.6 |
Total | | $ | 1,025.7 | | $ | 424.9 | | $ | 58.0 | | $ | 1,508.6 |
| | | | | | | | | | | | |
| | Year ended December 31, 2020 |
| | | | (in millions) | | |
Principal Product Line | | Americas | | Europe | | APMEA | | Consolidated |
Residential & Commercial Flow Control | | $ | 584.6 | | $ | 157.8 | | $ | 44.1 | | $ | 786.5 |
HVAC and Gas Products | | | 263.9 | | | 184.0 | | | 11.7 | | | 459.6 |
Drainage and Water Re-use Products | | | 75.8 | | | 79.4 | | | 1.1 | | | 156.3 |
Water Quality Products | | | 101.4 | | | 3.7 | | | 1.1 | | | 106.2 |
Total | | $ | 1,025.7 | | $ | 424.9 | | $ | 58.0 | | $ | 1,508.6 |
The Company generally considers customer purchase orders, which in some cases are governed by master sales agreements, to represent the contract with a customer. The Company’s contracts with customers are generally for products only and typically do not include other performance obligations such as professional services, extended warranties, or other material rights. In situations where sales are to a distributor, the Company has concluded that its contracts are with the distributor as the Company holds a contract bearing enforceable rights and obligations only with the distributor. As part of its consideration of the contract, the Company evaluates certain factors including the customer’s ability to pay (or credit risk). For each contract, the Company considers the promise to transfer products, each of which is distinct, to be the identified performance obligation. In determining the transaction price, the Company evaluates whether the price is subject to refund or adjustment to determine the net consideration to which the Company expects to be entitled. As the Company’s standard payment terms are less than one year, the Company has elected the practical expedient under ASC 606-10-32-18 not to assess whether a contract has a significant financing component. The Company allocates the transaction price to each distinct product based on its relative standalone selling price. The product price as specified on the purchase order is considered the standalone selling price as it is an observable input which depicts the price as if sold to a similar customer in similar circumstances. Revenue is recognized when control of the product is transferred to the customer (i.e., when the Company’s performance obligation is satisfied), which typically occurs at shipment from the Company’s manufacturing
site or distribution center, or delivery to the customer’s named location. In certain circumstances, revenue from shipments to retail customers is recognized only when the product is consumed by the customer, as based on the terms of the arrangement, transfer of control is not satisfied until that point in time. In determining whether control has transferred, the Company considers if there is a present right to payment, physical possession and legal title, along with risks and rewards of ownership having transferred to the customer. In certain circumstances, the Company manufactures customized productproducts without alternative use for its customers. However, as these arrangements do not entitle the Company to a right to payment of cost plus a profit for work completed, the Company has concluded that control transfers at the point in time and not over time.
Occasionally,At times, the Company receives orders for products to be delivered over multiple dates that may extend across reporting periods. The Company invoices for each delivery upon shipment and recognizes revenues for each distinct product delivered, assuming transfer of control has occurred. As scheduled delivery dates are within one year, under the optional exemption provided by ASC 606-10-50-14,the guidance, revenues allocated to future shipments of partially completed contracts are not disclosed.
The Company generally provides an assurance warranty that its products will substantially conform to the published specification. The Company’s liability is limited to either a credit equal to the purchase price or replacement of the defective part. Returns under warranty have historically been immaterial. The Company does not consider activities related to such warranty, if any, to be a separate performance obligation. For certain of its products, the Company will separately sell extended warranty and service policies to its customers. The Company considers the sale of the extended warranty athese as separate performance obligation.obligations. These policies typically are for periods ranging from one to three years.
Payments received are deferred and recognized over the policy period. For all periods presented, the revenue recognized and the revenue deferred under these policies is not material to the consolidated financial statements.
The timing of revenue recognition, billings and cash collections from the Company’s contracts with customers can vary based on the payment terms and conditions in the customer contracts. In somelimited cases, customers will partially prepay for their goods; in other cases, after appropriate credit evaluations, payment is due in arrears.goods. In addition, there are constraints which cause variability in the ultimate consideration to be recognized. These constraints typically include early payment discounts, volume rebates, rights of return, cooperative advertising, and market development funds. The Company includes these constraints in the estimated transaction price when there is a basis to reasonably estimate the amount of variable consideration. These estimates are based on historical experience, anticipated future performance and the Company’s best judgment at the time. The Company did not recognize any material revenue from obligations satisfied in prior periods. When the timing of the Company’s recognition of revenue is different from the timing of payments made by the customer, the Company recognizes either a contract asset (performance precedes contractual due date) or a contract liability (customer payment precedes performance). Contracts with payment in arrears areFor all periods presented, the recognized as receivables. The opening and closing balances of the Company’s contract assets and contract liabilities are as follows:
| | | | | | | | | |
| | Contract | | Contract | | Contract |
| | Assets | | Liabilities - Current | | Liabilities - Noncurrent |
| | | | | (in millions) | | | |
Balance - January 1, 2018 | | $ | 0.6 | | $ | 11.3 | | $ | 2.1 |
Change in period | | | 1.1 | | | 0.2 | | | 0.3 |
Balance - April 1, 2018 | | $ | 1.7 | | $ | 11.5 | | $ | 2.4 |
Change in period | | | (0.3) | | | 0.1 | | | 0.3 |
Balance - July 1, 2018 | | $ | 1.4 | | $ | 11.6 | | $ | 2.7 |
Change in period | | | 0.4 | | | (0.4) | | | — |
Balance - September 30, 2018 | | $ | 1.8 | | $ | 11.2 | | $ | 2.7 |
Change in period | | | (0.8) | | | 0.1 | | | — |
Balance - December 31, 2018 | | $ | 1.0 | | $ | 11.3 | | $ | 2.7 |
The amount ofand the associated revenue recognized during the year ended December 31, 2018 that was included in the opening contract liability balance was $11.3 million. This revenue consists primarily of revenue recognized for shipments of product which had been prepaid as well as the amortization of extended warranty and service policy revenue. The Company did not recognize any material revenue from obligations satisfied in prior periods. The change in Contract Liabilities isdeferred are not material forto the year ended December 31, 2018. There were no impairment losses related to Contract Assets for the year ended December 31, 2018.consolidated financial statements.
The Company incurs costs to obtain and fulfill a contract; however, the Company has elected the practical expedient under ASC 340-40-24-4 to recognize all incremental costs to obtain a contract as an expense when incurred if the amortization period is one year or less. The Company has elected to treat shipping and handling activities performed after the customer has obtained control of the related goods as a fulfillment cost and the related cost is accrued for in conjunction with the recording of revenue for the goods.
(5) SaleLeases
The Company adopted ASC 842 effective January 1, 2019. The Company has a variety of Business
Gaincategories of lease arrangements, including real estate, automobiles, manufacturing equipment, facility equipment, office equipment and certain service arrangements that are dependent on Salean identified asset. The Company’s real estate leases, which consist primarily of China Operating Subsidiary
On September 22, 2015,manufacturing facilities, office space and warehouses, represent approximately 93% of the Company signed an agreement to sell anCompany’s operating subsidiary in China that was dedicated to the productionlease liabilities and generally have a leaseterm between 2 and 15 years. The remaining leases primarily consist of non-core products. The sale was finalizedautomobiles, machinery and equipment used in the second quartermanufacturing processes (e.g., forklifts and pallets), general office equipment and certain service arrangements, each with various lease terms. The Company’s automobile leases typically have terms ranging from 3 to 5 years. The Company’s remaining population of 2016, and the Company received proceeds of $8.4 millionleases have terms ranging from the sale as2 to 15 years. Certain lease arrangements may contain renewal terms rangingfrom 1 to 5 years. The majority of the fourth quarterCompany’s real estate, automobile, and equipment leases consist of 2016.fixed and variable lease payments. For the Company’s real estate leases, variable payments include those for common area maintenance, property taxes, and insurance. For automobile leases, variable payments primarily include maintenance, taxes, and insurance. For equipment leases, variable payments include maintenance and payments based on usage. The Company recognizedhas elected to account for lease and non-lease components as a pre-tax gain of $8.7 million, which includessingle component for all leases. Therefore, all fixed costs within a non-cash accumulated currency translation adjustment of $7.3 million. The net after-tax gain was approximately $8.3 million.
lease arrangement are included in the
fixed lease payments for the single, combined lease component and used to measure the lease liability. Variable lease costs are recognized in the period when the event, activity, or circumstance in the lease agreement occurs.
(6) Business Acquisitions
PVI Industries, LLC
On November 2, 2016, the Company acquired 100%Some of the sharesCompany’s lease agreements include Company options to either extend and/or early terminate the lease, the costs of PVI Riverside Holdings, Inc., the parent company of PVI Industries, LLC (“PVI”). The aggregate purchase price, including the final working capital adjustment, was approximately $79.1 million.
PVI is a leading manufacturer of commercial stainless steel water heating equipment, focused on the high capacity market in North America and is based in Fort Worth, Texas. PVI’s water heater product offering complements AERCO’s boiler products, allowing the Company to address customers’ heating and hot water requirements. The results for PVIwhich are included in the Company’s Americas segment.lease liability to the extent that such options are reasonably certain of being exercised. Renewal options are generally not included in the lease term for the Company’s existing leases because the Company is not reasonably certain to exercise these renewal options. The Company does not generally enter into leases involving the construction or design of the underlying asset, and nearly all of the assets the Company leases are not specialized in nature. The Company’s leases generally do not include termination options for either party to the lease or restrictive financial or other covenants. The Company’s lease agreements generally do not include residual value guarantees.
Right-of-use asset amounts reported in the consolidated balance sheet by asset category as of December 31, 2021 and 2020 were as follows:
| | | | | | |
| | December 31, 2021 | | December 31, 2020 |
| | (in millions) | | (in millions) |
Operating Leases (1) | | | | | | |
Real Estate | | $ | 43.4 | | $ | 48.1 |
Automobile | | | 2.2 | | | 3.2 |
Machinery and equipment | | | 1.3 | | | 1.3 |
Total operating lease ROU Asset | | $ | 46.9 | | $ | 52.6 |
| | | | | | |
Finance Leases (2) | | | | | | |
Real Estate | | $ | — | | $ | 15.8 |
Automobile | | | 0.1 | | | 0.1 |
Machinery and equipment | | | 7.3 | | | 7.8 |
Less: Accumulated depreciation | | | (4.2) | | | (10.8) |
Finance Leases, net | | $ | 3.2 | | $ | 12.9 |
(1) | Included on the Company’s consolidated balance sheet in other assets (other, net). |
(2) | Included on the Company’s consolidated balance sheet in property, plant and equipment. |
The Company accountedmaturity of the Company’s operating and finance lease liabilities as of December 31, 2021 was as follows:
| | | | | | |
| | December 31, 2021 |
| | Operating Leases | | Finance Leases |
|
| | (in millions) |
2022 | | $ | 10.4 | | $ | 1.4 |
2023 | | | 8.9 | | | 1.0 |
2024 | | | 6.8 | | | 0.8 |
2025 | | | 6.1 | | | 0.4 |
2026 | | | 4.4 | | | — |
Thereafter | | | 23.4 | | | — |
Total undiscounted minimum lease payments | | $ | 60.0 | | $ | 3.6 |
Less imputed interest | | | 9.2 | | | 0.2 |
Total lease liabilities | | $ | 50.8 | | $ | 3.4 |
Included in the consolidated balance sheet | | | | | | |
Current lease liabilities (included in other current liabilities) | | | 8.8 | | | 1.5 |
Non-Current lease liabilities (included in other non-current liabilities) | | | 42.0 | | | 1.9 |
Total lease liabilities | | $ | 50.8 | | $ | 3.4 |
The total lease cost consisted of the following amounts:
| | | | | |
| | Year Ended | | | Year Ended |
| | December 31, 2021 | | | December 31, 2020 |
| | (in millions) | | | (in millions) |
Operating lease cost | $ | 11.7 | | $ | 12.1 |
Amortization of finance lease right-of-use assets | | 1.5 | | | 1.5 |
Interest on finance lease liabilities | | 0.1 | | | 0.2 |
Short-term lease cost | | 0.1 | | | 0.1 |
Sublease (income) | | (0.2) | | | (0.2) |
Variable lease cost | | 2.8 | | | 2.6 |
Total lease cost | $ | 16.0 | | $ | 16.3 |
The following information represents supplemental disclosure for the transaction as a purchased business combinationstatement of cash flows related to operating and the acquisition was funded partially with available cashfinance leases:
| | | | | | |
| | December 31, 2021 | | December 31, 2020 |
| | (in millions) | | (in millions) |
Operating cash flows from operating leases | | $ | 11.3 | | $ | 11.8 |
Operating cash flows from finance leases | | | 0.1 | | | 0.2 |
Financing cash flows from finance leases | | | 1.4 | | | 2.1 |
Total cash paid for amounts included in the measurement of lease liabilities | | | 12.8 | | | 14.1 |
Finance lease liabilities arising from obtaining right-of-use assets | | | 0.4 | | | 2.1 |
Operating lease liabilities arising from obtaining right-of-use assets | | | 4.9 | | | 24.7 |
The following summarizes additional information related to operating and partially from borrowings under the Company’s Credit Agreement. During the second quarter of 2017, the Company finalized the purchase price allocation for the PVI purchase. The acquisition resulted in the recognition of $41.1 million in goodwill and $31.0 million in intangible assets. The intangible assets acquired consist of customer relationships valued at $17.6 million with estimated lives of 15 years, developed technology valued at $10.2 million with estimated lives of 10 years, and the trade name valued at $3.2 million with an estimated life of 20 years. The goodwill is attributable to the workforce of PVI and the strategic platform adjacency that will allow Watts to extend its product offerings as a result of the acquisition. Approximately $6.9 million of the goodwill is deductible for tax purposes. finance leases:
| | | | | | | | |
| | December 31, 2021 | | December 31, 2020 |
Weighted-average remaining lease term - finance leases | | | 3.0 | years | | | 3.4 | years |
Weighted-average remaining lease term - operating leases | | | 8.5 | years | | | 9.0 | years |
Weighted-average discount rate - finance leases | | | 3.2 | % | | | 3.5 | % |
Weighted-average discount rate - operating leases | | | 3.5 | % | | | 3.6 | % |
(7)(6) Goodwill & Intangibles
Goodwill
The Company performs its annual goodwill impairment testing for each reporting unit as of fiscal October month endmonth-end or earlier if there is a triggering event or circumstance that indicates an impairment loss may have occurred. As of the October 28, 201824, 2021 testing date, the Company had $544.3$605.8 million of goodwill on its balance sheet. In 2018,2021, the Company had eight7 reporting units. OneNaN of these reporting units, Water Quality, had no0 goodwill. The Company performed a qualitative analysis for each of the seven6 remaining reporting units, which include Blücher, Dormont, US Drains, Europe, Residential and Commercial,Fluid Solutions-Europe, Fluid Solutions-Americas, Heating and Hot Water Solutions (“HHWS”) and APMEA. As a result of the qualitative analyses, the Company determined that the fair values of the reporting units were more likely than not greater than the carrying amounts. In 2018,2021 and 2020, the Company did not need to proceed beyond the qualitative analysis, and no0 goodwill impairments were recorded.
In the fourth quarter of 2017,2021, the Company performed a quantitative impairment analysis forcompleted an acquisition within the HHWS reporting unitAmericas segment resulting in connection with the annual strategic plan and due$8.4 million of goodwill. The acquisition is not considered material to underperformance to budget, primarily caused by continuing softness in the condensing boiler market, weakness in the Company’s tankless water heater products and competitive pricing pressure. The Company estimated the fair value of the reporting unit using a weighted calculation of the income approach and the market approach. The income approach calculated the present value of expected future cash flows. The guideline public company method (market approach) calculated the estimated fair values based on valuation multiples derived from stock prices and enterprise values of publicly traded companies that are comparable to the reporting unit. The estimated fair value of the reporting unit exceeded the carrying value in 2017 and therefore, no impairment was recorded.
consolidated financial statements. The changes in the carrying amount of goodwill by geographic segment arewere as follows:
| | | | | | | | | | | | | | | | | | | | | | | | | |
| | | December 31, 2021 |
| | | Gross Balance | | Accumulated Impairment Losses | | Net Goodwill |
| | | | | Acquired | | Foreign | | | | | | | | | | | |
| | | Balance | | During | | Currency | | Balance | | Balance | | Impairment | | Balance | | |
| | | January 1, | | the | | Translation | | December 31, | | January 1, | | Loss During | | December 31, | | December 31, |
| | | 2021 | | Period | | and Other | | 2021 | | 2021 | | the Period | | 2021 | | 2021 |
| | | | | | | | | | | | | | | | | | | | | | | | | |
| | December 31, 2018 | |
| | Gross Balance | | Accumulated Impairment Losses | | Net Goodwill | |
| | | | Acquired | | Foreign | | | | | | | | | | | | |
| | Balance | | During | | Currency | | Balance | | Balance | | Impairment | | Balance | | | |
| | January 1, | | the | | Translation | | December 31, | | January 1, | | Loss During | | December 31, | | December 31, | |
| | 2018 | | Period (1) | | and Other | | 2018 | | 2018 | | the Period | | 2018 | | 2018 | |
| | (in millions) | |
| | | (in millions) |
Americas | | $ | 437.4 | | | 1.5 | | | (0.8) | | | 438.1 | | $ | (24.5) | | | — | | | (24.5) | | | 413.6 | | $ | 482.5 | | | 8.4 | | $ | — | | $ | 490.9 | | $ | (24.5) | | | — | | $ | (24.5) | | $ | 466.4 |
Europe | | | 249.3 | | | — | | | (5.6) | | | 243.7 | | | (129.7) | | | — | | | (129.7) | | | 114.0 | | | 252.1 | | | — | | | (9.2) | | | 242.9 | | | (129.7) | | | — | | | (129.7) | | | 113.2 |
APMEA | | | 30.9 | | | — | | | (0.8) | | | 30.1 | | | (12.9) | | | — | | | (12.9) | | | 17.2 | | | 34.9 | | | — | | | (0.9) | | | 34.0 | | | (12.9) | | | — | | | (12.9) | | | 21.1 |
Total | | $ | 717.6 | | | 1.5 | | | (7.2) | | | 711.9 | | $ | (167.1) | | | — | | | (167.1) | | | 544.8 | | $ | 769.5 | | | 8.4 | | $ | (10.1) | | $ | 767.8 | | $ | (167.1) | | | — | | $ | (167.1) | | $ | 600.7 |
| (1)
| | Americas goodwill additions during 2018 relate to immaterial acquisitions.
|
| | | | | | | | | | | | | | | | | | | | | | | | |
| | December 31, 2020 |
| | Gross Balance | | Accumulated Impairment Losses | | Net Goodwill |
| | | | Acquired | | Foreign | | | | | | | | | | |
| | Balance | | During | | Currency | | Balance | | Balance | | Impairment | | Balance | | |
| | January 1, | | the | | Translation | | December 31, | | January 1, | | Loss During | | December 31, | | December 31, |
| | 2020 | | Period | | and Other | | 2020 | | 2020 | | the Period | | 2020 | | 2020 |
|
| | (in millions) |
Americas | | $ | 476.8 | | $ | 5.5 | | $ | 0.2 | | $ | 482.5 | | $ | (24.5) | | $ | — | | $ | (24.5) | | $ | 458.0 |
Europe | | | 241.4 | | | — | | | 10.7 | | | 252.1 | | | (129.7) | | | — | | | (129.7) | | | 122.4 |
APMEA | | | 30.0 | | | 3.9 | | | 1.0 | | | 34.9 | | | (12.9) | | | — | | | (12.9) | | | 22.0 |
Total | | $ | 748.2 | | $ | 9.4 | | $ | 11.9 | | $ | 769.5 | | $ | (167.1) | | $ | — | | $ | (167.1) | | $ | 602.4 |
| | | | | | | | | | | | | | | | | | | | | | | | |
| | December 31, 2017 |
| | Gross Balance | | Accumulated Impairment Losses | | Net Goodwill |
| | | | Acquired | | Foreign | | | | | | | | | | |
| | Balance | | During | | Currency | | Balance | | Balance | | Impairment | | Balance | | |
| | January 1, | | the | | Translation | | December 31, | | January 1, | | Loss During | | December 31, | | December 31, |
| | 2017 | | Period | | and Other | | 2017 | | 2017 | | the Period | | 2017 | | 2017 |
| | (in millions) |
Americas | | $ | 434.7 | | | 2.0 | | | 0.7 | | | 437.4 | | $ | (24.5) | | | — | | | (24.5) | | | 412.9 |
Europe | | | 234.9 | | | — | | | 14.4 | | | 249.3 | | | (129.7) | | | — | | | (129.7) | | | 119.6 |
APMEA | | | 30.2 | | | — | | | 0.7 | | | 30.9 | | | (12.9) | | | — | | | (12.9) | | | 18.0 |
Total | | $ | 699.8 | | | 2.0 | | | 15.8 | | | 717.6 | | $ | (167.1) | | | — | | | (167.1) | | | 550.5 |
Long-Lived Assets
Indefinite‑livedIndefinite-lived intangibles are tested for impairment at least annually or more frequently if events or circumstances, such as a change in business conditions, indicate that it is “more likely than not” that an intangible asset might be impaired. The Company performs its annual indefinite‑livedindefinite-lived intangibles impairment assessment in the fourth quarter of each year. For the 2018, 2017 and 2016 impairment assessments,In 2021, the Company performed quantitative assessmentsa qualitative assessment for all indefinite‑lived intangible assets.tradenames, and in 2020 and 2019 performed a qualitative assessment for certain tradenames where the fair value significantly exceeded the carrying value in the most recent quantitative assessment, and no other indicators of impairment were present. For the remaining tradenames in 2020 and 2019, the Company performed a quantitative assessment. The methodology employed for quantitative assessments was the relief from royalty method, a subset of the income approach. Based on the results of the assessment,assessments, the Company did not recognize an impairment on any indefinite-lived intangibles in 20182021, 2020 or 2017. In 2016, Company recognized non‑cash pre‑tax impairment charges of approximately $0.4 million related to a trade name in the Europe segment.2019.
Intangible assets with estimable lives and other long‑livedlong-lived assets are reviewed for impairment wheneverat least quarterly or more frequently if events or changes in circumstances indicate that the carrying amount of an asset or asset group may not be recoverable. Recoverability of intangible assets with estimable lives and other long‑livedlong-lived assets is measured by a comparison of the carrying amount of an asset or asset group to future net undiscounted pre-tax cash flows expected to be generated by the asset or asset group. If these comparisons indicate that an asset is not recoverable, the impairment loss recognized is the amount by which the carrying amount of the asset or asset group exceeds the related estimated fair value. Estimated fair value is based on either discounted future pre-tax operating cash flows or appraised values, depending on the nature of the asset. The Company determines the discount rate for this analysis based on the weighted average cost of capital using the market and guideline public companies for the related businesses and does not allocate interest charges to the asset or asset group being measured. Judgment is required to estimate future operating cash flows. In the fourth quarter of 2017,2020, the Company recognized a $1.0 million impairment charge infor a long-lived asset and $0.4 million impairment charge for an amortizable technology asset, both within the Americas segment, for a technology asset as a changechanges in market expectations indicated the carrying amount of this asset wasthese assets were no longer recoverable. In 2016,2021 and 2019, there were no indications of the Company recognized a $0.1 million impairment charge on long-lived assets.carrying amounts of intangible assets with estimable lives not being recoverable.
Intangible assets include the following:
| | | | | | | | | | | | | | | | | | | |
| | | December 31, 2021 | | December 31, 2020 |
| | | Gross | | | | | Net | | Gross | | | | | Net |
| | | Carrying | | Accumulated | | Carrying | | Carrying | | Accumulated | | Carrying |
| | | Amount | | Amortization | | Amount | | Amount | | Amortization | | Amount |
| | | | | | | | | | | | | | | | | | | |
| | December 31, 2018 | | December 31, 2017 | |
| | Gross | | | | | Net | | Gross | | | | | Net | |
| | Carrying | | Accumulated | | Carrying | | Carrying | | Accumulated | | Carrying | |
| | Amount | | Amortization | | Amount | | Amount | | Amortization | | Amount | |
| | (in millions) | |
| | | (in millions) |
Patents | | $ | 16.1 | | $ | (15.8) | | $ | 0.3 | | $ | 16.1 | | $ | (15.4) | | $ | 0.7 | | $ | 16.1 | | $ | (16.1) | | $ | — | | $ | 16.1 | | $ | (16.0) | | $ | 0.1 |
Customer relationships | | | 232.9 | | | (146.9) | | | 86.0 | | | 233.2 | | | (133.5) | | | 99.7 | | | 237.5 | | | (173.1) | | | 64.4 | | | 236.2 | | | (165.8) | | | 70.4 |
Technology | | | 54.6 | | | (27.3) | | | 27.3 | | | 53.9 | | | (23.1) | | | 30.8 | | | 58.6 | | | (40.7) | | | 17.9 | | | 58.0 | | | (36.4) | | | 21.6 |
Trade names | | | 26.1 | | | (11.5) | | | 14.6 | | | 25.5 | | | (9.7) | | | 15.8 | | | 26.8 | | | (16.9) | | | 9.9 | | | 27.0 | | | (15.1) | | | 11.9 |
Other | | | 4.3 | | | (3.5) | | | 0.8 | | | 6.9 | | | (6.0) | | | 0.9 | | | 4.3 | | | (3.8) | | | 0.5 | | | 4.3 | | | (3.7) | | | 0.6 |
Total amortizable intangibles | | | 334.0 | | | (205.0) | | | 129.0 | | | 335.6 | | | (187.7) | | | 147.9 | | | 343.3 | | | (250.6) | | | 92.7 | | | 341.6 | | | (237.0) | | | 104.6 |
Indefinite-lived intangible assets | | | 36.2 | | | — | | | 36.2 | | | 37.3 | | | — | | | 37.3 | | | 35.9 | | | — | | | 35.9 | | | 37.2 | | | — | | | 37.2 |
| | $ | 370.2 | | $ | (205.0) | | $ | 165.2 | | $ | 372.9 | | $ | (187.7) | | $ | 185.2 | |
| | | $ | 379.2 | | $ | (250.6) | | $ | 128.6 | | $ | 378.8 | | $ | (237.0) | | $ | 141.8 |
Aggregate amortization expense for amortized intangible assets for 2018, 20172021, 2020 and 20162019 was $19.6$13.7 million, $22.5$15.2 million and $20.8$15.6 million, respectively. Additionally, future amortization expense on amortizable intangible assets is expected to be $17.2 million for 2019, $16.2 million for 2020, $14.6 million for 2021, $13.5$13.0 million for 2022, and $11.6$12.3 million for 2023.2023, $12.0 million for 2024, $10.5 million for 2025 and $9.8 million for 2026. Amortization expense is provided on a straight‑linestraight-line basis over the estimated useful lives of the intangible assets. The weighted‑averageweighted-average remaining life of total amortizable intangible assets is 12.17.6 years. Patents, customerCustomer relationships, technology, trade names and other amortizable intangibles have weighted‑averageweighted-average remaining lives of 3.37.8 years, 11.04.1 years, 7.2 years, 13.710.9 years and 19.115.6 years, respectively. Indefinite‑livedIndefinite-lived intangible assets primarily include trade names and trademarks.
(8)(7) Inventories, net
Inventories consist of the following:
| | | | | | | |
| | | December 31, |
| | | 2021 | | 2020 |
| | | | | | | |
| | December 31, | |
| | 2018 | | 2017 | |
| | (in millions) | |
| | | (in millions) |
Raw materials | | $ | 87.4 | | $ | 81.8 | | $ | 119.4 | | $ | 79.6 |
Work-in-process | | | 17.3 | | | 17.5 | | | 20.4 | | | 16.1 |
Finished goods | | | 182.1 | | | 159.8 | | | 230.9 | | | 167.9 |
| | $ | 286.8 | | $ | 259.1 | |
| | | $ | 370.7 | | $ | 263.6 |
Raw materials, work‑in‑processwork-in-process and finished goods are net of valuation reserves of $27.4$36.7 million and $28.2$37.3 million as of December 31, 20182021 and 2017,2020, respectively. Finished goods of $17.4$10.6 million and $17.5$16.3 million as of December 31, 20182021 and 2017,2020, respectively, were consigned.
(9)(8) Property, Plant and Equipment
Property, plant and equipment consist of the following:
| | | | | | | |
| | | December 31, |
| | | 2021 | | 2020 |
| | | | | | | |
| | December 31, | |
| | 2018 | | 2017 | |
| | (in millions) | |
| | | (in millions) |
Land | | $ | 14.1 | | $ | 14.5 | | $ | 12.6 | | $ | 13.2 |
Buildings and improvements | | | 165.7 | | | 164.6 | | | 190.6 | | | 194.3 |
Machinery and equipment | | | 342.2 | | | 336.9 | | | 394.5 | | | 386.6 |
Construction in progress | | | 15.4 | | | 9.8 | | | 11.1 | | | 14.5 |
| | | 537.4 | | | 525.8 | |
Property, plant and equipment, at cost | | | | 608.8 | | | 608.6 |
Accumulated depreciation | | | (335.5) | | | (327.3) | | | (408.1) | | | (396.3) |
| | $ | 201.9 | | $ | 198.5 | |
Property, plant, and equipment, net | | | $ | 200.7 | | $ | 212.3 |
(9) Income Taxes
The significant components of the Company’s deferred income tax liabilities and assets are as follows:
| | | | | | | |
| | | December 31, |
| | | 2021 | | 2020 |
| | | | | | | |
| | December 31, | |
| | 2018 | | 2017 | |
| | (in millions) | |
| | | (in millions) |
Deferred income tax liabilities: | | | | | | | | | | | | |
Excess tax over book depreciation | | $ | 16.2 | | $ | 13.5 | | $ | 21.5 | | $ | 22.5 |
Intangibles | | | 33.8 | | | 37.1 | | | 29.0 | | | 31.7 |
Goodwill | | | 17.4 | | | 16.3 | | | 25.1 | | | 23.6 |
Foreign earnings | | | 5.1 | | | 14.6 | | | 2.2 | | | 4.2 |
Operating lease ROU assets | | | | 8.6 | | | 11.0 |
Other | | | 3.2 | | | 5.7 | | | 3.2 | | | 2.9 |
Total deferred tax liabilities | | | 75.7 | | | 87.2 | | | 89.6 | | | 95.9 |
Deferred income tax assets: | | | | | | | | | | | | |
Accrued expenses | | | 16.0 | | | 17.8 | | | 10.7 | | | 7.8 |
Capital loss carry forward | | | — | | | 0.3 | |
Product liability | | | | 5.9 | | | 6.1 |
Operating lease liabilities | | | | 8.9 | | | 11.2 |
Stock based compensation | | | | 6.2 | | | 4.9 |
Foreign tax credits | | | 33.5 | | | 22.0 | | | 13.8 | | | 34.4 |
Net operating loss carry forward | | | 6.1 | | | 6.5 | | | 6.6 | | | 7.5 |
Capital loss carry forward | | | | 1.7 | | | 1.0 |
Inventory reserves | | | 6.0 | | | 5.8 | | | 9.4 | | | 9.0 |
Other | | | 7.1 | | | 9.9 | | | 9.6 | | | 9.4 |
Total deferred tax assets | | | 68.7 | | | 62.3 | | | 72.8 | | | 91.3 |
Less: valuation allowance | | | (29.9) | | | (28.7) | | | (20.2) | | | (42.1) |
Net deferred tax assets | | | 38.8 | | | 33.6 | | | 52.6 | | | 49.2 |
Net deferred tax liabilities | | $ | (36.9) | | $ | (53.6) | | $ | (37.0) | | $ | (46.7) |
The provision for income taxes is based on the following pre‑taxpre-tax income:
| | | | | | | | | | |
| | | Year Ended December 31, |
| | | 2021 | | 2020 | | 2019 |
| | | | | | | | | | |
| | Year Ended December 31, | |
| | 2018 | | 2017 | | 2016 | |
| | (in millions) | |
| | | (in millions) |
Domestic | | $ | 103.2 | | $ | 80.3 | | $ | 64.8 | | $ | 139.6 | | $ | 96.8 | | $ | 119.9 |
Foreign | | | 71.4 | | | 62.8 | | | 63.0 | | | 94.5 | | | 70.2 | | | 64.0 |
| | $ | 174.6 | | $ | 143.1 | | $ | 127.8 | |
| | | $ | 234.1 | | $ | 167.0 | | $ | 183.9 |
The provision for income taxes consists of the following:
| | | | | | | | | | |
| | | Year Ended December 31, |
| | | 2021 | | 2020 | | 2019 |
| | | | | | | | | | |
| | Year Ended December 31, | |
| | 2018 | | 2017 | | 2016 | |
| | (in millions) | |
| | | (in millions) |
Current tax expense: | | | | | | | | | | | | | | | | | | |
Federal | | $ | 24.7 | | $ | 42.1 | | $ | 18.3 | | $ | 32.0 | | $ | 13.4 | | $ | 18.7 |
Foreign | | | 29.0 | | | 17.3 | | | 17.2 | | | 30.3 | | | 25.3 | | | 25.5 |
State | | | 7.7 | | | 4.2 | | | 3.9 | | | 14.4 | | | 6.9 | | | 6.4 |
| | | 61.4 | | | 63.6 | | | 39.4 | |
| | | | 76.7 | | | 45.6 | | | 50.6 |
Deferred tax expense (benefit): | | | | | | | | | | | | | | | | | | |
Federal | | | (3.2) | | | 4.0 | | | 3.6 | | | (4.8) | | | 14.8 | | | 2.5 |
Foreign | | | (7.7) | | | 8.5 | | | 0.6 | | | (2.4) | | | (6.7) | | | (2.1) |
State | | | (1.9) | | | 5.9 | | | — | | | (1.1) | | | (1.0) | | | 1.4 |
| | | (12.8) | | | 18.4 | | | 4.2 | |
Deferred tax remeasurement of the 2017 Tax Act | | | (2.0) | | | (12.0) | | | — | |
| | $ | 46.6 | | $ | 70.0 | | $ | 43.6 | |
| | | | (8.3) | | | 7.1 | | | 1.8 |
| | | $ | 68.4 | | $ | 52.7 | | $ | 52.4 |
The 2017 Tax Cuts and Jobs Act (“2017 Tax Act”) was enacted on December 22, 2017 and has resulted in significant changes
In 2020, final tax regulations were released with respect to the U.S. corporateGILTI tax regime. These regulations permit an exclusion from GILTI for items of foreign income tax system. These changes included lowering the U.S. Corporate income tax rate from 35% to 21% and the elimination or reduction of certain domestic deductions and credits. The 2017 Tax Act also transitioned international taxation from a worldwide systemsubject to a modified territorial system creating new taxes on certain foreign-sourced earnings and certain related party payments, which arehigh effective tax rate, referred to as the Global Intangible Low-taxed IncomeGILTI High Tax andExclusion (“HTE”). Under the Annual Anti-Base Erosion Tax, respectively. The 2017 Tax Act also imposed a one-time mandatory deemed repatriation tax (“Toll Tax”) on foreign subsidiaries’ previously untaxed accumulated foreign earnings.
Due to the timing of the enactment and the complexity involved applying the provisions of the 2017 Tax Act,new regulations, the Company made reasonable estimates of the effects and recorded provisional amounts inwas allowed to review its December 31, 2017 financial statements. In December 2017, the SEC staff issued Staff Accounting Bulletin No. 118, Income Tax Accounting Implications of the Tax Cuts and Jobs Act (SAB 118), which allows companies to record provisional amounts during a measurement period not to extend beyond one year of the enactment date. Adjustments made to the provisional amounts allowed under SAB 118 were identified and recorded as discrete adjustments as described in the following paragraphs.
Changes in tax rates and tax laws are accountedGILTI income for in the period of enactment. Therefore, the Company recorded a provisional tax expense of $25.1 million related to the 2017 Tax Act, as of December 31, 2017. This amount also included an immaterial benefit to the Company’s 2017 current year tax expense. During the year ended December 31, 2018, the Company finalized the impact of the 2017 Tax Act and recorded a benefit of $3.7 million, reducing the net impact to $21.4 million. Included in the 2018 adjustment was a $10.6 million benefit related toand 2019 tax years. The Company elected the determination of our foreignexclusion for both the 2018 and 2019 tax credits and partial release of a related valuation allowance, partially offset by additional Toll Tax of $10.2 million.
Toll Tax
The 2017 Tax Act imposed a one-time Toll Tax requiring the Company to pay U.S. income taxes on accumulated foreign subsidiary earnings not previously subject to U.S. income tax at a rate of 15.5% to the extent of foreign cash and cash equivalents and 8% on the remaining earnings. For the year ended December 31, 2017, the Company recorded a provisional amount of $23.3 million related to the Toll Tax. As of December 31, 2018, the Company recorded tax expense based on final guidance on the 2017 Tax Act of $10.2 million,years resulting in a total Toll Tax charge of $33.5 million which is being paid over eight years starting in 2018 and will not accrue interest.
Deferred Tax Remeasurement
As the Company’s deferred tax liabilities exceeded the balance of the Company’s deferred tax assets, for the year ended December 31, 2017 the Company recorded a provisional amount of tax benefit of $12$2.1 million and as of December 31, 2018 the Companywhich was recorded a final tax benefit of $2 million, for a net $14 million benefit, reflecting the decrease in the U.S. Corporate income tax rate. 2020.
Tax on Foreign Earnings
As a result of the 2017 Tax Act, the Company can repatriate its cumulative undistributed foreign earning back to the U.S. with minimal U.S. income tax consequences other than the one-time Toll Tax. The Company recorded a provisional amount of deferred tax expense of $14.6 million, and as of December 31, 2018 the Company recorded a final tax benefit of $2 million, for a net deferred tax expense of $12.6 million for the future repatriation of foreign earnings.
Actual income taxes reported are different than what would have been computed by applying the federal statutory tax rate to income before income taxes. The reasons for these differences are as follows:
| | | | | | | | | | |
| | | Year Ended December 31, |
| | | 2021 | | 2020 | | 2019 |
| | | | | | | | | | |
| | Year Ended December 31, | |
| | 2018 | | 2017 | | 2016 | |
| | (in millions) | |
| | | (in millions) |
Computed expected federal income expense | | $ | 36.6 | | $ | 50.1 | | $ | 44.7 | | $ | 49.2 | | $ | 35.0 | | $ | 38.6 |
State income taxes, net of federal tax benefit | | | 5.3 | | | 2.7 | | | 2.2 | | | 6.6 | | | 4.6 | | | 6.3 |
Foreign tax rate differential | | | 2.7 | | | (6.7) | | | (6.7) | | | 4.3 | | | 2.7 | | | 4.2 |
Impact of the 2017 Tax Act | | | (3.7) | | | 25.1 | | | — | |
Unrecognized tax benefits | | | 3.2 | | | — | | | — | |
Restructuring of manufacturing supply chain operations | | | | 29.3 | | | — | | | — |
Valuation allowance | | | | (22.1) | | | 12.9 | | | — |
GILTI HTE | | | | — | | | (2.1) | | | — |
Unrecognized tax benefits, net | | | | 2.0 | | | (0.3) | | | 0.7 |
Other, net | | | 2.5 | | | (1.2) | | | 3.4 | | | (0.9) | | | (0.1) | | | 2.6 |
| | $ | 46.6 | | $ | 70.0 | | $ | 43.6 | |
| | | $ | 68.4 | | $ | 52.7 | | $ | 52.4 |
In 2021, the Company restructured its Mexican manufacturing supply chain operations, which resulted in $29.3 million in additional tax expense, and was offset by a $22.1 million release of the valuation allowance on foreign tax credits, for a net tax of $7.2 million. The additional tax expense was primarily related to the prepayment of future royalties from the new structure, which resulted in current foreign source income. The foreign tax credit benefit significantly offset the additional tax expense resulting from the new supply chain structure.
At December 31, 2018,2021, the Company had foreign and domestic net operating loss carry forwards of $24.6 million and $2.6 million, respectively, for income tax purposes before considering valuation allowances; $24.6 million of the foreign losses can be carried forward indefinitely, $1.8 million of the domestic losses expire between 2035 and 2040 and $0.8 million can be carried forward indefinitely. The net operating losses consist of $24.6 million related to Austrian operations and $2.6 million related to United States operations.
At December 31, 2018, all2021, the Company had a U.S. capital loss carry forwards were utilized or expired.forward of $1.7 million before considering valuation allowances that will expire in 2025.
At December 31, 20182021 and December 31, 2017,2020, the Company had foreign tax credit carry forwards of $33.5$13.8 million and $22.0$34.4 million, respectively, for income tax purposes before considering valuation allowances. The foreign tax credit carryforwards expire inbetween 2027 and 2028.2031.
At December 31, 20182021 and December 31, 2017,2020, the Company had valuation allowances of $29.9$20.2 million and $28.7$42.1 million, respectively. At December 31, 2018, $23.82021, $12.4 million related to foreign tax credits, and $6.1 million related to Austrian net operating losses.losses, and $1.7 million related to the domestic capital loss carry forward. At December 31, 2017, $0.3 million related to U.S. capital losses, $22.02020, $34.4 million related to foreign tax credits, and $6.4$6.7 million related to Austrian net operating losses.losses, and $1.0 million related to the domestic capital loss carry forward. The $21.9 million decrease from December 31, 2020 to December 31, 2021 in the valuation allowance mainly related to foreign tax credits utilized against additional foreign source income due to supply chain restructuring. Management believes that the ability of the Company to use such foreign tax credits and losses within the applicable carry forward period does not rise to the level of the more likely than not threshold. The Company does not have a valuation allowance on other deferred tax assets, as management believes that it is more likely than not that the Company will recover the net deferred tax assets. Management believes it is more likely than not that the future reversals of the deferred tax liabilities, together with forecasted income, will be sufficient to fully recover the deferred tax assets.
AfterSubsequent to recording the Toll Tax as part of the Tax Cuts and Jobs Act of 2017, after December 31, 2017, the Company consideredconsiders all of its foreign earnings to be permanently reinvested outside of the U.S. and has no plans to repatriate these foreign earnings to the U.S.
Unrecognized Tax Benefits
(11)As of December 31, 2021, the Company had gross unrecognized tax benefits of approximately $8.5 million, approximately $5.0 million of which, if recognized, would affect the effective tax rate. The difference between the amount of unrecognized tax benefits and the amount that would affect the effective tax rate consists of allowable correlative adjustments that are available for certain jurisdictions.
A reconciliation of the beginning and ending amount of unrecognized tax is as follows:
| | | |
| | (in millions) |
Balance at January 1, 2021 | | $ | 11.7 |
Increases related to prior year tax positions | | | 1.1 |
Decreases related to prior year tax positions | | | (1.4) |
Decreases due to lapse in statutes | | | (2.2) |
Currency movement | | | (0.7) |
Balance at December 31, 2021 | | $ | 8.5 |
The Company estimates that it is reasonably possible that the balance of unrecognized tax benefits as of December 31, 2021 may decrease by $2.6 million to $3.3 million in the next twelve months, as a result of lapses in statutes of limitations and settlements and $1.7 million to $2.2 million of which, if recognized, would affect the effective tax rate.
The Company conducts business in a variety of locations throughout the world resulting in tax filings in numerous domestic and foreign jurisdictions. The Company is subject to tax examinations regularly as part of the normal course of business. The Company’s major jurisdictions are the U.S., France, Germany, Italy and Canada. The statute of limitations in the U.S. is subject to tax examination for 2018 and later; France, Germany, Italy and Canada are subject to tax examination for 2016 and later. All other jurisdictions, with few exceptions, are no longer subject to tax examinations in state, local or international jurisdictions for tax years before 2014.
The Company accounts for interest and penalties related to uncertain tax positions as a component of income tax expense.
(10) Accrued Expenses and Other Liabilities
Accrued expenses and other liabilities consist of the following:
| | | | | | | |
| | | December 31, |
| | | 2021 | | 2020 |
| | | | | | | |
| | December 31, | |
| | 2018 | | 2017 | |
| | (in millions) | |
| | | (in millions) |
Commissions and sales incentives payable | | $ | 46.3 | | $ | 40.1 | | $ | 57.1 | | $ | 44.6 |
Product liability and workers’ compensation | | | 22.3 | | | 24.5 | |
Product liability | | | | 22.2 | | | 22.1 |
Shipping / freight payable | | | | 16.9 | | | 5.3 |
Other | | | 54.6 | | | 57.6 | | | 77.4 | | | 57.5 |
Income taxes payable | | | 7.4 | | | 3.6 | | | 13.3 | | | 7.9 |
| | $ | 130.6 | | $ | 125.8 | |
| | | $ | 186.9 | | $ | 137.4 |
(12)(11) Financing Arrangements
The Company’s debt consists of the following:
| | | | | | |
| | December 31, |
| | 2021 | | 2020 |
|
| | (in millions) |
Line of Credit due March 2026 | | $ | 145.0 | | | — |
Line of Credit due February 2022 | | | — | | | 200.0 |
Less debt issuance costs (deduction from debt liability) | | | (3.1) | | | (1.8) |
Total long-term debt | | $ | 141.9 | | $ | 198.2 |
| | | | | | |
| | December 31, |
| | 2018 | | 2017 |
| | (in millions) |
5.05% notes due June 2020 | | $ | 75.0 | | | 75.0 |
Term Loan due February 2021 | | | 255.0 | | | 277.5 |
Line of Credit due February 2021 | | | 25.0 | | | 147.0 |
Total debt outstanding | | | 355.0 | | | 499.5 |
Less debt issuance costs (deduction from debt liability) | | | (1.6) | | | (2.4) |
Less current maturities | | | (30.0) | | | (22.5) |
Total long-term debt | | $ | 323.4 | | $ | 474.6 |
Principal payments during each of the next five years and thereafter are due as follows (in millions): 2019—$30.0; 2020—$105.0; 2021—$220.0; and 2022 and thereafter - $0. 2022: $0; 2023: $0; 2024: $0; 2025: $0; 2026: $145.0.
On February 12, 2016,March 30, 2021, the Company entered into athe Second Amended Credit Agreement. The Second Amended Credit Agreement (the “Credit Agreement”) amongamends the Company, certain subsidiariesAmended Credit Agreement to extend the maturity date of the Company who become borrowers under the Credit Agreement, JPMorgan Chase Bank, N.A., as Administrative Agent, Swing Line Lender and Letter of Credit Issuer, and the other lenders referred to therein. The Credit Agreement provides for a $500$800 million five‑year, senior unsecured revolving credit facility (the “Revolvingfrom February 12, 2022 to March 30, 2026 (“New Revolving Credit Facility”) with a sublimit. Among other changes, the Second Amended Credit Agreement increases the Company’s maximum consolidated leverage ratio (including both the base ratio and the ratio permitted during temporary step-ups following certain acquisitions), adjusts certain fees to reflect market conditions and reduces the 1.00% floor on the adjusted LIBOR rate to 0.00%.
The New Revolving Credit Facility also includes sublimits of up to $100 million for letters of credit and $15 million for swing line loans. As of December 31, 2021, the Company had drawn down $145.0 million on this line of credit and had $14.0 million in letters of credit. As of December 31, 2018, the Company had $25.0 million drawn on the line of credit. The Credit Agreement also provides for a $300 million, five‑year, term loan facility (the “Term Loan Facility”) available to the Companycredit outstanding, which resulted in a single draw, of which the entire $300 million had been drawn in February 2016. The Company had $255.0$641.0 million of borrowings outstanding onunused and available credit under the term loan as of December 31, 2018.New Revolving Credit Facility. Borrowings outstanding under the Revolving Credit Facility bear interest at a fluctuating rate per annum equal to an applicable percentage defined as (i) in the case of Eurocurrency rate loans, the ICE Benchmark Administrationadjusted British Bankers Association LIBOR rate plus an applicable percentage, ranging from 0.975%1.075% to 1.45%1.325%, determined by reference to the Company’sCompany's consolidated leverage ratio, or (ii) in the case of alternate base rate loans and swing line loans, interest (which at all times will not be less than 1.00%) at the highestgreatest of (a) the federal funds rate plus 0.5%,Prime Rate in effect on such day, (b) the rate of interestFRBNY Rate in effect foron such day as announced by JPMorgan Chase Bank, N.A. as its “prime rate,”plus 0.50% and (c) the ICE Benchmark Administrationadjusted LIBOR rate plus 1.0%, plus an applicable percentage, ranging from 0.00% to 0.45%, determined by reference to the Company’s consolidated leverage ratio. Borrowings1.00% for a one month interest period in dollars. The weighted average interest rate on debt outstanding under the Term LoanNew Revolving Credit Facility will bear interest at a fluctuating rate per annum equal to an applicable percentage defined as the ICE Benchmark Administration LIBOR rate plus an applicable percentage, ranging from 1.125% to 1.75%, determined by reference to the Company’s consolidated leverage ratio. The interest rates as of December 31, 20182021 was 1.17%. The weighted average interest rate on debt outstanding inclusive of the interest rate swap discussed in Note 16 of the Notes to Consolidated Financial Statements and interest rates under the New Revolving Credit Facility and onas of December 31, 2021 was 1.82%. As of December 31, 2021, the Term Loan Facility were 3.50% and 3.86%, respectively. Company was in compliance with all covenants related to the Second Amended Credit Agreement.
The loan under the Term Loan Facility amortizes as follows: 0% per annum during the first year, 7.5% in the second and third years, 10% in the fourth and fifth years, and the remaining unpaid balance paid in full on the maturity date. Payments when due are made ratably each year in quarterly installments. The Company paid quarterly installments of $22.5 million during 2018. In addition to paying interest under the Second Amended Credit Agreement, the Company is also required to pay certain fees in connection with the credit facility,New Revolving Credit Facility, including, but not limited to, an unused facility fee and letter of credit fees.
The Second Amended Credit Agreement matures on February 12, 2021,March 30, 2026, subject to extension under certain circumstances and subject to the terms of the Second Amended Credit Agreement. The Company may repay loans outstanding under the Second Amended Credit Agreement from time to time without premium or penalty, other than customary breakage costs, if any, and subject to the terms of the Second Amended Credit Agreement. Once repaid, amounts borrowed under
The Second Amended Credit Agreement impose various restrictions on the Term Loan Facility may not be borrowed again.
Company and its subsidiaries, including restrictions pertaining to: (i) the incurrence of additional indebtedness, (ii) limitations on liens, (iii) making distributions, dividends and other payments, (iv) mergers, consolidations and acquisitions, (v) dispositions of assets, (vi) certain consolidated leverage ratios and consolidated interest coverage ratios, (vii) transactions with affiliates, (viii) changes to governing documents, and (ix) changes in control.
The Company maintains letters of credit that guarantee its performance or payment to third parties in accordance with specified terms and conditions. Amounts outstanding were $25.8$14.0 million as of December 31, 20182021 and $25.7$16.2 million as of December 31, 2017.2020. The Company’s letters of credit are primarily associated with insurance coverage. The Company’s letters of credit generally expire within one year of issuance and are drawn down against the Revolving Credit Facility.issuance. These instruments may exist or expire without being drawn down. Therefore, they do not necessarily represent future cash flow obligations.
As of December 31, 2018, the Company had $449.2 million of unused and available credit under theThe Amended Credit Agreement amended and $25.8restated the Prior Credit Agreement in its entirety while increasing the amount of revolving credit available from $500 million to $800 million and extended the maturity by one additional year to February 2022. The senior unsecured revolving credit facility (the "Revolving Credit Facility") also included sublimits of stand-by$100 million for letters of credit and $15 million for swing line loans. The term loan facility under the Prior Credit Agreement was terminated and paid off effective April 24, 2020, with funds from the Revolving Credit Facility. Borrowings outstanding under the Revolving Credit Facility bore interest at a fluctuating rate per annum equal to an applicable percentage defined as (i) in the case of Eurocurrency rate loans, the adjusted British Bankers Association LIBOR rate (which at all times was not less than 1.00%) plus an applicable percentage, ranging from 1.50% to 2.10%, determined by reference to the Company's consolidated leverage ratio, or (ii) in the case of alternate base rate loans and swing line loans, interest (which at all times was not less than 2.00%) at the greatest of (a) the Prime Rate in effect on such day, (b) the FRBNY Rate in effect on such day plus 0.50% and (c) the adjusted LIBOR rate plus 1.00% for a one
month interest period in dollars. In addition to paying interest under the Amended Credit Agreement. As of December 31, 2018,Agreement, the Company was in compliance with all covenants related to the Credit Agreement.
On June 18, 2010, the Company entered into a note purchase agreement with certain institutional investors (the 2010 Note Purchase Agreement). Pursuant to the 2010 Note Purchase Agreement, the Company issued senior notes of $75.0 million in principal, due June 18, 2020. The Company pays interest on the outstanding balance of the Notes at the rate of 5.05% per annum, payable semi-annually on June 18th and December 18th until the principal on the Notes shall become due and payable. The Company may, at its option, upon notice, and subject to the terms of the 2010 Note Purchase Agreement, prepay at any time all or part of the Notes in an amount not less than $1.0 million by paying the principal amount plus a make-whole amount, which is dependent upon the yield of respective U.S. Treasury securities. The 2010 Note Purchase Agreement includes operational and financial covenants, with which the Company isalso required to comply,pay certain fees in connection with the Revolving Credit Facility, including, among others, maintenancebut not limited to, an unused facility fee and letter of certain financial ratioscredit fees.
(12) Earnings per Share and restrictions on additional indebtedness, liens and dispositions. As of December 31, 2018, the Company was in compliance with all covenants related to the 2010 Note Purchase Agreement.Stock Repurchase Program
(13) Common Stock
The Class A common stock and Class B common stock have equal dividend and liquidation rights. Each share of the Company’s Class A common stock is entitled to one1 vote on all matters submitted to stockholders and each share of Class B common stock is entitled to ten10 votes on all such matters. Shares of Class B common stock are convertible into shares of Class A common stock on a one‑to‑one1-to-one basis at the option of the holder. As of December 31, 2018,2021, the Company had reserved a total of 2,581,3892,157,082 shares of Class A common stock for issuance under its stock‑basedstock-based compensation plans and 6,329,2906,024,290 shares for conversion of Class B common stock to Class A common stock.
Basic net income per common share is calculated by dividing net income by the weighted average number of common shares outstanding. The calculation of diluted net income per share assumes the conversion of all dilutive securities.
Net income and the number of shares used to compute net income per share, basic and assuming full dilution, are reconciled below:
| | | | | | | | | | | | | | | | | | | | | | | | |
| | Year Ended December 31, |
| | 2021 | | 2020 | | 2019 |
| | | | | | | Per | | | | | | | Per | | | | | | | Per |
| | Net | | | | Share | | Net | | | | Share | | Net | | | | Share |
| | Income | | Shares | | Amount | | Income | | Shares | | Amount | | Income | | Shares | | Amount |
|
| | (Amounts in millions, except per share information) |
Basic EPS | | $ | 165.7 | | 33.8 | | $ | 4.90 | | $ | 114.3 | | 33.9 | | $ | 3.37 | | $ | 131.5 | | 34.1 | | $ | 3.86 |
Dilutive securities, principally common stock options | | | — | | 0.1 | | | (0.02) | | | — | | 0.1 | | | (0.01) | | | — | | 0.1 | | | (0.01) |
Diluted EPS | | $ | 165.7 | | 33.9 | | $ | 4.88 | | $ | 114.3 | | 34.0 | | $ | 3.36 | | $ | 131.5 | | 34.2 | | $ | 3.85 |
On July 27, 2015,February 6, 2019, the Company’s Board of Directors authorized the repurchase of up to $100$150 million of the Company’s Class A common stock, to be purchased from time to time on the open market or in privately negotiated transactions. In connection with thisFor the stock repurchase program, the Company enteredenters into a Rule 10b5-1 plan,plans, which permitspermit shares to be repurchased when the Company might otherwise be precluded from doing so under insider trading laws. The repurchase program may be suspended or discontinued at any time, subject to the terms of the Rule 10b5-1 planplans the Company entered into with respect to the repurchase program. As of December 31, 2018,2021, there was approximately $11.8$97.4 million remaining authorized for share repurchases under thisthe $150 million program.
The following table summarizes the cost and the number of shares of Class A common stock repurchased under the July 27, 2015 programs forFor the years ended December 31, 20182021 and 2017:2020, the Company repurchased 109,998 shares for $16.0 million and 331,531 shares for $28.9 million, respectively.
| | | | | | | | | | |
| | Year Ended December 31, |
| | 2018 | | 2017 |
| | Number of shares | | Cost of shares | | Number of shares | | Cost of shares |
| | repurchased | | repurchased | | repurchased | | repurchased |
| | (amounts in millions, except share amount) |
Stock repurchase programs: | | | | | | | | | | |
July 27, 2015 | | 340,106 | | | 26.0 | | 277,886 | | | 18.2 |
Total | | 340,106 | | $ | 26.0 | | 277,886 | | $ | 18.2 |
(13) Stock-Based Compensation
(14) Stock‑Based Compensation
As of December 31, 2018,2021, the Company maintains one1 stock incentive plan, the Second Amended and Restated 2004 Stock Incentive Plan (the “2004 Stock Incentive Plan”). At December 31, 2018, 1,232,1372021, 1,038,783 shares of Class A common stock were authorized for future grants of new equity awards under this plan. The Company currently grants shares of restricted stock and deferred stock awards to key employees and stock awards to non‑employeenon-employee members of the Company’s Board of Directors under the 2004 Stock Incentive Plan. The Company also previously granted shares of restricted stock to key employees. Stock awards to non‑employeenon-employee members of the Company’s Board of Directors vest immediately. Employees’ restricted stock awards and deferred stock awards typically vest over a three‑yearthree-year period at the rate of one‑thirdone-third per year. The restricted stock awards are outstanding upon grant whereas the deferred stock awards are outstanding upon vesting. The restricted stock awards and deferred stock awards are amortized to expense on a straight-line basis over the vesting period.
The Company also grants performance stock units to key employees under the 2004 Stock Incentive Plan. Performance stock units cliff vest at the end of a performance period set by the Compensation Committee of the Board of Directors at the time of grant.grant, which is currently three years. Upon vesting, the number of shares of the Company’s Class A common
stock awarded to each performance stock unit recipient will be determined based on the Company’s performance relative to certain performance goals set at the time the performance stock units were granted. The recipient of a performance stock unit
award may earn from zero0 shares to twice the number of target shares awarded to such recipient. The performance stock units are amortized to expense over the vesting period, and based on the Company’s performance relative to the performance goals, may be adjusted. Changes to the estimated shares expected to vest will result in adjustments to the related share-based compensation expense that will be recorded in the period of change. If the performance goals are not met, no awards are earned and previously recognized compensation expense is reversed. The Company granted performance stock units in 2018, 20172021, 2020 and 2016.2019. The performance goals for the performance stock units are based on the compound annual growth rate of the Company’s revenue over the three-year performance period and the Company’s return on invested capital (“ROIC”) for the third year of the performance period.
Beginning in 2019, the Company included “retirement vesting” provisions in the agreements for its deferred stock awards and performance stock units. These provisions provide that an employee who retires from the Company after attaining age 55 and 10 years of service and who meets certain other requirements, including non-competition and non-solicitation requirements, would be allowed to continue to vest in his or her deferred stock awards for the duration of the vesting periods and would be entitled to receive a pro rata portion of his or her performance stock units based on the period of service elapsed during the performance period.
Beginning in 2015, the Company stopped granting stock options as part of its annual equity awards to employees. Previously under the 2004 Stock Incentive Plan, key employees were granted nonqualified stock options to purchase the Company’s Class A common stock. Options typically became exercisable over a four-year period at the rateMinimal options remain outstanding, all of 25% per yearwhich are vested and expire ten years afterfrom the grant date. However, most options granted in 2014 become exercisable over a three-year period at a ratedate of one-third per year.grant. Options granted under the plan may have exercise prices of not less than 100% of the fair market value of the Class A common stock on the date of grant. The Company’s practice was to grant all options at fair market value on the grant date. Upon exercise of options, the Company issues shares of Class A common stock.
The Company also has a Management Stock Purchase Plan that allows for the granting of restricted stock units (RSUs) to key employees. On an annual basis, key employees may elect to receive a portion of their annual incentive compensation in RSUs instead of cash. Participating employees may use up to 50% of their annual incentive bonus to purchase RSUs for a purchase price equal to 80% of the fair market value of the Company’s Class A common stock as of the date of grant. RSUs vest either annually over a three-year period from the grant date or upon the third anniversary of the grant date. Receipt of the shares underlying RSUs is deferred for a minimum of three years, or such greater number of years as is chosen by the employee, from the date of grant. An aggregate of 2,000,000 shares of Class A common stock may be issued under the Management Stock Purchase Plan. At December 31, 2018, 750,4212021, 720,109 shares of Class A common stock were authorized for future grants under the Company’s Management Stock Purchase Plan.
2004 Stock Incentive Plan
The following is a summary of unvested restricted stock and deferred stock awards activity and related information:
| | | | | | | | | | | | | | | | |
| | | Year Ended December 31, |
| | | 2021 | | 2020 | | 2019 |
| | | | | Weighted | | | | Weighted | | | | Weighted |
| | | | | Average | | | | Average | | | | Average |
| | | | | Grant Date | | | | Grant Date | | | | Grant Date |
| | | Shares | | Fair Value | | Shares | | Fair Value | | Shares | | Fair Value |
| | | | | | | | | | | | | | | | |
| | Year Ended December 31, | |
| | 2018 | | 2017 | | 2016 | |
| | | | Weighted | | | | Weighted | | | | Weighted | |
| | | | Average | | | | Average | | | | Average | |
| | | | Grant Date | | | | Grant Date | | | | Grant Date | |
| | Shares | | Fair Value | | Shares | | Fair Value | | Shares | | Fair Value | |
| | (Shares in thousands) | |
| | | (Shares in thousands) |
Unvested at beginning of year | | 217 | | $ | 57.31 | | 210 | | $ | 53.79 | | 244 | | $ | 52.61 | | 166 | | $ | 77.97 | | 196 | | $ | 76.56 | | 216 | | $ | 71.28 |
Granted | | 153 | | | 80.52 | | 139 | | | 60.88 | | 140 | | | 56.33 | | 61 | | | 128.32 | | 92 | | | 75.77 | | 96 | | | 78.54 |
Vested | | | (84) | | | 81.70 | | (100) | | | 74.84 | | (102) | | | 68.83 |
Cancelled/Forfeitures | | (126) | | | 59.52 | | (9) | | | 55.55 | | (42) | | | 54.43 | | (5) | | | 93.98 | | (22) | | | 75.73 | | (14) | | | 56.97 |
Vested | | (28) | | | 66.24 | | (123) | | | 55.35 | | (132) | | | 53.10 | |
Unvested at end of year | | 216 | | $ | 71.28 | | 217 | | $ | 57.31 | | 210 | | $ | 53.79 | | 138 | | $ | 97.43 | | 166 | | $ | 77.97 | | 196 | | $ | 76.56 |
The total fair value of shares vested during 2018, 20172021, 2020 and 20162019 was $10.2$10.5 million, $7.7$8.1 million and $7.9$8.4 million, respectively. At December 31, 2018,2021, total unrecognized compensation cost related to unvested restricted stock and deferred stock awards was approximately $10.0$7.0 million with a total weighted average remaining term of 1.701.43 years. For 2018, 20172021, 2020 and 2016,2019, the Company recognized compensation costs of $7.6 million, $6.9$7.7 million and $7.6$8.5 million, respectively.
The aggregate intrinsic value of restricted stock and deferred shares granted and outstanding approximated $13.9 million representing the total pre‑tax intrinsic value based on the Company’s closing Class A common stock price of $64.53 as of December 31, 2018.
The following is a summary of unvested performance stock award activity and related information:
| | | | | | | | | | | | | | | |
| | Year Ended December 31, |
| | 2018 | | 2017 | | 2016 |
| | | | Weighted | | | | Weighted | | | | Weighted |
| | | | Average | | | | Average | | | | Average |
| | | | Grant Date | | | | Grant Date | | | | Grant Date |
| | Shares | | Fair Value | | Shares | | Fair Value | | Shares | | Fair Value |
| | (Shares in thousands) |
Unvested at beginning of year | | 273 | | $ | 58.23 | | 267 | | $ | 56.96 | | 201 | | $ | 57.98 |
Granted | | 96 | | | 81.51 | | 98 | | | 60.45 | | 107 | | | 55.27 |
Cancelled/Forfeitures | | (80) | | | 58.96 | | (38) | | | 57.12 | | (41) | | | 57.56 |
Vested | | (40) | | | 63.43 | | (54) | | | 56.81 | | — | | | — |
Unvested at end of year | | 249 | | $ | 66.15 | | 273 | | $ | 58.23 | | 267 | | $ | 56.96 |
The total fair value of shares vested during 2018 and 2017 was $5.8 million and $3.5 million, respectively. For 2016, no performance stock awards vested. At December 31, 2018, total unrecognized compensation cost related to unvested performance stock awards was approximately $6.6 million with a total weighted average remaining term of 1.51 years. For 2018, 2017 and 2016, the Company recognized compensation costs of $5.2 million, $4.8 million and $4.0 million, respectively.
The aggregate intrinsic value of performance shares granted and outstanding approximated $16.1$26.8 million representing the total pre-tax intrinsic value based on the Company’s closing Class A common stock price of $64.53$194.17 as of December 31, 2018.2021.
The following is a summary of unvested performance stock award activity and related information:
| | | | | | | | | | | | | | | |
| | Year Ended December 31, |
| | 2021 | | 2020 | | 2019 |
| | | | Weighted | | | | Weighted | | | | Weighted |
| | | | Average | | | | Average | | | | Average |
| | | | Grant Date | | | | Grant Date | | | | Grant Date |
| | Shares | | Fair Value | | Shares | | Fair Value | | Shares | | Fair Value |
|
| | (Shares in thousands) |
Unvested at beginning of year | | 208 | | $ | 78.06 | | 238 | | $ | 73.84 | | 249 | | $ | 66.15 |
Granted | | 61 | | | 113.37 | | 94 | | | 70.65 | | 88 | | | 77.58 |
Vested | | (85) | | | 81.50 | | (97) | | | 60.45 | | (82) | | | 55.27 |
Cancelled/Forfeitures | | (6) | | | 83.53 | | (27) | | | 78.59 | | (17) | | | 71.50 |
Unvested at end of year | | 178 | | $ | 88.32 | | 208 | | $ | 78.06 | | 238 | | $ | 73.84 |
The total fair value of shares vested during 2021, 2020 and 2019 was $10.8 million, $10.0 million and $6.3 million, respectively. At December 31, 2021, total unrecognized compensation cost related to unvested performance stock awards was approximately $10.5 million with a total weighted average remaining term of 1.42 years. For 2021, 2020 and 2019, the Company recognized compensation costs of $14.6 million, $4.3 million and $8.5 million, respectively.
The aggregate intrinsic value of performance shares granted and outstanding approximated $34.6 million representing the total pre-tax intrinsic value based on the Company’s closing Class A common stock price of $194.17 as of December 31, 2021.
The following is a summary of stock option activity and related information:
| | | | | | | | | | | | | | | | | | | |
| | | Year Ended December 31, |
| | | 2021 | | 2020 | | 2019 |
| | | | | Weighted | | Weighted | | | | Weighted | | | | Weighted |
| | | | | Average | | Average | | | | Average | | | | Average |
| | | | | Exercise | | Intrinsic | | | | Exercise | | | | Exercise |
| | | Options | | Price | | Value | | Options | | Price | | Options | | Price |
| | | | | | | | | | | | | | | | | | | |
| | Year Ended December 31, | |
| | 2018 | | 2017 | | 2016 | |
| | | | Weighted | | Weighted | | | | Weighted | | | | Weighted | |
| | | | Average | | Average | | | | Average | | | | Average | |
| | | | Exercise | | Intrinsic | | | | Exercise | | | | Exercise | |
| | Options | | Price | | Value | | Options | | Price | | Options | | Price | |
| | (Options in thousands) | |
| | | (Options in thousands) |
Outstanding at beginning of year | | 95 | | $ | 54.91 | | | | | 130 | | $ | 54.46 | | 362 | | $ | 48.46 | | 5 | | $ | 52.40 | | | | | 10 | | $ | 53.65 | | 49 | | $ | 55.25 |
Granted | | — | | | — | | | | | — | | | — | | — | | | — | |
Cancelled/Forfeitures | | — | | | — | | | | | (3) | | | 55.81 | | (43) | | | 52.93 | | — | | | — | | | | | — | | | — | | (1) | | | 57.47 |
Exercised | | (46) | | | 54.55 | | | | | (32) | | | 53.19 | | (189) | | | 43.31 | | (1) | | | 51.04 | | | | | (5) | | | 55.03 | | (38) | | | 55.63 |
Outstanding at end of year | | 49 | | $ | 55.25 | | $ | 9.28 | | 95 | | $ | 54.91 | | 130 | | $ | 54.46 | | 4 | | $ | 52.92 | | $ | 141.25 | | 5 | | $ | 52.40 | | 10 | | $ | 53.65 |
Exercisable at end of year | | 49 | | $ | 55.25 | | $ | 9.28 | | 93 | | $ | 54.85 | | 82 | | $ | 53.38 | | 4 | | $ | 52.92 | | $ | 141.25 | | 5 | | $ | 52.40 | | 10 | | $ | 53.65 |
As of December 31, 2018, all stock options that had been granted under the 2004 Stock Incentive plan had vested. For 20182021, 2020 and 2019, the Company did not recognize any compensation costs for options. For 2017 and 2016, the Company recognized compensation cost for options of $0.5 million and $1.1 million, respectively. As of December 31, 2018,2021, there was no0 unrecognized compensation cost related to unvested options. As of December 31, 2018,2021, the aggregate intrinsic value of exercisable options was approximately $0.5 million, representing the total pre‑taxpre-tax intrinsic value, based on the Company’s closing Class A common stock price of $64.53$194.17 as of December 31, 2018,2021, which would have been received by the option holders had all option holders exercised their options as of that date. The total intrinsic value of options exercised for 2018, 20172021, 2020 and 20162019 was approximately $1.2$0.2 million, $0.5$0.3 million and $3.5$1.3 million, respectively.
The following table summarizes information about options outstanding at December 31, 2018:2021:
| | | | | | | | | | | | | |
| | Options Outstanding | | Options Exercisable | |
| | | | Weighted Average | | Weighted Average | | | | Weighted Average | |
| | Number | | Remaining Contractual | | Exercise | | Number | | Exercise | |
| | | | | | | | | | | | | |
| | | Options Outstanding | | Options Exercisable |
| | | | | Weighted Average | | Weighted Average | | | | Weighted Average |
| | | Number | | Remaining Contractual | | Exercise | | Number | | Exercise |
Range of Exercise Prices | | Outstanding | | Life (years) | | Price | | Exercisable | | Price | | Outstanding | | Life (years) | | Price | | Exercisable | | Price |
| | (Options in thousands) | |
$29.05-$54.76 | | 17,933 | | 3.47 | | $ | 50.64 | | 17,933 | | $ | 50.64 | |
| | | (Options in thousands) |
$37.41-$37.41 | | | 1 | | 0.59 | | $ | 37.41 | | 1 | | $ | 37.41 |
$54.76-$54.76 | | | 1 | | 1.59 | | | 54.76 | | 1 | | | 54.76 |
$57.47–$57.47 | | 22,372 | | 4.81 | | | 57.47 | | 22,372 | | | 57.47 | | 2 | | 2.58 | | | 57.47 | | 2 | | | 57.47 |
$57.95–$60.10 | | 8,446 | | 5.01 | | | 59.17 | | 8,446 | | | 59.17 | |
| | 48,751 | | 4.35 | | $ | 55.25 | | 48,751 | | $ | 55.25 | |
| | | 4 | | 1.84 | | $ | 52.92 | | 4 | | $ | 52.92 |
Management Stock Purchase Plan
Total unrecognized compensation cost related to unvested RSUs was approximately $0.8$0.9 million at December 31, 20182021 with a total weighted average remaining term of 1.21 1.40 years. For 2018, 2017 and 2016, theThe Company recognized compensation cost of $1.0$0.7 million $1.0 million andfor 2021, $0.7 million respectively.for 2020, and $0.8 million in 2019. Dividends declared for RSUs that are paid to individuals thatbut remain unpaid and accrued at December 31, 2018 total2021 totaled approximately $0.1 million.
A summary of the Company’s RSU activity and related information is shown in the following table:
| | | | | | | | | | | | | | | | | | | |
| | | Year Ended December 31, |
| | | 2021 | | 2020 | | 2019 |
| | | | | Weighted | | Weighted | | | | Weighted | | | | Weighted |
| | | | | Average | | Average | | | | Average | | | | Average |
| | | | | Purchase | | Intrinsic | | | | Purchase | | | | Purchase |
| | | RSUs | | Price | | Value | | RSUs | | Price | | RSUs | | Price |
| | | | | | | | | | | | | | | | | | | |
| | Year Ended December 31, | |
| | 2018 | | 2017 | | 2016 | |
| | | | Weighted | | Weighted | | | | Weighted | | | | Weighted | |
| | | | Average | | Average | | | | Average | | | | Average | |
| | | | Purchase | | Intrinsic | | | | Purchase | | | | Purchase | |
| | RSUs | | Price | | Value | | RSUs | | Price | | RSUs | | Price | |
| | (RSU’s in thousands) | |
| | | (RSU’s in thousands) |
Outstanding at beginning of year | | 174 | | $ | 39.68 | | | | | 148 | | $ | 36.37 | | 101 | | $ | 36.14 | | 95 | | $ | 64.54 | | | | | 110 | | $ | 57.91 | | 154 | | $ | 45.02 |
Granted | | 36 | | | 61.84 | | | | | 47 | | | 49.92 | | 89 | | | 35.41 | | 25 | | | 97.98 | | | | | 28 | | | 69.76 | | 37 | | | 63.77 |
Settled | | | (34) | | | 61.38 | | | | | (40) | | | 49.76 | | (79) | | | 35.63 |
Cancelled/Forfeitures | | (10) | | | 48.82 | | | | | (3) | | | 41.55 | | (28) | | | 32.25 | | (1) | | | 77.03 | | | | | (3) | | | 65.69 | | (2) | | | 56.25 |
Settled | | (46) | | | 37.34 | | | | | (18) | | | 39.09 | | (14) | | | 36.91 | |
Outstanding at end of year | | 154 | | $ | 45.02 | | 19.51 | | $ | 174 | | $ | 39.68 | | 148 | | $ | 36.37 | | 85 | | $ | 75.34 | $ | 118.83 | | $ | 95 | | $ | 64.54 | | 110 | | $ | 57.91 |
Vested at end of year | | 66 | | $ | 38.17 | | 26.36 | | $ | 57 | | $ | 36.26 | | 28 | | $ | 37.78 | | 31 | | $ | 65.29 | $ | 128.88 | | $ | 32 | | $ | 61.89 | | 35 | | $ | 52.67 |
As of December 31, 2018,2021, the aggregate intrinsic values of outstanding and vested RSUs were approximately $3.0$10.1 million and $1.7$4.0 million, respectively, representing the total pre‑taxpre-tax intrinsic value, based on the Company’s closing Class A common stock price of $64.53$194.17 as of December 31, 2018,2021, which would have been received by the RSUs holders had all RSUs settled as of that date. The total intrinsic value of RSUs settled for 2018, 20172021, 2020 and 20162019 was approximately $1.8$2.1 million, $0.4$2.3 million and $1.5$3.5 million, respectively. Upon settlement of RSUs, the Company issues shares of Class A common stock.
The following table summarizes information about RSUs outstanding at December 31, 2018:2021:
| | | | | | | | | | |
| | RSUs Outstanding | | RSUs Vested |
| | | | Weighted Average | | | | Weighted Average |
| | Number | | Purchase | | Number | | Purchase |
Range of Purchase Prices | | Outstanding | | Price | | Vested | | Price |
| | (RSUs in thousands) |
$35.41-$40.27 | | 80 | | $ | 35.47 | | 54 | | $ | 35.50 |
$49.92-$61.84 | | 74 | | | 55.37 | | 12 | | | 49.92 |
| | 154 | | $ | 45.02 | | 66 | | $ | 38.17 |
| | | | | | | | | | |
| | RSUs Outstanding | | RSUs Vested |
| | | | Weighted Average | | | | Weighted Average |
| | Number | | Purchase | | Number | | Purchase |
Range of Purchase Prices | | Outstanding | | Price | | Vested | | Price |
|
| | (RSUs in thousands) |
$35.41-$63.77 | | 35 | | $ | 63.69 | | 23 | | $ | 63.64 |
$69.76-$97.98 | | 50 | | | 83.52 | | 8 | | | 69.76 |
| | 85 | | $ | 75.34 | | 31 | | $ | 65.29 |
The fair value of each share issued under the Management Stock Purchase Plan is estimated on the date of grant, using the Black‑Scholes‑MertonBlack-Scholes-Merton Model, based on the following weighted average assumptions:
| | | | | | | | |
| | Year Ended | | |
| | December 31, | | |
| | 2018 | | 2017 | | 2016 | | |
| | | | | | |
| | | 2021 | | 2020 | |
Expected life (years) | | 3.0 | | 3.0 | | 3.0 | | | 3.0 | | 3.0 | |
Expected stock price volatility | | 24.1 | % | 25.0 | % | 24.8 | % | | 32.7 | % | 24.6 | % |
Expected dividend yield | | 1.0 | % | 1.2 | % | 1.3 | % | | 0.75 | % | 1.1 | % |
Risk-free interest rate | | 2.4 | % | 1.5 | % | 0.9 | % | | 0.3 | % | 0.6 | % |
The risk‑freerisk-free interest rate is based upon the U.S. Treasury yield curve at the time of grant for the respective expected life of the RSUs. The expected life (estimated period of time outstanding) of RSUs and volatility were calculated using historical data. The expected dividend yield of stock is the Company’s best estimate of the expected future dividend yield.
The above assumptions were used to determine the weighted average grant‑dategrant-date fair value of RSUs granted of $21.80, $16.84$37.49, $22.36 and $18.15$22.16 during 2018, 20172021, 2020 and 2016,2019, respectively.
TheAt December 31, 2021, the Company distributed dividendshad total unrecognized compensation costs related to unvested stock-based compensation arrangements of $0.82approximately $18.4 million and a total weighted average remaining term of 1.42 years. For 2021, 2020 and 2019, the Company recognized compensation costs related to stock-based programs of $22.9 million, $12.7 million, and $17.8 million, respectively. For 2021, 2020 and 2019, stock compensation expense of $1.4 million, $0.9 million and $0.9 million, respectively, was recorded in cost of goods sold and $21.5 million, $11.8 million and $16.9 million, respectively, was recorded in selling, general and administrative expenses. For 2021, 2020 and 2019, the Company recorded $3.7 million, $2.1 million and $3.1 million, respectively, of tax benefit for its other stock-based plans. For 2021, 2020 and 2019, the recognition of total stock-based compensation expense impacted both basic and diluted net income per common share for 2018, $0.75 per share for 2017by $0.53, $0.30 and $0.71 per share for 2016 on the Company’s Class A common stock and Class B common stock.$0.42, respectively.
(15)(14) Employee Benefit Plans
The Company’s domestic employees are eligible to participate in the Company’s 401(k) savings plan. Since January 1, 2012, the Company has provided a base contribution of 2% of an employee’s salary, regardless of whether the employee participates in the plan. Further, the Company matches the contribution of up to 100% of the first 4% of an employee’s contribution. The Company’s match contributions for the years ended December 31, 2018, 20172021, 2020 and 2016,2019, were $6.1$6.6 million, $5.0$6.7 million and $5.4$6.8 million, respectively. Charges for Europe pension plans approximated $3.9$4.6 million, $4.1$3.4 million and $4.5$3.6 million for the years ended December 31, 2018, 20172021, 2020 and 2016,2019, respectively. These costs relate to plans administered by certain European subsidiaries, with benefits calculated according to government requirements and paid out to employees upon retirement or change of employment.
(16)(15) Contingencies and Environmental Remediation
Accrual and Disclosure Policy
The Company is a defendant in numerous legal matters arising from its ordinary course of operations, including those involving product liability, environmental matters, and commercial disputes.
The Company reviews its lawsuits and other legal proceedings on an ongoing basis and follows appropriate accounting guidance when making accrual and disclosure decisions. The Company establishes accruals for matters when the Company assesses that it is probable that a loss has been incurred and the amount of the loss can be reasonably estimated. The Company does not establish accruals for such matters when the Company does not believe both that it is probable that a loss has been incurred and that the amount of the loss can be reasonably estimated. The Company’s assessment of whether a loss is probable is based on its assessment of the ultimate outcome of the matter following all appeals.
Under the FASB issuedFASB-issued ASC 450 “Contingencies”, an event is “reasonably possible” if “the chance of the future event or events occurring is more than remote but less than likely” and an event is “remote” if “the chance of the future event or events occurring is slight”. Thus, references to the upper end of the range of reasonably possible loss for cases in
which the Company is able to estimate a range of reasonably possible loss mean the upper end of the range of loss for cases for which the Company believes the risk of loss is more than slight.
There may continue to be exposure to loss in excess of any amount accrued. When it is possible to estimate the reasonably possible loss or range of loss above the amount accrued for the matters disclosed, that estimate is aggregated and disclosed. The Company records legal costs associated with its legal contingencies as incurred, except for legal costs
associated with product liability claims which are included in the actuarial estimates used in determining the product liability accrual.
As of December 31, 2018,2021, the Company estimates that the aggregate amount of reasonably possible loss in excess of the amount accrued for its legal contingencies is approximately $5.3$5.5 million pre‑tax.pre-tax. With respect to the estimate of reasonably possible loss, management has estimated the upper end of the range of reasonably possible loss based on (i) the amount of money damages claimed, where applicable, (ii) the allegations and factual development to date, (iii) available defenses based on the allegations, and/or (iv) other potentially liable parties. This estimate is based upon currently available information and is subject to significant judgment and a variety of assumptions, and known and unknown uncertainties. The matters underlying the estimate will change from time to time, and actual results may vary significantly from the current estimate. In the event of an unfavorable outcome in one or more of the matters, the ultimate liability may be in excess of amounts currently accrued, if any, and may be material to the Company’s operating results or cash flows for a particular quarterly or annual period. However, based on information currently known to it, management believes that the ultimate outcome of all matters, as they are resolved over time, is not likely to have a material adverse effect on the financial condition of the Company, though the outcome could be material to the Company’s operating results for any particular period depending, in part, upon the operating results for such period.
Product Liability
The Company is subject to a variety of potential liabilities in connection with product liability cases. TheFor our most significant volume of liability matters, the Company maintains a high self-insured retention limit within its product liability and general liability coverage, which the Company believes to be generally in accordance with industry practices. For product liability cases in the U.S., management establishes its product liability accrual, which includes estimated legal costs associated with accrued claims. For its most significant volume of liability matters, the Company utilizes third‑partythird-party actuarial valuations which incorporate historical trend factors, including, but not limited to, claim frequency and loss severity, and the Company’s specific claims experience derived from loss reports provided by third‑partythird-party claims administrators. The product liability accrual is established after considering any applicable insurance coverage. The product liability accrual represents the estimated ultimate losses for all reported and incurred but not reported claims. Changes in the nature of product liability claims or the actual settlement amounts could affect the adequacy of the estimates and require changes to the provisions. Because the liability is an estimate, the ultimate liability may be more or less than reported.
Environmental Remediation
The Company has been named as a potentially responsible party with respect to a limited number of identified contaminated sites. The levels of contamination vary significantly from site to site as do the related levels of remediation efforts. Environmental liabilities are recorded based on the most probable cost, if known, or on the estimated minimum cost of remediation. Accruals are not discounted to their present value, unless the amount and timing of expenditures are fixed and reliably determinable. The Company accrues estimated environmental liabilities based on assumptions, which are subject to a number of factors and uncertainties. Circumstances that can affect the reliability and precision of these estimates include identification of additional sites, environmental regulations, level of clean‑upclean-up required, technologies available, number and financial condition of other contributors to remediation and the time period over which remediation may occur. The Company recognizes changes in estimates as new remediation requirements are defined or as new information becomes available.
Chemetco, Inc. Superfund Site, Hartford, Illinois
In August 2017, Watts Regulator Co. (a wholly-owned subsidiary of the Company) received a “Notice of Environmental Liability” from the Chemetco Site Group (“Group”) alleging that it is a potentially responsible party for the Chemetco, Inc. Superfund Site in Hartford, Illinois (the Site)“Site”) because it arranged for the disposal or treatment of hazardous substances that were contained in materials sent to the Site and that resulted in the release or threat of release of
hazardous substances at the Site. As of August 2017, 162 companies were members of the Group. The letter offered Watts Regulator Co. the opportunity to join the Group and participate in the Remedial Investigation and Feasibility Study (“RI/FS”) atfor a portion of the Site. Watts Regulator Co. joined the Group in September 2017 and was added in March 2018 as a signatory together with 43 other new Group members, to the Administrative Settlement Agreement and Order on Consent with the United States Environmental Protection Agency (“USEPA”) governing completion of the RI/FS. The Remedial Investigation (“RI”) report has been completed for the first portion of the Site. For that same portion of the Site, the draft Feasibility Study (“FS”) report was submitted to U.S. Environmental Protection Agency (USEPA) for review and comment in September 2021. Comments and final approval from the EPA are required to complete the FS process; comments from the EPA are pending. Based on information currently known to it, management believes that Watts Regulator Co.’s share of the costs of the RI/FS is not likely to have a material adverse effect on the financial condition of the Company, or have a material adverse effect on the Company’s operating results for any particular period. In February 2018, the Group commenced
suit in the United States District Court for the Southern District of Illinois seeking response costs from other potentially responsible parties for the Site. The Group has identified more than 2,000 additional potentially responsible parties to date. The Company is unable to estimate a range of reasonably possible loss for the above matter in which damages have not been specified because: (i) the RI/FS process for the first portion of the Site has not been completed, and the RI/FS process for the remainder of the Site has not yet been initiated, to determine what remediation planplans will be implemented and the costs of such plan;plans; (ii) the total amount of material sent to the Site, and the total number of potentially responsible parties who may or may not agree to fund or perform any remediation, hashave not yet been determined; (iii) the share contribution for potentially responsible parties to any remediation has not been determined; and (iv) the number of years required to complete the RI/FS and implement a remediation plan acceptable to USEPA is uncertain.
Asbestos Litigation
The Company is defending approximately 300400 lawsuits in different jurisdictions, alleging injury or death as a result of exposure to asbestos. The complaints in these cases typically name a large number of defendants and do not identify any particular Company products as a source of asbestos exposure. To date, discovery has failed to yield evidence of substantial exposure to any Company products and no0 judgments have been entered against the Company.
Other Litigation
Other lawsuits and proceedings or claims, arising from the ordinary course of operations, are also pending or threatened against the Company.
(17)(16) Financial Instruments
Fair Value
The carrying amounts of cash and cash equivalents, trade receivables and trade payablespayable approximate fair value because of the short maturity of these financial instruments.
The fair value of the Company’s 5.05% senior notes due 2020 is based on quoted market prices of similar notes (level 2). The fair value of the Company’s borrowings outstandingvariable rate debt under the New Revolving Credit Agreement, and the Company’s variable rate debtFacility approximates its carrying value. The carrying amount and the estimated fair market value of the Company’s long-term debt, including the current portion, are as follows:
| | | | | | |
| | December 31, |
| | 2018 | | 2017 |
| | (in millions) |
Carrying amount | | $ | 355.0 | | $ | 499.5 |
Estimated fair value | | $ | 355.4 | | $ | 501.1 |
Financial Instruments
The Company measures certain financial assets and liabilities at fair value on a recurring basis, including deferred compensation plan assets and related liabilities, redeemable financial instruments, and derivatives. The fair values of
these certain financial assets and liabilities were determined using the following inputs at December 31, 20182021 and December 31, 2017:2020:
| | | | | | | | | | | | |
| | Fair Value Measurement at December 31, 2021 Using: |
| | | | | Quoted Prices in Active | | Significant Other | | Significant |
| | | | | Markets for Identical | | Observable | | Unobservable |
| | | | | Assets | | Inputs | | Inputs |
| | Total | | (Level 1) | | (Level 2) | | (Level 3) |
|
| | (in millions) |
Assets | | | | | | | | | | | | |
Plan asset for deferred compensation(1) | | $ | 2.6 | | $ | 2.6 | | $ | — | | $ | — |
Interest rate swap(1) | | $ | 1.4 | | $ | — | | $ | 1.4 | | $ | — |
Total assets | | $ | 4.0 | | $ | 2.6 | | $ | 1.4 | | $ | — |
Liabilities | | | | | | | | | | | | |
Interest rate swap(3) | | $ | 0.6 | | $ | — | | $ | 0.6 | | $ | — |
Plan liability for deferred compensation(2) | | $ | 2.6 | | $ | 2.6 | | $ | — | | $ | — |
Contingent consideration(4) | | $ | 6.3 | | $ | — | | $ | — | | $ | 6.3 |
Total liabilities | | $ | 9.5 | | $ | 2.6 | | $ | 0.6 | | $ | 6.3 |
| | | | | | | | | | | | |
| | Fair Value Measurements at December 31, 2020 Using: |
| | | | | Quoted Prices in Active | | Significant Other | | Significant |
| | | | | Markets for Identical | | Observable | | Unobservable |
| | | | | Assets | | Inputs | | Inputs |
| | Total | | (Level 1) | | (Level 2) | | (Level 3) |
|
| | (in millions) |
Assets | | | | | | | | | | | | |
Plan asset for deferred compensation(1) | | $ | 2.5 | | $ | 2.5 | | $ | — | | $ | — |
Total assets | | $ | 2.5 | | $ | 2.5 | | $ | — | | $ | — |
Liabilities | | | | | | | | | | | | |
Interest rate swaps(3) | | $ | 0.6 | | $ | — | | $ | 0.6 | | $ | — |
Plan liability for deferred compensation(2) | | $ | 2.5 | | $ | 2.5 | | $ | — | | $ | — |
Designated foreign currency hedge(3) | | $ | 0.1 | | $ | — | | $ | 0.1 | | $ | — |
Contingent consideration(4) | | $ | 3.2 | | $ | — | | $ | — | | $ | 3.2 |
Total liabilities | | $ | 6.4 | | $ | 2.5 | | $ | 0.7 | | $ | 3.2 |
| | | | | | | | | | | | |
| | Fair Value Measurement at December 31, 2018 Using: |
| | | | | Quoted Prices in Active | | Significant Other | | Significant |
| | | | | Markets for Identical | | Observable | | Unobservable |
| | | | | Assets | | Inputs | | Inputs |
| | Total | | (Level 1) | | (Level 2) | | (Level 3) |
| | (in millions) |
Assets | | | | | | | | | | | | |
Plan asset for deferred compensation(1) | | $ | 2.6 | | $ | 2.6 | | $ | — | | $ | — |
Interest rate swaps (1) | | $ | 6.5 | | $ | — | | $ | 6.5 | | $ | — |
Total assets | | $ | 9.1 | | $ | 2.6 | | $ | 6.5 | | $ | — |
Liabilities | | | | | | | | | | | | |
Plan liability for deferred compensation(2) | | $ | 2.6 | | $ | 2.6 | | $ | — | | $ | — |
Redeemable financial instrument(3) | | $ | 2.8 | | $ | — | | $ | — | | $ | 2.8 |
Total liabilities | | $ | 5.4 | | $ | 2.6 | | $ | — | | $ | 2.8 |
| | | | | | | | | | | | |
| | Fair Value Measurements at December 31, 2017 Using: |
| | | | | Quoted Prices in Active | | Significant Other | | Significant |
| | | | | Markets for Identical | | Observable | | Unobservable |
| | | | | Assets | | Inputs | | Inputs |
| | Total | | (Level 1) | | (Level 2) | | (Level 3) |
| | (in millions) |
Assets | | | | | | | | | | | | |
Plan asset for deferred compensation(1) | | $ | 3.2 | | $ | 3.2 | | $ | — | | $ | — |
Interest rate swaps (1) | | $ | 5.6 | | $ | — | | $ | 5.6 | | $ | — |
Total assets | | $ | 8.8 | | $ | 3.2 | | $ | 5.6 | | $ | — |
Liabilities | | | | | | | | | | | | |
Plan liability for deferred compensation(2) | | $ | 3.2 | | $ | 3.2 | | $ | — | | $ | — |
Redeemable financial instrument(3) | | | 2.9 | | | — | | | — | | | 2.9 |
Total liabilities | | $ | 6.1 | | $ | 3.2 | | $ | — | | $ | 2.9 |
| (1) | (1)
| | Included on the Company’s consolidated balance sheet in other assets (other, net). |
| (2) | (2)
| | Included on the Company’s consolidated balance sheet in accrued compensation and benefits. |
| (3) | (3)
| | Included on the Company’s consolidated balance sheet in accrued expenses and other currentliabilities. |
| (4) | As of December 31, 2021, $3.8 million classified in accrued expenses and other liabilities andon the Company’s consolidated balance sheet, relates to a mandatorily redeemable equity instrumentcontingent consideration as part of the Apex acquisition of Australian Valve Group Pty Ltd (“AVG”) and $2.5 million classified in 2015.other noncurrent liabilities relates to contingent consideration as part of the acquisition of Sentinel Hydrosolutions, LLC (“Sentinel”). The balance as of December 31, 2020 of $3.2 million related to the estimated contingent consideration as part of the acquisition of AVG and was classified on the Company’s consolidated balance sheet in other noncurrent liabilities. |
The table below provides a summary of the changes in fair value of all financial assets and liabilities measured at fair value on a recurring basis using significant unobservable inputs (Level 3) for the period December 31, 20172020 to
December 31, 2018.2021.
| | | | | | | | | | | | | | | | | | |
| | | | | | | | | | | Total realized and unrealized | | | |
| | Balance | | | | | | | (gains) losses included in: | | Balance |
| | December 31, | | | | | | | Net earnings | | Comprehensive | | December 31, |
| | 2017 | | Settlements | | Purchases | | adjustments | | income | | 2018 |
| | (in millions) |
Redeemable financial instrument | | $ | 2.9 | | | — | | $ | — | | | — | | $ | (0.1) | | $ | 2.8 |
| | | | | | | | | | | | | | | | | | |
| | | | | | | | | | | Total realized and unrealized | | | |
| | Balance | | | | | | | (gains) losses included in: | | Balance |
| | December 31, | | | | | | | Net earnings | | Comprehensive | | December 31, |
| | 2020 | | Settlements | | Purchases | | adjustments | | income | | 2021 |
|
| | (in millions) |
Contingent consideration | | $ | 3.2 | | | — | | $ | 2.5 | | | 0.8 | | $ | (0.2) | | $ | 6.3 |
On November 30, 2015,AVG completed during the Company acquired 80%third quarter of 2020 and Sentinel completed during the outstanding sharesfourth quarter of Apex Valves Limited (“Apex”). The aggregate purchase price was approximately $20.42021, contingent liabilities of $2.8 million and the Company recorded a long-term liability of $5.5$2.5 million, respectively, were recognized as the estimate of the acquisition date fair value onof the contractual call option to purchasecontingent consideration. The AVG contingent liability as December 31, 2021 was $3.8 million after increasing the remaining 20% within three years of closing. The Company acquired an additional 10% ownership inliability by $0.8 million during the firstsecond quarter of 2017 for approximately $2.9 million and now owns 90%2021, due to increased probability of Apex outstanding shares. The remaining liability isachieving higher performance metrics. These liabilities were classified as Level 3 under the fair value hierarchy as it iswas based on the commitment to purchaseprobability of achievement of future performance metrics as of the remaining 10%date of Apex shares within the next year,acquisition, which iswas not observable in the market. On November 30, 2018,Failure to meet the Company executed an agreementperformance metrics would reduce these liabilities to extend0; while complete achievement would increase the exerciseliability to a maximum contingent consideration of the contractual call option into the first quarter of 2019.million 4.4 million for AVG and $4.5 million for Sentinel.
Cash equivalents consist of instruments with remaining maturities of three months or less at the date of purchase and consist primarily of money market funds, for which the carrying amount is a reasonable estimate of fair value.
The Company uses financial instruments from time to time to enhance its ability to manage risk, including foreign currency and commodity pricing exposures, which exist as part of its ongoing business operations. The use of derivatives exposes the Company to counterparty credit risk for nonperformance and to market risk related to changes in currency exchange rates and commodity prices. The Company manages its exposure to counterparty credit risk through diversification of counterparties. The Company’s counterparties in derivative transactions are substantial commercial banks with significant experience using such derivative instruments. The impact of market risk on the fair value and cash flows of the Company’s derivative instruments is monitored and the Company restricts the use of derivative financial instruments to hedging activities. The Company does not enter into contracts for trading purposes nor does the Company enter into any contracts for speculative purposes. The use of derivative instruments is approved by senior management under written guidelines.
Interest Rate Swaps
In order to manage the Company’s exposure to changes in cash flows attributable to fluctuations in LIBOR-indexed interest payments related to the Company’s floating rate debt under the New Revolving Credit Facility, see Note 11 of Notes to Consolidated Financial Statements in this Annual Report Form 10-K, the Company entered into an interest rate swap on March 30, 2021. Under the interest rate swap agreement, the Company receives the one-month USD-LIBOR subject to a 0.00% floor and pays a fixed rate of 1.02975% on a notional amount of $100.0 million. The swap matures on March 30, 2026. The Company formally documents the hedge relationships at hedge inception to ensure that its interest rate swap qualifies for hedge accounting. On a quarterly basis, the Company assesses whether the interest rate swap is highly effective in offsetting changes in the cash flow of the hedged item. The Company does not hold or issue interest rate swaps for trading purposes. The swap is designated as a cash flow hedge. For the year ended December 31, 2021, a gain of $0.7 million was recorded in Accumulated Other Comprehensive Loss to recognize the effective portion of the fair value of the interest rate swap that qualifies as a cash flow hedge.
On February 12, 2016, the Company entered into the Prior Credit Agreement pursuant to which it received a funding commitment under a Term Loan of $300 million, and a Revolving Commitment (“Revolver”) of $500 million. For each facility, under the Credit Agreement, the Company cancould choose either an Adjusted LIBOR or Alternative Base Rate (“ABR”). Upon intended election of Adjusted LIBOR as the interest rate, the Term Loan has quarterly interest payments that began in May 2016, quarterly principal repayments that commenced on March 31, 2017, with a balloon payment of principal on maturity date. The Revolving Credit Facility has quarterly interest payments.
Accordingly, the Company’s earnings and cash flows arewere exposed to interest rate risk from changes in Adjusted LIBOR. In order to manage the Company’s exposure to changes in cash flows attributable to fluctuations in LIBOR-indexed interest payments related to the Company’s floating rate debt, the Company entered into two2 interest rate swaps. For each interest rate swap, the Company receivesreceived the three-month USD-LIBOR subject to a 0%0.00% floor and payspaid a fixed rate of 1.31375% on a notional amount of $225.0 million. The swaps were expected to mature on the same date as the Prior Credit Agreement on February 12, 2021.2021, and were designated as cash flow hedges. On April 24, 2020, the Company
entered into the Amended Credit Agreement. The Company formally documentsAmended Credit Agreement amended and restated the hedge relationships at hedge inceptionPrior Credit Agreement in its entirety. As part of the Amended Credit Agreement, the LIBOR rate was subject to ensure that its interest rate swaps qualify for hedge accounting. On a quarterly basis,1.00% floor as opposed to a 0.00% floor in the Company assesses whetherPrior Credit Agreement. The change in the LIBOR floor in the Amended Credit Agreement caused the interest rate swaps areto no longer be considered highly effective in offsetting changes in the cash flow of the hedged item, as critical terms of the Amended Credit Agreement no longer matched the hedged item. As a result, the cash flow hedges no longer qualified for hedge accounting as of the date of execution of the Amended Credit Agreement. The Company does not hold or issue interest ratesubsequently began recognizing the mark-to-market fair value adjustments on a monthly basis in the consolidated statement of operations and continued to do so through the expiration date of the swaps, for trading purposes. The swaps are designated as cash flow hedges.which occurred on February 12, 2021. For the yearsfirst quarter ended December 31, 2018 and 2017, a net of tax gain of $0.7 million and $0.6 million, respectively,March 28, 2021, an immaterial amount was recorded into interest expense related to the change in Accumulated Other Comprehensive Income to recognize the effective portion of themark-to-market fair value of interest rate swaps that qualify as a cash flow hedge.adjustments.
Designated Foreign Currency Hedges
The Company’s foreign subsidiaries transact most business, including certain intercompany transactions, in foreign currencies. Such transactions are principally purchases or sales of materials. The Company has exposure to a number of foreign currencies, including the Canadian Dollar,dollar, the euro, and the Chinese Yuan. Beginning in the first quarter of 2018, theyuan. The Company has useduses a layering methodology, whereby at the end of each quarter, the Company enters into forward exchange contracts hedging Canadian dollar to U.S. dollar, which hedge approximately 70%up to 85% of the forecasted intercompany purchase transactions between one of the Company’s Canadian subsidiaries and the Company’s U.S. operating subsidiaries for the next twelve months. The Company uses a similar layering methodology when entering into forward exchange contracts hedging U.S. dollar to the Chinese yuan, which hedge up to 60% of the forecasted intercompany sales transactions between one of the Company’s Chinese subsidiaries and one of the Company’s U.S. operating subsidiaries for the next twelve months. As of December 31, 2018,2021, all designated foreign exchange hedge contracts were cash flow hedges under ASC 815, Derivatives and Hedging ("ASC 815"). The Company records the effective portion of the designated foreign currency hedge contracts in other comprehensive income until inventory turns and is sold to a third-party. Once the third-party transaction associated with the hedged forecasted transaction occurs, the effective portion of any related gain or loss on the designated foreign currency hedge will beare reclassified into earnings.earnings within cost of goods sold. In the event the notional amount of the derivatives exceeds the forecasted intercompany purchases for a given month, the excess hedge position will be attributed to the following month’s forecasted purchases. However, if the following month’s forecasted purchases cannot absorb the excess hedge
position from the current month, the effective portion of the hedge recorded in other comprehensive income will be reclassified to earnings.
The notional amounts outstanding as of December 31, 2021 for the Canadian dollar to U.S. dollar contracts and the U.S. dollar to the Chinese yuan contracts were $15.1 million and $0.6 million, respectively. The combined fair value of the Company’s designated foreign currency hedge contracts outstanding as of December 31, 20182021 was $0.3a liability balance of less than $0.1 million. For the year ended As of December 31, 2018,2021, the amount expected to be reclassified into earningscost of goods sold from other comprehensive income in the next twelve months for both programs is not material to the financial statements.a gain of less than $0.1 million.
Non-Designated Cash Flow Hedge
The Company’s foreign subsidiaries transact most business, including certain intercompany transactions, in foreign currencies. Such transactions are principally purchases or sales of materials and are denominated in European currencies or the U.S. or Canadian dollar. The Company uses foreign currency forward exchange contracts from time to time to manage the risk related to intercompany loans, intercompany purchases that occur during the course of a year, and certain open foreign currency denominated commitments to sell products to third parties. The Company entered into one forward contract in the fourth quarter of 2016 and one forward contract in the first quarter of 2017 to manage the foreign currency rate exposure in 2016 and 2017. These forward contracts were entered into to manage the foreign currency rate exposure between the Hong Kong Dollar and the euro regarding two intercompany loans. These forward contracts were marked-to-market with changes in the fair value recorded to earnings. The Company recognized a loss of $2.9 million related to forward exchange contracts in 2017. These forward contracts were not renewed in September 2017 as the intercompany loans for which the Company was hedging the foreign currency rate exposure were settled.
Leases
The Company leases certain manufacturing facilities, sales offices, warehouses, automobiles, and equipment. Generally, the leases carry renewal provisions and require the Company to pay maintenance costs. Future minimum lease payments under capital leases and non‑cancelable operating leases as of December 31, 2018 are as follows:
| | | | | | |
| | Capital Leases | | Operating Leases |
| | (in millions) |
2019 | | $ | 1.8 | | $ | 10.7 |
2020 | | | 1.6 | | | 8.7 |
2021 | | | 0.7 | | | 5.6 |
2022 | | | 0.3 | | | 3.4 |
2023 | | | 0.1 | | | 2.4 |
Thereafter | | | — | | | 4.9 |
Total | | $ | 4.5 | | $ | 35.7 |
Less amount representing interest (at rates ranging from 1.8% to 5.9%) | | | 0.2 | | | |
Present value of net minimum capital lease payments | | | 4.3 | | | |
Less current installments of obligations under capital leases | | | 1.6 | | | |
Obligations under capital leases, excluding current installments | | $ | 2.7 | | | |
Carrying amounts of assets under capital lease include:
| | | | | | |
| | | December 31, |
| | | 2018 | | 2017 |
| | | (in millions) |
Buildings | | $ | 14.6 | | $ | 15.3 |
Machinery and equipment | | | 3.6 | | | 1.7 |
| | | 18.2 | | | 17.0 |
Less accumulated depreciation | | | (7.8) | | | (6.8) |
| | $ | 10.4 | | $ | 10.2 |
(18)(17) Segment Information
The Company operates in three3 geographic segments: Americas, Europe, and APMEA. Each of these segments sells similar products and has separate financial results that are reviewed by the Company’s chief operating decision‑maker.decision-maker. Each segment earns revenue and income almost exclusively from the sale of the Company’s products. The Company
sells its products into various end markets around the world with sales by region based upon location of the entity recording the sale. See Note 4 for further detail on the product lines sold into by region. All intercompany sales transactions have been eliminated. The accounting policies for each segment are the same as those described in Note 2 of the Notes to Consolidated Financial Statements in the Company’s Annual Report on Form 10-K for the year ended December 31, 2018. Statements.
The following is a summary of the Company’s significant accounts and balances by segment, reconciled to its consolidated totals:
| | | | | | | | | |
| | Year Ended December 31, |
| | 2021 | | 2020 | | 2019 |
|
| | (in millions) |
Net sales | | | | | | | | | |
Americas | | $ | 1,207.2 | | $ | 1,025.7 | | $ | 1,084.1 |
Europe | | | 517.4 | | | 424.9 | | | 451.0 |
APMEA | | | 84.6 | | | 58.0 | | | 65.4 |
Consolidated net sales | | $ | 1,809.2 | | $ | 1,508.6 | | $ | 1,600.5 |
Operating income (loss) | | | | | | | | | |
Americas | | $ | 211.0 | | $ | 166.3 | | $ | 187.4 |
Europe | | | 63.6 | | | 50.2 | | | 49.9 |
APMEA | | | 14.4 | | | 3.5 | | | 6.9 |
Subtotal reportable segments | | | 289.0 | | | 220.0 | | | 244.2 |
Corporate(*) | | | (49.4) | | | (38.9) | | | (47.1) |
Consolidated operating income | | | 239.6 | | | 181.1 | | | 197.1 |
Interest income | | | — | | | (0.2) | | | (0.4) |
Interest expense | | | 6.3 | | | 13.3 | | | 14.1 |
Other (income) expense, net | | | (0.8) | | | 1.0 | | | (0.5) |
Income before income taxes | | $ | 234.1 | | $ | 167.0 | | $ | 183.9 |
Capital expenditures | | | | | | | | | |
Americas | | $ | 17.6 | | $ | 31.2 | | $ | 18.3 |
Europe | | | 8.5 | | | 11.4 | | | 10.3 |
APMEA | | | 0.6 | | | 1.2 | | | 0.6 |
Consolidated capital expenditures | | $ | 26.7 | | $ | 43.8 | | $ | 29.2 |
Depreciation and amortization | | | | | | | | | |
Americas | | $ | 29.8 | | $ | 29.7 | | $ | 29.3 |
Europe | | | 12.6 | | | 14.3 | | | 14.6 |
APMEA | | | 2.7 | | | 2.5 | | | 2.7 |
Consolidated depreciation and amortization | | $ | 45.1 | | $ | 46.5 | | $ | 46.6 |
Identifiable assets (at end of period) | | | | | | | | | |
Americas | | $ | 1,133.5 | | $ | 1,075.1 | | $ | 1,102.9 |
Europe | | | 584.8 | | | 537.2 | | | 515.2 |
APMEA | | | 137.3 | | | 125.9 | | | 105.0 |
Consolidated identifiable assets | | $ | 1,855.6 | | $ | 1,738.2 | | $ | 1,723.1 |
Property, plant and equipment, net (at end of period) | | | | | | | | | |
Americas | | $ | 121.3 | | $ | 122.9 | | $ | 116.7 |
Europe | | | 74.5 | | | 83.8 | | | 77.5 |
APMEA | | | 4.9 | | | 5.6 | | | 5.8 |
Consolidated property, plant and equipment, net | | $ | 200.7 | | $ | 212.3 | | $ | 200.0 |
| | | | | | | | | |
| | Year Ended December 31, |
| | 2018 | | 2017 | | 2016 |
| | (in millions) |
Net Sales | | | | | | | | | |
Americas | | $ | 1,032.1 | | $ | 951.9 | | $ | 900.9 |
Europe | | | 467.0 | | | 440.3 | | | 431.3 |
APMEA | | | 65.8 | | | 64.5 | | | 66.2 |
Consolidated net sales | | $ | 1,564.9 | | $ | 1,456.7 | | $ | 1,398.4 |
Operating income | | | | | | | | | |
Americas | | $ | 171.1 | | $ | 146.8 | | $ | 127.1 |
Europe | | | 49.8 | | | 47.6 | | | 40.0 |
APMEA | | | 7.2 | | | 4.7 | | | 15.1 |
Subtotal reportable segments | | | 228.1 | | | 199.1 | | | 182.2 |
Corporate(*) | | | (39.7) | | | (36.8) | | | (37.2) |
Consolidated operating income | | | 188.4 | | | 162.3 | | | 145.0 |
Interest income | | | (0.8) | | | (1.0) | | | (1.0) |
Interest expense | | | 16.3 | | | 19.1 | | | 22.6 |
Other (income) expense, net | | | (1.7) | | | 1.1 | | | (4.4) |
Income before income taxes | | $ | 174.6 | | $ | 143.1 | | $ | 127.8 |
Capital Expenditures | | | | | | | | | |
Americas | | $ | 21.5 | | $ | 20.7 | | $ | 25.7 |
Europe | | | 12.7 | | | 8.0 | | | 8.9 |
APMEA | | | 1.7 | | | 0.7 | | | 1.4 |
Consolidated capital expenditures | | $ | 35.9 | | $ | 29.4 | | $ | 36.0 |
Depreciation and Amortization | | | | | | | | | |
Americas | | $ | 29.1 | | $ | 30.8 | | $ | 28.8 |
Europe | | | 16.7 | | | 18.6 | | | 19.3 |
APMEA | | | 2.7 | | | 2.8 | | | 3.1 |
Consolidated depreciation and amortization | | $ | 48.5 | | $ | 52.2 | | $ | 51.2 |
Identifiable assets (at end of period) | | | | | | | | | |
Americas | | $ | 1,028.1 | | $ | 1,069.2 | | $ | 1,054.7 |
Europe | | | 510.2 | | | 524.0 | | | 577.3 |
APMEA | | | 115.4 | | | 143.3 | | | 131.2 |
Consolidated identifiable assets | | $ | 1,653.7 | | $ | 1,736.5 | | $ | 1,763.2 |
Property, plant and equipment, net (at end of year) | | | | | | | | | |
Americas | | $ | 115.0 | | $ | 109.3 | | $ | 106.2 |
Europe | | | 80.0 | | | 82.1 | | | 75.6 |
APMEA | | | 6.9 | | | 7.1 | | | 7.9 |
Consolidated property, plant and equipment, net | | $ | 201.9 | | $ | 198.5 | | $ | 189.7 |
* Corporate expenses are primarily for administrative compensation expense, compliance costs, professional fees, including corporate-related legal and audit expenses, shareholder services and benefit administration costs.
** Included in APMEA’s operating income for 2016 is $8.7 million gain related to the sale of an operating subsidiary in China. Refer to Note 5 “Sale of Business” for further discussion.
The following includes U.S. net sales and U.S. property, plant and equipment of the Company’s Americas segment:
| | | | | | | | | |
| | |
| | December 31, |
| | 2021 | | 2020 | | 2019 |
|
| | (in millions) |
U.S. net sales | | $ | 1,123.9 | | $ | 956.5 | | $ | 1,014.0 |
U.S. property, plant and equipment, net (at end of year) | | $ | 116.2 | | $ | 118.9 | | $ | 112.6 |
| | | | | | | | | |
| | December 31, |
| | 2018 | | 2017 | | 2016 |
| | (in millions) |
U.S. net sales | | $ | 964.2 | | $ | 886.2 | | $ | 839.2 |
U.S. property, plant and equipment, net (at end of year) | | $ | 111.0 | | $ | 105.1 | | $ | 102.5 |
The following includes intersegment sales for Americas, Europe and APMEA:
| | | | | | | | | | |
| | | December 31, |
| | | 2021 | | 2020 | | 2019 |
| | | | | | | | | | |
| | December 31, | |
| | 2018 | | 2017 | | 2016 | |
| | (in millions) | |
| | | (in millions) |
Intersegment Sales | | | | | | | | | | | | | | | | | | |
Americas | | $ | 12.7 | | $ | 12.1 | | $ | 12.0 | | $ | 9.3 | | $ | 8.7 | | $ | 12.1 |
Europe | | | 14.2 | | | 14.6 | | | 12.3 | | | 29.1 | | | 18.9 | | | 15.2 |
APMEA | | | 88.4 | | | 69.7 | | | 76.7 | | | 120.5 | | | 71.4 | | | 67.7 |
Intersegment sales | | $ | 115.3 | | $ | 96.4 | | $ | 101.0 | | $ | 158.9 | | $ | 99.0 | | $ | 95.0 |
(19)(18) Accumulated Other Comprehensive Loss
Accumulated other comprehensive loss consists of the following:
| | | | | | | | | |
| | | | | | | | Accumulated |
| | Foreign | | | | | Other |
| | Currency | | | Cash Flow | | Comprehensive |
| | Translation | | | Hedges (1) | | Loss |
| | (in millions) |
| | | | | | | | | |
Balance December 31, 2017 | | $ | (102.6) | | $ | 3.5 | | $ | (99.1) |
Change in period | | | 9.7 | | | 2.8 | | | 12.5 |
Balance April 1, 2018 | | $ | (92.9) | | $ | 6.3 | | $ | (86.6) |
Change in period | | | (26.6) | | | 1.0 | | | (25.6) |
Balance July 1, 2018 | | $ | (119.5) | | $ | 7.3 | | $ | (112.2) |
Change in period | | | 2.5 | | | (0.1) | | | 2.4 |
Balance September 30, 2018 | | $ | (117.0) | | $ | 7.2 | | $ | (109.8) |
Change in period | | | (9.3) | | | (2.0) | | | (11.3) |
Balance December 31, 2018 | | $ | (126.3) | | $ | 5.2 | | $ | (121.1) |
| | | | | | | | | |
Balance December 31, 2016 | | $ | (153.7) | | $ | 2.9 | | $ | (150.8) |
Change in period | | | 7.9 | | | 0.1 | | | 8.0 |
Balance April 02, 2017 | | $ | (145.8) | | $ | 3.0 | | $ | (142.8) |
Change in period | | | 21.5 | | | (0.7) | | | 20.8 |
Balance July 02, 2017 | | $ | (124.3) | | $ | 2.3 | | $ | (122.0) |
Change in period | | | 15.4 | | | 0.1 | | | 15.5 |
Balance October 01, 2017 | | $ | (108.9) | | $ | 2.4 | | $ | (106.5) |
Change in period | | | 6.3 | | | 1.1 | | | 7.4 |
Balance December 31, 2017 | | $ | (102.6) | | $ | 3.5 | | $ | (99.1) |
| | | | | | | | | |
| | | | | | | | Accumulated |
| | Foreign | | | | | Other |
| | Currency | | | Cash Flow | | Comprehensive |
| | Translation | | | Hedges (1) | | Loss |
|
| | (in millions) |
| | | | | | | | | |
Balance December 31, 2019 | | $ | (131.3) | | $ | 0.5 | | $ | (130.8) |
Change in period | | | 31.4 | | | (0.6) | | | 30.8 |
Balance December 31, 2020 | | $ | (99.9) | | $ | (0.1) | | $ | (100.0) |
Change in period | | | (28.0) | | | 0.7 | | | (27.3) |
Balance December 31, 2021 | | $ | (127.9) | | $ | 0.6 | | $ | (127.3) |
| | | | | | | | | |
| | |
(1) | | Cash flow hedges include interest rate swaps and designated foreign currency hedges. See Note 1716 for further details. |
(20) Quarterly Financial Information (unaudited)
| | | | | | | | | | | | |
| | First | | Second | | Third | | Fourth |
| | Quarter | | Quarter | | Quarter | | Quarter |
| | (in millions, except per share information) |
Year ended December 31, 2018 | | | | | | | | | | | | |
Net sales | | $ | 378.5 | | $ | 407.9 | | $ | 390.9 | | $ | 387.6 |
Gross profit | | | 156.7 | | | 169.4 | | | 164.5 | | | 165.9 |
Net income | | | 28.2 | | | 36.0 | | | 31.5 | | | 32.3 |
Per common share: | | | | | | | | | | | | |
Basic | | | | | | | | | | | | |
Net income | | | 0.82 | | | 1.05 | | | 0.92 | | | 0.94 |
Diluted | | | | | | | | | | | | |
Net income | | | 0.82 | | | 1.05 | | | 0.92 | | | 0.94 |
Dividends declared per common share | | | 0.19 | | | 0.21 | | | 0.21 | | | 0.21 |
Year ended December 31, 2017 | | | | | | | | | | | | |
Net sales | | $ | 347.2 | | $ | 378.5 | | $ | 364.7 | | $ | 366.3 |
Gross profit | | | 143.8 | | | 156.7 | | | 152.7 | | | 149.2 |
Net income (loss) | | | 21.7 | | | 27.2 | | | 26.5 | | | (2.3) |
Per common share: | | | | | | | | | | | | |
Basic | | | | | | | | | | | | |
Net income (loss) | | | 0.63 | | | 0.79 | | | 0.77 | | | (0.07) |
Diluted | | | | | | | | | | | | |
Net income (loss) | | | 0.63 | | | 0.79 | | | 0.77 | | | (0.07) |
Dividends declared per common share | | | 0.18 | | | 0.19 | | | 0.19 | | | 0.19 |
Note: Four quarters may not sum to full year due to rounding.
(21)(19) Subsequent Events
On February 6, 2019,7, 2022, the Company declared a quarterly dividend of twenty-oneNaN cents ($0.21)0.26) per share on each outstanding share of Class A common stock and Class B common stock payable on March 15, 20192022 to stockholders of record on March 1, 2019.2022.
On February 6, 2019, the Board of Directors authorized a stock repurchase program of up to $150 million of the Company’s Class A common stock to be purchased from time to time on the open market or in privately negotiated transactions. The timing and number of shares repurchased will be determined by the Company’s management based on its evaluation of market conditions and other factors.
Watts Water Technologies, Inc. and Subsidiaries
Schedule II—Valuation and Qualifying Accounts
(Amounts in millions)
| | | | | | | | | | | | | |
| | Balance At | | Additions | | Foreign | | | | Balance At |
| | Beginning of | | Charged To | | Exchange | | | | End of |
| | Period | | Expense | | Impact | | Deductions | | Period |
Year Ended December 31, 2016 | | | | | | | | | | | | | |
Allowance for doubtful accounts | | $ | 10.1 | | $ | 5.5 | | 0.5 | | (1.9) | | $ | 14.2 |
Reserve for excess and obsolete inventories | | $ | 29.1 | | $ | 7.0 | | 0.6 | | (10.6) | | $ | 26.1 |
Year Ended December 31, 2017 | | | | | | | | | | | | | |
Allowance for doubtful accounts | | $ | 14.2 | | $ | 3.7 | | 0.4 | | (4.0) | | $ | 14.3 |
Reserve for excess and obsolete inventories | | $ | 26.1 | | $ | 7.3 | | 1.5 | | (9.5) | | $ | 25.4 |
Year Ended December 31, 2018 | | | | | | | | | | | | | |
Allowance for doubtful accounts | | $ | 14.3 | | $ | 3.3 | | (0.2) | | (2.4) | | $ | 15.0 |
Reserve for excess and obsolete inventories | | $ | 25.4 | | $ | 7.7 | | (0.7) | | (8.0) | | $ | 24.4 |
| | | | | | | | | | | | | |
| | Balance At | | Additions | | Foreign | | | | Balance At |
| | Beginning of | | Charged To | | Exchange/Acquisitions | | | | End of |
| | Period | | Expense | | Impact | | Deductions | | Period |
Year Ended December 31, 2019 | | | | | | | | | | | | | |
Accounts Receivable Reserve Allowances | | $ | 15.0 | | $ | 2.2 | | — | | (2.9) | | $ | 14.3 |
Reserve for excess and obsolete inventories | | $ | 24.4 | | $ | 6.6 | | (0.1) | | (5.9) | | $ | 25.0 |
Year Ended December 31, 2020 | | | | | | | | | | | | | |
Accounts Receivable Reserve Allowances | | $ | 14.3 | | $ | 1.1 | | 0.9 | | (5.2) | | $ | 11.1 |
Reserve for excess and obsolete inventories | | $ | 25.0 | | $ | 13.3 | | 1.4 | | (6.3) | | $ | 33.4 |
Year Ended December 31, 2021 | | | | | | | | | | | | | |
Accounts Receivable Reserve Allowances | | $ | 11.1 | | $ | 3.4 | | (0.2) | | (4.0) | | $ | 10.3 |
Reserve for excess and obsolete inventories | | $ | 33.4 | | $ | 8.7 | | (0.9) | | (8.2) | | $ | 33.0 |
| | Exhibit No. |
| Description |
|---|
3.1 | | | Exhibit No.
| | Description
| 3.1 | | Restated Certificate of Incorporation, as amended. Incorporated by reference to the Registrant’s Quarterly Report on Form 10‑Q10-Q for the quarter ended July 3, 2005June 30, 2019 (File No. 001‑001- 11499). | 3.2 | | Amended and Restated By‑By-Laws. Incorporated by reference to the Registrant’s Current Report on Form 8‑K8-K dated July 27, 2015November 1, 2021 (File No. 001‑11499)001-11499). | 9.14† | | Description of the Registrant’s Class A Common Stock. | 9.1 | | The Amended and Restated George B. Horne Voting Trust Agreement—1997 dated as of September 14, 1999. Incorporated by reference to the Registrant’s Annual Report on Form 10‑K10-K for year ended June 30, 1999 (File No. 001‑11499)001-11499). | 10.1* | | Supplemental Compensation Agreement effective as of September 1, 1996 between the Registrant and Timothy P. Horne. Incorporated by reference to the Registrant’s Annual Report on Form 10‑K10-K for year ended June 30, 1996 (File No. 001‑11499)001-11499). | 10.2* | | Amendment No. 1, dated July 25, 2000, to Supplemental Compensation Agreement effective as of September 1, 1996 between the Registrant and Timothy P. Horne. Incorporated by reference to the Registrant’s Quarterly Report on Form 10‑Q10-Q for quarter ended September 30, 2000 (File No. 001‑001- 11499). | 10.3* | | Amendment No. 2, dated October 23, 2002, to Supplemental Compensation Agreement effective as of September 1, 1996 between the Registrant and Timothy P. Horne. Incorporated by reference to the Registrant’s Annual Report on Form 10‑K10-K for the year ended December 31, 2002 (File No. 001‑001- 11499). | 10.4* | | Amendment No. 3, dated August 18, 2015, to Supplemental Compensation Agreement effective as of September 1, 1996 between the Registrant and Timothy P. Horne. Incorporated by reference to the Registrant’s Current Report on Form 8‑K8-K dated August 18, 2015 (File No. 001‑001- 11499). | 10.5 | | Amended and Restated Stock Restriction Agreement dated October 30, 1991. Incorporated by reference to the Registrant’s Current Report on Form 8‑K8-K dated November 14, 1991 (File No. 001‑11499)001-11499). | 10.6 | | Amendment, dated August 26, 1997, to Amended and Restated Stock Restriction Agreement dated October 30, 1991. Incorporated by reference to the Registrant’s Annual Report on Form 10‑K10-K for year ended June 30, 1997 (File No. 001‑11499)001-11499). | 10.7 | | Registration Rights Agreement dated July 25, 1986. Incorporated by reference to the Registrant’s Form S‑1S-1 (No. 33‑6515)33-6515) as part of the Second Amendment to such Form S‑1S-1 dated August 21, 1986. | 10.8*† | | Form of Indemnification Agreement between the Registrant and certain directors and officers of the Registrant. Incorporated by reference to the Registrant’s Quarterly Report on Form 10‑Q for the quarter ended July 1, 2018 (File No. 001‑ 11499). | 10.9* | | Watts Water Technologies, Inc. Executive Incentive Bonus Plan. Incorporated by reference to the Registrant’s Annual Report on Form 10‑K for year ended December 31, 2015 (File No. 001‑11499). | 10.10*
| | Watts Water Technologies, Inc. Executive Officer Incentive Bonus Plan. Incorporated by reference to the Registrant’s Current Report on Form 8‑K8-K dated February 6, 2019 (File No. 001‑11499)001-11499).
| 10.10* | | Non-Employee Director Compensation Arrangements. Incorporated by reference to the Registrant’s Annual Report on Form 10-K for the year ended December 31, 2018 (File No. 001-11499). | 10.11* | † | | Non‑Employee Director Compensation Arrangements.
| 10.12*
| | Watts Water Technologies, Inc. Management Stock Purchase Plan Amended and Restated as of October 27, 2015. Incorporated by reference to the Registrant’s Current Report on Form 8‑K dated October 26, 2015 (File No. 001‑ 11499).November 1, 2021. | 10.13*10.12*
| | Watts Water Technologies, Inc. Second Amended and Restated 2004 Stock Incentive Plan. Incorporated by reference to the Registrant’s Current Report on Form 8‑K8-K dated May 15, 2013 (File No. 001‑11499)001-11499). | 10.14*10.13*
| | Form of Non‑Qualified Stock Option Agreement under the Watts Water Technologies, Inc. Second Amended and Restated 2004 Stock Incentive Plan. Incorporated by reference to the Registrant’s Quarterly Report on Form 10‑Q for the quarter ended June 30, 2013 (File No. 001‑ 11499).
| 10.15*
| | Form of Restricted Stock Award Agreement for Employees under the Watts Water Technologies, Inc. Second Amended and Restated 2004 Stock Incentive Plan. Incorporated by reference to the Registrant’s Quarterly Report on Form 10‑Q for the quarter ended July 1, 2018 (File No. 001‑11499). |
| | | Exhibit No.
| | Description
| 10.16*
| | Form of 2015 Performance Stock Unit Award Agreement under the Watts Water Technologies, Inc. Second Amended and Restated 2004 Stock Incentive Plan. Incorporated by reference to the Registrant’s Quarterly Report on Form 10‑Q for the quarter ended September 27, 2015 (File No. 001‑11499).
| 10.17*
| | Form of 2016 Performance Stock Unit Award Agreement under the Watts Water Technologies, Inc. Second Amended and Restated 2004 Stock Incentive Plan. Incorporated by reference to the Registrant’s Annual Report on Form 10‑K for the year ended December 31, 2016 (File No. 001‑ 11499).
| 10.18*
| | Form of 2017 Performance Stock Unit Award Agreement under the Watts Water Technologies, Inc. Second Amended and Restated 2004 Stock Incentive Plan. Incorporated by reference to the Registrant’s Quarterly Report on Form 10‑Q for the quarter ended April 2, 2017 (File No. 001‑11499).
| 10.19*
| | Form of 2018 Performance Stock Unit Award Agreement under the Watts Water Technologies, Inc. Second Amended and Restated 2004 Stock Incentive Plan. Incorporated by reference to the Registrant’s Quarterly Report on Form 10‑Q for the quarter ended April 1, 2018 (File No. 001‑11499).
| 10.20*
| | Form of 2014 Non‑Qualified Stock Option Agreement under the Watts Water Technologies, Inc. Second Amended and Restated 2004 Stock Incentive Plan. Incorporated by reference to the Registrant’s Quarterly Report on Form 10‑Q for quarter ended June 29, 2014 (File No. 001‑ 11499).
| 10.21*
| | Watts Water Technologies, Inc. Executive Severance Plan, as amended and restated as of February 8, 2018. Incorporated by reference to the Registrant’s Quarterly Report on Form 10-Q for the quarter ended July 1, 2018 (File No. 001-11499).
| 10.2210.14* | | Form of Deferred Stock Award Agreement under the Watts Water Technologies, Inc. Second Amended and Restated 2004 Stock Incentive Plan. Incorporated by reference to the Registrant’s Quarterly Report on Form 10-Q for the quarter ended March 31, 2019 (File No. 001-11499). |
| | |
|---|
Exhibit No. |
| Description |
|---|
10.15* | | Form of 2019 Performance Stock Unit Award Agreement under the Watts Water Technologies, Inc. Second Amended and Restated 2004 Stock Incentive Plan. Incorporated by reference to the Registrant’s Quarterly Report on Form 10-Q for the quarter ended March 31, 2019 (File No. 001-11499) | 10.16* | | Form of 2020 Performance Stock Unit Award Agreement under the Watts Water Technologies, Inc. Second Amended and Restated 2004 Stock Incentive Plan. Incorporated by reference to the Registrant’s Quarterly Report on Form 10-Q for the quarter ended March 29, 2020 (File No. 001-11499) | 10.17* | | Form of 2021 Performance Stock Unit Award Agreement under the Watts Water Technologies, Inc. Second Amended and Restated 2004 Stock Incentive Plan. Incorporated by reference to the Registrant’s Quarterly Report on Form 10-Q for the quarter ended March 28, 2021 (File No. 001-11499) | 10.18* | † | Watts Water Technologies, Inc. Executive Severance Plan, as amended and restated as of February 8, 2018. | 10.19 | | Amended and Restated Credit Agreement, dated as of February 12, 2016,April 24, 2020, by and among the Registrant, certain subsidiaries of the Registrant asSubsidiary Borrowers JPMorganparty thereto, the Lenders party thereto, JP Morgan Chase Bank, N.A., as Administrative Agent, Swing Line LenderBank of America N.A., Keybank National Association, Wells Fargo Bank, National Association, and L/C IssuerT.D. Bank, N.A., as Co-Syndication Agents, and the other lenders referred to therein.PNC Bank, National Association and U.S. Bank National Association, as Co-Documentation Agents. Incorporated by reference to the Registrant’s Current Report on Form 8‑K8-K dated February 9, 2016April 24, 2020 (File No. 001‑11499)001-11499). | 10.2310.20 | | Amended and Restated Guaranty, dated as of February 12, 2016,April 24, 2020, by the Registrant and the Subsidiaries of the Registrant set forth therein, in favor of JPMorgan Chase Bank N.A. and other lenders referred to therein. Incorporated by reference to the Registrant’s Current Report on Form 8‑K8-K dated February 9, 2016April 24, 2020 (File No. 001‑001 11499). | 10.2410.21 | | Note PurchaseSecond Amended and Restated Credit Agreement, dated as of June 18, 2010, betweenMarch 30, 2021, by and among the Registrant, the Subsidiary Borrowers party thereto, the Lenders party thereto, JP Morgan Chase Bank, N.A., as Administrative Agent, Bank of America N.A., Keybank National Association, Wells Fargo Bank, National Association, and Purchasers named in Schedule A thereto relating to the Registrants $75,000,000 5.05% Senior Notes due June 18, 2020.T.D. Bank, N.A., as Co-Syndication Agents, and PNC Bank, National Association, U.S. Bank National Association, HSBC Bank USA, National Association and HSBC Bank Canada, as Co-Documentation Agents. Incorporated by reference to the Registrant’s Current Report on Form 8‑K8-K dated June 18, 2010March 30, 2021 (File No. 001‑11499)001-11499).
| 10.2510.22 | | Form of 5.05% Senior Note due June 18, 2020. Incorporated by reference to the Registrant’s Current Report on Form 8‑K dated June 18, 2010 (File No. 001‑11499).
| 10.26 | | Form of SubsidiarySecond Amended and Restated Guaranty, in connection with the Registrant’s 5.05% Senior Notes due June 18, 2020, including the form of Joinder to Subsidiary Guaranty. Incorporated by reference to the Registrant’s Current Report on Form 8‑K dated June 18, 2010 (File No. 001‑11499).
| 10.27 | | Facility Agreement dated as of December 16, 2016, among Watts International Holdings Limited, as original borrowerMarch 30, 2021, by the Registrant and original guarantor, Watts Water Technologies EMEA B.V., as original guarantor,the Subsidiaries of the Registrant set forth therein, in favor of JPMorgan Chase Bank N.A., as sole bookrunner and sole lead arranger, J.P. Morgan Europe Limited, as agent to the financial parties, and the other lenders referred to therein. Incorporated by reference to the Registrant’s Current Report on Form 8‑K8-K dated December 16, 2016March 30, 2021 (File No. 001‑11499)001-11499).
| 21†21���
| | Subsidiaries | 23† | | Consent of KPMG LLP, Independent Registered Public Accounting Firm | 31.1† | | Certification of Principal Executive Officer pursuant to Rule 13a‑14(a)13a-14(a) or Rule 15d‑14(a)15d-14(a) of the Securities Exchange Act of 1934, as amended | 31.2† | | Certification of Principal Financial Officer pursuant to Rule 13a‑14(a)13a-14(a) or Rule 15d‑14(a)15d-14(a) of the Securities Exchange Act of 1934, as amended | 32.1†† | | Certification of Principal Executive Officer pursuant to 18 U.S.C. Section 1350 | 32.2†† | | Certification of Principal Financial Officer Pursuant to 18 U.S.C. Section 1350 | 101.INS† | | Inline XBRL Instance Document. |
| | | Exhibit No.
| | Description
| 101.SCH† | | Inline XBRL Taxonomy Extension Schema Document. | 101.CAL† | | Inline XBRL Taxonomy Extension Calculation Linkbase Document. | 101.DEF† | | Inline XBRL Taxonomy Extension Definition Linkbase Document | 101.LAB† | | Inline XBRL Taxonomy Extension Label Linkbase Document. | 101.PRE† | | Inline XBRL Taxonomy Extension Presentation Linkbase Document. |
Exhibit No. |
| Description |
|---|
104 | | Cover Page Interactive Data File (formatted as Inline XBRL and contained in Exhibit 101) |
* | Management contract or compensatory plan or arrangement. |
†Filed herewith. ††Furnished herewith. Attached as Exhibit 101 to this report are the following formatted in Inline XBRL (Extensible Business Reporting Language): (i) Consolidated Statements of Operations for the Years Ended December 31, 2018, 20172021, 2020 and 2016,2019, (ii) Consolidated Statements of Comprehensive (Loss) Income for the Years Ended December 31, 2018, 20172021, 2020 and 2016,2019, (iii) Consolidated Balance Sheets at December 31, 20182021 and December 31, 2017,2020, (iv) Consolidated Statements of Stockholders’ Equity for the Years Ended December 31, 2018, 20172021, 2020 and 2016,2019, (v) Consolidated Statements of Cash Flows for the Years Ended December 31, 2018, 20172021, 2020 and 2016,2019, and (vi) Notes to Consolidated Financial Statements. SIGNATURES SIGNATURES
Pursuant to the requirements of Section 13 or 15(d) of the Securities Exchange Act of 1934, the registrant has duly caused this report to be signed on its behalf by the undersigned, thereunto duly authorized. | | | | WATTS WATER TECHNOLOGIES, INC. | | | | | By: | /s/ Robert J. Pagano, Jr. | | | Robert J. Pagano, Jr. | | | Chief Executive Officer and President |
DATED: February 22, 20192022 Pursuant to the requirements of the Securities Exchange Act of 1934, this report has been signed below by the following persons on behalf of the registrant and in the capacities and on the dates indicated. | | | | | Signature |
| Title |
| Date | Signature
| | Title
| | Date
| | | | | | /s/ ROBERT J. PAGANO, JR. | | Chief Executive Officer, President, Chairperson of the Board and Director | | February 22, 20192022 | Robert J. Pagano, Jr. | | (Principal Executive Officer) | | | | | | | | /s/ SHASHANK PATEL | | Chief Financial Officer | | February 22, 20192022 | Shashank Patel | | (Principal Financial Officer) | | | | | | | | /s/ VIRGINIA A. HALLORAN | | Chief Accounting Officer | | February 22, 20192022 | Virginia A. Halloran | | (Principal Accounting Officer) | | | | | | | | /s/ CHRISTOPHER L. CONWAY | | Director | | February 21, 201914, 2022 | Christopher L. Conway | | | | | | | | | | /s/ MICHAEL J. DUBOSE | | Director | | February 14, 2022 | Michael J. Dubose | | | | | | | | | | /s/ DAVID A. DUNBAR | | Director | | February 18, 201914, 2022 | David A. Dunbar | | | | | | | | | | /s/ LOUISE K. GOESER | | Director | | February 15, 201914, 2022 | Louise K. Goeser | | | | | | | | | | /s/ JES MUNK HANSEN | | Director | | February 19, 201915, 2022 | Jes Munk Hansen | | | | | | | | | | /s/ W. CRAIG KISSEL | | Chairman of the BoardLead Independent Director
| | February 16, 201914, 2022 | W. Craig Kissel | | | | | | | | | | /s/ JOSEPH T. NOONAN | | Director | | February 15, 201914, 2022 | Joseph T. Noonan | | | | | | | | | | /s/ MERILEE RAINES | | Director | | February 20, 201914, 2022 | Merilee Raines | | | | | | | | | | /s/ JOSEPH W. REITMEIER | | Director | | February 15, 201914, 2022 | Joseph W. Reitmeier | | | | |
|
|---|