UNITED STATES
SECURITIES AND EXCHANGE COMMISSION
Washington, D.C. 20549
FORM 10-K10-K/A
(Amendment No. 1)
☑ Annual report pursuant to Section 13 or 15(d) of the Securities Exchange Act of 1934
For the fiscal year ended December 31, 20182020
OR
☐
¨Transition report pursuant to Section 13 or 15(d) of the Securities Exchange Act of 1934
Commission file number 001-13913
WADDELL & REED FINANCIAL, INC.
(Exact name of registrant as specified in its charter)
Delaware | 51-0261715 |
6300 Lamar Avenue
Overland Park, Kansas66202
913-236-2000913-236-2000
(Address, including zip code, and telephone number of Registrant’s principal executive offices)
SECURITIES REGISTERED PURSUANT TO SECTION 12(b) OF THE ACT
Title of each class | Trading Symbol(s) | Name of each exchange on which registered |
Class A Common Stock, $.01 par value | WDR | New York Stock Exchange |
SECURITIES REGISTERED PURSUANT TO SECTION 12(g) OF THE ACT:
None
(Title of class)
Indicate by check mark if the registrant is a well-known seasoned issuer, as defined in Rule 405 of the Securities Act. YES Yes☑ NO No ☐
Indicate by check mark if the registrant is not required to file reports pursuant to Section 13 or Section 15(d) of the Act. YES Yes ☐ NO ☑.No☑.
Indicate by check mark whether the registrant (1) has filed all reports required to be filed by Section 13 or 15(d) of the Securities Exchange Act of 1934 during the preceding 12 months (or for such shorter period that the registrant was required to file such reports), and (2) has been subject to such filing requirements for the past 90 days. Yes☑ No ☐.☐.
Indicate by check mark whether the registrant has submitted electronically every Interactive Data File required to be submitted pursuant to Rule 405 of Regulation S-T (§232.405 of this chapter) during the preceding 12 months (or for such shorter period that the registrant was required to submit such files). Yes☑ No ☐.☐.
Indicate by check mark if disclosure of delinquent filers pursuant to Item 405 of Regulation S-K is not contained herein, and will not be contained, to the best of registrant’s knowledge, in definitive proxy or information statements incorporated by reference in Part III of this Form 10-K or any amendments to this Form 10-K. ☐
Indicate by check mark whether the registrant is a large accelerated filer, an accelerated filer, a non-accelerated filer, smaller reporting company, or an emerging growth company. See the definitions of “large accelerated filer,” “accelerated filer,” “smaller reporting company,” and “emerging growth company” in Rule 12b-2 of the Exchange Act.
Large accelerated filer | Accelerated filer ☐ | |
Non-accelerated filer ☐ | Smaller reporting company ☐ | |
Emerging growth company ☐ |
If an emerging growth company, indicate by check mark if the registrant has elected not to use the extended transition period for complying with any new or revised financial accounting standards provided pursuant to Section 13(a) of the Exchange Act. ☐
Indicate by check mark whether the registrant is a shell company (as defined by Rule 12b-2 of the Exchange Act). Yes ☐ No ☑.☑.
The aggregate market value of the voting and non-votingregistrant’s common stock equity held by non-affiliates based on the closing sale price on June 30, 20182020 was $1.41 billion.$973.6 million.
Shares outstanding of each of the registrant’s classes of common stock as of February 8, 2019April 15, 2021 Class A common stock, $.01 par value: 76,332,069
DOCUMENTS INCORPORATED BY REFERENCE
In Parts II and III of this Form 10-K, portions of the definitive proxy statement for the 2019 Annual Meeting of Stockholders to be held April 23, 2019.
Index of Exhibits (Pages 49 through 51)
Total Number of Pages Included Are 86
None
WADDELL & REED FINANCIAL, INC.
INDEX TO AMENDMENT NO.1 TO ANNUAL REPORT ON FORM 10‑K10-K/A
For the fiscal year ended December 31, 20182020
2
EXPLANATORY NOTE
2
Forward‑Looking Statements
This Amendment No. 1 to the Annual Report on Form 10‑K and the letter to stockholders contain “forward‑looking statements” within the meaning10-K/A (this “Amendment No. 1”) of Section 27A of the Securities Act of 1933, as amended, and Section 21E of the Securities Exchange Act of 1934, as amended, which reflect the current views and assumptions of management with respect to future events regarding our business and the industry in general. These forward‑looking statements include all statements, other than statements of historical fact, regarding our financial position, business strategy and other plans and objectives for future operations, including statements with respect to revenues and earnings, the amount and composition of assets under management, distribution sources, expense levels, redemption rates and the financial markets and other conditions. These statements are generally identified by the use of words such as “may,” “could,” “should,” “would,” “believe,” “anticipate,” “forecast,” “estimate,” “expect,” “intend,” “plan,” “project,” “outlook,” “will,” “potential” and similar statements of a future or forward‑looking nature. Readers are cautioned that any forward‑looking information provided by or on behalf of the Company is not a guarantee of future performance. Certain important factors that could cause actual results to differ materially from our expectations are disclosed in the Item 1 “Business” and Item 1A “Risk Factors” sections of this Annual Report on Form 10‑K, which include, without limitation, the adverse effect from a decline in securities markets or in the relative investment performance of our products, our inability to pay future dividends, the loss of existing distribution channels or the inability to access new ones, a reduction of the assets we manage on short notice, and adverse results of litigation and/or arbitration. The forgoing factors should not be construed as exhaustive and should be read together with other cautionary statements included in this and other reports and filings we make with the SEC. All forward‑looking statements speak only as of the date on which they are made and we undertake no duty to update or revise any forward‑looking statements, whether as a result of new information, future events or otherwise.
General
Waddell & Reed Financial, Inc. (hereinafter referred(the “Company”) amends the Company’s Annual Report on Form 10-K for the fiscal year ended December 31, 2020 that was originally filed with the Securities and Exchange Commission (the “SEC”) on February 19, 2021 (the “Original Form 10-K”). The capitalized terms used in this Amendment No. 1 but not defined shall have the meaning specified for such terms in the Original Form 10-K.
This Amendment No. 1 is being filed solely to include the information required in Part III (Items 10, 11, 12, 13 and 14) of Form 10-K that was previously omitted from the Original Form 10-K in reliance upon General Instruction G(3) to Form 10-K and to include additional exhibits to the Exhibit Index referenced in Item 15 of the Original Form 10-K, which includes the Certifications to this Amendment No. 1. This Amendment No. 1 consists solely of the preceding cover page, this Explanatory Note, Part III (Items 10, 11, 12, 13 and 14), Part IV (Item 15) and the signature page.
Except as described in this Explanatory Note, no other information in the Original Form 10-K is being modified, updated or amended by this Amendment No. 1. Accordingly, this Amendment No. 1 should be read in conjunction with the Original Form 10-K and the Company’s other filings with the SEC.
As previously disclosed, on December 2, 2020, the Company entered into an Agreement and Plan of Merger (the “Merger Agreement”) with Macquarie Management Holdings, Inc., a Delaware corporation (“Macquarie”), Merry Merger Sub, Inc., a Delaware corporation and a wholly-owned subsidiary of Macquarie (“Merger Sub”), and (solely for limited purposes) Macquarie Financial Holdings Pty Ltd, an Australian proprietary company formed under the laws of the Commonwealth of Australia, providing for, subject to the satisfaction or waiver of certain conditions, the acquisition of the Company by Macquarie. Subject to the terms and conditions of the Merger Agreement, Merger Sub will be merged with and into the Company (the “merger”), with the Company surviving the merger as a wholly-owned subsidiary of Macquarie.
As of the filing of this Amendment No. 1, the merger is expected to close on April 30, 2021 (the “Closing Date” or the “Effective Time”), pursuant to the terms of the Merger Agreement.
3
PART III
Item 10. Directors, Executive Officers and Corporate Governance
Number of Directors and Term of Directors and Executive Officers
The Company’s Bylaws provide that the number of directors will not be less than seven nor more than 15 with the exact number to be fixed by the Board of Directors (the “Board”). The Company’s Certificate of Incorporation divides the Board into three classes of as equal size as possible, with the terms of each class expiring in consecutive years so that only one class is elected in any given year. Currently, there are nine directors with three directors in Class I, three directors in Class II and three directors in Class III.
The stockholders of the Company elect successors for directors whose terms have expired at the Company’s annual meeting. The Board elects members to fill new membership positions and vacancies on the Board resulting from death, resignation, retirement, disqualification, removal from office or other cause. Pursuant to the Company’s Corporate Governance Guidelines, non-employee directors must retire from the Board at the close of the annual meeting of stockholders following their 75th birthday; provided, that existing directors that are 75 years or older may complete their current term. Because the 2021 annual meeting of stockholders was postponed due to the pending merger between the Company and Macquarie, Messrs. Logue and Morrissey have not retired from the Board. Executive officers of the Company are elected by the Board and hold office until their successors are elected and qualified or until their earlier death, retirement, resignation or removal.
Directors and Executive Officers
The names of each of the Company’s directors and executive officers, their respective ages on the date of this report, and current positions are as follows:
| Name | Age | Position |
| Kathie. J. Andrade | 60 | Class III Director |
| Brent K. Bloss | 52 | President |
| Mark P. Buyle | 54 | Senior Vice President, Chief Legal Officer, General Counsel and Secretary |
| Benjamin R. Clouse | 47 | Senior Vice President and Chief Financial Officer |
| Sharilyn S. Gasaway | 52 | Class I Director |
| Thomas C. Godlasky | 65 | Class II Director |
| Daniel P. Hanson | 51 | Senior Vice President and Chief Investment Officer |
| James A. Jessee | 63 | Class III Director |
| Katherine M.A. (“Allie”) Kline | 49 | Class I Director |
| Dennis E. Logue | 77 | Class II Director |
| Shawn M. Mihal | 46 | Senior Vice President – Wealth Management, President of Waddell & Reed, Inc. |
| Michael F. Morrissey | 78 | Class II Director |
| Christopher W. Rackers | 50 | Senior Vice President and Chief People and Brand Officer |
| Philip J. Sanders | 61 | Chief Executive Officer and Class III Director |
| Amy J. Scupham | 46 | Senior Vice President – Distribution, President of Ivy Distributors, Inc. |
| Jerry W. Walton | 74 | Class I Director |
Below is a description of the backgrounds of the executive officers and directors, including their principal occupation and membership on public or registered investment company boards for the past five years. We have also provided information concerning the particular experience, qualification, attributes and skills that the Nominating and Corporate Governance Committee (the “Corporate Governance Committee”) and the Board considered relevant to each director that led to the conclusion that he or she should serve as a director.
Kathie J. Andrade has been a director of the Company since March 2019. She has served as a director of The Brink’s Company, a Richmond, Virginia cash management company, since August 2019. She served as a member of the Executive Committee of TIAA, a financial services organization in New York, New York, from 2014 to June 2018 and as CEO of its Retail Financial Services business and Chairman of TIAA Federal Savings from 2016 to August 2018. Ms. Andrade also served as President of TIAA Services Broker Dealer from 2011 to 2016. She joined TIAA in 2008 as COO of Wealth Management. Prior to TIAA, Ms. Andrade held a number of senior management positions at Bank of America, a financial services company in Boston, Massachusetts, from 1986 to 2008. Ms. Andrade's term on the Board expires in 2022.
4
Ms. Andrade has over 35 years of experience in the financial services industry, including as a member of the executive leadership team of TIAA, a Fortune 100 company. She has significant experience developing and executing successful sales and recruitment strategies for financial services organizations. Ms. Andrade also brings to the Board substantial knowledge in the areas of mergers and acquisitions, strategic operational leadership, wealth management, risk management and compliance, technology innovation, leadership development, diversity and inclusion.
Brent K. Bloss has been President of the Company since February 2020. He served as Executive Vice President of the Company from February 2018 to February 2020 and Chief Operating Officer of the Company from November 2017 to February 2020. Mr. Bloss served as Senior Vice President, Chief Financial Officer and Treasurer of the Company from March 2014 to February 2018. Prior thereto, Mr. Bloss was Senior Vice President – Finance and Principal Accounting Officer of the Company since July 2007 and Treasurer of the Company since January 2006. Previously, he served as Vice President of the Company from April 2004 to July 2007, as Assistant Treasurer of the Company from January 2002 to January 2006, and as Assistant Vice President from January 2002 to April 2004. From September 1995 to December 2001, he served in various roles in the audit practice of KPMG. Mr. Bloss joined the Company in January 2002.
Mark P. Buyle has been Senior Vice President, Chief Legal Officer, General Counsel and Secretary of the Company since August 2018. Previously he served as Interim General Counsel and Secretary of the Company from April 2018 to August 2018 and as Senior Vice President and Deputy General Counsel of the Company from January 2017 to April 2018. Prior thereto, he served as Senior Vice President and Associate General Counsel of the Company from March 2000 to January 2017. Before joining the Company, Mr. Buyle was a corporate attorney with the Kansas City law firm Polsinelli. Mr. Buyle joined the Company in 1995 as a senior attorney.
Benjamin R. Clouse has been Senior Vice President and Chief Financial Officer of the Company since February 2018. Mr. Clouse served as Treasurer of the Company from December 2018 to July 2019, as Vice President and Chief Accounting Officer of the Company from February 2017 to February 2018 and Vice President and as Principal Accounting Officer of the Company from March 2016 to February 2017. Prior thereto, Mr. Clouse was Vice President of the Company since October 2015. Prior to joining the Company, Mr. Clouse served as Chief Financial Officer of Executive AirShare Corporation, a private aviation company in Lenexa, Kansas, from September 2012 to October 2015. From 2006 to 2012 and from 2002 to 2005, he served in various roles with H&R Block, Inc., a tax preparation company in Kansas City, Missouri, including Assistant Vice President — Audit Services and Assistant Vice President and Controller — Tax Services. From 2005 to 2006, Mr. Clouse served as Vice President — Finance and Corporate Controller of Gold Bank Corporation, Inc., a bank holding company. From September 1996 to January 2002, he served in various roles in the audit practice of Deloitte & Touche, LLP. Mr. Clouse joined the Company in October 2015.
Sharilyn S. Gasaway has been a director of the Company since July 2010. She has served as a director of Genesis Energy, L.P., a Houston, Texas diversified midstream energy master limited partnership, since March 2010 and of J.B. Hunt Transport Services, Inc., a transportation logistics company in Lowell, Arkansas, since February 2009. From February 2006 to January 2009, she served as Executive Vice President and Chief Financial Officer of Alltel Corporation (“Alltel”), a U.S. wireless telecommunications network operator, acquired by Verizon Wireless in 2009. She served as Corporate Controller of Alltel from May 2002 to February 2006 and as Controller of Alltel Communications, Inc., a subsidiary of Alltel, from April 1999 to May 2002. Prior thereto, she served as Audit Manager of the former independent registered public accounting firm Arthur Andersen LLP from 1992 to April 1999. Ms. Gasaway’s term on the Board expires in 2023.
As the former Executive Vice President and Chief Financial Officer of a Fortune 500 company, Ms. Gasaway has extensive experience in the areas of capital markets, budgeting and forecasting, strategic planning, internal audit, tax and auditing with respect to complex business operations and transactions. As a result, she brings to the Board a breadth of knowledge regarding the financial and accounting functions of the Company’s operations, as well as with respect to the Company’s financial controls, financial reporting and disclosure, balance sheet management, integration of acquisitions, and accounting. Ms. Gasaway’s experience serving as a director for companies within the oil and gas and transportation industries provides her with a diverse perspective on Board-related matters. She has been a Certified Public Accountant since 1993.
Thomas C. Godlasky has been a director of the Company since July 2010 and Chairman of the Board since April 2018. Mr. Godlasky served as Chief Executive Officer of Aviva North America, Aviva plc’s life insurance and annuity business in the U.S. and its property and casualty business in Canada, from July 2007 to March 2010. Mr. Godlasky also served in the dual position as Chief Executive Officer and President of Aviva USA from November 2006 to November 2009. Prior thereto, Mr. Godlasky served as Chairman of the Board, Chief Executive Officer and President of AmerUs Group, Des Moines, Iowa, a life insurance and annuity business, which was acquired by Aviva plc in 2006, from November 2005 to November 2006 and as President and Chief Operating Officer from November 2003 to November 2006. He also served as a director of AmerUs Group from November 2003 until November 2006, whereupon he joined the Aviva USA Board of Directors until March 2010. Mr. Godlasky earned the Chartered Financial Analyst designation in 1992. Mr. Godlasky’s term on the Board expires in 2021.
5
Mr. Godlasky’s service as the “Company,” “we,” “our” or “us”) isChairman and Chief Executive Officer of AmerUs Group, a holdingleading U.S. producer of annuity and life insurance products, provides him with valuable insights on running a complex financial services company incorporatedwith diverse operations and products. He has experience in a number of areas that are critical to the Company, including mergers and acquisitions, information and technology, risk management, long-range strategic planning, expertise in the statetypes of Delawareproducts we offer to our clients and the importance of close cooperation with our regulators. Mr. Godlasky brings strong leadership skills and a valuable perspective on global financial, operational and strategic matters to the Board, as well as maintains a deep understanding of the challenges of operating in 1981,a highly regulated industry such as ours.
Daniel P. Hanson has been Senior Vice President and Chief Investment Officer of the Company and the Company's asset manager, Ivy Investment Management Company, since June 2019. Prior to joining the Company, he served as Head of Impact Investing for JANA Partners LLC since 2018. From 2013-2018, Mr. Hanson was with Jarislowsky Fraser Global Investment Management, where he served as Partner, Head of U.S. Equities and Co-Chair of the Investment Strategy Committee. From 2006-2013, Mr. Hanson was with BlackRock, where he served as Portfolio Manager and Managing Director.
James A. Jessee has been a director of the Company since July 2019. He has served as a director of YieldStreet Prism Fund Inc., a closed-end multi-asset fixed income fund managed by YieldStreet Management, LLC based in New York, New York since October 2019. He served as a member of the Management Committee of MFS Investment Management, an investment management company based in Boston, Massachusetts, from 2011 to 2018. Mr. Jessee was President of MFS Fund Distributors, Inc. from 2004 to 2018 and Co-Head of Global Distribution from 2011 to 2018. Prior to that, conducts business through its subsidiaries. Foundedhe held various positions with MFS from 1987 to 2004. Mr. Jessee also served on the board of the Investment Company Institute from 2014 to 2018. Mr. Jessee's term on the Board expires in 1937, we are2022.
Mr. Jessee has over 39 years of experience in the financial services industry, which includes participating as a member of the Management Committee of MFS Investment Management, one of the oldest mutual fund complexescompanies focused on active management. He brings the Board valuable insight regarding mutual fund operations and distribution based on his experience with MFS. He also has substantial knowledge in the areas of marketing, asset management distribution outside of the United States, having introducedas well as a broad wealth management industry perspective.
Katherine M.A. (“Allie”) Kline has been a Director of the Waddell & Reed Advisors groupCompany since February 2020. She has served as a director of mutual funds (the “Advisors Funds”)Huntington Bancshares Incorporated, a Columbus, Ohio regional bank holding company, since April 2019 and of Bill.com, a Palo Alto, California cloud-based software provider, since September 2020. Ms. Kline served as a director of Pier 1 Imports, Inc., a Fort Worth, Texas retailer specializing in 1940. Over time we’ve added additional mutual funds: Ivy Funds (the “Ivy Funds”); Ivy Variable Insurance Portfolios, our variable product offering (“Ivy VIP”); InvestEd Portfolios, our 529 college savings plan (“InvestEd”); Ivy High Income Opportunities Fund,home furnishings and décor, from September 2018 to October 2020. She also serves as a closed-end mutual fund (“IVH”);director of National Forest Foundation, the Ivy Global Investors Société d’Investissement à Capital Variable (non-profit partner of the “SICAV”)U.S. Forest Service. Ms. Kline is a founding principal of LEO DIX, a boutique services firm that helps CEOs, Boards, and C-Suite executives drive growth during times of disruption, transition, transformation and turnarounds. Ms. Kline served as chief marketing and communications officer for Oath Inc. (now Verizon Media), the Verizon Communications, Inc. subsidiary consisting of 20+ distinctive digital brands, from its Ivy Global Investors sub‑funds (the “IGI Funds”)formation in 2017 following Verizon’s acquisition of Yahoo to July 2018. Ms. Kline was chief marketing and communications officer for AOL from 2013 to 2017 prior to and following Verizon’s acquisition of AOL in 2015. She also served as the CEO of MAKERS, Verizon Media's prominent women's media brand from 2016-2018. Earlier in her career she held digital media and marketing leadership positions with data and analytics company 33Across, Unicast (now Amazon), an undertaking for the collective investment in transferable securities (“UCITS”);InterVU (now Akamai), and the Ivy NextShares® exchange-traded managed funds (“Ivy NextShares”) (collectively,Washington Wizards. Ms. Kline’s term on the Advisors Funds, Ivy Funds, Ivy VIP, InvestEd, IVHBoard expires in 2023.
Ms. Kline has valuable experience as a senior executive at a publicly traded company and Ivy NextShares are referredprovides the Board with strategic marketing, communications, M&A and transformation expertise. Her service as a director of other public companies also provides her with a different perspective on Board-related matters.
Dennis E. Logue has been a Director of the Company since January 2002. He served as Chairman of the Board of Ledyard Financial Group, Inc., a bank holding company located in Hanover, New Hampshire, from August 2005 to May 2019. Additionally, Mr. Logue has served as an Emeritus Professor of Management at the “Funds”). In February 2018, we completedAmos Tuck School, Dartmouth College since August 2005. He served as Dean of the mergerMichael F. Price College of all Advisors Funds into Ivy Funds with substantially similar objectivesBusiness at the University of Oklahoma from July 2001 to September 2005. Prior thereto, Mr. Logue held numerous business-oriented professorships, including at the Amos Tuck School, Dartmouth College from July 1974 to June 2001. He has also worked as a consultant and strategies. Inexpert witness on various financial matters since 1974. Mr. Logue has served as a director of Abraxas Petroleum Corporation, San Antonio, Texas, a natural gas and crude oil exploration, development and production company, since April 2003 and of ALCO Stores, Inc., Dallas, Texas, a general merchandise retailer, from May 2018, we started2005 through September 2014. Mr. Logue’s term on the processBoard expires in 2021.
6
Mr. Logue is highly accomplished in the field of liquidating the IGI Funds, which was substantially complete in 2018. In addition to the Funds and IGI Funds, our assets under management (“AUM”) include institutional accounts managed by the Company.
We derive our revenues from providing investmentbusiness management and advisoryfinancial academia, having taught in the areas of managerial economics and finance, corporate governance, financial markets and international finance for 48 years and published over 90 books and articles in the areas of economics, pension plans, corporate and international finance and capital markets. His past leadership roles in the academic world allow him to bring a wide range of experience and new insights to his service on the Board. As a founding director of Ledyard National Bank, Mr. Logue also has substantial expertise in the areas of the financial services investment product underwritingindustry, executive management and distribution,operations.
Shawn M. Mihal has been Senior Vice President – Wealth Management of the Company since December 2018 and shareholder services administration to the Funds, institutional accounts, and the IGI Funds prior to their liquidation. We also provide brokerage services, primarily to retail clients throughPresident, Waddell & Reed, Inc. (“W&R”WRI”) since November 2017. Prior to that, Mr. Mihal was Chief Operating Officer of WRI from August 2017 to November 2017 and Senior Vice President, Chief Compliance Officer and Chief Regulatory Officer of WRI and Ivy Distributors, Inc. (“IDI”) from March 2015 to August 2017. Prior to joining the company, he served as Vice President and Chief Compliance Officer for Transamerica Financial Advisors, Inc., an independent broker-dealer and independentregistered investment advisor in St. Petersburg, Florida, from September 2010 to March 2015 and as Chief Compliance Officer for Great American Advisors, Inc., a registered investment advisor in Cincinnati, Ohio, from October 2004 to August 2010. Mr. Mihal joined the Company in March 2015.
Michael F. Morrissey has been a director of the Company since July 2010. He has been a director of Ferrellgas Partners, L.P., a propane gas marketing and distribution company in Liberty, Missouri since 1999. He was a director of Westar Energy, Inc., an electric service company based in Topeka, Kansas, from 2003 through May 2015. Mr. Morrissey retired in September 1999 after serving 24 years, including 17 years as a partner, with Ernst & Young LLP, an auditing and financial advisors associated with W&R (“Advisors”)services firm. Prior thereto, Mr. Morrissey worked for five years for another major accounting firm and six years for a motor truck manufacturer. Mr. Morrissey has been a Certified Public Accountant since 1972. Mr. Morrissey also served as a director of Blue Cross Blue Shield of Kansas City, a Kansas City, Missouri health insurance company, from 2006 through April 2017; of J.E. Dunn Construction Group, Inc., who providea private construction business located in Kansas City, Missouri, from 2000 through January 2017; of Balance Innovations, Inc., an office management technology company located in Lenexa, Kansas, from 2008 through May 2019; and a special advisor to the audit committee of the Dairy Farmers of America, a farmer-owned milk marketing cooperative located in Kansas City, Missouri, from 2000 through August 2014. Mr. Morrissey also serves as a director or trustee for numerous non-profit, civic, and charitable organizations. Mr. Morrissey’s term on the Board expires in 2021.
Mr. Morrissey’s qualifications to serve as a director include his substantial experience as the Chairman or member of the audit committee of other public companies, his many years of experience as an audit partner of a major accounting firm, and his extensive experience as a director of other large companies, both public and private. Mr. Morrissey brings to the Board significant audit and accounting expertise and a deep understanding of financial planning and advice to their clients. Investmentstatements, corporate finance, risk management and advisory feesinternal audit functions. Mr. Morrissey’s knowledge and experience gained as a board member of various public and private companies, as well as not-for profit, civic and charitable organizations provide the Board with a wide range of experience and insights regarding Board actions. Mr. Morrissey is also a Certified Public Accountant (retired).
Christopher W. Rackers has been Senior Vice President and Chief People and Brand Officer since June 2020. He served as Senior Vice President and Chief Administrative Officer of the Company from June 2019 to June 2020, as Senior Vice President and Chief Human Resources Officer of the Company from January 2019 to June 2019 and as Senior Vice President and Chief Human Resources Officer of certain underwritingof the Company’s subsidiaries from January 2017 to June 2019. Prior to joining the Company, Mr. Rackers was Vice President, Global Human Resources at Payless ShoeSource, a discount footwear retailer in Topeka, Kansas, from January 2016 to January 2017, Vice President, Global Human Resources at WIS International, a retail and distribution revenues are based oninventory services company in Dallas, Texas, from May 2015 to December 2015, Vice President of Human Resources at H&R Block, a tax preparation company in Kansas City, Missouri, from May 2013 to June 2015. Prior thereto, he held several positions with Aramark, a food service, facilities and uniform services provider, including Senior Vice President, Human Resources, from June 2006 to May 2013. Mr. Rackers joined the level of AUM and assets under administration (“AUA”) and are affected by sales levels, financial market conditions, redemptions and the composition of assets. Our underwriting and distribution revenues consist of fees earned on fee‑based asset allocation programs and related advisory services, asset‑based service and distribution fees promulgated under the 1940 Act (“Rule 12b-1”), distribution fees on certain variable products, and commissions derived from sales of investment and insurance products. The products sold have various commission structures and the revenues received from those sales vary based on the type and dollar amount sold. Shareholder service fee revenue includes transfer agency fees, custodian fees from retirement plan accounts, portfolio accounting and administration fees, and is earned based on client AUM or number of client accounts. Our major expenses are for distribution of our products, compensation related costs, occupancy, general & administrative, and information technology.Company in January 2017.
7
3
Organization
We deliver our investment management advisory services through our subsidiary companies, primarilythe Company since August 2016. He served as Chief Investment Officer of the Company from February 2011 to June 2019. Mr. Sanders has served as President of Ivy Investment Management Company (“IICO”), the registered investment adviser for the Ivy Funds, Ivy VIP, InvestEd, from August 2016 and Ivy NextShares; and, priorwas Chief Investment Officer of IICO from August 2010 to completionJune 2019. Prior thereto, he served as Senior Vice President of the Advisors Funds mergers into Ivy Funds in 2018, Waddell & Reed Investment Management Company (“WRIMCO”), a registered investment adviser for from July 2000 to August 2016, Senior Vice President of IICO from April 2003 to August 2016 and Vice President of WRIMCO from January 1999 to July 2000. He is also President of the Advisors Funds. WRIMCO merged into IICO, effective December 31, 2018.
Our underwriting and distribution services are delivered through our two broker-dealers: W&R and Ivy Distributors, Inc. (“IDI”). W&R is a registered broker-dealer and investment adviser that acts as the national distributor and underwriter for shares of InvestEd other mutual funds, and the former Advisors Funds, and as a distributor of variable annuities and other insurance products issued by our business partners. IDI is the distributor and underwriter for thePortfolios, Ivy Funds, Ivy VIPHigh Income Opportunities Fund, Ivy NextShares and Ivy Nextshares.Variable Insurance Portfolios, all of which are mutual funds managed by the Company. Mr. Sanders joined the Company as a mutual fund portfolio manager in August 1998. Mr. Sanders’ term on the Board expires in 2022.
Waddell & Reed Services
Mr. Sanders has over 32 years of experience in the financial services industry, including 22 years with the Company. Mr. Sanders' oversight of all Company (“WRSCO”) provides transfer agencyoperations and accounting serviceshis experience in investment management is an indispensable contribution to the Funds. Waddell & ReedBoard and provides a critical link between management and the Board.
Amy J. Scupham has been Senior Vice President – Distribution of the Company since December 2018 and President of IDI since April 2018. Prior to that Ms. Scupham was Chief Operating Officer of IDI from February 2018 to April 2018 and Senior Vice President – Institutional Sales from May 2016 to February 2018. Prior thereto, she held various positions at the Company in institutional sales and consultant relations. Ms. Scupham joined the Company in April 2008.
Jerry W. Walton has been a Director of the Company since April 2000. Mr. Walton served as a business consultant to Hunt Ventures, a group of private companies located in Rogers, Arkansas, from April 2010 to February 2016. He served as Executive Vice President of Finance and Administration and Chief Financial Officer of J.B. Hunt Transport Services, Inc., W&R, WRIMCO, WRSCO, IICOa transportation provider in Lowell, Arkansas, from October 1991 until September 2009. Prior thereto, Mr. Walton served as a managing partner and IDI are hereafter collectively referreda tax partner with KPMG, with whom he had been employed since 1968. Mr. Walton also serves as a director of the Northwest Arkansas National Airport Authority. Mr. Walton’s term on the Board expires in 2023.
Mr. Walton brings extensive financial, operational and executive management expertise to the Board having served as the “Company,” “we,” “us” or “our” unless the context requires otherwise.
Investment Management Operations
Our investment managementExecutive Vice President and advisory services provideChief Financial Officer of J.B. Hunt Transport Services, Inc., one of ourthe largest sourcestransportation logistics companies in North America. Mr. Walton also has significant public accounting experience, including in the areas of revenues. We earn investment management fee revenues by providing investment managementaccounting, finance and advisorytax, and direct experience in the areas of information and technology services, pursuant to investment management agreements with the Funds. While the specific termstreasury functions, real estate, human resources and risk management. As a long-time director, Mr. Walton offers a breadth of the agreements vary, the basic terms are similar. The agreements provide that we render overall investment management services to each of the Funds, subject to the oversight of each Fund’s board of trustees and in accordance with each Fund’s investment objectives and policies. The agreements permit us to enter into separate agreements for shareholder services or accounting services with each respective Fund.
Each Fund’s board of trustees, including a majority of the trustees who are not “interested persons” of the Fund orknowledge about issues affecting the Company within the meaning of the Investment Company Act of 1940, as amended (the “ICA”) (“disinterested members”) and the Fund’s shareholders must approve the investment management agreement between the respective Fund and the Company. These agreements may continue in effect from year to year if specifically approved at least annually by (i) the Fund’s board, including a majority of the disinterested members, or (ii) the vote of a majority of both the shareholders of the Fund and the disinterested members of each Fund’s board, each vote being cast in person at a meeting called for such purpose. Each agreement automatically terminates in the event of its assignment, as defined by the ICA or the Investment Advisers Act of 1940, as amended (the “Advisers Act”), and may be terminated without penalty by any Fund by giving us 60 days’ written notice if the termination has been approved by a majority of the Fund’s trustees or the Fund’s shareholders. We may terminate an investment management agreement without penalty on 120 days’ written notice.
In addition to performing investment management services for the Funds, we act as an investment adviser for institutional and other private investors and we provide subadvisory services to other investment companies. We also acted as investment advisor to the IGI Funds prior to their liquidation. Such services are provided pursuant to various written agreements, and our fees are generally based on a percentage of AUM.
Our investment management team begins each business day in a collaborative discussion that fosters idea sharing, yet reinforces individual accountability. Through all market cycles, we remain dedicated to the following investment principles:
|
|
|
|
|
|
4
These three principles shape our investment philosophy and money management approach. For over 80 years, our investment organization has delivered consistently competitive investment performance. Through bull and bear markets, our investment professionals have not strayed from what works—fundamental research and a time‑tested investment process. We believe long-term clients turn to us because they appreciate that our investment approach continues to identify and create opportunities for wealth creation.
Our investment management team is comprised of 89 professionals, including 32 portfolio managers who average 23 years of industry, experience and 16 years of tenure with our firm. We have significant experience in virtually all major asset classes, several specialized asset classes and a range of investment styles. We continue to move towards team-based portfolio management on our funds, and have fortified our research team with additional investment analysts, while continuing to foster a collaborative culture across our investment management professionals. We also engage subadvisors who bring additional expertise in specific asset classes, when appropriate.
Investment Management Products
Our mutual funds provide a wide variety of investment options. We are the exclusive underwriter and distributor of 83 registered mutual fund portfolios in the Funds, which includes 14 investment styles. During the first quarter of 2018, the remaining Advisors Funds merged into Ivy Funds with substantially similar objectives and strategies. During 2018, six Ivy Funds and one Ivy VIP fund merged into Ivy Funds and an Ivy VIP fund, respectively, with generally similar investment objectives. Variable products, Ivy VIP and InvestEd are offered primarily through Advisors in the broker-dealer channel; in some circumstances, certain of those funds are also offered through the unaffiliated channel. The Ivy Funds are offered through both our unaffiliated channel and broker-dealer channel. The Funds’ AUM are included in either our unaffiliated channel or our broker-dealer channel depending on which channel marketed the client account or is the broker of record. As of December 31, 2018, we had $65.8 billion in AUM.
Broker-Dealer Products and Services
Since 1937, W&R has been committed to our client’s financial goals. W&R offers a variety of sophisticated and personalized financial planning services to address virtually any client goal, objective or situation including retirement planning, education planning, addressing survivor needs, asset allocation, estate planning, business planning, income tax planning, disability and long-term care. In 2017, W&R introduced a new, industry-leading financial planning platform centered around technology provided by eMoney Advisor. This platform enables Advisors to better serve their client’s financial planning needs and provides clients with access to their financial plan, important financial planning documents and a holistic view of their entire financial situation all through a convenient wealth management portal.
W&R offers clients full-service brokerage services as well as a variety of fee‑based asset allocation programs, including Managed Allocation Portfolio (“MAP”), MAP Choice, MAP Flex, MAPSelect, MAPLatitude and Strategic Portfolio Allocation (“SPA”). These programs utilize a variety of underlying investment options including mutual funds, individual stocks and bonds and exchange traded funds. During 2017, we launched MAPNavigator, an open architecture mutual fund advisory program and enhanced the SPA program, partnering with Wilshire Associates, Inc., an independent consultant, to develop a series of taxable and tax-sensitive investment models consisting of our affiliated Ivy Funds. As of December 31, 2018, clients had $21.2 billion invested in our fee‑based asset allocation programs.
Through our broker-dealer, we distribute various variable annuity products, some of which offer our affiliated Ivy VIP funds as an investment vehicle. In 2017, IICO enhanced InvestEd by lowering fees and expanding the available investment options. InvestEd offers lower sales charges, reduced minimum initial investment, an increased number of aged-based and static portfolios and individual fund options, along with an expanded range of underlying funds within aged-based and static portfolios. Through our insurance agency subsidiaries, Advisors also offer clients retirement and life insurance products underwritten by our business partners. We offer unaffiliated mutual fund products, other variable annuity products, and full service brokerage products and services through a third-party clearing broker-dealer. AUA were $51.3 billion at December 31, 2018.
5
Distribution Channels
One of our distinctive qualities is that we distribute our investment products through a balanced distribution network. Our distribution channels cover both retail and institutional unaffiliated sales channels, described below, as well as our affiliated broker-dealer, W&R.
Unaffiliated Channel
In 2018, IDI leadership realigned its distribution model to respond to a changing marketplace and to reinvigorate sales using a more focused approach. The moves centered on two sales channels, National Distribution and Professional Buyers Distribution, in an effort to diversify asset flow and the AUM profile of the Company.
National Distribution, inclusive of National Accounts and National Wholesale, was enhanced to increase focus and drive fund sales throughout the nationwide broker-dealer network. With the National Accounts team focused on firm home office interactions and the National Wholesale team focused on driving sales at the financial advisor level. This alignment provides a holistic, cohesive and collaborative sales and service approach to our national broker-dealer partners. National Wholesale includes 24 external wholesalers, four of which are exclusively devoted to W&R.
Professional Buyers Distribution was enhanced to focus on sales and service across the institutional, consultant relations, insurance, registered investment advisor (“RIA”) and defined contribution investment only (“DCIO”) categories. Unifying sales strategies within the Professional Buyers Distribution group brings collaboration, shared knowledge and enhanced service levels to key institutional, retirement, insurance and RIA clients that require specialized interactions and communication.
The Distribution Operations team supports IDI’s sales and service-related processes including training, business intelligence, client relationship management and sales systems, and practice management. This group also includes IDI’s professional client experience team, which creates key client-facing deliverables utilized by both distribution groups. The Distribution Operations team is designed to help increase the overall knowledge and responsiveness of the entire distribution channel.
AUM in this channel were $25.0 billion at the end of 2018.
Broker-Dealer Channel
Throughout our history, Advisors sold investment products to individuals, families and businesses across the country in geographic markets of all sizes. Advisors assist clients on a wide range of financial issues with a significant focus on helping them plan, generally, for long‑term goals and offer one‑on‑one consultations that emphasize long‑term relationships through continued service.
Over the past several years, we have expanded our brokerage platform technology and product offering, while continuing to make investments that allow Advisors to simplify the way they conduct business with clients. We continued to work to transform W&R into a self-sustaining, fully competitive and profitable entity. These efforts include enhancing the compensation program for Advisors, investing in a new advisor technology platform, transitioning advisors currently leasing space in W&R offices to personal branch offices and redesigning services offered to Advisors. These additional enhancements will continue in the future and are designed to increase our ability to retain and competitively recruit experienced Advisors.
As of December 31, 2018, there were 1,060 Advisors and 343 licensed advisor associates, for a total of 1,403 individuals associated with W&R who operate out of offices located throughout the United States. We believe, based on industry data, that W&R ranks among the largest independent broker-dealers. As of December 31, 2018, our broker-dealer channel had approximately 380,000 mutual fund clients and AUM of $37.2 billion. Assets under administration (“AUA”) includes both client assets invested in the Funds and in other companies’ products that are distributed through W&R held in brokerage accounts, within our fee-based asset allocation programs, or held directly with the funds.
6
Institutional Channel
We also manage assets in a variety of investment styles for a variety of types of institutions. The largest client type is other asset managers that hire us to act as subadviser for their branded products; they are typically domestic or foreign distributors of investment products who lack scale or the track record to manage internally, or choose to market multi‑manager styles. Our diverse client list includes pension funds, Taft‑Hartley plans and endowments. AUM in the institutional channel were $3.7 billion at December 31, 2018.
Service Agreements
We earn service fee revenues by providing various services to the Funds and their shareholders. Pursuant to shareholder servicing agreements, we perform shareholder servicing functions for which the Funds pay us a monthly fee, including: maintaining shareholder accounts; issuing, transferring and redeeming shares; distributing dividends and paying redemptions; furnishing information related to the Funds; and handling shareholder inquiries. Pursuant to accounting service agreements, we provide the Funds with bookkeeping and accounting services and assistance for which the Funds pay us a monthly fee, including: maintaining the Funds’ records; pricing Fund shares; and preparing prospectuses for existing shareholders, proxy statements and certain other shareholder reports.
Agreements with the Funds may be adopted or amended with the approval of the disinterested members of each Fund’s board of trustees and have annually renewable terms.
Competition
The financial services industry is a highly competitive global industry. According to the Investment Company Institute (the “ICI”), at the end of 2018 there were more than 9,300 open‑end investment companies, more than 500 closed‑end investment companies and more than 1,900 exchange traded funds of varying sizes, investment policies and objectives whose shares are being offered to the public in the United States alone. Factors affecting our business include investment performance, fees, brand recognition, business reputation, quality of service and the continuity of both client relationships and AUM. A majority of mutual fund sales go to funds that are highly rated by a small number of well‑known ranking services that focus on investment performance. Competition is influenced by the achievement of competitive investment management performance, distribution methods, the type and quality of shareholder services, the success of marketing efforts and the ability to develop investment products for certain market segments to meet the changing needs of investors.
We compete with other mutual fund management, distribution and service companies that distribute their fund shares through a variety of methods, including affiliated and unaffiliated sales forces, broker-dealers and direct sales to the public of shares offered at a low or no sales charge. Many larger mutual fund complexes have significant advertising budgets and established relationships with brokerage houses with large distribution networks, which enable these fund complexes to reach broad client bases. Many investment management firms and unaffiliated advisors offer services and products similar to ours. We also compete with brokerage and investment banking firms, insurance companies, commercial banks and other financial institutions and businesses offering other financial products in all aspects of their businesses.
The distribution of mutual funds and other investment products has experienced significant developments in recent years, which have intensified the competitive environment. These developments include the introduction of new products, the rationalization of the number of products offered on third party platforms, increasingly complex distribution systems with multiple classes of shares, the development of investors’ ability to invest online, the introduction of sophisticated technological platforms used by financial advisors to sell and service mutual funds for their clients, the introduction of separately managed accounts—previously available only to institutional investors—to individuals, and growth in the number of mutual funds offered. In recent years, we have faced significant competition from passive investment strategies, which have taken market share from active managers like ourselves. While we cannot predict how much market share these competitors will gain, we believe there will always be demand for active management.
We believe we effectively compete across multiple dimensions of the asset management and broker-dealer businesses. First, we market our products, primarily the Ivy Funds family, to unaffiliated broker-dealers and advisors and compete against other asset managers offering mutual fund products. Competition is impacted by sales techniques, personal relationships and skills, and the quality of financial planning products and services offered. We compete against a broad range of asset managers that are both larger and smaller than our firm, but we believe that the breadth and depth
7
of our products position us to compete in this environment. Second, we believe our business model targets clients seeking personal assistance from financial advisors or planners. The market for financial advice is extremely broad and fragmented. Advisors compete with large and small broker-dealers, unaffiliated advisors, registered investment advisers, financial institutions, insurance representatives and others. Finally, we compete in the institutional marketplace, working with consultants who select asset managers for various opportunities, as well as working directly with plan sponsors, foundations, endowments, sovereign funds and other asset managers who hire subadvisors.
We also face competition in attracting and retaining qualified employees and Advisors. To maximize our ability to compete effectively in our business, we offer competitive compensation. We are advancing our culture by focusing on our Core Values and further investing in our people through areas such as talent management, employee experiences, diversity & inclusion and total rewards. For Advisors, we enhanced the compensation program, are investing in a new advisor technology platform and have expanded our brokerage platform technology and product offering.
For additional discussion regarding the impact of competition, please see the Market and Competition risk factors included in Item 1A—“Risk Factors” in this Annual Report.
Regulation
The securities industry is subject to extensive regulation and virtually all aspects of our business are subject to various federal and state laws and regulations. These laws and regulations are primarily intended to protect investment advisory clients and shareholders of registered investment companies. Under such laws and regulations, agencies and organizations that regulate investment advisers, broker-dealers, and transfer agents like us have broad administrative powers, including the power to limit, restrict or prohibit an investment adviser, broker-dealer or transfer agent from carrying on its business in the event that it fails to comply with applicable laws and regulations. In such event, the possible sanctions that may be imposed include, but are not limited to, the suspension of individual employees or agents, limitations on engaging in certain lines of business for specified periods of time, censures, fines and the revocation of investment adviser and other registrations.
The United States Securities and Exchange Commission (the “SEC”) is the federal agency responsible for the administration of federal securities laws. Certain of our subsidiaries are registered with the SEC as investment advisers under the Advisers Act, which imposes numerous obligations on registered investment advisers including, among other things, fiduciary duties, record‑keeping and reporting requirements, operational requirements and disclosure obligations, as well as general anti‑fraud prohibitions. Investment advisers are subject to periodic examination by the SEC, and the SEC is authorized to institute proceedings and impose sanctions for violations of the Advisers Act, ranging from censure to termination of an investment adviser’s registration.
The Funds are registered as investment companies with the SEC under the ICA, and various filings are made with states under applicable state rules and regulations. The ICA regulates the relationship between a mutual fund and its investment adviser and prohibits or severely restricts principal transactions and joint transactions. Various regulations cover certain investment strategies that may be used by the Funds for hedging and/or speculative purposes. To the extent the Funds purchase futures contracts, options on futures contracts, swaps and foreign currency contracts above certain de minimis thresholds established by the Commodity Futures Trading Commission (the “CFTC”), they are subject to the commodities and futures regulations of the CFTC.
We derive a large portion of our revenues from investment management agreements. Under the Advisers Act, our investment management agreements terminate automatically if assigned without the client’s consent. Under the ICA, investment advisory agreements with registered investment companies, such as the Funds, terminate automatically upon assignment. The term “assignment” is broadly defined and includes direct assignments, as well as assignments that may be deemed to occur, under certain circumstances, upon the transfer, directly or indirectly, of a controlling interest in the Company.
The Company is also subject to federal and state laws affecting corporate governance, including the Sarbanes‑Oxley Act of 2002, as well as rules adopted by the SEC. Our report on internal controls over financial reporting for 2018 is included in Part I, Item 9A.
As a publicly traded company, we are also subject to the rules of the New York Stock Exchange (the “NYSE”), the exchange on which our stock is listed, including the corporate governance listing standards approved by the SEC.
8
Two of our subsidiaries, W&R and IDI, are registered as broker-dealers with the SEC and the states. Much of the broker-dealer regulation has been delegated by the SEC to self‑regulatory organizations, principally the Municipal Securities Rulemaking Board and the Financial Industry Regulatory Authority, Inc. (“FINRA”), which is the primary regulator of our broker-dealer activities. These self‑regulatory organizations adopt rules (subject to approval by the SEC) that govern the industry and conduct periodic examinations of our operations over which they have jurisdiction. Securities firms are also subject to regulation by state securities administrators in those states in which they conduct business. Broker-dealers are subject to regulations that cover all aspects of the securities business, including sales practices, market making and trading among broker-dealers, the use and safekeeping of clients’ funds and securities, capital structure, record‑keeping, and the conduct of directors, officers, employees and associated persons. Violation of applicable regulations can result in the revocation of broker-dealer licenses, the imposition of censures or fines, and the suspension or expulsion of a firm, its officers or employees.
W&R and IDI are each subject to certain net capital requirements pursuant to the Securities Exchange Act of 1934, as amended (the “Exchange Act”). Uniform Net Capital Rule 15c3‑1 of the Exchange Act (the “Net Capital Rule”) specifies the minimum level of net capital a registered broker-dealer must maintain and also requires that part of its assets be kept in a relatively liquid form. The Net Capital Rule is designed to ensure the financial soundness and liquidity of broker-dealers. Any failure to maintain the required minimum net capital may subject us to suspension or revocation of our registration or other limitations on our activity by the SEC, and suspension or expulsion by FINRA or other regulatory bodies, and ultimately could require the broker-dealer’s liquidation. The maintenance of minimum net capital requirements may also limit our ability to pay dividends. As of December 31, 2018 and 2017, net capital for W&R and IDI exceeded all minimum requirements.
Pursuant to the requirements of the Securities Investor Protection Act of 1970, W&R is a member of the Securities Investor Protection Corporation (the “SIPC”). IDI is exempt from the membership requirements and is not a member of the SIPC. The SIPC provides protection against lost, stolen or missing securities (but not loss in value due to a rise or fall in market prices) for clients in the event of the failure of a broker-dealer. Accounts are protected up to $500,000 per client with a limit of $250,000 for cash balances. However, since the Funds, and not our broker-dealer subsidiaries, maintain client accounts, SIPC protection would not cover mutual fund shareholders whose accounts are maintained directly with the Funds, but would apply to brokerage accounts held on our brokerage platform.
Title III of the USA PATRIOT Act, the International Money Laundering Abatement and Anti‑Terrorist Financing Act of 2001, imposes significant anti‑money laundering requirements on all financial institutions, including domestic banks and domestic operations of foreign banks, broker-dealers, futures commission merchants and investment companies.
The Company and Advisors in our broker-dealer channel are subject to the Employee Retirement Income Security Act of 1974, as amended (“ERISA”), and related provisions of the Internal Revenue Code of 1986, as amended, to the extent they are considered “fiduciaries” under ERISA with respect to certain clients. Although in 2018 the U.S. Court of Appeals for the Fifth Circuit vacated regulations adopted by the U.S. Department of Labor that,its financial statements, balance sheet management, budgeting process and executive compensation. Mr. Walton is also a Certified Public Accountant (retired).
There are no family relationships among other things, treated as fiduciaries any person who provides investment advice or recommendations to employee benefit plans, plan fiduciaries, plan participants, plan beneficiaries, IRAs or IRA owners, other regulators have enacted or proposed other fiduciary standards that could require modifications to our distribution activities and may impact our ability to service clients or engage in certain types of distribution or other business activities.
Our businesses may be materially affected not only by regulations applicable to us as an investment adviser, broker-dealer or transfer agent, but also by law and regulations of general application. For example, the volume of our principal investment advisory business in a given time period could be affected by, among other things, existing and proposed tax legislation and other governmental regulations and policies (including the interest rate policies of the Federal Reserve Board),Company’s executive officers and changes indirectors.
Code of Business Conduct and Ethics
The Board has adopted a Corporate Code of Business Conduct and Ethics that applies to all of the interpretationCompany’s directors, officers and employees. The purpose and role of this code is to focus our directors, officers and employees on areas of ethical risk, provide guidance to help them recognize and deal with ethical issues, provide mechanisms to report unethical or enforcementunlawful conduct, and to help enhance and formalize our culture of existing lawsintegrity, honesty and rules that affectaccountability. As required by applicable law, the business and financial communities.
Our business is also subject to new and changing laws and regulations. For additional discussion regardingCompany will post on the impact of current and proposed legal or regulatory requirements, please see the Legal, Regulatory and Tax risk factors included in Item 1A—“Risk Factors” in this Annual Report.
9
Intellectual Property
We regard our names as material to our business, and have registered certain service marks associated with our business with the United States Patent and Trademark Office.
Employees
At December 31, 2018 we had 1,332 full‑time employees, consisting of 1,198 home office employees and 134 employees responsible for field supervision and administration.
Available Information
We make available free of charge our proxy statements, Annual Reports on Form 10‑K, quarterly reports on Form 10‑Q, current reports on Form 8‑K and amendments to those reports“Governance Documents” page under the “Reports & SEC Filings” menu“Corporate Governance” tab on the “Investor Relations” section of our internetits website at ir.waddell.com as soon as reasonably practical after such filing has been any amendments or waivers of any provision of this code made withfor the SEC.benefit of executive officers or directors of the Company.
You should carefully considercan access and print the following risk factorscharters of our Audit Committee, Compensation Committee and Corporate Governance Committee, as well as the other risksour Corporate Governance Guidelines, Corporate Code of Business Conduct and uncertainties contained in this Annual Report on Form 10‑K or in our other SEC filings. The occurrence of one or more of these risks or uncertainties could materially and adversely affect our business, financial condition, operating results and cash flows. In this Annual Report on Form 10‑K, unless the context expressly requires a different reading, when we state that a factor could “adversely affect us,” have a “material adverse effect on our business,” “adversely affect our business” and similar expressions, we mean that the factor could materially and adversely affect our business, financial condition, operating results and cash flows. Information contained in this section may be considered “forward‑looking statements.” See “Part I—Forward Looking Statements” for a discussion of cautionary statements regarding forward‑looking statements.
MARKET AND COMPETITION RISKS
We Could Experience Adverse Effects On Our Market Share Due To Strong Competition From Numerous And Sometimes Larger Companies. The investment management industry is highly competitive. We compete with stock brokerage firms, mutual fund companies, investment banking firms, insurance companies, banks, internet investment sites, mobile investment products, automated financial advisors, registered investment advisers,Ethics, Whistleblower Policy and other financial institutionsCompany policies and individuals basedprocedures required by applicable law, regulation or NYSE corporate governance listing standards on a numberthe “Governance Documents” link in the dropdown menu on the “Corporate Governance” tab of factors, including investment performance, the level of fees charged, the quality and diversity of products and services offered, name recognition and reputation, and the ability to develop new investment strategies and products to meet the changing needs of investors. Many of these competitors not only offer mutual fund investments and services, but also offer an ever-increasing number of other financial products and services. Many“Investor Relations” section of our competitors have more productswebsite at ir.waddell.com.
Director Nominations
During 2020, we made no material changes to the procedures by which stockholders may recommend nominees to our Board as described in the proxy statement for our 2020 Annual Meeting of Stockholders.
8
Audit Committee
The Board has an Audit Committee composed of four members: Sharilyn S. Gasaway (Chair), Dennis E. Logue, Michael F. Morrissey, and product lines,Jerry W. Walton. Ms. Gasaway assumed the role of Chair of the Audit Committee from Mr. Morrissey on January 1, 2021. The Audit Committee (1) appoints, terminates, retains, compensates and oversees the work of the independent registered public accounting firm, (2) pre-approves all audit services and brand recognition and also may have substantially greater AUM. See Item 1 – “Business – Competition.”
Many larger mutual fund complexes have developed more extensive relationships with brokerage houses that have large distribution networks, which may enable those fund complexes to reach broader client bases. In recent years, there has been a trend of consolidation inpermitted non-audit services provided by the mutual fund industry resulting in stronger competitors with greater financial resources than us.
There has also been a trend toward online internet financial services and financial services that are based on mobile applications or automated processes as clients increasingly seek to manage their investment portfolios digitally. This is leading to increased utilization of “robo” adviser platforms. If existing or potential clients decide to invest with our competitors instead of with us, our market share could decline, which could have a material adverse effect on our business.
We have faced significant competition in recent years from lower fee, passive investment strategies. Investment advisers that emphasize passive products have gained, and may continue to gain, market share from active managers like us, which could have a material impact on our business.
We Could Lose Market Share To Competitors That Have Broader Investment Product Offerings. There are a number of asset classes and product types that are not well covered by our current products and services. When these asset
10
classes or products are in favor with investors, our competitors may receive outsized flows compared to others in the industry. As a result, we may miss the opportunity to gain the AUM that are being invested in these assets and face the risk of our managed assets being withdrawn in favor of competitors who provide services covering these classes or products. For example, to the extent there is a trend in the asset management business in favor of passive products, such as index and certain types of exchange-traded funds, it favors our competitors who provide those products over active managers like us. In addition, we are not typically the lowest cost provider of asset management services. To the extent that we compete on the basis of price, we may not be able to maintain our current fee structure, which could adversely affect our operating revenues.
Our Business And Prospects Could Be Adversely Affected If The Securities Markets Decline. Our results of operations are affected by certain economic factors, including the success of the securities markets. There are often substantial fluctuations in price levels in the securities markets. These fluctuations can occur on a daily basis and over longer periods as a result of a variety of factors, including national and international economic and political events, broad trends in business and finance, and interest rate movements. Adverse market conditions, particularly in the U.S. domestic stock market due to our high concentration of AUM in that market, and lack of investor confidence could result in investors further withdrawing from the markets or decreasing their rate of investment, either of which could adversely affect our revenues, earnings and growth prospects.
Our revenues are, to a large extent, investment management fees that are based on the market value of AUM. A decline in the securities markets may cause the value of our AUM to decline or cause investors to redeem assets in favor of investments they perceive offer greater opportunity or lower risk, both of which decrease investment management and other fees and could significantly reduce our revenues and earnings. We do not hedge our revenue stream from this risk through derivatives or other financial contracts. Our growth is dependent to a significant degree upon our ability to attract and retain mutual fund assets, and, in an adverse economic environment, this may prove more difficult. The combination of adverse market conditions reducing both sales and investment management fees could compound one another and materially affect our business.
There May Be Adverse Effects On Our Business If Our Funds’ Performance Declines. Success in the investment management and mutual fund businesses, including the growth and retention of AUM, is dependent on the investment performance of client accounts relative to market conditions andindependent registered public accounting firm, (3) oversees the performance of competing funds. Good relativethe Company’s internal audit function, (4) evaluates the qualifications, performance stimulates salesand independence of the Funds’ sharesindependent registered public accounting firm, (5) reviews external and tends to keep redemptions low. Sales ofinternal audit reports and management’s responses thereto, (6) oversees the Funds’ shares in turn generate higher management fees and distribution revenues. Good relative performance may also attract institutional accounts. It may also result in higher ratings or rankings by research services such as Morningstar, Lipper or eVestment Alliance, which may compound the foregoing effects. Conversely, poor relative performance results in decreased sales, increased redemptions of the Funds’ shares and the loss of institutional accounts, resulting in decreases in our AUM and revenues. Poor investment performance also may adversely affect our ability to expand the distribution of our products through unaffiliated third parties. Further, any drop in market share of mutual fund sales in our broker-dealer channel may further reduce profits as sales of unaffiliated mutual funds are less profitable than sales of our affiliated mutual funds. As of December 31, 2018, 37% our AUM were concentrated in five Funds. As a result, our operating results are significantly affected by the performance of those Funds and our ability to minimize redemptions from and maintain AUM in those Funds. If we experienced a significant amount of redemptions of those Funds for any reason, our revenues would decline and our operating results would be adversely affected. Further, any adverse performance of those Funds may also indirectly affect the net sales and redemptions in our other products, which in turn, may adversely affect our business. We have experienced net outflows in recent years due in part to underperformance of our mutual funds and depressed sales. During fiscal years 2018 and 2017, we had $10.4 billion and $11.4 billion of net outflows, respectively.
In the ordinary course of our business, we may reduce or waive investment management fees, or limit total expenses, on certain products or services for particular time periods to manage fund expenses, or for other reasons, and to help retain or increase AUM. If our revenues decline without a commensurate reduction in our expenses, our net income will be reduced. From time to time, we may experience poor investment performance, on a relative or absolute basis, in certain products or accounts that we manage, which may contribute to a significant reduction in our AUM and revenues. There is typically a lag before improvements in investment performance produce a positive effect on asset flows. The implementation of new fiduciary standards could also reduce asset flows in the event of underperformance. There can be no assurances as to when, or if, investment performance issues will cease to negatively influence our AUM and revenues.
Changes In The Distribution Channels In Which We Operate Could Reduce Our Net Revenues and Adversely Affect Our AUM, Revenues and Growth Prospects. Our ability to market and distribute mutual funds and other
11
investment products we manage is significantly dependent on access to third party financial intermediaries that distribute these products. We sell a significant portion of our investment products through a variety of such intermediaries, including major wire houses, national and regional broker-dealers, defined contribution plan administrators, retirement platforms and registered investment advisers. AUM in our unaffiliated channel at December 31, 2018 were $25.0 billion, or 38% of total AUM. It would be difficult for us to acquire or retain the management of those assets without the assistance of the intermediaries. As third party intermediaries rationalize and reduce the number of product offerings on their platforms, including in response to new fiduciary standards, we cannot provide assurances that we will be able to maintain an adequate number of investment product offerings, or access to these intermediaries, which could have a material adverse effect on our business. Relying on third party intermediaries also exposes us to the risk of increasing costs of distribution, as certain intermediaries with which we conduct business charge fees (largely determined by the distributor) to maintain access to their distribution networks. If we choose not to pay such fees, our ability to distribute through those intermediaries would be limited; significant increases in such fees will cause our distribution costs to increase, which could lower our profitability. In addition, over time certain sectorsintegrity of the financial services industry have become considerably more concentrated, asreporting process, system of internal accounting controls, and financial institutions involved in a broad range of financial services have been acquired by or merged into other firms. In April 2016, the U.S. Department of Labor (the “DOL”) adopted regulations that, among other things, treated as fiduciaries any person who provides investment advice or recommendations to employee benefit plans, plan fiduciaries, plan participants, plan beneficiaries, IRAs or IRA owners (the “DOL Fiduciary Rule”). Although the DOL Fiduciary Rule has been vacated by the U.S. Court of Appeals for the Fifth Circuit, other regulators have enacted or proposed other fiduciary standards that could require modifications to our distribution activitiesstatements and may impact our ability to service clients or engage in certain types of distribution or other business activities. The convergence of all of these activities could result in our competitors gaining greater resources, and we may experience pressure on our pricing and market share as a result, and as some of our competitors seek to increase market share by reducing prices. If these changes continue, our distribution costs could increase as a percentage of our revenues generated. We could experience lower sales or incur higher distribution costs or other developments, which could have an adverse effect on our results of operations if third party selling agreements are terminated or there is a change in the terms of those agreements.
Approximately half of our AUM, $37.2 billion, or 57%, as of December 31, 2018 are held in our broker-dealer channel. The investment products distributed in our broker-dealer channel include our affiliated mutual funds and other products, as well as products issued by unaffiliated mutual fund companies. A significant portionreports of the sales in this channel are sales of affiliated mutual funds, upon which we earn higher revenues from asset management fees as compared to the sale of unaffiliated funds. Sales of affiliated investment products in our broker-dealer channel may decrease (and redemptions increase) materially with the introduction of additional unaffiliated investment products in our advisory programs. Further, qualified accounts, particularly IRAs, make up a significant portion of our AUM and AUA in this channel, and a significant portion of those retirement assets are invested in our affiliated products. The introduction of additional unaffiliated products in this channel, sustained underperformance of key investment products, and the implementation of new fiduciary standards could cause us to experience lower sales of our affiliated investment products, increased redemptions, or other developments that may not be fully offset by higher distribution revenues or other benefits. As a result, our AUM, revenues and earnings may decline. See “Legal, Regulatory and Tax Risks.”
Increasingly, investors, particularly in the institutional market, rely on external consultants and other third party financial professionals for advice on the choice of an investment adviser and investment portfolio. Further, the institutional account business uses referrals from investment consultants, investment advisers and other professionals. These consultants and third parties tend to exert a significant degree of influence over their clients’ choices, and they may favor a competitor of ours. We cannot assure that our investment offerings will be among their recommended choices in the future. The Company, cannot be certain that it will continue to have access to these third party distribution channels or have an opportunity to offer some or all of its investment products through these channels. Further, their recommendations can change over time and we could lose their recommendation and their client assets under our management. Any failure to maintain strong business relationships with these distribution sources and the consultant community could impair our ability to sell our products, which in turn could have a negative effect on our revenues and profitability.
A Significant Percentage Of Our AUM Are Distributed Through Our Unaffiliated Channel, Which Has Higher Redemption Rates Than Our Broker-Dealer Channel. In recent years, we have focused on expanding distribution efforts relating to our unaffiliated channel. The percentage of our AUM in the unaffiliated channel was 38% at December 31, 2018, and the percentage of our total sales represented by the unaffiliated channel was 61% for the year ended December 31, 2018. The success of sales in our unaffiliated channel depends upon our maintaining strong relationships with certain strategic partners, third party distributors and institutional accounts, as well as on the performance of our investment products marketed through this channel. Many of those distribution sources also offer
12
investors competing funds that are internally or externally managed, or may reduce the number of competing products on their platforms through systemic rationalization and reduction, which could limit the distribution of our products. The loss of any of these distribution channels and the inability to continue to access new distribution channels could decrease our AUM and adversely affect our results of operations and growth. There are no assurances that these channels and their client bases will continue to be accessible to us. The loss or diminution of the level of business we do with those providers could have a material adverse effect on our business. Compared to the industry average redemption rate of 24.9% and 22.9% for the years ended December 31, 2018 and 2017, respectively, the unaffiliated channel had redemption rates of 38.7% and 40.1% for the years ended December 31, 2018 and 2017, respectively. Redemption rates were 13.9% and 15.6% for our broker-dealer channel in the same periods, reflecting the higher rate of transferability of investment assets in the unaffiliated channel. However, the modernization of our brokerage and advisory platforms and products and the introduction of additional unaffiliated investment products in our advisory programs, as well as changes resulting from possible implementation of new fiduciary standards, may result in a higher redemption rate in our broker-dealer channel, as Advisors may move to sell more unaffiliated products. An increase in the sale of unaffiliated mutual funds compared to sales of the Funds in our broker-dealer channel may reduce profits, as sales of unaffiliated mutual funds are less profitable than sales of our Funds. See “Legal, Regulatory and Tax Risks.”
Fee Pressures Could Reduce Our Revenues And Profitability. There is an accelerating trend toward lower fees in some segments of the investment management business. The SEC has adopted rules that are designed to alter mutual fund corporate governance, which could result in further downward pressure on investment advisory fees in the mutual fund industry. Investors and clients are increasingly fee sensitive. Active management continues to experience pressure by increased flows to lower fee passive products. This trend has resulted in pressure on active management firms to reduce fees to compete with passive products. New fiduciary standards could increase fee pressure as financial advisors may have more fee sensitivity given their new fiduciary role. In addition, competition could cause us to reduce the fees we charge for products and services. In the event that competitors charge lower fees for substantially similar products, we may be forced to compete on the basis of price in order to attract and retain clients. Effective July 31, 2018, we implemented fee reductions in selected mutual funds. The investment management agreements with the Funds continue in effect from year to year only if approved by the Funds’ board of trustees. Periodic review of these advisory agreements could result in a reduction in investment management fee revenues received from the Funds. Accordingly, there can be no assurance that we will be able to maintain our current fee structure. Fee reductions on existing or future new business could reduce our operating revenues and may adversely affect our business, future revenue and profitability.
The fees we earn vary depending on the type of asset managed, the type of client, the type of asset management product or service provided and whether the product is sub-advised. A shift in the mix of our AUM from higher revenue-generating assets to lower revenue-generating assets may result in a decrease in our operating revenues even if our aggregate AUM do not change. There can be no assurance that we will achieve a more favorable product mix in the future.
Our Ability To Attract And Retain Key Personnel Is Significant To Our Success And Growth. Our success is largely dependent on our ability to attract and retain highly skilled personnel, including our corporate officers, portfolio managers, investment analysts, and sales and client relationship personnel, many of whom have specialized expertise and extensive experience in our industry. The market for experienced asset management personnel is extremely competitive, and is increasingly characterized by the movement of employees among different firms. Most of our employees do not have employment contracts, and generally can terminate their employment with us at any time. Those employees who are subject to employment contracts are generally eligible to terminate their employment at any time upon written notice. Due to the competitive market for these professionals and the success of our highly skilled employees, our costs to attract and retain key personnel are significant. If we are unable to offer competitive compensation or otherwise attract and retain talented individuals,(7) oversees the Company’s ability to compete effectively and retain its existing clients may be materially impacted. Because the investment track record of many of our products and services is often attributed to a small number of individual employees, the departure of one or more of these employees could damage our reputation and result in the loss of assets or client accounts, which could have a material adverse effect on our results of operations and financial condition. If we are unable to attract and retain qualified personnel, it could damage our reputation, make it more difficult to retain and attract new employees, cause our retention costs to increase significantly, and materially adversely impact our financial condition and results of operations.
Additionally, a significant portion of the sales of our mutual funds, investment products, annuities and insurance products are sold in our broker-dealer channel. Our growth prospects are directly affected by the quality, quantity and productivity of Advisors who continue to manage their independent practices through their association with us.
13
There May Be An Adverse Effect On Our Business If Our Investors Redeem The Assets We Manage On Short Notice. Our investment management agreements with institutions and other non-mutual fund accounts are generally terminable upon relatively short notice, and investors in the Funds that we manage may redeem their investments in the Funds at any time without prior notice. Institutional and individual clients can terminate their relationships with us, reduce the aggregate amount of AUM, or shift their funds to other types of accounts with different rate structures for any number of reasons, including investment trends, investment performance, changes in prevailing interest rates, changes in investment preferences of clients, changes in our reputation in the marketplace, changes in management or control of clients or third party distributors with whom we have relationships, loss of key investment management or other personnel, and financial market performance. In addition, in a declining securities market, the pace of mutual fund redemptions and withdrawal of assets from other accounts could accelerate. Poor investment performance generally or relative to other investment management firms tends to result in decreased purchases of Fund shares, increased redemptions of Fund shares, and the loss of institutional or individual accounts. Historically, the risk of our investors redeeming their investments in the Funds on short notice has been greater for assets in our unaffiliated channel. Additionally, redemptions in our broker-dealer channel may increase materially with the introduction of additional unaffiliated investment products in our advisory programs. The implementation of new fiduciary standards could also result in increased redemptions. An increase in redemptions and the corresponding decrease in our AUM may have a material adverse effect on our business.
There May Be Adverse Effects On Our Business Upon The Termination Of, Or Failure To Renew, Certain Agreements. A majority of our revenues are derived from investment management agreements with the Funds that, as required by law, are terminable on 60 days’ notice. Each investment management agreement must be approved and renewed annually by the disinterested members of each Fund’s board of trustees or its shareholders, as required by law. Additionally, our investment management agreements provide for automatic termination in the event of assignment, which includes a change of control, without the consent of our clients and, in the case of the Funds, approval of the Funds’ board of trustees and shareholders to continue the agreements. There can be no assurances that our clients will consent to any assignment of our investment management agreements, or that those and other contracts will not be terminated or will be renewed on favorable terms, if at all, at their expiration and new agreements may not be available. The decrease in revenues that could result from any such event could have a material adverse effect on our business.
We May Be Unable To Develop New Products And Support Provided To New Products May Reduce Fee Revenue, Increase Expenses And Expose Us To Potential Loss On Invested Capital. Our financial performance depends, in part, on our ability to develop, market and manage new investment products and services, which may require significant time and resources, as well as ongoing support and investment. Substantial risk and uncertainties are associated with the introduction of new products and services, including the implementation of new and appropriate operational controls and procedures, shifting client and market preferences, the introduction of competing products or services, and compliance with regulatory requirements. A failure to continue to innovate to introduce new products and services, or to manage successfully the risks associated with such products and services, may impact our market share relevance and may cause our AUM, revenue and earnings to decline.
Additionally, we may support the development of new investment products by waiving a portion of the fees we usually receive for managing such products, by subsidizing expenses, or by making seed capital investments. There can be no assurance that new investment products we develop will be successful, which could have a material adverse effect on our business. Failure to have or devote sufficient capital to support new products could have an adverse impact on our future growth. Seed capital investments in new products utilize capital that would otherwise be available for general corporate purposes and expose us to capital losses due to investment market risk. Our non-operating investment and other income could be adversely affected by the realization of losses upon the disposition of our investments or the recognition of significant other-than-temporary impairments in the case of our available-for-sale portfolio and the recognition of unrealized losses related to our sponsored investment portfolios that are held as trading and accounted for under the equity method. We may use various derivative instruments to mitigate the risk of our seed capital investments, although some market risk would remain. The risk of loss may be greater for seed capital investments that are not hedged, or if an intended hedge does not perform as expected. Our use of derivatives would result in counterparty risk in the event of non-performance by counterparties to these derivative instruments, regulatory risk and the risk that the underlying positions do not move in relation to the related derivative instruments. As a result, volatility in the capital markets may affect the value of our seed capital investments, which may increase the volatility of our earnings and adversely affect our business.
The Failure Or Negative Performance Of Products Offered By Competitors May Cause AUM In Our Similar Products To Decline Irrespective Of The Performance Of Our Products. Many competitors offer similar products to those offered by us and the failure or negative performance of competitors’ products or the loss of confidence in a product
14
type could lead to a loss of confidence in similar products offered by us, irrespective of the performance of our products. Any loss of confidence in a product type could lead to redemptions in such products, which may cause the Company’s AUM to decline and materially affect our business.
The Impairment Or Failure Of Other Financial Institutions Could Adversely Affect Our Business. The investment management activities expose the Company, and the Funds and institutional clients we manage, to many different industries and counterparties. We routinely execute transactions with counterparties, including brokers-dealers, commercial and investment banks, clearing organizations, mutual and hedge funds, and other institutional clients that expose us or the Funds or accounts we manage to operational, credit or other risks in the event that a counterparty with whom the Company transacts defaults on its obligations or if there are other unrelated systemic failures in the markets. Although we regularly assess risks posed by counterparties, such counterparties may be subject to sudden swings in the financial and credit markets that may impair their ability to perform or they may otherwise fail to meet their obligations. Any such impairment failure could negatively impact the performance of products or accounts we manage, which could lead to the loss of clients and may cause our AUM, revenue and earnings to decline.
Restrictions On Our Inability To Use “Soft Dollars” Could Result In An Increase In Our Expenses. On behalf of our mutual fund and investment advisory clients, we make decisions to buy and sell securities for each portfolio, select broker-dealers to execute trades, and negotiate brokerage commission rates. In connection with these transactions, we may receive “soft dollar credits” from broker-dealers that we can use to defray certain of our research and brokerage expenses consistent with Section 28(e) of the Securities Exchange Act of 1934, as amended. We may be limited in our ability to use “soft dollars,”. If our use of “soft-dollars” decreases or is eliminated, including due to the adoption of regulations, our operating expenses could increase. The Markets in Financial Instruments Directive II (“MiFID II”), which was effective in Europe in January 2018, regulates the use of “soft dollars” to pay for research and other services. Although MiFID II does not apply to our investment management business in the United States, it may result in changes to industry practice that limits our use of “soft dollars”.
LEGAL, REGULATORY AND TAX RISKS
Regulatory Risk Is Substantial In Our Business And Regulatory Reforms Could Have A Material Adverse Effect On Our Business, Reputation And Prospects. Virtually all aspects of our business, including the activities of our parent company and our investment advisory and broker-dealer subsidiaries, are heavily regulated, primarily at the federal level. See Item 1 – “Business – Regulation.” The regulatory environment in which we operate frequently changes and has seen a significant increase in regulation in recent years, which could have a material adverse effect on our business.
Potential impacts of current or proposed legal or regulatory requirements include, without limitation, the following:
|
|
|
|
15
|
|
|
|
|
|
|
16
|
|
|
|
|
|
At this time, we cannot predict the nature or full impact of future changes to the legal and regulatory requirements, applicable to our business, nor the extent to which current or future proposals, or possible enforcement proceedings, will impact our business. All of these new(8) reviews and developing laws and regulations are likely to result in greater compliance and administrative burdens on the Company, including the investment of significantdiscusses with management time and resources in order to satisfy new regulatory requirements or to compete in a changed business environment, and the imposition of new compliance costs and/or capital requirements, including costs related to information technology systems. The evolving regulatory environment may impact a number of our service providers and, to the extent such providers alter their services or increase their fees, it may impact our expenses or those of the products we offer. Changes in current rules and regulations that impact the business and financial communities generally, including changes in current legal, regulatory,independent registered public accounting or compliance requirements, including state and federal taxation, or in governmental policies, could have a material adverse impact on our results of operations, financial condition or liquidity.
Compliance Within A Complex Regulatory Environment Imposes Significant Financial And Strategic Costs On Our Business, and Non-Compliance Could Result in Fines And Penalties. Non-compliance with applicable laws or regulations could result in criminal and civil liability, the suspension of our employees, sanctions being levied against us, including fines, penalties and censures, injunctive relief, suspension or expulsion from a certain jurisdiction or market, or the temporary or permanent revocation of licenses or registrations necessary to conduct our business. A regulatory proceeding, even one that does not result in a finding of wrongdoing or sanctions, could consume substantial expenditures of time and capital. Any regulatory investigation and any failure to maintain compliance with applicable laws and regulations could severely damage our reputation or otherwise adversely affect our business and prospects.
Our Business Is Subject To Substantial Risk From Litigation, Regulatory Investigations And Potential Securities Laws Liability. Many aspects of our business involve substantial risks of litigation, regulatory investigations and/or arbitration, and from time to time, we are involved in various legal proceedings in the course of operating our
17
business, including employment-related claims. See Item 3 – “Legal Proceedings.” We are exposed to liability under federal and state securities laws, other federal and state laws and court decisions, as well as rules and regulations promulgated by the SEC, FINRA and other regulatory bodies. These regulatory bodies have the authority to review our products and business practices, and those of our employees and the Advisors, and to bring regulatory or other legal actions against us if, in their view, our practices, or those of our employees or the Advisors, are improper. Actions brought against us may result in awards, settlements, penalties, injunctions or other adverse results, including reputational damage. In addition, we may incur significant expenses in connection with our defense against such actions regardless of their outcome. We, our subsidiaries, and/or certain of our past and present officers, have been named as parties in legal actions, regulatory investigations and proceedings, and/or securities arbitrations in the past, and have been subject to claims alleging violation of such laws, rules and regulations, which have resulted in the payment of fines and settlements. From time to time, we receive subpoenas or other requests for information from governmental and regulatory authorities in connection with certain industry-wide, company-specific or other investigations or proceedings. These examinations, inquiries and proceedings, have in the past and could in the future, if compliance failures or other violations are found, cause the relevant regulator to institute proceedings and impose sanctions for violations. Any such action may also result in litigation by investors in the Funds, other clients or by our stockholders, which could harmfirm the Company’s reputation, potentially harm the investment returns of the Funds, or resultannual and quarterly financial statements, including disclosures made in the Company being liable for damages.
In addition, the Funds to which we provide investment advisory and management services are subject to litigation and governmental and self-regulatory organization investigations and proceedings, any of which could harm the investment returns or reputation of the applicable Fund or result in our investment adviser subsidiaries being liable to the Funds for any resulting damages.
There has been an increase in litigation and regulatory investigations in the asset management and financial services industries in recent years, including client claims, class action suits and government actions alleging substantial monetary damages and penalties. An adverse resolution of any lawsuit, legal or regulatory proceeding or claim against us could result in substantial costs or reputational harm to us, and have a material adverse effect on our business. In addition to these financial costs and risks, the defense of litigation, regulatory investigations or arbitration may divert resources and management’s attention from operations.
Insurance May Not Be Available On A Cost Effective Basis To Protect Us From Liability. We face inherent liability risk related to litigation from mutual fund investors, clients, third party vendors and others, and actions taken by regulatory agencies. To help protect against these potential liabilities, we purchase insurance in amounts, and against risks, that we consider appropriate and commercially reasonable, where such insurance is available at prices we deem acceptable. There can be no assurance, however, that a claim or claims will be covered by insurance or, if covered, will not exceed the limits of available insurance coverage, that any insurer will remain solvent and will meet its obligations to provide us with coverage, or that insurance coverage will continue to be available with sufficient limits at a reasonable cost. Insurance costs are impacted by market conditions and the risk profile of the insured, including prior claims, and may increase significantly over relatively short periods. In addition, certain insurance coverage may not be available or may only be available at prohibitive costs. Renewals of insurance policies may expose us to additional costs through higher premiums or the assumption of higher deductibles or co-insurance liability.
Financial Advisors In Our Broker-Dealer Channel Are Classified As Independent Contractors, And Changes To Their Classification May Increase Our Operating Expenses. From time to time, various legislative or regulatory proposals are introduced at the federal or state levels addressing the criteria for determining the status of independent contractors’ classification as employees for either employment tax purposes (withholding, social security, Medicare and unemployment taxes) or other employment benefits. Currently, most individuals are classified as employees or independent contractors for employment tax purposes based on relevant statutory, regulatory and common law tests, including the multi-factor test utilized by the Internal Revenue Service. We classify Advisors as independent contractors for all purposes, including employment tax. There can be no assurance that legislative, judicial or regulatory (including tax) authorities will not introduce proposals or assert interpretations of existing rules and regulations that would change the independent contractor classification of those Advisors or that private litigants might file actions seeking to change such classification. The costs associated with potential changes, if any, with respect to these independent contractor classifications could have a material adverse effect on our business.
Misconduct By Our Employees And/Or By Advisors Could Result In Liability, Subject Us To Regulatory Sanctions Or Otherwise Adversely Affect Our Business, Results of Operations or Financial Condition. Our business is based on the trust and confidence of our clients, for whom Advisors handle a significant amount of funds, as well as
18
financial and personal information. Misconduct by our employees or by Advisors could result in violations of law, regulatory sanctions and/or serious reputational or financial harm. Misconduct that could occur includes: (i) binding us to transactions that exceed authorized limits; (ii) hiding unauthorized or unsuccessful activities resulting in unknown and unmanaged risks or losses; (iii) improperly using, disclosing or otherwise compromising confidential information; (iv) recommending transactions that are not suitable; (v) engaging in fraudulent or otherwise improper activity, including the misappropriation of funds; (vi) engaging in unauthorized or excessive trading to the detriment of clients; or (vii) otherwise not complying with laws, regulations or our control procedures. Although we have implemented a system of internal controls to minimize the risk of misconduct, there can be no assurance that our controls or precautions to detect and prevent misconduct will be effective in all cases. Preventing and detecting misconduct among Advisors, who are not employees, presents additional challenges. We could be liable in the event of misconduct by employees or Advisors and we could also be subject to regulatory sanctions. Although we believe that we have adequately insured against these risks, there can be no assurance that our insurance will be maintained or that it will be adequate to meet any liability resulting from these activities. Any damage to the trust and confidence placed in us by our clients may cause our AUM to decline, which could adversely affect our reputation, business and prospects and lead to a material adverse effect on our business, results of operations or financial condition.
The Application of Tax Laws and Regulations and Challenges To Our Tax Positions May Adversely Affect Our Effective Tax Rate and Business. The application of complex tax laws and regulations involves numerous uncertainties. Tax authorities may disagree with certain tax positions that we have taken, as we are periodically under audit by various state and federal jurisdictions. We regularly assess the likely outcomes of these audits in order to determine the appropriateness of our tax provision. However, there can be no assurance that we will accurately predict the outcomes of these audits, and the actual outcomes of these audits could have a material impact on our financial statements. Tax authorities may assess additional taxes, which could result in adjustments to, or impact the timing or amount of, taxable income, deductions or other tax allocations, and may adversely affect our effective tax rate and business.
TECHNOLOGY AND OPERATIONAL RISKS
Our Business Is Subject to Numerous Operational Risks. Sustained Interruptions In Our Operating Systems, Technology Systems, Or Other Failure In Operational Execution, Could Materially And Adversely Affect Our Business. We face numerous and complex operational risks related to our business on a day-to-day basis. Operating risks include, but are not limited to:
|
|
|
|
|
|
|
|
|
|
The systems upon which we rely upon to conduct our business may fail to operate properly or become disabled as a result of events that are wholly or partially beyond our control, including a disruption of electrical or communications services, termination or capacity constraints of any of the clearing agents, exchanges, clearing houses or other third party
19
service providers that we use to facilitate, or are component providers to, our brokerage operations, securities transactions and other product manufacturing and distribution activities. Any such failure, termination or constraint could adversely impact our ability to effect transactions, service our clients, manage our exposure to risk, or otherwise achieve desired outcomes. Failure to keep current and accurate books and records can render us subject to disciplinary action by governmental and self-regulatory authorities, as well as to claims by our clients. In connection with the modernization of our brokerage and advisory platforms and products, a significant portion of our software is licensed from and supported by third party vendors upon whom we rely to prevent operating system failure. A suspension or termination of these licenses or the related support, upgrades and maintenance could cause system delays or interruption. If any of our financial, portfolio accounting, brokerage or other data processing systems, or the systems of third parties on whom we rely, do not operate properly or are disabled, or if there are other shortcomings or failures in our internal processes, people or systems, or those of third parties on whom we rely, we could suffer financial loss, a disruption of our businesses, liability to clients, regulatory problems or damage to our reputation.
Interruptions could be caused by operational failures arising from service provider, employee or Advisor error or malfeasance, interference by third parties, including hackers, our implementation of new technology, as well as from our maintenance of existing technology. Our financial, accounting, brokerage, data processing or other operating systems and facilities may fail to operate or report data properly, experience connectivity disruptions or otherwise become disabled as a result of events that are wholly or partially beyond our control, adversely affecting our ability to process transactions or provide products and services to our clients. These interruptions can include fires, floods, earthquakes and other natural disasters, power losses, equipment failures, attacks by third parties, failures of internal or vendor personnel, software, equipment or systems and other events beyond our control. Although we have developed and maintain a comprehensive business continuity plan, and require our key technology vendors and service providers to do the same, there are inherent limitations in such plans and they might not, despite testing and monitoring, operate as designed. Further, we cannot control the execution of any business continuity plans implemented by our service providers.
Failure To Implement New Information Technology Systems Successfully Could Materially And Adversely Affect Our Business. We are in the process of continuing to modernize our brokerage and advisory platforms and products and implementing new information technology systems, including a new business administration platform and integrated data repository that we believe will facilitate and improve our core businesses and our productivity, and position our broker-dealer channel for long-term competitiveness. Additionally, new fiduciary standards could require significant changes to our business operations, including, but not limited to, our distribution methods, compensation models and product shelf. We may be required to make significant capital expenditures to maintain competitive infrastructure. Our technology infrastructure is vital to the competitiveness of our business. We depend on specialized technology to operate our business and a number of our key information technology systems were developed solely to handle our particular information technology infrastructure. Our continued success depends on our ability to effectively integrate necessary technology systems across our organization, and to adopt new or adapt existing technologies to meet client, industry, and regulatory demands. There can be no assurance that we will successfully implement new information technology systems, that our existing technology infrastructure can support new systems or changes to existing systems, that their implementation will be completed in a timely or cost effective manner, or that we will derive the expected benefits from these new systems. Failure to implement or maintain adequate information technology infrastructure may cause us to lose investors, clients, Advisors and fail to maintain regulatory compliance, which could severely damage our reputation, impede our ability to support business growth, and materially and adversely affect our results of operations.
A Failure In Or Breach Of Our Operational Or Security Systems Or Our Technology Infrastructure, Or Those Of Third Parties, Or Failure To Maintain Adequate Business Continuity Plans, Could Result In A Material Adverse Effect On Our Business And Reputation. We are highly dependent upon the use of various proprietary and third party software applications and other technology systems to operate our business. As part of our normal operations, we process a large number of transactions on a daily basis and maintain and transmit confidential client and employee information, the safety and security of which is dependent upon the effectiveness of our information security policies, procedures, capabilities and employees to protect such systems and the data that reside on or are transmitted through them. Although we take protective measures and endeavor to modify these protective measures as circumstances warrant, technology is subject to rapid change and the nature of the threats continue to evolve. As a result, our operating and technology systems, software and networks may fail to operate properly or become disabled, or may be vulnerable to unauthorized access, inadvertent disclosure, loss or destruction of data (including confidential client information), computer viruses or other malicious code, cyber-attacks and other events that could materially damage our operations, have an adverse security impact, or cause the disclosure or modification of sensitive or confidential information. Further, a cybersecurity intrusion could occur and persist for an extended period of time without detection, and any investigation of a cybersecurity intrusion
20
could require a substantial amount of time. During all this time we might not know the extent of the harm or how best to remediate it, and errors or omissions could be repeated or compounded before being discovered and remediated, all of which could aggravate the costs and consequences of the intrusion. Most of the software applications that we use in our business are licensed from, and supported, upgraded and maintained by, third party vendors. A suspension or termination of certain of these licenses or the related support, upgrades and maintenance could cause temporary system delays or interruption. We also take precautions to password protect and/or encrypt our laptops and other mobile electronic hardware. If such hardware is stolen, misplaced or left unattended, it may become vulnerable to hacking or other unauthorized use, creating a possible security risk and resulting in potentially costly actions by us. While we collaborate with clients, vendors and other third parties to develop secure transmission capabilities and protect against cyber-attacks, we cannot ensure that we or any third parties has all appropriate controls in place to protect the confidentiality of such information. Further, while we have in place a disaster recovery plan to address business continuity and catastrophic and unpredictable events, there is no guarantee that this plan will be sufficient in responding to or ameliorating the effects of all disaster scenarios, and we may experience system delays and interruptions as a result of natural disasters, power failures, acts of war, and third party failures. In addition, we rely to varying degrees on outside vendors for disaster contingency support, and we cannot be assured that these vendors will be able to perform in an adequate and timely manner.
The breach of our operational or security systems or our technology infrastructure, or those of third parties, due to one or more of these events could cause interruptions, malfunctions or failures in our operations and/or the loss or inadvertent disclosure of confidential client information could result in substantial financial loss or costs, liability for stolen assets or information, breach of client contracts, client dissatisfaction and/or loss, regulatory actions, remediation costs to repair damage caused by the breach, additional security costs to mitigate against future incidents and litigation costs resulting from the incident. Although we seek to assess regularly and improve our existing business continuity plans, a major disaster, or one that affected certain important operating areas, or our inability to recover successfully should we experience a disaster or other business continuity problem, could materially interrupt our business operations and cause material financial loss, loss of human capital, regulatory actions, reputational harm or legal liability. These events, and those discussed above, could have a material adverse effect on our business and reputation.
Failure To Establish Adequate Controls And Risk Management Policies, The Circumvention Of Controls And Risk Management Policies, Or Fraud Could Have An Adverse Effect On Our Reputation And Financial Position. We have established a comprehensive risk management process and continue to enhance various controls, procedures, policies and systems to monitor and manage risks; however, we cannot assure that such controls, procedures, policies and systems will successfully identify and manage internal and external risks to our business. We are subject to the risk that our employees, contractors or other third parties may deliberately seek to circumvent established controls to commit fraud or act in ways that are inconsistent with our controls, policies and procedures. Persistent attempts to circumvent policies and controls, or repeated incidents involving fraud, conflicts of interests or transgressions of policies and controls, could have a materially adverse effect on our reputation and lead to costly regulatory inquiries, fines and/or sanctions.
Our Own Operational Failures Or Those Of Third Parties We Rely On, Including Failures Arising Out Of Human Error, Could Disrupt Our Business And Damage Our Reputation.Our business is highly dependent on our ability to process, on a daily basis, large numbers of transactions. These transactions generally must comply with client investment guidelines, as well as stringent legal and regulatory standards. Despite our employees being highly trained and skilled, due to the large number of transactions we process, errors may occur. If we make mistakes in performing our services that cause financial harm to our clients, our clients may seek to recover their losses. The occurrence of mistakes, particularly significant ones, could have a material adverse effect on our reputation and business.
RISKS RELATED TO OUR BUSINESS
A Failure To Protect Our Reputation Could Adversely Affect Our Businesses. Our reputation is one of our most important assets. Our ability to attract and retain clients, investors, employees and Advisors is highly dependent upon external perceptions of our Company. Damage to our reputation could cause significant harm to our business and prospects and may arise from numerous sources, including litigation or regulatory actions, failing to deliver minimum standards of service and quality, compliance failures, any perceived or actual weakness in our financial strength or liquidity, technological, cybersecurity, or other security breaches (including attempted breaches) resulting in improper disclosure of client or employee personal information, unethical behavior, and the misconduct of employees, Advisors and counterparties. Negative perceptions or publicity regarding these matters, even if they are baseless or eventually satisfactorily addressed, could damage our reputation among existing and potential clients, investors, employees and Advisors. Reputations may take decades to re-build, and negative incidents can quickly erode trust and confidence,
21
particularly if they result in adverse mainstream and social media publicity, governmental investigations or litigation. Adverse developments with respect to our industry may also, by association, negatively impact our reputation or result in greater regulatory or legislative scrutiny or litigation against us.
Our reputation is also dependent on our continued identification of and mitigation against conflicts of interest, including those relating to our proprietary activities. For example, conflicts may arise between our position as a provider of financial planning services and as an investment adviser to Funds that an Advisor may recommend to a financial planning client. We have procedures and controls that are designed to identify, address and appropriately disclose perceived conflicts of interest. However, identifying and appropriately addressing conflicts of interest is complex, and our reputation could be damaged if we fail, or appear to fail, to address conflicts of interest appropriately.
In addition, the SEC and other federal and state regulators have increased their scrutiny of potential conflicts of interest, including through the implementation of new fiduciary standards. It is possible that potential or perceived conflicts could give rise to litigation or enforcement actions. It is possible also that the regulatory scrutiny of, and litigation in connection with, conflicts of interest will make our clients less willing to enter into transactions in which such a conflict may occur, and may materially affect our business.
Our Expenses Are Subject To Fluctuations That Could Materially Affect Our Operating Results. Our results of operations are dependent on the level of expenses, which can vary significantly from period to period. Our expenses may fluctuate as a result of, among other things:
|
|
|
|
|
|
|
|
|
|
|
|
|
|
|
|
|
|
Increases in our level of expenses, or our inability to reduce our level of expenses, could materially affect our operating results. If we are unable to effect appropriate expense reductions in a timely manner to align with decreases in our revenue due to, among other things, a decline in the level of our AUM or our current business environment, through operational changes or performance improvement, our business may be adversely affected.
We Have Significant Goodwill and Intangibles On Our Balance Sheet, And Any Impairment Could Adversely Affect Our Results of Operations. At December 31, 2018, our total assets were approximately $1.34 billion, of which approximately $145.9 million, or 11%, consisted of goodwill and identifiable intangible assets. See Item 7 – “Management’s Discussion and Analysis of Financial Condition and Results of Operations – Critical Accounting Policies and Estimates.” We complete an ongoing review of goodwill and intangible assets for impairment on an annual basis or more frequently whenever events or a change in circumstances warrant. Important factors in determining whether an impairment of goodwill or intangible assets might exist include significant continued underperformance compared to peers, the likelihood of termination or non-renewal of a mutual fund advisory or sub-advisory contract or substantial changes in
22
revenues earned from such contracts, significant changes in our business and products, material and ongoing negative industry or economic trends, or other factors specific to each asset or subsidiary being tested. Because of the significance of goodwill and other intangibles to our consolidated balance sheets, the impairment analysis is critical. Any changes in key assumptions about our business and our prospects, or changes in market conditions or other externalities, could result in an impairment charge. Any such charge could have a material effect on our results of operations.
We May Engage In Strategic Transactions And Opportunities That Could Create Risk In Order To Maintain Or Enhance Our Competitive Position. The Company has and may acquire or invest in businesses that it believes will add value and generate positive net returns. Any strategic transaction can involve a number of risks, including additional demands on our existing employees; additional or new regulatory requirements, operating facilities and technologies; adverse effects in the event acquired intangible assets or goodwill become impaired; and the existence of liabilities or contingencies not disclosed to or otherwise known by us prior to closing a transaction. Acquisitions also pose the risk that any business we acquire may lose clients or employees or could underperform relative to expectations. We could also experience financial or other setbacks if pending transactions encounter unanticipated problems, including problems related to closing or the integration of technology and new employees. There can be no assurance that we will find suitable candidates for strategic transactions at acceptable prices, have sufficient capital resources to pursue such transactions or be successful in negotiating the required agreements. Following the completion of an acquisition, we may have to rely on the seller to provide administrative and other support, including financial reporting and internal controls, to the acquired business for a period of time. There can be no assurance that such sellers will do so in a manner that is acceptable to us. We may be required to spend additional time or money on integration which could decrease its earnings and prevent the Company from focusing on the development and expansion of its existing business and services. These risks could result in decreased earnings and harm to the Company’s competitive position in the investment management and/or brokerage industry.
Our Ability To Maintain Our Credit Ratings And To Access The Capital Markets In A Timely Manner Should We Seek To Do So Depends On A Number Of Factors. Our access to the capital markets depends significantly on our credit rating. We believe that rating agency concerns include, but are not limited to, the fact that our revenues are exposed to equity market volatility and the potential impact from regulatory changes to the industry. Additionally, rating agencies could decide to downgrade the entire investment management industry based on their perspective of future growth and solvency. Material deterioration of these factors, and others defined by each rating agency, could result in downgrades to our credit ratings, thereby limiting our ability to generate additional financing. We cannot predict what actions rating organizations may take, or what actions we may take in response to the actions of rating organizations, which could adversely affect our business. As with other companies in the financial services industry, our rating could be changed at any time and without any notice by the ratings organizations. Our credit facility borrowing rates are tied to our credit rating. Management believes that solid investment grade ratings are an important factor in winning and maintaining institutional business and strives to manage the Company to maintain such ratings. A downgrade in our credit rating, or the announced potential for a downgrade, could have a significant adverse effect on our financial condition and results of operations.
A reduction in our long-term credit rating could increase our borrowing costs, could limit our access to the capital markets, and may result in outflows thereby reducing AUM and operating revenues. Volatility in global finance markets may also affect our ability to access the capital markets should we seek to do so. If we are unable to access capital markets in a timely manner, our business could be adversely affected.
The Terms Of Our Credit Facility And Senior Unsecured Notes Impose Restrictions On Our Operations That May Adversely Impact Our Prospects And The Operations Of Our Business. There are no assurances that we will be able to raise additional capital if needed, which could negatively impact our liquidity, prospects and operations. On October 20, 2017, we entered into a three-year revolving credit facility (the “Credit Facility”) with various lenders providing for total availability of $100 million. Under the Credit Facility, the lenders may, at their option upon our request, expand the Credit Facility to $200 million. At February 8, 2019, there was no balance outstanding under the Credit Facility. We also have outstanding $95 million of 5.75% senior notes, series B, due 2021, which were issued on January 13, 2011 pursuant to a note purchase agreement. The terms and conditions of the Credit Facility and note purchase agreement impose restrictions that affect, among other things, our ability to incur additional debt, make capital expenditures and acquisitions, merge, sell assets, pay dividends and create or incur liens. Our ability to comply with the financial covenants set forth in the Credit Facility and note purchase agreement could be affected by events beyond our control, and there can be no assurance that we will achieve operating results that will comply with such terms and conditions, a breach of which could result in a default under our credit facility and note purchase agreement. In the event of a default under the Credit Facility
23
and/or note purchase agreement, the banks could elect to declare the outstanding principal amount of the Credit Facility, all interest thereon, and all other amounts payable under the Credit Facility to be immediately due and payable, and the Company’s obligations under the senior unsecured notes could be accelerated and become due and payable, including any make-whole amount, respectively.
Our ability to meet our cash needs and satisfy our debt obligations will depend upon our future operating performance, asset values, the perception of our creditworthiness and, indirectly, the market value of our stock. These factors may be affected by prevailing economic, financial and business conditions and other circumstances, some of which are beyond our control. We anticipate that any funds generated by any borrowings from the Credit Facility and/or cash provided by operating activities will provide sufficient funds to finance our business plans, meet our operating expenses and service our debt obligations as they become due. However, in the event that we require additional capital, there can be no assurance that we will be able to raise such capital when needed or on satisfactory terms, if at all, and there can be no assurance that we will be able to renew or refinance the Credit Facility or senior unsecured notes upon their maturity or on favorable terms. If we are unable to raise capital or obtain financing, we may be forced to incur unanticipated costs or revise our business plan.
Net Capital Requirements May Impede The Business Operations Of Our Subsidiaries. Certain of our subsidiaries are subject to net capital requirements imposed by various federal, state, and foreign authorities. Each of our subsidiaries’ net capital meets or exceeds all current minimum requirements; however, a significant change in the required net capital, an operating loss, or an extraordinary charge against net capital could adversely affect the ability of our subsidiaries to expand or even maintain their operations if we were unable to make additional investments in them.
RISKS RELATED TO OUR COMMON STOCK
The Market Price Of Our Stock May Fluctuate. The market price of our Class A common stock may fluctuate widely, depending upon many factors, some of which may be beyond our control, including changes in expectations concerning our future financial performance and the future performance of the financial services industry in general, including financial estimates and recommendations by securities analysts; differences between our actual financial and operating results and those expected by investors and analysts; our strategic moves and those of our competitors, such as acquisitions, divestitures or restructurings; changes in the regulatory framework of the financial services industry and regulatory action; changes in and the adoption of accounting standards and securities and insurance rating agency processes and standards applicable to our businesses and the financial services industry; and changes in general economic or market conditions. Additionally, stock markets in general have experienced volatility that has often been unrelated to the operating performance of a particular company. These broad market fluctuations may adversely affect the trading price of our common stock.
Our Holding Company Structure Results In Structural Subordination And May Affect Our Ability To Fund Our Operations And Make Payments On Our Debt. We are a holding company and, accordingly, substantially all of our operations are conducted through our subsidiaries. As a result, our cash flow and our ability to service our debt, including $95 million of our senior notes, are dependent upon the earnings of our subsidiaries and the distribution of earnings, loans or other payments by our subsidiaries to us. Our subsidiaries are separate and distinct legal entities and have no obligation to pay any amounts due on our debt or provide us with funds for our payment obligations, whether by dividends, distributions, loans or other payments. In addition, any payment of dividends, distributions, loans or advances to us by our subsidiaries could be subject to statutory or contractual restrictions. Payments to us by our subsidiaries will also be contingent upon our subsidiaries’ earnings and business considerations. Our right to receive any assets of any of our subsidiaries upon their liquidation or reorganization, and therefore the right of the holders of our debt to participate in those assets, would be effectively subordinated to the claims of those subsidiaries’ creditors, including trade creditors. In addition, even if we were a creditor of any of our subsidiaries, our rights as a creditor would be effectively subordinate to any security interest in the assets of our subsidiaries and any indebtedness of our subsidiaries senior to that held by us.
There Are No Assurances That We Will Pay Future Dividends, Which Could Adversely Affect Our Stock Price. The Waddell & Reed Financial, Inc. Board of Directors (the “Board of Directors”) currently intends to continue to declare quarterly dividends on our Class A common stock. However, the declaration and payment of dividends is subject to the discretion of our Board of Directors. Any determination as to the payment of dividends, as well as the level of such dividends, will depend on, among other things, general economic and business conditions, our strategic plans, our financial results and condition, and contractual, legal, and regulatory restrictions on the payment of dividends by us or our subsidiaries. We are a holding company and, as such, our ability to pay dividends is subject to the ability of our subsidiaries
24
to provide us with cash. There can be no assurance that the current quarterly dividend level will be maintained or that we will pay any dividends in any future period. Any change in the level of our dividends or the suspension of the payment of dividends could adversely affect our stock price. See Item 7 – “Management’s Discussion and Analysis of Financial Condition and Results of Operations – Liquidity and Capital Resources.”
Provisions Of Our Organizational Documents Could Deter Takeover Attempts, Which Some Of Our Stockholders May Believe To Be In Their Best Interest. Under our Restated Certificate of Incorporation, our Board of Directors has the authority, without action by our stockholders, to fix certain terms and issue shares of our Preferred Stock, par value $1.00 per share. Actions of our Board of Directors pursuant to this authority may have the effect of delaying, deterring or preventing a change in control of the Company. Other provisions in our Restated Certificate of Incorporation and in our Amended and Restated Bylaws impose procedural and other requirements that could be deemed to have anti-takeover effects, including replacing incumbent directors. Our Board of Directors is divided into three classes, each of which is to serve for a staggered three-year term after the initial classification and election, and incumbent directors may not be removed without cause, all of which may make it more difficult for a third party to gain control of our Board of Directors. In addition, as a Delaware corporation, we are subject to section 203 of the Delaware General Corporation Law. With certain exceptions, section 203 imposes restrictions on mergers and other business combinations between us and any holder of 15% or more of our voting stock.
ITEM 1B. Unresolved Staff Comments
None.
Our existing home office lease agreements cover approximately 298,000 square feet located in Overland Park, Kansas and 38,000 square feet for our disaster recovery facility. We also own three buildings on our home office campus: two 50,000 square foot buildings and a 52,000 square foot building. In the opinion of management, the office space owned and leased by the Company is adequate for existing home office operating needs. In addition, we lease office space utilized by Advisors and field office support staff in various locations throughout the United States totaling approximately 518,000 square feet. Starting in 2018, we are transitioning all of the Advisors currently leasing space from W&R to personal branch offices.
The information set forth in response to Item 103 of Regulation S-K under “Legal Proceedings” is incorporated by reference from Part II, Item 8. “Financial Statements and Supplementary Data,” Note 17 – Contingencies, of this Annual Report on Form 10-K.
ITEM 4. Mine Safety Disclosures
Not applicable.
ITEM 5. Market for Registrant’s Common Equity, Related Stockholder Matters and Issuer Purchases of Equity Securities
Our Class A common stock (“common stock”) is listed on the NYSE under the ticker symbol “WDR.”
According to the records of our transfer agent, we had 2,341 holders of record of common stock as of February 8, 2019. We believe that a substantially larger number of beneficial stockholders hold such shares in depository or nominee form.
Dividends
The declaration of dividends is subject to the discretion of the Board of Directors. We intend, from time to time, to pay cash dividends on our common stock as our Board of Directors deems appropriate, after consideration of our
25
operating results, financial condition, cash and capital requirements, compliance with covenants in the Credit Facility, note purchase agreement and such other factors as the Board of Directors deems relevant. To the extent assets are used to meet minimum net capital requirements under the Net Capital Rule, they are not available for distribution to stockholders as dividends. See Part I, Item 1. “Business—Regulation.” We anticipate that quarterly dividends will continue to be paid. See Part II, Item 7. “Management’s Discussion and Analysis of Financial Condition and Results of Operations—Liquidity and Capital Resources.”
Common Stock Repurchases
Our Board of Directors has authorized the repurchase of our common stock in the open market and/or private purchases. The acquired shares may be used for corporate purposes, including shares issued to employees in our share-based compensation programs. During the year ended December 31, 2018, we repurchased 6,963,269 shares in the open market and privately at an aggregate cost, including commissions, of $135.9 million, including 729,882 shares repurchased from employees to cover their tax withholdings from the vesting of shares granted under our share‑based compensation programs at a cost of $14.5 million. The purchase price paid by us for private repurchases of our common stock from related parties is the closing market price on the purchase date.
The following table sets forth certain information about the shares of common stock we repurchased during the fourth quarter of 2018:
|
|
|
|
|
|
|
|
|
|
|
|
|
|
|
|
| Total Number of |
| Maximum Number (or |
|
|
|
|
|
|
| Shares |
| Approximate Dollar |
|
|
|
|
|
|
| Purchased as |
| Value) of Shares That |
|
| Total Number |
| Average |
| Part of Publicly |
| May Yet Be | |
|
| of Shares |
| Price Paid |
| Announced |
| Purchased Under The | |
Period |
| Purchased |
| per Share |
| Program (1) |
| Program (1) | |
October 1 - October 31 |
| 699,000 |
| $ | 20.26 |
| 699,000 |
| n/a |
November 1 - November 30 |
| 705,242 |
|
| 19.68 |
| 705,000 |
| n/a |
December 1 - December 31 |
| 1,039,481 |
|
| 18.12 |
| 940,000 |
| n/a |
Total |
| 2,443,723 |
| $ | 19.18 |
| 2,344,000 |
|
|
|
|
During the fourth quarter of 2018, 99,723 shares were purchased in connection with funding employee income tax withholding obligations arising from the vesting of restricted shares.
In connection with our existing capital return policy, we intend to complete the repurchase of $250 million of our Class A common stock through late 2019, which is inclusive of buybacks to offset dilution of our equity grants. We continue to engage in opportunistic share repurchases to fulfill the targeted buybacks having repurchased $155.9 million since the fourth quarter of 2017 at a weighted average share price of $19.75.
26
Total Return Performance
Comparison of Cumulative Total Return (1)

The above graph compares the cumulative total stockholder return on the Company’s common stock from December 31, 2013 through December 31, 2018 with the cumulative total return of the Standard & Poor’s 500 Stock Index and the SNL Asset Manager Index. The SNL Asset Manager Index is a composite of 41 publicly traded asset management companies (including, among others, the companies in the peer group reviewed by the Compensation Committee for executive compensation purposes) prepared by S&P Global Market Intelligence. The graph assumes the investment of $100 in the Company’s common stock and in each of the two indices on December 31, 2013 with all dividends being reinvested. The closing price of the Company’s common stock on December 31, 2013 was $65.12 per share. The stock price performance on the graph is not necessarily indicative of future price performance.
|
|
|
|
|
|
|
|
|
|
|
|
|
|
|
| Period Ending |
| ||||||||||
Index |
| 12/31/2013 |
| 12/31/2014 |
| 12/31/2015 |
| 12/31/2016 |
| 12/31/2017 |
| 12/31/2018 |
|
Waddell & Reed Financial, Inc. |
| 100.00 |
| 78.25 |
| 46.83 |
| 34.97 |
| 44.13 |
| 37.52 |
|
SNL Asset Manager |
| 100.00 |
| 105.50 |
| 89.97 |
| 95.18 |
| 126.39 |
| 95.35 |
|
S&P 500 |
| 100.00 |
| 113.69 |
| 115.26 |
| 129.05 |
| 157.22 |
| 150.33 |
|
|
|
27
ITEM 6. Selected Financial Data
The following table sets forth our selected consolidated financial and other data as of the dates and for the periods indicated, and reflects continuing operations data. Selected financial data should be read in conjunction with, and is qualified in its entirety by, “Management’s Discussion and Analysis of Financial Condition and Results of Operations” and our Consolidated Financial Statements and the Notes thereto appearing elsewhere in this Annual Report.
|
|
|
|
|
|
|
|
|
|
|
|
|
|
| For the Year Ended December 31, |
| |||||||||
|
| 2018 |
| 2017 |
| 2016 |
| 2015 |
| 2014 |
| |
|
| (in thousands, except per share data and percentages) |
| |||||||||
Revenues from: |
|
|
|
|
|
|
|
|
|
|
|
|
Investment management fees |
| $ | 507,906 |
| 531,850 |
| 557,112 |
| 709,562 |
| 768,102 |
|
Underwriting and distribution fees |
|
| 550,010 |
| 518,699 |
| 561,670 |
| 663,998 |
| 678,678 |
|
Shareholder service fees |
|
| 102,385 |
| 106,595 |
| 120,241 |
| 143,071 |
| 150,979 |
|
Total revenues |
|
| 1,160,301 |
| 1,157,144 |
| 1,239,023 |
| 1,516,631 |
| 1,597,759 |
|
Net income attributable to Waddell & Reed Financial, Inc. |
| $ | 183,588 |
| 141,279 |
| 156,695 |
| 237,578 |
| 285,360 |
|
Operating margin |
|
| 19 | % | 19 | % | 21 | % | 27 | % | 30 | % |
Net income per share from continuing operations, basic and diluted |
| $ | 2.28 |
| 1.69 |
| 1.90 |
| 2.85 |
| 3.38 |
|
Dividends declared per common share |
| $ | 1.00 |
| 1.63 |
| 1.84 |
| 1.75 |
| 1.45 |
|
Shares outstanding at December 31, |
|
| 76,790 |
| 82,687 |
| 83,118 |
| 82,850 |
| 83,654 |
|
|
|
|
|
|
|
|
|
|
|
|
|
|
|
| As of December 31, |
| |||||||||
|
| 2018 |
| 2017 |
| 2016 |
| 2015 |
| 2014 |
| |
|
| (in millions) |
| |||||||||
Assets under management |
| $ | 65,809 |
| 81,082 |
| 80,521 |
| 104,399 |
| 123,650 |
|
|
|
|
|
|
|
|
|
|
|
|
|
|
Balance sheet data: |
|
|
|
|
|
|
|
|
|
|
|
|
Goodwill and identifiable intangible assets |
| $ | 145.9 |
| 147.1 |
| 148.6 |
| 158.1 |
| 158.1 |
|
Total assets |
|
| 1,344.1 |
| 1,384.4 |
| 1,406.3 |
| 1,555.2 |
| 1,511.1 |
|
Long-term debt |
|
| 94.9 |
| 94.8 |
| 189.6 |
| 189.4 |
| 189.3 |
|
Total liabilities |
|
| 449.2 |
| 497.0 |
| 551.6 |
| 708.7 |
| 725.0 |
|
Total Waddell & Reed stockholders’ equity |
|
| 883.5 |
| 872.9 |
| 844.0 |
| 846.5 |
| 786.1 |
|
28
ITEM 7. Management’s Discussion and Analysis of Financial Condition and Results of Operations
The following should be read in conjunction with the “Selected Financial Data” and our Consolidated Financial Statements and Notes thereto appearing elsewhere in this Annual Report.
Strategic Initiatives
In 2017, we announced an actionable plan around four strategic pillars. These pillars include (1) strengthening our investment management resources, processes and results; (2) reinvigorating our product line and sales; (3) continuing the evolution of our broker-dealer to a self-sustaining, fully competitive and profitable entity; and (4) making investments in support of our evolving business model, while improving efficiency. The following includes highlights of our progress to-date.
To strengthen our investment management resources, processes and results, we are working to align investment management resources and our philosophy toward the strongest growth opportunities, key products and new initiatives, and to fortify the foundation of our active management heritage. Over the course of 2018, we continued to invest in our people, technology resources, and risk management capabilities. We continue to move towards team-based portfolio management of the Funds, and have fortified our research team with additional investment analysts, while continuing to foster a collaborative culture across our investment management professionals. We are encouraged by recent performance improvements, in fact, despite market volatility in the fourth quarter of 2018, relative investment performance at year-end 2018 improved compared to the prior year across much of our complex.
To reinvigorate our product line and sales, we continue to manage the product line dynamically to respond to the competitive environment and opportunities for growth, and are directing sales activities to the best opportunities across product, channel, distributor and advisor. In 2018, we completed the merger of the remaining Advisors Funds into Ivy Funds, resulting in operational efficiency and added fund-level scale. We also announced and completed the merger of six Ivy Funds and one Ivy VIP fund into other Ivy Funds, and one Ivy VIP fund, respectively, with generally similar investment objectives, creating more economies of scale for the benefit of fund shareholders. Finally, we implemented fee reductions in selected mutual funds, effective July 31, 2018, as we continue to focus on strategies where we feel we are best positioned to compete. Although there are many factors at play, net outflows have slowed 9% year-over-year on a reported basis and 24% excluding the outsized impact of Institutional flows due to personnel changes.
To continue the evolution of our broker-dealer to a self-sustaining, fully competitive and profitable entity, we are improving competitiveness by evolving the platform and product offerings and moving to an industry standard compensation and services model. During 2018, we further realigned our field resources and announced plans to exit leased field real-estate, while enhancing our Advisor payout grid to what we believe is best-in-class. We continue to direct efforts around a field services model focused on delivering robust practice development, while expanding recruiting efforts and creating a diamond service group for top Advisors. We also continue to enhance the technology platform and launched plans for an advisor technology platform that integrates all of our enterprise technology applications and provides a desktop solution where Advisors can manage all aspects of their business, allowing Advisors to work efficiently and seamlessly.
To focus investment in support of our evolving business model, while improving efficiency, we are advancing our culture by further investing in our people through talent management, while ensuring our resources are aligned in the most productive and effective manner as we build a framework for long-term success. Additionally, we introduced an enterprise project management organization (PMO) and related project processes and governance, and are driving targeted allocation and efficient utilization of corporate resources. We continue to focus on long-term controllable expenses, which includes compensation, general and administrative, technology, occupancy and marketing and advertising costs. We’ve made considerable progress on this front, achieving our previously stated goal of adding $30 million, on a run-rate basis, to pre-tax income by the end of 2018, and having reduced controllable expenses nearly 8% since 2015, while making targeted investments in growth areas.
Operating Results
We earned $1.2 billion in revenues in 2018, which was relatively unchanged as compared to 2017. Average AUM were $78.3 billion in 2018 compared to $81.0 billion in 2017. Net income attributable to Waddell & Reed Financial, Inc. increased 30% compared to 2017, while our operating margin was relatively unchanged from 2017.
29
Our balance sheet remains strong, as we ended the year with cash and investments of $837.9 million, excluding noncontrolling interests. There were no borrowings under the Credit Facility at December 31, 2018 or at any point during the year.
Assets Under Management
AUM of $65.8 billion at December 31, 2018 decreased $15.3 billion, or 19%, compared to $81.1 billion at December 31, 2017. The decrease in AUM is due to net outflows of $10.4 billion and market depreciation of $4.9 billion.
Change in Assets Under Management(1)
|
|
|
|
|
|
|
|
|
|
| |
|
|
|
|
|
|
|
|
|
| ||
|
|
|
|
|
| Broker- |
|
|
| ||
|
| Unaffiliated (2) |
| Institutional |
| Dealer |
| Total |
| ||
|
| (in millions) |
| ||||||||
2018 |
|
|
|
|
|
|
|
|
|
| |
Beginning Assets |
| $ | 31,133 |
| 6,289 |
| 43,660 |
| 81,082 |
| |
Sales(3) |
|
| 7,287 |
| 873 |
| 3,835 |
| 11,995 |
| |
Redemptions |
|
| (11,399) |
| (4,108) |
| (6,889) |
| (22,396) |
| |
Net Exchanges |
|
| 759 |
| 511 |
| (1,270) |
| — |
| |
Net Flows |
|
| (3,353) |
| (2,724) |
| (4,324) |
| (10,401) |
| |
Market Action |
|
| (2,803) |
| 90 |
| (2,159) |
| (4,872) |
| |
Ending Assets at December 31, 2018 |
| $ | 24,977 |
| 3,655 |
| 37,177 |
| 65,809 |
| |
2017 |
|
|
|
|
|
|
|
|
|
| |
Beginning Assets |
| $ | 30,295 |
| 7,904 |
| 42,322 |
| 80,521 |
| |
Sales(3) |
|
| 7,243 |
| 356 |
| 4,221 |
| 11,820 |
| |
Redemptions |
|
| (11,990) |
| (3,446) |
| (7,753) |
| (23,189) |
| |
Net Exchanges |
|
| 1,001 |
| 6 |
| (1,007) |
| — |
| |
Net Flows |
|
| (3,746) |
| (3,084) |
| (4,539) |
| (11,369) |
| |
Market Action |
|
| 4,584 |
| 1,469 |
| 5,877 |
| 11,930 |
| |
Ending Assets at December 31, 2017 |
| $ | 31,133 |
| 6,289 |
| 43,660 |
| 81,082 |
| |
2016 |
|
|
|
|
|
|
|
|
|
| |
Beginning Assets |
| $ | 45,641 |
| 15,414 |
| 43,344 |
| 104,399 |
| |
Sales(3) |
|
| 6,362 |
| 1,065 |
| 4,287 |
| 11,714 |
| |
Redemptions |
|
| (22,438) |
| (8,860) |
| (5,736) |
| (37,034) |
| |
Net Exchanges |
|
| 458 |
| 254 |
| (712) |
| — |
| |
Net Flows |
|
| (15,618) |
| (7,541) |
| (2,161) |
| (25,320) |
| |
Market Action |
|
| 272 |
| 31 |
| 1,139 |
| 1,442 |
| |
Ending Assets at December 31, 2016 |
| $ | 30,295 |
| 7,904 |
| 42,322 |
| 80,521 |
| |
|
|
|
|
|
|
30
Average AUM, which are generally more indicative of trends in revenue from investment management services than the change in ending AUM, decreased by 3% compared to 2017.
Average Assets Under Management
|
|
|
|
|
|
|
|
|
|
|
|
|
|
|
|
| 2018 |
| 2017 |
| 2016 |
| |||||||
|
|
|
|
| Percentage |
|
|
| Percentage |
|
|
| Percentage |
|
|
| Average |
| of Total |
| Average |
| of Total |
| Average |
| of Total |
| |
|
| (in millions, except percentage data) |
| |||||||||||
Distribution Channel: |
|
|
|
|
|
|
|
|
|
|
|
|
|
|
Unaffiliated |
|
|
|
|
|
|
|
|
|
|
|
|
|
|
Equity |
| $ | 24,164 |
| 81 | % | 23,549 |
| 78 | % | 28,078 |
| 79 | % |
Fixed income |
|
| 5,607 |
| 19 | % | 6,662 |
| 22 | % | 7,289 |
| 21 | % |
Money market |
|
| 92 |
| — |
| 105 |
| — |
| 159 |
| — |
|
Total |
| $ | 29,863 |
| 100 | % | 30,316 |
| 100 | % | 35,526 |
| 100 | % |
Institutional |
|
|
|
|
|
|
|
|
|
|
|
|
|
|
Equity |
| $ | 5,410 |
| 99 | % | 6,773 |
| 96 | % | 10,026 |
| 93 | % |
Fixed income |
|
| 54 |
| 1 | % | 298 |
| 4 | % | 711 |
| 7 | % |
Money market |
|
| — |
| — |
| — |
| — |
| — |
| — |
|
Total |
| $ | 5,464 |
| 100 | % | 7,071 |
| 100 | % | 10,737 |
| 100 | % |
Broker-Dealer |
|
|
|
|
|
|
|
|
|
|
|
|
|
|
Equity |
| $ | 31,446 |
| 73 | % | 31,485 |
| 72 | % | 30,681 |
| 72 | % |
Fixed income |
|
| 9,870 |
| 23 | % | 10,243 |
| 24 | % | 9,828 |
| 23 | % |
Money market |
|
| 1,696 |
| 4 | % | 1,862 |
| 4 | % | 2,029 |
| 5 | % |
Total |
| $ | 43,012 |
| 100 | % | 43,590 |
| 100 | % | 42,538 |
| 100 | % |
Total by Asset Class: |
|
|
|
|
|
|
|
|
|
|
|
|
|
|
Equity |
| $ | 61,020 |
| 78 | % | 61,807 |
| 76 | % | 68,785 |
| 77 | % |
Fixed income |
|
| 15,531 |
| 20 | % | 17,203 |
| 21 | % | 17,828 |
| 20 | % |
Money market |
|
| 1,788 |
| 2 | % | 1,967 |
| 3 | % | 2,188 |
| 3 | % |
Total |
| $ | 78,339 |
| 100 | % | 80,977 |
| 100 | % | 88,801 |
| 100 | % |
31
The following table summarizes our five largest mutual funds as of December 31, 2018 by ending AUM and investment management fees, with the comparative positions in 2017 and 2016. The AUM and management fees of these mutual funds are presented as a percentage of our total AUM and total management fees. The increase in AUM in the Ivy Science & Technology, Ivy Mid Cap Growth and Ivy Large Cap Growth Funds is primarily due to the Advisors Fund mergers during the first quarter of 2018.
Five Largest Mutual Funds by Ending Assets Under Management and Investment Management Fees
|
|
|
|
|
|
|
|
|
|
|
|
|
|
|
|
| 2018 |
| 2017 |
| 2016 |
| |||||||
|
|
|
|
| Percentage |
|
|
| Percentage |
|
|
| Percentage |
|
|
| Ending |
| of Total |
| Ending |
| of Total |
| Ending |
| of Total |
| |
|
| (in millions, except percentage data) |
| |||||||||||
By AUM: |
|
|
|
|
|
|
|
|
|
|
|
|
|
|
|
|
|
|
|
|
|
|
|
|
|
|
|
|
|
Ivy Science & Technology |
| $ | 6,345 |
| 10 | % | 4,116 |
| 5 | % | 3,829 |
| 5 | % |
Ivy International Core Equity |
|
| 5,438 |
| 8 | % | 7,140 |
| 9 | % | 4,405 |
| 5 | % |
Ivy High Income |
|
| 4,857 |
| 7 | % | 4,180 |
| 5 | % | 4,616 |
| 6 | % |
Ivy Mid Cap Growth |
|
| 3,983 |
| 6 | % | 2,377 |
| 3 | % | 2,363 |
| 3 | % |
Ivy Large Cap Growth |
|
| 3,873 |
| 6 | % | 1,898 |
| 2 | % | 1,539 |
| 2 | % |
Total |
| $ | 24,496 |
| 37 | % | 19,711 |
| 24 | % | 16,752 |
| 21 | % |
|
| (in thousands, except percentage data) |
| |||||||||||
By Management Fees: |
|
|
|
|
|
|
|
|
|
|
|
|
|
|
Ivy Science & Technology |
| $ | 56,997 |
| 11 | % | 32,933 |
| 6 | % | 36,428 |
| 7 | % |
Ivy International Core Equity |
|
| 49,645 |
| 10 | % | 45,017 |
| 8 | % | 35,181 |
| 6 | % |
Ivy Mid Cap Growth |
|
| 30,885 |
| 6 | % | 19,198 |
| 4 | % | 23,528 |
| 4 | % |
Ivy Core Equity |
|
| 28,264 |
| 6 | % | 11,044 |
| 2 | % | 6,675 |
| 1 | % |
Ivy High Income |
|
| 27,971 |
| 5 | % | 23,672 |
| 4 | % | 25,106 |
| 5 | % |
Total |
| $ | 193,762 |
| 38 | % | 131,864 |
| 24 | % | 126,918 |
| 23 | % |
Assets Under Administration
AUA includes both client assets invested in the Funds and in other companies’ products that are distributed through W&R and held in brokerage accounts, within our fee-based asset allocation programs, or held directly with the funds. AUA decreased 10% as compared to 2017, primarily due to a reduction in non-advisory assets, primarily due to market action. At the end of 2018, there were 1,060 Advisors and 343 licensed advisor associates, both associated with W&R, for a total of 1,403. Average productivity per Advisor for the year ended December 31, 2018 was $378 thousand, an increase of 48% as compared to 2017. The decrease in Advisors, along with an increase in productivity is due to our efforts to transform W&R into a self-sustaining, fully competitive and profitable entity, with a focus on higher producing Advisors.
32
|
|
|
|
|
|
|
|
|
|
|
|
|
|
|
|
|
|
|
|
|
|
|
|
|
|
|
|
|
| For the Year ended December 31, |
| ||||
|
|
| 2018 |
|
|
| 2017 |
|
|
|
| (in millions, except advisor data |
| ||||
|
|
| and percentages) |
| ||||
AUA |
|
|
|
|
|
|
|
|
Advisory assets |
| $ | 21,207 |
|
|
| 21,613 |
|
Non-advisory assets |
|
| 30,059 |
|
|
| 35,073 |
|
Total AUA |
| $ | 51,266 |
|
|
| 56,686 |
|
|
|
|
|
|
|
|
|
|
|
|
|
|
|
|
|
|
|
Net new advisory assets (1) |
| $ | 575 |
|
|
| 471 |
|
Net new non-advisory assets (1), (2) |
|
| (3,670) |
|
|
| (3,573) |
|
Total net new assets (1), (2) |
| $ | (3,095) |
|
|
| (3,102) |
|
|
|
|
|
|
|
|
|
|
|
|
|
|
|
|
|
|
|
Annualized advisory AUA growth (3) |
|
| 2.7 | % |
|
| 2.6 | % |
Annualized AUA growth (3) |
|
| (5.5) | % |
|
| (5.9) | % |
|
|
|
|
|
|
|
|
|
|
|
|
|
|
|
|
|
|
Advisor count |
|
| 1,060 |
|
|
| 1,367 |
|
Average trailing 12-month production per Advisor (4) (in thousands) |
| $ | 378 |
|
|
| 256 |
|
Advisor associate count |
|
| 343 |
|
|
| 265 |
|
|
|
|
|
|
|
|
|
|
|
|
|
|
|
|
|
|
|
|
|
|
|
|
|
|
|
Results of Operations
Net Income
|
|
|
|
|
|
|
|
|
|
|
|
|
|
| For the Year ended |
|
|
|
|
| |||||
|
| December 31, |
| Variance |
| |||||||
|
|
|
|
|
|
|
|
| 2018 vs. |
| 2017 vs. |
|
|
| 2018 |
| 2017 |
| 2016 |
| 2017 |
| 2016 |
| |
|
| (in thousands, except per share and percentage data) |
| |||||||||
Net income attributable to Waddell & Reed Financial, Inc. |
| $ | 183,588 |
| 141,279 |
| 156,695 |
| 30 | % | (10) | % |
Earnings per share, basic and diluted |
| $ | 2.28 |
| 1.69 |
| 1.90 |
| 35 | % | (11) | % |
Operating Margin |
|
| 19 | % | 19 | % | 21 | % | — |
| (10) | % |
33
Total Revenues
Total revenues were relatively consistent in 2018 as compared to 2017. Total revenues decreased 7% in 2017 compared to 2016, primarily due to a decrease in average AUM of 9%.
|
|
|
|
|
|
|
|
|
|
|
|
|
|
| For the Year ended |
|
|
|
|
| |||||
|
| December 31, |
| Variance |
| |||||||
|
|
|
|
|
|
|
|
| 2018 vs. |
| 2017 vs. |
|
|
| 2018 |
| 2017 |
| 2016 |
| 2017 |
| 2016 |
| |
|
| (in thousands, except percentage data) |
| |||||||||
Investment management fees |
| $ | 507,906 |
| 531,850 |
| 557,112 |
| (5) | % | (5) | % |
Underwriting and distribution fees |
|
| 550,010 |
| 518,699 |
| 561,670 |
| 6 | % | (8) | % |
Shareholder service fees |
|
| 102,385 |
| 106,595 |
| 120,241 |
| (4) | % | (11) | % |
Total revenues |
| $ | 1,160,301 |
| 1,157,144 |
| 1,239,023 |
| — |
| (7) | % |
Investment Management Fee Revenues
Investment management fee revenues decreased $23.9 million, or 5%, in 2018 and decreased $25.3 million, or 5%, in 2017. Investment management fee revenues are based on the level of average client AUM and are affected by sales, financial market conditions, redemptions and the composition of assets. The following graph illustrates the direct relationship between average client AUM and investment management fee revenues for the years ending December 31, 2018, 2017 and 2016.
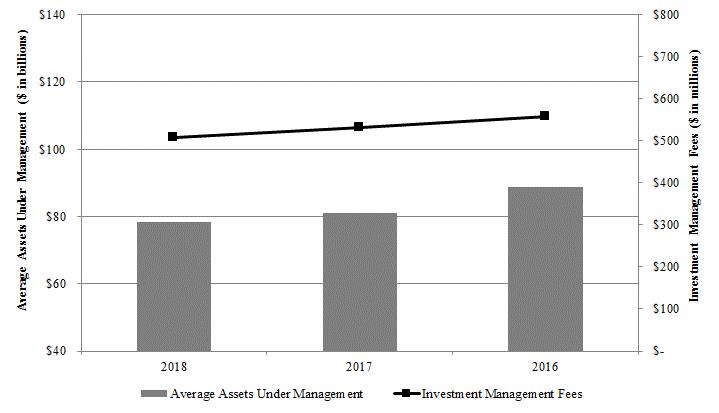
34
The following table summarizes investment management fee revenues, related average AUM, fee waivers and investment management fee rates for the years ending December 31, 2018, 2017 and 2016. Fee waivers for the Funds are recorded as an offset to investment management fees up to the amount of fees earned.
|
|
|
|
|
|
|
|
|
|
|
|
|
|
|
|
| For the Year ended |
|
|
|
|
| |||||||
|
| December 31, |
| Variance |
| |||||||||
|
|
|
|
|
|
|
|
|
|
| 2018 vs. |
| 2017 vs. |
|
|
| 2018 |
| 2017 |
| 2016 |
| 2017 |
| 2016 |
| |||
|
| (in thousands, except for management fee rate, average assets and |
| |||||||||||
|
| percentage data) |
| |||||||||||
Funds investment management fees (net) |
| $ | 486,181 |
|
| 506,868 |
|
| 521,207 |
| (4) | % | (3) | % |
Funds average assets (in millions) |
|
| 72,875 |
|
| 73,906 |
|
| 78,065 |
| (1) | % | (5) | % |
Funds management fee rate (net) |
|
| 0.6671 | % |
| 0.6858 | % |
| 0.6677 | % |
|
|
|
|
|
|
|
|
|
|
|
|
|
|
|
|
|
|
|
Total fee waivers |
| $ | 17,696 |
|
| 7,648 |
|
| 8,110 |
| 131 | % | (6) | % |
|
|
|
|
|
|
|
|
|
|
|
|
|
|
|
Institutional investment management fees (net) |
| $ | 21,725 |
|
| 24,982 |
|
| 35,905 |
| (13) | % | (30) | % |
Institutional average assets (in millions) |
|
| 5,464 |
|
| 7,071 |
|
| 10,737 |
| (23) | % | (34) | % |
Institutional management fee rate (net) |
|
| 0.4057 | % |
| 0.3786 | % |
| 0.3502 | % |
|
|
|
|
Revenues from investment management services provided to our retail mutual funds, which are distributed through the unaffiliated and broker-dealer channels, decreased $20.7 million in 2018, or 4%, compared to 2017, primarily due to an increase in fee waivers due to fee reductions in selected mutual funds that were implemented as of July 31, 2018, as well as the merger of the remaining Advisors Funds into Ivy Funds. Additionally, revenues decreased due to a slight decrease in average AUM and a shift in the mix of our AUM. Absent improvement in flow trends or markets, our revenues in 2019 could be further reduced by a full year impact of fee reductions we put into place during 2018. Revenues from investment management services provided to our mutual funds decreased $14.3 million in 2017, or 3%, compared to 2016. Investment management fee revenues declined less on a percentage basis than the related average AUM due to an increase in the average management fee rate. A lower asset base in the Ivy Asset Strategy Fund resulted in increased management fee rates from 2016 to 2017, due to the fund having a management fee rate less than our average management fee rate. Fee waivers declined in 2017 primarily due to lower money market fee waivers as a result of federal interest rate hikes in 2017 and 2016 and were partially offset by increases due to the launch of new funds.
Institutional account revenues in 2018 decreased $3.3 million, or 13%, compared to 2017 due to a 23% decrease in average AUM, which was partially offset by an increased management fee rate. Outflows in assets for 2018 in this channel are primarily due to personnel changes at the portfolio manager level. Additionally, we have been notified of approximately $0.5 billion of redemptions in our institutional channel for first half of 2019. Institutional account revenues in 2017 decreased $10.9 million, or 30%, compared to 2016 due to a 34% decrease in average AUM. For both comparative periods, the increase in the average management fee rate was due to a mix‑shift of assets to client accounts with higher management fee rates.
|
|
|
|
|
|
|
|
|
| Long-term redemption rates |
| ||||
|
| (excludes money market redemptions) |
| ||||
|
| for the year ended December 31, |
| ||||
|
| 2018 |
| 2017 |
| 2016 |
|
Unaffiliated channel |
| 38.7 | % | 40.1 | % | 63.7 | % |
Institutional channel |
| 75.2 | % | 48.7 | % | 82.5 | % |
Broker-Dealer channel |
| 13.9 | % | 15.6 | % | 11.1 | % |
Total |
| 27.8 | % | 27.8 | % | 41.1 | % |
In 2018, as compared to 2017, the long-term redemption rate improved slightly as we saw lower redemptions in key strategies due to improving performance and market dynamics. The decreased long-term redemption rate in 2017 compared to 2016 for the unaffiliated channel was primarily driven by improved redemption rates in the Asset Strategy funds. Prolonged redemptions in the unaffiliated channel could negatively affect revenues in future periods. The increased long-term redemption rate for our institutional channel in 2018 compared to 2017 was driven by larger client redemptions than the comparative period, primarily due to portfolio manager turnover. In 2017, the institutional channel experienced an overall decrease in redemption activity with less significant redemptions from our core equity, core fixed income and large cap core strategies, compared to 2016. In the broker-dealer channel, we historically experienced a long‑term redemption rate lower than that of the industry average. With the modernizing of our broker-dealer platform and the
35
introduction of new fee-based products, such as the launch of the MAP Navigator product in 2017 (which increases the availability of third party products), we experienced pressure on the long-term redemption rate in 2017 but saw a slight improvement in 2018. The industry average redemption rate in 2018, based on data provided by the ICI, was 24.9% versus our rate of 27.8% in total and 24.1% excluding the institutional channel, which had elevated redemptions in 2018, primarily due to certain portfolio manager departures.
Underwriting and Distribution
We earn underwriting and distribution fee revenues primarily by distributing the Funds pursuant to an underwriting agreement with each Fund (except Ivy VIP as explained below) and by distributing mutual funds offered by other unaffiliated companies. Pursuant to each agreement, we offer and sell the Funds’ shares on a continuous basis (open‑end funds) and pay certain costs associated with underwriting and distributing the Funds, including the costs of developing and producing sales literature and printing of prospectuses, which may be either partially or fully reimbursed by the Funds. The Funds are sold in various classes that are structured in ways that conform to industry standards (i.e., “front‑end load,” “back‑end load,” “level‑load” and institutional).
We offer several fee‑based asset allocation products. These products offer clients a selection of traditional asset allocation models, as well as features such as systematic rebalancing and client and Advisor participation in determining asset allocation across asset classes. We earn asset‑based fees on our asset allocation products. In 2016, we converted the load‑waived Class A shares previously offered in our investment advisory programs to institutional share classes, which do not charge a Rule 12b‑1 fee. As a result, we no longer collect Rule 12b‑1 asset‑based service and distribution fee revenue on these AUM.
We distribute variable products offering Ivy VIP as investment vehicles pursuant to general agency arrangements with our business partners and receive commissions, marketing allowances and other compensation as stipulated by such agreements. In connection with these arrangements, Ivy VIP is offered and sold on a continuous basis.
In addition to distributing variable products, we distribute a number of other insurance products through our insurance agency subsidiaries, including individual term life, group term life, whole life, accident and health, long‑term care, Medicare supplement and disability insurance. We receive commissions and compensation from various underwriters for distributing these products. We are not an underwriter for any insurance policies.
Underwriting and Distribution Fee Revenues
The following tables summarize the significant components of underwriting and distribution fee revenues segregated by distribution channel for the years ended December 31, 2018, 2017 and 2016:
|
|
|
|
|
|
|
|
|
|
| Total |
| |||||
|
| 2018 |
| 2017 |
| 2016 |
| |
|
| (in thousands) |
| |||||
Underwriting and distribution fee revenues: |
|
|
|
|
|
|
|
|
Fee-based asset allocation product revenues |
| $ | 269,069 |
| 240,089 |
| 224,319 |
|
Rule 12b-1 service and distribution fees |
|
| 148,979 |
| 167,163 |
| 215,186 |
|
Sales commissions on front-end load mutual fund and variable annuity sales |
|
| 56,781 |
| 56,791 |
| 67,734 |
|
Sales commissions on other products |
|
| 36,131 |
| 31,286 |
| 31,246 |
|
Other revenues |
|
| 39,050 |
| 23,370 |
| 23,185 |
|
Total |
| $ | 550,010 |
| 518,699 |
| 561,670 |
|
|
|
|
|
|
|
|
|
|
|
| Unaffiliated Channel |
| |||||
|
| 2018 |
| 2017 |
| 2016 |
| |
|
| (in thousands) |
| |||||
Underwriting and distribution fee revenues: |
|
|
|
|
|
|
|
|
Rule 12b-1 service and distribution fees |
| $ | 78,041 |
| 91,313 |
| 121,926 |
|
Sales commissions on front-end load mutual fund sales |
|
| 1,886 |
| 1,498 |
| 565 |
|
Other revenues |
|
| 568 |
| 1,182 |
| 2,924 |
|
Total |
| $ | 80,495 |
| 93,993 |
| 125,415 |
|
36
|
|
|
|
|
|
|
|
|
|
| Broker-Dealer Channel |
| |||||
|
| 2018 |
| 2017 |
| 2016 |
| |
|
| (in thousands) |
| |||||
Underwriting and distribution fee revenues: |
|
|
|
|
|
|
|
|
Fee-based asset allocation product revenues |
| $ | 269,069 |
| 240,089 |
| 224,319 |
|
Rule 12b-1 service and distribution fees |
|
| 70,938 |
| 75,850 |
| 93,260 |
|
Sales commissions on front-end load mutual fund and variable annuity sales |
|
| 54,895 |
| 55,293 |
| 67,169 |
|
Sales commissions on other products |
|
| 36,131 |
| 31,286 |
| 31,246 |
|
Other revenues |
|
| 38,482 |
| 22,188 |
| 20,261 |
|
Total |
| $ | 469,515 |
| 424,706 |
| 436,255 |
|
A significant portion of underwriting and distribution revenues are received from asset‑based fees earned on our asset allocation products and commissions. Underwriting and distribution revenues also include Rule 12b‑1 asset‑based service and distribution fees earned on load, load‑waived and deferred‑load products sold by Advisors and third party intermediaries, sales commissions charged on front‑end load products sold by Advisors, including mutual fund Class A shares (those sponsored by the Company and those underwritten by other non‑proprietary mutual fund companies), variable annuities, sales of other insurance products, and financial planning fees. A significant amount of unaffiliated channel mutual fund sales are load‑waived. We recover certain of our underwriting and distribution costs through Rule 12b‑1 service and distribution fees, which are paid by the Funds. All Rule 12b‑1 service and distribution fee revenue received from the Funds is recorded on a gross basis.
Underwriting and distribution revenues earned in 2018 increased by $31.3 million, or 6%, compared to 2017. Revenues from fee‑based asset allocation products increased 12% due to an increase in fee-based asset allocation average assets of 12%. Sales commissions on other products increased $4.8 million, or 15%, primarily due to an increase in fixed indexed annuity sales. Other revenues increased $16.3 million, or 73%, compared to 2017, primarily due to an increase in payments received from Advisors for services. Starting in 2018, the compensation structure for Advisors has been revised to align W&R more closely with industry standards, while offering competitive programs and services to Advisors. Under the new structure, the Company receives compensation for certain services made available to our Advisors, including, but not limited to, facilities, technology and supervision. These increases were partially offset by a decrease in Rule 12b‑1 asset based service and distribution fees across both channels of $18.2 million, or 11%, compared to 2017, driven by a decrease in average mutual fund AUM for which we earn Rule 12b‑1 revenues. Due to current industry trends toward institutional share classes in fee based programs we anticipate a continued decrease in 12b-1 service and distribution fees and sales commissions.
Underwriting and distribution revenues earned in 2017 decreased by $43.0 million, or 8%, compared to 2016. Rule 12b‑1 asset based service and distribution fees across both channels decreased $48.0 million, or 22%, year over year, driven by a decrease in average mutual fund AUM for which we earn Rule 12b‑1 revenues and the share class conversion from load-waived Class A shares previously in our advisory products to institutional share classes, which do not charge a Rule 12b-1 fee. Sales commissions on front-end load mutual fund and variable annuity sales decreased $10.9 million, or 16%, due to decreases in sales volume and revenue rates. Fee-based asset allocation revenue increased $15.8 million, or 7%, due to an increase in fee-based asset allocation average assets of 4%.
Shareholder Service Fees Revenue
Shareholder service fee revenue primarily includes transfer agency fees, custodian fees from retirement plan accounts, and portfolio accounting and administration fees. Transfer agency fees and portfolio accounting and administration fees are asset‑based revenues or account‑based revenues, while custodian fees from retirement plan accounts are based on the number of client accounts.
During 2018, shareholder service fees revenue decreased $4.2 million, or 4%, over 2017. Account-based fees decreased $2.6 million compared to 2017 due to a decrease in the number of accounts, partially offset by increased fees for custodian and retail accounts due to a 2018 fee schedule change. Service fees based on assets decreased $1.6 million, or 3%, compared to 2017, primarily due to a decrease in fund administrative and accounting services fees due to the 2017 and 2018 fund mergers.
During 2017, shareholder service fees revenue decreased $13.6 million, or 11%, compared to 2016. Account-based fees decreased $22.3 million compared to 2016 due to a decrease in the number of accounts, and were partially
37
offset by an increase in asset-based fees of $9.0 million, or 26%, compared to 2016. The change was primarily a result of the share class conversion in 2016 from account-based, load-waived Class A shares to asset-based, institutional share classes offered in our advisory programs. Assets in the institutional share classes increased from an average of $23.3 billion at December 31, 2016 to an average of $30.9 billion at December 31, 2017, representing an increase of 33%.
Total Operating Expenses
Operating expenses for the years ended December 31, 2018, 2017 and 2016 are set forth in the following table:
|
|
|
|
|
|
|
|
|
|
|
|
|
|
| For the Year ended |
|
|
|
|
| |||||
|
| December 31, |
| Variance |
| |||||||
|
|
|
|
|
|
|
|
| 2018 vs. |
| 2017 vs. |
|
|
| 2018 |
| 2017 |
| 2016 |
| 2017 |
| 2016 |
| |
|
| (in thousands, except percentage data) |
| |||||||||
Distribution |
| $ | 456,832 |
| 432,264 |
| 485,981 |
| 6 | % | (11) | % |
Compensation and benefits |
|
| 263,329 |
| 271,276 |
| 267,839 |
| (3) | % | 1 | % |
General and administrative |
|
| 73,643 |
| 88,951 |
| 80,820 |
| (17) | % | 10 | % |
Technology |
|
| 65,275 |
| 66,078 |
| 63,045 |
| (1) | % | 5 | % |
Occupancy |
|
| 27,197 |
| 30,721 |
| 31,406 |
| (11) | % | (2) | % |
Marketing and advertising |
|
| 10,323 |
| 12,425 |
| 13,080 |
| (17) | % | (5) | % |
Depreciation |
|
| 25,649 |
| 20,983 |
| 18,358 |
| 22 | % | 14 | % |
Subadvisory fees |
|
| 14,805 |
| 13,174 |
| 9,572 |
| 12 | % | 38 | % |
Intangible asset impairment |
|
| 1,200 |
| 1,500 |
| 9,749 |
| (20) | % | (85) | % |
Total operating expenses |
| $ | 938,253 |
| 937,372 |
| 979,850 |
| — |
| (4) | % |
Distribution Expenses
Distribution costs fluctuate with sales volume, such as Advisor commissions and commissions paid to field management, Advisor incentive compensation, commissions paid to third parties and to our own wholesalers, and related management commissions in our unaffiliated channel. Direct selling costs also fluctuate with AUM, such as Rule 12b‑1 service and distribution fees paid to third parties.
Distribution expenses in 2018 increased by $24.6 million, or 6%, compared to 2017. Expenses in the broker-dealer channel increased $42.1 million compared to 2017, primarily due to an increase in average advisory assets and the changes made to our Advisor pay structure starting in 2018. Additionally, in late 2018, the Company announced further enhancements to the compensation grid for Advisors, which we believe are best in class payout rates. Expenses in the unaffiliated channel decreased $17.5 million compared to 2017 due to lower Rule 12b‑1 asset‑based service and distribution expenses paid to third party distributors and lower dealer compensation due to lower client assets.
Distribution expenses in 2017 decreased by $53.7 million, or 11%, compared to 2016. Expenses in the broker-dealer channel declined $19.1 million compared to 2016, primarily due to the changes we made to the management structure in our broker-dealer channel and a decrease in deferred acquisition expense due to a share class conversion in our advisory products in 2016. Compensation for managers has moved from commissions and overrides, which were captured as distribution expense, to a salary and bonus, which is compensation and benefits expense. Partially offsetting the expense decreases, advisory fee commissions increased due to the increase in fee-based asset allocation average assets and changes to the compensation plan. Expenses in the unaffiliated channel decreased $34.6 million compared to 2016 as a result of a decrease in average unaffiliated AUM, which resulted in lower Rule 12b‑1 asset‑based service and distribution expenses paid to third party distributors and lower dealer compensation.
Compensation and Benefits
Compensation and benefits in 2018 decreased $7.9 million, or 3%, compared to 2017. The primary drivers of the decrease were a decrease in share-based compensation of $6.2 million, a decrease in pension costs of $8.4 million due to the freeze of the Pension Plan in 2017, and a decrease of $4.0 million due to a discretionary 401k contribution in 2017. The decrease in share-based compensation is primarily due to shifting the employee grant date to January from April in 2017, larger grant years being fully amortized and, to a lesser extent, revaluation of cash-settled restricted stock units (“RSUs”). Partially offsetting these decreases were an increase of $5.1 million in salaries and wages due to annual merit increases and $5.1 million due to increases in incentive compensation and severance expense.
38
Compensation and related costs in 2017 increased $3.4 million, or 1%, compared to 2016. The primary drivers of the increase were an increase in share-based compensation (including RSUs) of $6.2 million, an increase in salaries and wages of $1.4 million, an increase in group health insurance costs of $4.2 million and an increase of $4.7 million primarily due to a discretionary 401k contribution in 2017. Partially offsetting these increases were a decrease in other compensation of $5.5 million and a $3.8 million decrease in pension expenses due to the freeze of the Pension Plan in 2017. The increase in share-based compensation is primarily due to the grant date shifting to January from April in 2017, revaluation of RSUs and changes in forfeitures. The increase in salaries and wages was due to the change to our broker-dealer market structure in 2017, partially offset by decrease in headcount due to 2016 workforce reductions. The increase in group health insurance costs is due to a curtailment gain realized on the amendment of our defined benefit postretirement medical plan in 2016. The decrease in other compensation was primarily due to severance expense in 2016 as a result of workforce reductions.
General and Administrative Expenses
General and administrative expenses are operating costs, including, but not limited to, dealer services, professional services, including legal, audit and consulting, travel and meetings and temporary office staff.
General and administrative expenses decreased $15.3 million for the year ended December 31, 2018, compared to 2017. Temporary office staff expense decreased $7.9 million primarily due to reduced technology consulting services and reduced consulting services primarily due to DOL Fiduciary Rule implementation in the prior year. There were also decreases in legal, audit and consulting costs and fund expenses in 2018 compared to 2017.
General and administrative expenses increased $8.1 million for the year ended December 31, 2017 compared to 2016. Temporary office staff expense increased $8.0 million primarily due to increased technology consulting services and consulting services related to DOL Fiduciary Rule implementation. There were also increases in legal, audit and consulting costs and fund expenses in 2017 compared to 2016, offset partially by decreased dealer service costs, which primarily represent account servicing costs to third party dealers, as a result of lower asset levels in certain share classes.
Occupancy
Occupancy expenses include facilities costs of our home offices, as well as rent expense for our leased home office and field office space. Occupancy expenses decreased $3.5 million in 2018 as compared to 2017 primarily due to the elimination of the Advisor and field office allowance program that ceased in 2017 and lower rent expense due to the closure of some field offices. From 2017 to 2016 occupancy costs were relatively unchanged.
Marketing and advertising
Marketing and advertising expense decreased in both comparative periods as we focus our marketing efforts on the highest impact markets and activities.
Depreciation
Depreciation expense increased in 2018 as compared to 2017 due to an adjustment to the useful life of certain internally developed software assets. The increase in 2017 as compared to 2016 was due to assets placed in service during the latter part of 2016. We expect depreciation expense to decrease in 2019 as a number of fixed assets reached the end of their useful lives during 2018 and we continue to shift our technologies toward Software-as-a-Service.
Subadvisory Fees
Subadvisory fees represent fees paid to other asset managers for providing advisory services for certain mutual fund portfolios. These expenses reduce our operating margin, as we pay out approximately half of our management fee revenues received from subadvised products.
Subadvisory expenses increased $1.6 million for the year ended December 31, 2018 due to an increase in subadvised average assets of 8% and an increase in the average subadvisory fee rate. Subadvisory expenses increased $3.6 million for the year ended December 31, 2017 due to an increase in subadvised average assets of 97%, due to the launch in 2017 of Ivy ProShares, the Ivy IG International Small Cap Fund, the Ivy PineBridge High Yield Fund, and the
39
introduction of the Advisors Wilshire Global Allocation Fund. This period was also impacted by a decrease in the average subadvisory fee rate due to a mix-shift of assets into subadvised funds with lower subadvisory fee rates.
Intangible Asset Impairment
During 2018 and 2017, we recorded intangible asset impairment charges of $1.2 million and $1.5 million, respectively, related to our subadvisory agreement to manage certain mutual fund products, as a result of a decline in AUM in 2017 primarily attributable to a realignment of fund offerings and the termination of the subadvisory agreement in 2018. At December 31, 2018, there was no remaining balance of our subadvisory intangible asset.
Other Income and Expenses
Investment and Other Income (Loss)
Investment and other income decreased $14.4 million in 2018 compared to 2017. Mark-to-market losses in 2018 on our consolidated sponsored funds, equity method sponsored funds and equity securities caused a decrease of $67.8 million compared to gains in 2017. The mark-to-market decreases were offset by a $51.5 million increase in mark-to-market gains generated by our economic hedging program that uses total return swap contracts to hedge market risk in certain sponsored funds for the same comparative period. In addition, unrealized gains attributable to noncontrolling interests in sponsored funds where the Company held majority ownership decreased $4.9 million and the gain related to revaluation of the Pension Plan liability decreased $3.6 million compared to 2017. Partially offsetting these decreases, interest and dividend income increased $10.4 million compared to 2017 primarily due to the laddered fixed income portfolio.
Investment and other income increased $45.1 million in 2017 compared to 2016. Mark-to-market gains in 2017 on our consolidated sponsored funds, equity method sponsored funds and equity securities increased $19.9 million compared to 2016. The mark-to-market increases were offset by a $4.4 million increase in mark-to-market losses generated by our economic hedging program that uses total return swap contracts to hedge market risk in certain sponsored funds for the same comparative period. In 2017, interest and dividend income increased $4.3 million compared to 2016. The increase is due in part to a laddered fixed income investment portfolio we implemented in the second quarter of 2017 to optimize the return on our cash. In addition, gains related to the Pension Plan in 2017 increased $28.7 million as compared to 2016, including gains related to the freeze of the Pension Plan on September 30, 2017. Partially offsetting these increases, losses on the sales of sponsored funds and impairment charges on securities held as available for sale decreased $3.9 million.
Interest Expense
Interest expense was $6.5 million, $11.3 million and $11.1 million in 2018, 2017 and 2016, respectively. The majority of our interest expense in 2016 and 2017 was related to our $190.0 million Series A and Series B senior unsecured notes. The $95.0 million Series A senior unsecured notes matured and were repaid in January 2018. As a result, we experienced $4.8 million in annual interest expense savings from 2017 to 2018.
Income Taxes
Our effective income tax rate was 23.3%, 41.3%, and 34.1% in 2018, 2017, and 2016, respectively. The lower effective tax rate in 2018 as compared to 2017 was primarily the result of U.S. tax reform that was enacted on December 22, 2017, which reduced the federal statutory tax rate from 35% to 21%.
In addition, during 2018, the Company recognized a tax shortfall from share-based payments of $4.4 million, which was less than the $8.4 million shortfall experienced in 2017, causing our effective tax rate to decrease. The tax effects of share-based payments could create continued volatility in the effective tax rate in future periods. The lower effective tax rate in 2018 as compared to 2017 was also a result of $6.4 million that was reversed in 2018 upon the completion of a voluntary disclosure agreement with a state tax jurisdiction during the year and the 2017 charge of $5.4 million to revalue the Company's net deferred tax assets for U.S. tax reform. These decreases were partially offset by the removal of a $1.3 million deferred tax asset in 2018 related to the Company's tax basis in Ivy Global Investors SICAV, pursuant to the pending liquidation of that entity.
The higher effective tax rate in 2017 as compared to 2016 was primarily the result of a tax shortfall from share-
40
based payments in 2017 as compared to no such impact in 2016, a reduction in the year over year release of valuation allowance on capital losses, and the 2017 charge to revalue the Company's net deferred tax assets for U.S. tax reform.
Liquidity and Capital Resources
We strive to maintain a capital structure that supports our business strategies and to maintain the appropriate amount of liquidity at all times. Expected uses of cash include capital expenditures for enhancement of technology infrastructure, repurchases of our common stock, dividend payments, interest on indebtedness, income tax payments, seed money for new products, payment of deferred commissions to Advisors and third parties, collateral funding for margin accounts established to support derivative positions, and leasehold and building improvements, and could include strategic acquisitions. Our seed investments in consolidated sponsored funds are not managed as liquid assets because they may be longer term in nature.
|
|
|
|
|
|
|
|
|
|
|
|
|
|
| For the Year Ended |
| Variance |
| |||||||
|
| December 31, |
| 2018 vs. |
| 2017 vs. |
| |||||
|
| 2018 |
| 2017 |
| 2016 |
| 2017 |
| 2016 |
| |
|
| (in thousands, except percentage data) |
| |||||||||
Balance Sheet Data: |
|
|
|
|
|
|
|
|
|
|
|
|
Cash and cash equivalents |
| $ | 231,997 |
| 207,829 |
| 555,102 |
| 12 | % | (63) | % |
Investment securities |
|
| 617,135 |
| 700,492 |
| 328,750 |
| (12) | % | 113 | % |
Short-term debt |
|
| — |
| 94,996 |
| — |
| (100) | % | 100 | % |
Long-term debt |
|
| 94,854 |
| 94,783 |
| 189,605 |
| — |
| (50) | % |
Cash Flow Data: |
|
|
|
|
|
|
|
|
|
|
|
|
Cash flows from operating activities |
|
| 357,015 |
| 50,851 |
| 87,904 |
| 602 | % | (42) | % |
Cash flows from investing activities |
|
| 10,343 |
| (212,395) |
| 75,871 |
| NM |
| NM |
|
Cash flows from financing activities |
|
| (311,788) |
| (188,710) |
| (202,911) |
| (65) | % | 7 | % |
Our operations provide much of the cash necessary to fund our priorities, as follows:
|
|
|
|
|
|
Repurchase Our Stock
We repurchased 7.0 million shares of our Class A common stock in the open market or privately in 2018 compared to 1.8 million and 2.3 million shares in 2017 and 2016, respectively, resulting in share repurchases of $135.9 million, $35.8 million and $49.8 million, respectively. These share repurchases included 729,882 shares, 402,337 shares and 423,726 shares tendered by employees to cover their tax withholdings with respect to vesting of share-based awards during the years ended December 31, 2018, 2017 and 2016, respectively.
In connection with our existing capital return policy, we intend to complete the repurchase of $250 million of our Class A common stock by late 2019, which is inclusive of buybacks to offset dilution of our equity grants. We continue to engage in opportunistic share repurchases to fulfill the targeted buybacks. We have repurchased $155.9 million of our Class A common stock since the announcement of this policy at a weighted average share price of $19.75.
Pay Dividends
We paid quarterly dividends on our Class A common stock that resulted in financing cash outflows of $81.2 million, $154.0 million and $152.8 million in 2018, 2017 and 2016, respectively.
In December 2018, the Board of Directors declared a quarterly dividend on our common stock of $0.25 per share payable on February 1, 2019 to stockholders of record as of January 11, 2019.
Finance Internal Growth
41
We use cash to fund growth in our distribution channels. We continue to invest in our broker-dealer channel by offering home office resources, wholesaling efforts and enhanced technology tools, including the modernization of our brokerage and product platform. Our unaffiliated channel requires cash outlays for wholesaler commissions and commissions to third parties on deferred load product sales. We also provide seed money for new products to further enhance our product offerings and distribution efforts. As we continue to advance our investment in improved technology, we expect increased costs in this area in the near term.
On October 20, 2017, we entered into a three-year unsecured revolving credit facility (the “Credit Facility”) with various lenders, which initially provides for borrowings of up to $100.0 million and may be expanded to $200.0 million. The Credit Facility replaced the prior credit facility, which was set to expire in June 2018. There were no borrowings under the Credit Facility at December 31, 2018 and no borrowings at any point during the year. The covenants in the Credit Facility are consistentperiodic reports filed with the covenants inSEC, (9) discusses with management earnings press releases, (10) meets with management, the prior credit facility, including the required consolidated leverage ratio and the consolidated interest coverage ratio, which match those outlined below for the senior unsecured notes.
On August 31, 2010, the Company entered into an agreement to complete a $190.0 million private placement of the Series A and Series B senior unsecured notes. The $95.0 million Series A, senior unsecured notes that matured on January 13, 2018 were repaid. Interest is payable semi‑annually in January and July of each year. The most restrictive provisions of the agreement require the Company to maintain a consolidated leverage ratio not to exceed 3.0 for four consecutive quarters and a consolidated interest coverage ratio of not less than 4.0 for four consecutive quarters. The Company was in compliance with these covenants for all periods presented. As of December 31, 2018, the Company’s consolidated leverage ratio was 0.3, and consolidated interest coverage ratio was 48.7.
Cash Flows
Cash from operations is our primary source of funds.In 2018, cash from operations increased primarily due to increased sales of trading securities held by consolidated sponsored funds, due to the liquidation of the IGI Funds, and an increase in net income as compared to 2017. In 2017, cash from operations decreased due to increased purchases of trading securities, a decrease in the amortization of deferred sales commission payments related to deferred sales load and fee based products and a decrease in net income as compared to 2016. In 2016, cash from operations decreased due to a decrease in the amortization of deferred sales commission payments related to deferred sales load and fee based products and a decrease in net income as compared to 2015.
In addition to the items noted above, the payable to investment companies for securities, payable to customers and other receivables accounts can fluctuate significantly based on trading activity at the end of a reporting period. Changes in these accounts result in variances within cash from operations on the statement of cash flows; however, there is no impact to the Company’s liquidity and operations for the variances in these accounts.
Investing activities consist primarily of the seeding and sale of sponsored investment securities, purchases and maturities of investments held in our fixed income laddering program and capital expenditures.
Financing activities include payment of dividends and repurchase of our common stock. Additionally, in 2018, financing activities included repayment of our Series A senior unsecured notes at maturity. Future financing cash flows will be affected by our existing capital return policy.
Contractual Obligations and Contingencies
Expected long‑term capital requirements include interest on indebtedness and maturities of outstanding debt, operating leases and purchase obligations, and potential recognition of tax liabilities, summarized in the following table
42
as of December 31, 2018. Purchase obligations include amounts that will be due for the purchase of goods and services to be used in our operations under long‑term commitments or contracts.
|
|
|
|
|
|
|
|
|
|
|
|
|
|
|
|
|
|
|
| 2020- |
| 2022- |
| Thereafter/ |
|
|
| Total |
| 2019 |
| 2021 |
| 2023 |
| Indeterminate |
| |
|
| (in thousands) |
| |||||||||
Short-term and long-term debt obligations, including interest |
| $ | 108,657 |
| 5,463 |
| 103,194 |
| — |
| — |
|
Non-cancelable operating lease commitments |
|
| 42,436 |
| 16,488 |
| 15,554 |
| 5,233 |
| 5,161 |
|
Purchase obligations |
|
| 76,778 |
| 36,465 |
| 36,123 |
| 4,190 |
| — |
|
Unrecognized tax benefits |
|
| 2,741 |
| 390 |
| — |
| — |
| 2,351 |
|
|
| $ | 230,612 |
| 58,806 |
| 154,871 |
| 9,423 |
| 7,512 |
|
Off‑Balance Sheet Arrangements
Other than operating leases, which are included in the table above, the Company does not have any off‑balance sheet financing. The Company has not created, and is not party to, any special‑purpose or off‑balance sheet entities for the purpose of raising capital, incurring debt or operating its business.
Critical Accounting Policies and Estimates
Management believes the following critical accounting policies affect its significant estimates and judgments used in the preparation of its consolidated financial statements.
Accounting for Goodwill and Intangible Assets
Two significant considerations arise with respect to goodwill and intangible assets that require management estimates and judgment: (i) the valuation in connection with the initial purchase price allocation, and (ii) the ongoing evaluation of impairment.
In connection with all of our acquisitions, an evaluation is completed to determine reasonable purchase price allocations. The purchase price allocation process requires management estimates and judgments as to expectations for the various products, distribution channels and business strategies. For example, certain growth rates and operating margins were assumed for different products and distribution channels. If actual growth rates or operating margins, among other assumptions, differ from the estimates and judgments used in the purchase price allocation, the amounts recorded in the financial statements for identifiable intangible assets and goodwill could be subject to charges for impairment in the future.
We complete an ongoing review of the recoverability of goodwill and intangible assets using a two-step impairment approach on an annual basis, or more frequently whenever events occur or circumstances change that would more likely than not reduce the fair value of a reporting unit below its carrying amount. Annually, the Company performs a qualitative assessment before calculating the fair value of the reporting unit. If the Company determines, on the basis of qualitative factors, that the fair value of the reporting unit is more likely than the carrying amount, the two-step impairment test would not be required. We consider mutual fund advisory contracts indefinite lived intangible assets as they are expected to be renewed without significant cost or modification of terms. Factors that are considered important in determining whether an impairment of goodwill or intangible assets might exist include significant continued underperformance compared to peers, the likelihood of termination or non‑renewal of a mutual fund advisory or subadvisory contract or substantial changes in revenues earned from such contracts, significant changes in our business and products, material and ongoing negative industry or economic trends, or other factors specific to each asset or subsidiary relationship being evaluated. Because of the significance of goodwill and other intangibles to our consolidated balance sheets, the annual impairment analysis is critical. Any changes in key assumptions about our business and our prospects, or changes in market conditions or other externalities, could result in an impairment charge.
Accounting for Income Taxes
In the ordinary course of business, many transactions occur for which the ultimate tax outcome is uncertain. In addition, respective tax authorities periodically audit our income tax returns. These audits examine our significant tax filing positions, including the timing and amounts of deductions and the allocation of income among tax jurisdictions. We adjust our income tax provision in the period in which we determine the actual outcomes will likely be different from our
43
estimates. The recognition or derecognition of income tax expense related to uncertain tax positions is determined under the guidance as prescribed by Accounting Standards Codification (“ASC”) 740, “Income Taxes Topic.”
We recognize an asset or liability for the deferred tax consequences of temporary differences between the tax basis of assets and liabilities and their reported amounts in the financial statements, including the determination of any valuation allowance that might be required for deferred tax assets. These temporary differences will result in taxable or deductible amounts in future years when the reported amounts of assets are recovered or liabilities are settled.
Income taxes are recorded at the rates in effect in the various tax jurisdictions in which we operate. Tax law and rate changes are reflected in the income tax provision in the period in which such changes are enacted.
Seasonality and Inflation
We do not believe our operations are subject to significant seasonal fluctuation. We have historically experienced increased sales activity in the first and fourth quarters of the year due to funding of retirement accounts by our clients. The Company has not suffered material adverse effects from inflation in the past. However, a substantial increase in the inflation rate in the future may adversely affect clients’ purchasing decisions, may increase the costs of borrowing, or may have an impact on the Company’s margins and overall cost structure.
ITEM 7A. Quantitative and Qualitative Disclosures About Market Risk
We use various financial instruments with certain inherent market risks, primarily related to interest rates and securities prices. The principal risks of loss arising from adverse changes in market rates and prices to which we are exposed relate to interest rates on debt and marketable securities. Generally, these instruments have not been entered into for trading purposes. Management actively monitors these risk exposures; however, fluctuations could impact our results of operations and financial position. As a matter of policy, we only execute derivative transactions to manage exposures arising in the normal course of business and not for speculative or trading purposes. The following information, together with information included in other parts of Management’s Discussion and Analysis of Financial Condition and Results of Operations, which are incorporated herein by reference, describe the key aspects of certain financial instruments that have market risk to us.
Interest Rate Sensitivity
Our interest sensitive assets and liabilities include the debt security holdings in our fixed income laddering program, our long‑term fixed rate Senior Notes and obligations for any balances outstanding under the Credit Facility or other short‑term borrowings. Increases in market interest rates would generally cause a decrease in the fair value of the debt security holdings in the fixed income laddering program and the Senior Notes, and an increase in interest expense associated with short‑term borrowings and borrowings under the Credit Facility. Decreases in market interest rates would generally cause an increase in the fair value of the debt security holdings in the fixed income laddering program and Senior Notes, and a decrease in interest expense associated with short‑term borrowings and borrowings under the Credit Facility. There were no borrowings under the Credit Facility at December 31, 2018 or at any point during the year.
Investment Securities Sensitivity
We maintain an investment portfolio of various holdings, types and maturities. Our portfolio is diversified and consists primarily of sponsored funds and debt securities. We have a hedging program that uses total return swaps to hedge our exposure to fluctuations in the value of our investment portfolio classified as equity securities measured through net income, recorded using the equity method, or consolidated within our consolidated financial statements. At any time, a sharp increase in interest rates or a sharp decline in the United States stock market could have a significant negative impact on the fair value of our investment portfolio. Conversely, declines in interest rates or a sizeable rise in the United States stock market could have a significant positive impact on our investment portfolio. The results of fluctuations in interest rates and stock market volatility on our investment portfolio may be offset due to the hedging program. A portion of debt securities are classified as available for sale investments. If a decline in fair value is determined to be other than temporary by management or the Company intends or is required to sell the available for sale security prior to recovery of the amortized cost, the cost basis of the individual security accounted for as available for sale is written down to fair value. However, unrealized gains are not recognized in operations on available for sale debt securities until they are sold.
44
The following is a summary of the effect that a 10% increase or decrease in equity or fixed income prices would have on our investment portfolio subject to equity or fixed income price fluctuations at December 31, 2018:
|
|
|
|
|
|
|
|
|
|
|
|
|
| Fair Value |
| Fair Value |
|
|
|
|
|
| Assuming a 10% |
| Assuming a 10% |
|
Investment Securities |
| Fair Value |
| Increase |
| Decrease |
| |
|
| (in thousands) |
| |||||
Available for sale: |
|
|
|
|
|
|
|
|
Certificates of deposit |
| $ | 5,001 |
| 5,501 |
| 4,501 |
|
Commercial paper |
|
| 7,970 |
| 8,767 |
| 7,173 |
|
Corporate bonds |
|
| 218,121 |
| 239,933 |
| 196,309 |
|
U.S. Treasury bills |
|
| 19,672 |
| 21,639 |
| 17,705 |
|
Trading: |
|
|
|
|
|
|
|
|
Commercial paper |
|
| 1,993 |
| 2,192 |
| 1,794 |
|
Corporate bonds |
|
| 77,250 |
| 84,975 |
| 69,525 |
|
U.S. Treasury bills |
|
| 5,884 |
| 6,472 |
| 5,296 |
|
Mortgage-backed securities |
|
| 7 |
| 8 |
| 6 |
|
Consolidated sponsored funds |
|
| 33,088 |
| 36,397 |
| 29,779 |
|
Equity Securities: |
|
|
|
|
|
|
|
|
Common stock |
|
| 21,204 |
| 23,324 |
| 19,084 |
|
Sponsored funds |
|
| 153,548 |
| 168,903 |
| 138,193 |
|
Sponsored privately offered funds |
|
| 678 |
| 746 |
| 610 |
|
Consolidated sponsored funds |
|
| 24,879 |
| 27,367 |
| 22,391 |
|
Equity Method: |
|
|
|
|
|
|
|
|
Sponsored funds |
|
| 47,840 |
| 52,624 |
| 43,056 |
|
Total |
| $ | 617,135 |
| 678,849 |
| 555,422 |
|
Securities Price Sensitivity
Our revenues are dependent on the underlying AUM and AUA for which we provide services. These assets are comprised of various combinations of equity, fixed income and other types of securities and commodities. Fluctuations in the value of these securities are common and are caused by numerous factors, including, without limitation, market volatility, the overall economy, inflation, changes in investor strategies, availability of alternative investment vehicles and government regulations. Accordingly, declines in any one or a combination of these factors, or other factors not separately identified, may reduce the value of investment securities and, in turn, the underlying assets on which our revenues are earned. These declines have an impact in our investment sales, and our trading portfolio, thereby compounding the impact on our earnings if our hedging strategy is not fully effective.
ITEM 8. Financial Statements and Supplementary Data
Reference is made to the Consolidated Financial Statements referred to in the Index on page 53 setting forth our consolidated financial statements, together with the report of KPMG LLP dated February 22, 2019 on page 54.
ITEM 9. Changes in and Disagreements with Accountants on Accounting and Financial Disclosure
None.
45
ITEM 9A. Controls and Procedures
|
|
|
|
Based on our evaluation under the framework in “Internal Control‑Integrated Framework (2013),” management concluded that, as of December 31, 2018, our internal control over financial reporting was effective. KPMG LLP,auditors, the independent registered public accounting firm and the Board, (11) discusses with the independent registered public accounting firm the matters required to be discussed by standards adopted by the Public Company Accounting Oversight Board (the “PCAOB”) or other applicable accounting standards or regulations, including the independent registered public accounting firm’s responsibility under the auditing and related professional practice standards established by the PCAOB, critical audit matters addressed during the audit, and disagreements with management encountered in the course of the audit, (12) provides the Board with information and materials as it deems necessary to make the Board aware of significant financial, accounting and internal control matters of the Company, (13) periodically reviews the Company’s Whistleblower Policy and Code of Business Conduct and Ethics and oversees the receipt, investigation, resolution and retention of all complaints submitted under these policies, (14) reviews and pre-approves all “related-person transactions” (as defined the Securities and Exchange Commission regulations), (15) produces a report for inclusion in the Company’s proxy statement, and (16) otherwise complies with its responsibilities and duties as stated in the Company’s Audit Committee Charter.
The Board has determined that auditedall four members of the Audit Committee satisfy the independence and other requirements for audit committee membership of the NYSE corporate governance listing standards and SEC requirements. The Board has also determined that Ms. Gasaway and Messrs. Logue, Morrissey and Walton are audit committee financial experts as defined by the SEC. The Board determined that these members acquired the attributes of an audit committee financial expert through their experience in preparing, auditing, analyzing or evaluating financial statements containing accounting issues as generally complex as the Company’s financial statements; actively supervising one or more persons engaged in such activities; and their experience of overseeing or assessing the performance of companies and public accountants with respect to the preparation, auditing or evaluation of financial statements. In 2020, the Audit Committee met six times.
9
Item 11. Executive Compensation
COMPENSATION COMMITTEE REPORT
Notwithstanding anything to the contrary set forth in any filings of the Company under the Securities Act of 1933, as amended (the “Securities Act”) or the Exchange Act of 1934, as amended (the “Exchange Act”), that might incorporate future filings by reference, including this Annual Report on Form 10-K, as amended, in whole or in part, the following Compensation Committee Report shall not be incorporated by reference into any such filings, and shall not be deemed soliciting material or filed under the Securities Act or the Exchange Act.
The Compensation Committee has reviewed and discussed the Compensation Discussion & Analysis required by Item 402(b) of Regulation S-K with management and, based on such review and discussions, the Compensation Committee recommended to the Board of Directors that the Compensation Discussion & Analysis be included in this Annual Report on Form 10‑K, also audited the effectiveness of our internal control over financial reporting10-K, as of December 31, 2018, as stated in their attestation report which follows.amended.
46
Report of Independent Registered Public Accounting Firm
To the Stockholders and Board of Directors
Waddell & Reed Financial, Inc.:
Opinion on Internal Control Over Financial Reporting
We have audited Waddell & Reed Financial, Inc. Compensation Committee
Jerry W. Walton, Chair
Kathie J. Andrade
James A. Jessee
Michael F. Morrissey
COMPENSATION DISCUSSION & ANALYSIS
Introduction
This Compensation Discussion & Analysis, among other things, provides an overview of our executive compensation program, sets forth the objectives and subsidiaries’elements of our executive compensation program, and describes the executive compensation decisions with respect to our named executive officers for 2020 set forth below.
| Name | Title |
| Philip J. Sanders | Chief Executive Officer |
| Benjamin R. Clouse | Senior Vice President and Chief Financial Officer |
| Brent K. Bloss | President |
| Daniel P. Hanson | Senior Vice President and Chief Investment Officer |
| Shawn M. Mihal | Senior Vice President – Wealth Management and President, Waddell & Reed, Inc. |
Executive Summary
The intellectual capital of our employees is collectively the most important asset of our firm. We invest in people – we hire qualified people, train them, motivate them to give their best thinking to the Company and our clients, and compensate them in a manner designed to motivate and retain them. Our financial results are primarily based upon the level of AUM and AUA, which are impacted by the strength of our investment performance and the success of our marketing and distribution organization, along with careful management of our expenses, all of which are directly dependent upon our people and the intellectual capital they bring to bear.
We believe that the quality, expertise and commitment of our executive officers are critical to enhancing the long-term value of the Company. To this end, a core objective in designing our executive compensation program is to deliver competitive total direct compensation (i.e., base salary, annual cash incentive award and annual equity-based incentive award), based on our financial and operating performance, progress on our strategic objectives and individual performance and contributions, that will attract, motivate and retain a high-performance executive team and drive the creation of sustainable long-term stockholder value.
The market volatility that began in March 2020, as a result of the reaction to COVID-19 and its impact on the global economy and financial markets, resulted in significant depreciation in the stock markets and major disruption in the fixed income markets. Despite the impact of the global pandemic and the uncertainty related to the U.S. presidential election, the equity markets rebounded during the second through fourth quarters of 2020 to close the year with solid gains and a return to some stability in fixed income markets.
10
We transitioned most of our workforce to a work from home environment early in March 2020. The remote work environment has continued through the end of 2020 and into 2021. Our steady and proactive response has allowed our asset management and wealth management businesses to maintain full continuity of service and the access that our clients need and expect.
Despite the challenging operating environment and continued challenges related to the trend toward passive strategies, fee pressure and regulatory changes, 2020 marked a year of significant progress in transforming our firm into a more diversified and growth-oriented financial services enterprise, with significant progress across both of our businesses while successfully navigating during a global pandemic. See “Analysis of 2020 Compensation – 2020 Operating Environment” for information regarding the progress we made during 2020 with respect to our strategic initiatives.
Key financial measures and operational highlights for 2020 compared to 2019 are set forth below:
| 2020 | 2019 | |||||||
| Earnings per share | $ | 1.08 | $ | 1.57 | ||||
| Adjusted Earnings per share (1) | $ | 1.58 | $ | 1.87 | ||||
| Net income attributable to the Company | $ | 70.5 million | $ | 115.0 million | ||||
| Adjusted net income attributable to the Company (1) | $ | 102.8 million | $ | 137.4 million | ||||
| Operating income | $ | 94.8 million | $ | 145.7 million | ||||
| Adjusted operating income (1) | $ | 134.4 million | $ | 163.9 million | ||||
| Operating expenses | $ | 954.7 million | $ | 924.6 million | ||||
| Adjusted operating expenses (1) | $ | 915.1 million | $ | 906.4 million | ||||
| Controllable expenses (2) | $ | 449.4 million | $ | 428.9 million | ||||
| Operating Margin | 9.0 | % | 13.6 | % | ||||
| Adjusted operating Margin (1) | 12.8 | % | 15.3 | % | ||||
| AUM | $ | 74.8 billion at December 31 | $ | 70.0 billion at December 31 | ||||
| AUA | $ | 69.7 billion at December 31 | $ | 60.1 billion at December 31 | ||||
| Cash and investments | $ | 760.5 million | $ | 840.2 million | ||||
| Capital return | $ | 180.2 million | $ | 228.5 million | ||||
| · | Dividends – $65.6 million | · | Dividends – $74.3 million | |||||
| · | Stock repurchases – $114.7 million | · | Stock repurchases – $154.2 million | |||||
| (1) | These are non-GAAP financial measures. See Non-GAAP Financial Measures and Reconciliation of GAAP to non-GAAP Financial Measures on pages 48 and 49 of the Original Form 10-K. |
| (2) | Controllable expenses defined as compensation and benefits, general and administrative, occupancy, technology, and marketing and advertising costs, which, for 2020, includes $39.6 million of merger-related costs. |
The Compensation Committee believes that our executive compensation program plays a significant role in our ability to drive financial and operating results and align the interests of our executive officers with the interests of our stakeholders. Key aspects of our executive compensation program in 2020 included the following:
| · | A significant portion of each named executive officer’s total direct compensation – approximately 84% on average for 2020 – was “at risk” compensation, delivered in the form of a cash incentive award and an equity-based incentive award. |
11
| · | Approximately 41%, on average for each named executive officer, of total annual incentive compensation was comprised of an equity-based incentive award and approximately 59%, on average, was comprised of a cash incentive award. |
| · | The form of equity-based awards changed from shares of restricted stock granted in the prior year to restricted stock units (“RSUs”) due to restrictions in the Merger Agreement on the Company’s ability to issue restricted stock while the proposed merger between the Company and Macquarie is pending. The RSUs granted in March 2021 were different than cash-settled restricted stock units (“CSRSUs”) granted in prior years to non-executive officers because the RSUs can be settled in cash or shares of Company Class A common stock (“Shares”) at the sole discretion of the Company; provided, that in the event of a change of control of the Company, each RSU shall be settled in cash. |
The 2020 incentive compensation awards reflect the Compensation Committee’s determination to (1) award incentive compensation based on execution of strategic initiatives in light of the Company’s 2020 financial and operational performance in a challenging operating environment due to COVID-19, balanced with the need to provide total direct compensation that remains competitive in the marketplace and (2) reflect, as appropriate, differences in each named executive officer’s scope of authority and responsibilities, the assumption of additional responsibilities, and an appropriate balance of total direct compensation between cash and equity with an emphasis on cash due to the pending merger between the Company and Macquarie and the requirement in the Merger Agreement to limit equity-based awards to the target amounts.
The table below sets forth the components of total direct compensation for each named executive officer attributable to 2020, as well as total direct compensation attributable to 2019, in each case regardless of the timing of incentive compensation payments or grants. Total direct compensation for 2019 and 2020 set forth below is different than total direct compensation set forth in the Summary Compensation Table because equity-based incentive awards based on 2019 and 2020 performance were not granted until March 2020 and March 2021, respectively, and, therefore, are not reflected in the Summary Compensation Table or the Grants of Plan-Based Award Table for the respective years.
| Base Salary | Cash Incentive | Equity- Based Incentive | 2020 Total Direct Compensation | 2019 Total Direct Compensation | |||||||||||||||
| Philip J. Sanders | $ | 725,000 | $ | 2,030,000 | $ | 2,718,500 | $ | 5,473,500 | $ | 4,325,000 | |||||||||
| Benjamin R. Clouse | $ | 420,000 | $ | 1,338,750 | $ | 420,000 | $ | 2,178,750 | $ | 1,525,000 | |||||||||
| Brent K. Bloss | $ | 525,000 | $ | 1,748,250 | $ | 1,575,000 | $ | 3,848,250 | $ | 2,650,000 | |||||||||
| Daniel P. Hanson | $ | 525,000 | $ | 1,575,000 | $ | 1,575,000 | $ | 3,675,000 | $ | 2,332,692 | |||||||||
| Shawn M. Mihal | $ | 400,000 | $ | 1,225,000 | $ | 400,000 | $ | 2,025,000 | $ | 1,375,000 | |||||||||
2020 Stockholder Vote on Named Executive Officer Compensation
In April 2020, the compensation paid to our named executive officers in 2019 was approved by 88% of the votes cast by our stockholders on the proposal. The Compensation Committee considered the results of the advisory vote in assessing our executive compensation program, noting the high level of stockholder support. The Compensation Committee elected to continue the same general principles in determining the types and amounts of compensation paid to our executive officers in 2020.
Compensation Program Objectives
The Company’s executive compensation program is intended to attract and retain highly qualified executive talent, provide rewards for the prior year’s performance, and provide incentives for future performance to drive the creation of stockholder value. More specifically, our executive compensation program objectives are to:
12
| · | Attract, motivate and retain a high-performing executive team with the appropriate expertise and leadership to build and sustain long-term stockholder value; |
| · | Incentivize and reward short-term and long-term financial, operational, strategic and individual performance that results in increased value for our stockholders; and |
| · | Align our executives’ interests with those of our stockholders. |
The asset management and wealth management industries are extremely competitive, and experienced professionals have significant career mobility. Our intellectual capital is our greatest asset. Our success, and that of our stakeholders, depends on our ability to successfully engage a highly skilled and experienced executive team through a combination of career opportunities, a challenging work environment, and competitive compensation, particularly during the challenging operating environment for active asset managers and the dynamic operating environment for wealth managers during recent years. Our executive officers have developed as a cohesive and complementary executive team and are considered an invaluable resource. Historically, we have sought to groom internal personnel for executive positions or recruited external candidates with a high degree of experience and knowledge of our industry, believing that executives with industry knowledge are more likely to excel. However, this limits the recruiting pool and makes retention a key focus of our compensation program.
Considering these objectives and factors, the Compensation Committee has developed an executive compensation program that continues to be based on the following principles:
| · | Compensation levels should be sufficiently competitive to attract, motivate and retain high caliber executives. |
| · | Appropriate levels of reward for performance should be tied to and vary with the Company’s financial and operational performance, as well as progress on strategic objectives and individual performance. |
| · | A majority of total compensation should be “at risk” in the form of cash and equity-based incentive awards. |
| · | Equity-based awards should constitute a significant portion of incentive awards to encourage executives to focus on the Company’s long-term growth and prospects. |
Retirement benefits no longer comprise a significant element of executive compensation. Effective September 30, 2017, the Compensation Committee froze future benefit accruals under Company’s Retirement Income Plan (the Company)“Pension Plan”). Although each named executive officer except Mr. Hanson had an accrued a vested pension benefit in the Pension Plan, they stopped earning additional benefits based on service or compensation after September 30, 2017. The Compensation Committee approved the termination of the Pension Plan, effective June 1, 2019, and the participating named executive officers received lump sum distributions of their vested pension benefit in July 2020. See “Executive Compensation – Pension Benefits” for additional information regarding the Pension Plan. The Company maintains a 401(k) Plan and matches employee contributions up to 4% of eligible compensation and has the discretion to make additional contributions to eligible participants, subject to applicable non-discrimination requirements. For the 2020 plan year, the Company made a discretionary contribution to the 401(k) account of eligible participants in an amount equal to 2% of eligible 2020 compensation.
Elements of Our Compensation Program
Each element of compensation paid to the Company’s executive officers is designed to support one or more of the objectives described above. Total compensation for the executive officers consists of one or more of the following components:
| · | Base salary; |
| · | Annual performance-based incentive awards, including a cash award and an equity-based award; |
| · | Retirement benefits; and |
| · | Personal benefits and other perquisites. |
13
How We Determine Compensation
The Compensation Committee makes compensation decisions using an approach that considers total direct compensation (i.e., base salary, cash incentive awards and equity-based incentive awards). Base salary is generally the smallest component of total direct compensation, which results in a significant portion of our executive officers’ compensation being paid in “at risk” incentive compensation. At the beginning of each year, the Compensation Committee designates the executive officers that will participate in our Executive Incentive Plan. All executive officers participated in the Executive Incentive Plan during 2020.
For 2020, the Compensation Committee continued to utilize one incentive pool under the Executive Incentive Plan, funded with 10% of adjusted operating income for cash and equity-based awards to be determined at the discretion of the Compensation Committee. Utilizing one pool for cash and equity-based incentive compensation is consistent with the approach used by several companies in the Company’s peer group and provides the Compensation Committee the flexibility to award cash and equity-based incentive compensation in the proportions that it determines are most appropriate for each executive officer. The aggregate of all executive officer incentive awards under the Executive Incentive Plan is not limited to the funding pool described above, as the Compensation Committee has discretion to reward extraordinary performance.
The Compensation Committee continued to utilize the incentive plan design that was implemented in 2019, as described below.
| · | A more structured discretionary approach to better align incentive awards with performance. Under this approach, the Compensation Committee, with the input of the executive officers, established strategic objectives, as well as certain financial and operating goals, at the beginning of the year. |
| · | Target cash and equity-based incentive opportunities as a percentage of base salary. |
Although the Compensation Committee utilizes financial and operating metrics to monitor the Company’s performance in light of the strategic objectives and goals established at the beginning of the year, it does not utilize any weightings or formulas to determine incentive compensation based on achievement of those strategic objectives and goals. Rather, the strategic objectives, goals and financial and operating metrics are components of the framework the Compensation Committee uses to evaluate the performance of each executive. The Compensation Committee establishes cash and equity-based incentive targets for executive officers in February of each year; however, such targets are only meant to be a guide for the Compensation Committee in determining incentive compensation. The Compensation Committee may exercise its discretion, consistent with industry practice, to determine actual incentive compensation awards, which can be greater than or less than target based on Company and individual performance. In determining total direct compensation, the Compensation Committee reviews and considers one or more of the following:
| · | The Company’s financial and operational performance; |
| · | Progress on strategic initiatives; |
| · | Market survey information for comparable public and private asset managers; |
| · | Recommendations of the Company’s Chief Executive Officer, based on individual performance and contributions and internal pay equity; |
| · | The previous year’s compensation levels for each executive officer; and |
| · | Overall effectiveness of the executive compensation program. |
The Compensation Committee may also consider, as applicable, levels of sustained past performance, performance potential, retention risk and the value of the particular compensation element needed to keep an executive’s level of total direct compensation competitive and consistent with our executive compensation program’s objectives. Although there is no formal policy regarding the relationship of compensation among the executive officers, the Compensation Committee also considers the appropriateness of each executive officer’s compensation relative to the other executive officers to reflect differences in the scope of authority and responsibilities among executive officers. The actual cash and equity-based incentive awards paid to each executive officer are determined in the Compensation Committee’s subjective judgment and discretion, based upon the above factors, and its assessment of such compensation’s fairness and adequacy in achieving the objectives of our executive compensation program. This approach enables the Compensation Committee to be responsive to the dynamics of the labor market, including the need to retain and motivate a particular executive, and provides the Compensation Committee with flexibility to compensate our executive officers in a way that reflects the influence and contributions of each executive individually to overall corporate performance and reinforces our pay-for-performance culture.
14
The table below sets forth the percentage each component of total direct compensation bears to total direct compensation based on 2020 target incentive compensation, as well as total direct compensation attributable to 2019 and 2020, regardless of the timing of payments or grants.
2020 Target | 2020 Actual | 2019 Actual | ||||||||||||||||||||||||||||||||||
Base % | Cash % | Equity- Incentive % | Base % | Cash % | Equity- Incentive % | Base % | Cash % | Equity- Incentive % | ||||||||||||||||||||||||||||
| Philip J. Sanders | 15 | % | 27 | % | 58 | % | 13 | % | 37 | % | 50 | % | 17 | % | 22 | % | 61 | % | ||||||||||||||||||
| Benjamin R. Clouse | 31 | % | 38 | % | 31 | % | 19 | % | 62 | % | 19 | % | 26 | % | 38 | % | 36 | % | ||||||||||||||||||
| Brent K. Bloss | 18 | % | 27 | % | 55 | % | 14 | % | 45 | % | 41 | % | 18 | % | 27 | % | 55 | % | ||||||||||||||||||
| Daniel P. Hanson | 18 | % | 27 | % | 55 | % | 14 | % | 43 | % | 43 | % | 12 | % | 20 | % | 68 | % | ||||||||||||||||||
| Shawn M. Mihal | 31 | % | 38 | % | 31 | % | 20 | % | 60 | % | 20 | % | 27 | % | 35 | % | 38 | % | ||||||||||||||||||
Compensation Consultant
The Compensation Committee has the authority to engage independent advisors to assist it in carrying out its responsibilities. For 2020, the Compensation Committee engaged Frederic W. Cook & Co., Inc. (“FW Cook”), the Compensation Committee’s independent compensation consultant, to (1) review and assess competitive compensation information regarding total direct compensation and individual pay components for the Company’s executive officers compared to the Company’s peer group, (2) review and assess competitive compensation information for directors who are not officers or employees of the Company or its subsidiaries (the “Outside Directors”) and (3) review and assess proposed compensation for executive officers in connection with the proposed merger between the Company and Macquarie. FW Cook did not provide any other additional services to the Company or management, meet with any members of management individually, or receive any payments from the Company, other than in its capacity as a consultant to the Compensation Committee in 2020. FW Cook has served as the Compensation Committee’s compensation consultant since 2004. At the Compensation Committee’s request, FW Cook provided the Compensation Committee with information regarding its independence pursuant to SEC and NYSE disclosure requirements regarding the independence of compensation consultants. This information, which addressed each of the six independence factors, affirmed the independence of FW Cook and the partners, consultants and employees who service the Compensation Committee on executive compensation issues.
In connection with the proposed merger between the Company and Macquarie, the Company engaged a compensation consultant (the “Non-executive Compensation Consultant”) to provide recommendations, based on market practice, with respect to employee, including executive officer, compensation arrangements in light of the proposed merger. The Compensation Committee asked FW Cook to review the executive officer compensation information included in the Non-executive Compensation Consultant’s recommendations. Based on its review, FW Cook informed the Compensation Committee that the proposed compensation arrangements for executive officers were reasonable. See “Executive Compensation - Potential Payments Upon Termination or Change in Control” for a description of the terms of the Change of Control Retention and Severance Agreements entered into by the Company with each executive officer in connection with the proposed merger between the Company and Macquarie.
15
Peer Group Analysis
In making executive compensation decisions, the Compensation Committee evaluates its executive compensation program against a broad group of companies in the investment management and financial services industries representative of companies against which the Company competes for executive talent. The Compensation Committee, with the assistance of FW Cook, determined that no changes were necessary to the Company's compensation peer group in connection with decisions related to 2020 executive compensation. With the assistance of FW Cook, the Compensation Committee compared the Company's executive compensation program in 2020 against this peer group, which consists of:
| ·AllianceBernstein Holding L.P. | ·GAMCO Investors, Inc. |
| ·Artisan Partners Asset Management Inc. | ·Legg Mason, Inc. |
| ·BrightSphere Investment Group plc | ·Victory Capital Holdings, Inc. |
| ·Cohen & Steers, Inc. | ·Virtus Investment Partners, Inc. |
| ·Federated Investors, Inc. | ·WisdomTree Investments, Inc. |
The Compensation Committee believes that the Company competes for market share, shelf space, mutual fund shareholders and institutional clients, executive talent and employees with each of these 10 publicly traded asset managers. Additionally, this peer group comprises nine of the 40 companies in the SNL Asset Manager Index, a composite of publicly traded asset management companies used by SNL Financial for comparison purposes in preparing the Company’s stock performance graph. Legg Mason, Inc. was not included in the SNL Asset Manager Index for 2020 due to its acquisition by Franklin Resources Inc. in July 2020. However, Legg Mason remained in the peer group used by the Compensation Committee for year-over-year continuity. The peer group does not include the 29 additional companies comprising the SNL Asset Manager Index due to their size, business orientation and/or status as a foreign corporation.
The Compensation Committee reviews compensation information of the peer group compared to that of the Company based on both the 1st through 5th most highly paid officer positions, and information comparing titled officer positions, if available. In evaluating competitive compensation information of the peer group, the Compensation Committee does not target our executives’ compensation to be paid at a specific percentile or limit its overall evaluation of competitive compensation to a particular percentile, but does take into consideration, on a non-formulaic basis, various differences between the Company and the comparison companies, including measures such as market capitalization, number of employees, assets under management, revenues, income and profitability.
The Compensation Committee also reviews competitive compensation information obtained from the McLagan Survey, which provides detailed analyses of compensation for a greater depth of investment management employees than is available for our public peers and is specifically focused on the asset management industry. Confidentiality obligations to McLagan Partners and to its survey participants prevent us from disclosing the firms included in the McLagan Survey. In addition, the McLagan Survey maintains the confidentiality of individual company pay practices from other participants. The Company did not purchase the McLagan Survey in 2020. However, FW Cook carried forward 2019 McLagan Survey results with cash aged 2.5%, which is consistent with current merit increase expectations. The Compensation Committee reviewed the results of the McLagan Survey information to account for differences in the scale and scope of operations of participant companies, to evaluate the overall competitive position of the Company, as well as its position by business unit and by officer title, and to make comparisons on an officer by officer basis, where sufficient market data was available and an appropriate match of position and responsibilities could be made.
The Compensation Committee considers the compensation information derived from the peer group and the McLagan Survey equally relevant and important, with neither source of information being a predominant determining factor in setting executive compensation levels.
Management’s Role in the Compensation Setting Process and Other Considerations
Our Chief Executive Officer regularly attends Compensation Committee meetings and advises the Compensation Committee regarding, among other things, the design and effectiveness of the Company’s performance measures, the general competitiveness of our compensation program, information on the Company’s business strategies and objectives, financial and operational performance, including progress regarding key metrics and strategic initiatives. The Compensation Committee also requests that the Chief Executive Officer evaluate the performance of the executive officers and to make recommendations to the Compensation Committee regarding their base salary levels and the form and amount of their annual cash incentive award and equity-based incentive award. For 2020, Mr. Sanders evaluated the performance of the other executive officers. Mr. Sanders did not make a recommendation with respect to his own base salary or his performance-based incentive awards.
16
Mr. Sanders’ recommendations are based on his subjective evaluations regarding the individual performance and contributions of each of the other executive officers in furthering the Company’s success, creating stockholder value and executing individual responsibilities, which may include:
| · | Internal working and reporting relationships that promote collaboration and teamwork; |
| · | Leadership, including the ability to develop and motivate employees and personal development; and |
| · | Individual expertise, skills and knowledge relevant to each executive’s position and responsibilities, the potential to assume increased responsibilities, and long-term value to the Company. |
With respect to Mr. Sanders’ position and responsibilities, the Compensation Committee considers his company-wide oversight and management, execution and success of the Company’s business and strategic initiatives, the Company’s financial and operating results, the creation of stockholder value, the size and complexity of the Company’s business, and effective leadership of the Company’s management team.
The Compensation Committee does not assign individual weight or particular emphasis to any of the above factors; the emphasis placed on any specific factor or individual contribution may vary by executive officer.
Our Chief Financial Officer regularly attends Compensation Committee meetings and advises the Compensation Committee as necessary regarding the Company’s financial and operating results, progress on strategic initiatives, accounting rules that are relevant to incentive compensation or other matters that come before the Compensation Committee and provides the Compensation Committee with historical and prospective compensation information relevant to their determinations. Additionally, our Chief Legal Officer, General Counsel and Secretary regularly attends Compensation Committee meetings and provides advice regarding legal and corporate governance matters, details regarding our stock award and incentive compensation plans, and other requested information related to Compensation Committee discussions.
Analysis of 2020 Compensation
The Compensation Committee’s focus is to set competitive pay levels on an annual basis, and to ensure a significant portion of compensation is performance-based. Consistent with the philosophy that a majority of total direct compensation should be “at risk,” the named executive officers received, on average, approximately 16% of their total direct compensation for 2020 in base salary and approximately 84% in incentive compensation.
2020 Operating Environment
The market volatility that began in March 2020, as a result of the reaction to COVID-19 and its impact on the global economy and financial markets, resulted in significant depreciation in the stock markets and major disruption in the fixed income environment. Despite the impact of the global pandemic and the uncertainty related to the U.S. presidential election, the equity markets rebounded during the second through fourth quarters of 2020 to close the year with solid gains and a return to some stability in fixed income markets.
We transitioned most of our workforce and Advisors to a work from home environment early in March 2020. The remote work environment has continued through the end of 2020 and into 2021. Our steady and proactive response has allowed our asset management and wealth management businesses to maintain full continuity of service and the access that our clients need and expect.
Despite the challenging operating environment and continued challenges related to the trend toward passive strategies, fee pressure and regulatory changes, 2020 marked a year of significant progress in transforming our firm into a more diversified and growth-oriented financial services enterprise, with meaningful progress across both of our businesses while successfully navigating during a global pandemic. Following is a summary of progress we made on our strategic initiatives during 2020.
Asset Manager: Ivy Investments®
| · | Fortified existing product offerings, including the introduction of two additional strategies in a model-delivery format, bringing the total model-deliver offerings to nine strategies |
| · | Continued proactive, strategic approach to pricing – 79% of AUM at or better than competitor median fees |
17
| · | Investment performance improved across the complex as measured by the percentage of funds ranked in the top half of their respective Morningstar universes, resulting in an increase from the prior year in trailing one-, three- and five-year performance |
| · | Gross sales and overall redemption rate improved, with unaffiliated sales notably improving |
| · | Continued to enhance investment culture – commitment to environmental, social and governance matters, including signatory and member of various stewardship and active ownership organizations and launching efforts to bolster an authentic environmental, social and governance credibility and a stewardship culture |
| · | Continued progress to transition to an institutional sales and servicing model toward advancing institutional credibility |
| · | Enhanced partnership between Investment Management and Distribution to ensure strategic and operational alignment |
| · | Deepened the collaborative relationship with distribution, to continue to enhance the sales approach |
| · | Successfully outsourced our transfer agency transactional processing operations to a third-party service provider |
Wealth Manager: Waddell & Reed Financial Advisors®
| · | Execution and delivery of Advisory Roadmap (fee-based accounts) to have a fully competitive and comprehensive product offering that covers all client segments – introduced a High Net Worth suite of products and services as well as a new Separately Managed Account Strategies product offering |
| · | Expanded the WaddellONE centralized digital platform with the launch of ONESource, a consolidated digital repository, which seamlessly connects data across platforms for Advisors, and ONEService, a web-based repository of processes and other information available to all Advisors |
| · | Advisor recruiting – 51 new Advisors affiliated with W&R during 2020 with combined prior firm AUA totaling over $2.8 billion, reinvigorating advisor recruiting efforts; developed significant pipeline of candidates; stabilized advisor count with underlying growth trends and reversing the multi-year decline |
| · | Increased Advisor productivity – average trailing 12-month revenue per Advisor of $487,000, with over 11% growth from 2019 |
| · | Continued growth in Advisory AUA on the strength of positive net new Advisory AUA for the 8th consecutive quarter and positive net new AUA for the last quarter of 2020, reversing a multi-year decline, ending the last quarter of 2020 with positive net AUA flows and positive net advisor growth |
| · | Advisor net promoter score – continued significant improvement in advisor net promoter score throughout 2020 |
| · | Hired industry veteran to develop and lead strategies in support of best-in-class client and advisor experience, processes and procedures |
| · | Completed our multi-year real estate transition for advisors successfully with minimal advisor attrition impacts |
Enterprise Wide
| · | Transition of our workforce to a work from home environment, including deployment of incremental technology resources and modified processes to ensure full continuity of operations for clients, advisors and employees |
| · | Returned $180.2 million of capital to stockholders through dividends and share repurchases |
| · | Balance sheet remains strong with $760.5 million in unrestricted cash and investments at December 31, 2020 |
| · | Prior to the proposed merger with Macquarie, proactively pursued acquisitions for the asset management and wealth management businesses |
○Hired VP of Acquisition Strategy and Integration
○Refined process to evaluate opportunities
○Built a pipeline of opportunities through strategic targeting and relationships with investment bankers
○Significant effort to advance discussions with several potential targets through management meetings and diligence
18
| · | Continued to advance the enterprise project management organization, which is responsible for driving targeted allocation and efficient utilization of corporate resources to accomplish the Company’s strategic initiatives |
| · | Hired an executive to lead the technology teams dedicated to leveraging technology as a strategic asset across the organization, including establishment of strategic direction for the technology function across asset management, wealth management and support services |
| · | Hired an executive to lead the data analytics teams dedicated to leveraging data analytics capabilities across the organization, with completion of an initial distribution support effort through building of an initial data warehouse |
| · | Initiated brand positioning and strategy review, completing initial work towards new strategies for brand articulation, positioning and standards |
| · | Drove enhanced employee engagement and focus with improvement in employee net promoter scores through 2020 |
| · | Continued to advance new headquarters construction and transition of real estate strategy |
| · | Continued focus on growth culture and agile organization |
| ○ | Implemented mentor program available to all employees |
| ○ | Expanded partnership with Rock The Street Wall Street, a national, non-profit organization offering a financial and investment literacy program designed to spark the interest of female high school students in careers in finance |
| ○ | Announced partnerships with non-profit organizations focused on connecting and increasing women in the workplace | |
| · | Continued to enhance diversity and inclusion efforts, including holding Racial Diversity Days of Understanding for employees to continue the tough and important conversations around racial injustice, as well as advanced recruiting strategies to focus on diversity |
We continue to work hard to ensure our firm’s ability to compete, succeed and – most importantly – serve stakeholders well across the many different market cycles and business challenges that companies in our business inevitably face.
Base Salary
The Compensation Committee reviewed the base salary of the named executive officers and, based on Mr. Sanders’ recommendations in December 2019, Messrs. Clouse, Bloss and Mihal received a base salary increase for 2020 in recognition of their expanded roles and internal pay equities among the executive officers. Messrs. Sanders and Hanson did not receive base salary adjustments for 2020. Mr. Hanson’s base salary was established in connection with his hiring in June 2019 and was based on market data, his responsibilities and experience and internal pay equity among the executive officers. On average, base salary comprises approximately 16% of our named executive officer’s total direct compensation for 2020.
Performance-Based Incentive Awards
Executive officers are eligible to receive annual performance-based incentive awards pursuant to the Executive Incentive Plan. These incentive awards, granted in cash and equity-based awards, provide an incentive for annual performance, align our executives’ interests with that of our stockholders, and encourage retention and a long-term commitment to the Company, all of which are reinforced by the vesting provisions of our equity-based incentive awards. The size of the incentive pool to fund executive officer incentive compensation is determined upon the achievement of a pre-established performance goal that is set by the Compensation Committee in the first quarter of each year. However, the Compensation Committee has discretion under the Executive Incentive Plan to award incentive compensation in an aggregate amount that exceeds the incentive pool.
The Compensation Committee designates the executive officers of the Company that are eligible to receive annual incentive awards. For 2020, all executive officers participated in the Executive Incentive Plan. In February 2020, the Compensation Committee established target percentages for cash and equity-based incentive awards based on the base salary of each executive officer. The following table sets forth the cash and equity-based incentive compensation targets, expressed as a percentage of base salary and in dollars, for the named executive officers.
19
Base | Cash % | Cash Target $ | Equity-Based Target % | Equity-Based $ | ||||||||||||||||
| Philip J. Sanders | $ | 725,000 | 175 | % | $ | 1,268,750 | 375 | % | $ | 2,718,750 | ||||||||||
| Benjamin R. Clouse | $ | 420,000 | 125 | % | $ | 525,000 | 100 | % | $ | 420,000 | ||||||||||
| Brent K. Bloss | $ | 525,000 | 150 | % | $ | 787,500 | 300 | % | $ | 1,575,000 | ||||||||||
| Daniel P. Hanson | $ | 525,000 | 150 | % | $ | 787,500 | 300 | % | $ | 1,575,000 | ||||||||||
| Shawn M. Mihal | $ | 400,000 | 125 | % | $ | 500,000 | 100 | % | $ | 400,000 | ||||||||||
Determination of Incentive Compensation Pool. For 2020, the Compensation Committee elected to continue to utilize a single incentive pool funded with a percentage of adjusted operating income. In February 2020, the Compensation Committee determined that the size of the incentive pool would be based upon 10% of the Compensation Company’s 2020 “adjusted operating income,” defined as net income (1) increased by interest expense; federal, state and local income taxes; executive cash incentive awards; extraordinary or non-recurring losses ($33.8 million merger-related charges); and losses from publicly-disclosed acquisitions in 2020 (of which there were none) and (2) decreased by extraordinary or non-recurring gains (of which there were none) and gains from publicly-disclosed acquisitions (of which there were none), for a total of $15.2 million.
Operating income is used by the Company and stockholders as a measure of the Company’s underlying profitability and fluctuates with the Company’s performance, which in turn creates an incentive pool that moves with the Company’s performance. It is adjusted in order to provide a measure of performance that reflects the influence and contributions of each participating executive on a relatively equal basis and excludes items that, for example, may be disproportionately influenced by the business decisions of one executive more than others, or that are not indicative of our business and economic trends. This results in a measure of our executive officers’ management of the Company’s operating business as a whole. In setting the 10% threshold, the Compensation Committee considered industry practice, recommendations of FW Cook regarding the performance measure, the number of executive officers participating in the Executive Incentive Plan, projected operating results, the need to have the ability to reward extraordinary performance, when and if achieved, and incentive awards granted in prior years.
Use of Discretion. Pursuant to the Executive Incentive Plan, and consistent with industry practice, the Compensation Committee may exercise its discretion to determine incentive compensation. Although the Compensation Committee has implemented a more structured discretionary approach to determine incentive compensation, the Compensation Committee did not assign any formula or metrics to financial and operational goals and used its discretion to determine executive officer incentive compensation after considering the significant progress made on the Company’s strategic initiatives and individual performance. The Compensation Committee believes that this incentive compensation structure is in the best interests of stockholders because it enables the Compensation Committee to pay amounts it determines are necessary to appropriately compensate executives in light of the Company’s industry, which is highly dependent on market performance.
2020 Cash and Equity-Based Incentive Awards. In determining 2020 cash and equity-based incentive awards, the Compensation Committee considered (i) the cash and equity-based incentive targets for the executive officers, (ii) execution of the strategic initiatives, (iii) the Company’s financial and operating performance compared to the goals established at the beginning of 2020 in light of the challenging operating environment due to COVID-19 and (iv) Mr. Sanders’ recommendations based on his assessment of the other named executive officers’ individual performance and contributions. FW Cook informed the Compensation Committee that it is market practice for companies to award incentive compensation for a completed performance year while a merger transaction is pending. Therefore, the Compensation Committee determined and awarded incentive compensation for 2020 performance notwithstanding the pending merger between the Company and Macquarie.
Although the Company experienced a challenging operating environment during 2020, the senior management team made significant progress on the Company’s strategic initiatives. The Compensation Committee used financial and operating goals, including adjusted operating income, net consolidated AUM flows and net AUA flows, to monitor performance throughout the year and at year-end; however, achievement of all financial and operating goals was not required for payment of incentive compensation. This is particularly important because some of the strategic initiatives (e.g., fee reductions for certain mutual funds) drive change that challenges short-term financial and operating metrics in order to better position the Company for long-term success. The Compensation Committee placed significant emphasis on the senior management team’s achievements with respect to executing on strategic initiatives. See “Analysis of 2020 Compensation – 2020 Operating Environment” for a summary of progress we made on our strategic initiatives during 2020.
20
The table below sets forth the cash and equity-based incentive compensation targets for each named executive officer, along with actual cash and equity-based incentive awards for 2020, which includes the March 2021 RSU grants. The form of equity-based awards changed from shares of restricted stock in the prior year to RSUs due to restrictions in the Merger Agreement on the Company’s ability to issue restricted stock while the merger is pending. The RSUs granted in March 2021 were different than the CSRSUs issued in prior years to non-executive officers because the RSUs can be settled in cash or Shares at the sole discretion of the Company; provided, that in the event of a change of control of the Company, each RSU shall be settled in cash.
Cash Target | Cash Award | Equity-Based Target | Equity-Based Award | |||||||||||||
| Philip J. Sanders | $ | 1,268,750 | $ | 2,030,000 | $ | 2,718,750 | $ | 2,718,750 | ||||||||
| Benjamin R. Clouse | $ | 525,000 | $ | 1,338,750 | $ | 420,000 | $ | 420,000 | ||||||||
| Brent K. Bloss | $ | 787,500 | $ | 1,748,250 | $ | 1,575,000 | $ | 1,575,000 | ||||||||
| Daniel P. Hanson | $ | 787,500 | $ | 1,575,000 | $ | 1,575,000 | $ | 1,575,000 | ||||||||
| Shawn M. Mihal | $ | 500,000 | $ | 1,225,000 | $ | 400,000 | $ | 400,000 | ||||||||
The Compensation Committee accepted Mr. Sanders’ recommendations with respect to total incentive compensation for the other named executive officers based on 2020 performance and the desire to reward them for their extraordinary performance in executing on the Company’s strategic initiatives during a challenging operating environment. The Compensation Committee placed an emphasis on cash due to the pending merger with Macquarie and the requirement in the Merger Agreement to limit equity-based awards to the target amounts. Therefore, the cash incentive awards exceeded target for each named executive officer and was greater than the cash portion of incentive compensation in the prior year. Consistent with the cash incentive awards for the other named executive officers, Mr. Sanders’ cash incentive award exceeded target in order to reward him for his extraordinary performance in 2020. These cash incentive awards represented between 43-76% of each named executive officers’ total incentive compensation for 2020. Mr. Hanson’s cash award increased by the greatest percentage as compared to the prior year because his 2019 cash incentive award was pro-rated due to his June 2019 hire date.
2019 Cash Award | 2020 Cash Award | Change $ | Change % | |||||||||||||
| Philip J. Sanders | $ | 950,000 | $ | 2,030,000 | $ | 1,080,000 | 114 | % | ||||||||
| Benjamin R. Clouse | $ | 575,000 | $ | 1,338,750 | $ | 763,750 | 133 | % | ||||||||
| Brent K. Bloss | $ | 725,000 | $ | 1,748,250 | $ | 1,023,250 | 141 | % | ||||||||
| Daniel P. Hanson | $ | 475,000 | $ | 1,575,000 | $ | 1,100,000 | 232 | % | ||||||||
| Shawn M. Mihal | $ | 475,000 | $ | 1,225,000 | $ | 750,000 | 158 | % | ||||||||
The Compensation Committee accepted Mr. Sanders’ recommendations to grant equity-based incentive awards at target for the other named executive officers based on 2020 performance. Consistent with the equity-based incentive awards for the other named executive officers, Mr. Sanders’ equity-based incentive award was granted at target. These equity incentive awards represented between 24-57% of each named executive officer’s total incentive compensation for 2020. The number of RSUs granted to each named executive officer was determined by dividing the dollar value of the award by the closing market price of a Share on the grant date and rounding the RSUs up to the nearest whole unit. Equity-based incentive awards for 2020 were granted on March 10, 2021 and vest in 25% increments annually, beginning on the first anniversary of the grant date. However, these awards, like the Company’s other outstanding equity-based awards, will accelerate upon a change in control of the Company.
21
2019 Equity Award | 2020 Equity Award | Change $ | Change % | |||||||||||||
| Philip J. Sanders | $ | 2,650,000 | $ | 2,718,750 | $ | 68,750 | 3 | % | ||||||||
| Benjamin R. Clouse | $ | 550,000 | $ | 420,000 | $ | (130,000 | ) | (24 | )% | |||||||
| Brent K. Bloss | $ | 1,450,000 | $ | 1,575,000 | $ | 125,000 | 9 | % | ||||||||
| Daniel P. Hanson | $ | 1,575,000 | $ | 1,575,000 | - | - | ||||||||||
| Shawn M. Mihal | $ | 525,000 | $ | 400,000 | $ | (125,000 | ) | (24 | )% | |||||||
Mr. Sanders continued to guide the execution of the Company’s strategic initiatives. Like the other named executive officers, his total incentive compensation increased, and most of the increase was reflected in additional cash incentive compensation due to the desire to limit equity-based compensation to the target amount due to the pending merger between the Company and Macquarie. The level of incentive compensation for each other named executive officer was based primarily on their individual performance and contribution to the financial and operational performance of the Company and progress on strategic initiatives, as described below, along with internal pay equity among the named executive officers.
The 2020 annual incentive compensation awards reflect the Compensation Committee’s determination to (1) award incentive compensation based on execution of strategic initiatives in light of the Company’s 2020 financial and operational performance in a challenging operating environment due to COVID-19, balanced with the need to provide total direct compensation that remains competitive in the marketplace and (2) reflect, as appropriate, differences in each named executive officer’s scope of authority and responsibilities, the assumption of additional responsibilities, and an appropriate balance of total direct compensation between cash and equity with an emphasis on cash due to the pending merger with Macquarie and the requirement in the Merger Agreement to limit equity-based awards to the target amounts. The 2020 incentive awards were based solely on performance in 2020, as each named executive officer is party to a Change of Control Retention and Severance Agreement, which provides compensation opportunities, along with accelerated vesting of outstanding equity-based awards, in conjunction with the proposed merger between the Company and Macquarie.
Mr. Sanders discussed with the Compensation Committee the following individual performance considerations that impacted his incentive award recommendations for 2020:
| · | Mr. Clouse: Mr. Clouse directs the finance organization and oversees accounting, data analytics, financial planning and analysis, investor relations, mutual fund accounting, procurement, strategic acquisitions, tax and treasury. Mr. Clouse was instrumental in execution of our corporate strategic objectives, including identifying and pursuing strategic acquisition opportunities prior to the proposed merger with Macquarie. Mr. Clouse was influential in continuing to advance the enterprise project management organization, which is responsible for driving targeted allocation and efficient utilization of corporate resources to accomplish the Company’s strategic initiatives. Mr. Clouse also began the building of a data analytics function by onboarding a new leader and formulating the strategic plan for leveraging data analytics across the organization with an initial focus on distribution enablement strategies. Mr. Clouse was also instrumental in maintaining the strength of our balance sheet during the global pandemic to allow us to further invest in the Company and our people, while pursuing strategic acquisition opportunities prior to the proposed merger with Macquarie. In addition, he administered the Company’s capital management initiatives during the year, including the return of $180.2 million to stockholders through a combination of stock repurchases and regular dividends, and the termination of the Pension Plan and resulting transfer of the remaining liability to the selected annuity provider to further de-risk the balance sheet. |
| · | Mr. Bloss: Mr. Bloss has oversight responsibilities for all operations of the Company and directly leads multiple functions, including the wealth management business, transfer agency, technology, legal/compliance, investment risk management, investment operations and trading, corporate administration and strategic acquisitions. Mr. Bloss was instrumental in execution of our corporate strategic objectives, including identifying and pursuing strategic acquisition opportunities prior to the proposed merger with Macquarie and the outsourcing of our transfer agency transactional processing operations. He has been influential in the continued development of the Company’s information technology group, including the hiring of our Chief Technology Officer and setting strategic direction for the technology function across asset management, wealth management and support services. As a director of the Company’s wealth management subsidiary, he played a key role in the continued evolution of the wealth management business and the advances in technology, processes, recruiting and the business model. Mr. Bloss was instrumental in the transition of our workforce to a work from home environment during the global pandemic, including deployment of incremental technology resources and modified processes to ensure full continuity of operations for clients, advisors and employees. Mr. Bloss oversaw the continued advancement of our transition to a new corporate headquarters and the related changes in our real estate strategies. He has also continued to advance our position as a values-based and purpose driven organization. |
22
| · | Mr. Hanson: Mr. Hanson is responsible for leading the company’s investment management division. Mr. Hanson has day-to-day management and oversight responsibility over our investment management division, including the development of strong investment professionals and the direction of investment processes and organizational capabilities to support our long-term investment strategies. Under his direction and guidance as Chief Investment Officer, our team of portfolio managers, analysts and traders employs a collaborative, research-based investment process that provides a strong foundation for our success. Mr. Hanson was instrumental in execution of our corporate strategic objectives, in particular those related to the asset management business including deepening the collaborative relationship with distribution, advancing institutional credibility and launching efforts to bolster authentic environmental, social and governance credibility and a stewardship culture. |
| · | Mr. Mihal: Mr. Mihal leads the Company’s wealth management business and oversees wealth management markets, sales, advisor recruiting, operations, product and planning, administration and supervision. Mr. Mihal was instrumental in execution of our corporate strategic objectives, in particular those related to the wealth management business. Key among these was the completion of our real estate transition for advisors, reinvigoration of advisor recruiting efforts with reversal of a multi-year decline, and significant progress in reversing a multi-year AUA decline ending the last quarter of 2020 with positive net AUA flows and positive net advisor growth. In addition, Mr. Mihal was influential in the continued evolution of advisor and client facing technology enhancements with significant progress toward our technology strategy achieved in 2020. |
Retirement Benefits
Effective September 30, 2017, the Compensation Committee froze future benefit accruals under the Pension Plan. Participants stopped earning additional benefits based on service or compensation after September 30, 2017. The Compensation Committee approved the termination of the Pension Plan, effective June 1, 2019, and participants were eligible to receive a lump sum distribution of their vested pension benefit in July 2020 or to have their vested benefit transferred to the selected annuity provider for future distribution pursuant to the terms of the Pension Plan. See “Executive Compensation – Pension Benefits” for additional information regarding the Pension Plan.
The Company maintains a 401(k) Plan and matches employee contributions up to 4% of eligible compensation and has the discretion to make additional contributions to eligible participants, subject to applicable non-discrimination requirements. For the 2020 plan year, the Company made a discretionary contribution to the 401(k) account of eligible participants in an amount equal to 2% of eligible 2020 compensation.
Personal Benefits and Other Perquisites
The Company’s employees are eligible to participate in the Company’s active employee flexible benefits plans, which include medical, vision, life insurance and long-term disability coverage and are generally available to all Company employees. Additionally, all of the Company’s employees are entitled to vacation, sick leave and paid holidays, and may be eligible for severance payments under the Severance Plan described below. The Compensation Committee believes that the Company’s commitment to provide the employee benefits summarized above recognizes that the health and well-being of the Company’s employees contribute directly to a productive and successful work life that enhances results for the Company and its stockholders.
The Company provides all full-time employees with (1) life insurance and accidental death and disability coverage, in each case equal to two times the sum of the employee’s current base salary plus the prior year’s W-2 incentive pay (bonus/commissions), up to a maximum of $1 million in coverage, and (2) long-term disability coverage equal to 60% of the employee’s current base salary plus the prior year’s W-2 incentive pay (bonus/commissions), up to a maximum annual benefit of $90,000 ($240,000 for designated senior executives based on position).
23
Pursuant to the Company’s Aircraft Policy, the executive officers and other management employees were provided use of the Company aircraft for business purposes. During 2020, the named executive officers did not use Company aircraft for personal use.
Perquisites represent a relatively insignificant portion of the named executive officers’ total compensation and did not materially influence the Compensation Committee’s decision in determining such officers’ total compensation.
Incentive Compensation Program in General
The incentive program for non-executive officers is structured similarly to the incentive program for executive officers. See “How We Determine Compensation” for additional information regarding the Company’s structured discretionary incentive compensation program.
The Company maintains an incentive compensation program for key employees in order to attract and retain employees who contribute to the Company’s success, to provide incentives that enhance job performance, and to enable those persons to participate in the long-term success of the Company. Beginning in 2017, equity compensation awards granted to non-executive officers have been comprised of a mix of restricted stock and CSRSUs, which are economically equivalent to restricted stock from the recipient’s perspective. On the vesting date, the recipient of a CSRSU receives cash equal to the closing price of a Share on the vesting date for each CSRSU, subject to applicable taxes withholding. Recipients of CSRSUs are not entitled to voting rights or to receive dividends. However, recipients of CSRSUs receive dividend equivalent rights, which are economically equivalent to, and paid concurrently with, dividend payments on the Shares. Restricted stock and CSRSU awards vest in 25% increments beginning on the first anniversary of the grant date. Similar to equity-based awards for named executive officers, non-executive officers received RSUs instead of restricted stock based on 2020 performance.
In connection with the implementation of the new structured discretionary incentive compensation program in 2019, equity awards are granted in March of the year following the performance period. In 2020, the Company began making pro-rata equity grants during the second, third and fourth quarters to new hires so that newly hired employees do not have to wait until the next annual grant in the March following their hire date to begin participating in the plan.
The Compensation Committee has approved, and will continue to approve, all grants of equity compensation. Although Company management, including the Chief Executive Officer, makes recommendations to the Compensation Committee from time to time on the form and amount of equity-based incentive awards to be granted to Company employees, such awards are approved by the Compensation Committee.
The Company does not have a formal policy on timing equity-based incentive awards in connection with the release of material non-public information to affect the value of compensation. In the event that material non-public information becomes known to the Compensation Committee prior to granting equity-based incentive awards, the Compensation Committee will take the existence of such information under advisement and make an assessment in its business judgment whether to delay the grant of the award in order to avoid any impropriety.
Tax Considerations
Section 162(m) of the Internal Revenue Code (“IRC Section 162(m)”) places a limit of $1 million on the amount of compensation the Company may deduct for federal income tax purposes in any one year with respect to certain covered officers that were employed by the Company on the last day of the fiscal year.
In connection with 2020 executive compensation decisions, the Compensation Committee considered the anticipated tax treatment to the Company and to the executive officers of various payments and benefits, including deductibility under IRC Section 162(m). The deductibility of certain compensation payments depends upon the timing of an executive’s vesting of previously granted awards, as well as interpretations and changes in the tax laws and other factors beyond the Compensation Committee’s control. For these and other reasons, including to maintain flexibility in compensating the executive officers in a manner designed to promote varying corporate goals, the Compensation Committee has not historically limited executive compensation to that which is deductible under IRC Section 162(m) and has not adopted a policy requiring all compensation to be deductible. In light of the repeal of the “performance-based” compensation exception to IRC Section 162(m) in December 2017, the Compensation Committee expects to approve compensation that is not deductible for income tax purposes.
24
Clawback Policy
The Board adopted a Clawback Policy in November 2016. The Clawback Policy provides that in the event a material restatement of the Company’s financial results is necessary within three years of the original reporting, the Board will review the facts and circumstances that led to the requirement for the restatement and will consider whether any executive officer received incentive compensation based on the original financial statements that in fact was not warranted based on the restated financial statements. The Board will also consider the accountability of any executive officer whose acts or omissions were responsible in whole or in part for the events that led to the restatement.
The actions the Board may elect to take against a particular executive officer, depending on all facts and circumstances as determined during its review, include: (1) the recoupment of all or part of any incentive compensation paid to the executive officer, including recoupment in whole or in part of vested and/or unvested equity awards; (2) the reduction of future incentive compensation to be paid to the executive officer; (3) disciplinary actions, up to and including termination; and/or (4) the pursuit of other available remedies, at the Board’s discretion.
The Clawback Policy applies to “executive officers” of the Company as defined under the Exchange Act and such other senior executives as may be determined by the Board.
Prohibition on Hedging and Pledging of Company Securities
Our Insider Trading Policy prohibits all directors and “officers” of the Company for purposes of Section 16 of the Exchange Act, including the named executive officers, from transacting in put and call options on any Company securities. The policy also prohibits these individuals from engaging in any hedging or monetization transactions or similar arrangements with respect to any Company securities. Additionally, the policy prohibits these individuals from holding Company securities in a margin account or pledging Company securities as collateral for any indebtedness.
Stock Ownership Guidelines
To reinforce the importance of aligning the financial interests of the Company’s directors and executive officers with stockholders, the Board has approved minimum stock ownership guidelines for the directors and executive officers. Directors are required to maintain stock ownership equal in value to five times such director’s annual cash retainer. The Chief Executive Officer is required to maintain stock ownership equal in value to five times his base salary and the other executive officers are required to maintain stock ownership equal in value to three times their base salary. The value of minimum stock ownership that must be maintained is based upon the respective director’s annual cash retainer or the executive officer’s annual base salary for the most recently completed year. Directors and executive officers are expected to be in compliance with the applicable ownership level within five years of becoming subject to the ownership guidelines. Stock ownership includes Shares over financial reportingwhich a director or executive officer has direct or indirect ownership or control, including restricted stock. As of April 15, 2021, all of our directors, except for those directors appointed to the Board in 2019 and 2020, and all of our executive officers have satisfied their respective stock ownership requirement.
25
EXECUTIVE COMPENSATION
Summary Compensation
The following table summarizes total compensation awarded, paid or earned by our named executive officers who served in such capacities during 2018, 2019 and 2020.
SUMMARY COMPENSATION TABLE
Name and Principal Position | Year | Salary | Bonus | Equity-Based | Non-Equity | Change in | All Other | Total | ||||||||||||||||||||||||
| (a) | (b) | (c) | (d) | (e) | (f) | (g) | (h) | (i) | ||||||||||||||||||||||||
| Philip J. Sanders | 2020 | 725,000 | 2,650,009 | 2,030,000 | (1,119,206 | ) | 17,000 | 4,302,803 | ||||||||||||||||||||||||
| Chief Executive | 2019 | 725,000 | - | - | 950,000 | 221,238 | 30,572 | 1,926,810 | ||||||||||||||||||||||||
| Officer | 2018 | 725,000 | - | 2,975,010 | 750,000 | - | 18,478 | 4,468,488 | ||||||||||||||||||||||||
| Benjamin R. Clouse | 2020 | 420,000 | - | 550,001 | 1,338,750 | (55,427 | ) | 17,000 | 2,270,324 | |||||||||||||||||||||||
| SVP and Chief | 2019 | 400,000 | - | 575,000 | 17,169 | 16,800 | 1,008,969 | |||||||||||||||||||||||||
| Financial Officer | 2018 | 350,000 | - | 700,003 | 375,000 | - | 12,060 | 1,437,063 | ||||||||||||||||||||||||
| Brent. K. Bloss | 2020 | 525,000 | 1,450,008 | 1,748,250 | (672,099 | ) | 17,000 | 3,068,159 | ||||||||||||||||||||||||
| President | 2019 | 475,000 | - | - | 725,000 | 184,031 | 31,960 | 1,415,991 | ||||||||||||||||||||||||
| 2018 | 475,000 | - | 1,500,007 | 600,000 | - | 18,934 | 2,593,941 | |||||||||||||||||||||||||
| Daniel P. Hanson | 2020 | 525,000 | 1,575,006 | 1,575,000 | - | 17,000 | 3,692,006 | |||||||||||||||||||||||||
| SVP and Chief | 2019 | 282,692 | - | 2,500,002 | 475,000 | - | 34,389 | 3,292,083 | ||||||||||||||||||||||||
| Investment Officer (5) | ||||||||||||||||||||||||||||||||
| Shawn M. Mihal | 2020 | 400,000 | 525,002 | 1,225,000 | (83,059 | ) | 17,922 | 2,084,865 | ||||||||||||||||||||||||
| SVP – Wealth | 2019 | 375,000 | - | - | 475,000 | 26,707 | 38,359 | 915,066 | ||||||||||||||||||||||||
| Management | 2018 | 350,000 | 375,000 | 900,023 | 250,011 | - | 35,344 | 1,910,378 | ||||||||||||||||||||||||
| (1) | Represents the grant date fair value computed in accordance with ASC 718, disregarding any forfeiture assumptions. All awards are valued based on the closing market price of a Share on the date of grant, or the last business day immediately preceding the grant date if the grant date is not a business day. Equity-based awards are subject to accelerated vesting upon a change of control, death or disability. |
Prior to 2019, equity-based awards were granted on December 31 of each year and reported in the Summary Compensation Table in the year they were earned and granted. Equity-based awards based on 2020 performance were granted on March 10, 2021 and, therefore, such awards are not reported in the Summary Compensation Table. Equity-based awards based on 2019 performance were granted on March 10, 2020 and, therefore, are reported as 2020 compensation in the Summary Compensation Table. The table below sets forth 2020 compensation for each named executive officer, including equity-based awards granted on March 10, 2021 based on 2020 performance, which are not included in the Summary Compensation Table.
26
Salary | Equity-Based Awards |
Non-Equity Incentive |
Change in Pension |
All Other Compensation |
Total | |||||||||||||||||||
| Philip J. Sanders | $ | 725,000 | $ | 2,718,764 | $ | 2,030,000 | $ | (1,119,206 | ) | $ | 17,000 | $ | 4,354,558 | |||||||||||
| Benjamin R. Clouse | $ | 420,000 | $ | 420,021 | $ | 1,338,750 | $ | (55,247 | ) | $ | 17,000 | $ | 2,123,344 | |||||||||||
| Brent K. Bloss | $ | 525,000 | $ | 1,575,016 | $ | 1,748,250 | $ | (672,099 | ) | $ | 17,000 | $ | 3,176,167 | |||||||||||
| Daniel P. Hanson | $ | 525,000 | $ | 1,575,016 | $ | 1,575,000 | n/a | $ | 17,000 | $ | 3,675,016 | |||||||||||||
| Shawn M. Mihal | $ | 400,000 | $ | 400,019 | $ | 1,225,000 | $ | (83,059 | ) | $ | 17,922 | $ | 1,941,960 | |||||||||||
| (2) | For 2020, represents the cash incentive awards made under the Executive Incentive Plan based on 2020 performance, which is discussed in further detail under “Analysis of 2020 Compensation” set forth above in the “Compensation Discussion & Analysis.” |
| (3) | For 2020, the present value of benefits under the Pension Plan decreased for the named executive officers that were participants in the Pension Plan by the present value of benefits reported in the Pension Benefits Table in the proxy statement for the 2020 Annual Meeting of Stockholders. In connection with the termination of the Pension Plan, payments were made in July 2020 to participants that elected to receive a lump sum distribution. See the Pension Benefits Table for the lump sum distribution amounts made to the named executive officers that were participants in the Pension Plan. |
| (4) | For 2020, represents the following: |
| (a) | Company matching contributions to the 401(k) Plan of $11,400 and a $5,600 discretionary 401(k) Plan contribution for each of the named executive officers. The Company made a discretionary contribution in the first quarter of 2021 to the account of eligible 401(k) participants in an amount equal to 2% of eligible 2020 compensation. |
| (b) | Incremental cost to the Company of convention allowance and gross-up related to an advisor conference for Mr. Mihal. The direct costs of the convention allowance were imputed to Mr. Mihal and included as taxable income on his Form W-2. |
| (5) | Mr. Hanson was not a named executive officer in 2018; therefore, compensation information is not presented for that year. |
27
Grants of Plan-Based Awards
The following table reflects information regarding non-equity and equity-based incentive plan awards during 2020. Cash and equity-based incentive awards are granted to participants pursuant to the Executive Incentive Plan. Cash incentive awards based on 2020 performance were paid in December 2020 and equity-based incentive awards based on 2019 performance were granted on March 10, 2020. Equity-based incentive awards based on 2020 performance were granted on March 10, 2021 and are not included in the table below or the Summary Compensation Table. See footnote 1 to the Summary Compensation Table for information regarding the 2020 equity-based incentive awards granted in March 2021.
For more detailed information regarding awards earned by the named executive officers, please refer to “Analysis of 2020 Compensation” set forth in the “Compensation Discussion & Analysis”.
GRANTS OF PLAN-BASED AWARDS TABLE
| Estimated Possible Payouts Under Non-Equity Incentive Plan Awards | All Other Stock Awards: Number of Shares of | Grant Date Fair Value of | ||||||||||||||||||||||||||
| Name | Grant Date | Date of Committee Action | Thres- hold ($) | Target ($)(1) | Maximum ($) | Stock or Units (#) (2) | Stock and Unit Awards ($) (3) | |||||||||||||||||||||
| (a) | (b) | (c) | (d) | (e) | (f) | (g) | (h) | |||||||||||||||||||||
| Philip J. | - | - | - | 1,268,750 | - | - | - | |||||||||||||||||||||
| Sanders | 03/10/2020 | 01/27/2020 | 206,387 | 2,650,009 | ||||||||||||||||||||||||
| Benjamin R. | - | - | - | 525,000 | - | - | - | |||||||||||||||||||||
| Clouse | 03/10/2020 | 01/27/2020 | 42,835 | 550,001 | ||||||||||||||||||||||||
| Brent K. | - | - | - | 787,500 | - | - | - | |||||||||||||||||||||
| Bloss | 03/10/2020 | 01/27/2020 | 112,929 | 1,450,008 | ||||||||||||||||||||||||
| Daniel P | - | - | - | 787,500 | - | - | - | |||||||||||||||||||||
| Hanson | 03/10/2020 | 01/27/2020 | 122,664 | 1,575,006 | ||||||||||||||||||||||||
| Shawn M. | - | - | - | 500,000 | - | - | - | |||||||||||||||||||||
| Mihal | 03/10/2020 | 01/27/2020 | 40,888 | 525,002 | ||||||||||||||||||||||||
| (1) | Represents the 2020 cash incentive target for each named executive officer established by the Compensation Committee in February 2020. There was no threshold or maximum amount established by the Compensation Committee for cash incentive awards under the Executive Incentive Plan. Actual awards are reported in the “Non-Equity Incentive Plan Compensation” column of the Summary Compensation Table. |
| (2) | Represents the number of shares of restricted stock granted in 2020 pursuant to the Company’s Stock Incentive Plan. |
| (3) | Represents the grant date fair value computed in accordance with ASC 718, disregarding any forfeiture assumptions and based on the number of shares of restricted stock granted and the closing market price of the Shares on the March 10, 2020 grant date, which was $12.84. The number of shares of restricted stock granted was determined by dividing the dollar amount of the award by such closing market price of a Share and rounding up to the nearest whole share. The awards vest in 25% increments annually beginning on the first anniversary of the grant date and are subject to accelerated vesting upon a change of control, death or disability. Dividends are paid on awards of restricted stock at the same rate as is paid to all stockholders generally. Pursuant to ASC 718, the right to receive dividends is included in the calculation of the grant date fair value of the restricted stock awards. The restricted stock awards are reported in the “Equity-Based Awards” column of the Summary Compensation Table. |
28
Outstanding Equity Awards at Fiscal Year-End
The following table reflects outstanding shares of restricted stock and CSRSUs held by the named executive officers as of December 31, 2018,2020, the value of which was determined based on criteria established in Internal Control – Integrated Framework (2013) issuedthe number of shares of restricted stock or CSRSUs granted and the $25.47 closing market price of a Share on December 31, 2020.
OUTSTANDING EQUITY AWARDS AT FISCAL YEAR-END
Stock Awards | ||||||||||
Name | Grant Date | Number | Market | |||||||
| (a) | (b) | (c) | ||||||||
| Philip J. Sanders | 12/31/17 | 34,971 | (1) | 890,711 | ||||||
| 12/31/18 | 82,273 | (2) | 2,095,493 | |||||||
| 03/10/20 | 206,387 | (3) | 5,256,677 | |||||||
| Benjamin R. Clouse | 12/31/17 | 5,595 | (1) | 142,505 | ||||||
| 12/31/18 | 19,358 | (2) | 493,048 | |||||||
| 03/10/20 | 42,835 | (3) | 1,091,007 | |||||||
| Brent K. Bloss | 12/31/17 | 18,464 | (1) | 470,278 | ||||||
| 12/31/18 | 41,482 | (2) | 1,056,547 | |||||||
| 03/10/20 | 112,929 | (3) | 2,876,302 | |||||||
| Daniel P. Hanson | 06/10/19 | 112,007 | (4) | 2,852,818 | ||||||
| 03/10/20 | 122,664 | (3) | 3,124,252 | |||||||
| Shawn M. Mihal | 01/10/17 | 1,622 | (5) | 41,312 | ||||||
| 01/10/17 | 1,622 | (5) | 41,312 | |||||||
| 01/10/18 | 5,638 | (6) | 143,600 | |||||||
| 01/10/18 | 5,638 | (6) | 143,600 | |||||||
| 12/31/18 | 17,976 | (2) | 457,849 | |||||||
| 03/10/20 | 40,888 | (3) | 1,041,417 | |||||||
| (1) | These shares will vest on December 31, 2021. |
| (2) | These shares will vest in 50% increments on December 31, 2021 and 2022. |
| (3) | These shares will vest in 25% increments on March 10, 2021, 2022, 2023 and 2024. |
| (4) | These shares will vest in 331/3% increments on June 10, 2021, 2022 and 2023. |
| (5) | These shares will vest on January 10, 2021. |
| (6) | These awards will vest in 50% increments on January 10, 2021 and 2022. |
29
Option Exercises and Stock Vested
The following table reflects shares of restricted stock and CSRSUs held by the Committee of Sponsoring Organizationsnamed executive officers that vested during 2020.
OPTION EXERCISES AND STOCK VESTED TABLE
| Stock Awards | ||||||||
Name | Number of Shares | Value Realized | ||||||
| (a) | (b) | (c) | ||||||
| Philip J. Sanders | 111,983 | 2,852,207 | ||||||
| Benjamin R. Clouse | 19,118 | 486,935 | ||||||
| Brent K. Bloss | 58,106 | 1,479,960 | ||||||
| Daniel P. Hanson | 37,336 | 582,068 | ||||||
| Shawn M. Mihal | 20,491 | 405,638 | ||||||
| (1) | The number of shares acquired on vesting for Mr. Mihal includes 4,442 CSRSUs, the value of which is based on the closing price of a Share on the vesting date, or the last business day immediately preceding the vesting date if the vesting date is not a business day. The number of Shares received by each named executive officer upon vesting of these awards, net of shares withheld by the Company to cover associated tax liabilities, was as follows: Messrs. Sanders (61,200), Clouse (10,641), Bloss (32,337), Hanson (24,816) and Mihal (9,757). |
| (2) | The value realized on vesting is based on the closing market price of a Share on the vesting date, or the last business day immediately preceding the vesting date if the vesting date is not a business day. |
Pension Benefits
The Pension Plan was a tax-qualified, non-contributory pension plan that covered all eligible employees of the Treadway Commission.Company who were 21 years of age or older and had one or more years of credited service. Benefits payable were generally based on a participant’s years of credited service and their highest average earnings in any five consecutive years during the last ten years of service prior to retirement, or their “5-year average earnings.” The retirement benefit amount payable upon normal retirement was calculated as (1) 2% of a participant’s 5-year average earnings for each year of credited service (up to a maximum of 30 years), plus (2) 1% of a participant’s 5-year average earnings for each additional year of credited service in excess of 30 years (up to a maximum of ten years); this amount is then reduced by a social security offset.
Due to the Pension Plan freeze, effective September 30, 2017, participants no longer accrued future benefits based on years of service and compensation after the freeze date. The Pension Plan was terminated, effective June 1, 2019, and all participants in the Pension Plan were fully vested in their accrued benefit. In our opinion,connection with the termination of the Pension Plan, in July 2020, payments were made to participants, beneficiaries and alternate payees that elected to receive a lump sum distribution and to the selected annuity provider that assumed the remaining liabilities of the Pension Plan.
The actuarial present value of accumulated benefits payable to each of the named executive officers under the Pension Plan is zero, as each named executive officer elected to receive a lump sum distribution of their accumulated benefit in July 2020. The lump sum distribution amounts were determined assuming a payment date of July 1, 2020, using the Internal Revenue Code Section 417(e) prescribed 2020 mortality rates and the three segment rates of 2.04%/3.09%/3.68%.
30
PENSION BENEFITS TABLE
| Name | Plan Name | Number of Years Credited Service (#) | Present Value of Accumulated Benefit ($) | Payments During Last Fiscal Year ($)(1) | ||||||||||
| (a) | (b) | (c) | (d) | (e) | ||||||||||
| Philip J. Sanders | Pension Plan | 19 | - | 1,095,595 | ||||||||||
| Benjamin R. Clouse | Pension Plan | 1.98 | - | 48,507 | ||||||||||
| Brent K. Bloss | Pension Plan | 15.75 | - | 615,277 | ||||||||||
| Daniel P. Hanson (2) | Pension Plan | - | - | - | ||||||||||
| Shawn M. Mihal | Pension Plan | 2.52 | - | 71,354 | ||||||||||
| (1) | Amounts represent lump sum distributions made in July 2020 in connection with termination of the Pension Plan. |
| (2) | Mr. Hanson is not a participant in the Pension Plan. |
Nonqualified Deferred Compensation Plans
The Company does not provide any deferred compensation arrangements for its named executive officers.
Potential Payments Upon Termination or Change in Control
Severance Plan
The named executive officers are eligible to receive certain severance benefits under the Company’s Severance Pay Plan (the “Severance Plan”) if they are involuntarily terminated due to a corporate realignment, downsizing or other event that the Company, maintained, in all material respects,its sole discretion, determines is a qualifying event for purposes of the Severance Plan. Participants in the Severance Plan who receive severance are entitled to periodic payment of their base pay and health care severance pay for no fewer than 12 weeks and no more than 52 weeks (subject to the six month delay on certain termination payments imposed by the Internal Revenue Code) with the number of weeks of severance determined by multiplying the participant’s years of service by two weeks. The amount of the health care severance pay will be determined by the Company in its discretion. In addition, the Company may provide, in its discretion, career transition services.
Change of Control Retention and Severance Agreements
In connection with the proposed merger between the Company and Macquarie, each of the Company’s executive officers, including the named executive officers, entered into a Change of Control Retention and Severance Agreement effective internalDecember 2, 2020 (the “Change of Control Agreements”). The Change of Control Agreements provide for the following retention and severance payments to the executives:
| · | A cash retention bonus (the “Retention Bonus”), calculated as described below, that is payable to the executive in a single lump sum immediately prior to the Effective Time if (i) the executive remains continuously employed until the Closing Date or (ii) the executive’s employment terminates before the Closing Date due to his or her death or disability. |
| · | A cash payment equal to the executive’s target annual cash incentive opportunity for the 2021 calendar year, prorated through the date of a qualifying termination (as defined below) (the “Prorated 2021 Target STI Payment”). An executive’s Prorated 2021 Target STI Payment is payable to the executive in a single lump sum on or before March 15, 2022, provided the executive remains continuously employed until the Closing Date or his or her employment terminates before the Closing Date due to his or her death or disability. |
| · | A cash severance payment (the “Severance Payment”) payable to the executive in a single lump sum if the executive incurs a qualifying termination (as defined below) of employment within 24 months following the Effective Time. An executive’s Severance Payment is equal to his or her highest annual base salary during the period that begins on December 2, 2020, and ends on the date of his or her qualifying termination. For this purpose, a “qualifying termination” means the executive’s employment is terminated (i) by the Company (or its successor) other than for “cause,” (ii) by the executive for “good reason,” or (iii) due to the executive’s death or disability. The Change of Control Agreement conditions receipt of the Severance Payment on the executive entering into a release of claims in favor of the Company. |
The amount of an executive’s Retention Bonus is the amount equal to the sum of his or her “fixed retention bonus,” “at-risk retention bonus,” and “at-risk additional bonus,” each as calculated as follows: an executive’s “fixed retention bonus” is the amount equal to the sum of his or her (a) annual base salary in effect on December 2, 2020, (b) target annual cash incentive opportunity for the 2020 calendar year (“2020 Target Cash Bonus Opportunity”), (c) target annual long-term incentive opportunity for the 2021 calendar year, prorated through the Closing Date (the “Prorated 2021 Target LTI Payment”), and (d) $50,000.
31
An executive’s “at-risk retention bonus” is a performance-based bonus in the target amount (which is also the maximum amount) equal to the sum of the executive’s annual base salary in effect on December 2, 2020, and his or her 2020 Target Cash Bonus Opportunity. Seventy-five percent (75%) of the executive’s at-risk retention bonus will be determined based on the amount by which the Client Consent Percentage and the Company Advisor Percentage, each as determined pursuant to the Merger Agreement, exceed 65% and 40%, respectively. The remaining twenty-five percent (25%) of the executive’s target at-risk retention bonus will be determined based on the executive’s individual performance during the period that begins on December 2, 2020, and ends three days before the Closing Date (or, if earlier, the executive’s termination due to his or her death or disability), as determined by the Company’s Chief Executive Officer and Macquarie in their good faith discretion.
An executive’s “at-risk additional bonus” is a performance-based bonus in a target amount (which is also the maximum amount) equal to a specified amount of the aggregate $5 million bonus pool amount, which individual target amounts were approved by the Board in connection with its approval of the Change of Control Agreement. Seventy-five percent (75%) of each executive’s at-risk additional bonus will be determined based on the amount by which the Client Consent Percentage and the Company Advisor Percentage, each as determined pursuant to the Merger Agreement, exceed 65% and 40%, respectively. The remaining twenty-five percent (25%) of the executive’s at-risk additional bonus will be determined based on the executive’s individual performance during the period that begins on December 2, 2020, and ends three days before the Closing Date (or, if earlier, the executive’s termination due to his or her death or disability), as determined by the Company’s Chief Executive Officer and Macquarie in their good faith discretion.
The Change of Control Agreement also includes a provision providing that if any payments to be made to the executive, whether under the agreement or otherwise, would subject the executive to the excise tax on so-called “golden parachute payments” in accordance with Sections 280G or 4999 of the Internal Revenue Code, then the payments will be reduced to the extent necessary to avoid the excise tax. Similarly, if any of the payments payable to the executive after the Effective Time, whether under the agreement or otherwise, which are subject to Part 2D.2 of the Australian Corporations Act of 211 (Cth) (the “Corporations Act”) exceed the amount that is permitted to be paid to the executive under the Corporations Act, then such payment will be reduced to the greatest amount that is permitted to be paid to the executive.
The Change of Control Agreement will be null and void if the Merger Agreement terminates for any reason without consummation of the merger.
Accelerated Vesting of Equity Awards
The equity incentive awards granted to the named executive officers under the Company Stock Plans provide for accelerated vesting upon a “change in control” (as defined in the Company Stock Plans) unless otherwise determined by the Compensation Committee prior to such “change in control, over financial reporting” whether or not the named executive officer’s employment terminates. Equity incentive awards also vest upon the death or “disability” (permanent disability as determined under the Company’s long-term disability plan) of a named executive officer.
Effect of the Merger Agreement
The Merger Agreement provides that the Company’s equity awards that are outstanding immediately prior to the Effective Time will be subject to the following treatment:
Each outstanding RSU and CSRSU will be terminated and cancelled as of December 31, 2018, based on criteria establishedimmediately prior to the Effective Time in Internal Control – Integrated Framework (2013) issuedexchange for the right to receive a cash payment equal to (i) (A) the merger consideration, multiplied by (B) the Committeenumber of Sponsoring OrganizationsShares subject to such RSU or CSRSU immediately prior to the Effective Time, plus (ii) the amount of any accrued but unpaid dividend equivalent rights under such RSU or CSRSU, net of any taxes withheld pursuant to the Merger Agreement.
Each outstanding share of restricted stock will vest in full and any forfeiture restrictions applicable to such restricted stock will immediately lapse. By virtue of the Treadway Commission.
We also have audited,merger, and without any action on the part of the holder thereof, each share of restricted stock will be treated as a Share for all purposes of the Merger Agreement, including the right to receive the merger consideration in accordance with the standardsterms thereof, less applicable taxes required to be withheld with respect to such vesting.
32
The table below quantifies (1) amounts payable and the value of benefits available pursuant to the Severance Plan if a named executive officer is involuntarily terminated due to a corporate realignment, downsizing or other event that the Company, in its sole discretion, determines is a qualifying event for purposes of the PublicSeverance Plan [column (a)], (2) the value of restricted stock vesting upon a “change in control,” death or “disability” for purposes of the Company’s Stock Incentive Plan [column (b)] and (3) the amounts payable pursuant to the Change of Control Agreements, all of which assume that the applicable triggering event occurred on December 31, 2020 and where applicable, is based on a stock price of $25.47, which was the closing market price of the Company’s Class A common stock on December 31, 2020.
The amounts indicated below are estimates based on multiple assumptions that may or may not actually occur or be accurate as of the date referenced, therefore, the actual amounts, if any, that may be paid or become payable may materially differ from the amounts set forth below.
For an estimate of payments and benefits to be made to the named executive officers pursuant to the Change of Control Agreement, see “The Merger – Interests of Directors and Executive Officers in the Merger” in the Company’s proxy statement filed with the SEC on February 17, 2021, which used the following assumptions:
| · | the relevant price per Share is $25.00, which is the price per Share to be paid in connection with the merger; |
| · | the assumed Effective Date of the merger is February 15, 2021, which was the latest practicable date prior to filing the Company’s proxy statement with the SEC on February 17, 2021 in connection with the Special Meeting of Stockholders that was held on March 23, 2021 in connection with the merger; and |
| · | the employment of each named executive officer of the Company will have been involuntarily terminated without cause by the Company immediately following the assumed Effective Date of the merger on February 15, 2021. |
33
POTENTIAL PAYMENTS UPON TERMINATION OR CHANGE IN CONTROL TABLE
| Name | Payments and Benefits under Severance Plan ($)(1)(2) | Change in Control to Company Stock Plans | Payments under Change of Control Agreements ($)(4) | |||||||||
| (a) | (b) | (c) | ||||||||||
| Philip J. Sanders | ||||||||||||
| Retention Payment | 5,080,300 | |||||||||||
| Severance Payment | 613,462 | 725,000 | ||||||||||
| Medical and Dental Benefits | 9,697 | |||||||||||
| Career Transition Services | 108,750 | |||||||||||
| Equity Award Vesting | 8,242,881 | |||||||||||
| Total | 731,908 | 5,805,300 | ||||||||||
| Benjamin R. Clouse | ||||||||||||
| Retention Payment | 2,228,599 | |||||||||||
| Severance Payment | 96,923 | 420,000 | ||||||||||
| Medical and Dental Benefits | 3,708 | |||||||||||
| Career Transition Services | 63,000 | |||||||||||
| Equity Award Vesting | 1,726,560 | |||||||||||
| Total | 163,631 | 2,648,599 | ||||||||||
| Brent K. Bloss | ||||||||||||
| Retention Payment | 3,441,400 | |||||||||||
| Severance Payment | 363,462 | 525,000 | ||||||||||
| Medical and Dental Benefits | 11,124 | |||||||||||
| Career Transition Services | 78,750 | |||||||||||
| Equity Award Vesting | 4,403,127 | |||||||||||
| Total | 453,336 | 3,966,400 | ||||||||||
| Daniel P. Hanson | ||||||||||||
| Retention Payment | 3,313,000 | |||||||||||
| Severance Payment | 121,154 | 525,000 | ||||||||||
| Medical and Dental Benefits | 3,708 | |||||||||||
| Career Transition Services | 78,750 | |||||||||||
| Equity Award Vesting | 5,977,070 | |||||||||||
| Total | 203,612 | 3,838,000 | ||||||||||
| Shawn M. Mihal | ||||||||||||
| Retention Payment | 2,048,661 | |||||||||||
| Severance Payment | 92,308 | 400,000 | ||||||||||
| Medical and Dental Benefits | 3,708 | |||||||||||
| Career Transition Services | 60,000 | |||||||||||
| Equity Award Vesting | 1,869,090 | |||||||||||
| Total | 156,016 | 2,448,661 | ||||||||||
| (1) | Severance Plan benefits for Messrs. Sanders, Clouse, Bloss, Hanson and Mihal are equal to 44, 12, 36, 12 and 12 weeks of base pay, respectively, in accordance with the normal payroll practices of the Company. The named executive officers are not entitled to benefits under the Severance Plan in connection with a change of control due to the proposed merger between the Company and Macquarie. |
| (2) | Reflects career transition services equal to 15% of each named executive officer’s base salary. Pursuant to the Severance Plan, career transition services may be offered in the sole discretion of the Company. Consequently, these amounts may not be payable even if the named executive officer is otherwise eligible for benefits under the Severance Plan. |
34
| (3) | Includes unvested restricted stock and unvested CSRSUs, in the aggregate, held as of December 31, 2020 by each named executive officer as follows: Messrs. Sanders (323,631), Clouse (67,788), Bloss (172,875), Hanson (234,671) and Mihal (73,384). |
| (4) | The amounts in this column represent, for each of the named executive officers, (i) a Retention Bonus and (ii) a Severance Payment equal to the executive’s 2020 annual base salary. The Retention Bonus represents the sum of the executive’s “fixed retention bonus,” “at-risk retention bonus,” and “at-risk additional bonus,” each as described above assuming each “at-risk” bonus amount is earned in full, except that the “fixed retention bonus” does not include a Prorated 2021 Target LTI Payment because the triggering event is assumed to have occurred on December 31, 2020. The Prorated 2021 Target STI Payment is also excluded because of the assumed date of the triggering event. |
35
Compensation of Directors
The Compensation Committee reviews annual compensation for Outside Directors. The Company Accounting Oversightuses a combination of cash and equity compensation to attract and retain qualified candidates to serve on the Board. All amounts are pro-rated if a director joins the Board (United States) (PCAOB)after the commencement of the Company’s fiscal year.
In setting Outside Director compensation, the Compensation Committee considers the significant amount of time that directors spend in fulfilling their duties to the Company, as well as the skill level required of Board members. The Compensation Committee also reviews competitive compensation data and analysis provided by FW Cook.
In December 2019, FW Cook provided the Compensation Committee with competitive compensation data and analysis of our Outside Director compensation, including retainers and equity-based compensation awards, as compared to that paid to the non-employee directors of the Company’s peer group. The Compensation Committee considered the current compensation structure for Outside Directors, market trends with respect to director compensation and peer data. The companies included in the peer group are listed in “How We Determine Compensation – Peer Group Analysis” in the “Compensation Discussion & Analysis” above.
Based on the peer data and the time commitment of Mr. Morrissey, as Chair of the Audit Committee, the Compensation Committee (with Mr. Morrissey abstaining) approved an increase to the cash retainer for the Chair of the Audit Committee in 2020 to $25,000, and the Board ratified the change. Compensation for other Outside Directors in 2020 was unchanged from 2019.
Cash Compensation
For 2020, Outside Directors received the following cash compensation:
Cash Retainers – Board
| · | $80,000 for each Board member |
| · | $225,000 for the Chairman |
Cash Retainers – Committees
| · | $25,000 for Audit Committee Chair |
| · | $10,000 for Audit Committee Member |
| · | $15,000 for Compensation Committee Chair |
| · | $7,500 for Compensation Committee Member |
| · | $12,000 for Corporate Governance Committee Chair |
| · | $6,000 for Corporate Governance Committee Member |
Although, Outside Directors generally are not paid for attending Board or committee meetings, the Chairman of the Board and the Chair of the Compensation Committee may determine to pay meeting fees for one or more meetings to the extent the number of Board or committee meetings exceeds the typical number of meetings during the year. During 2020, the Board met 17 times and the Executive Committee of the Board, comprised of Messrs. Godlasky, Morrissey, Sanders and Walton, met four times. As a result, the Board approved additional cash payments to the Outside Directors as follows: Mr. Godlasky received $50,000; Messrs. Morrissey and Walton each received $45,000; and Mss. Andrade, Gasaway and Kline and Messrs. Jessee and Logue each received $37,500.
The Company also reimburses Outside Directors for travel and lodging expenses, if any, incurred to attend Board and committee meetings, and subject to approval by the Chairman of the Board, expenses incurred by a director in attending continuing education programs relevant to his or her duties as a director of the Company.
36
Equity Compensation
For 2020, Outside Directors received the following equity-based compensation:
Restricted Stock Awards
| · | $125,000 for each Board member |
| · | $165,000 for the Chairman |
Equity awards for Outside Directors are intended to increase their beneficial ownership in the Company to more closely align their interests with those of our stockholders. On January 2, 2020, (i) Mss. Andrade and Gasaway and Messrs. Jessee, Logue, Morrissey and Walton were each granted 7,504 shares of restricted stock, (ii) Mr. Kosloff was granted 2,502 shares of restricted stock, and (iii) Mr. Godlasky was granted 9,904 shares of restricted stock. On February 21, 2020, Mss. Kline and Weaver were each granted 6,794 shares of restricted stock. Restricted stock granted to Outside Directors do not have a purchase price and are subject to accelerated vesting upon a change of control, death, disability or mandatory retirement. Restricted stock awards granted to Outside Directors in 2020 vested 100% on the first anniversary of the grant date. Dividends are paid on awards of restricted stock at the same rate that is paid to all stockholders generally.
In addition to the compensation outlined above, the Company maintains director and officer insurance coverage and provides Outside Directors with special indemnification rights in the form of an indemnification agreement that exceeds the general rights provided under our Certificate of Incorporation and Bylaws.
2021 Compensation
In December 2020, FW Cook provided the Compensation Committee with competitive compensation data and analysis of our Outside Director compensation, including retainers and equity compensation awards, as compared to that paid to the non-employee directors of the Company’s peer group. The Compensation Committee considered the current compensation structure for Outside Directors, market trends with respect to director compensation and peer data. Based on the pending merger between the Company and Macquarie, no changes were made to Outside Director compensation for 2021.
The following table reflects the compensation paid to our Outside Directors for 2020.
2020 Director Compensation
Name | Fees | Stock | All Other | Total | ||||||||||||
| (a) | (b) | (c) | (d) | (e) | ||||||||||||
| Kathie J. Andrade | 134,500 | 125,017 | - | 259,517 | ||||||||||||
| Sharilyn S. Gasaway | 137,000 | 125,017 | - | 262,017 | ||||||||||||
| Thomas C. Godlasky | 275,000 | 165,001 | - | 440,001 | ||||||||||||
| Chairman of the Board | ||||||||||||||||
| James A. Jessee | 134,500 | 125,017 | - | 259,517 | ||||||||||||
| Katherine M.A. Kline (2) | 114,750 | 109,383 | 224,133 | |||||||||||||
| Alan W. Kosloff (3) | 31,167 | 41,683 | 855 | 73,705 | ||||||||||||
| Dennis E. Logue | 135,500 | 125,017 | - | 260,517 | ||||||||||||
| Michael F. Morrissey | 165,500 | 125,017 | - | 290,517 | ||||||||||||
| Jerry W. Walton | 158,000 | 125,017 | - | 283,017 | ||||||||||||
| Constance K. Weaver (2) | 35,833 | 109,383 | - | 145,216 | ||||||||||||
| (1) | Represents the grant date fair value computed in accordance with Accounting Standards Codification Topic 718, “Stock Compensation” (“ASC 718”) disregarding any forfeiture assumptions. All awards are valued based on the closing market price of a Share on the date of grant ($16.66 and $16.10) for 2020 awards granted on January 2, 2020 and February 21, 2020, respectively). The number of shares of restricted stock granted was determined by dividing the dollar amount of the equity award by such closing market price of a Share and rounding up to the nearest whole share. As of December 31, 2020, (i) each of Mss. Andrade and Gasaway and Messrs. Jessee, Logue, Morrissey, and Walton held 7,504 shares of unvested restricted stock, (ii) Ms. Kline held 6,794 shares of unvested restricted stock and (iii) Mr. Godlasky held 9,904 shares of unvested restricted stock. |
| (2) | Mss. Kline and Weaver were appointed to the Board, effective February 21, 2020. Ms. Weaver resigned from the Board on July 10, 2020 due to her acceptance of a chief marketing officer position with another company. |
| (3) | Mr. Kosloff retired from the Board on April 29, 2020. |
37
Pay Ratio
Following is a reasonable estimate of the ratio of the annual total compensation of Philip J. Sanders, our Chief Executive Officer, to the median of the annual total compensation of our other employees. We determined our median employee based on compensation during 2019 for each of our employees (excluding Mr. Sanders), as reflected in our payroll records and reported to the consolidated balance sheetsIRS on Form W-2. For 2020, we are using the same median employee as used in 2019. The annual total compensation of our median employee for 2020, who was not eligible for equity-based awards, was $57,038 ($89,184 if the reduction in pension value is not included due to the lump sum distribution in connection with the termination of the Pension Plan). As disclosed in the Summary Compensation Table, the annual total compensation of Mr. Sanders for 2020 was $4,302,803 ($5,422,009 if the reduction in pension value is not included due to the lump sum distribution in connection with the termination of the Pension Plan). Based on the foregoing, our estimate of the ratio of the annual total compensation of Mr. Sanders to the median of the annual total compensation of all other employees was 75 to 1 (61 to 1 if the reduction in pension value is not included in compensation due to the lump sum distribution in connection with the termination of the Pension Plan).
Compensation Committee Interlocks and Insider Participation
During the 2020 fiscal year, none of the Company’s executive officers served on the board of directors of any entities whose directors or officers serve as a director of the Company. No current or past executive officers of the Company asserve on the Compensation Committee.
Risk Analysis of December 31, 2018Compensation Policies and 2017, the related consolidated statements of income, comprehensive income, stockholders’ equity, and cash flows for each of the years in the three-year period ended December 31, 2018, and the related notes (collectively, the consolidated financial statements), and our report dated February 22, 2019 expressed an unqualified opinion on those consolidated financial statements.Practices
Basis for Opinion
The Company’sCompensation Committee assessed, with the assistance of management, is responsible for maintaining effective internal control over financial reporting and for its assessment of the effectiveness of internal control over financial reporting, included in the accompanying Management’s Report on Internal Control over Financial Reporting. Our responsibility is to express an opinion on the Company’s internal control over financial reporting based on our audit. We are a public accounting firm registered with the PCAOB and are required to be independent with respect to the Company in accordance with the U.S. federal securities laws and the applicable rules and regulations of the Securities and Exchange Commission and the PCAOB.
We conducted our audit in accordance with the standards of the PCAOB. Those standards require that we plan and perform the audit to obtain reasonable assurance about whether effective internal control over financial reporting was maintained in all material respects. Our audit of internal control over financial reporting included obtaining an understanding of internal control over financial reporting, assessing the risk that a material weakness exists, and testing and evaluating the design and operating effectiveness of internal control based on the assessed risk. Our audit also included performing such other procedures as we considered necessary in the circumstances. We believe that our audit provides a reasonable basis for our opinion.
Definition and Limitations of Internal Control Over Financial Reporting
A company’s internal control over financial reporting is a process designed to provide reasonable assurance regarding the reliability of financial reporting and the preparation of financial statements for external purposes in accordance with generally accepted accounting principles. A company’s internal control over financial reporting includes thosecompensation policies and procedurespractices to determine whether these policies and practices create risks that (1) pertainare reasonably likely to the maintenance of records that, in reasonable detail, accurately and fairly reflect the transactions and dispositions of the assets of the company; (2) provide reasonable assurance that transactions are recorded as necessary to permit preparation of financial statements in accordance with generally accepted accounting principles, and that receipts and expenditures of the company are being made only in accordance with authorizations of management and directors of the company; and (3) provide reasonable assurance regarding prevention or timely detection of unauthorized acquisition, use, or disposition of the company’s assets that could have a material adverse effect on the financial statements.Company.
Because
This assessment included a review of the Company’s executive and broad-based employee compensation programs, the identification of potential risks that could result from such policies and practices, the identification of factors and controls that mitigate those risks, and an analysis of the potential risks against mitigating factors and controls and the Company’s business strategies and objectives. Based on this assessment, the Compensation Committee concluded that our compensation policies and practices do not create risks that are reasonably likely to have a material adverse effect on the Company. In its inherent limitations, internal control over financial reporting may not prevent or detect misstatements. Also, projections of any evaluation of effectiveness to future periods are subject toassessment and conclusion, the risk that controls may become inadequate because of changes in conditions, or thatCompensation Committee considered the degree of compliance with the policies or procedures may deteriorate.following design features, among others:
/s/ KPMG LLP
| · | Overall compensation levels competitive with the market. |
| · | The use of financial performance measures that are quantifiable and measurable. |
| · | The use of performance goals that are appropriate in light of past performance and market conditions. |
| · | Oversight by a Compensation Committee comprised of independent, non-employee directors with the ability to use discretion in determining compensation levels, supported by guidance from the Compensation Committee’s independent compensation consultant, FW Cook. |
| · | The use of long-term equity-based incentive awards, which comprise a significant portion of total annual incentive compensation and typically vest over a four-year period, and stock ownership requirements that align the long-term interests of our executive officers with those of our stockholders. |
Kansas City, Missouri
February 22, 2019
38
47
|
|
| · | Multiple internal controls and approval processes intended to prevent manipulation of performance. |
None.
ITEM 10. Directors, Executive Officers and Corporate Governance
Information required by this Item 10 is incorporated herein by reference to our definitive proxy statement for our 2019 Annual Meeting of Stockholders to be filed pursuant to Regulation 14A under the Exchange Act.
ITEM 11. Executive Compensation
Information required by this Item 11 is incorporated herein by reference to our definitive proxy statement for our 2019 Annual Meeting of Stockholders to be filed pursuant to Regulation 14A under the Exchange Act.
ITEM 12. Security Ownership of Certain Beneficial Owners and Management and Related Stockholder Matters
Information required by Item 403 of Regulation S-K is incorporated herein by reference to our definitive proxy statement
Securities Authorized for our 2019 Annual Meeting of Stockholders to be filed pursuant to Regulation 14AIssuance under the Exchange Act.
Equity Compensation Plan InformationPlans
The following table provides information as of December 31, 20182020 with respect to shares of the Company’s common stockShares that may be issued under our existing equity compensation plans.
Plan Category | Number of | Weighted-average | Number of | |||||||||
| Equity compensation plans approved by security holders | - | $ | - | 5,255,495 (1) | ||||||||
| Equity compensation plans not approved by security holders | - | - | - | |||||||||
| Total | - | $ | - | 5,255,495 | ||||||||
|
|
|
|
|
|
|
|
|
|
|
|
|
|
|
|
Plan Category |
| (a) |
| (b) |
| (c) |
|
|
|
|
|
|
|
|
|
|
|
|
|
|
|
|
|
Equity compensation plans approved by security holders |
| — |
| — |
| 2,121,728 | (1) |
|
|
|
|
|
|
|
|
Equity compensation plans not approved by security holders |
| — |
| — |
| — |
|
|
|
|
|
|
|
|
|
Total |
| — |
| — |
| 2,121,728 |
|
|
|
|
|
|
|
|
|
| (1) | Represents Shares available for future issuance from the Stock Incentive Plan. |
Security Ownership of Management
The following table reflects information regarding beneficial ownership of Shares by each director and named executive officer set forth in the Summary Compensation Table, as well as by all directors and executive officers as a group, as of April 15, 2021. Unless otherwise indicated in the footnotes below, “beneficially owned” means the sole power to vote or direct the voting of a security and the sole power to dispose or direct the disposition of a security.
| Name of Beneficial Owner | Number of Shares | Number of Shares | Percent of Class | |||||||||
| Kathie J. Andrade | 13,150 | - | * | |||||||||
| Brent K. Bloss | 367,201 | - | * | |||||||||
| Benjamin R. Clouse | 105,280 | 2,588 | * | |||||||||
| Sharilyn S. Gasaway | 52,187 | - | * | |||||||||
| Thomas C. Godlasky | 58,026 | - | * | |||||||||
| Daniel P. Hanson | 360,414 | 19,184 | * | |||||||||
| James A. Jessee | 11,229 | - | * | |||||||||
| Katherine M.A. (“Allie”) Kline | 6,794 | - | * | |||||||||
| Dennis E. Logue | 76,956 | - | * | |||||||||
| Shawn M. Mihal | 86,578 | - | * | |||||||||
| Michael F. Morrissey | 52,187 | - | * | |||||||||
| Philip J. Sanders | 736,496 | - | 1.19 | % | ||||||||
| Jerry W. Walton | 76,831 | - | * | |||||||||
| All Directors and Executive Officers as a group (16 persons) | 2,220,429 | 21,772 | 3.62 | % | ||||||||
| * | Denotes less than 1%. |
| (1) | Includes unvested shares of restricted Class A common stock granted under the Company’s Stock Incentive Plan, as amended and restated (the “Stock Incentive Plan”), for Messrs. Bloss (144,642), Clouse (57,079), Hanson (204,005), Mihal (51,461), and Sanders (272,034). |
| (2) | For Messrs. Clouse and Hanson, indirect beneficial ownership reflects shares of Class A common stock owned by their spouse. |
39
(1) Represents shares available for future issuance from the Stock Incentive Plan.Security Ownership of Certain Beneficial Owners
The following table reflects all persons known to be the beneficial owner of more than 5% of the Company’s Shares as of April 15, 2021. Unless otherwise indicated in the footnotes below, “beneficially owned” means the sole power to vote or direct the voting of a security and the sole power to dispose or direct the disposition of a security.
| Name and Address | Number of | Percent of | ||||||
| Burgundy Asset Management Ltd. (1) | 3,344,677 | 5.39 | % | |||||
| 181 Bay Street, Suite 4510 | ||||||||
| Toronto, Ontario M5J 2T3 | ||||||||
| The Vanguard Group (2) 100 Vanguard Boulevard Malvern, PA 19355 | 6,702,961 | 10.81 | % | |||||
Blackrock, Inc. (3) 55 East 52nd Street New York, NY 10055 | 9,564,315 | 15.42 | % | |||||
| (1) | These shares are beneficially owned, or may be deemed beneficially owned, by Burgundy Asset Management Ltd. on behalf of clients for whom it acts as investment adviser. The reporting stockholder reports sole voting power with respect to 2,362,531 shares and sole investment power with respect to 3,344,677 shares. Information relating to these stockholders is based on the stockholder's Schedule 13G filed with the SEC on February 12, 2021. |
| (2) | These shares are beneficially owned, or may be deemed beneficially owned, by The Vanguard Group, certain of its subsidiaries and affiliates, and other companies. The reporting stockholder reports shared voting power with respect to 62,095 shares, sole investment power with respect to 6,587,480 shares and shared investment power with respect to 115,481 shares. Information relating to this stockholder is based on the stockholder’s Schedule 13G/A filed with the SEC on February 10, 2021. |
| (3) | These shares are beneficially owned, or may be deemed beneficially owned, by Blackrock, Inc., certain of its subsidiaries and affiliates, and other companies. The reporting stockholder reports sole voting power with respect to 9,457,272 shares and sole investment power with respect to 9,564,315 shares. Information relating to this stockholder is based on the stockholder’s Schedule 13G/A filed with the SEC on January 26, 2021. |
40
48
ITEMItem 13. Certain Relationships and Related Transactions, and Director Independence
Information required
Certain Relationships and Related Transactions
The Audit Committee is charged with the responsibility of reviewing and pre-approving all “related-person transactions” (as defined in SEC regulations), and periodically reassessing any related-person transaction entered into by this Item 13the Company to ensure its continued appropriateness. This responsibility is incorporated hereinset forth in the Company’s Corporate Code of Business Conduct and Ethics. See footnote 16 to the Original Form 10-K for a description of the Company’s investment management and services agreements with the Company’s affiliated mutual funds that are approved or renewed on an annual basis by reference to our definitive proxy statementeach fund’s board of trustees, including a majority of the disinterested members.
Director Independence
The Board is composed of a majority of directors who satisfy the criteria for our 2019 Annual Meetingindependence under the NYSE corporate governance listing standards. In determining independence, each year the Board affirmatively determines, among other items, whether the directors have any direct or indirect material relationship with the Company or any of Stockholders to be filedits subsidiaries pursuant to Regulation 14Athe NYSE corporate governance listing standards. When assessing the “materiality” of a director’s relationship with the Company, if any, the Board considers all relevant facts and circumstances, not merely from the director’s standpoint, but from that of the persons or organizations with which the director has an affiliation. Material relationships can include commercial, banking, industrial, consulting, legal, accounting, charitable and familial relationships. The Board also considers any other relationship that could interfere with the exercise of independence or judgment in carrying out the duties of a director.
Applying these independence standards, the Board determined that Kathie J. Andrade, Sharilyn S. Gasaway, Thomas C. Godlasky, James A. Jessee, Katherine M.A. (“Allie”) Kline, Dennis E. Logue, Michael F. Morrissey, and Jerry W. Walton are all independent directors. Additionally, during their time on the Board, Constance K. Weaver and Alan W. Kosloff were also independent directors.
After due consideration, the Board has determined that no non-employee director has a material relationship with the Company or any of its subsidiaries (either directly or indirectly as a partner, stockholder or officer of an organization that has a relationship with the Company or any of its subsidiaries) and they all meet the criteria for independence under the Exchange Act.NYSE corporate governance listing standards.
ITEM
Item 14. Principal Accounting Fees and Services
Information required by this Item 14 is incorporated herein by reference to our definitive proxy statement for our 2019 Annual Meeting of Stockholders
The Audit Committee or its Chair pre-approves audit and non-audit services to be filed pursuantrendered to Regulation 14A under the Exchange Act.Company and establishes a dollar limit on the amount of fees the Company will pay for each category of services. Generally, management will submit to the Audit Committee a detailed list of services that it recommends the Audit Committee engage the independent registered public accounting firm to provide for the fiscal year. During the year, the Audit Committee periodically reviews the types of services and dollar amounts approved and adjusts such amounts, as it deems appropriate. Unless a service to be provided by the independent registered public accounting firm has received general pre-approval, it will require specific pre-approval by the Audit Committee or its Chair. Any audit or non-audit services pre-approved by the Chair are presented to the full Audit Committee at its next scheduled meeting. The Audit Committee also periodically reviews all non-audit services to ensure such services do not impair the independence of the Company's independent registered public accounting firm. The Audit Committee approved all services provided by KPMG for the 2019 and 2020 fiscal years. These services included the audit of the Company's annual financial statements, audit of the Company's internal control over financial reporting, review of the Company's quarterly financial statements, tax consultation services, preparation of corporate tax returns, auditing of employee benefits plans and certain agreed upon procedures.
The following table shows the fees billed by KPMG for audit and other services provided to the Company for the 2020 and 2019 fiscal years, respectively:
2020 | 2019 | |||||||
| Audit Fees (1) | $ | 916,800 | $ | 850,000 | ||||
| Audit-Related Fees (2) | 134,719 | 144,408 | ||||||
| Tax Fees (3) | 26,693 | 49,677 | ||||||
| All Other Fees | — | — | ||||||
| Total | $ | 1,078,212 | $ | 1,044,085 | ||||
| (1) | Audit fees consist of fees for the audit of the Company’s annual financial statements, the audit of its internal control over financial reporting, reviews of the financial statements included in quarterly reports on Form 10-Q and professional services rendered in connection with the audit of the Company’s annual financial statements. |
| (2) | Audit-related fees primarily relate to financial statement audits of employee benefit plans, certain agreed upon procedures and the issuance of SSAE 16 reports. |
| (3) | Tax fees consist of fees for income tax consultation, including tax compliance, preparation and review of corporate tax returns, and other general tax consultation. |
41
ITEM 15. Exhibits, Financial Statement Schedules
| | (a)(1) | Financial Statements. | |||||||
| |
|
| |||||||
Reference is made to the Index to Consolidated Financial Statements on page | |||||||||
| | (a)(2) | Financial Statement Schedules. | |||||||
| | | None. | |||||||
| | (b) | Exhibits. | |||||||
| Exhibit No. | Exhibit Description | |
| 2.1 to the Company’s Current Report on Form 8-K, File No. 001-13913, filed on December 4, 2020 and incorporated herein by reference. † | |
|
42
| Exhibit No. | Exhibit Description | |
|
49
43
50
| |||||||||
| |||||||||
| |||||||||
Rule | |||||||||
Rule | |||||||||
| Rule 13a-14(a)/15d-14(a) Certification of the Chief Executive Officer # | ||||||||
| 31.4 | Rule 13a-14(a)/15d-14(a) Certification of the Chief Financial Officer # | ||||||||
| 32.1 | Section 1350 Certification of the Chief Executive Officer + | ||||||||
101 | Materials from the Waddell & Reed Financial, Inc. Annual Report on Form | ||||||||
| Cover Page Interactive Data File (formatted as Inline XBRL and contained in Exhibit 101) # | |||||||||
# Filed with this Form 10-K/A.
ITEM 16.
* Indicates management contract or compensatory plan, contract or arrangement.
† Schedules omitted pursuant to item 601(b)(2) of Regulation S-K. The Company agrees to furnish supplementally a copy of any omitted schedule upon request by the SEC; provided, however, that the Company may request confidential treatment pursuant to Rule 24b-2 of the Exchange Act, as amended, for any schedule or exhibit so furnished.
+ Previously filed or furnished with the Original Form 10-K Summary
Not applicable.10-K.
44
51
SIGNATURES
Pursuant to the requirements of Section 13 or 15(d) of the Securities Exchange Act of 1934, as amended, the Company has duly caused this Report to be signed on its behalf by the undersigned, thereunto duly authorized, in the City of Overland Park, State of Kansas, on February 22, 2019.April 29, 2021.
WADDELL & REED FINANCIAL, INC. | |||
By: | /s/ PHILIP J. SANDERS | ||
Philip J. Sanders | |||
Chief Executive Officer | |||
Pursuant to the requirements of the Securities Exchange Act of 1934, as amended, this Report has been signed below by the following persons on behalf of the Company and in the capacities and on the dates indicated.
|
|
| ||
|
|
| ||
| ||||
|
|
| ||
| ||||
|
|
| ||
| ||||
|
|
| ||
| ||||
|
|
| ||
| ||||
|
|
| ||
| ||||
|
|
| ||
| ||||
|
|
| ||
| ||||
|
|
| ||
| ||||
|
|
| ||
|
*By: Attorney‑in‑fact
45
52
53
Report of Independent Registered Public Accounting Firm
To the Stockholders and Board of Directors
Waddell & Reed Financial, Inc.:
Opinion on the Consolidated Financial Statements
We have audited the accompanying consolidated balance sheets of Waddell & Reed Financial, Inc. and subsidiaries (the Company) as of December 31, 2018 and 2017, the related consolidated statements of income, comprehensive income, stockholders’ equity, and cash flows for each of the years in the three year period ended December 31, 2018, and the related notes (collectively, the consolidated financial statements). In our opinion, the consolidated financial statements present fairly, in all material respects, the financial position of the Company as of December 31, 2018 and 2017, and the results of its operations and its cash flows for each of the years in the three year period ended December 31, 2018, in conformity with U.S. generally accepted accounting principles.
We also have audited, in accordance with the standards of the Public Company Accounting Oversight Board (United States) (PCAOB), the Company’s internal control over financial reporting as of December 31, 2018, based on criteria established in Internal Control – Integrated Framework (2013) issued by the Committee of Sponsoring Organizations of the Treadway Commission, and our report dated February 22, 2019 expressed an unqualified opinion on the effectiveness of the Company’s internal control over financial reporting.
Basis for Opinion
These consolidated financial statements are the responsibility of the Company’s management. Our responsibility is to express an opinion on these consolidated financial statements based on our audits. We are a public accounting firm registered with the PCAOB and are required to be independent with respect to the Company in accordance with the U.S. federal securities laws and the applicable rules and regulations of the Securities and Exchange Commission and the PCAOB.
We conducted our audits in accordance with the standards of the PCAOB. Those standards require that we plan and perform the audit to obtain reasonable assurance about whether the consolidated financial statements are free of material misstatement, whether due to error or fraud. Our audits included performing procedures to assess the risks of material misstatement of the consolidated financial statements, whether due to error or fraud, and performing procedures that respond to those risks. Such procedures included examining, on a test basis, evidence regarding the amounts and disclosures in the consolidated financial statements. Our audits also included evaluating the accounting principles used and significant estimates made by management, as well as evaluating the overall presentation of the consolidated financial statements. We believe that our audits provide a reasonable basis for our opinion.
/s/ KPMG LLP
We have served as the Company’s auditor since 1981.
Kansas City, Missouri
February 22, 2019
54
WADDELL & REED FINANCIAL, INC.
December 31, 2018 and 2017
|
|
|
|
|
|
|
|
|
|
|
|
|
|
|
| 2018 |
| 2017 |
| |
|
| (in thousands) |
| |||
Assets: |
|
|
|
|
|
|
Cash and cash equivalents |
| $ | 231,997 |
| 207,829 |
|
Cash and cash equivalents - restricted |
|
| 59,558 |
| 28,156 |
|
Investment securities |
|
| 617,135 |
| 700,492 |
|
Receivables: |
|
|
|
|
|
|
Funds and separate accounts |
|
| 18,112 |
| 25,664 |
|
Customers and other |
|
| 151,515 |
| 131,108 |
|
Prepaid expenses and other current assets |
|
| 27,164 |
| 25,593 |
|
Total current assets |
|
| 1,105,481 |
| 1,118,842 |
|
|
|
|
|
|
|
|
Property and equipment, net |
|
| 63,429 |
| 87,667 |
|
Goodwill and identifiable intangible assets |
|
| 145,869 |
| 147,069 |
|
Deferred income taxes |
|
| 12,321 |
| 13,308 |
|
Other non-current assets |
|
| 16,979 |
| 17,476 |
|
Total assets |
| $ | 1,344,079 |
| 1,384,362 |
|
|
|
|
|
|
|
|
Liabilities: |
|
|
|
|
|
|
Accounts payable |
| $ | 26,253 |
| 38,998 |
|
Payable to investment companies for securities |
|
| 100,085 |
| 43,422 |
|
Payable to third party brokers |
|
| 19,891 |
| 25,153 |
|
Payable to customers |
|
| 86,184 |
| 66,830 |
|
Short-term notes payable |
|
| — |
| 94,996 |
|
Accrued compensation |
|
| 54,129 |
| 47,643 |
|
Other current liabilities |
|
| 51,580 |
| 44,797 |
|
Total current liabilities |
|
| 338,122 |
| 361,839 |
|
|
|
|
|
|
|
|
Long-term debt |
|
| 94,854 |
| 94,783 |
|
Accrued pension and postretirement costs |
|
| 798 |
| 15,137 |
|
Other non-current liabilities |
|
| 15,392 |
| 25,210 |
|
Total liabilities |
|
| 449,166 |
| 496,969 |
|
|
|
|
|
|
|
|
Redeemable noncontrolling interests |
|
| 11,463 |
| 14,509 |
|
|
|
|
|
|
|
|
Stockholders’ equity: |
|
|
|
|
|
|
Preferred stock—$1.00 par value: 5,000 shares authorized; none issued |
|
| — |
| — |
|
Class A Common stock—$0.01 par value: 250,000 shares authorized; 99,701 shares issued; 76,790 shares outstanding (82,687 at December 31, 2017) |
|
| 997 |
| 997 |
|
Additional paid-in capital |
|
| 311,264 |
| 301,410 |
|
Retained earnings |
|
| 1,198,445 |
| 1,092,394 |
|
Cost of 22,911 common shares in treasury (17,014 at December 31, 2017) |
|
| (627,587) |
| (522,441) |
|
Accumulated other comprehensive income |
|
| 331 |
| 524 |
|
Total stockholders’ equity |
|
| 883,450 |
| 872,884 |
|
|
|
|
|
|
|
|
Total liabilities, redeemable noncontrolling interests and stockholders’ equity |
| $ | 1,344,079 |
| 1,384,362 |
|
See accompanying notes to consolidated financial statements.
55
WADDELL & REED FINANCIAL, INC.
CONSOLIDATED STATEMENTS OF INCOME
Years ended December 31, 2018, 2017 and 2016
|
|
|
|
|
|
|
|
|
|
|
|
|
|
|
|
|
|
|
|
|
|
|
| 2018 |
| 2017 |
| 2016 |
| |||
|
| (in thousands, except per share data) |
| |||||||
Revenues: |
|
|
|
|
|
|
|
|
|
|
Investment management fees |
| $ | 507,906 |
|
| 531,850 |
|
| 557,112 |
|
Underwriting and distribution fees |
|
| 550,010 |
|
| 518,699 |
|
| 561,670 |
|
Shareholder service fees |
|
| 102,385 |
|
| 106,595 |
|
| 120,241 |
|
Total |
|
| 1,160,301 |
|
| 1,157,144 |
|
| 1,239,023 |
|
|
|
|
|
|
|
|
|
|
|
|
Operating expenses: |
|
|
|
|
|
|
|
|
|
|
Distribution |
|
| 456,832 |
|
| 432,264 |
|
| 485,981 |
|
Compensation and benefits (including share-based compensation of $51,565, $57,716 and $51,514, respectively) |
|
| 263,329 |
|
| 271,276 |
|
| 267,839 |
|
General and administrative |
|
| 73,643 |
|
| 88,951 |
|
| 80,820 |
|
Technology |
|
| 65,275 |
|
| 66,078 |
|
| 63,045 |
|
Occupancy |
|
| 27,197 |
|
| 30,721 |
|
| 31,406 |
|
Marketing and advertising |
|
| 10,323 |
|
| 12,425 |
|
| 13,080 |
|
Depreciation |
|
| 25,649 |
|
| 20,983 |
|
| 18,358 |
|
Subadvisory fees |
|
| 14,805 |
|
| 13,174 |
|
| 9,572 |
|
Intangible asset impairment |
|
| 1,200 |
|
| 1,500 |
|
| 9,749 |
|
Total |
|
| 938,253 |
|
| 937,372 |
|
| 979,850 |
|
|
|
|
|
|
|
|
|
|
|
|
Operating income |
|
| 222,048 |
|
| 219,772 |
|
| 259,173 |
|
Investment and other income (loss) |
|
| 22,705 |
|
| 37,084 |
|
| (8,058) |
|
Interest expense |
|
| (6,461) |
|
| (11,279) |
|
| (11,122) |
|
|
|
|
|
|
|
|
|
|
|
|
Income before provision for income taxes |
|
| 238,292 |
|
| 245,577 |
|
| 239,993 |
|
Provision for income taxes |
|
| 55,480 |
|
| 101,368 |
|
| 81,884 |
|
Net income |
|
| 182,812 |
|
| 144,209 |
|
| 158,109 |
|
Net (loss) income attributable to redeemable noncontrolling interests |
|
| (776) |
|
| 2,930 |
|
| 1,414 |
|
Net income attributable to Waddell & Reed Financial, Inc. |
| $ | 183,588 |
|
| 141,279 |
|
| 156,695 |
|
|
|
|
|
|
|
|
|
|
|
|
Net income per share attributable to Waddell and Reed Financial, Inc. common shareholders, basic and diluted: |
| $ | 2.28 |
|
| 1.69 |
|
| 1.90 |
|
|
|
|
|
|
|
|
|
|
|
|
Weighted average shares outstanding, basic and diluted: |
|
| 80,468 |
|
| 83,573 |
|
| 82,668 |
|
See accompanying notes to consolidated financial statements.
56
WADDELL & REED FINANCIAL, INC.
CONSOLIDATED STATEMENTS OF COMPREHENSIVE INCOME
Years ended December 31, 2018, 2017 and 2016
|
|
|
|
|
|
|
|
|
|
|
|
|
|
|
|
|
|
|
| 2018 |
| 2017 |
| 2016 |
| |
|
| (in thousands) |
| |||||
Net income |
| $ | 182,812 |
| 144,209 |
| 158,109 |
|
|
|
|
|
|
|
|
|
|
Other comprehensive income: |
|
|
|
|
|
|
|
|
|
|
|
|
|
|
|
|
|
Unrealized gain (loss) on available for sale investment securities during the period, net of income tax expense (benefit) of $2, $(956) and $(2), respectively |
|
| 13 |
| 7,505 |
| (391) |
|
|
|
|
|
|
|
|
|
|
Postretirement benefit, net of income tax expense (benefit) of $202, $(99) and $(718), respectively |
|
| 642 |
| (224) |
| (1,220) |
|
|
|
|
|
|
|
|
|
|
Comprehensive income |
|
| 183,467 |
| 151,490 |
| 156,498 |
|
Comprehensive (loss) income attributable to redeemable noncontrolling interests |
|
| (776) |
| 2,930 |
| 1,414 |
|
Comprehensive income attributable to Waddell & Reed Financial, Inc. |
| $ | 184,243 |
| 148,560 |
| 155,084 |
|
See accompanying notes to consolidated financial statements.
57
WADDELL & REED FINANCIAL, INC.
CONSOLIDATED STATEMENTS OF STOCKHOLDERS’ EQUITY
Years ended December 31, 2018, 2017 and 2016
(in thousands)
|
|
|
|
|
|
|
|
|
|
|
|
|
|
|
|
|
|
|
|
|
|
|
|
|
|
|
|
|
|
|
| Accumulated |
|
|
| Redeemable |
|
|
|
|
|
|
|
| Additional |
|
|
|
|
| Other |
| Total |
| Non |
|
|
| Common Stock |
| Paid-In |
| Retained |
| Treasury |
| Comprehensive |
| Stockholders’ |
| Controlling |
| |||
|
| Shares |
| Amount |
| Capital |
| Earnings |
| Stock |
| Income (Loss) |
| Equity |
| interest |
| |
Balance at December 31, 2015 |
| 99,701 |
| $ | 997 |
| 331,611 |
| 1,085,248 |
| (566,256) |
| (5,145) |
| 846,455 |
| — |
|
Adoption of consolidation guidance on January 1, 2016 - redeemable noncontrolling interests in sponsored funds |
| — |
|
| — |
| — |
| — |
| — |
| — |
| — |
| 14,330 |
|
Net income |
| — |
|
| — |
| — |
| 156,695 |
| — |
| — |
| 156,695 |
| 1,414 |
|
Net redemption of redeemable noncontrolling interests in sponsored funds |
| — |
|
| — |
| — |
| — |
| — |
| — |
| — |
| (5,091) |
|
Recognition of equity compensation |
| — |
|
| — |
| 51,382 |
| 132 |
| — |
| — |
| 51,514 |
| — |
|
Net issuance/forfeiture of nonvested shares |
| — |
|
| — |
| (84,741) |
| — |
| 84,741 |
| — |
| — |
| — |
|
Dividends accrued, $1.84 per share |
| — |
|
| — |
| — |
| (152,953) |
| — |
| — |
| (152,953) |
| — |
|
Tax impact of share-based payment arrangements |
| — |
|
| — |
| (6,344) |
| — |
| — |
| — |
| (6,344) |
| — |
|
Repurchase of common stock |
| — |
|
| — |
| — |
| — |
| (49,753) |
| — |
| (49,753) |
| — |
|
Other comprehensive loss |
| — |
|
| — |
| — |
| — |
| — |
| (1,612) |
| (1,612) |
| — |
|
Balance at December 31, 2016 |
| 99,701 |
|
| 997 |
| 291,908 |
| 1,089,122 |
| (531,268) |
| (6,757) |
| 844,002 |
| 10,653 |
|
Adoption of share-based compensation guidance on January 1, 2017 |
| — |
|
| — |
| 3,504 |
| (2,200) |
| — |
| — |
| 1,304 |
| — |
|
Net income |
| — |
|
| — |
| — |
| 141,279 |
| — |
| — |
| 141,279 |
| 2,930 |
|
Net subscription of redeemable noncontrolling interests in sponsored funds |
| — |
|
| — |
| — |
| — |
| — |
| — |
| — |
| 926 |
|
Recognition of equity compensation |
| — |
|
| — |
| 50,593 |
| 690 |
| — |
| — |
| 51,283 |
| — |
|
Net issuance/forfeiture of nonvested shares |
| — |
|
| — |
| (44,595) |
| — |
| 44,595 |
| — |
| — |
| — |
|
Dividends accrued, $1.63 per share |
| — |
|
| — |
| — |
| (136,497) |
|
|
|
|
| (136,497) |
| — |
|
Repurchase of common stock |
| — |
|
| — |
| — |
| — |
| (35,768) |
| — |
| (35,768) |
| — |
|
Other comprehensive income |
| — |
|
| — |
| — |
| — |
| — |
| 7,281 |
| 7,281 |
| — |
|
Balance at December 31, 2017 |
| 99,701 |
| $ | 997 |
| 301,410 |
| 1,092,394 |
| (522,441) |
| 524 |
| 872,884 |
| 14,509 |
|
Adoption of recognition and measurement of financial assets and liabilities guidance (ASU 2016-01) on January 1, 2018 |
| — |
|
| — |
| — |
| 812 |
| — |
| (812) |
| — |
| — |
|
Adoption of reclassification of tax effects from accumulated other comprehensive income (loss) guidance (ASU 2018-02) on January 1, 2018 |
| — |
|
| — |
| — |
| 36 |
| — |
| (36) |
| — |
| — |
|
Net income (loss) |
| — |
|
| — |
| — |
| 183,588 |
| — |
| — |
| 183,588 |
| (776) |
|
Net redemption of redeemable noncontrolling interests in sponsored funds |
| — |
|
| — |
| — |
| — |
| — |
| — |
| — |
| (2,270) |
|
Recognition of equity compensation |
| — |
|
| — |
| 40,598 |
| 1,383 |
| — |
| — |
| 41,981 |
| — |
|
Net issuance/forfeiture of nonvested shares |
| — |
|
| — |
| (30,744) |
|
|
| 30,744 |
| — |
| — |
| — |
|
Dividends accrued, $1.00 per share |
| — |
|
| — |
| — |
| (79,768) |
| — |
| — |
| (79,768) |
| — |
|
Repurchase of common stock |
| — |
|
| — |
| — |
| — |
| (135,890) |
| — |
| (135,890) |
| — |
|
Other comprehensive income |
| — |
|
| — |
| — |
| — |
| — |
| 655 |
| 655 |
| — |
|
Balance at December 31, 2018 |
| 99,701 |
| $ | 997 |
| 311,264 |
| 1,198,445 |
| (627,587) |
| 331 |
| 883,450 |
| 11,463 |
|
See accompanying notes to consolidated financial statements.
58
WADDELL & REED FINANCIAL, INC.
CONSOLIDATED STATEMENTS OF CASH FLOWS
Years ended December 31, 2018, 2017 and 2016
|
|
|
|
|
|
|
|
|
|
|
|
|
|
|
|
|
|
|
| 2018 |
| 2017 |
| 2016 |
| |
|
| (in thousands) |
| |||||
Cash flows from operating activities: |
|
|
|
|
|
|
|
|
Net income |
| $ | 182,812 |
| 144,209 |
| 158,109 |
|
Adjustments to reconcile net income to net cash provided by operating activities: |
|
|
|
|
|
|
|
|
Depreciation and amortization |
|
| 28,278 |
| 20,983 |
| 18,359 |
|
Write-down of impaired assets |
|
| 1,538 |
| 1,500 |
| 9,749 |
|
Amortization of deferred sales commissions |
|
| 3,348 |
| 4,855 |
| 23,601 |
|
Share-based compensation |
|
| 51,565 |
| 57,716 |
| 51,514 |
|
Investments loss (gain), net |
|
| 26,449 |
| (17,104) |
| (12,075) |
|
Net purchases of trading and equity securities |
|
| (30,237) |
| (43,714) |
| (24,352) |
|
Deferred income taxes |
|
| 783 |
| 20,481 |
| 1,982 |
|
Pension and postretirement plan benefits |
|
| (15,380) |
| (17,714) |
| 3,166 |
|
Net change in equity securities and trading debt securities held by consolidated sponsored funds |
|
| 81,119 |
| (101,457) |
| (79,065) |
|
Other |
|
| 1,158 |
| 3,276 |
| (2,523) |
|
Changes in assets and liabilities: |
|
|
|
|
|
|
|
|
Customer and other receivables |
|
| (20,407) |
| (3,013) |
| 92,565 |
|
Payable to investment companies for securities and payable to customers |
|
| 76,017 |
| (26,357) |
| (97,459) |
|
Receivables from funds and separate accounts |
|
| 7,552 |
| 1,517 |
| 7,218 |
|
Other assets |
|
| 2,194 |
| 10,134 |
| 2,255 |
|
Accounts payable and payable to third party brokers |
|
| (18,007) |
| 4,395 |
| (22,948) |
|
Other liabilities |
|
| (21,767) |
| (8,856) |
| (42,192) |
|
Net cash provided by operating activities |
|
| 357,015 |
| 50,851 |
| 87,904 |
|
|
|
|
|
|
|
|
|
|
Cash flows from investing activities: |
|
|
|
|
|
|
|
|
Purchases of available for sale and equity method securities |
|
| (113,975) |
| (365,770) |
| (72,096) |
|
Proceeds from sales of available for sale and equity method securities |
|
| 1,157 |
| 160,158 |
| 156,965 |
|
Proceeds from maturities of available for sale securities |
|
| 125,727 |
| — |
| — |
|
Additions to property and equipment |
|
| (2,566) |
| (6,783) |
| (15,691) |
|
Net cash of sponsored funds on consolidation |
|
| — |
| — |
| 6,887 |
|
Other |
|
| — |
| — |
| (194) |
|
Net cash provided by (used in) investing activities |
|
| 10,343 |
| (212,395) |
| 75,871 |
|
|
|
|
|
|
|
|
|
|
Cash flows from financing activities: |
|
|
|
|
|
|
|
|
Dividends paid |
|
| (81,215) |
| (154,042) |
| (152,830) |
|
Repurchase of common stock |
|
| (133,378) |
| (35,768) |
| (49,753) |
|
Repayment of short-term debt, net of debt issuance costs |
|
| (94,925) |
| — |
| — |
|
Net subscriptions, (redemptions, distributions and deconsolidations) of redeemable noncontrolling interests in sponsored funds |
|
| (2,270) |
| 926 |
| (3,473) |
|
Other |
|
| — |
| 174 |
| 3,145 |
|
Net cash used in financing activities |
|
| (311,788) |
| (188,710) |
| (202,911) |
|
|
|
|
|
|
|
|
|
|
Net increase (decrease) in cash and cash equivalents |
|
| 55,570 |
| (350,254) |
| (39,136) |
|
Cash, cash equivalents, and restricted cash at beginning of period |
|
| 235,985 |
| 586,239 |
| 625,375 |
|
Cash, cash equivalents, and restricted cash at end of period |
| $ | 291,555 |
| 235,985 |
| 586,239 |
|
Cash paid for: |
|
|
|
|
|
|
|
|
Income taxes, net |
| $ | 59,147 |
| 85,299 |
| 76,982 |
|
Interest |
| $ | 7,948 |
| 10,299 |
| 10,289 |
|
See accompanying notes to consolidated financial statements.
59
WADDELL & REED FINANCIAL, INC.
NOTES TO CONSOLIDATED FINANCIAL STATEMENTS
December 31, 2018, 2017 and 2016
1. Summary of Significant Accounting Policies
Basis of Presentation
The accompanying consolidated financial statements are prepared in accordance with accounting principles generally accepted in the United States of America (“GAAP”) and include the accounts of the Company and its subsidiaries. All significant intercompany accounts and transactions have been eliminated in consolidation. Amounts in the accompanying financial statements and notes are rounded to the nearest thousand unless otherwise stated. Certain amounts in the prior years’ financial statements have been reclassified for consistent presentation.
The Company operates in one business segment as the Company’s management utilizes a consolidated approach to assess performance and allocate resources.
Effective January 1, 2018, the Company changed the presentation of certain line items in the consolidated statements of income that are intended to improve the transparency of the Company’s financial statements through clearer alignment of operating expenses with financial statement captions. Specifically, the Company revised its accounting policy related to the reporting of indirect underwriting and distribution expenses in the former underwriting and distribution caption and certain expenses historically reported as general and administrative. Expenses previously recorded as underwriting and distribution expenses were retrospectively reclassified into (a) the following existing operating expense captions: Compensation and benefits and General and administrative, and (b) the following newly created operating expense captions: Distribution, Technology, Occupancy, and Marketing and advertising. Certain expenses historically reported as general and administrative were retrospectively reclassified into the following newly created operating expense captions: Technology, Occupancy, and Marketing and advertising. The Company considers the change in policy to be preferable and does not consider the change to be material to its consolidated financial statements. These changes were applied retrospectively to all periods presented and do not affect net income attributable to the Company. The Company also adopted Accounting Standards Update (“ASU”) 2017-07, “Compensation — Retirement Benefits (Topic 715): Improving the Presentation of Net Periodic Pension Cost and Net Periodic Postretirement Benefit Cost”. As a result, the Company retrospectively reclassified all net periodic pension costs, other than the historical service cost, from Compensation and benefits to Investment and other income (loss) within the consolidated statements of income. The reclassification of expenses as a result of the adoption of ASU 2017-07 does not affect net income attributable to the Company.
Consolidation
In the normal course of our business, we sponsor and manage various types of investment products. These investment products include open-end mutual funds, a closed-end mutual fund, privately offered funds, exchange-traded managed funds, and a Luxembourg SICAV. When creating and launching a new investment product, we typically fund the initial cash investment, commonly referred to as “seeding,” to allow the investment product the ability to generate an investment performance track record so that it is able to attract third party investors. Our initial investment in a new product typically represents 100% of the ownership in that product. We generally redeem our investment in seeded products when the related product establishes a sufficient track record, when third party investments in the related product are sufficient to sustain the strategy, or when a decision is made to no longer pursue the strategy. The length of time we hold a majority interest in a product varies based on a number of factors, including market demand, market conditions and investment performance. Our exposure to risk in these investment products is generally limited to any equity investment we have in the product and any earned but uncollected management or other fund-related service fees.
In accordance with financial accounting standards, we consolidate certain sponsored investment products in which we have a controlling interest or the investment product meets the criteria of a variable interest entity (“VIE”) and we are deemed to be the primary beneficiary. In order to make this determination, an analysis is performed to determine if the investment product is a VIE or a voting interest entity (“VOE”). Assessing if an entity is a VIE or VOE involves judgment and analysis on an entity by entity basis. Factors included in this assessment include the legal organization of
60
the entity, the Company’s contractual involvement with the entity and any implications resulting from or associated with related parties’ involvement with the entity.
A VIE is an entity which does not have adequate equity to finance its activities without subordinated financial support, the equity investors do not have the normal characteristics of equity investors for a potential controlling financial interest as a group, or the voting rights are not proportional to their obligations to absorb the expected losses or their rights to receive the expected residual returns of the entity. The Company is deemed to be the primary beneficiary if it absorbs a majority of the VIE’s expected losses, expected residual returns, or both. If the Company is the primary beneficiary of a VIE, we are required to consolidate the assets, liabilities, results of operations and cash flows of the VIE into our consolidated financial statements.
If an entity does not meet the criteria and is not considered a VIE, it is treated as a VOE, which is subject to traditional consolidation concepts based on ownership rights. Sponsored investment products that are considered VOEs are consolidated if we have a controlling financial interest in the entity absent substantive investor rights to replace the investment manager of the entity (kick-out rights).
Use of Estimates
GAAP requires us to make estimates and assumptions that affect the reported amounts of assets, liabilities, revenues and expenses in the consolidated financial statements and accompanying notes, and related disclosures of commitments and contingencies. Estimates are used for, but are not limited to, depreciation and amortization, income taxes, valuation of assets, pension and postretirement obligations, and contingencies. Management evaluates its estimates and assumptions on an ongoing basis using historical experience and other factors, including the current economic environment. Actual results could differ from our estimates.
Cash and Cash Equivalents
Cash and cash equivalents include cash on hand and short‑term investments. We consider all highly liquid investments with maturities upon acquisition of 90 days or less to be cash equivalents. Cash and cash equivalents – restricted represents cash held for the benefit of customers and non-customers segregated in compliance with federal and other regulations.
Disclosures About Fair Value of Financial Instruments
Fair value of cash and cash equivalents, receivables and payables approximates carrying value. Fair values for investment securities are based on quoted market prices, where available. Otherwise, fair values for investment securities are based on Level 2 or Level 3 inputs detailed in Note 4. Fair value of long‑term debt is disclosed in Note 8.
Investment Securities and Investments in Sponsored Funds
Our investments are comprised of debt and equity securities, investments in sponsored funds and sponsored privately offered funds. Sponsored funds, which include the Funds and the IGI Funds, are investments we have made to provide seed capital for new investment products. The Company has classified its investments in certain sponsored funds as either equity method investments (when the Company owns between 20% and 50% of the fund) or as equity securities measured at fair value through net income (when the Company owns less than 20% of the fund).
Unrealized gains and losses on debt securities classified as available for sale, net of related tax effects, are excluded from earnings until realized and are reported as a separate component of comprehensive income. For debt securities classified as trading and equity securities, unrealized gains and losses are included in earnings. Realized gains and losses are computed using the specific identification method for all investment securities, other than sponsored funds. For sponsored funds, realized gains and losses are computed using the average cost method. Substantially all of the Company’s equity method investees are investment companies that record their underlying investments at fair value. Therefore, under the equity method of accounting, our share of the investee's underlying net income or loss is predominantly representative of fair value adjustments in the investments held by the equity method investee. Our share of the investee's net income or loss is based on the most current information available and is recorded as a net gain or loss on investments within investment and other income (loss).
61
Our available for sale debt securities are reviewed each quarter and adjusted for other than temporary declines in value. We consider factors affecting the issuer and the industry in which the issuer operates, general market trends including interest rates, and our ability and intent to hold an investment until it has recovered. Consideration is given to the length of time an investment’s market value has been below its amortized cost basis as well as prospects for recovery to the amortized cost basis. When a decline in the fair value of debt securities is determined to be other than temporary, the amount of the impairment recognized in earnings depends on whether the Company intends to sell the security or more likely than not will be required to sell the security before recovery of its amortized cost basis less any current‑period credit loss. If so, the other than temporary impairment recognized in earnings is equal to the entire difference between the investment’s amortized cost basis and its fair value at the balance sheet date. If not, the portion of the impairment related to the credit loss is recognized in earnings while the portion of the impairment related to other factors is recognized in other comprehensive income, net of tax.
Property and Equipment
Property and equipment are carried at cost. The costs of improvements that extend the life of a fixed asset are capitalized, while the costs of repairs and maintenance are expensed as incurred. Depreciation and amortization are calculated and recorded using the straight‑line method over the estimated useful life of the related asset (or lease term if shorter), generally three to 10 years for furniture and fixtures; one to 10 years for computer software; one to five years for data processing equipment; one to 30 years for buildings; two to 26 years for other equipment; and up to 15 years for leasehold improvements, determined by the lesser of the lease term or expected life.
Software Developed for Internal Use
Certain internal costs incurred in connection with developing or obtaining software for internal use are capitalized in accordance with ASC 350, “Intangibles – Goodwill and Other Topic.” Internal costs capitalized are included in property and equipment, net in the consolidated balance sheets, and were $6.4 million and $10.5 million as of December 31, 2018 and 2017, respectively. Amortization begins when the software project is complete and ready for its intended use and continues over the estimated useful life, generally one to 10 years.
Goodwill and Identifiable Intangible Assets
Goodwill represents the excess of cost over fair value of the identifiable net assets of acquired companies. Indefinite-lived intangible assets represent advisory and subadvisory management contracts for managed assets obtained in acquisitions. The Company considers these contracts to be indefinite-lived intangible assets as they are expected to be renewed without significant cost or modification of terms. Goodwill and indefinite-lived intangible assets are tested for impairment annually or more frequently if events or circumstances indicate that the carrying value may not be recoverable. Goodwill and intangible assets require significant management estimates and judgment, including the valuation determination in connection with the initial purchase price allocation and the ongoing evaluation for impairment. Additional information related to the indefinite-lived intangible assets is included in Note 7.
Revenue Recognition
As of January 1, 2018, the Company adopted ASU 2014-09, “Revenue from Contracts with Customers” and all subsequent ASUs that modified Accounting Standards Codification (“ASC”) 606, “Revenue from Contracts with Customers.” The Company elected to apply the standard utilizing the cumulative effect approach. The implementation of the new standard did not have a material impact on the measurement or recognition of revenue.
Investment Management and Advisory Fees
We recognize investment management and advisory fees as earned over the period in which investment management and advisory services are provided. While our investment management and advisory contracts are long-term in nature, the performance obligations are generally satisfied daily or monthly based on AUM. We calculate investment management fees from the Funds daily based upon average daily net AUM in accordance with investment management agreements between the Funds and the Company. The majority of investment and/or advisory fees earned from institutional accounts are calculated either monthly or quarterly based upon an average of net AUM in accordance with such investment management agreements. The Company may waive certain fees for investment management services at its discretion, or
62
in accordance with contractual expense limitations, and these waivers are reflected as a reduction to investment management fees on the consolidated statements of income.
Our investment advisory business receives research products and services from broker-dealers through “soft dollar” arrangements. Consistent with the “soft dollar” safe harbor established by Section 28(e) of the Securities Exchange Act of 1934, as amended, the investment advisory business does not have any contractual obligation requiring it to pay for research products and services obtained through soft dollar arrangements with brokers. As a result, we present “soft dollar” arrangements on a net basis.
The Company has contractual arrangements with third parties to provide subadvisory services. Investment advisory fees are recorded gross of any subadvisory payments and are included in investment management fees based on management’s determination that the Company is acting in the capacity of principal service provider with respect to its relationship with the Funds. Any corresponding fees paid to subadvisors are included in operating expenses.
Underwriting, Distribution and Shareholder Service Fees
Fee‑based asset allocation products offer clients a selection of traditional asset allocation models, as well as features such as systematic rebalancing and client and Advisor participation in determining asset allocation across asset classes. Underwriting and distribution fee-based asset allocation revenues are calculated monthly based upon beginning of month client assets and are earned over the period in which services are provided. Performance obligations are generally satisfied daily or monthly based on client assets.
Under a Rule 12b-1 service plan, the Funds may charge a maximum fee of 0.25% of the average daily net AUM for Ivy Funds Class B, C, E and Y shares for expenses paid to broker-dealers and other sales professionals in connection with providing ongoing services to the Funds’ shareholders and/or maintaining the Funds’ shareholder accounts, with the exception of the Funds’ Class R shares, for which the maximum fee is 0.50%. The Funds’ Class B and C shares may charge a maximum of 0.75% of the average daily net AUM under a Rule 12b-1 distribution plan to broker-dealers and other sales professionals for their services in connection with distributing shares of that class. The Funds’ Class A shares may charge a maximum fee of 0.25% of the average daily net AUM under a Rule 12b-1 service and distribution plan for expenses detailed previously. The Rule 12b-1 plans are subject to annual approval by the Funds’ board of trustees, including a majority of the disinterested members, by votes cast in person at a meeting called for the purpose of voting on such approval. All Funds may terminate the service and distribution plans at any time with approval of fund trustees or portfolio shareholders (a majority of either) without penalty.
Underwriting and distribution commission revenues resulting from the sale of investment products are recorded upon satisfaction of performance obligations, which occurs on the trade date. For certain types of investment products, primarily variable annuities, distribution revenues are generally calculated based upon average daily net assets. When a client purchases Class A or Class E shares (front-end load), the client pays an initial sales charge of up to 5.75% of the amount invested. The sales charge for Class A or Class E shares typically declines as the investment amount increases. In addition, investors may combine their purchases of all fund shares to qualify for a reduced sales charge. When a client invests in a fee-based asset allocation product, Class I or Y shares are purchased at net asset value, and we do not charge an initial sales charge.
Underwriting and distribution revenues resulting from payments from Advisors for office space, compliance oversight and affiliation fees are earned over the period in which the service is provided, which is generally monthly and is based on a fee schedule. Fees collected from Advisors for various services are recorded in underwriting and distribution fees on a gross basis, as the Company is the principal in these arrangements.
Shareholder service fee revenue primarily includes transfer agency fees, custodian fees from retirement plan accounts, and portfolio accounting and administration fees. Transfer agency fees and portfolio accounting and administration fees are asset‑based revenues or account‑based revenues, while custodian fees from retirement plan accounts are based on the number of client accounts. Custodian fees, transfer agency fees and portfolio accounting and administration fees are earned upon completion of the service when all performance obligations have been satisfied.
63
Advertising and Promotion
We expense all advertising and promotion costs as the advertising or event takes place. Advertising expense was $8.1 million, $9.7 million and $9.4 million for the years ended December 31, 2018, 2017 and 2016, respectively, and is classified in marketing and advertising expense in the consolidated statements of income.
Leases
The Company leases office space under various leasing arrangements. Certain lease agreements contain renewal options, rent escalation clauses and/or other inducements provided by the landlord. Rent expense is recorded on a straight-line basis, including escalations and inducements, over the term of the lease.
Share‑Based Compensation
We account for share‑based compensation expense using the fair value method. Under the fair value method, share‑based compensation expense reflects the fair value of share‑based awards measured at grant date, and is recognized over the service period. The Company also issues share‑based awards to our Board of Directors. Changes in the Company’s share price result in variable compensation expense over the vesting period of awards granted to our Board of Directors.
The Company’s Cash Settled RSU Plan (the “RSU Plan”) allows the Company to grant cash-settled restricted stock units (“RSUs”). Unvested RSUs have no purchase price and vest in 25% increments over four years, beginning on the first anniversary of the grant date. On the vesting date, RSU holders receive a lump sum cash payment equal to the fair market value of one share of the Company’s common stock, par value $0.01, for each RSU that has vested, subject to applicable tax withholdings. We treat RSUs as liability-classified awards and, therefore, account for them at fair value based on the closing price of our common stock on the reporting date, which results in variable compensation expense over the vesting period.
Accounting for Income Taxes
Income tax expense is based on pre-tax income, including adjustments made for the recognition or derecognition related to uncertain tax positions. The recognition or derecognition of income tax expense related to uncertain tax positions is determined under the guidance as prescribed by ASC 740, “Income Taxes Topic.” Deferred tax assets and liabilities are recognized for the future tax attributable to differences between the financial statement carrying amounts of existing assets and liabilities and their respective tax basis. A valuation allowance is recognized to reduce deferred tax assets if, based on available evidence, it is more likely than not that all or some portion of the asset will not be realized. Deferred tax assets and liabilities are measured using enacted tax rates that will be in effect when they are expected to be realized or settled. The effect on the measurement of deferred tax assets and liabilities of a change in income tax law is recognized in earnings in the period that includes the enactment date.
On December 22, 2017, the Tax Cuts and Jobs Act (the “Tax Reform Act”) was enacted, which significantly revised the U.S. corporate income tax system by, among other things, permanently reducing the federal statutory tax rate from 35% to 21% effective January 1, 2018. The Company recorded a one-time charge of $5.4 million in the fourth quarter of 2017 to measure net deferred tax assets at the reduced federal statutory rate. According to guidance from SEC Staff Accounting Bulletin 118, the Company recognized a provisional tax impact related to the revaluation of deferred tax assets and liabilities and included those amounts in its consolidated financial statements for the year ended December 31, 2017. In the third quarter of 2018, we finalized our 2017 U.S. corporate income tax return and revised provisional adjustments made to our net deferred tax asset. Accordingly, we recorded a discrete tax benefit of $1.0 million. The Company now considers its accounting for the income tax effects of the Tax Reform Act to be complete.
2. New Accounting Guidance
Accounting Guidance Adopted During Fiscal Year 2018
On January 1, 2018, the Company adopted ASU 2014-09, “Revenue from Contracts with Customers.” This ASU requires an entity to recognize the amount of revenue to which it expects to be entitled for the transfer of promised goods or services to customers. This standard also specifies the accounting for certain costs to obtain or fulfill a contract with a customer. The Company applied the five-step method detailed in this ASU to all revenue streams and elected the
64
cumulative effect approach. The implementation of this ASU did not have a material impact on the measurement or recognition of revenue from prior periods. See Note 1 - Summary of Significant Accounting Policies and Note 3 – Revenue Recognition, for additional accounting policy information and the additional disclosures required by this ASU.
On January 1, 2018, the Company adopted ASU 2016-01, “Recognition and Measurement of Financial Assets and Financial Liabilities.” This ASU provided updated guidance on the recognition, measurement, presentation and disclosure of certain financial assets and financial liabilities. After January 1, 2018, the guidance requires substantially all equity investments in non-consolidated entities to be measured at fair value with changes recognized in earnings, except for those accounted for using the equity method of accounting. As such, the guidance eliminated the available for sale investment category for equity securities, which required unrealized holding gains to be recognized in accumulated other comprehensive income. Upon adoption, we reclassified net unrealized holding gains, net of taxes, related to our available for sale investment portfolio from accumulated other comprehensive income to retained earnings. See consolidated statement of stockholders’ equity and redeemable noncontrolling interests for the financial statement reclassification impact of adopting this ASU.
On January 1, 2018, the Company adopted ASU 2016-15, “Classification of Certain Cash Receipts and Cash Payments.” This ASU eliminated the diversity in practice related to the classification of certain cash receipts and payments for debt prepayment or extinguishment costs, the maturing of a zero coupon bond, the settlement of contingent liabilities arising from a business combination, proceeds from insurance settlements, distributions from certain equity method investees and beneficial interests obtained in a financial asset securitization. This ASU designates the appropriate cash flow classification, including requirements to allocate certain components of these cash receipts and payments among operating, investing and financing activities. The adoption of this ASU did not impact our consolidated financial statements and related disclosures.
On January 1, 2018, the Company adopted ASU 2016-18, “Statement of Cash Flows: Restricted Cash.” This ASU is intended to reduce diversity in practice by adding or clarifying guidance on classification and presentation of changes in restricted cash on the statement of cash flows. The amendments in this ASU required that a statement of cash flows include the change during the period in the total of cash, cash equivalents, and amounts generally described as restricted cash or restricted cash equivalents. Cash and cash equivalents – restricted is included as a component of cash and cash equivalents on the Company’s consolidated statements of cash flows for all periods presented.
On January 1, 2018, the Company adopted ASU 2017-07, “Compensation-Retirement Benefits: Improving the Presentation of Net Periodic Pension Cost and Net Periodic Postretirement Benefit Cost.” This ASU changed the income statement presentation of our noncontributory retirement plan that covers substantially all employees and certain vested employees of our former parent company (the “Pension Plan”) by requiring separation between operating expense (service cost component) and non-operating expense (all other components, including interest cost, amortization of prior service cost, curtailments and settlements, etc.). In addition, only the service cost component is eligible for capitalization as part of an asset. The adoption of this ASU had no effect on our net income because it only impacts the classification of certain information on the consolidated statements of income. An amendment to freeze our noncontributory retirement plan that covers substantially all employees and certain vested employees of our former parent company was approved effective September 30, 2017; therefore, after September 30, 2017, we no longer incur service costs. The service cost component of net periodic benefit cost is recognized in compensation and related costs through September 30, 2017. The other components of net periodic cost were reclassified to investment and other income (loss) on a retrospective basis.
On January 1, 2018, the Company adopted ASU 2017-09, “Compensation-Stock Compensation: Scope of Modification Accounting.” This ASU provided guidance about which changes to the terms or conditions of a share-based payment award require an entity to apply modification accounting in Topic 718, “Compensation – Stock Compensation Topic.” The adoption of this ASU had an immaterial impact our consolidated financial statements and related disclosures.
On January 1, 2018, the Company early adopted ASU 2018-02, “Reclassification of Certain Tax Effects from Accumulated Other Comprehensive Income.” This ASU allows entities to reclassify stranded tax effects attributable to the Tax Reform Act from accumulated other comprehensive income (“AOCI”) to retained earnings. Tax effects that are stranded in other comprehensive income for reasons unrelated to the Tax Reform Act, such as other changes in tax law, will be reclassified in future periods in accordance with the Company’s policy. Under the policy, the Company releases stranded income tax effects on available for sale securities on a security-by-security basis as securities are sold, matured, or extinguished. For the post retirement plan, the Company will release stranded income tax effects when the entire plan is liquidated or terminated. The adoption of this ASU did not have a material impact on our consolidated financial
65
statements and related disclosures. See consolidated statement of stockholders’ equity for the financial statement reclassification impact of adopting this ASU.
On January 1, 2018, the Company adopted ASU 2018-05, “Amendments to SEC Paragraphs Pursuant to SEC Staff Accounting Bulletin No. 118.” This ASU updates the income tax accounting in U.S. GAAP to reflect SEC interpretive guidance released on December 22, 2017 when the Tax Reform Act became law. Staff Accountant Bulletin No. 118 states the SEC permits companies to use “reasonable estimates” and “provisional amounts” for some of their line items for taxes for their fourth quarter and year-end 2017 financial statements and regulatory filings. The Company has applied this guidance to its consolidated financial statements and related disclosures. See Note 1 - Summary of Significant Accounting Policies for additional information on the adoption of this ASU.
During the fourth quarter of 2018, the company early adopted ASU 2018-14, Compensation – Retirement Benefits – Defined Benefit Plans – General (Subtopic 715-20): Disclosure Framework – Changes to the Disclosure Requirements for Defined Benefit Plans, which removes certain disclosures that are not considered cost beneficial, clarifies certain required disclosures and adds additional disclosures. See Note 10 – Pension Plan and Postretirement Benefits Other Than Pension for updated disclosures as a result of the adoption of this ASU.
New Accounting Guidance Not Yet Adopted
In February 2016, the Financial Accounting Standards Board (“FASB”) issued ASU 2016-02, Leases, which increases transparency and comparability among organizations by establishing a right-of-use model that requires a lessee to record a right-of-use asset and a lease liability on the balance sheet with additional disclosures of key information about leasing arrangements. The new standard, and related ASUs, are effective for us on January 1, 2019, with early adoption permitted. A modified retrospective transition approach is required, applying the new standard to all leases existing at the date of initial application. An entity may choose to use either (1) its effective date or (2) the beginning of the earliest comparative period presented in the financial statements as its date of initial application. We expect to adopt the new standard on January 1, 2019 and use the effective date as our date of initial application. Consequently, financial information will not be updated and the disclosures required under the new standard will not be provided for dates and periods before January 1, 2019. The new standard provides a number of optional practical expedients in transition. We expect to elect all of the new standard’s available transition practical expedients. We expect that this ASU will have a material effect on our financial statements. While we continue to assess all of the effects of adoption, we currently believe the most significant effects relate to the recognition of new right-of-use assets and lease liabilities on our balance sheet for our real estate and equipment leases ranging from $35.0-45.0 million and the addition of significant new disclosures about our leasing activities. The new standard also provides practical expedients for an entity’s ongoing accounting. We currently expect to elect the short-term lease recognition exemption for all leases that qualify. This means, for those leases that qualify, we will not recognize right-of-use assets or lease liabilities, and this includes not recognizing right-of-use assets or lease liabilities for existing short-term leases of those assets in transition.
In June 2018, FASB issued ASU 2018-07, Compensation – Stock Compensation: Improvements to Nonemployee Share-Based Payment Accounting, which simplifies the accounting for share–based payments granted to nonemployees by aligning the accounting with the requirements for employee share–based compensation. This ASU is effective for fiscal years, and for interim periods within those fiscal years, beginning after December 15, 2018, with early adoption permitted. The Company will adopt the provisions of this guidance on January 1, 2019. We have concluded that the adoption of this ASU will have an immaterial impact on our consolidated financial statements and related disclosures.
In August 2018, FASB issued ASU 2018-13, Fair Value Measurement (Topic 820): Disclosure Framework – Changes to the Disclosure Requirements for Fair Value Measurement, which eliminates certain disclosure requirements for fair value measurements, requires entities to disclose new information, and modifies existing disclosure requirements. This ASU is effective for fiscal years, and for interim periods within those fiscal years, beginning after December 15, 2019, with early adoption permitted. Upon adoption of this ASU, disclosure changes will be reflected in our consolidated financial statements and related disclosures.
In August 2018, FASB issued ASU 2018-15, Intangibles – Goodwill and Other – Internal-Use Software (Subtopic 350-40): Customer’s Accounting for Implementation Costs Incurred in a Cloud Computing Arrangement that is a Service Contract, which aligns the requirements for capitalizing implementation costs incurred in a hosting arrangement that is a service contract with the requirements for capitalizing implementation costs incurred to develop or obtain internal-use software (and hosting arrangements that include an internal-use software license). This ASU is effective for fiscal years,
66
and for interim periods within those fiscal years, beginning after December 15, 2019, with early adoption permitted. We are evaluating the impact the adoption of this ASU will have on our consolidated financial statements and related disclosures.
3. Revenue Recognition
All revenue recognized in the consolidated statements of income is considered to be revenue from contracts with customers. The vast majority of revenue is determined based on average assets and is earned daily or monthly or is transactional and is earned on the trade date. As such, revenue from remaining performance obligations is not significant. The following table depicts the disaggregation of revenue by product and distribution channel:
|
|
|
|
|
|
|
|
|
|
|
|
| For the Year ended December 31, | ||||
|
|
|
| 2018 |
| 2017 |
| 2016 |
|
|
|
| (in thousands) | ||||
Investment management fees: |
|
|
|
|
|
|
|
|
Funds |
|
| $ | 486,181 |
| 506,868 |
| 521,207 |
Institutional |
|
|
| 21,725 |
| 24,982 |
| 35,905 |
Total investment management fees |
|
|
| 507,906 |
| 531,850 |
| 557,112 |
Underwriting and distribution fees: |
|
|
|
|
|
|
|
|
Unaffiliated |
|
|
|
|
|
|
|
|
Rule 12b-1 service and distribution fees |
|
|
| 78,041 |
| 91,313 |
| 121,926 |
Sales commissions on front-end load mutual fund and variable annuity sales |
|
|
| 1,886 |
| 1,498 |
| 565 |
Other revenues |
|
|
| 568 |
| 1,182 |
| 2,924 |
Total unaffiliated distribution fees |
|
|
| 80,495 |
| 93,993 |
| 125,415 |
Broker-Dealer |
|
|
|
|
|
|
|
|
Fee-based asset allocation product revenues |
|
|
| 269,069 |
| 240,089 |
| 224,319 |
Rule 12b-1 service and distribution fees |
|
|
| 70,938 |
| 75,850 |
| 93,260 |
Sales commissions on front-end load mutual fund and variable annuity sales |
|
|
| 54,895 |
| 55,293 |
| 67,169 |
Sales commissions on other products |
|
|
| 36,131 |
| 31,286 |
| 31,246 |
Other revenues |
|
|
| 38,482 |
| 22,188 |
| 20,261 |
Total broker-dealer distribution fees |
|
|
| 469,515 |
| 424,706 |
| 436,255 |
Total distribution fees |
|
|
| 550,010 |
| 518,699 |
| 561,670 |
Shareholder service fees: |
|
|
|
|
|
|
|
|
Total shareholder service fees |
|
|
| 102,385 |
| 106,595 |
| 120,241 |
|
|
|
|
|
|
|
|
|
Total revenues |
|
| $ | 1,160,301 |
| 1,157,144 |
| 1,239,023 |
|
|
|
|
|
|
|
|
|
67
4. Investment Securities
Investment securities at December 31, 2018 and 2017 are as follows:
|
|
|
|
|
|
|
|
| December 31, |
| December 31, |
| |
|
| 2018 |
| 2017 |
| |
|
|
| (in thousands) |
| ||
Available for sale securities: |
|
|
|
|
|
|
Certificates of deposit |
| $ | 5,001 |
| 12,999 |
|
Commercial paper |
|
| 7,970 |
| 34,978 |
|
Corporate bonds |
|
| 218,121 |
| 197,442 |
|
U.S. Treasury bills |
|
| 19,672 |
| 19,779 |
|
Total available for sale securities |
|
| 250,764 |
| 265,198 |
|
Trading debt securities: |
|
|
|
|
|
|
Certificates of deposit |
|
| — |
| 1,999 |
|
Commercial paper |
|
| 1,993 |
| — |
|
Corporate bonds |
|
| 77,250 |
| 55,414 |
|
U.S. Treasury bills |
|
| 5,884 |
| 4,929 |
|
Mortgage-backed securities |
|
| 7 |
| 10 |
|
Consolidated sponsored funds |
|
| 33,088 |
| 62,038 |
|
Total trading securities |
|
| 118,222 |
| 124,390 |
|
Equity securities: |
|
|
|
|
|
|
Common stock |
|
| 21,204 |
| 116 |
|
Sponsored funds(1) |
|
| 153,548 |
| 137,857 |
|
Sponsored privately offered funds |
|
| 678 |
| 695 |
|
Consolidated sponsored funds |
|
| 24,879 |
| 77,048 |
|
Total equity securities |
|
| 200,309 |
| 215,716 |
|
Equity method securities: |
|
|
|
|
|
|
Sponsored funds |
|
| 47,840 |
| 95,188 |
|
Total securities |
| $ | 617,135 |
| 700,492 |
|
|
|
Certificates of deposit, commercial paper, corporate bonds and U.S. Treasury bills accounted for as available for sale and held as of December 31, 2018 mature as follows:
|
|
|
|
|
|
| Amortized |
|
|
|
| cost |
| Fair value |
|
| (in thousands) | ||
Within one year | $ | 97,196 |
| 96,726 |
After one year but within five years |
| 154,614 |
| 154,038 |
| $ | 251,810 |
| 250,764 |
Commercial paper, corporate bonds, U.S. Treasury bills and mortgage-backed securities accounted for as trading and held as of December 31, 2018 mature as follows:
|
|
|
|
|
|
|
|
| Fair value |
|
|
|
| (in thousands) |
Within one year |
|
| $ | 30,929 |
After one year but within five years |
|
|
| 49,660 |
After five years but within 10 years |
|
|
| 4,545 |
|
|
| $ | 85,134 |
68
The following is a summary of the gross unrealized gains (losses) related to securities classified as available for sale at December 31, 2018:
|
|
|
|
|
|
|
|
|
|
|
|
| Amortized |
| Unrealized |
| Unrealized |
|
|
| |
|
| cost |
| gains |
| losses |
| Fair value |
| |
|
| (in thousands) |
| |||||||
Available for sale securities: |
|
|
|
|
|
|
|
|
|
|
Certificates of deposit |
| $ | 5,000 |
| 1 |
| — |
| 5,001 |
|
Commercial paper |
|
| 7,902 |
| 68 |
| — |
| 7,970 |
|
Corporate bonds |
|
| 219,236 |
| 254 |
| (1,369) |
| 218,121 |
|
U.S. Treasury bills |
|
| 19,672 |
| — |
| — |
| 19,672 |
|
|
| $ | 251,810 |
| 323 |
| (1,369) |
| 250,764 |
|
The following is a summary of the gross unrealized gains (losses) related to securities classified as available for sale at December 31, 2017:
|
|
|
|
|
|
|
|
|
|
|
|
| Amortized |
| Unrealized |
| Unrealized |
|
|
| |
|
| cost |
| gains |
| losses |
| Fair value |
| |
|
| (in thousands) |
| |||||||
Available for sale securities: |
|
|
|
|
|
|
|
|
|
|
Certificates of deposit |
| $ | 13,000 |
| 1 |
| (2) |
| 12,999 |
|
Commercial paper |
|
| 34,836 |
| 142 |
| — |
| 34,978 |
|
Corporate bonds |
|
| 198,404 |
| 33 |
| (995) |
| 197,442 |
|
U.S. Treasury bills |
|
| 20,019 |
| — |
| (240) |
| 19,779 |
|
|
| $ | 266,259 |
| 176 |
| (1,237) |
| 265,198 |
|
Investment securities with fair values of $84.5 million, $237.2 million and $234.4 million were sold or redeemed during 2018, 2017 and 2016, respectively. During 2018, net realized gains of $0.3 million, less than $0.1 million and $12.8 million were recognized from the sale of $8.3 million in equity securities, the sale of $1.2 million in equity method securities and the redemption of $75.1 million in consolidated traded securities, respectively. During 2017, net realized gains of $0.9 million, $6.9 million and $1.5 million were recognized from the sale of $86.9 million in available for sale securities, the sale of $73.2 million in equity method securities, and the sale of $57.1 million in consolidated traded securities, respectively, and net realized losses of $0.5 million were recognized from the sale of $19.8 million in trading securities. During 2016, net realized gains of $3.6 million were recognized from the sale of $98.2 million in available for sale securities and net realized losses of $2.3 million were recognized from the sale of $58.7 million in equity method securities.
A summary of available for sale sponsored funds with fair values below carrying values at December 31, 2018 is as follows:
|
|
|
|
|
|
|
|
|
|
|
|
|
|
|
| Less than 12 months |
| 12 months or longer |
| Total | |||||||
|
|
|
|
| Unrealized |
|
|
| Unrealized |
|
|
| Unrealized |
December 31, 2018 |
| Fair value |
| losses |
| Fair value |
| losses |
| Fair value |
| losses | |
|
| (in thousands) | |||||||||||
Corporate bonds |
| $ | 36,302 |
| (160) |
| 119,480 |
| (1,209) |
| 155,782 |
| (1,369) |
A summary of available for sale sponsored funds with fair values below carrying values at December 31, 2017 is as follows:
|
|
|
|
|
|
|
|
|
|
|
|
|
|
|
| Less than 12 months |
| 12 months or longer |
| Total | |||||||
|
|
|
|
| Unrealized |
|
|
| Unrealized |
|
|
| Unrealized |
December 31, 2017 |
| Fair value |
| losses |
| Fair value |
| losses |
| Fair value |
| losses | |
|
| (in thousands) | |||||||||||
Certificates of deposit |
| $ | 2,998 |
| (2) |
| — |
| — |
| 2,998 |
| (2) |
Corporate bonds |
|
| 192,409 |
| (995) |
| — |
| — |
| 192,409 |
| (995) |
U.S. Treasury bills |
|
| 19,779 |
| (240) |
| — |
| — |
| 19,779 |
| (240) |
|
| $ | 215,186 |
| (1,237) |
| — |
| — |
| 215,186 |
| (1,237) |
69
The Company’s investment portfolio included 44 securities which were in an unrealized loss position at December 31, 2018.
During 2018 and 2017, we recorded pre-tax charges of $0.3 million and $1.3 million, respectively, to reflect the “other than temporary” decline in value of certain of the Company’s available for sale investments with fair value below amortized cost. These charges were recorded due to either an intent to sell prior to recovery of the amortized cost or the investment in an unrealized loss position for an extended period of time where the losses were expected to become realized. These charges are recorded in investment and other income (loss) in the consolidated statement of operations for 2018 and 2017.
The Company evaluated all of the other available for sale securities in an unrealized loss position at December 31, 2018 and concluded no additional other-than-temporary impairment existed at December 31, 2018. The unrealized losses in the Company’s investment portfolio at December 31, 2018 were primarily caused by changes in interest rates. At this time, the Company does not intend to sell, and does not believe it will be required to sell these securities before recovery of their amortized cost, with the exception of the securities mentioned above for which a charge was recorded.
Sponsored Privately Offered Funds
The Company holds a voting interests in a sponsored privately offered fund that is structured as an investment company in the legal form of an LLC. The Company held an investment in this fund totaling $0.7 million as of December 31, 2018 and December 31, 2017, which is the maximum loss exposure.
Consolidated Sponsored Funds
The following table details the balances related to consolidated sponsored funds at December 31, 2018 and 2017, as well as the Company’s net interest in these funds:
|
|
|
|
|
|
|
|
| December 31, |
|
| December 31, | |
|
| 2018 |
|
| 2017 | |
|
| (in thousands) | ||||
Cash |
| $ | 4,285 |
|
| 8,472 |
Investments |
|
| 57,967 |
|
| 139,086 |
Other assets |
|
| 872 |
|
| 1,588 |
Other liabilities |
|
| (79) |
|
| (1,040) |
Redeemable noncontrolling interests |
|
| (11,463) |
|
| (14,509) |
Net interest in consolidated sponsored funds |
| $ | 51,582 |
|
| 133,597 |
During the year ended December 31, 2018, we consolidated one sponsored privately offered fund, Ivy Funds, IGI Funds and Ivy NextShares in which we provided initial seed capital at the time of the funds’ formation. When we no longer have a controlling financial interest in a sponsored fund, it is deconsolidated from our consolidated financial statements. During 2018, we liquidated and redeemed our investment in the sponsored privately offered fund and the majority of our investment in the remaining IGI Funds, which resulted in a decrease in investments in the consolidated sponsored funds. One Ivy Fund, the IGI Funds and the Ivy Nextshares funds remain consolidated as of December 31, 2018. There was no impact to the consolidated statement of income as a result of the sponsored privately offered fund or IGI liquidation, as the funds were carried at fair value.
Fair Value
Accounting standards establish a framework for measuring fair value and a three‑level hierarchy for fair value measurements based upon the transparency of inputs to the valuation of the asset. Inputs may be observable or unobservable and refer broadly to the assumptions that market participants would use in pricing the asset. An individual investment’s fair value measurement is assigned a level based upon the observability of the inputs that are significant to the overall valuation. The three‑level hierarchy of inputs is summarized as follows:
|
|
70
|
|
|
|
Assets classified as Level 2 can have a variety of observable inputs. These observable inputs are collected and utilized, primarily by an independent pricing service, in different evaluated pricing approaches depending upon the specific asset to determine a value. The carrying amounts of certificates of deposit and commercial paper are measured at amortized cost, which approximates fair value due to the short-time between purchase and expected maturity of the investments. Depending on the nature of the inputs, these investments are generally classified as Level 1 or 2 within the fair value hierarchy. U.S. Treasury bills are valued upon quoted market prices for similar assets in active markets, quoted prices for identical or similar assets that are not active and inputs other than quoted prices that are observable or corroborated by observable market data. The fair value of corporate bonds is measured using various techniques, which consider recently executed transactions in securities of the issuer or comparable issuers, market price quotations (where observable), bond spreads and fundamental data relating to the issuer. The fair value of equity derivatives is measured based on active market broker quotes, evaluated broker quotes and evaluated prices from vendors.
The following tables summarize our investment securities as of December 31, 2018 and 2017 that are recognized in our consolidated balance sheets using fair value measurements based on the differing levels of inputs. There were no transfers between levels for the years ended December 31, 2018 or 2017.
|
|
|
|
|
|
|
|
|
|
|
|
|
December 31, 2018 |
| Level 1 |
| Level 2 |
| Level 3 |
| Other Assets Held at Net Asset Value |
| Total |
| |
|
| (in thousands) |
| |||||||||
Cash equivalents: (1) |
|
|
|
|
|
|
|
|
|
|
|
|
Money market funds |
| $ | 121,759 |
| — |
| — |
| — |
| 121,759 |
|
U.S. government sponsored enterprise note |
|
| — |
| 895 |
| — |
| — |
| 895 |
|
Commercial paper |
|
| — |
| 74,277 |
| — |
| — |
| 74,277 |
|
Total cash equivalents |
| $ | 121,759 |
| 75,172 |
| — |
| — |
| 196,931 |
|
Available for sale securities: |
|
|
|
|
|
|
|
|
|
|
|
|
Certificates of deposit |
| $ | — |
| 5,001 |
| — |
| — |
| 5,001 |
|
Commercial paper |
|
| — |
| 7,970 |
| — |
| — |
| 7,970 |
|
Corporate bonds |
|
| — |
| 218,121 |
| — |
| — |
| 218,121 |
|
U.S. Treasury bills |
|
| — |
| 19,672 |
| — |
| — |
| 19,672 |
|
Trading debt securities: |
|
|
|
|
|
|
|
|
|
|
|
|
Commercial paper |
|
| — |
| 1,993 |
| — |
| — |
| 1,993 |
|
Corporate bonds |
|
| — |
| 77,250 |
| — |
|
|
| 77,250 |
|
U.S. Treasury bills |
|
| — |
| 5,884 |
| — |
| — |
| 5,884 |
|
Mortgage-backed securities |
|
| — |
| 7 |
| — |
| — |
| 7 |
|
Consolidated sponsored funds |
|
| — |
| 33,088 |
| — |
| — |
| 33,088 |
|
Equity securities: |
|
|
|
|
|
|
|
|
|
|
|
|
Common stock |
|
| 21,192 |
| — |
| 12 |
| — |
| 21,204 |
|
Sponsored funds |
|
| 153,548 |
| — |
| — |
| — |
| 153,548 |
|
Sponsored privately offered funds measured at net asset value (2) |
|
| — |
| — |
| — |
| 678 |
| 678 |
|
Consolidated sponsored funds |
|
| 24,879 |
| — |
| — |
| — |
| 24,879 |
|
Equity method securities: (3) |
|
|
|
|
|
|
|
|
|
|
|
|
Sponsored funds |
|
| 47,840 |
| — |
| — |
| — |
| 47,840 |
|
Total |
| $ | 247,459 |
| 368,986 |
| 12 |
| 678 |
| 617,135 |
|
71
|
|
|
|
|
|
|
|
|
|
|
|
|
December 31, 2017 |
| Level 1 |
| Level 2 |
| Level 3 |
| Other Assets Held at Net Asset Value |
| Total |
| |
|
| (in thousands) |
| |||||||||
Cash equivalents: (1) |
|
|
|
|
|
|
|
|
|
|
|
|
Money market funds |
| $ | 145,785 |
| — |
| — |
| — |
| 145,785 |
|
Commercial paper |
|
| — |
| 11,064 |
| — |
| — |
| 11,064 |
|
Total cash equivalents |
| $ | 145,785 |
| 11,064 |
| — |
| — |
| 156,849 |
|
Available for sale securities: |
|
|
|
|
|
|
|
|
|
|
|
|
Certificates of deposit |
| $ | — |
| 12,999 |
| — |
| — |
| 12,999 |
|
Commercial paper |
|
| — |
| 34,978 |
| — |
| — |
| 34,978 |
|
Corporate bonds |
|
| — |
| 197,442 |
| — |
| — |
| 197,442 |
|
U.S. Treasury bills |
|
| — |
| 19,779 |
| — |
| — |
| 19,779 |
|
Trading debt securities: |
|
|
|
|
|
|
|
|
|
|
|
|
Certificates of deposit |
|
| — |
| 1,999 |
| — |
| — |
| 1,999 |
|
Corporate bonds |
|
| — |
| 55,414 |
| — |
|
|
| 55,414 |
|
U.S. Treasury bills |
|
| — |
| 4,929 |
| — |
| — |
| 4,929 |
|
Mortgage-backed securities |
|
| — |
| 10 |
| — |
| — |
| 10 |
|
Consolidated sponsored funds |
|
| — |
| 62,038 |
| — |
| — |
| 62,038 |
|
Equity securities: |
|
|
|
|
|
|
|
|
|
|
|
|
Common stock |
|
| 116 |
| — |
| — |
| — |
| 116 |
|
Sponsored funds |
|
| 137,857 |
| — |
| — |
| — |
| 137,857 |
|
Sponsored privately offered funds measured at net asset value (2) |
|
| — |
| — |
| — |
| 695 |
| 695 |
|
Consolidated sponsored funds |
|
| 77,048 |
| — |
| — |
| — |
| 77,048 |
|
Equity method securities: (3) |
|
|
|
|
|
|
|
|
|
|
|
|
Sponsored funds |
|
| 95,188 |
| — |
| — |
| — |
| 95,188 |
|
Total |
| $ | 310,209 |
| 389,588 |
| — |
| 695 |
| 700,492 |
|
|
|
|
|
|
|
The following table summarizes the activity of investments categorized as Level 3 for the year ended December 31, 2018:
|
|
|
|
|
|
| For the year ended |
|
| December 31, 2018 | |
|
| (in thousands) | |
Level 3 assets at December 31, 2017 |
| $ | — |
Additions |
|
| 359 |
Valuation change |
|
| 5 |
Redemptions |
|
| (352) |
Level 3 assets at December 31, 2018 |
| $ | 12 |
72
5. Derivative Financial Instruments
The Company has in place an economic hedge program that uses total return swap contracts to hedge market risk related to its investments in certain sponsored funds. Certain of the consolidated sponsored funds may utilize derivative financial instruments within their portfolios in pursuit of their stated investment objectives. We do not hedge for speculative purposes.
Excluding derivative financial instruments held in certain consolidated sponsored funds, the Company was party to five total return swap contracts with a combined notional value of $194.4 million and six total return swap contracts with a combined notional value of $213.9 million as of December 31, 2018 and 2017, respectively. These derivative instruments are not designated as hedges for accounting purposes. Changes in fair value of the total return swap contracts are recognized in investment and other income (loss) on the Company’s consolidated statement of income.
The Company posted $5.2 million and $9.7 million in cash collateral with the counterparties of the total return swap contracts as of December 31, 2018 and 2017, respectively. The cash collateral is included in customers and other receivables on the Company’s consolidated balance sheet. The Company does not record its fair value in derivative transactions against the posted collateral.
The following table presents the fair value of the derivative financial instruments, excluding derivative financial instruments held in certain consolidated sponsored funds as of December 31, 2018 and 2017 calculated based on Level 2 inputs:
|
|
|
|
|
|
|
|
|
|
|
|
|
| December 31, |
|
| December 31, |
|
|
|
|
| 2018 |
|
| 2017 |
|
| Balance sheet |
|
|
|
|
|
|
|
| location |
| Fair value |
| Fair value | ||
|
|
|
| (in thousands) | ||||
Total return swap contracts |
| Prepaid expenses and other current assets |
| $ | 4,968 |
|
| — |
Total return swap contracts |
| Other current liabilities |
|
| — |
|
| 1,093 |
Total |
|
|
| $ | 4,968 |
|
| 1,093 |
The following is a summary of net gains (losses) recognized in income for the years ended December 31, 2018 and 2017:
|
|
|
|
|
|
|
|
|
|
|
| Year ended | |||
|
| Income statement |
| December 31, | |||
|
| location |
|
| 2018 |
| 2017 |
|
|
|
| (in thousands) | |||
Total return swap contracts |
| Investment and other income (loss) |
| $ | 15,163 |
| (36,368) |
6. Property and Equipment
A summary of property and equipment at December 31, 2018 and 2017 is as follows:
|
|
|
|
|
|
|
|
|
|
|
|
|
|
|
|
| Estimated |
| |
|
| 2018 |
| 2017 |
| useful lives |
| ||
|
| (in thousands) |
|
|
|
| |||
Leasehold improvements |
| $ | 21,790 |
| 22,106 |
| 1 - 15 | years |
|
Furniture and fixtures |
|
| 28,482 |
| 30,529 |
| 3 - 10 | years |
|
Equipment |
|
| 20,248 |
| 20,802 |
| 2 - 26 | years |
|
Computer software |
|
| 100,507 |
| 99,644 |
| 1 - 10 | years |
|
Data processing equipment |
|
| 17,056 |
| 18,678 |
| 1 - 5 | years |
|
Buildings |
|
| 11,772 |
| 11,759 |
| 1 - 30 | years |
|
Land |
|
| 2,843 |
| 2,843 |
|
|
|
|
Property and equipment, at cost |
|
| 202,698 |
| 206,361 |
|
|
|
|
Accumulated depreciation |
|
| (139,269) |
| (118,694) |
|
|
|
|
Property and equipment, net |
| $ | 63,429 |
| 87,667 |
|
|
|
|
73
Depreciation expense was $25.6 million, $21.0 million and $18.4 million during the years ended December 31, 2018, 2017 and 2016, respectively.
At December 31, 2018, we had property and equipment under capital leases with a cost of $1.6 million and accumulated depreciation of $1.1 million. At December 31, 2017, we had property and equipment under capital leases with a cost of $1.9 million and accumulated depreciation of $1.0 million.
7. Goodwill and Identifiable Intangible Assets
Goodwill and identifiable intangible assets (all considered indefinite-lived) at December 31, 2018 and 2017 are as follows:
|
|
|
|
|
|
|
|
| December 31, |
| December 31, |
| |
|
| 2018 |
| 2017 |
| |
|
| (in thousands) |
| |||
Goodwill |
| $ | 106,970 |
| 106,970 |
|
|
|
|
|
|
|
|
Mutual fund management advisory contracts |
|
| 38,699 |
| 38,699 |
|
Mutual fund management subadvisory contract |
|
| — |
| 1,200 |
|
Other |
|
| 200 |
| 200 |
|
Total identifiable intangible assets |
|
| 38,899 |
| 40,099 |
|
|
|
|
|
|
|
|
Total |
| $ | 145,869 |
| 147,069 |
|
During 2018, the balance of the mutual fund management subadvisory contract intangible asset was determined to be impaired due to a termination of the subadvisory agreement.
8. Indebtedness
On August 31, 2010, the Company entered into a note purchase agreement to complete a $190.0 million private placement Series A and Series B senior unsecured notes. The $95.0 million Series A, senior unsecured notes that matured on January 13, 2018 were repaid. Interest is payable semi‑annually in January and July of each year. The agreement requires the Company to maintain a consolidated leverage ratio not to exceed 3.0 to 1.0 for four consecutive quarters and a consolidated interest coverage ratio of not less than 4.0 to 1.0 for four consecutive quarters. The Company was in compliance with these covenants for all periods presented. As of December 31, 2018, the Company’s consolidated leverage ratio was 0.3 to 1.0, and the consolidated interest coverage ratio was 48.7 to 1.0.
Debt is reported at its carrying amount in the consolidated balance sheet. The fair value of the Company’s Series B Senior Notes maturing January 13, 2021 was $98.0 million at December 31, 2018 compared to the carrying value net of debt issuance costs of $94.9 million, which is listed under long-term debt in the consolidated balance sheet. Fair value is calculated based on Level 2 inputs.
On October 20, 2017, we entered into a three-year unsecured revolving credit facility (the “Credit Facility”) with various lenders, which initially provides for borrowings of up to $100.0 million and may be expanded to $200.0 million. The Credit Facility replaced the prior credit facility, which was set to expire in June 2018. At December 31, 2018 and 2017, there were no borrowings outstanding under the Credit Facility. Borrowings under the Credit Facility bear interest at various rates including adjusted LIBOR or an alternative base rate plus, in each case, an incremental margin based on the Company’s credit rating. The Credit Facility also imposes a facility fee on the aggregate amount of commitments under the revolving facility (whether or not utilized). The facility fee is also based on the Company’s credit rating level. The covenants in the Credit Facility are consistent with the covenants in the prior credit facility, including the required consolidated leverage ratio and the consolidated interest coverage ratio, which match those outlined above for the Senior Notes.
74
9. Income Taxes
The provision for income taxes from continuing operations for the years ended December 31, 2018, 2017 and 2016 consists of the following:
|
|
|
|
|
|
|
|
|
|
| 2018 |
| 2017 |
| 2016 |
| |
|
| (in thousands) |
| |||||
Current taxes: |
|
|
|
|
|
|
|
|
Federal |
| $ | 54,071 |
| 73,167 |
| 72,711 |
|
State |
|
| 625 |
| 7,720 |
| 7,174 |
|
Foreign |
|
| 1 |
| — |
| 17 |
|
|
|
| 54,697 |
| 80,887 |
| 79,902 |
|
Deferred taxes |
|
| 783 |
| 20,481 |
| 1,982 |
|
Provision for income taxes |
| $ | 55,480 |
| 101,368 |
| 81,884 |
|
The following table reconciles the statutory federal income tax rate with our effective income tax rate from continuing operations for the years ended December 31, 2018, 2017 and 2016:
|
|
|
|
|
|
|
|
|
| 2018 |
| 2017 |
| 2016 |
|
Statutory federal income tax rate |
| 21.0 | % | 35.0 | % | 35.0 | % |
State income taxes, net of federal tax benefit |
| 2.4 |
| 2.2 |
| 2.0 |
|
Share-based compensation |
| 1.8 |
| 3.4 |
| — |
|
Effects of U.S. tax rate decrease |
| (0.4) |
| 2.2 |
| — |
|
Uncertain tax positions |
| (2.2) |
| (0.2) |
| (0.1) |
|
Valuation allowance on losses capital in nature |
| — |
| (1.0) |
| (3.2) |
|
Other items |
| 0.7 |
| (0.3) |
| 0.4 |
|
Effective income tax rate |
| 23.3 | % | 41.3 | % | 34.1 | % |
The tax effect of temporary differences that give rise to significant portions of deferred tax liabilities and deferred tax assets at December 31, 2018 and 2017 are as follows:
|
|
|
|
|
|
|
|
| 2018 |
| 2017 |
| |
|
| (in thousands) |
| |||
Deferred tax assets: |
|
|
|
|
|
|
Benefit plans |
| $ | — |
| 3,381 |
|
Accrued compensation and related costs |
|
| 5,868 |
| 5,558 |
|
Other accrued expenses |
|
| 3,861 |
| 4,094 |
|
Unrealized losses on investment securities and partnerships |
|
| 6,272 |
| — |
|
Share-based compensation |
|
| 10,300 |
| 15,047 |
|
Unused state tax credits |
|
| 2,618 |
| 2,788 |
|
State net operating loss carryforwards |
|
| 7,266 |
| 7,235 |
|
Other |
|
| 1,171 |
| 2,874 |
|
Total gross deferred assets |
|
| 37,356 |
| 40,977 |
|
Deferred tax liabilities: |
|
|
|
|
|
|
Property and equipment |
| $ | (3,700) |
| (7,301) |
|
Benefit plans |
|
| (1,872) |
| — |
|
Identifiable intangible assets |
|
| (9,206) |
| (7,419) |
|
Unrealized gains on investments securities and partnerships |
|
| — |
| (3,554) |
|
Prepaid expenses |
|
| (2,478) |
| (1,679) |
|
Other |
|
| (513) |
| (481) |
|
Total gross deferred liabilities |
|
| (17,769) |
| (20,434) |
|
Valuation allowance |
|
| (7,266) |
| (7,235) |
|
Net deferred tax asset |
| $ | 12,321 |
| 13,308 |
|
Certain subsidiaries of the Company have net operating loss carryforwards in certain states in which these companies file on a separate company basis. The deferred tax asset, net of federal tax effect, relating to these carryforwards as of December 31, 2018 and 2017 is approximately $7.3 million and $7.2 million, respectively. The carryforwards, if not
75
utilized, will expire between 2019 and 2038. Management believes it is not more likely than not that these subsidiaries will generate sufficient future taxable income in these states to realize the benefit of the net operating loss carryforwards and, accordingly, a valuation allowance in the amount of $7.3 million and $7.2 million has been recorded at December 31, 2018 and 2017, respectively.
The Company has state tax credit carryforwards of $2.6 million and $2.8 million as of December 31, 2018 and 2017, respectively. Of these state tax credit carryforwards, $2.3 million will expire between 2024 and 2034 if not utilized, $0.2 million will expire in 2026 if not utilized, and $0.1 million can be carried forward indefinitely. The Company anticipates these credits will be fully utilized prior to their expiration date.
In the accompanying consolidated balance sheet, unrecognized tax benefits that are not expected to be settled within the next 12 months are included in other liabilities; unrecognized tax benefits that are expected to be settled within the next 12 months are included as a reduction to income taxes receivable; unrecognized tax benefits that reduce a net operating loss, similar tax loss, or tax credit carryforward are presented as a reduction to non-current deferred income taxes. As of December 31, 2018 and December 31, 2017, the Company’s consolidated balance sheet included unrecognized tax benefits, including penalties and interest, of $2.7 million ($2.4 million net of federal benefit) and $10.9 million ($8.9 million net of federal benefit), respectively, that if recognized, would impact the Company’s effective tax rate. The Company finalized a voluntary disclosure agreement with a state tax jurisdiction in June 2018, which reduced unrecognized tax benefits by $9.3 million ($7.6 million net of federal benefit).
The Company’s accounting policy with respect to interest and penalties related to income tax uncertainties is to classify these amounts as income taxes. As of December 31, 2018, and December 31, 2017, the total amount of accrued interest and penalties related to uncertain tax positions recognized in the consolidated balance sheet was $0.7 million ($0.6 million net of federal benefit) and $4.0 million ($3.5 million net of federal benefit), respectively. The total amount of penalties and interest, net of federal expense, related to tax uncertainties recognized in the statement of income for the period ended December 31, 2018 was a benefit of $2.8 million, which was comprised of a $3.0 million benefit related to settlement of the previously mentioned voluntary disclosure agreement and offset by the accrual of $0.2 million additional penalties and interest on outstanding uncertain tax positions.
The following table summarizes the Company's reconciliation of unrecognized tax benefits, excluding penalties and interest, for the years ended December 31, 2018, 2017 and 2016:
|
|
|
|
|
|
|
|
|
|
| 2018 |
| 2017 |
| 2016 |
| |
|
| (in thousands) |
| |||||
Balance at beginning of year |
| $ | 6,843 |
| 7,734 |
| 8,448 |
|
Increases during the year: |
|
|
|
|
|
|
|
|
Gross increases - tax positions in prior period |
|
| 712 |
| 244 |
| 465 |
|
Gross increases - current-period tax positions |
|
| 331 |
| 97 |
| 494 |
|
Decreases during the year: |
|
|
|
|
|
|
|
|
Gross decreases - tax positions in prior period |
|
| (4,219) |
| (56) |
| (167) |
|
Decreases due to settlements with taxing authorities |
|
| (1,385) |
| (178) |
| (21) |
|
Decreases due to lapse of statute of limitations |
|
| (212) |
| (998) |
| (1,485) |
|
Balance at end of year |
| $ | 2,070 |
| 6,843 |
| 7,734 |
|
In the ordinary course of business, many transactions occur for which the ultimate tax outcome is uncertain. In addition, respective tax authorities periodically audit our income tax returns. These audits examine our significant tax filing positions, including the timing and amounts of deductions and the allocation of income among tax jurisdictions. The Company is currently under audit in one state jurisdiction in which the Company operates. During 2017, the Company closed an Internal Revenue Service audit of the 2014 tax year. This audit was settled with no significant adjustments. During 2016, the Company settled two open tax years that were undergoing audit by a state jurisdiction in which the Company operates. The 2015, 2016, 2017 and 2018 federal income tax returns are open tax years that remain subject to potential future audit. State income tax returns for all years after 2014 and, in certain states, income tax returns for 2014, are subject to potential future audit by tax authorities in the Company’s major state tax jurisdictions.
76
10. Pension Plan and Postretirement Benefits Other Than Pension
Benefits payable under the Pension Plan are based on employees’ years of service and compensation during the final 10 years of employment. The Compensation Committee of the Company’s Board of Directors approved an amendment to freeze the Pension Plan effective September 30, 2017. After September 30, 2017, participants in the Pension Plan no longer accrue additional benefits for future service or compensation. Participants will retain benefits accumulated as of September 30, 2017 in accordance with the terms of the Pension Plan. In accordance with applicable accounting standards, the Pension Plan’s assets and liabilities were remeasured as of July 31, 2017, the date participants were notified of the freeze. This resulted in a reduction of the accrued pension liability of approximately $30.0 million and a curtailment gain of $31.6 million.
During 2016, the Company offered eligible terminated, vested Pension Plan participants an option to elect a one-time voluntary lump sum window distribution equal to the present value of the participant’s pension benefit, in settlement of all future pension benefits to which they would otherwise have been entitled. This offer was made in an effort to reduce pension obligations and ongoing annual pension expense. Payments were distributed to participants who accepted the lump sum offer in 2016 from the assets of the Pension Plan. The Company recognized a non-cash settlement charge of $20.7 million in 2016 related to this event.
We also sponsor an unfunded defined benefit postretirement medical plan that previously covered substantially all employees, as well as Advisors. The medical plan is contributory with participant contributions adjusted annually. The medical plan does not provide for benefits after age 65 with the exception of a small group of employees that were grandfathered when such plan was established. During 2016, the Company amended this plan to discontinue the availability of coverage for any individuals who retire after December 31, 2016. The plan amendment resulted in an $8.5 million curtailment gain, recorded in 2016 as part of net other postretirement benefit costs.
A reconciliation of the funded status of these plans and the assumptions related to the obligations at December 31, 2018, 2017 and 2016 are as follows:
|
|
|
|
|
|
|
|
|
|
|
|
|
|
|
|
|
|
|
|
|
|
|
| Other |
| ||||
|
| Pension Benefits |
| Postretirement Benefits |
| |||||||||
|
| 2018 |
| 2017 |
| 2016 |
| 2018 |
| 2017 |
| 2016 |
| |
|
| (in thousands) |
| |||||||||||
Change in projected benefit obligation: |
|
|
|
|
|
|
|
|
|
|
|
|
|
|
Net benefit obligation at beginning of year |
| $ | 184,245 |
| 180,921 |
| 210,783 |
| 2,195 |
| 2,446 |
| 8,421 |
|
Service cost |
|
| — |
| 8,367 |
| 12,199 |
| — |
| — |
| 555 |
|
Interest cost |
|
| 5,986 |
| 6,248 |
| 9,432 |
| 54 |
| 58 |
| 297 |
|
Benefits paid |
|
| (13,690) |
| (8,511) |
| (52,288) |
| (602) |
| (954) |
| (674) |
|
Actuarial (gain) loss |
|
| (22,013) |
| 28,841 |
| (19,886) |
| (965) |
| 139 |
| 1,790 |
|
Retiree contributions |
|
| — |
| — |
| — |
| 366 |
| 506 |
| 532 |
|
Curtailment gain |
|
| — |
| (31,621) |
| — |
| — |
| — |
| (8,475) |
|
Settlement loss |
|
| — |
| — |
| 20,681 |
| — |
| — |
| — |
|
Net benefit obligation at end of year |
| $ | 154,528 |
| 184,245 |
| 180,921 |
| 1,048 |
| 2,195 |
| 2,446 |
|
|
|
|
|
|
|
|
|
|
|
|
|
|
|
|
|
|
|
|
|
|
|
|
| Other |
| ||||
|
| Pension Benefits |
| Postretirement Benefits |
| |||||||||
|
| 2018 |
| 2017 |
| 2016 |
| 2018 |
| 2017 |
| 2016 |
| |
|
| (in thousands) |
| |||||||||||
Change in plan assets: |
|
|
|
|
|
|
|
|
|
|
|
|
|
|
Fair value of plan assets at beginning of year |
| $ | 170,881 |
| 144,529 |
| 173,885 |
| — |
| — |
| — |
|
Actual return on plan assets |
|
| 1,808 |
| 24,863 |
| 2,932 |
| — |
| — |
| — |
|
Employer contributions |
|
| 4,000 |
| 10,000 |
| 20,000 |
| 236 |
| 448 |
| 142 |
|
Retiree contributions |
|
| — |
| — |
| — |
| 366 |
| 506 |
| 532 |
|
Benefits paid |
|
| (13,690) |
| (8,511) |
| (52,288) |
| (602) |
| (954) |
| (674) |
|
Fair value of plan assets at end of year |
| $ | 162,999 |
| 170,881 |
| 144,529 |
| — |
| — |
| — |
|
Funded status at end of year |
| $ | 8,471 |
| (13,364) |
| (36,392) |
| (1,048) |
| (2,195) |
| (2,446) |
|
77
|
|
|
|
|
|
|
|
|
|
|
|
|
|
|
|
|
|
|
|
|
|
|
| Other |
| ||||
|
| Pension Benefits |
| Postretirement Benefits |
| |||||||||
|
| 2018 |
| 2017 |
| 2016 |
| 2018 |
| 2017 |
| 2016 |
| |
|
| (in thousands, except percentage data) |
| |||||||||||
Amounts recognized in the statement of financial position: |
|
|
|
|
|
|
|
|
|
|
|
|
|
|
Noncurrent assets |
| $ | 8,471 |
| — |
| — |
| — |
| — |
| — |
|
Current liabilities |
|
| — |
| — |
| — |
| (250) |
| (422) |
| (458) |
|
Noncurrent liabilities |
|
| — |
| (13,364) |
| (36,392) |
| (798) |
| (1,773) |
| (1,988) |
|
Net amount recognized at end of year |
| $ | 8,471 |
| (13,364) |
| (36,392) |
| (1,048) |
| (2,195) |
| (2,446) |
|
Weighted average assumptions used to determine benefit obligation at December 31: |
|
|
|
|
|
|
|
|
|
|
|
|
|
|
Discount rate |
|
| 4.45 | % | 3.76 | % | 4.39 | % | 4.08 | % | 3.28 | % | 3.46 | % |
Rate of compensation increase |
|
| Not applicable | 5.12 | % | Not applicable |
| |||||||
The discount rate assumption used to determine the pension and other postretirement benefits obligations was based on the Aon Hewitt AA Only Above Median Yield Curve. This discount rate was determined separately for each plan by plotting the expected benefit payments from each plan against a yield curve of high quality, zero coupon bonds and calculating the single rate that would produce the same present value of liabilities as the yield curve.
Our Pension Plan asset allocation at December 31, 2018 and 2017 is as follows:
|
|
|
|
|
|
|
| Percentage of |
| Percentage of |
|
|
| Plan Assets at |
| Plan Assets at |
|
Plan assets by category |
| December 31, 2018 |
| December 31, 2017 |
|
Cash |
| 2 | % | 40 | % |
Equity securities: |
|
|
|
|
|
Domestic |
| — |
| 29 | % |
International |
| — |
| 18 | % |
Fixed income securities |
| 98 | % | 8 | % |
Gold bullion |
| — |
| 5 | % |
Total |
| 100 | % | 100 | % |
Historically, the primary investment objective has been to maximize growth of the Pension Plan assets to meet the projected obligations to the beneficiaries over a long period of time and to do so in a manner that is consistent with the Company’s earnings strength and risk tolerance. Asset allocation is the most important decision in managing the assets and is reviewed regularly. The asset allocation policy considers the Company’s financial strength and long‑term asset class risk/return expectations since the obligations are long‑term in nature. Prior to the Pension Plan freeze in 2017, assets were invested in our Asset Strategy investment style, managed by our in‑house investment professionals. Subsequent to the freeze, the Company adjusted the Pension Plan’s asset allocation to decrease the exposure to equity securities. In 2018, the Company implemented a new pension de-risking strategy designed to more closely match assets to the pension obligations by shifting exposure from return-seeking assets to liability-hedging assets.
We determine the fair value of our Pension Plan assets using broad levels of inputs as defined by related accounting standards and categorized as Level 1, Level 2 or Level 3, as described in Note 4. The following tables summarize our Pension Plan assets as of December 31, 2018 and 2017. As of December 31, 2018 and 2017 a portion of
78
the international equity securities were valued utilizing Level 2 inputs, in accordance with company policy based on market movement greater than or equal to 0.50% on the final trading day of the year.
|
|
|
|
|
|
|
|
|
|
|
|
2018 |
| Level 1 |
| Level 2 |
| Level 3 |
| Total |
| ||
|
| (in thousands) |
| ||||||||
Cash equivalents |
| $ | — |
| 465 |
| — |
|
| 465 |
|
Equity securities: |
|
|
|
|
|
|
|
|
|
|
|
International |
|
| — |
| 4 |
| — |
|
| 4 |
|
Fixed income securities: |
|
|
|
|
|
|
|
|
|
|
|
U.S. Treasuries |
|
| — |
| 46,415 |
| — |
|
| 46,415 |
|
Corporate bond |
|
| — |
| 91,521 |
| — |
|
| 91,521 |
|
Foreign bonds |
|
| — |
| 21,870 |
| — |
|
| 21,870 |
|
Total investment securities |
|
| — |
| 160,275 |
| — |
|
| 160,275 |
|
Cash |
|
|
|
|
|
|
|
|
| 2,724 |
|
Total |
|
|
|
|
|
|
|
| $ | 162,999 |
|
|
|
|
|
|
|
|
|
|
|
|
|
2017 |
| Level 1 |
| Level 2 |
| Level 3 |
| Total |
| ||
|
| (in thousands) |
| ||||||||
Cash equivalents |
| $ | — |
| 66,779 |
| — |
|
| 66,779 |
|
Equity securities: |
|
|
|
|
|
|
|
|
|
|
|
Domestic |
|
| 49,540 |
| — |
| — |
|
| 49,540 |
|
International |
|
| 4,889 |
| 26,542 |
| — |
|
| 31,431 |
|
Fixed income securities: |
|
|
|
|
|
|
|
|
|
|
|
U.S. Treasuries |
|
| — |
| 6,455 |
| — |
|
| 6,455 |
|
Corporate bond |
|
| — |
| 587 |
| — |
|
| 587 |
|
Foreign Bonds |
|
| — |
| 6,591 |
| — |
|
| 6,591 |
|
Gold bullion |
|
| 8,369 |
| — |
| — |
|
| 8,369 |
|
Total investment securities |
|
| 62,798 |
| 106,954 |
| — |
|
| 169,752 |
|
Cash |
|
|
|
|
|
|
|
|
| 1,129 |
|
Total |
|
|
|
|
|
|
|
| $ | 170,881 |
|
The 6.00% expected long‑term rate of return utilized after the Pension Plan freeze in 2017 reflected management’s expectations of long‑term average rates of return on funds invested to provide for benefits included in the projected benefit obligations. The expected return was based on the outlook for inflation, fixed income returns and equity returns, while also considering historical returns, asset allocation and investment strategy. In 2018, we adjusted the expected long-term rate of return to 5.00% to reflect a further decrease to the Plan’s equity securities’ holdings based on expected investment mix at the beginning of the year. During the year, we accelerated the de-risking strategy and as such, expect to further reduce the long-term rate of return in the future.
The components of net periodic pension and other postretirement costs consisted of the following for the years ended December 31, 2018, 2017 and 2016:
|
|
|
|
|
|
|
|
|
|
|
|
|
|
|
|
|
|
|
|
|
|
|
| Other |
| ||||
|
| Pension Benefits |
| Postretirement Benefits |
| |||||||||
|
| 2018 |
| 2017 |
| 2016 |
| 2018 |
| 2017 |
| 2016 |
| |
|
| (in thousands) |
| |||||||||||
Components of net periodic benefit cost: |
|
|
|
|
|
|
|
|
|
|
|
|
|
|
Service cost |
| $ | — |
| 8,367 |
| 12,199 |
| — |
| — |
| 555 |
|
Interest cost |
|
| 5,986 |
| 6,248 |
| 9,432 |
| 54 |
| 58 |
| 297 |
|
Expected return on plan assets |
|
| (8,320) |
| (10,113) |
| (13,927) |
| — |
| — |
| — |
|
Actuarial (gain) loss |
|
| (15,501) |
| 14,091 |
| (8,891) |
| — |
| — |
| — |
|
Actuarial gain amortization |
|
| — |
| — |
| — |
| (120) |
| (180) |
| (153) |
|
Prior service cost amortization |
|
| — |
| — |
| — |
| (2) |
| (4) |
| 4 |
|
Curtailment gain |
|
| — |
| (31,621) |
| — |
| — |
| — |
| (8,475) |
|
Settlement loss |
|
| — |
| — |
| 20,681 |
| — |
| — |
| — |
|
Total |
| $ | (17,835) |
| (13,028) |
| 19,494 |
| (68) |
| (126) |
| (7,772) |
|
79
The weighted average assumptions used to determine net periodic benefit cost for the years ended December 31, 2018, 2017 and 2016 are as follows:
|
|
|
|
|
|
|
|
|
|
|
|
|
|
|
|
|
|
|
|
|
| Other |
| ||||
|
| Pension Benefits |
| Postretirement Benefits |
| ||||||||
|
| 2018 |
| 2017 |
| 2016 |
| 2018 |
| 2017 |
| 2016 |
|
Discount rate |
| 3.76 | % | 4.39% / 3.96 | 1% | 4.60 | % | 3.28 | % | 3.46 | % | 4.44 | % |
Expected return on plan assets |
| 5.00 | % | 7.00% / 6.00 | 1% | 7.50 | % | Not applicable |
| ||||
Rate of compensation increase |
| Not applicable |
| 5.12 | % | 5.12 | % | Not applicable |
| ||||
________________________
|
|
Under current plan provisions, we expect the following benefit payments to be paid:
|
|
|
|
|
|
|
|
|
|
|
| Other |
|
|
| Pension |
| Postretirement |
| |
|
| Benefits |
| Benefits |
| |
|
| (in thousands) |
| |||
2019 |
| $ | 7,984 |
| 250 |
|
2020 |
|
| 8,068 |
| 179 |
|
2021 |
|
| 9,371 |
| 131 |
|
2022 |
|
| 8,843 |
| 116 |
|
2023 |
|
| 9,031 |
| 79 |
|
2024 through 2028 |
|
| 46,521 |
| 233 |
|
|
| $ | 89,818 |
| 988 |
|
Our policy with respect to funding the Pension Plan is to fund at least the minimum required by the Employee Retirement Income Security Act of 1974, as amended, and not more than the maximum amount deductible for tax purposes. All contributions made to the Pension Plan for 2018, 2017 and 2016 were voluntary.
All Company contributions to other postretirement medical benefits are voluntary, as the postretirement medical plan is not funded and is not subject to any minimum regulatory funding requirements. The contributions for each year represent claims paid for medical expenses, and we anticipate making the 2019 expected contribution with cash generated from operations. Contributions by participants to the postretirement plan were $366 thousand, $506 thousand and $532 thousand for the years ended December 31, 2018, 2017 and 2016, respectively.
For measurement purposes, the initial health care cost trend rate was 8.05% (prior to age 65) and 9.30% (subsequent to age 65) for 2018, 7.02% (prior to age 65) and 8.47% (subsequent to age 65) for 2017 and 6.82% for 2016. The health care cost trend rate reflects anticipated increases in health care costs. The initial growth rates for 2018 are assumed to gradually decline over the next 8 years to a rate of 4.5%.
We also sponsored the Waddell & Reed Financial, Inc. Supplemental Executive Retirement Plan, as amended and restated (the “SERP”), a non-qualified deferred compensation plan covering eligible employees. The SERP was adopted to supplement the annual pension benefit for certain senior executive officers that the Pension Plan was prevented from providing because of compensation and benefit limits in the Internal Revenue Code (the “IRC”).
The SERP allowed for discretionary contributions, though none were awarded to participants in 2017 or 2016. Additionally, each calendar year, participants’ accounts were credited (or charged) with an amount equal to the performance of certain hypothetical investment vehicles since the last preceding year. Upon a participant’s separation, or at such other time based on a pre-existing election by a participant, benefits accumulated under the SERP were payable in installments or in a lump sum. Following a lump sum payment of $3.8 million in February 2017 to the sole remaining participant in the SERP, the Board of Directors terminated the SERP.
At December 31, 2018, the pension asset and postretirement liability recorded in the consolidated balance sheet was comprised of a pension asset of $8.5 million and a liability for postretirement benefits in the amount of $0.8 million.
80
The current portion of postretirement liability of $0.3 million is included in other current liabilities on the consolidated balance sheet. At December 31, 2017, the accrued pension and postretirement liability recorded in the consolidated balance sheet was comprised of accrued pension costs of $13.4 million and a liability for postretirement benefits in the amount of $1.8 million. The accrued liability for the current portion of postretirement liability of $0.4 million is included in other current liabilities on the consolidated balance sheet.
11. Defined Contribution Plan
We sponsor a defined contribution plan that qualifies under Section 401(k) of the IRC to provide retirement benefits to substantially all of our employees. As allowed under Section 401(k), the plan provides tax‑deferred salary deductions for eligible employees. Our matching contributions to the plan for the years ended December 31, 2018, 2017 and 2016 were $6.8 million, $6.0 million and $6.8 million, respectively.
In 2017, in connection with the Pension Plan freeze, the Company amended its 401(k) plan to permit employer discretionary nonelective contributions to eligible participants. For the 2017 plan year, the Company approved a discretionary nonelective contribution in an amount equal to 4% of such participant’s eligible compensation. These contributions, which were expensed over the service period in 2017, totaled $5.5 million and were funded and allocated to participant accounts during the first quarter of 2018.
12. Stockholders’ Equity
Earnings per Share
For the years ended December 31, 2018, 2017 and 2016, earnings per share were computed as follows:
|
|
|
|
|
|
|
|
|
| 2018 |
| 2017 |
| 2016 | |
|
|
|
|
|
|
|
|
Net income attributable to Waddell & Reed Financial, Inc. |
| $ | 183,588 |
| 141,279 |
| 156,695 |
|
|
|
|
|
|
|
|
Weighted average shares outstanding, basic and diluted |
|
| 80,468 |
| 83,573 |
| 82,668 |
|
|
|
|
|
|
|
|
Earnings per share, basic and diluted |
| $ | 2.28 |
| 1.69 |
| 1.90 |
Dividends
The Board of Directors declared dividends on our Class A common stock of $1.00 per share, $1.63 per share and $1.84 per share for the years ended December 31, 2018, 2017 and 2016, respectively. In December 2018, the Board of Directors declared a quarterly dividend on our Class A common stock of $0.25 per share payable on February 1, 2019 to stockholders of record as of January 11, 2019. As of December 31, 2018 and 2017, other current liabilities included $19.2 million and $20.7 million, respectively, for dividends payable to stockholders.
Common Stock Repurchases
The Board of Directors has authorized the repurchase of our Class A common stock in the open market and/or private purchases. The acquired shares may be used for corporate purposes, including as shares issued to employees in our share‑based compensation programs. There were 6,963,269 shares, 1,842,337 shares and 2,320,726 shares repurchased in the open market or privately during the years ended December 31, 2018, 2017 and 2016, respectively. The repurchased shares include; 729,882 shares, 402,337 shares and 423,726 shares repurchased from employees who elected to tender shares to cover their income tax withholdings with respect to vesting of stock awards during the years ended December 31, 2018, 2017 and 2016, respectively.
Accumulated Other Comprehensive Loss
The following tables summarize other comprehensive income (loss) activity for the years ended December 31, 2018 and 2017.
81
|
|
|
|
|
|
|
|
|
|
|
|
|
|
|
|
|
|
|
|
| Total |
| |
|
|
|
|
| Unrealized |
| Postretirement |
| accumulated |
| |
|
|
|
|
| gains (losses) on |
| benefits |
| other |
| |
|
|
|
|
| AFS investment |
| unrealized |
| comprehensive |
| |
Year ended December 31, 2018 |
|
|
|
| securities |
| gains (losses) |
| income (loss) |
| |
|
|
|
|
| (in thousands) |
| |||||
Balance at December 31, 2017 |
|
|
|
| $ | 145 |
| 379 |
| 524 |
|
Amount reclassified to retained earnings for ASUs adopted in 2018 |
|
|
|
|
| (955) |
| 107 |
| (848) |
|
Other comprehensive (loss) income before reclassification |
|
|
|
|
| (360) |
| 736 |
| 376 |
|
Amount reclassified from accumulated other comprehensive income (loss) |
|
|
|
|
| 373 |
| (94) |
| 279 |
|
Net current period other comprehensive (loss) income |
|
|
|
|
| (942) |
| 749 |
| (193) |
|
Balance at December 31, 2018 |
|
|
|
| $ | (797) |
| 1,128 |
| 331 |
|
|
|
|
|
|
|
|
|
|
|
|
|
|
|
|
|
| Change in |
|
|
|
|
| |
|
|
|
|
| valuation |
|
|
|
|
| |
|
|
|
|
| allowance for |
|
|
|
|
| |
|
|
|
|
| unrealized |
|
|
| Total |
| |
|
| Unrealized |
| gains |
| Postretirement |
| accumulated |
| ||
|
| gains (losses) |
| (losses) on |
| benefits |
| other |
| ||
|
| on investment |
| investment |
| unrealized |
| comprehensive |
| ||
Year ended December 31, 2017 |
| securities |
| securities |
| gains (losses) |
| income (loss) |
| ||
|
| (in thousands) |
| ||||||||
Balance at December 31, 2016 |
| $ | (3,972) |
|
| (3,388) |
| 603 |
| (6,757) |
|
Other comprehensive income (loss) before reclassification |
|
| 4,039 |
|
| 3,743 |
| (106) |
| 7,676 |
|
Amount reclassified from accumulated other comprehensive income (loss) |
|
| 78 |
|
| (355) |
| (118) |
| (395) |
|
Net current period other comprehensive income (loss) |
|
| 4,117 |
|
| 3,388 |
| (224) |
| 7,281 |
|
Balance at December 31, 2017 |
| $ | 145 |
|
| — |
| 379 |
| 524 |
|
Reclassifications from accumulated other comprehensive income (loss) and included in net income are summarized in the tables that follow:
|
|
|
|
|
|
|
|
|
|
|
|
|
| For the year ended December 31, 2018 |
|
|
| ||||
|
|
|
|
| Tax |
|
|
|
|
|
|
|
|
|
| (expense) |
|
|
| Statement of income |
|
|
| Pre-tax |
| benefit |
| Net of tax |
| line item or retained earnings |
| |
|
| (in thousands) |
| |||||||
Reclassifications included in net income or retained earnings for ASUs adopted in 2018: |
|
|
|
|
|
|
|
|
|
|
Sponsored funds investment gains |
| $ | 1,295 |
| (340) |
| 955 |
| Retained earnings |
|
Losses on available for sale debt securities |
| $ | (489) |
| 116 |
| (373) |
| Investment and other income (loss) |
|
Amortization of postretirement benefits |
|
| 122 |
| (135) |
| (13) |
| Compensation and benefits and retained earnings |
|
Total |
| $ | 928 |
| (359) |
| 569 |
|
|
|
|
|
|
|
|
|
|
|
|
|
|
|
| For the year ended December 31, 2017 |
|
|
| |||||
|
|
|
|
| Tax |
|
|
|
|
|
|
|
|
|
| benefit |
|
|
|
|
|
|
| Pre-tax |
| (expense) |
| Net of tax |
| Statement of income line item |
| |
|
| (in thousands) |
| |||||||
Reclassifications included in net income: |
|
|
|
|
|
|
|
|
|
|
Sponsored funds investment losses |
| $ | (124) |
| 46 |
| (78) |
| Investment and other income (loss) |
|
Valuation allowance |
|
| — |
| 355 |
| 355 |
| Provision for income taxes |
|
Amortization of postretirement benefits |
|
| 184 |
| (66) |
| 118 |
| Compensation and benefits |
|
Total |
| $ | 60 |
| 335 |
| 395 |
|
|
|
82
13. Share‑Based Compensation
The Company’s 1998 Stock Incentive Plan, as amended and restated (the “SI Plan”) allows us to grant equity compensation awards, including nonvested stock, as part of our overall compensation program to attract and retain key personnel and encourage a greater personal financial investment in the Company, thereby promoting the long-term growth of the Company. A maximum of 35.6 million shares of common stock are authorized for issuance under the SI Plan and as of December 31, 2018, 2,121,728 shares of common stock were available for issuance under the SI Plan. In addition, we may make incentive payments under the Company Executive Incentive Plan, as amended and restated (the “EIP”) in the form of cash, nonvested stock or a combination thereof. Incentive awards paid under the EIP in the form of nonvested stock are issued out of shares reserved for issuance under the SI Plan. Generally, shares of common stock subject to an award that expires or is cancelled, forfeited, exchanged, settled in cash or is terminated will again be available for awards under the SI Plan.
Nonvested stock awards are valued on the date of grant and have no purchase price. These awards have historically vested over four years in 33 1/3% increments on the second, third and fourth anniversaries of the grant date; however, awards granted on or after December 31, 2016 vest in 25% increments on the first anniversary of the grant date. The Company has issued nonvested stock awards to non-employee directors. These awards generally have the same terms as awards issued to employees, except awards granted on or after January 2, 2017 fully vest on the first anniversary of the grant date and changes in the Company’s share price result in variable compensation expense over the vesting period.
Beginning in 2017, the Company established a Cash Settled RSU Plan (the “RSU Plan”), which allows the Company to grant cash-settled restricted stock units (“RSU”) to attract and retain key personnel and enable them to participate in the long-term growth of the Company. Unvested RSUs have no purchase price and vest in 25% increments over four years, beginning on the first anniversary of the grant date. On the vesting date, RSU holders receive a lump sum cash payment equal to the fair market value of one share of the Company’s common stock, par value $0.01, for each RSU that has vested, subject to applicable tax withholdings. We treat RSUs as liability-classified awards and, therefore, account for them at fair value based on the closing price of our common stock on the reporting date, which results in variable compensation expense over the vesting period.
Nonvested shares and nonvested RSU’s are forfeited upon the termination of employment with or service to the Company, as applicable, or service on the Board of Directors, dependent upon the circumstances of termination. Except for restrictions placed on the transferability of nonvested shares, holders of nonvested shares have full stockholders’ rights during the term of restriction, including voting rights and the rights to receive cash dividends. Since nonvested RSUs are not shares of Company stock, holders of nonvested RSUs are not entitled to voting rights, but are entitled to dividend equivalent payments for each RSU equal to the dividend paid on one share of our common stock.
A summary of nonvested share activity and related fair value for the year ended December 31, 2018 follows:
|
|
|
|
|
|
|
|
|
|
| Weighted |
| |
|
|
|
| Average |
| |
|
| Nonvested |
| Grant Date |
| |
|
| Stock Shares |
| Fair Value |
| |
Nonvested at December 31, 2017 |
| 5,088,640 |
| $ | 27.26 |
|
Granted |
| 1,561,155 |
|
| 20.87 |
|
Vested |
| (2,061,297) |
|
| 32.02 |
|
Forfeited |
| (494,738) |
|
| 24.23 |
|
Nonvested at December 31, 2018 |
| 4,093,760 |
| $ | 22.79 |
|
A summary of nonvested RSU activity for the year ended December 31, 2018 follows:
| ||
| ||
|
| |
|
| |
|
| |
|
| |
|
|
83
For the years ended December 31, 2018, 2017 and 2016 compensation expense related to nonvested shares totaled $51.6 million, $57.7 million and $51.5 million, respectively.
The deferred income tax benefit from the compensation expense related to nonvested stock was $10.0 million, $12.2 million and $19.2 million for the years ended December 31, 2018, 2017 and 2016, respectively. These benefits will be recognized upon vesting and may increase or decrease depending on the fair value of the shares on the date of vesting. As of December 31, 2018, the remaining unamortized expense of $60.6 million is expected to be recognized over a weighted average period of 2.2 years.
The total fair value of shares vested (at vest date) during the years ended December 31, 2018, 2017 and 2016, was $41.0 million, $20.8 million and $26.7 million, respectively. The Company withholds a portion of each employee’s vested shares to satisfy income tax withholding obligations of the Company with respect to vesting of the shares.
14. Uniform Net Capital Rule Requirements
Two of our subsidiaries, W&R and IDI are registered broker-dealers and members of FINRA. Broker-dealers are subject to the SEC’s Uniform Net Capital Rule (Rule 15c3‑1), which requires the maintenance of minimum net capital and requires that the ratio of aggregate indebtedness to net capital, both as defined, shall not exceed 15.0 to 1.0. The primary difference between net capital and stockholders’ equity is the non‑allowable assets that are excluded from net capital.
A broker-dealer may elect not to be subject to the Aggregate Indebtedness Standard of paragraph (a)(1)(i) of Rule 15c3‑1, in which case net capital must exceed the greater of $250 thousand or 2% of aggregate debit items computed in accordance with the Formula for Determination of Reserve Requirements for broker-dealers. W&R made this election and thus is not subject to the aggregate indebtedness ratio as of December 31, 2018 or 2017.
Net capital and aggregated indebtedness information for our broker-dealer subsidiaries is presented in the following table as of December 31, 2018 and 2017:
|
|
|
|
|
|
|
|
|
|
|
|
|
|
|
|
| 2018 |
| 2017 |
| |||||||||
|
| (in thousands) |
| |||||||||||
|
| W&R |
| IDI |
| W&R |
| IDI |
| |||||
Net capital |
| $ | 57,109 |
|
|
| 25,688 |
| 28,024 |
|
|
| 21,167 |
|
Required capital |
|
| 250 |
|
|
| 1,336 |
| 250 |
|
|
| 1,757 |
|
Excess of required capital |
| $ | 56,859 |
|
|
| 24,352 |
| 27,774 |
|
|
| 19,410 |
|
Ratio of aggregate indebtedness to net capital |
|
| Not |
|
|
|
|
| Not |
|
|
|
|
|
|
|
| applicable |
|
|
| 0.78 to 1.0 |
| applicable |
|
|
| 1.25 to 1.0 |
|
15. Rental Expense and Lease Commitments
We lease certain home office buildings, certain sales and other office space and equipment under operating leases. Rent expense was $22.7 million, $24.5 million and $24.3 million, for the years ended December 31, 2018, 2017 and 2016, respectively. Future minimum rental commitments under non‑cancelable operating leases are as follows:
|
|
|
|
|
Year |
| Commitments |
| |
|
| (in thousands) |
| |
2019 |
| $ | 16,488 |
|
2020 |
|
| 9,797 |
|
2021 |
|
| 5,757 |
|
2022 |
|
| 2,913 |
|
2023 |
|
| 2,320 |
|
Thereafter |
|
| 5,161 |
|
|
| $ | 42,436 |
|
84
16. Related Party Transactions
We earn investment management fee revenues from the Funds and IGI Funds for which we act as an investment adviser, pursuant to an investment management agreement with each Fund. In addition, we have agreements with the Funds pursuant to Rule 12b‑1 under the ICA for which distribution and service fees are collected from the Funds for distribution of mutual fund shares, for costs such as advertising and commissions paid to broker-dealers, and for providing ongoing services to shareholders of the Funds and/or maintaining shareholder accounts. We also earn service fee revenues by providing various services to the Funds and their shareholders pursuant to a shareholder servicing agreement with each Fund (except Ivy VIP) and an accounting service agreement with each Fund. Certain of our officers and directors are also officers and/or trustees for the various Funds for which we act as an investment adviser. These agreements are approved or renewed on an annual basis by each Fund’s board of trustees, including a majority of the disinterested members.
Revenues for services provided or related to the Funds and IGI Funds for the years ended December 31, 2018, 2017 and 2016 are as follows:
|
|
|
|
|
|
|
|
|
|
| 2018 |
| 2017 |
| 2016 |
| |
|
| (in thousands) |
| |||||
Investment management fees |
| $ | 486,581 |
| 508,035 |
| 523,304 |
|
Rule 12b-1 service and distribution fees |
|
| 141,220 |
| 159,873 |
| 208,901 |
|
Shareholder service fees |
|
| 102,385 |
| 106,595 |
| 120,241 |
|
Total revenues |
| $ | 730,186 |
| 774,503 |
| 852,446 |
|
Included in Funds and separate accounts receivable at December 31, 2018 and 2017 are receivables due from the Funds of $14.6 and $20.6 million, respectively.
17. Contingencies
The Company is involved from time to time in various legal proceedings, regulatory investigations and claims incident to the normal conduct of business, which may include proceedings that are specific to us and others generally applicable to business practices within the industries in which we operate. A substantial legal liability or a significant regulatory action against us could have an adverse effect on our business, financial condition and on the results of operations in a particular quarter or year.
The Company establishes reserves for litigation and similar matters when those matters present material loss contingencies that management determines to be both probable and reasonably estimable in accordance with ASC 450, “Contingencies Topic.” These amounts are not reduced by amounts that may be recovered under insurance or claims against third parties, but undiscounted receivables from insurers or other third parties may be accrued separately. The Company regularly revises such accruals in light of new information. The Company discloses the nature of the contingency when management believes it is reasonably possible the outcome may be significant to the Company’s consolidated financial statements and, where feasible, an estimate of the possible loss. For purposes of our litigation contingency disclosures, “significant” includes material matters as well as other items that management believes must be disclosed. Management’s judgment is required related to contingent liabilities because the outcomes are difficult to predict.
Shareholder Derivative Litigation
In an action filed on April 18, 2016 in the District Court of Johnson County, Kansas, Hieu Phan v. Ivy Investment Management Company, et al. (Case No. I6CV02338 Div. 4), plaintiff filed a putative derivative action on behalf of the nominal defendant, a mutual fund trust affiliated with the Company, alleging breach of fiduciary duty and breach of contract claims relating to an investment held in the affiliated mutual fund by the Company's registered investment adviser subsidiary. On behalf of the nominal defendant trust, plaintiff filed claims against the Company’s registered investment adviser subsidiary and current and retired trustees of the trust seeking monetary damages and demanding a jury trial. While the Company denies that any of its subsidiaries breached their fiduciary duties to, or committed a breach of the investment management agreement with, the nominal defendant trust, the parties to the litigation reached a settlement. The February 14, 2018 settlement agreement provided a full release for the benefit of defendants and for the payment of $19.9 million (less $6.1 million for attorney’s fees plus nominal costs associated with notice to shareholders), recoverable to the Company through insurance, to the affiliated mutual fund for the benefit of its shareholders. On July 30, 2018, the court entered an order granting final approval of the settlement. The settlement amount has been funded by insurance, and the affiliated mutual fund has received the net settlement amount after deduction for attorney’s fees and nominal costs
85
described above.
401(k) Plan Class Action Litigation
In an action filed on June 23, 2017 and amended on June 26, 2017 in the U.S. District Court for the District of Kansas, Schapker v. Waddell & Reed Financial, Inc., et al, (Case No. 17-2365 D. Kan.), Stacy Schapker, a participant in the Company’s 401(k) and Thrift Plan, as amended and restated (the “401(k) Plan”), filed a lawsuit against the Company, the Company’s Board of Directors, the Administrative Committee of the 401(k) Plan, and unnamed Jane and John Doe Defendants 1-25. On August 7, 2017, plaintiff filed a second amended complaint on behalf of the 401(k) Plan and a proposed class of 401(k) Plan participants, alleging claims for breach of fiduciary duty and prohibited transactions under the Employee Retirement Income Security Act of 1974, as amended, based on the 401(k) Plan’s offering of investments managed by the Company or its affiliates during a proposed class period of June 23, 2011 to present. The second amended complaint dismissed the Company’s Board of Directors as a defendant and named as defendants the Company, the Compensation Committee of the Company’s Board of Directors, the Administrative Committee of the 401(k) Plan, and the individuals who served on those committees during the proposed class period. While the Company and all other defendants deny any and all liability with respect to the claims, the parties to the litigation reached a settlement. The November 19, 2018 settlement agreement contemplates a full release for the benefit of the Company and all other defendants and the payment of $4.875 million (less attorney’s fees and costs, class representative compensation, and administrative expenses) to eligible settlement class members, their beneficiaries or alternate payees. On November 28, 2018, the court entered an order granting preliminary approval of the settlement, including preliminary certification of a class for settlement purposes only, to include 401(k) Plan participants at any time during the approved class period of June 23, 2011 to November 28, 2018. A fairness hearing is scheduled for April 8, 2019, at which the court will consider granting final approval to the settlement. The settlement is subject to final court approval. The payments contemplated by the proposed settlement are recoverable to the Company through insurance. The Company has recorded a liability and offsetting receivable from insurance, as reflected in the Company's consolidated balance sheets.
18. Concentrations of Risk
Financial instruments that potentially subject the Company to concentrations of credit risk consist primarily of cash and cash equivalents held. The Company maintains cash and cash equivalents with various financial institutions. Cash deposits maintained at financial institutions may exceed the federally insured limit.
Our investments in sponsored funds and investments held as trading expose us to market risk. The underlying holdings of our AUM are also subject to market risk, which may arise from changes in equity prices, credit ratings, foreign currency exchange rates, and interest rates.
19. Selected Quarterly Information (Unaudited)
|
|
|
|
|
|
|
|
|
|
|
|
| Quarter |
| |||||||
|
| First |
| Second |
| Third |
| Fourth |
| |
|
| (in thousands) |
| |||||||
2018 |
|
|
|
|
|
|
|
|
|
|
Total revenues |
| $ | 297,615 |
| 295,338 |
| 295,118 |
| 272,230 |
|
Net income attributable to Waddell & Reed Financial, Inc. |
| $ | 46,337 |
| 44,478 |
| 46,305 |
| 46,468 |
|
Net income per share, basic and diluted |
| $ | 0.56 |
| 0.55 |
| 0.58 |
| 0.60 |
|
|
|
|
|
|
|
|
|
|
|
|
|
| Quarter |
| |||||||
|
| First |
| Second |
| Third |
| Fourth |
| |
|
| (in thousands) |
| |||||||
2017 |
|
|
|
|
|
|
|
|
|
|
Total revenues |
| $ | 286,564 |
| 286,657 |
| 289,447 |
| 294,476 |
|
Net income attributable to Waddell & Reed Financial, Inc. |
| $ | 33,871 |
| 24,061 |
| 53,582 |
| 29,765 |
|
Net income per share, basic and diluted |
| $ | 0.40 |
| 0.29 |
| 0.64 |
| 0.36 |
|
86